Embed Size (px)
Citation preview

NI-43-101 TECHNICAL REPORT ON THE PRELIMINARY ECONOMIC ASSESSMENT FOR THE
DEER HORN GOLD-SILVER-TELLURIUM PROPERTY
Report Authors: Tracey Meintjes P.Eng. Bob Lane P.Geo. Gary Giroux P.Eng. Marc Schulte P.Eng.
REPORT EFFECTIVE DATE:
MAY 31, 2018

PRELIMINARY ECONOMIC ASSESSMENT FOR THE DEER HORN PROPERTY
DEER HORN CAPITAL PAGE I
TABLE OF CONTENTS
1.0 EXECUTIVE SUMMARY .............................................................................................................. 1
1.1 INTRODUCTION ...................................................................................................................................................... 1
1.2 PROPERTY LOCATION AND ACCESSIBILITY .......................................................................................................... 1
1.3 GEOLOGY ................................................................................................................................................................ 2
1.4 METALLURGICAL TEST WORK ............................................................................................................................... 3
1.5 RESOURCE ............................................................................................................................................................... 3
1.6 MINE PLANNING .................................................................................................................................................... 3
1.7 PROCESSING ........................................................................................................................................................... 6
1.8 TAILINGS MANAGEMENT AND WASTE ROCK STORAGE .................................................................................... 6
1.9 SITE GENERAL ARRANGEMENT ............................................................................................................................. 6
1.10 ENVIRONMENTAL CONSIDERATIONS ................................................................................................................... 8
1.11 CAPITAL AND OPERATING COST .......................................................................................................................... 8
1.12 ECONOMIC EVALUATION ...................................................................................................................................... 9
1.13 ECONOMIC SENSITIVITY ANALYSIS .................................................................................................................... 10
1.14 INTERPRETATION AND CONCLUSIONS .............................................................................................................. 11
1.15 RECOMMENDATIONS ........................................................................................................................................... 11
2.0 INTRODUCTION .................................................................................................................... 12
3.0 RELIANCE ON OTHER EXPERTS ............................................................................................... 13
4.0 PROPERTY DESCRIPTION AND LOCATION ................................................................................ 14
4.1 LOCATION ............................................................................................................................................................. 14
4.2 MINERAL DISPOSITIONS ...................................................................................................................................... 14
4.3 OWNERSHIP .......................................................................................................................................................... 14
4.4 TENURE RIGHTS .................................................................................................................................................... 14
4.5 RESOURCES, RESERVES, DEVELOPMENT & INFRASTRUCTURE ........................................................................... 16
4.6 ENVIRONMENTAL LIABILITIES ............................................................................................................................... 16 4.6.1 1989 Assessment .................................................................................................................................................... 16 4.6.2 2009 Assessment .................................................................................................................................................... 16
4.7 PERMITS................................................................................................................................................................. 17
5.0 ACCESSIBILITY, LOCAL RESOURCES, CLIMATE, INFRASTRUCTURE AND PHYSIOGRAPHY ............... 20
5.1 ACCESS .................................................................................................................................................................. 20
5.2 LOCAL RESOURCES ............................................................................................................................................... 20 5.2.1 Wildlife & Fisheries ................................................................................................................................................ 20
5.3 CLIMATE AND PHYSIOGRAPHY ............................................................................................................................ 21

PRELIMINARY ECONOMIC ASSESSMENT FOR THE DEER HORN PROPERTY
DEER HORN CAPITAL PAGE II
5.4 INFRASTRUCTURE .................................................................................................................................................. 21
6.0 HISTORY .............................................................................................................................. 22
6.1 PIONEER GOLD MINES OF B.C. LIMITED ............................................................................................................ 23
6.2 DEER HORN MINES LIMITED ............................................................................................................................... 23
6.3 THE GRANBY MINING COMPANY LIMITED ....................................................................................................... 24
6.4 GOLDEN KNIGHT RESOURCES INC. ..................................................................................................................... 24
6.5 AMBER MINERALS LTD. ....................................................................................................................................... 25
6.6 GUARDSMEN RESOURCES INC. ........................................................................................................................... 25
6.7 CHRISTOPHER JAMES GOLD CORP. ................................................................................................................... 25
6.8 GOLDEN ODYSSEY MINING INC. ........................................................................................................................ 26
6.9 DEER HORN METALS INC. .................................................................................................................................. 26
6.10 DEER HORN CAPITAL INC. .................................................................................................................................. 26
7.0 GEOLOGICAL SETTING AND MINERALIZATION ......................................................................... 27
7.1 REGIONAL GEOLOGY ........................................................................................................................................... 27
7.2 LOCAL GEOLOGY .................................................................................................................................................. 27
7.3 STRUCTURE ........................................................................................................................................................... 34
7.4 MINERALIZATION ................................................................................................................................................. 34 7.4.1 Gold-Silver-Tellurium Vein Mineralization .................................................................................................... 35 7.4.2 Tungsten Mineralization ....................................................................................................................................... 37 7.4.3 Molybdenum Mineralization ............................................................................................................................... 37 7.4.4 Copper Mineralization ........................................................................................................................................... 38
8.0 DEPOSIT TYPES ..................................................................................................................... 39
9.0 EXPLORATION ...................................................................................................................... 40
9.1 SURFACE ROCK GEOCHEMICAL SAMPLING ....................................................................................................... 40
9.2 TRENCHING ........................................................................................................................................................... 41
10.0 DRILLING ............................................................................................................................. 55
10.1 MAIN VEIN AND CONTACT ZONE DRILLING .................................................................................................... 61
10.2 HARRISON SCHEELITE OCCURRENCE DRILLING ................................................................................................ 69
11.0 SAMPLE COLLECTION, PREPARATION, ANALYSES AND SECURITY ................................................ 71
11.1 SURFACE CHANNEL AND CHIP SAMPLE COLLECTION ..................................................................................... 71
11.2 DIAMOND DRILL CORE LOGGING AND SAMPLE COLLECTION ....................................................................... 71
11.3 GEOCHEMICAL ANALYSIS AND ASSAYING ........................................................................................................ 71
11.4 SECURITY ............................................................................................................................................................... 72
12.0 DATA VERIFICATION ............................................................................................................. 73

PRELIMINARY ECONOMIC ASSESSMENT FOR THE DEER HORN PROPERTY
DEER HORN CAPITAL PAGE III
12.1 HISTORICAL DATA................................................................................................................................................ 73
12.2 2009 DATA .......................................................................................................................................................... 73
12.3 2011 AND 2012 DATA ...................................................................................................................................... 73 12.3.1 Geochemical Standards, Blanks and Duplicate Samples.......................................................................... 74
13.0 MINERAL PROCESSING AND METALLURGICAL TESTING ............................................................ 76
14.0 MINERAL RESOURCE ESTIMATES ............................................................................................ 78
14.1 DATA ANALYSIS ................................................................................................................................................... 78
14.2 COMPOSITES......................................................................................................................................................... 91
14.3 VARIOGRAPHY ...................................................................................................................................................... 92
14.4 BLOCK MODEL ..................................................................................................................................................... 92
14.5 BULK DENSITY ...................................................................................................................................................... 94
14.6 GRADE INTERPOLATION ...................................................................................................................................... 94
14.7 CLASSIFICATION ................................................................................................................................................... 96
14.8 MINERAL RESOURCE STATEMENT ...................................................................................................................... 97
15.0 MINERAL RESERVE ESTIMATES ............................................................................................. 100
16.0 MINING METHODS ............................................................................................................. 101
16.1 INTRODUCTION ................................................................................................................................................. 101
16.2 MINING DATUM ............................................................................................................................................... 101
16.3 PRODUCTION RATE CONSIDERATION ............................................................................................................. 101
16.4 MINE PLANNING 3D BLOCK MODEL AND MINESIGHT PROJECT ............................................................... 102
16.5 NET SMELTER RETURN ..................................................................................................................................... 103
16.6 MINING LOSS AND DILUTION ......................................................................................................................... 104
16.7 ECONOMIC PIT LIMITS ...................................................................................................................................... 105 16.7.1 Pit Optimization Inputs ...................................................................................................................................... 105 16.7.2 Economic Pit Limit ................................................................................................................................................ 107
16.8 DETAILED PITS ................................................................................................................................................... 111 16.8.1 Haul Road Widths ................................................................................................................................................ 111 16.8.2 Minimum Mining Width..................................................................................................................................... 111 16.8.3 Access Considerations ........................................................................................................................................ 111 16.8.4 Berm Width ............................................................................................................................................................. 111 16.8.5 Bench Height .......................................................................................................................................................... 112 16.8.6 LG Phase Selection ............................................................................................................................................... 112 16.8.7 Pit Designs .............................................................................................................................................................. 112
16.9 PIT RESOURCE ................................................................................................................................................... 119
16.10 MINE PLAN ........................................................................................................................................................ 120

PRELIMINARY ECONOMIC ASSESSMENT FOR THE DEER HORN PROPERTY
DEER HORN CAPITAL PAGE IV
16.10.1 Mine Production Schedule ................................................................................................................................ 120 16.10.2 Waste Rock Dumps and Top Soil Storage................................................................................................... 122 16.10.3 Mine Production Detail ...................................................................................................................................... 123 16.10.3.1. Pre-production (Year -1) .................................................................................................................................... 123 16.10.3.2. Year 1 ........................................................................................................................................................................ 123 16.10.3.3. Years 2-4 .................................................................................................................................................................. 124 16.10.3.4. Years 5-9 .................................................................................................................................................................. 124 16.10.3.5. End of Open Pit Mining ...................................................................................................................................... 124
16.11 MINE OPERATIONS ........................................................................................................................................... 128 16.11.1 Drilling ...................................................................................................................................................................... 128 16.11.2 Blasting ..................................................................................................................................................................... 128 16.11.3 Loading .................................................................................................................................................................... 129 16.11.4 Hauling ..................................................................................................................................................................... 129 16.11.5 Pit Maintenance .................................................................................................................................................... 129 16.11.6 Mine Maintenance ............................................................................................................................................... 130 16.11.7 General Mine Expense ........................................................................................................................................ 130
16.12 MINE CLOSURE AND RECLAMATION .............................................................................................................. 130
16.13 MINE EQUIPMENT ............................................................................................................................................. 131
17.0 RECOVERY METHODS .......................................................................................................... 132
17.1 CRUSHING .......................................................................................................................................................... 133
17.2 GRINDING .......................................................................................................................................................... 133
17.3 FLOTATION ........................................................................................................................................................ 133
18.0 PROJECT INFRASTRUCTURE .................................................................................................. 134
18.1 SITE ACCESS ...................................................................................................................................................... 134
18.2 CAMP ................................................................................................................................................................. 134
18.3 PROCESS AREA .................................................................................................................................................. 134
18.4 FUEL STORAGE FACILITIES ................................................................................................................................ 136
18.5 SEWAGE TREATMENT ........................................................................................................................................ 136
18.6 WATER SUPPLY ................................................................................................................................................. 136
18.7 ELECTRICAL AND COMMUNICATION ............................................................................................................... 136
18.8 WASTE AND TAILINGS STORAGE ..................................................................................................................... 136
19.0 MARKET STUDIES AND CONTRACTS ..................................................................................... 137
19.1 MARKET PRICES ................................................................................................................................................ 137
19.2 CONTRACTS ....................................................................................................................................................... 137
20.0 ENVIRONMENTAL STUDIES, PERMITTING AND SOCIAL OR COMMUNITY IMPACT ...................... 138

PRELIMINARY ECONOMIC ASSESSMENT FOR THE DEER HORN PROPERTY
DEER HORN CAPITAL PAGE V
20.1 REGULATORY FRAMEWORK .............................................................................................................................. 138
20.2 PROVINCIAL PROCESSES .................................................................................................................................. 139
20.3 FEDERAL PROCESSES ......................................................................................................................................... 140
20.4 LOCAL AND REGIONAL PROCESSES................................................................................................................. 141 20.4.1 Regional Land Use Planning ............................................................................................................................. 141 20.4.2 Local Land Use Planning .................................................................................................................................... 142
20.5 ENVIRONMENT .................................................................................................................................................. 142
20.6 SOCIAL AND ECONOMIC .................................................................................................................................. 145
20.7 STAKEHOLDER IDENTIFICATION ....................................................................................................................... 146
20.8 ENGAGEMENT AND CONSULTATION .............................................................................................................. 146
20.9 FIRST NATIONS CONSULTATION AND ENGAGEMENT ................................................................................... 146 20.9.1 Consultation ........................................................................................................................................................... 146 20.9.2 Engagement ........................................................................................................................................................... 146
21.0 CAPITAL AND OPERATING COSTS ......................................................................................... 148
21.1 CAPITAL COST ESTIMATE ................................................................................................................................. 148
21.2 OPERATING COST ESTIMATE ........................................................................................................................... 149
22.0 ECONOMIC ANALYSIS ......................................................................................................... 150
22.1 ECONOMIC SENSITIVITY ANALYSIS ................................................................................................................. 154
23.0 ADJACENT PROPERTIES ....................................................................................................... 155
24.0 OTHER RELEVANT DATA AND INFORMATION ........................................................................ 156
25.0 INTERPRETATION AND CONCLUSIONS................................................................................... 157
26.0 RECOMMENDATIONS .......................................................................................................... 159
26.1 RESOURCE MODELING ..................................................................................................................................... 159
26.2 MINING .............................................................................................................................................................. 159
26.3 PROCESSING ...................................................................................................................................................... 160
26.4 ENVIRONMENTAL STUDIES, PERMITTING AND SOCIAL OR COMMUNITY IMPACT ..................................... 160
26.5 INFRASTRUCTURE .............................................................................................................................................. 161
26.6 MARKET STUDIES .............................................................................................................................................. 161
27.0 REFERENCES ....................................................................................................................... 162

PRELIMINARY ECONOMIC ASSESSMENT FOR THE DEER HORN PROPERTY
DEER HORN CAPITAL PAGE VI
LIST OF TABLES
TABLE 1-1 METAL PRICES AND NSP ................................................................................................. 4 TABLE 1-2 PIT DELINEATED RESOURCE ........................................................................................... 5 TABLE 1-3 DILUTION GRADES ............................................................................................................. 5 TABLE 1-4 PIT DELINEATED RESOURCE BY ASSURANCE OF EXISTENCE CLASS .............. 5 TABLE 1-5 SUMMARIZED PRODUCTION SCHEDULE .................................................................. 6 TABLE 1-6 DEER HORN CAPITAL COST ESTIMATE ....................................................................... 8 TABLE 1-7 DEER HORN OPERATING COST SUMMARY .............................................................. 9 TABLE 1-8 ECONOMIC RESULTS FOR PRICE CASE SCENARIOS ............................................ 10 TABLE 4-1 DEER HORN PROPERTY - MINERAL TENURE ......................................................... 17 TABLE 6-1 SUMMARY OF DIAMOND DRILLING, DEER HORN PROPERTY ........................ 23 TABLE 9-1 SELECTED 2011 SURFACE GEOCHEMICAL SAMPLE RESULTS .......................... 43 TABLE 9-2 SELECTED 2012 SURFACE GEOCHEMICAL SAMPLE RESULTS .......................... 48 TABLE 9-3 SELECTED TRENCH SAMPLE RESULTS ...................................................................... 52 TABLE 10-1 COLLAR LOCATIONS FOR 2011 DIAMOND DRILLHOLES .................................. 57 TABLE 10-2 2011 DOWN-HOLE SURVEYS ....................................................................................... 60 TABLE 10-3 SELECTED 2011 MAIN VEIN AND CONTACT ZONE DIAMOND DRILLING RESULTS 62 TABLE 10-4 SELECTED 2011 HARRISON SCHEELITE OCCURRENCE DRILLING RESULTS 70 TABLE 13-1 METALLURGICAL SAMPLE HEAD GRADES .................................................................................................... 76 TABLE 14-1 LISTING OF DRILLHOLES AND SURFACE SAMPLES ............................................. 79 TABLE 14-2 SUMMARY STATISTICS FOR ALL VARIABLES IN ALL SAMPLES ....................... 80 TABLE 14-3 PEARSON CORRELATION MATRIX FOR ALL VARIABLES IN ALL ASSAYS..... 81 TABLE 14-4 PEARSON CORRELATION MATRIX FOR ALL VARIABLES IN VEINS ................ 82 TABLE 14-5 ASSAY STATISTICS FOR GOLD, SILVER AND TELLURIUM FOR MINERALIZED ZONES. 85 TABLE 14-6 ASSAY STATISTICS FOR COPER, LEAD AND ZINC FOR MINERALIZED ZONES 85 TABLE 14-7 CONTACT ZONE AU POPULATIONS .......................................................................... 87 TABLE 14-8 CAPPING LEVELS BY VEIN ZONE ................................................................................. 90 TABLE 14-9 CAPPED ASSAY STATISTICS FOR GOLD, SILVER AND TELLURIUM ................ 90 TABLE 14-10 STATISTICS FOR 1M COMPOSITES ............................................................................. 91 TABLE 14-11 SUMMARY OF SEMIVARIOGRAM PARAMETERS FOR AU, AG AND TE ........ 93 TABLE 14-12 SPECIFIC GRAVITY MEASUREMENTS OF TEN CORE SAMPLES ........................ 94 TABLE 14-13 KRIGING SEARCH PARAMETERS FOR GOLD .......................................................... 95 TABLE 14-14 INDICATED RESOURCE WITHIN MINERALIZED SOLIDS ..................................... 98 TABLE 14-15 INFERRED RESOURCE WITHIN MINERALIZED SOLIDS ....................................... 99 TABLE 16-1 METAL PRICES AND NSP ............................................................................................. 103 TABLE 16-2 DILUTION ESTIMATION ................................................................................................ 104

PRELIMINARY ECONOMIC ASSESSMENT FOR THE DEER HORN PROPERTY
DEER HORN CAPITAL PAGE VII
TABLE 16-3 DILUTION GRADES ......................................................................................................... 105 TABLE 16-4 DEER HORN MINING COSTS FOR ECONOMIC PIT LIMITS .............................. 107 TABLE 16-5 DEER HORN UNIT PROCESS AND G&A COSTS FOR ECONOMIC PIT LIMITS 107 TABLE 16-6 PIT DELINEATED RESOURCE ....................................................................................... 119 TABLE 16-7 SUMMARIZED PRODUCTION SCHEDULE .............................................................. 121 TABLE 16-8 WASTE VOLUMES AND TONNAGES BY YEAR...................................................... 123 TABLE 16-9 TYPICAL MINING CONTRACTOR EQUIPMENT FLEET ........................................ 131 TABLE 19-1 MARKET PRICES .............................................................................................................. 137 TABLE 21-1 DEER HORN CAPITAL COST ESTIMATE ................................................................... 148 TABLE 21-2 DEER HORN OPERATING COST ESTIMATE .......................................................... 149 TABLE 22-1 OFFSITE COSTS AND SMELTER TERMS .................................................................. 151 TABLE 22-2 ECONOMIC RESULTS FOR PRICE CASE SCENARIOS .......................................... 151 TABLE 22-3 DEER HORN CASH FLOW SUMMARY ..................................................................... 153

PRELIMINARY ECONOMIC ASSESSMENT FOR THE DEER HORN PROPERTY
DEER HORN CAPITAL PAGE VIII
LIST OF FIGURES
FIGURE 1-1 DEER HORN MINE GENERAL ARRANGEMENT ....................................................... 7 FIGURE 1-2 DEER HORN AFTER TAX ECONOMIC SENSITIVITY ANALYSIS ......................... 11 FIGURE 4-1 DEER HORN PROPERTY - LOCATION ........................................................................ 15 FIGURE 4-2 DEER HORN PROPERTY - MINERAL TENURE ........................................................ 19 FIGURE 7-1 REGIONAL GEOLOGY OF THE LINDQUIST LAKE AREA (SOURCE DIGITAL GEOLOGY MAP OF BRITISH COLUMBIA) ............................................................................................................................... 31 FIGURE 7-2 REGIONAL GEOLOGY OF THE LINDQUIST LAKE AREA (AFTER DIAKOW AND KOYANAGI, 1988B) 32 FIGURE 7-3 GEOLOGY OF THE DEER HORN ADIT AREA (MODIFIED AFTER FOLK (1990A) AND CHILDE AND KAIP (2000)) 33 FIGURE 7-4 COMMON GEOMETRIC ARRANGEMENTS OF FAULT-FILLED AND EXTENSIONAL VEINS IN SHEAR ZONES ................................................................................................................................. 35 FIGURE 9-1 SELECTED 2011 SURFACE GEOCHEMICAL SAMPLE LOCATIONS ................... 51 FIGURE 9-2 2012 SAMPLE LOCATIONS ............................................................................................ 53 FIGURE 9-3 TRENCH LOCATIONS ....................................................................................................... 54 FIGURE 10-1 2011 DIAMOND DRILLHOLE LOCATIONS ............................................................... 56 FIGURE 14-1 CUMULATIVE FREQUENCY PLOT FOR GOLD IN VEIN MATERIAL SORTED BY DRILL CAMPAIGN 80 FIGURE 14-2 ISOMETRIC VIEW LOOKING N SHOWING DRILLHOLE TRACES AND MAIN VEIN SOLIDS IN RED, FW SOLIDS IN DARK GREEN AND CONTACT ZONE IN BLUE. ............................................ 83 FIGURE 14-3 ISOMETRIC VIEW LOOKING S SHOWING DRILLHOLE TRACES AND MAIN VEIN SOLIDS IN RED, FW SOLIDS IN DARK GREEN AND CONTACT ZONE IN BLUE. ............................................ 84 FIGURE 14-4 LOGNORMAL CUMULATIVE FREQUENCY PLOT FOR AU IN CONTACT ZONE 89 FIGURE 16-1 DEER HORN MINE PLANNING 3DBM LIMITS ...................................................... 102 FIGURE 16-2 PLAN VIEW OF MINERALIZED ZONES, 3DBM LIMIT AND 5M TOPOGRAPHY CONTOURS 103 FIGURE 16-3 MILL FEED BY PRICE FACTOR LG CASE ................................................................... 107 FIGURE 16-4 OBLIQUE VIEW OF THE SELECTED LG PIT LIMIT SHELL .................................... 108 FIGURE 16-5 PLAN VIEW OF THE CHOSEN LG PIT SHELL .......................................................... 109 FIGURE 16-6 LG PIT LIMIT N-S SECTION AT EAST 613905 VIEWED FROM THE EAST ..... 110 FIGURE 16-7 PLAN VIEW OF STARTER PIT D651 WITH THE PIT LIMIT OUTLINE .............. 113 FIGURE 16-8 PLAN VIEW OF STARTER PIT D652 WITH THE PIT LIMIT OUTLINE .............. 114 FIGURE 16-9 PLAN VIEW OF STARTER PIT D653 WITH THE PIT LIMIT OUTLINE .............. 115 FIGURE 16-10 PLAN VIEW OF PHASE D654I WITH THE PIT LIMIT OUTLINE ......................... 116 FIGURE 16-11 PLAN VIEW OF ULTIMATE PIT D655 ........................................................................ 117 FIGURE 16-12 PLAN VIEW OF ALL PIT PHASES ................................................................................ 118 FIGURE 16-13 LOM PRODUCTION SCHEDULE ................................................................................. 121 FIGURE 16-14 EOP 01 MINE LAYOUT .................................................................................................. 125

PRELIMINARY ECONOMIC ASSESSMENT FOR THE DEER HORN PROPERTY
DEER HORN CAPITAL PAGE IX
FIGURE 16-15 EOP 04 MINE LAYOUT .................................................................................................. 126 FIGURE 16-16 EOP 09 MINE LAYOUT .................................................................................................. 127 FIGURE 17-1 DEER HORN PROCESS FLOW DIAGRAM ................................................................ 132 FIGURE 18-1 DEER HORN SITE ACCESS MAP ................................................................................. 135 FIGURE 22-1 DEER HORN AFTER TAX ECONOMIC SENSITIVITY ANALYSIS ....................... 154

PRELIMINARY ECONOMIC ASSESSMENT FOR THE DEER HORN PROPERTY
MAY 2018 PAGE 1
1.0 EXECUTIVE SUMMARY
1.1 INTRODUCTION
The Deer Horn project (the ”Project”) involves the development of a gold-silver-tellurium deposit in west-central British Columbia, 135km southwest of the community of Burns Lake and 36km south of the Huckleberry mine.
This National Instrument 43-101 (“NI 43-101”) Preliminary Economic Assessment (“PEA”) report has been prepared at the request of Deer Horn Capital by:
• Moose Mountain Technical Services (“MMTS”)
• Plateau Minerals Corp.
• Giroux Consultants Ltd.
Tracey Meintjes (P.Eng.) of MMTS is the QP for matters relating to mineral processing and metallurgical testing, capital and operating costs, environmental, infrastructure, financial evaluation, and overall report preparation (Sections 1-3, 13, 17-27 of this Technical Report).
Marc Schulte (P.Eng.) of MMTS is the QP for matter relating for mining (Sections 15 and 16 of this Technical Report).
Bob Lane (P.Geo.), of Plateau Minerals Corp visited the Project during drill programs that took place in 2009 and 2011 and during a surface sampling program that took place in 2012. He is the Qualified Person (“QP”) for all matters relating to Geology (Sections 4-12 of this Technical Report)
Gary Giroux (P.Eng.), of Giroux Consultants Ltd. is the QP for all matters relating to the Mineral Resource Estimate (Section 14 of this Technical Report).
This report also makes recommendations for additional exploration to further define and expand the known zones of mineralization. This report builds upon an earlier report entitled ‘NI-43-101 Preliminary Economic Assessment For The Deer Horn Gold-Silver-Tellurium Property’ dated July 26, 2013. Supporting historic data was sourced principally from two technical reports prepared in 1990 by P. Folk of Golden Knight Resources Inc.
Deer Horn Capital Inc. (“DHC”, “Company” or “Proponent”) owns a 50% interest in the Deer Horn property and may acquire an additional 25% interest in the property from Guardsmen Resources Inc. (“Guardsmen”). Under the terms of an agreement dated August 13, 2009, by paying the costs required to bring the property to commercial production.
1.2 PROPERTY LOCATION AND ACCESSIBILITY
The Deer Horn property is located in the Omineca Mining Division, approximately one hour by air south of the town of Smithers, British Columbia. It is situated immediately north of Lindquist Lake, about 135km southwest of the community of Burns Lake and 36km south of the Huckleberry mine, in west-central British Columbia. The property is centered at Latitude 53°22’26” W and Longitude 127°17’16” N and consists of 18 MTO cell claims covering an area of 5133.26 hectares of land. Access to the site is via helicopter, float plane or barge. An overgrown 7.8 km road extends from a barge landing on Whitesail Lake, past Kenney Lake and Lindquist Lake to the main area of interest in the alpine on the south facing flank of Lindquist Peak. This

PRELIMINARY ECONOMIC ASSESSMENT FOR THE DEER HORN PROPERTY
MAY 2018 PAGE 2
area of concentrated historic exploration is centered 5 km southwest of the west end of Whitesail Lake at an elevation of about 1290 m.
1.3 GEOLOGY
The Deer Horn property is located in the Intermontane tectonic belt of the Canadian Cordillera, adjacent to the eastern margin of the Coast tectonic belt. The oldest rocks exposed in the area consist of mafic volcanic strata of the pre-Jurassic Gamsby Group and a quartz diorite stock of pre-Jurassic age. The quartz diorite and mafic volcanics are thrust over sedimentary and volcanic strata of the Lower Cretaceous Skeena Group and over maroon volcanic strata of the Lower to Middle Jurassic Telkwa Formation (Hazelton Group). The thrust is west–trending, and west of the Deer Horn adit, is offset by a later northeast trending fault. Development of the thrust fault postdates deposition of the Lower Cretaceous Skeena Group and predates an Eocene granodiorite intrusion which invades the structure east of the Deer Horn adit and underlies much of the area around Lindquist Lake. The granodiorite is in intrusive contact with the foliated quartz diorite and with strata of the Gamsby and Skeena groups. Northwest of the Deer Horn adit, Lower Cretaceous and older strata are intruded by Late Cretaceous to Eocene granodiorite and quartz diorite of the Coast tectonic belt.
The Deer Horn property hosts a gold-silver-tellurium vein system that developed within and in the immediate hangingwall of a local thrust fault. The property was the subject of three main phases of exploration in the mid-1940s, the early to mid-1950s, and from 1989-1990. Surface diamond drilling and underground exploration defined the veins over a strike length of approximately 700 m, while the system has been traced for approximately 1.5 km. The gold-silver-tellurium vein system is comprised of two principal mineralized structures, the Main vein and the nearby Contact zone, that are thought to coalesce with depth, and a series of associated narrow veins and stringers. The veins occur mainly in foliated quartz diorite up to 250 m south of the thrust fault, and at its contact with the underlying clastic sedimentary rocks. The Main vein occurs 100 m to 250 m south of the thrust fault, generally strikes west and, where exposed at surface, dips from 20° – 45° to the north. However, underground mapping indicated that the dip of the Main vein reverses to a shallow southerly dip as it encroaches on the Contact zone, perhaps as a result of drag folding that occurred in response to normal movement along the reactivated thrust fault. The Contact zone occupies an area immediately above and sub-parallel to the thrust fault, striking to the west and dipping 55°-60° to the south. The veins have an apparent genetic and spatial association with an Eocene granodiorite stock. The vein system is offset by a number of northwest and northeast-trending post-mineral faults that create a number of individual vein segments. Gold-silver grades are erratic in both the Main vein and Contact zone. The highest grades of gold-silver vein mineralization are associated with consistently elevated levels of tellurium and commonly elevated levels of copper, zinc and lead.
In July, August, and September 2011, a total of 55 NQ2 diameter diamond drillholes, with an aggregate length of 3772.5 m, were completed on the Deer Horn property. A total of 49 drillholes targeted the two, known, west-trending mineralized structures, the Main Vein and Contact Zone, over a strike length of 875 m in the vicinity of the Deer Horn adit. Most of the drillholes were drilled on an azimuth of either 000 or 180 degrees, and were shallow, with lengths ranging from 26.5 m to 150.6 m. Limited surface channel sampling was also carried out primarily on exposures of the Main Vein. The other six drillholes targeted the historic ‘Harrison Scheelite’ tungsten occurrence following a limited prospecting and excavator trenching program. In September 2012, prospecting and surface sampling identified new vein showings that trace the Deer

PRELIMINARY ECONOMIC ASSESSMENT FOR THE DEER HORN PROPERTY
MAY 2018 PAGE 3
Horn system for more than 1500m further west of 2011 drilling, and identified several porphyry-style showings.
1.4 METALLURGICAL TEST WORK
Metallurgical test work on Deer Horn ore indicates that gold and silver mineralization is generally associated with copper and lead minerals. The test work indicates that zinc minerals are relatively barren of gold and silver but could be recovered into a saleable zinc product.
Flotation tests recovered more 95% of gold, silver, lead, copper and zinc at a grind size of 75 micron. These recoveries were achieved by producing a separate copper/lead concentrate and a zinc concentrates with combined concentrate mass pull of 7.6% from a sample head grade of 5.62 g/t Au, 284 g/t Ag, 0.15 % Cu, 0.68 % Pb, 0.85 % Zn.
Recovery projections for the PEA are based on tailings grades achieved in the metallurgical testwork.
1.5 RESOURCE
The effective date of the Mineral Resources is May 5, 2018. The Qualified Person for the estimates is Mr. Gary Giroux, P.Eng., of Giroux Consultants Ltd. The resource estimate was produced from a database consisting of 196 diamond drillholes completed from 1944 to 2011 and 42 surface samples. Geologic solids were built to constrain the Main and Footwall Veins as well as the Contact Zone. The individual gold, silver and tellurium assays were evaluated for each domain. The Contact Zone, and Main and Footwall veins were evaluated using lognormal cumulative frequency plots and capping levels for gold, silver, and tellurium were established for each domain. Composites 1 m in length were formed and semivariograms produced to determine the grade continuity within the various domains.
For the Contact Zone, the composites include a high grade vein system that cross cuts the lower grade stockwork and background mineralized zone. Therefore, to avoid overestimating the average grade of the Contact Zone, an indicator approach was used for the resource estimation.
Grades for gold, silver, and tellurium were interpolated into the Main and Footwall veins by ordinary kriging using composites from the appropriate vein. Grades for gold, silver and tellurium for the Contact Zone were estimated by a combination of ordinary and indicator kriging. Bulk densities were established for the mineralization using measured pieces of drill core.
Estimated blocks were classified as Indicated or Inferred based on grade continuity. The results within the mineralized zones at a 1 g/t Au cut-off show 414,000 tonnes averaging 5.12 g/t Au and 157.5 g/t Ag and 160 ppm Te classed as Indicated. The Indicated Tellurium resource was estimated with about ½ the data used to estimate the Indicated Au and Ag. Te represents a minor component to the projects economics. The reader should be aware that the confidence in the Indicated Te estimate is lower than the confidence in Indicated Au and Ag. An additional 197,000 tonnes averaging 5.04 g/t Au, 146.5 g/t Ag and 137 ppm Te classed as Inferred.
1.6 MINE PLANNING
A PEA production schedule, based on a 74,000 tonne per year mill feed rate, has been developed for the Deer Horn Project using open pit mining methods. Mining is assumed to be carried out by a contract miner

PRELIMINARY ECONOMIC ASSESSMENT FOR THE DEER HORN PROPERTY
MAY 2018 PAGE 4
as a summer only seasonal operation to avoid high snowfall winter conditions. This will require annual mobilization of the small mine fleet at the start of the season, and complete demobilization and removal of the mine fleet at the end of the summer season.
MMTS has produced a series of Lerchs-Grossman (“LG”) pit shell optimizations using the Deer Horn resource model with inferred classification included. The pit optimizations use mining, processing, tailing, general and administrative (“G&A”) costs, and process metal recoveries.
Cut off grade (“COG”) is determined using the Net Smelter Return (“NSR”) in $/t, which is calculated using Net Smelter Prices (“NSP”). The NSR (net of offsite concentrate and smelter charges and onsite mill recovery) is used as a cut-off item for break-even ore/waste selection. The NSP includes metal prices, US currency exchange rate, and offsite transportation, smelting, and refining charges. The metal prices from three year trailing averages and resultant NSPs used are shown in Table 1-1.
Table 1-1 Metal Prices and NSP
Metal Price (US$) NSP (Cdn$)
Au 1,300 /oz 49.3/g Ag 17.00/oz 0.581/g Te 70.00/kg 0.037/g
Assumes Forex of 0.80 US$ per Cdn$
Factors that may affect the pit delineated resource estimates include: metal price assumptions, changes in interpretations of mineralization geometry and continuity of mineralization zones, changes to compositing or kriging assumptions, metallurgical recovery assumptions, operating cost assumptions, confidence in the modifying factors, including assumptions that surface rights to allow mining infrastructure to be constructed will be forthcoming, delays or other issues in reaching agreements with local or regulatory authorities and stakeholders, and changes in land tenure requirements or in permitting requirements from those discussed in this Report.
The ultimate pit limits in this study are selected where an incremental increase in pit size does not significantly increase the pit resource, or an incremental increase in the pit resource results in only marginal economic return. This establishes the limits to the mineable resource base for the mine design work.
Detailed pit phases have been developed from the results of the LG sensitivity analysis integrating pit slope criteria and highwall roads where required. The ultimate pit has been divided into smaller mining phases, or pushbacks, to allow targeting of high grade, low strip ratio zones early in the mine life, and for more even waste stripping in the optimized scheduling stage of the project design.
The Pit Delineated Resource shown in Table 1-2 includes allowance for 50% mining dilution and assumes a waste/ore COG of $29/t NSR. The dilution grades provided in Table 1-3 represent the average grade of the waste item in the resource model.

PRELIMINARY ECONOMIC ASSESSMENT FOR THE DEER HORN PROPERTY
MAY 2018 PAGE 5
Table 1-2 Pit Delineated Resource
Pit Mill Feed AU AG TE CU PB ZN Waste Strip
kt g/t g/t ppm % % % kt Ratio
D651 12 8.17 222.9 62.4 0.07 0.018 0.20 147 12.3
D652 87 4.43 163.3 153.5 0.26 0.035 0.43 216 2.5
D653i 21 5.99 176.5 176.4 0.09 0.037 0.32 107 5.1
D654i 365 3.34 92.4 99.6 0.08 0.019 0.19 3,169 8.7
D655i 169 3.65 132.0 134.7 0.20 0.048 0.41 3,382 20.0
Total 656 3.73 117.1 117.6 0.14 0.029 0.28 7,022 10.7 Note: The pit delineated resource includes Inferred that is considered too speculative geologically to have the economic considerations applied to them that would enable them to be categorized as mineral reserves, and there is no certainty that they will be converted to Measured or Indicated.
Table 1-3 Dilution Grades
Au (g/t) 0.13
Ag (g/t) 5.1
Te (ppm) 7.2
Cu (%) 0.005
Pb (%)
0.001
Zn (%) 0.011
Pit Delineated Resource by assurance of existence class is show in Table 1-4.
Table 1-4 Pit Delineated Resource by assurance of existence class
Class Mill Feed AU AG TE CU PB ZN
kt g/t g/t ppm % % %
Indicated 535 3.52 109.8 114.2 0.14 0.026 0.27
Inferred 121 4.70 149.7 132.5 0.14 0.045 0.33
Note: Inferred material is considered too speculative geologically to have the economic considerations applied to them that would enable them to be categorized as mineral reserves, and there is no certainty that they will be converted to Measured or Indicated.

PRELIMINARY ECONOMIC ASSESSMENT FOR THE DEER HORN PROPERTY
MAY 2018 PAGE 6
A summary of the production schedule is provided in Table 1-5.
Table 1-5 Summarized Production Schedule
Year Mill Feed AU AG TE CU PB ZN Waste Strip
kt g/t g/t ppm % % % kt Ratio
-1 475 7.0
1 74 5.71 181.3 149.9 0.18 0.034 0.36 476 6.4
2 74 3.56 137.5 135.1 0.20 0.048 0.39 514 6.9
3 74 3.95 126.1 127.8 0.14 0.029 0.36 821 11.1
4 74 3.00 87.1 92.9 0.07 0.020 0.18 800 10.8
5 74 2.81 64.3 76.4 0.06 0.009 0.12 800 10.8
6 74 3.96 95.4 106.9 0.07 0.006 0.11 800 10.8
7 74 3.55 111 106.5 0.14 0.017 0.23 962 13.0
8 74 3.61 130.6 137.2 0.21 0.058 0.45 983 13.3
9 64 3.42 121.2 126.5 0.17 0.044 0.35 391 6.1
Total 656 3.73 117.1 117.6 0.14 0.029 0.28 7,022 10.7
Deer Horn mining operations will be typical of small open pit operations in mountainous terrain in western Canada and will employ accepted selective mining methods and equipment. There is considerable operating experience and technical expertise for the proposed operation in western Canada. Services and support in BC and in the local area are well-established.
A small capacity mining operation is being designed suitable for experienced contract miners. Mining equipment is similar in size to typical fleets used in civil construction projects. Several suitable contractors are available in the region.
1.7 PROCESSING
Deer Horn deposit ore will be processed using a conventional flowsheet including crushing, grinding, and flotation to produce base metal concentrates with precious metals. The processing plant is a 500 tpd mill feed plant that will only operate during summer months and avoid operating during the high snowfall winter periods.
1.8 TAILINGS MANAGEMENT AND WASTE ROCK STORAGE
Placement of mine waste rock and process tailings is designed to minimize the project footprint. Flotation tailings will be filtered. Waste rock and filtered tailings are placed in a gulley below the pit area. Waste rock will be placed as a containment buttress for the tailings, and the tailings will be co-mingled with waste rock upon deposition. Some waste rock is backfilled into the mined out pit at the end of the mine life. A collection pond for sediment control will be placed downstream of the waste rock and tailings to intercept any seepage from the tailings or water runoff from the waste.
1.9 SITE GENERAL ARRANGEMENT
Figure 1-1 is shows an overview of the general arrangement of the Deer Horn project.

PRELIMINARY ECONOMIC ASSESSMENT FOR THE DEER HORN PROPERTY
MAY 2018 PAGE 7
Figure 1-1 Deer Horn Mine General Arrangement

PRELIMINARY ECONOMIC ASSESSMENT FOR THE DEER HORN PROPERTY
MAY 2018 PAGE 8
1.10 ENVIRONMENTAL CONSIDERATIONS
The proposed Deer Horn mine has a relatively small footprint and low expected environmental impact. Environmental and related studies are estimated to take less than one year to complete if the permit application proceeds through the regulatory process as a “small mine” application under the British Columbia Mines Act.
Despite the proximity of nearby protected areas, the Deer Horn Project is located near areas that have significant industrial activity. Proposed impacts to fish, wildlife and water do not appear to be significant, and First Nations engagement appears to be positive. Community support is anticipated as the area has similar mining activities in the vicinity of the proposed mine, and economic and employment opportunities are expected.
1.11 CAPITAL AND OPERATING COST
Capital and operating costs are factored estimates derived from a combination of MMTS experience in similar projects and consultation with contractors and equipment suppliers. The estimated capital costs breakdown is shown in Table 1-6. All currencies are expressed in Canadian dollars unless otherwise stated.
The expected accuracy range of the capital cost estimate is +/- 30 %.
Table 1-6 Deer Horn Capital Cost Estimate
Capital ($ Millions)
Direct Capital Cost Mining 3.6
Process 7.2
Tailings and Water Management 2.3
Infrastructure 6.5
Total Direct Capital Costs 19.6
Indirect Capital Cost Owner’s Costs 1.4
Indirects 2.6
Total Indirect Capital Cost 4.0
Contingency (20 %) 4.7
Total Capital 28.3

PRELIMINARY ECONOMIC ASSESSMENT FOR THE DEER HORN PROPERTY
MAY 2018 PAGE 9
The capital costs include delivery to the site and assembly but do not include the following:
• Force majeure • Schedule delays such as those caused by:
o major scope changes o unidentified ground conditions o labour disputes o environmental permitting activities o abnormally adverse weather conditions
• Cost of financing (including interests incurred during construction) • HST • Royalties • Cost of this study • Sunk costs
The estimated operating costs are summarized in Table 1-7. The expected accuracy range of the operating cost estimate is +/-30 %.
Table 1-7 Deer Horn Operating Cost Summary
Operating Cost Units Mining 44 $/t mill feed Process 30 $/t mill feed G&A 20 $/t mill feed Total Operating Cost 94 $/t mill feed
1.12 ECONOMIC EVALUATION
The results of the economic analyses discussed in this section represent forward looking information as defined under Canadian securities law. The results depend on inputs that are subject to a number of known and unknown risks, uncertainties and other factors that may cause actual results to differ materially from those presented here.
Information that is forward-looking includes:
• Mineral Resource estimates;
• Assumed commodity prices and exchange rates;
• The proposed mine production plan;
• Projected recovery rates;
• Sustaining costs and proposed operating costs;
• Assumptions as to closure costs and closure requirements;
• Assumptions as to environmental, permitting and social risks.
Additional risks to the forward-looking information include:

PRELIMINARY ECONOMIC ASSESSMENT FOR THE DEER HORN PROPERTY
MAY 2018 PAGE 10
• Changes to costs of production from what is assumed;
• Unrecognized environmental risks;
• Unanticipated reclamation expenses;
• Unexpected variations in quantity of mineralised material, grade, or recovery rates;
• Geotechnical and hydrogeological considerations during mining being different from what was assumed;
The economic evaluation of the Deer Horn Project includes one year of construction and 9-years of mining and milling. Corporate sunk costs including costs for exploration, technical studies, and permitting, are excluded from the initial capital but have been considered in the estimation of tax depreciation pools.
The inferred material included in the preliminary economic analysis is considered too speculative geologically to have the economic considerations applied to them that would enable them to be categorized as mineral reserves, and there is no certainty that the preliminary economic assessment will be realized.
The Deer Horn economic evaluation is summarized in Table 1-8.
Table 1-8 Economic Results for Price Case Scenarios
Item Unit Value Gold Price US$/Oz $1,300 Silver Price US$/Oz $17 Tellurium Price US$/kg $100 Copper Price US$/lb $3 Zinc Price US$/lb $1 Currency exchange rate C$:US$ 0.79 Pre-Tax NPV (5%) C$ M $56.6 Post-Tax NPV (5%) C$ M $36.5 Pre-Tax IRR % 56% Post-Tax IRR % 42% Pre-Tax Payback Years 1.3 Post-Tax Payback Years 1.6 LOM Gold Production Oz 72,560 LOM Silver Production Oz 2,144,014 LOM Tellurium Production kg 66,722 LOM Copper Production lb 1,680,919 LOM Zinc Production lb 3,633,269
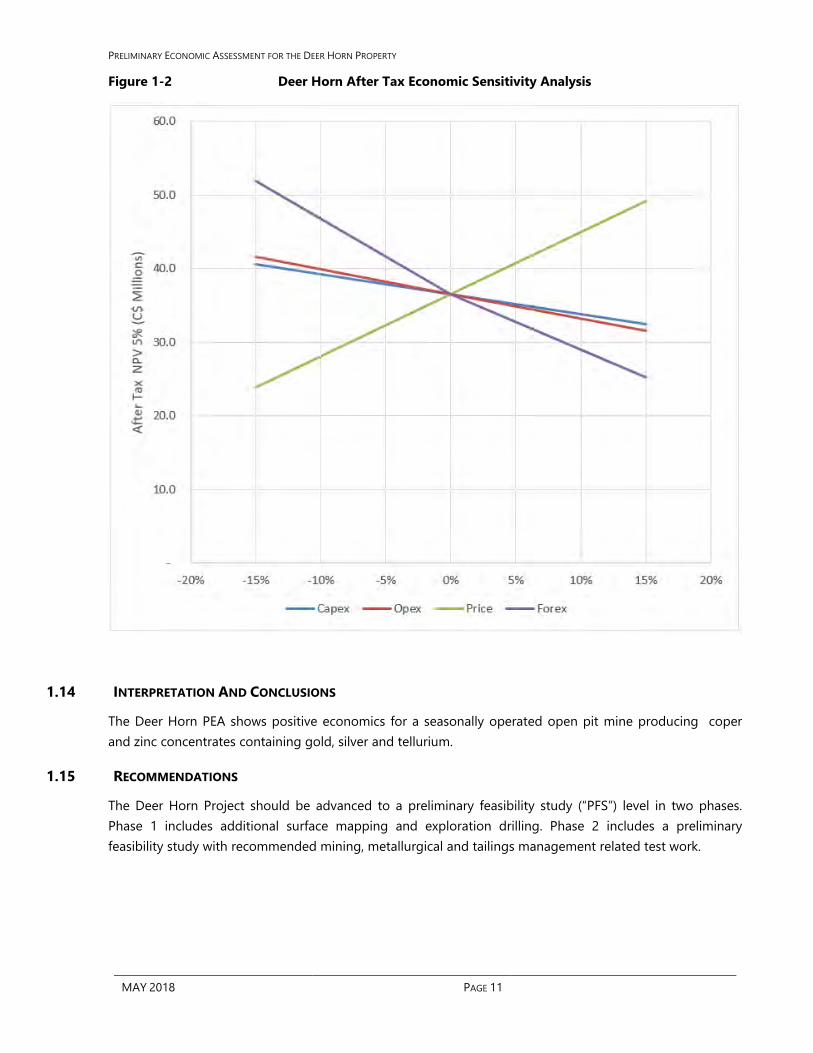
1.13 ECONOMIC SENSITIVITY ANALYSIS
Sensitivity of NPV at 5 % discount rate to the major cash flow inputs are shown graphically in Figure 1-2. Project NPV is most sensitivity to metal prices and foreign exchange rate assumption and less sensitive to capital cost. Sensitivity to metal grades is reflected by the sensitivity to price assumption.
PRELIMINARY ECONOMIC ASSESSMENT FOR THE DEER HORN PROPERTY
MAY 2018 PAGE 11
Figure 1-2 Deer Horn After Tax Economic Sensitivity Analysis
1.14 INTERPRETATION AND CONCLUSIONS
The Deer Horn PEA shows positive economics for a seasonally operated open pit mine producing coper and zinc concentrates containing gold, silver and tellurium.
1.15 RECOMMENDATIONS
The Deer Horn Project should be advanced to a preliminary feasibility study (“PFS”) level in two phases. Phase 1 includes additional surface mapping and exploration drilling. Phase 2 includes a preliminary feasibility study with recommended mining, metallurgical and tailings management related test work.

PRELIMINARY ECONOMIC ASSESSMENT FOR THE DEER HORN PROPERTY
MAY 2018 PAGE 12
2.0 INTRODUCTION This technical report was prepared for Deer Horn Capital Inc. (DHC), a public company actively trading on the TSX Venture Exchange, to assess the preliminary economics of the Deer Horn property.
DHC entered into a mineral property option agreement dated August 13, 2009 with Guardsmen Resources Inc. up to a 75% interest in and to certain mineral claims known as the Deer Horn property, located in the Omineca Mining Division, British Columbia. Under the terms of the agreement, DHC acquired a 50% interest in the Deer Horn property by having spent $5,000,000 in work expenditures on the property within the stipulated 4 year period. DHC can acquire an additional 25% interest in the property by paying the costs required to bring the property to commercial production.
This revised report is written at the request of DHC by Tracey Meintjes, P.Eng., Marc Schulte, P.Eng., Bob Lane, P.Geo., and Gary Giroux, P.Eng., who are all independent qualified persons as defined under NI 43-101.
Tracey Meintjes is responsible for the metallurgy and process designs, infrastructure layouts, environmental and socio-economic impacts, capital and operating cost estimates, economic evaluations, and overall report preparation (Sections 1-3, 13, 17-27). Marc Schulte is responsible for the mine plans (Sections 15 and 16). Bob Lane is responsible for the geological components of this report (Sections 4-12). Gary Giroux is responsible for the NI 43-101 resource estimate contained herein (Section 14). Bob Lane visited and took part in the 2009 exploration program, the 2011 exploration program (July 13-15, July 28-31, August 5-9, August 14-17, and September 13-14), and a brief 2012 exploration program (September 8-20, 2012).
This report discloses all scientific and technical information concerning the Deer Horn property and has been prepared in accordance with NI 43-101. Parts 4 through 6 are reproduced from an earlier compilation report entitled ‘Updated Resource Estimate for the Deer Horn Gold-Silver-Tellurium Project’ dated April 17, 2012. It is understood that this report may be required for material disclosure. Property visits by Bob Lane, P.Geo., as required under the terms and conditions of NI 43-101 – Standards of Disclosure for Mineral Projects, took place in July, August and September, 2011, and most recently in September, 2012, during active phases of exploration.
The authors have given their approval for this document to be used in support and maintenance of DHC’s public financings.

PRELIMINARY ECONOMIC ASSESSMENT FOR THE DEER HORN PROPERTY
MAY 2018 PAGE 13
3.0 RELIANCE ON OTHER EXPERTS Bob Lane, P.Geo., supervised and participated in the Company’s 2009, 2011 and 2012 exploration and diamond drilling programs on the Deer Horn property.
Descriptions of the property geology and mineralization are a blend of personal observation, and observations made by a team of geologists consisting of Barney Bowen, Cam Scott, Don Strachan, Lee Groat and Luke Marshall who logged drill core and conducted field work in 2011.
Prior to the field visits, and in preparation for writing the revised Deer Horn NI 43-101 report, Bob Lane, P.Geo., reviewed the contents of historical information provided by Guardsmen, including numerous published and unpublished reports summarizing previous exploration work on the property. Those materials were supplemented by published and available studies that document bedrock mapping and geological fieldwork conducted by the Geological Survey Branch of the British Columbia Ministry of Energy, Mines and Petroleum Resources (“MEMPR”). A list of sources used to construct this report is provided in References, Section 27.
Bob Lane, P.Geo., has relied upon information sourced from published scientific papers, published assessment reports, unpublished property reports, and personal communications found in historical files. The previous fieldwork was either carried out or supervised by experienced, professional geologists and is considered to be of a very high standard.
The authors have also relied upon:
• Publicly available information from government websites and other publications
• mineral tenure ownership information posted on the government web sites, and;
• initial metallurgical testwork conducted by Coastech Research Inc.

PRELIMINARY ECONOMIC ASSESSMENT FOR THE DEER HORN PROPERTY
MAY 2018 PAGE 14
4.0 PROPERTY DESCRIPTION AND LOCATION 4.1 LOCATION
The Deer Horn property is situated immediately north of Lindquist Lake, about 135 km southwest of the community of Burns Lake and 36 km south of the Huckleberry mine, in west-central British Columbia (Figure 4-1). The property is located on BCGS map 093E.034 and centered at approximately 614000E, 5914000N (Zone 9, NAD 83) or on NTS Map 93E/6W and centered at Latitude 53°21’43”N and Longitude 127°17’19”W.
4.2 MINERAL DISPOSITIONS
The present claim configuration of the property consists of 18 Mineral Titles Online (MTO) cell mineral claims. The 18 claims are contiguous and cover approximately 5133.26 hectares of land available for exploration (excluding major lakes and protected areas) in the Omineca Mining Division of British Columbia. The mineral claims that comprise the Deer Horn property are listed in Table 4-1 and are shown in Figure 4-2.
4.3 OWNERSHIP
The 18 cell mineral claims that comprise the Deer Horn property are shown in the MTO website as owned 100% by Guardsmen. Guardsmen has indicated that there are no underlying royalties or encumbrances associated with the claims.
4.4 TENURE RIGHTS
The present mineral tenure rights are 100 % owned by DHC and Guardsmen. There are no other agreements, liens, judgments, debentures, royalties, or back-in rights known to the author. The claims abut Tweedsmuir Provincial Park and the Kitlope Heritage Conservancy. There are no surface tenure rights over the mineral dispositions known to the authors.
There is no tree harvesting activity within the area encompassed by the mineral tenures and no special forest management exists (e.g. crown-granted woodlots). The registered guide-outfitters for the area are Karl Seitzinger (registration number 604G009) and Dennis Schlauch (registration number 601G045). The registered trappers for the area are William Palmer (trapline 604T044), Violet Amos (trapline 603T036), and a vacant trapline (trapline 603T113).

PRELIMINARY ECONOMIC ASSESSMENT FOR THE DEER HORN PROPERTY
MAY 2018 PAGE 15
Figure 4-1 Deer Horn Property - Location
PRELIMINARY ECONOMIC ASSESSMENT FOR THE DEER HORN PROPERTY
MAY 2018 PAGE 16
4.5 RESOURCES, RESERVES, DEVELOPMENT & INFRASTRUCTURE
The Deer Horn property is considered to be at an intermediate to advanced stage of exploration. Historically, at least three calculations of gold and silver content have been made and these figures have appeared in print and have been referenced and/or reported in a number of mineral deposit compilations. An initial NI43-101 resource estimate was calculated in 2010 by Gary Giroux (Lane and Giroux, 2010), followed by an updated resource estimate that included gold, silver and tellurium in 2012 by Gary Giroux (Lane and Giroux, 2012),
The Deer Horn property lacks any significant infrastructure. However, a barge landing and road that was cleared of slide alder and modestly upgraded in 2009, provides access to the property and a seasonal exploration camp. There is no mining infrastructure on the property apart from the historic, but intact Deer Horn adit which is described below.
4.6 ENVIRONMENTAL LIABILITIES
There are no known environmental liabilities attached to the Deer Horn project. Unreclaimed disturbance related to past mineral exploration consists of a 7.8 km road to the site from the south shore of Whitesail Lake, a limited number of drill access roads and drill sites, and the Deer Horn adit and underground workings, which remain open. Most of this disturbance relates to exploration conducted during the 1940’s and 1950’s and was not reclaimed. However, the site access road and a number of drill access roads were reopened in 2009 to support the fall exploration drilling program. Rehabilitation of the access consisted of removing vegetation, consisting mainly of slide alder, and slide debris from the road bed and back-blading the road surface.
4.6.1 1989 ASSESSMENT
Water quality and acid rock drainage (“ARD”) studies were conducted by a previous property owner, Golden Knight Resources Inc. (“Golden Knight”), in 1989. Water sampled from five creeks on the property was reported to be ‘pure’, while a low volume of water (estimated rate of 1-2 litres per second) being issued from the Deer Horn adit contained dissolved zinc (0.31 mg/l) that measured above the provincial mining objective of 0.2 mg/l (Folk, 1990a). Fifteen rock samples were analyzed for their potential to generate ARD. Eleven of fifteen samples returned negative net neutralizing potential (“NNP”) numbers, indicating that there is potential for ARD to develop (Folk, 1990a). However, these samples were collected from high-grade drill core intersections of the Main Vein, of the Contact Zone or from underground zones of quartz stringers, of immediate hanging wall or of immediate footwall. The results at the time of the study were believed to be indicative of the sulphide content of the ore zones which would be accounted for in mine design and tailings disposal.
4.6.2 2009 ASSESSMENT
Ecofor Consultants of Fort St. James, BC were contracted to conduct a state of the environmental baseline for the Deer Horn project and initiated field sampling and assessment for several environmental disciplines in the fall of 2009. Ecofor initiated a water quality study at six stations within the local study area, including one station at the Deer Horn adit. Prior to commencement of the program Ecofor met with the BC Ministry of Environment (“MoE”) staff to review the proposed water quality baseline assessment and ensure sites and measured parameters met the MoE guidelines. Two sampling events were conducted prior to winter freeze, in September and October of 2009. Low water flows and frozen conditions precluded a November event.

PRELIMINARY ECONOMIC ASSESSMENT FOR THE DEER HORN PROPERTY
MAY 2018 PAGE 17
Results obtained from the October set of samples were considerably higher than the September set for certain parameters. The high level of total metals recorded at the Deer Horn adit and two other sites are reflective of the high turbidity and total suspended solids recorded at each station. However, the shallow nature of the streams and an abundance of snow made collecting “clean” water samples extremely difficult.
The results obtained from the two sampling sessions were then compared to the BC guideline for protection of aquatic health to determine if the water quality is meeting standard guidelines. Guidelines were not being met for certain elements at the Deer Horn adit site (dissolved zinc in September and October; total aluminum, arsenic, lead and copper in October) or for a restricted number of elements at four of the other sites (Dup-A1 total aluminum in October, A2 total aluminum, lead and silver in October, A4 fluoride in October, and C1 total aluminum in October). These findings were consistent with Golden Knight’s 1989 water quality analytical results.
A preliminary ARD/Metal Leaching (“ARD/ML”) assessment was conducted along the access road after re-opening. The entire length of the access road is routed through coarse-grained, foliated granodiorite. No exposures of pyrite or sulphide bearing material were found and no ABA samples were collected.
Preliminary ABA sampling and analysis was conducted for hangingwall and footwall rocks and there are no anticipated acid rock drainage or metal leaching concerns.
4.7 PERMITS
Prior to the commencement of any exploration work that constitutes mechanical disturbance of the ground, an application must be made, and approval and a permit received from the MEM. Any proposed work involving significant exploration-related mechanical ground disturbance would also require the proponent to post with the Crown a reclamation security (bond) of an appropriate amount to cover the third-party costs of reclamation in the event of failure of the company to complete the reclamation work. The current exploration permit for the Deer Horn property is MX-1-737 and is held by Guardsmen. The existing reclamation security, held by the B.C. Minister of Finance under the permit, is $82,000.
On April 8, 2013, a permit for a multi-year area-based (“MYAB”) exploration program on Deer Horn property was submitted to the MEMPR and referred by it to other resource agencies. As a condition of the permit, and prior to its issuance, Guardsmen was required to post an additional $40,000 of reclamation security. This was not done and the permit application was not approved. A 2018 permit application is currently under development and will be submitted to the MEMPR in May 2018 for review and approval. A revised reclamation bond calculator has been adopted by the MEMPR and is expected to result in a further increase to the reclamation security for the property.
Table 4-1 Deer Horn Property - Mineral Tenure
Tenure Number
Claim Name Owner* Tenure Type
Issue Date Good To
Date Area (ha)
520025
131812 (100 %) Mineral 2005/sep/15 2027/dec/15 1,350.55

PRELIMINARY ECONOMIC ASSESSMENT FOR THE DEER HORN PROPERTY
MAY 2018 PAGE 18
529884 DEERHORN 1 131812 (100 %) Mineral 2006/mar/10 2027/dec/15 463.13
529885 DEERHORN 2 131812 (100 %) Mineral 2006/mar/10 2027/dec/15 482.26
529886 DEERHORN 3 131812 (100 %) Mineral 2006/mar/10 2027/dec/15 482.08
529887 DEERHORN 4 131812 (100 %) Mineral 2006/mar/10 2027/dec/15 462.78
529947 DEERHORN 5 131812 (100 %) Mineral 2006/mar/12 2027/dec/15 482.10
543636 DEER HORN 2006 131812 (100 %) Mineral 2006/oct/19 2027/dec/15 212.19
545108 DEER HORN WEST 131812 (100 %) Mineral 2006/nov/10 2027/dec/15 482.43
545110 DEER HORN SOUTHWEST 131812 (100 %) Mineral 2006/nov/10 2027/dec/15 482.52
545112 DEER HORN NORTHWEST 131812 (100 %) Mineral 2006/nov/10 2027/dec/15 270.06
545113 DEER HORN SOUTH
FRACTION 131812 (100 %) Mineral 2006/nov/10 2027/dec/15 57.91
545114 DEER HORN GLACIER
FRACTIO 131812 (100 %) Mineral 2006/nov/10 2027/dec/15 38.58
545115 DEER HORN NORTH 131812 (100 %) Mineral 2006/nov/10 2027/dec/15 482.00
545116 DEER HORN NORTHEAST 131812 (100 %) Mineral 2006/nov/10 2027/dec/15 231.35
545118 DEER HORN MOLY 131812 (100 %) Mineral 2006/nov/10 2027/dec/15 77.16
594795 DH CONNECTOR 131812 (100 %) Mineral 2008/nov/24 2027/dec/15 443.35
988582 DH B1 131812 (100 %) Mineral 2012/may/21 2027/dec/15 57.85
988583 DH B2 131812 (100 %) Mineral 2012/may/21 2027/dec/15 38.57
* The 100 % owner-of-record of all of the Deer Horn mineral tenure is Guardsmen Resources Inc.

PRELIMINARY ECONOMIC ASSESSMENT FOR THE DEER HORN PROPERTY
MAY 2018 PAGE 19
Figure 4-2 Deer Horn Property - Mineral Tenure

PRELIMINARY ECONOMIC ASSESSMENT FOR THE DEER HORN PROPERTY
MAY 2018 PAGE 20
5.0 ACCESSIBILITY, LOCAL RESOURCES, CLIMATE, INFRASTRUCTURE AND PHYSIOGRAPHY 5.1 ACCESS
Access to the property is via helicopter, float plane or barge. Helicopter and float plane bases are located in numerous nearby communities that lie to the north, such as Houston, Burns Lake and Smithers. Flight times to the property are typically one hour or less. The communities of Bella Coola and Kitimat, which lie to the west, are also about a one hour flight from the property.
Transportation to the property by barge would facilitate the most cost-effective means of delivering heavy equipment to the property. The barge would depart from Andrews Bay or the East Ootsa logging camp on Ootsa Lake to the south end of Whitesail Lake. An overgrown 7.8 km road extends from the barge landing to the area of interest in the alpine. The principal showings of interest, including the Deer Horn adit, are at an elevation of about 1,290 m.
5.2 LOCAL RESOURCES
The Deer Horn property falls within the administrative boundary of the Nadina Forest District of the Northern Interior Forest Region. The project also falls within the administrative boundary of the Lakes Land and Resource Plan Area (Lakes LRMP), for which a provincial government approved land use plan was adopted in January 2000. The Lakes LRMP is a consensus built land use plan that directs the management of resources by land managers, resource proponents, and resource agency staff. All land use and resource management within the Lakes LRMP are subject to existing legislature, policies, and regulations for Crown land and resource management.
During development of the Lakes LRMP, all recognized resource values were evaluated with a view to integrating resource development with recognized conservation values and the biodiversity of the land base. Other significant resources were evaluated during the formation of the plan including timber, fisheries, water quality, wildlife, agriculture, range, outdoor recreation and tourism, along with subsurface resources (mining and exploration). Tweedsmuir North Provincial Park and Tweedsmuir South Provincial Park form one of British Columbia’s largest parks and was created in 1938. Land use within park boundaries is regulated by the Tweedsmuir Master Plan, which was released to the public in 1988. The park is roughly triangular in shape and protects a number of ecosystems. Backcountry hiking, fishing and camping opportunities exist for visitors to the park.
5.2.1 WILDLIFE & FISHERIES
The Deer Horn project falls within the Lakes North Sustainable Resource Management Plan (Lakes North SRMP) area of the Nadina Forest District. The plan is consistent with, and builds upon, the provisions of the Lakes LRMP. The plan includes seven landscape units encompassing 451,105 ha of which 404,556 ha is Crown forest land.
The Lakes North SRMP area has a diversity of fish populations inhabiting the rivers and lakes. Several fish species require specific management objectives, with other species being managed indirectly. Although riparian and biodiversity retention provide habitat for a large number of species, wildlife management for individual species is also necessary. This represents a fine filter component of the provincial approach to biodiversity. Selected species are also of particular importance to First Nations, guide-outfitters, trappers, hunters and non-consumptive wildlife users. A number of legislated Wildlife Habitat Areas (WHAs) exist in
PRELIMINARY ECONOMIC ASSESSMENT FOR THE DEER HORN PROPERTY
MAY 2018 PAGE 21
the Lakes North SRMP area. These areas contain various species including mule deer, mountain caribou, mountain goat, moose, grizzly bear, and fur bearers.
5.3 CLIMATE AND PHYSIOGRAPHY
The climate of the Deer Horn property is typical of north-central of British Columbia. Summer temperatures average daytime highs in the 20°C range with occasional temperatures reaching the low 30°C range. October through April sees average subzero temperatures with extreme lows reaching -30°C from November through March.
The Deer Horn property is located on the edge of the Coast Range and topography is fair to relatively rugged. Elevation on the property ranges from approximately 865 m at Kenney Lake to 1788 m on Lindquist Peak. The Deer Horn workings are primarily located above the treeline on the southeastern slope of Lindquist Peak, north of Lindquist Lake.
The predominant soil development is humo-ferric podzols. The bioclimatic zone varies from Spruce-Subalpine Fir with leading growth of pine, popular and spruce; this gives way to Alpine Tundra marked by stunted juniper, sedges and grasses at higher elevations. Seepages are widespread, notable by thick peat accumulations and an undergrowth of mountain alder.
There is an ample water supply for all exploration and camp requirements from numerous drainages that are fed by a snow pack that remains at higher elevations year-round, particularly on the north facing slopes. Snow begins to accumulate by late-September and the lakes are frozen throughout the winter months. The summer months are highly influenced by coastal weather. The most dependable weather forecasts for the property are those issued for the town of Kitimat.
5.4 INFRASTRUCTURE
The small towns of Smithers, Burns Lake, and Houston, located north of the Deer Horn property, are population centres that offer services, supplies, and sources for skilled labour. Field operations are generally conducted with crews located in a camp setting on the Deer Horn property. Seasonal access to the property from the barge landing on the south shore of Whitesail Lake was developed in the 1950’s and rehabilitated in 1989. It is now overgrown and in need of additional rehabilitation to support an exploration program. There is no nearby electrical power grid. Year round working conditions are hampered by extended periods of cold weather, snow accumulation and local avalanche conditions, and access roads requiring snow clearing.

PRELIMINARY ECONOMIC ASSESSMENT FOR THE DEER HORN PROPERTY
MAY 2018 PAGE 22
6.0 HISTORY The Deer Horn property, or Harrison property as it was originally known, was first staked in 1943 by the Harrison brothers following their discovery of scheelite in talus about one km southwest of Lindquist Peak. Discovery of nearby gold and silver bearing veins was made in 1944 by Franc Joubin (Joubin, 1950). Prior to DHM’s involvement, four phases of mechanical exploration had taken place on the Deer Horn property since it was first staked. Pioneer Gold Mines of BC Limited (“Pioneer”) optioned the property in 1944 and completed extensive trenching and diamond drilling until allowing its option to lapse in 1946. The property was inactive from 1947 until 1951 when newly formed Deer Horn Mines Limited purchased the Harrison property outright. It explored the property from 1951 to 1955. During that period the company constructed a road from the shores of Whitesail Lake to the property and developed an exploration adit and conducted underground and surface diamond drilling. Field work in support of a Master’s Thesis on the geology of the deposit was also completed during this time (Papezik, 1957). In 1967, Granby Consolidated Mining, Smelting and Power optioned the property and completed further road work and extensive machine trenching. The property reverted to the Crown in 1975 and was the subject of possible addition to Tweedsmuir Provincial Park. A temporary ‘No Staking Reserve’ covered the area. The ‘No Staking Reserve’ was lifted in 1989 and the creation of specific enclaves in the north Tweedsmuir Provincial Park area were created to allow claim staking and exploration to recommence in areas regarded to be highly prospective.
In 1989, the British Columbia Government put part of the area, which covered what was then ‘parceled’ claims XK1214, XK1414 and XK1412, as well as an additional three claims located immediately to the west, up for bid. The six claims covered a total of 24 square km including the prospective Deer Horn vein system and were awarded to Golden Knight. The surrounding ground was made available for one-post staking and twelve claims were acquired by Michael Renning and Scott Gifford, the principals of Guardsmen. Ownership of the twelve claims was later transferred to Guardsmen. Modest geophysical and geochemical programs were conducted on some of these peripheral claims in 1990 by Amber Minerals Ltd. on behalf of Guardsmen.
Through 1989 and 1990, Golden Knight carried out extensive exploration programs that included: prospecting; geological mapping and sampling; grid-based soil geochemical sampling; VLF and magnetometer surveying; rehabilitation, mapping and chip sampling of the underground workings; 4,511 m of surface diamond drilling; environmental water sampling and preliminary metallurgical testing. The Golden Knight work was the last mechanical exploration to occur on the property before 2009. A summary of the diamond drilling programs is presented in Table 6-1.
Repadre Capital acquired the assets of Golden Knight in 1990, but sold the claims to Guardsmen in 2000. In that year, Guardsmen completed a modest field review of the property, and in 2005 converted all of its legacy claims to modern MTO cell mineral claims. Christopher James Gold Corp (“Christopher James”) optioned the property from Guardsmen in 2006 and in 2006-2007, conducted a reconnaissance geochemical sampling program over several areas of the property. Christopher James later dropped its option and the property reverted back to Guardsmen. In 2009, Guardsmen optioned the property to Golden Odyssey Mining Inc. (which became Deer Horn Capital). In the fall of 2009 it drilled a total of 35 NQ and HQ diameter diamond drillholes, with an aggregate length of 1,706 m. All available surface and drilling data was used to support the calculation of a resource estimate for the Deer Horn property in 2010.

PRELIMINARY ECONOMIC ASSESSMENT FOR THE DEER HORN PROPERTY
MAY 2018 PAGE 23
Table 6-1 Summary of Diamond Drilling, Deer Horn Property
Company Hole Designation Year # of
Holes Metres Drilled
Pioneer Gold Mines of BC Limited
XR-
(data for 14 holes is missing) 1944-1946 30 3,822
Deer Horn Mines Limited
DDH-
(data for holes 8, 11, 12, 22, 24, 26 and 28 is missing) 1951-1955 37 2,497.2
Golden Knight Resources Inc
89-
90-
1989
1990
31
29
2,253.4
2,256.2
Golden Odyssey Mining Inc DH09- 2009 35 1,706
Deer Horn Metals DH11- 2011 55 3772.5
Total 217 16,307
6.1 PIONEER GOLD MINES OF B.C. LIMITED
In 1944, Pioneer Gold Mines of B.C. Limited (“Pioneer”) optioned the Deer Horn property and built a pack trail from the south shore of Whitesail Lake to the property (Holland, 1945). From 1944 to 1946 Pioneer completed limited surface sampling and a total of 3,822 m of surface diamond drilling on the Main vein. This work determined that the vein was faulted into a series of disjointed vein segments that dip gently to the north. The Main vein was traced down-dip for approximately 45 m where it met the Contact zone or vein, a series of narrow stringers and quartz veins up to 1.2 m across that dip 55° to the south (Duffell, 1959).
Pioneer outlined eight segments or panels of the Main vein that ranged in dimension from: 7.6 m long by 1.3 m wide with an estimated average grade of 7.44 g/t Au and 54.9 g/t Ag, to: 82 m long by 3.3 m wide with an estimated average grade of 10.08 g/t Au and 281.1 g/t Ag (Holland, 1946; Duffell, 1959). Despite promising results, Pioneer Gold Mines was unable to meet the financial obligations of its option and following the 1946 field season, its option on the property was allowed to lapse (Joubin, 1950).
Little exploration took place between 1947 and 1950, but the central part of the property was geologically mapped in 1950 by Joubin (1950).
6.2 DEER HORN MINES LIMITED
The Deer Horn property was purchased by Deer Horn Mines Limited (Deer Horn Mines) in 1951. In 1952 the company embarked on a program of trench rehabilitation, re-examining drill core and other surface works. During the period 1953 to 1955, the company constructed a road from the shores of Whitesail Lake to the property and completed 913.5 m of surface diamond drilling (Bacon, 1956). Drill results from a segment of the Main vein (location unknown) measuring 180 m long, averaging 3.4 m wide and traced for 60 m down

PRELIMINARY ECONOMIC ASSESSMENT FOR THE DEER HORN PROPERTY
MAY 2018 PAGE 24
dip averaged 9.70 g/t Au and 284.6 g/t Ag (results reported in the August 1953 edition of the Western Miner). Assay results for individual drillholes were compiled by Golden Knight, but the exact location of the drill collars could only be estimated (Folk, 1990a).
Underground development took place in 1954 and 1955 consisting of 589.8 m of drifting and raising and 1,129 m of underground diamond drilling (Duffell, 1959). Results and plans from this early work are missing (although later assessment of the underground workings by Golden Knight provides the most current information). The first 120 m of the horizontal adit was developed along an azimuth of approximately 308° and intersected a segment of the Main vein twice, a shallow north dipping vein at the portal and a shallow south dipping vein. The adit intersected the Contact zone at a distance of 102 m from the portal and was extended a further 18 m into the footwall sedimentary rocks. At the 102 m mark, drifting followed the trend of the Contact zone along an azimuth of approximately 270°. Results of underground sampling are discussed below.
In 1952, Deer Horn Mines investigated the area of scheelite mineralization first discovered by the Harrison brothers in 1943. The tungsten showing consists of anomalous talus and bedrock near the contact between stratified rocks of the Hazelton Group and the Coast intrusions (Diakow and Koyanagi, 1987b). Deer Horn Mines identified an area measuring 485 m by 50 m wide that averaged 0.34 % WO3 (Duffell, 1959) through systematic sampling of the talus. A single trench excavated through the talus did encounter scheelite mineralization in bedrock. No further work was conducted on the occurrence.
6.3 THE GRANBY MINING COMPANY LIMITED
In 1967, Granby Mining Company Limited (“Granby”) optioned the Deer Horn property from Deer Horn Mines and built 2.4 km of access road, completed fifteen dozer trenches totaling 1.5 km, and conducted limited geological mapping (MEMPR AR, 1967). The company completed no further work and the property reverted to the province in 1975. The result of Granby’s work was not located by the authors, therefore it’s work has not contributed to the understanding of the geology or mineralization of the property.
6.4 GOLDEN KNIGHT RESOURCES INC.
Golden Knight embarked on an extensive exploration program following acquisition of the property on July 10, 1989, that included: establishment of a 3 km by 1 km grid over the principal area of interest; collection of 2,090 soil geochemical samples; a VLF and magnetometer survey over half of the grid area; prospecting, bedrock mapping and sampling; rehabilitation, surveying, mapping and chip sampling of underground workings; and completion of 31 surface diamond drillholes totaling 2253.4 m (Folk, 1990a). Golden Knight’s work focused entirely on the Contact zone and Main vein.
The 1989 drilling intersected a number of narrow, high-grade veins (i.e. 93.5 g/t Au and 1480 g/t Ag over 0.3 m in hole 89-07), generally regarded to be stringer zones in the hangingwall of the Contact zone (Folk, 1990a). However, and perhaps more importantly, the 1989 drilling also identified the previously unrecognized potential for bulk tonnage gold mineralization of the Contact zone as evidenced by a 42.53 m intersection averaging 2.88 g/t Au and 84.68 g/t Ag in hole 89-02 collared near the Deer Horn adit (Folk, 1990a).
Chip sampling of Main vein mineralization, exposed in two areas in the first 70 m of the adit, returned erratic, but potentially economic results, ranging from 0.006 oz/t Au and 0.35 oz/t Ag over 1.2 m to 1.037

PRELIMINARY ECONOMIC ASSESSMENT FOR THE DEER HORN PROPERTY
MAY 2018 PAGE 25
oz/t Au and 22.75 oz/t Ag over 1.1 m (Folk, 1990a). Sampling of the vein material in the remainder of the underground workings, mainly developed along and/or parallel to the Contact zone, returned poor results. One exception was a 2.55 m wide chip sample of Contact zone vein mineralization collected from a raise 210 m from the portal (Folk, 1990b). Golden Knight concluded that at the time of underground development the geometry of the Contact zone was not well understood and, as a consequence, most of the Deer Horn adit was driven along veins essentially barren of gold-silver values.
In 1990, Golden Knight continued with its surface diamond drilling program completing 29 more holes for an aggregate length of 2,256.2 m. One of the last 1990 holes, collared approximately 210 m west of the portal, encountered significant grades of gold and silver with elevated base metal values. The 11.2 m intersection averaged 14.36 g/t Au, 781.5 g/t Ag, 0.40 % Cu, 0.24 % Pb and 1.02 % Zn, including a 3.0 m interval that graded 37.73 g/t Au and 2,065 g/t Ag.
Over the two years Golden Knight drilled sixty holes totaling 4,510.6 m. This work, together with drilling data from the earlier programs, outlined a 400 m long south-dipping and shallow eastward plunging component of the Contact zone that is open to the east and to the west as well as down-plunge (Folk, 1990b).
Golden Knight also completed a preliminary acid rock generation study of material from the underground workings, an environmental water sampling program and preliminary metallurgical testing.
6.5 AMBER MINERALS LTD.
In 1990, a limited VLF-EM, magnetometer and reconnaissance biogeochemical sampling program and a later follow-up prospecting program, was conducted on ground adjoining and immediately east of the Deer Horn property. The work was completed by Amber Minerals Ltd. (Coffin and Renning, 1990; Renning, 1990) on behalf of Guardsmen. The program outlined weak northeast trending linear features and anomalous levels of molybdenum and zinc in a twenty sample biogeochemical survey.
6.6 GUARDSMEN RESOURCES INC.
In the year 2000, IMAP Interactive Mapping Solutions conducted a brief field program on behalf of Guardsmen. The primary focus of this work was to examine gold and silver bearing quartz-sulphide veins near the Deer Horn adit and in the Lindquist Peak area. Work conducted included geological mapping and sampling. A total of 24 rock samples were collected for geochemical analysis (Kaip and Childe, 2000). This work confirmed the results of earlier surface sampling.
6.7 CHRISTOPHER JAMES GOLD CORP.
In 2006, Guardsmen optioned the Deer Horn property to Christopher James Gold Corp. (“Christopher James”). Modest prospecting and geochemical exploration programs were conducted by Guardsmen on behalf of Christopher James in 2006 and 2007. The programs included clearing of a section of the access road from a temporary camp at Lindquist Lake, reconnaissance soil, silt and rock sampling in four areas, and an attempt to relocate core from the 1989 and 1990 drilling campaigns (Renning et al., 2007; Renning, 2008). The geochemical sampling program targeted areas west, northwest and south of the Deer Horn adit, and east, west and southwest of Kenney Lake. Results included (1) a strong gold, silver, arsenic, lead, cesium coincident soil geochemical anomaly west of the adit, (2) impressive molybdenum silt anomalies (148 ppm Mo and 60.7 ppm Mo) west of Kenney Lake where several creeks drain gossanous, sedimentary

PRELIMINARY ECONOMIC ASSESSMENT FOR THE DEER HORN PROPERTY
MAY 2018 PAGE 26
rock bluffs east of Lindquist Peak, and (3) a number of rock and silt samples anomalous in molybdenum collected southwest of Kenney Lake, where fine-grained molybdenum occurs in quartz veinlets, along fractures, and as disseminations in andesite grading up to 1,350 ppm Mo (Renning, 2008).
6.8 GOLDEN ODYSSEY MINING INC.
In October and early November 2009, Golden Odyssey drilled a total of 35 HQ and NQ diameter diamond bore holes, with an aggregate length of 1,706 m, on the Deer Horn property. Drilling targeted the two, known, west-trending mineralized structures, the Main Vein and Contact Zone, over a strike length of 320 m in the vicinity of the Deer Horn adit. Most of the bore holes were drilled on an azimuth of either 000 or 180 degrees, and were shallow, with lengths ranging from 23.77 m to 79.20 m. Surface channel sampling was also carried out primarily on exposures of the Main Vein. In addition, a fifteen line-kilometre grid was established over the central part of the Deer Horn property and ground magnetic, 3D-IP and Maxmin surveys were conducted over all or part the grid. An airborne LiDAR (Light Detection and Ranging) survey was completed over the property to provide detailed digital topographic information.
Early in 2010, an initial resource estimate was reported for the Deer Horn property (Lane and Giroux, 2010). Golden Odyssey later changed its name to Deer Horn Metals Inc.
6.9 DEER HORN METALS INC.
In July, August, and September 2011, a total of 55 NQ2 diameter diamond bore holes, with an aggregate length of 3,772.5 m, were completed on the Deer Horn property (Lane, 2012). A total of 49 drillholes targeted the two known, west-trending mineralized structures, the Main Vein and Contact Zone, over a strike length of 875 m in the vicinity of the Deer Horn adit. Most of the bore holes were drilled on an azimuth of either 000 or 180 degrees. Bore hole lengths ranged from 26.5 m to 150.6 m. Limited surface channel sampling was also carried out primarily on exposures of the Main Vein. The other six bore holes targeted the historic ‘Harrison Scheelite’ tungsten occurrence following a limited prospecting and excavator trenching program. An updated resource estimate was produced from an improved data base consisting of 196 diamond drill holes completed from 1944 to 2011 and 42 surface samples (Lane and Giroux, 2012). A more detailed account of the 2011 exploration program is presented in Sections 9 through 12.
In 2012, a ten-day prospecting program on the Deer Horn property discovered several significant mineral showings. The new Saddle, New Vein, Pry Bar and New West zones extend the overall strike length of the Deer Horn gold-silver vein system to more than 2,400 m, and it remains open to the west. The H-Spot and Pond zones are new discoveries of porphyry-style copper+/-gold+/-silver mineralization and associated alteration. They are located at the head of the valley north of the Deer Horn adit and 2.3 km west of Lindquist Peak in an area with no known exploration history. A second area of anomalous porphyry-style copper-gold mineralization occurs on a ridge crest 1.8 km northwest of Kenney Lake. All of the newly discovered showings warrant follow-up examination.
6.10 DEER HORN CAPITAL INC.
In 2014, Deer Horn Metals Inc. changed its name to Deer Horn Capital Inc. (DHC). DHC has not conducted any exploration on the Deer Horn property.
PRELIMINARY ECONOMIC ASSESSMENT FOR THE DEER HORN PROPERTY
MAY 2018 PAGE 27
7.0 GEOLOGICAL SETTING AND MINERALIZATION 7.1 REGIONAL GEOLOGY
Regional mapping of the Whitesail Lake region was conducted by the Geological Survey of Canada (“GSC”) between 1947 and 1952 (Duffell, 1959) and later by G. Woodsworth (1979, 1980). The most recent regional mapping on and around the Deer Horn property was conducted as part of the Canada/British Columbia Mineral Development Agreement by Diakow and Koyanagi (1988a and 1988b) of the BC Geological Survey Branch. This work was later compiled with previous regional bedrock mapping data to form a digital geology map for the province. The latter forms the base for the regional geology of the Deer Horn area presented in Figure 7-1. However, 1:50,000 scale mapping of the Deer Horn property by Diakow and Koyanagi (1988b) is also presented (Figure 7-2) because it portrays subtle, but potentially important, differences in the location of a thrust fault that plays a major role in controlling the distribution of vein mineralization on the property. The following description of the regional geology of the area is based on these works.
The Deer Horn property is located in the Intermontane tectonic belt of the Canadian Cordillera, adjacent to the eastern margin of the Coast tectonic belt. The oldest rocks exposed in the area consist of mafic volcanic and volcaniclastic strata of the Pre-Jurassic Gamsby Group, exposed on the west end of Lindquist Lake, and a quartz diorite of Pre-Jurassic age exposed on the southwest flank of Lindquist Peak, from the Deer Horn adit in the north, to the shores of Lindquist Lake in the south. Both units are regionally metamorphosed to greenschist facies and exhibit a strong penetrative foliation.
The Pre-Jurassic quartz diorite and mafic volcanics of the Gamsby Group are thrust over sedimentary and volcanic strata of the Lower Cretaceous Skeena Group and over maroon volcanic strata of the Lower to Middle Jurassic Telkwa Formation (Hazelton Group). The thrust is west–trending, and west of the Deer Horn adit is offset by a later northeast trending fault. Development of the thrust fault postdates deposition of the Lower Cretaceous Skeena Group and predates an Eocene granodiorite intrusion which invades the structure east of the Deer Horn adit and underlies much of the area around Lindquist Lake. The granodiorite is in intrusive contact with the foliated quartz diorite and with strata of the Gamsby and Skeena groups. Northwest of the Deer Horn adit, Lower Cretaceous and older strata are intruded by Late Cretaceous to Eocene granodiorite and quartz diorite of the Coast tectonic belt. The foliated quartz diorite, Gamsby Group and Skeena Group strata are also cut by felsic dykes related to the main granodiorite body.
7.2 LOCAL GEOLOGY
The Deer Horn property was first geologically mapped by Franc Joubin on behalf of Deer Horn Mines (Joubin, 1950); this information was provided to S. Duffell of the GSC, who included a version of the map in GSC Memoir 299 (Duffell, 1959). The central part of the property was mapped in detail by Golden Knight in 1989. Results of this work are available in Folk (1990a) and the central part is presented in Figure 7-3 with modifications after Childe and Kaip (2000).
The property is underlain predominantly by foliated quartz diorite and meta-volcanic rocks of the pre-Jurassic Gamsby Group, that have been thrust over a package of sedimentary rocks of the Late Cretaceous Skeena Group (Duffell, 1959). Eocene granodiorite and related dykes intrude the older rocks (Diakow and Koyanagi, 1988a). The northern and central portion of the property are composed of lower Jurassic Telkwa Formation (Hazelton Group) intermediate volcanic flows and lithic tuffs, which are overlain by lower

PRELIMINARY ECONOMIC ASSESSMENT FOR THE DEER HORN PROPERTY
MAY 2018 PAGE 28
Cretaceous intermediate to felsic lapilli tuff and by lower Cretaceous Skeena Group grey-black sedimentary units grading from argillite through silts and sandstone.
Metamorphic Rocks
PRE-JURASSIC GAMSBY GROUP
Metavolcanic Rocks
Medium greenish-grey intermediate to mafic tuffs, flows and schists associated with a dioritic intrusion comprise the Gamsby Group (Woodsworth, 1978) and cover a limited area of the property west and south of Lindquist Lake. The rocks have been regionally metamorphosed to greenschist facies and commonly contain ubiquitous albite, epidote and chlorite (Diakow and Koyanagi, 1988a). Deformation of the strata is defined by a pronounced foliation and local shearing. The diorite, whose contact with the metavolcanic rocks may be a fault, occurs in the lower levels of the succession (Diakow and Koyanagi, 1988a).
LOWER JURASSIC TELKWA FORMATION (HAZELTON GROUP)
Maroon Volcanics
Well-layered maroon pyroclastic rocks (primarily crystal-lapilli tuff and ash tuff) and lava flows of the Telkwa Formation occupy a large area of the Deer Horn property north and northwest of Lindquist Peak. The unit is characterized by its maroon to red and locally green colour and its distinctly bedded nature (Diakow and Koyanagi, 1988a). Rocks of the Telkwa Formation are primarily in fault contact with younger rocks of the Skeena Formation and, in the northwest part of the property, are cut by granodiorite.
Sedimentary Rocks
CRETACEOUS SKEENA GROUP
Sedimentary strata of the Skeena Group were divided into four main units by Folk (1990a). Each unit is based on its predominant lithology, but the units appear to grade into one another. Tops were not determined and therefore the units are listed in structural sequence from highest to lowest.
Quartzite
Quartzite was observed in outcrop, in drill core and in the underground workings (Folk, 1990a). It is fine-grained, pale grey to pale yellow-grey and very siliceous. Outcrops are blocky in appearance and the rock weathers to a light, off-white color with rusty tones. Very fine-grained pyrite occurs as disseminations and in fractures. This unit was mapped by Papezik as aplite and feldspathic quartzite (Papezik, 1957).
Green-Brown Greywacke
‘Greywacke’ includes several lithologies that lie between the quartzite and underlying argillite. The dominant lithology is a medium greenish grey to greyish brown, slightly schistose wacke, which weathers to a light greenish brown color. Minor amounts of mudstone and very fine grained arkose are included in this unit. In drill core it is fine grained, medium grey to brownish grey and locally has a light green tone (Folk, 1990a).
Generally, it contains small, white, anhedral quartz specks, which are less than 5 mm in diameter. The rock is weakly to strongly silicified and the abundance of quartz specks tends to increase with silicification. It is often weakly foliated and locally contains small (<5 mm diameter), dark, well-rounded clasts. Where silicification is intense, the greywacke and quartzite are indistinguishable (Folk, 1990a).

PRELIMINARY ECONOMIC ASSESSMENT FOR THE DEER HORN PROPERTY
MAY 2018 PAGE 29
Argillite
Argillite is black, thinly laminated and displays a phyllitic sheen. It weathers a dark rusty brown. The unit is locally metamorphosed to andalusite schist. The schist contains approximately 10 % randomly orientated metacrysts of andalusite, less than 3 mm in length and largely altered to translucent white sericite. In drill core it is well-indurated, black to dark brown with local beige and green laminae (Folk, 1990a).
Feldspathic Greywacke
Feldspathic greywacke is a fine-grained, medium to dark grey rock with a very dense appearance. Fine translucent white feldspar grains are visible with a hand lens. Outcrops weather to a grainy, often pitted buff colored surface. The rock breaks with a fairly sharp and slightly concoidal fracture. Feldspathic greywacke outcrops on Lindquist Peak, but was not encountered in drillholes or underground in the adit (Folk, 1990a).
Intrusive Rocks
Pre-Jurassic Quartz Diorite
Quartz diorite, spatially associated with pre-Jurassic metavolcanic rocks, underlies much of the central area of interest and is seen in drill core, surface outcrops and underground workings where it has been highly altered. It occurs in outcrops that extend from the Deer Horn adit in the north to within 100 meters of the shore of Lindquist Lake in the south. It is dominantly pale to dark green, fine to medium grained and weakly to strongly foliated. It consists of plagioclase, quartz, and 10-35 % hornblende that is altered almost completely to chlorite. The foliation is best developed proximal to the thrust that places quartz diorite over younger sedimentary and volcanic strata. Foliated quartz diorite is the principal host to the Deer Horn vein system.
Cretaceous and/or Tertiary Granodiorite
Granodiorite is buff-coloured, medium- to coarse-grained and equigranular to porphyritic. It forms large, pale grey outcrops which underlie the southeast corner of the property. It is composed of quartz, plagioclase, orthoclase and accessory biotite, which is altered in part to chlorite. The contact between granodiorite and quartz diorite was observed to be gradational over a distance of about 40 m (Folk, 1990a).
Dykes
Felsic dykes are light greenish grey, fine grained, and moderately siliceous. They are composed of plagioclase with minor quartz and orthoclase (Papezik, 1957). Outcrops weather light beige to locally medium brown and are locally display small spots of iron oxide. The dykes are commonly amygdaloidal with calcite filling cavities (Folk, 1990a). The unit was also mapped as felsite and as albitite by previous workers.
Mafic dykes, typically less than one m in width, are dark greenish grey and contain very fine (<1 mm diameter) feldspar phenocrysts and finely disseminated magnetite. Mafic dykes were encountered both on surface and in drill core. The unit was also mapped as ‘trap’ and hornblende latite (Papezik, 1957).
PRELIMINARY ECONOMIC ASSESSMENT FOR THE DEER HORN PROPERTY
MAY 2018 PAGE 30
Cataclastic Rocks
Perthite-Quartz Cataclastite
This rock unit is adopted from the work of Papezik (1957). No surface outcrops were noted, but it was encountered locally in the underground workings and in some drillholes. It is described as spotty grey to greenish grey with rounded to subangular clasts of quartz and feldspar embedded in a matrix of sericite. A characteristic feature of the unit is the presence of rounded or rectangular orthoclase ‘porphyroblasts’ up to 1.8 cm in diameter that comprise 25–50 % of the rock. In drill core it is described as silicified and biotite-altered fault breccia.

PRELIMINARY ECONOMIC ASSESSMENT FOR THE DEER HORN PROPERTY
MAY 2018 PAGE 31
Figure 7-1 Regional Geology of the Lindquist Lake Area (source Digital Geology Map of British Columbia)

PRELIMINARY ECONOMIC ASSESSMENT FOR THE DEER HORN PROPERTY
MAY 2018 PAGE 32
Figure 7-2 Regional Geology of the Lindquist Lake Area (after Diakow and Koyanagi, 1988b)
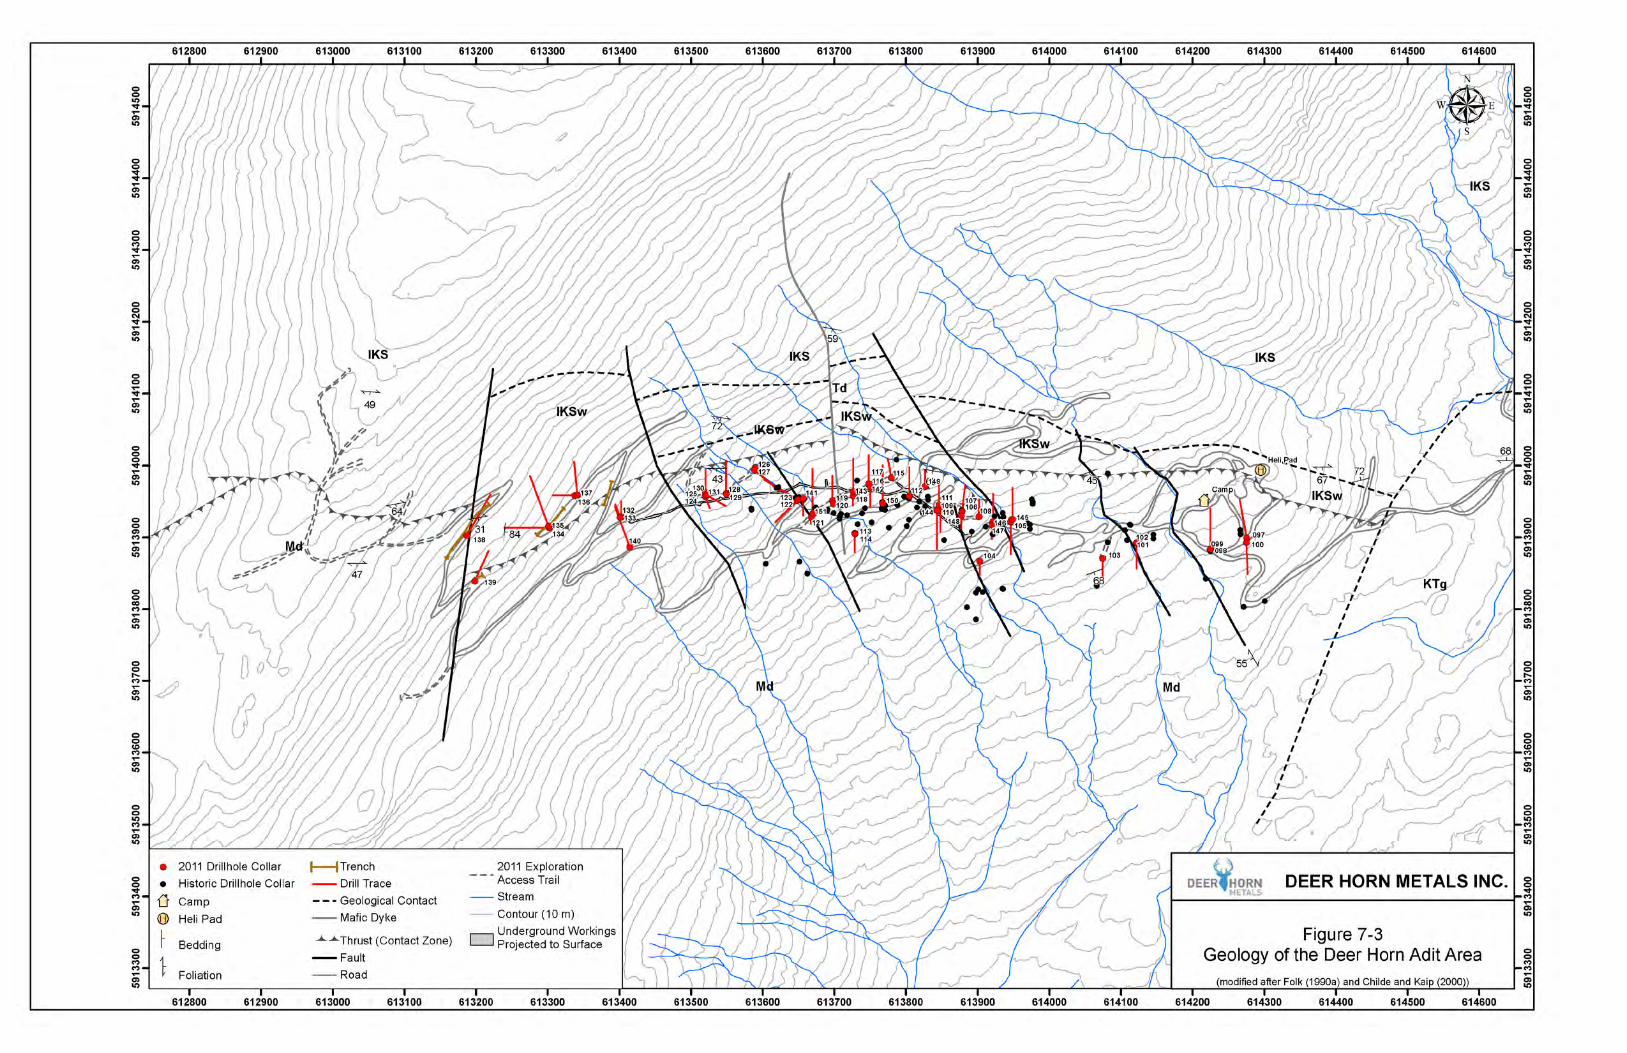
PRELIMINARY ECONOMIC ASSESSMENT FOR THE DEER HORN PROPERTY
MAY 2018 PAGE 33
Figure 7-3 Geology of the Deer Horn Adit Area (modified after Folk (1990a) and Childe and Kaip (2000))
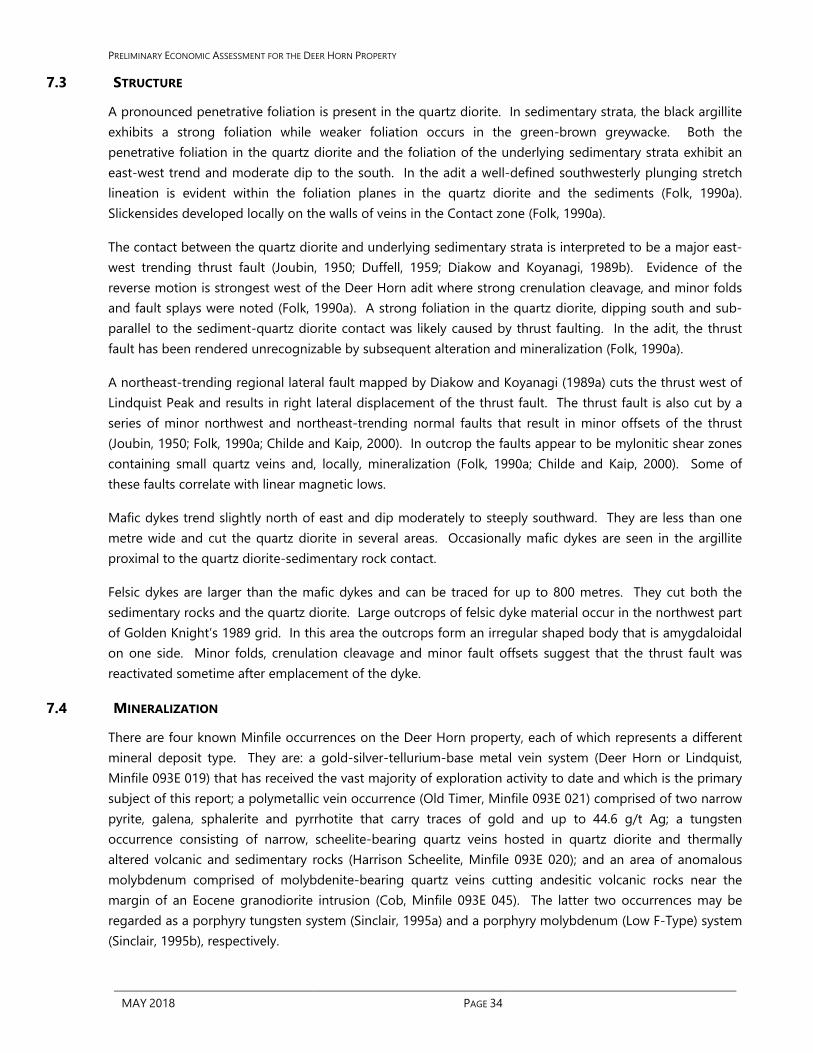
PRELIMINARY ECONOMIC ASSESSMENT FOR THE DEER HORN PROPERTY
MAY 2018 PAGE 34
7.3 STRUCTURE
A pronounced penetrative foliation is present in the quartz diorite. In sedimentary strata, the black argillite exhibits a strong foliation while weaker foliation occurs in the green-brown greywacke. Both the penetrative foliation in the quartz diorite and the foliation of the underlying sedimentary strata exhibit an east-west trend and moderate dip to the south. In the adit a well-defined southwesterly plunging stretch lineation is evident within the foliation planes in the quartz diorite and the sediments (Folk, 1990a). Slickensides developed locally on the walls of veins in the Contact zone (Folk, 1990a).
The contact between the quartz diorite and underlying sedimentary strata is interpreted to be a major east-west trending thrust fault (Joubin, 1950; Duffell, 1959; Diakow and Koyanagi, 1989b). Evidence of the reverse motion is strongest west of the Deer Horn adit where strong crenulation cleavage, and minor folds and fault splays were noted (Folk, 1990a). A strong foliation in the quartz diorite, dipping south and sub-parallel to the sediment-quartz diorite contact was likely caused by thrust faulting. In the adit, the thrust fault has been rendered unrecognizable by subsequent alteration and mineralization (Folk, 1990a).
A northeast-trending regional lateral fault mapped by Diakow and Koyanagi (1989a) cuts the thrust west of Lindquist Peak and results in right lateral displacement of the thrust fault. The thrust fault is also cut by a series of minor northwest and northeast-trending normal faults that result in minor offsets of the thrust (Joubin, 1950; Folk, 1990a; Childe and Kaip, 2000). In outcrop the faults appear to be mylonitic shear zones containing small quartz veins and, locally, mineralization (Folk, 1990a; Childe and Kaip, 2000). Some of these faults correlate with linear magnetic lows.
Mafic dykes trend slightly north of east and dip moderately to steeply southward. They are less than one metre wide and cut the quartz diorite in several areas. Occasionally mafic dykes are seen in the argillite proximal to the quartz diorite-sedimentary rock contact.
Felsic dykes are larger than the mafic dykes and can be traced for up to 800 metres. They cut both the sedimentary rocks and the quartz diorite. Large outcrops of felsic dyke material occur in the northwest part of Golden Knight’s 1989 grid. In this area the outcrops form an irregular shaped body that is amygdaloidal on one side. Minor folds, crenulation cleavage and minor fault offsets suggest that the thrust fault was reactivated sometime after emplacement of the dyke.
7.4 MINERALIZATION
There are four known Minfile occurrences on the Deer Horn property, each of which represents a different mineral deposit type. They are: a gold-silver-tellurium-base metal vein system (Deer Horn or Lindquist, Minfile 093E 019) that has received the vast majority of exploration activity to date and which is the primary subject of this report; a polymetallic vein occurrence (Old Timer, Minfile 093E 021) comprised of two narrow pyrite, galena, sphalerite and pyrrhotite that carry traces of gold and up to 44.6 g/t Ag; a tungsten occurrence consisting of narrow, scheelite-bearing quartz veins hosted in quartz diorite and thermally altered volcanic and sedimentary rocks (Harrison Scheelite, Minfile 093E 020); and an area of anomalous molybdenum comprised of molybdenite-bearing quartz veins cutting andesitic volcanic rocks near the margin of an Eocene granodiorite intrusion (Cob, Minfile 093E 045). The latter two occurrences may be regarded as a porphyry tungsten system (Sinclair, 1995a) and a porphyry molybdenum (Low F-Type) system (Sinclair, 1995b), respectively.
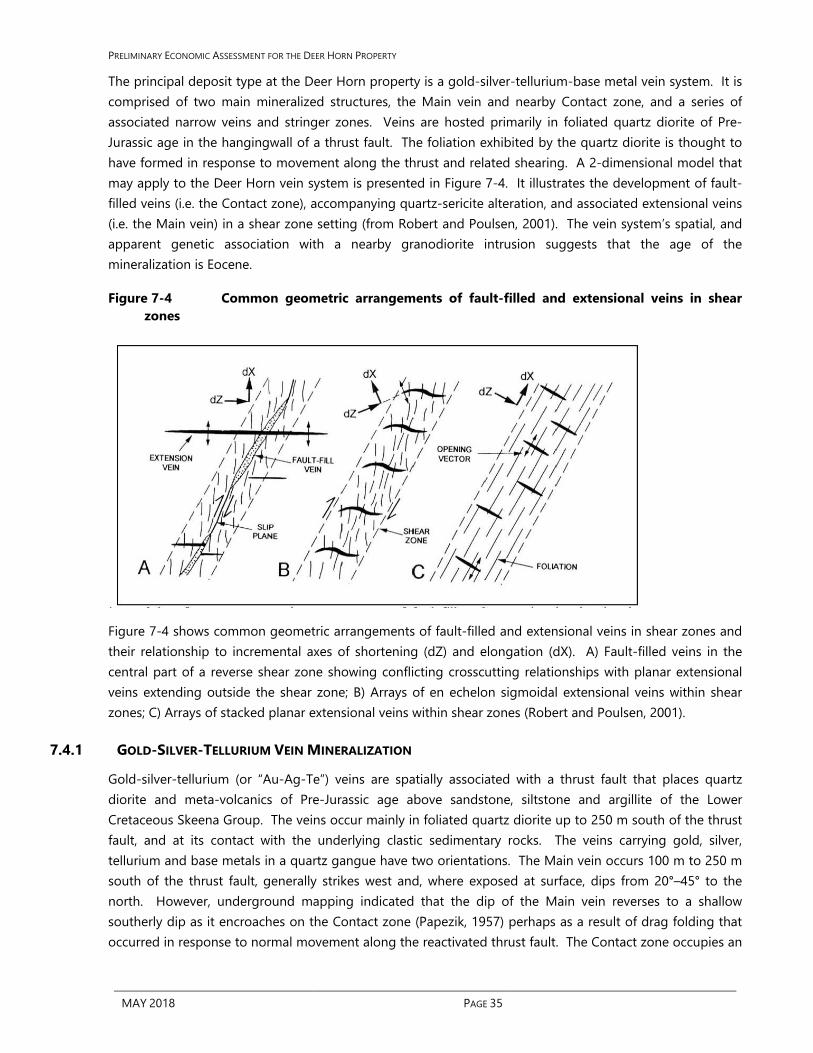
PRELIMINARY ECONOMIC ASSESSMENT FOR THE DEER HORN PROPERTY
MAY 2018 PAGE 35
The principal deposit type at the Deer Horn property is a gold-silver-tellurium-base metal vein system. It is comprised of two main mineralized structures, the Main vein and nearby Contact zone, and a series of associated narrow veins and stringer zones. Veins are hosted primarily in foliated quartz diorite of Pre-Jurassic age in the hangingwall of a thrust fault. The foliation exhibited by the quartz diorite is thought to have formed in response to movement along the thrust and related shearing. A 2-dimensional model that may apply to the Deer Horn vein system is presented in Figure 7-4. It illustrates the development of fault-filled veins (i.e. the Contact zone), accompanying quartz-sericite alteration, and associated extensional veins (i.e. the Main vein) in a shear zone setting (from Robert and Poulsen, 2001). The vein system’s spatial, and apparent genetic association with a nearby granodiorite intrusion suggests that the age of the mineralization is Eocene.
Figure 7-4 Common geometric arrangements of fault-filled and extensional veins in shear zones
Figure 7-4 shows common geometric arrangements of fault-filled and extensional veins in shear zones and their relationship to incremental axes of shortening (dZ) and elongation (dX). A) Fault-filled veins in the central part of a reverse shear zone showing conflicting crosscutting relationships with planar extensional veins extending outside the shear zone; B) Arrays of en echelon sigmoidal extensional veins within shear zones; C) Arrays of stacked planar extensional veins within shear zones (Robert and Poulsen, 2001).
7.4.1 GOLD-SILVER-TELLURIUM VEIN MINERALIZATION
Gold-silver-tellurium (or “Au-Ag-Te”) veins are spatially associated with a thrust fault that places quartz diorite and meta-volcanics of Pre-Jurassic age above sandstone, siltstone and argillite of the Lower Cretaceous Skeena Group. The veins occur mainly in foliated quartz diorite up to 250 m south of the thrust fault, and at its contact with the underlying clastic sedimentary rocks. The veins carrying gold, silver, tellurium and base metals in a quartz gangue have two orientations. The Main vein occurs 100 m to 250 m south of the thrust fault, generally strikes west and, where exposed at surface, dips from 20°–45° to the north. However, underground mapping indicated that the dip of the Main vein reverses to a shallow southerly dip as it encroaches on the Contact zone (Papezik, 1957) perhaps as a result of drag folding that occurred in response to normal movement along the reactivated thrust fault. The Contact zone occupies an
PRELIMINARY ECONOMIC ASSESSMENT FOR THE DEER HORN PROPERTY
MAY 2018 PAGE 36
area immediately above and sub-parallel to the thrust fault, striking to the west and dipping 55°-60° to the south (Joubin, 1950).
The Main vein and subordinate hangingwall and/or footwall veins are hosted primarily by foliated quartz diorite, but also by granodiorite and to a lesser extent quartzite and greywacke. These ‘Main-type’ veins do not tend to penetrate very far into the sedimentary rocks in areas observed at surface (Folk, 1990a). The Main vein has been traced intermittently for over 1,400 m along strike and is from < 1.0 m to 4.5 m wide (Papezik, 1957). It is segmented by a series of brittle north to north-westerly trending faults that offset the vein up to 30 m (Joubin, 1950). Later workers suggest that the vein ‘segments’ are separate en echelon tensional vein structures (Folk, 1990b). Locally some of these vein ‘segments’ appear to have been rotated, such as at the Deer Horn portal where a thick vein strikes due north and dips moderately to the east. This particular vein contains appreciable amounts of magnetite, however, a feature that suggests that it may be not be part of the ‘Main-type’ vein system.
‘Main-type’ vein mineralization consists of pyrite, sphalerite, galena, scheelite, pyrrhotite, chalcopyrite, and the telluride minerals tetradymite, hessite, tellurobismuth and altaite, that typically occurs as small patches, blebs and disseminations in a gangue of white quartz (Folk, 1990b).
Silver, bismuth, and lead-bearing telluride minerals have been reported historically and were identified in a recent petrographic and scanning electron microscope (“SEM”) assessment of six polished thin sections by Le Couteur (2010). This study identified that a considerable range of telluride mineral compositions exist at the Deer Horn property. The telluride grains are typically less than 50 microns long. Some of the minerals have similar compositions, and together with their small size, were often difficult to distinguish from one another. The following telluride species present are thought to include: hessite (Ag2Te), empressite (AgTe), stutzite (Ag4.6-4.8Te3), volynskite (AgBiTe2), hedleyite (Bi7Te2), tellurobismuthite (Bi2Te3), tsumoite (BiTe) and altaite (PbTe) (Le Couteur, 2010). No gold-bearing tellurides or gold-bearing minerals were identified in the study and further petrographic and SEM work is required to ascertain the gold-bearing mineral species.
Vein quartz is typically white to translucent grey and commonly includes traces of chlorite and up to several percent magnetite. Drusy cavities lined with quartz and crustiform banding occur locally. At surface, veins containing at least trace amounts of sulphide minerals are typically Fe-oxide stained. Early trenching and shallow drilling indicated that large, flat Main vein material with good grades occurs at or near the surface (Folk, 1990a) and could be amenable to limited scale open pit development.
The Contact zone is comprised of individual quartz veins up to 1.8 m wide and bands of quartz stringers up to 4.6 m across within a band of quartz-sericite altered quartz diorite located just above the thrust fault. It has similar mineralogy to the Main vein and has been traced by surface work, including prospecting, trenching and diamond drilling for 1,650 m and up to 150 m down dip. Quartz-sericite alteration developed in the footwall of the thrust grades into zones of quartz-epidote that are locally well-developed, particularly in sandstone, where they form bands consisting of 10-50 % epidote and fine-grained quartz cut by veinlets of quartz-carbonate-epidote that reach 2 m to 4 m in width (Childe and Kaip, 2000).
Narrow, high grade gold-silver veins and broad, bulk tonnage, gold-silver mineralization has been encountered at Deer Horn. The high-grade veins are typically also elevated in tellurium, copper, zinc and lead, and locally bismuth, mercury and tungsten. Of note is drillhole 90-57 that was collared approximately 210 m west of the portal. It encountered significant grades of gold and silver with elevated base metal
PRELIMINARY ECONOMIC ASSESSMENT FOR THE DEER HORN PROPERTY
MAY 2018 PAGE 37
values. The 11.2 m intersection averaged 14.36 g/t Au, 781.5 g/t Ag, 0.40 % Cu, 0.24 % Pb and 1.02 % Zn, including a 3.0 m interval that graded 37.73 g/t Au and 2,065 g/t Ag. The intersection in part defines the western part of the 400 m east plunging shoot mentioned above.
Many narrow, high-grade veins intersected in the immediate hangingwall of the thrust are generally regarded to be stringer zones that are part of the Contact zone (Folk, 1990a). These narrow high-grade veins are important components of the vein system, and while some may stand alone as potentially economic veins, they may alternatively contribute significantly to the bulk tonnage potential of the Contact zone. Hole 89-02, collared near the Deer Horn adit, intersected 42.53 m averaging 2.88 g/t Au and 84.68 g/t Ag and in part defines the east-central part of the 400 m east plunging shoot mentioned above. West of the Deer Horn adit, a northeast-trending fault displaces the thrust northwards, but regional mapping suggests that the offset portion of the thrust continues its westerly trend for approximately 2 km (Diakow and Koyanagi, 1988a).
1.1.1.1 Age of Vein Mineralization
Diakow and Koyanagi (1988a) reported an age of 56+/-2 Ma for sericite collected from alteration that envelopes part of the Contact zone, suggesting that the mineralization developed in the Eocene. Two age dates for biotite extracted from a nearby granodiorite body suggest that is has a similar age of formation and that emplacement of the granodiorite and the mineralizing event are genetically related. The thrust fault is cut by both the granodiorite and vein system and provided a structural focus for localizing hydrothermal solutions that may have been associated with the emplacement of the granodiorite in the Early Eocene.
7.4.2 TUNGSTEN MINERALIZATION
A tungsten showing, later called Harrison Scheelite, was discovered in 1943 approximately one km southwest of Lindquist Peak. The showing consists of two aprons of scheelite-bearing talus near the contact between metamorphosed volcanic and sedimentary rocks of the Hazelton Group and granite, quartz diorite and diorite of the Coast intrusions (Diakow and Koyanagi, 1987b). The talus aprons are centered approximately 250 m to 300 m west of the western end of the Main vein. The scheelite occurs with quartz in narrow veins and stringers in diorite and the altered volcanic and sedimentary rocks. The main apron of anomalous talus has a sinuous northwest trend and covers an area measuring 485 m long by an average of approximately 50 m wide (Duffell, 1959). Systematic sampling of talus from the area yielded an average of 0.34 % WO3 (Duffell, 1959). A 40 m long trench was excavated through the talus to bedrock. Bedrock samples collected from the western part of the trench averaged 0.84 % WO3 over 18 m and bedrock samples collected from the eastern part of the trench averaged 1.55 % WO3 over 22 m (Duffell, 1959). Sampling of the second, smaller apron of talus produced modest results.
7.4.3 MOLYBDENUM MINERALIZATION
Occurrences of molybdenite are located in the eastern part of the property, immediately east of Kenney Lake, in the vicinity of the Cob Minfile showing. Molybdenite occurs in fractures and narrow quartz veins in andesitic volcanic rocks and related (?) sedimentary rocks of the Lower Cretaceous Skeena Group in proximity to an Eocene granodiorite stock (Renning, 1990). Little more than reconnaissance work, consisting primarily of prospecting and geochemical sampling, has been completed in the area. However, rock geochemical samples from the area have yielded results as high as 1,350 ppm Mo (Renning, 2008).

PRELIMINARY ECONOMIC ASSESSMENT FOR THE DEER HORN PROPERTY
MAY 2018 PAGE 38
Also, stream sediment sampling conducted immediately west of Kenney Lake returned highly anomalous levels of molybdenum in two samples. Follow-up of the anomaly has not been conducted.
7.4.4 COPPER MINERALIZATION
In September 2012, prospecting and surface sampling identified several porphyry-style showings at the head of the valley northwest of the resource area.
The Pond and H-Spot showings are discoveries of bulk tonnage, porphyry-style copper+/-silver mineralization and associated alteration. They are located at the head of the valley north of the Deer Horn adit and 2.3 km west of Lindquist Peak in an area with no known exploration history. A second area of anomalous porphyry-related copper-gold mineralization occurs on a ridge crest 1.8 km northwest of Kenney Lake. The following description of the showings is adapted from Lane (2013).
The Pond showing consists of coarse blebs and knots of pyrite, and traces of chalcopyrite and molybdenite in propylitic and potassic-altered diorite. The H-Spot showing, located 200 m north of Pond, consists of potassic-altered granodiorite containing coarse aggregates of pyrite and bands and coarse aggregates of intergrown magnetite-chalcopyrite. Grab and channel samples collected from the two showings graded from 18.5 to 4240 ppm Cu, from 0.06 to 6.6 ppm Ag and from <5 – 24 ppb Au. The full dimensions of the H-Spot showing are unknown because it is covered by snow pack and glacial debris. Several other small showings of chalcopyrite were located nearby and additional pyrite-altered tuffaceous volcanic rocks were identified 450 m to the north. These new showings, and their broad distribution may be evidence of a largely hidden porphyry copper system. Another new area of anomalous copper-gold mineralization was discovered along ridge crests northwest of Kenney Lake. This area is underlain by rocks mapped as part of the Telkwa Formation (Hazelton Group). Chalcopyrite occurs in hairline fractures in propylitic to weakly potassic-altered andesitic flows. Select grab samples graded from 10 to 4540 ppm Cu, from 0.07 to 7.72 ppm Ag and from <5 to 262 ppb Au.

PRELIMINARY ECONOMIC ASSESSMENT FOR THE DEER HORN PROPERTY
MAY 2018 PAGE 39
8.0 DEPOSIT TYPES Economic mineral deposits in the region include the Huckleberry copper-molybdenum mine, the Endako molybdenum mine, and the former Equity Silver mine. All are located north of the Deer Horn property and south of Highway 16 (see Figure 4-1).
The Huckleberry porphyry copper-molybdenum deposit (Minfile 093E 037), located 36 km north of the Deer Horn property, includes two ore bodies that are associated with porphyritic granodiorite intrusions of Late Cretaceous age which have intruded volcanic rocks of the Jurassic Hazelton Group. Mineralization occurs primarily within hornfelsed volcanic rocks that encompass the porphyritic intrusions. Mineralization occurs as a stockwork of fractures and veinlets of chalcopyrite and lesser molybdenite in a ganuge that includes pyrite, quartz and anhydrite (Jackson and Illerbrun, 1995). The Huckleberry mine was put into production in 1997. Huckleberry ceased mine operations in August 2016, and remains on care and maintenance at the time of writing.
The Endako molybdenum deposit (Minfile 093K 006), located 162 km northeast of the Deer Horn property, occurs entirely within the Endako quartz monzonite phase of the Upper Jurassic Francois Lake Intrusions. The northwest trending orebody is 3,360 m in length, 370 m wide and 370 m deep (Bysouth and Wong, 1995). The molybdenite and associated minerals occur mainly in milky white quartz veins that commonly display ribbon structures or breccias healed by late-stage silica and molybdenite. The Endako mine was put into production in 1964. The mine and concentrator were placed on care and maintenance in July 2015.
The former Equity Silver mine (Minfile 093L 001), located 162 km northeast of the Deer Horn property, was in operation for thirteen years before closing permanently in 1994. Copper-silver-gold mineralization was mined from three tabular orebodies that developed within structurally prepared pyroclastic and volcanic rocks of Upper Jurassic to Cretaceous age. A 57 Ma quartz monzonite intrusion and 48 Ma gabbro-monzonite complex cut the stratified rocks. Pyrite, chalcopyrite, pyrrhotite and tetrahedrite with minor amounts of galena, sphalerite, argentite, pyrargyrite and other silver sulphosalts occur as disseminations and in veins, fracture fillings and locally as massive pods.
The Emerald Glacier mine (Minfile 093E 001) is a small historic underground producer located 4 km north of the Deer Horn property. Polymetallic vein mineralization occurs in shears that cut clastic sedimentary rocks of the Lower-Middle Jurassic Hazelton Group. Quartz-sulphide veins are up to three metres wide and sulphide mineralization includes galena, sphalerite, chalcopyrite, and pyrite that carry high grades of silver.
Other mineral occurrences of note include two polymetallic vein occurrences, the Roosevelt (Minfile 093E 029) and Ruby Adit (Minfile 093E 028), that occur 13 km to 14 km northeast of the Deer Horn property. The two occurrences consist of narrow veins carrying pyrite, galena, sphalerite, arsenopyrite and locally, high-grade gold and silver values (Hanson, 1991). Limited tonnage is reported to have been extracted from the two sites in the mid-1930’s from small underground developments (Duffel, 1959).

PRELIMINARY ECONOMIC ASSESSMENT FOR THE DEER HORN PROPERTY
MAY 2018 PAGE 40
9.0 EXPLORATION Exploration and camp construction crews first arrived at the barge landing on the south end of Whitesail Lake on July 10, 2011. Equipment was off-loaded from two 100-tonne barges and a temporary camp was constructed nearby. An existing 8 km access road, that had been rehabilitated in 2009 provided access to the existing camp located in the alpine. A physical review of the proposed drill sites was completed, and drill collar locations were confirmed. The diamond drill, provided by Radius Drilling Corporation, was skidded up to the exploration site and began drilling the first hole of the campaign on July 20, 2011. The last hole of the campaign was completed on September 13, 2011. In total 55 NQ2 diamond drillholes were completed for an aggregate length of 3,772.5 metres.
Re-opening and modification of 1.71 km of existing exploration trails was completed to provide access for trenching and drilling, and a total of 1.13 km of new exploration trails were built to provide additional access for drilling.
Trenching took place in four closely spaced areas and was focussed on the area of the historic Harrison Scheelite tungsten mineral occurrence located west of the Deer Horn gold-silver vein system. Continuous chip sampling of the rock exposed in the trenches was completed. In addition, channel sampling of selected vein outcrops was conducted using either a portable diamond saw or standard chip sampling methods in order to provide additional data for deposit modelling. Prospecting and rock geochemical sampling took place outside of the principal areas of interest and identified several showings worthy of follow-up.
The 2011 program also included a property-wide, helicopter-borne magnetic and radiometric geophysical survey flown by Precision GeoSurveys Inc. of Vancouver, BC. However, the results of the survey are not part of this report.
Following compilation of all the data from diamond drilling and surface sampling, construction of a 3D wire frame model of the deposit was completed and a resource estimate was calculated (see Section 14).
9.1 SURFACE ROCK GEOCHEMICAL SAMPLING
A total of 84 cut channel, chip or grab surface samples were collected from the property in 2011 (Figure 9-1). The sampling took place over an east-west distance of approximately 2.8 km centered roughly on the Deer Horn resource area. Results range from less than detection to 30.6 g/t Au, 1,083 g/t Ag and 1,006 ppm Te over 2.15 m of cut channel (sample 1361404). Several new, narrow sulphide-bearing quartz veins were encountered well outside of the area drilled in 2011. Some of these discoveries may represent the westward continuation of Main Vein or Contact Zone mineralization (e.g. samples 1361475 and 1361476) or may be discrete zones with a genetic relationship to the Deer Horn gold-silver vein deposit (e.g. samples 1361385, 1361386 and 1361394). Veins sampled more than 550 m east of the area being drilled returned interesting concentrations of molybdenum (e.g. samples 1361406 and 1361409) and gold (e.g. sample 1361407).
Several new occurrences were discovered during a prospecting program carried out in 2012; a total of 83 rock grab, chip and cut channel samples and 6 reconnaissance silt samples were collected. The New Vein, Pry Bar and New West zones are located west of the Deer Horn resource area and bring the overall strike length of the vein system to more than 2,400 m. The Saddle area, located east of the New Vein area was

PRELIMINARY ECONOMIC ASSESSMENT FOR THE DEER HORN PROPERTY
MAY 2018 PAGE 41
also prospected and numerous well-mineralized veins were located and sampled. Overall, veins in these new showings carry anomalous to high-grade values of silver (from 0.14 to 633 g/t Ag), anomalous values of gold (from <5 to 1160 ppb Au), and variably elevated levels of tellurium, bismuth and base metals.
Also discovered in 2012 were the Pond and H-Spot occurrences, two closely-spaced showings located near the head of the valley, just 1 km west-northwest and downslope of the New Vein area and 2.3 km west of Lindquist Peak. The Pond showing consists of coarse blebs and knots of pyrite, and traces of chalcopyrite and molybdenite in propylitic and potassic-altered diorite. The H-Spot showing, located 200 m north of Pond, consists of potassic-altered granodiorite containing coarse-grained aggregates of pyrite and bands of coarse-grained, intergrown magnetite-chalcopyrite. Grab and channel samples collected from the two showings range from 18.5 to 4240 ppm Cu and from 0.6 to 6.6 ppm Ag; gold is typically at or below detection limit. Several other small showings of chalcopyrite were located nearby and additional pyrite-altered tuffaceous volcanic rocks were identified 450 m to the north. The broad distribution of these showings may be evidence of a largely hidden porphyry copper system
Table 9-1 provides a location, a description, and multi-element results for a selection of surface samples collected during the 2011 exploration program.
Table 9-2 provides a location, description, and multi-element results for a selection of surface samples collected during the 2012 exploration program. The 2012 sample locations are shown in Figure 9-2.
9.2 TRENCHING
Excavator trenching was undertaken primarily to evaluate a tungsten soil geochemical anomaly, outlined by Teck in 1989-1990, that is coincident with the historic Harrison Scheelite tungsten occurrence. Prior to trenching, crews were dispatched to lamp the areas using short-wave ultraviolet lights. These efforts confirmed the presence of scheelite.
Trenching was centered approximately 625 m west of the Deer Horn Adit on a southeast facing slope where old sloughed trenches and trails were readily apparent (Figure 9-3). Three areas were trenched specifically to investigate the earlier work, and a fourth trench was cut across an alteration zone encountered during rehabilitation of the access trails. A total of 94 chip samples were collected. Results are summarized below, and selected intervals are presented in Table 9-3.
Trench 1 (51 m in length) exposed a panel of weakly silicified fine-grained clastic sedimentary rocks. An 18 m length of the trench returned consistently anomalous tungsten values.
Trench 2 (12 m in length), centered approximately 150 m southwest of Trench 1, exposed a foliated to sheared diorite in contact with a zone of intense chlorite-epidote replacement mineralization locally containing coarsely disseminated galena, pyrite and scheelite. Three consecutive two metre channel samples averaged 1.08 % WO3 and 114 g/t Ag with strongly elevated levels of lead and bismuth and weakly elevated tellurium. Selected grab samples collected from Trench 2 assayed up to 2.145 % WO3, 192 g/t Ag, > 1 % Pb and 461 ppm Bi.
Trench 3 (102 m in length), centered 110 m due west of Trench 1, was excavated across a strike-slip fault that places quartz-chlorite-sericite altered diorite up against sericitized and silicified clastic sedimentary rocks. Anomalous levels of tungsten where encountered in both units (four widely-spaced tungsten-bearing intervals) with the last five intervals sampled at the northeast end of Trench 3 averaging 0.10 %

PRELIMINARY ECONOMIC ASSESSMENT FOR THE DEER HORN PROPERTY
MAY 2018 PAGE 42
WO3. A composite chip sample collected from an outcrop located just four metres north of the centre of Trench 3 returned 0.66 % WO3, 111 g/t Ag, > 1000 ppm Te, and 244 ppm Bi.
Trench 4 (35 m in length), centered 90 m east of Trench 1, was excavated across an area of intensely oxidized bedrock that may represent the surface trace of a property-wide thrust fault. The trench was divided up into a north segment (4A) and a south segment (4B) for sampling purposes because the center of the trench badly sloughed. The southern part of the trench produced anomalous results including 0.19 % WO3 over 2 m.

PRELIMINARY ECONOMIC ASSESSMENT FOR THE DEER HORN PROPERTY
MAY 2018 PAGE 43
Table 9-1 Selected 2011 Surface Geochemical Sample Results
Sample ID
Type Length (m)
Easting Northing Comments Mo (ppm)
Cu (ppm)
Pb (ppm)
Zn (ppm)
Ag (ppm)
Au (ppb)
Te (ppm)
Ag (g/t)
Au (g/t)
W (%)
1DX15 1DX15 1DX15 1DX15 1DX15 1DX15 1DX15 G6Gr G6Gr 7KP
1361313 channel 1 614245 5914016 core shack vein #1; 3 m
(A) 19.7 179 11 60 22.7 1,905.8 62.3 <50
1361315 channel 1.3 614243 5914016 core shack vein #1; 4 m
(A) 16 110 6.8 76 11.7 469.5 20.9
1361321 composite
grab
613020 5914134 cam's trench #1; grab of material excavated from
pit 2.4 19.4 >10,000 >10,000 34.5 23.3 71.5
1361322 channel 1 613020 5914134 cam's trench #1; 0-1 m 6.3 41 22.5 83 0.2 <0.5 0.2
1361323 channel 1 613020 5914134 cam's trench #1; 1-2 m 2.4 54.8 123.4 72 0.4 <0.5 0.4
1361324 channel 1 613020 5914134 cam's trench #1; 2-3 m 1.9 39.8 198.1 130 0.4 <0.5 0.3
1361333 channel 1.1 613950 5913910 qtz w/ diss cpy, py, tr gl,
sp 8.5 1,581.5 41.3 822 >100 17,003.7 468.8 316 15.9
1361334 channel 0.8 614230 5913859 white qtz, central zone
of diss py, possible tr cpy
26.8 249.8 19.7 58 72.5 4,703.2 99 84 5
1361335 channel 0.9 614227 5913851 qtz, w/ central zone of
diss py (5-8 %) 15.9 65.8 16.3 15 20.9 1,365.5 79.8 <50 1.5
1361336 channel 0.5 614272 5913875 qtz vein, 3-4 % py, cpy 28.6 166.4 29.1 124 39.7 3,545.4 108.1 <50 3.6

PRELIMINARY ECONOMIC ASSESSMENT FOR THE DEER HORN PROPERTY
MAY 2018 PAGE 44
Sample ID
Type Length (m)
Easting Northing Comments Mo (ppm)
Cu (ppm)
Pb (ppm)
Zn (ppm)
Ag (ppm)
Au (ppb)
Te (ppm)
Ag (g/t)
Au (g/t)
W (%)
1361351 panel
sample
613192 5913925 4m north (above) of
trench 3 sample #1361500
12.2 404.1 7,786.4 7,565 >100 144 1,184 111
0.525
1361385 grab
612183 5913753
1.5x20 m vein, foot of western alpine glacier;
py, sp and other sulphides
9.5 413.5 >10,000 >10,000 39.8 57.3 105.1
1361386 composite
grab
612122 5913736 new vein sampled along
structure 16.9 1,049.7 >10,000 >10,000 >100 144.1 214.8 103 <0.9
1361394 chip 0.35 612238 5913719 continuous chip sample
across narrow vein; sample 'BL-50'
19.1 1111 >10,000 8,087 >100 3,017 231 200 2.4
1361401 channel 1.6 613536 5913909
Main Vein; white to pale rusty quartz w local
boxwork after py & ga (?)
72.6 371.7 4,763.9 175 >100 1,414.4 160 200 1.2
1361402 channel 1.4 613534 5913913 Main Vein; continuation
from above; same description
78 391 1,043.5 206 87.4 400.7 50.5 82 <0.9
1361403 channel 0.55 613524 5913913
continuous from previous sample; qz-
sulphide vein w 4-5 % interconnected network
of py-ga-cp
35.5 >10,000 >10,000 >10,000 >100 8,495.4 771.5 926 7.4

PRELIMINARY ECONOMIC ASSESSMENT FOR THE DEER HORN PROPERTY
MAY 2018 PAGE 45
Sample ID
Type Length (m)
Easting Northing Comments Mo (ppm)
Cu (ppm)
Pb (ppm)
Zn (ppm)
Ag (ppm)
Au (ppb)
Te (ppm)
Ag (g/t)
Au (g/t)
W (%)
1361404 channel 2.15 613610 5913988 massive qtz vein w tr–1% py, ga & soft grey-silver mineral; may be sub-o/c
49.9 378.4 2,221 61 >100 37,964.5 1,006 1,083 30.6
1361405 channel 1.3 613870 5913916
qtz-chl vein w 1-2 % py, tr cp & mal; true width 0.7 m; oriented 050/35
SW;
11.2 541.5 136.4 131 16.3 371.9 13
1361406 chip 2 614913 5913602 large quartz vein 1,118.6 624.3 8.1 11 1.6 40.3 4.5
1361407 composite
chip
614916 5913779 quartz vein 44.6 104.7 393.6 19 53.5 4,078.5 121.6 50 4.1 0.015
1361409 composite
chip
614836 5913725 quartz vein 1,269.3 149.6 9.6 4 3.1 50.8 4.3
1361428 composite
grab
613167 5913737 talus/scree material 62.3 27.2 202.4 89 8.3 48.3 3
0.191
1361429 composite
grab
613288 5913904 talus/scree material 32.7 57.8 654.3 117 49.4 6 20.1
1.895
1361463
composite chip
613271 5913917
qtz vein, tr py, 1.8 m thick, but discontinuous
'DH11-BL02' 33.6 52.1 1,176.7 59 >100 7.3 58.7 146
0.079
1361464 composite
chip
613274 5913920 qtz veinlet, siliceous, pyritic 'DH11-BL03'
8.7 273.9 437.7 187 18.3 0.9 11.7
0.118

PRELIMINARY ECONOMIC ASSESSMENT FOR THE DEER HORN PROPERTY
MAY 2018 PAGE 46
Sample ID
Type Length (m)
Easting Northing Comments Mo (ppm)
Cu (ppm)
Pb (ppm)
Zn (ppm)
Ag (ppm)
Au (ppb)
Te (ppm)
Ag (g/t)
Au (g/t)
W (%)
1361466 select grab
613203 5913844
from centre of sample #1361459
30.7 71.8 >10,000 207 >100 17.1 63.2 192
2.145
1361470 grab
613321 5913939 WO3 grab from trench
1E 'DH11-BL13' 9 56.5 23.2 43 0.8 <0.5 4.6
0.088
1361471 grab
613241 5913848 WO3 grab from trench
1E 'DH11-BL14' 41 12.6 182 39 11.8 13.6 8.7
0.9
1361472 grab
613211 5913851 WO3 grab from trench
1E 'DH11-BL15' 60.1 8.1 760.3 101 14.6 8.5 3.9
0.134
1361473 composite
grab
612933 5913894 south-dipping
brecciated qtz vein, tr py 'DH11-BL20'
2.7 164.8 1,412.5 248 9.3 62 15.8
1361474 chip 0.8 613129 5913778 tr of mal, cpy, py 'DH11-
BL21' 7.5 989.8 144.5 4 20.6 27.9 5.3
1361475 chip 0.7 613091 5913741 tr py, ga; 'DH11-BL22' 5.6 195.9 >10,000 32 >100 808.3 47.3 147
1361476 chip
613083 5913742 ga bearing vein; 'DH11-
BL23' 4.9 50.9 >10,000 13 >100 29.7 85.9 295
0.069
1361478 grab
613205 5913845 select grab from Trench
2 channel sample #1361458
31.6 26 6,110.8 273 >100 2.5 32.8 141
1.722
1361479 composite
grab
613198 5913930 TR3 GR1 38.3 55.4 430.3 160 16 1.3 5.2
0.365

PRELIMINARY ECONOMIC ASSESSMENT FOR THE DEER HORN PROPERTY
MAY 2018 PAGE 47
Sample ID
Type Length (m)
Easting Northing Comments Mo (ppm)
Cu (ppm)
Pb (ppm)
Zn (ppm)
Ag (ppm)
Au (ppb)
Te (ppm)
Ag (g/t)
Au (g/t)
W (%)
1361480 composite
grab
613198 5913930 TR3 GR2 33.9 45.2 611.5 204 14.5 3.9 6
0.556
1361481 composite
grab
613108 5913959 TR5 GR1 13.7 88.9 593.6 736 13.3 2.4 14
0.758

PRELIMINARY ECONOMIC ASSESSMENT FOR THE DEER HORN PROPERTY
MAY 2018 PAGE 48
Table 9-2 Selected 2012 Surface Geochemical Sample Results
Sample ID Type Locatio
n Eastin
g Northin
g Au
(ppb) Ag
(ppm)
Te (ppm
)
Bi (ppm
)
Cu (ppm
) Pb
(ppm) Zn
(ppm) Description
1251 grab Saddle 612580 5913731 6 0.14 0.12 0.05 10.6 87.8 433 epidote-altered metavolcanic FW to vein (sample 1252)
1252 grab Saddle 612580 5913731 399 150 36.6 1.69 1260 >10000 >10000
qz-py-gl vein 20-25 cm thick oriented 155/24S; cutting strongly foliated diorite w pronounced epidote banding
1253 grab Saddle 612580 5913731 14 0.53 0.23 0.06 52.6 93.1 168 epidote-altered metavolcanic HW to vein (sample 1252)
1254 grab Saddle 612580 5913731 <5 0.66 0.41 0.04 7.3 316 125 epidote-altered metavolcanic HW to vein (sample 1252)
1255 chip Saddle 612589 5913724 1060 57.6 30.7 2.96 91.6 >10000 1030 qz-py-gl-cp vein; 38 cm thick where sampled; thickens to 70 cm; oriented 158/subvertical
1256 chip Saddle 612598 5913723 1160 159 57.6 2.19 896 >10000 9160 qz-py-gl vein; 18 cm where sampled, but thickens to 40 cm; oriented 058/38S
1257 chip Saddle 612564 5913714 885 161 25.8 0.46 78.8 >10000 111 qz vein w tr py-gl+/-cp; 16 cm thick where sampled; oriented 028/26S
1258 chip New Vein 612279 5913753 30 19 15.1 0.34 525 7170 4430
qz-py-gl vein oriented 044/36S; 40 cm thick where sampled, but thickens to 100 cm immediately to east
1259 grab New Vein 612183 5913753 103 53.2 125 66.3 653 >10000 >10000
selected grab from HW part of 90 cm qz-py-gl vein oriented 034/42S; near sample 1361385 (2011)
1261 grab New Vein 612286 5913761 58 12.3 24.5 5.35 537 2900 2070 85 to 100 cm wide qz vein w tr to 1 % diss py-gl
1262 grab New Vein 612285 5913760 9 0.81 0.99 0.26 71.4 128 216 diorite from HW of vein (sample 1261)
1263 chip New Vein 612078 5913660 37 33.1 58.9 5.96 574 >10000 3440
qz vein w 6-8% diss gl-py-sp+/-cp; 25 cm chip from centre of vein; vein follows lith contact
1264 grab New Vein 612076 5913659 756 197 99.7 5.26 82.9 >10000 1190
60 cm qz vein w 1-2% diss gl-py; oriented 038/22SE; 20 m east of Pry Bar Vein
1265 chip New Vein 612078 5913660 <5 1.75 0.96 0.2 140 556 279
footwall siliciclastics - composite chip across 3 m of FW
1266 grab New Vein 612046 5913642 35 6.38 1.75 0.3 132 478 167
qz-py vein oriented 050/20S; hosted by sheared diorite

PRELIMINARY ECONOMIC ASSESSMENT FOR THE DEER HORN PROPERTY
MAY 2018 PAGE 49
Sample ID Type Locatio
n Eastin
g Northin
g Au
(ppb) Ag
(ppm)
Te (ppm
)
Bi (ppm
)
Cu (ppm
) Pb
(ppm) Zn
(ppm) Description
1267 chip Pry Bar 611941 5913609 66 94.8 0.49 1 1750 2050 973 composite chip of 'Contact Zone' style QSP alteration w polymetallic stringers
1268 grab Pry Bar 611922 5913599 11 7.27 3.53 2.09 126 1180 1320 40 cm qz vein w tr py; oriented 066/40S
1269 grab Pry Bar 611913 5913613 23 12.2 2.2 0.2 355 1170 505 composite grab of qz stringer mineralization w tr-0.5% py+/-gl
1275 channel Pry Bar 611937 5913610 27 5.06 0.17 0.12 211 263 429
QSP 'Contact-Style' alteration enclosing Pry Bar Vein; 1.12 m cut channel sample
1276 channel Pry Bar 611937 5913610 32 35.9 0.7 0.5 2440 2100 1280
QSP 'Contact-Style' alteration enclosing Pry Bar Vein; 0.57 m cut channel sample
1277 channel Pry Bar 611937 5913610 104 274 0.16 0.61 5910 2340 1910
QSP 'Contact-Style' alteration enclosing Pry Bar Vein; 0.87 m cut channel sample
1278 channel Pry Bar 611932 5913608 19 143 0.66 1.23 5350 1430 854
Pry Bar Vein Prospect Pit; qz-py vein up to 40 cm thick oriented 078/78N; sits within 'Contact Zone" style alt'n & min'n w diss gl, sp, py in wallrock envelopes; 0.66 m cut channel sample
1279 channel Pry Bar 611919 5913594 154 354 1.14 0.83 6030 1350 2040
Pry Bar Vein: qz-py vein up to 40 cm thick oriented 078/78N; 0.86 m cut channel sample
1280 chip New West 611812 5913572 712 92.7 149 61.7 203 6930 3670
0.95 m wide qz vein w 4-5% patchy-blebby py-gl-sp; vein oriented 044/19S; sampled across bottom 0.7 m of vein
1281 grab New West 611803 5913549 61 47.6 37.1 7.65 161 >10000 4550 sub o/c of qz vein w 2-3% c-gr diss py-gl-sp
1282 grab New West 611803 5913549 138 40.7 19.4 3.96 400 6190 2740
qz vein w 1-2% diss py-gl-sp; vein oriented 140/15SE
1285 grab Pond 611283 5913866 <5 0.13 0.06 0.06 20.1 12.2 7 oxidized and QSP-altered diorite to qz diorite w 6-8% of coarse aggregates & stringers of py
1286 channel H-Spot 611211 5913990 <5 0.07 0.09 0.07 52.5 7.5 19
intensely QSP altered diorite to qz diorite w up 8-10% py as coarse aggregates; 1.10 m cut channel sample
1287 channel H-Spot 611211 5913990 11 0.06 0.06 0.04 35.5 7.8 16
intensely QSP altered diorite to qz diorite w up 8-10% py as coarse aggregates; 0.75 m cut channel sample
1288 channel H-Spot 611211 5913990 <5 0.07 <0.05 0.08 86.3 7.2 18
intensely QSP altered diorite to qz diorite w up 8-10% py as coarse aggregates; 0.78 m cut channel sample

PRELIMINARY ECONOMIC ASSESSMENT FOR THE DEER HORN PROPERTY
MAY 2018 PAGE 50
Sample ID Type Locatio
n Eastin
g Northin
g Au
(ppb) Ag
(ppm)
Te (ppm
)
Bi (ppm
)
Cu (ppm
) Pb
(ppm) Zn
(ppm) Description
1289 channel H-Spot 611211 5913990 <5 0.06 0.08 0.09 56.3 7.4 14
intensely QSP altered diorite to qz diorite w up 8-10% py as coarse aggregates; 0.70 m cut channel sample
1290 channel H-Spot 611211 5913990 <5 0.07 0.14 0.09 115 6.3 16
intensely QSP altered diorite to qz diorite w up 8-10% py as coarse aggregates; 0.84 m cut channel sample
1291 channel H-Spot 611211 5913990 8 0.07 0.26 0.12 121 9.8 14
intensely QSP altered diorite to qz diorite w up 8-10% py as coarse aggregates; 0.88 m cut channel sample
1292 channel H-Spot 611211 5913990 <5 6.57 0.14 0.18 4240 12.3 101
potassic alt'd diorite w 5% aggregates of intergrown mt-cp-py; strong fabric 142/74 SW; 0.86 m cut channel sample
1304 grab Pry Bar 611882 5913548 <5 0.78 0.23 0.66 14.5 14.7 14 qz vein w 1-2% diss py
1305 grab Pry Bar 611887 5913562 24 12.6 4.76 1.41 85.3 4430 2850 ladder qz veins w 1-2% diss py-gl-sp
1306 grab Pry Bar 611896 5913588 8 2.79 1.3 0.87 547 21.8 1180 diorite w qz stringers and tr diss f-gr Sx
1307 grab New West 611825 5913586 15 12.7 18.8 4.58 206 5190 2710 qz vein w 1-2% diss py-gl-sp
1310 grab Pond Zone 611289 5913855 <5 0.08 0.2 0.07 18.5 16.5 20
oxidized and QSP-altered diorite to qz diorite w 6-8% of coarse aggregates & stringers of py
1311 grab Pond Zone 611261 5913860 6 1.2 1.28 0.58 73.8 82.8 90
oxidized and QSP-altered diorite to qz diorite w 6-8% of coarse aggregates & stringers of py
1312 grab Pond Zone 611196 5913796 6 2 0.23 1.19 181 35.7 64
oxidized and QSP-altered diorite to qz diorite w 6-8% of coarse aggregates & stringers of py
1322 grab Saddle 612763 5913873 295 27.3 17.3 7.1 104 1120 403 HW qz vein w tr diss py
1327 grab Saddle 612715 5913806 55 16.4 437 507 169 135 47 select grab from 40 cm qz-py vein; oriented 166/26E
1328 grab Saddle Area 612738 5913875 <5 0.58 2.81 4.63 48.7 150 236 hornfels to skarn-alt'd tuffaceous seds
1329 grab Saddle 612712 5913803 916 633 357 1240 358 >10000 8230 select grab from 1.4 m qz-py-sp-gl-cp vein; oriented 160/40E
1330 grab Saddle 612720 5913795 100 109 124 249 637 3970 967 20 cm qz vein w diss 1-2% diss py-gl-cp; oriented 058/42S

PRELIMINARY ECONOMIC ASSESSMENT FOR THE DEER HORN PROPERTY
MAY 2018 PAGE 51
Figure 9-1 Selected 2011 Surface Geochemical Sample Locations

PRELIMINARY ECONOMIC ASSESSMENT FOR THE DEER HORN PROPERTY
MAY 2018 PAGE 52
Table 9-3 Selected Trench Sample Results
Trench ID
From (m) To (m) Interval* (m) Au (g/t ) Ag (g/t ) Te (ppm) WO3 (%)
Trench 1 34.25 52.25 18.0 - - - 0.03
Including 44.25 48.25 4.0 - - - 0.05
Trench 2 0 10.0 10.0 - 79.1 - 0.70
Including 2.0 8.0 6.0 - 114.0 - 1.08
Trench 3 10.0 14.0 4.0 - - - 0.17
And 38.0 40.0 2.0 - - - 0.15
And 62.0 70.0 8.0 - - - 0.14
Including 66.0 68.0 2.0 - - - 0.25
And 92.0 102.0 10.0 - - - 0.10
Including 94.0 96.0 4.0 - - - 0.15
Trench 4B
0.0 11.0 11.0 - - - 0.07
Including 2.0 4.0 2.0 - - - 0.19
Note: *Intervals listed above are channel sample lengths and do not imply true widths.

PRELIMINARY ECONOMIC ASSESSMENT FOR THE DEER HORN PROPERTY
DEER HORN CAPITAL PAGE 53
Figure 9-2 2012 Sample Locations

PRELIMINARY ECONOMIC ASSESSMENT FOR THE DEER HORN PROPERTY
DEER HORN CAPITAL PAGE 54
Figure 9-3 Trench Locations

PRELIMINARY ECONOMIC ASSESSMENT FOR THE DEER HORN PROPERTY
DEER HORN CAPITAL PAGE 55
10.0 DRILLING A total of 55 NQ2 diameter diamond drillholes, with an aggregate length of 3,772.50 m, were completed on the Deer Horn property from mid-July to mid-September 2011. Drillhole locations are shown in Figure 10-1 and location information is listed in Table 10-1. Down-hole survey data is presented in Table 10-2.
The majority of the drillholes (49) targeted the two known and closely-spaced west-trending mineralized structures, the Main Vein and Contact Zone, over a strike length of 875 m in the vicinity of the Deer Horn adit. Most of these holes were drilled on an azimuth of at or close to either 000 or 180 degrees, and were shallow, with lengths ranging from 26.5 m to 150.6 m. Three of the holes were abandoned because of drilling difficulties and did not contribute useful data. The intersections include modest to high gold-silver-tellurium grades over narrow widths, encountered principally in the Main Vein, and bulk mineable gold-silver grades, encountered principally in the Contact Zone. Better precious metal grades are accompanied by significant concentrations of copper, lead and zinc, and by highly anomalous amounts of tellurium. A summary of Main Vein and Contact Zone drill results are listed in Table 10-3. The remaining six holes were drilled in an area immediately west of the principal target to test the historic Harrison Scheelite tungsten occurrence that was trenched earlier in the program. A summary of selected tungsten target drill results is provided in Table 10-4. All 2011 drill results are provided in Appendix A.

PRELIMINARY ECONOMIC ASSESSMENT FOR THE DEER HORN PROPERTY
DEER HORN CAPITAL PAGE 56
Figure 10-1 2011 Diamond Drillhole Locations

PRELIMINARY ECONOMIC ASSESSMENT FOR THE DEER HORN PROPERTY
DEER HORN CAPITAL PAGE 57
Table 10-1 Collar Locations for 2011 Diamond Drillholes
Drillhole ID Easting Northing Section Azimuth Dip EOH Assay Certificate
ID
Comments
DH11-097 614269 5913896 614275 350 -43.5 74.98 11003764.1 Resource extension to east of MRA
DH11-098 614224 5913880 614225
-90 63.10 11003764.1 Resource extension to east of MRA
DH11-099 614224 5913882 614225 360 -44 78.30 11003811.1 Resource extension to east of MRA
DH11-100 614269 5913895 614275 178 -43 59.70 11003876.1 Resource extension to east of MRA
DH11-101 614122 5913895 614125 180 -47 50.90 11003876.1 Resource extension to east of MRA
DH11-102 614122 5913896 614125 180 -79.5 53.95 11003876.1 Resource extension to east of MRA
DH11-103 614073 5913875 614075 180 -49.5 50.30 11003876.1 Resource extension to east of MRA
DH11-104 613900 5913869 613900 180 -70 57.00 11003928.1 Resource extension to east of MRA
DH11-105 613946 5913922 613950 180 -54.5 78.00 11003811.1 Main resource area (MRA*) fill-in
DH11-106 613876 5913936 - 1.5 -61 8.42
Hole abandoned
DH11-107 613876 5913936 613875 6.5 -62.5 81.38 11003629.1 Main resource area (MRA*) fill-in
DH11-108 613899 5913929 613900 1 -75 93.60 11003928.1 Main resource area (MRA*) fill-in
DH11-109 613850 5913941 613850 180 -70 32.3 11004109.1 Hole abandoned in Deer Horn adit workings @ 29.3 to 32.3 m
DH11-110 613850 5913941 613850 180 -78.5 166.7 11003928.1 & 11003986.1
Main resource area (MRA*) fill-in

PRELIMINARY ECONOMIC ASSESSMENT FOR THE DEER HORN PROPERTY
DEER HORN CAPITAL PAGE 58
Drillhole ID Easting Northing Section Azimuth Dip EOH Assay Certificate
ID
Comments
DH11-111 613848 5913945 613850 360 -75 111.86 11004364.1 & 11004109.1
Main resource area (MRA*) fill-in
DH11-112 613805 5913958 613800 360 -45 57.00 11003986.1 Main resource area (MRA*) fill-in
DH11-113 613725 5913907 613725
-90 26.52 11004109.1 Main resource area (MRA*) fill-in
DH11-114 613725 5913908 613725 180 -50 39.62 11004109.1 Main resource area (MRA*) fill-in
DH11-115 613777 5913984 613775 350 -60 53.94 11004109.1 Main resource area (MRA*) fill-in
DH11-116 613746 5913971 613750 360 -79 69.19 11003986.1 & 11004109.1
Main resource area (MRA*) fill-in
DH11-117 613746 5913971 613750 360 -53 66.14 11004316.1 Main resource area (MRA*) fill-in
DH11-118 613724 5913962 613725 180 -80 78.33 11004364.1 Main resource area (MRA*) fill-in
DH11-119 613694 5913954 613700 360 -55 60.04 11004316.1 Main resource area (MRA*) fill-in
DH11-120 613696 5913950 613700 180 -85 47.85 11004316.1 Main resource area (MRA*) fill-in
DH11-121 613668 5913926 613675 180 -77 38.71 11004109.1 Main resource area (MRA*) fill-in
DH11-122 613651 5913954 613650 225 -42.5 58.22 11004316.1 Main resource area (MRA*) fill-in
DH11-123 613647 5913951 613650 300 -50 84.30 11004316.1 Main resource area (MRA*) fill-in
DH11-124 613518 5913956 - 160 -50 26.50
Casing only - hole abandoned
DH11-125 613518 5913959 613525
-90 72.23 11004316.1 Resource extension to

PRELIMINARY ECONOMIC ASSESSMENT FOR THE DEER HORN PROPERTY
DEER HORN CAPITAL PAGE 59
Drillhole ID Easting Northing Section Azimuth Dip EOH Assay Certificate
ID
Comments
west of MRA
DH11-126 613591 5913993 613600
-90 69.19 11004377.1 Resource extension to west of MRA
DH11-127 613588 5913994 613600 130 -72 150.6 11005292.1 Resource extension to west of MRA
DH11-128 613548 5913960 613550 360 -50 71.32 11005326.1 Resource extension to west of MRA
DH11-129 613547 5913961 613550
-90 59.4 11005348.1 Resource extension to west of MRA
DH11-130 613515 5913963 613525 360 -50 50.3 11004415.1 Resource extension to west of MRA
DH11-131 613518 5913959 613525 120 -70 92.4 11004377.1 Resource extension to west of MRA
DH11-132 613400 5913929 - 360 -50 32.6
Stuck rods at 32.6m
DH11-133 613400 5913929 613400 340 -75 72.2 11005352.1 Resource extension to west of MRA
DH11-134 613292 5913905 613300 270 -50 96.6 11005351.1 Tungsten hole
DH11-135 613292 5913905 613300 340 -45 104.9 11005370.1 Tungsten hole
DH11-136 613340 5913954 613325 270 -50 47.9 11005386.1 Tungsten hole
DH11-137 613340 5913954 613325 355 -50 72.24 11005373.1 Tungsten hole
DH11-138 613185 5913903 613200 30 -45 93.57 11005374.1 Tungsten hole
DH11-139 613196 5913840 613200 25 -45 66.14 11005385.1 Tungsten hole
DH11-140 613416 5913883 613400 340 -60 121.01 11005369.1 Resource extension to west of MRA
DH11-141 613650 5913951 613650 180 -60 47.85 11005325.1 Main Vein Te
DH11-142 613750 5913976 613750 180 -70 81.38 11005024.1 Main Vein Te
DH11-143 613725 5913968 613725 360 -44 63.09 11005349.1 Contact Zone Te

PRELIMINARY ECONOMIC ASSESSMENT FOR THE DEER HORN PROPERTY
DEER HORN CAPITAL PAGE 60
Drillhole ID Easting Northing Section Azimuth Dip EOH Assay Certificate
ID
Comments
DH11-144 613847 5913936 613850 180 -45 75.29 11005350.1 Main Vein Te
DH11-145 610000 5910000 613950 360 -45 63.09 11005021.1 Contact Zone Te
DH11-146 613920 5913924 613925 360 -50 59.44 11005021.1 & 11005371.1
Contact Zone Te
DH11-147 613919 5913919 613925 180 -75 75.29 11005384.1 Main Vein Te
DH11-148 613875 5913931 613875 180 -70 50.9 11005020.1 Main Vein Te
DH11-149 613825 5913972 613825 360 -65 53.95 11005022.1 Contact Zone Te
DH11-150 613767 5913941 613775 360 -45 75.29 11005023.1 Contact Zone Te
DH11-151 610000 5910000 613675 360 -45 87.48 11005347.1 Contact Zone Te
55 Drillholes
Grand Total:
3,772.5 metres
Table 10-2 2011 Down-Hole Surveys
Drillhole ID
Depth (m)
Azimuth Dip Casing Drillhole ID
Depth (m)
Azimuth Dip Casing
DH11-97 70.1 354 -43 1.52
DH11-98 61.6 51 -89.3 2.13
DH11-126 67.7 32.2 -88.3 4.57 DH11-99 63.6 364.4 -43 2.13
DH11-127 145.4 119.2 -69.6 3.04
DH11-100 55.2 173.6 -43.6 3.7
DH11-128 69.8 1.3 -50.6 1.52 DH11-101 46.3 178.2 -47 3.1
DH11-129 54.7 65.7 -87.4 8.4
DH11-102 49.4 183.8 -80.5 2.13
DH11-130 46.3 2.3 -49.9 9.14 DH11-103 46.8 179.5 -51.1 2.13
DH11-131 87.8 101.1 -67.7 18.29
DH11-104 52.4 179.7 -70 3.1
DH11-133 67.7 343.8 -74.5 1.52 DH11-105 73.5 176.5 -53 3.1
DH11-134 22.6 272.6 -49.6 9.14
DH11-107 79.9 4.1 -62.6 0
DH11-134 92.0 274.2 -48.2 9.14 DH11-108 89.0 6.6 -74.7 0
DH11-135 103.3 341.9 -44.6 1.52
DH11-110 73.8 185.6 -78.9 1.52
DH11-136 45.4 272.9 -50.7 9.14 DH11-110 162.2 187.2 -79.4 1.52
DH11-137 67.7 357.7 -49.5 24.38
DH11-111 107.3 351.5 -74 1.52
DH11-138 75.3 22.1 -46.5 9.14 DH11-112 55.6 359.9 -45.1 1.52
DH11-139 61.6 26.5 -43.3 12.19
DH11-113 25.0 266.3 -87.6 1.52
DH11-140 104.2 345.9 -57.2 1.52 DH11-114 34.1 182.8 -47.2 1.52
DH11-141 49.4 179.5 -61.2 3.04
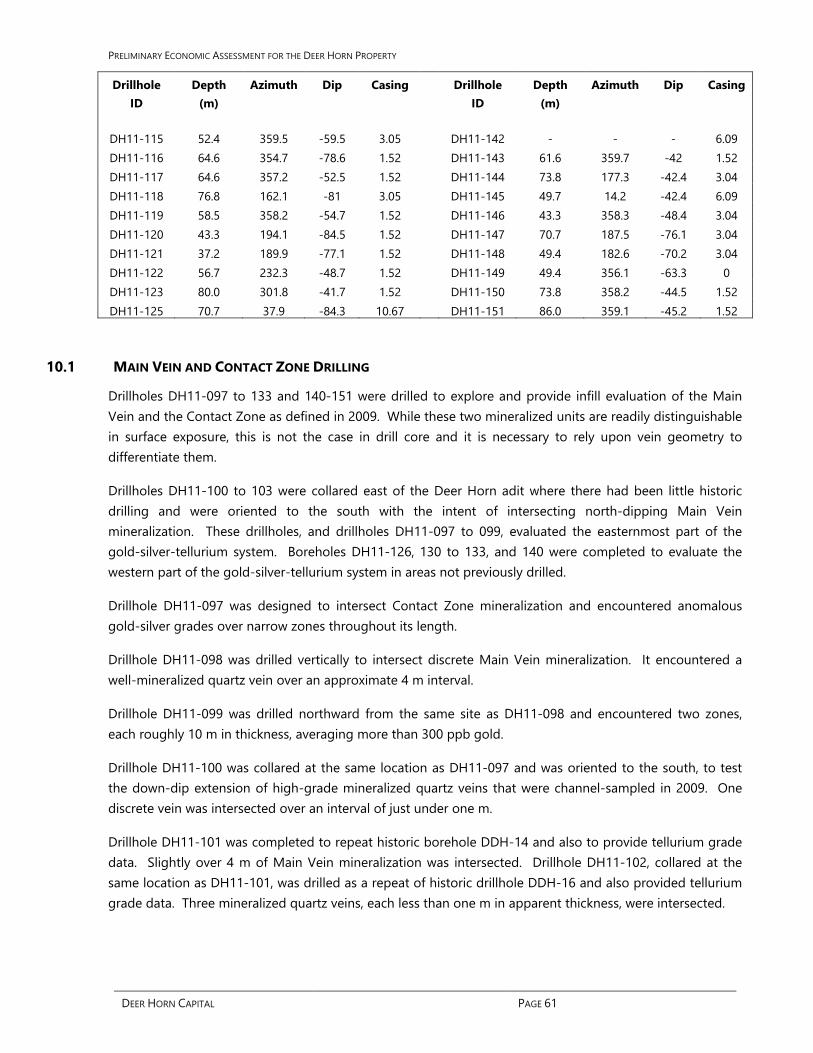
PRELIMINARY ECONOMIC ASSESSMENT FOR THE DEER HORN PROPERTY
DEER HORN CAPITAL PAGE 61
Drillhole ID
Depth (m)
Azimuth Dip Casing Drillhole ID
Depth (m)
Azimuth Dip Casing
DH11-115 52.4 359.5 -59.5 3.05
DH11-142 - - - 6.09 DH11-116 64.6 354.7 -78.6 1.52
DH11-143 61.6 359.7 -42 1.52
DH11-117 64.6 357.2 -52.5 1.52
DH11-144 73.8 177.3 -42.4 3.04 DH11-118 76.8 162.1 -81 3.05
DH11-145 49.7 14.2 -42.4 6.09
DH11-119 58.5 358.2 -54.7 1.52
DH11-146 43.3 358.3 -48.4 3.04 DH11-120 43.3 194.1 -84.5 1.52
DH11-147 70.7 187.5 -76.1 3.04
DH11-121 37.2 189.9 -77.1 1.52
DH11-148 49.4 182.6 -70.2 3.04 DH11-122 56.7 232.3 -48.7 1.52
DH11-149 49.4 356.1 -63.3 0
DH11-123 80.0 301.8 -41.7 1.52
DH11-150 73.8 358.2 -44.5 1.52 DH11-125 70.7 37.9 -84.3 10.67
DH11-151 86.0 359.1 -45.2 1.52
10.1 MAIN VEIN AND CONTACT ZONE DRILLING
Drillholes DH11-097 to 133 and 140-151 were drilled to explore and provide infill evaluation of the Main Vein and the Contact Zone as defined in 2009. While these two mineralized units are readily distinguishable in surface exposure, this is not the case in drill core and it is necessary to rely upon vein geometry to differentiate them.
Drillholes DH11-100 to 103 were collared east of the Deer Horn adit where there had been little historic drilling and were oriented to the south with the intent of intersecting north-dipping Main Vein mineralization. These drillholes, and drillholes DH11-097 to 099, evaluated the easternmost part of the gold-silver-tellurium system. Boreholes DH11-126, 130 to 133, and 140 were completed to evaluate the western part of the gold-silver-tellurium system in areas not previously drilled.
Drillhole DH11-097 was designed to intersect Contact Zone mineralization and encountered anomalous gold-silver grades over narrow zones throughout its length.
Drillhole DH11-098 was drilled vertically to intersect discrete Main Vein mineralization. It encountered a well-mineralized quartz vein over an approximate 4 m interval.
Drillhole DH11-099 was drilled northward from the same site as DH11-098 and encountered two zones, each roughly 10 m in thickness, averaging more than 300 ppb gold.
Drillhole DH11-100 was collared at the same location as DH11-097 and was oriented to the south, to test the down-dip extension of high-grade mineralized quartz veins that were channel-sampled in 2009. One discrete vein was intersected over an interval of just under one m.
Drillhole DH11-101 was completed to repeat historic borehole DDH-14 and also to provide tellurium grade data. Slightly over 4 m of Main Vein mineralization was intersected. Drillhole DH11-102, collared at the same location as DH11-101, was drilled as a repeat of historic drillhole DDH-16 and also provided tellurium grade data. Three mineralized quartz veins, each less than one m in apparent thickness, were intersected.

PRELIMINARY ECONOMIC ASSESSMENT FOR THE DEER HORN PROPERTY
DEER HORN CAPITAL PAGE 62
Table 10-3 Selected 2011 Main Vein and Contact Zone Diamond Drilling Results
Drillhole ID From (m)
To (m) Interval* (m)
Au (g/t) Ag (g/t) Te (ppm) WO3 (%)
DH11-097 14.00 14.30 0.30 6.30 70.0 295
DH11-098 16.92 20.88 3.96 5.37 55.7 252
including 16.92 19.00 2.08 8.40 84.0 342
DH11-100 11.00 14.46 3.46 1.13 15.4 46
DH11-101 38.10 40.40 2.30 1.80 18.4 43
DH11-102 25.00 43.70 18.70 1.42 14.9 35
including 28.70 34.90 6.20 2.57 24.2 67
and 31.00 33.30 2.30 3.80 34.5 101
DH11-103 33.05 36.45 3.40 2.99 34.4 96
including 33.05 34.20 1.15 7.32 79.2 248
DH11-104 7.60 10.60 3.00 3.95 107 133
and 25.00 40.50 15.50 1.09 30.4 39
including 32.90 35.70 2.80 3.30 71.2 115
and 40.00 40.50 0.50 4.40 108 165
DH11-105 8.00 9.50 1.50 4.30 109 109
and 18.00 18.80 0.80 49.9 1,042 1,281
and 26.60 28.00 1.40 4.30 94.0 95
and 60.70 63.50 2.80 4.61 75.6 135
DH11-107 10.60 46.00 35.40 4.12 94.4 115
including 13.60 16.60 3.00 17.30 285.0 367
and including 13.60 15.00 1.40 33.40 507.0 667
and 44.90 46.00 1.10 25.50 749.0 781
and 51.90 52.40 0.50 16.40 588.0 467
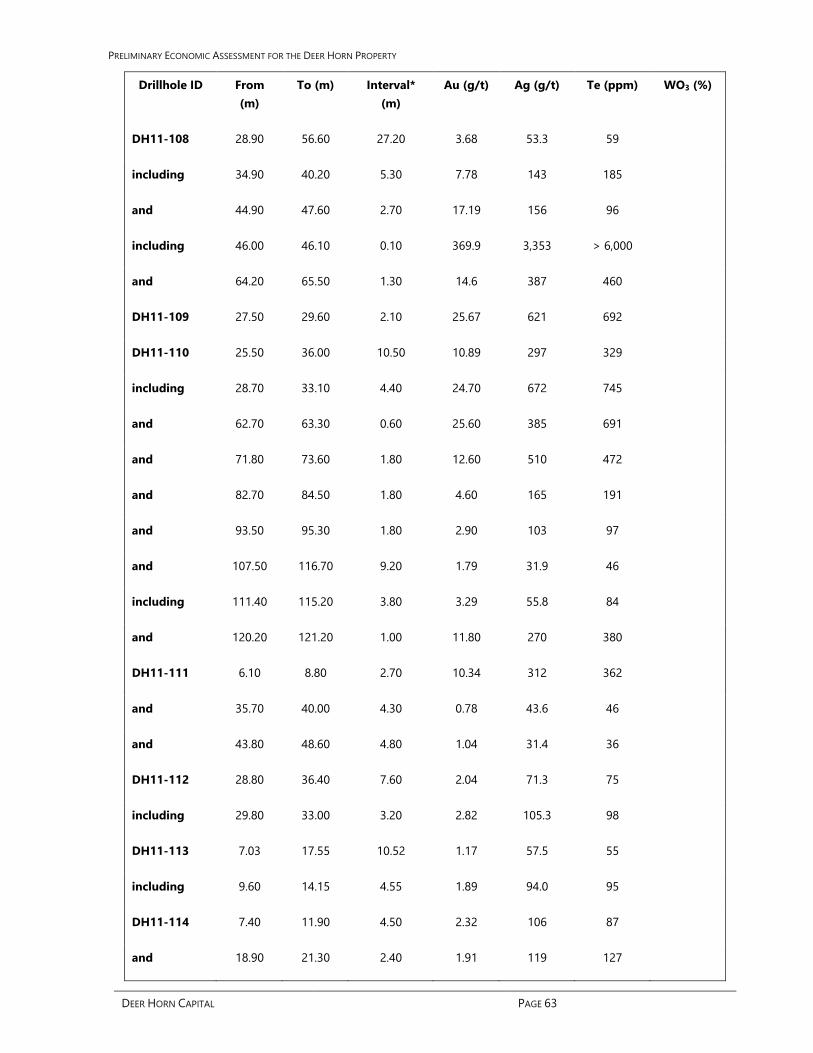
PRELIMINARY ECONOMIC ASSESSMENT FOR THE DEER HORN PROPERTY
DEER HORN CAPITAL PAGE 63
Drillhole ID From (m)
To (m) Interval* (m)
Au (g/t) Ag (g/t) Te (ppm) WO3 (%)
DH11-108 28.90 56.60 27.20 3.68 53.3 59
including 34.90 40.20 5.30 7.78 143 185
and 44.90 47.60 2.70 17.19 156 96
including 46.00 46.10 0.10 369.9 3,353 > 6,000
and 64.20 65.50 1.30 14.6 387 460
DH11-109 27.50 29.60 2.10 25.67 621 692
DH11-110 25.50 36.00 10.50 10.89 297 329
including 28.70 33.10 4.40 24.70 672 745
and 62.70 63.30 0.60 25.60 385 691
and 71.80 73.60 1.80 12.60 510 472
and 82.70 84.50 1.80 4.60 165 191
and 93.50 95.30 1.80 2.90 103 97
and 107.50 116.70 9.20 1.79 31.9 46
including 111.40 115.20 3.80 3.29 55.8 84
and 120.20 121.20 1.00 11.80 270 380
DH11-111 6.10 8.80 2.70 10.34 312 362
and 35.70 40.00 4.30 0.78 43.6 46
and 43.80 48.60 4.80 1.04 31.4 36
DH11-112 28.80 36.40 7.60 2.04 71.3 75
including 29.80 33.00 3.20 2.82 105.3 98
DH11-113 7.03 17.55 10.52 1.17 57.5 55
including 9.60 14.15 4.55 1.89 94.0 95
DH11-114 7.40 11.90 4.50 2.32 106 87
and 18.90 21.30 2.40 1.91 119 127

PRELIMINARY ECONOMIC ASSESSMENT FOR THE DEER HORN PROPERTY
DEER HORN CAPITAL PAGE 64
Drillhole ID From (m)
To (m) Interval* (m)
Au (g/t) Ag (g/t) Te (ppm) WO3 (%)
DH11-115 36.00 37.50 1.50 1.50 118 100
DH11-116 29.10 36.20 7.10 5.65 182 169
including 29.10 31.70 2.60 12.03 346 330
and 46.90 47.90 1.00 8.43 260 208
DH11-117 26.20 39.00 12.80 8.69 316.8 257
including 29.20 32.00 2.80 30.16 1,098 849
and including 30.20 31.20 1.00 48.70 2,002 1,421
and 49.70 52.80 3.10 - 18.8 - 0.23
DH11-118 28.00 30.00 2.00 3.05 92.0 119
and 58.65 59.30 0.65 6.20 283.0 308
DH11-119 27.50 29.60 2.10 1.20 44.4 68
and 31.50 53.35 21.85 0.43 17.8 26
including 51.50 53.35 1.85 1.46 52.9 53
DH11-120 17.40 22.75 5.35 2.93 148 134
including 18.20 19.77 1.57 8.20 424 350
DH11-121 16.90 19.00 2.10 9.75 430 416
DH11-122 30.50 33.20 2.70 5.84 171 190
including 32.50 33.20 0.70 14.90 342 430
DH11-123 19.50 24.50 5.00 1.03 38.6 53
and 36.40 40.85 4.45 5.30 164 207
and 50.80 51.15 0.35 7.10 304 267
DH11-125 20.50 26.15 5.65 9.57 368 319
including 21.90 24.60 2.70 18.63 712 604
and including 23.00 24.00 1.00 39.60 1,211 1,070

PRELIMINARY ECONOMIC ASSESSMENT FOR THE DEER HORN PROPERTY
DEER HORN CAPITAL PAGE 65
Drillhole ID From (m)
To (m) Interval* (m)
Au (g/t) Ag (g/t) Te (ppm) WO3 (%)
and 45.85 46.15 0.30 13.3 550 402
DH11-126 5.55 8.70 3.15 1.90 122.9 119
including 7.00 8.70 1.70 3.12 203.7 200
DH11-127 42.65 66.50 23.85 2.34 130 102
including 55.85 56.40 0.55 17.20 1,282 836
and including 59.50 63.00 3.50 4.94 316 236
and including 64.85 65.25 0.40 24.80 937 885
DH11-128 19.00 34.00 15.00 2.45 127.7 132
including 20.42 24.50 4.08 5.95 300.0 290
and including 20.42 22.50 2.08 10.90 508.4 465
and 42.84 43.14 0.30 - 106.0 86 0.97
and 56.80 57.50 0.70 - 18.4 12
DH11-129 12.60 20.55 7.95 5.93 272 253
including 17.15 20.55 3.40 9.42 467 433
and 36.90 49.05 12.15 1.36 102 106
including 41.00 44.90 3.90 3.00 155 159
DH11-130 9.60 11.28 1.68 2.40 114.0 94 0.77
and 15.00 21.00 6.00 0.46 31.0 32
including 18.00 19.00 1.00 1.50 114.0 127
and 23.80 25.34 1.54 3.00 136.0 113
and 26.95 27.85 0.90 1.50 72.0 105
DH11-131 17.37 18.56 1.19 0.84 189.0 119
and 21.05 26.75 5.70 2.96 156.8 139
including 23.27 25.27 2.00 7.46 330.2 307

PRELIMINARY ECONOMIC ASSESSMENT FOR THE DEER HORN PROPERTY
DEER HORN CAPITAL PAGE 66
Drillhole ID From (m)
To (m) Interval* (m)
Au (g/t) Ag (g/t) Te (ppm) WO3 (%)
and 50.45 50.54 0.09 14.60 748.0 732
and 72.00 75.00 3.00 0.82 35.0 39
DH11-133 45.60 47.60 2.00 0.62 51.0 59
and 49.55 50.60 1.05 2.00 142 151 0.02
DH11-140 50.00 71.00 21.00 1.57 113 89
including 51.70 59.50 7.80 3.89 277 217
including 53.70 55.25 1.55 11.79 769 503
and 57.25 59.50 2.25 3.80 321 319
and 77.55 77.75 0.20 - - - 0.11
DH11-141 36.10 37.33 1.23 13.80 422 381
DH11-142 35.12 37.60 2.48 2.21 84.8 204
and 42.20 45.40 3.20 2.45 88.6 109
DH11-143 28.00 32.00 4.00 3.43 56.0 91
including 30.50 32.00 1.50 7.70 101 158
and 39.50 42.05 2.55 3.15 128 109
including 40.50 41.00 0.50 14.80 588 494
and 53.80 54.30 0.50 - 192 107 1.80
DH11-144 27.85 29.40 1.55 26.34 827 722
and 61.20 64.75 3.55 2.14 78.2 78
DH11-145 30.60 37.30 6.70 1.24 28.5 48
including 32.50 33.30 0.80 6.50 117 169
DH11-146 21.00 24.25 3.25 6.17 108 124
and 41.60 43.00 1.40 4.32 106 98
DH11-147 41.65 45.00 3.35 11.51 156 228

PRELIMINARY ECONOMIC ASSESSMENT FOR THE DEER HORN PROPERTY
DEER HORN CAPITAL PAGE 67
Drillhole ID From (m)
To (m) Interval* (m)
Au (g/t) Ag (g/t) Te (ppm) WO3 (%)
including 42.80 43.45 0.65 51.8 655 1,156
and 62.85 67.85 5.00 2.13 26.0 57
DH11-148 0.00 17.80 17.80 1.16 34.2 41
and 34.56 35.20 0.64 88.7 1,092 1,707
DH11-149 21.00 26.50 5.50 2.57 106 99
including 21.00 22.00 1.00 7.80 330 303
DH11-150 37.50 40.50 3.00 3.30 75.5 110
and 50.50 52.00 1.50 1.50 65.0 56
DH11-151 59.80 67.00 7.20 0.99 46.0 43
Note:*Intervals indicated refer to core lengths and do not imply true widths
Drillhole DH11-103 was completed to extend the Main Vein that was intersected by drillhole DDH89-11 towards surface and to obtain tellurium data. An approximate 1.4 m interval of the Main vein was intersected.
Drillhole DH11-104 was completed to evaluate the potential for mineralization in the footwall of the Main Vein. It encountered three narrow veins, with the latter two occurring within a 15.5 m zone averaging 10.8 g/t Au, 30.4 g/t Ag and 39 ppm Te.
Drillhole DH11-105 was completed to test the Contact Zone and Main Vein and intersected four narrow gold-silver-tellurium zones.
Drillhole DH11-107 intersected Contact Zone mineralization over a 35.40 m interval which contained several high-grade intercepts.
Drillhole DH11-108 was intended to infill-test the contact 25 m east of DH11-107. Contact Zone mineralization was intersected over almost 30 m including narrow intervals of high-grade gold-silver mineralization.
Drillholes DH11-109 and 110 were drilled from the same site. Drillhole 109 was abandoned when it intersected the Deer Horn adit after intersecting a 2 m high-grade gold-silver-tellurium vein. DH11-110 was drilled to test the Main Vein and intersected this target while also intersecting contact Zone mineralization.
Drillhole DH11-111 was collared very close by Holes 109 and 110 but was oriented to the north to test the Contact Zone. It intersected two mineralized zones.
Drillholes DH11-113 and 114 were collared at the same location, and both encountered narrow Main Vein Mineralized zones.

PRELIMINARY ECONOMIC ASSESSMENT FOR THE DEER HORN PROPERTY
DEER HORN CAPITAL PAGE 68
Drillhole DH11-115 encountered a discontinuously-mineralized Contact Zone rocks with one narrow zone of economic interest.
Drillhole DH11-116 also intersected the Contact Zone, and included a well-mineralized 7 m interval that, over 2.6 m, graded 12.03 g/t Au, 346 g/t Ag and 330 ppm Te.
Drillhole DH11-117 was intended to intersect shallow Contact Cone mineralization and did so, encountering several polymetallic-mineralized quartz veins. About 10 m below the Contact Zone, the drillhole intersected siliceous chlorite-epidote replacement zones including several narrow sections of coarsely-disseminated scheelite (tungsten)--the first indications of the tungsten mineralization encountered further to the west.
Drillhole DH11-118 was intended to intersect Main Vein mineralization and cut one weakly mineralized vein over an approximate 10 m interval, and a narrow footwall vein.
Drillholes DH11-119 and 120 were drilled from adjacent pads, with DH11-119 intersecting Contact Zone mineralization, and 120 intersecting Main Vein mineralization. Similarly, drillholes DH11-122 and 123 were drilled from near coincident pads and intersected mineralization from the Main Vein and Contact Zone respectively.
Drillhole DH11-121 intersected a well-mineralized section of the Main Vein.
Drillhole DH11-125 was drilled vertically to test the western extension of the Contact Zone and intersected it from surface to a depth of about 60 m, where it encountered footwall sedimentary rocks.
Drillhole DH11-126 was drilled vertically to test the Contact Zone near a high-grade surface chip sample location from 2009 and encountered footwall sedimentary rocks at a depth of 7.0 m.
Drillhole DH11-127 was drilled southward along Contact Zone mineralization to encounter Main Vein mineralization and therefore does not give a true representation of Contact Zone thickness at this location. Several discrete well-mineralized veins were intersected towards the bottom of the mineralized section.
Drillhole DH11-128 was drilled northward across the westward extension of the Contact Zone and intersected a 15 m zone of well-mineralized quartz-sericite rock and, in the footwall, two narrow silver-tellurium-tungsten veins.
Drillhole DH11-130 was drilled northward from a multi-hole pad, so as to intersect Contact Zone alteration and associated mineralization exposed at the surface. From the same pad, drillhole DH-131 was drilled at an azimuth of 120o to intersect Main Vein mineralization.
Drillhole DH11-133 intersected several narrow zones of modest-grade gold-silver mineralization attributed to the upper part of the Contact Zone.
Drillhole DH11-140 intersected a section of the Contact Zone about 50 m down-dip from the mineralized zones intersected by drillhole DH11-133, and with higher gold, silver and tellurium grades. These two holes, and especially drillhole DH11-140, demonstrate the westward extension of the precious metals-tellurium system outlined by the 2009 drilling program, and identify important tungsten mineralization in altered sedimentary rocks in the footwall of the Contact Zone.
In the same area, drillhole DH11-141 intersected one discrete well-mineralized vein over about one m.
PRELIMINARY ECONOMIC ASSESSMENT FOR THE DEER HORN PROPERTY
DEER HORN CAPITAL PAGE 69
Drillhole DH11-142 intersected three quartz-polymetallic sulphide veins.
Drillhole DH11-143 intersected over 19 m of contact Zone alteration and mineralization, and several bands of disseminated scheelite within epidote-altered footwall rocks.
Drillhole DH11-144 intersected a well-mineralized section of the Main Vein, a zone of footwall vein, and stringer mineralization within quartz-sericite alteration.
Drillhole DH11-145 encountered a modestly-mineralized section of Contact Zone in contact with silicified footwall clastic rocks that in turn host precious-metal-containing narrow quartz-polymetallic sulphide veins.
Drillholes DH11-146 and 147 were collared close by one another and were drilled to the north and south respectively. Drillhole 146 intersected a 3.25 m interval of a quartz vein and silicified wall rock and the contact between altered granodiorite and footwall clastic rocks. Drillhole 147 intersected a narrow, very well-mineralized quartz-polymetallic vein near the granodiorite-footwall clastic rock contact.
Drillhole DH11-148 intersected a low-grade zone to a depth of about 18 m, and a deeper, high-grade quartz-polymetallic sulphide vein about 1.6 m in thickness.
Drillholes DH 149, 150 and 151 were all advanced to test the Contact Zone, and all intersected the zone over varying widths, returning anomalous to modest gold-silver-tellurium grades.
10.2 HARRISON SCHEELITE OCCURRENCE DRILLING
The Harrison Scheelite tungsten occurrence was explored by drillholes DH11-134 to DH11-139 inclusive, and selected assay results are summarized in Table 10-4. Drill pad locations were constrained to two exploration trails built decades previously on the steep southeast-facing slope, so were less than ideal for evaluating mineralization exposed in trenches completed during this program. These holes represent the recorded drilling of the tungsten zone.
Drilling and surface exploration determined that tungsten mineralization (WO3) occurs in three settings: (1) in chlorite, epidote and/or silica-altered sedimentary rocks structurally beneath the thrust fault that forms the footwall of the contact zone, (2) in crosscutting quartz veins and stockwork zones along with elevated levels of lead, sliver and bismuth, and (3) in discrete quartz veins with high concentrations of silver and tellurium. Typically, WO3 occurs in the absence of gold, silver and tellurium.
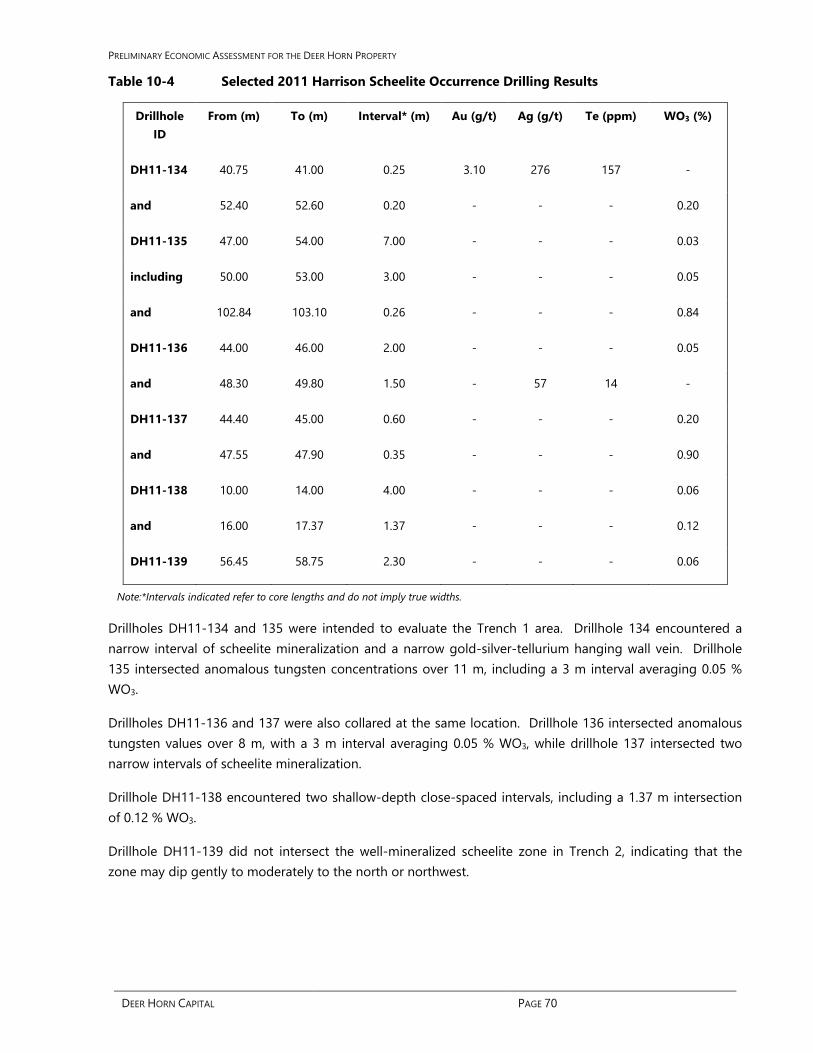
PRELIMINARY ECONOMIC ASSESSMENT FOR THE DEER HORN PROPERTY
DEER HORN CAPITAL PAGE 70
Table 10-4 Selected 2011 Harrison Scheelite Occurrence Drilling Results
Drillhole ID
From (m) To (m) Interval* (m) Au (g/t) Ag (g/t) Te (ppm) WO3 (%)
DH11-134 40.75 41.00 0.25 3.10 276 157 -
and 52.40 52.60 0.20 - - - 0.20
DH11-135 47.00 54.00 7.00 - - - 0.03
including 50.00 53.00 3.00 - - - 0.05
and 102.84 103.10 0.26 - - - 0.84
DH11-136 44.00 46.00 2.00 - - - 0.05
and 48.30 49.80 1.50 - 57 14 -
DH11-137 44.40 45.00 0.60 - - - 0.20
and 47.55 47.90 0.35 - - - 0.90
DH11-138 10.00 14.00 4.00 - - - 0.06
and 16.00 17.37 1.37 - - - 0.12
DH11-139 56.45 58.75 2.30 - - - 0.06
Note:*Intervals indicated refer to core lengths and do not imply true widths.
Drillholes DH11-134 and 135 were intended to evaluate the Trench 1 area. Drillhole 134 encountered a narrow interval of scheelite mineralization and a narrow gold-silver-tellurium hanging wall vein. Drillhole 135 intersected anomalous tungsten concentrations over 11 m, including a 3 m interval averaging 0.05 % WO3.
Drillholes DH11-136 and 137 were also collared at the same location. Drillhole 136 intersected anomalous tungsten values over 8 m, with a 3 m interval averaging 0.05 % WO3, while drillhole 137 intersected two narrow intervals of scheelite mineralization.
Drillhole DH11-138 encountered two shallow-depth close-spaced intervals, including a 1.37 m intersection of 0.12 % WO3.
Drillhole DH11-139 did not intersect the well-mineralized scheelite zone in Trench 2, indicating that the zone may dip gently to moderately to the north or northwest.

PRELIMINARY ECONOMIC ASSESSMENT FOR THE DEER HORN PROPERTY
DEER HORN CAPITAL PAGE 71
11.0 SAMPLE COLLECTION, PREPARATION, ANALYSES AND SECURITY 11.1 SURFACE CHANNEL AND CHIP SAMPLE COLLECTION
In 2011 and 2012, channel, chip and grab samples were collected by the qualified person, or field staff working under him. In the Deer Horn adit area, sample locations were selected based on the presence of well-exposed vein material, and/or stockwork mineralization.
Channel samples, 5 cm wide, were cut with a gas-powered circular diamond saw to a depth of 4 cm to 5 cm and sample material was removed with a chisel and crack hammer. Where possible the channels were cut perpendicular to the interpreted strike of the vein or zone, starting at the footwall and proceeding in a continuous manner across the vein or zone to its contact with the hangingwall or until limited by a lack of rock exposure.
Chip samples were collected across the trend of the vein or zone sampled. Selected grab samples were collected from mineralized outcrop, sub-outcrop or float.
The four excavated trenches were systematically chip sampled from beginning to end. The chip samples were collected from a continuous channel using rock chisels and crack hammers. Individual samples were typically 2 m in length.
Each sample collected for analysis was described and its location was recorded using hand-held GPS units with an accuracy of 4 m to 8 m. The sample was then placed in a polyethylene bag, given a unique sequential sample number and tag, and sealed with a zap strap. Photographs of each sample location site were also taken. Because of the low number of rock samples collected in 2011, blanks, duplicates, and standards were not inserted into the sample stream, but standard laboratory repeat analysis served to provide quality control.
11.2 DIAMOND DRILL CORE LOGGING AND SAMPLE COLLECTION
Drill core was logged for geological and geotechnical properties at the project’s core logging facility. Each section of core to be sampled was clearly identified, marked with a centre-line and halved using a water-cooled diamond saw. Half of the core from each sample interval was then placed in a polyethylene bag, given a unique sequential sample number and tag, and sealed with a zap strap. A corresponding tag was stapled to the core box for each sample interval. A total of 1,855 core samples (excluding duplicates) were collected, labeled, cut and bagged.
Two-hundred-and-twenty-five (225) quality control samples (26 blanks, 115 standards and 84 duplicates) were inserted into the sample stream at regular intervals following a prescribed sequence. All of the samples were recorded on shipment forms as they were readied for shipment.
11.3 GEOCHEMICAL ANALYSIS AND ASSAYING
Each core or rock sample was individually crushed and pulverized (following Acme’s R200-250 procedure), and the resulting sample pulp was analyzed. Samples were jaw crushed until 80 % passed through a 10-mesh screen. From this material a 250 g riffle split sample was collected and then pulverized in a mild-steel ring-and-puck mill until 85 % passed through a 200-mesh screen. Each resulting sample was analyzed by

PRELIMINARY ECONOMIC ASSESSMENT FOR THE DEER HORN PROPERTY
DEER HORN CAPITAL PAGE 72
one or more of the methods described below. The remaining coarse reject portion of each original sample was collected and remains in storage.
All rock and drill core samples were evaluated for 34 elements, including gold, silver and tellurium, by leaching a 15 g sample split in hot (95°C) aqua regia followed by ICP-MS analysis (method 1DX2). Samples returning more than 1,000 ppb Au and/or more than 50 ppm Ag were re-analyzed utilizing standard Fire Assay methods with a gavimetric finish (method G6Gr) on a 30 g sample. Samples returning more than 1,000 ppm Te were not re-analyzed, however the actual value was provided by the lab for reference only; therefore values beyond 1,000 ppm are regarded to be qualitative. Samples returning more than 100 ppm W were re-analyzed by phosphoric acid leach followed by ICP-ES analysis (method 7KP).
Certified reference blanks, gold and silver standards, tungsten standards and field duplicates were systematically inserted into the sample stream as part of quality control/quality assurance program (see Section 12.3). No certified tellurium standards were used. Assay certificates from the 2011 exploration program can be made available upon request to DHC and are provided in an assessment report filed with the MEM. For a listing of assay certificates for the 1989, 1990 and 2009 exploration campaigns, the reader is referred to exploration assessment reports that are available online at the MEM at:
www.em.gov.bc.ca/cf/aris/search/search.cfm
11.4 SECURITY
All 2011-2012 rock and 2011 core samples were packed into sealed and tamper-proof 5-gallon pails and shipped in batches via a commercial carrier, or were delivered directly by staff working under the direction of the qualified person, to Acme Analytical Labs in Vancouver, BC.
Drill core from the 2009 and 2011 drill programs is stored on the property at the camp location in cross-stacked fashion. Because the property is remote and not accessible by road, there is little risk to the security of the core.
PRELIMINARY ECONOMIC ASSESSMENT FOR THE DEER HORN PROPERTY
DEER HORN CAPITAL PAGE 73
12.0 DATA VERIFICATION 12.1 HISTORICAL DATA
Data from the historical exploration programs completed on the Deer Horn property was supplied by Guardsmen Resources Inc and/or collected by Bob Lane, P.Geo., on behalf of DHC, and was in the form of hard copy reports, spreadsheets and corresponding laboratory certificates. A review of laboratory certificates from the 2000 to 2007 exploration program indicates that the results reported are consistent with the results presented in reports for those years of work. Laboratory certificates from earlier programs were not available and have not been verified. The historical fieldwork was managed and/or performed by industry professionals and is regarded by the qualified person to be valid. No further verification of the historical data has been completed.
12.2 2009 DATA
Data from the 2009 surface sampling and diamond drilling program, including all laboratory certificates, was reviewed and verified (Lane and Giroux, 2010). The data was subsequently used, with the historical data, to construct a geologic model and calculate an initial resource estimate for the deposit (Lane and Giroux, 2010).
12.3 2011 AND 2012 DATA
Data from the 2011 surface sampling and diamond drilling program consisted of results for 1,855 core samples, 94 channel chip samples from trenches, and 84 channel cuts, chip samples and grab samples from outcrops. 2011 control samples consisting of one or more of either a blank, one of five different ‘reference’ standards, or a duplicate sample were inserted into each shipment of drill core that was sent to the lab. A total of 26 blanks, 115 standards, and 84 duplicate samples were inserted into the sample stream at regular intervals following a prescribed sequence; a review of this analytical data is discussed below in Section 12.3.1. Control samples did not get submitted with the surface samples; however, the lab conducted and reported on its own internal repeats of surface samples as well as of the drill core.
Data from the 2012 surface sampling program consisted of 83 rock and 6 silt samples. The geochemical standards and blanks used in the 2012 quality control program were supplied by CDN Resources Laboratories Ltd of Delta, BC. The accepted analytical values for the two standards used are listed below with a +/- error which is equal to two interlab standard deviations. High-Grade Gold Standard (CDN-GS-22): 22.94 +/- 1.12 g/t Au Bulk Tonnage Gold-Copper Standard (CDN-CGS-18): 0.297 +/- 0.040 g/t Au & 0.319 +/- 0.016 % Cu The 4 assay results of the standard CDN-GS-22 fall within two interlab standard deviations of the recommended value. Three out of four analyses of the standard CDN-CGS-18 (for copper and gold) fall within two interlab standard deviations of the accepted values. Overall, the analytical data for the standards used indicate that the lab showed an acceptable analytical quality and absence of bias and are not discussed further
All of the assay certificates for 2011 and 2012 samples were reviewed and verified by the qualified person.

PRELIMINARY ECONOMIC ASSESSMENT FOR THE DEER HORN PROPERTY
DEER HORN CAPITAL PAGE 74
12.3.1 GEOCHEMICAL STANDARDS, BLANKS AND DUPLICATE SAMPLES
The geochemical standards and blanks used in the 2011 quality control program were supplied by CDN Resources Laboratories Ltd. of Delta, BC. The accepted analytical values for the six different standards and blanks used are listed below with a +/- error which is equal to two interlab standard deviations.
Low-Grade Gold-Silver Standard (CDN-HC-2): 1.67 +/- 0.12 g/t Au & 15.3 +/- 1.4 g/t Ag
Low-Grade Gold, Medium-Grade Silver Standard (CDN-ME-4): 2.61 +/- 0.30 g/t Au & 402 +/- 25 g/t Ag
Medium-Grade Gold Standard (CDN-GS-5G): 4.77 +/- 0.40 g/t Au & 101.8 +/- 7.0 g/t Ag
High-Grade Gold Standard (CDN-GS-15B): 15.98 +/- 0.71 g/t Au
Tungsten Standard (CDN-W-5): 0.391 +/- 0.040 % W
Blank (CDN-BL-9): < 0.01 g/t Au
Results of 26 analyses for the standard CDN-HC-2 produced an arithmetic mean grade of 1.82 g/t Au and 16.1 g/t Ag. Note that sample 1360582 assayed 16.1 g/t Au, a result that is consistent with standard CDN-GS-15B, and therefore was not included in the determination of the arithmetic mean for the analysis of standard CDN-HC-2; the sample may have been mislabeled on the sample submittal forms. Only 65 % of the results (17/26) for gold and for silver fall within two interlab standard deviations of the accepted value.
Results of 26 analyses for the standard CDN-ME-4 produced an arithmetic mean grade of 2.53 g/t Au and 396 g/t Ag. Note that sample 1360600 assayed 1.7 g/t Au and < 50 g/t Ag, a result that is consistent with standard CDN HC-2 and was not included in the determination of the arithmetic mean for the analysis of standard CDN-ME-4; the sample may have been mislabeled on the sample submittal forms. Almost all of the results (22/26 or 85 %) for gold fall within two interlab standard deviations of the accepted value and all but one of the results (25/26 or 96 %) for silver fall within two interlab standard deviations of the accepted value.
Results of eight analyses of the standard CDN-GS-5G produced an arithmetic mean grade of 4.81 g/t Au and 99.7 g/t Ag. All (100 %) of the results for gold fall within two interlab standard deviations of the accepted value and six out of eight results (or 75 %) for silver fall within two interlab standard deviations of the accepted value.
Results of 46 assays of the standard CDN-GS-15B produced an arithmetic mean grade of 15.93 g/t Au, close to the recommended value of 15.98 g/t Au. Most of the assay results (42/46 or 91 %) for gold fall within two interlab standard deviations of the recommended value.
Results of four analyses of the standard CDN-W-5 fell within the range of two interlab standard deviations.
A total of 26 blanks (CDN-BL-9) were analyzed. All but one of the blanks produced acceptable values of below < 0.01 g/t Au (or < 10 ppb). The single high value of 17.9 ppb Au (sample 1360722) and followed a core sample from DH11-113 that assayed 34.5 g/t Au (sample 1360721). It is possible that contamination from the earlier high-grade sample in the run affected the result for that particular blank.
The analytical data for gold, silver and tungsten standards and for blanks shows acceptable analytical quality and absence of bias.

PRELIMINARY ECONOMIC ASSESSMENT FOR THE DEER HORN PROPERTY
DEER HORN CAPITAL PAGE 75
Rigorous quality control and quality assurance procedures were not applied specifically for tellurium. The lack of a certified tellurium standard required that duplicate analyses (discussed below) and laboratory repeat analyses (from different labs in 2009 and 2011) be depended upon. A review of laboratory repeat analyses showed there to be generally good reproducibility. The duplicate samples for the 2011 drill program were not true duplicates because the initial sample collected was of half-core, while the ‘duplicate’ sample collected was of quarter-core (half of the remaining core after the initial half-core sample was taken). However, when the two populations of analytical results (gold, silver and tellurium by ICP-MS) were compared there is still a reasonable level of reproducibility. Only 7 of 87 results for the ‘duplicate’ samples are regarded to be significantly higher or lower than that of the initial samples. The poor reproducibility for these ‘duplicate’ samples versus their corresponding initial samples is at least in part due to the fact that the initial sample was of half-core and the ‘duplicate’ sample was of quarter-core. Perhaps the reason for the high level of acceptable reproducibility is that many of the duplicate samples were from parts of deposit that are weakly to non-mineralized (containing very low concentrations of gold and silver) and therefore are unaffected by poor sampling techniques.
A revised protocol for the selection and preparation of duplicate samples is required in order to provide quality control data that provides more adequate information with respect to field and laboratory operating procedures. In addition, it is recommended that two or more certified tellurium reference standards be developed in order to provide an increased level of quality control and quality assurance for data generated by future exploration programs.
The author is of the opinion that the quality control and quality assurance protocols and results are adequate for mineral resource estimation.

PRELIMINARY ECONOMIC ASSESSMENT FOR THE DEER HORN PROPERTY
DEER HORN CAPITAL PAGE 76
13.0 MINERAL PROCESSING AND METALLURGICAL TESTING Preliminary metallurgical test work has been carried out by Coastech Research Inc. of North Vancouver, BC in 1989 on two 50 kg samples collected from the Deer Horn adit. Sample head grade assays are shown in Table 13-1
Table 13-1 Metallurgical Sample Head Grades
Item Unit Sample 1 Sample 2
Gold g/t 5.87 3.86
Silver g/t 156 211
Copper % 0.1 0.1
Lead % 0.1 0.43
Zinc % 0.41 0.58
Sulphur % 1.54 1.89
Tellurium g/t 340 310
One sample was collected from a segment of the Main vein and assayed 5.87 g/t Au and 155.67 g/t Ag. The other sample was collected from the Contact zone and assayed 3.86 g/t Au and 211.22 g/t Ag. Both samples contained small quantities of copper, lead, zinc, and tellurium, and the grades are representative of the range of mill feed grades in the PEA mine plan.
Three gravity tests yielded a maximum of 6.4 % gold recovery into a pan concentrate, indicating that the orebody is not amenable to gravity concentration.
Flotation tests resulted in recoveries of more than 95% of gold, silver, lead, copper and zinc at a grind size of 75 micron. These recoveries were achieved by producing a separate copper/lead concentrate and a zinc concentrates with combined concentrate mass pull of approximately 7%.

PRELIMINARY ECONOMIC ASSESSMENT FOR THE DEER HORN PROPERTY
DEER HORN CAPITAL PAGE 77
The metallurgical test work on Deer Horn ore indicates that gold and silver mineralization is generally associated with copper and lead minerals. The test work indicates that zinc minerals are relatively barren of gold and silver but could be recovered into a saleable zinc product.
The metallurgical significance of elevated tellurium content is not known, but it appears that tellurium will not adversely affect the recovery of gold or silver (Hawthorn, 2009). Typically, nothing is done specifically to recover tellurium; rather the metal is recovered secondarily to the recovery of base and precious metals. Gold telluride minerals are described as being inherently floatable and therefore behave similarly to many sulphide minerals in flotation circuits (Zhang et al., 2010).
Recovery projections for the PEA are based on tailings grades achieved in the 1989 metallurgical test work. Tellurium recovery is assumed to be similar to gold recovery.
Concentrate deleterious elements are low and are unlikely to attract penalties.

PRELIMINARY ECONOMIC ASSESSMENT FOR THE DEER HORN PROPERTY
DEER HORN CAPITAL PAGE 78
14.0 MINERAL RESOURCE ESTIMATES Giroux Consultants was contracted by DHC to complete a resource estimate update for the Au-Ag-Te system on the Deer Horn property. Issued in May 2018, this updates a previous resource estimate completed in 2012 (Lane and Giroux, 2012). The resources were estimated by Gary Giroux, P.Eng., MASc. who is a qualified person and independent of the both the issuer and the title holder, based on the tests outlined in NI43-101. Mr. Giroux has not visited the property.
14.1 DATA ANALYSIS
Giroux Consultants Ltd. was contracted to produce a resource update for gold, silver and tellurium on the Deer Horn vein deposit. The supplied data base consisted of 196 diamond drillholes, completed from 1944 to 2011, and 42 surface samples, summarized in Table 14-1. A list of drillholes and surface samples can be found in Lane (2010) and Lane (2012).
With the drill results coming from three different drilling time periods it was first necessary to compare the results to validate the data base. The gold assays from vein material during each time period were plotted on a lognormal cumulative frequency plot to determine if any bias existed between the four drill campaigns. The results are shown below in Figure 14-1.
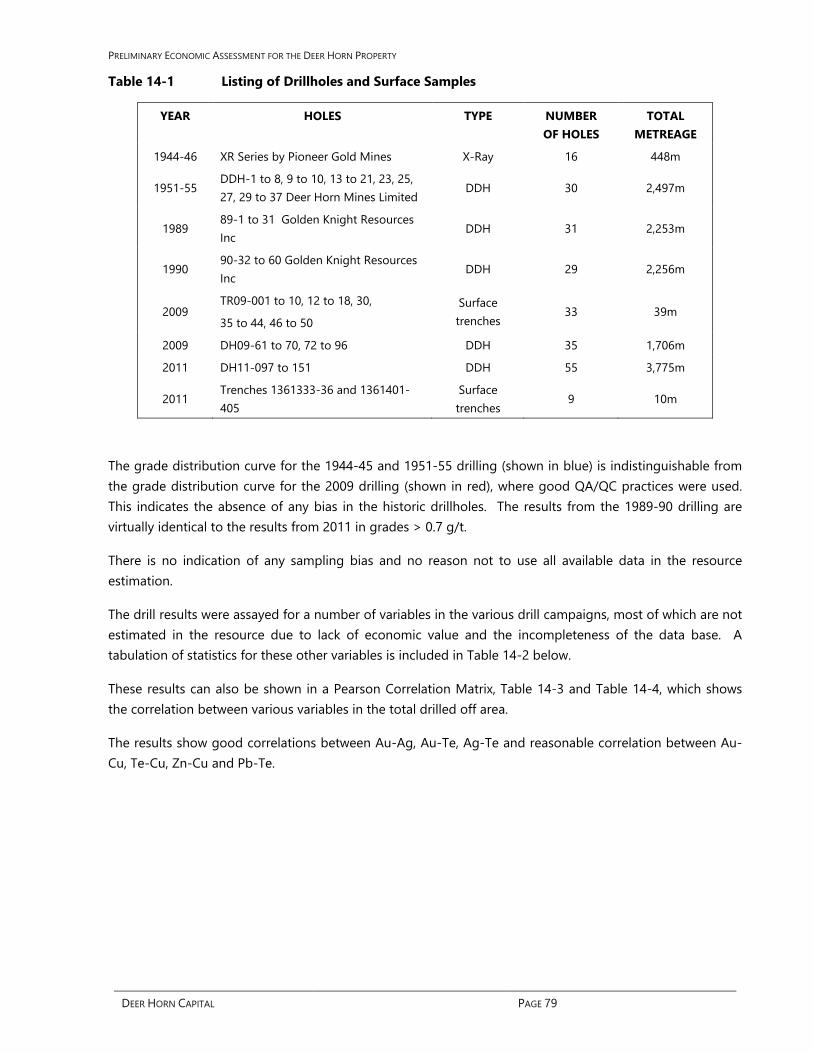
PRELIMINARY ECONOMIC ASSESSMENT FOR THE DEER HORN PROPERTY
DEER HORN CAPITAL PAGE 79
Table 14-1 Listing of Drillholes and Surface Samples
YEAR HOLES TYPE NUMBER OF HOLES
TOTAL METREAGE
1944-46 XR Series by Pioneer Gold Mines X-Ray 16 448m
1951-55 DDH-1 to 8, 9 to 10, 13 to 21, 23, 25, 27, 29 to 37 Deer Horn Mines Limited
DDH 30 2,497m
1989 89-1 to 31 Golden Knight Resources Inc
DDH 31 2,253m
1990 90-32 to 60 Golden Knight Resources Inc
DDH 29 2,256m
2009 TR09-001 to 10, 12 to 18, 30,
35 to 44, 46 to 50 Surface trenches
33 39m
2009 DH09-61 to 70, 72 to 96 DDH 35 1,706m
2011 DH11-097 to 151 DDH 55 3,775m
2011 Trenches 1361333-36 and 1361401-405
Surface trenches
9 10m
The grade distribution curve for the 1944-45 and 1951-55 drilling (shown in blue) is indistinguishable from the grade distribution curve for the 2009 drilling (shown in red), where good QA/QC practices were used. This indicates the absence of any bias in the historic drillholes. The results from the 1989-90 drilling are virtually identical to the results from 2011 in grades > 0.7 g/t.
There is no indication of any sampling bias and no reason not to use all available data in the resource estimation.
The drill results were assayed for a number of variables in the various drill campaigns, most of which are not estimated in the resource due to lack of economic value and the incompleteness of the data base. A tabulation of statistics for these other variables is included in Table 14-2 below.
These results can also be shown in a Pearson Correlation Matrix, Table 14-3 and Table 14-4, which shows the correlation between various variables in the total drilled off area.
The results show good correlations between Au-Ag, Au-Te, Ag-Te and reasonable correlation between Au-Cu, Te-Cu, Zn-Cu and Pb-Te.

PRELIMINARY ECONOMIC ASSESSMENT FOR THE DEER HORN PROPERTY
DEER HORN CAPITAL PAGE 80
Figure 14-1 Cumulative frequency plot for gold in Vein Material sorted by drill campaign
Table 14-2 Summary Statistics for all variables in all samples
Au
(g/t)
Ag
(g/t)
Te (ppm)
Cu (ppm)
Pb (ppm)
Zn (ppm)
Mo (ppm)
W
(ppm)
Number 4,958 4,958 2,519 2,153 2,145 2,145 884 605
Mean 1.48 45.57 44.1 680.5 178.3 1,645.7 26.2 34.3
S. D. 7.86 186.1 142.6 2,220.1 802.8 4,377.2 101.9 215.2
Minimum 0.001 0.01 0.1 0.5 0.5 8.0 1.0 1.0
Maximum 369.80 3,353.0 2,471.0 53,212 14,400 60,000 2,400 3,500
Coef. of Variation
5.33 4.00 3.23 3.26 4.50 2.66 3.89 6.28
Note: Te assays are only available from 2009 and later drill results. Te analysis was not completed for holes drilled prior to 2009. For 2009 drill results 656 out of 768 samples were tested for Te. Of the 112 samples not assayed for Te, only 2 were within the vein material. In the 2011 drill program all samples from vein material were analyzed for Te. All trench samples from 2011 were analyzed for Te. Of the total 2,519 Te assays collected, the distribution was evenly spaced throughout the mineralized zones and allowed for Te to be estimated even though there were about half the number of samples as assayed for gold and silver. Samples from older drilling where Te was not analyzed were left blank and not used for Te estimation.
10 -3
10 -2
10 -1
1
10 1
10 2
10 3
AUG
PT
Percent10 -3
10 -2
10 -1
1
101
102
103
0.1
0.5
1.0510203040506070809095
99.0
99.5
99.9
0.1
0.5
1.0
51020304050607080909599.0
99.5
99.9
10 -3
10 -2
10 -1
1
10 1
10 2
10 3
AUG
PT
Percent10 -3
10 -2
10 -1
1
101
102
103
0.1
0.5
1.0510203040506070809095
99.0
99.5
99.9
0.1
0.5
1.0
51020304050607080909599.0
99.5
99.9
10 -3
10 -2
10 -1
1
10 1
10 2
10 3
AUG
PT
Percent10 -3
10 -2
10 -1
1
101
102
103
0.1
0.5
1.0510203040506070809095
99.0
99.5
99.9
0.1
0.5
1.0
51020304050607080909599.0
99.5
99.9
Cumulative Frequency Plot - Au in Veins
10 -3
10 -2
10 -1
1
10 1
10 2
10 3
AUG
PT
Percent10 -3
10 -2
10 -1
1
101
102
103
0.1
0.5
1.0510203040506070809095
99.0
99.5
99.9
0.1
0.5
1.0
51020304050607080909599.0
99.5
99.9
1944-1955 Results1980-1990 Results2009 Results2011 Results

PRELIMINARY ECONOMIC ASSESSMENT FOR THE DEER HORN PROPERTY
DEER HORN CAPITAL PAGE 81
Table 14-3 Pearson Correlation Matrix for all variables in all assays
Au Ag Te Cu Pb Zn Mo W
Au 1.0000
Ag 0.8787 1.0000
Te 0.8165 0.6426 1.0000
Cu 0.4035 0.3595 0.6808 1.0000
Pb 0.2727 0.3041 0.5394 0.3630 1.0000
Zn 0.4009 0.3584 0.6038 0.5978 0.5094 1.0000
Mo 0.1787 0.2228 0.1811 0.1606 0.1119 1.0000
W 0.0948 0.1203 0.0823 0.0257 0.1286 1.0000
Number of pairs used in Pearson Correlation:
Au Ag Te Cu Pb Zn Mo
Au
Ag 4,958
Te 2,519 2,519
Cu 2,153 2,153 656
Pb 2,145 2,145 656 2,145
Zn 2,145 2,145 656 2,140 2,140
Mo 884 884 0 884 884 879
W 605 605 0 605 605 605 0

PRELIMINARY ECONOMIC ASSESSMENT FOR THE DEER HORN PROPERTY
DEER HORN CAPITAL PAGE 82
A similar Correlation Matrix is shown below for only assays within the mineralized veins.
Table 14-4 Pearson Correlation Matrix for all variables in Veins
Au Ag Te Cu Pb Zn Mo W
Au 1.0000
Ag 0.8211 1.0000
Te 0.8656 0.7243 1.0000
Cu 0.4607 0.4193 0.6548 1.0000
Pb 0.3376 0.3666 0.5111 0.3590 1.0000
Zn 0.4595 0.4973 0.5309 0.5712 0.5132 1.0000
Mo 0.3058 0.2756 0.1797 0.2753 0.1285 1.0000
W 0.0695 -0.0074 -0.0928 -0.0454 -0.0130 1.0000
Number of pairs used in Pearson Correlation
Au Ag Te Cu Pb Zn Mo
Au
Ag 1,031
Te 514 514
Cu 516 516 160
Pb 510 510 160 510
Zn 510 510 160 510 510
Mo 216 216 0 216 216 216
W 134 134 0 134 134 134 0
Three dimensional solids, shown in Figure 14.2 and Figure 14.3 , were produced from cross sections and geologic interpretation outlining a Footwall vein, Main vein and Contact Shear Zone. The Hanging Wall vein interpreted for the previous NI43-101 Technical Report (Lane and Giroux, 2010) was included within the Contact Zone for this estimation. Drillholes were “passed through” these solids with the point each hole entered and left the solids recorded. Assays were then back tagged with a vein code. Assay intervals not sampled within the vein solids were assigned a value of 0.001 g/t Au and 0.01 g/t Ag. Gold assays reported as 0.000 g/t were set to 0.001 g/t. Silver assays reported as 0.00 g/t were set to 0.01 g/t.
The assay statistics for each zone are tabulated in Table 14-5.
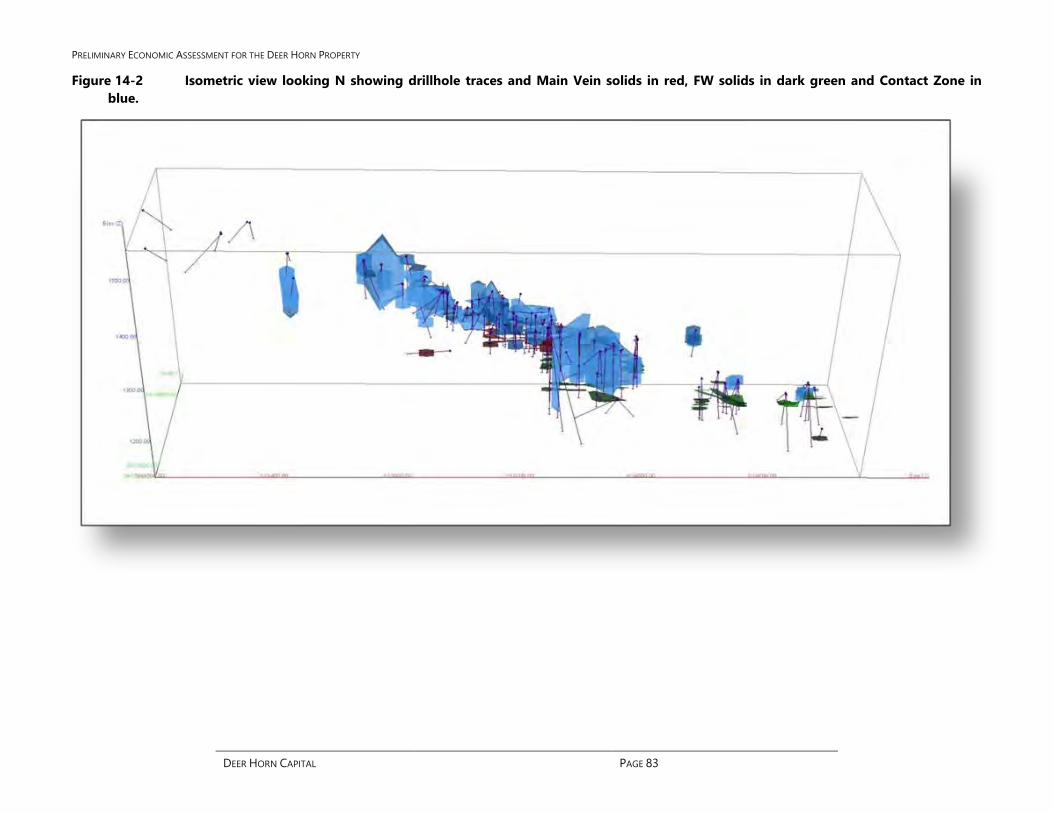
PRELIMINARY ECONOMIC ASSESSMENT FOR THE DEER HORN PROPERTY
DEER HORN CAPITAL PAGE 83
Figure 14-2 Isometric view looking N showing drillhole traces and Main Vein solids in red, FW solids in dark green and Contact Zone in blue.

PRELIMINARY ECONOMIC ASSESSMENT FOR THE DEER HORN PROPERTY
DEER HORN CAPITAL PAGE 84
Figure 14-3 Isometric view looking S showing drillhole traces and Main Vein solids in red, FW solids in dark green and Contact Zone in blue.

PRELIMINARY ECONOMIC ASSESSMENT FOR THE DEER HORN PROPERTY
DEER HORN CAPITAL PAGE 85
Table 14-5 Assay statistics for gold, silver and tellurium for mineralized zones.
FW VEIN MAIN VEIN CONTACT ZONE
Au
(g/t)
Ag
(g/t)
Te
(ppm)
Au
(g/t)
Ag
(g/t)
Te
(ppm)
Au
(g/t)
Ag
(g/t)
Te
(ppm)
Number of Assays 194 194 87 215 215 129 622 622 298
Mean grade 6.69 129.8 179.0 6.46 217.2 188.7 6.09 197.2 170.6
Standard Deviation 14.93 299.1 351.7 9.01 292.2 249.6 18.35 392.5 239.6
Minimum Value 0.001 0.01 0.2 0.001 0.01 1.0 0.001 0.01 0.3
Maximum Value 101.00 1,963.9 2,471 51.00 1,632.0 1,188 369.8 3,353.0 1,421
Coefficient of Variation
2.23 2.31 1.97 1.39 1.35 1.32 3.01 1.99 1.40
Table 14-6 Assay statistics for coper, lead and zinc for mineralized zones
FW VEIN MAIN VEIN CONTACT ZONE
Cu
(%)
Pb
(%)
Zn
(%)
Cu
(%)
Pb
(%)
Zn
(%)
Cu
(%)
Pb
(%)
Zn
(%)
Number of Assays 97 97 87 98 96 96 321 317 317
Mean grade 0.08 0.004 0.11 0.23 0.11 0.60 0.19 0.04 0.44
Standard Deviation 0.14 0.006 0.21 0.59 0.24 0.81 0.38 0.12 0.75
Minimum Value 0.002 0.001 0.001 0.001 0.001 0.005 0.001 0.001 0.005
Maximum Value 1.04 0.03 1.47 5.32 1.44 5.04 3.81 1.08 6.00
Coefficient of Variation
1.61 1.44 1.92 2.51 2.23 1.35 1.96 3.13 1.69

PRELIMINARY ECONOMIC ASSESSMENT FOR THE DEER HORN PROPERTY
DEER HORN CAPITAL PAGE 86
The individual gold, silver and tellurium assays were evaluated for each domain. All elements showed skewed distributions and were converted to lognormal cumulative frequency plots. The lognormal cumulative frequency plot for Au in the Contact zone is shown as

PRELIMINARY ECONOMIC ASSESSMENT FOR THE DEER HORN PROPERTY
DEER HORN CAPITAL PAGE 87
Figure 14-4. A total of seven overlapping lognormal populations are partitioned out. The overlapping gold populations are summarized below in Table 14-7. Populations 6 & 7 represent internal waste. Populations 5 (49.6 % of the data) might represent the background mineralization throughout the Contact zone contained in quartz-sericite alteration zone and averaging 1.0 g/t Au. Population 4 representing 32.8 % of the data could be quartz-stringer stockwork zone averaging 6.4 g/t Au. Populations 3 to 1 representing a combined 5.8 % of the data could represent narrow high grade veins that cross cut through the broader Contact zone.
Table 14-7 Contact Zone Au Populations
The Contact, Main and FW veins were evaluated using lognormal cumulative frequency plots,
Population Mean Au (g/t) Percentage of Total Data Set
Number of Assays
1 378.50 0.33 % 2
2 95.70 0.35 % 2
3 35.72 5.11 % 32
4 6.47 32.81 % 204
5 1.05 49.63 % 309
6 0.19 5.49 % 34
7 0.01 6.28 % 39

PRELIMINARY ECONOMIC ASSESSMENT FOR THE DEER HORN PROPERTY
DEER HORN CAPITAL PAGE 88
Figure 14-4, and capping levels for Au, Ag, and Te were established for each vein as shown in Table 14-8 below.
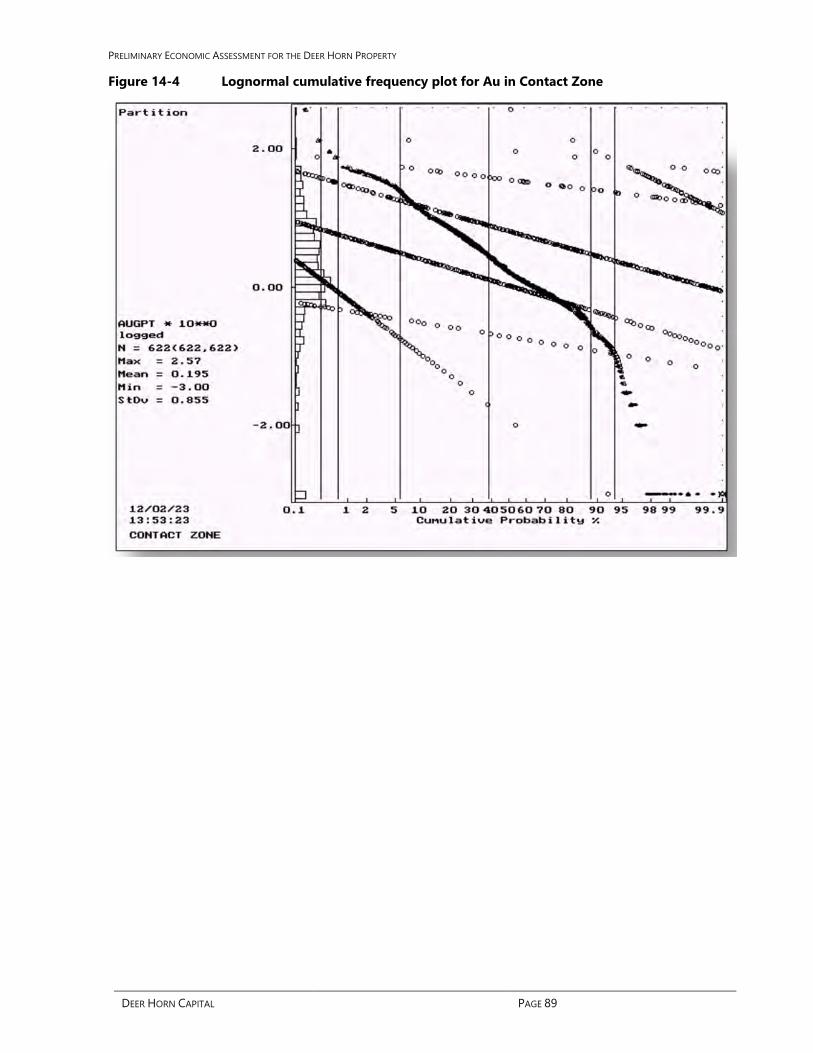
PRELIMINARY ECONOMIC ASSESSMENT FOR THE DEER HORN PROPERTY
DEER HORN CAPITAL PAGE 89
Figure 14-4 Lognormal cumulative frequency plot for Au in Contact Zone
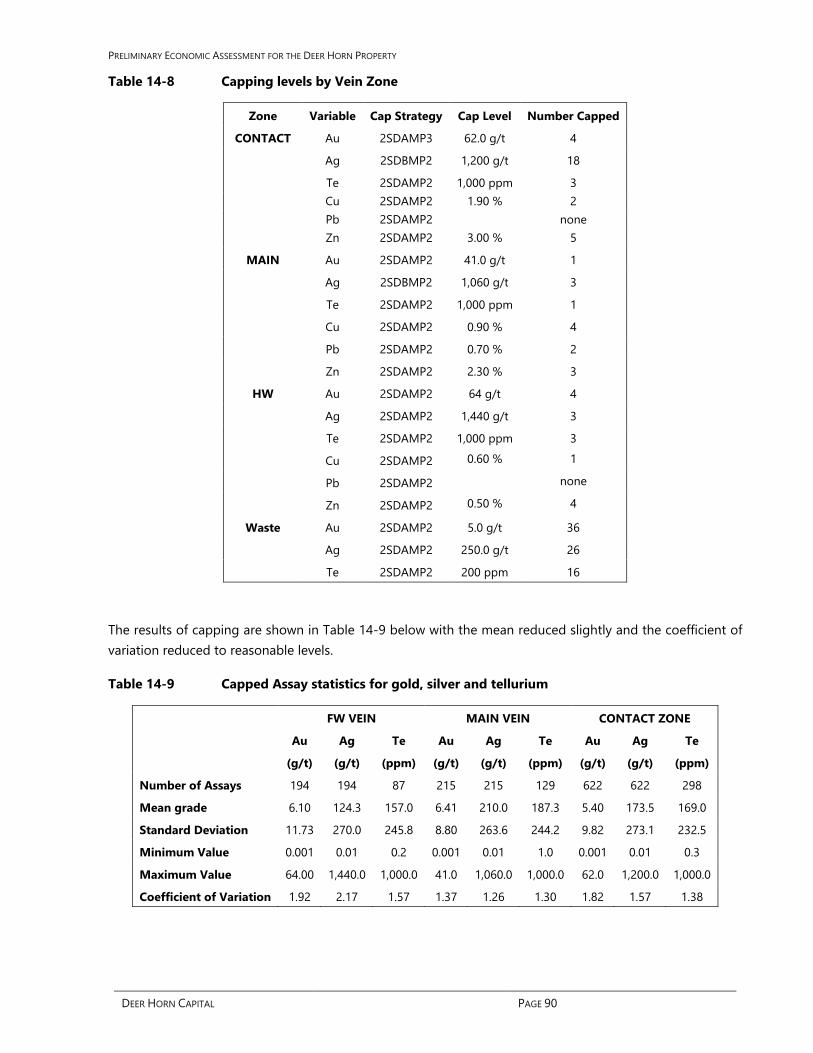
PRELIMINARY ECONOMIC ASSESSMENT FOR THE DEER HORN PROPERTY
DEER HORN CAPITAL PAGE 90
Table 14-8 Capping levels by Vein Zone
Zone Variable Cap Strategy Cap Level Number Capped
CONTACT Au 2SDAMP3 62.0 g/t 4
Ag 2SDBMP2 1,200 g/t 18
Te 2SDAMP2 1,000 ppm 3 Cu 2SDAMP2 1.90 % 2 Pb 2SDAMP2 none Zn 2SDAMP2 3.00 % 5
MAIN Au 2SDAMP2 41.0 g/t 1
Ag 2SDBMP2 1,060 g/t 3
Te 2SDAMP2 1,000 ppm 1
Cu 2SDAMP2 0.90 % 4
Pb 2SDAMP2 0.70 % 2
Zn 2SDAMP2 2.30 % 3
HW Au 2SDAMP2 64 g/t 4
Ag 2SDAMP2 1,440 g/t 3
Te 2SDAMP2 1,000 ppm 3
Cu 2SDAMP2 0.60 % 1
Pb 2SDAMP2 none
Zn 2SDAMP2 0.50 % 4
Waste Au 2SDAMP2 5.0 g/t 36
Ag 2SDAMP2 250.0 g/t 26
Te 2SDAMP2 200 ppm 16
The results of capping are shown in Table 14-9 below with the mean reduced slightly and the coefficient of variation reduced to reasonable levels.
Table 14-9 Capped Assay statistics for gold, silver and tellurium
FW VEIN MAIN VEIN CONTACT ZONE
Au
(g/t)
Ag
(g/t)
Te
(ppm)
Au
(g/t)
Ag
(g/t)
Te
(ppm)
Au
(g/t)
Ag
(g/t)
Te
(ppm)
Number of Assays 194 194 87 215 215 129 622 622 298
Mean grade 6.10 124.3 157.0 6.41 210.0 187.3 5.40 173.5 169.0
Standard Deviation 11.73 270.0 245.8 8.80 263.6 244.2 9.82 273.1 232.5
Minimum Value 0.001 0.01 0.2 0.001 0.01 1.0 0.001 0.01 0.3
Maximum Value 64.00 1,440.0 1,000.0 41.0 1,060.0 1,000.0 62.0 1,200.0 1,000.0
Coefficient of Variation 1.92 2.17 1.57 1.37 1.26 1.30 1.82 1.57 1.38

PRELIMINARY ECONOMIC ASSESSMENT FOR THE DEER HORN PROPERTY
DEER HORN CAPITAL PAGE 91
14.2 COMPOSITES
The drillholes were “passed through” the various mineralized 3-dimensional solids, with the point each hole entered and left each solid recorded. Uniform down hole composites, one m in length, were produced that honoured the solid outlines. Small intervals at the solid boundaries were combined with adjoining samples if less than 0.5 m. In this manner a uniform support of 1 ± 0.5 m was produced for each mineralized zone. The statistics for each zone are tabulated in Table 14-10 below.
Table 14-10 Statistics for 1m Composites
FW VEIN MAIN VEIN CONTACT ZONE
Au
(g/t)
Ag
(g/t)
Te
(ppm)
Au
(g/t)
Ag
(g/t)
Te
(ppm)
Au
(g/t)
Ag
(g/t)
Te
(ppm)
Number 222 222 100 252 252 139 686 686 323
Mean grade 4.92 100.67 118.4 5.95 187.3 176.2 4.35 138.52 132.0
Standard Deviation
10.49 248.60 200.9 7.85 232.7 224.0 7.49 214.72 176.1
Minimum Value
0.001 0.01 0.16 0.001 0.01 1.00 0.001 0.01 0.8
Maximum Value
64.00 1,440.0 1,000 41.00 1,060.0 1,000 62.0 1,200.0 1,000
Coef. of Variation
2.13 2.47 1.70 1.32 1.24 1.27 1.72 1.55 1.33
Cu % Pb % Zn % Cu % Pb % Zn % Cu % Pb % Zn %
Number 93 93 93 96 95 95 338 335 335
Mean grade 0.07 0.004 0.09 0.16 0.09 0.52 0.17 0.04 0.38
Standard Deviation
0.10 0.005 0.11 0.19 0.16 0.57 0.26 0.12 0.55
Minimum Value
0.002 0.001 0.002 0.001 0.001 0.005 0.001 0.001 0.005
Maximum Value
0.60 0.023 0.50 0.90 0.70 2.30 1.90 1.08 3.00
Coef. of Variation
1.31 1.24 1.31 1.24 1.71 1.08 1.58 3.04 1.43
For the Contact Zone the composites include a high grade vein system that cross cuts the lower grade stockwork and background mineralized zone. If left alone, however, these higher grade veins would be smoothed into lower grade rock and would undoubtedly overestimate the average grade of the Contact Zone. As a result, for the Contact Zone, an indicator approach is used for the resource estimation.
A lognormal cumulative frequency plot was produced for gold in Contact Zone composites. A total of six overlapping lognormal populations were identified. The top two, with mean grades of 49.70 g/t Au and 27.42 g/t Au, represented a combined 5.54 % of the data and probably represent the high grade structures. The third and fourth populations, with mean grades of 3.67 g/t Au and 1.11 g/t Au respectively, probably

PRELIMINARY ECONOMIC ASSESSMENT FOR THE DEER HORN PROPERTY
DEER HORN CAPITAL PAGE 92
represent the stockwork mineralization. The lower two populations have a mean grade of 0.5 g/t Au representing background and 0.02 g/t Au representing internal waste.
A threshold of 17 g/t Au would separate the upper two populations from the main mineralizing events. An Indicator integer for composites, within the Contact Zone, that were greater than the threshold 17 g/t Au was set to 1 while in all other composites the Indicator was set to 0.
IND = 1 for Au ≥ 17.0 g/t
IND = 0 for Au < 17.0 g/t
Composites with grades less than 17.0 g/t were modeled using semivariograms. The indicators (0’s or 1’s) were modeled separately to determine the continuity of the high grade veins. Due to the high correlation between Au-Ag and Au-Te, the high grade indicator was used for all three variables.
14.3 VARIOGRAPHY
The grade continuity within each of the mineralized zones with sufficient data to model was quantified using pairwise relative semivariograms. The strike and dip of the various veins were measured and used to control the semivariogram orientations. Nested spherical models were fit to Au, Ag, Te, Cu, Pb and Zn in the FW vein, Main Vein and low grade Contact Zone. For the Contact Zone a high grade indicator was also modeled. Finally, all composites outside of the mineralized solids were modeled as waste. The parameters for each model in each zone are tabulated in Table 14-11 below.
14.4 BLOCK MODEL
A block model, with blocks 10 m E-W, 5 m N-S and 5 m high, was superimposed over the various mineralized solids. For each block the percentage below surface topography and the percentage within each of the mineralized solids were recorded. The block model origin is as follows:
Lower Left Corner of Model: 613375 E Column size = 10 m 98 Columns 5913765 N Row size = 5 m 53 Rows Top of Model: 1510 Elevation Level size = 5 m 68 Levels No rotation.

PRELIMINARY ECONOMIC ASSESSMENT FOR THE DEER HORN PROPERTY
DEER HORN CAPITAL PAGE 93
Table 14-11 Summary of Semivariogram Parameters for Au, Ag and Te
Zone Variable Az / Dip C0 C1 C2 Short Range
(m)
Long Range
(m)
FW Au 90 / 0 0.35 0.40 0.60 20 30
0 / -40 0.35 0.40 0.60 29 28
180 / -50 0.35 0.40 0.60 5 40
Ag 90 / 0 0.40 0.40 0.45 5 30
0 / -40 0.40 0.40 0.45 15 50
180 / -50 0.40 0.40 0.45 5 28
Te 90 / 0 0.40 1.2 25
0 / -40 0.40 1.2 25
180 / -50 0.40 1.2 20
Main Au 90 / -20 0.60 0.10 0.50 10 30
0 / -55 0.60 0.10 0.50 8 20
180 / -35 0.60 0.10 0.50 5 10
Ag 90 / -20 0.50 0.25 0.45 10 30
0 / -55 0.50 0.25 0.45 5 28
180 / -35 0.50 0.25 0.45 5 15
Te 90 / -20 0.30 0.50 0.20 10 20
0 / -55 0.30 0.50 0.20 20 30
180 / -35 0.30 0.50 0.20 8 15
Contact
Low Grade
Au Omni Dir. 0.50 0.22 0.10 6 60
Ag Omni Dir. 0.50 0.20 0.13 8 60
Te Omni Dir. 0.50 0.18 0.06 6 60
Contact IND 105/ 0 1.80 0.10 0.10 20 80
15 / 0 1.80 0.10 0.10 15 24
0 / -90 1.80 0.10 0.10 10 25
Waste Au Omni dir. 0.20 0.40 0.30 12 40
Ag Omni dir. 0.15 0.40 0.48 10 40
Te Omni dir. 0.40 0.15 0.25 8 20
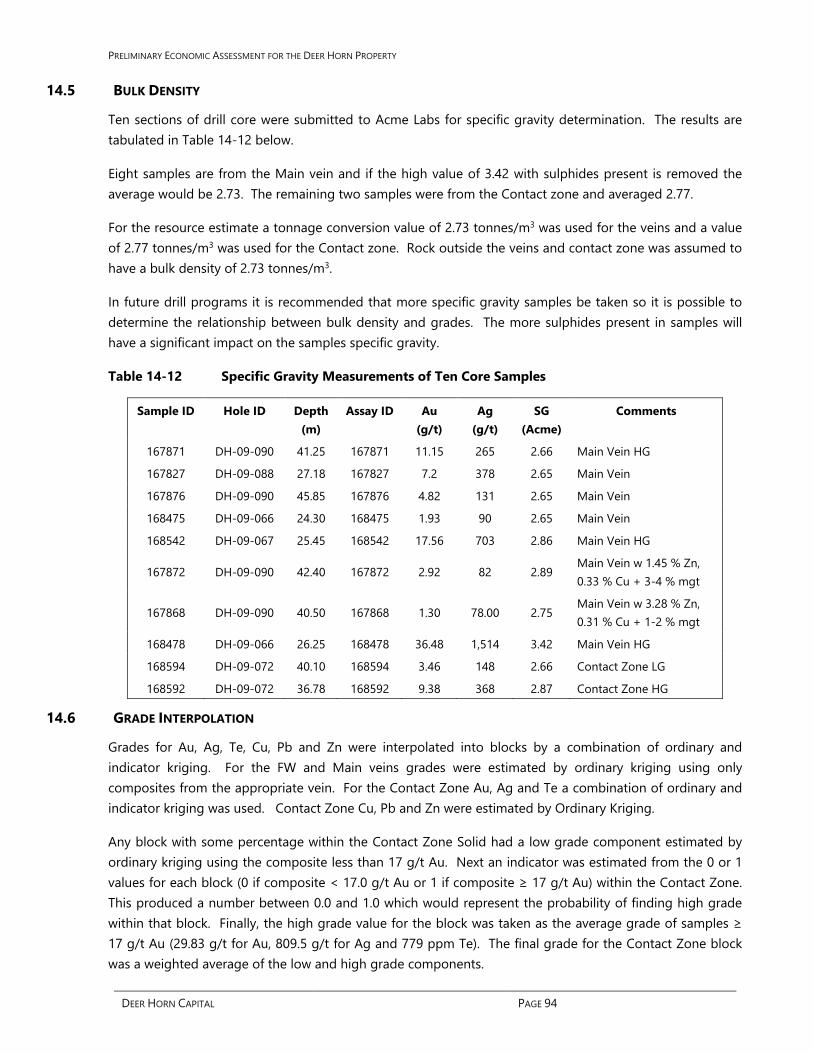
PRELIMINARY ECONOMIC ASSESSMENT FOR THE DEER HORN PROPERTY
DEER HORN CAPITAL PAGE 94
14.5 BULK DENSITY
Ten sections of drill core were submitted to Acme Labs for specific gravity determination. The results are tabulated in Table 14-12 below.
Eight samples are from the Main vein and if the high value of 3.42 with sulphides present is removed the average would be 2.73. The remaining two samples were from the Contact zone and averaged 2.77.
For the resource estimate a tonnage conversion value of 2.73 tonnes/m3 was used for the veins and a value of 2.77 tonnes/m3 was used for the Contact zone. Rock outside the veins and contact zone was assumed to have a bulk density of 2.73 tonnes/m3.
In future drill programs it is recommended that more specific gravity samples be taken so it is possible to determine the relationship between bulk density and grades. The more sulphides present in samples will have a significant impact on the samples specific gravity.
Table 14-12 Specific Gravity Measurements of Ten Core Samples
Sample ID Hole ID Depth (m)
Assay ID Au (g/t)
Ag (g/t)
SG (Acme)
Comments
167871 DH-09-090 41.25 167871 11.15 265 2.66 Main Vein HG
167827 DH-09-088 27.18 167827 7.2 378 2.65 Main Vein
167876 DH-09-090 45.85 167876 4.82 131 2.65 Main Vein
168475 DH-09-066 24.30 168475 1.93 90 2.65 Main Vein
168542 DH-09-067 25.45 168542 17.56 703 2.86 Main Vein HG
167872 DH-09-090 42.40 167872 2.92 82 2.89 Main Vein w 1.45 % Zn, 0.33 % Cu + 3-4 % mgt
167868 DH-09-090 40.50 167868 1.30 78.00 2.75 Main Vein w 3.28 % Zn, 0.31 % Cu + 1-2 % mgt
168478 DH-09-066 26.25 168478 36.48 1,514 3.42 Main Vein HG
168594 DH-09-072 40.10 168594 3.46 148 2.66 Contact Zone LG
168592 DH-09-072 36.78 168592 9.38 368 2.87 Contact Zone HG
14.6 GRADE INTERPOLATION
Grades for Au, Ag, Te, Cu, Pb and Zn were interpolated into blocks by a combination of ordinary and indicator kriging. For the FW and Main veins grades were estimated by ordinary kriging using only composites from the appropriate vein. For the Contact Zone Au, Ag and Te a combination of ordinary and indicator kriging was used. Contact Zone Cu, Pb and Zn were estimated by Ordinary Kriging.
Any block with some percentage within the Contact Zone Solid had a low grade component estimated by ordinary kriging using the composite less than 17 g/t Au. Next an indicator was estimated from the 0 or 1 values for each block (0 if composite < 17.0 g/t Au or 1 if composite ≥ 17 g/t Au) within the Contact Zone. This produced a number between 0.0 and 1.0 which would represent the probability of finding high grade within that block. Finally, the high grade value for the block was taken as the average grade of samples ≥ 17 g/t Au (29.83 g/t for Au, 809.5 g/t for Ag and 779 ppm Te). The final grade for the Contact Zone block was a weighted average of the low and high grade components.

PRELIMINARY ECONOMIC ASSESSMENT FOR THE DEER HORN PROPERTY
DEER HORN CAPITAL PAGE 95
Grade in Contact Zone = ((Indicator * High Grade) + ((1 – Indicator) * Low Grade)
All kriging runs were completed in a series of four passes with the search ellipse for each pass tied to the semivariogram range for the particular domain being estimated. The first pass would search for a minimum of four composites, within a search ellipse, oriented along strike and down dip of the zone, with dimensions equal to ¼ of the semivariogram range. For blocks not estimated in Pass 1 the search ellipse was expanded to ½ the semivariogram range in Pass 2. A third pass using the full range and a fourth pass using twice the range completed the kriging exercise. In all cases a maximum of 3 composites from any one hole was allowed. If more than twelve composites were located within any search ellipse the closest twelve were used. The search parameters for gold in each domain are tabulated in Table 14-13 below.
Table 14-13 Kriging Search Parameters for Gold
Domain Variable Pass Number
Estimated
AZ/DIP Dist.
(m)
AZ/DIP Dist.
(m)
AZ/DIP Dist.
(m)
MAIN AU 1 16 90 / -20 7.5 0 / -55 5.0 180 / -35 2.5
2 146 90 / -20 15.0 0 / -55 10.0 180 / -35 5.0
3 446 90 / -20 30.0 0 / -55 20.0 180 / -35 10.0
4 119 90 / -20 60.0 0 / -55 40.0 180 / -35 20.0
FW AU 1 36 90 / 0 7.5 0 / -40 5.0 180 / -50 10.0
2 317 90 / 0 15.0 0 / -40 10.0 180 / -50 20.0
3 835 90 / 0 30.0 0 / -40 20.0 180 / -50 40.0
4 307 90 / 0 60.0 0 / -40 40.0 180 / -50 80.0
CZ LG AU 1 1,183 Omni Directional 15.0
2 1,662 Omni Directional 30.0
3 393 Omni Directional 60.0
4 100 Omni Directional 120.0
CZ IND AU IND 1 416 105 / 0 20.0 15 / 0 6.00 0 / -90 6.25
2 1,468 105 / 0 40.0 15 / 0 12.00 0 / -90 12.5
3 1,108 105 / 0 80.0 15 / 0 24.00 0 / -90 25.0
4 346 105 / 0 160.0 15 / 0 48.00 0 / -90 50.0
Waste AU 1 1,340 Omni Directional 10.0
2 2,886 Omni Directional 20.0
3 1,124 Omni Directional 40.0
4 74 Omni Directional 80.0

PRELIMINARY ECONOMIC ASSESSMENT FOR THE DEER HORN PROPERTY
DEER HORN CAPITAL PAGE 96
14.7 CLASSIFICATION
Based on the study herein reported, delineated mineralization of the Deer Horn Property is classified as a resource according to the following definition from NI43-101:
“A Mineral Resource is a concentration or occurrence of solid material of economic interest in or on the Earth’s crust in such form, grade or quality and quantity that there are reasonable prospects for eventual economic extraction.
The location, quantity, grade or quality, continuity and other geological characteristics of a Mineral Resource are known, estimated or interpreted from specific geological evidence and knowledge, including sampling.”
The terms Measured, Indicated and Inferred are defined in NI43-101 as follows:
“A Measured Mineral Resource is that part of a Mineral Resource for which quantity, grade or quality, densities, shape, and physical characteristics are estimated with confidence sufficient to allow the application of Modifying Factors to support detailed mine planning and final evaluation of the economic viability of the deposit.
Geological evidence is derived from detailed and reliable exploration, sampling and testing and is sufficient to confirm geological and grade or quality continuity between points of observation.
A Measured Mineral Resource has a higher level of confidence than that applying to either an Indicated Mineral Resource or an Inferred Mineral Resource. It may be converted to a Proven Mineral Reserve or to a Probable Mineral Reserve.”
“An Indicated Mineral Resource is that part of a Mineral Resource for which quantity, grade or quality, densities, shape and physical characteristics are estimated with sufficient confidence to allow the application of Modifying Factors in sufficient detail to support mine planning and evaluation of the economic viability of the deposit.
Geological evidence is derived from adequately detailed and reliable exploration, sampling and testing and is sufficient to assume geological and grade or quality continuity between points of observation.
An Indicated Mineral Resource has a lower level of confidence than that applying to a Measured Mineral Resource and may only be converted to a Probable Mineral Reserve.”
“An Inferred Mineral Resource is that part of a Mineral Resource for which quantity and grade or quality are estimated on the basis of limited geological evidence and sampling. Geological evidence is sufficient to imply but not verify geological and grade or quality continuity.
An Inferred Mineral Resource has a lower level of confidence than that applying to an Indicated Mineral Resource and must not be converted to a Mineral Reserve. It is reasonably expected that the majority of Inferred Mineral Resources could be upgraded to Indicated Mineral Resources with continued exploration.”
Geologic continuity is established by surface and underground mapping and through the logging of drill core. This geologic continuity led to the interpretation of the various veins and contact zone and the construction of geologic 3-dimensional solids to constrain the estimation. Grade continuity can be quantified by semivariograms. At this time the drill density is not sufficient to classify any material as Measured. Blocks within the better drilled western portion of the deposit and estimated for Au in Pass 1 or Pass 2 using search ellipses up to ½ the semivariogram range were classified as Indicated. The remaining blocks were classified as Inferred.

PRELIMINARY ECONOMIC ASSESSMENT FOR THE DEER HORN PROPERTY
DEER HORN CAPITAL PAGE 97
14.8 MINERAL RESOURCE STATEMENT
The Mineral Resources have an effective date of May 15, 2018. The Qualified Person for the estimate is Mr. Gary Giroux, P.Eng., MASc., of Giroux Consultants Ltd.
Mineral Resources comply with 2014 CIM Definitions Standards.
The geologic resources are presented as two Tables (Table 14-14 and

PRELIMINARY ECONOMIC ASSESSMENT FOR THE DEER HORN PROPERTY
DEER HORN CAPITAL PAGE 98
Table 14-15) and identify the resource present within the mineralized solids at various gold cutoff grades. This estimates the tonnes and grade of material if one could mine to the limits of the mineralized solids, in other words, with no external dilution. The 1.0 g/t Au cut-off is highlighted as a possible open pit mining cut-off for this deposit. This cut-off grade includes the following considerations: Gold Price of US$1,300/oz., Silver Price of US$17/oz., Tellerium price of US$70/kg, exchange rate of 0.8 US$:CDN$, process costs of $29 per tonne milled, process recovery of 90 %, mining costs of $4/tonne mined.
Table 14-14 Indicated Resource within Mineralized Solids
Au Cut-off
(g/t)
Tonnes> Cut-off
(tonnes)
Grades > Cut-off Contained Metal
Au (g/t)
Ag (g/t)
Te (ppm)
Ounces Au Ounces Ag kg Te
0.50 429,000 4.97 153.42 158 68,000 2,120,000 68,000
1.00 414,000 5.12 157.50 160 68,000 2,100,000 66,000
1.50 386,000 5.39 164.90 166 67,000 2,050,000 64,000
2.00 343,000 5.84 178.24 177 64,000 1,970,000 61,000
2.50 307,000 6.27 190.76 188 62,000 1,880,000 58,000
3.00 262,000 6.87 208.00 204 58,000 1,750,000 53,000
3.50 233,000 7.32 220.48 216 55,000 1,650,000 50,000
4.00 206,000 7.78 233.02 228 52,000 1,540,000 47,000
4.50 182,000 8.25 244.75 240 48,000 1,430,000 44,000
5.00 165,000 8.63 253.50 249 46,000 1,340,000 41,000
Note: The Tellurium, Copper, Lead and Zinc resource was estimated with about ½ the data used to estimate Au and Ag. Since these variables represent a minor component to the projects economics it is classified as Indicated in this table. The reader should be aware that the confidence in the Te estimate is lower than the confidence on Au and Ag.
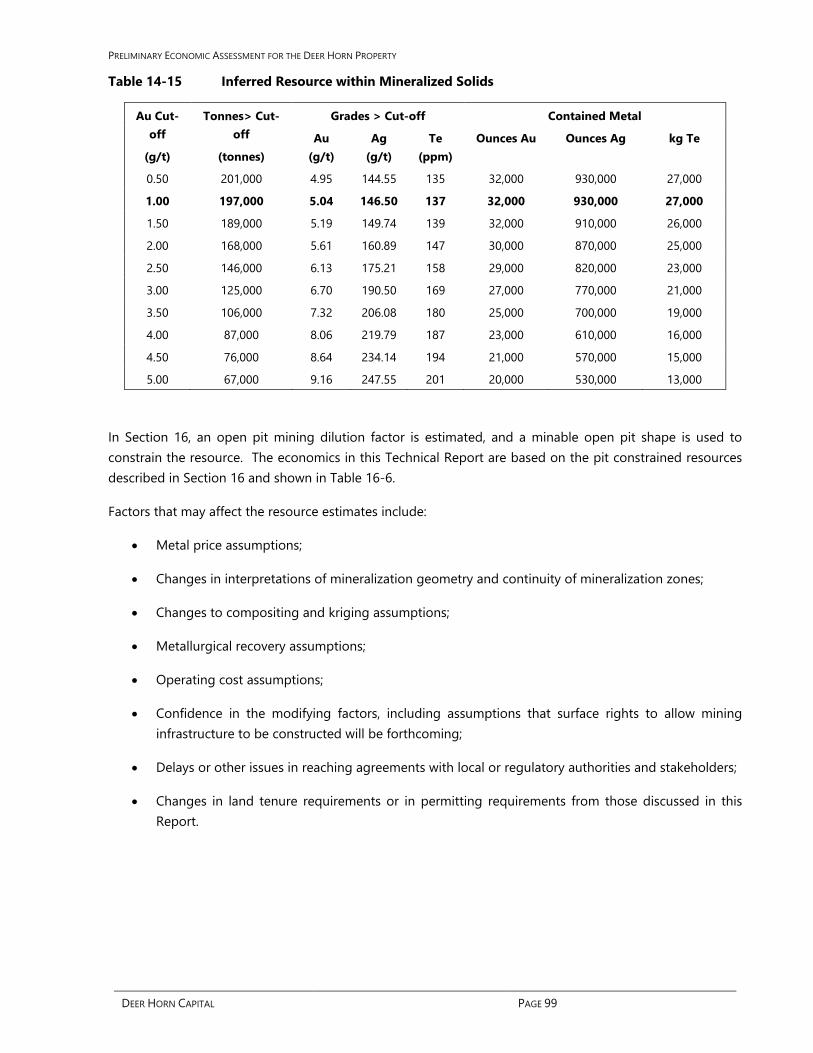
PRELIMINARY ECONOMIC ASSESSMENT FOR THE DEER HORN PROPERTY
DEER HORN CAPITAL PAGE 99
Table 14-15 Inferred Resource within Mineralized Solids
Au Cut-off
(g/t)
Tonnes> Cut-off
(tonnes)
Grades > Cut-off Contained Metal
Au (g/t)
Ag (g/t)
Te (ppm)
Ounces Au Ounces Ag kg Te
0.50 201,000 4.95 144.55 135 32,000 930,000 27,000
1.00 197,000 5.04 146.50 137 32,000 930,000 27,000
1.50 189,000 5.19 149.74 139 32,000 910,000 26,000
2.00 168,000 5.61 160.89 147 30,000 870,000 25,000
2.50 146,000 6.13 175.21 158 29,000 820,000 23,000
3.00 125,000 6.70 190.50 169 27,000 770,000 21,000
3.50 106,000 7.32 206.08 180 25,000 700,000 19,000
4.00 87,000 8.06 219.79 187 23,000 610,000 16,000
4.50 76,000 8.64 234.14 194 21,000 570,000 15,000
5.00 67,000 9.16 247.55 201 20,000 530,000 13,000
In Section 16, an open pit mining dilution factor is estimated, and a minable open pit shape is used to constrain the resource. The economics in this Technical Report are based on the pit constrained resources described in Section 16 and shown in Table 16-6.
Factors that may affect the resource estimates include:
• Metal price assumptions;
• Changes in interpretations of mineralization geometry and continuity of mineralization zones;
• Changes to compositing and kriging assumptions;
• Metallurgical recovery assumptions;
• Operating cost assumptions;
• Confidence in the modifying factors, including assumptions that surface rights to allow mining infrastructure to be constructed will be forthcoming;
• Delays or other issues in reaching agreements with local or regulatory authorities and stakeholders;
• Changes in land tenure requirements or in permitting requirements from those discussed in this Report.

PRELIMINARY ECONOMIC ASSESSMENT FOR THE DEER HORN PROPERTY
DEER HORN CAPITAL PAGE 100
15.0 MINERAL RESERVE ESTIMATES This PEA Study includes Inferred material reported as a pit resource in Section 16.0 and does not include any reserves.
This section is not relevant to the Technical Report.

PRELIMINARY ECONOMIC ASSESSMENT FOR THE DEER HORN PROPERTY
DEER HORN CAPITAL PAGE 101
16.0 MINING METHODS A PEA production schedule, based on a 74,000 tonne per year mill feed rate, has been developed for the Deer Horn Project based on an open pit mine plan. Mining will be carried out by a contract miner as a summer only seasonal operation to avoid potential winter operating hazards.
The pit phases are engineered based on the results of an economic pit limit analysis.
16.1 INTRODUCTION
The mine planning work for this study is based on the 3D Block Model (3DBM) created by Giroux Consultants Ltd.
Mine planning for the Deer Horn mineral property is based on work done with MineSight®, a suite of software proven in the industry. The work includes adding engineering items to the resource model, pit optimization (MineSight Economic Planner [MS-EP]), detailed pit design, and optimized production scheduling (MineSight Strategic Planner [MS-SP]).
In addition to the geological information used for the block model, other data used for the mine planning included the base economic parameters, mining cost data derived from supplier estimates and data from other projects in the local area, estimated pit slope angles (“PSAs”), projected project metallurgical recoveries, plant costs, and throughput rates.
16.2 MINING DATUM
The Project design work is based on NAD83 coordinates. Historical drillhole information is based on various surveys with different sets of control that have been converted to NAD83 and a topography surface has been produced from a 2009 LiDAR survey.
16.3 PRODUCTION RATE CONSIDERATION
Several factors are considered when establishing an appropriate mining and processing rate. Key factors include:
• Resource Size: Typically, a planned mine life is set at 12.5 to 20 years; beyond this, time-value discounting shows an insignificant contribution to the NPV of the project at discount rates of 8 % or higher.
• Capital Payback: Capital investment typically is targeted at projects with a payback period of 2 to 5 years or shorter.
• Operational Constraints: Power, water, or supplies and services for support of operations can limit production.
• Site Delivery Constraints: Physical size and weight of equipment and shipping limits can determine the maximum size of units that can be delivered to site.
• Project Financial Performance: o Generally, economies of scale can be realized at higher production rates and lead to reduced unit
operating costs. These are tempered to the above-mentioned physical and operational constraints and flexibility issues.

PRELIMINARY ECONOMIC ASSESSMENT FOR THE DEER HORN PROPERTY
DEER HORN CAPITAL PAGE 102
o Generally higher tonnage throughputs require more capital and the size of the project is reflected in the initial investment. Economies of scale can still apply where some access and construction issues have a high fixed component regardless of the size of size of the project.
Higher production rates generally pay back fixed capital earlier and provide a higher rate of return on capital, which improves project NPV.
The PEA throughput has been set at 74,000 tonne per year which is less than the maximum throughput allowed for a small mine permit and sets the mine life to 9 years.
16.4 MINE PLANNING 3D BLOCK MODEL AND MINESIGHT PROJECT
All mine planning uses vein mineralized grades for Au (g/t), Ag (g/t), and Te (ppm), along with estimates of block percentages within mineralized veins. The 3DBM also contains estimates of grade in the portions of the block outside of the mineralized veins, an SG (density) item, a class item (Indicated or Inferred), and a topography item representing the proportion of a block below the topographic surface.
The PEA mine planning model dimensions are provided in Figure 16-1. The total model area is illustrated for orientation in plan view in the Figure 16-2.
Figure 16-1 Deer Horn Mine Planning 3DBM Limits
Note: X = Easting, Y = Northing, Z = Elevation.
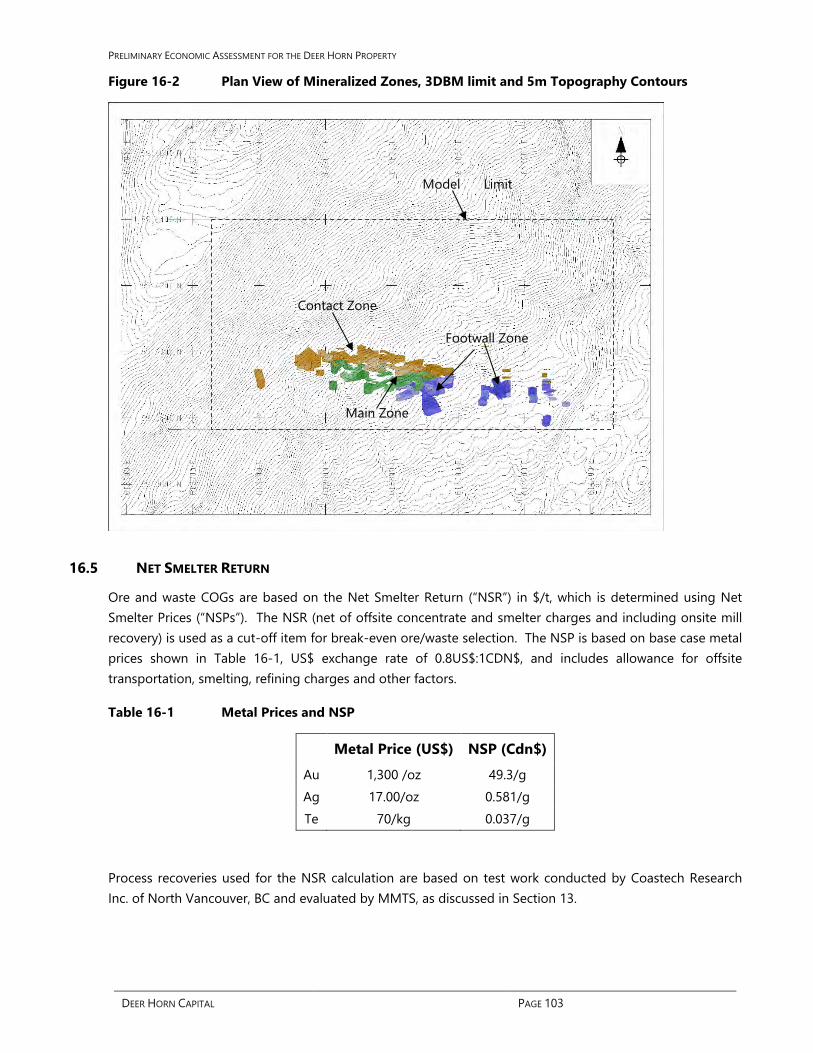
PRELIMINARY ECONOMIC ASSESSMENT FOR THE DEER HORN PROPERTY
DEER HORN CAPITAL PAGE 103
Figure 16-2 Plan View of Mineralized Zones, 3DBM limit and 5m Topography Contours
16.5 NET SMELTER RETURN
Ore and waste COGs are based on the Net Smelter Return (“NSR”) in $/t, which is determined using Net Smelter Prices (“NSPs”). The NSR (net of offsite concentrate and smelter charges and including onsite mill recovery) is used as a cut-off item for break-even ore/waste selection. The NSP is based on base case metal prices shown in Table 16-1, US$ exchange rate of 0.8US$:1CDN$, and includes allowance for offsite transportation, smelting, refining charges and other factors.
Table 16-1 Metal Prices and NSP
Metal Price (US$) NSP (Cdn$) Au 1,300 /oz 49.3/g Ag 17.00/oz 0.581/g Te 70/kg 0.037/g
Process recoveries used for the NSR calculation are based on test work conducted by Coastech Research Inc. of North Vancouver, BC and evaluated by MMTS, as discussed in Section 13.
Contact Zone
Main Zone
Footwall Zone
Model Limit

PRELIMINARY ECONOMIC ASSESSMENT FOR THE DEER HORN PROPERTY
DEER HORN CAPITAL PAGE 104
The NSR calculation is shown in Equation 16.1.
Equation 16.1 NSR Formula
NSR = Au x RecAu x NSPAu + Ag x RecAg x NSPAg + Te x RecTe x NSPTe 100 100 100 Where: Au = gold grade (g/t) Ag = silver grade (g/t) Te = tellurium grade (ppm or g/t) RecAu = gold recovery (%) RecAg = silver recovery (%) RecTe = tellurium recovery (%) NSPAu = net smelter price for gold (Cdn$/g) NSPAg = net smelter price for silver (Cdn$/g) NSPTe = net smelter price for tellurium (Cdn$/g).
16.6 MINING LOSS AND DILUTION
The Deer Horn Project is a gold-silver-tellurium vein deposit. The pits will be selectively mined with small excavators and trucks at an ore mining rate of 500 t/d. Blast-hole assays will be used to determine the waste/ore boundaries for material designations on the pit bench for daily operations.
Dilution as part of a selective mining scenario is estimated using the 3D solids built to represent the mineralization. It is assumed that the solids will be targeted for mining, and that they will be fully recovered with a dilution skin around the solids.
A hydraulic excavator with a 2.1 m3 bucket is chosen to estimate dilution, as two of these loading tools will meet the needs of the mine plan. The 2.1 m3 bucket has a width of 1.5 m. It is assumed that the dilution skin around the original mineralized solids will equal ½ of the width of the bucket, or 0.75 m.
The volumes of the mineralized solids are measured, as well as the surface area. An estimate of thickness is made by dividing the volume by the surface area. The thickness is expanded by 0.75 m on both the hangingwall and footwall, and the volumes of the expanded solids are estimated and compared to the original solids.
Table 16-2 Dilution Estimation
Contact Zone Footwall Zone MN_2012 Zone Total
Original Solid Projected Area (m2) 42,180 21,018 14,325 77,523
Original Solid Volume (m3) 160,710 47,418 28,971 237,099
Projected Thickness (m) 3.81 2.26 2.02 3.06
0.75m Addition Thickness (m) 5.31 3.76 3.52 4.56
0.75m Diluted Volume (m3) 223,980 78,945 50,459 353,384
Potential Dilution 39 % 66 % 74 % 49 %

PRELIMINARY ECONOMIC ASSESSMENT FOR THE DEER HORN PROPERTY
DEER HORN CAPITAL PAGE 105
The dilution grades provided in Table 16-3 represent the average grade of the non-mineralized portions of the blocks in the resource model, which should be representative of the skin of material excavated outside of the mineralized veins.
Table 16-3 Dilution Grades
Dilution Grade
Au (g/t) 0.13 Ag (g/t) 5.1 Te (ppm) 7.2 Cu (%) 0.005 Pb (%) 0.001 Zn (%) 0.011
A mining recovery of 100 % of the mineralized solids is assumed. A mining dilution of 50 % at the grades shown in Table 16-3 is applied to the mineralized tonnes and grade.
16.7 ECONOMIC PIT LIMITS
The economic pit limit has been determined using the Lerchs–Grossmann (LG) algorithm, which uses the ore grades, mineralized percentage and specific gravity (SG) for each block of the three-dimensional (3D) block model and evaluates the costs and revenues of the blocks within potential pit shells. The routine uses input economic and engineering parameters and expands downwards and outwards until the last increment is at break-even economics.
Additional cases are included in the analysis to evaluate the sensitivities of resources to strip ratio/topography and high grade/low grade areas of the deposit. In this study, the various cases or pit shells are generated by varying the input metal prices and comparing the resultant waste and mill feed tonnages, and grades, for each pit shell.
By varying the economic parameters while keeping inputs for metallurgical recoveries and pit slopes constant, various generated pit cases are evaluated to determine where incremental pit shells produce marginal or negative economic returns. This drop-off is due to increasing strip ratios, decreasing grades, increased mining costs associated with the larger or deeper pit shells, and the value of discounting costs before revenues. At some point, further expansion does not provide significant added value. A pit limit can then be chosen that has suitable economic return for the deposit.
The chosen pit shell is then used as the basis for more detailed design and economic modelling.
16.7.1 PIT OPTIMIZATION INPUTS
Metal prices shown in Table 16-1 are used as inputs for the pit optimization. The NSR value derived from these prices is varied from 10 % to 100 % in 5 % increments.
The average unit costs to generate the LG pits are shown in

PRELIMINARY ECONOMIC ASSESSMENT FOR THE DEER HORN PROPERTY
DEER HORN CAPITAL PAGE 106
Table 16-4 and Table 16-5 below.

PRELIMINARY ECONOMIC ASSESSMENT FOR THE DEER HORN PROPERTY
DEER HORN CAPITAL PAGE 107
Table 16-4 Deer Horn Mining Costs For Economic Pit Limits
Ore Cdn $/t 3.00
Waste Cdn $/t 3.00
Table 16-5 Deer Horn Unit Process and G&A Costs For Economic Pit Limits
Process Cost Cdn $/t 38.75
G&A Cost Cdn $/t 5.81
Process + G&A Cdn $/t 44.56
A pit slope geotechnical assessment has not yet been carried out. The PEA pit slope angle design basis is assumed to be 45 degrees.
16.7.2 ECONOMIC PIT LIMIT
Figure 16-3 shows the contents of the generated LG pit shells using a mill feed/waste cutoff grade of $28.70/t NSR, 100 % mining recovery, and 50 % mining dilution at 0.133 g/t Au, 5.096 g/t Ag, 7.196 ppm Te.
An inflection point can be seen in the curve of cumulative resources by pit case. The 55 % Price Factor Case indicates a point at which larger pit shells will not produce significant increases to the resource within the pit shell or where an incremental increase in the pit resource results in only marginal economic return.
Figure 16-3 Mill Feed by Price Factor LG Case
0
100
200
300
400
500
600
700
800
900
1,000
0% 20% 40% 60% 80% 100% 120% 140% 160%
Mill
Fee
d (k
tonn
e)
Price Factor Pit Case
Economic Pit Limit

PRELIMINARY ECONOMIC ASSESSMENT FOR THE DEER HORN PROPERTY
DEER HORN CAPITAL PAGE 108
The pit shell generated from the 55 % Price Factor is selected as the ultimate pit limits for the Deer Horn deposit and is used for further mine planning and as a target for detailed open pit designs. Lower price factor cases are used to guide the designs of earlier pit phases within the limits of the selected ultimate pit.
Oblique and plan views and north-south section views of the chosen ultimate pit limit is shown in the Figure 16-4, Figure 16-5, and Figure 16-6.
Figure 16-4 Oblique View of the selected LG Pit Limit Shell

PRELIMINARY ECONOMIC ASSESSMENT FOR THE DEER HORN PROPERTY
DEER HORN CAPITAL PAGE 109
Figure 16-5 Plan View of the chosen LG Pit Shell

PRELIMINARY ECONOMIC ASSESSMENT FOR THE DEER HORN PROPERTY
DEER HORN CAPITAL PAGE 110
Figure 16-6 LG Pit Limit N-S Section at East 613905 Viewed from the East
The chosen LG shell is shown as red, the topography surface as green. Outlines of the mineralized solids are shown in blue, green, and orange, and are labelled. The mineralized Au grade is shown and scaled by the mineralized % of the block.

PRELIMINARY ECONOMIC ASSESSMENT FOR THE DEER HORN PROPERTY
DEER HORN CAPITAL PAGE 111
16.8 DETAILED PITS
MMTS has completed pit designs that demonstrate the viability of accessing and mining economic resources at the Deer Horn property. The designs utilize estimated geotechnical parameters, suitable road widths for the equipment size, and minimum mining widths based on efficient operation for the size of mining equipment chosen for the project.
16.8.1 HAUL ROAD WIDTHS
Mining is anticipated to be carried out by contractor miners using small mine equipment (25 t to 50 t payload articulated trucks). Haul road design widths have been assumed as follows:
• Double lane highwall haul road allowance: 12 m;
• Single lane highwall haul road allowance: 9 m.
Haul road widths are dictated by equipment size. One-way haul roads must have a travel surface more than twice the width of the widest haul vehicle. Two-way roads require a running surface more than three times the width of the widest vehicle planned to use the road. One-way roads are not normally employed for main long-term haul routes because they limit the safe by passing of trucks and consequently lead to reduced productivity. One-way roads are, however, an appropriate option for low volume traffic flow or shorter-term operations.
Select pit berms can be designed at 9 m width to allow for single lane access across the pit.
16.8.2 MINIMUM MINING WIDTH
A minimum mining width between pit phases is reserved to maintain a suitable mining platform for efficient mining operations. This width is established based on equipment size and operating characteristics. For this study, the minimum mining width generally conforms to 20 m.
In areas where the minimum mining width is not achieved, such as initial outcrop benches, drill and blast ramps will be cut on original side slopes. Crawler-dozers, loader casting, or loader tramming will be utilized to move material over the crest to ravel down slope. Where bench width is sufficient, this material will be excavated as rehandle from lower benches.
16.8.3 ACCESS CONSIDERATIONS
Most of the Deer Horn pit benches are located above the lowest point of the pit rim and can be accessed by external roads built on the original hill side slopes, reducing the need for internal ramps in the final wall.
Road grades are designed at a maximum grade of 8 %. Steeper roads (10 %) can be considered after more weather data has been accumulated.
16.8.4 BERM WIDTH
Pit designs for Deer Horn are designed using a minimum 8 m wide safety berm. Where haul roads intersect designed safety benches, the haul road width is counted towards the safety berm. These berms can be modified in places to accommodate single lane hauler traffic for access to specific benches.
PRELIMINARY ECONOMIC ASSESSMENT FOR THE DEER HORN PROPERTY
DEER HORN CAPITAL PAGE 112
16.8.5 BENCH HEIGHT
Pit designs are based on the digging reach of the excavators (7 m operating bench) with double benching between highwall berms; therefore, the berms are separated vertically by 14 m. Future pit design configurations can be done following block size bench heights of 5 m, without materially affecting the contents of the pit.
16.8.6 LG PHASE SELECTION
The LG pits discussed previously are used to evaluate alternatives for determining the economic pit limit and the optimal push-backs or phases before commencing detailed design work. LG pits provide a geometrical guide to detailed pit designs. Among the details are the addition of roads and bench access, the removal of impractical mining areas with a width less than the minimum, and to ensure the pit slopes meet the detailed geotechnical recommendations.
The LG pit case selected as the pit limit for the mine area discussed above is 55 % price factor LG pit.
There are smaller pit shells within the economic pit limits that have higher economic margins, due to their lower strip ratios or better grades than the full economic pit limit. Mining these pits as phases from higher to lower margins maximizes revenue and minimizes mining cost at the start of mining operations, which therefore shortens the project capital payback.
The selection of LG pit cases identified to guide the design of starter pits requires the consideration of some practical mining constraints. The starter pits:
• must be large enough to accommodate the multiple unit mining operations of drilling, blasting, loading, and hauling;
• must have bench sizes large enough so the number of benches mined per year is reasonable;
• must be wide enough so that excavators can load the trucks efficiently;
• must be able to provide a sufficient quantity of ore.
The LG pits have been examined to find the lowest LG price case that can sustain mining operations.
16.8.7 PIT DESIGNS
The description of the detailed pit designs and phases in this section uses the following naming conventions:
• The letter D signifies Deer Horn.
• The middle digit signifies the design series. In this report, the fifth pit design series is used.
• The final digit signifies the pit phase number (this pit design has five phases).
• A suffix of ‘i’ indicates that the drawing reserve tonnage for the phase is incremental from the previous phase. If there is no ‘i’ specified, it is cumulative up to the phase indicated.

PRELIMINARY ECONOMIC ASSESSMENT FOR THE DEER HORN PROPERTY
DEER HORN CAPITAL PAGE 113
Where possible, phase sequencing starts at one side of the ultimate pit and expands in one direction. This sequencing is more efficient for operations where blasts from the subsequent phase only bury access to lower benches on one side at a time. It also allows the final ramp to be established on one side of the ultimate pit. The initial three pit phases (D651, D652, and D653) are nearly independent starter-pits with a small amount of overlap between pit phases D651 and D653i. These phases will be mined first. The independence of the starter phases enables flexibility in day-to-day scheduling. The fourth pit phase (D654i) mines to the pit limit on the east side. The fifth and final pit phase (D655i) mines to final wall on the west side.
Phase D651
Phase D651 is a starter phase that mines at the southeast corner of the ultimate pit footprint. It begins mining at an elevation of 1,305 m. Access is established via an external haul road. The pit is mined to a bottom elevation of 1,201 m. Waste is hauled to the waste area to the south of the pit area. A plan view of the D651 pit with the pit limit outline is provided in Figure 16-7.
Figure 16-7 Plan View of Starter Pit D651 with the Pit Limit Outline

PRELIMINARY ECONOMIC ASSESSMENT FOR THE DEER HORN PROPERTY
DEER HORN CAPITAL PAGE 114
Phase D652
Phase D652 is a starter phase that mines at the western edge of the final pit footprint. Mining starts at an elevation of 1,460 m with access is established via an external haul road. The pit is mined to a bottom elevation of 1,390 m. Waste is hauled to the waste area to the south of the pit area. A plan view of the D652 pit with the pit limit outline is provided in Figure 16-8.
Figure 16-8 Plan View of Starter Pit D652 with the Pit Limit Outline

PRELIMINARY ECONOMIC ASSESSMENT FOR THE DEER HORN PROPERTY
DEER HORN CAPITAL PAGE 115
Phase D653i
Phase D653i is a starter phase that mines at the south eastern edge of the final pit footprint. It overlaps and is considered incremental to D651. D653i pit phase begins mining at an elevation of 1,345 m. Pit access is via an external haul road. The pit is mined to a bottom elevation of 1,291 m. Waste is hauled to the waste area to the south of the pit area. A plan view of the D653i pit with the pit limit outline is provided in Figure 16-9.
Figure 16-9 Plan View of Starter Pit d653 with the Pit Limit Outline

PRELIMINARY ECONOMIC ASSESSMENT FOR THE DEER HORN PROPERTY
DEER HORN CAPITAL PAGE 116
Phase D654i
Phase D654i is an incremental pit phase that mines to final wall on the eastern side of the ultimate pit footprint. The pit begins mining at an elevation of 1,415 m. The pit is mined to a bottom elevation of 1,226 m. Waste is hauled to the waste area to the south of the pit area. A plan view of the D654i pit with the pit limit outline is provided in Figure 16-10.
Figure 16-10 Plan View of Phase D654i with the Pit Limit Outline

PRELIMINARY ECONOMIC ASSESSMENT FOR THE DEER HORN PROPERTY
DEER HORN CAPITAL PAGE 117
Phase D655i
Phase D655i mines to final wall at the western side of the pit area. The pit begins mining at an elevation of 1,515 m. The D655i pit is mined to a bottom elevation of 1,226 m. Waste rock is hauled to the waste rock pile area to the south of the pit area, and a waste rock pile backfilled into the mined out pit phase D654i. A plan view of the D655 pit with the pit limit outline is provided in Figure 16-11.
Figure 16-11 Plan View of Ultimate Pit d655

PRELIMINARY ECONOMIC ASSESSMENT FOR THE DEER HORN PROPERTY
DEER HORN CAPITAL PAGE 118
Combined Pit Areas
Figure 16-12 shows the combined pit phases.
Figure 16-12 Plan View of all Pit Phases
D651
D653
D652
D654
D655

PRELIMINARY ECONOMIC ASSESSMENT FOR THE DEER HORN PROPERTY
DEER HORN CAPITAL PAGE 119
16.9 PIT RESOURCE
The pit delineated resource summarized in Table 16-6 uses an NSR cutoff grade of $29/t, 100 % mining recovery, and a mining dilution of 50 % with dilution grades shown in Table 16-3.
Table 16-6 Pit Delineated Resource
Pit Mill Feed NSR AU AG TE CU PB ZN Waste Strip
kt $/t g/t g/t ppm % % % kt Ratio
P651 12 494.01 8.17 222.9 62.4 0.07 0.018 0.20 147 12.3
P652 87 286.86 4.43 163.3 153.5 0.26 0.035 0.43 216 2.5
P653i 21 364.35 5.99 176.5 176.4 0.09 0.037 0.32 107 5.1
P654i 365 199.98 3.34 92.4 99.6 0.08 0.019 0.19 3,169 8.7
P655i 169 240.07 3.65 132.0 134.7 0.20 0.048 0.41 3,382 20.0
Total 656 232.48 3.73 117.1 117.6 0.14 0.029 0.28 7,022 10.7
Notes:
1) The pit delineated resource has an effective date of 15 May 2018. The Qualified Person for the estimate is Mr. Marc Schulte, P.Eng.
2) The $29/t NSR cut-off grade includes the following considerations: Gold Price of US$1,300/oz., Silver Price of US$17/oz., Tellerium price of US$70/kg, exchange rate of 0.8 US$:CDN$, process costs of $29 per tonne milled, process recovery of 90 %, mining costs of $4/tonne mined, and overall pit slope angles of 44 degrees.
3) The pit delineated resources are mined tonnes and grade, the reference point is the ill feed at the primary crusher.
4) Mining recovery of 100% of mineralized tonnes and grade. Mining dilution of 50% at 0.133 g/t Au, 5.096 g/t Ag, 7.196 ppm Te, 0.005 % Cu, 0.001 % Pb, 0.011 % Zn, applied to the block modeled mineralized tonnes and grade.
5) The pit delineated resource includes Inferred material that is considered too speculative geologically to have the economic considerations applied to them that would enable them to be categorized as mineral reserves, and there is no certainty that the preliminary economic assessment will be realized.
Factors that may affect the estimates include:
• Metal price assumptions;
• Changes in interpretations of mineralization geometry and continuity of mineralization zones;
• Changes to compositing and kriging assumptions;
• Metallurgical recovery assumptions;
• Operating cost assumptions;
• Confidence in the modifying factors, including assumptions that surface rights to allow mining infrastructure to be constructed will be forthcoming;
• Delays or other issues in reaching agreements with local or regulatory authorities and stakeholders;
• Changes in land tenure requirements or in permitting requirements from those discussed in this Report.

PRELIMINARY ECONOMIC ASSESSMENT FOR THE DEER HORN PROPERTY
DEER HORN CAPITAL PAGE 120
16.10 MINE PLAN
16.10.1 MINE PRODUCTION SCHEDULE
The mine production schedule is developed using annual production requirements, mine operating considerations, product prices, recoveries, destination capacities, equipment performance and operating costs.
The following schedule characteristics are applied:
• Pre-production occurs one year ahead of mill operations and entails building haul roads to access the top of the pits and excavating waste rock to build buttresses for the year one tailings production.
• Pre-production is not required to expose ore for mill start-up.
• Pre-production is not required to source construction rock for infrastructure or facilities other than the tailings buttresses. Waste material may be used for some construction fills; however, it may be more cost effective to use borrow material from other areas if hauls are too long from the starter pit area or if waste rock is unsuitable to be used as construction material. A second cost effective alternative for construction material is to borrow the material from the upper benches of future pit phases.
• Annual mill feed of 74 ktpa is targeted.
• No mill ramp up in first year of operations. The 500 tpd capacity mill should be able to handle 74 kt throughput in the first year of operation.
• Low grade stockpiling has not been examined, ore is mined and sent to the mill in the same period.
• Phased pit bench reserves and waste contents are used as input to the mine production schedule.
• Within a given phase, each 5 m bench is fully mined before progressing to the next bench. The possibility of partial bench mining is not examined, even in zones of predominately waste.
• Pit phases are mined in order. The second pit phase is limited from progressing vertically below the first pit phase.
• Pit phase progression is limited to no more than 8 benches in each year. Average phase bench progression in an annual period is 5 benches.
• 2.1m3 bucket hydraulic excavators are used with 25 t payload articulated haul trucks.
• Seasonal operations with 200 days per year available for mine operation, as well as 2 x 12 hour shifts planned per day.

PRELIMINARY ECONOMIC ASSESSMENT FOR THE DEER HORN PROPERTY
DEER HORN CAPITAL PAGE 121
The summarized production schedule results are shown in the Table 16-7 below.
Table 16-7 Summarized Production Schedule
Year Mill Feed AU AG TE CU PB ZN Waste Strip
kt g/t g/t ppm % % % kt Ratio
-1 475
1 74 5.71 181.3 149.9 0.18 0.034 0.36 476 6.4
2 74 3.56 137.5 135.1 0.20 0.048 0.39 514 6.9
3 74 3.95 126.1 127.8 0.14 0.029 0.36 821 11.1
4 74 3 87.1 92.9 0.07 0.020 0.18 800 10.8
5 74 2.81 64.3 76.4 0.06 0.009 0.12 800 10.8
6 74 3.96 95.4 106.9 0.07 0.006 0.11 800 10.8
7 74 3.55 111 106.5 0.14 0.017 0.23 962 13.0
8 74 3.61 130.6 137.2 0.21 0.058 0.45 983 13.3
9 64 3.42 121.6 127.4 0.17 0.044 0.35 391 6.1
Total 656 3.73 117.1 117.6 0.14 0.029 0.28 7,022 10.7
Figure 16-13 shows the LOM open pit production schedule. The higher grades at the start of the Deer Horn production schedule are a result of the prevailing grades in the starter pits and not the result of COG optimization.
Figure 16-13 LOM production schedule

PRELIMINARY ECONOMIC ASSESSMENT FOR THE DEER HORN PROPERTY
DEER HORN CAPITAL PAGE 122
16.10.2 WASTE ROCK DUMPS AND TOP SOIL STORAGE
Waste rock in the mine plan is placed in dumps in as close proximity to the mining areas as possible in an area that enables the waste rock to contain and comingle with mine tailings. All dump designs assume a natural angle of repose of 27°. A 25 % swell factor is applied to in situ volumes to calculate the loose volume requiring placement.
Bottom up construction methods have been assumed for the construction of waste rock dumps to maximize dump stability. Top-down placement will have some economic benefit and should be evaluated as a part of future geotechnical studies.
Some waste from Pit Phase D655i is backfilled into the mined out pit Phase D654i.
Recovered topsoil from the dump foundation and pit areas may be required as reclamation material for capping the final dumps. Allowance has been made for the storage of Topsoil east of the tailings facility.
Annual waste volumes are shown by year in Table 16-8. Estimated tails volumes are also included, assuming a placement volume of 1.3 m3 per tonne of mill feed.
0.0
1.0
2.0
3.0
4.0
5.0
6.0
7.0
8.0
0
200
400
600
800
1,000
1,200
1 2 3 4 5 6 7 8 9
Dilu
ted
Mill
Fee
d Au
Gra
de (g
/t)
Min
e Pr
oduc
tion
(kt)
Year
Mill Feed Waste AU

PRELIMINARY ECONOMIC ASSESSMENT FOR THE DEER HORN PROPERTY
DEER HORN CAPITAL PAGE 123
Table 16-8 Waste Volumes and Tonnages by Year
16.10.3 MINE PRODUCTION DETAIL
The mine plan for select periods is described in this section with illustrative End of Period (EoP) figures.
16.10.3.1. PRE-PRODUCTION (YEAR -1)
At the start of Year -1, access roads are built to top of all pit phases and pre-stripping is completed. Pre-stripping includes mining D652 to an elevation of 1,440 m, D563 to an elevation of 1,315 m, D654 to an elevation of 1,370 m, and D655 to an elevation of 1,475 m. By the end of the preproduction period, the mill pad is complete, foundation preparation for the waste dump is completed, and the starter tailings buttress has been constructed. The water collection pond is also constructed.
16.10.3.2. YEAR 1
By the end of Year 1, D651 is mined to completion at an elevation of 1,240 m, D652 is mined down to an elevation of 1,415 m, D653 is mined to completion at an elevation of 1,290 m, and D654 is mined to an elevation of 1,360 m. All waste is used to build up double lane haul roads or is hauled to the waste rock dump. Ore is hauled to the crusher or stockpiled adjacent to the plant area.
The mine layout at the end of Year 1 is shown in
Period Waste
(kTonnes)
Waste Volume
(m3x1000)
Cumulative Waste
(kTonnes)
Cumulative Waste Volume
(m3x1000)
Cumulative Tails Volume
(m3x1000)
Y-01 475 216 475 216 0
Y01 476 216 951 432 57
Y02 514 234 1,465 666 114
Y03 821 373 2,286 1,039 171
Y04 800 364 3,086 1,403 228
Y05 800 364 3,886 1,766 285
Y06 800 364 4,686 2,130 342
Y07 962 437 5,648 2,567 398
Y08 983 447 6,631 3,014 455
Y09 391 178 7,022 3,192 505

PRELIMINARY ECONOMIC ASSESSMENT FOR THE DEER HORN PROPERTY
DEER HORN CAPITAL PAGE 124
Figure 16-14.
16.10.3.3. YEARS 2-4
By the end of Year 2, D652 is mined to completion at an elevation of 1,390 m, and D654 is mined to 1,335 m elevation. All waste is hauled to the waste rock dump. Ore is hauled to the crusher or stockpiled adjacent to plant area.
By the end of Year 3, D654 is mined to 1,300 m elevation. All waste is hauled to the waste rock dump. Ore is hauled to the crusher or stockpiled adjacent to plant area.
By the end of Year 4, D654 is mined to 1,280 m elevation and D655 is mined to 1,455 m elevation. All waste is hauled to the waste rock dump. Ore is hauled to the crusher or stockpiled adjacent to plant area.
The mine layout at the end of Year 4 is shown in Figure 16-15Error! Reference source not found..
16.10.3.4. YEARS 5-9
By the end of Year 5, D654 is mined to 1,265 m elevation and D655 is mined to 1,435 m elevation. All waste is hauled to the waste rock dump. Ore is hauled to the crusher or stockpiled adjacent to plant area.
By the end of Year 6, D654 is mined to 1,245 m elevation and D655 is mined to 1,410 m elevation. All waste is hauled to the waste rock dump. Ore is hauled to the crusher or stockpiled adjacent to plant area.
By the end of Year 7, D654 is mined to completion at elevation 1,225 m and D655 is mined to 1,385 m elevation. All D654 waste is hauled to the waste rock dump. Once phase D654 is complete waste rock from D655 is backfilled into the pit. Ore is hauled to the crusher or stockpiled adjacent to plant area.
By the end of Year 8, D655 is mined to 1,340 m elevation. All waste is hauled to the backfill waste rock dump. Ore is hauled to the crusher or stockpiled adjacent to plant area.
By the end of Year 9, D655 is mined to completion at an elevation of 1,300 m. Waste is hauled to the backfill waste rock dump. Ore is hauled to the crusher or stockpiled adjacent to plant area.
The mine layout at the end of Year 9 is shown in Figure 16-16.
16.10.3.5. END OF OPEN PIT MINING
At end of the mining phase, any stockpiled ore is milled, and any necessary waste dump reclamation is performed.

PRELIMINARY ECONOMIC ASSESSMENT FOR THE DEER HORN PROPERTY
DEER HORN CAPITAL PAGE 125
Figure 16-14 EOP 01 Mine Layout
Blue lines are streams, pink dashed lines are watershed boundaries, and dark red line is proposed ex-pit haul road layout. Pits are yellow.

PRELIMINARY ECONOMIC ASSESSMENT FOR THE DEER HORN PROPERTY
DEER HORN CAPITAL PAGE 126
Figure 16-15 EOP 04 Mine Layout
Blue lines are streams, pink dashed lines are watershed boundaries, and dark red line is proposed ex-pit haul road layout. Pits are yellow.

PRELIMINARY ECONOMIC ASSESSMENT FOR THE DEER HORN PROPERTY
DEER HORN CAPITAL PAGE 127
Figure 16-16 EOP 09 Mine Layout
Blue lines are streams, pink dashed lines are watershed boundaries, and dark red line is proposed ex-pit haul road layout. Pits are yellow.

PRELIMINARY ECONOMIC ASSESSMENT FOR THE DEER HORN PROPERTY
DEER HORN CAPITAL PAGE 128
16.11 MINE OPERATIONS
Deer Horn mining operations will be typical of small open pit operations in mountainous terrain in western Canada and will employ accepted selective mining methods and equipment. There is considerable operating experience and technical expertise for the proposed operation in western Canada. Services and support in BC and in the local area are well-established.
A small capacity mining operation is being designed suitable for experienced contract miners. Mining equipment is similar in size to typical fleets used in civil construction projects. Several suitable contractors are available in the region.
Mine operations will be carried out in the summer to avoid the high snowfall winter conditions. This will require annual mobilization of the small mine fleet at the start of the season, and complete demobilization and removal of the mine fleet at the end of the summer season. The potential mine operation season will start in May after freshet and end in November before major snowfall begins. During operations, 2 x 12-hour shifts are planned for each day.
In situ rock will require drilling and blasting to create suitable fragmentation for efficient loading and hauling of both mill feed and waste material. Ore and waste limits will be defined in the blasted muck pile through blasthole assays and grade control technicians. Support personnel and equipment under contractor supervision will be required to maintain the mining area, ensuring the operation runs safely and efficiently.
16.11.1 DRILLING
Areas will be prepared on the bench floor blast patterns in the in situ rock. The spacing and burden between blast holes will be varied as required to meet the required powder. Dozers will be used to establish initial benches for the upper portions of each phase. Drill ramps will be cut between benches where the outside holes on established benches do not meet the burden and spacing requirement of the pattern for the next bench below.
Drills should be fitted with automatic samplers to provide ore grade control samples from drill cuttings in the ore zones. These samples will be used in the Ore Control System (“OCS”) for blast hole kriging to define the ore/waste boundaries on the bench as well as stockpile grade bins for the grade control system to the mill.
Small blast hole drills will be used for production drilling, both in ore and waste. Based on the estimated powder factor a small diameter blast hole size of 4 inches with a burden and spacing of approximately 2.8 m is expected. These parameters will be re-evaluated in the future with a detailed blasting study, using site-specific rock strength parameters.
16.11.2 BLASTING
An appropriate powder factor will be used to provide adequate fragmentation and digging conditions for the excavators. Similar open pit projects in region use a powder factor of 0.35 kg/t for competent rock, which should achieve adequate fragmentation.

PRELIMINARY ECONOMIC ASSESSMENT FOR THE DEER HORN PROPERTY
DEER HORN CAPITAL PAGE 129
The blasting crew will be comprised of contractor employees and will be on day shift only. The blasting crew will coordinate the drilling and blasting activities to ensure a minimum of two weeks of broken material inventory is maintained for each excavator.
The explosives contractor will supply and store bulk explosives on site. The explosives contractor’s employees will deliver explosives to the blast hole.
Specifications for blasting plant and explosives storage magazines and the locations of these facilities must adhere to the Explosives Act of Canada regulations as published by the Explosives Regulatory Division of Natural Resources Canada, and regulations as published by the MEMPR in BC (in particular, the Health, Safety and Reclamation Codes for Mines in BC).
Loading of the explosives will be done with bulk explosives loading trucks provided by the explosives supplier. The explosives product that is being used is a mix of ANFO and emulsion.
The blast holes will be stemmed to avoid fly-rock and excessive air blasts. Crushed rock will be provided for stemming material and will be dumped adjacent to the blast pattern. A loader with a side dump bucket is included in the mine fleet to tram and dump the crush into the hole. The crushed rock is provided by an onsite rock crusher specified for mine roads.
16.11.3 LOADING
Ore and waste will be defined in the blasted muck pile as defined by the OCS. It is expected that the contract miner will use 2.1 m3 excavators as the primary digging units. Loading will be completed on either 2.5 m or 5 m benches, depending on grade control requirements.
16.11.4 HAULING
Ore and waste will be hauled out of the pit and to scheduled destinations by articulated off-highway haul trucks with 25 t payloads.
16.11.5 PIT MAINTENANCE
The contract miner is responsible for pit maintenance services including:
• Haul road maintenance;
• Pit floor and ramp maintenance;
• Waste dump maintenance;
• Ditching;
• Dewatering;
• Secondary blasting and rock breaking;
• Reclamation and environmental control;
• Lighting;
• Transporting personnel and operating supplies.
A rock crusher for road grading material may be required to improve truck travel speeds, reduce mechanical fatigue to the haul trucks, and to enhance tire life, which is a major mine operating cost.

PRELIMINARY ECONOMIC ASSESSMENT FOR THE DEER HORN PROPERTY
DEER HORN CAPITAL PAGE 130
16.11.6 MINE MAINTENANCE
Mine maintenance includes the supervision and planning of the mine maintenance activities and will be carried out by the contract miner. The mine maintenance team will perform breakdown and field maintenance and repairs, regular preventive maintenance, component change-outs, in-field fuel and lube servicing, and tire change-outs.
16.11.7 GENERAL MINE EXPENSE
GME area accounts for the supervision, safety, environment, and training for the direct mining activities as well as technical support from mine engineering and geology functions. Mine operation supervision will extend down to the shift foreman level.
Most of the GME functions at Deer Horn will be assumed by the selected contract miner. The owners GME cost will include:
• a geologist, ore grade technicians and a mining engineer who will coordinate the mine plan with the contract miner;
• a senior surveyor who will assume responsibility for surveying for the entire property; • an environmental engineer and technician will co-ordinate sustainability issues.
Mine geotechnical issues including pit slope stability and hydro-geological studies will be contracted out. The geotechnical engineers will have oversight for the whole property for any geohazard monitoring and assessment programs being carried out by safety personnel or third party consultants.
16.12 MINE CLOSURE AND RECLAMATION
At the end of the mine life, an approved closure and reclamation plan will be implemented that will meet the end land use objectives and satisfy the regulatory commitments. The mining costs provide an allowance for the following general reclamation activities.
Mine waste rock piles have been designed as bottom-up lift dumping. The waste rock piles will be placed during the mine life, as close to their final closure configuration as possible. Where possible waste rock piles will be reclaimed as a part of ongoing mine operations. Some re-contouring and reclamation will be required at closure. Salvaged reclamation and soil material will be placed on the waste rock piles surfaces after resloping, where required. Decommissioned mine roads will be scarified and capped with available surficial soils. Dykes and dams that are exposed above the water line will also be scarified and capped with suitable soils. The surfaces will then be planted/seeded as required.
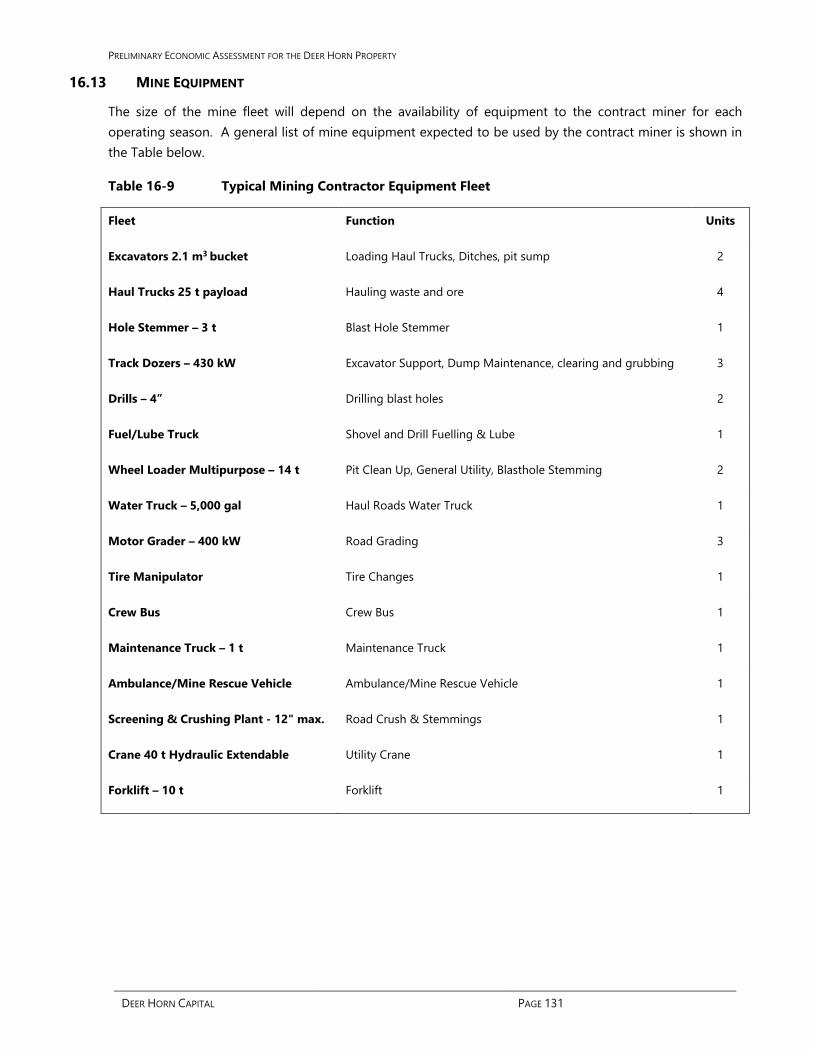
PRELIMINARY ECONOMIC ASSESSMENT FOR THE DEER HORN PROPERTY
DEER HORN CAPITAL PAGE 131
16.13 MINE EQUIPMENT
The size of the mine fleet will depend on the availability of equipment to the contract miner for each operating season. A general list of mine equipment expected to be used by the contract miner is shown in the Table below.
Table 16-9 Typical Mining Contractor Equipment Fleet
Fleet Function Units
Excavators 2.1 m3 bucket Loading Haul Trucks, Ditches, pit sump 2
Haul Trucks 25 t payload Hauling waste and ore 4
Hole Stemmer – 3 t Blast Hole Stemmer 1
Track Dozers – 430 kW Excavator Support, Dump Maintenance, clearing and grubbing 3
Drills – 4” Drilling blast holes 2
Fuel/Lube Truck Shovel and Drill Fuelling & Lube 1
Wheel Loader Multipurpose – 14 t Pit Clean Up, General Utility, Blasthole Stemming 2
Water Truck – 5,000 gal Haul Roads Water Truck 1
Motor Grader – 400 kW Road Grading 3
Tire Manipulator Tire Changes 1
Crew Bus Crew Bus 1
Maintenance Truck – 1 t Maintenance Truck 1
Ambulance/Mine Rescue Vehicle Ambulance/Mine Rescue Vehicle 1
Screening & Crushing Plant - 12" max. Road Crush & Stemmings 1
Crane 40 t Hydraulic Extendable Utility Crane 1
Forklift – 10 t Forklift 1

PRELIMINARY ECONOMIC ASSESSMENT FOR THE DEER HORN PROPERTY
DEER HORN CAPITAL PAGE 132
17.0 RECOVERY METHODS Based on preliminary metallurgical results and the core inspections discussed in Section 13.0 it is MMTS’s opinion that the Deer Horn deposit can be processed using conventional flotation to produce a gold-silver-tellurium polymetallic concentrate. The potential processing flow sheet shown in Figure 17.1 includes the following:
• 3-Stage crushing to 12mm; • Ball mill grinding to P80 of 75 μm; • Copper/Lead Flotation; • Zinc Flotation on Copper/Lead flotation tailings; • Concentrate dewatering by thickener and filtration; • Tailings dewatering by thickener and filtration;
Figure 17-1 Deer Horn Process Flow Diagram
PRELIMINARY ECONOMIC ASSESSMENT FOR THE DEER HORN PROPERTY
DEER HORN CAPITAL PAGE 133
17.1 CRUSHING
ROM will be hauled from the pit to the primary crusher and tipped over a static grizzly. Mine operations will use a mobile rock breaker to reduce the lump size.
Grizzly undersize is conveyed to a mobile crushing plant to produce a fine ore sized to a P80 of 12 mm. The average throughput of the crushing plant package is 500 t/d at a crushing plant availability of 60%.
The mobile crushing plant will include a 3-stage crushing circuit with a primary jaw crusher, a secondary cone crusher, and a tertiary cone crusher. A tramp magnet will remove steel trash from the primary crushed ore.
The fine ore product will be conveyed to a fine ore bin. Fine ore feed to the mill is conveyed by a mill feed conveyor.
17.2 GRINDING
Fine ore will be processed through one single pinion ball mill in closed circuit with hydrocyclones producing a final product of P80 75 μm. The mill has a nominal solids throughput of 500 t/d.
Mill slurry discharge will overflow onto a rubber-lined trommel screen. The trammel undersize gravitates to a cyclone feed hopper where the slurry is diluted with process water and pumped with a cyclone feed pump to the cyclone cluster.
The cyclone underflow will gravity flow back to the ball mill. The cyclone overflow product of P80 75 μm then gravitates to the flotation circuit.
17.3 FLOTATION
Copper/Lead flotation will be carried out in a conventional rougher-cleaner-scavenger circuit to produce a coper/lead concentrate with gold, silver, and tellurium. Tailings will be fed to a zinc flotation circuit. Zinc flotation will produce a zinc concentrate and final process tailings.
Concentrates will be dewatered with thickeners and filtered to prepare final product for shipping.
Flotation tailing will be dewatered with thickeners and filtered. Tailings filter cake will be hauled to the TMF for disposal with the waste rock.

PRELIMINARY ECONOMIC ASSESSMENT FOR THE DEER HORN PROPERTY
DEER HORN CAPITAL PAGE 134
18.0 PROJECT INFRASTRUCTURE 18.1 SITE ACCESS
A map showing planned site access is show in Figure 18-1. Site is accessed from Houston, the closest town, by travelling west on Highway 16 and tuning left on the Morice Forest Service Road. A network of well used existing forest service roads (“FSR”) enables access to the north side of the Tahtsa Reach Ferry crossing. The ferry provides transport to the southern shore of Tahtsa Reach. Travel is resumed along existing FSR’s to Andrews Bay or the East Ootsa logging camp on Ootsa Lake where a barge provides transport to the south end Whitesail Lake.
An existing 7.8 km access road will require widening and preparation to enable delivery of the process and mining equipment. The 2009 base line study (ECOFOR, 2009) recommends relocating some of the stream crossings.
The barge crossing limits the loads along the route to a maximum single load of 100 t.
No road major road construction will be required for the initial delivery of equipment to prepare the mine site. The widening of the existing access road can take place during the pre-production phase.
A gate will be erected at the main entrance of the site. The gate, operated by a security guard, will be used to control pedestrian and all vehicle access to the site.
18.2 CAMP
Due to the remoteness of the Property, a temporary camp is planned to house workers throughout the life of the Project.
18.3 PROCESS AREA
The process area includes the process facilities, maintenance facilities, warehouse and administration facilities. Temporary warehouse, laboratory and administration facilities are located in the processing plant area, in an avalanche safe zone, allowing them to remain in place during the winter months when operations are stopped.
The mine maintenance facility (“MMF”) will be used for servicing the mobile equipment. The MMF requires lubricants, tools, air compressors, a wash pad, and a crane for servicing the equipment. The MMF will only be required during a short summer operation and most mine maintenance will take place in the field. Therefore, it is possible a temporary MMF will be supplied by the contract miner and removed at the end of each operating season.
The laboratory area will contain necessary equipment for chemical analysis, particle size analysis, wet assaying, and weighing.
Due to the summer only operations most of the warehouse area uses outside storage facilities. Some warehouse storage is established in temporary buildings.

PRELIMINARY ECONOMIC ASSESSMENT FOR THE DEER HORN PROPERTY
DEER HORN CAPITAL PAGE 135
Figure 18-1 Deer Horn Site Access Map

PRELIMINARY ECONOMIC ASSESSMENT FOR THE DEER HORN PROPERTY
DEER HORN CAPITAL PAGE 136
The administration area contains office space for administration, geology, engineering, general services, environment, health and safety, human resources, information technology, communications, plant and mine superintendents and their staff. The administration areas also contain a training and conference room, employee lunch and coffee room, dispatch offices, a medical center, men’s and women’s change and washrooms.
18.4 FUEL STORAGE FACILITIES
Fuel will be delivered and stored in mobile tanks at a fuel island provided by fuel vendors in an area adjacent to, or a part of, the process area where it is convenient for mobile equipment access. Lubricant product storage facilities for all mobile equipment will be stationed at the fuel island.
18.5 SEWAGE TREATMENT
Sewage treatment facilities will be erected for the camp and process areas based on anticipated staff requirements.
18.6 WATER SUPPLY
Fresh water is supplied either from wells or the nearby Lindquist Lake. Contact water from surface runoff will be collected and used for the process plant. The preferred option for water supply will be established after water balance and hydrological studies have been completed.
18.7 ELECTRICAL AND COMMUNICATION
Site power demand is estimated to be approximately 1 MW. All site power will be by diesel powered generators.
Site communication will be primarily by radio. A computer network will be setup in the administration area with satellite based internet and phone connectivity typical of exploration projects in the area.
18.8 WASTE AND TAILINGS STORAGE
Placement of mine waste rock and process tailings is designed to minimize the project footprint. Waste rock and tailings are placed in a gulley below the pit area. Waste rock will be placed as a containment buttress for the tailings, and the tailings will be co-mingled with waste rock upon deposition. Some waste rock is backfilled into the mined out pit near the end of the mine life. A collection pond for sediment control will be placed downstream of the waste rock and tailings to intercept any seepage from the tailings or water runoff from the waste rock. Detailed engineering design of the waste and tailings storage will be assessed in future studies following hydrology and ground condition studies.
Ground conditions below the selected waste and tailings area are not well known. Geotechnical and hydrology studies are required to confirm that the area selected for tailings and waste storage are suitable.
Process water will be pumped back to the mill from the collection pond to meet requirements for the mill make-up.

PRELIMINARY ECONOMIC ASSESSMENT FOR THE DEER HORN PROPERTY
DEER HORN CAPITAL PAGE 137
19.0 MARKET STUDIES AND CONTRACTS Market studies have not yet been conducted for the Deer Horn property. The Deer Horn gold-silver-tellurium concentrate will likely either be marketed as feedstock to copper and zinc refineries that possess the technology to specifically economically extract the tellurium, or a gold-silver sweetener for existing copper and zinc concentrate producers.
There are refineries equipped to separate the gold-silver-tellurium from concentrate in North America.
19.1 MARKET PRICES
Metal price assumptions based on a recent review of credible metal price forecast sources are shown in Table 19-1.
The 2018 Pre-Feasibility Study has assumed an exchange rate of C$:US$: 0.79.
Table 19-1 Market Prices
Gold Price $1,300.00 $US/oz Silver Price $17.00 $US/oz TelluriumPrice $100.00 $US/kg Copper Price $3.00 $US/lb Zinc Price $1.20 $US/lb
19.2 CONTRACTS
DHC has not entered into any contracts related to the Deer Horn project.

PRELIMINARY ECONOMIC ASSESSMENT FOR THE DEER HORN PROPERTY
DEER HORN CAPITAL PAGE 138
20.0 ENVIRONMENTAL STUDIES, PERMITTING AND SOCIAL OR COMMUNITY IMPACT 20.1 REGULATORY FRAMEWORK
The Deer Horn Project, with a projected maximum production of 74,000 tonnes per year, should not fall within the category of a “reviewable project” of the British Columbia Environmental Assessment Act (“BCEAA”), administered by the BC Environmental Assessment Office (“BCEAO”), and therefore may not trigger the Canadian Environmental Assessment Act (“CEAA”). The Project may be permitted under the Mines Act of BC as a small mine, without the requirement for a full environmental assessment (“EA”). Despite not directly triggering a Provincial or Federal environmental assessment, it is possible that an EA could be required. If a responsible Minister determines that a significant risk to the environment or local communities justifies a more detailed analysis of the Project, then an EA may be triggered.
Other requirements of Provincial and Federal laws would also apply, depending upon final Project design components.
If the Project does not trigger Provincial or Federal EA, then the Project may be approved by means of an application for a small mines permit under Section 10(1) the Mines Act. The subsequent approval process and timeline are summarized below.
BC MINES ACT SMALL MINES APPROVAL PROCESS
1. Develop draft Project Description 2. Meetings with MEM and other regulators to develop Project Application Information Requirements
(“AIR”) likely in concert with the Regional Mine Development Review Committee (“MDRC”) 3. Conduct gap analysis of AIR 4. Finalize AIR, including a list of all required permits and authorizations 5. Collect information, compile Project applications as required 6. Submit Mines Act Project application and other related permit applications for concurrent review 7. Review of Project applications by MDRC 8. Recommendation by MDRC to BC MEM Chief Inspector for approval of Project applications 9. Approval of Project applications by Chief Inspector 10. Approval of related permits by other government ministries
Depending upon the complexity of issues and the related mitigation planning, the availability of any required specialty consulting services, the ability for regulators to review and correspond with the proponent, and the workload of government authorities, it is estimated that the total time required from draft Project description to approval of the Project application by the Chief Inspector and others is between 10 to 12 months.
It may be possible to shorten the total time required with acute attention to AIR details, and the proactive collection of environmental, First Nations, and community information required for an expedited review process. With this approach, it may be possible to reduce the total approval timeline by several months.
The Project development timeline may be extended for reasons of issue complexity, regulator availability, and First Nations or community concerns.

PRELIMINARY ECONOMIC ASSESSMENT FOR THE DEER HORN PROPERTY
DEER HORN CAPITAL PAGE 139
The Project is expected to recover 656 kt of ore at a production rate of approximately 74,000 tonnes mill feed/yr, during a May to November operating season. Mine facilities will be shut down during winter months. Ore processing will be done on site with a conventional floatation process. No permanent facilities will be constructed on site, no living accommodations are planned, and the Project life is expected to be nine years.
Reclamation of the site will be done concurrently with mining, as areas become dormant, and should be completed within two years of the cessation of mining.
20.2 PROVINCIAL PROCESSES
The Mines Act process works with First Nations, other government agencies, and possibly the public to ensure mine projects are developed in a sustainable manner. The process examines projects for potentially adverse environmental, economic, social, health, and heritage effects that may occur during the lifecycle of these projects.
Public participation in a mine application process helps to ensure that community values and public goals for community development are considered in project planning and decision-making and may be an important component of permitting. The MDRC may recommend some form of public awareness and opportunity for input, such as a public open house presentation, in one or more of the local communities.
The Deer Horn Project proponent may be able to shorten the approval timeline by several months or more, with early and clear Project descriptions, and early consultation and engagement with government agencies, community, non-government organizations (NGOs), First Nations and stakeholders.
Once issued, the Mines Act small mine approval remains in effect for the life of the Project, unless suspended or cancelled by the Minister of MEM for non-compliance with permit conditions. Approvals often also contain a deadline from date of issuance to substantial start.
If a BCEAA process is required, application costs and approval timelines will be increased by several million dollars and several years.
A significant aspect of permit application for the Deer Horn Project will include the need for an acceptable Mine and Reclamation Plan, an Environmental Management System, a Sediment Control and Water Management Plan, and a Mine Abandonment Plan. Other specific Environmental Plans may include Fish Habitat Mitigation, Wildlife Habitat Mitigation, Access Management, Selenium Management, Special Waste Management, ARD/ML Management Plans, and others.
Some of the Provincial permits and approvals that may apply to the Deer Horn Project include the
• Drinking Water Protection Act • Energy Efficiency Act • Environmental Management Act (including wastes and contaminated sites authorizations) • Fish Protection Act • Forest and Range Practices Act • Forest Practices Code of BC Act • Health, Safety and Reclamation Code for Mines in BC • Heritage Conservation Act

PRELIMINARY ECONOMIC ASSESSMENT FOR THE DEER HORN PROPERTY
DEER HORN CAPITAL PAGE 140
• Archaeological permitting and registries • Hydro and Power Authority Act • Land Act • Crown Land tenure applications • Local Government Act • Mineral Tenure Act • Mines Act (including Mining and Reclamation Permits and Bonding) • Transport of Dangerous Goods Act • Transportation Act • Utilities Commission Act • Water Act • Water Protection Act • Water Utility Act • Wildlife Act
A concurrent process for obtaining the necessary provincial and federal approvals and authorizations other than the Mines Act permit is also possible and can save permitting time before start-up. The concurrent process is assumed in the projected timelines discussed for the Deer Horn Project.
20.3 FEDERAL PROCESSES
Federal environmental assessments must be conducted prior to a project proceeding if:
• a Federal authority is the proponent of the project
• Federal funds are involved
• the project involves land in which a Federal authority has an interest
• some aspect of the project requires Federal approval or authorization
One possible Federal approval trigger might be the potential impact on fish-bearing streams, requiring a Federal authorization.
It is unclear at this stage of the Deer Horn Project definition whether a Federal EA process will be triggered as project details have not been sufficiently developed.
Federal assessments will likely focus on areas of particular interest to the Federal authorities such as species at risk, effects of accidents and malfunctions, effects of the environment on the project, effects of the project on the capacity of renewable resources, cumulative effects, and First Nations engagement and consultation.
The additional cost of a Federal EA process could add $2 million or more to costs, as well as at least one to two years of approval time. Additional costs of monitoring, mitigation and decommissioning may also be required during operations.
The Project proponents should be diligent in considering mine plan alternatives and details that do not require Federal approvals triggering the full CEAA process.

PRELIMINARY ECONOMIC ASSESSMENT FOR THE DEER HORN PROPERTY
DEER HORN CAPITAL PAGE 141
Federal permits and approvals that still may be required are included in the following:
• Canadian Environmental Protection Act
• Fisheries Act
• Migratory Birds Convention Act
• Navigable Waters Protection Act
• Species at Risk Act
• Transportation of Dangerous Goods Act
• Canadian Environmental Assessment Agency Registry
• Canadian Transportation Agency
• Environment Canada, including the Canadian Wildlife Service and Species at Risk requirements
• Indian and Northern Affairs Canada
• Fisheries and Oceans Canada Species at Risk, including Species at Risk requirements
• Health Canada requirements
• Natural Resources Canada
• Transport Canada requirements
• Explosives Act
20.4 LOCAL AND REGIONAL PROCESSES
20.4.1 REGIONAL LAND USE PLANNING
The Deer Horn Project falls within the administrative boundary of the Nadina Forest District of the Northern Interior Forest Region. The Project also falls within the administrative boundary of the Lakes District Land and Resource Plan Area (Lakes LRMP) for which a provincial government approved land use plan was adopted in January 2000. The Lakes LRMP is a consensus built land use plan that directs the management of resources by land managers, resource proponents and resource agency staff. All land use and resource management within the Lakes LRMP are subject to existing legislature, policies and regulations for Crown land and resource management.
The proposed Deer Horn Project lies within the area zoned as Mineral/Wildlife Management Zone, a description of which is summarized in the Lakes LRMP as “…to provide opportunity for mineral exploration and development while giving consideration to wildlife values present in the zone.”
The adjacent Tweedsmuir North Provincial Park and Tweedsmuir South Provincial Parks form one of BC’s largest parks, created in 1938. Land use within park boundaries is regulated by the Tweedsmuir Master Plan, which was released to the public in 1988. The park protects a number of ecosystems. Backcountry hiking, fishing and camping opportunities exist for park visitors. Project development planning, including mining and access development and use, will need to consider the unique values of the park and its users, due to its proximity.

PRELIMINARY ECONOMIC ASSESSMENT FOR THE DEER HORN PROPERTY
DEER HORN CAPITAL PAGE 142
20.4.2 LOCAL LAND USE PLANNING
The Project may require some zoning modifications by local communities and the Regional District, consistent with the practice of the other local mines to allow for mining and related activities.
Due to the proximity to the Tweedsmuir Parks, wildlife and fisheries values, and the public and commercial use of the area, it is likely that impact management and communication with potentially effected First Nations and stakeholders will require significant time and resources.
Other licensed land use tenures in the Deer Horn Project area include mineral resources, forest resources, registered trap lines, guide outfitter areas, and commercial recreation areas. All current tenure holders would require consultation and possible accommodation as a result of impacts to their operations. The general area is presently very active with forest harvesting operations.
Non-tenured land use in and adjacent to the project area include hiking, camping, boating, hunting, fishing, skiing, and motorized recreation with ATVs and snowmobiles.
The time and cost for coordination with the Regional and Local Plans are included in the permitting timelines and the cost of permitting process.
It is anticipated that the following list of government agencies will be involved in project communications in some form:
• Canadian Environmental Assessment Agency (likely to confirm that no EA is required) • Fisheries and Oceans Canada (“DFO”) • Environment Canada • Natural Resources Canada • Health Canada • BCEAO (likely to confirm that no EA is required) • BC MoE • BC Ministry of Forests, Lands and Natural Resource Operations • BC MEM • BC Ministry of Community, Sport and Cultural Development • BC Interior Health Authority • Identified local First Nations • Local Regional District • Local communities including Smithers and Burns Lake
20.5 ENVIRONMENT
The required components of the Mines Act Project application include;
1. Baseline information
2. Mine plan
3. Plan for environmental protection
Background studies, including at least one year of environmental monitoring, are usually required, but this may vary, depending upon the existing data base and the significance of the component.

PRELIMINARY ECONOMIC ASSESSMENT FOR THE DEER HORN PROPERTY
DEER HORN CAPITAL PAGE 143
It is assumed that individuals and professional organizations are available with the expertise and time to conduct the appropriate studies.
Significant environmental study components include, but are not limited to the following, and may also be the subject of cumulative effects studies as required.
Water
The Deer Horn Project is adjacent to Lindquist Lake which flows into Whitesail Lake, then into Kenney Lake and Ootsa Lake approximately 70 kilometres to the northeast. Lindquist Lake and its tributaries have characteristically clean waters, with the exception of the small stream running through the mineralized zone on the property. Water quality is likely representative of other area streams with industrial resource extraction activities such as forest harvesting and mining.
Some background data and information on water quality and temperature is available from existing studies, but baseline studies for the Deer Horn property may need to be conducted for a minimum of one year to assess water quality, biota and habitat.
Mine and related disturbances are located to avoid direct disturbance of streams with construction offsets, bridges, clean water diversion ditches and exfiltration ponds. Studies of the potential issues of sediment, ARD/ML, selenium management and other issues that exist at similar mines will be required, and mitigation measures put in place as necessary.
Significantly, the Deer Horn Project does not include any rock drains and is relatively small and temporary in nature relative to other BC metal mines.
Previous studies (See section 4.6.2) indicated that preliminary ABA sampling and analysis has been conducted for hangingwall and footwall rocks and there are no anticipated ARD/ML concerns.
All mine disturbances will be reclaimed within two years of cessation of mining. The proposed Deer Horn mine disturbances are not expected to have a significant impact on water resources with the implementation of acceptable mitigation plans.
Air
The general Project area has been periodically active for mining exploration and forest harvesting, and several forest and resource exploration roads in the area can contribute to air borne dust emissions. No permanent residents are in the local area, and recreational use is limited.
Background air quality in the area is expected to be very good. A minimum of one year of baseline air quality analysis of dustfall, suspended particulate, SOx and NOx may be required.
Mitigation measures to protect air quality include mine site traffic dust control, early reclamation of disturbed areas, and containment of ore concentrate in haulage trucks and barges being moved from the mine site.
Fisheries
Lindquist Lake and its tributary streams contain several species of fish, including rainbow trout, Kokanee and mountain whitefish. These species are important components of both public and commercial recreation in the project area.

PRELIMINARY ECONOMIC ASSESSMENT FOR THE DEER HORN PROPERTY
DEER HORN CAPITAL PAGE 144
The ECOFOR study conducted in 2009 established baseline conditions for fisheries in the project area, however additional resources would be required to study the entire Project area in detail, as well as the expected impacts and mitigation measures needed to satisfy mine permitting conditions.
The Deer Horn Project does not directly impact Lindquist Lake but does possibly impact some tributary streams, which do not appear to be fish-bearing. Planned mine infrastructure, pits, and waste storage are designed to avoid impact by utilizing relatively low pile heights, clear span bridges over fish-bearing waters, and sediment collection ditches and ponds.
No significant impact to fisheries is anticipated from the proposed Deer Horn Project with diligent execution of mitigation and reclamation plans.
Wildlife
The Project area contains habitat for several species of wildlife. In summer and fall woodland caribou frequent the slopes of the Chikamin mountain ranges nearby. In other nearby areas mountain goats, mule deer, moose, black bear, grizzly bear, and wolves are in evidence. Small mammals such as hoary marmots, wolverines, and Siberian lemmings as well as various bird species, including willow ptarmigans, gray-crowned rosy finches, and golden-crowned sparrows, occur in nearby alpine meadows.
Elsewhere members of the grouse family occur in considerable numbers and waterfowl are usually plentiful in the swamps and ponds. Around the Nechako Reservoir, dead trees provide nesting sites for fish-hunting ospreys.
Significant resources will need to be applied to baseline and mitigation studies on all affected wildlife species to support the necessary environmental impact studies. Specific attention will be required on the subject of Caribou habitat and connectivity for wildlife values.
With early and well planned mitigation and reclamation of disturbances, it is anticipated that impacts to wildlife in the Project area will not be significant.
Hydrology
Lindquist Lake and its major tributaries near the Project area are not directly affected by the Deer Horn Project. Mine planning criteria will be required to ensure that waste rock and tailings containment facilities are designed to provide for high factors of safety against waste disposal and tailings pond failures.
Further hydrological studies in the Project area will be required for impact assessment applications.
As a result of planning and site management, it is anticipated that no significant impacts to the Project area hydrology will occur.
Noise and Visuals
The area of the Deer Horn Project hosts a wide variety of visual landscapes and is likely at a low background level for noise. Visitors utilizing the nearby parks and local area would be considered as one of the potentially impacted groups, requiring both consultation and potential mitigation measures.
Further studies on both noise and visual impacts will be required for environmental impact assessments.

PRELIMINARY ECONOMIC ASSESSMENT FOR THE DEER HORN PROPERTY
DEER HORN CAPITAL PAGE 145
Due to the relatively small size of the proposed pit and spoil area, and the temporary nature of the disturbances, the overall impact of noise and visuals is expected to be minimal, with mitigation measures.
Land and Resource Use
The land uses as described above provide a strong framework for inclusion of identified features significant to the Deer Horn Project. The inclusion of planning components such as Old Growth Strategies, Biodiversity Emphasis and Connectivity will support planning, mitigation, operational, and closure activities.
Land use will be incorporated into the Reclamation and Abandonment Plan and will be required to address previously existing land use on a property average basis.
It is anticipated that the Deer Horn Project will be compatible with the objectives of regional and local land use plans.
Archaeological and Heritage Resources
The Deer Horn Project area may have been utilized by First Nations before contact with Europeans and may contain archaeological and heritage resources.
Detailed studies on the existing and potential resources within the Project area need to be conducted and will require assessment by archeologists.
Given the high forest harvesting activity in the area, it is likely that some studies have been done near the Project area, and more focused work will be required to support potential impact studies. An archaeological overview assessment and preliminary field reconnaissance will guide initial planning, and archaeological impact studies, or other work may be required to delineate any cultural materials found and plan for their appropriate management. To the extent possible, local First Nations will be provided opportunity for involvement.
20.6 SOCIAL AND ECONOMIC
The MDRC may recommend some form of public participation in the Mines Act permitting process. One likely outcome would be the requirement for an open house presentation by the Project proponent in local communities to provide details of mining proposals, environmental mitigation plans, economic impacts, employment opportunities, and impacts upon local communities.
The estimated cost and time for social and economic impact reviews is $50,000, also done concurrently with Project applications.
The Project proponent will be required to have safety and health policies consistent with government requirements and at a standard to maintain a skilled workforce. A commitment to sustainability governance will also be an asset to maintaining the necessary social license to operate in the area with local community support.
Benefits of the Project include direct and indirect employment, local spending by the mine operation, contractors and employees, and significant contributions to local, regional, provincial, and Federal taxes.
A policy of local spending and local employment practices for area residents is recommended, as is a policy to attract, train and retain First Nations employees and contractors.
PRELIMINARY ECONOMIC ASSESSMENT FOR THE DEER HORN PROPERTY
DEER HORN CAPITAL PAGE 146
20.7 STAKEHOLDER IDENTIFICATION
Stakeholders with an interest in the Project should be identified early in the permitting process, so that their input may be considered and applied where appropriate.
It is recommended that engagement with identified stakeholders by the Project proponent be initiated as soon as possible. Regional planning tables, government review committees, local government, businesses, community, and NGOs groups are examples of such stakeholders.
20.8 ENGAGEMENT AND CONSULTATION
Once stakeholders have been identified, early communication with them is recommended.
Communication should begin as early as reasonably practicable, and should increase accordingly, once a final Project description is generated. Meaningful dialogue with stakeholders will improve project timelines, reduce unnecessary costs, and enhance the probability of required Project approvals.
The Company has met with municipal representatives of Smithers and Burns Lake in February 2013 introducing itself and the Project.
20.9 FIRST NATIONS CONSULTATION AND ENGAGEMENT
An important component of Project approval will be the fulfillment of the government of its requirement to consult, and accommodate if necessary, the Project impact to potentially impacted First Nations communities. Although consultation is the duty of government, certain aspects of the consultation process can, and will likely be, delegated to the Project proponent.
20.9.1 CONSULTATION
The Proponent’s consultation should be focused on developing a full understanding of First Nations’ aboriginal rights and interests in the Project area. The consultation will provide the Province with information to evaluate the relationship between the Project and such rights and interests.
20.9.2 ENGAGEMENT
Depending upon the specifics of the consultation process, and if any accommodation of impacts to the effected First Nation is determined, a plan for engagement would be developed and implemented. It may be of mutual benefit to the parties that Memorandums of Agreement, Impact Benefit Agreement or other mechanisms be used to ensure efficient project development, minimize impacts, and maintain good working relationships.
The Company has been in communication with First Nations who assert aboriginal rights in and around the Deer Horn property. Communications with First Nations commenced in 2009 and are comprised of meetings in Smithers, Burns Lake, and surrounding locales to provide updates on the company’s exploration plans and activities. The Company views its relationship with First Nations as amicable.
When feasible, the Company has retained First Nations’ businesses to provide assistance in carrying out exploration activities. As the Deer Horn Project develops, it is anticipated that there will be increased opportunities for First Nations businesses and their members to provide goods and services to the

PRELIMINARY ECONOMIC ASSESSMENT FOR THE DEER HORN PROPERTY
DEER HORN CAPITAL PAGE 147
company. The Company also supported local First Nations with a monetary contribution to the trust fund to assist workers and their families who have suffered from the tragic Burns Lake mill fire in 2012.
As the Deer Horn Project advances, the Company expects to enter into benefit agreements with First Nations communities in recognition of their aboriginal rights and title. The Company has also received a positive response from one First Nation that it will consider investing in the Project as it becomes progressively developed. Equity participation by First Nations in the Project is viewed as an important indicium of the First Nations’ support.
It is estimated that $50,000 is required for consultation with First Nations, not including the negotiation costs of any resultant benefit agreements.
Time requirements for the process of First Nations engagement are difficult to estimate without more details of Project impacts and identified interests, but are estimated to be at least equal to, and done concurrently, with the Project application process.

PRELIMINARY ECONOMIC ASSESSMENT FOR THE DEER HORN PROPERTY
DEER HORN CAPITAL PAGE 148
21.0 CAPITAL AND OPERATING COSTS 21.1 CAPITAL COST ESTIMATE
Capital cost estimates are derived from a combination of MMTS experience in similar projects and consultation with contractors and equipment suppliers. The estimated capital costs breakdowns are shown in Table 21-1. All currencies in this section are expressed in Canadian dollars.
The expected accuracy range of the capital cost estimate is +/- 30 %.
Table 21-1 Deer Horn Capital Cost Estimate
Capital ($ Millions)
Direct Capital Cost Mining 3.6
Process 7.2 Tailings and Water Management 2.3 Infrastructure 6.5 Total Direct Capital Costs 19.6
Indirect Capital Cost Owner’s Costs 1.4
Indirects 2.6 Total Indirect Capital Cost 4.0 Contingency (20 %) 4.7 Total Capital 28.3
The capital costs include delivery to the site and assembly but do not include the following:
• Force majeure • schedule delays such as those caused by
o major scope changes o unidentified ground conditions o labour disputes o environmental permitting activities o abnormally adverse weather conditions
• cost of financing (including interests incurred during construction) • HST • royalties • cost of this study • sunk costs
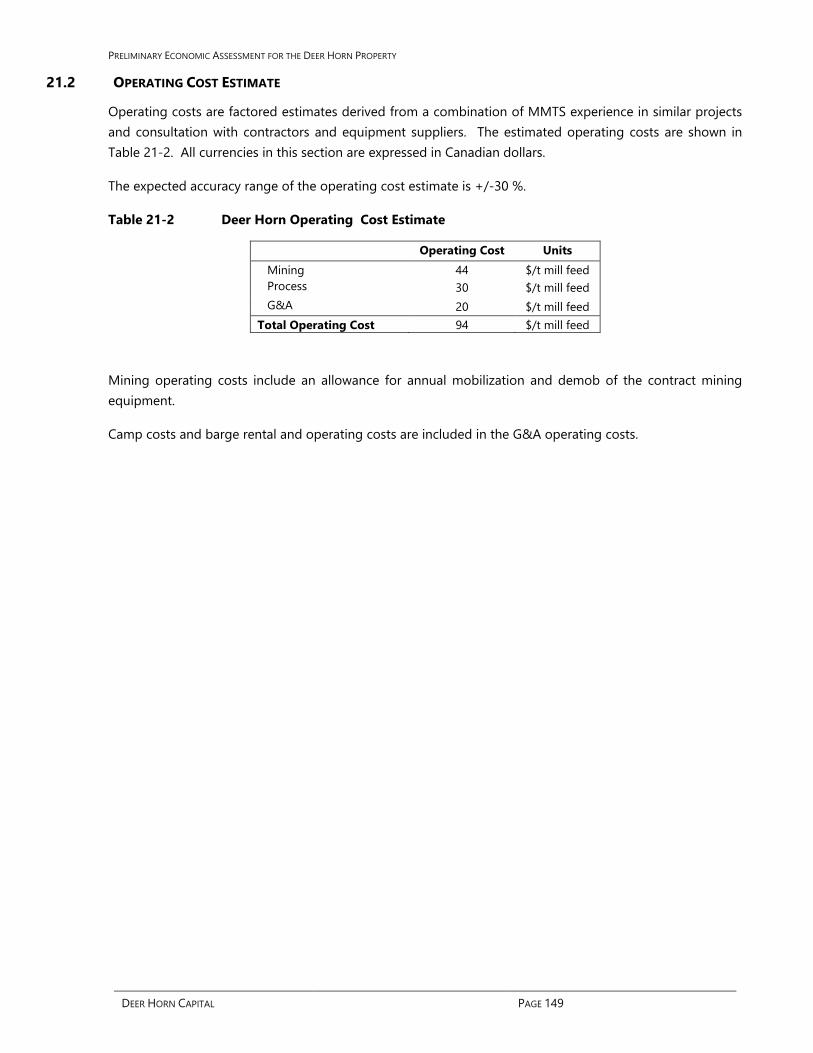
PRELIMINARY ECONOMIC ASSESSMENT FOR THE DEER HORN PROPERTY
DEER HORN CAPITAL PAGE 149
21.2 OPERATING COST ESTIMATE
Operating costs are factored estimates derived from a combination of MMTS experience in similar projects and consultation with contractors and equipment suppliers. The estimated operating costs are shown in Table 21-2. All currencies in this section are expressed in Canadian dollars.
The expected accuracy range of the operating cost estimate is +/-30 %.
Table 21-2 Deer Horn Operating Cost Estimate
Operating Cost Units Mining 44 $/t mill feed Process 30 $/t mill feed G&A 20 $/t mill feed Total Operating Cost 94 $/t mill feed
Mining operating costs include an allowance for annual mobilization and demob of the contract mining equipment.
Camp costs and barge rental and operating costs are included in the G&A operating costs.
PRELIMINARY ECONOMIC ASSESSMENT FOR THE DEER HORN PROPERTY
DEER HORN CAPITAL PAGE 150
22.0 ECONOMIC ANALYSIS The results of the economic analyses discussed in this section represent forward looking information as defined under Canadian securities law. The results depend on inputs that are subject to a number of known and unknown risks, uncertainties and other factors that may cause actual results to differ materially from those presented here.
Information that is forward-looking includes:
• Mineral Resource estimates;
• Assumed commodity prices and exchange rates;
• The proposed mine production plan;
• Projected recovery rates;
• Sustaining costs and proposed operating costs;
• Assumptions as to closure costs and closure requirements;
• Assumptions as to environmental, permitting and social risks.
Additional risks to the forward-looking information include:
• Changes to costs of production from what is assumed;
• Unrecognized environmental risks;
• Unanticipated reclamation expenses;
• Unexpected variations in quantity of mineralised material, grade, or recovery rates;
• Geotechnical and hydrogeological considerations during mining being different from what was assumed;
The economic evaluation of the Deer Horn Project includes one year of construction and 9-years of mining and milling. Corporate sunk costs including costs for exploration, technical studies, and permitting, are excluded from the initial capital but have been considered in the estimation of tax depreciation pools.
The inferred material included in the preliminary economic analysis is considered too speculative geologically to have the economic considerations applied to them that would enable them to be categorized as mineral reserves, and there is no certainty that the preliminary economic assessment will be realized.
Offsite charges and Smelter Term assumptions are summarized in Table 22-1.

PRELIMINARY ECONOMIC ASSESSMENT FOR THE DEER HORN PROPERTY
DEER HORN CAPITAL PAGE 151
Table 22-1 Offsite Costs and Smelter Terms
Gold Refining Cost 10 US$/Oz Silver Refining Cost 0.60 US$/Oz Tellurium Refining Cost 10.0 US$/kg Payable Gold 99.5 % Payable Silver 90 % Payable Tellurium 90 % Copper Concentrate Deduction 1% Copper Refining 0.10 US$/lb Zn Payable 85% Zn Refining 0.10 US$/lb Concentrate Smelter Charge 100 US$/Dry Tonne Concentrate Truck Freight $50/Wet Tonne Concentrate Ocean Freight $80/ Wet Tonne Other Offsite Costs (Losses, Insurance, Selling ,Assay) $20/ Wet Tonne
The Deer Horn economic evaluation is summarized in Table 22-2.
Table 22-2 Economic Results for Price Case Scenarios
Item Unit Value Gold Price US$/Oz $1,300 Silver Price US$/Oz $17 Tellurium Price US$/kg $100 Copper Price US$/lb $3 Zinc Price US$/lb $1 Currency exchange rate C$:US$ 0.79 Pre-Tax NPV (5%) C$ M $56.6 Post-Tax NPV (5%) C$ M $36.5 Pre-Tax IRR % 56% Post-Tax IRR % 42% Pre-Tax Payback Years 1.3 Post Tax Payback Years 1.6 LOM Gold Production Oz 72,560 LOM Silver Production Oz 2,144,014 LOM Tellurium Production kg 66,722 LOM Copper Production lb 1,680,919 LOM Zinc Production lb 3,633,269
Tax assumptions include:
• Federal income tax rate of 15% • Provincial income tax rate of 11% • BC Mineral Tax:
o 2% net proceeds tax o 13% net revenue tax
Annual cashflow results are shown in Table 22-3.

PRELIMINARY ECONOMIC ASSESSMENT FOR THE DEER HORN PROPERTY
DEER HORN CAPITAL PAGE 152

PRELIMINARY ECONOMIC ASSESSMENT FOR THE DEER HORN PROPERTY
DEER HORN CAPITAL PAGE 153
Table 22-3 Deer Horn Cash Flow Summary
Year -1 1 2 3 4 5 6 7 8 9 10 Total Production
Au Produced Oz
12,919 7,804 8,731 6,471 6,019 8,755 7,780 7,923 6,158 - 72,560 Ag Produced Oz
395,650 291,444 264,322 171,536 117,291 191,283 228,397 275,028 209,062 - 2,144,014
Te Produced kg
10,175 8,907 8,332 5,691 4,335 6,667 6,816 8,987 6,813 - 66,722 Cu Produced lb 261,025 293,653 195,768 81,570 65,256 81,570 195,768 309,967 196,342 - 1,680,919 Zn Produced lb 538,363 587,305 538,363 244,711 146,826 130,512 326,281 685,190 435,717 - 3,633,269
Net Revenue $ million
30.21 20.34 20.79 14.49 12.44 18.38 18.23 20.40 15.47 - 170.75 Operating Costs
Mining $ million
2.20 2.35 3.58 3.50 3.50 3.50 4.14 4.23 1.82 - 28.81 Processing $ million
2.22 2.22 2.22 2.22 2.22 2.22 2.22 2.22 1.83 - 19.59
G&A $ million
1.48 1.48 1.48 1.48 1.48 1.48 1.48 1.48 1.22 - 13.06 Total Operating Costs $ million
5.90 6.05 7.28 7.20 7.20 7.20 7.84 7.93 4.87 - 61.46
Capital Cost $ million 28.30 0.28 0.28 0.28 0.28 0.28 0.28 0.28 0.28 0.28 -
1.33 29.52 Pre Tax Cashflow $ million -28.30 24.03 14.00 13.23 7.01 4.97 10.90 10.10 12.19 10.32 1.33 79.77 Taxes $ million - 1.56 3.62 3.30 2.04 3.12 3.71 4.08 3.94 1.37 0.13 16.69 Post Tax Cashflow $ million -28.30 22.47 10.39 9.93 4.97 1.85 7.19 6.02 8.25 8.95 1.20 63.07

PRELIMINARY ECONOMIC ASSESSMENT FOR THE DEER HORN PROPERTY
DEER HORN CAPITAL PAGE 154
22.1 ECONOMIC SENSITIVITY ANALYSIS
Sensitivity of NPV at 5 % discount rate to the major cash flow inputs are shown graphically in Figure 22-1. Project NPV is most sensitivity to metal prices and foreign exchange rate assumption and less sensitive to capital cost. Sensitivity to metal grades is reflected by the sensitivity to price assumption.
Figure 22-1 Deer Horn After Tax Economic Sensitivity Analysis

PRELIMINARY ECONOMIC ASSESSMENT FOR THE DEER HORN PROPERTY
DEER HORN CAPITAL PAGE 155
23.0 ADJACENT PROPERTIES There is no information in this report pertaining to adjacent properties. The present mineral claim disposition is identified in the section above.

PRELIMINARY ECONOMIC ASSESSMENT FOR THE DEER HORN PROPERTY
DEER HORN CAPITAL PAGE 156
24.0 OTHER RELEVANT DATA AND INFORMATION To the authors’ knowledge, there are no other relevant data or information available for the Deer Horn property.

PRELIMINARY ECONOMIC ASSESSMENT FOR THE DEER HORN PROPERTY
DEER HORN CAPITAL PAGE 157
25.0 INTERPRETATION AND CONCLUSIONS The 2011 exploration program expanded upon the results of earlier and historic exploration campaigns on the Deer Horn property. In 2011, diamond drilling (55 NQ2 diameter diamond drillholes with an aggregate length of 3,772.5 m) took place over an 875 m strike length of the vein system. This work partly defined the extent of the Main Vein and associated Contact Zone that together comprise the Deer Horn deposit. The deposit remains open to the west, to the east and down-dip and there are several internal gaps that require drilling.
Prospecting, trenching and limited diamond drilling also confirmed the presence of important concentrations of scheelite (tungsten) mineralization on the property. The elevated levels of tungsten occur in the vicinity of the historic Harrison Scheelite mineral occurrence and locally in drill core over an east-west distance of at least 550 m. The mineralization appears to be particularly concentrated in altered sedimentary rocks in the footwall of the regional thrust (and Contact Zone). Additional exploration of the tungsten is recommended.
An updated resource estimate was produced from a database containing 196 diamond drillholes and 42 surface samples. Geologic solids were built to constrain the Main and Footwall veins, and the Contact Zone. Assays were sorted into these three domains and capped for gold, silver and tellurium to reduce the effects of several outlier samples. Composites one m in length were formed and semivariograms were produced to determine the grade continuity within the various domains. Grades for gold, silver and tellurium were interpolated into the Main and Footwall veins by ordinary kriging using composites from the appropriate vein. Grades for gold, silver and tellurium for the Contact Zone were estimated by a combination of ordinary and indicator kriging. Estimated blocks were classified as Indicated or Inferred based on grade continuity. The results within the mineralized zones at a 1 g/t Au cut-off outlines 414,000 tonnes at an average grade of 5.12 g/t Au and 157.5 g/t Ag and 160 ppm Te classed as indicated and an additional 197,000 tonnes averaging 5.04 g/t Au, 146.5 g/t Ag and 137 ppm Te classed as Inferred.
It is the authors’ opinion that the Deer Horn property merits infill and tightly-spaced step-out diamond drilling focussed both on upgrading and expanding the existing resource. Secondarily, several untested areas adjacent to existing resource blocks and evaluation of the gold-silver vein system along strike to the west and to the east beyond the limits of the 2011 drilling campaign should be contemplated.
A positive preliminary economic assessment of a 656 kt pit delineated resource mine plan has been developed for the Deer Horn property showing positive economics. The mine plan is a summer seasonal operation to avoid high snowfall winter conditions.
The Deer Horn Project as described meets the minimum requirements for a Small Mine permit application under the Mines Act of BC. There is no guarantee that the permit application will be allowed to proceed as Small Mine under the Mine Act of BC.
The proposed mine has a relatively small footprint and low expected environmental impact.
Preliminary ABA sampling and analysis of hangingwall and footwall rocks indicate that there are no anticipated ARD/ML concerns. This will be verified in future studies.
PRELIMINARY ECONOMIC ASSESSMENT FOR THE DEER HORN PROPERTY
DEER HORN CAPITAL PAGE 158
The environmental and related studies and Mines Act’s small mine permit application are estimated to take less than one year to complete, once the Project has been fully defined.
Despite the proximity of nearby protected areas, the Deer Horn Project is located near areas that have significant industrial activity including the damming of the Nechako River and reversing its flow to create the Nechako Reservoir to generate electricity for the Kitimat, aluminum smelter. Proposed impacts to fish, wildlife and water do not appear to be significant, and First Nations engagement appears to be positive. Community support is anticipated as the area has similar mining activities in the vicinity of the proposed mine, and economic and employment opportunities are expected.

PRELIMINARY ECONOMIC ASSESSMENT FOR THE DEER HORN PROPERTY
DEER HORN CAPITAL PAGE 159
26.0 RECOMMENDATIONS The Deer Horn Project should be advanced to a preliminary feasibility study (“PFS”) level in two phases. Phase 1 includes additional surface mapping and exploration drilling. Phase 2 includes a preliminary feasibility study with recommended mining, metallurgical and tailings management related test work.
The following items are recommendations as a part of advancing the study to PFS level and are estimated to cost $4 to $5 million.
26.1 RESOURCE MODELING
It is recommended that exploration of the Deer Horn property continue and consist of:
• Detailed structural mapping of surface showings, underground workings and a review of the 2009 and 2011 drill core. The estimated cost for structural mapping is approximately $30,000.
• A systematic diamond drilling program (of approximately 3,900 m of drilling from up to 28 drill sites) targeting the near surface, high-grade gold-silver-tellurium potential of the Main vein, the bulk tonnage gold-silver-tellurium potential offered by the Contact zone, and several precious-metal targets that lie contiguously west of the current resource. The estimated cost for the drilling program is approximately $2,000,000.
• Further assessment of the significant tungsten showings located primarily west of the Deer Horn adit, with follow-up trenching and/or diamond drilling should results warrant. It is recommended that two or more certified tellurium reference standards be developed in order to provide an increased level of quality control and quality assurance for data generated by future exploration programs. The estimated cost for this assessment of the tungsten showings is approximately $150,000.
• Completion of an environmental baseline assessment of the property, and examination of the suitability of several areas proposed for construction of infrastructure that would be in support of the submitted bulk sample permit application. The estimated cost is approximately $100,000.
It is recommended that DHC proceed with the program as early as possible in 2018 to allow for the ten to twelve week program to be completed prior to the onset of winter conditions. Following completion of the fieldwork, all existing data should be compiled, and a revision of the existing NI 43-101 mineral resource estimate should be completed.
The overall estimated cost for the above proposed program is $2.3 million.
26.2 MINING
MMTS recommends that the project proceed to further mine planning of the potential open pit with the following specific studies. These recommendations are not necessarily contingent on positive results from previous phases but reflect the ongoing level of detail required to advance the project, leading to eventual construction and operational level designs. Mine planning work will cost between $300,000 and $400,000 depending on the results of future exploration and geological modeling, pit geotechnical studies, bench marking studies, mine waste management studies, mine reclamation planning, and closure planning.

PRELIMINARY ECONOMIC ASSESSMENT FOR THE DEER HORN PROPERTY
DEER HORN CAPITAL PAGE 160
Specific mine plan recommendations for the ongoing studies are as follows:
• Geotechnical evaluations of the open pit.
• Topsoil assessment is required to estimate the top soil storage requirements.
• Alternative waste storage closer to the pits should be considered to minimize mining cost.
• Areas where the starter pits are located have shallow and substantially higher grades than the rest of the deposit. These high grade areas have had a significant positive impact on the project economics. These areas are priority targets for upgrading the resource class from Inferred to Measured and Indicated. Expanding these shallow high grade zones could potentially significantly improve the project economics.
• Drill and blast operation characterization of both waste and ore rocks.
• Further engagement with potential contractors for mine operations.
• Alternative Explosive storage and magazines locations should be examined.
26.3 PROCESSING
• It is recommended that future process test work collect concentrate product for evaluation by potential buyers.
• A gravity concentration stage ahead of the flotation plant could add significant value to the overall process by further upgrading the final concentrate while saving energy in primary grinding, or potentially producing a precious metal concentrate.
• A wider range of representative samples of the potentially mineable zones should be used in future metallurgical test programs. These samples need to be tested by a combination of gravity concentration and flotation. Evaluating gravity concentration under a wide range of primary grinding sizes could potentially help save in grinding operating cost. Attempts should be made to separate the production into a precious metals concentrate, and a base metals concentrate.
• Future process test work should include evaluation of Tellurium recoveries.
A Pre-feasibility level metallurgical test work plan addressing above recommendations would cost approximately $200,000 to $250,000.
26.4 ENVIRONMENTAL STUDIES, PERMITTING AND SOCIAL OR COMMUNITY IMPACT
It is recommended that, in addition to further exploration of the Deer Horn property, the following activities also take place:
• Continue engagement with First Nations.
• Develop a list of potentially affected stakeholders.
• Initiate discussions with appropriate regulators.

PRELIMINARY ECONOMIC ASSESSMENT FOR THE DEER HORN PROPERTY
DEER HORN CAPITAL PAGE 161
• Develop a stakeholder engagement process.
• Complete the Project definition.
• Initiate a gap analysis of the environmental studies required for permitting.
• Refine Environmental study and Permitting Plan.
• Initiate background environmental studies.
• Map regulatory process.
• Engage stakeholders in detailed discussions.
• Develop a TOC for the Mines Act small mine permit application for regulator review and comment.
• Develop a closure plan that will meet the end land use objectives and satisfy the regulatory commitments.
Assuming no Provincial EA Process is required, the estimated permitting program cost is $750,000 to $1,000,000.
26.5 INFRASTRUCTURE
The overall estimated cost for the proposed infrastructure studies is $500,000 and include allowance for the following studies:
• A weather study is required to update the expected seasonal operating window.
• A terrain hazard assessment,
• An avalanche study is required to determine what areas of the mine can be used for long term storage of equipment to minimize the seasonal mobilization and demobilization.
• A site water balance is required to determine water needs.
• Waste and tailings geotechnical assessments are required.
• Waste rock characterization study is required to assess ARD/ML potential from waste rock.
• Geotechnical assessment of ground conditions at the process plant area.
• A site hydrology study is required.
• A site access audit is required to confirm the existing access road suitability and potential costs for using forestry roads in the vicinity. Maximum loads and widths of the site access route should be examined to determine if any access road upgrades are required. The cost of upgrading the site access road requires examination.
26.6 MARKET STUDIES
A market study is required to confirm smelter terms and is estimated to cost $50,000.

PRELIMINARY ECONOMIC ASSESSMENT FOR THE DEER HORN PROPERTY
DEER HORN CAPITAL PAGE 162
27.0 REFERENCES Baase, A. (1989): Lindquist Lake Potential – Revision 1; Private report prepared for Equity Silver Mines Ltd., 4 pages.
Bacon, W.R. (1956): Harrison Gold (Deer Horn Mines Ltd.), Minister of Mines, B.C., Annual Report, 1955, p. 25-27.
Bentzen, A. and A.J. Sinclair (1993): P-RES – a computer program to aid in the investigation of polymetallic ore reserves; Tech. Rept. MT-9, Mineral Deposit Research Unit, Department of Geological Sciences, University of British Columbia, 55 pages.
Buckles, H.R. (1954): The Deer Horn Property, Western Miner and Oil Review, November 1954 pp. 82-85
Bysouth, G.D. and Wong, G.Y. (1995): The Endako molybdenum mine, central British Columbia: An update; In Porphyry Deposits of the Northwestern Cordillera of North America; Edited by T.G. Schroeter, Canadian Institute of Mining, Metallurgy and Petroleum, Special Volume 46, p 697-703.
Childe F. and Kaip, A. (2000): Assessment Report for Surface Work on the Deer Horn Mine Property; BC Ministry of Energy, Mines and Petroleum Resources; Prepared for Guardsmen Resources Inc, Assessment Report 26419.
Clarke, W.G. (1968): Harrison (The Granby Mining Company Limited); Minister of Mines, B.C., Annual Report, 1967, p. 114.
Coffin, D. and Renning, M. (1990): Geophysical and Geochemical Assessment Report on the Red, Yellow and Guardsmen Groups of Mineral Claims, Prepared for Amber Minerals Ltd; BC Ministry of Energy, Mines and Petroleum Resources; Assessment Report 20135.
Cox, D.P. and W.C. Bagby (1986): Descriptive Model of Au-Ag-Te Veins; in Mineral Deposit Models, USGS Bulletin 1693, p. 124.
Diakow, L.J. and Koyanagi, V. (1988a): Stratigraphy and Mineral occurrences of Chikamin Mountain and Whitesail Reach Map Areas, BC Ministry of Energy, Mines and Petroleum Resources, Geological Fieldwork 1987, Paper 1988-1, pp. 155-168.
Diakow, L.J. and Koyanagi, V. (1988b): Geology of Chikamin Mountain Map Area, BC Ministry of Energy, Mines and Petroleum Resources, Open File 1988-2.
Duffell, S. (1959): Whitesail Map Area, British Columbia; Geological Survey of Canada, Memoir 299.
ECOFOR (2009): 2009 Baseline Study Conducted on the Deer Horn Property; prepared for Golden Odyssey Mining Inc., 131 pages. Folk, P.G. (1990a): Quarterly Progress Report and Assessment Report for Work Done in 1989 on the Deer Horn Mine Project, Lindquist Lake, Tweedsmuir Recreation Area (93E/6W), Omineca Mining Division, Prepared for Golden Knight Resources Inc; BC Ministry of Energy, Mines and Petroleum Resources; Assessment Report 19966. Folk, P.G. (1990b): Final report of work done in 1989 and 1990 on the Deer Horn Mine Project, Lindquist Lake, Tweedsmuir Recreation Area, 93E/6W, Omineca Mining Division, Unpublished report prepared for Golden Knight Resources Inc., October 30, 1990.
Hanson, D.J. (1992): 1991 Diamond Drilling on the Midnight Property Mineral Claims; Prepared for Equity Silver Mines Limited, BC Ministry of Energy, Mines and Petroleum Resources; Assessment Report 22432.
Holland, S.S. (1945): Whitesail Lake, Gold, Harrison; Minister of Mines, B.C., Annual Report, 1944, p. 176.
Holland, S.S. (1946): Whitesail Lake, Gold, Harrison; Minister of Mines, B.C., Annual Report, 1945, p. A71-A72.
Hawthorn, G. (2009): Deer Horn Project – Metallurgical Related Comments; Private memo to Golden Odyssey Mining Inc., 7 p.
Jackson, A. and Illerbrun, K. (1995): Huckleberry porphyry copper deposit, Tahtsa Lake district, west-central British Columbia; In Porphyry Deposits of the Northwestern Cordillera of North America; Edited by T.G. Schroeter, Canadian Institute of Mining, Metallurgy and Petroleum, Special Volume 46, p 313-321.
Joubin. F. (1950): Geological Report on the Harrison Group; BC Ministry of Energy, Mines and Petroleum Resources; Assessment Report 00050.
Lane, B. (2009): Summary Report on the Deer Horn Gold-Silver Project; Private report prepared for Golden Odyssey Mining Inc., 49 pages.
PRELIMINARY ECONOMIC ASSESSMENT FOR THE DEER HORN PROPERTY
DEER HORN CAPITAL PAGE 163
Lane, B. (2010): 2009 Diamond Drilling Report on the Deer Horn Project; BC Ministry of Energy and Mines; Assessment Report 31511, 284 pages.
Lane, B. (2012): 2011 Diamond Drilling Report on the Deer Horn Gold-Silver-Tellurium Property; BC Ministry of Energy and Mines; Assessment Report 33172, 749 pages.
Lane, B. and Giroux, G. (2010): Technical Report on the Deer Horn Gold-Silver-Tellurium Project; prepared for Golden Odyssey Mining Inc., 191 pages.
Lane, B. and Giroux, G. (2012): Updated Resource Estimate for the Deer Horn Gold-Silver-Tellurium Property; prepared for Deer Horn Metals Inc., 98 pages.
Lindner, J. and Jego, A. (2009): Magnetometer, 3DIP and Maxmin Electromagnetic Surveys on the Deer Horn Property; Logistical Report prepared for Golden Odyssey Mining Inc., 20 pages.
Papezik, V.S. (1957): Geology of the Deer Horn Prospect, Omineca Mining Division, British Columbia, Unpublished M.Sc. Thesis, The University of British Columbia, 85 pages.
Pezzot, E.T. (2010): Geophysical data review – Deer Horn Project; Private Memorandum prepared for Golden Odyssey Mining Inc., 8 pages.
Renning, M.D. (1990): Geochemical Survey and Prospecting Report on the Red, Yellow and Guardsmen Groups of Mineral Claims, Lindquist Lake Area, British Columbia; BC Ministry of Energy, Mines and Petroleum Resources; Assessment Report 21559.
Renning, M.D. (2008): 2007 Geochemical and Prospecting Report on the Deer Horn Property; Prepared for Christopher James Gold Corp., BC Ministry of Energy, Mines and Petroleum Resources, Assessment Report 29527.
Renning, M.D., Gifford, L. and Graham, L (2007): 2006 Geochemical and Prospecting Report on the Deer Horn Mine Property; Prepared for Christopher James Gold Corp., BC Ministry of Energy, Mines and Petroleum Resources, Assessment Report 28898.
Robert F. and Poulsen, H. (2001): Vein Formation and Deformation in Greenstone Gold Deposits; in Structural Control on Ore Genesis: Reviews in Economic Geology, Edited by Richards, J.P., Tosdal, R.M., Volume 14, pages 111-156.
Sinclair, A.J. (1974): Applications of probability graphs in mineral exploration; Spec. v. Association of Exploration Geochemists, 95 pages.
Sinclair, W.D. (1995a): Porphyry W; in Selected British Columbia Mineral Deposit Profiles, Volume 1, Metallics and Coal, Lefebure, D.V. and Ray, G.E., Editors, BC Ministry of Energy, Mines and Petroleum Resources, Open File 1995-20, pages 99-102.
Sinclair, W.D. (1995b): Porphyry Mo (Low-F-Type); in Selected British Columbia Mineral Deposit Profiles, Volume 1, Metallics and Coal, Lefebure, D.V. and Ray, G.E., Editors, BC Ministry of Energy, Mines and Petroleum Resources, Open File 1995-20, pages 91-94.
Woodsworth, G.J. (1978): Eastern Margin of the Coast Plutonic Complex in Whitesail Map-area, British Columbia; In Current Research, Part A, Geological Survey of Canada, Paper 78-1A, pages 71-75.
Woodsworth, G.J. (1979): Age Determinations and Geological Studies, K-Ar Isotopic Ages, R.K. Wanless, R.D. Stevens, G.R. Lachance and R.N. Delabio, Editors, Report A, Geological Survey of Canada, Paper 79-2, pages 21-22.
Woodsworth, G.J. (1980): Geology of the Whitesail Lake (93E) Map-area, Geological Survey of Canada, Open File Map 708.
Zhang, J., Zhang, Y., Richmond, W. and Wang, H. (2010): Processing Technologies for Gold-Telluride Ores; International Journal of Minerals, Metallurgy and Materials, Volume 17, Number 1, 10 pp.


![Preliminary study of [Ni(en)3] (CF3CO2)2 and Ni(en) (hfpd](https://img.dokumen.tips/doc/110x75/6200d2e4078f20693139d41a/preliminary-study-of-nien3-cf3co22-and-nien-hfpd-.jpg)


