Embed Size (px)
DESCRIPTION
NI 43-101 technical report on the Alberta 1 property rare element pegmatites in Galicia Spain.
Citation preview

SOLID RESOURCES LIMITED
ALBERTA-1
RARE METALS PROJECT
GALICIA, SPAIN
MINERAL RESOURCES
NI 43-101 TECHNICAL REPORT
Prepared By:
Stanley C. Bartlett, M.Sc., PGeo.
Micon International Co Limited
Suite 10 Keswick Hall, Norwich, NR4 6TJ, United Kingdom
23rd
May 2014

Solid Resources Ltd
Page
TABLE OF CONTENTS
1.0 SUMMARY 1 1.1 INTRODUCTION ....................................................................................................... 1 1.2 PROPERTY DESCRIPTION ...................................................................................... 1
1.3 OWNERSHIP .............................................................................................................. 2 1.4 DISCLAIMER ............................................................................................................. 2 1.5 HISTORY .................................................................................................................... 2 1.6 GEOLOGY AND MINERALISATION ..................................................................... 3 1.7 EXPLORATION AND DRILLING ............................................................................ 4
1.8 MINERAL PROCESSING AND METALLURGICAL TESTING ........................... 5 1.9 MINERAL RESOURCE ESTIMATE ......................................................................... 5 1.10 MINING AND MINERAL RESERVE ....................................................................... 6 1.11 CONCLUSIONS ......................................................................................................... 6
1.12 RECOMMENDATIONS ............................................................................................. 7
2.0 INTRODUCTION 9 2.1 TERMS OF REFERENCE AND PURPOSE OF THE TECHNICAL
REPORT ...................................................................................................................... 9 2.2 SCOPE OF WORK ...................................................................................................... 9
2.3 SOURCE OF INFORMATION ................................................................................... 9 2.4 QUALIFICATIONS OF THE CONSULTANT ........................................................ 10
2.4.1 General ............................................................................................................... 10 2.4.2 Micon International Limited .............................................................................. 10 2.4.3 Independence ..................................................................................................... 13
2.5 TECHNICAL REPORT USE .................................................................................... 13 2.6 UNITS AND CURRENCY ....................................................................................... 13
2.7 GLOSSARY .............................................................................................................. 13
2.8 ABBREVIATIONS ................................................................................................... 19
3.0 RELIANCE ON OTHER EXPERTS 21
4.0 PROPERTY DESCRIPTION AND LOCATION 22 4.1 LOCATION ............................................................................................................... 22 4.2 MINERAL TITLE ..................................................................................................... 22 4.3 PERMITTING REQUIREMENTS ........................................................................... 24
4.3.1 General ............................................................................................................... 24
4.3.2 Permits ............................................................................................................... 24
5.0 ACCESSIBILITY, CLIMATE, LOCAL RESOURCES,
INFRASTRUCTURE AND PHYSIOGRAPHY 26 5.1 PROPERTY ACCESS ............................................................................................... 26
5.2 CLIMATE .................................................................................................................. 26 5.3 LOCAL RESOURCES .............................................................................................. 26 5.4 INFRASTRUCTURE ................................................................................................ 27
5.5 PHYSIOGRAPHY ..................................................................................................... 27
6.0 HISTORY 28
7.0 GEOLOGICAL SETTING AND MINERALISATION 29

Solid Resources Ltd
Page
7.1 GEOLOGICAL SETTING ........................................................................................ 29 7.1.1 Regional Geology .............................................................................................. 29 7.1.2 Local Geology .................................................................................................... 31
7.2 MINERALISATION ................................................................................................. 35
7.2.1 Geometry and Structure ..................................................................................... 35 7.2.2 Mineralogy ......................................................................................................... 36
8.0 DEPOSIT TYPES 43
9.0 EXPLORATION 45 9.1 GEOLOGICAL MAPPING ....................................................................................... 45
9.2 GEOCHEMICAL SAMPLING ................................................................................. 45 9.3 STUDY OF OLD MINE WORKINGS ..................................................................... 45 9.4 TRENCHING ............................................................................................................ 45
10.0 DRILLING 46 10.1 INTRODUCTION ..................................................................................................... 46 10.2 DRILL SURVEYS .................................................................................................... 48
10.3 DENSITY .................................................................................................................. 48 10.4 GEOLOGICAL AND GEOTECHNICAL LOGGING ............................................. 49 10.5 RESULTS INTERPRETATIONS AND RECOMMENDATIONS .......................... 49
10.6 PRESQUEIRAS ......................................................................................................... 49 10.7 CORREA ................................................................................................................... 53
10.8 COTO TOCAYO ....................................................................................................... 55 10.9 ACEBEDO ................................................................................................................. 57 10.10 RUBILLÓN ............................................................................................................... 59
10.11 TABOAZAS .............................................................................................................. 61
11.0 SAMPLE PREPARATION, ANALYSES AND SECURITY 63 11.1 SAMPLING METHOD AND QUALITY CONTROL ............................................. 63 11.2 SAMPLE ANALYSIS ............................................................................................... 64 11.3 MICON QUALITY CONTROL ANALYSIS ........................................................... 66
11.4 STANDARDS ........................................................................................................... 66 11.5 BLANK ANALYSIS ................................................................................................. 70 11.6 DUPLICATES ........................................................................................................... 71 11.7 CONCLUSIONS AND RECOMMENDATIONS .................................................... 76
12.0 DATA VERIFICATION 77 12.1 SITE VISIT ................................................................................................................ 77 12.2 ASSAY VERIFICATION ......................................................................................... 77
13.0 MINERAL PROCESSING AND METALLURGICAL TESTING 78 13.1 MINERALOGICAL CHARACTERISTICS OF SAMPLE ...................................... 78
13.1.1 XRD Analysis .................................................................................................... 78 13.1.2 QEMSCAN™ Analysis ..................................................................................... 78 13.1.3 Elemental Deportment ....................................................................................... 78
13.2 RECOVERY OF TIN, TANTALUM AND LITHIUM ............................................ 79
14.0 MINERAL RESOURCE ESTIMATES 81 14.1 ALBERTA 1 RESOURCE MODELLING ............................................................... 81

Solid Resources Ltd
Page
14.2 PRESQUEIRAS MINERAL RESOURCE ESTIMATION ...................................... 81 14.2.1 Database Summary ............................................................................................ 81 14.2.2 Wireframes ......................................................................................................... 82 14.2.3 Topography ........................................................................................................ 83
14.2.4 Statistical Analysis of Samples .......................................................................... 85 14.2.5 Top-Cutting ........................................................................................................ 86 14.2.6 Compositing ....................................................................................................... 87 14.2.7 Block Modelling ................................................................................................ 91 14.2.8 Mineral Resource Estimation ............................................................................. 91
14.2.9 Mineral Resource Classification ........................................................................ 98 14.2.10 Density ............................................................................................................... 98 14.2.11 Dilution .............................................................................................................. 99 14.2.12 Mineral Resource Model Evaluation ................................................................. 99 14.2.13 Mineral Resource Cut-Off Evaluation ............................................................. 101
14.3 SOUTHERN AREA MINERAL RESOURCE ESTIMATE .................................. 103 14.3.1 Database Summary .......................................................................................... 103 14.3.2 Wireframes ....................................................................................................... 103
14.3.3 Topography ...................................................................................................... 107 14.3.4 Statistical Analysis of Samples ........................................................................ 107 14.3.5 Top Cutting ...................................................................................................... 107
14.3.6 Compositing ..................................................................................................... 111 14.3.7 Block Modelling .............................................................................................. 111 14.3.8 Mineral Resource Estimation ........................................................................... 112
14.3.9 Mineral Resource Classification ...................................................................... 114 14.3.10 Density ............................................................................................................. 114
14.3.11 Dilution ............................................................................................................ 114 14.3.12 Mineral Resource Evaluation ........................................................................... 114
14.4 MICON MINERAL RESOURCE STATEMENT .................................................. 116
14.5 COMPARISON WITH SOLID 2011 MINERAL RESOURCE
ESTIMATE .............................................................................................................. 118 14.6 CONCLUSIONS AND RECOMMENDATIONS .................................................. 119
15.0 MINERAL RESERVE ESTIMATES 121
16.0 MINING METHODS 122
17.0 RECOVERY METHODS 123
18.0 PROJECT INFRASTRUCTURE 124
19.0 MARKET STUDIES AND CONTRACTS 125
20.0 ENVIRONMENTAL STUDIES, PERMITTING AND SOCIAL OR
COMMUNITY IMPACT 126
21.0 CAPITAL AND OPERATING COSTS 127
22.0 ECONOMIC ANALYSIS 128
23.0 ADJACENT PROPERTIES 129

Solid Resources Ltd
Page
24.0 OTHER RELEVANT DATA AND INFORMATION 130
25.0 INTERPRETATION AND CONCLUSIONS 131
26.0 RECOMMENDATIONS 132
27.0 REFERENCES 134
28.0 DATE AND SIGNATURE PAGE 137
29.0 CERTIFICATE 138

Solid Resources Ltd
Page
LIST OF TABLES
Table 1.1: Alberta-1 Mineral Resource Estimate as at 15th
May 2014 ....................................... 5
Table 1.2: Alberta-1 Proposed Budget........................................................................................ 8
Table 5.1: Climate Data for Orense .......................................................................................... 26
Table 7.1: Summary of the Mineralogical Study of Dense and Light Concentrates ................ 42
Table 8.1: Rare Element Class Pegmatite Classification .......................................................... 43
Table 8.2: Petrogenetic Family Classification .......................................................................... 44
Table 10.1: Average Density of Different Rock Types by Zones ............................................ 49
Table 10.2: Presqueiras – Zone Summary ................................................................................ 50
Table 10.3: Mineralised Pegmatite Intervals - Main Dyke I Hole SO-11-12 ........................... 50
Table 11.1: Ranges for the Different XRF Assayed Elements ................................................. 64
Table 11.2: Ranges for the Different ICP-MS Assayed Elements............................................ 65
Table 11.3: Number of Samples Analysed ............................................................................... 66
Table 11.4: Duplicates Summary Statistics .............................................................................. 72
Table 11.5: Analytical Error of the Original Assays to the Mean of Assay Pairs .................... 76
Table 14.1: Summary of Drilling at Southern Deposits ........................................................... 81
Table 14.2: Statistical Summary of Database ........................................................................... 82
Table 14.3: Statistical Summary of Database ........................................................................... 82
Table 14.4: Statistical Summary of Samples within Micon Wireframes .................................. 85
Table 14.5: Statistical Review of Composite Sample Lengths (across the dyke width) .......... 87
Table 14.6: Statistical Review of Composite Sample Grades (across the dyke width) ............ 88
Table 14.7: Statistical Review of 1 m Composite Sample Length ........................................... 89
Table 14.8: Statistical Review of 1 m Composite Samples ...................................................... 89
Table 14.9: Comparison of Sample Sets Statistical Analysis ................................................... 90
Table 14.10: Micon Columnar Model Prototype ...................................................................... 91
Table 14.11: Micon Estimation Parameters .............................................................................. 95
Table 14.12: Additional Estimation Parameters ....................................................................... 95
Table 14.13: Comparison of Global Declustered Mean Grades ............................................... 98
Table 14.14: Mineral Resource Classification Criteria ............................................................. 98
Table 14.15: Micon Presqueiras Volume of Mineralisation ..................................................... 99
Table 14.16: Micon Presqueiras Mineralisation by Dyke Structure ......................................... 99
Table 14.17: Economic Parameters ........................................................................................ 102
Table 14.18: Micon Resource Evaluation for Presqueiras (2014) .......................................... 102
Table 14.19: Basic Statistical Summary for the Southern Zones ........................................... 103

Solid Resources Ltd
Page
Table 14.20: Wireframe Summary ......................................................................................... 104
Table 14.21: Southern Zones - Statistical Summary of Samples within Micon
Wireframes .................................................................................................... 107
Table 14.22: Statistical Review of Composite Sample Lengths (across the zone
width) ............................................................................................................. 111
Table 14.23: Statistical Review of Composite Sample Grades (across the zone width) ........ 111
Table 14.24: Columnar Model Prototype, Southern Areas..................................................... 112
Table 14.25: Micon Estimation Parameters ............................................................................ 112
Table 14.26: Additional Estimation Parameters ..................................................................... 112
Table 14.27: Southern Zones Resource Evaluation of Inferred Material, Micon
(2014) ............................................................................................................. 115
Table 14.28: Presqueiras Measured and Indicated Resources, Micon 2014 ........................... 116
Table 14.29: Presqueiras and Southern Zones Inferred Resources, Micon 2014 ................... 117
Table 14.30: Alberta-1 Mineral Resource Estimate as at 15th
May 2014 ............................... 118
Table 14.31: Alberta-1 Comparison of Mineral Resource Estimates ..................................... 119
Table 26.1: Alberta-1 Proposed Budget.................................................................................. 133

Solid Resources Ltd
Page
LIST OF FIGURES
Figure 1.1: Map Showing the Location of the Alberta-1 Project Area and the Port of
Pontevedra ......................................................................................................... 1
Figure 4.1: Map Showing the Location of the Alberta-1 Project Area and the Port of
Pontevedra ....................................................................................................... 22
Figure 4.2: Location Map of Alberta-1 Permit ......................................................................... 23
Figure 4.3: Detailed Location Map of Alberta-1 Permit ........................................................... 25
Figure 7.1: Schematic Map of the Tectono-Stratigraphic Zones of the Iberian Massif ........... 29
Figure 7.2: Geology of Galicia ................................................................................................. 30
Figure 7.3: Detailed Geological Map of Alberta-1 Permit ....................................................... 32
Figure 7.4: Photograph of a Pegmatite Dyke Outcrop .............................................................. 33
Figure 7.5: Microphotograph of Pegmatite Core Sample ......................................................... 37
Figure 7.6: Microphotograph of Prismatic-Tabular Crystals of Columbite-Tantalite .............. 38
Figure 7.7: Back-Scattered Electron Images of Crystals of Columbite-Tantalite .................... 38
Figure 7.8: Microphotograph of Aggregate of Cassiterite Crystals .......................................... 39
Figure 7.9: Microphotograph of Crystal Aggregate of Cassiterite ........................................... 39
Figure 7.10: Microphotographs – Spodumene.......................................................................... 40
Figure 7.11: Microphotographs – Spodumene.......................................................................... 40
Figure 7.12: Back Scattered Images of (a) Spodumene Crystals (b) Sub-Rounded
Petalite Crystal ................................................................................................. 41
Figure 7.13: Electron Microscope Image of Spodumene Crystal ............................................. 42
Figure 10.1: Overall Geological Map with the Drill Hole Locations ....................................... 47
Figure 10.2: Photographs of the Location Marker and Collar Protection ................................. 48
Figure 10.3: Presqueiras Map with Drill Hole Locations ......................................................... 51
Figure 10.4: Longitudinal Section of Presqueiras..................................................................... 52
Figure 10.5: Cross Section of Presqueiras ................................................................................ 52
Figure 10.6: Sections of Drill Holes at Correa ......................................................................... 53
Figure 10.7: Correa Map with Drill Hole Locations................................................................. 54
Figure 10.8: Coto Tocayo - Section of Drill Hole SO-11-19 ................................................... 55
Figure 10.9: Coto Tocayo Map with Drill Hole Locations ....................................................... 56
Figure 10.10: Acebedo - Section of Drill Hole SO-11-21-B .................................................... 57
Figure 10.11: Acebedo Map with Drill Hole Locations ........................................................... 58
Figure 10.12: Rubillón - Section of Drill Hole SO-11-25 ........................................................ 59
Figure 10.13: Rubillón Map with Drill Hole Locations ........................................................... 60
Figure 10.14: Taboazas - Section of Drill Hole SO-11-26 ....................................................... 61

Solid Resources Ltd
Page
Figure 10.15: Taboazas Map with Drill Hole Locations .......................................................... 62
Figure 11.1: 2011 Tantalum Standard Assay Plot .................................................................... 67
Figure 11.2: 2012 Tantalum Standard Assay Plot .................................................................... 67
Figure 11.3: 2011 Tin Standard Assay Plot .............................................................................. 68
Figure 11.4: 2012 Tin Standard Assay Plot .............................................................................. 68
Figure 11.5: 2011 Lithium Standard Assay Plot ....................................................................... 69
Figure 11.6: 2012 Lithium Standard Assay Plot ....................................................................... 69
Figure 11.7: Blank Data Analysis for Tantalum, Tin and Lithium ........................................... 71
Figure 11.8: Correlation Plot for Original and Duplicate Tantalum Assays ............................ 72
Figure 11.9: Correlation Plot for Original and Duplicate Tin Assays ...................................... 73
Figure 11.10: Correlation Plot for Original and Duplicate Lithium Assays ............................. 73
Figure 11.11: Error Plot for Original and Duplicate Tantalum Assays .................................... 74
Figure 11.12: Error Plot for Original and Duplicate Tin Assays .............................................. 75
Figure 11.13: Error Plot for Original and Duplicate Lithium Assays ....................................... 75
Figure 13.1: Test Programme for Tin, Tantalum and Lithium Recovery ................................. 80
Figure 14.1: Oblique View of the Micon Pegmatite Dyke Wireframes ................................... 84
Figure 14.2: Oblique View of Topographic Surface ................................................................ 85
Figure 14.3: Tantalum Log Probability Plot ............................................................................. 86
Figure 14.4: Tin Log Probability Plot ....................................................................................... 86
Figure 14.5: Lithium Log Probability Plot ............................................................................... 87
Figure 14.6: Histogram of Sample Lengths within Micon Pegmatite Wireframes .................. 88
Figure 14.7: Tantalum Down-Hole Variogram ........................................................................ 92
Figure 14.8: Tin Down-Hole Variogram .................................................................................. 92
Figure 14.9: Lithium Down-Hole Variogram ........................................................................... 93
Figure 14.10: Tantalum Isotropic Variogram ........................................................................... 93
Figure 14.11: Tin Isotropic Variogram ..................................................................................... 94
Figure 14.12: Lithium Isotropic Variogram .............................................................................. 94
Figure 14.13: Oblique Views of the Search Ellipsoid in Relation to the Micon
Wireframes ...................................................................................................... 95
Figure 14.14: Tantalum Decluster Plot ..................................................................................... 96
Figure 14.15: Tin Decluster Plot ............................................................................................... 97
Figure 14.16: Lithium Decluster Plot ....................................................................................... 97
Figure 14.17: Presqueiras - Tantalum Grade-Tonnage Curve for Measured and
Indicated Categories ...................................................................................... 100

Solid Resources Ltd
Page
Figure 14.18: Presqueiras - Tin Grade-Tonnage Curve for Measured and Indicated
Categories ...................................................................................................... 100
Figure 14.19: Presqueiras - Lithium Grade-Tonnage Curve for Measured and
Indicated Categories ...................................................................................... 101
Figure 14.20: Acebedo - Plan View Micon 2014 ................................................................... 104
Figure 14.21: Correa - Plan View Micon 2014....................................................................... 105
Figure 14.22: Coto Tocayo - Oblique View Micon 2014 ....................................................... 105
Figure 14.23: Rubillón - Oblique View Micon 2014 .............................................................. 106
Figure 14.24: Taboazas - Oblique View Micon 2014............................................................. 106
Figure 14.25: Acebedo - Log Probability Plots ...................................................................... 108
Figure 14.26: Correa - Log Probability Plots.......................................................................... 108
Figure 14.27: Coto Tocayo - Log Probability Plots ................................................................ 109
Figure 14.28: Rubillón - Log Probability Plots ...................................................................... 109
Figure 14.29: Taboazas - Log Probability Plots ..................................................................... 110
Figure 14.30: Tantalum Decluster Plot - All Southern Zones ................................................ 113
Figure 14.31: Tin Decluster Plot - All Southern Zones .......................................................... 113
Figure 14.32: Lithium Decluster Plot - All Southern Zones ................................................... 114

Solid Resources Ltd
Alberta-1 Rare Metals Project May 2014 1
1.0 SUMMARY
1.1 INTRODUCTION
Solid Resources Limited (Solid) has engaged Micon International Co Limited (Micon) to
complete an independent Technical Report (Report) describing Solid’s Alberta-1 Rare Metals
Project (Alberta-1), located in the Autonomous Community of the Region of Galicia
(Galicia), Spain. Solid holds the permit for the Alberta-1 Rare Metals Project and intends to
develop the project via a number of funding options. This Report is intended to update the
resources presented in the NI 43-101 report dated 8th
December, 2011 by Dr. José M. Cantó
Romera.
This Report has been prepared in compliance with the Canadian National Instrument
43-101 Standards of Disclosure for Mineral Projects. The purpose of this Report is to
provide investors with an independent assessment of the Alberta-1 Rare Metals Project
owned by Solid.
1.2 PROPERTY DESCRIPTION
The Alberta-1 Permit is situated in the north-west of Spain, approximately 25 km to the east
of Pontevedra (population circa 82,000) and 42 km north-west of Orense (population circa
108,000) see Figure 1.1. The northern portion of the property is located in the Pontevedra
province, whilst the southern part lies in the province of Orense.
Figure 1.1: Map Showing the Location of the Alberta-1 Project Area and the Port of Pontevedra
Source: Google Maps, 2014
Alberta-1
Project Area
5 km 0 km 5 km 10 km
Solid Resources Ltd
Alberta-1 Rare Metals Project May 2014 2
Access to the deposit area is via a network of paved toll-free highways; the project is located
approximately 6 km south of the main Orense to Pontevedra highway (N-541). The
international sea port of Vigo is located some 41 km to the south-west. The Orense to
Santiago de Compostela railway is situated to the east at a distance of 21 km and the Santiago
de Compostela International Airport is located 40 km to the north.
1.3 OWNERSHIP
Solid Resources Limited (Solid) is a publicly-listed company on the Toronto Stock Exchange
(TSX Venture Exchange). The company trades under the symbol “SRW”, and has registered
offices at Suite 505 - 1238 Melville Street, Vancouver, British Columbia, V6E 4N2, Canada.
The governing jurisdiction is Alberta, Canada.
The area of the Alberta-1 Exploration Permit is approximately 3,690 ha, corresponding to
123 cuadrículas mineras, (mineral concession unit used by Spanish mining law each mining
unit was defined by 20 seconds of latitude and 20 seconds of longitude). The area of the
Exploitation Licence to be applied for will be reduced according to Spanish Mining Law
(2,395 hectares corresponding to 85 cuadrículas mineras).
The official name of the Permit is “Permiso de Investigación Alberta-1, 1ª Fracción,
Nº 4966.1” and it is valid until 14th
June, 2014. The Spanish Mining Law permits an
extension period to be applied to this date. Preparation of the documentation for the
application of the Exploitation Licence is currently in progress.
The permit is held 100% by Solid through its wholly owned subsidiary Solid Mines España,
S.A.U.
1.4 DISCLAIMER
Whilst Micon has reviewed the exploration and mining licences, permits and entitlements of
the property in so far as these may influence the investigation and development of the mining
assets, Micon has not undertaken legal due diligence of the asset portfolio described in this
Report. The reader is therefore, cautioned that the inclusion of exploration and mining
properties within this Report does not in any form imply legal ownership.
During the preparation of this Report, Micon has relied upon information provided by Solid
Resources Limited, which describes the legal title, infrastructure, exploration history for the
project. Micon has not independently verified the statements and data contained in the
supplied information and has assumed that the information provided is representative and
materially complete. The reports that provide this information are recorded in the list of
references in Section 20.0.
1.5 HISTORY
Mining and exploration work was conducted from the 1940’s to the 1980’s within the permit
area. Old mine workings include open pits and some adits excavated in the softer and more
kaolinised parts of the pegmatites. Most were made in the 1940's and 1950's by local miners,
often in pursuit of small deposits exposed in streambeds. This activity ceased in the early
1960's.

Solid Resources Ltd
Alberta-1 Rare Metals Project May 2014 3
In 1970 and 1971 Compañía Estañífera de Galicia exploited cassiterite in a relatively large
dyke in the northern area of the permit, especially in the underground mine at Presqueiras.
No further mining has taken place since this time, though several stages of exploration in the
permit area have taken place since the mining ceased.
Between 1972 and 1974, the Geological and Mining Institute of Spain (IGME) conducted a
general study of the area, to identify potential sources of tin and tungsten mineralisation.
From 1981 to 1985 a large area in the south of the permit was investigated by the state-owned
company ADARO. The work carried out included: mapping, soil and rock geochemistry,
trenching, and the drilling of eight core holes totalling 586.9 m. In addition, various tests on
concentrate production were conducted. In 1982, a joint venture by the companies
SEVELAR and RÍO IBEX began an exploration programme with geological mapping and
trenching in the north of the permit area near the Presqueiras mine and at Coto Tocayo permit
area further to the south. This was followed by a programme of twenty core drill holes, with
a total of 2,069 m drilled over the two areas.
Since 2000 Solid has carried out a programme of exploration on the Alberta-1 Project, mainly
through its Spanish subsidiary company Solid Mines España, S.A.U. These include four
diamond drilling programmes during 2003, 2005, 2011 and 2012.
1.6 GEOLOGY AND MINERALISATION
The mineralised pegmatites of the Alberta-1 Project are situated within the
Galicia-Tras-os-Montes Zone of the north-west Iberian Massif, formed during the Variscan
Orogeny between 370 Ma to 290 Ma by the convergence and collision of the continents
Laurasia and Gondwana (Abati, et al., 2010).
The Galicia-Tras-os-Montes Zone that hosts the mineralised pegmatites, does not fit the
continuous and concentric trend of the rest of the zones making up the Iberian Massif and
represents a parautochthonous crustal block, thrust over the Central Iberian Zone (Farias et
al., 1987). The units are grouped into basal, intermediate or ophiolitic and upper units
according to their structural position within the thrust pile. Many of the units have
recrystallised under deep conditions and represent lower crust and upper mantle.
The mineralised pegmatites intrude a mica schist unit of the Schistose Domain that strikes
north-north-west to south-south-east (Paraño group), and is bounded to the east by the
Forcarei unit (allochthonous synform), and to the west by a two mica, syn-kinematic granite.
The Presqueiras-Taboazas mineralised (rare element) pegmatites correspond to the rare
element-Lithium (REL-Li) subclass of the Li-Cs-Ta (LCT) enriched family of pegmatites
according to the Cerny and Ercit (2005) classification. The key points are the geochemical
signature (Sn, Ta>Nb) and the parental synkinematic granite outcropping to the west,
corresponding to syn-orogenic plutons within the Variscan Belt of Europe.
The Presqueiras-Taboazas mineralised pegmatites are included within a belt approximately
350 m wide, extending 11 km (in the area of the permit) in a north-north-west to south-south-
east direction, conforming to the regional schistosity, and to the contact of the two mica
syn-kinematic granites outcropping to the west. The syn-kinematic granite is the fertile
granite responsible for the mineralised pegmatites.
The mineralised albite pegmatite dykes are intruded discordantly into the mica schist host
rock. The mica schists are in contact both in the hanging wall and the footwall of each dyke.
The dimensions of the dykes determined from drilling intersections are up to 15.6 m thick,

Solid Resources Ltd
Alberta-1 Rare Metals Project May 2014 4
550 m long and 300 m wide, and are open at depth and along strike. The average thickness
varies from 2.8 m to 8.6 m. Weathering is irregular in depth and intensity and affects the
dykes up to a depth of 30 m. The depth of the dykes varies from surface to 244.7 m, 160 m
vertical depth.
The major minerals of the mineralised pegmatites are albite (30% to 50%), quartz (25% to
35%), K-feldspar (orthoclase, microcline) (5% to 10%), muscovite (4% to 8%), spodumene
(up to 10%). The minor minerals are cassiterite, columbite-tantalite, eucryptite, petalite,
amblygonite, kaolinite, apatite, sphalerite, zircon and chlorite. Tantalum and niobium occur
mainly as columbite-tantalite, tin as cassiterite and lithium as spodumene and petalite.
1.7 EXPLORATION AND DRILLING
Old mining workings include an open pit as well as some near-surface galleries, excavated in
the softer and more kaolinised parts of the pegmatites. Most of the excavations were
developed in the 1940’s and 1950’s of the last century by local miners, often in small
deposits in streambeds. This activity ceased in the early 1960's. In 1970 and 1971 a
company named Compañía Estañífera de Galicia exploited the cassiterite in a relatively large
dyke in the northern area of the permit, particularly in the underground mine at Presqueiras.
Between 1972 and 1974, the Geological and Mining Institute of Spain (IGME), carried out an
exploration project to identify the potential for tin and tungsten. Between 1981 and 1985 a
large area in the south of the Permit was investigated by the state-owned company ADARO.
The exploration programme concluded with a total of 586.9 m drilled, as well as various
concentrate production tests. In 1982, a joint venture by the companies SEVELAR and RÍO
IBEX began to explore the Presqueiras and Coto Tocayo deposits. A total of 20 holes were
drilled for a total of 2,069 m between the two areas.
Since the year 2000, Solid has conducted a programme of exploration on the Alberta-1
Permit to assess the potential for niobium, tantalum, tin, tungsten and lithium. The
programme has included: compilation of existing information, geological mapping,
geochemical sampling of streams and rocks, studying of old mine workings, trenching and,
finally, drilling. Four drilling programmes have been completed in 2003, 2005, 2011 and
2012.
In 2003, the first drilling campaign with recovery of continuous core was undertaken with a
total of 1,235 m drilled in 10 holes. A second campaign in 2005 drilled 7 holes, for a total of
850 m. The third drilling campaign was conducted in 2011 with 3,364.05 m completed in
31 drill holes. In 2012 a further campaign of infill drilling was conducted. A total of
19 diamond drill holes were completed (two from the previous drilling programme were
re-entered), for a total length of 1,570.2 m. The core was logged and sampled and samples
were sent to independent laboratories in Canada for chemical assay.
A total of 65 holes have been drilled on the project for a total length of 7,021 m. The total by
deposit area includes:
Presqueiras 46 drill holes 4,676 m;
Correa 2 drill holes 156 m;
Coto Tocayo 4 drill holes 383 m;
Acebedo 4 drill holes 366 m;
Rubillón 2 drill holes 225 m; and,
Taboazas 7 drill holes 1,216 m.

Solid Resources Ltd
Alberta-1 Rare Metals Project May 2014 5
1.8 MINERAL PROCESSING AND METALLURGICAL TESTING
SGS Minerals Services UK Limited (SGS) conducted laboratory test work and concluded that
tin and tantalum concentrates can be produced by gravity separation methods. Tin recovery
from test work was as high as 88.1% reporting to a concentrate grading 54.8% Sn. Tantalum
recovery of 85.2% was achieved in test work reporting to a concentrate with grade of 30%
Ta2O5.
Laboratory studies suggest that commercially viable lithium concentrates may be produced
from flotation.
1.9 MINERAL RESOURCE ESTIMATE
Micon has generated the most recent mineral resource estimate for the Alberta-1 Project
dated May 2014. This estimate incorporates the latest drilling results from the 2012 drill
programme.
Alberta-1 mineral resources are defined by 46 drill holes (4,676.05 m) covering the main
Presqueiras deposit and a further 19 drill holes at the five Southern zones of Correa, Coto
Tocayo, Acebedo, Rubillón and Taboazas. The main Presqueiras deposit is interpreted to
comprise two principal zones, plus three subsidiary zones of more limited continuity. The
Southern area is subdivided into the Acebedo, Correa, Coto Tocayo, Rubillón and Taboazas
zones comprising a total of 14 sill-like structures. The Presqueiras and Southern zones
remain open both along strike and down-dip.
A cut-off value of US$25 per tonne was selected to define Alberta-1 mineral resources. No
economic studies of the project have been conducted and therefore it is possible that a
different cut-off value may be considered upon completion of an appropriate engineering
study. Tables 1.1 summarises the mineral resource estimate for the Alberta-1 project at a
cut-off value of US$25 per tonne.
Table 1.1: Alberta-1 Mineral Resource Estimate as at 15th
May 2014
Area Resource
Classification
Tonnage
(Mt)
Ta2O5
(ppm)
Sn
(ppm)
Li2O
(%)
Ta2O5
(t)
Sn
(kt)
Li2O
(kt)
Presqueiras Measured 2.96 111 752 0.52 327 2.23 15.4
Indicated 1.99 90 675 0.52 178 1.34 10.3
Presqueiras Inferred 2.69 80 668 0.39 214 1.79 10.5
Acebedo Inferred 3.68 122 955 0.41 449 3.51 15.1
Correa Inferred 0.88 142 557 0.50 125 0.49 4.4
Coto Tocayo Inferred 3.43 215 1,180 0.26 737 4.05 8.9
Rubillón Inferred 0.20 202 1,212 0.04 39 0.24 0.1
Taboazas Inferred 6.53 103 506 0.41 673 3.30 26.8
Alberta-1 Measured + Indicated 4.95 102 721 0.52 505 3.57 25.7
Alberta-1 Inferred 17.4 129 769 0.38 2,238 13.4 65.7
Note: Totals may vary due to rounding.
Cut-Off Value US$25 per tonne
The mineral resource estimate is compliant with the Canadian Institute of Mining, Metallurgy
and Petroleum (CIM), CIM Standards on Mineral Resources and Reserves, Definitions and
Guidelines prepared by the CIM Standing Committee on Reserve Definitions and adopted by
CIM Council on 27th
November, 2010.

Solid Resources Ltd
Alberta-1 Rare Metals Project May 2014 6
1.10 MINING AND MINERAL RESERVE
There are no CIM Standards-compliant mineral reserves for the Alberta-1 Rare Metals
Project.
1.11 CONCLUSIONS
Tantalum, tin and lithium mineralisation has been confirmed by drilling along a 12 km trend
(including all zones). The mineralised zone ranges up to 350 m wide and 15.6 m thick. The
Measured and Indicated mineral resources are estimated to be 4.95 Mt at a grade of 102 ppm
Ta2O5, 721 ppm Sn and 0.52% Li2O. Inferred mineral resources are estimated to be 17.4 Mt
at a grade of 129 ppm Ta2O5, 769 ppm Sn and 0.38% Li2O.
The knowledge of the geology and mineralogy has been improved with the most recent
drilling programmes and mineralogical studies of the mineralised pegmatite and waste rocks
from the core. Sections have been interpreted to update the 3-D geological model.
The mineralisation occurs along a 12-km trend and is open along strike and down dip.
Considering the surface geology, distribution of old workings and the continuity of the dykes
there appears to be potential for 20 Mt to 30 Mt of additional resources. It should be noted
that the potential quantity and grade is conceptual in nature and that there has been
insufficient exploration to define a mineral resource. It is uncertain whether further
exploration will result in the target zones being delineated as a mineral resource.
SGS test work has concluded that tin and tantalum concentrates can be made relatively easily
using conventional gravity separation methods.
It is evident that tantalum and tin grades are higher in the Southern areas of the project.
These areas should be more accurately assessed with planned drilling in order to improve the
quality of the mineral resources. This will help to define the future development of the
project.
The mineral resources are amenable to exploitation by both open pit and underground
mining. Underground mining methods may be preferred in order to minimise the
environmental impact and reduce the costs of the Restoration Plan. The waste material
produced in the mine or plant is characterised as chemically inert.
Preliminary market enquiries for tantalum, tin and lithium minerals indicate that there is a
ready market for good quality tantalum and tin concentrates. There is also a market for
high-grade lithium concentrates. There is a potential market for a lithium + sodium feldspar
product as a raw material for ceramic and glass manufacture.
According to Spanish Mining Law, the subsurface belongs to the State. A tax must be paid
annually for the land occupied by the Exploitation Licence (depending on the extent of the
land occupied). Exploitation Concessions can be granted for 30 year periods, up to a
maximum of 90 years.
The statistical analysis of the standards for both sample programmes received in 2011 and
2012 show that the laboratory is capable of producing precise assay results and these results
are acceptable. However, it is not possible to discern any real statistical trends in the standard
data due to the small number of assays, and the lack of certified standards means that Micon
is unable to comment on the accuracy of the data.
Solid Resources Ltd
Alberta-1 Rare Metals Project May 2014 7
1.12 RECOMMENDATIONS
1. Further metallurgical testing combining gravity and magnetic separation, should be
conducted to improve the quality of the cassiterite and tantalite concentrates.
2. The feasibility of obtaining commercial spodumene concentrates should be
investigated. The chemical character of the mineralisation appears favourable,
including a low iron content (0.04% Fe2O3), which could also improve project value.
Flotation test work should be conducted to confirm whether a high-grade of lithium
product can be achieved.
3. The tailings product from the gravity separation of cassiterite and tantalite contains a
mixture of sodium feldspar, quartz and lithium minerals (up to 2% Li2O). If this
material can be processed to yield a product of uniform specification it may be
possible to sell into the ceramic and glass markets. Lithium flotation should be
investigated to produce a commercial lithium concentrate (spodumene) in order to add
value to the project.
4. Potential purchasers of low-grade lithium and sodium feldspar product should be
contacted in order to obtain detailed specifications for their raw material
requirements. Once these specifications are obtained it will be possible to assess
whether these raw materials can be produced from Alberta-1 mineralisation.
5. Micon recommends that Solid undertake the following assay quality control measures
for future drilling campaigns:
a) Increase the number of standard, duplicate and blank samples to 5% of the
total number of samples sent for analysis in the future to meet current
recommended practice standards in the industry.
b) Review the procedures for producing standards for analysis to ensure that each
element concentration matches the description of a “high” and “low” standard.
c) Further analysis of the locally produced standards in order to produce upper
and lower control limits to establish any future problems with batches of
assays analysed.
d) External accredited standards should be introduced to the quality control
programme to monitor the suitability and accuracy of locally prepared
standards.
e) The duplicate analysis revealed good repeatability achieved by the laboratory
and high precision of sample pairs. However, duplicate samples should be
sent for analysis at an external laboratory as a further validation method for
the existing quality control procedures.
In addition to the above a preliminary environmental impact assessment is required for
continued work on the project. The preliminary environmental assessment report should be
accompanied by feedback from public consultation with local inhabitants.
An allocation of funds is also recommended for maintenance of the mineral concessions and
overheads related to administration of the project.
The budget proposed for the completion of the work recommended is presented in Table 1.2.

Solid Resources Ltd
Alberta-1 Rare Metals Project May 2014 8
Table 1.2: Alberta-1 Proposed Budget
Item US$
Lithium Market Analysis 10,000
Metallurgical Test Work 30,000
Permitting Environmental Impact Assessment 20,000
Permitting Community Consultation 20,000
Mineral Concession Maintenance and Overheads 65,000
Total 145,000
Solid Resources Ltd
Alberta-1 Rare Metals Project May 2014 9
2.0 INTRODUCTION
2.1 TERMS OF REFERENCE AND PURPOSE OF THE TECHNICAL REPORT
Solid Resources Limited (Solid) has engaged Micon International Co Limited (Micon) to
compile an independent Technical Report (Report) describing Solid’s Alberta-1 Rare Metals
Project (Alberta-1), located in the Autonomous Community of the Region of Galicia
(Galicia), Spain. Solid holds the permit for the Alberta-1 Rare Metals Project and intends to
develop the project via a number of funding options.
Solid requested that Micon’s Technical Report be prepared in accordance with the formatting
requirements of National Instrument 43-101F1 for providing documentation for written
disclosures, and is intended to be read in its entirety. The purpose of this Report is to provide
investors with an independent assessment of the Alberta-1 Rare Metals Project held by Solid.
This Report has been compiled in compliance with Canadian National Instrument 43-101.
The mineral resources presented in this Report have been estimated in accordance with CIM
Definition Standards – For Mineral Resources and Mineral Reserves (CIM Standards).
The current Report contains a CIM Standards-compliant mineral resource estimate, but there
are no CIM Standards-compliant mineral reserves.
2.2 SCOPE OF WORK
This Report is intended to update the latest version of the NI 43-101 technical report dated
8th
December, 2011 prepared by Dr. José M. Cantó Romera.
Important aspects of this update include:
Updated mineral resource evaluation using the most recent drilling results;
Integration of all information of the Alberta-1 Permit; and,
Establishing the proper protocols for future exploration and exploitation plans.
2.3 SOURCE OF INFORMATION
The information available with which to prepare the Report was derived from a number of
sources including the following:
Documents provided for review by Solid;
An electronic database of drilling and sample analysis data for the Alberta-1 deposits
compiled by Solid; and,
Published scientific reports on Galicia.
The main sources of information used to compile this Report are as follows:
NI-43-101 Technical Report on the Alberta-1 Property, Rare Element Pegmatites,
Galicia, Spain, by Dr José M. Cantó Romera, 8th
December, 2011.
Alberta-1 Rare Metals Project (Sn, Ta, Li), Located in Galicia (Spain), an internal
company report prepared by Alfonso Gracia Plaza, Manuel Prieto de Dios, Adam
Wheeler and Robert Dowdell, dated 2nd
April 2014.

Solid Resources Ltd
Alberta-1 Rare Metals Project May 2014 10
Additional sources of information and data used to prepare this Report are mainly from
official reports to mining authorities (according to Spanish Mining Law), internal reports of
the company and reports from consultancy companies. A full list of references is supplied in
Section 20.0.
2.4 QUALIFICATIONS OF THE CONSULTANT
2.4.1 General
The Report has been prepared by Micon International Co Limited (Micon) from its UK
office. The following authors have contributed to the Report:
Mr Stanley Currie Bartlett, M.Sc., PGeo., of Micon, by reason of education,
experience and professional registration, fulfils the requirements of an independent
Qualified Person (QP) as defined by Canadian National Instrument NI 43-101 and
CIM Standards. Mr. Bartlett has over 35 years of field experience with metal
mineralisation similar to that found within the Alberta-1 property. Mr Bartlett visited
the site of the project from 10th
to 11th
April 2014 and reviewed all the mineralised
areas and visited a number of the old workings within the project area;
Robin Bernau, Ph.D., MAusIMM(CP) reviewed the geology and mineralisation;
Hannah Davies, B.Sc., prepared the mineral resource estimate; and,
Sandra Mahé, B.Sc., reviewed the quality control assay data.
During the site visit outcrops and old mine workings were inspected. Drill collars were
observed and the distribution of these was compared with drill plans to verify the relative
location and density of drilling.
Subsequent to the site visit the electronic database was audited and quality control assay data
was reviewed. The audited database was used to generate a CIM Standards-compliant
mineral resource estimate.
2.4.2 Micon International Limited
Micon International Limited has provided consulting services to the international mining
industry since 1988, with particular focus upon mineral resource estimations, metallurgical
services, mine design and production scheduling, preparation of pre-feasibility and feasibility
studies, independent due diligence reviews of mining and mineral properties, project
monitoring, independent engineer roles, financial analysis and litigation support.
Micon's staff is comprised of highly qualified and experienced professionals who are guided
by the principles of Integrity, Competence and Independence. Each member has extensive
experience with mineral exploration and mining companies and leading consultant groups.
Micon applies the skills of its staff and associate consultants to suit the specific requirements
of the assignment so as to provide the highest level of service, value and quality.
Micon's clients include mining and mineral exploration companies, financial institutions and
government agencies from around the world. Assignments have been carried out in virtually
every country of the world for such commodities as precious and base metals, industrial
minerals, diamonds and the energy fuels. A particular expertise has been developed in the
economic evaluation of mining properties, including studies in support of debt and equity

Solid Resources Ltd
Alberta-1 Rare Metals Project May 2014 11
financing. Micon's professional staff have the experience, education and professional
credentials to act as Qualified Persons and/or Competent Persons, as required by world-wide
regulatory agencies.
Micon fulfilled an integral role in the development of the National Instrument 43-101
legislation in Canada. In 1997 the Mining Standards Task Force of the Toronto Stock
Exchange and the Ontario Securities Commission appointed Micon to review and assess the
current requirements and procedures for technical reporting by mining and mineral
exploration companies falling under the regulatory regime of the OSC and/or administration
of the TSE, and assess the need for revising and improving the requirements and procedures
with the objective of maintaining the status of, and confidence in, Toronto as the premier
international mining finance centre. Micon’s report entitled Standards for the Acquisition
and Reporting of Technical Information by the Mining Industry was published as
Appendix D in the final report of the Mining Standards Task Force in January 1999. The
report forms the basis of the current Canadian National Instrument 43-101 legislation and
related policy.
Specific examples of Competent Persons, Independent Experts, Qualified Persons, Minerals
Expert and Canadian National Instrument 43-101 Reports prepared by Micon are provided
below.
Competent Person’s Report
Ovoca Gold PLC, United Kingdom: Competent Person’s Report on the Goltsovoye Silver
Project, Magadan Region, Russian Federation in support of London Stock Exchange listing.
OJSC MMC Norilsk Nickel, Russian Federation: Competent Person’s Report on the Mineral
Assets of OJSC MMC Norilsk Nickel.
Peter Hambro Mining Limited, United Kingdom: Qualified Person’s Report on the
Pokrovskoye Gold Mining Project, Amur Region, Chita, Russian Federation, prepared in
support of London Stock Exchange listing.
Touchstone Gold Limited, Canada: Independent Technical Report for the Rio Pescado Gold
Project, Department of Antioquia, Colombia, prepared for Touchstone Gold Limited and
Collins Stewart Europe Limited, in support of Toronto Stock Exchange and AIM listings.
Independent Expert’s Report
OJSC Polyus Gold, Russian Federation: Independent Expert Report on the Reserves and
Resources of OJSC Polyus Gold, Russian Federation in support of London Stock Exchange
listing.
JSC Alrosa, Russian Federation: Independent Expert Report on the Reserves and Resources
of JSC Alrosa Diamond Assets.
Alrosa Group of Companies, Russian Federation: Independent Expert Report on the Reserves
and Resources of the Diamond Assets of the Alrosa Group of Companies.
Alrosa Group of Companies, Russian Federation: Independent Expert Report on the Reserves
and Resources of the Diamond Assets of the Alrosa Group of Companies, in support of
Moscow Stock Exchange listing.
Solid Resources Ltd
Alberta-1 Rare Metals Project May 2014 12
Mineral Expert’s Report
OJSC Matrosova Mine, Russian Federation: Mineral Expert’s Report on the Natalka Gold
Deposit, Tenkin District, Magadan Region Russian Federation.
Polyus Gold International, Bailiwick of Jersey: Mineral Expert’s Report on the Mineral
Reserves and Resources Polyus Gold, Russian Federation.
Independent Engineer’s Report
HypoVereinsbank/Unicredit: Independent Engineer services and monitoring of construction
of the Voskhod chromite project in Kazakhstan on behalf of HypoVereinsbank/Unicredit as
technical agent.
Optimum Capital/ING Bank N.V.: Independent Engineers Report and ongoing monitoring of
construction and development of the Hemerdon tungsten-tin project in Devon, United
Kingdom, as Independent Engineer to the lenders.
Dannemora Mineral AB, Sweden: Independent Engineer’s report and monitoring of the
underground iron mining project.
Canadian National Instrument 43-101 Reports
Endomines OY, Finland: Independent 43-101 Technical Report on the Illomantsi gold
project.
Andina Minerals Incorporated, Canada: Technical Report – Review of Gold and Copper
Exploration Potential of Mineral Properties in Chile.
Inter-Citic Minerals, Canada: Incorporated Technical Report on an Updated Mineral
Resource Estimate, and a Preliminary Assessment and Economic Analysis for the Dachang
Gold Project, Qinghai Province, People’s Republic of China.
Azerbaijan International Mineral Resources Operating Company (AIMROC), Azerbaijan:
Technical Report on the Chovdar Gold Property, Khalnar Administrative District,
Azerbaijan.
Dalsvetmet, Russian Federation: Technical Report on the Nasedkino Gold Project, Chita
Region, Russian Federation, prepared in support of Toronto Stock Exchange listing.
Portex Minerals Incorporated, Canada: Technical Report on the Toral Zinc-Lead-Silver
Project, Castile and León, Spain.
MMC Intergeo, Russian Federation: Technical Report on Mineral Resources of the
Kingashsky, Verkhnekingashsky and Kuyovksy Nickel-Copper Deposits and Results of the
Preliminary Economic Assessment, Krasnoyarsk Krai, Russian Federation, prepared in
support of Toronto Stock Exchange listing.
KGHM Polska Miedź S.A., Poland: Technical Report on the Copper-Silver Production
Operations of KGHM Polska Miedź S.A. in the Legnica-Głogów Copper Belt Area of
Southwestern Poland. Prepared in support of Warsaw Stock Exchange listing.
Managazeya Mining Limited, Russian Federation: Technical Report on the Savkino Gold
Project Mineral Resources and Reserves, Chita Region, Russian Federation.

Solid Resources Ltd
Alberta-1 Rare Metals Project May 2014 13
2.4.3 Independence
Micon is internally owned and is entirely independent of all parties involved in Solid
Resources Limited. Micon’s consulting staff consists of fulltime employees. In certain
circumstances, Micon contracts the specialist services of individual, independent associate
consultants. However, Micon selects associates on the basis of their appropriateness to a
specific project. Micon has access to the services of its Toronto and Vancouver, Canada
offices, Norwich and Cornwall, UK-based staff, supported by senior consultants based in
Moscow, Russian Federation and the United States of America.
As Independent Consultant, Micon will receive a fee for its services based on time and
expenses and will not receive any capital stock from any of the parties associated with the
Alberta-1 Magnetite Project.
2.5 TECHNICAL REPORT USE
This Report is intended to be used by Solid Resources Limited subject to the terms and
conditions of its agreement with Micon.
The conclusions and recommendations in this Report reflect the authors’ best judgment in
light of the information available to them at the time of writing. The authors and Micon
reserve the right, but will not be obliged, to revise this Report and conclusions if additional
information becomes known to them subsequent to the date of this Report. Use of this
Report acknowledges acceptance of the foregoing conditions.
2.6 UNITS AND CURRENCY
All financial values are reported in either Euros (€) or the currency of the United States of
America (US$) while units are reported in the Système Internationale d’Unités (SI), as
utilised by the international mining industries, including: metric tons (tonnes, t), million
metric tonnes (Mt), kilograms (kg) and grams (g) for weight; kilometres (km), metres (m),
centimetres (cm), millimetres (mm) or microns (µm) for distance; cubic metres (m3), litres
(l), millilitres (ml) or cubic centimetres (cm3) for volume; square kilometres (km
2) or hectares
(ha) for area; weight percent (%) for metal grades and grams per metric tonne (g/t) for
precious metal grades. Sometimes parts per billion (ppb) or parts per million (ppm) are used
to express metal content and tonnes per cubic metre (t/m3) for density.
A glossary of terms and abbreviations are provided in the following sections.
2.7 GLOSSARY
Albite (NaAlSi3O8): Sodium end member of the plagioclase feldspar minerals.
Amblygonite (LiAl(PO4)F): This mineral forms a series with montebrasite (LiAl(PO4)(OH)
amblygonite is the fluorine rich member and montebrasite the hydroxyl rich member. These
minerals occur in coarsely crystalline igneous rocks and pegmatites.
Anatase (TiO2): An allotrope of titanium dioxide usually found in metamorphic rocks,
especially schist and gneiss. The other allotropes are rutile and brookite.
Apatite (Ca5(PO4)3 (F,Cl,OH)): Calcium phosphate.
Solid Resources Ltd
Alberta-1 Rare Metals Project May 2014 14
Beryl (Be3Al2(SiO3)6): A cyclosilicate mineral found in pegmatites and granites and in some
regionally metamorphosed rocks.
Biotite (K(Mg,Fe)3(AlSi3O10)(F,OH)2): Mafic rich mica mineral.
Cassiterite (SnO2): Tin oxide. Commonly found in vein deposits, granitic rocks, pegmatites
and in areas of contact metamorphism.
Chalcopyrite (CuFeS2): Copper iron sulphide important non-magnetic copper ore mineral.
Chlorite (Mg,Fe)3(Si,Al)4O10(OH)2.(Mg,Fe)3(OH)6: Sheet silicate mineral primarily found
in weakly metamorphosed rocks from the alteration of either clays in sedimentary rocks or
pyroxenes, amphiboles and micas in igneous rocks.
Columbite – Tantalite (Fe,Mn)(Nb,Ta)2O6: A ferro magnesium oxide mineral series with
columbite the niobium rich end member and tantalite the tantalum rich other end member.
Usually found in granitic pegmatites.
Cut-off criteria: A set of requirements for the quality and quantity of a mineral in subsoil,
for mining and other conditions of the deposit development that define the commercial value
of the deposit. The cut-off criteria are used to calculate mineral reserves.
Cut-off grade: The minimum concentration of a valuable component in a marginal sample of
the mineral. The cut-off grade is used to delineate parts of the deposit to be mined.
Dilution: Waste rock that is, by necessity, removed along with the ore in the mining process
subsequently lowering the grade of the ore.
Dip angle: The angle between the direction of the described geological structure and
horizontal plane.
Due Diligence: The procedure of forming an objective opinion about the investment facility
that includes investment risks, independent assessment of the facility, comprehensive
research on the company's operation, complex inspection of its financial status and market
position. Due diligence is usually performed prior to a business purchase, a merger
(acquisition) deal or start of cooperation with the company.
Dyke: An intrusive geological body with transversal contacts. The length of a dyke many
times exceeds its width, whereas the planes are nearly parallel. As such, a dyke is a fracture
that has been filled with magmatic melt.
Elbaite (Na(Mg,Fe,Li,Mn,Al)3(Al)6(BO3)3(Si)6.O18(OH,F)4): A multi coloured variety of
tourmaline.
Eucryptite (LiAlSiO4): A lithium rich aluminium silicate mineral found in pegmatites.
Euxenite ((Y,Ca,Ce,U,Th)(Nb,Ta,Ti)2O6): A complex rare element rich oxide found in
pegmatites.

Solid Resources Ltd
Alberta-1 Rare Metals Project May 2014 15
Feasibility Study: As defined by the CIM, a Feasibility Study is a comprehensive technical
and economic study of the selected development option for a mineral project that includes
appropriately detailed assessments of realistically assumed mining, processing, metallurgical,
economic, marketing, legal, environmental, social and governmental considerations together
with any other relevant operational factors and detailed financial analysis, that are necessary
to demonstrate at the time of reporting that extraction is reasonably justified (economically
mineable). The results of the study may reasonably serve as the basis for a final decision by a
proponent or financial institution to proceed with, or finance, the development of the project.
Feldspars: A group of silicate minerals with four distinct categories, potassium feldspars
(KAlSi3O4); sodium feldspars (NaAlSi3O8); calcium feldspars (CaAl2Si2O8); and barium
feldspars (BaAl2Si2O8).
Fergusonite ((Y,RE)NbO4): A complex oxide mineral containing various rare earth
elements in solid solution with yttrium.
Ferri-sicklerite (Li(Fe3+
)(PO4)): The lithium ferric member of the triphylite group of
minerals with the general formula AB(PO4) where A and B can be can be a combination of
Li, Na, Fe3+
, Fe2+
, Mn2+
and Mn3+
. Found in granite pegmatites.
Footwall: The rock on the underside of a vein or ore structure.
Foliation: A parallel orientation of platy minerals or mineral banding producing a planar
fabric within a rock.
Gadolinite (Y2FeBe2Si4O10) otherwise Ytterbite: A ytterbium, iron, beryllium silicate
mineral that can be found in coarsely crystalline igneous rocks and pegmatites. This mineral
often contains other rare earth elements such as Ce, La, and Nd.
Garnet (Mg,Ca,Fe)3Al2 (SiO4)3: Group of cubic silicate minerals with general formula
X3Z2(SiO4)3 where X can be Ca, Fe2+
, Mg etc and Z can be Al, Cr, Mn3+
. These minerals can
be found in a variety of rocks from igneous to metamorphic and also sedimentary rocks.
Geochemical Exploration: Exploration or prospecting methods depending on chemical
analysis of the rocks or soil, or of soil gas and plants.
Geological fault: Discontinuity of rock with or without a shift on the surface. Faults occur
due to the movement of rock masses.
Gneiss: A coarse-grained rock in which bands rich in granular minerals alternate with bands
in which schistose minerals predominate.
Granite: A coarsely crystalline igneous rock consisting essentially of quartz, alkali feldspar
and commonly mica.
Greenschist facies: Zone of low-grade metamorphic rocks characterised by low temperature
and moderate pressure metamorphism, typically 400°C to 500°C, at depths between 8 km to
50 km. Mineral suite typically consists of actinolite, epidote, chlorite, albite and quartz.
Hangingwall: The rock on the upper side of a vein or ore deposit.

Solid Resources Ltd
Alberta-1 Rare Metals Project May 2014 16
Hematite (Fe2O3): Iron oxide common in igneous, metamorphic and sedimentary rocks.
Heterosite ((Fe3+
,Mn3+
)PO4): Member of the triphylite mineral group (see ferri-sicklerite).
Host rock: Wall rock that confines the mineral occurrence zone.
Intrusion: A body of igneous rock that invades older rock. The invading rock may be a
plastic solid or magma that pushes its way into the older rock.
JORC Code: The Australasian Code for Reporting of Exploration Results, Mineral
Resources and Ore Reserves prepared by the Joint Ore Reserve Committee of the
Australasian Institute of Mining and Metallurgy, Australian Institute of Geoscientists and
Minerals Council of Australia. The current edition is dated 2012.
Kaolinite (Al2Si2O5(OH)4): A common clay mineral.
Lepidolite (K(Li,Al,Rb)3(Al,Si)4O10(F,OH)2): Lithium rich mica mineral found in granites
and pegmatites.
Mafic: Subsilicic, basic. Pertaining to or composed dominantly of the magnesian
rock-forming silicates; said of some igneous rocks and their constituent minerals. In general,
synonymous with ‘dark minerals’.
Magnetite (Fe3O4): Iron oxide common in igneous, metamorphic and sedimentary rocks,
strongly magnetic and an important source of iron.
Metamorphic rock: A rock that has, in a solid state, undergone changes in mineralogy,
texture, or chemical composition as a result of heat or pressure.
Metasomatite: The name of the rock that has undergone the metamorphic process in which
the chemical composition has changed significantly.
Mica: Group of sheet silicate minerals which characteristically have perfect basal cleavage.
Mine: A mineral mining enterprise. The term is often used to refer to an underground mine.
Mineral Deposit: A body of mineralisation that represents a concentration of valuable
metals. The limits can be defined by geological contacts or assay cut-off grade criteria.
Mining method: A combination of technical solutions that define the geometry, technology
and sequence of mining.
Monazite ((Ce, Gd, La, Pr, Sm, Th, Nd, Y) PO4): Series of phosphate minerals containing
a combination of rare earth elements. These minerals occur in granites, gneisses, aplites and
pegmatites and can be mildly radioactive.
Montebrasite (LiAl(PO4)(OH)): This mineral forms a series with amblygonite and occurs in
coarsely crystalline igneous rocks and pegmatites.

Solid Resources Ltd
Alberta-1 Rare Metals Project May 2014 17
Muscovite (KAl2(AlSi3O10)(F,OH)2): Sheet silicate mineral common in igneous and
metamorphic rocks, occurring as a detrital mineral in sedimentary rocks.
NI 43-101: Standards of Disclosure for Mineral Projects as dictated by the Canadian Institute
of Mining (CIM).
Open pit: A mine that is entirely on surface; also referred to as open-cut or open-cast mine.
Operational reserves: Balance mineral reserves that have been adjusted for dilution and
losses, and have been incorporated into a mine production schedule.
Ore: Natural mineral formation that contains valuable components in such compounds and
concentrations that make the mining technically and economically feasible.
Ore body: A body of mineralisation that either has been, or demonstrates a reasonable
probability of being mined profitably.
Ore field: A collection of mines that exploit a common mineral deposit or cluster of closely
related mineral deposits.
Orthogneiss: A gneiss formed from an igneous parent rock.
Overburden: Waste rock overlying and hosting mineral deposits that is subject to excavation
in the course of open-pit mining. The process of overburden removal to access and mine the
mineral is called stripping.
Petalite (LiAlSi4O10): Lithium phyllosilicate commonly associated with lepidolite and
spodumene, found similarly in coarsely crystalline igneous rocks and pegmatites.
Plagioclase (NaAlSi3O8 – CaAl2Si2O8): Type of feldspar mineral forms a solid solution
series between end members.
Porphyry: An igneous rock with large crystals in a fine crystalline matrix.
Processing: A combination of processes for primary treatment of solid minerals in order to
extract the products amenable to further technically and economically feasible chemical or
metallurgical treatment or use.
Pyrite (FeS2): Iron sulphide. Sulphide mineral which can contain refractory gold.
Run of mine (ROM): A term used loosely to describe ore of average grade as produced from
the mine.
Rutile (TiO2): An allotrope of titanium dioxide often found in igneous and metamorphic
rocks. The other allotropes are anastase and brookite.
Saleable ore: The term used to describe ore of average grade coming from the mine.
Sampling: The process of studying the qualitative and quantitative composition and
properties of natural formations comprising a deposit.

Solid Resources Ltd
Alberta-1 Rare Metals Project May 2014 18
Schist: Medium grade metamorphic rock characterised by a parallel arrangement of the bulk
constituent minerals.
Sedimentary rock: Rock formed by sedimentation of substances in water, less often from air
and due to glacial actions on the land surface and within sea and ocean basins. Sedimentation
can be mechanical (under the influence of gravity or environment dynamics changes),
chemical (from water solutions upon their reaching saturation concentrations and as a result
of exchange reactions), or biogenic (under the influence of biological activity).
Sericite ((KAl2(AlSi3O10)(F,OH)2): A finely crystalline variety of mica very similar to
muscovite. This mineral is a common hydrothermal alteration product of feldspar minerals.
Sphalerite (ZnS): A zinc sulphide which can contain variable amounts of iron. Commonly
found in hydrothermal veins.
Spodumene (LiAlSi2O6): Pyroxene silicate mineral occurs in pegmatites associated with
other lithium rich minerals. The mineral is metastable and is often found altered to mica or
clay minerals.
Stripping ratio: The relation of overburden volume to a mineral volume. A stripping ratio
largely defines the economic feasibility of open-pit mining.
Suite: An aggregate of conformable rock beds with similar general properties that
differentiate them from overlying or underlying rocks.
Tailings: Liquid wastes of mineral processing with valuable component grade lower than that
of the initial material.
Tailings facility: A complex of special structures and equipment used for storage of liquid
wastes of mineral processing (tailings).
Topaz (Al2SiO4(F,OH)2): A silicate mineral that can be found in pegmatites and veins in
granitic rocks.
Tourmaline (Na(Mg,Fe,Li,Mn,Al)3(Al)6(BO3)3(Si)6.O18(OH,F)4): A boron silicate mineral
found in granites, pegmatites and veins, as well as some metamorphic rocks.
Vein: Tabular geological body formed as a result of mineral substance filling a fracture or
due to metasomatic replacement of rock with mineral(s) along a fracture. Unlike dykes
formed primarily by magmatic rock, a vein is composed of vein and ore minerals (quartz,
carbonated, sulphides etc.).
Waste dump: An artificial dump formed as a result of disposing of overburden (waste rock)
at specially designated sites.
Zircon (ZrSiO4): This silicate mineral often contains trace amounts of uranium and thorium
and as a result it can be radioactive. Zircon forms in igneous rocks, but can often be found in
sedimentary rocks as a detrital mineral.

Solid Resources Ltd
Alberta-1 Rare Metals Project May 2014 19
2.8 ABBREVIATIONS
° degree (angle)
% percent
< Less than
> Greater than
£ Pound(s) sterling
A Amp(s)
A/m2 Amps per square metre
°C Centigrade
CIM Canadian Institute of Mining
CP Competent Person
d Day(s)
€ Euros
Fe Iron
g Gram(s)
g/L Grams per litre
g/t Grams per tonne
h Hour(s)
IRR Internal Rate of Return
kg Kilogramme
km Kilometre(s)
km2 Square Kilometre
kV Kilovolt(s)
kW Kilowatt(s)
kWh Kilowatt hour(s)
kWh/t Kilowatt hours per tonne
L Litre(s)
LCT Lithium-Caesium-Tantalum
Li Lithium
LOM Life-of-Mine
Ma Millions of years ago
m Metre(s)
mm Millimetre
µm Micron
m2 Square metre
m3 Cubic metre
m/s Metres per second
mg Milligram(s)
mg/L Milligrams per litre
Mn Manganese
Mt Million tonnes
Mt/a Million tonnes per year
Nb Niobium
NYF Niobium-Yttrium-Fluorine
ppm Parts per million
QA/QC Quality assurance/quality control
QP Qualified Person
REL-Li Rare element-Lithium
REL-REE Rare Element-Rare Earth Element

Solid Resources Ltd
Alberta-1 Rare Metals Project May 2014 20
ROM Run of Mine
s Second
Sn Tin
SRW Solid Resources Limited trading symbol
Ta Tantalum
t Tonne (metric, 2,204.6 pounds)
t/a Tonnes per year
t/d Tonnes per day
t/h Tonnes per hour
t/m Tonnes per month
TMF Tailings management facility
TSX Toronto Stock Exchange
US$ United States dollar(s)
V Volt(s)
VAT Value Added Tax
W Tungsten
Wt% Weight percent
XRF X-ray fluorescence
Zn Zinc
Solid Resources Ltd
Alberta-1 Rare Metals Project May 2014 21
3.0 RELIANCE ON OTHER EXPERTS
The authors of this Report have reviewed and analysed data provided by Solid and have
drawn their own conclusions therefrom, augmented by a direct field examination. The
authors have not conducted any independent exploration work, drilled any holes or performed
any sampling and assaying programmes.
While exercising all reasonable diligence in checking, confirming and testing it, the authors
have relied upon the data presented by Solid in preparing the Technical Report.
The descriptions of geology, mineralisation and exploration are taken from reports prepared
by various companies or their contracted consultants. The conclusions of this Report rely on
data available in published and unpublished reports, information supplied by the various
companies which have conducted exploration and or development activities on the property,
and information supplied by Solid. Where applicable, the source is noted in the text of this
Report and a list of references is provided in Section 27.0 of this Report. The information
provided to Solid appears to have been gathered by reputable companies and, having
reviewed the information Micon has no reason to doubt its validity.
The various agreements or licences under which Solid holds title to the mineral lands for this
project have not been investigated or confirmed by the author and no opinion is offered as to
the validity of the mineral title claimed.
This Technical Report has been prepared in accordance with Canadian National Instrument
43-101 Standards of Disclosure for Mineral Projects on behalf of Solid. It is based on
information available at the time of preparation, data supplied by outside sources, and the
assumptions, conditions and qualifications set out herein. This Report is intended to be used
by Solid, subject to the terms of its agreement with the authors.
The author acknowledges the helpful cooperation of Solid’s management and field staff, all
of whom made any and all data requested available and responded openly and helpfully to all
questions, queries and requests for material.
Micon retains the right to change or modify its conclusions if new or undisclosed information
is provided, which might change its opinion.

Solid Resources Ltd
Alberta-1 Rare Metals Project May 2014 22
4.0 PROPERTY DESCRIPTION AND LOCATION
4.1 LOCATION
The Alberta-1 Permit is situated in the north-west of Spain, approximately 25 km to the east
of Pontevedra (population circa 82,000) and 42 km north-west of Orense (population circa
108,000). The location is shown in Figure 4.1. The northern portion of the property is
located in the Pontevedra province, whilst the southern part lies in the province of Orense.
All the Alberta-1 Permit obligations are dealt with by the Orense mining authorities, since the
largest part of the permit surface area is located in this province.
Figure 4.1: Map Showing the Location of the Alberta-1 Project Area and the Port of Pontevedra
Source: Google Maps, 2014
4.2 MINERAL TITLE
Solid acquired the Alberta-1 Rare Metals Project in 2000.
Solid Mines España S.A.U., 100% owned by Solid Resources Limited, is the holder of 100%
of the mining rights (Section C) of the Alberta-1 Permit.
The area of the Alberta-1 Exploration Permit (Permiso de Investigación) is approximately
3,690 ha, corresponding to 123 cuadrículas mineras, (mineral concession unit used by
Spanish mining law each mining unit was defined by 20 seconds of latitude and 20 seconds
of longitude). The coordinates are 08º20´ longitude and 42º28´ latitude. A location map of
the permit area is shown in Figure 4.2. The area of the Exploitation Licence (Concesión de
Explotación) to be applied for will be reduced according to Spanish Mining Law
(2,395 hectares corresponding to 85 cuadrículas mineras).
Alberta I
Project Area
5 km 0 km 5 km 10 km

Solid Resources Ltd
Alberta-1 Rare Metals Project May 2014 23
Figure 4.2: Location Map of Alberta-1 Permit

Solid Resources Ltd
Alberta-1 Rare Metals Project May 2014 24
4.3 PERMITTING REQUIREMENTS
4.3.1 General
The governing law for mining operations in Galicia is formulated and regulated by the local
government of Galicia. It follows a National Mining Law framework, and local formulation
must fall within the National framework. At the present time, Solid management has
experienced that the government is favourably disposed toward mining activities.
4.3.2 Permits
The official name of the Permit is “Permiso de Investigación Alberta-1, 1ª Fracción,
Nº 4966.1” and it is valid until 14th
June, 2014. The Spanish Mining Law permits an
extension period to be applied to this date. There is an obligation to complete the planned
programme approved by the mining authorities during the period granted. Preparation of the
documentation for the application of the Exploitation Licence is currently in progress. In
accordance with the Spanish Mining Law, the Exploitation Licence can be granted initially
for a 30 year period, with possible extensions, up to a maximum of 90 years. The Permit is
granted for any element, mineral or substance included in “Sección C”. “Sección C”
according to Spanish law includes all elements, minerals or substances except energy types.
Therefore Sn, Ta, Nb, Li, Rb, Cs, W and industrial minerals are included.
According to Spanish Mining Law, the subsurface belongs to the State. There is a tax to be
paid annually for mining rights depending on the extension of land occupied by the licence,
not on production. In addition there is a local tax for the town depending on the depreciated
value of the facilities (plant, offices, stores) in place for the operation. No royalties are
payable for either the Exploration Permit (or licence) or the Exploitation Licence.
The environmental liabilities are applicable upon award of the Exploitation Licence
(Concesión de Explotación). Environmental studies are underway to be submitted with the
application for the Exploitation Licence. The boundaries are located within a perimeter
defined by 20 apices identified by geographical coordinates according to the Spanish Mining
Law specifications, as shown in Figure 4.3.
Permits from local communities, which hold surface rights, must be granted for access. To
date, the relationship with the local communities is excellent, and the work agreed has been
performed under contract with them. In the future, similar agreements should be carried out
with local interest groups.

Solid Resources Ltd
Alberta-1 Rare Metals Project May 2014 25
Figure 4.3: Detailed Location Map of Alberta-1 Permit

Solid Resources Ltd
Alberta-1 Rare Metals Project May 2014 26
5.0 ACCESSIBILITY, CLIMATE, LOCAL RESOURCES, INFRASTRUCTURE
AND PHYSIOGRAPHY
5.1 PROPERTY ACCESS
The Alberta-1 Permit is situated approximately 25 km to the east of Pontevedra city
(sea port), and 41 km from Vigo (international sea port). The area can be accessed from the
Orense-Pontevedra national main road N-541, followed by secondary asphalted roads, which
cross the Permit from north to south. Motorways to the east, south and west are located
around 25 km from the Permit. The Santiago de Compostela International Airport is located
40 km to the north.
5.2 CLIMATE
Galicia, in the north west of Spain, lies in an area known as “España Verde” (Green Spain).
The climate is Atlantic with Mediterranean influence in the some of the interior areas. The
Atlantic Ocean influences the climate and is characterised by slight variations in temperature,
mild winters and only moderately warm summers, with rainfall interspersed by dry spells
producing the green countryside (see Table 5.1).
Table 5.1: Climate Data for Orense
Month Jan Feb Mar Apr May Jun Jul Aug Sep Oct Nov Dec Year
Average High °C/(°F) 12.1
(53.8)
14.7
(58.5)
18.1
(64.6)
19.0
(66.2)
22.3
(72.1)
26.7
(80.1)
29.7
(85.5)
29.9
(85.8)
26.6
(79.9)
20.9
(69.6)
15.5
(59.9)
12.7
(54.9)
20.6
(69.1)
Daily Mean °C/(°F) 7.5
(45.5)
9.2
(48.6)
11.4
(52.5)
12.7
(54.9)
15.7
(60.3)
19.4
(66.9)
22.1
(71.8)
22.0
(71.6)
19.4
(66.9)
15.1
(59.2)
10.8
(51.4)
8.5
(47.3)
14.5
(58.1)
Average Low °C/(°F) 2.9
(37.2)
3.7
(38.7)
4.6
(40.3)
6.3
(43.3)
9.2
(48.6)
12.2
(54)
14.6
(58.3)
14.2
(57.6)
12.3
(54.1)
9.3
(48.7)
6.1
(43)
4.4
(39.9)
8.3
(46.9)
Precipitation mm (inches) 90
(3.54)
81
(3.19)
54
(2.13)
70
(2.76)
67
(2.64)
39
(1.54)
19
(0.75)
23
(0.91)
57
(2.24)
97
(3.82)
93
(3.66)
124
(4.88)
817
(32.17)
Average Precipitation Days
(≥ 1 mm) 10 10 8 11 10 5 3 3 6 10 10 11 97
Mean Monthly
Sunshine Hours 87 105 167 180 199 239 272 270 201 138 90 70 2,043
Source: Valores Climatólogicos Normales – Orense, Agencia Estatal de Meteorología
Because of its location, stretching from the sea to the central plateau of Spain, the weather in
Galicia tends to vary from area to area. In the permit area, temperatures range from a
minimum daily average temperature of -0.9ºC in winter, to a maximum daily average
temperature of 25.4ºC in summer. The average rainfall is between 817 mm and 1,462 mm
per annum.
The summers can be quite dry with a high risk of fire due to the high density of vegetation.
Consequently, special precautions during the operations must be taken during this time of
year.
5.3 LOCAL RESOURCES
There is a power line crossing the permit area and there is also a wind farm situated on the
western edge. Both these options are possible for the supply of electrical power to the mining
operations and processing plants.

Solid Resources Ltd
Alberta-1 Rare Metals Project May 2014 27
Water supplies are readily available year around from the local rivers as the rainfall is high
and quite constant throughout most of the year. However, there can be local supply shortages
during the summer. The water supply to the mining operations should be integrated with the
needs of the local population living in the affected areas. Permits for water usage from the
legal authorities must be applied for prior to commencing exploration and mining operations.
There are several villages situated in and around the permit area, mainly down the eastern
edge (Figure 4.3), which could supply skilled workers. Many of these workers were working
in the manufacturing, construction and infrastructure sectors, which have recently been
seriously cut back due to the financial crisis.
Land for mining access, waste disposal areas, storage areas and processing plants is easily
available for rent, as most of the properties are managed by public communities, which would
benefit from any future mining.
5.4 INFRASTRUCTURE
The Alberta-1 project lies in a region with good existing infrastructure; there are good road
links close the permit area in addition to the close proximity of an international sea port. The
project is however still at the exploration stage and the site infrastructure is at the planning
stage.
Within the area of the Exploitation Licence (Concesión de Explotación), there are sufficient
surface rights for mining operations, potential tailings storage areas, potential waste disposal
areas and potential processing plant sites.
5.5 PHYSIOGRAPHY
The Alberta-1 project is located in an area characterised by narrow valleys and rounded hills,
some with steep slopes. The topography of the permit area ranges from 431 m to 931 m
above sea level. The soils are well developed, especially in the valleys, with bedrock
outcrops mainly on the hills and slopes.
The streams and rivers in the permit area north of Ermida de Santo Domingo flow north into
the Rio de Castro whilst those south of Ermida de Santo Domingo flow south into the Rio
Doade.
The main vegetation in this location is comprised of bush (gorse and heather) and woods
containing oak and pine trees. There are areas of pasture for cows and sheep and cultivated
fields where the local inhabitants grow vegetables and cereal crops.

Solid Resources Ltd
Alberta-1 Rare Metals Project May 2014 28
6.0 HISTORY
Mining and exploration work was conducted from the 1940’s to the 1980’s within the permit
area. Old mine workings include open pits and some adits excavated in the softer and more
kaolinised parts of the pegmatites. Most were made in the 1940's and 1950's by local miners,
often in pursuit of small deposits exposed in streambeds. This activity ceased in the early
1960's.
In 1970 and 1971 Compañía Estañífera de Galicia exploited cassiterite in a relatively large
dyke in the northern area of the permit, especially in the underground mine at Presqueiras.
These underground workings cover an area approximately 100 m by 100 m, and have
overlapping galleries on four levels, following the dip of the pegmatitic structure, with dyke
thicknesses of over 10 m.
Between 1972 and 1974, the Geological and Mining Institute of Spain (IGME) conducted a
general study of the area, to identify potential sources of tin and tungsten mineralisation. A
survey of surface rock samples and soil geochemistry was undertaken and concentration tests
were performed.
Between 1981 and 1985 a large area in the south of the permit was investigated by the
state-owned company ADARO. The work carried out included: mapping, soil and rock
geochemistry, trenching, and the drilling of eight core holes totalling 586.9 m. In addition,
various tests on concentrate production were conducted.
In 1982, a joint venture by the companies SEVELAR and RÍO IBEX began an exploration
programme with geological mapping and trenching in the north of the permit area near the
Presqueiras mine and at Coto Tocayo permit area further to the south. This was followed by
a programme of twenty core drill holes, with a total of 2,069 m drilled over the two areas.
No reliable result information obtained during the exploration work completed since 1972
undertaken by previous companies has been found. Some information can be found in the
reports prepared by Dr. Rolf Burkhardt (2003, 2005). This historical information has not
been used by the authors. No information has been found on production, mineral resource
estimates or mineral reserve estimates.

Solid Resources Ltd
Alberta-1 Rare Metals Project May 2014 29
7.0 GEOLOGICAL SETTING AND MINERALISATION
7.1 GEOLOGICAL SETTING
7.1.1 Regional Geology
The mineralised pegmatites of the Alberta-1 Project are situated within the Galicia-Tras-os-
Montes Zone of the north-west Iberian Massif, formed during the Variscan Orogeny between
370 Ma to 290 Ma by the convergence and collision of the continents Laurasia and
Gondwana (Abati, et al., 2010).
The Iberian Massif is bounded to the north-east and south-south east by fold belts, the
Pyrenean and Betic respectively, which together form part of the Alpine belt. To the west the
Iberian Massif is bounded by the continental margin formed by the opening of the Atlantic
Ocean. The Iberian Massif is comprised of five zones parallel and concentric to the
Ibero-Armorican Arc that include the Cantabrian Zone (CZ), West Asturian-Leonese Zone
(WALZ), Central Iberian Zone (CIZ), Ossa-Morena Zone (OMZ) and the South Portuguese
Zone (SPZ) (Gibbons and Moreno, 2002). The tectono-stratigraphic zones of the Iberian
Massif are provided in Figure 7.1.
Figure 7.1: Schematic Map of the Tectono-Stratigraphic Zones of the Iberian Massif
(After Gibbons and Moreno, 2002)
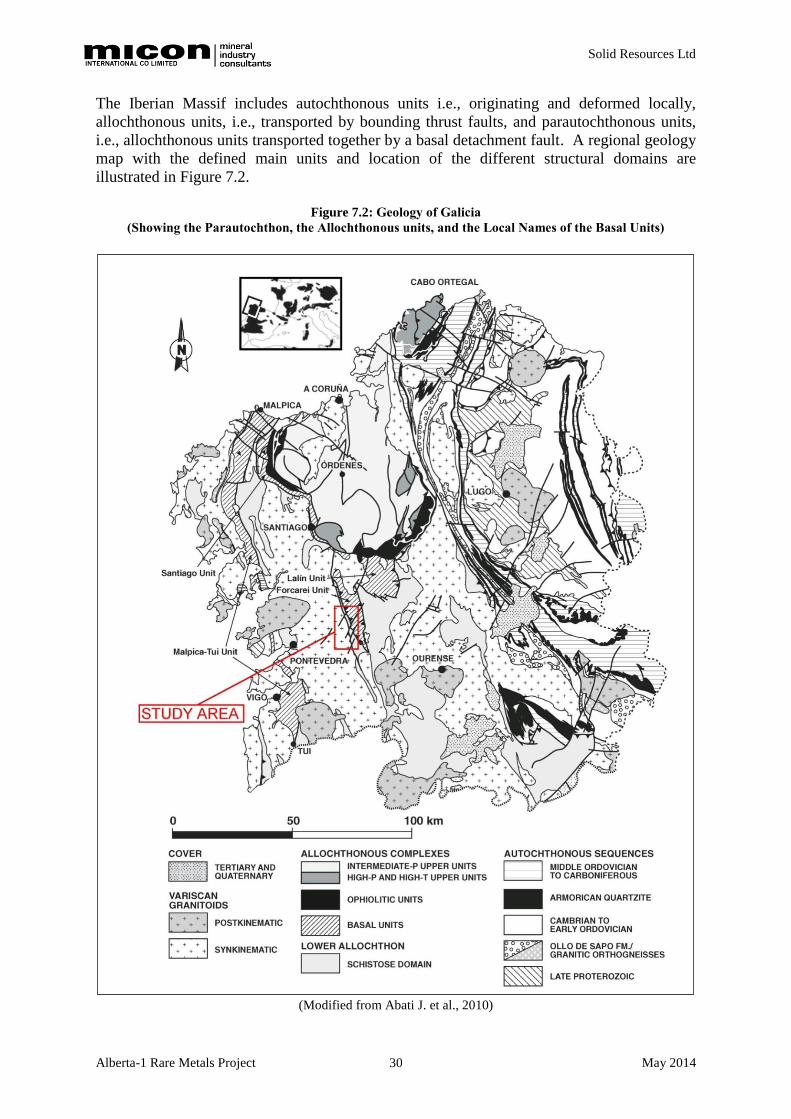
Solid Resources Ltd
Alberta-1 Rare Metals Project May 2014 30
The Iberian Massif includes autochthonous units i.e., originating and deformed locally,
allochthonous units, i.e., transported by bounding thrust faults, and parautochthonous units,
i.e., allochthonous units transported together by a basal detachment fault. A regional geology
map with the defined main units and location of the different structural domains are
illustrated in Figure 7.2.
Figure 7.2: Geology of Galicia
(Showing the Parautochthon, the Allochthonous units, and the Local Names of the Basal Units)
(Modified from Abati J. et al., 2010)
Solid Resources Ltd
Alberta-1 Rare Metals Project May 2014 31
The autochthonous realm locally comprises metamorphic rocks ranging from very low grade
to catazonal and plutonic rocks. The metamorphic rocks comprise a thick metasedimentary
sequence inferred to have been deposited on the northern Gondwanian margin during late
Neoproterozoic and Palaeozoic times (Abati, et al., 2010).
The allochthon is the remnant of a huge and structurally complex nappe stack preserved in
the core of late Variscan synforms. The allochthonous units occur above the Iberian
autochthon and exhibit different degrees of exoticism (Gómez-Barreiro, et al., 2010).
The Galicia-Tras-os-Montes Zone that hosts the mineralised pegmatites, does not fit the
continuous and concentric trend of the rest of the zones making up the Iberian Massif and
represents a parautochthonous crustal block, thrust over the Central Iberian Zone (Farias et
al., 1987). This zone includes the allochthons of Cabo Ortegal, Órdenes and Malpica-Tui in
Galicia (Spain), and of Bragança and Morais in Trásos-Montes (Portugal), as well as a
common underlying thrust sheet which has been called the Schistose, Parautochthonous or
Lower Autochthon Domain (Martínez Catalán, 2007).
The units of the Galicia-Tras-os-Montes Zone are grouped into basal, intermediate or
ophiolitic and upper units according to their structural position within the thrust pile. Many
of the units have recrystallised under deep conditions and represent lower crust and upper
mantle. The basal units represent the most external margin of Gondwana and provide
magmatic evidence for Ordovician rifting, mostly linked to the Rheic Ocean, and
metamorphic evidence for early Variscan subduction (Arenas, et al., 2007).
The Galicia-Tras-os-Montes Zone records the progressive incorporation onto the orogenic
prism of a volcanic arc, as well as the partial westward subduction of the outermost margin of
Gondwana. The volcanic arc is represented by an imbricate pile of oceanic lithosphere of
various ages that overlay the subducted basal units. The blocking of continental subduction
in the late Devonian marked the transition to a collisional regime. The subducted basal units
were over-thrust onto the external platform of Gondwana in the early Carboniferous and a
sheet of sediments was wedged underneath forming the Schistose Domain (Martínez Catalán,
2007).
The mineralised pegmatites intrude a mica schist unit of the Schistose Domain that strikes
north-north-west to south-south-east (Paraño group), and is bounded to the east by the
Forcarei unit (allochthonous synform), and to the west by a two mica, syn-kinematic granite.
7.1.2 Local Geology
The Presqueiras-Taboazas mineralised rare element pegmatites are included within a belt
approximately 350 m wide, extending 11 km (in the area of the permit) in a north-north-west
to south-south-east direction, conforming to the regional schistosity, and to the contact of the
two mica syn-kinematic granites outcropping to the west. The syn-kinematic granite is the
fertile granite responsible for the mineralised pegmatites.
Numerous pegmatite dykes and sill-like structures are hosted within the mica schist belt and
occur as sharply bounded homogeneous to zoned bodies within the Paraño Group of the
Schistose Domain. The enrichment of the rare elements in the pegmatite dykes is dependent
on the distance from the contact between the mica schist and the two mica granite. The
mineralised dykes are situated from 600 m in the Presqueiras zone to 1,600 m in the

Solid Resources Ltd
Alberta-1 Rare Metals Project May 2014 32
Taboazas zone from the contact with the granite. Pegmatite dykes within 600 m of the
contact with the two mica granite are unmineralised. The mineralised pegmatite dykes
exhibit an increase in the grade of cassiterite and columbite-tantalite to the east. A detailed
geological map, with the main pegmatite dykes defined and their relationship to the granite,
host rock, and thrust of the Forcarei unit, is shown in Figure 7.3.
Figure 7.3: Detailed Geological Map of Alberta-1 Permit
(Showing the Presqueiras-Taboazas Mineralised Pegmatite Field)

Solid Resources Ltd
Alberta-1 Rare Metals Project May 2014 33
The rock types in the pegmatite field and adjacent areas are described in the following
sections.
7.1.2.1 Pegmatites
The pegmatite dykes are Carboniferous in age and are dated from 318 Ma to 316 Ma
(Fernández, et al., 2009). The pegmatite dykes were intruded along the mica schist belt
during the third regional phase of deformation resulting in asymmetric folding. The
pegmatite dykes strike in a 160° direction, which is the direction of the main vertical
schistosity of the host rock, and dip to the west variably between 0º and 60º, toward the
source granite. The initial temperature of crystallisation is estimated at around 600ºC at a
pressure of 2.5 kbar to 3.5 kbar (Hensen, 1967).
There are two types of pegmatite dykes observed in the field area: the mineralised albite
pegmatite dykes and the mica pegmatite dykes. The crystal size is variable and locally aplitic
dykes are observed exhibiting a fine crystal size. The mica pegmatite dykes are elongated
parallel to the granite contact and occur in close proximity to it.
The mineralised albite pegmatite dykes are intruded discordant to the mica schist host rock.
The mica schists are in contact both in the hanging wall and the footwall of each dyke. The
dimensions of the dykes determined from drilling intersections are up to 15.6 m thick, 550 m
long, 300 m wide and are open at depth and along strike. The average thickness varies from
2.8 m to 8.6 m. Weathering is irregular in depth and intensity and affects the dykes up to a
depth of 30 m. The depth of the dykes varies from surface to 244.7 m, 160 m vertical depth.
Figure 7.4 shows a mineralised pegmatite dyke folded and faulted, hosted by the mica schist
unit.
Figure 7.4: Photograph of a Pegmatite Dyke Outcrop
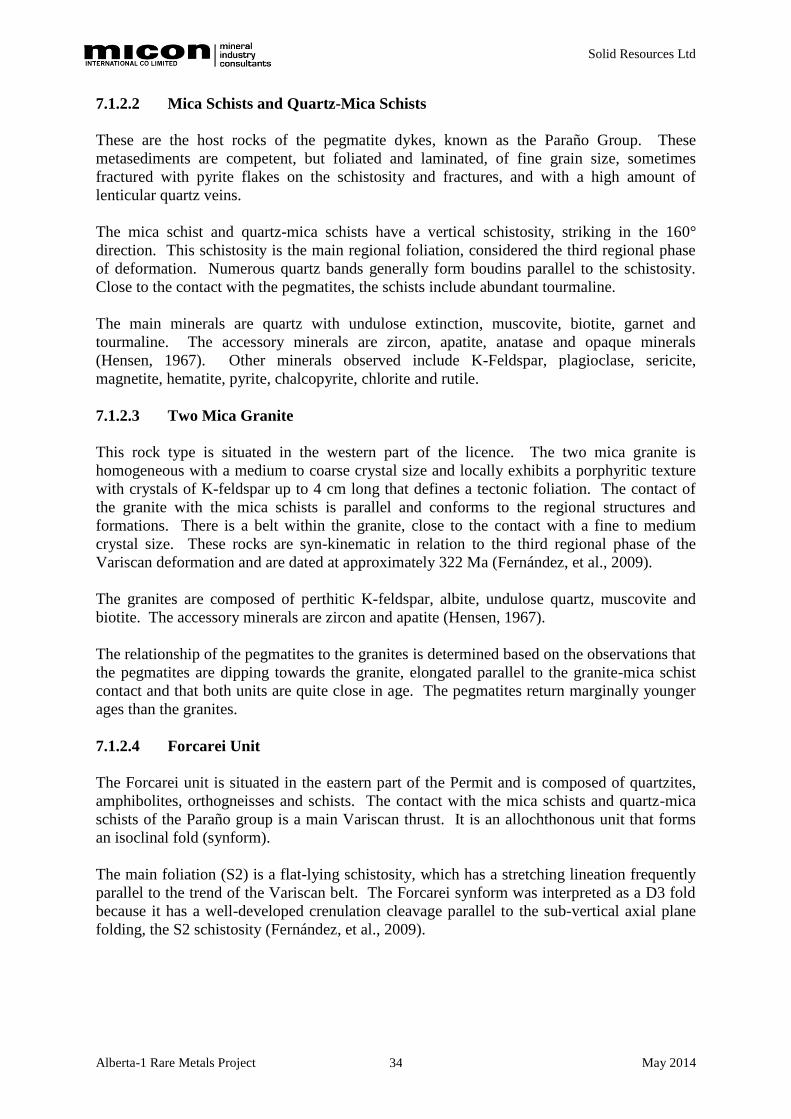
Solid Resources Ltd
Alberta-1 Rare Metals Project May 2014 34
7.1.2.2 Mica Schists and Quartz-Mica Schists
These are the host rocks of the pegmatite dykes, known as the Paraño Group. These
metasediments are competent, but foliated and laminated, of fine grain size, sometimes
fractured with pyrite flakes on the schistosity and fractures, and with a high amount of
lenticular quartz veins.
The mica schist and quartz-mica schists have a vertical schistosity, striking in the 160°
direction. This schistosity is the main regional foliation, considered the third regional phase
of deformation. Numerous quartz bands generally form boudins parallel to the schistosity.
Close to the contact with the pegmatites, the schists include abundant tourmaline.
The main minerals are quartz with undulose extinction, muscovite, biotite, garnet and
tourmaline. The accessory minerals are zircon, apatite, anatase and opaque minerals
(Hensen, 1967). Other minerals observed include K-Feldspar, plagioclase, sericite,
magnetite, hematite, pyrite, chalcopyrite, chlorite and rutile.
7.1.2.3 Two Mica Granite
This rock type is situated in the western part of the licence. The two mica granite is
homogeneous with a medium to coarse crystal size and locally exhibits a porphyritic texture
with crystals of K-feldspar up to 4 cm long that defines a tectonic foliation. The contact of
the granite with the mica schists is parallel and conforms to the regional structures and
formations. There is a belt within the granite, close to the contact with a fine to medium
crystal size. These rocks are syn-kinematic in relation to the third regional phase of the
Variscan deformation and are dated at approximately 322 Ma (Fernández, et al., 2009).
The granites are composed of perthitic K-feldspar, albite, undulose quartz, muscovite and
biotite. The accessory minerals are zircon and apatite (Hensen, 1967).
The relationship of the pegmatites to the granites is determined based on the observations that
the pegmatites are dipping towards the granite, elongated parallel to the granite-mica schist
contact and that both units are quite close in age. The pegmatites return marginally younger
ages than the granites.
7.1.2.4 Forcarei Unit
The Forcarei unit is situated in the eastern part of the Permit and is composed of quartzites,
amphibolites, orthogneisses and schists. The contact with the mica schists and quartz-mica
schists of the Paraño group is a main Variscan thrust. It is an allochthonous unit that forms
an isoclinal fold (synform).
The main foliation (S2) is a flat-lying schistosity, which has a stretching lineation frequently
parallel to the trend of the Variscan belt. The Forcarei synform was interpreted as a D3 fold
because it has a well-developed crenulation cleavage parallel to the sub-vertical axial plane
folding, the S2 schistosity (Fernández, et al., 2009).

Solid Resources Ltd
Alberta-1 Rare Metals Project May 2014 35
7.2 MINERALISATION
The mineralisation is defined in terms of the three main elements with possible profitable
economic value; tantalum, tin and lithium. For the purposes of exploration, the permit area
has been divided into six areas along the mineralised pegmatite field within the mica schist
belt. From north to south the names of the areas are: Presqueiras, Correa, Coto Tocayo,
Acebedo, Rubillón and Taboazas, Figures 4.3 and 10.1 illustrate the location of these areas.
7.2.1 Geometry and Structure
The pegmatite dykes are intruded within the mica schist host rock and are elongated in the
160°direction, approximately the direction of the main schistosity. The hanging wall and
footwall contacts of the mineralised pegmatite dykes are irregular, but are more or less
parallel to each other and are angled in relation to the vertical schistosity, clearly visible in
the mica schist and quartz-mica schist host rocks. The thickness is variable and has been
calculated from the intersections of the drill holes. The thickness of the dyke intersections in
the Presqueiras deposit are close to the true thicknesses and approximately 90% of the true
thicknesses in the rest of the areas of the permit. Details on thicknesses and dimensions of
the dykes can be found in Sections 10.0 and 14.0 including Figures to illustrate the geometry
and structure of the deposits.
7.2.1.1 Presqueiras
The mineralisation includes two main pegmatite dykes, and extends along 700 m with a
width of 300 m. The dykes are continuous and the thicknesses are variable, up to a maximum
of 15.6 m. The average thickness varies from 2.8 m to 8.6 m. The strike of the pegmatite
dykes is 160°, and the dip is variable from sub-horizontal in the northern zone up to 40º to the
west in the southern zone. The maximum depth intersected by the drill holes of the main
mineralised dyke is 158.40 m. There is a possible extension of mineralisation to the north
and south.
There is a zonation of the distribution of tin and tantalum within the main pegmatite dykes,
with the enrichment increasing to the eastern part. The lithium grade distribution is irregular,
however in general it is high in the western part of the mineralisation where the grades of tin
and tantalum are lower.
7.2.1.2 Correa
One mineralised pegmatite dyke was intersected by two drill holes. The mineralisation is
continuous and extends approximately 300 m along the strike in a 160° direction and 100 m
in the 070° direction, with a possible extension of 200 m more to the west to be confirmed by
future drilling. A main dyke was intersected with a variable thickness from 3.4 m to 5.3 m
dipping 20º to the west. There is a possible extension of the mineralisation to the north, south
and west.

Solid Resources Ltd
Alberta-1 Rare Metals Project May 2014 36
7.2.1.3 Coto Tocayo
The mineralisation includes two main pegmatite dykes, and extends 450 m along the strike,
and 200 m in the 070° direction. The dykes are considered continuous, although this will be
tested by future infill drilling, and the thicknesses are variable from a minimum of 2.65 m to
a maximum of 12.05 m. The strike of the pegmatite dykes is from 140° to 150°, and the dip
is about 40º to the west. The maximum depth of the main mineralised dyke intersected by the
drill holes is 101.5 m. There is a possible extension of mineralisation to the north, south and
west.
7.2.1.4 Acebedo
The mineralisation includes one important main pegmatite dyke intersected by four drill
holes. The mineralisation is continuous and extends approximately 600 m along the strike, in
a 155° direction and 200 m in the 070° direction. The mineralisation has the potential to be
extended 200 m to the west, this will be tested by future drilling. The main dyke was
intersected with a variable thickness from 4.75 m to 11.5 m, dipping 20° to 40º to the west.
There is a possible extension of mineralisation to the north, south and west.
7.2.1.5 Rubillón
One mineralised pegmatite dyke was intersected by two drill holes. The mineralisation is
continuous and extends 200 m along the strike in a 160° direction and 100 m in a 070°
direction. A main dyke was intersected with a variable thickness from 4.55 m to 6.05 m and
dipping 35º to the west. There is a possible extension of mineralisation to the north, south
and west.
7.2.1.6 Taboazas
The mineralisation extends 400 m along the strike, and 200 m in a 070° direction, it includes
two main pegmatite dykes. The dykes have been intersected by four drill holes, they are
continuous and the thickness is variable from a minimum of 4.1 m to a maximum of 10.4 m.
The strike of the pegmatite dykes is 150° with the dip variable from 40º to 60º to the west.
The depth varies from surface outcrop to a maximum of 244.7 m (160 m vertical depth) in
hole SO-11-27. There is a possible extension of mineralisation to the north, south and west.
The distribution of high grades of tin, tantalum and lithium is quite constant along the strike
of the main pegmatite dykes. Additional drilling will provide information about the zonation
perpendicular to the strike.
7.2.2 Mineralogy
A mineralogical and petrographic study of 17 core samples from Presqueiras and Taboazas
drill holes was carried out. In addition, a mineralogical and micro-analytical study of two of
these samples by ESEM-EDS and EPMA was completed by F. Gervilla, from September,
2011 to January, 2012. Mr Gervilla is a Professor at Granada University.

Solid Resources Ltd
Alberta-1 Rare Metals Project May 2014 37
The major minerals of the mineralised pegmatites are:
Albite 30% to 50%;
Quartz 25% to 35%;
K-feldspar (orthoclase, microcline) 5% to 10%;
Muscovite 4% to 8%: and,
Spodumene up to 10%.
The minor minerals are cassiterite, columbite-tantalite, eucryptite, petalite, amblygonite,
kaolinite, apatite, sphalerite, zircon and chlorite.
The paragenetic relationships of the pegmatitic phase, which constitutes the bulk of the
pegmatites in the order of formation described by Hensen (1967) are:
1. K-feldspar and quartz, some albite);
2. Albite and petalite;
3. Spodumene and quartz, some albite;
4. Sugary albite, muscovite, quartz, cassiterite, beryl and accessory minerals
(columbite-tantalite).
Figure 7.5 shows the texture of a pegmatite core sample (major minerals: albite, orthoclase,
quartz, and muscovite). Xenomorphic-hypidiomorphic texture shows some partially
dissolved crystals of orthoclase (in the centre).
Figure 7.5: Microphotograph of Pegmatite Core Sample
Note: Picture was taken under transmitted crossed polarised light.

Solid Resources Ltd
Alberta-1 Rare Metals Project May 2014 38
7.2.2.1 Tantalum and Niobium
Tantalum and niobium occur mainly as columbite-tantalite minerals. Columbite,
(Mg,Ti,Fe,Mn)Nb2O6, is an end member of a columbite-tantalite solid solution series with
Tantalite (Mg,Ti,Fe,Mn)Ta2O6, the other end member of the solid solution series.
Columbite-tantalite crystals are commonly black, prismatic to tabular with a crystal size up to
200 µm by 50 µm, irregularly disseminated in the pegmatite (exceptionally, crystals up to
800 µm by 25 µm can be seen). The crystals are frequently zoned, depending on the Ta/Nb
ratio. There are also inclusions of columbite-tantalite crystals within the cassiterite
(see Figures 7.6 and 7.7).
Figure 7.6: Microphotograph of Prismatic-Tabular Crystals of Columbite-Tantalite
Note: Picture was taken under reflected, parallel light.
Figure 7.7: Back-Scattered Electron Images of Crystals of Columbite-Tantalite
Note: Showing diverse patterns of sector zoning. The light areas correspond to compositions rich in Ta whereas
grey to dark-grey areas correspond to compositions rich in Nb.
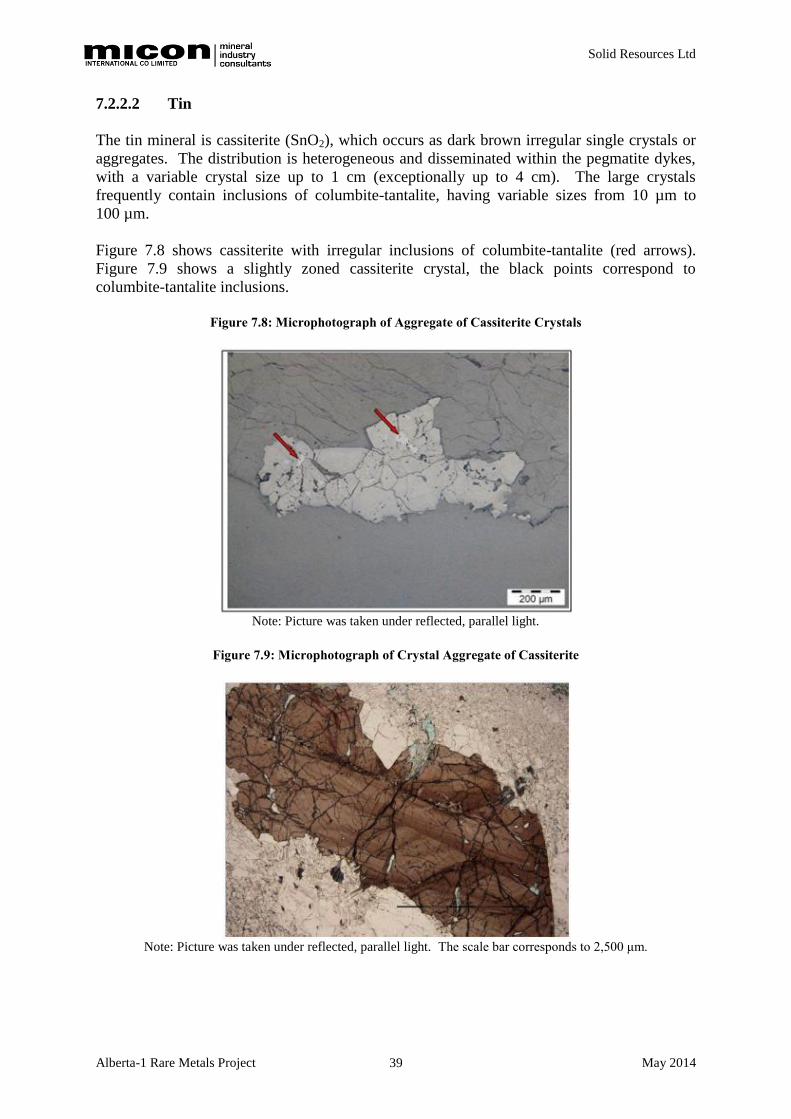
Solid Resources Ltd
Alberta-1 Rare Metals Project May 2014 39
7.2.2.2 Tin
The tin mineral is cassiterite (SnO2), which occurs as dark brown irregular single crystals or
aggregates. The distribution is heterogeneous and disseminated within the pegmatite dykes,
with a variable crystal size up to 1 cm (exceptionally up to 4 cm). The large crystals
frequently contain inclusions of columbite-tantalite, having variable sizes from 10 µm to
100 µm.
Figure 7.8 shows cassiterite with irregular inclusions of columbite-tantalite (red arrows).
Figure 7.9 shows a slightly zoned cassiterite crystal, the black points correspond to
columbite-tantalite inclusions.
Figure 7.8: Microphotograph of Aggregate of Cassiterite Crystals
Note: Picture was taken under reflected, parallel light.
Figure 7.9: Microphotograph of Crystal Aggregate of Cassiterite
Note: Picture was taken under reflected, parallel light. The scale bar corresponds to 2,500 μm.

Solid Resources Ltd
Alberta-1 Rare Metals Project May 2014 40
7.2.2.3 Lithium
The main lithium minerals are spodumene (LiAlSi2O6, 8.03% of Li2O) and petalite
(LiAlSi4O10, 4.5% of Li2O). There are also small quantities of the minerals eucryptite and
montebrasite. Ferri-sicklerite and heterosite minerals have been described by Hensen (1967).
Spodumene occurs either irregularly distributed among quartz and orthoclase or randomly
concentrated in several zones. The crystal size varies from a few hundred microns to 3 mm.
Spodumene also occurs as micro-intergrowths with quartz where it becomes slightly replaced
by eucryptite. It forms corroded crystals included in K-feldspar and albite crystals.
Petalite occurs as sub-rounded to irregular crystals mainly included in albite, with variable
crystal sizes from 100 µm to 500 μm.
Figure 7.10 shows the distribution of spodumene among albite and quartz crystals under
transmitted crossed polarised light. Figure 7.10 shows the distribution of spodumene among
albite and quartz crystals.
Figure 7.10: Microphotographs – Spodumene
Note: Picture was taken under transmitted crossed polarised light.
Figure 7.11: Microphotographs – Spodumene
Note: Picture was taken under reflected, parallel light.
Figure 7.12 (a) is a back-scattered image of spodumene crystals associated with albite
showing the characteristic double cleavage intersection at approximately 90°. Figure 7.12 (b)
shows a sub-rounded crystal of petalite included within albite and associated with muscovite.
The latter is partially replaced by kaolinite.

Solid Resources Ltd
Alberta-1 Rare Metals Project May 2014 41
Figure 7.12: Back Scattered Images of (a) Spodumene Crystals (b) Sub-Rounded Petalite Crystal
(a)
(b)
7.2.2.4 Mineralogical Study of Lithium Minerals
A mineralogical analysis was carried out by Dr. M. Fuertes Fuente (University of Oviedo) in
January 2014 on a sample of the tailings treated in the pilot plant from the bulk sample
extracted in Presqueiras. The objective of the study is to quantify the amount and
composition of the different lithium minerals identified (spodumene, petalite, amblygonite).
The methodology employed in this study consisted of the following stages:
1. Weighing and sieving of the sample in order to obtain the different grain-size
fractions as suggested by the patron company.
2. Division of these grain-size fractions with a riffle sample divider to obtain a
representative sample of each.
3. For each of these representative samples, separation of a heavier and a lighter
concentrate, achieved by employing the heavy liquid method.
4. Resin encasement of the grains of these two concentrates from each fraction to form
cylinders from which thin section slides (thin sections) may be obtained.
5. Study by optical microscopy of the thin sections obtained from the concentrates (both
dense and light).
6. Subsequent microanalysis of these thin sections using a scanning electron microscope
equipped with an X-ray spectrometer (EDX).
Through this study, the results of which are summarised in Table 7.1, it has been possible to
identify that in the dense concentrates of all the grain-size fractions the principal lithium
containing mineral is spodumene, representing more than 90%, accompanied by amblygonite,
at 1% to 3%. The light concentrates comprise lithium containing phases of petalite at 1%,
although it was not present in all the grain-size fractions, and compound grains of spodumene
and quartz at between 2% and 10%. The percentage of spodumene present in the light
concentrate increases with increasing grain size, as is shown in Table 7.1, owing to lower
liberation of the spodumene that generally displays in compound grains alongside quartz.

Solid Resources Ltd
Alberta-1 Rare Metals Project May 2014 42
Table 7.1: Summary of the Mineralogical Study of Dense and Light Concentrates
(From the Presqueiras (Pontevedra) Pegmatite Dykes)
Grain-Size Fraction
Lithium Bearing Minerals
Dense Concentrate
(%)
Light Concentrate
(%)
1 mm > F > 710 µm Spodumene > 90%
Amblygonite 2%
Spodumene 10%
Petalite 1%
710 µm > F > 500 µm Spodumene > 90%
Amblygonite 2% to 3% Spodumene 7%
500 µm > F > 250 µm Spodumene > 90%
Amblygonite 2% to 3%
Spodumene 2%
Petalite 1%
F < 250 µm Spodumene > 90%
Amblygonite 1% to 2% Spodumene 2% to 3%
Figure 7.13 shows an electron microscope image of a spodumene crystal with the X-ray
spectrum of EDX microanalysis. The table at the base of the figure shows the weight % of
the analysed elements marked in the electron microscope image. Identification is based on
composition.
Figure 7.13: Electron Microscope Image of Spodumene Crystal
7.2.2.5 Other Minerals
Significant quantities of Rubidium and Caesium have been reported by the laboratory on the
chemical assays. However, Rb and Cs minerals have not been observed in the mineralogical
study. Muscovite and biotite are the main minerals with important quantities of Rb and Cs
according to the mineralogical and micro-analytical study by EPMA. There are also
significant quantities within tourmaline, spodumene, albite and orthoclase minerals.
Therefore, the possibility of extraction at present, of these minerals is very unlikely, from a
technical and economic point of view. These elements will not affect the recovery of the
other elements, because they are included mainly in the tailings of the concentration plant.

Solid Resources Ltd
Alberta-1 Rare Metals Project May 2014 43
8.0 DEPOSIT TYPES
Derived from the depth-related “formations” of Ginsburg et al. (1979), five classes of granitic
pegmatites are distinguished, based on the pressure (and, in part, temperature) conditions that
characterise their host-rock suites. These classes are Abyssal, Muscovite,
Muscovite-Rare‐element, Rare‐element (REL) and Miarolitic (Cerny and Ercit, 2005). The
Rare‐element (REL) class can be divided into different subclasses, types and subtypes, as
showed in Table 8.1.
Table 8.1: Rare Element Class Pegmatite Classification
(From Cerny and Ercit (2005))
Subclass Type Subtype Geochemical
Signature Typical Minerals
Metamorphic
Environment
Relation to
Granites
REL‐REE
allanite‐monazite LREE, U, Th,
(Be, Nb>Ta, F, [P])
allanite, monazite, zircon,
rutile, fluorite, ilmenite
Variable, largely
shallow and postdating
regional events affecting
the host rocks
Interior to
marginal (rarely
exterior)
euxenite L‐H‐REE, Y, Ti, Zr,
Nb>Ta (F, P)
euxenite, monazite,
xenotime, zircon, rutile,
ilmenite, (fergusonite,
aeschynite, zinnwaldite)
gadolinite Be, Y, HREE, Zr, Ti,
Nb>Ta, F (P)
gadolinite, fergusonite,
samarskite, zircon, rutile,
ilmenite, fluorite,
(zinnwaldite)
REL‐Li
beryl
beryl‐columbite Be, Nb‐Ta
(+/‐Sn, B)
beryl, columbite,
tantalite, (rutile)
Low‐P, Abukuma
amphibolite
(andalusite‐sillimanite)
to upper green schist
facies, ~2 to 4 kbar,
~ 650 to 450°C
(Interior to marginal to)
exterior
beryl‐columbite
phosphate
Be, Nb‐Ta, P
(Li, F, +/‐Sn, B)
beryl, columbite,
tantalite, triplite,
triphylite
complex
spodumene Li, Rb, Cs, Be,
Ta-Nb (Sn, P, F,+/‐B)
spodumene, beryl,
columbite‐tantalite,
(amblygonite, lepidolite,
pollucite)
petalite Li, Rb, Cs, Be,
Ta-Nb (Sn, P, F,+/‐B)
petalite, beryl,
columbite‐tantalite,
(amblygonite, lepidolite,
pollucite)
lepidolite Li, F, Rb, Cs, Be,
Ta ‐Nb (Sn, P, B)
lepidolite, beryl, topaz,
microlite,
columbite‐tantalite,
(pollucite)
elbaite Li, B, Rb, Sn, F
(Ta, Be, Cs)
tourmaline, hambergite,
danburite, datolite,
microlite, (polylithionite)
amblygonite Li, Rb, Cs, Ta ‐Nb,
Be (Sn)
amblygonite, beryl,
columbite‐tantalite,
(lepidolite, pollucite)
albite-spodumene Li, (Sn, Be,
Ta ‐Nb +/‐B)
spodumene, (cassiterite,
beryl, columbite‐tantalite)
albite Ta ‐Nb, Be,
(Li,+/‐ Sn, B)
columbite‐tantalite,
beryl (cassiterite)
The Presqueiras-Taboazas mineralised pegmatites according to the Cerny and Ercit (2005)
classification correspond to the Rare-element (REL) class, Rare element-Lithium (REL-Li)
subclass, albite-spodumene or albite type pegmatites, taking into account the mineralogy and
geochemical signature of the drilled dykes.

Solid Resources Ltd
Alberta-1 Rare Metals Project May 2014 44
The albite-spodumene type of complex pegmatites is compositionally related to the
spodumene subtype, and consolidates at elevated pressures. However, it differs in its bulk
composition by substantial dominance of albite and quartz over K-feldspar, and by lithium
commonly within the uppermost range established by experimental magmatic enrichment.
The most conspicuous difference is in the simple zoning, approaching textural
near-homogeneity, of individual bodies, and strong preferred orientation of lath- and
club-shaped crystals of spodumene and K-feldspar, subnormal to oblique to the attitude of the
pegmatite dykes. Pegmatites of the albite type have an aplitic feature. Albite is dominant
over quartz, and generally minor to accessory K-feldspar, spodumene or lepidolite (Cerny
and Ercit, 2005).
From the genetic point of view, taking into account the provenance of the pegmatites from
diverse granites and the relationship with their parental plutonic sources, the pegmatites are
classified in different families by Cerny and Ercit (Table 8.2).
Table 8.2: Petrogenetic Family Classification
(From Cerny and Ercit (2005))
Family Pegmatite
Subclass
Geochemical
Signature
Pegmatite Bulk
Composition
Associated
Granites
Granite Bulk
Composition Source Lithologies
LCT REL-Li
MI-Li
Li, Rb, Cs, Be,
Sn, Ga, Ta>Nb
(B, P, F)
peraluminous to
subaluminous
(synorogenic to)
late-orogenic
(to anorogenic);
largely heterogeneous
peraluminous S, I or
mixed S+I types
Undepleted upper- to
middle-crust
supracrustal rocks and
basement gneisses
NYF REL-REE
MI-REE
Nb>Ta, Ti, Y,
Sc, REE, Zr,
U, Th, F
subaluminous to
metaluminous
(to subalkaline)
syn-, late, post- to
mainly anorogenic;
quasi-
homogeneous
(peraluminous to)
subaluminous and
metaluminous;
A and I types
Depleted middle- to
lower-crust granulites,
juvenile granites,
mantle-metasomatised
crust
Mixed Cross-bred:
LCT and NYF Mixed
(metaluminous to)
moderately
peraluminous
(postorogenic to)
anororgenic;
heterogeneous
subaluminous to
slightly peraluminous
Mixed protoliths or
assimilation of
supracrustal rocks by
NYF granites
Note: LCT - Li-Cs-Ta; NYF – Nb-Y-F: REL-REE - Rare Element-Rare Earth Element
The Presqueiras-Taboazas mineralised pegmatites correspond to the Rare element-Lithium
(REL-Li) subclass of the Li-Cs-Ta (LCT) enriched family of pegmatites, from the
classification in Table 8.2. The key points are the geochemical signature (Sn, Ta>Nb) and
the parental synkinematic granite outcropping to the west, corresponding to synorogenic
plutons within the Variscan Belt of Europe.
LCT granitic pegmatites form part of the orogenic association, and represent the culmination
of protracted crystallisation of a magma typically formed in part at the expense of
metasedimentary materials. NYF granitic pegmatites form part of the anorogenic association,
and may represent the culmination of protracted fractional crystallisation of a basaltic
magma. We consider LCT pegmatites to be members of the orogenic (calc-alkaline suites)
formed in a subduction setting (Martin and De Vito, 2005).
The basis on which the exploration programme is planned are: following the mineralisation
intersected by the drill holes within the geological context of LCT family, REL-Li subclass
(Table 8.2, Cerny and Ercit, 2005) and Rare-element (REL) class, REL-Li subclass,
albite-spodumene or albite type pegmatites dykes (Table 8.1, Cerny and Ercit, 2005). Two
examples of LCT pegmatite deposits are Greenbushes (Lithium mining project in Australia)
and Pivert-Rose (Rare elements exploration project in Canada).
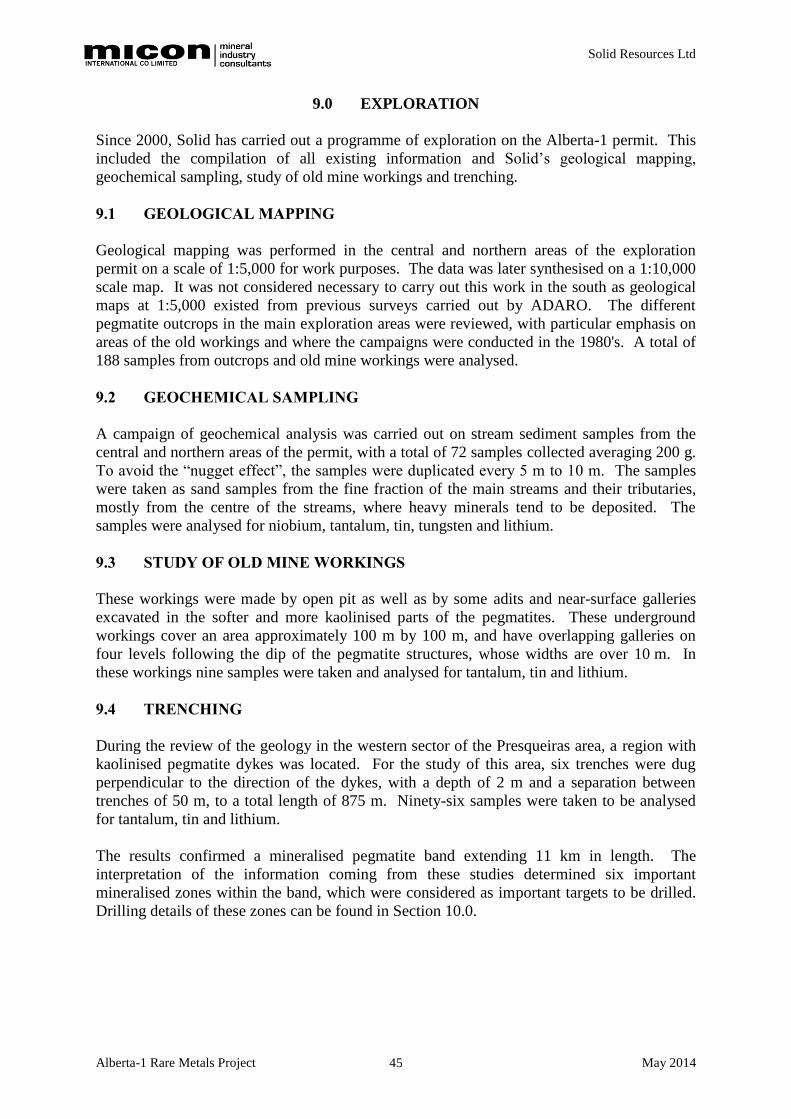
Solid Resources Ltd
Alberta-1 Rare Metals Project May 2014 45
9.0 EXPLORATION
Since 2000, Solid has carried out a programme of exploration on the Alberta-1 permit. This
included the compilation of all existing information and Solid’s geological mapping,
geochemical sampling, study of old mine workings and trenching.
9.1 GEOLOGICAL MAPPING
Geological mapping was performed in the central and northern areas of the exploration
permit on a scale of 1:5,000 for work purposes. The data was later synthesised on a 1:10,000
scale map. It was not considered necessary to carry out this work in the south as geological
maps at 1:5,000 existed from previous surveys carried out by ADARO. The different
pegmatite outcrops in the main exploration areas were reviewed, with particular emphasis on
areas of the old workings and where the campaigns were conducted in the 1980's. A total of
188 samples from outcrops and old mine workings were analysed.
9.2 GEOCHEMICAL SAMPLING
A campaign of geochemical analysis was carried out on stream sediment samples from the
central and northern areas of the permit, with a total of 72 samples collected averaging 200 g.
To avoid the “nugget effect”, the samples were duplicated every 5 m to 10 m. The samples
were taken as sand samples from the fine fraction of the main streams and their tributaries,
mostly from the centre of the streams, where heavy minerals tend to be deposited. The
samples were analysed for niobium, tantalum, tin, tungsten and lithium.
9.3 STUDY OF OLD MINE WORKINGS
These workings were made by open pit as well as by some adits and near-surface galleries
excavated in the softer and more kaolinised parts of the pegmatites. These underground
workings cover an area approximately 100 m by 100 m, and have overlapping galleries on
four levels following the dip of the pegmatite structures, whose widths are over 10 m. In
these workings nine samples were taken and analysed for tantalum, tin and lithium.
9.4 TRENCHING
During the review of the geology in the western sector of the Presqueiras area, a region with
kaolinised pegmatite dykes was located. For the study of this area, six trenches were dug
perpendicular to the direction of the dykes, with a depth of 2 m and a separation between
trenches of 50 m, to a total length of 875 m. Ninety-six samples were taken to be analysed
for tantalum, tin and lithium.
The results confirmed a mineralised pegmatite band extending 11 km in length. The
interpretation of the information coming from these studies determined six important
mineralised zones within the band, which were considered as important targets to be drilled.
Drilling details of these zones can be found in Section 10.0.
Solid Resources Ltd
Alberta-1 Rare Metals Project May 2014 46
10.0 DRILLING
10.1 INTRODUCTION
Four diamond drilling programmes were carried out during 2003, 2005, 2011 and 2012 on the
Alberta-1 1ª Fracción Permit. The objective was to explore the potential of the mineralised
pegmatite dykes (thickness, extension and grade) for tantalum, tin and lithium and define the
mineral resources.
A total of 65 drill holes with a total length of 7,021.45 m were drilled in the different areas:
Presqueiras - 46 drill holes (4,676.05 m);
Correa - 2 drill holes (155.6 m);
Coto Tocayo - 4 drill holes (382.8 m);
Acebedo - 4 drill holes (366.2 m);
Rubillón - 2 drill holes (224.65 m); and,
Taboazas - 7 drill holes (1,216.15 m).
In the 2003 to 2005 drilling programmes, a total of 17 diamond drill holes were drilled, with
a total length of 2,087.20 m. Most of the core obtained was 6.3 cm in diameter from a HQ
bit. In 2005, for operational purposes, the start of each hole was drilled with a PQ bit (9.2 cm
core) up to 4.6 m deep. In 2003, three sizes of bits were used, the last phase being drilled
with an HQ bit until the end of the hole: 13.0 cm core was obtained up to 3 m, followed by
10.5 cm core up to 22.5 m, followed by 9.2 cm core up to 60.0 m. The core recovery was
98.9% (weighted average).
In the 2011 drilling programme, a total of 31 diamond drill holes were drilled, with a total
length of 3,364.05 m. Most of the core obtained was with a HQ bit (6.3 cm core). Just the
start of each hole, due to operational purposes, was drilled with a PQ bit (11.5 cm) up to 3 m
deep. The core recovery was 98.6% (weighted average).
In the 2012 infill drilling programme, a total of 19 diamond drill holes were drilled (two of
them re-entered from the previous drilling programme), with a total length of 1,570.20 m.
Most of the core obtained was with a HQ bit (6.3 cm core). Just the start of each hole, for
operational purposes, was drilled with a PQ bit (at 11.5 cm) up to 3 m deep. The core
recovery was 98.9% (weighted average).
The relationship between the core length and the true thickness of the mineralisation is about
90%, as most of the drill holes have been drilled perpendicular to the dip of the dykes. A
map with the location of drill holes is shown in Figure 10.1.

Solid Resources Ltd
Alberta-1 Rare Metals Project May 2014 47
Figure 10.1: Overall Geological Map with the Drill Hole Locations

Solid Resources Ltd
Alberta-1 Rare Metals Project May 2014 48
10.2 DRILL SURVEYS
All inclined drill holes have been down-hole surveyed. A selection of the vertical holes,
especially drill holes deeper than 100 m, were also surveyed. The down-hole surveys were
recorded every 50 m and at the end of the hole by the drillers. A single-shot camera was used
to provide a photographic disc showing the dip and azimuth data for each depth. Some of the
measurements were repeated to check the accuracy of the device.
Collar surveys were carried out for all drill holes by Topofor (Qualified Contractor for
detailed topographic surveys). The precision accuracy of the measurement for the northing,
easting and elevation coordinates is estimated to be 1 cm for 2011 and 2012 drill programmes
and 2 m for 2003 to 2005 drill programmes. The projection coordinate system used was
UTM, European Datum 1950, 29 North Zone. Once plotted, all the data was checked in the
field when any discrepancies were detected. All the drill holes are marked in the field by a
location marker. Holes drilled during the 2011 and 2012 campaigns are capped using metal
collar protectors (Figure 10.2).
Figure 10.2: Photographs of the Location Marker and Collar Protection
10.3 DENSITY
A total of 1,446 density measurements were carried out on lengths of drill core. The samples
were selected to provide a representative suite of densities of the two main lithology types,
including altered zones. The number of samples includes all drill holes from the Alberta-1
2003, 2005, 2011 and 2012 drilling programmes.
Density determinations were taken from the core on samples of about 20 cm in length and
from ½ or ¼ of the core (mainly 6.3 cm diameter) after being cut for sampling. Within
pegmatite dykes one measurement was made every metre. In addition, one or two
measurements were taken, from the hanging wall and footwall of each dyke, within the mica
schist host rock. In the 2012 drilling programme, systematic measurements every 10 m were
taken within the mica schist host rock.
The water displacement method was used. The density measurement for each core sample
was calculated by using the Weight in Air / Weight in Water method. The core is weighed in
air and in water; the weight (grams) in air is divided by the difference between weight in air
and weight in water (cm3), to get the density value (g/cm
3). Detailed density data of different
zones is shown in Table 10.1.

Solid Resources Ltd
Alberta-1 Rare Metals Project May 2014 49
Table 10.1: Average Density of Different Rock Types by Zones
Zone
Density
Pegmatite
(g/cm3)
Mica Schist
(g/cm3)
Presqueiras 2.59 2.75
Correa 2.59 2.73
Coto Tocayo 2.62 2.79
Acebedo 2.61 2.74
Rubillón 2.58 2.65
Taboazas 2.64 2.72
10.4 GEOLOGICAL AND GEOTECHNICAL LOGGING
Detailed geological logging was completed for all the drill holes. The cores were also logged
quantitatively for geotechnical data (Recovery, RQD, number of fractures, main angles of
fractures) and qualitatively and quantitatively for lithological and mineralogical data. The
core was assembled in boxes, and marked for logging based on mineralogical and lithological
variations. They were also marked for assay based on the lithology and thickness of the
dykes. In general, all the dykes above 1 m thickness and 1 m of mica schist at the hanging
wall or footwall of each dyke have been assayed. The core was also photographed in detail
(one photograph per core box; about 5 m core). Detailed photographs of cassiterite and
spodumene were also taken, where the core showed intense mineralisation.
All the logging data was recorded in logs written by hand on paper. The more relevant data
(rock type, mineralisation, alteration, contact, schistosity) was selected and recorded in an
electronic format to build a basic database in Text or Excel format. The data was exported
into a Geosoft database, which includes collar, geology, survey, and assay information. All
the tasks carried out during this programme are in accordance with standard industry practice.
10.5 RESULTS INTERPRETATIONS AND RECOMMENDATIONS
The intersections of pegmatite dykes by drill holes recognised an important mineralisation
zone extending 11 km. The mineralisation has been confirmed and extended in the
Presqueiras, Taboazas, Coto Tocayo and Acebedo zones. In addition, in the Correa and
Rubillón areas the mineralised pegmatite dykes have been intersected, confirming the
exploration potential of these areas. The length of the interval analysed is the length of the
intersection of the drill hole. The assays are weighted averages of the samples of the interval.
The variations of the results, in terms of grade, within a mineralised interval are due to the
nugget effect. Cross sections of the mineralised intervals illustrate the tin and tantalum
grades in the figures for each of the different areas in the following detailed discussion.
The different areas have been assessed separately in order to provide a more accurate
knowledge of the calculated resources and in order to plan the future exploration drilling
potential.
10.6 PRESQUEIRAS
During the 2003, 2005, 2011 and 2012 drilling programmes, a total of 4,676.05 m, from 46
drill holes have been drilled. During the 2012 drilling programme 1,570.2 m were drilled,
corresponding to 17 new drill holes and two re-entered from the previous programme. In the
2011 drilling programme 1,934.90 m were drilled, comprising of 18 drill holes.

Solid Resources Ltd
Alberta-1 Rare Metals Project May 2014 50
In 2005 850.25 m were drilled, corresponding to seven drill holes and in 2003 320.7 m were
drilled, comprising of four drill holes.
The mineralisation has been extended to a total of 700 m in a NNW-SSE direction, 300 m
perpendicularly and up to 18.4 m thick. Average thicknesses range from 3.0 m to 8.4 m, as
shown in Table 10.2. The results confirm the continuity of the main dykes in terms of
thickness and grades of tin, tantalum and lithium (see Figure 10.3).
Table 10.2: Presqueiras – Zone Summary
Zone Number of
Holes
Strike Length
(m)
Width
(m)
Average Thickness
(m)
1 42 700 100 to 400 8.4
2 22 420 300 5.8
3 10 260 250 3.0
4 12 500 40 to 180 4.8
5 8 300 50 to 180 5.0
Within the mineralised band the lithium grade is high in the western zone of the band while,
the tantalum and tin grades are high in the eastern area. There is a grade zonation of tantalum
and tin parallel to the NNW-SSE band. The tantalum and tin grades increase towards the
eastern area. In some drill holes the higher grades of tantalum, tin and lithium coincide. One
such example is the SO-11-12 drill hole, which contains the highest grades for all three
elements in Main Dyke I, (Table 10.3).
Table 10.3: Mineralised Pegmatite Intervals - Main Dyke I Hole SO-11-12
Width Interval
(m)
Sample
(m) Rock Type
Ta2O5
(ppm)
Sn
(ppm)
Li2O
(%)
Nb2O5
(ppm)
Rb
(ppm)
11.75
73.95 – 74.95 1 Pegmatite 36 289 0.78 31 842
74.95 – 75.95 1 Pegmatite 73 417 1.38 54 1130
75.95 – 76.95 1 Pegmatite 146 810 1.55 107 844
76.95 – 77.95 1 Pegmatite 85 845 1.03 84 1190
77.95 – 78.95 1 Pegmatite 122 807 1.88 92 946
78.95 – 79.95 1 Pegmatite 146 1235 1.08 101 1220
79.95 – 80.95 1 Pegmatite 158 1480 0.8 130 930
80.95 – 81.95 1 Pegmatite 122 2350 1.3 125 1875
81.95 – 82.95 1 Pegmatite 122 832 2.06 102 981
82.95 – 83.95 1 Pegmatite 122 539 1.33 111 514
83.95 – 84.95 1 Pegmatite 146 1100 0.31 115 454
84.95 – 85.7 0.75 Pegmatite 183 1040 0.042 143 524
The drill holes collars were spaced around 50 m, within the most important zone (Measured
and Indicated resources area) and up to 100 m, within the area of Inferred resources
(Figure 10.3). Due to the continuity in thickness and grade of the pegmatite dykes, the
drill-hole spacing is sufficient to complete a resource calculation.
As most of the drill holes are perpendicular to the dip of the dykes the true thicknesses are
very close to the lengths intersected.

Solid Resources Ltd
Alberta-1 Rare Metals Project May 2014 51
Figure 10.3 shows the location of the drill holes from different drilling programmes, detailed
geology of mineralised pegmatite dykes, the bulk sampling adit and old mining works.
Figure 10.3: Presqueiras Map with Drill Hole Locations
The longitudinal section in Figure 10.4 shows intersections of tantalum and tin grades and the
interpretation of the main pegmatite dyke. Figure 10.5 shows the tantalum and tin grades
increasing to the east.
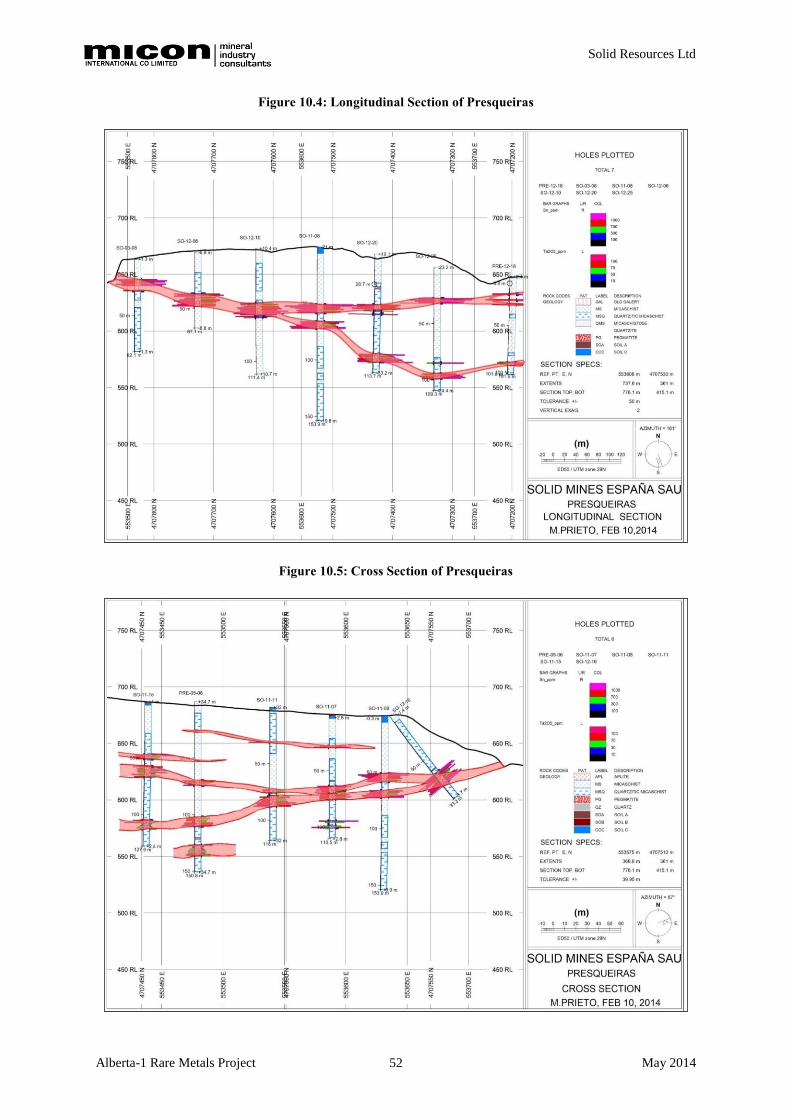
Solid Resources Ltd
Alberta-1 Rare Metals Project May 2014 52
Figure 10.4: Longitudinal Section of Presqueiras
Figure 10.5: Cross Section of Presqueiras
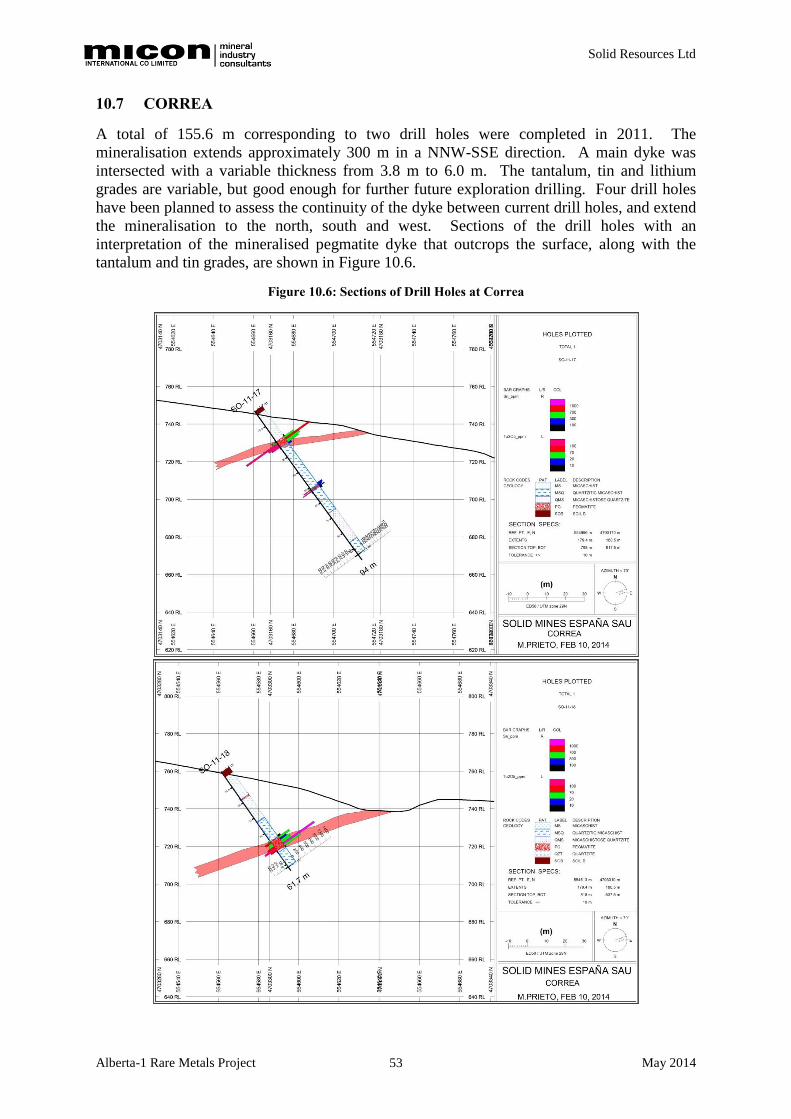
Solid Resources Ltd
Alberta-1 Rare Metals Project May 2014 53
10.7 CORREA
A total of 155.6 m corresponding to two drill holes were completed in 2011. The
mineralisation extends approximately 300 m in a NNW-SSE direction. A main dyke was
intersected with a variable thickness from 3.8 m to 6.0 m. The tantalum, tin and lithium
grades are variable, but good enough for further future exploration drilling. Four drill holes
have been planned to assess the continuity of the dyke between current drill holes, and extend
the mineralisation to the north, south and west. Sections of the drill holes with an
interpretation of the mineralised pegmatite dyke that outcrops the surface, along with the
tantalum and tin grades, are shown in Figure 10.6.
Figure 10.6: Sections of Drill Holes at Correa

Solid Resources Ltd
Alberta-1 Rare Metals Project May 2014 54
A map of the area is shown in Figure 10.7 showing the 2011 drill holes, planned drill holes,
and the detailed geology of the mineralised pegmatite dykes.
Figure 10.7: Correa Map with Drill Hole Locations

Solid Resources Ltd
Alberta-1 Rare Metals Project May 2014 55
10.8 COTO TOCAYO
This area has had a total of 382.8 m drilled corresponding to two drill holes completed during
2003 amounting to 179.55 m and 203.25 m corresponding to two drill holes drilled during
2011.
The mineralisation extends about 450 m in a NNW-SSE direction, and more than 200 m
perpendicularly. A main dyke was intersected with a variable thickness from 3.1 m to
12.05 m and a secondary mineralised pegmatite dyke with a variable thickness from 1.15 m
to 5.7 m was intersected. The grades of tantalum, tin are high and whereas the lithium grade
is variable.
A section showing a drill hole with an interpretation of the mineralised pegmatite dykes and
the tantalum and tin grades is given in Figure 10.8. A map of the area is shown in
Figure 10.9 including the drill holes from the 2003 and 2011 drilling programmes, planned
drill holes and the detailed geology of the mineralised pegmatite dykes.
Additional future drilling is recommended to assess the continuity of the dykes, the
variability of the grade between the drilled holes and the extension of the mineralisation to
the west. A minimum of seven drill holes have been planned.
Figure 10.8: Coto Tocayo - Section of Drill Hole SO-11-19

Solid Resources Ltd
Alberta-1 Rare Metals Project May 2014 56
Figure 10.9: Coto Tocayo Map with Drill Hole Locations

Solid Resources Ltd
Alberta-1 Rare Metals Project May 2014 57
10.9 ACEBEDO
A total of 366.2 m has been drilled in the Acebedo area corresponding to one drill hole in
2003 of 163.15 m and 203.05 m corresponding to three drill holes completed in 2011.
The mineralisation extends approximately 600 m in a NNW-SSE direction and more than
200 m perpendicularly. A main dyke was intersected with relatively continuous thickness of
10.3 m to 12.8 m. The tantalum and tin grades are high whereas the lithium grade is variable.
A section showing a drill hole with an interpretation of the mineralised pegmatite dyke and
the tantalum and tin grades is given in Figure 10.10. A map of the area is provided in
Figure 10.11 illustrating the 2003 and 2011 drilling programmes drill holes, planned drill
holes, and the detailed geology of the mineralised pegmatite dykes.
Additional future drilling is recommended to assess the continuity of the dyke, the variability
of the grade between the drilled holes and the extension of the mineralisation to the west.
A minimum of 12 drill holes have been planned.
Figure 10.10: Acebedo - Section of Drill Hole SO-11-21-B
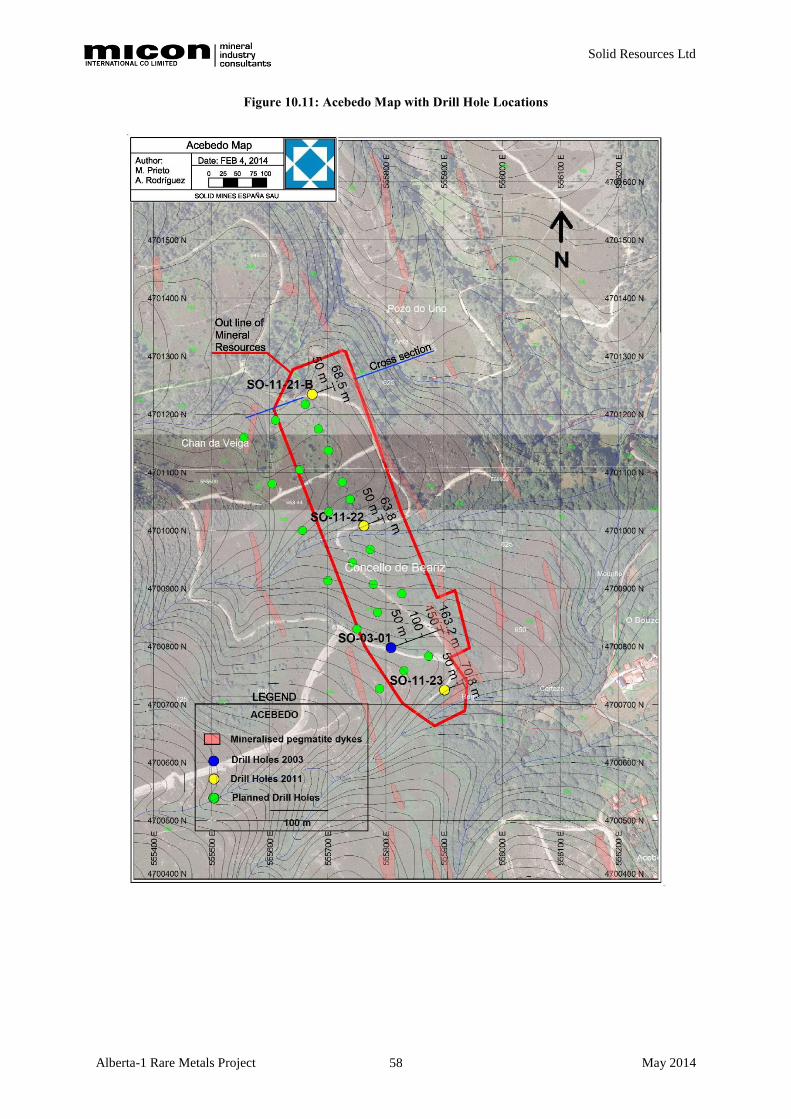
Solid Resources Ltd
Alberta-1 Rare Metals Project May 2014 58
Figure 10.11: Acebedo Map with Drill Hole Locations

Solid Resources Ltd
Alberta-1 Rare Metals Project May 2014 59
10.10 RUBILLÓN
A total of 224.65 m has been drilled corresponding to two drill holes completed in 2011. The
mineralisation extends approximately 200 m in a NNW-SSE direction. A main dyke was
intersected with a variable thickness from 4.55 m to 6.05 m.
The tantalum and tin grades are variable with drill hole SO-11-25 intersecting high grades of
tantalum and tin and drill hole SO-11-24 intersecting low grades of tantalum and tin. More
exploration is recommended with additional future drilling, following the good grades found
in drill hole SO-11-25.
A future drilling programme is recommended to assess the continuity of the dyke, and check
the possible extension of the mineralisation to the north, south and west. A section showing a
drill hole with an interpretation of the mineralised pegmatite dykes and the tantalum and tin
grades is given in Figure 10.12. A map of the area is shown in Figure 10.13 including the
detailed geology of the mineralised pegmatite dykes.
Figure 10.12: Rubillón - Section of Drill Hole SO-11-25
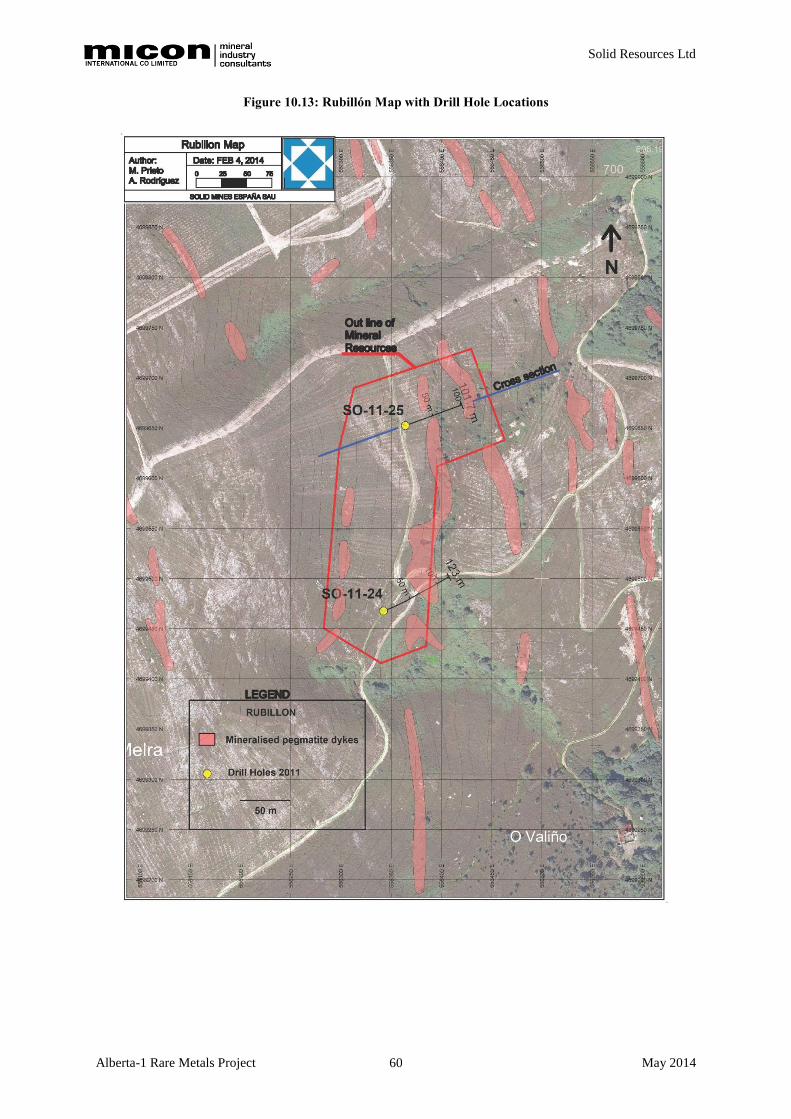
Solid Resources Ltd
Alberta-1 Rare Metals Project May 2014 60
Figure 10.13: Rubillón Map with Drill Hole Locations

Solid Resources Ltd
Alberta-1 Rare Metals Project May 2014 61
10.11 TABOAZAS
A total of 1,216.15 m corresponding to seven drill holes has been drilled. Three holes were
drilled in 2003 comprising of 573.55 m and in 2011 a total of 642.6 m was drilled from four
drill holes.
The main mineralisation has been extended to a total of 400 m in a NNW-SSE direction
(Figure 10.15), and 150 m perpendicularly (Figure 10.14). The results confirm the continuity
of the main dykes in terms of thickness and tantalum, tin and lithium grades.
A mineralised band in a NNW-SSE direction is confirmed by drill holes SO-11-26 and
SO-11-27. The tantalum, tin and lithium grades are the highest of the Alberta-1 Permit.
There are at least two main dykes intersected with a variable thickness from 4.45 m up to
11.5 m.
There is a secondary mineralised area intersected by drill holes SO-11-28 and SO-11-29, with
very high grades of tantalum and tin, but the dykes intersected have a maximum thickness of
2.2 m. Once a cut-off thickness/grade is established, an economic assessment of this
mineralisation can be made.
A 50 m grid drilling programme is recommended to improve the quality of the calculated
resources and enhance them to the north and deeper (to the west) than the previous drilled
area. A total of 3,150 m of drilling has been planned see Figure 10.15.
Figure 10.14: Taboazas - Section of Drill Hole SO-11-26

Solid Resources Ltd
Alberta-1 Rare Metals Project May 2014 62
Figure 10.15 shows the drill holes from the 2003 and 2011 programmes, planned drill holes
and the detailed geology of the mineralised pegmatites.
Figure 10.15: Taboazas Map with Drill Hole Locations
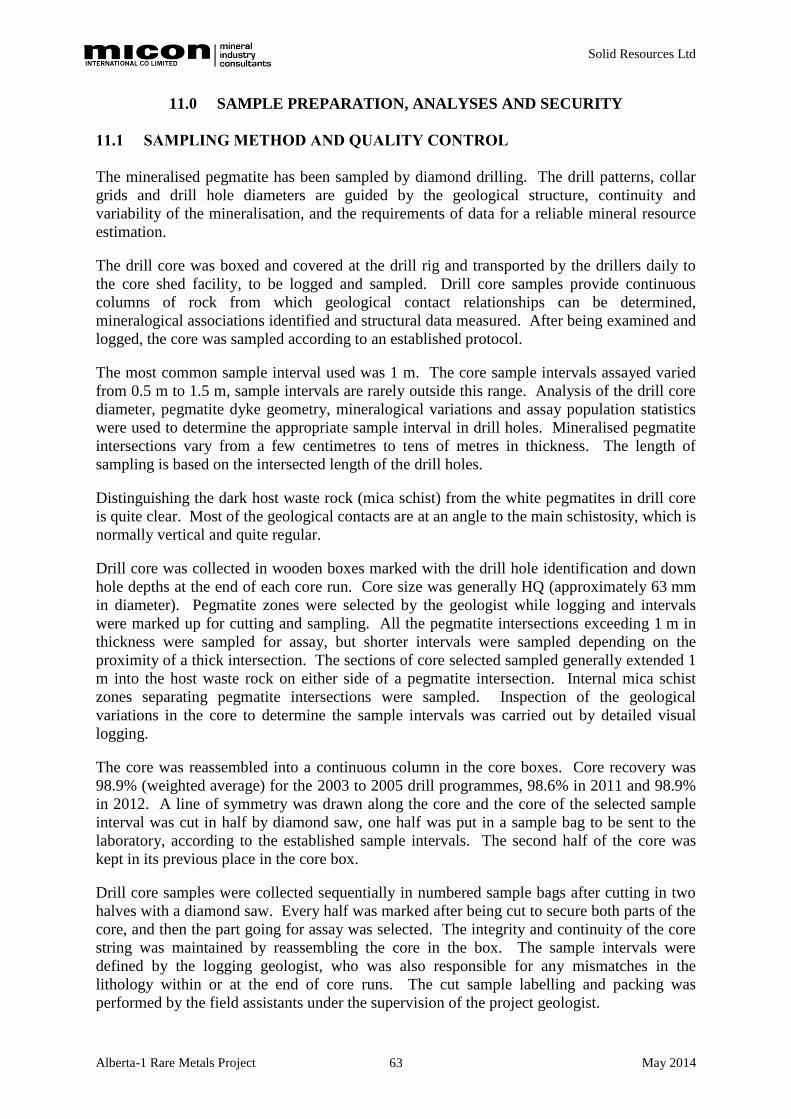
Solid Resources Ltd
Alberta-1 Rare Metals Project May 2014 63
11.0 SAMPLE PREPARATION, ANALYSES AND SECURITY
11.1 SAMPLING METHOD AND QUALITY CONTROL
The mineralised pegmatite has been sampled by diamond drilling. The drill patterns, collar
grids and drill hole diameters are guided by the geological structure, continuity and
variability of the mineralisation, and the requirements of data for a reliable mineral resource
estimation.
The drill core was boxed and covered at the drill rig and transported by the drillers daily to
the core shed facility, to be logged and sampled. Drill core samples provide continuous
columns of rock from which geological contact relationships can be determined,
mineralogical associations identified and structural data measured. After being examined and
logged, the core was sampled according to an established protocol.
The most common sample interval used was 1 m. The core sample intervals assayed varied
from 0.5 m to 1.5 m, sample intervals are rarely outside this range. Analysis of the drill core
diameter, pegmatite dyke geometry, mineralogical variations and assay population statistics
were used to determine the appropriate sample interval in drill holes. Mineralised pegmatite
intersections vary from a few centimetres to tens of metres in thickness. The length of
sampling is based on the intersected length of the drill holes.
Distinguishing the dark host waste rock (mica schist) from the white pegmatites in drill core
is quite clear. Most of the geological contacts are at an angle to the main schistosity, which is
normally vertical and quite regular.
Drill core was collected in wooden boxes marked with the drill hole identification and down
hole depths at the end of each core run. Core size was generally HQ (approximately 63 mm
in diameter). Pegmatite zones were selected by the geologist while logging and intervals
were marked up for cutting and sampling. All the pegmatite intersections exceeding 1 m in
thickness were sampled for assay, but shorter intervals were sampled depending on the
proximity of a thick intersection. The sections of core selected sampled generally extended 1
m into the host waste rock on either side of a pegmatite intersection. Internal mica schist
zones separating pegmatite intersections were sampled. Inspection of the geological
variations in the core to determine the sample intervals was carried out by detailed visual
logging.
The core was reassembled into a continuous column in the core boxes. Core recovery was
98.9% (weighted average) for the 2003 to 2005 drill programmes, 98.6% in 2011 and 98.9%
in 2012. A line of symmetry was drawn along the core and the core of the selected sample
interval was cut in half by diamond saw, one half was put in a sample bag to be sent to the
laboratory, according to the established sample intervals. The second half of the core was
kept in its previous place in the core box.
Drill core samples were collected sequentially in numbered sample bags after cutting in two
halves with a diamond saw. Every half was marked after being cut to secure both parts of the
core, and then the part going for assay was selected. The integrity and continuity of the core
string was maintained by reassembling the core in the box. The sample intervals were
defined by the logging geologist, who was also responsible for any mismatches in the
lithology within or at the end of core runs. The cut sample labelling and packing was
performed by the field assistants under the supervision of the project geologist.

Solid Resources Ltd
Alberta-1 Rare Metals Project May 2014 64
The numbered sample bags were sent to the laboratory for chemical assay. An average
sample bag taken from 1 m long core (½ HQ) was about 4 kg in weight. The sample bags
were labelled outside with their corresponding number, and a safety label with the same
number was also put inside the bag for security. Every 4 to 5 bags were photographed and
put in a sack to facilitate the logistics and avoid loss of any bag when transported by the
certified courier. A list with the number of bags was sent to the laboratory.
Once two or three drill holes were completely sampled, all the sample bags were sent to the
laboratory in the same batch (all the samples of the two or three drill holes to be analysed
were sent at the same time to the laboratory in one shipment). Slightly more than 8% of the
samples were duplicates, blanks or standards for quality control, at least one of each was sent
per batch. One or two quality control samples per drill hole were sent, depending on the
length of the mineralised interval; one for a short interval and two for long mineralised
intervals.
The batch was sent to ALS Laboratory Group, Mineral Division, located in Seville (Spain) by
courier, where they perform the crushing, pulverising and splitting of each sample. The
sequence starts with a crushing process (CRU-21) described as “coarse crushing of drill
samples to 70% nominal 6 mm”, after that a pulverising process (PUL-21) described as
“to pulverise the entire sample to 85% passing 75 micron or better”, then comes a splitting
process (SPL-22) described as “to split sample using a rotary splitter” to obtain a sample of
250 grams. These samples were then sent to ALS Laboratory Group Minerals located in
Vancouver (Canada) for chemical assay.
11.2 SAMPLE ANALYSIS
The chemical assays were performed by ALS Laboratory Group Minerals (Canada), which
produced the assay certificates.
In 2011 tin, tantalum, niobium and rubidium were analysed using XRF assay. In 2012 tin,
tantalum and niobium were analysed using XRF assay. The code for XRF assay used by the
laboratory is ME-XRF05. The XRF analytical method is based on X-Ray fluorescence
spectroscopy. This method is described by ALS Laboratory as follows: "A finely ground
sample powder (10 g minimum) is mixed with a few drops of liquid binder (Polyvinyl
Alcohol) and then transferred into an aluminium cap. The sample is subsequently
compressed under approximately 30 ton/in2 in a pellet press. After pressing, the pellet is
dried to remove the solvent and analysed by WDXRF spectrometry for the different elements"
(from www.alsglobal.com). The assay ranges are shown in Table 11.1.
Table 11.1: Ranges for the Different XRF Assayed Elements
Element Symbol Lower Limit
(ppm)
Upper Limit
(ppm)
Niobium Nb 2 10,000
Rubidium Rb 2 10,000
Tin Sn 5 10,000
Tantalum Ta 10 10,000

Solid Resources Ltd
Alberta-1 Rare Metals Project May 2014 65
The analytical method used for lithium and caesium was based on four acid near-total
digestion with an assay code of ME-MS61.
This method is described by ALS Laboratory as follows: "Inductively Coupled
Plasma-Atomic Emission Spectroscopy (ICP-AES) and Inductively Coupled Plasma-Mass
Spectrometry (ICP-MS). A prepared sample (0.25 g) is digested with perchloric, nitric,
hydrofluoric and hydrochloric acids. The residue is topped up with diluted hydrochloric acid
and analysed by inductively coupled plasma-atomic emission spectrometry. Following this
analysis, the results are reviewed for high concentrations of bismuth, mercury, molybdenum,
silver and tungsten and diluted accordingly. Samples meeting this criterion are then
analysed by inductively coupled plasma-mass spectrometry. Results are corrected for
spectral inter-element interferences" (from www.alsglobal.com).
The elements analysed were Ag, Al, As, Ba, Be, Bi, Ca, Cd, Ce, Co, Cr, Cs, Cu, Fe, Ga, Ge,
Hf, In, K, La, Li, Mg, Mn, Mo, Na, Nb, Ni, P, Pb, Rb, Re, S, Sb, Sc, Se, Sn, Sr, Ta, Te, Th,
Ti, Tl, U, V, W, Y, Zn and Zr. The detection limits of the relevant elements are shown in
Table 11.2.
Table 11.2: Ranges for the Different ICP-MS Assayed Elements
Element Symbol Lower Limit
(ppm)
Upper Limit
(ppm)
Caesium Cs 0.05 500
Lithium Li 0.2 10,000
A quality control procedure of standard, blank and duplicate samples is followed by the
ALS Laboratory Group. A certificate is given to Solid Mines España, S.A.U. (Solid Mines)
for each batch of samples. In addition, Solid Mines used up to 10% of the samples per batch
for duplicate, blank or standard samples for its own quality control.
The ALS Laboratory Group has provided the corresponding certificates for each batch. The
batch certificate includes sample preparation, analysis and the quality control procedure. All
these certificates have been sent to Solid Mines, which keeps records of all of them.
The procedure described above was performed during the 2011 and 2012 drill programmes.
Similar procedures were carried out during the 2003 and 2005 drill programmes, but only the
main elements were chemically assayed (Ta, Sn, Li, Nb). In addition, some of the samples
were also assayed for Cs and Rb. No quality control samples were sent to the laboratory.
A photocopy of the assay certificates is attached to the internal drilling reports.
Micon considers that the current sample preparation, security, analytical procedures and data
management procedures used conform to industry standards and are adequate for the purpose
of mineral resource estimation and the assessment of the exploration potential of the
Alberta-1 project.

Solid Resources Ltd
Alberta-1 Rare Metals Project May 2014 66
11.3 MICON QUALITY CONTROL ANALYSIS
Micon has completed a statistical analysis of the quality control chemical assay data received
from Solid. Standard, duplicate and blank samples were routinely and blindly included for
analysis along with the samples from the 2011 and 2012 drilling programmes. Samples were
sent for processing to the ALS Laboratory Group, Mineral Division (Spain) and subsequently
to the ALS Laboratory Group Minerals (Canada) for chemical assay. No external duplicates
have been sent to a separate laboratory for additional verification.
Table 11.3 presents the assay data received for analysis by Micon from Solid and includes
standard, duplicate and blank samples.
Table 11.3: Number of Samples Analysed
Type of Sample Number of
Samples
% of Total
Samples
2011 Assay Programme
Samples 511 -
Standards 15 2.7
Duplicates 14 2.5
Blanks 14 2.5
Total 554 -
2012 Assay Programme
Samples 270 -
Standards 15 5.1
Duplicates 5 1.7
Blanks 6 2.0
Total 296 -
The percentage of standard, duplicate and blank samples included with the 2011 assay
programme are 2.7%, 2.5% and 2.5% respectively. For the 2012 programme the percentage
of standard, duplicate and blank samples are 5.1%, 1.7% and 2.0%. Micon recommends that
Solid increase the percentage of standard, duplicate and blank samples analysed to 5% of the
total number of samples sent for analysis (i.e. 1 in 20 samples).
11.4 STANDARDS
Two standard samples were prepared by Solid at the core shed from the master pulp of
previous samples sent to the ALS laboratory. STD-H is high grade (Sn, Ta and Li) and
STD-L is low grade (Sn, Ta and Li). Approximately 100 grams of either standard STD-H or
STD-L was sent to the laboratory every one to three batches. The standard samples analysed
were positioned blindly with the core samples of the batch.
The standards have not been certified by the laboratory, instead the mean and standard
deviation has been calculated for the STD-H and STD-L samples for each drill programme in
2011 and 2012 to assess the precision of the data. Figures 11.1 to 11.6 show the results for
the STD-H and STD-L standard assays for tantalum, tin and lithium for the 2011 and 2012
drill programmes respectively.

Solid Resources Ltd
Alberta-1 Rare Metals Project May 2014 67
Figure 11.1: 2011 Tantalum Standard Assay Plot
Figure 11.2: 2012 Tantalum Standard Assay Plot
Note: There are no Standard Deviation (SD) lines as the statistical analysis produced a SD value of zero

Solid Resources Ltd
Alberta-1 Rare Metals Project May 2014 68
Figure 11.3: 2011 Tin Standard Assay Plot
Figure 11.4: 2012 Tin Standard Assay Plot
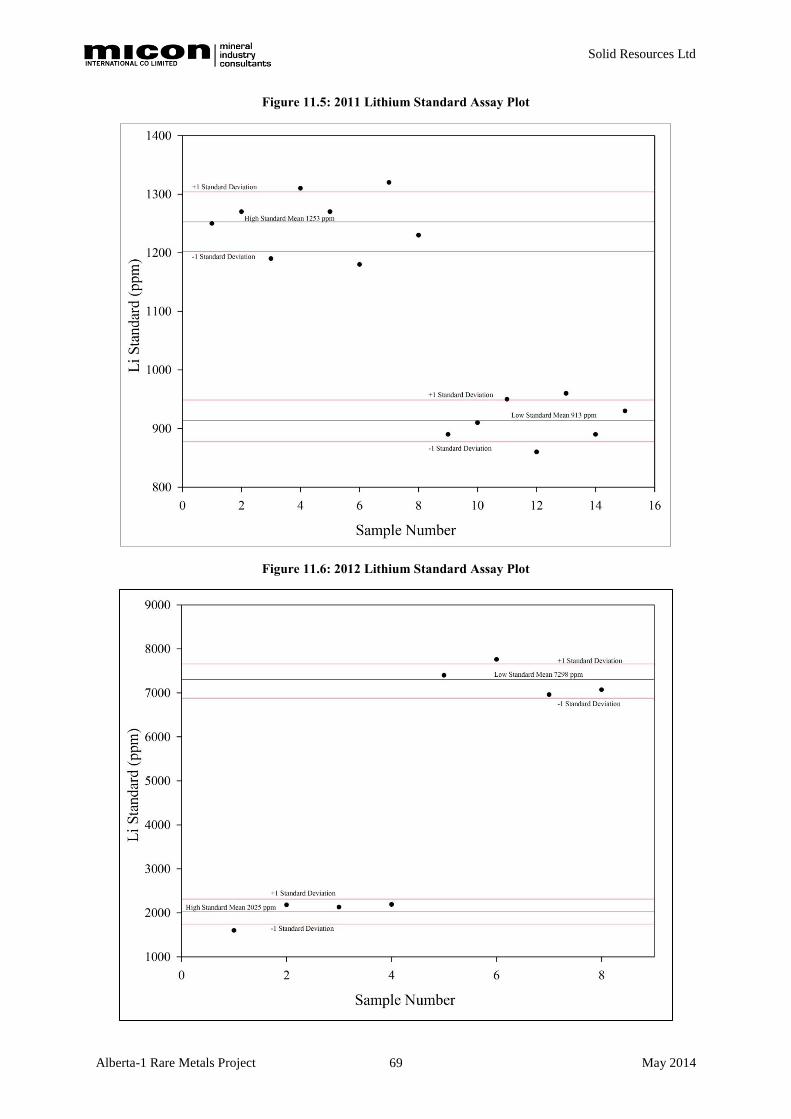
Solid Resources Ltd
Alberta-1 Rare Metals Project May 2014 69
Figure 11.5: 2011 Lithium Standard Assay Plot
Figure 11.6: 2012 Lithium Standard Assay Plot
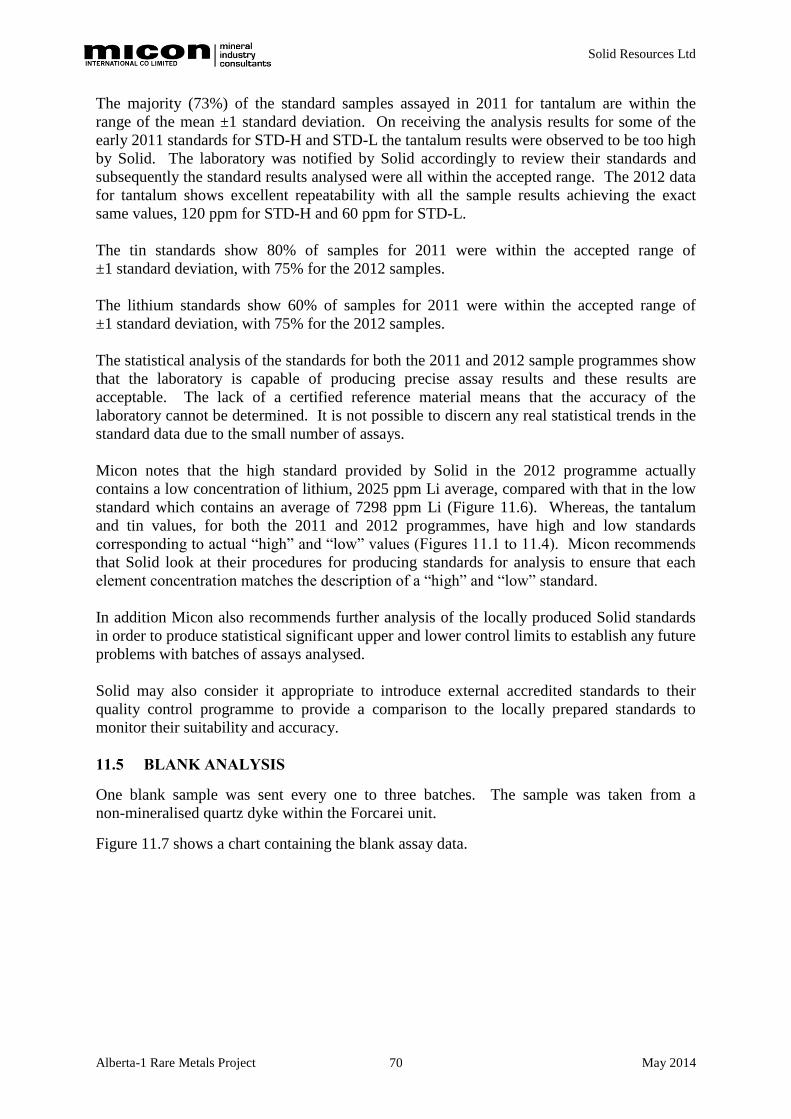
Solid Resources Ltd
Alberta-1 Rare Metals Project May 2014 70
The majority (73%) of the standard samples assayed in 2011 for tantalum are within the
range of the mean ±1 standard deviation. On receiving the analysis results for some of the
early 2011 standards for STD-H and STD-L the tantalum results were observed to be too high
by Solid. The laboratory was notified by Solid accordingly to review their standards and
subsequently the standard results analysed were all within the accepted range. The 2012 data
for tantalum shows excellent repeatability with all the sample results achieving the exact
same values, 120 ppm for STD-H and 60 ppm for STD-L.
The tin standards show 80% of samples for 2011 were within the accepted range of
±1 standard deviation, with 75% for the 2012 samples.
The lithium standards show 60% of samples for 2011 were within the accepted range of
±1 standard deviation, with 75% for the 2012 samples.
The statistical analysis of the standards for both the 2011 and 2012 sample programmes show
that the laboratory is capable of producing precise assay results and these results are
acceptable. The lack of a certified reference material means that the accuracy of the
laboratory cannot be determined. It is not possible to discern any real statistical trends in the
standard data due to the small number of assays.
Micon notes that the high standard provided by Solid in the 2012 programme actually
contains a low concentration of lithium, 2025 ppm Li average, compared with that in the low
standard which contains an average of 7298 ppm Li (Figure 11.6). Whereas, the tantalum
and tin values, for both the 2011 and 2012 programmes, have high and low standards
corresponding to actual “high” and “low” values (Figures 11.1 to 11.4). Micon recommends
that Solid look at their procedures for producing standards for analysis to ensure that each
element concentration matches the description of a “high” and “low” standard.
In addition Micon also recommends further analysis of the locally produced Solid standards
in order to produce statistical significant upper and lower control limits to establish any future
problems with batches of assays analysed.
Solid may also consider it appropriate to introduce external accredited standards to their
quality control programme to provide a comparison to the locally prepared standards to
monitor their suitability and accuracy.
11.5 BLANK ANALYSIS
One blank sample was sent every one to three batches. The sample was taken from a
non-mineralised quartz dyke within the Forcarei unit.
Figure 11.7 shows a chart containing the blank assay data.

Solid Resources Ltd
Alberta-1 Rare Metals Project May 2014 71
Figure 11.7: Blank Data Analysis for Tantalum, Tin and Lithium
Figure 11.7 illustrates the low blank values for tin and tantalum, 60% of the values for both
these elements were reported below the detection limits of 5 ppm and 10 ppm respectively.
The lithium blank data values range from 14.9 ppm to 31.3 ppm which is considered to be
very low in comparison to the mineralised samples which range from 101 ppm to 9320 ppm.
There is just one sample out of range, not shown on Figure 11.7, one of the tin blanks
reported 991 ppm. This can most likely be attributed to a one off result of either
contamination or laboratory error.
The results for the blank samples are satisfactory and suggest that there is no systematic
contamination or mixing during analysis.
11.6 DUPLICATES
One duplicate sample (repeat assay) per batch was sent to the laboratory in 2011 and one per
every three batches in 2012. As the total number of duplicate samples sent for analysis for
the 2011 and 2012 programmes only amounts to 19 assays Micon has analysed the duplicates
together. The summary statistics for the duplicates are presented in Table 11.4.

Solid Resources Ltd
Alberta-1 Rare Metals Project May 2014 72
Table 11.4: Duplicates Summary Statistics
Element Parameters Original Duplicate
Ta
(ppm)
Mean 100 98
Standard Deviation 42 37
Correlation Coefficient 0.8798
No. of Samples 19
Sn
(ppm)
Mean 681 742
Standard Deviation 189 226
Correlation Coefficient 0.7593
No. of Samples 19
Li
(ppm)
Mean 3416 3298
Standard Deviation 3048 2941
Correlation Coefficient 0.9891
No. of Samples 19
Correlation plots (Figures 11.8 and 11.10) were generated to assess the relationship between
the original assays and the duplicates.
Figure 11.8: Correlation Plot for Original and Duplicate Tantalum Assays
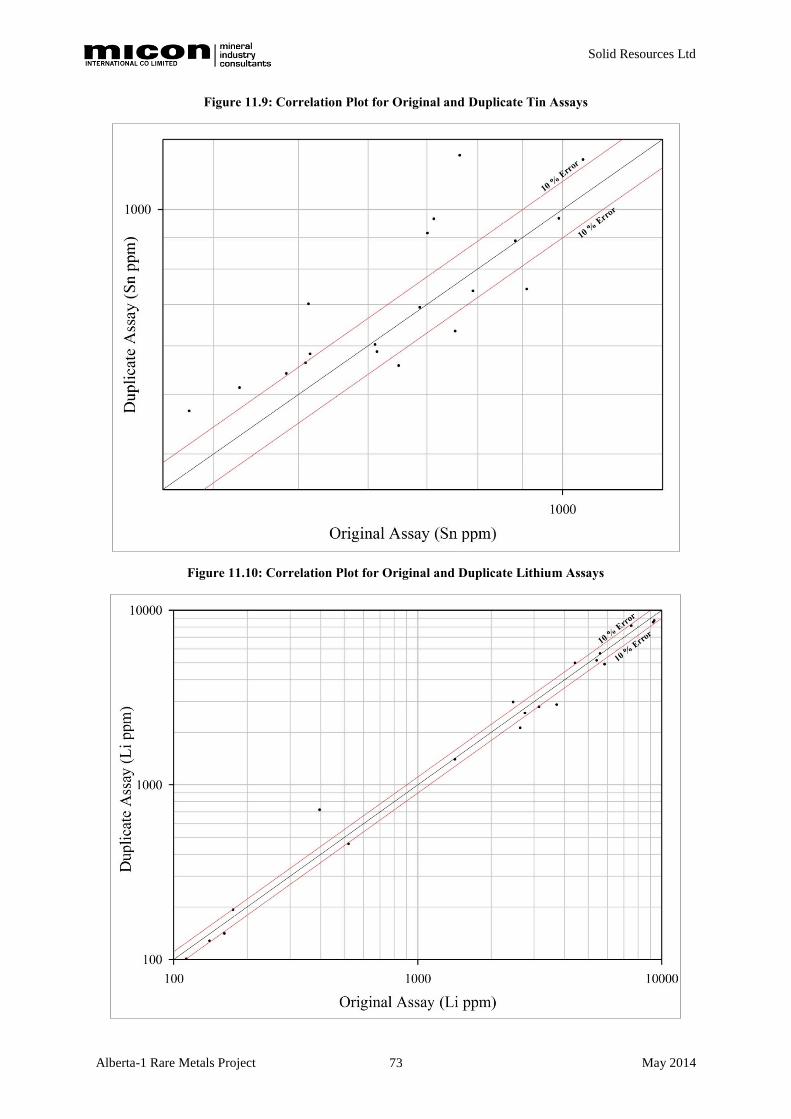
Solid Resources Ltd
Alberta-1 Rare Metals Project May 2014 73
Figure 11.9: Correlation Plot for Original and Duplicate Tin Assays
Figure 11.10: Correlation Plot for Original and Duplicate Lithium Assays

Solid Resources Ltd
Alberta-1 Rare Metals Project May 2014 74
The correlation plots show three correlation lines; the central black line is the 1:1 line, the red
lines denote ±20% error. The ±20% error limits indicate the acceptable range of analytical
error for assays derived from unknown samples.
The percentage of samples exceeding ±20% error for tantalum, tin and lithium are 52.6%,
68.4% and 47.4% respectively. These values are relatively high, however the total number of
samples analysed is only 19 samples.
Micon has also completed an analysis of the absolute error for the original and duplicate
samples these are shown in Figures 11.11, 11.12 and 11.13 for tantalum, tin and lithium
respectively.
Figure 11.11: Error Plot for Original and Duplicate Tantalum Assays

Solid Resources Ltd
Alberta-1 Rare Metals Project May 2014 75
Figure 11.12: Error Plot for Original and Duplicate Tin Assays
Figure 11.13: Error Plot for Original and Duplicate Lithium Assays

Solid Resources Ltd
Alberta-1 Rare Metals Project May 2014 76
The error plots of Figures 11.11 to 11.13 present the absolute difference of the original assay
value from the mean of assay pairs. The plot illustrates the accuracy of analysis for sample
pairs. The percentages of pairs with analytical errors of less than ±20% and ±10% are
displayed in Table 11.15.
Table 11.5: Analytical Error of the Original Assays to the Mean of Assay Pairs
Error Ta
(ppm)
Sn
(ppm)
Li
(ppm)
Pairs with Analytical Errors Less than ±20% 100% 95% 95%
Pairs with Analytical Errors Less than ±10% 74% 68% 84%
The error plots show that the absolute errors for all three elements are acceptable.
11.7 CONCLUSIONS AND RECOMMENDATIONS
The statistical analysis of the standards for both sample programmes received in 2011 and
2012 show that the laboratory is capable of producing precise assay results and these results
are acceptable. However, it is not possible to discern any real statistical trends in the standard
data due to the small number of assays, and the lack of certified standards means that Micon
is unable to comment on the accuracy of the data.
Micon recommends that Solid undertake the following measures:
1. Increase the number of standard, duplicate and blank samples to 5% of the total
number of samples sent for analysis in the future to meet current recommended
practice standards in the industry.
2. Review their procedures for producing standards for analysis to ensure that each
element concentration matches the description of a “high” and “low” standard.
3. Further analysis of the locally produced standards in order to produce upper and lower
control limits to establish any future problems with batches of assays analysed.
Solid may consider it appropriate to introduce external accredited standards to their quality
control programme to provide a comparison to the locally prepared standards to monitor their
suitability and accuracy.
The duplicate analysis revealed good repeatability achieved by the laboratory and high
precision of sample pairs. However, Solid should consider sending duplicate samples for
analysis at an external laboratory as a further validation method for their existing quality
control procedures.
Overall Micon considers the sample assays suitable for mineral resource calculations.

Solid Resources Ltd
Alberta-1 Rare Metals Project May 2014 77
12.0 DATA VERIFICATION
12.1 SITE VISIT
Mr Stanley Bartlett visited the Alberta-1 project site from 10th
to 11th
April 2014. The
purpose of the site visit was to review the site as a whole and all the mineralised areas.
During the visit Mr Bartlett also visited a number of the old workings within the project area,
interviewed project personnel, assessed current exploration procedures and arranged for
receipt by Micon of all relevant information for the preparation of this Technical Report.
At Presqueiras a number of drill sites were observed and compared with the relative position
of these on drill hole collar plans. Each of the Solid drill hole collars was well marked with a
concrete survey marker and a steel collar plug. The drill holes were often aligned to intercept
the mineralised zones down-dip from surface exposures of the mineralisation. Surface
exposures of the mineralisation were usually manifest as trenches that run along the trend of
the slope.
At the north end of Presqueiras an old open pit is present, which probably dates back to the
1950’s or 1960’s. The pit forms a ravine-like structure that opens to the north and has a
maximum depth of only 30 m. However, at the base of the pit a number of adits cross cut the
mineralisation and turn to follow the trend of the mineralisation at fairly constant elevation.
Toward the southern end of the Presqueiras prospect an adit with a locked gate is present.
This adit was the source of the bulk sample sent to SGS in Cornwall, UK. Specimens from
the stockpile contain coarse-grained spodumene. Cassiterite was also observed.
Approximately, 45 tonnes remains on the stockpile.
At Coto Tocayo drill hole collars were observed below the crest of the ridge and the trench
that trends along the mineralisation at surface. The collars were marked with survey markers
and steel caps.
Similar collar markers and trenches were observed at Rubillón and Taboazas. At Taboazas
an adit was observed in the ravine where a dyke of the upper mineralised zone is exposed at
surface.
12.2 ASSAY VERIFICATION
Micon completed standard validation checks to ensure that the drill hole database provided
did not contain duplicate data, overlapping intervals, unmatched drill hole identifiers, and
incorrect data values. No matters of concern were identified (see Section 14.0).

Solid Resources Ltd
Alberta-1 Rare Metals Project May 2014 78
13.0 MINERAL PROCESSING AND METALLURGICAL TESTING
A sample of mineralised pegmatite was prepared in August 2011 for mineralogical and
metallurgical testing. This sample weighed 246 kg and was made up from ¼ HQ-PQ drill
cores from Presqueiras drill holes from different parts of the deposit. The chemical content
was calculated from the assay data of the core by weighted average for the whole sample;
Sn 751 ppm, Ta2O5 106 ppm, Nb2O5 101 ppm and Li2O 0.92%.
The sample was sent to SGS Minerals Services UK, Limited. The results of the
mineralogical characteristics and recovery are described in the SGS reports cited in the list of
references. A summary of these results are given in the following sections.
13.1 MINERALOGICAL CHARACTERISTICS OF SAMPLE
The mineralogical examination of the sample was carried out with X-ray diffraction (XRD),
QEMSCAN™, electron microprobe and chemical analysis. The purpose of this test
programme was to determine the overall mineral assemblage and the liberation/association of
Li, Sn and Nb-Ta minerals. The mineralogical analysis was conducted on four size fractions
including -300/+150 µm, -150/+75 µm, -75/+25 µm and -25 µm. A summary of the results
are presented below.
13.1.1 XRD Analysis
The SGS285 sample consists of major amounts of quartz and plagioclase, minor petalite,
Kfeldspar and mica and trace amounts of tentatively identified spodumene. Note that the
presence of spodumene was also verified with the electron microprobe analyses.
13.1.2 QEMSCAN™ Analysis
The sample is dominated by Na-feldspar (albite) 36.0% and quartz 21.9%, moderate
muscovite 15.0% and microcline 10.6%, minor petalite 9.6%, kaolinite 4.3% and trace
amounts <1% of beryl/topaz, apatite, biotite, amblygonite, tourmaline, cassiterite, oxides,
monazite, columbite, lithiophilite and other minerals.
13.1.3 Elemental Deportment
The elemental deportment is calculated based on the mass and chemical composition of each
mineral in the sample/fraction. Micas and microcline carry the Rb at 51.2% and 48.8%,
respectively. Columbite carries most of the Ta at 93.8% and Nb at 95.8%, while cassiterite
hosts 6.2% and 4.2%, respectively. Cassiterite contains most of the Sn (99.7%), while trace
amounts are accounted for by the columbite.
Liberation and association of petalite, columbite and cassiterite:
Free and liberated petalite accounts for 80.4%. The main association of petalite is as
complex particles (9.7%) and as middlings with clays (3.5%), quartz (2.9%), feldspar
(2.0%), tertiary middlings with quartz/micas (1.3%);
Free and liberated columbite accounts for 37.6%. The main association of columbite
is as complex particles (56.7%) and as middlings with feldspars (1.8%), cassiterite
(1.2%), and micas (1.1%); and,

Solid Resources Ltd
Alberta-1 Rare Metals Project May 2014 79
Free and liberated cassiterite accounts for 85.3%. The main association of cassiterite
is as complex particles (12.4%) and as middlings with feldspar (2.2%).
Mineral release curves of petalite, columbite and cassiterite:
Petalite liberation ranges from 79% to 82% to 84% to 74% for grain sizes of 254 µm,
106 µm, 43 µm and 9 µm respectively;
Liberation of columbite ranges from nil to 3% to 46% to 48% for the same sizes,
respectively; and,
Liberation of cassiterite ranges from 52% to 83% to 97% to 87% for the same sizes,
respectively.
Micon considers the main lithium mineral to be spodumene as the chemical assay of lithium
is more consistent with the chemical composition of spodumene than petalite, as evidenced in
the field samples and in the drill cores. That statement is also confirmed by the last
mineralogical study performed by Dr. M. Fuertes dated in January 2014 (Oviedo University),
which proved that the main lithium mineral is spodumene. More than 90% of lithium
minerals in the pegmatite are spodumene, refer to Section 7.0 (Table 7.1 and Figure 7.13).
13.2 RECOVERY OF TIN, TANTALUM AND LITHIUM
Taking into account the results of the mineralogical study a test programme was designed
(Figure 13.1).
The mineralogy showed that the D50 liberation size for the main minerals of interest was
around 50 µm. The columbite had a D50 liberation size of 15 µm.
Both the gravity and mineralogy showed that the cassiterite was liberated at all sizes, and this
would dictate that any processing circuit would require stage grinding followed by separation
to remove the cassiterite as soon as it was liberated. This would prevent the cassiterite from
being overground to slimes, which would report to tailings as evidenced by the bulk table
test. There is also evidence that over 40% of the cassiterite can be scalped at the relatively
coarse size of 3.35 mm, using jigs.
The tantalum and niobium also show some liberation at all sizes, which may be due to their
association with the tin, which again points to a stage grind/separation type process. There is
evidence of a small amount of concentration of lithium to gravity concentrates, due to the
presence of minor lithium minerals with higher densities. However, the recoveries are very
low, and would ultimately report to a middlings fraction.
The mineralogy pointed to an optimum grind size of 150 µm for ultimate cassiterite
liberation. However, finer grinding of potential tailings products could be necessary in order
to extract the maximum amount of tantalum and niobium.
Some tin can be recovered at all sizes to grades above 10%, but tin concentration becomes
most effective at sizes below 500 µm, and especially below 250 µm. Both the tantalum and
niobium tend to follow the same trend as the tin, due to the simple locking described in the
mineralogy. Lithium does not respond well to gravity separation, and tends to report to
tailings.

Solid Resources Ltd
Alberta-1 Rare Metals Project May 2014 80
Magnetic profiling would indicate that the tantalum and niobium can be separated from the
tin at magnetic field strengths of 1.0 Tesla or below on concentrates milled to below 125 µm.
Cleaning would be required to reduce entrainment and to maximise tin recovery.
A small-scale pilot plant may be necessary to generate sufficient concentrate to determine
final grades and weight splits for cassiterite and columbite production.
Figure 13.1: Test Programme for Tin, Tantalum and Lithium Recovery
Source: Solid
The metallurgical test work that was conducted at the SGS Laboratory at Cornwall, UK
produced inconclusive results concerning the recovery of lithium minerals. There was some
confusion at the time the test work was conducted whether the primary lithium mineral was
spodumene (LiAlSi2O6) or petalite (Li(AlSi)4O10). Differentiation of the two minerals is
critical as spodumene is much simpler to concentrate by flotation and spodumene
concentrates tend to be higher grade at 5% to 6% Li2O. In contrast petalite concentrates
typically contain 3.5% to 4.5 % Li2O.
In order to generate net smelter return values to be used to establish the cut-off grade for
mineral resources Micon assumed the following recoveries could be achieved: Sn 80%,
Ta 75% and Li2O 80%.

Solid Resources Ltd
Alberta-1 Rare Metals Project May 2014 81
14.0 MINERAL RESOURCE ESTIMATES
14.1 ALBERTA 1 RESOURCE MODELLING
Solid provided Micon with a series of database files in .csv format and plane interpretations
for a series of zone structures for the Presqueiras, Correa, Coto Tocayo, Acebedo, Rubillón
and Taboazas deposits.
A review of the databases provided to Micon revealed that the five deposits to the south of
Presqueiras; Correa, Coto Tocayo, Acebedo, Rubillón and Taboazas, possess a limited
amount of exploration data. The drilling undertaken at these deposits is summarised in
Table 14.1.
Table 14.1: Summary of Drilling at Southern Deposits
Zone Number Drill holes
Correa 2
Coto Tocayo 4
Acebedo 4
Rubillón 2
Taboazas 7
Total 19
14.2 PRESQUEIRAS MINERAL RESOURCE ESTIMATION
14.2.1 Database Summary
Micon obtained a database for Presqueiras in .csv format that was imported into CAE Studio
3 software. The imported database contains a total of 46 diamond drill holes. The majority
of the drill holes are vertical, with five angled drill holes trending in a north easterly
direction. The drill holes range from a maximum depth of 41.95 m to 195.15 m and total
4,676.05 m of drilling.
Table 14.2 summarises the basic statistics of the database for each of the principal elements:
tin (Sn), tantalum (Ta) and lithium (Li2O). The database contains lithium (Li) values in parts
per million (ppm) and lithium oxide (Li2O) as a percentage value. The Li2O values have
been used within the resource modelling as industry standard; these are recorded within the
database within the field “LI20_100”.
The assay .csv file provided by Solid contains a total of 905 assayed sample intervals, which
differs from the number of samples stated within Table 14.2 and later Table 14.3. This
difference occurs due to the import functions of CAE Studio 3 modelling software. The drill
hole database contains two sample interval files, an assay file and a geological description
file. Where the sample intervals do not correspond, the software generates a new sample
interval. The corresponding sample data is per the original file, but the numbers of samples
increase so that no sample data from either the assay or geology interval files is lost.

Solid Resources Ltd
Alberta-1 Rare Metals Project May 2014 82
Table 14.2: Statistical Summary of Database
Element Number
Samples Minimum Maximum
Length
Weighted
Mean
Standard
Deviation
Coefficient
of Variation
Ta2O5 (ppm) 920 0.98 333.94 73.89 57.34 0.77
Sn (ppm) 920 7.00 2350 525.16 411.18 0.78
Li2O (%) 920 0.00 2.93 0.41 0.49 1.19
Along with assay data for several elements there are also two geological fields; LITH and
GEOL. Discrepancies were observed locally between the data recorded in the two geological
fields.
Upon import of the database a number of drill holes were lacking in survey data and as
default these drill holes are imported as vertical holes.
Duplicate sample intervals were identified in several holes. A summary of the duplicate
sample intervals is discussed in the QAQC section of this Report (Section 11.6). Micon
flagged the 14 duplicate sample intervals in the drill hole database and removed the repeated
interval from the drill hole dataset used for statistical analysis and compositing. Table 14.3
summarises the basic statistics of the database with these duplicate samples removed.
Table 14.3: Statistical Summary of Database
(Duplicate Samples Removed)
Element Number
Samples Minimum Maximum
Length
Weighted
Mean
Standard
Deviation
Coefficient
of Variation
Ta2O5 (ppm) 906 0.98 333.94 73.25 57.31 0.78
Sn (ppm) 906 7.00 2,350 522.47 413.31 0.79
Li2O (%) 906 0.00 2.93 0.41 0.48 1.17
14.2.2 Wireframes
The pegmatite intervals were flagged and composite samples generated, controlled by the
flagged sample intervals. The centre point of these composite samples was then used to
generate two dimensional plane surfaces. This was undertaken for each zone structure and
used in further modelling. Within Surfaces 1 and 2 (Figure 14.1), unsampled intersections
between narrow pegmatite units are included within the composite samples. This includes an
interval in surface 1 described within the LITH field as “ADIT”.
The mineralisation of the deposits is hosted within pegmatite dykes, the plane surfaces
provided to Micon have been generated though the centre of the identified dyke structures.
The pegmatite dykes are clearly distinguishable within the geological logging. Micon has
utilised the geological information and the plane surface interpretations to generate a group of
wireframe solids. The geological data within the LITH field corresponds with the plane
surface interpretations provided by Solid. The morphology of the Micon wireframes in strike
and dip, predominantly correlate with the plane surface interpretations, extensions of the
surfaces along strike and down dip where justified were interpreted by Micon. Extensions
along the strike of 150 m were applied to the two larger dyke structures (Surfaces 1 and 2)
and 100 m to the other dyke structures. Extensions up and down dip of the sample
Solid Resources Ltd
Alberta-1 Rare Metals Project May 2014 83
intersections of approximately 50 m were applied, unless continuity between section lines
could be established. The unsampled intersections included within the centre line plane
surface interpretations are also included within the Micon interpretations in Surfaces 1 and 2.
A wireframe solid was generated for each individual dyke structure and were coded as
individual surfaces using a numerical reference ‘SURFACE’. The dyke structures were
defined as independent surfaces so that samples within each solid surface (dyke) could be
flagged accordingly with the surface number into which they occurred. Block estimation
search ellipsoids were controlled to use only samples within individual surfaces.
An oblique view of the wireframes generated by Micon is presented in Figure 14.1.
14.2.3 Topography
A topographic surface was provided by Solid which covered the area of the Presqueiras
deposit as presented in Figure 14.2. This topographic surface did not cover the extent of the
wireframe interpretations undertaken by Micon. An extension to the topography was
generated by Micon using the general trend of the topography. This extended topographic
surface was used to limit the block model at surface.

Solid Resources Ltd
Alberta-1 Rare Metals Project May 2014 84
Figure 14.1: Oblique View of the Micon Pegmatite Dyke Wireframes

Solid Resources Ltd
Alberta-1 Rare Metals Project May 2014 85
Figure 14.2: Oblique View of Topographic Surface
14.2.4 Statistical Analysis of Samples
Samples were selected within the Micon wireframes and coded by surface number so that a
separate analysis for each of the dyke structures could be completed. Table 14.4 summarises
the basic statistical sample populations within each surface for the principal elements.
Table 14.4: Statistical Summary of Samples within Micon Wireframes
Surface Element Number
Samples Minimum Maximum
Length
Weighted
Mean
Standard
Deviation
Coefficient
of Variation
1
Ta2O5 (ppm) 354 2.20 293.04 102.27 52.46 0.51
Sn (ppm) 354 32 2,350 681.39 352.47 0.52
Li2O (%) 354 0.01 2.93 0.50 0.56 1.12
2
Ta2O5 (ppm) 123 6.11 286.69 90.65 48.27 0.53
Sn (ppm) 123 40 1,532 605.55 362.35 0.60
Li2O (%) 123 0.00 2.53 0.44 0.54 1.23
3
Ta2O5 (ppm) 32 12.21 219.78 96.90 44.76 0.46
Sn (ppm) 32 164 1,900 772.01 424.22 0.55
Li2O (%) 32 0.01 0.40 0.08 0.08 1
4
Ta2O5 (ppm) 57 24.42 122.10 65.88 25.35 0.38
Sn (ppm) 57 53 1,800 712.73 423.48 0.59
Li2O (%) 57 0.02 2.15 0.70 0.58 0.83
5
Ta2O5 (ppm) 39 36.63 170.94 96.02 34.76 0.36
Sn (ppm) 39 181 1,650 733.67 364.20 0.50
Li2O (%) 39 0.02 2.13 0.64 0.58 0.91
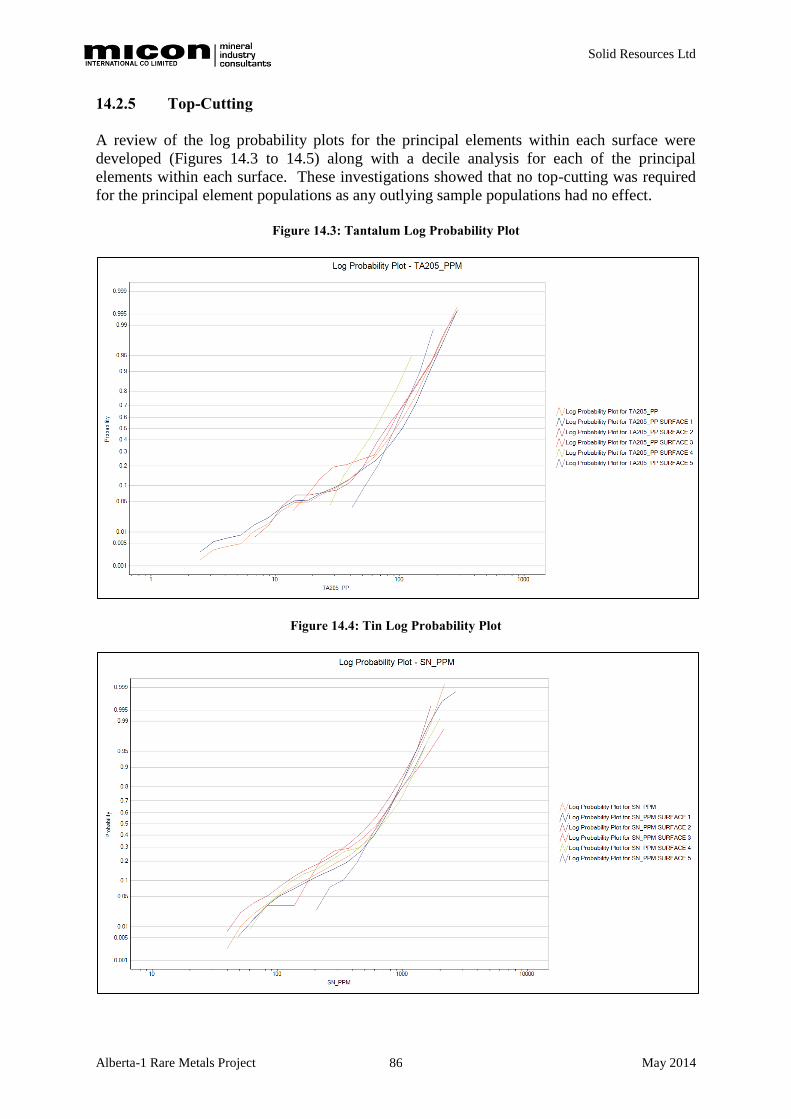
Solid Resources Ltd
Alberta-1 Rare Metals Project May 2014 86
14.2.5 Top-Cutting
A review of the log probability plots for the principal elements within each surface were
developed (Figures 14.3 to 14.5) along with a decile analysis for each of the principal
elements within each surface. These investigations showed that no top-cutting was required
for the principal element populations as any outlying sample populations had no effect.
Figure 14.3: Tantalum Log Probability Plot
Figure 14.4: Tin Log Probability Plot

Solid Resources Ltd
Alberta-1 Rare Metals Project May 2014 87
Figure 14.5: Lithium Log Probability Plot
14.2.6 Compositing
Micon used the wireframes generated to select the samples within each surface and produced
a composite sample equalling the width of the wireframe surfaces.
Table 14.5 summarises the width of the wireframe surfaces based on the composite sample
lengths. Table 14.6 provides a statistical summary of the composited sample grades for the
principal elements within each of the surfaces defined by the Micon wireframes.
Table 14.5: Statistical Review of Composite Sample Lengths (across the dyke width)
Surface
(Dyke)
Number of
Composites
Minimum
Dyke Width
(m)
Maximum
Dyke Width
(m)
Mean Dyke
Width (m)
Standard
Deviation
1 42 1.50 18.35 8.4 4.15
2 22 1.00 12.60 5.8 2.89
3 10 1.45 5.90 3.0 1.34
4 12 1.10 10.10 4.8 2.42
5 8 1.30 13.40 5.0 3.75

Solid Resources Ltd
Alberta-1 Rare Metals Project May 2014 88
Table 14.6: Statistical Review of Composite Sample Grades (across the dyke width)
Surface
(Dyke) Element
Number of
Composites Minimum Maximum
Length
Weighted
Mean
Standard
Deviation
Coefficient
of Variation
1
Ta2O5 (ppm) 42 21.37 176.49 102.24 36.80 0.36
Sn (ppm) 42 78.66 1,365.43 684.74 241.02 0.35
Li2O (%) 42 0.01 1.23 0.49 0.38 0.78
2
Ta2O5 (ppm) 22 36.63 177.34 88.40 36.27 0.41
Sn (ppm) 22 125.00 1,223.22 586.80 273.07 0.47
Li2O (%) 22 0.02 1.44 0.42 0.39 0.93
3
Ta2O5 (ppm) 10 43.81 176.06 96.90 34.65 0.36
Sn (ppm) 10 233.00 1,141.44 772.01 285.39 0.37
Li2O (%) 10 0.02 0.11 0.08 0.05 0.62
4
Ta2O5 (ppm) 12 36.63 109.89 65.88 15.73 0.24
Sn (ppm) 12 208.43 1,575.00 712.73 348.41 0.49
Li2O (%) 12 0.03 1.31 0.70 0.40 0.57
5
Ta2O5 (ppm) 8 74.05 158.73 96.02 21.07 0.22
Sn (ppm) 8 469.06 1,411.94 733.67 278.13 0.38
Li2O (%) 8 0.02 1.02 0.64 0.35 0.55
14.2.6.1 Composite Length by Most Common Sample Interval
A histogram plot was generated to establish the most common sample interval length selected
within the Micon wireframes of the pegmatite dykes. The histogram presented in Figure 14.6
clearly identifies that 1 m is the most common sample interval length. Compositing to the
most common sample interval was undertaken so that a dataset with a large enough number
of composites was available for the variographic analysis (Section 14.2.1).
Figure 14.6: Histogram of Sample Lengths within Micon Pegmatite Wireframes

Solid Resources Ltd
Alberta-1 Rare Metals Project May 2014 89
Compositing on a 1 m interval, constrained by the wireframe surface boundaries, was
adopted by Micon in order to undertake a statistical analysis, summarised within Tables 14.7
and 14.8. A minimum composite of 0.5 m was allowed.
Table 14.7: Statistical Review of 1 m Composite Sample Length
Surface
(Dyke)
Number of
Composites
Minimum
Composite
Length
Maximum
Composite
Length
Mean
Composite
Length
Standard
Deviation
1 354 0.50 1.00 0.98 0.08
2 126 0.60 1.00 0.98 0.08
3 29 0.50 1.00 0.94 0.14
4 57 0.55 1.00 0.99 0.07
5 35 0.50 1.00 0.98 0.09
Table 14.8: Statistical Review of 1 m Composite Samples
Surface
(Dyke) Element
Number of
Composites Minimum Maximum
Length
Weighted
Mean
Standard
Deviation
Coefficient
of Variation
1
Ta2O5 (ppm) 351 2.39 293.04 101.97 51.22 0.50
Sn (ppm) 351 32 2,350 679.70 345.91 0.51
Li2O (%) 351 0.01 2.33 0.50 0.55 1.10
2
Ta2O5 (ppm) 121 6.11 286.69 89.51 48.11 0.54
Sn (ppm) 121 40 1,532 593.46 365.20 0.62
Li2O (%) 121 0.00 1.97 0.40 0.48 1.20
3
Ta2O5 (ppm) 29 24.42 219.78 98.02 45.09 0.46
Sn (ppm) 29 164 1,900 754.67 400.56 0.53
Li2O (%) 29 0.01 0.35 0.08 0.07 0.88
4
Ta2O5 (ppm) 57 24.42 122.10 65.11 24.99 0.38
Sn (ppm) 57 53 1,800 706.23 423.17 0.60
Li2O (%) 57 0.02 2.15 0.72 0.58 0.81
5
Ta2O5 (ppm) 36 36.63 170.94 96.57 35.92 0.37
Sn (ppm) 36 181 1,650 729.03 346.12 0.47
Li2O (%) 36 0.02 2.13 0.66 0.60 0.91
The number of samples within each surface will differ between Tables 14.7 and 14.8 due to
the presence of un-assayed sample intervals, these intervals will have a length assigned and
therefore will be included within Table 14.7, but if they have a lack of assayed sample data
then they will not be included within the number of samples in Table 14.8.
14.2.6.2 Statistical Comparison of Composited Data
Table 14.9 summarises the statistical data from the samples within the Micon wireframes,
compositing across the width of the wireframe volume, and compositing on the most
common sample interval of 1 m.
It is evident from this comparison that compositing across the width of the wireframe volume
greatly reduces the number of samples available for estimation in a deposit which already has
a limited dataset. Compositing to 1 m intervals maintains a larger number of samples.

Solid Resources Ltd
Alberta-1 Rare Metals Project May 2014 90
Table 14.9: Comparison of Sample Sets Statistical Analysis
Surface
(Dyke) Element
Raw Samples Inside Wireframe Composite Samples Across Dyke Width 1 m Composite Samples
Number
of
Samples
Length
Weighted
Mean
Standard
Deviation
Coefficient
of Variation
Number
of
Samples
Length
Weighted
Mean
Standard
Deviation
Coefficient
of Variation
Number
of
Samples
Length
Weighted
Mean
Standard
Deviation
Coefficient
of Variation
1
Ta2O5 (ppm) 354 102.27 52.46 0.51 42 102.24 36.80 0.36 351 101.97 51.22 0.50
Sn (ppm) 354 681.39 352.47 0.52 42 684.74 241.02 0.35 351 679.70 345.91 0.51
Li2O (%) 354 0.50 0.56 1.12 42 0.49 0.38 0.78 351 0.50 0.55 1.10
2
Ta2O5 (ppm) 123 90.65 48.27 0.53 22 88.40 36.27 0.41 121 89.51 48.11 0.54
Sn (ppm) 123 605.55 362.35 0.60 22 586.80 273.07 0.47 121 593.46 365.20 0.62
Li2O (%) 123 0.44 0.54 1.23 22 0.42 0.39 0.93 121 0.40 0.48 1.20
3
Ta2O5 (ppm) 32 96.90 44.76 0.46 10 96.90 34.65 0.36 29 98.02 45.09 0.46
Sn (ppm) 32 772.01 424.22 0.55 10 772.01 285.39 0.37 29 754.67 400.56 0.53
Li2O (%) 32 0.08 0.08 1.00 10 0.08 0.05 0.62 29 0.08 0.07 0.88
4
Ta2O5 (ppm) 57 65.88 25.35 0.38 12 65.88 15.73 0.24 57 65.11 24.99 0.38
Sn (ppm) 57 712.73 423.48 0.59 12 712.73 348.41 0.49 57 706.23 423.17 0.60
Li2O (%) 57 0.70 0.58 0.83 12 0.70 0.40 0.57 57 0.72 0.58 0.81
5
Ta2O5 (ppm) 39 96.02 34.76 0.36 8 96.02 21.07 0.22 36 96.57 35.92 0.37
Sn (ppm) 39 733.67 364.20 0.50 8 733.67 278.13 0.38 36 729.03 346.12 0.47
Li2O (%) 39 0.64 0.58 0.91 8 0.64 0.35 0.55 36 0.66 0.60 0.91

Solid Resources Ltd
Alberta-1 Rare Metals Project May 2014 91
Drill holes at Presqueiras have an approximate average spacing of 57 m. The 1 m
composited samples therefore provide the most closely-spaced samples for variographic
analysis as the variogram range can be influenced by the sample spacing. The 1 m composite
sample dataset also contains enough samples to undertake variographic modelling if the
sample dataset is not further sub divided by surface. The 1 m composite sample dataset is
utilised by Micon to generate down-hole variograms for each of the principal elements to
establish continuity and trends within the deposit, comment will be provided in subsequent
sections.
As a columnar block model was utilised in the modelling of this deposit the accumulated
grade generated from the across-dyke composite dataset (grade x composite length) was used
to interpolate accumulation grades into the block model.
14.2.7 Block Modelling
The Micon columnar block model was created using the wireframe solids to control the block
height in the Z direction. The columnar model prototype used by Micon is summarised in
Table 14.10. In consideration of the drill-hole spacing, Micon has selected a block size of
approximately half the average drill-hole spacing at 25 m. The range in the Z elevation has
also been set to ensure that the wireframe solids sit within the prototype hull and complete
filling of the block model is achieved. The model has been rotated 30° around the Z axis to
align the Y axis along the strike of the deposit.
Table 14.10: Micon Columnar Model Prototype
(Rotation Angle 30o around the Z Axis)
Axis Origin
(m)
Range
(m)
Block Size
(m)
Number of
Blocks
X 553,450 1,050 25 42
Y 4,706,600 1,500 25 60
Z 490 250 250 1
14.2.8 Mineral Resource Estimation
14.2.8.1 Variographic Review
In order to establish the presence of continuity and presence of trends within the datasets
Micon undertook a review of the down-hole variography using the 1 m composite sample
dataset. Figures 14.7 to 14.9 display the down-hole variograms for each of the principal
elements. The dataset was not subdivided on the surface as there is not enough data available
at this stage to undertake an analysis at dyke level. On the plots the number of sample pairs
at each point is displayed.

Solid Resources Ltd
Alberta-1 Rare Metals Project May 2014 92
Figure 14.7: Tantalum Down-Hole Variogram
Figure 14.8: Tin Down-Hole Variogram

Solid Resources Ltd
Alberta-1 Rare Metals Project May 2014 93
Figure 14.9: Lithium Down-Hole Variogram
The across-dyke width composite dataset was used to generate a series of isotropic
variograms to review the continuity for each of the principal elements. The variograms are
presented in Figures 14.10 to 14.12. In order to generate these variograms the grade values
for tantalum, and tin were converted from parts per million (ppm) to percentage values.
Figure 14.10: Tantalum Isotropic Variogram

Solid Resources Ltd
Alberta-1 Rare Metals Project May 2014 94
Figure 14.11: Tin Isotropic Variogram
Figure 14.12: Lithium Isotropic Variogram
The difference in the ranges between the down-hole and isotropic variograms show that with
further drilling campaigns the variogram ranges are likely to change. Further drilling
campaigns would also increase the sample dataset available for variographic analysis,
allowing directional variograms to be developed for each dyke (surface) potentially
identifying trends individual to each dyke structure. At this stage of the project, with the data
available, Micon has applied the Inverse Distance Squared (ID2) weighting method for grade
interpolation.

Solid Resources Ltd
Alberta-1 Rare Metals Project May 2014 95
14.2.8.2 Micon Mineral Resource Estimation
Micon utilised the search parameters outlined summarised in Tables 14.11 and 14.12, Micon
also applied rotation to the search ellipsoid to align the search along the strike and average
dip of the defined dyke structures. The search ellipsoid in relation to the wireframe volumes
(shown in the skeletal form) is presented in Figure 14.13.
Table 14.11: Micon Estimation Parameters
Search
Number
Distance
(m)
Minimum Number
of Composites
Octant
Control
1 60 x 60 3 Yes
2 120 x 120 3 Yes
3 240 x 240 1 Yes
4 120 x 120 1 No
5 240 x 240 1 No
6 480 x 480 1 No
Table 14.12: Additional Estimation Parameters
Maximum No. of
Composites
Minimum
No. Octants
Minimum No. of
Comp. per Octant
Maximum No. of
Comp. per Octant
15 3 1 3
Figure 14.13: Oblique Views of the Search Ellipsoid in Relation to the Micon Wireframes
Grade interpolation was completed by Micon using the Inverse Distance Squared (ID2)
weighting method. The interpolation was limited to the individual dyke surfaces so that
samples located in adjacent dykes did not have an influence on the estimated block grades.
The accumulated composited grades were estimated into the blocks and the actual grades of
the block calculated though the application of the following equation.
Equation 1:

Solid Resources Ltd
Alberta-1 Rare Metals Project May 2014 96
14.2.8.3 Block Model Validation
The block model was validated using visual inspections of section and plan views and using
decluster plots for each of the principal elements. The estimated block grades and drill
composite grades were declustered onto a grid of 25 m by 25 m by 20 m (X, Y, and Z).
A dimension of 20 m was specified in the Z direction as the maximum composite length was
18 m; specifying 20 m ensures that the composite is included within the declustered grid.
The declustered drill-hole composite grades are plotted against the estimated block grades for
each block in which the drill-hole composites are located. Figures 14.14 to 14.16 display the
decluster plots generated for the ID2 estimations undertaken by Micon. The plots for
tantalum, tin and lithium show no bias and moderate to good correlation between the
estimated and composited grades within the block model.
Figure 14.14: Tantalum Decluster Plot

Solid Resources Ltd
Alberta-1 Rare Metals Project May 2014 97
Figure 14.15: Tin Decluster Plot
Figure 14.16: Lithium Decluster Plot

Solid Resources Ltd
Alberta-1 Rare Metals Project May 2014 98
Table 14.13 compares the global declustered mean grades.
Table 14.13: Comparison of Global Declustered Mean Grades
Element Declustered Composite
Mean Grade
Declustered Block Model
Mean Grade
Variance
(%)
Ta (ppm) 104.33 97.50 -7
Sn (ppm) 741.16 704.96 -5
Li (%) 0.38 0.42 11
14.2.9 Mineral Resource Classification
14.2.9.1 Micon Resource Classification
Micon applied the criteria outlined in Table 14.14, which are based on the geostatistical
studies undertaken and the drill-hole data available.
Table 14.14: Mineral Resource Classification Criteria
Classification Criteria
Measured Covered by a grid (at least 3 holes) of at least 120 m
Indicated Covered by a grid (at least 3 holes) of at least 250 m
Inferred
Remaining blocks within interpreted dyke structures, which
are generally limited to a maximum extrapolation of 100 m
down dip and 50 m along strike.
The search parameters applied in the estimation lead to the overlapping of search zones with
or without octant control applied. A review of the block model identified that the areas
classified as Measured lie mainly within the first and second searches (60 m by 60 m and
120 m by 120 m), which have octant controls applied. Material within the fourth search was
considered to be Indicated. All other material forms the Inferred proportions of the model.
Micon reviewed each dyke structure independently and used strings to define the block
classification, applying the criteria within Table 14.14. The search volume morphology
applied in relation to the block model was also considered.
There are also a number of areas within several of the surfaces where Indicated material has
been allocated on the presence of two samples not three, as per the criteria. Micon has
assigned this classification as the blocks are within the first search of 60 m by 60 m where
octant controls are present.
The Measured mineral resources are located in the more densely drilled Surfaces of 1 and 2,
with the other three surfaces comprising proportions of Inferred and Indicated material.
14.2.10 Density
A bulk density value of 2.59 t/m3 was assigned to the blocks within the pegmatite dykes. A
value of 2.75 t/m3 was applied to waste material. Average bulk density values for each dyke
were calculated from 1,446 specific gravity measurements taken between 2003 and 2012, in
all of the deposit areas; Presqueiras, Correa, Coto, Tocayo, Acebedo, Rubillón and Taboazas.
The samples used for specific gravity determination were taken within the pegmatite units at
1 m intervals (Section 10.3).

Solid Resources Ltd
Alberta-1 Rare Metals Project May 2014 99
14.2.11 Dilution
A minimum mining width of 2 m was applied to the blocks within the model. Dilution was
applied to a total of 47 blocks within the Micon model, with the block grades diluted
accordingly. Nil grade was assumed for waste dilution.
14.2.12 Mineral Resource Model Evaluation
The block model for the Presqueiras deposit was cut to the extended topographic surface
(Section 14.2.3) to remove blocks located above the topography. A summary of the
Presqueiras mineralisation within the Micon model is presented in Table 14.15. The figures
presented are the diluted grades with a minimum mining width of 2 m applied.
Table 14.15: Micon Presqueiras Volume of Mineralisation
Category Tonnage
(Mt)
Ta2O5
(ppm)
Sn
(ppm)
Li2O
(%)
Measured 3.1 108 733 0.51
Indicated 2.2 88 662 0.49
Measured + Indicated 5.3 100 704 0.50
Inferred 3.1 78 638 0.35
Table 14.16 summarises the mineral resources within each of the dyke structures and is
included for reference. The figures presented have been diluted to the minimum mining
width of 2 m.
Table 14.16: Micon Presqueiras Mineralisation by Dyke Structure
Category Dyke
(Surface)
Tonnage
(kt)
Ta2O5
(ppm)
Sn
(ppm)
Li2O
(%)
Measured 1 2.5 114 770 0.53
2 0.60 85 578 0.40
Indicated
1 1.2 97 687 0.48
2 0.36 84 576 0.63
3 0.11 97 734 0.04
4 0.39 57 626 0.55
5 0.07 101 746 0.42
Inferred
1 0.76 91 673 0.27
2 0.90 80 530 0.32
3 0.38 79 657 0.09
4 0.59 56 685 0.51
5 0.46 82 717 0.53
14.2.12.1 Grade Tonnage Curves
Grade tonnage curves for each of the principal elements have been generated to review the
relationship between the tonnage and grade of material classed as Measured and Indicated.
The diluted model was used to generate the plots displayed in Figures 14.17 to 14.19.
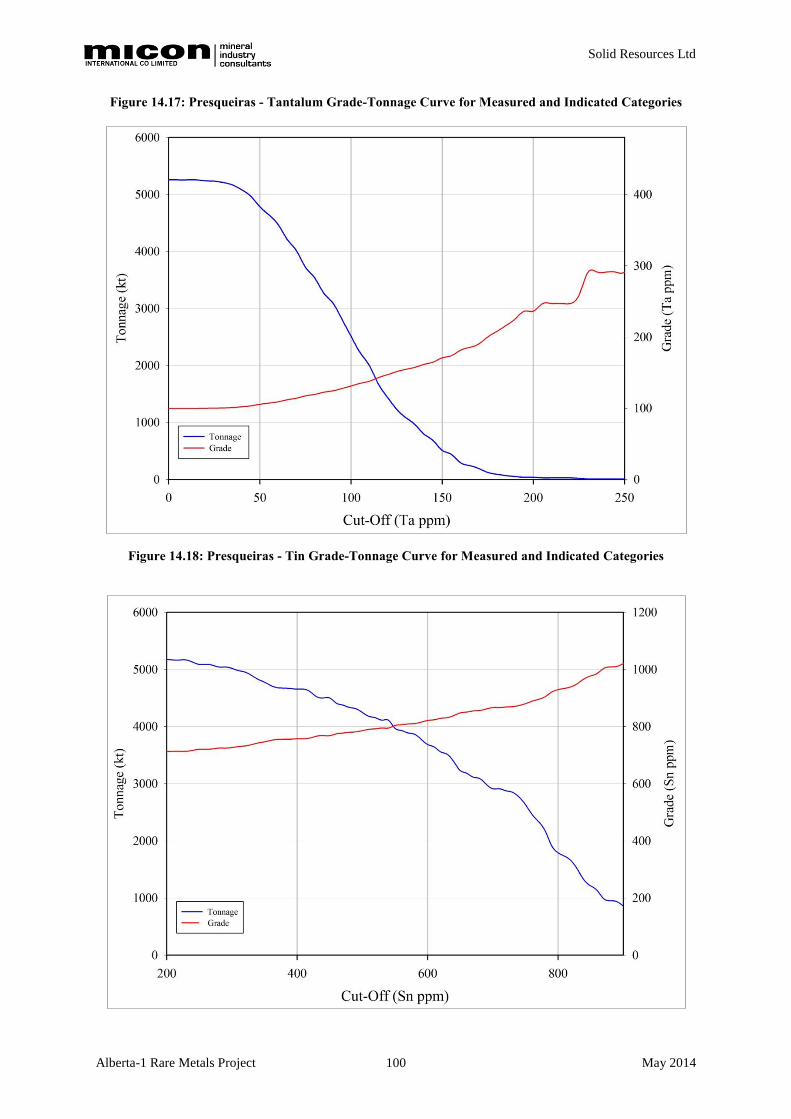
Solid Resources Ltd
Alberta-1 Rare Metals Project May 2014 100
Figure 14.17: Presqueiras - Tantalum Grade-Tonnage Curve for Measured and Indicated Categories
Figure 14.18: Presqueiras - Tin Grade-Tonnage Curve for Measured and Indicated Categories
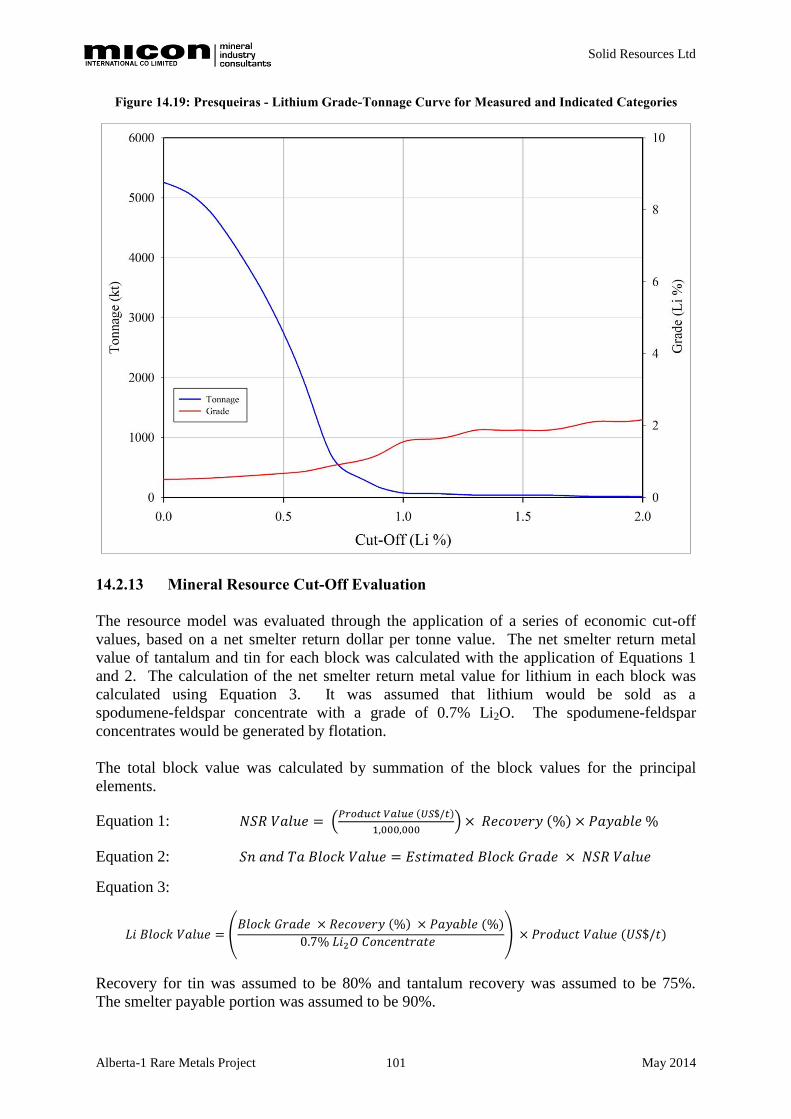
Solid Resources Ltd
Alberta-1 Rare Metals Project May 2014 101
Figure 14.19: Presqueiras - Lithium Grade-Tonnage Curve for Measured and Indicated Categories
14.2.13 Mineral Resource Cut-Off Evaluation
The resource model was evaluated through the application of a series of economic cut-off
values, based on a net smelter return dollar per tonne value. The net smelter return metal
value of tantalum and tin for each block was calculated with the application of Equations 1
and 2. The calculation of the net smelter return metal value for lithium in each block was
calculated using Equation 3. It was assumed that lithium would be sold as a
spodumene-feldspar concentrate with a grade of 0.7% Li2O. The spodumene-feldspar
concentrates would be generated by flotation.
The total block value was calculated by summation of the block values for the principal
elements.
Equation 1: (
)
Equation 2:
Equation 3:
(
)
Recovery for tin was assumed to be 80% and tantalum recovery was assumed to be 75%.
The smelter payable portion was assumed to be 90%.
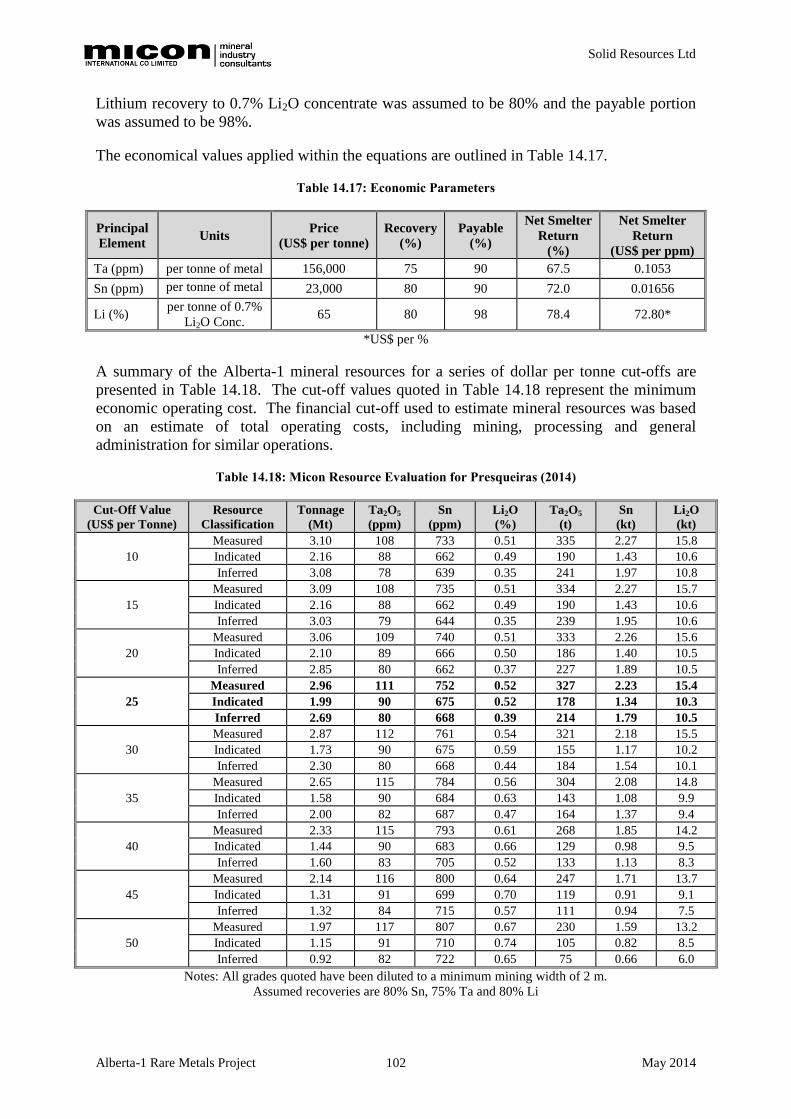
Solid Resources Ltd
Alberta-1 Rare Metals Project May 2014 102
Lithium recovery to 0.7% Li2O concentrate was assumed to be 80% and the payable portion
was assumed to be 98%.
The economical values applied within the equations are outlined in Table 14.17.
Table 14.17: Economic Parameters
Principal
Element Units
Price
(US$ per tonne)
Recovery
(%)
Payable
(%)
Net Smelter
Return
(%)
Net Smelter
Return
(US$ per ppm)
Ta (ppm) per tonne of metal 156,000 75 90 67.5 0.1053
Sn (ppm) per tonne of metal 23,000 80 90 72.0 0.01656
Li (%) per tonne of 0.7%
Li2O Conc. 65 80 98 78.4 72.80*
*US$ per %
A summary of the Alberta-1 mineral resources for a series of dollar per tonne cut-offs are
presented in Table 14.18. The cut-off values quoted in Table 14.18 represent the minimum
economic operating cost. The financial cut-off used to estimate mineral resources was based
on an estimate of total operating costs, including mining, processing and general
administration for similar operations.
Table 14.18: Micon Resource Evaluation for Presqueiras (2014)
Cut-Off Value
(US$ per Tonne)
Resource
Classification
Tonnage
(Mt)
Ta2O5
(ppm)
Sn
(ppm)
Li2O
(%)
Ta2O5
(t)
Sn
(kt)
Li2O
(kt)
10
Measured 3.10 108 733 0.51 335 2.27 15.8
Indicated 2.16 88 662 0.49 190 1.43 10.6
Inferred 3.08 78 639 0.35 241 1.97 10.8
15
Measured 3.09 108 735 0.51 334 2.27 15.7
Indicated 2.16 88 662 0.49 190 1.43 10.6
Inferred 3.03 79 644 0.35 239 1.95 10.6
20
Measured 3.06 109 740 0.51 333 2.26 15.6
Indicated 2.10 89 666 0.50 186 1.40 10.5
Inferred 2.85 80 662 0.37 227 1.89 10.5
25
Measured 2.96 111 752 0.52 327 2.23 15.4
Indicated 1.99 90 675 0.52 178 1.34 10.3
Inferred 2.69 80 668 0.39 214 1.79 10.5
30
Measured 2.87 112 761 0.54 321 2.18 15.5
Indicated 1.73 90 675 0.59 155 1.17 10.2
Inferred 2.30 80 668 0.44 184 1.54 10.1
35
Measured 2.65 115 784 0.56 304 2.08 14.8
Indicated 1.58 90 684 0.63 143 1.08 9.9
Inferred 2.00 82 687 0.47 164 1.37 9.4
40
Measured 2.33 115 793 0.61 268 1.85 14.2
Indicated 1.44 90 683 0.66 129 0.98 9.5
Inferred 1.60 83 705 0.52 133 1.13 8.3
45
Measured 2.14 116 800 0.64 247 1.71 13.7
Indicated 1.31 91 699 0.70 119 0.91 9.1
Inferred 1.32 84 715 0.57 111 0.94 7.5
50
Measured 1.97 117 807 0.67 230 1.59 13.2
Indicated 1.15 91 710 0.74 105 0.82 8.5
Inferred 0.92 82 722 0.65 75 0.66 6.0
Notes: All grades quoted have been diluted to a minimum mining width of 2 m.
Assumed recoveries are 80% Sn, 75% Ta and 80% Li

Solid Resources Ltd
Alberta-1 Rare Metals Project May 2014 103
14.3 SOUTHERN AREA MINERAL RESOURCE ESTIMATE
The Southern area comprises five separate zones; Correa, Coto Tocayo, Acebedo, Rubillón
and Taboazas. Solid provided Micon with the drill hole database files in .csv format for all
five zones. The drill-hole databases for each zone have a limited number of holes, which are
summarised in Table 14.1 in Section 14.1. Database review, wireframe development and
block model generation for the Southern areas were conducted as per the methodology
followed for the Presqueiras mineral resource estimate (Section 14.2). The following
sections summarise the modelling process completed by Micon.
14.3.1 Database Summary
While importing the data into the CAE Studio 3 software used for the deposit modelling four
duplicate sample intervals were identified in the database. These duplicate intervals have
been flagged by Micon and removed from the database used for analysis and modelling
purposes. Table 14.19 presents the basic statistical summary of the drill-hole databases
within each of the five zones.
Drill hole spacing within the zones ranges from approximately 100 m to 200 m.
Table 14.19: Basic Statistical Summary for the Southern Zones
Area Element Number
Samples Minimum Maximum
Length
Weighted
Mean
Standard
Deviation
Coefficient
of
Variation
Acebedo
Ta2O5 (ppm) 55 0.90 170 72.81 43.82 0.60
Sn (ppm) 55 4.00 1,490 706.77 432.43 0.61
Li2O (%) 55 0.01 2.15 0.31 0.43 1.39
Correa
Ta2O5 (ppm) 22 5.00 390 65.54 85.20 1.30
Sn (ppm) 22 2.50 1,235 309.27 322.18 1.04
Li2O (%) 22 0.01 1.80 0.32 0.46 1.44
Coto Tocayo
Ta2O5 (ppm) 102 1.20 229.20 84.31 68.48 0.81
Sn (ppm) 102 6.10 1,665 574.09 464.45 0.81
Li2O (%) 102 0.00 1.84 0.24 0.36 1.50
Rubillón
Ta2O5 (ppm) 20 5.00 180 62.54 52.24 0.84
Sn (ppm) 20 22.00 1,435 523.69 457.08 0.87
Li2O (%) 20 0.01 0.22 0.06 0.06 1.00
Taboazas
Ta2O5 (ppm) 191 1.10 344.30 83.67 84.52 1.01
Sn (ppm) 184 6.00 2,930 499.30 472.80 0.95
Li2O (%) 191 0.01 2.36 0.49 0.56 1.14
In the Taboazas zone there are a different number of samples for each of the principal
elements, this is due to some sample intervals not having assay samples for tin with results
stated for lithium and tantalum.
14.3.2 Wireframes
Wireframes were generated using the geological information within the database to define the
solid volumes of the pegmatite zone structures. Table 14.20 summaries the number of zone
structures identified within each of the zones. Each zone structure was assigned a numerical
“SURFACE” value which could be used to control later estimations and prevent the smearing

Solid Resources Ltd
Alberta-1 Rare Metals Project May 2014 104
of grades between the zone structures. Wireframes were extended along strike projections
approximately 100 m, and approximately 100 m to 150 m up and down dip of sample
intersections, unless the interpretation was constricted due to drilling data. Plan and oblique
views, where appropriate, of the wireframes developed for the five zones are displayed in
Figures 14.20 to 14.24. For display purposes, where multiple surfaces are present within the
zones the wireframe surfaces have been solid filled to allow the distinction between the
surfaces to be made.
Table 14.20: Wireframe Summary
Area Number of Zone Structures
(SURFACE)
Acebedo 1
Correa 1
Coto Tocayo 3
Rubillón 2
Taboazas 7
Figure 14.20: Acebedo - Plan View Micon 2014

Solid Resources Ltd
Alberta-1 Rare Metals Project May 2014 105
Figure 14.21: Correa - Plan View Micon 2014
Figure 14.22: Coto Tocayo - Oblique View Micon 2014

Solid Resources Ltd
Alberta-1 Rare Metals Project May 2014 106
Figure 14.23: Rubillón - Oblique View Micon 2014
Figure 14.24: Taboazas - Oblique View Micon 2014
All of the wireframe solids generated by Micon were validated, ensuring no open edges or
intersections were present within the solids.

Solid Resources Ltd
Alberta-1 Rare Metals Project May 2014 107
14.3.3 Topography
Topographic surfaces covering the extent of the five zones were provided by Solid. These
surfaces were used to limit the upper extensions of the block model.
14.3.4 Statistical Analysis of Samples
The wireframe solids were used to select samples within each zone. The statistical summary
of these samples is presented in Table 14.21.
Table 14.21: Southern Zones - Statistical Summary of Samples within Micon Wireframes
Area Element Number
Samples Minimum Maximum Mean
Standard
Deviation
Coefficient
of
Variation
Acebedo
Ta2O5 (ppm) 40 5 170 92.00 31.51 0.34
Sn (ppm) 40 71 1,490 895.70 327.38 0.37
Li2O (%) 40 0.01 2.15 0.37 0.49 1.32
Correa
Ta2O5 (ppm) 10 40 390 111.22 98.70 0.89
Sn (ppm) 10 255 1,235 549.10 301.74 0.55
Li2O (%) 10 0.03 1.80 0.52 0.58 1.12
Coto Tocayo
Ta2O5 (ppm) 68 4.30 229.20 122.02 52.85 0.43
Sn (ppm) 68 35 1,665 819.90 379.07 0.46
Li2O (%) 68 0.00 1.84 0.26 0.44 1.69
Rubillón
Ta2O5 (ppm) 14 30 180 84.78 48.02 0.57
Sn (ppm) 14 159 1,435 709.78 431.73 0.61
Li2O (%) 14 0.01 0.10 0.03 0.02 0.67
Taboazas
Ta2O5 (ppm) 122 1.10 344.30 125.20 79.03 0.63
Sn (ppm) 120 11.10 2,930 710.31 458.11 0.64
Li2O (%) 122 0.01 2.36 0.66 0.64 0.97
14.3.5 Top Cutting
A review of the sample populations was undertaken to establish if top-cutting was required to
remove the influence of high grade outlier samples for each of the principal elements within
the zones. Log probability plots and decile analysis were conducted. These investigations
showed that no top-cutting to the sample populations was required for the Southern zones.
The log probability plots of the elements within each of the areas are displayed in
Figures 14.25 to 14.29.

Solid Resources Ltd
Alberta-1 Rare Metals Project May 2014 108
Figure 14.25: Acebedo - Log Probability Plots
Figure 14.26: Correa - Log Probability Plots

Solid Resources Ltd
Alberta-1 Rare Metals Project May 2014 109
Figure 14.27: Coto Tocayo - Log Probability Plots
Figure 14.28: Rubillón - Log Probability Plots

Solid Resources Ltd
Alberta-1 Rare Metals Project May 2014 110
Figure 14.29: Taboazas - Log Probability Plots

Solid Resources Ltd
Alberta-1 Rare Metals Project May 2014 111
14.3.6 Compositing
Micon used the wireframes generated to select the samples within each surface of the five
zones and produced a series of composite samples equalling the width of the wireframe
surfaces.
Table 14.22 summarises the width of the wireframe surfaces based on the composite sample
lengths. Table 14.23 provides a statistical summary of the composited sample grades for the
principal elements within each of the areas defined by the Micon wireframes.
Table 14.22: Statistical Review of Composite Sample Lengths (across the zone width)
Area Number of
Composites
Minimum
Zone Width
(m)
Maximum
Zone Width
(m)
Mean
Zone Width
(m)
Standard
Deviation
Acebedo 4 2.90 15.00 10.25 4.56
Correa 2 3.80 6.00 4.90 1.10
Coto Tocayo 14 0.60 16.20 4.71 4.39
Rubillón 3 2.50 5.55 4.50 1.41
Taboazas 26 0.50 13.30 4.48 3.92
Table 14.23: Statistical Review of Composite Sample Grades (across the zone width)
Surface
(Zone) Element
Number of
Composites Minimum Maximum
Length
Weighted
Mean
Standard
Deviation
Coefficient
of Variation
Acebedo
Ta2O5 (ppm) 4 80.0 100.10 92.00 8.31 0.09
Sn (ppm) 4 788.83 1,009.59 895.70 93.39 0.10
Li2O (%) 4 0.01 0.75 0.37 0.28 0.76
Correa
Ta2O5 (ppm) 2 73.33 171.05 111.22 47.61 0.43
Sn (ppm) 2 532.0 576.11 549.10 21.49 0.04
Li2O (%) 2 0.07 0.81 0.52 0.36 0.69
Coto Tocayo
Ta2O5 (ppm) 14 79.25 190.0 122.02 27.71 0.23
Sn (ppm) 14 479.0 1,325.0 819.90 222.12 0.27
Li2O (%) 14 0.01 1.09 0.26 0.30 1.15
Rubillón
Ta2O5 (ppm) 3 44.95 114.68 84.78 33.36 0.39
Sn (ppm) 3 382.8 998.76 709.78 247.33 0.35
Li2O (%) 3 0.02 0.03 0.03 0.01 0.33
Taboazas
Ta2O5 (ppm) 26 42.43 230.0 124.49 41.94 0.34
Sn (ppm) 26 160.0 2,930.0 704.98 289.58 0.41
Li2O (%) 26 0.01 1.34 0.66 0.42 0.64
14.3.7 Block Modelling
The columnar model prototype used by Micon, in keeping with the drilling, is summarised in
Table 14.24. The range in the Z elevation has been set to ensure that the wireframe solids sit
within the prototype hull and complete filling of the block model is achieved. The model has
been rotated 25° around the Z axis to align the Y axis along the strike of the deposit. The
prototype was developed to cover the extent along strike and dip of all the Southern zones.

Solid Resources Ltd
Alberta-1 Rare Metals Project May 2014 112
Table 14.24: Columnar Model Prototype, Southern Areas
(Rotation Angle 25o around the Z axis)
Axis Origin
(m)
Range
(m)
Block Size
(m)
Number of
Blocks
X 556,867.87 700 25 28
Y 4,697,532.69 6,300 25 252
Z 343.84 750 750 1
14.3.8 Mineral Resource Estimation
Micon utilised the search parameters outlined in Tables 14.15 and 14.26. Micon also applied
rotation to the search ellipsoid to align the search along the strike and average dip of the
defined zone structures.
Interpolation was undertaken by Micon using Inverse Distance Squared (ID2) weighting, due
to the limited sample population. The interpolation was limited to the individual zone
surfaces within a zone, this is so that samples located in adjacent zones did not have an
influence on the estimated block grades of adjacent zone structures.
Table 14.25: Micon Estimation Parameters
Search
Number
Distance
(m)
Minimum Number
of Composites
Octant
Control
1 60 x 60 3 Yes
2 120 x 120 3 Yes
3 240 x 240 1 Yes
4 120 x 120 1 No
5 240 x 240 1 No
6 480 x 480 1 No
Table 14.26: Additional Estimation Parameters
Maximum No. of
Composites
Minimum
No. Octants
Minimum No. of
Comp. per Octant
Maximum No. of
Comp. per Octant
15 3 1 3
The accumulated composited grades were estimated into the blocks and the actual grades of
the block calculated though the application of the following equation.
14.3.8.1 Block Model Validation
The block model was validated by undertaking visual checks of both section and plan views
and by checking generated decluster plots for each of the principal elements. As the sample
populations for each individual zone were small, the whole sample population was used to
generate the decluster plots see Figures 14.30 to 14.32.

Solid Resources Ltd
Alberta-1 Rare Metals Project May 2014 113
Figure 14.30: Tantalum Decluster Plot - All Southern Zones
Figure 14.31: Tin Decluster Plot - All Southern Zones

Solid Resources Ltd
Alberta-1 Rare Metals Project May 2014 114
Figure 14.32: Lithium Decluster Plot - All Southern Zones
The general trend observed is underestimation of grades within the blocks, but no bias is
present within the models. Underestimation has occurred due to the large search ellipsoids
required to mirror the spacing of the sample data available for the estimations (approximately
100 m to 200 m) and the small sample populations within the zone structures.
14.3.9 Mineral Resource Classification
All the material within the block models for the Southern zones is classed as Inferred, due to
the limited amount of data available within each zone.
14.3.10 Density
The same bulk density values of 2.59 t/m3 and 2.75 t/m
3 were assigned to blocks of pegmatite
and waste material respectively, as detailed in Section 14.2.10.
14.3.11 Dilution
A minimum mining width of 2 m was applied to the block model. Dilution was applied to a
total of 431 blocks within the Micon model, with the grades diluted accordingly. Nil grade
was assumed for waste dilution.
14.3.12 Mineral Resource Evaluation
The block models for the Southern zones were cut to the topographic surface (see
Section 14.3.3) to remove blocks located above the topography. Cut-off values were applied
to the resource model, as per the descriptions outlined in Section 14.2.13.
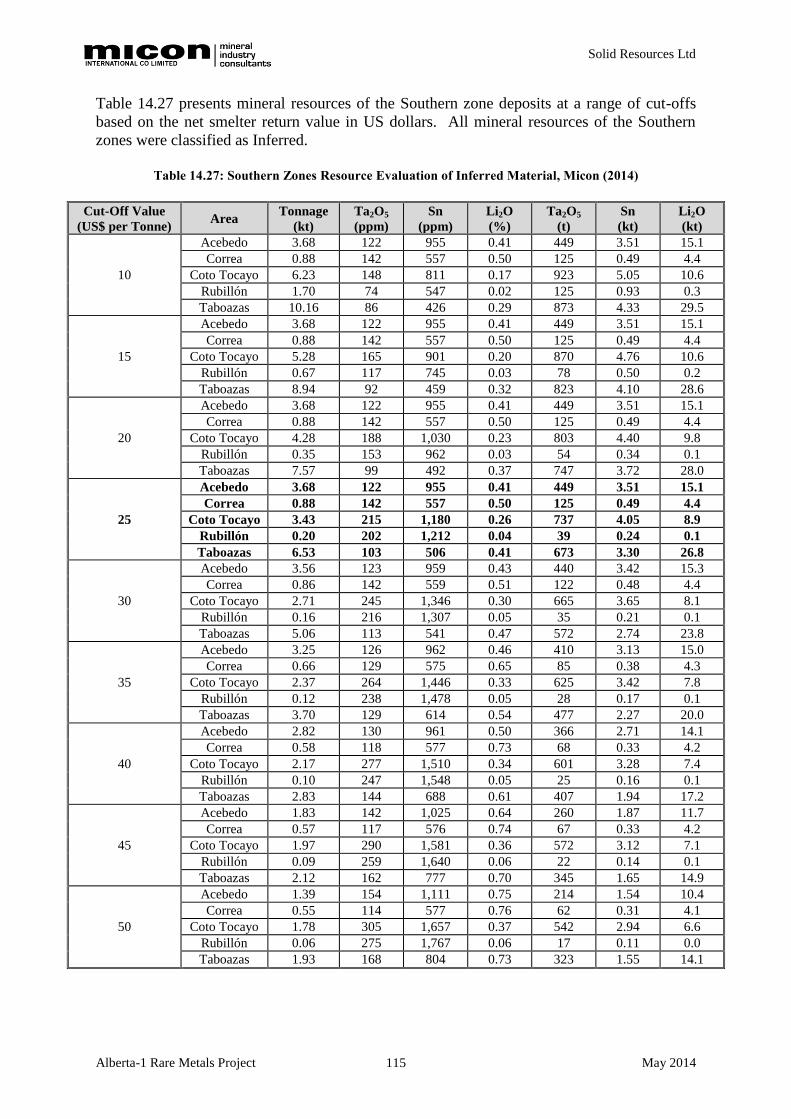
Solid Resources Ltd
Alberta-1 Rare Metals Project May 2014 115
Table 14.27 presents mineral resources of the Southern zone deposits at a range of cut-offs
based on the net smelter return value in US dollars. All mineral resources of the Southern
zones were classified as Inferred.
Table 14.27: Southern Zones Resource Evaluation of Inferred Material, Micon (2014)
Cut-Off Value
(US$ per Tonne) Area
Tonnage
(kt)
Ta2O5
(ppm)
Sn
(ppm)
Li2O
(%)
Ta2O5
(t)
Sn
(kt)
Li2O
(kt)
10
Acebedo 3.68 122 955 0.41 449 3.51 15.1
Correa 0.88 142 557 0.50 125 0.49 4.4
Coto Tocayo 6.23 148 811 0.17 923 5.05 10.6
Rubillón 1.70 74 547 0.02 125 0.93 0.3
Taboazas 10.16 86 426 0.29 873 4.33 29.5
15
Acebedo 3.68 122 955 0.41 449 3.51 15.1
Correa 0.88 142 557 0.50 125 0.49 4.4
Coto Tocayo 5.28 165 901 0.20 870 4.76 10.6
Rubillón 0.67 117 745 0.03 78 0.50 0.2
Taboazas 8.94 92 459 0.32 823 4.10 28.6
20
Acebedo 3.68 122 955 0.41 449 3.51 15.1
Correa 0.88 142 557 0.50 125 0.49 4.4
Coto Tocayo 4.28 188 1,030 0.23 803 4.40 9.8
Rubillón 0.35 153 962 0.03 54 0.34 0.1
Taboazas 7.57 99 492 0.37 747 3.72 28.0
25
Acebedo 3.68 122 955 0.41 449 3.51 15.1
Correa 0.88 142 557 0.50 125 0.49 4.4
Coto Tocayo 3.43 215 1,180 0.26 737 4.05 8.9
Rubillón 0.20 202 1,212 0.04 39 0.24 0.1
Taboazas 6.53 103 506 0.41 673 3.30 26.8
30
Acebedo 3.56 123 959 0.43 440 3.42 15.3
Correa 0.86 142 559 0.51 122 0.48 4.4
Coto Tocayo 2.71 245 1,346 0.30 665 3.65 8.1
Rubillón 0.16 216 1,307 0.05 35 0.21 0.1
Taboazas 5.06 113 541 0.47 572 2.74 23.8
35
Acebedo 3.25 126 962 0.46 410 3.13 15.0
Correa 0.66 129 575 0.65 85 0.38 4.3
Coto Tocayo 2.37 264 1,446 0.33 625 3.42 7.8
Rubillón 0.12 238 1,478 0.05 28 0.17 0.1
Taboazas 3.70 129 614 0.54 477 2.27 20.0
40
Acebedo 2.82 130 961 0.50 366 2.71 14.1
Correa 0.58 118 577 0.73 68 0.33 4.2
Coto Tocayo 2.17 277 1,510 0.34 601 3.28 7.4
Rubillón 0.10 247 1,548 0.05 25 0.16 0.1
Taboazas 2.83 144 688 0.61 407 1.94 17.2
45
Acebedo 1.83 142 1,025 0.64 260 1.87 11.7
Correa 0.57 117 576 0.74 67 0.33 4.2
Coto Tocayo 1.97 290 1,581 0.36 572 3.12 7.1
Rubillón 0.09 259 1,640 0.06 22 0.14 0.1
Taboazas 2.12 162 777 0.70 345 1.65 14.9
50
Acebedo 1.39 154 1,111 0.75 214 1.54 10.4
Correa 0.55 114 577 0.76 62 0.31 4.1
Coto Tocayo 1.78 305 1,657 0.37 542 2.94 6.6
Rubillón 0.06 275 1,767 0.06 17 0.11 0.0
Taboazas 1.93 168 804 0.73 323 1.55 14.1
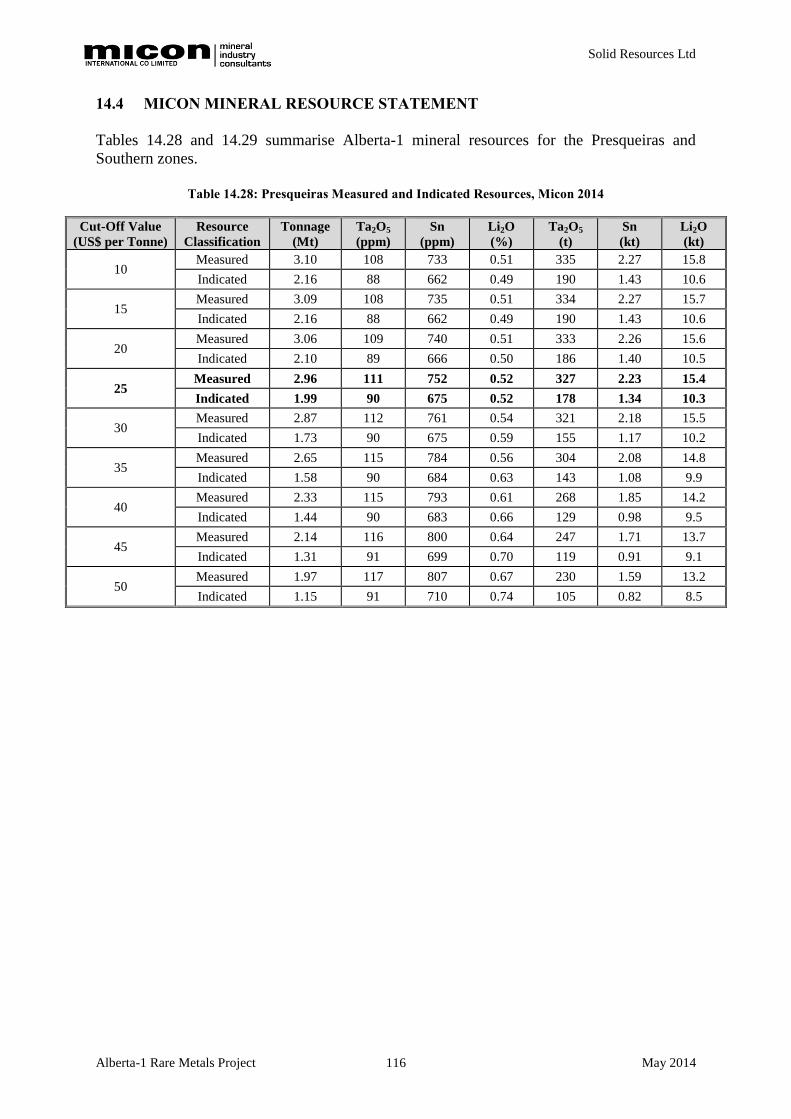
Solid Resources Ltd
Alberta-1 Rare Metals Project May 2014 116
14.4 MICON MINERAL RESOURCE STATEMENT
Tables 14.28 and 14.29 summarise Alberta-1 mineral resources for the Presqueiras and
Southern zones.
Table 14.28: Presqueiras Measured and Indicated Resources, Micon 2014
Cut-Off Value
(US$ per Tonne)
Resource
Classification
Tonnage
(Mt)
Ta2O5
(ppm)
Sn
(ppm)
Li2O
(%)
Ta2O5
(t)
Sn
(kt)
Li2O
(kt)
10 Measured 3.10 108 733 0.51 335 2.27 15.8
Indicated 2.16 88 662 0.49 190 1.43 10.6
15 Measured 3.09 108 735 0.51 334 2.27 15.7
Indicated 2.16 88 662 0.49 190 1.43 10.6
20 Measured 3.06 109 740 0.51 333 2.26 15.6
Indicated 2.10 89 666 0.50 186 1.40 10.5
25 Measured 2.96 111 752 0.52 327 2.23 15.4
Indicated 1.99 90 675 0.52 178 1.34 10.3
30 Measured 2.87 112 761 0.54 321 2.18 15.5
Indicated 1.73 90 675 0.59 155 1.17 10.2
35 Measured 2.65 115 784 0.56 304 2.08 14.8
Indicated 1.58 90 684 0.63 143 1.08 9.9
40 Measured 2.33 115 793 0.61 268 1.85 14.2
Indicated 1.44 90 683 0.66 129 0.98 9.5
45 Measured 2.14 116 800 0.64 247 1.71 13.7
Indicated 1.31 91 699 0.70 119 0.91 9.1
50 Measured 1.97 117 807 0.67 230 1.59 13.2
Indicated 1.15 91 710 0.74 105 0.82 8.5
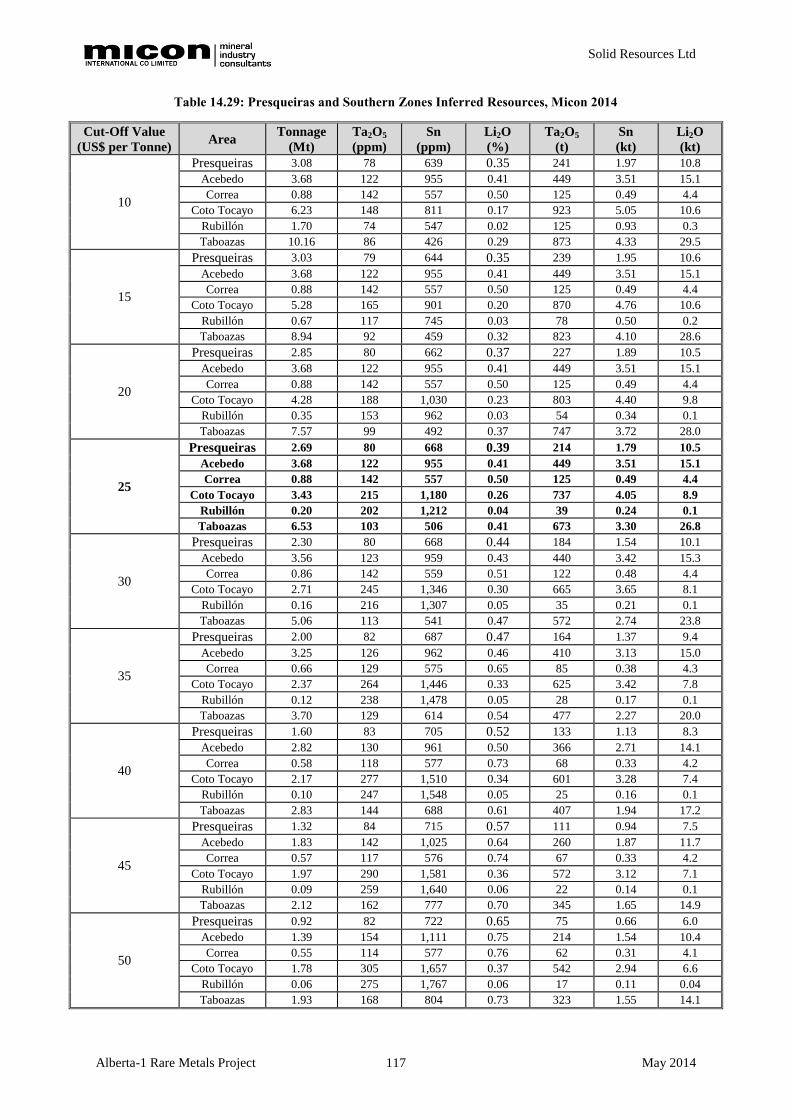
Solid Resources Ltd
Alberta-1 Rare Metals Project May 2014 117
Table 14.29: Presqueiras and Southern Zones Inferred Resources, Micon 2014
Cut-Off Value
(US$ per Tonne) Area
Tonnage
(Mt)
Ta2O5
(ppm)
Sn
(ppm)
Li2O
(%)
Ta2O5
(t)
Sn
(kt)
Li2O
(kt)
10
Presqueiras 3.08 78 639 0.35 241 1.97 10.8
Acebedo 3.68 122 955 0.41 449 3.51 15.1
Correa 0.88 142 557 0.50 125 0.49 4.4
Coto Tocayo 6.23 148 811 0.17 923 5.05 10.6
Rubillón 1.70 74 547 0.02 125 0.93 0.3
Taboazas 10.16 86 426 0.29 873 4.33 29.5
15
Presqueiras 3.03 79 644 0.35 239 1.95 10.6
Acebedo 3.68 122 955 0.41 449 3.51 15.1
Correa 0.88 142 557 0.50 125 0.49 4.4
Coto Tocayo 5.28 165 901 0.20 870 4.76 10.6
Rubillón 0.67 117 745 0.03 78 0.50 0.2
Taboazas 8.94 92 459 0.32 823 4.10 28.6
20
Presqueiras 2.85 80 662 0.37 227 1.89 10.5
Acebedo 3.68 122 955 0.41 449 3.51 15.1
Correa 0.88 142 557 0.50 125 0.49 4.4
Coto Tocayo 4.28 188 1,030 0.23 803 4.40 9.8
Rubillón 0.35 153 962 0.03 54 0.34 0.1
Taboazas 7.57 99 492 0.37 747 3.72 28.0
25
Presqueiras 2.69 80 668 0.39 214 1.79 10.5
Acebedo 3.68 122 955 0.41 449 3.51 15.1
Correa 0.88 142 557 0.50 125 0.49 4.4
Coto Tocayo 3.43 215 1,180 0.26 737 4.05 8.9
Rubillón 0.20 202 1,212 0.04 39 0.24 0.1
Taboazas 6.53 103 506 0.41 673 3.30 26.8
30
Presqueiras 2.30 80 668 0.44 184 1.54 10.1
Acebedo 3.56 123 959 0.43 440 3.42 15.3
Correa 0.86 142 559 0.51 122 0.48 4.4
Coto Tocayo 2.71 245 1,346 0.30 665 3.65 8.1
Rubillón 0.16 216 1,307 0.05 35 0.21 0.1
Taboazas 5.06 113 541 0.47 572 2.74 23.8
35
Presqueiras 2.00 82 687 0.47 164 1.37 9.4
Acebedo 3.25 126 962 0.46 410 3.13 15.0
Correa 0.66 129 575 0.65 85 0.38 4.3
Coto Tocayo 2.37 264 1,446 0.33 625 3.42 7.8
Rubillón 0.12 238 1,478 0.05 28 0.17 0.1
Taboazas 3.70 129 614 0.54 477 2.27 20.0
40
Presqueiras 1.60 83 705 0.52 133 1.13 8.3
Acebedo 2.82 130 961 0.50 366 2.71 14.1
Correa 0.58 118 577 0.73 68 0.33 4.2
Coto Tocayo 2.17 277 1,510 0.34 601 3.28 7.4
Rubillón 0.10 247 1,548 0.05 25 0.16 0.1
Taboazas 2.83 144 688 0.61 407 1.94 17.2
45
Presqueiras 1.32 84 715 0.57 111 0.94 7.5
Acebedo 1.83 142 1,025 0.64 260 1.87 11.7
Correa 0.57 117 576 0.74 67 0.33 4.2
Coto Tocayo 1.97 290 1,581 0.36 572 3.12 7.1
Rubillón 0.09 259 1,640 0.06 22 0.14 0.1
Taboazas 2.12 162 777 0.70 345 1.65 14.9
50
Presqueiras 0.92 82 722 0.65 75 0.66 6.0
Acebedo 1.39 154 1,111 0.75 214 1.54 10.4
Correa 0.55 114 577 0.76 62 0.31 4.1
Coto Tocayo 1.78 305 1,657 0.37 542 2.94 6.6
Rubillón 0.06 275 1,767 0.06 17 0.11 0.04
Taboazas 1.93 168 804 0.73 323 1.55 14.1

Solid Resources Ltd
Alberta-1 Rare Metals Project May 2014 118
A cut-off value of US$25 per tonne was selected to define Alberta-1 mineral resources. No
economic studies of the project have been conducted, and therefore it is possible that a
different cut-off value may be considered upon completion of an appropriate engineering
study. Tables 14.30 summarises the mineral resource estimate for the Alberta-1 project at a
cut-off value of US$25 per tonne.
Table 14.30: Alberta-1 Mineral Resource Estimate as at 15
th May 2014
Area Resource
Classification
Tonnage
(Mt)
Ta2O5
(ppm)
Sn
(ppm)
Li2O
(%)
Ta2O5
(t)
Sn
(kt)
Li2O
(kt)
Presqueiras Measured 2.96 111 752 0.52 327 2.23 15.4
Indicated 1.99 90 675 0.52 178 1.34 10.3
Presqueiras Inferred 2.69 80 668 0.39 214 1.79 10.5
Acebedo Inferred 3.68 122 955 0.41 449 3.51 15.1
Correa Inferred 0.88 142 557 0.50 125 0.49 4.4
Coto Tocayo Inferred 3.43 215 1,180 0.26 737 4.05 8.9
Rubillón Inferred 0.20 202 1,212 0.04 39 0.24 0.1
Taboazas Inferred 6.53 103 506 0.41 673 3.30 26.8
Alberta-1 Measured + Indicated 4.95 102 721 0.52 505 3.57 25.7
Alberta-1 Inferred 17.4 129 769 0.38 2,238 13.4 65.7
Note: Totals may vary due to rounding.
Cut-Off Value US$25 per tonne.
14.5 COMPARISON WITH SOLID 2011 MINERAL RESOURCE ESTIMATE
Micon generated the most recent mineral resource estimate dated May 2014. The mineral
resources have been classified following the guidelines of the Canadian Institute of Mining,
Metallurgy and Petroleum’s “CIM Definition Standards - For Mineral Resources and Mineral
Reserves" is presented in Section 14.0. This estimate incorporates the latest drilling results
from the 2012 drill programme.
The 2011 mineral resource estimate was based on a total of 28 drill holes in the Presqueiras
area and 4 holes in the Taboazas area. Micon’s 2014 estimate utilised 46 holes at
Presqueiras, including 18 holes drilled during 2012, plus three additional drill holes at
Taboazas. A comparison of the two estimates is provided in Table 14.31.

Solid Resources Ltd
Alberta-1 Rare Metals Project May 2014 119
Table 14.31: Alberta-1 Comparison of Mineral Resource Estimates
Area Resource
Classification
Micon 2014 Solid 2011
Tonnage
(Mt)
Ta2O5
(ppm)
Sn
(ppm)
Li2O
(%)
Tonnage
(Mt)
Ta2O5
(ppm)
Sn
(ppm)
Li2O
(%)
Presqueiras Measured 2.96 111 752 0.52 0.2 79.7 584.8 0.55
Indicated 1.99 90 675 0.52 1.4 86.1 584.1 0.43
Presqueiras Inferred 2.69 80 668 0.39 4.0 93.0 593.6 0.35
Acebedo Inferred 3.68 122 955
Correa Inferred 0.88 142 557
Coto Tocayo Inferred 3.43 215 1,180
Rubillón Inferred 0.20 202 1,212
Taboazas Indicated 0.2 150.8 708.2 0.81
Taboazas Inferred 6.53 103 506 0.41 4.0 144.7 646.1 0.77
Alberta-1 Measured +
Indicated 4.95 102 721 0.52 1.8 92.6 598.0 0.49
Alberta-1 Inferred 17.4 129 769 0.38 8.0 118.9 619.9 0.56
Note: Totals may vary due to rounding.
Cut-Off Value US$25 per tonne applied to Micon estimate.
Measured and indicated mineral resources for Alberta-1 have increased from 1.8 Mt to
4.95 Mt whilst Inferred mineral resources have increased 8.0 Mt to 17.4 Mt. The increase is
attributed to a combination of the step-out holes at Presqueiras and Taboazas that extended
the mineralisation, fill-in holes that upgrade mineralisation from the Inferred category to the
Measured and Indicated categories, and the addition of Inferred mineral resources outlined at
Acebedo, Correa, Coto Tocayo and Rubillón.
14.6 CONCLUSIONS AND RECOMMENDATIONS
The Alberta-1 mineral resources are defined by 46 drill holes (4,676.05 m) covering the main
Presqueiras deposit and a further 19 drill holes at the five Southern zones of Correa, Coto
Tocayo, Acebedo, Rubillón and Taboazas. The main Presqueiras deposit is interpreted to
contain two principal zones, plus three subsidiary zones of more limited continuity. The
Southern Area is divided into the Acebedo, Correa, Coto Tocayo, Rubillón and Taboazas
zones comprising a total of 14 zone structures. The Presqueiras and Southern zones remain
open both along strike and down-dip.
Alberta-1 mineral resources are defined by a limited amount of drilling data and Micon
recommends that additional drilling, as well as surface trenching, be conducted to outline
higher grade tantalum and tin mineralisation. Additional drilling and surface trench channel
sampling will serve to both better define the mineralisation, and improve the data density for
more robust grade interpolation.
There are distinct areas within the deposit where a lack of data has limited the interpretation
and extension of mineralised zones and conversely, a lack of sampling within some of the
drill holes have precluded their use to extend zones beyond their current range. Micon
recommends that a review of the drill holes in the Presqueiras database is undertaken to
investigate the possible up-dip extrapolation of Surface 2 and 3 to the north-east where there
is a cluster of un-sampled drill holes.

Solid Resources Ltd
Alberta-1 Rare Metals Project May 2014 120
Clearly, as more data is gathered the geological interpretation will require updating.
Consequently, it will be necessary to revise the mineral resource estimate to ensure that
robust evaluation can be undertaken.
Whilst density data is comprehensive with 1,446 measurements collected between 2003 and
2012 in all of the deposit areas, additional density data should be acquired particularly for
individual zones during future drilling campaigns.
The surface topography data does not quite cover the full extent of the currently interpreted
zones at Presqueiras, and with additional drilling this factor may be further deficient. It
would be prudent to extend the survey area to ensure complete coverage and to validate the
current topographic survey and drill hole collar positions. Future inclined drill holes should
be subject to down-hole surveys as a standard procedure.
Solid Resources Ltd
Alberta-1 Rare Metals Project May 2014 121
15.0 MINERAL RESERVE ESTIMATES
The Alberta-1 Project is at an early stage of development and as a result there are no mineral
reserves in accordance with the requirements of CIM Standards to be reported at this time.

Solid Resources Ltd
Alberta-1 Rare Metals Project May 2014 122
16.0 MINING METHODS
The Alberta-1 Project is at an early stage of development and no mining studies have been
completed at this stage. Alberta-1 mineralisation occurs in close proximity to the topographic
surface and outcrops at many points along the trend of the mineralisation. It is likely that
Alberta-1 would be exploited by a combination of open pit and underground mining methods.

Solid Resources Ltd
Alberta-1 Rare Metals Project May 2014 123
17.0 RECOVERY METHODS
The Alberta-1 Project is at an early stage of development and no comprehensive processing
studies have been undertaken at this time. Bench-scale test work demonstrates that tantalum
and tin mineralisation are amenable to concentration utilising gravity methods. Lithium
mineralisation would likely be concentrated using flotation methods.

Solid Resources Ltd
Alberta-1 Rare Metals Project May 2014 124
18.0 PROJECT INFRASTRUCTURE
The Alberta-1 Project lies in a region with good existing infrastructure; there are good road
links close the permit area in addition to the close proximity of an international sea port. The
project is however still at the exploration stage and the site infrastructure requirements will be
defined in future as part of an engineering study.
Within the area of the Exploitation Licence (Concesión de Explotación), there are sufficient
surface rights for mining operations, potential tailings storage areas, potential waste disposal
areas and potential processing plant sites.

Solid Resources Ltd
Alberta-1 Rare Metals Project May 2014 125
19.0 MARKET STUDIES AND CONTRACTS
The Alberta-1 Project is at an early stage of development and no comprehensive market
studies have been completed at this time. Some preliminary enquiries have been made
regarding the sale of tantalum, tin and lithium products; however, no sales contracts have
been negotiated.

Solid Resources Ltd
Alberta-1 Rare Metals Project May 2014 126
20.0 ENVIRONMENTAL STUDIES, PERMITTING AND SOCIAL OR
COMMUNITY IMPACT
The Alberta-1 Project is at an early stage of development and no comprehensive
environmental studies have been completed at this time. Preliminary environmental impact
assessments have been completed in order to obtain permission to conduct exploration.
Solid Resources Ltd
Alberta-1 Rare Metals Project May 2014 127
21.0 CAPITAL AND OPERATING COSTS
Capital and operating costs have not been estimated for the Alberta-1 Project.

Solid Resources Ltd
Alberta-1 Rare Metals Project May 2014 128
22.0 ECONOMIC ANALYSIS
An economic analysis has not been conducted for the Alberta-1 Project.
Solid Resources Ltd
Alberta I Project May 2014 129
23.0 ADJACENT PROPERTIES
There is a permit located to the south of the Alberta-1 Permit in the Orense Province of
Galicia. This permit is called Alberta-2, it is a similar exploration project within the same
geological environment and it belongs to Pacific Strategic Minerals Spain, S.L.U. No further
information on this project is available at this time.

Solid Resources Ltd
Alberta I Project May 2014 130
24.0 OTHER RELEVANT DATA AND INFORMATION
There is no relevant additional information on the Alberta-1 property and deposits that should
be provided in order to make this Report complete and not misleading.

Solid Resources Ltd
Alberta I Project May 2014 131
25.0 INTERPRETATION AND CONCLUSIONS
Tantalum, tin and lithium mineralisation for has been confirmed by drilling along a 11 km
trend (including all zones). The mineralised zone ranges up to 350 m wide and 15.6 m thick.
The Measured and Indicated mineral resources are estimated to be 4.95 Mt at a grade of
102 ppm Ta2O5, 721 ppm Sn and 0.52% Li2O. Inferred mineral resources are estimated to be
17.4 Mt at a grade of 129 ppm Ta2O5, 769 ppm Sn and 0.38% Li2O.
The knowledge of the geology and mineralogy has been improved with the most recent
drilling programmes and mineralogical studies of the mineralised pegmatite and waste rocks
from the core. Sections have been interpreted to update the 3-D geological model.
The mineralisation occurs along a 12-km trend and is open along strike and down dip.
Considering the surface geology, distribution of old workings and the continuity of the dykes
there appears to be potential for 20 Mt to 30 Mt of additional resources. It should be noted
that the potential quantity and grade is conceptual in nature and that there has been
insufficient exploration to define a mineral resource. It is uncertain whether further
exploration will result in the target zones being delineated as a mineral resource.
SGS test work has concluded that tin and tantalum concentrates can be made relatively easily
using conventional gravity separation methods.
It is evident that tantalum and tin grades are higher in the Southern areas of the project.
These areas should be more accurately assessed with planned drilling in order to improve the
quality of the mineral resources. This will help to define the future development of the
project.
The mineral resources are amenable to exploitation by both open pit and underground
mining. Underground mining methods may be preferred in order to minimise the
environmental impact and reduce the costs of the Restoration Plan. The waste material
produced in the mine or plant is characterised as chemically inert.
Preliminary market enquiries for tantalum, tin and lithium minerals indicate that there is a
ready market for good quality tantalum and tin concentrates. There is also a market for high-
grade lithium concentrates. There is a potential market for a lithium + sodium feldspar
product as a raw material for ceramic and glass manufacture.
According to Spanish Mining Law, the subsurface belongs to the State. A tax must be paid
annually for the land occupied by the Exploitation Licence (depending on the extent of the
land occupied). Exploitation Concessions can be granted for 30 year periods, up to a
maximum of 90 years.
The statistical analysis of the standards for both sample programmes received in 2011 and
2012 show that the laboratory is capable of producing precise assay results and these results
are acceptable. However, it is not possible to discern any real statistical trends in the standard
data due to the small number of assays, and the lack of certified standards means that Micon
is unable to comment on the accuracy of the data.

Solid Resources Ltd
Alberta I Project May 2014 132
26.0 RECOMMENDATIONS
1. Further metallurgical testing combining gravity and magnetic separation, should be
conducted to improve the quality of the cassiterite and tantalite concentrates.
2. The feasibility of obtaining commercial spodumene concentrates should be
investigated. The chemical character of the mineralisation appears favourable,
including a low iron content (0.04% Fe2O3), which could also improve project value.
Flotation test work should be conducted to confirm whether a high-grade of lithium
product can be achieved.
3. The tailings product from the gravity separation of cassiterite and tantalite contains a
mixture of sodium feldspar, quartz and lithium minerals (up to 2% Li2O). If this
material can be processed to yield a product of uniform specification it may be
possible to sell into the ceramic and glass markets. Lithium flotation should be
investigated to produce a commercial lithium concentrate (spodumene) in order to add
value to the project.
4. Potential purchasers of low-grade lithium and sodium feldspar product should be
contacted in order to obtain detailed specifications for their raw material
requirements. Once these specifications are obtained it will be possible to assess
whether these raw materials can be produced from Alberta-1 mineralisation.
5. Micon recommends that Solid undertake the following assay quality control measures
for future drilling campaigns:
a) Increase the number of standard, duplicate and blank samples to 5% of the
total number of samples sent for analysis in the future to meet current
recommended practice standards in the industry.
b) Review the procedures for producing standards for analysis to ensure that each
element concentration matches the description of a “high” and “low” standard.
c) Further analysis of the locally produced standards in order to produce upper
and lower control limits to establish any future problems with batches of
assays analysed.
d) External accredited standards should be introduced to the quality control
programme to monitor the suitability and accuracy of locally prepared
standards.
e) The duplicate analysis revealed good repeatability achieved by the laboratory
and high precision of sample pairs. However, duplicate samples should be
sent for analysis at an external laboratory as a further validation method for
the existing quality control procedures.
In addition to the above a preliminary environmental impact assessment is required for
continued work on the project. The preliminary environmental assessment report should be
accompanied by feedback from public consultation with local inhabitants.
An allocation of funds is also recommended for maintenance of the mineral concessions and
overheads related to administration of the project.
The budget proposed for the completion of the work recommended is presented in
Table 26.1.

Solid Resources Ltd
Alberta I Project May 2014 133
Table 26.1: Alberta-1 Proposed Budget
Item US$
Lithium Market Analysis 10,000
Metallurgical Test Work 30,000
Permitting Environmental Impact Assessment 20,000
Permitting Community Consultation 20,000
Mineral Concession Maintenance and Overheads 65,000
Total 145,000

Solid Resources Ltd
Alberta I Project May 2014 134
27.0 REFERENCES
Abati J. et al., 2010. Magmatism and early-Variscan continental subduction in the northern
Gondwana margin recorded in zircons from the basal units of Galicia, NW Spain. GSA
Bulletin; January/February 2010; v. 122; no. 1/2; pp. 219–235.
Gibbons W., and Moreno T., 2002. The Geology of Spain. Geological Society, London.
Gómez-Barreiro J. et al., 2010. Upper crust reworking during gravitational collapse: the
Bembibre – Pico Sacro detachment system (NW Iberia) Journal of the Geological Society,
London, Vol. 167, 2010, pp. 769–784.
Farias, P., Gallastegui, G., González-Lodeiro, F., Marquínez, J., Martín Parra, L.M., Martínez
Catalán, J.R., Maciá, J.G. de Pablo and Rodríguez Fernández, L.R., 1987. Aportaciones al
conocimiento de la litoestratigrafía and estructura de Galicia Central. Memórias da
Faculdade de Ciências, Universidade do Porto, 1, pp. 411-431.
Martínez Catalán, J.R., Arenas, R., Díaz García, F., Gómez-Barreiro, J., González Cuadra, P.,
Abati, J., Castiñeiras, P., Fernández-Suárez, J., Sánchez Martínez, S., Andonaegui, P.,
Gónzalez Clavijo, E., Díez Montes, A., Rubio Pascual, F.J. and Valle Aguado, B., 2007.
Space and time in the tectonic evolution of the northwestern Iberian Massif. Implications for
the comprehension of the Variscan belt. En: Hatcher, R.D., Jr., Carlson, M.P., McBride, J.H.
and Martínez Catalán, J.R. (Eds.), 4-D framework of continental crust. Geological Society of
America Memoir, 200.
Arenas, R., Martínez Catalán, J.R., Sánchez Martínez, S., Díaz García, F., Abati, J.,
Fernández-Suárez, J., Andonaegui, P. and Gómez-Barreiro, J. 2007. Palaeozoic ophiolites in
the Variscan suture of Galicia (northwest Spain): distribution, characteristics and meaning.
En: Hatcher, R.D., Jr., Carlson, M.P., McBride, J.H. and Martínez Catalán, J.R. (Eds.), 4-D
framework of continental crust. Geol. Soc. America Memoir, 200.
Fernández F. J., Diaz-Garcia F., Marquinez J., 2009. Quartz fabrics pattern along the
Forcarei synform (NW Iberian Massif) and their tentative tectonic model. Trabajos de
Geología, Universidad de Oviedo, 29, pp. 246-253.
Hensen B. J., 1967. Mineralogy and Petrography of Some Tin, Lithium and Beryllium
Bearing Albite-Pegmatites near Doade, Galicia, Spain. Leidse Geologische Mededelingen,
Vol. 39, pp. 249-259.
Cerny P. and Ercit T.S., 2005. The Classification of Granitic Pegmatites Revisited. The
Canadian Mineralogist Vol. 43, pp. 2005-2026.
Martin R.F. and De Vito C., 2005. The Patterns of Enrichment in Felsic Pegmatites
Ultimately Depend On Tectonic Setting. The Canadian Mineralogist, Vol. 43, pp.
2027-2048.
Solid Mines España S.A.U., 2003. Preliminary Exploration Campaign. Rolf Burkhardt.
Internal Company Report.

Solid Resources Ltd
Alberta I Project May 2014 135
Solid Mines España S.A.U., 2005. Drilling Campaign. Rolf Burkhardt. Internal Company
Report.
NI 43-101 Technical Report on the Alberta 1 Property, Rare Element Pegmatites, Galicia,
Spain, prepared for Solid Resources Ltd by Dr José M. Cantó Romera, 8th
December 2011.
Solid Mines España S.A.U., 2011. Mineralogy and petrography of twelve pegmatite samples
by Fernando Gervilla Linares. University of Granada. Internal Company Report.
Solid Mines España S.A.U., 2011. Mineralogy and petrography of five pegmatite samples by
Fernando Gervilla Linares. University of Granada. Internal Company Report.
Solid Mines España S.A.U., 2012. Mineralogical and micro-analytical study of samples N-4
and N-6 by ESEM-EDS and EPMA by Fernando Gervilla Linares. University of Granada.
Internal Company Report.
Fuertes Fuente M., 1996. Las pegmatitas del área de Lalin-Forcarei (Galicia) y las
mineralizaciones de elementos escasos asociadas. Tesis Doctoral, Universidad de Oviedo.
Solid Mines España S.A.U., 2011. Presqueiras_Resources Minarco, 13th
September, 2011.
Internal Company Report.
Solid Mines España S.A.U., 2011. Taboazas_Resources Minarco, 13th
September, 2011.
Internal Company Report.
SGS_Mineralogical-Solid Resources Report MI5039, 7th
January, 2012. Internal Company
Report.
SGS_Recovery-10866-285 Solid Mines España Letter Report, 20th
May, 2012. Internal
Company Report.
Adam Wheeler and Bob Dowdell, May 2013. Alberta-1 Scoping Study Report. Internal
Company Report.
Solid Mines Gravity Separation Report. Gordon Parkin, 12th
September, 2013. Internal
Company Report.
AGQ, July 11, 2013. Estudio Para La Caracterización de los Residuos Procedentes de
Ensayos Pilotos de Demostración de Concentración Gravimétrica Según
R.D.975/2009YR.D.777/2012. Internal Company Report.
Solid Mines España S.A.U., 2011. TOPOFOR_Informe_Presqueiras, April 2011. Internal
Company Report.
Solid Mines España S.A.U., 2011. TOPOFOR_Informe segunda fase Solid Mines Doade
Presqueiras completo, July 2011. Internal Company Report.
Solid Mines España S.A.U., 2012. TOPOFOR_Informe Presqueiras Ampliación, August
2012. Internal Company Report.

Solid Resources Ltd
Alberta I Project May 2014 136
Solid Mines España S.A.U., 2014. M. Fuertes Fuente, Mineralogical Study of Concentrates
from Plant of the Presqueiras Pegmatitic Dykes, Final Report, January 2014. Internal
Company Report.
Solid Mines España S.A.U., Report of Drilling Programme, 2003. Report of Drilling
Programme, 2005.
SGS Mineralogical, Solid Resources, Draft Report, MI5039-OCT11, 2011.
SGS_Recovery-10866-285 Solid Mines España Letter Report, 2012.
F.Gervilla_ESEM&EPMA_January2012.
F.Gervilla_ESEM_Diciembre2011.
F.Gervilla_Petrography_09_11.
.

Solid Resources Ltd
Alberta I Project May 2014 137
28.0 DATE AND SIGNATURE PAGE
Signed on behalf of Micon International Co Limited:
----------------------------------------------------------
Stanley C. Bartlett, M.Sc., PGeo. (#19698)
Senior Economic Geologist, Managing Director,
Micon International Co Limited
Effective Date: 15th
May 2014
Signed Date 23rd
May 2014

Solid Resources Ltd
Alberta I Project May 2014 138
29.0 CERTIFICATE
CERTIFICATE OF AUTHOR STANLEY CURRIE BARTLETT
As the author of “Independent Technical Report of the Alberta-1, Rare Metals Project, Galicia,
Spain”, effective date of 15th May 2014, signed 23
rd May 2014, I, Stanley Currie Bartlett, hereby
certify that:
1) I am employed by, and conducted this assignment for, Micon International Co Limited, Suite
10, Keswick Hall, Norwich, United Kingdom. tel. 0044(1603) 501 501, fax 0044(1603) 507
007 e-mail [email protected];
2) I hold the following academic qualifications:
B.Sc. Geological Sciences University of British Columbia, Vancouver, Canada, 1979;
M.Sc. (Mining Geology) Camborne School of Mines, Redruth, England, 1987;
3) I am a registered Professional Geoscientist with the Association of Professional Engineers
and Geoscientists of the Province of British Columbia (membership # 19698); In addition I
am a member in good standing of the Society for Mining, Metallurgy and Exploration;
4) I have worked as a geologist in the minerals industry for 35 years;
5) I do, by reason of education, experience and professional qualifications fulfil the requirements
of an independent Qualified Person as defined by NI 43-101 and CIM Standards. My work
experience includes five years as an exploration geologist developing tungsten, gold, silver
and base metal deposits, more than 14 years as a mining geologist in both open pit and
underground mines and 16 years as a consulting geologist working in precious, ferrous and
base metals and industrial minerals. I have more than 28 years of experience of mineral
resource estimation;
6) I visited the property that is the subject of this Technical Report from 10th to 11
th April, 2014;
7) I am responsible for the preparation or supervision of preparation of all sections of this
Report;
8) I am independent of Solid Resource Limited, its directors, senior management, and its other
advisers, as defined in Section 1.5 of NI 43-101, and I have had no prior involvement in the
Alberta-1, Rare Metals Project;
9) I have read Canadian National Instrument 43-101 and the Technical Report and confirm that
this Report has been prepared in compliance with the instrument; and,
10) As of the date of this certificate, to the best of my knowledge, information and belief, the
“Independent Technical Report of the Alberta-1, Rare Metals Project, Galicia, Spain”,
effective date of 15th May 2014 and signed 23
rd May 2014, contains all scientific and
technical information that is required to be disclosed to make this Report not misleading.
---------------------------------------------------------- Stanley C. Bartlett, M.Sc., PGeo. (#19698)
Senior Economic Geologist, Managing Director,
Micon International Co Limited
Effective Date: 15th
May 2014
Signed Date 23rd
May 2014


![Rare Metals (Ta-Nb-Sn) Mineralization Potential of Pegmatites of ... · rocks of metamorphic and igneous origin where they intrude the older litholo-gies discordantly [8][7] [9] [10]](https://img.dokumen.tips/doc/110x75/6071df8ab2fef320052c31ab/rare-metals-ta-nb-sn-mineralization-potential-of-pegmatites-of-rocks-of-metamorphic.jpg)