Embed Size (px)
Citation preview

National Dwelling Cost Study
Prepared for the National Housing Supply Council
May 2011

URBIS STAFF RESPONSIBLE FOR THIS REPORT WERE:
Director Malcolm AikmanAssociate Director Deanne FrankelSenior Consultant Sam WoodJob Code SSP02511Report Number V2xdisclaimerx
© Urbis Pty LtdABN 50 105 256 228
All Rights Reserved. No material may be reproduced without prior permission.While we have tried to ensure the accuracy of the information in this publication, the Publisher accepts no responsibility or liability for any errors, omissions orresultant consequences including any loss or damage arising from reliance in information in this publication.
URBISAustralia Asia Middle Easturbis.com.au

TABLE OF CONTENTS
Executive Summary................................................................................................................................ 1Introduction and Study Purpose........................................................................................................1Approach.......................................................................................................................................... 1Results and Analysis......................................................................................................................... 2Infill Dwelling Costs........................................................................................................................... 2Greenfield Dwelling Costs................................................................................................................. 3Policy Responses............................................................................................................................. 4
1 Introduction..................................................................................................................................... 11.1 Background............................................................................................................................ 11.2 Study Purpose....................................................................................................................... 31.3 Report Outline........................................................................................................................ 31.4 Report Limitations.................................................................................................................. 3
2 Study Methodology......................................................................................................................... 42.1 Key Assumptions................................................................................................................... 6
3 Results and Analysis...................................................................................................................... 93.1 Infill Dwelling Costs................................................................................................................93.1.1 Land..................................................................................................................................... 143.1.2 Construction......................................................................................................................... 153.1.3 Professional Fees................................................................................................................163.1.4 Government Taxes and Charges.........................................................................................173.1.5 Development Costs and Interest..........................................................................................193.1.6 Development Profit...............................................................................................................203.2 Greenfield Dwelling Costs....................................................................................................213.2.1 Land..................................................................................................................................... 263.2.2 Construction......................................................................................................................... 273.2.3 Professional Fees................................................................................................................283.2.4 Government Taxes and Charges.........................................................................................293.2.5 Development Costs and Interest..........................................................................................313.2.6 Development Profit...............................................................................................................323.3 Infill vs Greenfield................................................................................................................. 333.4 Review of Findings from Previous Study..............................................................................363.4.1 Infill Dwelling Costs..............................................................................................................363.4.2 Greenfield Dwelling Cost Summary.....................................................................................363.4.3 Infill vs Greenfield and Change over Time...........................................................................363.4.4 The Focus for Policy Responses..........................................................................................37
4 Conclusion.................................................................................................................................... 384.1 Infill Dwelling Cost Summary...............................................................................................384.2 Greenfield Dwelling Cost Summary.....................................................................................384.3 The Focus for Policy Responses..........................................................................................39
Appendix A Estate Master Output for Infill Developments......................................................41
Appendix B Estate Master Output for Greenfield Developments............................................47
Appendix C Construction and Professional Costs...................................................................53
Appendix D References..............................................................................................................55
URBISdocument.docx

URBISdocument.docx

Executive Summary
INTRODUCTION AND STUDY PURPOSEThe Australian Government Department of Families, Housing, Community Services and Indigenous Affairs (FaHCSIA) commissioned the inaugural National Dwelling Costs Study in December 2009 for delivery in early 2010 (herein referred to as the 2010 study). This work provided input into the housing supply monitoring role of the National Housing Supply Council.
The Australian Government is committed to monitoring the issue of dwelling costs as they affect housing affordability and has commissioned an update (herein referred to as the 2011 study) of the inaugural 2010 study. As a result of reorganisation of Australian Government portfolios following the federal election in 2010, the secretariat function supporting the work of the National Housing Supply Council has become part of the Department of Sustainability, Environment, Water, Population, and Communities (the Department) which becomes the commissioning department for this study update. Through this study the Department is seeking to identify policies and programs that can reduce dwelling costs and improve housing affordability across Australia.
This report focuses on collating the individual costs involved in delivering greenfield and infill housing product with the view to identifying the factors influencing rising dwelling prices. From this the study is able to provide policy recommendations on how the Australian Government can more effectively address the widespread decline in housing affordability for Australian residents.
APPROACHThe 2011 National Dwelling Costs Study is a direct update of the 2010 study. The 2010 study presented data on dwelling costs for 2009, while the 2011 report presents data for 2010. This study methodology required the segmentation of dwelling development costs into relevant categories that can be compared across locations and over time. This assessment allows comparison to the previous years study and other similar studies.
The key components of this approach are:
It comprises Australia’s five largest cities – Sydney, Melbourne, Brisbane, Perth, Adelaide
It includes two forms of residential development in each city – greenfield detached house; infill apartment
Cost components are consistent across locations so that cost differences between cities can be identified and understood
It is structured so that it is capable of being updated every one to two years
It should be noted that this approach is a static approach that only allows for limited cost changes during the development timeframe. As property development is a time based activity that involves costs changing over time, typical feasibility analyses allow for cost escalation. While some allowance for this has been incorporated into the results of this study other components of escalation have not, most notably sale prices in comparison to construction costs. Both of these factors are estimated in today’s terms thus excluding future sale price escalation during the development process. While this tends to underestimate development profit this approach does provide the most appropriate estimates of all other components of costs. This is consistent with the 2010 study approach.
From the 2010 study and work undertaken by Urbis since then, there are some minor modifications to the previous approach that enhance the output of the updated study. Improvements to the 2010 approach include the use of Estate Master software to better automate the dwelling cost template. This provides a consistent spreadsheet platform across all dwelling types and locations and is designed to accommodate different tax rates for each State.
Through the use of Estate Master there has been improved accuracy in calculating interest. Through enabling payback periods to be calculated monthly the methodology has effectively reduced the amount of interest payable, more closely reflecting what happens in practice.
URBISdocument.docx EXECUTIVE SUMMARY 1

A further improvement is the inclusion of developer input to the underlying land cost and sale price of dwellings. This has been used as a check against publicly sourced information and provides the benefit of aligning specific land costs with dwelling types and locations.
A key component of this assessment is the construction cost component. To optimise accuracy and consistency across the five cities Quantity Surveyors Rider Levett Bucknall has been commissioned for this component of the study.
Caution should be exercised in drawing conclusions from comparisons between the 2009 and 2010 data for some components of dwelling costs data owing to the changes in methodology. The cost component categories affected by the changes in methodology are interest costs and professional fees.
RESULTS AND ANALYSISThe analysis of infill and greenfield development has enabled a comparison of cost components between the five subject cities. The results of the analysis are summarised as follows.
Infill Dwelling CostsThe commercial viability of infill dwelling development has improved across Sydney, Brisbane and Perth. In the Melbourne market the viability of infill development declined marginally but is still performing relatively well. Adelaide saw a further decline in the viability of medium and high rise infill dwelling development.
Melbourne continues to be the best performing infill dwelling market in Australia both in terms of volume and profitability. This performance is underpinned by low land costs and competitive government taxes and charges, principally low infrastructure charges for this type of development. This is being offset by rising construction costs and sale prices which are starting to squeeze profit margins. It will be interesting to see if Melbourne can retain the market balance it has been able to achieve between supply, demand, and costing over the coming 12 months.
2 EXECUTIVE SUMMARYURBIS
document.docx
Infill - summary of cities, 2010National Dwelling Cost Study Executive summary
Source : Urbis
14%6% 8% 12% 10%
16%
15% 15%14% 16%
4%
4% 4% 3% 6%
45%52% 50% 49%
60%
10%9% 10% 11%
11%9% 14% 14% 11%
-3%
-10%
0%
10%
20%
30%
40%
50%
60%
70%
80%
90%
100%
2010 2010 2010 2010 2010
Sydney Melbourne Brisbane Perth Adelaide
Perc
ent o
f Dw
ellin
g C
ost
Land Govt taxes & charges Professional feesConstruction Development cost & interest Developers profit

Sydney, Brisbane and Perth achieved a notable increase in the costings of their infill dwelling products. In Sydney this has been driven by an increase in sale price and a stable construction cost. Perth has benefited from the same situation though it has also benefited from a reduction in construction costs. Brisbane has benefited from an increase in sale prices and a reduction in land prices. This reflects the potential oversupply of sites (land price) and supply constraints from the detached housing market (benefiting price).
Construction remains the largest cost component of infill dwellings (45%-60%) and a key area to focus reform to improve housing affordability. While most of the other factors appear to respond to market pressures or move with sale price movements, construction costs appear to be less influenced by dwelling market changes. Indirectly though the reduction in dwelling construction levels has placed price pressure on construction inputs including materials, labour costs and sub-contractor rates. This has been more noticeable in Brisbane and Perth where construction costs have declined at relatively low rates of 3%. Construction costs for medium and high rise infill dwellings are in the order of 50% higher than for greenfield dwellings that are of a larger size (2 bed vs 3 bed). This is a barrier to the provision of affordable inner city dwellings. There are a number of factors that lead to greater construction costs for infill dwellings over greenfield dwellings. These include higher environmental and safety requirements; additional components such as lifts, sprinklers, basements, and fire stairs; and additional labour costs associated with unionisation.
The next most significant component is government taxes and charges (14-16%). GST, stamp duty and infrastructure charges are the principal components here. Little progress appears to have been achieved in this regard across most jurisdictions in regard to addressing the big issues of tax reform. GST and stamp duty remain a double cost blow to new dwellings in an industry which has affordability issues.
Price pressure on land appears to have reduced somewhat with Brisbane experiencing a fall and most of the other cities remaining relatively stable. Perth is the exception here and this may be the result of a shortage of appropriate sites and the improving market.
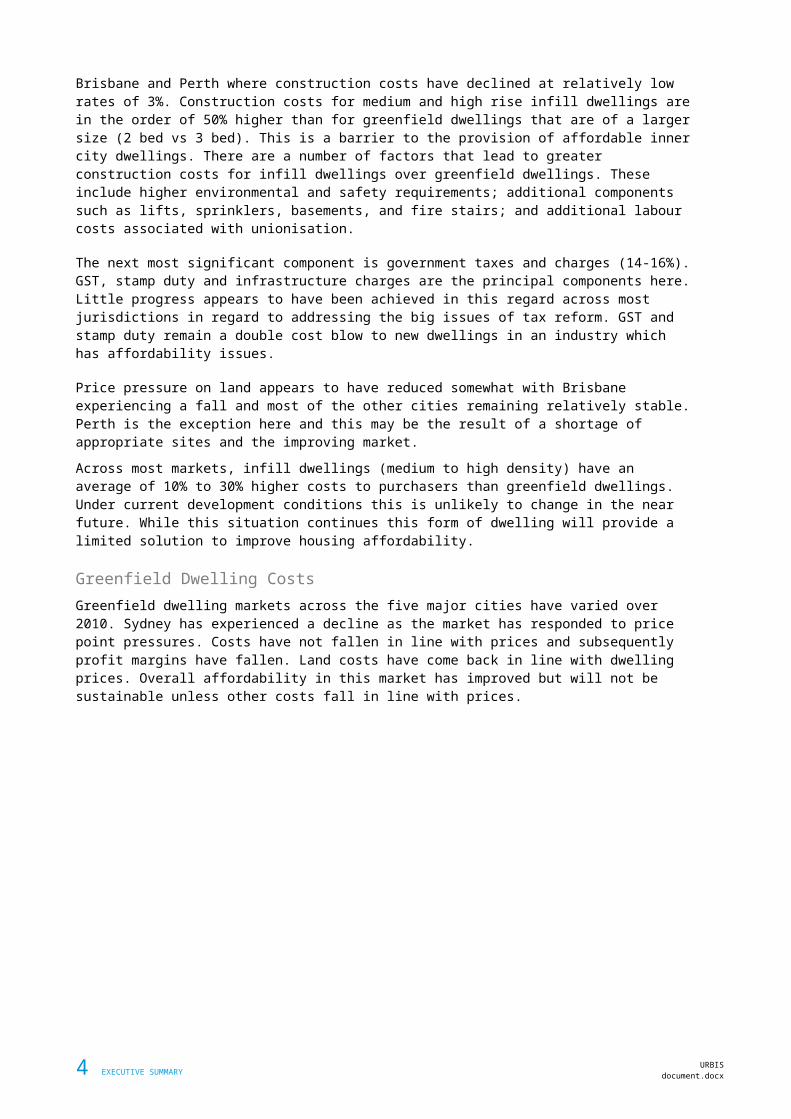
Across most markets, infill dwellings (medium to high density) have an average of 10% to 30% higher costs to purchasers than greenfield dwellings. Under current development conditions this is unlikely to change in the near future. While this situation continues this form of dwelling will provide a limited solution to improve housing affordability.
Greenfield Dwelling CostsGreenfield dwelling markets across the five major cities have varied over 2010. Sydney has experienced a decline as the market has responded to price point pressures. Costs have not fallen in line with prices and subsequently profit margins have fallen. Land costs have come back in line with dwelling prices. Overall affordability in this market has improved but will not be sustainable unless other costs fall in line with prices.
URBISdocument.docx EXECUTIVE SUMMARY 3
The Melbourne greenfield market has remained relatively strong over the year showing an increase in pricing and associated increases in costs. Developer margins have been squeezed slightly as costs have risen more than prices and this may reflect a downturn in the market going forward. Melbourne’s affordability advantage through its depth of product priced under $450,000 allows it to maintain high levels of greenfield dwelling development.
The Brisbane greenfield dwelling market has responded to consumer price pressures and reduced greenfield dwelling prices and costs. This has been principally achieved through lower land costs, stable construction costs, and the reduced costs associated with lower sale prices including GST and stamp duty.
The greenfield dwelling market in Perth has turned around in 2010 with increased sale prices, reduced land costs, and reduced construction costs. This has led to a recovery in profit to credible levels and strong dwelling development activity at long term averages.
Construction costs represent the largest component of total costs to purchasers (36% to 53%) though at levels lower than for infill dwellings. Most markets have experienced rises with Perth the only market reflecting less competitive conditions with a $24,000 fall.
Government taxes and charges remain a significant component (17% to 22%) of greenfield dwelling costs through major contributions from GST, stamp duty, and infrastructure charges in Sydney and Brisbane. As is the case with infill dwellings there remains pressure for reform in these areas.
POLICY RESPONSESThe findings from the 2011 National Dwelling Cost Study of greenfield and infill dwellings across Australia’s five major cities along with insights from the previous study, highlight four areas of focus for policy responses to improve housing affordability across Australia:
4 EXECUTIVE SUMMARYURBIS
document.docx
Greenfield - summary of cities, 2010National Dwelling Cost Study Executive summary
Source : Urbis
23%12% 7% 9% 13%
22%
17%18% 18%
17%
3%
3%3% 3% 3%
36%
47% 53% 47%51%
14%11% 10%
9%12%
3%9% 9% 13%
5%
-10%
0%
10%
20%
30%
40%
50%
60%
70%
80%
90%
100%
2010 2010 2010 2010 2010
Sydney Melbourne Brisbane Perth Adelaide
Perc
ent
Land Govt taxes & charges Professional fees
Construction Development cost & interest Developers profit

Construction Costs – These remain the single largest component of both infill and greenfield dwelling costs and subsequently reductions in this component can have significant benefits for improved affordability. This year’s study has shown that the construction sector can respond to changes in market demand and supply situations. The Queensland Government has attempted to address this issue through their Building Revival Forum. This forum had a strong focus on demand however policy responses were also identified with relation to costs.
An independent study into the value chain of both infill and greenfield dwelling construction would provide an opportunity to breakdown the elements of this cost component (as this study has done) which would shed light on what the major cost factors in construction are and whether measures can be taken to reduce these costs.
A further initiative to address this cost component is through alternative dwelling materials and construction techniques. Pilot testing of fast track dwelling development for both forms of dwellings in this study have been occurring in different parts of Australia over the past few years. Government incentives could be provided for the mass production of these forms of innovative, more affordable dwellings.
Tax Reform – The Australian Government presented the findings of the Henry Tax Review in 2010. To date the follow up to this review has been limited. New dwelling taxation reform addressing GST and stamp duty may improve housing affordability. Consideration needs to be given to how to restructure these components to improve this situation. We are conscious that as Australia emerges from the global financial crisis in a tight fiscal environment, policies to reduce taxation are unlikely to be appealing.
Initiatives to address increasing infrastructure charges are in the process of being introduced into Queensland following the recommendations from the State Government’s Infrastructure Charges Task Force. There is debate over the affordability of the recommended charges however they have provided short term certainty for the development industry. Queensland now appears to be ahead of the other states in this regard however this has not been a significant issue in Western Australia or South Australia. It is emerging as an issue in Victoria with respect to areas newly included in the urban growth boundary (Growth areas infrastructure charges). These are likely to be comparable to Brisbane rates in the near future for the higher rated areas.
Sydney is moving back into a high infrastructure charges regime after a couple of years of respite. This is a symptom of a government with significant debt and limited revenue. Unfortunately this is likely to constrain greenfield development going forward. Sydney needs to find a better solution to this approach as it has been down this path before with substantial negative impacts for the development and housing industry.
Land supply – Land supply is an area where State Governments have taken the most action. In Queensland four major greenfield development areas have been placed under the planning control of the Urban Land Development Authority for fast tracking of development. Sydney’s northern and southern growth corridors are beginning to gain momentum though pricing is still an issue. Perth has placed greater emphasis on understanding its land supply allowing it to focus policy in the right areas. Reductions and the slowing in growth in land values appear to reflect the impact that these policies and initiatives are having. There are lessons to be learned across the different states in terms of policies and initiatives that have improved land supply. Specifically these include:
Accurate monitoring of land supply – Victoria (Urban Development Program)
Single government approval authority for planning – Queensland (ULDA)
Clear planning guidelines – Western Australia (greater code assessment)
URBISdocument.docx EXECUTIVE SUMMARY 5

Product innovations – It is clear that the best performing dwelling market has been Melbourne and a key reason for this has been its ability to provide high quantities of dwellings that meet the affordability requirements of its markets. An important driver of this has been the reduction in lot sizes. This has led to lower prices and higher dwelling yields which benefit both pricing and developer margins. In the future this may also be associated with reductions in dwelling sizes which will provide further costs savings thereby improving housing affordability. This is a key learning for all other markets especially where minimum lot sizes prevent the delivery of lots less than 600m2 or more commonly less than 400m2. Government guidelines can assist with this however it is important that the government is not too prescriptive in relation to this as the market needs flexibility to meet market requirements and work with development constraints.
A small section of the construction industry is responding to high construction costs through concepts such as modular housing. We recommend greater government incentives including tax dispensation for these types of products.
6 EXECUTIVE SUMMARYURBIS
document.docx

RESULTS AND ANALYSIS
1 Introduction
The Australian Government Department of Families, Housing, Community Services and Indigenous Affairs (FaHCSIA) commissioned the inaugural National Dwelling Costs Study in December 2009 for delivery in early 2010 (herein referred to as the 2010 study). This work provided input into the housing supply monitoring role of the National Housing Supply Council.
The Australian Government is committed to monitoring the issue of dwelling costs as they affect housing affordability and has commissioned an update (herein referred to as the 2011 study) of the inaugural 2010 study. As a result of reorganisation of Australian Government portfolios following the federal election in 2010, the secretariat function supporting the work of the National Housing Supply Council has become part of the Department of Sustainability, Environment, Water, Population, and Communities (the Department) which becomes the commissioning department for this study update. Through this study the Department is seeking to identify policies and programs that can reduce dwelling costs and improve housing affordability across Australia.
This study, the 2011 study, has refined the previous methodology to enhance the comparability of results across locations. Importantly it collates costing information on greenfield and infill dwelling developments across five capital cities (Sydney, Brisbane, Melbourne, Adelaide and Perth) to gain insights into what factors are impacting rising dwelling prices. From this the study is able to provide policy recommendations on how the Australian Government can more effectively address the widespread decline in housing affordability for Australian residents.
1.1 BACKGROUNDThis study has a key focus on identifying initiatives to improve housing affordability. The 2010 study noted how housing affordability had emerged as a key issue in the early 2000s and had worsened as the decade progressed. Government policy responses to this situation are yet to achieve noticeable impacts on this problem.
During 2010 Australia’s housing affordability situation has worsened as indicated by a number of publicly advertised housing affordability measures. The Real Estate Institute of Australia (REIA), through its Deposit Power Housing Affordability Report, indicated that 2010 saw the largest annual decrease in housing affordability over the past decade noting that the proportion of income required to meet home loan repayments had increased from 29.0% to 34.8% over the year. At the end of 2010 the Housing Industry Association – Commonwealth Bank housing affordability index was 10% lower (reflecting declining affordability) than at the end of 2009 (Housing Industry Association, 2011). In addition, a survey of 976 home buyer candidates by Loan Market indicated that 65% of respondents rated housing affordability as the main market issue facing first home buyers (Loanmarket.com.au).
The worsening state of housing affordability in Australia over 2010 has been driven by rises in interest rates and increases in housing prices in a number of Australia’s major cities. During 2010 the Reserve Bank raised interest rates four times – March, April, May, and November. Increased interest payments for those with variable mortgage rates has reduced their disposable income and subsequently the affordability of home ownership for them.
An analysis of Australia’s housing market for the 2010 year by RP Data indicates that Sydney, Melbourne and Adelaide experienced real increases in median house prices while house prices in Brisbane and Perth actually declined. Sydney houses ($605,000) remained the most expensive although Melbourne houses ($557,750) are closing the gap.
document.docx
RESULTS AND ANALYSIS1

Though experiencing a decline in median prices, Perth houses remained the third most expensive of the major cities, comfortably ahead of Brisbane ($459,000), and Adelaide ($405,000).
The median house price data while providing an overall picture for each city does not necessarily have a direct relationship with situations in particular sub markets of interest to this study, such as the greenfield dwelling market. An analysis of the volume of houses available for sale broadly in the greenfield areas of the five cities indicates varying depths of the affordable dwelling markets in these cities.
The above table records advertised prices for detached dwellings (houses) in outer and fringe suburbs of Australia’s five major cities as recorded by a major real estate web site. The table highlights the high proportion of houses that Adelaide (68%) and Melbourne (61%) have in the affordable price range of less than $450,000. Generally a lower proportion of houses in the more affordable price range is indicative of a higher median house price and vice versa. That is, Sydney has the highest median house price. Sydney (40%) and Perth (40%) have the lowest proportion of dwellings under $450,000 . Brisbane (South East Queensland) has a moderately lower median house price than Perth and a moderately higher share of dwellings (47%) under $450,000. Adelaide (68%) has the lowest median house price and the highest proportion of dwellings below $450,000.
The major exception to this position is the Melbourne market. Melbourne has a high median house price ($557,750) but a large proportion (61%) of its outer and fringe housing market priced under $450,000. Analysis undertaken for the Queensland Building Revival Forum in April this year (Lend Lease, April 2011, Building Revival Forum Presentation) indicates that a key reason for this is the move by the Melbourne market to smaller lot sizes. While this trend has been occurring across Australia as a measure to improve housing affordability, the move has been greater in Melbourne than in other locations. Data collated by Lend Lease indicates that in the Melbourne greenfield market 46% of housing lots are 450m2 or less while in south east Queensland only 25% of lots are in this size range.
RESULTS AND ANALYSIS
Capital growth - housesYear on year capital growth to December 2010 Table 1.1
Sydney Melbourne Brisbane Adelaide Perth
Year on year (%) 6.4% 8.5% -1.1% 3.9% -1.5%
Median price1 ($) $605,000 $557,750 $459,000 $405,000 $487,000
1. Median price is based on settled sales over quarter Source : RP Data-Rismark hedonic Home Value index - 31.01.11; Urbis
Detached housing market by price pointCapital city outer suburban areas TABLE 1.2
House price City <$450,000 <$400,000 <$350,000
Sydney 40% 31% 19%
Melbourne 61% 48% 28%
Brisbane (SEQ) 47% 36% 23%
Perth 40% 30% 17%
Adelaide 68% 57% 42%
Source : www.domain.com.au; Urbis
2

RESULTS AND ANALYSIS
This is an important finding which is not directly identified in this study as it focuses on the cost component of comparable sized dwellings.
1.2 STUDY PURPOSEThis study updates the 2010 National Dwelling Cost Study undertaken for the Australian Government. Dwelling cost, as a major component of dwelling price, is a key to understanding housing affordability. To better understand the drivers of housing costs and thereby inform the most appropriate policy responses the Department has commissioned this independent assessment of residential dwelling costs across Australia’s major cities. Through an analysis of cost components of new dwelling development, the Department is seeking to identify policy initiatives and programs that can reduce dwelling costs across the country.
The study is intended to investigate housing affordability nationally and subsequently has reviewed housing costs in Australia’s five major cities – Sydney, Melbourne, Brisbane, Perth, and Adelaide. The inclusion of regional locations is under consideration as part of a future extension to this study.
The study is conscious of potential differences in dwelling costs for different types of dwellings. Due to this it has examined dwelling costs for detached dwellings (greenfield) and medium rise apartments (infill).
1.3 REPORT OUTLINEThe structure of this report includes an introduction to the study, an outline of the methodology, the results and analysis, and conclusions:
Section One: Introduction – Introduction, background, study purpose, report outline, report limitations
Section Two: Methodology – Study methodology, key assumptions
Section Three: Results and Analysis Infill dwelling costs, greenfield dwelling costs, infill vs greenfield, review of findings from previous study
Section Four: Conclusion Infill dwelling costs summary, greenfield dwelling costs summary, summary of results, focus for policy responses.
1.4 REPORT LIMITATIONSThis report has been prepared for the Australian Government Department of Sustainability, Environment, Water, Population, and Communities (the Department) and is not suitable for use other than by the party to whom it is addressed. It represents for the Department the various estimates of Urbis Pty Ltd and its subcontractors but no assurance is given by Urbis Pty Ltd that the estimates will be achieved.
This report contains a number of opinions and assumptions however, Urbis Pty Ltd will not accept liability or responsibility to any third party relying on information provided in this report.
document.docx
RESULTS AND ANALYSIS3

2 Study Methodology
The 2011 National Dwelling Costs Study is a direct update of the 2010 study. The 2011 study methodology required the segmentation of dwelling development costs into relevant categories that can be compared across locations and over time. This assessment allows comparison to the previous years study and other similar studies.
The key components of this approach are:
It comprises Australia’s five largest cities – Sydney, Melbourne, Brisbane, Perth, Adelaide
It includes two forms of residential development in each city – greenfield detached house; infill apartment
Cost components are consistent across locations so that cost differences between cities can be identified and understood
It is structured so that it is capable of being updated every one to two years
From the previous 2010 study and work undertaken by Urbis since then, there are some minor modifications to the previous approach that enhance the output of the updated study. Improvements to the 2010 approach include the use of Estate Master software to better automate the dwelling cost template. This provides a consistent spreadsheet platform across all dwelling types and locations and is designed to accommodate different tax rates for each State.
A further improvement is the inclusion of developer input to the underlying land cost and sale price of dwellings. This has been used as a check against publicly sourced information and provides the benefit of aligning specific land costs with dwelling types and locations.
A key component of this assessment is the construction cost component. To optimise accuracy and consistency across the five cities Quantity Surveyors Rider Levett Bucknall has been commissioned for this component of the study.
The specific steps comprising the methodology for this study update are outlined below.
Step 1 Confirmation of Criteria
The criteria used in this study to provide both comparisons across locations and ongoing replication included the following for greenfield and infill sites:
CRITERIA Greenfield specification Infill specification
Site Location Comparable outer city suburbs Comparable inner city locations
Land Zoning/Status
Urban development zoning but not currently subdivided or serviced
Urban development zoning
Development size Approximately 100 lot development – could be first stage of much larger development
30-70 apartments, in block of 5-9 storeys
Lot size Average lots 400-500 m2 0.5-1 hectares
Dwelling type 3 bedroom, one storey house 2 bedroom, single level apartment
Proximity to Approximately within 10km of major retail, Within 2-3km of main street and/or major
RESULTS AND ANALYSIS4

RESULTS AND ANALYSIS
CRITERIA Greenfield specification Infill specification
Services health (hospital), education (secondary) or planned services. Within 5km of primary education
supermarket (Coles/Woolworths)
Public Transport Access
Within 5-10km of rail station or major bus station. Within 1km of bus route or future bus route
Within 1km of major public transport – rail station, bus stop/station
Land Preparation Assume relatively flat Minimal vegetation clearing No major civil infrastructure works
required off site to support development
Assume relatively flat Minimal demolition No major civil infrastructure works required off
site to support development
Quality of finishes Medium quality finishes (not top of range or bottom)
Medium quality finishes (not top of range or bottom)
Step 2 Cost Compilation
The core cost components and the approaches for compiling these costs are:
Land – Review of development feasibility assessments for the appropriate dwelling type in the relevant location. This has been compared to publicly sourced land sale information from RP Data, Victorian Valuer General’s Department, and other land sales databases.
Development timing – This is based on research and experience from our town planning division across the relevant geographies. This has relevance in terms of development holding costs and consultant’s fees.
Council rates and fees – Council based costs incurred during the development of each type of dwelling. Sourced from Council web sites and other published Council documentation.
Taxes – Drawn from government published rates for stamp duty, land tax, and GST.
Professional fees – These have been provided by our sub consultants, Rider Levitt Bucknall and are based on relevant project examples.
Infrastructure charges – These are based on a range of sources including Local Government Association information, council information, and information from the Urbis Town Planning division. These reflect charges incurred during 2010 (and do not reflect changes to infrastructure charging regimes that have been implemented in 2011).
Land preparation costs and dwelling construction costs – This has been provided by Rider Levett Bucknall through its national office network and databases. This is based on identical dwelling developments across the study locations (taking into account appropriate geographic and climatic differences).
Development costs – These are a compilation of development management, marketing, and selling costs and any other development costs not included in the above categories. These are based primarily on industry benchmarks (typically these are percentages of overall costs and estimates of development management salaries) which have been verified through discussions with developers.
Sale prices – These have been drawn from national RP Data information, Victorian Valuer Generals data, and other dwelling sale data sources for dwelling sale prices over the relevant period and for
document.docx
RESULTS AND ANALYSIS5

the study locations and dwelling typologies. This assessment has also reviewed developer feasibility assessments to cross check publicly sourced information.
Development Profit – This is calculated as a result of the compilation of the above costs subtracted from the identified dwelling sale price.
Step 3 Results Compilation and Analysis
From the above cost analysis, cost tables were compiled for each of two dwelling types for each of the 5 study locations. Effectively this generates 5 greenfield tables and 5 infill tables across the study locations for comparison. This information has then been analysed to ascertain changes in dwelling cost components over the past year, the significance of each component, and compare cost components across geographies and dwelling types. Detailed data tables for infill, greenfield and construction and professional costs appear in appendices A, B and C respectively.
Step 4 Conclusions and Recommendations
The final stage of the study draws together the key findings and insights of the study and from this identifies recommendations and policy responses aimed at improving housing affordability across Australia.
2.1 KEY ASSUMPTIONSThe key assumptions for each cost component are outlined in the following tables for greenfield and infill dwellings.
Table 1 – Greenfield dwelling cost assumptions
Cost component Key assumptions
Land Based on the average price of urban development land in each city location over the period Jan 2008 to Jan 2011 combined with advice received from developers
Stamp duty Stamp duty assumes there are no concessions available to the developer
Local council fees Based on candidate location local government charges
Professional fees Provided by Rider Levett Bucknall and is based on relevant project examples
Infrastructure charges Based on state and local government identified charges appropriate for each location
Land preparation Based on minimal constraints to development
Council rates/water Rates are calculated on the parent site throughout the development period. Assumes no water usage, however charges are applied for connection.
Land tax Calculated on an 80% market value to estimate unimproved capital value
Development timing Assumes no undue time delay caused by developer in seeking planning approvals, land preparation or dwelling construction
RESULTS AND ANALYSIS6

RESULTS AND ANALYSIS
Dwelling construction costs While costs were based on effectively identical dwellings across states, it was considered appropriate to account for factors relating to climatic, geographic, and regulatory differences across the study locations
Development costs Marketing costs have increased in areas to account for in depth marketing strategies
Sales costs are calculated at 3% of sales value. This is consistent with market rates.
Development management fees typically represent 1.0% of project costs
Interest Assumed developer provides 40% equity on the purchase of land (consistent with market rate)
Interest on land (remaining 60%) and purchase costs is calculated on 9.5% p.a. for the whole of the development period
Interest for the remaining costs is calculated on a draw down facility at 9.5% p.a.
Sale price Reflective of recent sales of new 3 bedroom, 2 bathroom detached houses on 400m2 to 500m2 lots in relevant area
GST liability Calculated as 10% of end sale price
Development profit Based on difference between sale price and total development costs
Table 2 – Infill dwelling cost assumptions
Cost component Key assumptions
Land Based on average price of urban development land in each city location over the period Jan 2008 to Jan 2011
Stamp duty Stamp duty assumes there are no concessions available to the developer
Local council fees Based on candidate location local government charges
Professional fees Provided by Rider Levett Bucknall and is based on relevant project examples
Infrastructure charges Based on state and local government identified charges appropriate for each location
Land preparation Based on minimal constraints to development
Council rates/water Rates are calculated on the parent site throughout the development period. Assumes no water usage, however charges are applied for connection
Land tax Calculated on 80% of market value to estimate unimproved capital value
document.docx
RESULTS AND ANALYSIS7

Cost component Key assumptions
Development timing Assumes no undue time delay caused by developer in seeking planning approvals, land preparation or dwelling construction
Dwelling construction costs While costs were based on effectively identical dwellings across states, it was considered appropriate to account for factors relating to climatic, geographic, and regulatory differences across the study locations
Development costs Marketing costs have increased in areas to account for in depth marketing strategies
Sales costs are calculated at 3% of sales value. This is consistent with market rates.
Development management fees typically represent 1.0% of project costs
Interest Assumed developer provides 40% equity on the purchase of land (consistent with market rate)
Interest on land (remaining 60%) and purchase costs is calculated on 9.5% p.a. for the whole of the development period
Interest for the remaining costs is calculated on a draw down facility at 9.5% p.a.
Sale price Reflective of recent sales of new 2 bedroom, 2 bathroom apartments in the relevant area
GST liability Calculated as a 10% of end sale price
Development profit Based on difference between sale price and total development costs
RESULTS AND ANALYSIS8

RESULTS AND ANALYSIS
3 Results and AnalysisThis second edition of the National Dwelling Cost Study for the Australian Government examined the costs for new dwelling development of both infill and greenfield dwellings in Australia’s five major cities. The results of this assessment are presented in separate infill and greenfield sections with the emphasis on comparing cost similarities and differences between cities and changes over the past year. To focus the analysis of the results of this dwelling cost study the individual cost components for infill and greenfield dwelling developments have been compiled into six main categories as shown below.
TABLE 3 – Dwelling cost categories
Major category Component costs Cost to developer Cost to purchaser
Land Land acquisition
Government taxes and charges
Stamp duty on land Stamp duty on dwelling sale Local council fees Infrastructure charges Council rates/water Land tax GST liability Transfer fee on sale
Professional fees Professional fees during development Professional fees on sale
Construction Land preparation Dwelling construction costs
Development costs and interest
Development management Marketing Due diligence / legal fees Sale costs Interest on land and purchase costs Interest on construction Finance charges
Development profit Developer profit
This study examines the entire dwelling costs for a dwelling purchaser including post sale costs - stamp duty, transfer fees, and professional transaction fees. These components are generally not included when compiling housing affordability measures, however they are genuine costs of purchasing dwellings and need to be considered in a study that aims to assess housing affordability including all costs of dwelling development and purchase.
3.1 INFILL DWELLING COSTSIn 2010 sale prices for infill dwellings were higher for all cities than in 2009. Sales prices in Sydney, Brisbane and Perth experienced the highest increases (13-14%) while price increases in Melbourne and Adelaide were more modest (4-5%). The total costs to the purchaser have seen comparable increases to sales prices.
document.docx
RESULTS AND ANALYSIS9

When these price rises are placed in the context of new dwelling approvals for other dwellings (apartments, semi-detached, townhouses, cabins, and other dwellings) the Sydney and Brisbane markets appear to be on the upward part of the cycle seeing both strong increases in dwelling approvals and price increases. Perth also appears to be in the early stages of the upward cycle with price growth leading a moderate increase in new other dwelling approvals.
The Melbourne market appears to be turning with the potential for an oversupply through strong growth in new other dwellings leading to a slowing in price growth. Adelaide could be on the way down with a drop in new other dwelling approvals and low price growth.
RESULTS AND ANALYSIS
New dwelling approvals - attached/otherNational Dwelling Cost Study Table 3.1
Sydney Melbourne Brisbane Perth Adelaide
2000-01 11,524 8,955 4,013 2,161 9942001-02 18,037 10,489 4,911 2,189 1,3632002-03 19,034 12,840 5,839 2,667 1,7772003-04 17,507 9,733 6,571 2,867 2,0622004-05 11,506 7,858 6,090 3,448 1,8772005-06 10,116 6,000 5,347 3,037 2,5112006-07 10,381 7,581 4,933 3,920 1,5702007-08 11,195 9,785 5,656 4,480 2,1582008-09 7,526 10,036 4,014 2,745 2,2242009-10 11,139 15,246 6,399 3,093 2,172
5 year average 10,071 9,730 5,270 3,455 2,127
10 year average 12,797 9,852 5,377 3,061 1,871
Source : ABS Building Approval Data ; Urbis
Statistical divisions (SD)
10

URBISdocument.docx RESULTS AND ANALYSIS 11
Infill housing comparisonSummary table Table 3.2
Cost component Sydney Melbourne Brisbane2009 2010 2009 2010 2009 2010
$ % $ % $ % $ % $ % $ %
Cost to developer $532,000 $541,000 $462,000 $490,000 $515,000 $475,000
Sale price $531,000 $600,000 $550,000 $572,000 $490,000 $552,000
Total cost to purchaser $552,137 100% $624,702 100% $577,846 100% $603,845 100% $499,809 100% $565,580 100%
Land $85,000 15.4% $90,000 14.4% $32,000 5.5% $35,000 5.8% $72,000 14.4% $45,000 8.0%Govt taxes & charges $91,000 16.5% $102,000 16.3% $83,000 14.4% $93,000 15.4% $85,000 17.0% $83,000 14.7%Professional fees $24,000 4.3% $27,000 4.3% $17,000 2.9% $26,000 4.3% $16,000 3.2% $24,000 4.2%Construction $282,137 51.1% $282,702 45.3% $301,846 52.2% $313,845 52.0% $290,809 58.2% $282,580 50.0%Development cost & interest $71,000 12.9% $64,000 10.2% $56,000 9.7% $54,000 8.9% $61,000 12.2% $54,000 9.5%Developers profit -$1,000 -0.2% $59,000 9.4% $88,000 15.2% $82,000 13.6% -$25,000 -5.0% $77,000 13.6%
Cost component Perth Adelaide 2009 2010 2009 2010
$ % $ % $ % $ %
Cost to developer $500,000 $517,000 $446,000 $476,000
Sale price $513,000 $585,000 $440,000 $460,000
Total cost to purchaser $533,073 100% $608,935 100% $461,561 100% $484,452 100%
Land $60,000 11.3% $71,000 11.7% $48,000 10.4% $50,000 10.3%Govt taxes & charges $76,000 14.3% $87,000 14.3% $71,000 15.4% $78,000 16.1%Professional fees $17,000 3.2% $21,000 3.4% $7,000 1.5% $31,000 6.4%Construction $307,073 57.6% $296,935 48.8% $290,561 63.0% $290,452 60.0%Development cost & interest $60,000 11.3% $65,000 10.7% $51,000 11.0% $51,000 10.5%Developers profit $13,000 2.4% $68,000 11.2% -$6,000 -1.3% -$16,000 -3.3%
1. 2009 Inputs are based on the 2009 Final Report National Dwelling Cost Study J anuary 2010
2. Total cost to purchaser includes stamp duty, a transfer fee and legal costs
2. Initial developer profit figures are based on Estate Master
Source : Urbis ; Rider Levett Bucknall 2010

The relative proportion of the various dwelling cost components have not changed in 2010, with construction costs (45-60%) remaining the largest dwelling cost component, followed by government taxes and charges (14-16%), land (6-14%), and development costs and interest (9-11%). Development profit increased in 2010, with most cities achieving profit for infill developments of, on average, around 9-14% of total costs to the purchaser. The exception to this is Adelaide (-3%) where the infill development market for mid rise apartments remains commercially challenging.
Sydney ($624,000) remains the highest cost city for infill dwelling development followed by Perth ($609,000), Melbourne ($604,000), Brisbane ($565,000), and Adelaide ($484,000).
RESULTS AND ANALYSIS
Infill - summary of cities, 2009 & 2010National Dwelling Cost Study Chart 3.1
Source : Urbis
15% 14%6% 6%
14% 8% 11% 12% 10% 10%
16% 16%
14% 15%
17%
15% 14% 14% 15% 16%
4% 4%
3% 4%
3%
4% 3% 3% 2%6%
51%45%
52% 52%
58%
50%58%
49%63%
60%
13%
10%10% 9%
12%
10%
11%
11%
11% 11%
0%
9% 15% 14%
-5%
14%2%
11%
-1% -3%
-10%
0%
10%
20%
30%
40%
50%
60%
70%
80%
90%
100%
2009 2010 2009 2010 2009 2010 2009 2010 2009 2010
Sydney Melbourne Brisbane Perth Adelaide
Perc
ent o
f dw
ellin
g co
st
Land Govt taxes & charges Professional feesConstruction Development cost & interest Developers profit
12

RESULTS AND ANALYSIS
document.docx
RESULTS AND ANALYSIS13
Infill - summary by city, 2009 & 2010National Dwelling Cost Study Chart 3.2
Source : Urbis ; Rider levett Bucknell, 2011
-$100,000
$0
$100,000
$200,000
$300,000
$400,000
$500,000
$600,000
$700,000
Land Govt taxes &charges
Professionalfees
Construction Developmentcost &interest
Developersprof it
Total cost topurchaser
Sydney Melbourne Brisbane Perth Adelaide

3.1.1 LandIn 2010 the land cost component of infill dwelling development remained at a similar proportion of overall cost to that in 2009 for all cities with the exception of Brisbane. Brisbane has experienced a notable decrease in the land cost component of new infill dwellings, declining from around $72,000 to $45,000 (14% to 8% of the total cost to the purchaser). This reflects the difficult market conditions being experienced in the Brisbane residential market and Queensland economy in general. The decline in raw land cost is a function of meeting the relatively low demand and transactions that have occurred over the last 12 months which is reflective of a quieter market. According to the April 2011 Comsec Economic report, Queensland is currently experiencing the slowest economic growth and highest unemployment rate of any state or territory in Australia. In terms of these economic indicators NSW is faring only marginally better than Queensland.
In 2010 the land cost component for infill dwellings in Melbourne remained at the lowest proportion of total cost to purchaser (6%) of Australia’s largest five cities. Land cost accounted for a larger proportion of overall cost in Sydney (14% down from 15% the previous year), Perth (12% up from 11%), and Adelaide (remaining at 10%).
Sydney also has the highest cost for land in infill dwelling development at $90,000 compared to Melbourne’s low of $35,000. Brisbane ($45,000) and Adelaide ($50,000) are also at the lower end, while Perth ($71,000) is closer to Sydney’s high.
RESULTS AND ANALYSIS
Infill - land cost, 2009 & 2010National Dwelling Cost Study Chart 3.3
Source : Urbis ; Rider levett Bucknell, 2011
$0
$25,000
$50,000
$75,000
$100,000
2009 2010 2009 2010 2009 2010 2009 2010 2009 2010
Sydney Melbourne Brisbane Perth Adelaide
14

RESULTS AND ANALYSIS
3.1.2 ConstructionIn 2010, movements in construction costs for infill dwellings across the five cities varied with Sydney and Adelaide recording virtually no increase; Brisbane and Perth recording declines; and Melbourne recording an increase. In most instances construction costs have decreased as a proportion of overall costs to the purchaser with the exception of Melbourne where they remained steady at 52%. Construction costs still represent the largest component of overall costs by a considerable margin. The proportion of total costs attributable to construction varies across cities from 45% in Sydney, 49% in Perth, 50% in Brisbane, and a high of 60% in Adelaide.
Melbourne has replaced Perth as the most expensive city in which to build infill dwellings at $314,000 for a two bedroom unit in a medium to high storey development. Perth follows at $297,000, with Adelaide at $290,000. Brisbane ($283,000) and Sydney ($283,000) are the least expensive of the five cities in which to build infill dwellings.
document.docx
RESULTS AND ANALYSIS15
Infill - construction costs, 2009 & 2010National Dwelling Cost Study Chart 3.4
Source : Urbis ; Rider levett Bucknell, 2011
$250,000
$275,000
$300,000
$325,000
2009 2010 2009 2010 2009 2010 2009 2010 2009 2010
Sydney Melbourne Brisbane Perth Adelaide

3.1.3 Professional FeesProfessional fees include consultant fees outside of construction costs such as architects, traffic engineers, and post sale legal fees. In 2010 professional fees increased across all cities but remained relatively steady as a proportion of total cost to purchaser (3-4%). The exception to this has been Adelaide where professional fees rose from $7,000 in 2009 to $31,000 in 2010. This was also reflected in an increase from 2% in 2009 to 6% in 2010 of total costs to the purchaser.
The increase in professional fees, particularly in Adelaide, reflects a refinement to the methodology used for this report. The approach used in this study has drawn on the experience of Rider Levett Bucknall and reflects a more consistent approach in the determination of professional fees across the five cities. The previous study had estimated this component from a number of sources and in the case of Adelaide had not comprehensively captured these costs in this category.
RESULTS AND ANALYSIS
Infill - professional fees, 2009 & 2010National Dwelling Cost Study Chart 3.5
Source : Urbis ; Rider levett Bucknell, 2011
$0
$5,000
$10,000
$15,000
$20,000
$25,000
$30,000
$35,000
2009 2010 2009 2010 2009 2010 2009 2010 2009 2010
Sydney Melbourne Brisbane Perth Adelaide
16

RESULTS AND ANALYSIS
3.1.4 Government Taxes and ChargesIn 2010 government taxes and charges have increased for all cities with the exception of Brisbane. On the surface this would indicate that there have been few changes in policy and legislation with respect to infill dwelling development costs across Australia’s more populous states, with the exception of Queensland. This is reflected in the relatively unchanged proportion of total costs to purchasers for which government taxes and charges account for infill dwellings (14-16%). Most cities registered either a rise or fall of one percentage point in the proportion that government taxes and charges represent of total costs to purchaser. Brisbane has seen a slightly greater change with a decline from 17% or $86,000 in 2009 to 15% or $83,000 of total purchaser costs in 2010. All other cities recorded increases of $6,000-$11,000. In 2010, Sydney continued to have the highest government costs at $102,000 followed by Melbourne ($93,000), Perth ($87,000), Brisbane, with Adelaide ($78,000) the lowest.
Government taxes and charges incorporate a range of government costs, however GST liability is the largest item. This remains an issue for the development and construction industry as it is not a cost born by existing dwellings. Effectively then a new $500,000 dwelling incurs a $50,000 impost (approximately) compared to an established dwelling of comparable standard.
.
document.docx
RESULTS AND ANALYSIS17
Infill - govt taxes and charges, 2009 & 2010National Dwelling Cost Study Chart 3.6
Source : Urbis ; Rider levett Bucknell, 2011
$0
$25,000
$50,000
$75,000
$100,000
$125,000
2009 2010 2009 2010 2009 2010 2009 2010 2009 2010
Sydney Melbourne Brisbane Perth Adelaide

Stamp duty is the second most significant government cost and Brisbane infill dwellings have a significant advantage over their counterparts in the other major cities in this regard. This is very similar to the picture in the 2009 results and reflects Queensland’s favourable stamp duty treatment of lower priced and mid priced dwellings. We noted last year that there are two components of stamp duty that the state governments reap, being on the sale of the underlying land and again on sale of the completed property. The combination of GST and stamp duty for new dwellings remains a significant tax burden for dwellings that flows directly through to the end purchaser.
Much emphasis is given to infrastructure charges in relation to dwelling development. The above chart highlights the comparably high costs that NSW and Queensland pay for infrastructure. However, infrastructure costs represent between 2% to 3% of total costs to purchaser for infill dwellings in these cities. Notably Queensland costs reflect the highest share of overall costs. Recent government initiatives in Queensland have aimed to provide greater certainty and consistency for infrastructure charges (Infrastructure Charges Taskforce, 2011) though industry feedback indicates these charges are at the high end of the affordable range.
Land tax is a relatively insignificant component of government costs however it adds to the overall tax burden on dwellings more so in NSW than the other states.
RESULTS AND ANALYSIS
Infill - govt taxes and charges break down, 2010National Dwelling Cost Study Chart 3.7
1. Total stamp duty includes stamp duty payable to developer (on land) and purchaserSource : Urbis ; Rider levett Bucknell, 2011
$0
$10,000
$20,000
$30,000
$40,000
$50,000
$60,000
$70,000
Infrastructure charges Land tax GST liability Total stamp duty
Sydney Melbourne Brisbane Perth Adelaide
18

RESULTS AND ANALYSIS
3.1.5 Development Costs and InterestDevelopment costs, including interest have declined or remained steady across all major cities in 2010 with the exception of Perth. Development and interest costs in Perth rose from $60,000 to $65,000 to equal Sydney ($65,000) as the city with the highest development costs.
The decline in development and interest costs is a reflection of a change in methodology adopted in the compilation of 2010 data presented in this report. Through the use of Estate Master there has been improved accuracy in calculating interest. Through enabling payback periods to be calculated monthly the methodology has effectively reduced the amount of interest payable, more closely reflecting what happens in practice.
This has a particular effect on infill development due to the lumpy nature of development where construction funding is required up front as opposed to the on going need for construction funding when developing detached housing. This results in lumpier interest payments for infill development. However, when payback periods can be split into monthly repayments, a significant interest saving is incurred.
document.docx
RESULTS AND ANALYSIS19
Infill - development cost and interest, 2009 & 2010National Dwelling Cost Study Chart 3.8
Source : Urbis ; Rider levett Bucknell, 2011
$0
$25,000
$50,000
$75,000
2009 2010 2009 2010 2009 2010 2009 2010 2009 2010
Sydney Melbourne Brisbane Perth Adelaide

3.1.6 Development ProfitDevelopment profit is calculated as the difference between the cost to the developer and the dwelling sale price. Where markets are not performing well developer profit is expected to be low. As this study uses average costs of dwelling components and generally does not take into allowance timing differences between construction costs and sale costs it is possible to generate a loss. This generally would not happen in actuality as a developer would not proceed if there was a likelihood of incurring a loss.
Developer profit increased in 2010 for Sydney, Brisbane, and Perth. This reflects a turnaround from a loss or minimal profit in 2009 to a profit of between 9-14% of total costs to the purchaser. This is likely to be a reflection of these markets being on the upward part of the infill dwelling cycle with sales price increases exceeding or in line with the growth of volume of dwelling production. While developer profit for infill dwelling development in Melbourne has declined from 15% to 14% of overall cost to purchaser, this level of profit still falls within an acceptable range for the developer, be it at the low end. This is consistent with a falling market indicating that the Melbourne infill market could be in the early stages of a downturn. Infill dwelling development in Adelaide remains problematic with developer profit falling further into negative territory at -3%. This indicates the Adelaide infill dwelling market is in decline but also that it has a cost imbalance compared to market prices.
RESULTS AND ANALYSIS
Infill - developer profit, 2009 & 2010National Dwelling Cost Study Chart 3.9
Source : Urbis ; Rider levett Bucknell, 2011
-$50,000
-$25,000
$0
$25,000
$50,000
$75,000
$100,000
2009 2010 2009 2010 2009 2010 2009 2010 2009 2010
Sydney Melbourne Brisbane Perth Adelaide
20

RESULTS AND ANALYSIS
3.2 GREENFIELD DWELLING COSTSThe disparity between greenfield dwelling costs across Australia’s five major cities continued in 2010 although there was a change in the relative price differences between cities. This was due to a nominal fall in greenfield dwelling prices in Sydney (from $600,000 in 2009 to $570,000 in 2010) and Brisbane ($400,000 to $376,000) and moderate rises in Perth ($370,000 to $402,000) and Adelaide ($395,000 to $415,000). Greenfield dwelling prices in Melbourne experienced the greatest increase ($400,000 to $450,000) which is a reflection of the stronger greenfield dwelling market in this city compared with other major Australian cities.
It is important to note that this study does not necessarily assess the average growth in dwelling costs across capital cities over time. Rather it is a relative comparison of dwelling costs across Australia’s five major cities where average costs and prices for a relatively comparable dwelling in each city have been used. We noted in the background to this report how the Melbourne greenfield market provides a greater depth of affordable greenfield housing. This has been achieved through a number of mechanisms, an important factor being the reduction in average lot sizes. This has been more prevalent in the Melbourne market than other capital city markets. The impact for this study is that when comparing houses on comparable sized blocks (400-500m2) Melbourne’s affordability advantage is less apparent.
document.docx
RESULTS AND ANALYSIS21

22 RESULTS AND ANALYSIS URBIS
document.docx
Greenfield housing comparisonSummary table Table 3.3
Cost Component Sydney Melbourne Brisbane2009 2010 2009 2010 2009 2010
$ % $ % $ % $ % $ % $ %
Cost to developer $535,000 $552,000 $356,000 $406,000 $362,000 $342,000
Sale price $600,000 $570,000 $400,000 $450,000 $400,000 $376,000
Total cost to purchaser $626,146 100% $595,024 100% $418,911 100% $472,430 100% $407,588 100% $382,789 100%Land $152,000 24.3% $135,000 22.7% $50,000 11.9% $55,000 11.6% $54,000 13.2% $25,000 6.5%Govt taxes & charges $130,000 20.8% $131,000 22.0% $71,000 16.9% $82,000 17.4% $76,000 18.6% $69,000 18.0%Professional fees $10,000 1.6% $16,000 2.7% $2,000 0.5% $16,000 3.4% $3,000 0.7% $13,000 3.4%Construction $211,146 33.7% $214,024 36.0% $212,911 50.8% $221,430 46.9% $201,588 49.5% $201,789 52.7%Development cost & interest $58,000 9.3% $81,000 13.6% $39,000 9.3% $54,000 11.4% $35,000 8.6% $40,000 10.4%Developers profit $65,000 10.4% $18,000 3.0% $44,000 10.5% $44,000 9.3% $38,000 9.3% $34,000 8.9%
Cost Component Perth Adelaide 2009 2010 2009 2010
$ % $ % $ % $ %
Cost to developer $371,000 $347,000 $355,000 $394,000
Sale price $370,000 $402,000 $395,000 $415,000
Total cost to purchaser $384,204 100% $416,831 100% $415,289 100% $436,436 100%
Land $52,000 13.5% $38,000 9.1% $50,000 12.0% $55,000 12.6%Govt taxes & charges $70,000 18.2% $75,000 18.0% $66,000 15.9% $76,000 17.4%Professional fees $9,000 2.3% $14,000 3.4% $4,000 1.0% $13,000 3.0%Construction $219,204 57.1% $195,831 47.0% $217,289 52.3% $220,436 50.5%Development cost & interest $35,000 9.1% $39,000 9.4% $38,000 9.2% $51,000 11.7%Developers profit -$1,000 -0.3% $55,000 13.2% $40,000 9.6% $21,000 4.8%
1. 2009 Inputs are based on the 2009 Final Report National Dwelling Cost Study J anuary 2010
2. Total cost to purchaser includes stamp duty, a transfer fee and legal costs
2. Initial developer profit figures are based on Estate Master
Source : Urbis ; Rider Levett Bucknall 2010

RESULTS AND ANALYSIS
When examining new dwelling approvals for houses across the five major cities over the past year recoveries appear to have continued in the first part of 2010 before a slowing or decline in all markets. New dwelling approvals in Sydney remained steady and well above the five year average for the city. Approvals in Melbourne remained strong, although approvals weakened somewhat in the second half of 2010, but remained well above the five and ten year averages. Approvals in Brisbane weakened notably in the second half of the year and remained significantly below the five and ten year averages. Approvals in Perth declined in the second half of the year though remained in line with the five year average and above the ten year average. In Adelaide, approvals remained steady over the second part of the year and remained above the five and ten year averages.
In 2010, many of the components contributing to greenfield dwelling costs across the five cities have changed little as a proportion of total cost to purchasers. Exceptions to this include the developer’s profit for Sydney, Perth, and Adelaide; construction costs for Perth; and land costs for Brisbane and Perth which all increased substantially. These are discussed in detail in the analysis for each cost component later in this section of the report.
document.docx
RESULTS AND ANALYSIS 23
New dwelling approvals - housesNational Dwelling Cost Study Table 3.4
Sydney Melbourne Brisbane Perth Adelaide
2000-01 9,835 17,492 7,847 8,734 3,8382001-02 13,268 25,658 12,245 12,759 5,8482002-03 10,799 22,657 13,064 13,295 5,5382003-04 9,509 22,698 12,966 14,123 5,8592004-05 7,284 20,351 9,816 13,589 5,1962005-06 6,563 18,742 9,918 15,392 4,9822006-07 6,460 19,169 10,775 13,462 5,5262007-08 6,686 22,124 11,935 11,742 6,6732008-09 6,038 21,441 8,401 11,114 5,8502009-10 8,104 26,080 9,107 14,178 6,565
Calendar year 2010 8,020 25,644 8,453 13,025 6,350
5 year average 6,770 21,511 10,027 13,178 5,919
10 year average 8,455 21,641 10,607 12,839 5,588
Statistical Divisions (SD)

Although having experienced a decline over 2010, Sydney continued to have the highest costs to purchasers for greenfield dwellings ($595,000). This is owing to relatively high land costs, government taxes and charges, and development costs. Sydney is comparable to the other cities in regards to construction costs. Melbourne has the second highest total costs to purchasers ($472,000) owing to relatively higher construction costs, and development costs. Development profit in Melbourne is still relatively high as a result of the historically strong demand for greenfield dwellings and widespread affordability of this dwelling offer.
Adelaide has the third highest total costs to purchasers for greenfield dwellings (for the study areas), marginally lower than Melbourne. Adelaide has comparably high construction costs (second highest across the five cities), land costs, and development costs. This has put downward pressure on the development profit generating unsustainable levels of return of less than 5% for developers.
Perth has marginally lower total costs than Adelaide but has advantages in lower land costs, construction costs, and development costs. These factors have generated a stronger development profit (13%) for greenfield dwellings in Perth.
Brisbane has seen a notable change in greenfield dwelling development costs including a significant fall in the land cost component and a reduction in government taxes and charges principally as a result in the lower sale price. The cost reductions have balanced the fall in sale price leaving the developers profit stable at 9% of total cost to purchaser.
RESULTS AND ANALYSIS
Greenfield - summary of cities, 2009 & 2010National Dwelling Cost Study Chart 3.10
Source : Urbis
24% 23%12% 12% 13%
7%14% 9% 12% 13%
21% 22%
17% 17% 19%18%
18%18% 16% 17%
2% 3%
0% 3% 1%3%
2%3% 1%
3%
34% 36%
51% 47% 49%53%
57%
47% 52%51%
9%14%
9% 11% 9% 10%
9%
9%9%
12%10%
3%11% 9% 9% 9%
0%
13% 10% 5%
-10%
0%
10%
20%
30%
40%
50%
60%
70%
80%
90%
100%
2009 2010 2009 2010 2009 2010 2009 2010 2009 2010
Sydney Melbourne Brisbane Perth Adelaide
Perc
ent
Land Govt taxes & charges Professional fees
Construction Development cost & interest Developers profit
24

RESULTS AND ANALYSIS
document.docx
RESULTS AND ANALYSIS 25
Greenfield - summary by city, 2009 & 2010National Dwelling Cost Study Chart 3.11
Source : Urbis ; Rider levett Bucknell, 2011
-$100,000
$0
$100,000
$200,000
$300,000
$400,000
$500,000
$600,000
$700,000
Land Govt taxes &charges
Professionalfees
Construction Developmentcost &interest
Developersprof it
Total cost topurchaser
Sydney Melbourne Brisbane Perth Adelaide

3.2.1 LandThe land cost component of greenfield dwelling costs has not seen strong upward movement for most cities in 2010. Land costs declined in Sydney (from $152,000 in 2009 to $135,000 in 2010), Brisbane ($54,000 to $25,000), and Perth ($52,000 to $38,000). This is owing to weaknesses in these greenfield markets as sale volumes fall and developers have cut prices to stimulate demand. This response has also seen average block sizes decline as a response to increased demand for affordable dwellings.
The rise in the land cost component in Melbourne ($50,000 to $55,000) and Adelaide ($50,000 to $55,000) reflects the relative strength in these dwelling markets especially in the first half of 2010. This is also reflected in the strong increase in new dwelling approvals for houses in these cities.
RESULTS AND ANALYSIS
Greenfield - land cost, 2009 & 2010National Dwelling Cost Study Chart 3.12
Source : Urbis ; Rider levett Bucknell, 2011
$0
$25,000
$50,000
$75,000
$100,000
$125,000
$150,000
$175,000
2009 2010 2009 2010 2009 2010 2009 2010 2009 2010
Sydney Melbourne Brisbane Perth Adelaide
26

RESULTS AND ANALYSIS
3.2.2 ConstructionIn 2010, for greenfield dwellings construction costs remain the largest component of total costs to purchasers though, as was the case in 2009, these are generally at lower proportions than for infill dwellings. House construction costs have increased as a proportion of total cost to purchaser in Brisbane and Sydney as overall costs have declined. However, in absolute terms construction costs for greenfield dwellings in Brisbane have remained stable at $202,000. Construction costs have also remained relatively stable in Adelaide (from $217,000 in 2009 to $220,00 in 2010), and Sydney ($211,000 to $214,000). Melbourne has become the most expensive city to build greenfield dwellings in (from $213,000 in 2009 to $221,000 in 2010) just ahead of Adelaide, while Perth ($219,000 to $196,000) has gone from the most expensive to the least expensive city for greenfield dwelling construction.
With respect to these movements in construction costs, Rider Levett Bucknall has provided the following insights. Tendered construction prices are very closely related to work volumes. Up until 2008 the level of work exceeded the capacity of the industry and so prices received at tender were very high. However, since 2008 the volume of work has declined substantially so that currently the construction industry capacity is well in excess of the available work. This results in very competitive tender prices due to the following factors:
Suppliers offer substantial discounts on materials
Subcontractors cut margins to the minimum to secure work for their personnel
Main contractors cut margins to secure work
As a result there has been a 15% reduction in tendered prices from a high in September 2008 to the end of 2009 with relatively flat prices from then on. This has impacted each of the five major cities differently with construction cost increasing in the markets with greater demand and declining or remaining steady in weaker markets. The significant decline in Perth reflects a broader freeing of labour supply across the Perth market.
Tendered rates are expected to increase again from mid this year at an annual rate of 4%.
document.docx
RESULTS AND ANALYSIS 27
Greenfield - construction costs, 2009 & 2010National Dwelling Cost Study Chart 3.13
Source : Urbis ; Rider levett Bucknell, 2011
$175,000
$200,000
$225,000
2009 2010 2009 2010 2009 2010 2009 2010 2009 2010
Sydney Melbourne Brisbane Perth Adelaide

3.2.3 Professional FeesProfessional fees represent a relative minor component of total cost to purchaser. In 2010, the proportion of total cost attributable to professional fees was relatively consistent across the five cities (3%). The dollar value of professional fees increased across all cities, however this was principally due to a change in methodology in the compilation of the 2010 data. In 2009 some geographic variations relating to the development of greenfield land were included. Assumptions on land constraints and resulting professional input (e.g. hydrology, acoustics, traffic) varied across some locations. In 2010, these assumptions have been standardised across the locations and now better reflect averages incurred by the developer.
RESULTS AND ANALYSIS
Greenfield - professional fees, 2009 & 2010National Dwelling Cost Study Chart 3.14
Source : Urbis ; Rider levett Bucknell, 2011
$0
$5,000
$10,000
$15,000
$20,000
$25,000
$30,000
$35,000
2009 2010 2009 2010 2009 2010 2009 2010 2009 2010
Sydney Melbourne Brisbane Perth Adelaide
28

RESULTS AND ANALYSIS
3.2.4 Government Taxes and ChargesIn 2010, government taxes and charges have increased moderately across Melbourne, Perth, and Adelaide, generally in line with overall dwelling price movements. This would be expected as the major government components (GST, and stamp duty) relate principally to the sale price. In the cities which have experienced declines in greenfield dwelling prices government taxes and charges have remained stable (Sydney) or fallen (Brisbane).
An examination of the sub components of government taxes and charges provides insight into these movements. The decline in government taxes and charges for greenfield dwellings in Brisbane in 2010 is principally due to the lower levels of stamp duty resulting from the Queensland Government’s concessions in stamp duty to assist low income home buyers. Owing to this Queensland has increased its advantage in stamp duty costs for greenfield dwellings (generally entry level housing) over the other states. This is not as visible for the development industry as the majority of this cost is incurred after the sale, and is unlikely to be part of the comparison that interstate buyers make when considering relocating from another state. For Brisbane Greenfield dwellings, the GST liability has also declined with the decline in the dwelling price, while infrastructure charges have remained steady at around $27,000.
In 2010, government taxes and charges in Sydney remained at around the same level as in 2009, although they rose as a proportion of total cost to purchaser from 21% to 22%. In Sydney, declines in GST and stamp duty due to lower sale prices have been offset by an increase in infrastructure charges. This is mostly due to the inclusion of a $15,000 state infrastructure charge on top of the average $30,000 local government charges.
document.docx
RESULTS AND ANALYSIS 29
Greenfield - govt taxes & charges, 2009 & 2010National Dwelling Cost Study Chart 3.15
Source : Urbis ; Rider levett Bucknell, 2011
$0
$25,000
$50,000
$75,000
$100,000
$125,000
$150,000
2009 2010 2009 2010 2009 2010 2009 2010 2009 2010
Sydney Melbourne Brisbane Perth Adelaide

RESULTS AND ANALYSIS
Greenfield - govt taxes & charges categorised, 2010National Dwelling Cost Study Chart 3.16
1. Total stamp duty includes stamp duty payable to developer (on land) and purchaserSource : Urbis ; Rider levett Bucknell, 2011
$0
$10,000
$20,000
$30,000
$40,000
$50,000
$60,000
$70,000
Infrastructure charges Land tax GST liability Total stamp duty
Sydney Melbourne Brisbane Perth Adelaide
30

RESULTS AND ANALYSIS
3.2.5 Development Costs and InterestIn 2010, development costs and interest rose notably in Sydney (from $58,000 in 2009 to $81,000 in 2010), Melbourne (from $39,000 to $54,000), and Adelaide ($38,000 to $51,000). This reflected rises in interest rates, marketing costs and increased levels of required due diligence on site acquisitions following the global financial crisis.
With the reserve bank lifting interest rates by 100 basis points over the 2010 calendar year, developers incurred increases in borrowing costs, most notably interest payable.
With many housing markets finding it difficult to gather momentum, marketing campaigns and selling strategies (including targeting investor groups) have meant developers have been required to spend more on marketing in order to maintain cash flows.
As a result of these factors there was an increase in the proportion of total cost to purchaser attributable to development costs and interest from 9% in 2009 to 10-14% in 2010 across nearly all cities. Development costs in Brisbane experienced similar proportional increase from 9% to 10%. However, the overall cost figure in Brisbane remained relatively steady indicating the decline in total costs is the cause for the proportional increase of this component. Perth is the only location where despite a modest increase in this component, development costs and interest continue to account for 9% of total costs to purchasers.
document.docx
RESULTS AND ANALYSIS 31
Greenfield - development cost & interest, 2009 & 2010National Dwelling Cost Study Chart 3.17
Source : Urbis ; Rider levett Bucknell, 2011
$0
$25,000
$50,000
$75,000
$100,000
2009 2010 2009 2010 2009 2010 2009 2010 2009 2010
Sydney Melbourne Brisbane Perth Adelaide

3.2.6 Development ProfitIn 2010, there was a tightening in the profit levels in the greenfield dwelling development market in nearly all cities. The exception was Perth where developers profit rose to a creditable 13% of total costs to purchasers. This was due to a solid rise in greenfield dwelling prices and notable falls in land costs, and construction costs. While the market in Melbourne remained relatively strong, costs increased faster than sale prices in 2010. This resulted in development profit remaining steady at $44,000, but a decline from 11% to 9% of total costs to purchasers.
Brisbane’s greenfield dwelling market was difficult in 2010. New dwelling approval rates for detached dwellings rose in the early part of the year but then fell in the second half as the housing recovery stalled. Current new dwelling approval levels are still well below the five and ten year averages for new detached dwellings in Brisbane. This was reflected in substantial reductions in dwelling prices in greenfield areas in 2010. Developers responded to this through reductions in lot sizes. In comparison to Melbourne though it would appear that there needs to be a greater spread of this across the Brisbane greenfield market. As a result developer profit in Brisbane declined from $38,000 to $34,000 per house.
Sydney like Brisbane has experienced a difficult greenfield dwelling market during 2010. While prices have come down along with declines in land, and government taxes and charges, these have been offset with increases in professional fees, construction costs, and developer costs and interest. This has resulted in a reduction in developers profit from $65,000 (10% of total costs to purchasers) to $18,000 (3% of total costs to purchasers).
The Adelaide market appears to have turned during 2010 with costs increasing at a higher rate than dwelling sale prices. Notable increases in land, government taxes and charges, professional fees, and development costs and interest have resulted in a decrease in developer profit from 10% to 5% of total costs to purchasers.
RESULTS AND ANALYSIS
Greenfield - developer profit, 2009 & 2010National Dwelling Cost Study Chart 3.18
Source : Urbis ; Rider levett Bucknell, 2011
-$50,000
-$25,000
$0
$25,000
$50,000
$75,000
$100,000
2009 2010 2009 2010 2009 2010 2009 2010 2009 2010
Sydney Melbourne Brisbane Perth Adelaide
32

RESULTS AND ANALYSIS
3.3 INFILL VS GREENFIELDA comparison of infill and greenfield dwelling costs in 2009 was presented in the previous National Dwelling Costs Study report to ascertain the price and cost competitiveness between the two types of dwelling products across different locations at this time. The objective was to gain insight into how this may assist in improving housing affordability. In this analysis, greenfield dwellings in 2010 in all major cities had cost advantages over infill dwellings, however the scale of the advantage varied substantially across the cities.
The difference between the total costs to purchasers for greenfield and infill dwellings is greatest in Brisbane (32%) due to the decline in greenfield dwelling prices and associated cost cutting. Land is also much cheaper for greenfield dwellings than for infill dwellings. This is not the case in most of the other cities including Sydney and Melbourne where land is around twice as expensive for greenfield dwellings compared to infill dwellings. Professional fees are substantially cheaper for greenfield dwellings due to the less complex nature of these types of dwellings including limited architectural costs, and generally cheaper costs for traffic consultants, noise, and other specialists.
Sydney (5%) and Adelaide (10%) have minimal variations between infill and greenfield dwelling costs. This appears to reflect different situations. Sydney’s established infill dwelling market provides proximity advantages over its greenfield market and a genuine alternative housing option. Adelaide’s situation appears to be more of a cost constrained infill market that can’t achieve the price points it needs to be profitable.
Melbourne (22%) and Perth (32%) have relatively strong infill markets and this is reflected in the higher prices and costs of their medium and high rise infill product compared to their greenfield products.
document.docx
RESULTS AND ANALYSIS 33

34 RESULTS AND ANALYSIS URBIS
document.docx
Greenfield vs infill developmentNational Dwelling Cost Study Table 3.5
Sydney Melbourne Brisbane Perth AdelaideCost component $ % $ % $ % $ % $ %
Land - greenfield $135,000 -50% $55,000 -57% $25,000 44% $38,000 46% $55,000 -10%
Land - infill $90,000 $35,000 $45,000 $71,000 $50,000
Govt taxes & charges - greenfield $131,000 -28% $82,000 12% $82,000 1% $75,000 14% $76,000 3%
Govt taxes & charges - infill $102,000 $93,000 $83,000 $87,000 $78,000
Professional fees - greenfield $16,000 41% $16,000 38% $13,000 46% $14,000 33% $13,000 58%Professional fees - infill $27,000 $26,000 $24,000 $21,000 $31,000
Construction - greenfield $214,024 24% $221,430 29% $201,789 29% $195,831 34% $220,436 24%Construction - infill $282,702 $313,845 $282,580 $296,935 $290,452
Development cost & interest - greenfield $81,000 -27% $54,000 0% $40,000 26% $39,000 40% $51,000 0%Development cost & interest - infill $64,000 $54,000 $54,000 $65,000 $51,000
Developers profit - greenfield $18,000 69% $44,000 46% $34,000 56% $55,000 19% $21,000 231%Developers profit - infill $59,000 $82,000 $77,000 $68,000 -$16,000
Total cost to purchaser - greenfield $595,024 5% $472,430 22% $382,789 32% $416,831 32% $436,436 10%Total cost to purchaser - infill $624,702 $603,845 $565,580 $608,935 $484,452
*Excludes Negative Developer P rofit
Source : Urbis ; Rider Levett Bucknall 2010

CONCLUSION
There are also notable differences between infill and greenfield dwelling for the individual cost components.
In 2010, government taxes and charges were lower for greenfield dwellings than infill dwellings in Melbourne (12% lower) and Perth (14% lower) but more expensive in Sydney (28%), whereas they were comparable in Brisbane and Adelaide. In Melbourne and Perth this is due to lower infrastructure charges being applied to infill dwellings than greenfield dwellings. This results in a lower differential between greenfield and infill dwellings for government taxes and charges. Brisbane is also influenced by higher infrastructure charges for greenfield dwellings than for infill dwellings which results in little difference between government taxes and charges for Brisbane greenfield and infill dwellings.
In Adelaide, the limited differential between infill and greenfield dwelling costs for government taxes and charges (2%) is principally due to higher land tax costs for greenfield dwellings. This is a result of higher land costs for greenfield dwellings over infill dwellings.
Sydney is the only city where government taxes and charges are more expensive for greenfield dwellings than infill dwellings. This is a result of higher infrastructure charges for greenfield dwellings and higher stamp duty due to the higher land cost of the greenfield dwellings over the infill dwellings.
In 2010 it was considerably cheaper to construct greenfield dwellings than infill dwellings across all the major cities. It was around 24% to 34% cheaper to construction a three bedroom, single storey detached greenfield house compared to a two bedroom, unit in a multi-storey (5 levels or greater) infill development. The higher construction cost for infill development is due to increased costs in safety, union requirements, basement car parking, lifts, excavation, and foundations.
In 2010 it was broadly more profitable to undertake infill dwelling development than greenfield dwelling development. In Australia’s three largest cities developer profit for infill development has yielded higher returns than that for greenfield development – Sydney (9.4% of total cost to purchaser compared to 3.0%), Melbourne (14% compared to 9%), and Brisbane (14% compared to 9%). In Sydney and Melbourne higher developer profit for infill has been a result of the lower land costs for infill dwellings compared to greenfield. A reduction in developer profit for Greenfield dwellings in Sydney can be attributed to the higher government taxes and charges, and developer costs and interest for greenfield dwellings. While in Brisbane, lower dwelling sale prices for greenfield dwellings compared to infill dwellings has generated a lower developer profit for greenfield.
Perth and Adelaide have seen relatively better developer profit results for greenfield dwellings compared to infill dwellings. For Perth this has been driven by reductions in costs for greenfield dwellings for land, and construction (greater than the reduction for infill dwelling construction costs). Adelaide has seen a reduction in developer profit in gross terms for both infill and greenfield dwelling development as costs have risen faster than dwelling sale prices. However, greenfield dwellings have moved from a position of comparably strong performance to modest performance while infill dwellings have moved from a position of poor performance to an even poorer position.
document.docx
CONCLUSION 35

3.4 REVIEW OF FINDINGS FROM PREVIOUS STUDYIt has been a year since the previous National Dwelling Cost study and as we bring together the analysis for this years study it is worth recalling the findings from the 2009 study.
3.4.1 Infill Dwelling Costs The key findings from the 2009 National Dwelling Cost Study in relation to infill dwellings were:
Construction costs are the most significant component of infill dwelling costs, accounting for in excess of 50% of the total cost. This component has experienced substantial cost increases in recent years as a result of high demand for labour and materials and increasing regulation for sustainability and safety.
Government taxes and charges also represent a significant proportion of the total cost of infill dwellings. Substantial savings could be achieved through the elimination of the GST on new housing, reduction or elimination of stamp duty, and reductions in infrastructure charges in Sydney and Brisbane.
Improvements to improve infill dwelling costs were identified in increasing the supply of sites through streamlined planning legislation for this form of development; and reducing the development timeframe.
3.4.2 Greenfield Dwelling Cost SummaryKey findings for greenfield dwelling costs from the 2009 study were:
Sydney dwellings are much more costly than those of the other four cities, some $200,000 higher. This is principally due to the much higher land costs (three times higher) and the associated government taxes and charges costs (including higher infrastructure charges).
As was the case with infill dwellings, construction costs are the most significant individual cost category (34% to 52%), though proportionally less significant than for infill dwellings. Land (10% to 24%) and government taxes and charges (13% to 21%) are more significant than for infill dwellings.
Examination of dwelling price data and new dwelling approval (NDA) data indicates that dwelling supply issues are placing upward pressure on prices in Sydney and Brisbane while stronger markets in Melbourne and Adelaide have performed better in providing the necessary supply to the market.
Government taxes and charges, specifically the GST, stamp duty, and infrastructure charges are areas for reform that can significantly improve housing affordability
3.4.3 Infill vs Greenfield and Change over Time A key finding of this study is the significantly higher cost of infill dwellings over greenfield dwellings
(13% to 39% with the exception of Sydney where greenfield costs are higher). This is principally a result of higher construction costs for infill dwellings (medium rise two bedroom apartments) and longer development timeframes. Given the strategic planning push towards greater infill development across all major Australian cities, this represents a fundamental inconsistency that must be addressed as part of any strategic housing affordability response.
CONCLUSION36

CONCLUSION
3.4.4 The Focus for Policy ResponsesThere were four areas for the focus of future policy responses:
Construction Costs – While these have been impacted by high demand for resources and labour they have also been significantly impacted by increased government regulation in relation to environmental requirements (sustainability), and safety. Little work has been done in regard to this and a recommendation is made to undertake a detailed study into how dwelling construction costs can be reduced while limiting any reductions in desired environmental and safety outcomes.
Tax Reform – The Australian Government’s Henry Tax Review represents the most detailed and widespread review of Australia’s tax system in many years. Consideration needs to be given to incorporating the elimination of either the GST liability or stamp duty on new dwellings. Infrastructure charges are increasingly becoming a driver of worsening housing affordability. While the user pays approach underpinning this is designed to cover costs of necessary infrastructure this has not assisted the housing affordability position in these jurisdictions. A national review of infrastructure charging approaches is required with a policy response that reduces the impact that these costs are having on housing affordability.
Land Supply – Land supply is an important driver of end housing prices and subsequently housing affordability. The locations that have their residential land supply markets in relative equilibrium (Melbourne and Adelaide) appear to have the best balance between affordability, commerciality, and dwelling supply. Markets with constrained supply such as Sydney have a significant imbalance between affordability and long term supply. This is the responsibility of State and Local Governments, however a number of jurisdictions have been failing in this area for sometime. This is not as easy as just rezoning more land for residential development as this process is excessive in a number of jurisdictions making the end land supply unaffordable for the target markets. In addition, such land requires significant infrastructure of which a number of jurisdictions are unable to currently fund. Australian Government intervention appears warranted in these areas in the form of accelerated planning and approval processes and infrastructure funding.
Development Timeframes – Related to land supply is the issue of excessive development timeframes. Time is money in the residential development process and the ability to reduce development timeframes, principally planning approval timeframes can positively impact housing affordability. Increasing development timeframes are a result of increasing government regulation and pressure for resources, both labour and capital (including infrastructure). It is difficult to see how development approval timeframes can be accelerated without compromising recent regulatory goals, specifically in relation to environmental sustainability objectives. There are, however, likely to be opportunities to accelerate developments that voluntarily meet affordability and environmental sustainability objectives. Incentives, in the form of accelerated approval processes, where developments demonstrate the ability to achieve desired outcomes in these areas should be implemented across all jurisdictions.
document.docx
CONCLUSION 37

4 ConclusionThis update of the 2009 National Dwelling Cost Study across Australia’s five major cities provides an opportunity to review progress in relation to dwelling costs and identify areas for further focus or prioritised action. A summary of the key findings for infill and greenfield dwelling costs is presented below as a basis for policy recommendations that follow to identify initiatives to address housing affordability.
4.1 INFILL DWELLING COST SUMMARYInfill dwelling development improved across most of the five major city markets with the exception of Adelaide which saw a further decline in the viability of medium and high rise infill dwelling development. The Melbourne market declined marginally but is still performing relatively well.
Melbourne continues to be the best performing infill dwelling market in Australia both in terms of volume and profitability. This performance is underpinned by low land costs and competitive government taxes and charges, principally low infrastructure charges for this type of development. This is being offset by rising construction costs and sale prices which are starting to squeeze profit margins. It will be interesting to see if Melbourne can retain the market balance it has been able to achieve between supply, demand, and costing over the coming 12 months.
Sydney, Brisbane and Perth achieved notable turnarounds in the costings of their infill dwelling products. In Sydney this has been driven by an increase in sale price and a stable construction cost. Perth has benefited from the same situation though it has also benefited from a reduction in construction costs. Brisbane has benefited from an increase in sale prices and a reduction in land prices. This reflects the potential oversupply of sites (land price) and supply constraints from the detached housing market (benefiting price).
Construction remains the largest cost component of infill dwellings (45%-60%) and a key area to focus reform to improve housing affordability. While most of the other factors appear to respond to market pressures or move with sale price movements, construction costs appear to be less influenced by market changes. While construction costs in Brisbane and Perth declined these were at low rates (3%). Construction costs for medium and high rise infill dwellings are in the order of 50% higher than for greenfield dwellings that are of a larger size. This is a barrier to the provision of affordable inner city dwellings. There are a number of factors that lead to greater construction costs for infill dwellings over greenfield dwellings. These include higher environmental and safety requirements; additional components such as lifts, sprinklers, basements, and fire stairs; and additional labour costs associated with unionisation.
The next most significant component is government taxes and charges (14-16%). As highlighted previously, GST, stamp duty and infrastructure charges are the principal components here. Little progress appears to have been achieved across most jurisdictions in regard to addressing the big issues of tax reform. GST and stamp duty remain a double cost blow to new dwellings in an industry which has affordability issues.
Price pressure on land appears to have reduced somewhat with Brisbane experiencing a fall and most of the other cities remaining relatively stable. Perth is the exception here and this may be the result of a shortage of appropriate sites and the improving market.
4.2 GREENFIELD DWELLING COST SUMMARYGreenfield dwelling markets across the five major cities have varied over 2010. Sydney has experienced a decline as the market has responded to price point pressures. Costs have not fallen in line with prices and subsequently profit margins have fallen. Land costs have come back in line with dwelling prices. Overall affordability in this market has improved but will not be sustainable unless other costs fall in line with prices.
CONCLUSION38

CONCLUSION
The Melbourne greenfield market has remained relatively strong over the year showing an increase in pricing and associated increases in costs. Developer margins have been squeezed slightly as costs have risen more than prices and this may reflect a downturn in the market going forward. We noted Melbourne’s affordability advantage through its depth of product priced under $450,000 which allows it to maintain high levels of greenfield dwelling development.
The Brisbane greenfield dwelling market has responded to consumer price pressures and reduced greenfield dwelling prices and costs. This has been principally achieved through lower land costs, stable construction costs, and the reduced costs associated with lower sale prices including GST and stamp duty.
The greenfield dwelling market in Perth has turned around in 2010 with increased sale prices, reduced land costs, and reduced construction costs. This has led to a recovery in profit to credible levels and strong dwelling development activity at long term averages.
Construction costs represent the largest component of total costs to purchasers (36% to 53%) though at levels lower than for infill dwellings. Most markets have experienced rises with Perth the only market reflecting less competitive conditions with a $24,000 fall.
Government taxes and charges remain a significant component (17% to 22%) of greenfield dwelling costs through major contributions from GST, stamp duty, and infrastructure charges in Sydney and Brisbane. As is the case with infill dwellings their remains pressure for reform in these areas.
4.3 THE FOCUS FOR POLICY RESPONSESThe findings from this update of the National Dwelling Cost Study of greenfield and infill dwellings across Australia’s five major cities, along with insights from the previous study, highlight four areas of focus for policy responses to improve housing affordability across Australia:
Construction Costs – These remain the single largest component of both infill and greenfield dwelling costs and subsequently reductions in this component can have significant benefits for improved affordability. This year’s study has shown that the construction sector can respond to changes in market demand and supply situations. The Queensland Government has attempted to address this issue through their Building Revival Forum. This forum had a strong focus on demand however policy responses were also identified with relation to costs.
An independent study into the value chain of both infill and greenfield dwelling construction would provide an opportunity to breakdown the elements of this cost component (as this study has done) which would shed light on what the major cost factors in construction are and whether measures can be taken to reduce these costs.
A further initiative to address this cost component is through alternative dwelling materials and construction techniques. Pilot testing of fast track dwelling development for both forms of dwellings in this study have been occurring in different parts of Australia over the past few years. Government incentives could be provided for the mass production of these forms of innovative, more affordable dwellings.
Tax Reform – The Australian Government presented the findings of the Henry Tax Review in 2010. To date the follow up to this review has been limited. New dwelling taxation reform addressing GST and stamp duty may improve housing affordability. Consideration needs to be given to how to restructure these components to improve this situation. We are conscious that as Australia emerges from the global financial crisis in a tight fiscal environment, policies to reduce taxation are unlikely to be appealing.
Initiatives to address increasing infrastructure charges are in the process of being introduced into Queensland following the recommendations from the State Government’s Infrastructure Charges Task
document.docx
CONCLUSION 39

Force. There is debate over the affordability of the recommended charges however they have provided short term certainty for the development industry. Queensland now appears to be ahead of the other states in this regard however this has not been a significant issue in Western Australia or South Australia. It is emerging as an issue in Victoria with respect to areas newly included in the Urban Growth Boundary (Growth Areas Infrastructure Charges). These are likely to be comparable to Brisbane rates in the near future for the higher rated areas.
Sydney is moving back into a high infrastructure charges regime after a couple of years of respite. This is a symptom of a government with significant debt and limited revenue. Unfortunately this is likely to constrain greenfield development going forward. Sydney needs to find a better solution to this approach as it has been down this path before with substantial negative impacts for the development and housing industry.
Land Supply – Land supply is an area where State Governments have taken the most action. In Queensland four major greenfield development areas have been placed under the planning control of the Urban Land Development Authority for fast tracking of development. Sydney’s northern and southern growth corridors are beginning to gain momentum though pricing is still an issue. Perth has placed greater emphasis on understanding its land supply allowing it to focus policy in the right areas. Reductions and the slowing in growth in land values appears to reflect the impact that these policies and initiatives are having. There are lessons to be learned across the different states in terms of policies and initiatives that have improved land supply. Specifically these include:
Accurate monitoring of land supply – Victoria (Urban Development Program)
Single government approval authority for planning – Queensland (ULDA)
Clear planning guidelines – Western Australia (greater code assessment)
Product Innovations – It is clear that the best performing dwelling market has been Melbourne and a key reason for this has been its ability to provide high quantities of dwellings that meet the affordability requirements of its markets. An important driver of this has been the reduction in lot sizes. This has led to lower prices and higher dwelling yields which benefit both pricing and developer margins. Going forward this may also be associated with reductions in dwelling sizes which will provide further costs savings thereby improving housing affordability. This is a key learning for all other markets especially where minimum lot sizes prevent the delivery of lots less than 600m2 or more commonly less than 400m2. Government guidelines can assist with this however it is important that the Government is not too prescriptive in relation to this as the market needs flexibility to meet market requirements and work with development constraints.
A small section of the construction industry is responding to high construction costs through concepts such as modular housing. We recommend greater government incentives including tax dispensation for these types of products.
CONCLUSION40

Appendix A Estate Master Output for Infill Developments
URBISdocument.docx APPENDICES 41

42 APPENDICESURBIS
document.docx
National Housing Supply Council - Residential Dwelling Costs, Infill - Sydney
State NSWRegion MascotDevelopment Type InfillNumber of Dwellings 50
Revenue
Total Sales Revenue $30,000,000 $600,000Less Selling Costs $785,000 $15,700Legal Fees $92,500 $1,850Marketing Fees $92,500 $1,850Sales Comission $600,000 $12,000Net Sale Proceeds $29,215,000 $584,300
Total Revenue (before GST paid) $29,215,000 $584,300Less GST Paid $2,727,273 $54,545Total Revenue (after GST paid) $26,487,727 $529,755
Costs
Land Purchase Costs $4,950,000 $99,000Land Purchase $4,500,000 $90,000GST on Land Purchase $450,000 $9,000
Land Transaction Costs $307,240 $6,145Stamp Duty $257,740 $5,155Due Diligence and Legals $45,000 $900GST on Due Diligence and Legals $4,500 $90
Construction $15,548,610 $310,972Construction Costs $14,135,100 $282,702GST on Subdivision Construction Costs $1,413,510 $28,270
Professional Fees $1,717,326 $34,347Professional Fee $1,263,700 $25,274GST on Professional Fee $126,370 $2,527Development Manager $327,256 $6,545
Statutory Fees $721,938 $14,439Council Application $7,938 $159Infrastructure Charges $714,000 $14,280
Land Holding Costs $242,063 $4,841Land Tax $221,634 $4,433Council Rates $20,429 $409
Finance Charges $25,596 $512Loan 1 Application Fee $14,850 $297Loan 2 Application Fee $10,746 $215
Interest Expense $2,041,898 $40,838Interest on Loan 1 $734,494 $14,690Interest on Loan 2 $1,307,404 $26,148
Total Costs (before GST reclaimed) $25,554,671 $511,093Less GST Reclaimed $1,994,380 $39,888
Total Costs (after GST reclaimed) $23,560,291 $471,206
Net Development Profit $2,927,436 $58,549
Total Cost to End User Dwelling Purchase Price $ $600,000 Stamp Duty $ $22,490 Transfer Fee $ $398 Professional & Other $ $1,500
TOTAL COSTS $ $624,388
URBISdocument.docx APPENDICES 43
National Housing Supply Council - Residential Dwelling Costs, Infill - Melbourne
State VICRegion BrunswickDevelopment Type InfillNumber of Dwellings 50
Revenue
Total Sales Revenue $28,600,000 $572,000Less Selling Costs $1,144,000 $22,880Legal Fees $286,000 $5,720Marketing Fees $286,000 $5,720Sales Comission $572,000 $11,440Net Sale Proceeds $27,456,000 $549,120
Total Revenue (before GST paid) $27,456,000 $549,120Less GST Paid $2,600,000 $52,000Total Revenue (after GST paid) $24,856,000 $497,120
Costs
Land Purchase Costs $1,925,000 $38,500Land Purchase $1,750,000 $35,000GST on Land Purchase $175,000 $3,500
Land Transaction Costs $110,688 $2,214Stamp Duty $96,250 $1,925Due Diligence and Legals $13,125 $263GST on Due Diligence and Legals $1,313 $26
Construction $17,261,475 $345,230Construction Costs $15,692,250 $313,845GST on Subdivision Construction Costs $1,569,225 $31,385
Professional Fees $1,720,186 $34,404Professional Fee $1,247,900 $24,958GST on Professional Fee $124,790 $2,496Development Manager $347,496 $6,950
Statutory Fees $122,305 $2,446Council Application $8,064 $161Infrastructure Charges $87,500 $1,750Council BA Fees $6,655 $133State Government Fees $20,086 $402
Land Holding Costs $312,350 $6,247Land Tax $12,350 $247Council Rates $281,250 $5,625Water and Sewerage $18,750 $375
Finance Charges $10,286 $206Loan 1 Application Fee $578 $12Loan 2 Application Fee $9,708 $194
Interest Expense $1,161,177 $23,224Interest on Loan 1 $228,565 $4,571Interest on Loan 2 $932,612 $18,652
Total Costs (before GST reclaimed) $22,623,467 $452,469Less GST Reclaimed $1,870,328 $37,407
Total Costs (after GST reclaimed) $20,753,139 $415,063
Net Development Profit $4,102,861 $82,057
Total Cost to End User Dwelling Purchase Price $ $572,000 Stamp Duty $ $29,390 Transfer Fee $ $1,352 Professional & Other $ $1,500
TOTAL COSTS $ $604,242

44 APPENDICESURBIS
document.docx
National Housing Supply Council - Residential Dwelling Costs, Infill - Brisbane
State QLDRegion IndooroopillyDevelopment Type InfillNumber of Dwellings 50
Revenue
Total Sales Revenue $27,600,000 $552,000Less Selling Costs $828,000 $16,560Legal Fees $138,000 $2,760Marketing Fees $138,000 $2,760Sales Comission $552,000 $11,040Net Sale Proceeds $26,772,000 $535,440
Total Revenue (before GST paid) $26,772,000 $535,440Less GST Paid $2,509,091 $50,182Total Revenue (after GST paid) $24,262,909 $485,258
Costs
Land Purchase Costs $2,455,695 $49,114Land Purchase $2,232,450 $44,649GST on Land Purchase $223,245 $4,465
Land Transaction Costs $121,296 $2,426Stamp Duty $102,879 $2,058Due Diligence and Legals $16,743 $335GST on Due Diligence and Legals $1,674 $33
Construction $15,541,900 $310,838Construction Costs $14,129,000 $282,580GST on Subdivision Construction Costs $1,412,900 $28,258
Professional Fees $1,420,561 $28,411Professional Fee $1,122,800 $22,456GST on Professional Fee $112,280 $2,246Development Manager $185,481 $3,710
Statutory Fees $781,732 $15,635Council Application $16,540 $331Infrastructure Charges $747,300 $14,946Operational Works Approval Fee $4,312 $86Complianeand Inspection Fee $10,200 $204State Government DERM Title Registration Fee $3,095 $62Community managemnet Endorsement Fee $285 $6
Land Holding Costs $162,540 $3,251Land Tax $64,953 $1,299.06Council Rates $24,579 $491.58Water and Sewerage $73,008 $1,460.16
Finance Charges $9,690 $194Loan 1 Application Fee $737 $15Loan 2 Application Fee $8,953 $179
Interest Expense $1,684,855 $33,697Interest on Loan 1 $385,140 $7,703Interest on Loan 2 $1,299,715 $25,994
Total Costs (before GST reclaimed) $22,178,269 $443,565Less GST Reclaimed $1,750,099 $35,002
Total Costs (after GST reclaimed) $20,428,170 $408,563
Net Development Profit $3,834,739 $76,695
Total Cost to End User Dwelling Purchase Price $ $552,000 Stamp Duty $ $10,690 Transfer Fee $ $1,154 Professional & Other $ $1,500
TOTAL COSTS $ $565,344

URBISdocument.docx APPENDICES 45
National Housing Supply Council - Residential Dwelling Costs, Infill - Perth
State WARegion East PerthDevelopment Type InfillNumber of Dwellings 50
Revenue
Total Sales Revenue $29,250,000 $585,000Less Selling Costs $1,170,000 $23,400Legal Fees $146,250 $2,925Marketing Fees $146,250 $2,925Sales Comission $877,500 $17,550Net Sale Proceeds $28,080,000 $561,600
Total Revenue (before GST paid) $28,080,000 $561,600Less GST Paid $2,659,091 $53,182Total Revenue (after GST paid) $25,420,909 $508,418
Costs
Land Purchase Costs $3,877,940 $77,559Land Purchase $3,525,400 $70,508GST on Land Purchase $352,540 $7,051
Land Transaction Costs $204,558 $4,091Stamp Duty $175,473 $3,509Due Diligence and Legals $26,441 $529GST on Due Diligence and Legals $2,644 $53
Construction $16,331,425 $326,629Construction Costs $14,846,750 $296,935GST on Subdivision Construction Costs $1,484,675 $29,694
Professional Fees $1,254,321 $25,086Professional Fee $958,950 $19,179GST on Professional Fee $95,895 $1,918Development Manager $199,476 $3,990
Statutory Fees $346,597 $6,932Council Application $31,350 $627Building License $51,964 $1,039Strata Title Applciation $3,283 $66Water and Headworks $260,000 $5,200
Land Holding Costs $67,993 $1,360Land Tax $27,676 $553.52Council Rates $23,833 $476.66Water and Sewerage $7,452 $149MRIT $9,032 $181
Finance Charges $10,163 $203Loan 1 Application Fee $1,163 $23Loan 2 Application Fee $9,000 $180
Interest Expense $1,863,689 $37,274Interest on Loan 1 $397,661 $7,953Interest on Loan 2 $1,466,028 $29,321
Total Costs (before GST reclaimed) $23,956,686 $479,134Less GST Reclaimed $1,935,754 $38,715
Total Costs (after GST reclaimed) $22,020,932 $440,419
Net Development Profit $3,399,977 $68,000
Total Cost to End User Dwelling Purchase Price $ $585,000 Stamp Duty $ $21,803 Transfer Fee $ $245 Professional & Other $ $1,500
TOTAL COSTS $ $608,548

46 APPENDICESURBIS
document.docx
National Housing Supply Council - Residential Dwelling Costs, Infill - Adelaide
State VICRegion HindmarshDevelopment Type InfillNumber of Dwellings 50
Revenue
Total Sales Revenue $23,000,000 $460,000Less Selling Costs $920,000 $18,400Legal Fees $230,000 $4,600Marketing Fees $230,000 $4,600Sales Comission $460,000 $9,200Net Sale Proceeds $22,080,000 $441,600
Total Revenue (before GST paid) $22,080,000 $441,600Less GST Paid $2,090,909 $41,818Total Revenue (after GST paid) $19,989,091 $399,782
Costs
Land Purchase Costs $2,750,000 $55,000Land Purchase $2,500,000 $50,000GST on Land Purchase $250,000 $5,000
Land Transaction Costs $151,955 $3,039Stamp Duty $131,330 $2,627Due Diligence and Legals $18,750 $375GST on Due Diligence and Legals $1,875 $38
Construction $15,974,860 $319,497Construction Costs $14,522,600 $290,452GST on Subdivision Construction Costs $1,452,260 $29,045
Professional Fees $1,927,806 $38,556Professional Fee $1,452,250 $29,045GST on Professional Fee $145,225 $2,905Development Manager $330,331 $6,607
Statutory Fees $330,874 $6,617Council Application $18,264 $365Infrastructure Charges $300,000 $6,000Council BA Fees $12,610 $252
Land Holding Costs $210,825 $4,217Land Tax $94,350 $1,887Council Rates $103,125 $2,063Water and Sewerage $13,350 $267
Finance Charges $10,047 $201Loan 1 Application Fee $825 $17Loan 2 Application Fee $9,222 $184
Interest Expense $1,270,082 $25,402Interest on Loan 1 $328,266 $6,565Interest on Loan 2 $941,816 $18,836
Total Costs (before GST reclaimed) $22,626,449 $452,529Less GST Reclaimed $1,849,360 $36,987
Total Costs (after GST reclaimed) $20,777,089 $415,542
Net Development Profit -$787,998 -$15,760
Total Cost to End User Dwelling Purchase Price $ $460,000 Stamp Duty $ $19,330 Transfer Fee $ $2,963 Professional & Other $ $1,500
TOTAL COSTS $ $483,793

Appendix B Estate Master Output for Greenfield Developments
URBISdocument.docx APPENDICES 47

48 APPENDICESURBIS
document.docx
National Housing Supply Council - Residential Dwelling Costs, Greenfield - Sydney
State NSWRegion KellyvilleDevelopment Type GreenfieldNumber of Dwellings 100
Revenue
Total Sales Revenue $57,000,000 $570,000Less Selling Costs $3,015,000 $30,150Legal Fees $165,000 $1,650Marketing Fees $1,140,000 $11,400Sales Comission $1,710,000 $17,100Net Sale Proceeds $53,985,000 $539,850
Total Revenue (before GST paid) $53,985,000 $539,850Less GST Paid $5,181,818 $51,818Total Revenue (after GST paid) $48,803,182 $488,032
Costs
Land Purchase Costs $14,850,000 $148,500Land Purchase $13,500,000 $135,000GST on Land Purchase $1,350,000 $13,500
Land Transaction Costs $876,490 $8,765Stamp Duty $802,240 $8,022Due Diligence and Legals $67,500 $675GST on Due Diligence and Legals $6,750 $68
Construction $23,542,640 $235,426Subdivision Construction Costs $4,274,800 $42,748GST on Subdivision Construction Costs $427,480 $4,275House Construction Costs $17,127,600 $171,276GST on House Construction Costs $1,712,760 $17,128
Professional Fees $1,989,624 $19,896Subdivision Fee $277,900 $2,779GST on Subdivision Fee $27,790 $278Professional Fee $1,027,700 $10,277GST on Professional Fee $102,770 $1,028Development Manager $553,464 $5,535
Statutory Fees $4,421,150 $44,212
Council BA Fee $5,450 $55Infrastructure Charges $1,415,700 $14,157S94 Contributions $3,000,000 $30,000
Land Holding Costs $544,054 $5,441Land Tax $505,554 $5,056Council Rates $38,500 $385
Finance Charges $65,848 $658Loan 1 Application Fee $44,550 $446Loan 2 Application Fee $21,298 $213
Interest Expense $4,365,041 $43,650Interest on Loan 1 $2,201,327 $22,013Interest on Loan 2 $2,163,714 $21,637
Total Costs (before GST reclaimed) $50,654,847 $506,548Less GST Reclaimed $3,627,550 $36,276
Total Costs (after GST reclaimed) $47,027,297 $470,273
Net Development Profit $1,775,885 $17,759
Total Cost to End User Dwelling Purchase Price $ $570,000 Stamp Duty $ $21,140 Transfer Fee $ $338 Professional & Other $ $3,000
TOTAL COSTS $ $594,478

URBISdocument.docx APPENDICES 49
National Housing Supply Council - Residential Dwelling Costs, Greenfield - Melbourne
State VICRegion WollertDevelopment Type GreenfieldNumber of Dwellings 100
Revenue
Total Sales Revenue $45,000,000 $450,000Less Selling Costs $2,250,000 $22,500Legal Fees $450,000 $4,500Marketing Fees $450,000 $4,500Sales Comission $1,350,000 $13,500Net Sale Proceeds $42,750,000 $427,500
Total Revenue (before GST paid) $42,750,000 $427,500Less GST Paid $4,090,909 $40,909Total Revenue (after GST paid) $38,659,091 $386,591
Costs
Land Purchase Costs $6,050,000 $60,500Land Purchase $5,500,000 $55,000GST on Land Purchase $550,000 $5,500
Land Transaction Costs $332,750 $3,328Stamp Duty $302,500 $3,025Due Diligence and Legals $27,500 $275GST on Due Diligence and Legals $2,750 $28
Construction $24,357,300 $243,573Subdivision Construction Costs $4,565,700 $45,657GST on Subdivision Construction Costs $456,570 $4,566House Construction Costs $17,577,300 $175,773GST on House Construction Costs $1,757,730 $17,577
Professional Fees $2,119,761 $21,198Subdivision Fee $410,900 $4,109GST on Subdivision Fee $41,090 $411Professional Fee $1,054,600 $10,546GST on Professional Fee $105,460 $1,055Development Manager $507,711 $5,077
Statutory Fees $1,168,362 $11,684Council Application $8,064 $81Council BA Fee $31,955 $320Infrastructure Charges $1,100,000 $11,000State Government Fee $28,343 $283
Land Holding Costs $608,688 $6,087Land Tax $141,188 $1,412Council Rates $403,750 $4,038Water and Sewerage $63,750 $638
Finance Charges $17,677 $177Loan 1 Application Fee $1,815 $18Loan 2 Application Fee $15,862 $159
Interest Expense $2,559,689 $25,597Interest on Loan 1 $869,903 $8,699Interest on Loan 2 $1,689,786 $16,898
Total Costs (before GST reclaimed) $37,214,227 $372,142Less GST Reclaimed $2,913,600 $29,136
Total Costs (after GST reclaimed) $34,300,627 $343,006
Net Development Profit $4,358,464 $43,585
Total Cost to End User Dwelling Purchase Price $ $450,000 Stamp Duty $ $18,970 Transfer Fee $ $1,229 Professional & Other $ $1,500
TOTAL COSTS $ $471,699

50 APPENDICESURBIS
document.docx
National Housing Supply Council - Residential Dwelling Costs, Greenfield - Brisbane
State QLDRegion Redbank Plains/SpringfieldDevelopment Type GreenfieldNumber of Dwellings 100
Revenue
Total Sales Revenue $37,600,000 $376,000Less Selling Costs $1,504,000 $15,040Legal Fees $188,000 $1,880Marketing Fees $188,000 $1,880Sales Comission $1,128,000 $11,280Net Sale Proceeds $36,096,000 $360,960
Total Revenue (before GST paid) $36,096,000 $360,960Less GST Paid $3,418,182 $34,182Total Revenue (after GST paid) $32,677,818 $326,778
Costs
Land Purchase Costs $2,750,000 $27,500Land Purchase $2,500,000 $25,000GST on Land Purchase $250,000 $2,500
Land Transaction Costs $130,675 $1,307Stamp Duty $116,925 $1,169Due Diligence and Legals $12,500 $125GST on Due Diligence and Legals $1,250 $13
Construction $22,196,790 $221,968Subdivision Construction Costs $4,127,500 $41,275GST on Subdivision Construction Costs $412,750 $4,128House Construction Costs $16,051,400 $160,514GST on House Construction Costs $1,605,140 $16,051
Professional Fees $1,559,350 $15,594Subdivision Fee $371,400 $3,714GST on Subdivision Fee $37,140 $371Professional Fee $802,600 $8,026GST on Professional Fee $80,260 $803Development Manager $267,950 $2,680
Statutory Fees $2,696,966 $26,970Council Application $54,000 $540Infrastructure Charges $2,598,500 $25,985Operational Works Approval Fee $7,150 $72Council Plan Endorsement Fee $29,500 $295State Government DERM Title Registration Fee $7,816 $78
Land Holding Costs $115,713 $1,157Land Tax $73,750 $738Council Rates $41,274 $413Water and Sewerage $689 $7
Finance Charges $14,356 $144Loan 1 Application Fee $825 $8Loan 2 Application Fee $13,531 $135
Interest Expense $2,163,231 $21,632Interest on Loan 1 $407,676 $4,077Interest on Loan 2 $1,755,555 $17,556
Total Costs (before GST reclaimed) $31,627,081 $316,271Less GST Reclaimed $2,386,540 $23,865
Total Costs (after GST reclaimed) $29,240,541 $292,405
Net Development Profit $3,437,277 $34,373
Total Cost to End User Dwelling Purchase Price $ $376,000 Stamp Duty $ $4,410 Transfer Fee $ $668 Professional & Other $ $1,500
TOTAL COSTS $ $382,578

URBISdocument.docx APPENDICES 51
National Housing Supply Council - Residential Dwelling Costs, Greenfield - Perth
State WARegion WellardDevelopment Type GreenfieldNumber of Dwellings 100
Revenue
Total Sales Revenue $40,233,300 $402,333Less Selling Costs $1,609,333 $16,093Legal Fees $201,167 $2,012Marketing Fees $201,167 $2,012Sales Comission $1,206,999 $12,070Net Sale Proceeds $38,623,967 $386,240
Total Revenue (before GST paid) $38,623,967 $386,240Less GST Paid $3,657,573 $36,576Total Revenue (after GST paid) $34,966,394 $349,664
Costs
Land Purchase Costs $4,222,301 $42,223Land Purchase $3,838,455 $38,385GST on Land Purchase $383,846 $3,838
Land Transaction Costs $210,788 $2,108Stamp Duty $191,595 $1,916Due Diligence and Legals $17,448 $174GST on Due Diligence and Legals $1,745 $17
Construction $21,541,400 $215,414Subdivision Construction Costs $3,818,727 $38,187GST on Subdivision Construction Costs $381,873 $3,819House Construction Costs $15,764,364 $157,644GST on House Construction Costs $1,576,436 $15,764
Professional Fees $1,690,582 $16,906Subdivision Fee $343,727 $3,437GST on Subdivision Fee $34,373 $344Professional Fee $945,818 $9,458GST on Professional Fee $94,582 $946Development Manager $272,082 $2,721
Statutory Fees $2,210,310 $22,103
Building License $75,395 $754Council Application $31,350 $314Subdivsion Fees $3,565 $36Infrastructure Charges $1,580,000 $15,800Water and Sewerage Headworks $520,000 $5,200
Land Holding Costs $77,779 $778Land Tax $41,280 $413Metropolitan Regional Improvement Tax $8,618 $86Council Rates $21,205 $212Water and Sewerage $6,676 $67
Finance Charges $15,007 $150Loan 1 Application Fee $1,267 $13Loan 2 Application Fee $13,740 $137
Interest Expense $1,980,820 $19,808Interest on Loan 1 $456,467 $4,565Interest on Loan 2 $1,524,353 $15,244
Total Costs (before GST reclaimed) $31,948,986 $319,490Less GST Reclaimed $2,472,854 $24,729
Total Costs (after GST reclaimed) $29,476,132 $294,761
Net Development Profit $5,490,262 $54,903
Total Cost to End User Dwelling Purchase Price $ $402,333 Stamp Duty $ $13,129 Transfer Fee $ $225 Professional & Other $ $1,500
TOTAL COSTS $ $417,187

52 APPENDICESURBIS
document.docx
National Housing Supply Council - Residential Dwelling Costs, Greenfield - Adelaide
State SARegion SalisburyDevelopment Type GreenfieldNumber of Dwellings 100
Revenue
Total Sales Revenue $41,500,000 $415,000Less Selling Costs $2,075,000 $20,750Legal Fees $415,000 $4,150Marketing Fees $415,000 $4,150Sales Comission $1,245,000 $12,450Net Sale Proceeds $39,425,000 $394,250
Total Revenue (before GST paid) $39,425,000 $394,250Less GST Paid $3,772,727 $37,727Total Revenue (after GST paid) $35,652,273 $356,523
Costs
Land Purchase Costs $6,050,000 $60,500Land Purchase $5,500,000 $55,000GST on Land Purchase $550,000 $5,500
Land Transaction Costs $326,580 $3,266Stamp Duty $296,330 $2,963Due Diligence and Legals $27,500 $275GST on Due Diligence and Legals $2,750 $28
Construction $24,247,960 $242,480Subdivision Construction Costs $4,324,900 $43,249GST on Subdivision Construction Costs $432,490 $4,325House Construction Costs $17,718,700 $177,187GST on House Construction Costs $1,771,870 $17,719
Professional Fees $1,754,576 $17,546Subdivision Fee $259,500 $2,595GST on Subdivision Fee $25,950 $260Professional Fee $886,000 $8,860GST on Professional Fee $88,600 $886Development Manager $494,526 $4,945
Statutory Fees $489,276 $4,893Council Application $27,666 $277Council BA Fee $61,610 $616Infrastructure Charges $400,000 $4,000
Land Holding Costs $1,047,903 $10,479Land Tax $339,938 $3,399Council Rates $403,750 $4,038Water and Sewerage $304,215 $3,042
Finance Charges $17,337 $173Loan 1 Application Fee $1,815 $18Loan 2 Application Fee $15,522 $155
Interest Expense $2,530,656 $25,307Interest on Loan 1 $883,180 $8,832Interest on Loan 2 $1,647,476 $16,475
Total Costs (before GST reclaimed) $36,464,288 $364,643Less GST Reclaimed $2,871,660 $28,717
Total Costs (after GST reclaimed) $33,592,628 $335,926
Net Development Profit $2,059,645 $20,596
Total Cost to End User Dwelling Purchase Price $ $415,000 Stamp Duty $ $17,080 Transfer Fee $ $2,662 Professional & Other $ $1,500
TOTAL COSTS $ $436,242

Appendix C Construction and Professional Costs
URBISdocument.docx APPENDICES 53

54 APPENDICESURBIS
document.docx
Rider Levett Bucknall - construction & professional feesNational Dwelling Cost Study
Sydney Melbourne Brisbane Perth Adelaide$ $ $ $ $
SubdivisionConstruction Cost Per Lot $41,275 $42,748 $45,657 $43,249 $42,006Professional Fee Per Lot $3,714 $2,779 $4,109 $2,595 $3,781
Total Per Lot $44,989 $45,527 $49,766 $45,844 $45,787
Standard Single Level 3 Bed House (162 sq.m)Construction Cost Per House $160,514 $171,276 $175,773 $177,187 $173,408Professional Fee Per House $8,026 $10,277 $10,546 $8,860 $10,404
Total Per House $168,540 $181,553 $186,319 $186,047 $183,812
Infill Unit Development - 2 bed unit (99 sq.m)Construction Cost Per Unit $282,580 $282,702 $313,845 $290,452 $296,935Professional Fee Per Unit $22,456 $25,274 $24,958 $29,045 $19,179
Total Per Unit $305,036 $307,976 $338,803 $319,497 $316,114
Source : Rider Levett Bucknall 2010

Appendix D References
URBISdocument.docx APPENDICES 55

Australian Government, National Housing Supply Council, 2008, State of Supply Report
Australian Government, Productivity Commission, 2004, First Home Ownership Productivity Commission Inquiry Report
Australian Housing and Urban Research Institute 2008, Planning, government charges and the costs of land and housing, Sydney, AHURI
Australian Housing and Urban Research Institute, 2009, Counting the costs; planning requirements, infrastructure contributions and residential development in Australia, Sydney, AHURI
Comsec, State of the States, April 2011
Queensland Government, Infrastructure Charges Taskforce Final Report-Recommended reform of local government development infrastructure charging arrangements, March 2011
RP Data – Rismark Hedonic Home Value Index, January 2011
The Housing Industry Association – Commonwealth Bank Housing Affordability Index, 2011
The Real Estate Institute of Australia (REIA), Deposit Power Housing Affordability Report, 2011
The Residential Development Council, 2006, Residential Development Cost Benchmarking Study
56 APPENDICESURBIS
document.docx
SydneyLevel 21, 321 Kent StreetSydney, NSW 2000t +02 8233 9900f +02 8233 9966
BrisbaneLevel 12, 120 Edward StreetBrisbane, QLD 4000t +07 3007 3800f +07 3007 3811
MelbourneLevel 12, 120 Collins StreetMelbourne, VIC 3000t +03 8663 4888f +03 8663 4999
PerthLevel 1, 55 St Georges TerracePerth, WA 6000t +08 9346 0500f +08 9321 7790
Australia • Asia • Middle Eastw urbis.com.au e [email protected]