Embed Size (px)
Citation preview

www.parliament.uk/commons-library | intranet.parliament.uk/commons-library | [email protected] | @commonslibrary
BRIEFING PAPER
Number SN06994, 2 March 2016
NHS Wales Statistics By Alex Bate, Carl Baker
Inside: 1. The NHS in Wales 2. Accident & Emergency 3. Ambulance Performance 4. Hospital Activity 5. Referral to Treatment Waiting
Times 6. Waiting Times for Diagnostic
Tests 7. Cancer Waiting Times 8. Workforce 9. Delayed Transfers of Care 10. Bed Occupancy 11. NHS Wales Expenditure

Number SN06994, 2 March 2016 2
Contents Summary 3
1. The NHS in Wales 4
2. Accident & Emergency 6
3. Ambulance Performance 8
4. Hospital Activity 9
5. Referral to Treatment Waiting Times 10
6. Waiting Times for Diagnostic Tests 13
7. Cancer Waiting Times 15
8. Workforce 16
9. Delayed Transfers of Care 17
10. Bed Occupancy 18
11. NHS Wales Expenditure 19
Cover page image copyright: Ambiwlans what? By Mike Sarahan. Licensed under CC BY-NC-SA 2.0 / image cropped.

3 NHS Wales Statistics
Summary Health is a devolved policy area in Wales, and the Welsh NHS differs in many regards from the NHS in other parts of the UK, in terms of structure, policy and performance. This briefing paper looks at statistics, key trends, and, where possible, comparison with other parts of the UK, in the following areas of the NHS in Wales:
Key statistics:
Accident & Emergency The NHS in Wales has a target that 95% of patients should spend less than four hours in A&E from arrival to admission, transfer or discharge. For 2015, 79.4% of patients waited under four hours. Ambulance Performance The target that 65% of red calls should have an ambulance on the scene within 8 minutes has been met for each month since the new classification system was introduced in October 2015. Hospital Activity The number of consultant episodes involving admission to hospital has risen by 8% since 2005/06, whilst overall population has grown by 4% over the same period. Referral to Treatment Waiting Times In December 2015, 83.5% of patients referred to treatment had been waiting for less than 26 weeks. The 95% target for this measure has not been met since August 2010. Diagnostic Waiting Times A higher proportion of Welsh patients than English patients wait more than 8 weeks for selected diagnostic tests such as MRI, CT scans and non-obstetric ultrasounds. Cancer Waiting Times NHS Wales’ cancer waiting target states that 95% of patients diagnosed with cancer via the urgent route should start treatment within 62 days. The highest performing Local Health Board for the quarter ending December 2015 was Aneurin Bevan (South East Wales), with a score of 92.3%. Workforce In terms of number of GPs per head of population, Wales has a similar number to England and Northern Ireland, but fewer than Scotland. Delayed Transfers of Care Total delayed transfers fell by 6% in 2015 compared to the year before, but delayed transfers caused due to issues with healthcare arrangements rose by 60% over the same period. Bed Occupancy NHS bed occupancy has risen steadily over the past few decades, and was recorded at 86.7% for 2014/15. Expenditure Health expenditure per head in Wales for 2013/14 was the lowest of the four UK nations at £1,992, although England was only slightly higher at £1,994 per head. Health expenditure per head in Wales has fallen by 6% in real terms since 2009/10.

Number SN06994, 2 March 2016 4
1. The NHS in Wales Responsibility for the NHS in Wales has been devolved to the Welsh Government since 1999. A key difference between NHS Wales and NHS England is the absence of the ‘purchaser-provider split’ – in Wales, Local Health Boards (LHBs) are responsible for both funding and provision of NHS services.
In some cases, meaningful statistical comparisons between NHS Wales and NHS England are not possible because of differences in targets, definitions and data collection. Even where comparisons are possible, it is important to bear in mind that there are other differences between the two health systems.
One particularly important difference is the populations they serve. On average, the Welsh population is more elderly, has worse health and has higher levels of deprivation than the English population. This has clear implications for the health system, and is why the Nuffield Trust’s analysis of the Welsh NHS uses the North East of England, rather than England as a whole, as a comparator.
The Nuffield Trust’s analysis also points to significant differences in policy and investment priorities in England and Wales:
Policy priorities. The devolved government in Wales has used its powers to set different priorities and a different tone from its London counterpart. It has emphasised prevention and public health more than England. Meanwhile, it came later to introducing goals on waiting times, and over the last decade it did not adopt the emphasis of the English NHS on enforcing these through “targets and terror”, as the English performance management regime has become known.
Investment decisions. Difficult decisions have been required since 2010 and the start of austerity. Different approaches have been adopted. England (and Scotland) have protected NHS spending which has seen some small real terms growth over the last four years. Not so in Wales, where health spending has been cut in real terms by 4.3 per cent between 2009/10 and 2012/13, although there have now been further cash injections in 2014/15 and planned for 2015/16 to reverse this trend.
On the other hand, England has cut government grants to local authorities, resulting in a 16% reduction in funding for social care for the over 65s – a cause of some anxiety. In Wales, local authority spending has held up, although this is now planned to change. Wales has chosen to prioritise its spending differently within the health sector, adopting policies like free prescriptions and car parking.1
Additional statistics to those presented here can be found on the Welsh Government website2 and the dedicated statistics portal.3
1 Nuffield Trust, The challenge of change in the NHS in Wales, 30 January 2015 2 Welsh Government, Health Statistics Wales 3 StatsWales, Health and social care

5 NHS Wales Statistics
Figure 1: Map of NHS Local Health Boards in Wales
The Local Health Boards comprise the following local authority areas:
Betsi Cadwaladr University Health Board: Gwynedd, Isle of Anglesey, Conwy, Flintshire, Wrexham, Denbighshire
Powys Teaching Health Board: Powys
Hywel Dda Health Board: Ceredigion, Carmarthenshire, Pembrokeshire
Abertawe Bro Morgannwg University Health Board: Swansea, Neath Port Talbot, Bridgend
Cwm Taf Health Board: Rhondda Cynon Taf, Merthyr Tydfil
Aneurin Bevan Health Board: Caerphilly, Blaenau Gwent, Torfaen, Monmouthshire, Newport
Cardiff & Vale University Health Board: Cardiff, Vale of Glamorgan

Number SN06994, 2 March 2016 6
2. Accident & Emergency Attendance at A&E departments in Wales has not changed significantly in recent years. In 2015 there were 981,000 attendances at Welsh A&E departments, compared to 982,000 in 2010. Attendances at major departments account for around four-fifths of all trips to A&E – a higher proportion than in England, where the figure is around two-thirds.4 The distribution between major and minor departments has not changed substantially in recent years, although there was a slight fall in attendance at minor departments between 2006 and 2012, as Chart 1 shows.
Chart 1: Monthly A&E attendance in Wales, three-month rolling average
Source: StatsWales, Health and Social Care
As in England, the NHS in Wales has a target that 95% of patients should spend less than four hours in A&E from arrival to admission, transfer or discharge. However, the proportion of A&E patients spending four hours or more in emergency facilities is higher in Wales than in England. In 2015, 21% of patients at major departments in Wales spent over four hours in A&E – around double the percentage recorded by major departments in England.
Chart 2 illustrates this effect, and also shows that there is a close relationship between peaks and troughs in performance for England and Wales. It also shows that waiting times in Wales have followed the same rising trajectory as those in England since May 2013.
4 Major departments are typically those with a 24-hour consultant-led service dealing
with serious and life-threatening injuries, whereas minor departments (e.g. minor injury units) may not be open 24 hours, and typically specialise in dealing with less serious injuries and conditions.

7 NHS Wales Statistics
Chart 2: A&E waiting times Percentage of patients waiting for over four hours, with comparison to England
Source: StatsWales, Health and Social Care
Attendance and performance at A&E departments varies across Wales. Table A shows performance at major Welsh hospitals in 2015. The best performing hospital, Bronglais General Hospital in Aberystwyth, had equivalent performance on this measure to East Cheshire NHS Trust in England, which was ranked in the lowest quarter of English NHS providers.
Four hospitals, Morriston Hospital, Wrexham Maelor Hospital, Ysbyty Glan Clywd and Princess of Wales Hospital, had a lower performance than the lowest-performing English provider (Hull And East Yorkshire Hospitals NHS Trust) in 2015.
Table A: Major hospital A&E attendance and performance, 2015
Hospital Location
University Hospital Of Wales Cardiff 125,053 17.8%Morriston Hospital Swansea 79,812 38.4%Royal Gwent Hospital Newport 79,228 18.1%Wrexham Maelor Hospital Wrexham 64,433 30.0%The Royal Glamorgan Hospital Llantrisant 60,476 12.4%Ysbyty Glan Clwyd Rhyl 55,876 26.2%Prince Charles Hospital Merthyr Tydfil 54,811 12.6%Princess Of Wales Hospital Bridgend 50,419 24.2%Ysbyty Gwynedd Bangor 50,009 16.5%Nevill Hall Hospital Abergavenny 44,050 10.4%Glangwili General Hospital Carmarthen 38,731 18.3%Withybush General Hospital Haverfordwest 38,499 20.8%Bronglais General Hospital Aberystwyth 26,110 8.6%
AttendancePatients spending more than
4 hrs in A&E

Number SN06994, 2 March 2016 8
3. Ambulance Performance In October 2015, ambulance call categories were changed to a colour-coded system from red (life-threatening), through amber, to green (non-urgent). This is a change from the Category A coding used previously (and still used in England), and as a result, data is not comparable to that from prior to October 2015.
The performance target for ambulance quality in Wales is that 65% of red calls should have an ambulance at the scene within eight minutes. This target has been met in each of the three months from October 2015.
Chart 3: Cumulative percentage of ambulances arriving at scene, one-minute intervals Red calls only, December 2015
Chart 3 details performance from December 2015, showing the cumulative percentage of red calls which received an ambulance at the scene within a given number of minutes. 65% of red calls had an emergency response on the scene within 7 minutes, meeting the 8 minute national target.
Table B (below) shows the usage and performance of ambulances across Wales from October to December 2015. The table shows the number of red calls resulting in an ambulance arriving at the scene and the percentage of these ambulances which arrived within 8 minutes.
The 65% target for ambulances arriving within eight minutes was met in all but two Local Health Boards, Powys and Hywel Dda.
Table B: Ambulance performance, Oct-Dec 2015, by LHB
Source: StatsWales, Health and Social Care
Local Health Board
WALES 70.6%
Betsi Cadwaladr 72.6%Powys 64.6%Hywel Dda 61.6%Abertawe Bro Morgannwg 72.8%Cwm Taf 70.0%Aneurin Bevan 69.9%Cardiff & Vale 73.7%
703402694705
Category A Calls resulting in an
ambulance arriving at the scene
% of which with ambulance arriving within 8 minutes
3,857
878122353

9 NHS Wales Statistics
4. Hospital Activity The number of finished consultant episodes (FCEs – spells spent by a patient under the care of a particular consultant) in Welsh hospitals has risen by 14% since 2005/06. The number of episodes involving admission to hospital has risen by 8%. Over this time period the population of Wales grew by 4%.
Over four-fifths of all episodes in 2014/15 involved admission to hospital. 39% came after an emergency incident, while 32% came after the patient had been on a waiting list.
Table C shows variation in the number of episodes between LHBs. The highest population-adjusted rate of episodes was in Aneurin Bevan LHB, at 23% above the rate for Wales. The lowest rate was in Powys.
Table C: Finished Consultant Episodes by Local Health Board of Residence, 2014/15
Source: NHS Wales Informatics Services, PEDW Data
The mean and median waiting times for a consultant episode have both fallen since 2005/06. The median waiting time now stands at 45 days (down from 48), while the mean waiting time is 95 days (down from 100). The mean length of a stay is 7 days, and the median length is two days. The total number of bed days has fallen by 15% since 2005/06. The mean age of a patient in a consultant episode is 53.3 (up 1.3 years since 2005/06), with 26% of all patients being over 75.
1.4% of all finished episodes involved non-Welsh residents. This is unchanged from 2013/14. The mean waiting time for these patients was 10 days higher than the average. They were, on average, 4.6 years younger than Welsh resident FCEs, at 48.7 years.
In addition to those shown above, there were 66,943 FCEs which involved Welsh residents attending non-Welsh providers in 2014/15.
Total FCEs Rate per 1,000 population
Total Episodes 914,983 -
Welsh residents 902,080 292Betsi Cadwaladr 179,075 258Hywel Dda 115,003 299Abertawe Bro Morgannwg 163,892 313Cardiff and Vale 120,140 249Cwm Taf 95,502 323Aneurin Bevan 209,006 360Powys 19,462 147Non-Welsh resident 12,903 -

Number SN06994, 2 March 2016 10
5. Referral to Treatment Waiting Times
Datasets for consultant-led referral to treatment (RTT) for England and Wales are not directly comparable, since the targets with respect to which data is collected are not the same in the two countries.
In England, the key target is that 92% of patients waiting should have been waiting for less than 18 weeks from referral (with a ‘zero-tolerance’ to those waiting over 52 weeks). In Wales the targets are that 95% of patients waiting to start treatment must have waited less than 26 weeks from referral to treatment, and 100% of patients not treated within 26 weeks must be treated within 36 weeks.
Charts 4a and 4b show trends in RTT waiting times since 2009. In December 2015, 83.5% of patients waiting for treatment had been waiting for less than 26 weeks. The 95% target has not been met since August 2010.
Also displayed are trends on the second Welsh RTT target – the percentage of patients who waited over 26 weeks that were treated within 36 weeks. In December 2015 this figure was 54.1%. This is below the target that all patients who are not treated within 26 weeks should be treated within 36 weeks. Since 2009, this target has not been met in any month.
Charts 4a and 4b: RTT waiting times summary charts: Performance on target measures
Source: StatsWales, Health and Social Care
Chart 5 shows the increase in the number of patients waiting to start treatment since 2009, compared with the number treated in each month. Comparing the last twelve months of data with the equivalent figures for 2010, the average number of patients waiting has increased by 57% while the average number of patients treated has increased by 29%.
In Wales there are around 5.5 people on the waiting list for each person treated in December. In England, this figure is around 3.
% of patients waiting who have waited under 26 weeks Of patients treated who waited over 26 weeks, % treated within 36 weeks
0%
20%
40%
60%
80%
100%
Oct-09 Oct-10 Oct-11 Oct-12 Oct-13 Oct-14 Oct-150%
20%
40%
60%
80%
100%
Oct-09 Oct-10 Oct-11 Oct-12 Oct-13 Oct-14 Oct-15

11 NHS Wales Statistics
Chart 5: Referral to treatment waiting times: Numbers treated and waiting to start treatment, monthly data
Source: StatsWales, Health and Social Care
The specialisms with the highest percentage of patients waiting for long periods are shown in Table D (below).
Table D: Patients waiting for treatment, by speciality At end of December 2015
Source: StatsWales, Health and Social Care
Comparison to England
Referral to treatment waiting times in Wales are typically longer than in England. Chart 6 shows data from the most recent month for patients treated. Of those treated in December 2015, 91% of those in England had waited for less than 18 weeks, compared with 63% in Wales. 97% of those in England had waited for less than 26 weeks, compared with 76% in Wales.
Percent waiting over 26 weeks Percent waiting over 36 weeksGeneral Pathology 81% Clinical Pharmacology 67%
Clinical Pharmacology 72% Clinical Genetics 40%
Clinical Genetics 60% Ophthalmology 26%
Trauma and Orthopaedic 41% Paediatric Surgery 24%
Ophthalmology 39% Trauma and Orthopaedic 23%
Ear, Nose and Throat 35% Orthodontics 13%
Paediatric Surgery 35% Ear, Nose and Throat 12%
Anaesthetics 34% Neurology 12%
Allied Health Prof. Services 33% Anaesthetics 11%
Neurology 31% Dermatology 11%

Number SN06994, 2 March 2016 12
Chart 6: Patients treated in December 2015, cumulative percentages by weeks waited
Source: StatsWales, Health and Social Care;
NHS England, Consultant-led Referral to Treatment Waiting Times
The Department of Health warns that caution should be taken when comparing English and Welsh RTT data, since differences exist in the measurement rules. However, this unlikely to fully explain the difference in performance shown above.

13 NHS Wales Statistics
6. Waiting Times for Diagnostic Tests
The numbers of patients waiting for diagnostic and therapy services in Wales was 50% higher in December 2015 than in December 2010. However, the number of patients waiting for eight weeks or more is almost three times higher. Table E details the change in waiting lists for diagnostic and therapy services since 2010. Chart 7 illustrates these changes for four major diagnostic tests.
Table E: Waiting times for diagnostic tests and therapy services
Chart 7: Waiting times for selected diagnostics (thousand tests) By grouped weeks waited
Less than 8 weeks
8-14 weeks
14-24 weeks 24+ weeks
Total waiting
Dec-2010 87% 12% 2% 0% 81,926Dec-2011 79% 16% 4% 1% 102,932Dec-2012 74% 18% 6% 2% 114,014Dec-2013 71% 17% 8% 4% 121,607Dec-2014 74% 17% 6% 2% 117,991Dec-2015 75% 17% 6% 2% 122,584

Number SN06994, 2 March 2016 14
Chart 7 shows that between 2012 and 2014, waits of over 8 weeks increased markedly for non-obstetric ultrasounds, MRIs and echo cardiagrams, with these long waits beginning to decrease through 2015.
Diagnostic waiting times in Wales are not strictly comparable to those in England for a number of reasons:
• Measurements of grouped weeks differ: England measures waits of over 6 weeks and over 13 weeks, while Wales measures waits of over 8 weeks, 14 weeks and 24 weeks. This is in accordance with differing targets – England aims for patients to be tested within 6 weeks, while Wales aims for patients to be tested within 8 weeks.
• Welsh statistics measure people still on the waiting list for a diagnostic test at the end of a given month. English statistics measure people tested in a given month.
• Comparisons can only be made between specific tests, since England measures only diagnostic tests and Wales measures diagnostic and therapy services (encompassing, for instance, audiology and dietetics).
Despite this, the available data suggests that diagnostic waiting times for specific tests are, on average, longer in Wales than in England. Table F shows this effect for MRI, CT and non-obstetric ultrasound tests. Over 98% of English patients tested in December 2015 waited for less than 6 weeks for these tests.
In Wales, 23% of patients waiting for non-obstetric ultrasounds as of December 2015 had been waiting for over 8 weeks, along with 15% of those waiting for CT scans and 8% of those waiting for MRIs. However, the MRI and non-obstetric ultrasound figures for Wales have improved on December 2013 figures.
Table F: England and Wales diagnostic performance: selected tests
CT MRINon-
Obs. Ult. MRI CTNon-
Obs. Ult.
Dec-10 96% 94% 93% 98% 99% 99%Dec-11 98% 88% 89% 99% 100% 99%Dec-12 91% 73% 82% 99% 100% 99%Dec-13 91% 61% 64% 99% 99% 99%Dec-14 92% 84% 69% 98% 99% 99%Dec-15 92% 85% 77% 98% 99% 99%
England - Patients tested, % waited less than 6 weeks
Wales - Waiting l ist, % waited less than 8 weeks

15 NHS Wales Statistics
7. Cancer Waiting Times The Welsh targets for cancer waiting times are as follows:
• 95% of patients newly diagnosed with cancer via the Urgent route should start definitive treatment within 62 days
• 98% of patients newly diagnosed with cancer not via the urgent route should start definitive treatment within 31 days.
Patients diagnosed via the urgent route are those referred through primary care, i.e. by a GP. Those diagnosed not via the urgent route are all other patients, e.g. those diagnosed through emergency presentation.
Charts 8 and 9 show performance on these targets. The 95% urgent route target was last met in mid-2008. The highest performing LHB for the quarter ending December 2015 was Aneurin Bevan, with a score of 92.3%, below the 95% target.
The non-urgent route target of 98% was met consistently between 2007 and 2013, but was last met in the quarter ending June 2014. For the quarter ending December 2015, the 98% target was only met in two LHBs, Betsi Cadwaladr and Hywel Dda.
Chart 8: Patients diagnosed via the urgent route, % starting treatment within 62 days
Chart 9: Patients diagnosed NOT via the urgent route, % starting treatment within 31 days
Source: StatsWales, Health and Social Care
Number SN06994, 2 March 2016 16
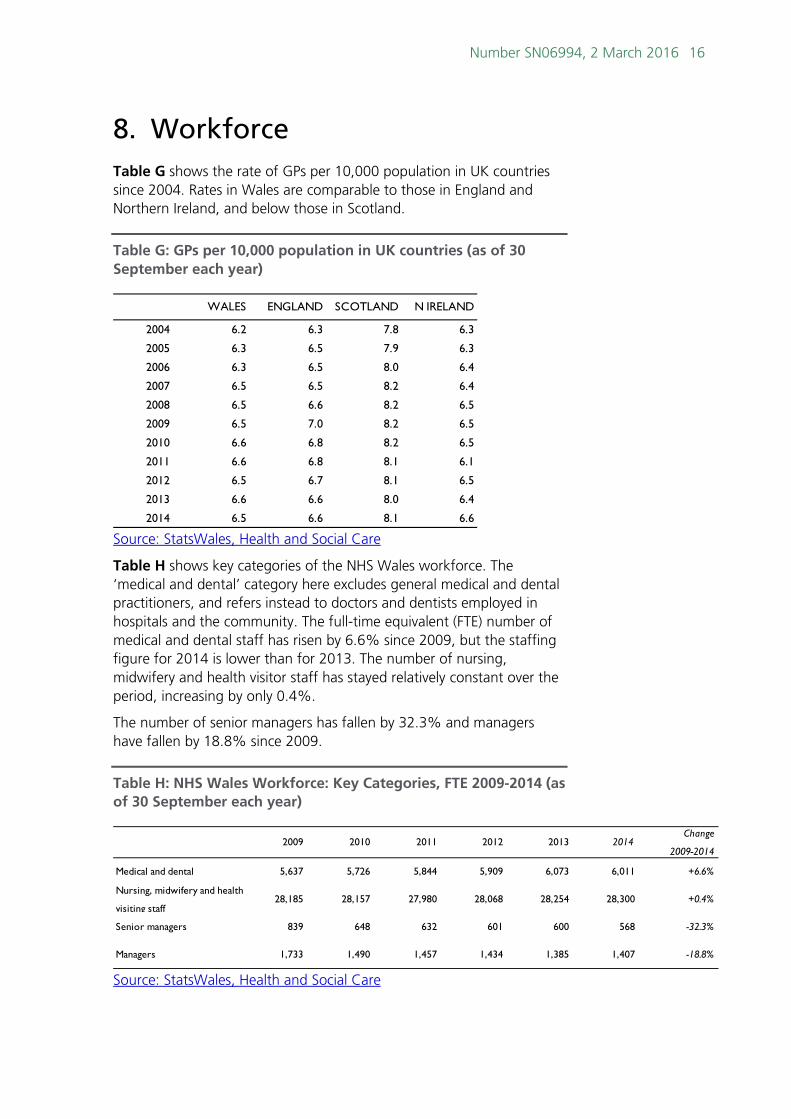
8. Workforce Table G shows the rate of GPs per 10,000 population in UK countries since 2004. Rates in Wales are comparable to those in England and Northern Ireland, and below those in Scotland.
Table G: GPs per 10,000 population in UK countries (as of 30 September each year)
Source: StatsWales, Health and Social Care
Table H shows key categories of the NHS Wales workforce. The ‘medical and dental’ category here excludes general medical and dental practitioners, and refers instead to doctors and dentists employed in hospitals and the community. The full-time equivalent (FTE) number of medical and dental staff has risen by 6.6% since 2009, but the staffing figure for 2014 is lower than for 2013. The number of nursing, midwifery and health visitor staff has stayed relatively constant over the period, increasing by only 0.4%.
The number of senior managers has fallen by 32.3% and managers have fallen by 18.8% since 2009.
Table H: NHS Wales Workforce: Key Categories, FTE 2009-2014 (as of 30 September each year)
Source: StatsWales, Health and Social Care
WALES ENGLAND SCOTLAND N IRELAND
2004 6.2 6.3 7.8 6.3
2005 6.3 6.5 7.9 6.3
2006 6.3 6.5 8.0 6.4
2007 6.5 6.5 8.2 6.4
2008 6.5 6.6 8.2 6.5
2009 6.5 7.0 8.2 6.5
2010 6.6 6.8 8.2 6.5
2011 6.6 6.8 8.1 6.1
2012 6.5 6.7 8.1 6.5
2013 6.6 6.6 8.0 6.4
2014 6.5 6.6 8.1 6.6
2009 2010 2011 2012 2013 2014Change
2009-2014
Medical and dental 5,637 5,726 5,844 5,909 6,073 6,011 +6.6%
Nursing, midwifery and health
visiting staff28,185 28,157 27,980 28,068 28,254 28,300 +0.4%
Senior managers 839 648 632 601 600 568 -32.3%
Managers 1,733 1,490 1,457 1,434 1,385 1,407 -18.8%

17 NHS Wales Statistics
9. Delayed Transfers of Care A delayed transfer of care is where a patient is ready and safe to leave hospital care, but is unable to do so, and remains occupying a hospital bed. Chart 10 shows the number of patients experiencing a delayed transfer on a given day each month
Chart 10: Delayed transfers of care, monthly snapshot
Source: StatsWales, Health and Social Care
Total delayed transfers are at a similar level to those in 2010. However, the number of patients affected did gradually decline until January 2014, when numbers began to rise again. The latest monthly figures for January 2016 are 33% higher than January 2014.
The number of delays in 2015 was 6% lower than the previous year. In terms of causes, the most significant increase has been for reasons of healthcare arrangements, which rose by 60% in 2015 compared with the previous year.
Table I shows delayed transfers of care by LHB since 2010. Over the period, Betsi Cadwaladr has seen delayed transfers increase by 69%, whilst Cwm Taf has reduced delayed transfers by 68%.
Table I: Annual delayed transfers of care by LHB, monthly snapshot data
2010 2011 2012 2013 2014 2015
Wales (All LHBs and Trusts) 6,554 5,672 5,364 5,393 5,256 5,811
Betsi Cadw aladr 891 925 1,118 1,253 1,174 1,509
Pow ys 435 279 288 324 342 298
Hyw el Dda 697 409 299 349 412 410
Abertaw e Bro Morgannw g 1,189 1,154 781 552 554 783
Cw m Taf 1,294 847 665 573 580 409
Aneurin Bevan 826 662 829 1,094 1,125 1,074
Cardiff and Vale 1,212 1,390 1,366 1,233 1,059 1,327

Number SN06994, 2 March 2016 18
10. Bed Occupancy The number of NHS beds in Wales, as in many other countries, have been in gradual decline for many years. The number of average daily available beds in 2014/15 was 25% lower than in 1999/00. This trend should be interpreted in the context of a shift to increased care in the community (i.e. outside of hospitals).
Chart 11 shows the percentage occupancy of NHS beds since 1989/90. Over this period, occupancy has risen by almost 10 percentage points, from 76.8% in 1989/90 to 86.7% in 2014/15.
Chart 11: NHS bed occupancy (%)
General NHS bed occupancy rates are very similar to those in England. In every year from 2010/11 onwards, bed occupancy in England has been within 0.5% of bed occupancy in Wales.
For 2014/15, occupancy in major hospitals ranged from 80.1% at Ysbyty Gwynedd hospital in Bangor, to 90.7% at the Princess of Wales Hospital in Bridgend (see Table J below).
Table J: NHS bed occupancy (%), by major hospital, 2014/15
Source: StatsWales, Health and Social Care;
NHS England, Bed Availablility and Occupancy
Morriston Hospital 86.3%
Princess Of Wales Hospital 90.7%
Nevill Hall Hospital 85.9%
Royal Gw ent Hospital 88.7%
Wrexham Maelor Hospital 84.4%
Ysbyty Glan Clw yd 84.8%
Ysbyty Gw ynedd 80.1%
University Hospital Of Wales 85.8%
Prince Charles Hospital 80.6%
The Royal Glamorgan Hospital 80.5%
Bronglais General Hospital 82.2%
Glangw ili General Hospital 85.2%
Withybush General Hospital 89.7%

19 NHS Wales Statistics
11. NHS Wales Expenditure Chart 12 and Table K show total identifiable expenditure per head on health in Wales, England, Scotland, Northern Ireland, and the UK as a whole. North East England is included for comparison, as the Nuffield Trust research found that this was the closest English region to Wales in terms of population characteristics (see section 1)
In 2009/10, Wales had the second highest health expenditure per head of the four nations, behind Scotland. However, subsequent annual decreases over the following three years meant that by 2013/14 it had the lowest health expenditure per head of the four UK nations.
Chart 12: Expenditure per head on health, UK countries & regions (2013/14 prices)
Table K: Total identifiable expenditure and expenditure per head on health, UK countries
Source: HM Treasury, Public Expenditure Statistical Analyses 2015
2009/10 2010/11 2011/12 2012/13 2013/14 2009/10 2010/11 2011/12 2012/13 2013/14
England 96,117 98,353 99,792 102,468 107,412 England 104,521 103,835 103,744 104,609 107,412Scotland 10,616 10,877 11,056 11,285 11,459 Scotland 11,544 11,483 11,494 11,521 11,459Wales 5,926 6,119 6,075 6,001 6,141 Wales 6,444 6,460 6,316 6,126 6,141Northern Ireland 3,442 3,595 3,638 3,844 3,882 Northern Ireland 3,743 3,795 3,782 3,924 3,882UK 116,100 118,945 120,561 123,597 128,894 UK 126,252 125,575 125,336 126,179 128,894
2009/10 2010/11 2011/12 2012/13 2013/14 2009/10 2010/11 2011/12 2012/13 2013/14
England 1,841 1,868 1,879 1,916 1,994 England 2,002 1,972 1,953 1,956 1,994Scotland 2,029 2,067 2,086 2,124 2,151 Scotland 2,206 2,182 2,169 2,168 2,151Wales 1,950 2,006 1,983 1,952 1,992 Wales 2,121 2,118 2,062 1,993 1,992Northern Ireland 1,919 1,992 2,005 2,108 2,121 Northern Ireland 2,087 2,103 2,084 2,152 2,121UK 1,865 1,895 1,905 1,940 2,011 UK 2,028 2,001 1,980 1,981 2,011
Cash Terms 2013/14 Prices
Total Identifiable Expenditure
(£ million)
Expenditure per Head
(£)

Number SN06994, 2 March 2016 20
Table L (below) shows local health board revenue expenditure with expenditure per head. Spending per head is highest in Cwm Taf LHB at 8% above the Welsh average, and lowest in Cardiff and Vale at 9% below the Welsh average. The figures here do not precisely match the public expenditure data shown above, since this shows total expenditure on health rather than expenditure by local health boards.
Table L: Local health board revenue expenditure, 2013/14
Source: StatsWales, Health and Social Care
Table M shows a detailed breakdown of NHS Wales LHB revenue spending by programme budget category.
Table M: LHB revenue expenditure by category, 2013/14
Expenditure (£million)
Expenditure per head (£)
WALES 5,560 1,804
Betsi Cadw aladr 1,254 1,811
Pow ys Teaching 258 1,945
Hyw el Dda 717 1,867
Abertaw e Bro Morgannw g 941 1,807
Cw m Taf 575 1,950
Aneurin Bevan 1,032 1,782
Cardiff and Vale 784 1,636
Expenditure (£000)
Expenditure per head (£)
Per cent of total
TOTAL 5,560,111 1,804 100
Infectious diseases 74,893 24 1.3Cancers & tumours 380,113 123 6.8Blood disorders 47,083 15 0.8Endocrine, nutritional & metabolic problems 205,464 67 3.7Mental health problems 634,474 206 11.4
Learning disability problems 123,928 40 2.2Neurological system problems 266,829 87 4.8Eye/vision problems 124,020 40 2.2Hearing problems 27,725 9 0.5Circulation problems 431,298 140 7.8
Respiratory problems 363,488 118 6.5Dental problems 182,118 59 3.3Gastro intestinal problems 314,925 102 5.7Skin problems 134,065 43 2.4Musculo skeletal system problems (exc Trauma) 342,629 111 6.2
Trauma & injuries (inc burns) 393,185 128 7.1Genito Urinary system disorders (exc infertility) 277,402 90 5.0Maternity & reproductive health 188,959 61 3.4Neonates 50,076 16 0.9Poisoning 66,580 22 1.2
Healthy individuals (includes Screening) 114,629 37 2.1Social care needs 49,110 16 0.9Other 767,117 249 13.8
Source: StatsWales NHS expenditure by budget category

BRIEFING PAPER Number SN06994, 2 March 2016
The House of Commons Library research service provides MPs and their staff with the impartial briefing and evidence base they need to do their work in scrutinising Government, proposing legislation, and supporting constituents.
As well as providing MPs with a confidential service we publish open briefing papers, which are available on the Parliament website.
Every effort is made to ensure that the information contained in these publically available research briefings is correct at the time of publication. Readers should be aware however that briefings are not necessarily updated or otherwise amended to reflect subsequent changes.
If you have any comments on our briefings please email [email protected]. Authors are available to discuss the content of this briefing only with Members and their staff.
If you have any general questions about the work of the House of Commons you can email [email protected].
Disclaimer - This information is provided to Members of Parliament in support of their parliamentary duties. It is a general briefing only and should not be relied on as a substitute for specific advice. The House of Commons or the author(s) shall not be liable for any errors or omissions, or for any loss or damage of any kind arising from its use, and may remove, vary or amend any information at any time without prior notice.
The House of Commons accepts no responsibility for any references or links to, or the content of, information maintained by third parties. This information is provided subject to the conditions of the Open Parliament Licence.