Embed Size (px)
Citation preview

17-043177-06 Version 1 | Public © Ipsos MORI
1
Version 1| Public
17-043177-06 Version 1 | Public © Ipsos MORI
NHS OXFORDSHIRE CCG
Latest survey results August 2018 publication

17-043177-06 Version 1 | Public © Ipsos MORI
2
Contents
This slide pack provides results for the following topic areas:
Background, introduction and guidance …………………………….……………………………………….. Slide 3
Overall experience of GP practice ………………………………………………………………..…..……….. Slide 8
Local GP services ………………………………………………………………………………………………... Slide 14
Access to online services ………………………………………………………………………………………. Slide 21
Making an appointment …………………………………………………………………………………………. Slide 27
Perceptions of care at patients’ last appointment …………………………………………….……………. Slide 38
Managing health conditions ……………………………………………………………………………............ Slide 42
Satisfaction with general practice appointment times …………………………………………………….. Slide 46
Services when GP practice is closed ……….………………………………………………………………… Slide 50
Statistical reliability ………………………………………………………………………………………………. Slide 55
Want to know more? …………………………………………………………………………………………....... Slide 57
17-043177-06 Version 1 | Public © Ipsos MORI
3
17-043177-06 Version 1 | Public © Ipsos MORI
Background, introduction
and guidance

17-043177-06 Version 1 | Public © Ipsos MORI
4
Background information about the survey
• The GP Patient Survey (GPPS) is an England-wide survey, providing practice-level
data about patients’ experiences of their GP practices.
• Ipsos MORI administers the survey on behalf of NHS England.
• For more information about the survey please refer to the end of this slide pack or visit
https://gp-patient.co.uk/.
• This slide pack presents some of the key results for NHS OXFORDSHIRE CCG.
• The data in this slide pack are based on the August 2018 GPPS publication.
• In NHS OXFORDSHIRE CCG, 20,620 questionnaires were sent out, and 7,649 were
returned completed. This represents a response rate of 37%.
• Prior to 2015 these slide packs presented Area Team averages for each CCG. These
are no longer included following the integration of Area Teams into the four existing
Regional Teams. However, CCGs can still see how their results compare to those of
other local CCGs.
• The questionnaire has been redeveloped for 2018 in response to significant changes to
primary care services as set out in the GP Forward View, and to provide a better
understanding of how local care services are supporting patients to live well, particularly
those with long-term care needs. The questionnaire (and past versions) can be found
here: https://gp-patient.co.uk/surveysandreports.

17-043177-06 Version 1 | Public © Ipsos MORI
5
Introduction
• The GP Patient Survey measures patients’ experiences across a range of topics, including:
- Making appointments
- Perceptions of care at appointments
- Managing health conditions
- Practice opening hours
- Services when GP practices are closed
• The GP Patient Survey provides data at practice level using a consistent methodology, which means it is comparable across organisations.
• The survey has limitations:
- Sample sizes at practice level are relatively small.
- The survey does not include qualitative data which limits the detail provided by the results.
- The data is provided once a year rather than in real time.
• However, given the consistency of the survey across organisations, GPPS can be used as one element of evidence.
• It can be triangulated with other sources of feedback, such as feedback from Patient Participation Groups, local surveys and the Friends and Family Test, to develop a fuller picture of patient journeys.
• This slide pack is intended to assist this triangulation of data. It aims to highlight where there may be a need for further exploration.
• Practices and CCGs can then discuss the findings further and triangulate them with other data – in order to identify potential improvements and highlight best practice.
• The following slide suggests ideas for how the data can be used to improve services.
• Given the extensive changes to the questionnaire in 2018, this pack does not include trends over time.

17-043177-06 Version 1 | Public © Ipsos MORI
6
Guidance on how to use the data
• Comparison of a CCG’s results against
the national average: this allows
benchmarking of the results to identify
whether the CCG is performing well,
poorly, or in line with others. The CCG may
wish to focus on areas where it compares
less favourably.
• Considering questions where there is a
larger range in responses among
practices or CCGs: this highlights areas
in which greater improvements may be
possible, as some CCGs or practices are
performing significantly better than others
nearby. The CCG may wish to focus on
areas with a larger range in the results.
• Comparison of practices’ results within
a CCG: this can identify practices within a
CCG that seem to be over-performing or
under-performing compared with others.
The CCG may wish to work with individual
practices: those that are performing
particularly well may be able to highlight
best practice, while those performing less
well may be able to improve their
performance.
The following suggest ideas for how the data in this slide pack can be used and interpreted to
improve GP services:

17-043177-06 Version 1 | Public © Ipsos MORI
7
Interpreting the results
• The number of participants answering (the
base size) is stated for each question. The
total number of responses is shown at the
bottom of each chart.
• All comparisons are indicative only.
Differences may not be statistically
significant – particularly when comparing
practices due to low numbers of
responses.
• For guidance on statistical reliability, or for
details of where you can get more
information about the survey, please refer to
the end of this slide pack.
• Maps: CCG and practice-level results are
also displayed on maps, with results split
across 5 bands (or ‘quintiles’) in order to
have a fairly even distribution at the national
level of CCGs/practices across each band.
• All data is taken from the latest / August
2018 publication (fieldwork January to
March 2018).
• For further information on using the data
please refer to the end of this slide pack.
* More than 0% but less
than 0.5%
100% Where results do not sum to
100%, or where individual
responses (e.g. fairly good;
very good) do not sum to
combined responses
(e.g. very/fairly good) this is
due to rounding, or cases
where multiple responses
are allowed.
When fewer than 10
patients respond
In cases where fewer than 10
patients have answered a
question, the data have been
suppressed and results will
not appear within the charts.
This is to prevent individuals
and their responses being
identifiable in the data.

17-043177-06 Version 1 | Public © Ipsos MORI
8
17-043177-06 Version 1 | Public © Ipsos MORI
Overall experience of GP practice

17-043177-06 Version 1 | Public © Ipsos MORI
9
84%
4%
Overall experience of GP practice
51%
36%
9% 3%
Very good
Fairly good
Neither good nor poor
Fairly poor
Very poor
Q31. Overall, how would you describe your experience of your GP practice?
Practice range in CCG – % Good Local CCG range – % Good
National
6%
Good
Poor
Lowest
Performing
Highest
Performing
64% 100%
Lowest
Performing
Highest
Performing
78% 89%
%Good = %Very good + %Fairly good
%Poor = %Very poor + %Fairly poor
Base: All those completing a questionnaire: National (746,847); CCG (7,543);
Practice bases range from 26 to 132; CCG bases range from 876 to 7,543
CCG’s results Comparison of results
87%
Good
Poor
CCG

17-043177-06 Version 1 | Public © Ipsos MORI
10
Results range from
to
Overall experience:
how the CCG’s results compare to other local CCGs
Comparisons are indicative only: differences may not be statistically significant
78%
89%
Percentage of patients saying ‘good’
Base: All those completing a questionnaire: CCG bases range from 876 to 7,543 %Good = %Very good + %Fairly good
Q31. Overall, how would you describe your experience of your GP practice?
The CCG represented by this pack is highlighted in red

17-043177-06 Version 1 | Public © Ipsos MORI
11
Overall experience: how the CCG’s practices compare
Percentage of patients saying ‘good’
Base: All those completing a questionnaire: Practice bases range from 26 to 132 %Good = %Very good + %Fairly good
Q31. Overall, how would you describe your experience of your GP practice?
Comparisons are indicative only: differences may not be statistically significant
Results range from
to
64%
100%

17-043177-06 Version 1 | Public © Ipsos MORI
12
Overall experience: how the CCG’s practices compare
Percentage of patients saying ‘good’ CCG Practices National average
Comparisons are indicative only: differences may not be statistically significant, particularly at practice level due to low numbers of responses
Base: All those completing a questionnaire: National (746,847); CCG (7,543);
Practice bases range from 26 to 132
%Good = %Very good + %Fairly good
Q31. Overall, how would you describe your experience of your GP practice?
0%
10%
20%
30%
40%
50%
60%
70%
80%
90%
100%
HO
RS
EF
AIR
SU
RG
ER
Y
DO
NN
ING
TO
N M
ED
ICA
LP
AR
TN
ER
SH
IP
BO
TLE
Y M
ED
ICA
L C
EN
TR
E
ALC
HE
ST
ER
ME
DIC
AL
GR
OU
P
TH
E C
HA
RL
BU
RY
ME
DIC
AL C
EN
TR
E
TH
E K
EY
ME
DIC
AL P
RA
CT
ICE
WE
ST
BA
R S
UR
GE
RY
TH
E L
EY
S H
EA
LT
H C
EN
TR
E
HE
DE
NA
HE
AL
TH
NE
WB
UR
Y S
TR
EE
T P
RA
CT
ICE
MA
LT
HO
US
E S
UR
GE
RY
BA
RT
LE
MA
S S
UR
GE
RY
DID
CO
T H
EA
LT
H C
EN
TR
E P
RA
CT
ICE
CH
IPP
ING
NO
RT
ON
HE
AL
TH
CE
NT
RE
WO
OD
LA
ND
S M
ED
ICA
L C
EN
TR
E
WO
OD
LA
ND
S S
UR
GE
RY
BR
OA
DS
HIR
ES
HE
ALT
H C
EN
TR
E
BA
NB
UR
Y H
EA
LT
H C
EN
TR
E
TE
MP
LE
CO
WL
EY
HE
ALT
H C
EN
TR
E
19
BE
AU
MO
NT
ST
RE
ET
SU
RG
ER
Y
MA
RC
HA
M R
D F
AM
ILY
HE
ALT
HC
EN
TR
E
27
BE
AU
MO
NT
ST
RE
ET
CH
UR
CH
ST
RE
ET
PR
AC
TIC
E
CO
GG
ES
SU
RG
ER
Y
CC
G
WIN
DR
US
H S
UR
GE
RY
MA
NO
R S
UR
GE
RY
ST
. C
LE
ME
NT
'S S
UR
GE
RY
KIN
G E
DW
AR
D S
T M
ED
ICA
LP
RA
CT
ICE
SU
MM
ER
TO
WN
HE
ALT
H C
EN
TR
E
ST
.BA
RT
HO
LO
ME
WS
ME
DIC
AL
CE
NT
RE
TH
E B
ELL
SU
RG
ER
Y
NU
FF
IELD
HE
AL
TH
CE
NT
RE
OA
K T
RE
E H
EA
LT
H C
EN
TR
E
TH
E H
AR
T S
UR
GE
RY
MO
NT
GO
ME
RY
HO
US
E S
UR
GE
RY
SIB
FO
RD
SU
RG
ER
Y
OB
SE
RV
AT
OR
Y M
ED
ICA
L P
RA
CT
ICE
BIC
ES
TE
R H
EA
LT
H C
EN
TR
E
HIG
HT
OW
N S
UR
GE
RY
JE
RIC
HO
HE
AL
TH
CE
NT
RE
WIN
DR
US
H M
ED
ICA
L P
RA
CT
ICE
BA
NB
UR
Y R
OA
D M
ED
ICA
L C
EN
TR
E
HO
LLO
W W
AY
ME
DIC
AL C
EN
TR
E

17-043177-06 Version 1 | Public © Ipsos MORI
13
Overall experience: how the CCG’s practices compare
Percentage of patients saying ‘good’ CCG Practices National average
Comparisons are indicative only: differences may not be statistically significant, particularly at practice level due to low numbers of responses
Base: All those completing a questionnaire: National (746,847); CCG (7,543);
Practice bases range from 26 to 132
%Good = %Very good + %Fairly good
Q31. Overall, how would you describe your experience of your GP practice?
0%
10%
20%
30%
40%
50%
60%
70%
80%
90%
100%
EY
NS
HA
M M
ED
ICA
L G
RO
UP
GO
RIN
G &
WO
OD
CO
TE
ME
DIC
AL
PR
AC
TIC
E
28
BE
AU
MO
NT
ST
RE
ET
BE
RIN
SF
IELD
HE
ALT
H C
EN
TR
E
CR
OP
RE
DY
SU
RG
ER
Y
CH
AL
GR
OV
E &
WA
TL
ING
TO
NS
UR
GE
RIE
S
WH
ITE
HO
RS
E M
ED
ICA
L P
RA
CT
ICE
DE
DD
ING
TO
N H
EA
LT
H C
EN
TR
E
CO
WLE
Y R
OA
D M
ED
ICA
L P
RA
CT
ICE
LO
NG
FU
RL
ON
G M
ED
ICA
L C
EN
TR
E
WA
LL
ING
FO
RD
ME
DIC
AL P
RA
CT
ICE
BU
RF
OR
D S
UR
GE
RY
ISL
IP S
UR
GE
RY
MO
RL
AN
D H
OU
SE
SU
RG
ER
Y
CL
IFT
ON
HA
MP
DE
N S
UR
GE
RY
WO
OD
ST
OC
K S
UR
GE
RY
GO
SF
OR
D H
ILL M
ED
ICA
L C
EN
TR
E
TH
E R
YC
OT
E P
RA
CT
ICE
TH
E A
BIN
GD
ON
SU
RG
ER
Y
BA
MP
TO
N S
UR
GE
RY
LU
TH
ER
ST
RE
ET
ME
DIC
AL P
RA
CT
ICE
SO
UT
H O
XF
OR
D H
EA
LT
H C
EN
TR
E
NE
TT
LE
BE
D S
UR
GE
RY
SO
NN
ING
CO
MM
ON
HE
ALT
H C
TR
BLO
XH
AM
SU
RG
ER
Y
MIL
L S
TR
EA
M S
UR
GE
RY
WY
CH
WO
OD
SU
RG
ER
Y

17-043177-06 Version 1 | Public © Ipsos MORI
14
17-043177-06 Version 1 | Public © Ipsos MORI
Local GP services

17-043177-06 Version 1 | Public © Ipsos MORI
15
18%
70% 82%
Not easy
Easy
Ease of getting through to GP practice on the phone
30%
52%
12%
5% Very easy
Fairly easy
Not very easy
Not at all easy
Easy
Practice range in CCG - % Easy Local CCG range - % Easy
Lowest
Performing
Highest
Performing
21% 100%
Lowest
Performing
Highest
Performing
57% 83%
%Easy = %Very easy + %Fairly easy
%Not easy = %Not very easy + %Not at all easy Base: All those completing a questionnaire excluding ‘Haven’t tried’: National (729,884); CCG (7,306);
Practice bases range from 22 to 127; CCG bases range from 853 to 7,306
CCG
Q1. Generally, how easy is it to get through to someone at your GP practice on the phone?*
National
30%
*Those who say ‘Haven't tried’ have been excluded from these results.
CCG’s results Comparison of results
Not easy

17-043177-06 Version 1 | Public © Ipsos MORI
16
0%
10%
20%
30%
40%
50%
60%
70%
80%
90%
100%
HO
RS
EF
AIR
SU
RG
ER
Y
TH
E L
EY
S H
EA
LT
H C
EN
TR
E
ALC
HE
ST
ER
ME
DIC
AL
GR
OU
P
WO
OD
LA
ND
S M
ED
ICA
L C
EN
TR
E
MA
NO
R S
UR
GE
RY
BO
TLE
Y M
ED
ICA
L C
EN
TR
E
WA
LL
ING
FO
RD
ME
DIC
AL P
RA
CT
ICE
MA
LT
HO
US
E S
UR
GE
RY
WE
ST
BA
R S
UR
GE
RY
MA
RC
HA
M R
D F
AM
ILY
HE
ALT
HC
EN
TR
E
TH
E C
HA
RL
BU
RY
ME
DIC
AL C
EN
TR
E
HE
DE
NA
HE
AL
TH
BA
RT
LE
MA
S S
UR
GE
RY
DO
NN
ING
TO
N M
ED
ICA
LP
AR
TN
ER
SH
IP
TH
E K
EY
ME
DIC
AL P
RA
CT
ICE
WIN
DR
US
H S
UR
GE
RY
EY
NS
HA
M M
ED
ICA
L G
RO
UP
DID
CO
T H
EA
LT
H C
EN
TR
E P
RA
CT
ICE
MO
NT
GO
ME
RY
HO
US
E S
UR
GE
RY
BR
OA
DS
HIR
ES
HE
ALT
H C
EN
TR
E
CH
IPP
ING
NO
RT
ON
HE
AL
TH
CE
NT
RE
CC
G
TH
E B
ELL
SU
RG
ER
Y
BIC
ES
TE
R H
EA
LT
H C
EN
TR
E
TH
E H
AR
T S
UR
GE
RY
WO
OD
LA
ND
S S
UR
GE
RY
TE
MP
LE
CO
WL
EY
HE
ALT
H C
EN
TR
E
GO
SF
OR
D H
ILL M
ED
ICA
L C
EN
TR
E
WIN
DR
US
H M
ED
ICA
L P
RA
CT
ICE
NE
WB
UR
Y S
TR
EE
T P
RA
CT
ICE
OB
SE
RV
AT
OR
Y M
ED
ICA
L P
RA
CT
ICE
TH
E R
YC
OT
E P
RA
CT
ICE
NU
FF
IELD
HE
AL
TH
CE
NT
RE
BA
NB
UR
Y H
EA
LT
H C
EN
TR
E
CH
AL
GR
OV
E &
WA
TL
ING
TO
NS
UR
GE
RIE
SG
OR
ING
& W
OO
DC
OT
E M
ED
ICA
LP
RA
CT
ICE
19
BE
AU
MO
NT
ST
RE
ET
SU
RG
ER
Y
ST
. C
LE
ME
NT
'S S
UR
GE
RY
ST
.BA
RT
HO
LO
ME
WS
ME
DIC
AL
CE
NT
RE
CH
UR
CH
ST
RE
ET
PR
AC
TIC
E
WO
OD
ST
OC
K S
UR
GE
RY
BU
RF
OR
D S
UR
GE
RY
ISL
IP S
UR
GE
RY
SU
MM
ER
TO
WN
HE
ALT
H C
EN
TR
E
Ease of getting through to GP practice on the phone:
how the CCG’s practices compare
Percentage of patients saying it is ‘easy’ to get through to someone on the phone
Comparisons are indicative only: differences may not be statistically significant, particularly at practice level due to lower numbers of responses
Base: All those completing a questionnaire excluding ‘Haven’t tried’: National (729,884); CCG (7,306);
Practice bases range from 22 to 127 %Easy = %Very easy + %Fairly easy
Q1. Generally, how easy is it to get through to someone at your GP practice on the phone?
CCG Practices National average

17-043177-06 Version 1 | Public © Ipsos MORI
17
0%
10%
20%
30%
40%
50%
60%
70%
80%
90%
100%
CO
WLE
Y R
OA
D M
ED
ICA
L P
RA
CT
ICE
SO
NN
ING
CO
MM
ON
HE
ALT
H C
TR
WH
ITE
HO
RS
E M
ED
ICA
L P
RA
CT
ICE
TH
E A
BIN
GD
ON
SU
RG
ER
Y
OA
K T
RE
E H
EA
LT
H C
EN
TR
E
HO
LLO
W W
AY
ME
DIC
AL C
EN
TR
E
DE
DD
ING
TO
N H
EA
LT
H C
EN
TR
E
BA
MP
TO
N S
UR
GE
RY
BA
NB
UR
Y R
OA
D M
ED
ICA
L C
EN
TR
E
SO
UT
H O
XF
OR
D H
EA
LT
H C
EN
TR
E
MO
RL
AN
D H
OU
SE
SU
RG
ER
Y
LU
TH
ER
ST
RE
ET
ME
DIC
AL P
RA
CT
ICE
LO
NG
FU
RL
ON
G M
ED
ICA
L C
EN
TR
E
CO
GG
ES
SU
RG
ER
Y
CL
IFT
ON
HA
MP
DE
N S
UR
GE
RY
BLO
XH
AM
SU
RG
ER
Y
HIG
HT
OW
N S
UR
GE
RY
BE
RIN
SF
IELD
HE
ALT
H C
EN
TR
E
CR
OP
RE
DY
SU
RG
ER
Y
SIB
FO
RD
SU
RG
ER
Y
JE
RIC
HO
HE
AL
TH
CE
NT
RE
28
BE
AU
MO
NT
ST
RE
ET
KIN
G E
DW
AR
D S
T M
ED
ICA
LP
RA
CT
ICE
NE
TT
LE
BE
D S
UR
GE
RY
MIL
L S
TR
EA
M S
UR
GE
RY
WY
CH
WO
OD
SU
RG
ER
Y
27
BE
AU
MO
NT
ST
RE
ET
Ease of getting through to GP practice on the phone:
how the CCG’s practices compare
Percentage of patients saying it is ‘easy’ to get through to someone on the phone
Comparisons are indicative only: differences may not be statistically significant, particularly at practice level due to lower numbers of responses
Base: All those completing a questionnaire excluding ‘Haven’t tried’: National (729,884); CCG (7,306);
Practice bases range from 22 to 127 %Easy = %Very easy + %Fairly easy
Q1. Generally, how easy is it to get through to someone at your GP practice on the phone?
CCG Practices National average

17-043177-06 Version 1 | Public © Ipsos MORI
18
Not helpful
Helpfulness of receptionists at GP practice
48%
44%
7% Very helpful
Fairly helpful
Not very helpful
Not at all helpful
Practice range in CCG - % Helpful Local CCG range - % Helpful
National
Not helpful
90%
10%
Helpful
Lowest
Performing
Highest
Performing
71% 100%
Lowest
Performing
Highest
Performing
86% 93%
%Helpful = %Very helpful + %Fairly helpful
%Not helpful = %Not very helpful + %Not at all helpful
Base: All those completing a questionnaire excluding ‘Don’t know’: National (738,543); CCG (7,430);
Practice bases range from 27 to 130; CCG bases range from 863 to 7,430
92%
8%
Helpful
CCG
Q2. How helpful do you find the receptionists at your GP practice?*
*Those who say ‘Don't know’ have been excluded from these results.
CCG’s results Comparison of results

17-043177-06 Version 1 | Public © Ipsos MORI
19
0%
10%
20%
30%
40%
50%
60%
70%
80%
90%
100%
HO
RS
EF
AIR
SU
RG
ER
Y
ALC
HE
ST
ER
ME
DIC
AL
GR
OU
P
DO
NN
ING
TO
N M
ED
ICA
LP
AR
TN
ER
SH
IP
WIN
DR
US
H S
UR
GE
RY
TH
E L
EY
S H
EA
LT
H C
EN
TR
E
BO
TLE
Y M
ED
ICA
L C
EN
TR
E
MA
LT
HO
US
E S
UR
GE
RY
ST
.BA
RT
HO
LO
ME
WS
ME
DIC
AL
CE
NT
RE
MA
RC
HA
M R
D F
AM
ILY
HE
ALT
HC
EN
TR
E
HE
DE
NA
HE
AL
TH
WO
OD
LA
ND
S M
ED
ICA
L C
EN
TR
E
TH
E C
HA
RL
BU
RY
ME
DIC
AL C
EN
TR
E
WE
ST
BA
R S
UR
GE
RY
WO
OD
LA
ND
S S
UR
GE
RY
OB
SE
RV
AT
OR
Y M
ED
ICA
L P
RA
CT
ICE
CH
IPP
ING
NO
RT
ON
HE
AL
TH
CE
NT
RE
BR
OA
DS
HIR
ES
HE
ALT
H C
EN
TR
E
LO
NG
FU
RL
ON
G M
ED
ICA
L C
EN
TR
E
HO
LLO
W W
AY
ME
DIC
AL C
EN
TR
E
CC
G
TE
MP
LE
CO
WL
EY
HE
ALT
H C
EN
TR
E
BA
NB
UR
Y R
OA
D M
ED
ICA
L C
EN
TR
E
BA
RT
LE
MA
S S
UR
GE
RY
WA
LL
ING
FO
RD
ME
DIC
AL P
RA
CT
ICE
TH
E K
EY
ME
DIC
AL P
RA
CT
ICE
BA
MP
TO
N S
UR
GE
RY
WO
OD
ST
OC
K S
UR
GE
RY
GO
RIN
G &
WO
OD
CO
TE
ME
DIC
AL
PR
AC
TIC
E
NU
FF
IELD
HE
AL
TH
CE
NT
RE
OA
K T
RE
E H
EA
LT
H C
EN
TR
E
DID
CO
T H
EA
LT
H C
EN
TR
E P
RA
CT
ICE
WIN
DR
US
H M
ED
ICA
L P
RA
CT
ICE
MA
NO
R S
UR
GE
RY
BU
RF
OR
D S
UR
GE
RY
BIC
ES
TE
R H
EA
LT
H C
EN
TR
E
CO
GG
ES
SU
RG
ER
Y
ISL
IP S
UR
GE
RY
NE
TT
LE
BE
D S
UR
GE
RY
TH
E B
ELL
SU
RG
ER
Y
TH
E H
AR
T S
UR
GE
RY
SU
MM
ER
TO
WN
HE
ALT
H C
EN
TR
E
NE
WB
UR
Y S
TR
EE
T P
RA
CT
ICE
CH
UR
CH
ST
RE
ET
PR
AC
TIC
E
MO
NT
GO
ME
RY
HO
US
E S
UR
GE
RY
Helpfulness of receptionists at GP practice:
how the CCG’s practices compare
Percentage of patients saying receptionists at the GP practice are ‘helpful’
Comparisons are indicative only: differences may not be statistically significant, particularly at practice level due to low numbers of responses
Base: All those completing a questionnaire excluding ‘Don’t know’: National (738,543); CCG (7,430);
Practice bases range from 27 to 130 %Helpful = %Very helpful + %Fairly helpful
Q2. How helpful do you find the receptionists at your GP practice?
CCG Practices National average

17-043177-06 Version 1 | Public © Ipsos MORI
20
0%
10%
20%
30%
40%
50%
60%
70%
80%
90%
100%
HIG
HT
OW
N S
UR
GE
RY
CO
WLE
Y R
OA
D M
ED
ICA
L P
RA
CT
ICE
28
BE
AU
MO
NT
ST
RE
ET
CH
AL
GR
OV
E &
WA
TL
ING
TO
NS
UR
GE
RIE
S
MO
RL
AN
D H
OU
SE
SU
RG
ER
Y
GO
SF
OR
D H
ILL M
ED
ICA
L C
EN
TR
E
27
BE
AU
MO
NT
ST
RE
ET
CR
OP
RE
DY
SU
RG
ER
Y
ST
. C
LE
ME
NT
'S S
UR
GE
RY
JE
RIC
HO
HE
AL
TH
CE
NT
RE
BA
NB
UR
Y H
EA
LT
H C
EN
TR
E
EY
NS
HA
M M
ED
ICA
L G
RO
UP
BE
RIN
SF
IELD
HE
ALT
H C
EN
TR
E
CL
IFT
ON
HA
MP
DE
N S
UR
GE
RY
WY
CH
WO
OD
SU
RG
ER
Y
TH
E R
YC
OT
E P
RA
CT
ICE
KIN
G E
DW
AR
D S
T M
ED
ICA
LP
RA
CT
ICE
19
BE
AU
MO
NT
ST
RE
ET
SU
RG
ER
Y
SO
NN
ING
CO
MM
ON
HE
ALT
H C
TR
WH
ITE
HO
RS
E M
ED
ICA
L P
RA
CT
ICE
DE
DD
ING
TO
N H
EA
LT
H C
EN
TR
E
BLO
XH
AM
SU
RG
ER
Y
SIB
FO
RD
SU
RG
ER
Y
MIL
L S
TR
EA
M S
UR
GE
RY
TH
E A
BIN
GD
ON
SU
RG
ER
Y
LU
TH
ER
ST
RE
ET
ME
DIC
AL P
RA
CT
ICE
SO
UT
H O
XF
OR
D H
EA
LT
H C
EN
TR
E
Helpfulness of receptionists at GP practice:
how the CCG’s practices compare
Percentage of patients saying receptionists at the GP practice are ‘helpful’
Comparisons are indicative only: differences may not be statistically significant, particularly at practice level due to low numbers of responses
Base: All those completing a questionnaire excluding ‘Don’t know’: National (738,543); CCG (7,430);
Practice bases range from 27 to 130 %Helpful = %Very helpful + %Fairly helpful
Q2. How helpful do you find the receptionists at your GP practice?
CCG Practices National average

17-043177-06 Version 1 | Public © Ipsos MORI
21
17-043177-06 Version 1 | Public © Ipsos MORI
Access to online services

17-043177-06 Version 1 | Public © Ipsos MORI
22
Awareness of online services
43% 44%
17%
6%
41% 41% 38%
13% 8%
42%
0
10
20
30
40
50
60
70
80
90
100
Bookingappointmentsonline
Ordering repeatprescriptionsonline
Accessing mymedical recordsonline
None of these Don't know
CCG
National
Comparisons are indicative only: differences may not be statistically significant
Pe
rcen
tage a
wa
re o
f o
nlin
e s
erv
ices o
ffe
red b
y
GP
pra
ctice
Base: All those completing a questionnaire: National (735,717); CCG (7,414);
Practice bases range from 27 to 132
Q4. As far as you know, which of the following online services does your GP practice offer?
Practice range
within CCG

17-043177-06 Version 1 | Public © Ipsos MORI
23
Online service use
14%
19%
5%
75%
13% 14%
3%
79%
0
10
20
30
40
50
60
70
80
90
100
Booking appointmentsonline
Ordering repeatprescriptions online
Accessing my medicalrecords online
None of these
CCG
National
Pe
rcen
tage u
se
d o
nlin
e s
erv
ices in p
ast 1
2 m
on
ths
Comparisons are indicative only: differences may not be statistically significant
Practice range
within CCG
Base: All those completing a questionnaire: National (742,492); CCG (7,485);
Practice bases range from 26 to 133
Q5. Which of the following general practice online services have you used in the past 12 months?
17-043177-06 Version 1 | Public © Ipsos MORI
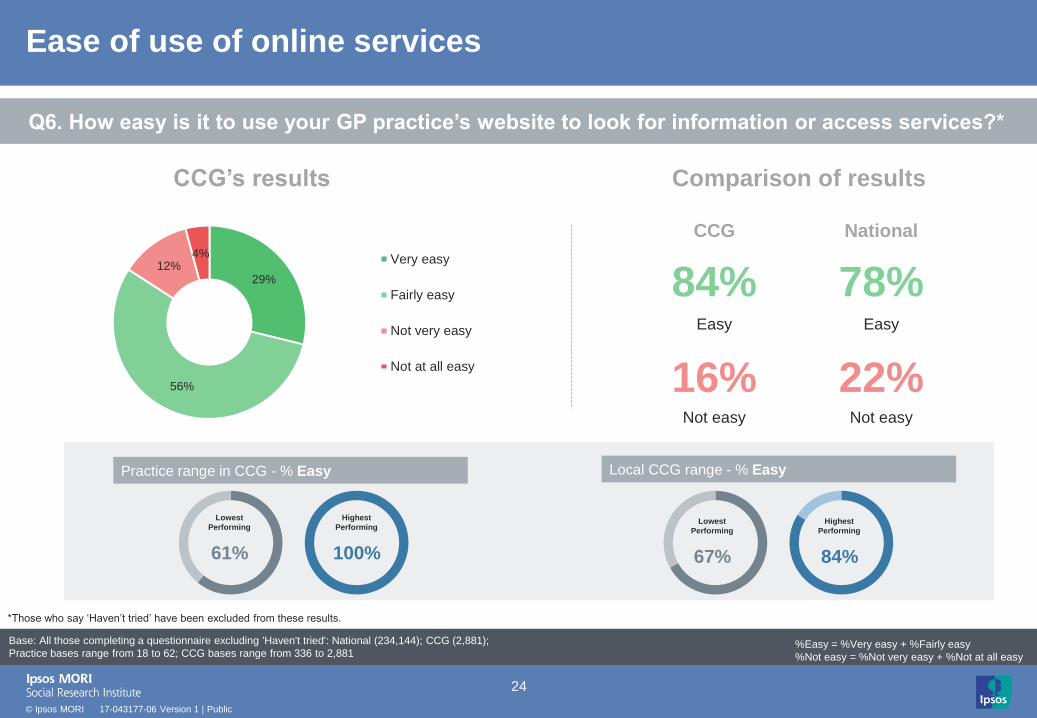
24
78%
22%
84%
16%
Base: All those completing a questionnaire excluding 'Haven't tried': National (234,144); CCG (2,881);
Practice bases range from 18 to 62; CCG bases range from 336 to 2,881
Ease of use of online services
29%
56%
12% 4% Very easy
Fairly easy
Not very easy
Not at all easy
Practice range in CCG - % Easy Local CCG range - % Easy
National
Easy
Not easy
Lowest
Performing
Highest
Performing
61% 100%
Lowest
Performing
Highest
Performing
67% 84%
CCG
Easy
Not easy
Q6. How easy is it to use your GP practice’s website to look for information or access services?*
%Easy = %Very easy + %Fairly easy
%Not easy = %Not very easy + %Not at all easy
*Those who say ‘Haven’t tried’ have been excluded from these results.
CCG’s results Comparison of results

17-043177-06 Version 1 | Public © Ipsos MORI
25
0%
10%
20%
30%
40%
50%
60%
70%
80%
90%
100%
TE
MP
LE
CO
WL
EY
HE
ALT
H C
EN
TR
E
BA
MP
TO
N S
UR
GE
RY
TH
E L
EY
S H
EA
LT
H C
EN
TR
E
TH
E C
HA
RL
BU
RY
ME
DIC
AL C
EN
TR
E
OB
SE
RV
AT
OR
Y M
ED
ICA
L P
RA
CT
ICE
DO
NN
ING
TO
N M
ED
ICA
LP
AR
TN
ER
SH
IP
JE
RIC
HO
HE
AL
TH
CE
NT
RE
DID
CO
T H
EA
LT
H C
EN
TR
E P
RA
CT
ICE
NE
WB
UR
Y S
TR
EE
T P
RA
CT
ICE
27
BE
AU
MO
NT
ST
RE
ET
ST
. C
LE
ME
NT
'S S
UR
GE
RY
BA
NB
UR
Y H
EA
LT
H C
EN
TR
E
19
BE
AU
MO
NT
ST
RE
ET
SU
RG
ER
Y
BO
TLE
Y M
ED
ICA
L C
EN
TR
E
HO
RS
EF
AIR
SU
RG
ER
Y
CH
IPP
ING
NO
RT
ON
HE
AL
TH
CE
NT
RE
CO
WLE
Y R
OA
D M
ED
ICA
L P
RA
CT
ICE
NU
FF
IELD
HE
AL
TH
CE
NT
RE
BR
OA
DS
HIR
ES
HE
ALT
H C
EN
TR
E
BA
NB
UR
Y R
OA
D M
ED
ICA
L C
EN
TR
E
SO
UT
H O
XF
OR
D H
EA
LT
H C
EN
TR
E
CH
AL
GR
OV
E &
WA
TL
ING
TO
NS
UR
GE
RIE
S
WE
ST
BA
R S
UR
GE
RY
BA
RT
LE
MA
S S
UR
GE
RY
LO
NG
FU
RL
ON
G M
ED
ICA
L C
EN
TR
E
ALC
HE
ST
ER
ME
DIC
AL
GR
OU
P
TH
E H
AR
T S
UR
GE
RY
ISL
IP S
UR
GE
RY
HE
DE
NA
HE
AL
TH
BU
RF
OR
D S
UR
GE
RY
HO
LLO
W W
AY
ME
DIC
AL C
EN
TR
E
WH
ITE
HO
RS
E M
ED
ICA
L P
RA
CT
ICE
28
BE
AU
MO
NT
ST
RE
ET
CC
G
BE
RIN
SF
IELD
HE
ALT
H C
EN
TR
E
WA
LL
ING
FO
RD
ME
DIC
AL P
RA
CT
ICE
TH
E K
EY
ME
DIC
AL P
RA
CT
ICE
SO
NN
ING
CO
MM
ON
HE
ALT
H C
TR
OA
K T
RE
E H
EA
LT
H C
EN
TR
E
MIL
L S
TR
EA
M S
UR
GE
RY
GO
SF
OR
D H
ILL M
ED
ICA
L C
EN
TR
E
BIC
ES
TE
R H
EA
LT
H C
EN
TR
E
WO
OD
LA
ND
S M
ED
ICA
L C
EN
TR
E
MA
NO
R S
UR
GE
RY
Ease of use of online services
Percentage of patients saying it is ‘easy’ to use their GP practice’s website
Comparisons are indicative only: differences may not be statistically significant, particularly at practice level due to low numbers of responses
%Easy = %Very easy + %Fairly easy
Base: All those completing a questionnaire excluding 'Haven't tried': National (234,144); CCG (2,881);
Practice bases range from 18 to 62
Q6. How easy is it to use your GP practice’s website to look for information or access services?
CCG Practices National average

17-043177-06 Version 1 | Public © Ipsos MORI
26
0%
10%
20%
30%
40%
50%
60%
70%
80%
90%
100%
MO
NT
GO
ME
RY
HO
US
E S
UR
GE
RY
TH
E A
BIN
GD
ON
SU
RG
ER
Y
MA
LT
HO
US
E S
UR
GE
RY
CR
OP
RE
DY
SU
RG
ER
Y
SU
MM
ER
TO
WN
HE
ALT
H C
EN
TR
E
WO
OD
ST
OC
K S
UR
GE
RY
HIG
HT
OW
N S
UR
GE
RY
WO
OD
LA
ND
S S
UR
GE
RY
MO
RL
AN
D H
OU
SE
SU
RG
ER
Y
MA
RC
HA
M R
D F
AM
ILY
HE
ALT
HC
EN
TR
E
CH
UR
CH
ST
RE
ET
PR
AC
TIC
E
TH
E R
YC
OT
E P
RA
CT
ICE
GO
RIN
G &
WO
OD
CO
TE
ME
DIC
AL
PR
AC
TIC
E
WIN
DR
US
H M
ED
ICA
L P
RA
CT
ICE
DE
DD
ING
TO
N H
EA
LT
H C
EN
TR
E
SIB
FO
RD
SU
RG
ER
Y
ST
.BA
RT
HO
LO
ME
WS
ME
DIC
AL
CE
NT
RE
TH
E B
ELL
SU
RG
ER
Y
WY
CH
WO
OD
SU
RG
ER
Y
EY
NS
HA
M M
ED
ICA
L G
RO
UP
NE
TT
LE
BE
D S
UR
GE
RY
WIN
DR
US
H S
UR
GE
RY
CL
IFT
ON
HA
MP
DE
N S
UR
GE
RY
KIN
G E
DW
AR
D S
T M
ED
ICA
LP
RA
CT
ICE
BLO
XH
AM
SU
RG
ER
Y
CO
GG
ES
SU
RG
ER
Y
Ease of use of online services
Percentage of patients saying it is ‘easy’ to use their GP practice’s website
Comparisons are indicative only: differences may not be statistically significant, particularly at practice level due to low numbers of responses
%Easy = %Very easy + %Fairly easy
Base: All those completing a questionnaire excluding 'Haven't tried': National (234,144); CCG (2,881);
Practice bases range from 18 to 62
Q6. How easy is it to use your GP practice’s website to look for information or access services?
CCG Practices National average

17-043177-06 Version 1 | Public © Ipsos MORI
27
17-043177-06 Version 1 | Public © Ipsos MORI
Making an appointment

17-043177-06 Version 1 | Public © Ipsos MORI
28
62%
38%
71%
29%
*Those who say ‘Doesn’t apply’ or ‘Can’t remember’ have been excluded from these results. The ‘Yes’ options are multi-code and so the summation of the three ‘Yes’ options does not equal the combined
‘Yes’ offered a choice statistic.
Choice of appointment
Practice range in CCG - % Yes Local CCG range - % Yes
National
Yes
No
Lowest
Performing
Highest
Performing
46% 97%
Lowest
Performing
Highest
Performing
49% 71%
CCG
Yes
No
Q16. On this occasion (when you last tried to make a general practice appointment), were you
offered a choice of appointment?*
%Yes = either offered a ‘Choice of place’, a ‘Choice of time or day’
or a ‘Choice of healthcare professional’
Base: All tried to make an appointment since being registered excluding ‘Doesn’t apply’ and ‘Can’t remember’: National (586,602); CCG (6,109);
Practice bases range from 18 to 112; CCG bases range from 714 to 6,109
12%
64%
14%
29%
Yes, a choice of place
Yes, a choice of time orday
Yes, a choice ofhealthcare professional
No, I was not offered achoice of appointment
CCG’s results Comparison of results

17-043177-06 Version 1 | Public © Ipsos MORI
29
Choice of appointment
Percentage of patients saying ‘yes’ they were offered a choice of appointment
Comparisons are indicative only: differences may not be statistically significant, particularly at practice level due to low numbers of responses
0%
10%
20%
30%
40%
50%
60%
70%
80%
90%
100%
HO
RS
EF
AIR
SU
RG
ER
Y
TE
MP
LE
CO
WL
EY
HE
ALT
H C
EN
TR
E
MA
LT
HO
US
E S
UR
GE
RY
BO
TLE
Y M
ED
ICA
L C
EN
TR
E
ALC
HE
ST
ER
ME
DIC
AL
GR
OU
P
NE
WB
UR
Y S
TR
EE
T P
RA
CT
ICE
WIN
DR
US
H S
UR
GE
RY
TH
E B
ELL
SU
RG
ER
Y
WO
OD
ST
OC
K S
UR
GE
RY
WO
OD
LA
ND
S M
ED
ICA
L C
EN
TR
E
DID
CO
T H
EA
LT
H C
EN
TR
E P
RA
CT
ICE
WO
OD
LA
ND
S S
UR
GE
RY
DO
NN
ING
TO
N M
ED
ICA
LP
AR
TN
ER
SH
IP
EY
NS
HA
M M
ED
ICA
L G
RO
UP
WE
ST
BA
R S
UR
GE
RY
NU
FF
IELD
HE
AL
TH
CE
NT
RE
BR
OA
DS
HIR
ES
HE
ALT
H C
EN
TR
E
GO
SF
OR
D H
ILL M
ED
ICA
L C
EN
TR
E
TH
E K
EY
ME
DIC
AL P
RA
CT
ICE
MA
RC
HA
M R
D F
AM
ILY
HE
ALT
HC
EN
TR
E
MA
NO
R S
UR
GE
RY
HO
LLO
W W
AY
ME
DIC
AL C
EN
TR
E
CH
IPP
ING
NO
RT
ON
HE
AL
TH
CE
NT
RE
TH
E L
EY
S H
EA
LT
H C
EN
TR
E
BA
RT
LE
MA
S S
UR
GE
RY
HIG
HT
OW
N S
UR
GE
RY
BA
MP
TO
N S
UR
GE
RY
GO
RIN
G &
WO
OD
CO
TE
ME
DIC
AL
PR
AC
TIC
E
CC
G
CH
UR
CH
ST
RE
ET
PR
AC
TIC
E
WIN
DR
US
H M
ED
ICA
L P
RA
CT
ICE
TH
E C
HA
RL
BU
RY
ME
DIC
AL C
EN
TR
E
OA
K T
RE
E H
EA
LT
H C
EN
TR
E
OB
SE
RV
AT
OR
Y M
ED
ICA
L P
RA
CT
ICE
WA
LL
ING
FO
RD
ME
DIC
AL P
RA
CT
ICE
CO
GG
ES
SU
RG
ER
Y
BU
RF
OR
D S
UR
GE
RY
TH
E H
AR
T S
UR
GE
RY
19
BE
AU
MO
NT
ST
RE
ET
SU
RG
ER
Y
BIC
ES
TE
R H
EA
LT
H C
EN
TR
E
ST
. C
LE
ME
NT
'S S
UR
GE
RY
JE
RIC
HO
HE
AL
TH
CE
NT
RE
BA
NB
UR
Y H
EA
LT
H C
EN
TR
E
WH
ITE
HO
RS
E M
ED
ICA
L P
RA
CT
ICE
Base: All tried to make an appointment since being registered excluding ‘Doesn’t apply’ and ‘Can’t remember’: National (586,602); CCG (6,109);
Practice bases range from 18 to 112
Q16. On this occasion (when you last tried to make a general practice appointment), were you
offered a choice of appointment?
%Yes = %Choice of place + %Choice of time or day
+ %Choice of healthcare professional
CCG Practices National average

17-043177-06 Version 1 | Public © Ipsos MORI
30
Choice of appointment
Percentage of patients saying ‘yes’ they were offered a choice of appointment
Comparisons are indicative only: differences may not be statistically significant, particularly at practice level due to low numbers of responses
0%
10%
20%
30%
40%
50%
60%
70%
80%
90%
100%
HE
DE
NA
HE
AL
TH
MO
NT
GO
ME
RY
HO
US
E S
UR
GE
RY
LO
NG
FU
RL
ON
G M
ED
ICA
L C
EN
TR
E
BE
RIN
SF
IELD
HE
ALT
H C
EN
TR
E
SU
MM
ER
TO
WN
HE
ALT
H C
EN
TR
E
ST
.BA
RT
HO
LO
ME
WS
ME
DIC
AL
CE
NT
RE
DE
DD
ING
TO
N H
EA
LT
H C
EN
TR
E
28
BE
AU
MO
NT
ST
RE
ET
ISL
IP S
UR
GE
RY
CR
OP
RE
DY
SU
RG
ER
Y
CO
WLE
Y R
OA
D M
ED
ICA
L P
RA
CT
ICE
CH
AL
GR
OV
E &
WA
TL
ING
TO
NS
UR
GE
RIE
S
SO
NN
ING
CO
MM
ON
HE
ALT
H C
TR
BA
NB
UR
Y R
OA
D M
ED
ICA
L C
EN
TR
E
TH
E R
YC
OT
E P
RA
CT
ICE
LU
TH
ER
ST
RE
ET
ME
DIC
AL P
RA
CT
ICE
KIN
G E
DW
AR
D S
T M
ED
ICA
LP
RA
CT
ICE
MO
RL
AN
D H
OU
SE
SU
RG
ER
Y
27
BE
AU
MO
NT
ST
RE
ET
SIB
FO
RD
SU
RG
ER
Y
SO
UT
H O
XF
OR
D H
EA
LT
H C
EN
TR
E
TH
E A
BIN
GD
ON
SU
RG
ER
Y
BLO
XH
AM
SU
RG
ER
Y
CL
IFT
ON
HA
MP
DE
N S
UR
GE
RY
WY
CH
WO
OD
SU
RG
ER
Y
NE
TT
LE
BE
D S
UR
GE
RY
MIL
L S
TR
EA
M S
UR
GE
RY
Base: All tried to make an appointment since being registered excluding ‘Doesn’t apply’ and ‘Can’t remember’: National (586,602); CCG (6,109);
Practice bases range from 18 to 112
Q16. On this occasion (when you last tried to make a general practice appointment), were you
offered a choice of appointment?
%Yes = %Choice of place + %Choice of time or day
+ %Choice of healthcare professional
CCG Practices National average

17-043177-06 Version 1 | Public © Ipsos MORI
31
6%
16%
4%
74%
20%
80%
No, took appt
Base: All tried to make an appointment since being registered: National (701,961); CCG (7,195);
Practice bases range from 26 to 128; CCG bases range from 828 to 7,195
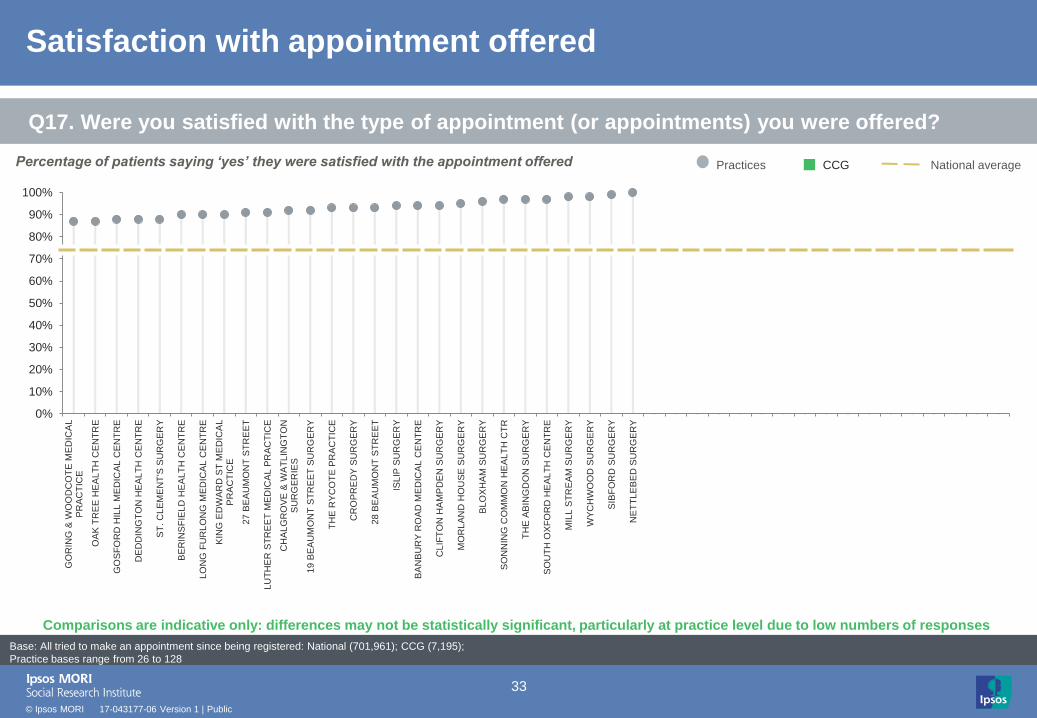
Satisfaction with appointment offered
80%
16%
4% Yes, and I accepted anappointment
No, but I still took anappointment
No, and I did not take anappointment
Practice range in CCG - % Yes Local CCG range - % Yes
National
Yes, took appt
No, took appt
Lowest
Performing
Highest
Performing
55% 100%
Lowest
Performing
Highest
Performing
65% 80%
CCG
Yes, took appt
Q17. Were you satisfied with the type of appointment (or appointments) you were offered?
No, didn’t take appt No, didn’t take appt
CCG’s results Comparison of results

17-043177-06 Version 1 | Public © Ipsos MORI
32
Satisfaction with appointment offered
Percentage of patients saying ‘yes’ they were satisfied with the appointment offered
Comparisons are indicative only: differences may not be statistically significant, particularly at practice level due to low numbers of responses
0%
10%
20%
30%
40%
50%
60%
70%
80%
90%
100%
HO
RS
EF
AIR
SU
RG
ER
Y
MA
LT
HO
US
E S
UR
GE
RY
TH
E L
EY
S H
EA
LT
H C
EN
TR
E
TE
MP
LE
CO
WL
EY
HE
ALT
H C
EN
TR
E
ALC
HE
ST
ER
ME
DIC
AL
GR
OU
P
DO
NN
ING
TO
N M
ED
ICA
LP
AR
TN
ER
SH
IP
BO
TLE
Y M
ED
ICA
L C
EN
TR
E
BR
OA
DS
HIR
ES
HE
ALT
H C
EN
TR
E
TH
E K
EY
ME
DIC
AL P
RA
CT
ICE
CH
IPP
ING
NO
RT
ON
HE
AL
TH
CE
NT
RE
BA
RT
LE
MA
S S
UR
GE
RY
HIG
HT
OW
N S
UR
GE
RY
NU
FF
IELD
HE
AL
TH
CE
NT
RE
MA
RC
HA
M R
D F
AM
ILY
HE
ALT
HC
EN
TR
E
WIN
DR
US
H S
UR
GE
RY
NE
WB
UR
Y S
TR
EE
T P
RA
CT
ICE
WE
ST
BA
R S
UR
GE
RY
MO
NT
GO
ME
RY
HO
US
E S
UR
GE
RY
WO
OD
LA
ND
S S
UR
GE
RY
CO
GG
ES
SU
RG
ER
Y
HE
DE
NA
HE
AL
TH
TH
E B
ELL
SU
RG
ER
Y
HO
LLO
W W
AY
ME
DIC
AL C
EN
TR
E
ST
.BA
RT
HO
LO
ME
WS
ME
DIC
AL
CE
NT
RE
WIN
DR
US
H M
ED
ICA
L P
RA
CT
ICE
DID
CO
T H
EA
LT
H C
EN
TR
E P
RA
CT
ICE
MA
NO
R S
UR
GE
RY
CC
G
SU
MM
ER
TO
WN
HE
ALT
H C
EN
TR
E
WO
OD
LA
ND
S M
ED
ICA
L C
EN
TR
E
EY
NS
HA
M M
ED
ICA
L G
RO
UP
CH
UR
CH
ST
RE
ET
PR
AC
TIC
E
TH
E C
HA
RL
BU
RY
ME
DIC
AL C
EN
TR
E
BA
MP
TO
N S
UR
GE
RY
WO
OD
ST
OC
K S
UR
GE
RY
BIC
ES
TE
R H
EA
LT
H C
EN
TR
E
JE
RIC
HO
HE
AL
TH
CE
NT
RE
BA
NB
UR
Y H
EA
LT
H C
EN
TR
E
TH
E H
AR
T S
UR
GE
RY
WA
LL
ING
FO
RD
ME
DIC
AL P
RA
CT
ICE
WH
ITE
HO
RS
E M
ED
ICA
L P
RA
CT
ICE
CO
WLE
Y R
OA
D M
ED
ICA
L P
RA
CT
ICE
OB
SE
RV
AT
OR
Y M
ED
ICA
L P
RA
CT
ICE
BU
RF
OR
D S
UR
GE
RY
Base: All tried to make an appointment since being registered: National (701,961); CCG (7,195);
Practice bases range from 26 to 128
Q17. Were you satisfied with the type of appointment (or appointments) you were offered?
CCG Practices National average
17-043177-06 Version 1 | Public © Ipsos MORI
33
Satisfaction with appointment offered
Percentage of patients saying ‘yes’ they were satisfied with the appointment offered
Comparisons are indicative only: differences may not be statistically significant, particularly at practice level due to low numbers of responses
0%
10%
20%
30%
40%
50%
60%
70%
80%
90%
100%
GO
RIN
G &
WO
OD
CO
TE
ME
DIC
AL
PR
AC
TIC
E
OA
K T
RE
E H
EA
LT
H C
EN
TR
E
GO
SF
OR
D H
ILL M
ED
ICA
L C
EN
TR
E
DE
DD
ING
TO
N H
EA
LT
H C
EN
TR
E
ST
. C
LE
ME
NT
'S S
UR
GE
RY
BE
RIN
SF
IELD
HE
ALT
H C
EN
TR
E
LO
NG
FU
RL
ON
G M
ED
ICA
L C
EN
TR
E
KIN
G E
DW
AR
D S
T M
ED
ICA
LP
RA
CT
ICE
27
BE
AU
MO
NT
ST
RE
ET
LU
TH
ER
ST
RE
ET
ME
DIC
AL P
RA
CT
ICE
CH
AL
GR
OV
E &
WA
TL
ING
TO
NS
UR
GE
RIE
S
19
BE
AU
MO
NT
ST
RE
ET
SU
RG
ER
Y
TH
E R
YC
OT
E P
RA
CT
ICE
CR
OP
RE
DY
SU
RG
ER
Y
28
BE
AU
MO
NT
ST
RE
ET
ISL
IP S
UR
GE
RY
BA
NB
UR
Y R
OA
D M
ED
ICA
L C
EN
TR
E
CL
IFT
ON
HA
MP
DE
N S
UR
GE
RY
MO
RL
AN
D H
OU
SE
SU
RG
ER
Y
BLO
XH
AM
SU
RG
ER
Y
SO
NN
ING
CO
MM
ON
HE
ALT
H C
TR
TH
E A
BIN
GD
ON
SU
RG
ER
Y
SO
UT
H O
XF
OR
D H
EA
LT
H C
EN
TR
E
MIL
L S
TR
EA
M S
UR
GE
RY
WY
CH
WO
OD
SU
RG
ER
Y
SIB
FO
RD
SU
RG
ER
Y
NE
TT
LE
BE
D S
UR
GE
RY
Base: All tried to make an appointment since being registered: National (701,961); CCG (7,195);
Practice bases range from 26 to 128
Q17. Were you satisfied with the type of appointment (or appointments) you were offered?
CCG Practices National average

17-043177-06 Version 1 | Public © Ipsos MORI
34
14%
8% 5%
11% 8%
24%
14% 14%
30%
14%
7% 11% 10% 11%
22%
11% 11%
28%
0%
10%
20%
30%
40%
50%
60%
70%
80%
90%
100%
Got anappointment fora different day
Called an NHShelpline, suchas NHS 111
Went to A&E Spoke to apharmacist
Went to orcontacted
another NHSservice
Decided tocontact my
practice anothertime
Looked forinformation
online
Spoke to afriend or family
member
Didn’t see or speak to anyone
CCG
National
What patients do when they are not satisfied with the
appointment offered and do not take it
Comparisons are indicative only: differences may not be statistically significant
Pe
rce
nta
ge
wh
o w
ent
on to
do s
om
eth
ing
els
e w
hen
did
not ta
ke the a
ppoin
tment off
ere
d
Base: All who did not take the appointment offered (excluding those who haven't tried to make one): National (32,326); CCG (174)
Q19. What did you do when you did not take the appointment you were offered?

17-043177-06 Version 1 | Public © Ipsos MORI
35
69%
15%
76%
10% Poor
Overall experience of making an appointment
37%
39%
14%
7% 3% Very good
Fairly good
Neither good nor poor
Fairly poor
Very poor
Practice range in CCG - % Good Local CCG range - % Good
National
Good
Poor
Lowest
Performing
Highest
Performing
43% 100%
Lowest
Performing
Highest
Performing
57% 77%
%Good = %Very good + %Fairly good
%Poor = %Fairly poor + %Very poor
Base: All tried to make an appointment since being registered: National (693,912); CCG (7,105);
Practice bases range from 25 to 127; CCG bases range from 814 to 7,105
CCG
Q22. Overall, how would you describe your experience of making an appointment?
CCG’s results Comparison of results
Good
17-043177-06 Version 1 | Public © Ipsos MORI
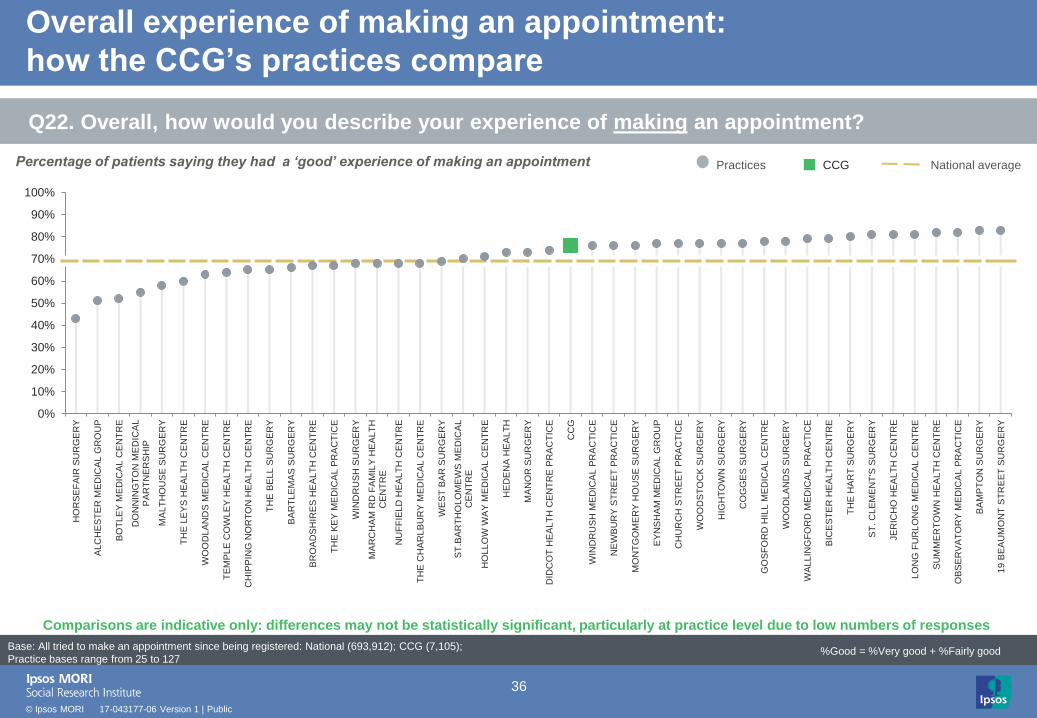
36
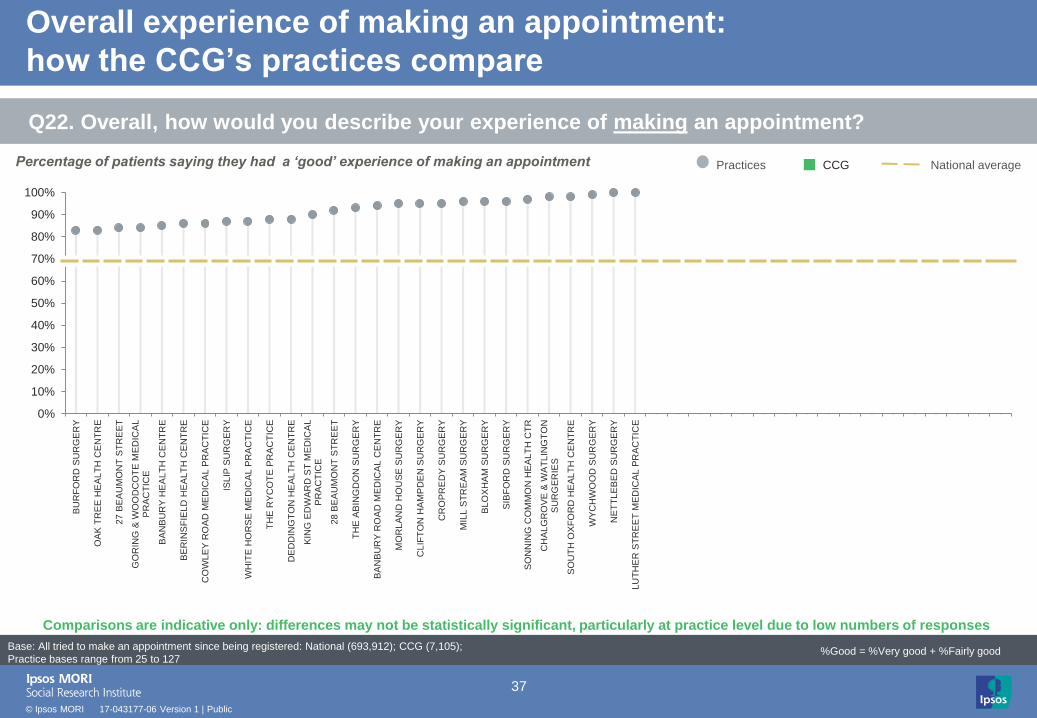
Overall experience of making an appointment:
how the CCG’s practices compare
Percentage of patients saying they had a ‘good’ experience of making an appointment
Comparisons are indicative only: differences may not be statistically significant, particularly at practice level due to low numbers of responses
Base: All tried to make an appointment since being registered: National (693,912); CCG (7,105);
Practice bases range from 25 to 127
0%
10%
20%
30%
40%
50%
60%
70%
80%
90%
100%
HO
RS
EF
AIR
SU
RG
ER
Y
ALC
HE
ST
ER
ME
DIC
AL
GR
OU
P
BO
TLE
Y M
ED
ICA
L C
EN
TR
E
DO
NN
ING
TO
N M
ED
ICA
LP
AR
TN
ER
SH
IP
MA
LT
HO
US
E S
UR
GE
RY
TH
E L
EY
S H
EA
LT
H C
EN
TR
E
WO
OD
LA
ND
S M
ED
ICA
L C
EN
TR
E
TE
MP
LE
CO
WL
EY
HE
ALT
H C
EN
TR
E
CH
IPP
ING
NO
RT
ON
HE
AL
TH
CE
NT
RE
TH
E B
ELL
SU
RG
ER
Y
BA
RT
LE
MA
S S
UR
GE
RY
BR
OA
DS
HIR
ES
HE
ALT
H C
EN
TR
E
TH
E K
EY
ME
DIC
AL P
RA
CT
ICE
WIN
DR
US
H S
UR
GE
RY
MA
RC
HA
M R
D F
AM
ILY
HE
ALT
HC
EN
TR
E
NU
FF
IELD
HE
AL
TH
CE
NT
RE
TH
E C
HA
RL
BU
RY
ME
DIC
AL C
EN
TR
E
WE
ST
BA
R S
UR
GE
RY
ST
.BA
RT
HO
LO
ME
WS
ME
DIC
AL
CE
NT
RE
HO
LLO
W W
AY
ME
DIC
AL C
EN
TR
E
HE
DE
NA
HE
AL
TH
MA
NO
R S
UR
GE
RY
DID
CO
T H
EA
LT
H C
EN
TR
E P
RA
CT
ICE
CC
G
WIN
DR
US
H M
ED
ICA
L P
RA
CT
ICE
NE
WB
UR
Y S
TR
EE
T P
RA
CT
ICE
MO
NT
GO
ME
RY
HO
US
E S
UR
GE
RY
EY
NS
HA
M M
ED
ICA
L G
RO
UP
CH
UR
CH
ST
RE
ET
PR
AC
TIC
E
WO
OD
ST
OC
K S
UR
GE
RY
HIG
HT
OW
N S
UR
GE
RY
CO
GG
ES
SU
RG
ER
Y
GO
SF
OR
D H
ILL M
ED
ICA
L C
EN
TR
E
WO
OD
LA
ND
S S
UR
GE
RY
WA
LL
ING
FO
RD
ME
DIC
AL P
RA
CT
ICE
BIC
ES
TE
R H
EA
LT
H C
EN
TR
E
TH
E H
AR
T S
UR
GE
RY
ST
. C
LE
ME
NT
'S S
UR
GE
RY
JE
RIC
HO
HE
AL
TH
CE
NT
RE
LO
NG
FU
RL
ON
G M
ED
ICA
L C
EN
TR
E
SU
MM
ER
TO
WN
HE
ALT
H C
EN
TR
E
OB
SE
RV
AT
OR
Y M
ED
ICA
L P
RA
CT
ICE
BA
MP
TO
N S
UR
GE
RY
19
BE
AU
MO
NT
ST
RE
ET
SU
RG
ER
Y
%Good = %Very good + %Fairly good
Q22. Overall, how would you describe your experience of making an appointment?
CCG Practices National average
17-043177-06 Version 1 | Public © Ipsos MORI
37
Overall experience of making an appointment:
how the CCG’s practices compare
Percentage of patients saying they had a ‘good’ experience of making an appointment
Comparisons are indicative only: differences may not be statistically significant, particularly at practice level due to low numbers of responses
Base: All tried to make an appointment since being registered: National (693,912); CCG (7,105);
Practice bases range from 25 to 127
0%
10%
20%
30%
40%
50%
60%
70%
80%
90%
100%
BU
RF
OR
D S
UR
GE
RY
OA
K T
RE
E H
EA
LT
H C
EN
TR
E
27
BE
AU
MO
NT
ST
RE
ET
GO
RIN
G &
WO
OD
CO
TE
ME
DIC
AL
PR
AC
TIC
E
BA
NB
UR
Y H
EA
LT
H C
EN
TR
E
BE
RIN
SF
IELD
HE
ALT
H C
EN
TR
E
CO
WLE
Y R
OA
D M
ED
ICA
L P
RA
CT
ICE
ISL
IP S
UR
GE
RY
WH
ITE
HO
RS
E M
ED
ICA
L P
RA
CT
ICE
TH
E R
YC
OT
E P
RA
CT
ICE
DE
DD
ING
TO
N H
EA
LT
H C
EN
TR
E
KIN
G E
DW
AR
D S
T M
ED
ICA
LP
RA
CT
ICE
28
BE
AU
MO
NT
ST
RE
ET
TH
E A
BIN
GD
ON
SU
RG
ER
Y
BA
NB
UR
Y R
OA
D M
ED
ICA
L C
EN
TR
E
MO
RL
AN
D H
OU
SE
SU
RG
ER
Y
CL
IFT
ON
HA
MP
DE
N S
UR
GE
RY
CR
OP
RE
DY
SU
RG
ER
Y
MIL
L S
TR
EA
M S
UR
GE
RY
BLO
XH
AM
SU
RG
ER
Y
SIB
FO
RD
SU
RG
ER
Y
SO
NN
ING
CO
MM
ON
HE
ALT
H C
TR
CH
AL
GR
OV
E &
WA
TL
ING
TO
NS
UR
GE
RIE
S
SO
UT
H O
XF
OR
D H
EA
LT
H C
EN
TR
E
WY
CH
WO
OD
SU
RG
ER
Y
NE
TT
LE
BE
D S
UR
GE
RY
LU
TH
ER
ST
RE
ET
ME
DIC
AL P
RA
CT
ICE
%Good = %Very good + %Fairly good
Q22. Overall, how would you describe your experience of making an appointment?
CCG Practices National average

17-043177-06 Version 1 | Public © Ipsos MORI
38
17-043177-06 Version 1 | Public © Ipsos MORI
Perceptions of care at patients’
last appointment

17-043177-06 Version 1 | Public © Ipsos MORI
39
Perceptions of care at patients’ last appointment with a
healthcare professional
Base: All had an appointment since being registered with current GP practice excluding 'Doesn't apply’:
National (706,895; 705,167; 706,882); CCG (7,206; 7,187; 7,209)
CCG’s results
*Those who say ‘Doesn’t apply’ have been excluded from these results.
Nationl results %
Poor (total)
CCG results
% Poor (total)
%Poor (total) = %Very poor + %Poor
Q26. Last time you had a general practice appointment, how good was the healthcare professional
at each of the following*
53% 57% 57%
36% 34% 33%
8% 7% 8%
Giving you enough time Listening to you Treating you with care and concern
Very good Good Neither good nor poor Poor Very poor
National results
% ‘Poor’ (total)
CCG results
% ‘Poor’ (total)
Very poor
Very good
4% 3% 4%
3% 2% 2%
Giving you enough time Listening to you Treating you with care and concern

17-043177-06 Version 1 | Public © Ipsos MORI
40
Perceptions of care at patients’ last appointment with a
healthcare professional
Base: All had an appointment since being registered with current GP practice excluding 'Doesn't apply’:
National (628,938; 695,421; 696,267); CCG (6,468; 7,126; 7,145);
CCG’s results
Nationl results %
Poor (total)
CCG results
% Poor (total)
Q28-30. During your last general practice appointment…*
67% 74% 68%
28% 23% 28%
4% 3% 5%
Felt involved in decisions about care andtreatment
Had confidence and trust in thehealthcare professional
Felt their needs were met
Yes, definitely Yes, to some extent No, not at all
National results
% ‘No, not at all’
CCG results
% ‘No, not at all’
No, not at all
Yes, definitely
*Those who say ‘Don’t know / doesn’t apply’ or ‘Don’t know / can’t say’ have been excluded from these results.
7% 4% 5%
4% 3% 5%
Felt involved in decisions about care
and treatment Had confidence and trust in the
healthcare professional
Felt their needs were met

17-043177-06 Version 1 | Public © Ipsos MORI
41
87%
13% 11%
89%
Mental health needs recognised and understood
57% 32%
11% Yes, definitely
Yes, to some extent
No, not at all
Practice range in CCG - % Yes Local CCG range - % Yes
National
Yes
No
Lowest
Performing
Highest
Performing
68% 100%
Lowest
Performing
Highest
Performing
84% 91%
%Yes = %Yes, definitely + %Yes, to some extent Base: All had an appointment since being registered with current GP practice excluding ‘I did not have any mental health needs’ or ‘Did not apply
to my last appointment’: National (277,497); CCG (2,717); Practice bases range from 16 to 60; CCG bases range from 285 to 2,717
*Those who say ‘I did not have any mental health needs’ or ‘Did not apply to my last appointment’ have been excluded from these results.
No
CCG
Q27. During your last general practice appointment, did you feel that the healthcare professional
recognised and/or understood any mental health needs that you might have had?*
CCG’s results Comparison of results
Yes

17-043177-06 Version 1 | Public © Ipsos MORI
42
17-043177-06 Version 1 | Public © Ipsos MORI
Managing health conditions

17-043177-06 Version 1 | Public © Ipsos MORI
43
79%
21%
85%
15%
Base: All with a long-term condition excluding ‘I haven’t needed support’ and ‘Don’t know / can’t say’: National (284,887); CCG (2,691);
Practice bases range from 19 to 51; CCG bases range from 317 to 2,691
Support with managing long-term health conditions
48%
36%
15% Yes, definitely
Yes, to some extent
No
Practice range in CCG - % Yes Local CCG range - % Yes
National
Yes
No
Lowest
Performing
Highest
Performing
68% 100%
Lowest
Performing
Highest
Performing
76% 87%
CCG
Yes
No
Q38. In the last 12 months, have you had enough support from local services or organisations to
help you to manage your condition (or conditions)?*
%Yes = %Yes, definitely + %Yes, to some extent
*Those who say ‘I haven’t needed support’ and ‘Don’t know / can’t say’ have been excluded from these results.
CCG’s results Comparison of results
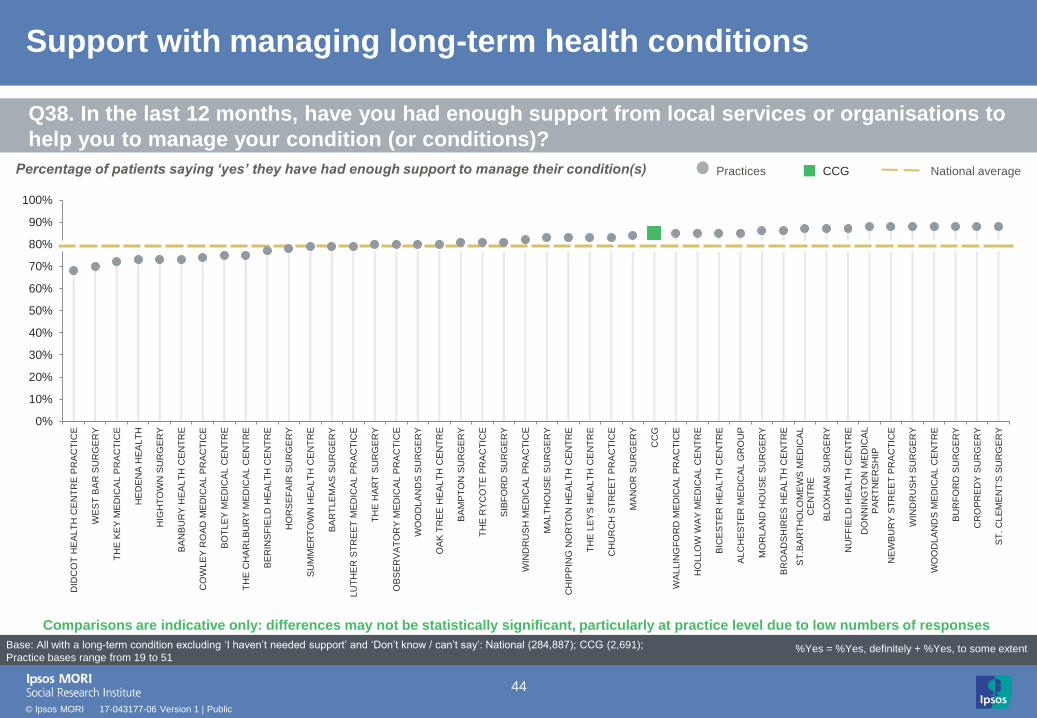
17-043177-06 Version 1 | Public © Ipsos MORI
44
Percentage of patients saying ‘yes’ they have had enough support to manage their condition(s)
Comparisons are indicative only: differences may not be statistically significant, particularly at practice level due to low numbers of responses
0%
10%
20%
30%
40%
50%
60%
70%
80%
90%
100%
DID
CO
T H
EA
LT
H C
EN
TR
E P
RA
CT
ICE
WE
ST
BA
R S
UR
GE
RY
TH
E K
EY
ME
DIC
AL P
RA
CT
ICE
HE
DE
NA
HE
AL
TH
HIG
HT
OW
N S
UR
GE
RY
BA
NB
UR
Y H
EA
LT
H C
EN
TR
E
CO
WLE
Y R
OA
D M
ED
ICA
L P
RA
CT
ICE
BO
TLE
Y M
ED
ICA
L C
EN
TR
E
TH
E C
HA
RL
BU
RY
ME
DIC
AL C
EN
TR
E
BE
RIN
SF
IELD
HE
ALT
H C
EN
TR
E
HO
RS
EF
AIR
SU
RG
ER
Y
SU
MM
ER
TO
WN
HE
ALT
H C
EN
TR
E
BA
RT
LE
MA
S S
UR
GE
RY
LU
TH
ER
ST
RE
ET
ME
DIC
AL P
RA
CT
ICE
TH
E H
AR
T S
UR
GE
RY
OB
SE
RV
AT
OR
Y M
ED
ICA
L P
RA
CT
ICE
WO
OD
LA
ND
S S
UR
GE
RY
OA
K T
RE
E H
EA
LT
H C
EN
TR
E
BA
MP
TO
N S
UR
GE
RY
TH
E R
YC
OT
E P
RA
CT
ICE
SIB
FO
RD
SU
RG
ER
Y
WIN
DR
US
H M
ED
ICA
L P
RA
CT
ICE
MA
LT
HO
US
E S
UR
GE
RY
CH
IPP
ING
NO
RT
ON
HE
AL
TH
CE
NT
RE
TH
E L
EY
S H
EA
LT
H C
EN
TR
E
CH
UR
CH
ST
RE
ET
PR
AC
TIC
E
MA
NO
R S
UR
GE
RY
CC
G
WA
LL
ING
FO
RD
ME
DIC
AL P
RA
CT
ICE
HO
LLO
W W
AY
ME
DIC
AL C
EN
TR
E
BIC
ES
TE
R H
EA
LT
H C
EN
TR
E
ALC
HE
ST
ER
ME
DIC
AL
GR
OU
P
MO
RL
AN
D H
OU
SE
SU
RG
ER
Y
BR
OA
DS
HIR
ES
HE
ALT
H C
EN
TR
E
ST
.BA
RT
HO
LO
ME
WS
ME
DIC
AL
CE
NT
RE
BLO
XH
AM
SU
RG
ER
Y
NU
FF
IELD
HE
AL
TH
CE
NT
RE
DO
NN
ING
TO
N M
ED
ICA
LP
AR
TN
ER
SH
IP
NE
WB
UR
Y S
TR
EE
T P
RA
CT
ICE
WIN
DR
US
H S
UR
GE
RY
WO
OD
LA
ND
S M
ED
ICA
L C
EN
TR
E
BU
RF
OR
D S
UR
GE
RY
CR
OP
RE
DY
SU
RG
ER
Y
ST
. C
LE
ME
NT
'S S
UR
GE
RY
Base: All with a long-term condition excluding ‘I haven’t needed support’ and ‘Don’t know / can’t say’: National (284,887); CCG (2,691);
Practice bases range from 19 to 51
Q38. In the last 12 months, have you had enough support from local services or organisations to
help you to manage your condition (or conditions)?
%Yes = %Yes, definitely + %Yes, to some extent
Support with managing long-term health conditions
CCG Practices National average

17-043177-06 Version 1 | Public © Ipsos MORI
45
Percentage of patients saying ‘yes’ they have had enough support to manage their condition(s)
Comparisons are indicative only: differences may not be statistically significant, particularly at practice level due to low numbers of responses
0%
10%
20%
30%
40%
50%
60%
70%
80%
90%
100%
28
BE
AU
MO
NT
ST
RE
ET
MA
RC
HA
M R
D F
AM
ILY
HE
ALT
HC
EN
TR
E
WO
OD
ST
OC
K S
UR
GE
RY
WH
ITE
HO
RS
E M
ED
ICA
L P
RA
CT
ICE
DE
DD
ING
TO
N H
EA
LT
H C
EN
TR
E
KIN
G E
DW
AR
D S
T M
ED
ICA
LP
RA
CT
ICE
NE
TT
LE
BE
D S
UR
GE
RY
SO
NN
ING
CO
MM
ON
HE
ALT
H C
TR
MIL
L S
TR
EA
M S
UR
GE
RY
JE
RIC
HO
HE
AL
TH
CE
NT
RE
BA
NB
UR
Y R
OA
D M
ED
ICA
L C
EN
TR
E
TH
E A
BIN
GD
ON
SU
RG
ER
Y
EY
NS
HA
M M
ED
ICA
L G
RO
UP
TE
MP
LE
CO
WL
EY
HE
ALT
H C
EN
TR
E
MO
NT
GO
ME
RY
HO
US
E S
UR
GE
RY
GO
SF
OR
D H
ILL M
ED
ICA
L C
EN
TR
E
19
BE
AU
MO
NT
ST
RE
ET
SU
RG
ER
Y
CL
IFT
ON
HA
MP
DE
N S
UR
GE
RY
SO
UT
H O
XF
OR
D H
EA
LT
H C
EN
TR
E
GO
RIN
G &
WO
OD
CO
TE
ME
DIC
AL
PR
AC
TIC
E
ISL
IP S
UR
GE
RY
CH
AL
GR
OV
E &
WA
TL
ING
TO
NS
UR
GE
RIE
S
CO
GG
ES
SU
RG
ER
Y
TH
E B
ELL
SU
RG
ER
Y
WY
CH
WO
OD
SU
RG
ER
Y
27
BE
AU
MO
NT
ST
RE
ET
LO
NG
FU
RL
ON
G M
ED
ICA
L C
EN
TR
E
Base: All with a long-term condition excluding ‘I haven’t needed support’ and ‘Don’t know / can’t say’: National (284,887); CCG (2,691);
Practice bases range from 19 to 51
Q38. In the last 12 months, have you had enough support from local services or organisations to
help you to manage your condition (or conditions)?
%Yes = %Yes, definitely + %Yes, to some extent
Support with managing long-term health conditions
CCG Practices National average

17-043177-06 Version 1 | Public © Ipsos MORI
46
17-043177-06 Version 1 | Public © Ipsos MORI
Satisfaction with general
practice appointment times

17-043177-06 Version 1 | Public © Ipsos MORI
47
66%
17%
70%
13% Dissatisfied
Satisfaction with appointment times
27%
43%
17%
8% 5%
Very satisfied
Fairly satisfied
Neither satisfied nordissatisfied
Fairly dissatisfied
Very dissatisfied
Practice range in CCG - % Satisfied Local CCG range - % Satisfied
National
Satisfied
Dissatisfied
Lowest
Performing
Highest
Performing
40% 100%
Lowest
Performing
Highest
Performing
53% 71%
Base: All those completing a questionnaire excluding ‘I’m not sure when I can get an appointment’: National (689,659); CCG (7,043);
Practice bases range from 26 to 127; CCG bases range from 824 to 7,043
%Satisfied = %Very satisfied + %Fairly satisfied
%Dissatisfied = %Very dissatisfied + %Fairly dissatisfied
Satisfied
CCG
Q8. How satisfied are you with the general practice appointment times that are available to you?*
*Those who say ‘I’m not sure when I can get an appointment’ have been excluded from these results.
CCG’s results Comparison of results

17-043177-06 Version 1 | Public © Ipsos MORI
48
Satisfaction with appointment times:
how the CCG’s practices compare
Percentage of patients saying they are ‘satisfied’ with the appointment times available
Comparisons are indicative only: differences may not be statistically significant, particularly at practice level due to low numbers of responses
Base: All those completing a questionnaire excluding ‘I’m not sure when I can get an appointment’: National (689,659); CCG (7,043);
Practice bases range from 26 to 127
0%
10%
20%
30%
40%
50%
60%
70%
80%
90%
100%
HO
RS
EF
AIR
SU
RG
ER
Y
TH
E L
EY
S H
EA
LT
H C
EN
TR
E
NU
FF
IELD
HE
AL
TH
CE
NT
RE
MA
LT
HO
US
E S
UR
GE
RY
BO
TLE
Y M
ED
ICA
L C
EN
TR
E
WO
OD
LA
ND
S M
ED
ICA
L C
EN
TR
E
ALC
HE
ST
ER
ME
DIC
AL
GR
OU
P
BA
RT
LE
MA
S S
UR
GE
RY
TH
E C
HA
RL
BU
RY
ME
DIC
AL C
EN
TR
E
BR
OA
DS
HIR
ES
HE
ALT
H C
EN
TR
E
MA
RC
HA
M R
D F
AM
ILY
HE
ALT
HC
EN
TR
E
TH
E B
ELL
SU
RG
ER
Y
TH
E K
EY
ME
DIC
AL P
RA
CT
ICE
DO
NN
ING
TO
N M
ED
ICA
LP
AR
TN
ER
SH
IP
CH
IPP
ING
NO
RT
ON
HE
AL
TH
CE
NT
RE
BA
MP
TO
N S
UR
GE
RY
WIN
DR
US
H S
UR
GE
RY
HE
DE
NA
HE
AL
TH
CO
GG
ES
SU
RG
ER
Y
WE
ST
BA
R S
UR
GE
RY
HO
LLO
W W
AY
ME
DIC
AL C
EN
TR
E
WIN
DR
US
H M
ED
ICA
L P
RA
CT
ICE
NE
WB
UR
Y S
TR
EE
T P
RA
CT
ICE
EY
NS
HA
M M
ED
ICA
L G
RO
UP
DID
CO
T H
EA
LT
H C
EN
TR
E P
RA
CT
ICE
TE
MP
LE
CO
WL
EY
HE
ALT
H C
EN
TR
E
19
BE
AU
MO
NT
ST
RE
ET
SU
RG
ER
Y
SU
MM
ER
TO
WN
HE
ALT
H C
EN
TR
E
MO
NT
GO
ME
RY
HO
US
E S
UR
GE
RY
MA
NO
R S
UR
GE
RY
CC
G
CH
UR
CH
ST
RE
ET
PR
AC
TIC
E
WO
OD
ST
OC
K S
UR
GE
RY
BU
RF
OR
D S
UR
GE
RY
WO
OD
LA
ND
S S
UR
GE
RY
OA
K T
RE
E H
EA
LT
H C
EN
TR
E
BIC
ES
TE
R H
EA
LT
H C
EN
TR
E
DE
DD
ING
TO
N H
EA
LT
H C
EN
TR
E
TH
E H
AR
T S
UR
GE
RY
WA
LL
ING
FO
RD
ME
DIC
AL P
RA
CT
ICE
ST
.BA
RT
HO
LO
ME
WS
ME
DIC
AL
CE
NT
RE
GO
RIN
G &
WO
OD
CO
TE
ME
DIC
AL
PR
AC
TIC
E
JE
RIC
HO
HE
AL
TH
CE
NT
RE
HIG
HT
OW
N S
UR
GE
RY
%Satisfied = %Very satisfied + %Fairly satisfied
Q8. How satisfied are you with the general practice appointment times that are available to you?
CCG Practices National average

17-043177-06 Version 1 | Public © Ipsos MORI
49
Satisfaction with appointment times:
how the CCG’s practices compare
Percentage of patients saying they are ‘satisfied’ with the appointment times available
Comparisons are indicative only: differences may not be statistically significant, particularly at practice level due to low numbers of responses
Base: All those completing a questionnaire excluding ‘I’m not sure when I can get an appointment’: National (689,659); CCG (7,043);
Practice bases range from 26 to 127
0%
10%
20%
30%
40%
50%
60%
70%
80%
90%
100%
CO
WLE
Y R
OA
D M
ED
ICA
L P
RA
CT
ICE
GO
SF
OR
D H
ILL M
ED
ICA
L C
EN
TR
E
LO
NG
FU
RL
ON
G M
ED
ICA
L C
EN
TR
E
ISL
IP S
UR
GE
RY
ST
. C
LE
ME
NT
'S S
UR
GE
RY
BA
NB
UR
Y R
OA
D M
ED
ICA
L C
EN
TR
E
BE
RIN
SF
IELD
HE
ALT
H C
EN
TR
E
27
BE
AU
MO
NT
ST
RE
ET
TH
E R
YC
OT
E P
RA
CT
ICE
OB
SE
RV
AT
OR
Y M
ED
ICA
L P
RA
CT
ICE
WH
ITE
HO
RS
E M
ED
ICA
L P
RA
CT
ICE
28
BE
AU
MO
NT
ST
RE
ET
MO
RL
AN
D H
OU
SE
SU
RG
ER
Y
CR
OP
RE
DY
SU
RG
ER
Y
BLO
XH
AM
SU
RG
ER
Y
SO
NN
ING
CO
MM
ON
HE
ALT
H C
TR
SIB
FO
RD
SU
RG
ER
Y
TH
E A
BIN
GD
ON
SU
RG
ER
Y
KIN
G E
DW
AR
D S
T M
ED
ICA
LP
RA
CT
ICE
BA
NB
UR
Y H
EA
LT
H C
EN
TR
E
CH
AL
GR
OV
E &
WA
TL
ING
TO
NS
UR
GE
RIE
S
CL
IFT
ON
HA
MP
DE
N S
UR
GE
RY
SO
UT
H O
XF
OR
D H
EA
LT
H C
EN
TR
E
MIL
L S
TR
EA
M S
UR
GE
RY
NE
TT
LE
BE
D S
UR
GE
RY
WY
CH
WO
OD
SU
RG
ER
Y
LU
TH
ER
ST
RE
ET
ME
DIC
AL P
RA
CT
ICE
%Satisfied = %Very satisfied + %Fairly satisfied
Q8. How satisfied are you with the general practice appointment times that are available to you?
CCG Practices National average

17-043177-06 Version 1 | Public © Ipsos MORI
50
17-043177-06 Version 1 | Public © Ipsos MORI
Services when GP practice is closed
• The services when GP practice is closed questions are only asked of those who have recently used an NHS service when they wanted to see
a GP but their GP practice was closed. As such, the base size is often too small to make meaningful comparisons at practice level; practice
range within CCG has therefore not been included for these questions.
• Please note that patients cannot always distinguish between out-of-hours services and extended access appointments. Please view the results
in this section with the configuration of your local services in mind.

17-043177-06 Version 1 | Public © Ipsos MORI
51
75%
35%
7%
29%
10%
14%
3%
9%
62%
25%
5%
36%
12%
18%
5%
8%
I contacted an NHS service by telephone
A healthcare professional called me back
A healthcare professional visited me at home
I went to A&E
I saw a pharmacist
I went to another general practice service
I went to another NHS service
Can't remember
CCG National
Use of services when GP practice is closed
Base: All those who have contacted an NHS service when GP practice closed in past 12 months: National (138,025); CCG (1,389)
Q45. Considering all of the services you contacted, which of the following happened on that
occasion?

17-043177-06 Version 1 | Public © Ipsos MORI
52
26%
65%
35%
74%
74%
26%
It was about right
It took too long
Time taken to receive care or advice when GP practice is closed
About right
Took too long
Local CCG range – % About right
Base: All those who have contacted an NHS service when GP practice closed in past 12 months excluding ‘Don’t know / doesn’t apply’:
National (129,429); CCG (1,327); CCG bases range from 135 to 1,327
Lowest
Performing
Highest
Performing
59% 75%
National CCG
About right
Took too long
Q46. How do you feel about how quickly you received care or advice on that occasion?*
*Those who say ‘Don’t know / doesn’t apply’ have been excluded from these results.
CCG’s results Comparison of results

17-043177-06 Version 1 | Public © Ipsos MORI
53
8%
91%
9%
92%
54% 38%
8% Yes, definitely
Yes, to some extent
No, not at all
Confidence and trust in staff providing services when GP
practice is closed
%Yes = %Yes, definitely + % Yes, to some extent
Yes
No
Local CCG range – % Yes
*Those who say ‘Don’t know / can’t say’ have been excluded from these results.
Lowest
Performing
Highest
Performing
86% 95%
National CCG
Yes
No
Q47. Considering all of the people that you saw or spoke to on that occasion, did you have
confidence and trust in them?*
Base: All those who have contacted an NHS service when GP practice closed in past 12 months excluding 'Don't know / can't say’:
National (132,710); CCG (1,349); CCG bases range from 138 to 1,349
CCG’s results Comparison of results

17-043177-06 Version 1 | Public © Ipsos MORI
54
14%
69%
15%
73% 36%
37%
14%
8% 6%
Very good
Fairly good
Neither good nor poor
Fairly poor
Very poor
Overall experience of services when GP practice is closed
%Good = %Very good + %Fairly good
%Poor = %Fairly poor + %Very poor
Base: All those who have contacted an NHS service when GP practice closed in past 12 months excluding 'Don't know / can't say’:
National (133,444); CCG (1,345); CCG bases range from 140 to 1,345
Good
Poor
Local CCG range - % Good
Lowest
Performing
Highest
Performing
61% 78%
Good
Poor
National CCG
Q48. Overall, how would you describe your last experience of NHS services when you wanted to
see a GP but your GP practice was closed?*
*Those who say ‘Don’t know / can’t say’ have been excluded from these results.
CCG’s results Comparison of results

17-043177-06 Version 1 | Public © Ipsos MORI
55
17-043177-06 Version 1 | Public © Ipsos MORI
Statistical reliability

17-043177-06 Version 1 | Public © Ipsos MORI
56
Statistical reliability
Participants in a survey such as GPPS represent only a sample of the total population of interest – this means we cannot be certain that the results of
a question are exactly the same as if everybody within that population had taken part (“true values”). However, we can predict the variation between
the results of a question and the true value by using the size of the sample on which results are based and the number of times a particular answer is
given. The confidence with which we make this prediction is usually chosen to be 95% – that is, the chances are 95 in 100 that the true value will fall
within a specified range (the “95% confidence interval”).
The table below gives examples of what the confidence intervals look like for an ‘average’ practice and CCG, as well as the confidence intervals at
the national level.
Average sample size on
which results are based
Approximate confidence intervals for percentages at or near
these levels
Level 1:
10% or 90%
Level 2:
30% or 70%
Level 3:
50%
+/- +/- +/-
National 758,165 0.09 0.15 0.16
CCG 4,000 1.32 2.02 2.20
Practice 100 6.93 10.21 11.08
An example of confidence intervals (at national, CCG and practice level) based on the average number of responses to the question
“Overall, how would you describe your experience of your GP practice?”
For example, taking a CCG where 4,000 people responded and where 30% answered ‘Very good’ in response to ‘Overall, how would you describe
your experience of making an appointment’, there is a 95% likelihood that the true value (which would have been obtained if the whole population had
been interviewed) will fall within the range of +/-2.02 percentage points from that question’s result (i.e. between 27.98% and 32.02%).
When results are compared between separate groups within a sample, the difference may be “real” or it may occur by chance (because not everyone
in the population has been interviewed). Confidence intervals will be wider when comparing groups, especially where there are small numbers e.g.
practices where 100 patients or fewer responded to a question. These findings should be regarded as indicative rather than robust.

17-043177-06 Version 1 | Public © Ipsos MORI
57
17-043177-06 Version 1 | Public © Ipsos MORI
Want to know more?

17-043177-06 Version 1 | Public © Ipsos MORI
58
Further background information about the survey
• The survey was sent to c.2.2 million adult patients registered with a GP practice.
• Participants are sent a postal questionnaire, also with the option of completing the
survey online or via telephone.
• Past results dating back to 2007 are available for every practice in the UK. From 2017
the survey has been annual; previously it ran twice a year (June 2011 – July 2016), on a
quarterly basis (April 2009 – March 2011) and annually (January 2007 – March 2009).
• For more information about the survey please visit https://gp-patient.co.uk/.
• The overall response rate to the survey is 34.1%, based on 758,165 completed surveys.
• Weights have been applied to adjust the data to account for potential age and gender
differences between the profile of all eligible patients in a practice and the patients who
actually complete a questionnaire. Since the first wave of the 2011-2012 survey the
weighting also takes into account neighbourhood statistics, such as levels of deprivation,
in order to further improve the reliability of the findings.
• Further information on the survey including questionnaire design, sampling,
communication with patients and practices, data collection, data analysis, response
rates and reporting can be found in the technical annex for each survey year, available
here: https://gp-patient.co.uk/surveysandreports.
758,165 Completed surveys in
the August 2018
publication
c.2.2m Surveys to adults
registered with an
English GP practice
34.1% National response
rate

17-043177-06 Version 1 | Public © Ipsos MORI
59
Where to go to do further analysis …
• For reports which show the National results broken down by CCG and Practice, go to
https://gp-patient.co.uk/surveysandreports - you can also see previous years’ results here.
• To look at the survey data at a national, CCG or practice level, and filter on a specific participant group (e.g. by
age), break down the survey results by survey question, or to create and compare different participant
‘subgroups’, go to https://gp-patient.co.uk/analysistool
• For general FAQs about the GP Patient Survey, go to https://gp-patient.co.uk/faq

17-043177-06 Version 1 | Public © Ipsos MORI
60
17-043177-06 Version 1 | Public © Ipsos MORI
For further information about the GP Patient Survey, please
get in touch with the GPPS team at Ipsos MORI at
We would be interested to hear any feedback you have on
this slide pack, so we can make improvements for the next
publication.