Embed Size (px)
Citation preview

NHS Management and Administration Staffing and Expenditure in a National and International Context
Dr Karen Bloor
Dr Emma Harvey
Professor Alan Maynard
University of York
with
Professor Jane Hall and Sandra Fowler,
University of Technology, Sydney, Australia
Professor Klaus-Dirk Henke and Katja Borchardt ,
Technische Universität Berlin, Germany
Professor Hans Maarse and Dr Milena Pavlova,
University of Maastricht, The Netherlands
Professor Kjeld Møller Pedersen,
University of Southern Denmark
Dr Philippe Ulmann, Dr Roland Cash and Dr Carole Müller,
Collège des Economistes de la Santé, Paris, France
March 2005
Summary of policy implications 1. During this project, an attempt was made in a very short period to review and interpret published literature and data sources, to derive a template for questioning international informants, and make international and cross-sectoral comparisons. Findings are presented from all these areas and while we emphasise the preliminary nature of all these findings, we believe that this is the best that can be done with available information and data at this stage. We would like to acknowledge the immense assistance we have had from international experts (particularly those listed on the title page). The primary authors accept full responsibility for the interpretation of the data these individuals provided and for any errors or omissions. 2. Before reviewing the data we have accessed, it is useful to emphasise the particular nature of the political debate about NHS ‘bureaucracy’. Expenditure on management in other public sector organisations (e.g. schools) is rarely measured systematically, and it is not denigrated in the way that the alleged ‘excesses’ of health sector management are. Yet in all service industries and organisations, management and administration is essential for the efficient delivery of services. Furthermore, as the complexities of health care delivery have increased, and there has been increased recognition of system failures such as practice variations, clinical errors and inappropriate or untimely treatment, the need for effective management and administration has increased in all health care systems, public and private. 3. Expenditure on management and administration, in the NHS and in all other health care systems, is a means to an end: its purpose is to improve patient care. The relatively ill-informed and superficial debates around whole system ‘bureaucracy’ make little attempt to assess the value of management and administration in particular activities, or accept that some such expenditure is essential to ensure the appropriate and efficient delivery of care. The primary policy issue should not be overall management staffing levels or costs, but how investments of this type affect the performance of the health care system and its component parts. Levels of management and administration reflect systems of finance and delivery and the structure of the health care system. As one American author (Blumenthal 1993) reflects, blaming the problems of health care on its administration ‘is as useful as attributing a patient’s septic shock to his or her fever’. It should be emphasised that administrative and management costs are a symptom, not a cause, of structural problems in the US and in other health care systems. 4. There are no agreed definitions of ‘administration’ and ‘management’ in health care between (and sometimes even within) countries’ health care systems. Substantial ambiguity exists around any comparisons, particularly as definitions shift as groups of workers are recategorised. Consequently, all cross-national and cross-sectoral figures must be viewed with extreme caution. Particularly limiting to this review is the emphasis in England on ‘management’ whereas other countries do not separate management from administration. The distinction between ‘management’ and ‘administration’ is usually artificial and may be politically motivated. The first definition of administration in the Oxford dictionary is ‘management’. The distinction between ‘managers and senior managers’, the usual statistic cited in health management debates, and ‘administration’ is artificial and may be inappropriate. The policy focus should be on the size, activity and effects of both groups. 5. A literature review revealed useful studies comparing administration costs in the US (predictably high) and Canada (substantially lower), and some single country attempts to relate management inputs to outcomes (in terms of health sector performance). These studies may be consistent with the hypothesis that returns to investment in management may increase at low levels of input, and then returns may diminish to zero and eventually decrease. In the US, where management and administration costs are high, it may be that there are diminishing or even decreasing returns to further investment in many parts of the system. 6. Historically, Beveridge-type systems like the ‘old’ NHS (pre-1991 reform) have been relatively inexpensive to manage and administer. The existence of a single payer, in

conjunction with simple resource allocation mechanisms, has substantially limited the number of transactions needed in the health system and the consequent information and resource requirements. This has permitted cost control and limited the need for administration costs. General reluctance to confront clinical freedom has meant that management costs have also historically been relatively low. Bismarck-type social insurance systems, by having more than one payer (e.g. multiple sickness funds in Germany) and distinctions between funding and provision, have historically created more expensive systems, both in general and in terms of administration costs. Private systems, with a plurality of payers and providers, and a mix of public and private finance generate a substantial need for information (for billing and contracting) and systems like the US have historically been expensive to manage and administer. 7. As we move towards mixed systems in the UK and elsewhere in Europe, these old distinctions begin to break down, and current management and administrative inputs (in terms of staffing and costs) appear to vary less between England, France, Germany and the Netherlands than might be expected. Inputs in Australia and Denmark appear on first impressions lower than the other four countries surveyed, but these conclusions are tentative. In the English NHS, the purchaser-provider split, private finance, national tariffs and other policies aiming to stimulate efficiency in the system and create a mix of public and private finance and provision mean almost unavoidably that the more information is needed to make contracts, hence transactions costs of providing care have increased, and may continue to increase. At the same time, policy makers, focusing on better monitoring of performance, have also created a need for information systems and management to detect whether improvements in health care delivery are taking place. 8. The challenge to research and policy is how to identify the impact of incremental investments in management and administration teams on improving system performance and patient outcomes. The evidence base for the impact of management investment is very limited, largely because of the apparent obsession of policy makers and researchers with ideological perspectives, and with overall system administrative costs. Identifying returns to management and administrative investment can only be achieved by disaggregated analysis, accepting that different sectors and different objectives require different levels of management and administration, not by the current focus on ambiguous global sums. The current level of debate is at times unhelpful and inappropriate in addressing this more relevant policy question. Our hope is that more consistent and accurate data can in future be collected and used, and that this review will act as a stimulus to further research and analysis of this challenging but important policy area.
Executive summary Background The costs of management and administration in the National Health Service remain a constant and often unnecessary source of debate and controversy. Some commentators believe NHS management to be extremely cost-effective, with a relatively small workforce managing a budget of over £65 billion and a workforce of 1.3 million. Others believe management and administration costs are ‘out of control’ and detract from patient care rather than adding to it. Both views deploy rhetoric and selective use of evidence, often tend to fail to focus on the purposes of such expenditure (the efficient and equitable finance and delivery of accessible patient care) and do not estimate cost flows accurately. Study Objectives 1. To deconstruct and outline clear definitions of the number (whole-time equivalent) and
costs of NHS management and administrative staff for England. 2. To review published literature on management and administration costs in health care
systems in England and elsewhere. 3. To review and explore existing sources of internationally comparable data on the
components of health expenditure (e.g. OECD Health Data, Eurostat). 4. To create a template of questions to determine comparable estimated figures from a
selection of countries (France, Germany, Denmark, Australia, the Netherlands), and use national expert contacts to provide national published data on management and administration staffing and costs in their health systems, and to access and interpret these data.
5. To investigate published accounts of a selection of private health care insurers and providers in the UK, to explore public-private sector comparisons of health care management and administration staffing and costs.
6. To explore the possibility of cross-sectoral comparisons of management and administration costs in comparable publicly funded professional service industries such as school teaching and higher education.
Summary methods and results
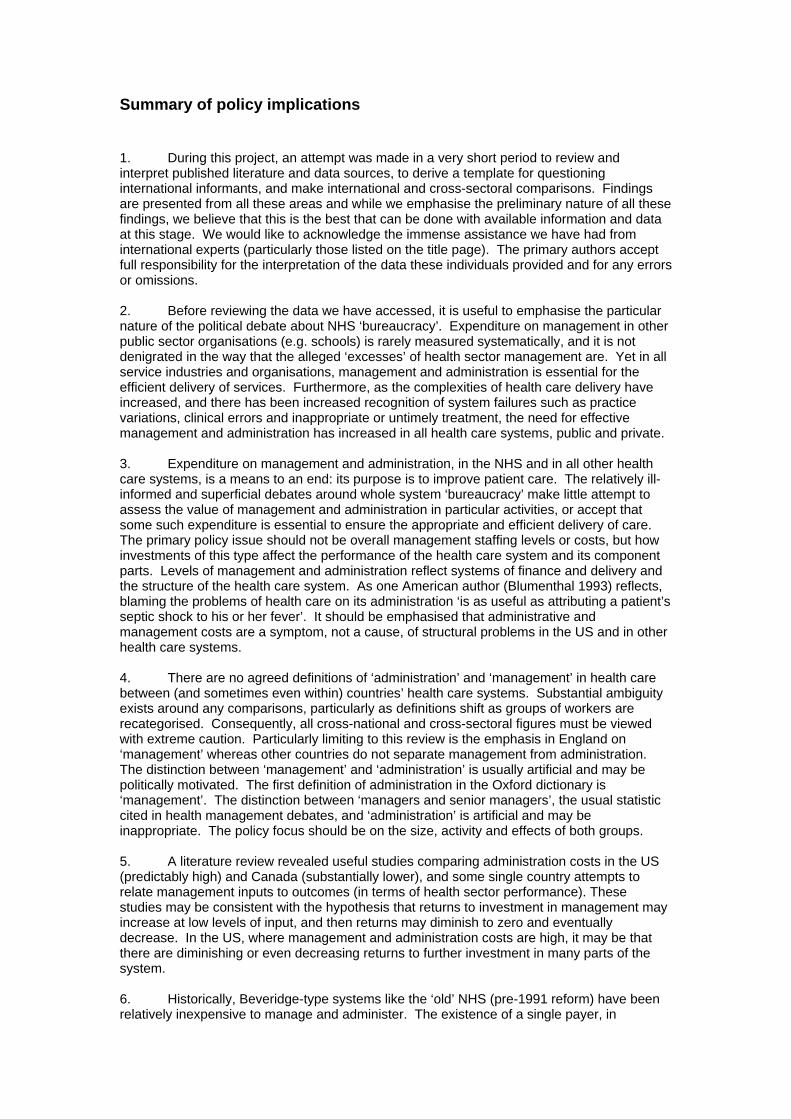
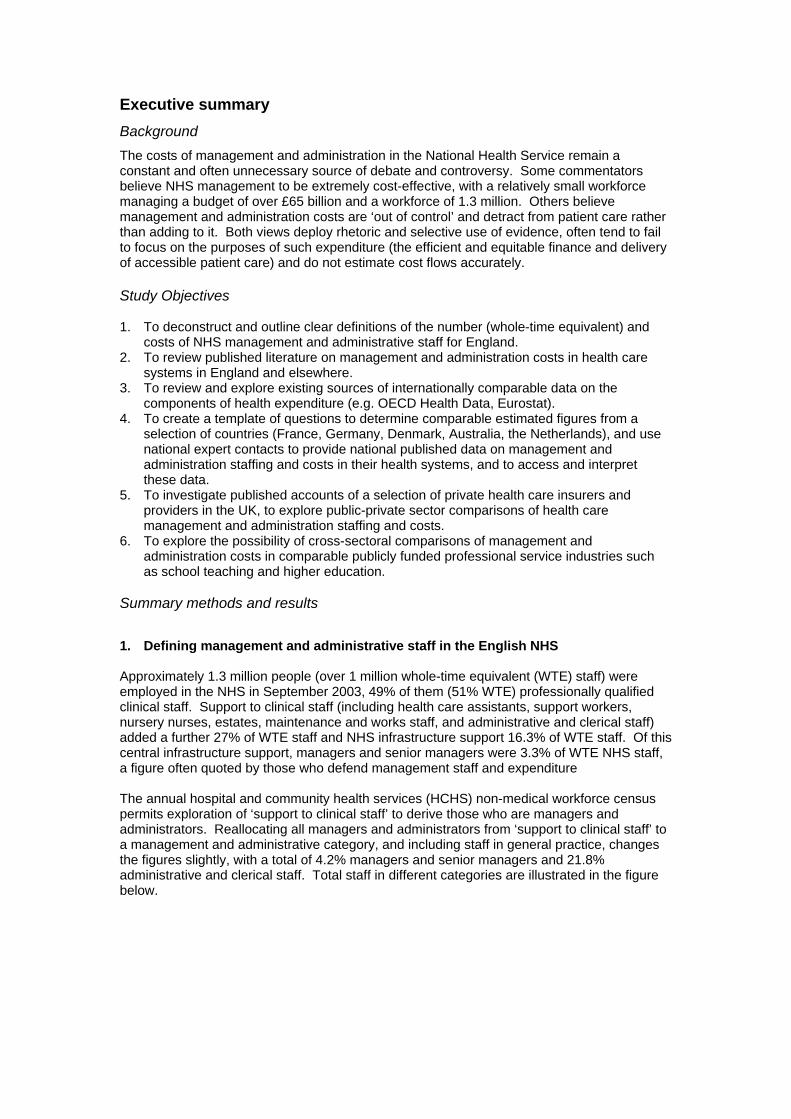
1. Defining management and administrative staff in the English NHS Approximately 1.3 million people (over 1 million whole-time equivalent (WTE) staff) were employed in the NHS in September 2003, 49% of them (51% WTE) professionally qualified clinical staff. Support to clinical staff (including health care assistants, support workers, nursery nurses, estates, maintenance and works staff, and administrative and clerical staff) added a further 27% of WTE staff and NHS infrastructure support 16.3% of WTE staff. Of this central infrastructure support, managers and senior managers were 3.3% of WTE NHS staff, a figure often quoted by those who defend management staff and expenditure The annual hospital and community health services (HCHS) non-medical workforce census permits exploration of ‘support to clinical staff’ to derive those who are managers and administrators. Reallocating all managers and administrators from ‘support to clinical staff’ to a management and administrative category, and including staff in general practice, changes the figures slightly, with a total of 4.2% managers and senior managers and 21.8% administrative and clerical staff. Total staff in different categories are illustrated in the figure below.
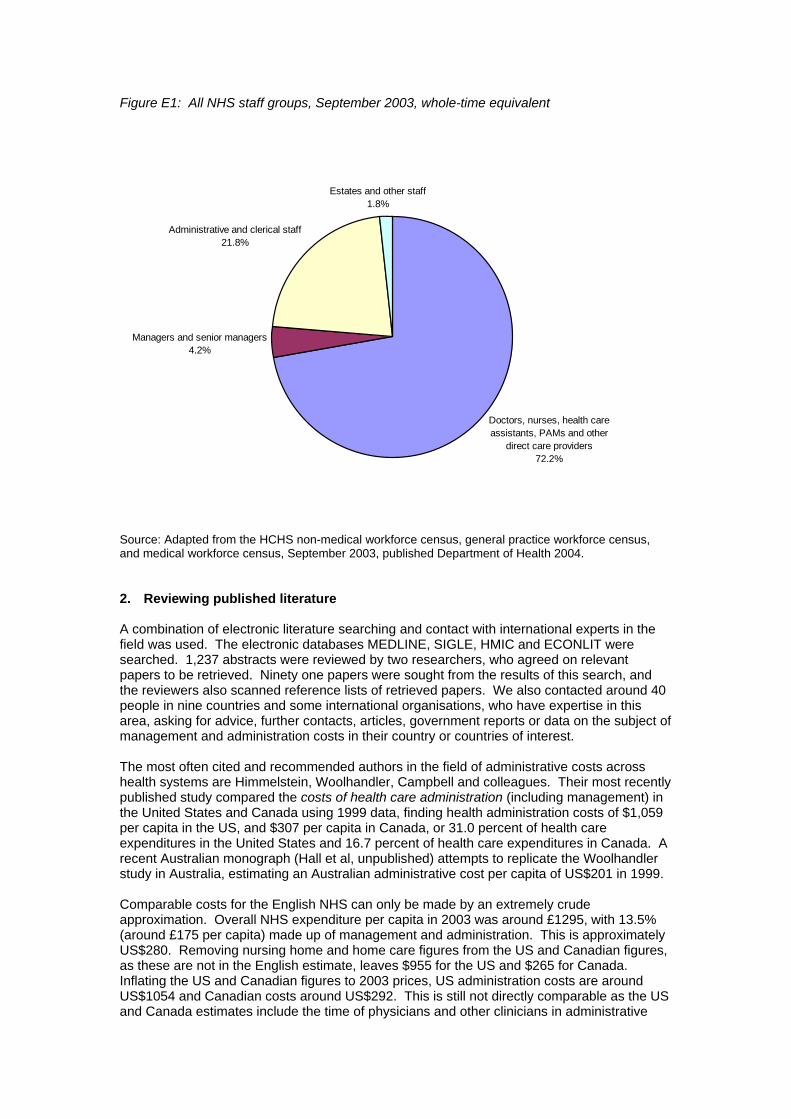
Figure E1: All NHS staff groups, September 2003, whole-time equivalent
Source: Adapted from the HCHS non-medical workforce census, general practice workforce census, and medical workforce census, September 2003, published Department of Health 2004. 2. Reviewing published literature A combination of electronic literature searching and contact with international experts in the field was used. The electronic databases MEDLINE, SIGLE, HMIC and ECONLIT were searched. 1,237 abstracts were reviewed by two researchers, who agreed on relevant papers to be retrieved. Ninety one papers were sought from the results of this search, and the reviewers also scanned reference lists of retrieved papers. We also contacted around 40 people in nine countries and some international organisations, who have expertise in this area, asking for advice, further contacts, articles, government reports or data on the subject of management and administration costs in their country or countries of interest. The most often cited and recommended authors in the field of administrative costs across health systems are Himmelstein, Woolhandler, Campbell and colleagues. Their most recently published study compared the costs of health care administration (including management) in the United States and Canada using 1999 data, finding health administration costs of $1,059 per capita in the US, and $307 per capita in Canada, or 31.0 percent of health care expenditures in the United States and 16.7 percent of health care expenditures in Canada. A recent Australian monograph (Hall et al, unpublished) attempts to replicate the Woolhandler study in Australia, estimating an Australian administrative cost per capita of US$201 in 1999. Comparable costs for the English NHS can only be made by an extremely crude approximation. Overall NHS expenditure per capita in 2003 was around £1295, with 13.5% (around £175 per capita) made up of management and administration. This is approximately US$280. Removing nursing home and home care figures from the US and Canadian figures, as these are not in the English estimate, leaves $955 for the US and $265 for Canada. Inflating the US and Canadian figures to 2003 prices, US administration costs are around US$1054 and Canadian costs around US$292. This is still not directly comparable as the US and Canada estimates include the time of physicians and other clinicians in administrative
Doctors, nurses, health care assistants, PAMs and other
direct care providers72.2%
Managers and senior managers4.2%
Administrative and clerical staff21.8%
Estates and other staff1.8%
tasks. This might reasonably be expected to take up between 10 and 25 per cent of English clinicians’ time, thus adding between 3.2% and 7.9% to the percentage of overall costs that are made up of administration and management in England, to be comparable with the Woolhandler figures. This means that between £216 and £277, or between US$346 and US$443 per capita may be spent on management and administration in England, exceeding the Canadian costs. However, the costs of office space and capital are not included in the English approximation, but the US and Canada estimates do not include insurance industry personnel, which underestimates the overall administrative costs of their health systems. For these and other reasons we urge extreme caution around all these comparisons. Workforce comparisons are perhaps safer than estimates of administrative costs. Woolhandler et al report that 27.3% of the US health workforce (in 1999) and 19.1% of the Canadian health workforce (in 1998) worked in administrative and clerical positions. In Australia Hall et al report that in 2001 administrative staff accounted for 21.3% of the health labour force. The English administrative workforce, at around 21.8% of the health workforce (excluding managers) or 26% (including managers), exceeds Canada and Australia, but remains less than the US. Costs of management and administration should not be compared in isolation from considering the efficient and appropriate amount of expenditure on these activities, and the contribution of management and administration to the performance of the health care system. We found only single-country papers assessing the value of management and administration to health care processes and outcomes. Studies may be thought generally consistent with the hypothesis that returns to investment in management may increase at low levels of input, and then diminish and eventually decrease. The English NHS, with relatively low levels of management input therefore shows some evidence that increasing management inputs (during the early to mid-1990s when studies were conducted) might have created a return on investment, if carefully targeted and used efficiently, in terms of better performing services. In the US, where management and administration costs are high, it may be that there are diminishing or even decreasing returns to further investment in most parts of the system. 3. Published international data on administration costs in health care The only source of international comparative data on administrative expenditure we found was OECD. For the only year that UK data exists (1999) this shows the UK as having relatively high administrative costs (ranking 8th highest of the 24 countries). However, the definition of ‘administrative costs’ is limited, perhaps particularly as hospital management costs and the costs of patient records and other administration of public health systems are explicitly excluded. This is not a reasonable comparison and the data was not pursued further. 4. Questionnaire survey of five countries To overcome the problems of published statistics on management and administration costs, a template of questions was derived and sent to international experts in this field from five countries: Australia, Denmark, France, Germany and the Netherlands. The questionnaire included a background of systems of finance and delivery of health care; overall national management and administration workforce and costs; and a description of the management and administration of a ‘typical’ hospital. This final section represented an attempt to move away from often variably defined and collected national data and explore real local resources. Responses were solicited in a very short timescale, and the comprehensiveness of the responses is mixed. It is extremely difficult to derive accurate comparisons of international data, as definitions and interpretations vary, and all results should be viewed very much as preliminary estimates. Global figures on the administration and management workforce in the health care system were derived, although definitional differences might limit their application. In France the management and administration workforce is approximated as around 14% of all health staff, in Australia 21.3%, in the Netherlands 18%, in Germany 13%, in Denmark 7% and in the UK
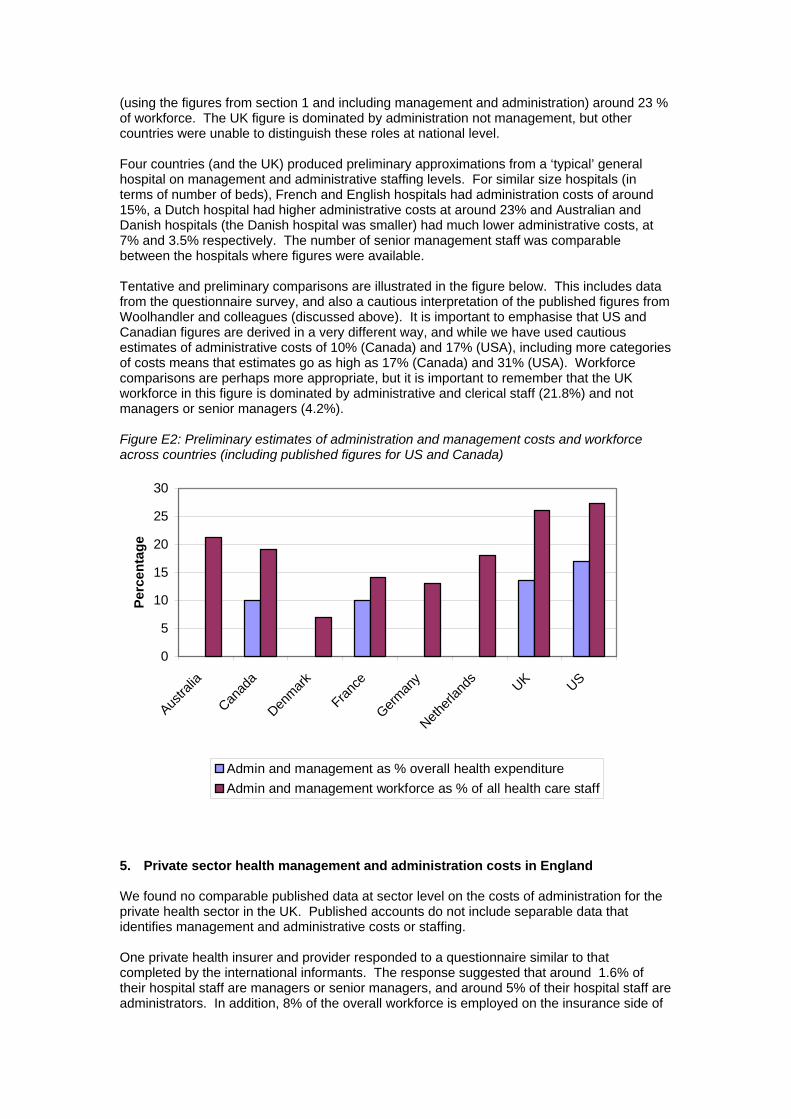
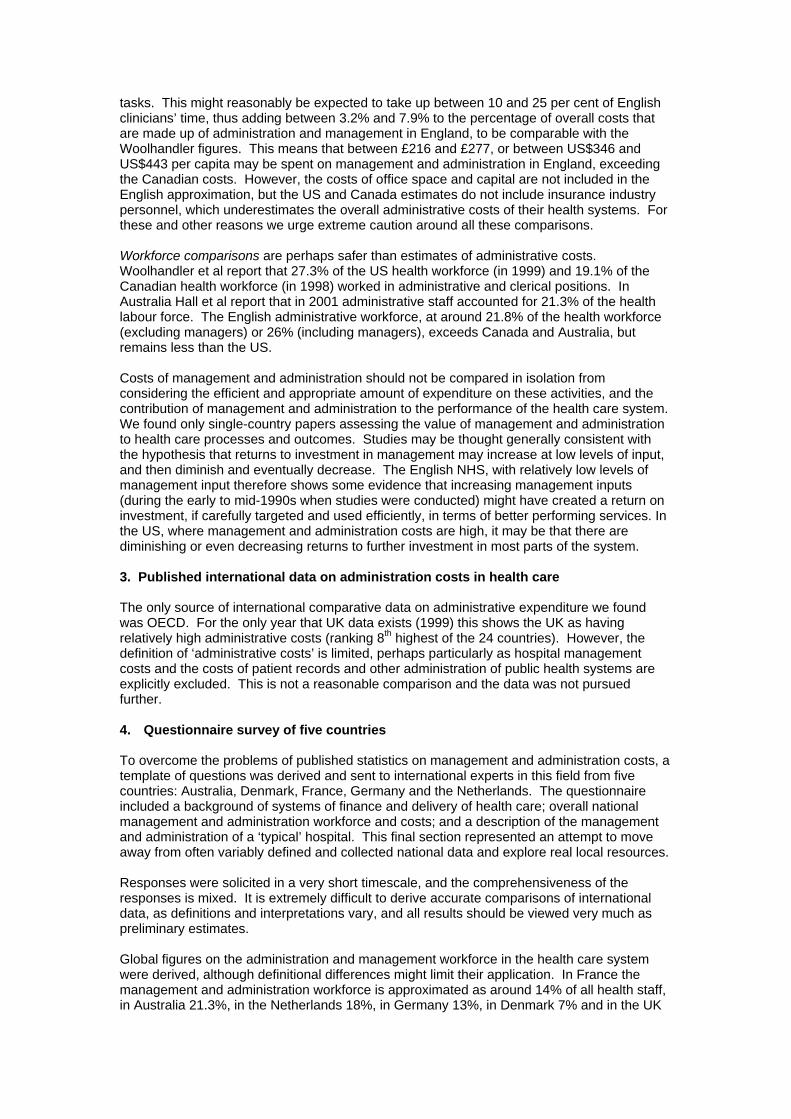
(using the figures from section 1 and including management and administration) around 23 % of workforce. The UK figure is dominated by administration not management, but other countries were unable to distinguish these roles at national level. Four countries (and the UK) produced preliminary approximations from a ‘typical’ general hospital on management and administrative staffing levels. For similar size hospitals (in terms of number of beds), French and English hospitals had administration costs of around 15%, a Dutch hospital had higher administrative costs at around 23% and Australian and Danish hospitals (the Danish hospital was smaller) had much lower administrative costs, at 7% and 3.5% respectively. The number of senior management staff was comparable between the hospitals where figures were available. Tentative and preliminary comparisons are illustrated in the figure below. This includes data from the questionnaire survey, and also a cautious interpretation of the published figures from Woolhandler and colleagues (discussed above). It is important to emphasise that US and Canadian figures are derived in a very different way, and while we have used cautious estimates of administrative costs of 10% (Canada) and 17% (USA), including more categories of costs means that estimates go as high as 17% (Canada) and 31% (USA). Workforce comparisons are perhaps more appropriate, but it is important to remember that the UK workforce in this figure is dominated by administrative and clerical staff (21.8%) and not managers or senior managers (4.2%). Figure E2: Preliminary estimates of administration and management costs and workforce across countries (including published figures for US and Canada)
0
5
10
15
20
25
30
Austra
lia
Canad
a
Denmark
France
German
y
Netherl
ands UK US
Perc
enta
ge
Admin and management as % overall health expenditureAdmin and management workforce as % of all health care staff
5. Private sector health management and administration costs in England We found no comparable published data at sector level on the costs of administration for the private health sector in the UK. Published accounts do not include separable data that identifies management and administrative costs or staffing. One private health insurer and provider responded to a questionnaire similar to that completed by the international informants. The response suggested that around 1.6% of their hospital staff are managers or senior managers, and around 5% of their hospital staff are administrators. In addition, 8% of the overall workforce is employed on the insurance side of

the business and 2% in the group head office. An average private hospital (76 beds) has perhaps 470 staff of whom four are senior managers and 15 other managers. Any comparison between the private health sector and the NHS in the UK would be inappropriate. Private hospitals are much smaller (an average sized NHS hospital is likely to have around 600 beds), they focus on elective surgery in relatively younger and healthier patients and have a much more homogeneous case mix in a small number of service areas. Emergencies tend to be dealt with by the NHS and complex and chronic cases are rare. The management task and the organisational structure is much more straightforward due to the limited range of services provided. 6. Cross sectoral comparison: management and administration in education Education was considered a potentially comparable sector, as a professionally led publicly financed and provided service. However, senior managers in education – school head teachers and university heads of department and vice chancellors, are education professionals, whereas senior managers in the health sector are not generally clinically qualified. While there is an administrative structure to both schools and universities, this is separate from the ‘management’ function. From the Annual Schools Census 2004, the percentage of administrative staff in schools is relatively low (5.7% of staff in nursery, primary and secondary schools), as most administration is carried out by teaching staff. ‘Management’, defined as heads, deputy heads and assistant heads, makes up 4.4% of all school staff, but these ‘management’ staff will often have additional teaching duties, and classroom teaching staff may have substantial management roles and responsibilities (e.g. head of department). The distinction between the professional teaching role and the management of schools is a grey area. In Universities, the management and administrative structure is more complex. Data from the Higher Education Statistics Agency illustrates ‘management’ as around 3% of the overall University sector workforce, and ‘administration’ as around 22%. This is reasonably comparable with the NHS figures. In theory, like in schools, there is likely to be a blurred distinction between ‘academic’ staff (carrying out teaching and research) and ‘administrative’ staff – at departmental level at least, management duties are carried out by academic staff, who also have a substantial administrative role. 7. Research agenda Research should focus on the disaggregated functions of management and administration in different sectors of the NHS, on the value of investment in these functions, in terms of system performance returns, and on the transactions costs of various health systems and reforms. The continuing absence of good measurement and research fuels a rhetorical policial debate of little value to taxpayers and patients.
Acknowledgements We contacted over 40 people in nine countries and some international organisations, who have expertise in this area, asking for advice, further contacts, articles, government reports or data on the subject of management and administration costs in their country or countries of interest. We would like to thank the following people and organisations for their invaluable help and support. Australia Professor Jane Hall (Centre for Health Economics Research and Evaluation University of Technology, Sydney) Canada Professor Morris Barer (University of British Columbia, Vancouver) Professor Bob Evans (University of British Columbia, Vancouver) Professor Stephen Birch (McMaster University) Dr Terry Campbell (Canadian Institute for Health Information) Denmark Professor Kjeld Møller Pedersen (University of Southern Denmark) France Dr Philippe Ulmann (Collège des Economistes de la Santé) Germany Professor Klaus Henke and Dr Susanne Neheider (Technische Universität Berlin) Professor Freddy Schnitzler (DKV Deutsche Krankenversicherungs AG) Professor Reinhard Busse (Technische Universitaet Berlin) The Netherlands Professor Kieke Okma (Ministry of Health) Professor Hans Maarse (University of Maastricht) Dr Milena Pavlova (University of Maastricht) New Zealand Professor Toni Ashton (University of Auckland) UK Dr Diane Dawson (University of York) Nigel Edwards (NHS Confederation) Dr Jonathan Erskine (University of Durham) Sarah Heanley (Department of Health) Bernard Horan (Department of Health) Mr Richard Howe (Department for Education and Skills) Ms Emma Huntridge (York Hospitals Trust) Dr William Laing (Laing and Buisson) Professor Nick Mays (King’s Fund) Professor Martin McKee (London School of Hygiene and Tropical Medicine) Mr James McLaren (Higher Education Statistics Authority) Professor Elias Mossialos (London School of Economics) Ms Sue Spurgin (NHS Confederation) Dr Andrew Street (University of York) Ms Madeleine Watson (Department of Health) Mr Alan Webber (Department of Health) Mr John Wilkinson (Department of Health) US Dr David Himmelstein (Harvard Medical School) Dr John Iglehart (Editor, Health Affairs) Professor Tim Jost (Washington and Lee University)

Dr Steffie Woolhandler (Harvard Medical School) Other national organisations Office for National Statistics BUPA AXA PPP Healthcare Group PLC Aviva PLC International organisations: Professor Per-Gunnar Svensson (International Hospital Federation) Jeremy Hurst (Organisation for Economic Co-operation and Development) Eva Orosz (Organisation for Economic Co-operation and Development)
1
Introduction
“In the face of a rising tide of misplaced criticism over waste and bureaucracy in the NHS, it is time to recognise that investment in high quality management is an investment in patient care” (Gill Morgan, NHS Confederation, 2004) “All that extra money … spent on paper clips instead of patient care, squandered on sticky tape instead of sticking plasters” (David Davidson, Conservative health spokesperson for Scotland, May 2004)
The costs of management and administration in the National Health Service (NHS) remain a
constant source of debate and controversy. As the quotes above demonstrate, some
commentators believe NHS management to be extremely cost-effective, with a relatively
small workforce managing a budget of over £65 billion and a workforce of 1.3 million. Other
commentators believe management and administration costs to be ‘out of control’ and to
detract from patient care rather than adding to it. Both views are ill-informed, as such
commentators fail both to focus on the purposes of such expenditure (the efficient and
equitable finance and delivery of health care) and to estimate cost flows accurately. Accurate
and comparable figures on staff and costs of health care management and administration are
usually absent, and when any figures are present they tend to be used with little consideration
of the fact that administration and management expenditure is a means to an end (patient
care). Indeed where policy makers and commentators use such data they tend to be used ‘as
a drunk uses a lamppost (more for support than for illumination)’.
The debate about management and administration expenditure is not limited to the United
Kingdom. The costs of administration in the US health care system, for example, also create
endless debate. Similar inflammatory language is often used and, as in the UK, management
and administration costs are often seen as more controllable and a more appropriate target
for making savings than the ‘caring professions’ (Fetter 2003). As in the UK, such views often
fail to recognise that management and administrative expenditure is a reflection of the overall
system in place, and that some expenditure is essential to ensure the efficient delivery of
care. The primary policy issue is how investments in management and administration affect
access, efficiency, equity and quality of health care.
Aims and objectives
This report aims to put NHS management costs in context. Attempts are made to obtain
figures for the levels of staff and cost of management and administration of health care in a
number of comparable developed countries’ health systems, in the private health sector in
England, and in education (particularly secondary and higher education) as a comparable
sector (publicly funded, with a professional organisational structure).

2
The following are more detailed project objectives:
1. To outline the number (whole-time equivalent) and costs of NHS management and
administrative staff for England.
2. To review published literature on management and administration costs in health care
systems in the UK and around the world.
3. To review and explore existing sources of internationally comparable data on the
components of health expenditure.
4. To create a template of questions to determine if possible comparable approximate
figures on management and administrative staff and costs from a selection of
countries (France, Germany, Denmark, Australia, the Netherlands).
5. To use national expert contacts to access and interpret local data – using the above
template – to provide data on management and administration staffing and costs in
their health systems, and where possible to determine comparisons across countries.
6. To investigate published accounts of a selection of private health care insurers and
providers in the UK, to explore public-private sector comparisons of health care
management and administration staffing and costs.
7. To explore the possibility of cross-sectoral comparisons of management and
administration costs in comparable, publicly funded, professional service industries
such as school teaching and higher education.
Section 1: Defining management and administration in the English NHS
1.1. Numbers of Management and Administration Staff in the NHS
Table 1 summarises the NHS workforce, including Hospital and Community Health Services
(HCHS) and general practice staff, head count and whole-time equivalent (both rounded) in
2003, from the annual medical and non-medical workforce censuses.
3
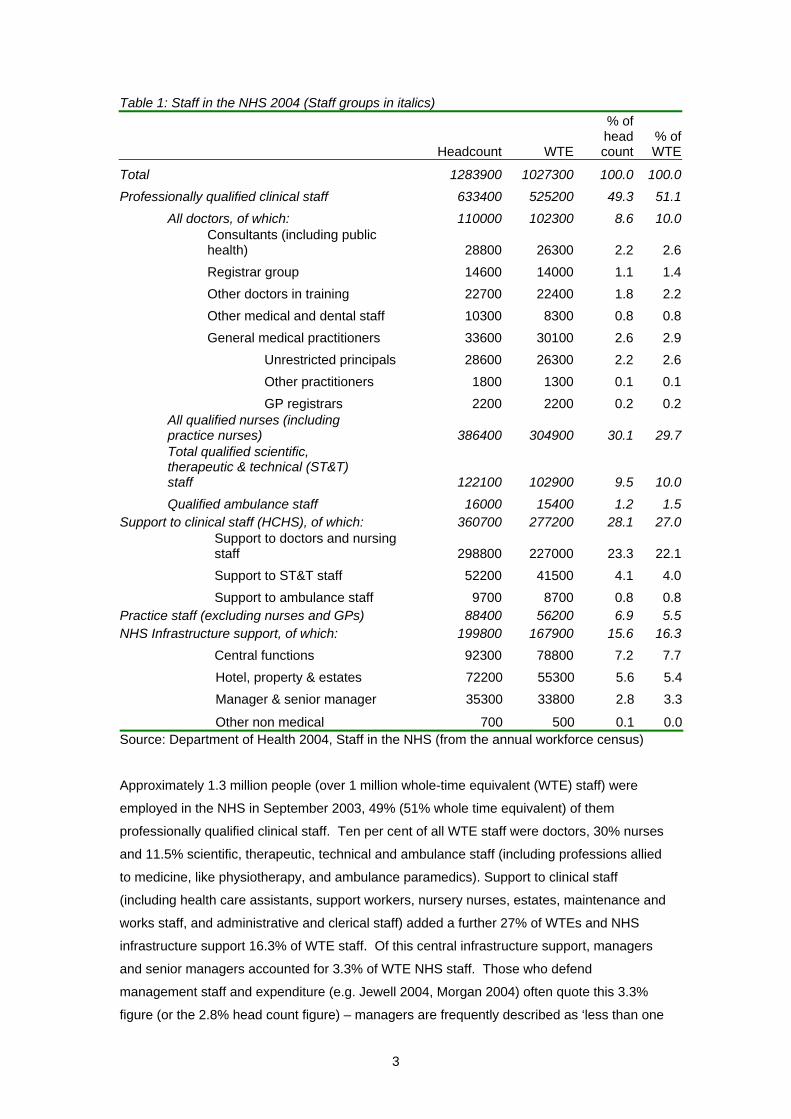
Table 1: Staff in the NHS 2004 (Staff groups in italics)
Headcount WTE
% of head count
% of WTE
Total 1283900 1027300 100.0 100.0Professionally qualified clinical staff 633400 525200 49.3 51.1
All doctors, of which: 110000 102300 8.6 10.0
Consultants (including public health) 28800 26300 2.2 2.6
Registrar group 14600 14000 1.1 1.4 Other doctors in training 22700 22400 1.8 2.2 Other medical and dental staff 10300 8300 0.8 0.8 General medical practitioners 33600 30100 2.6 2.9 Unrestricted principals 28600 26300 2.2 2.6 Other practitioners 1800 1300 0.1 0.1 GP registrars 2200 2200 0.2 0.2
All qualified nurses (including practice nurses) 386400 304900 30.1 29.7Total qualified scientific, therapeutic & technical (ST&T) staff 122100 102900 9.5 10.0Qualified ambulance staff 16000 15400 1.2 1.5
Support to clinical staff (HCHS), of which: 360700 277200 28.1 27.0Support to doctors and nursing staff 298800 227000 23.3 22.1Support to ST&T staff 52200 41500 4.1 4.0Support to ambulance staff 9700 8700 0.8 0.8
Practice staff (excluding nurses and GPs) 88400 56200 6.9 5.5NHS Infrastructure support, of which: 199800 167900 15.6 16.3
Central functions 92300 78800 7.2 7.7Hotel, property & estates 72200 55300 5.6 5.4Manager & senior manager 35300 33800 2.8 3.3
Other non medical 700 500 0.1 0.0Source: Department of Health 2004, Staff in the NHS (from the annual workforce census) Approximately 1.3 million people (over 1 million whole-time equivalent (WTE) staff) were
employed in the NHS in September 2003, 49% (51% whole time equivalent) of them
professionally qualified clinical staff. Ten per cent of all WTE staff were doctors, 30% nurses
and 11.5% scientific, therapeutic, technical and ambulance staff (including professions allied
to medicine, like physiotherapy, and ambulance paramedics). Support to clinical staff
(including health care assistants, support workers, nursery nurses, estates, maintenance and
works staff, and administrative and clerical staff) added a further 27% of WTEs and NHS
infrastructure support 16.3% of WTE staff. Of this central infrastructure support, managers
and senior managers accounted for 3.3% of WTE NHS staff. Those who defend
management staff and expenditure (e.g. Jewell 2004, Morgan 2004) often quote this 3.3%
figure (or the 2.8% head count figure) – managers are frequently described as ‘less than one
4
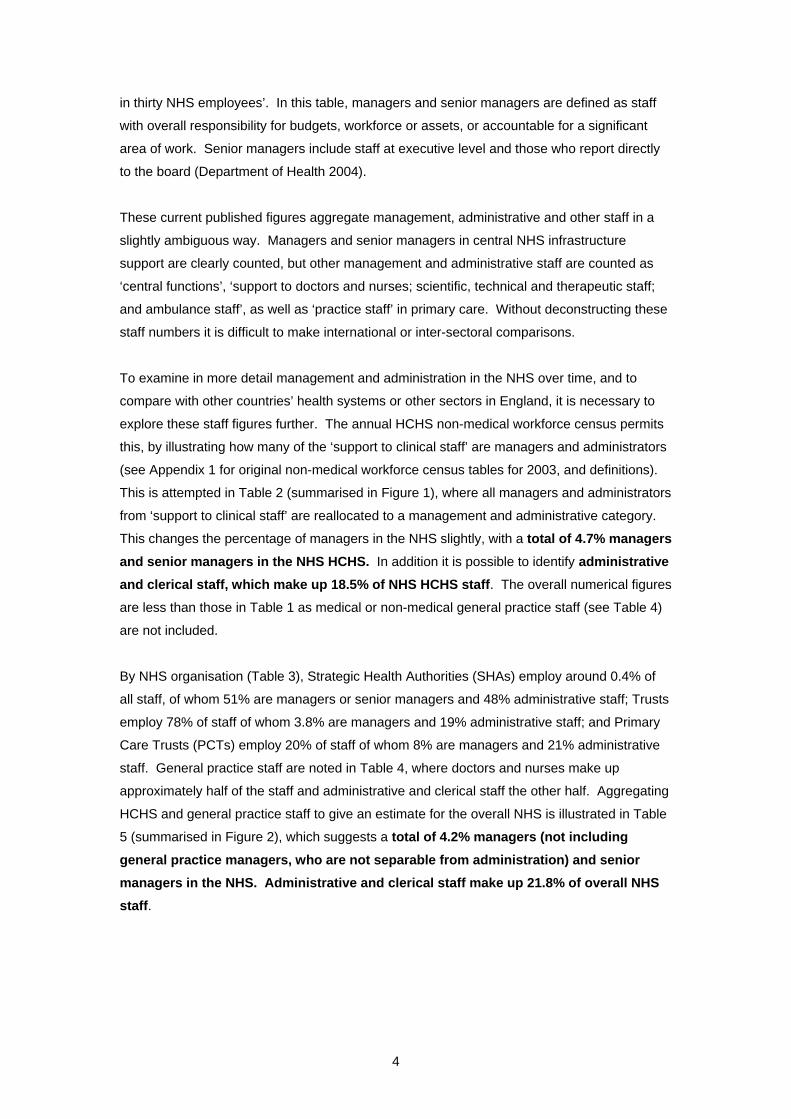
in thirty NHS employees’. In this table, managers and senior managers are defined as staff
with overall responsibility for budgets, workforce or assets, or accountable for a significant
area of work. Senior managers include staff at executive level and those who report directly
to the board (Department of Health 2004).
These current published figures aggregate management, administrative and other staff in a
slightly ambiguous way. Managers and senior managers in central NHS infrastructure
support are clearly counted, but other management and administrative staff are counted as
‘central functions’, ‘support to doctors and nurses; scientific, technical and therapeutic staff;
and ambulance staff’, as well as ‘practice staff’ in primary care. Without deconstructing these
staff numbers it is difficult to make international or inter-sectoral comparisons.
To examine in more detail management and administration in the NHS over time, and to
compare with other countries’ health systems or other sectors in England, it is necessary to
explore these staff figures further. The annual HCHS non-medical workforce census permits
this, by illustrating how many of the ‘support to clinical staff’ are managers and administrators
(see Appendix 1 for original non-medical workforce census tables for 2003, and definitions).
This is attempted in Table 2 (summarised in Figure 1), where all managers and administrators
from ‘support to clinical staff’ are reallocated to a management and administrative category.
This changes the percentage of managers in the NHS slightly, with a total of 4.7% managers and senior managers in the NHS HCHS. In addition it is possible to identify administrative and clerical staff, which make up 18.5% of NHS HCHS staff. The overall numerical figures
are less than those in Table 1 as medical or non-medical general practice staff (see Table 4)
are not included.
By NHS organisation (Table 3), Strategic Health Authorities (SHAs) employ around 0.4% of
all staff, of whom 51% are managers or senior managers and 48% administrative staff; Trusts
employ 78% of staff of whom 3.8% are managers and 19% administrative staff; and Primary
Care Trusts (PCTs) employ 20% of staff of whom 8% are managers and 21% administrative
staff. General practice staff are noted in Table 4, where doctors and nurses make up
approximately half of the staff and administrative and clerical staff the other half. Aggregating
HCHS and general practice staff to give an estimate for the overall NHS is illustrated in Table
5 (summarised in Figure 2), which suggests a total of 4.2% managers (not including general practice managers, who are not separable from administration) and senior managers in the NHS. Administrative and clerical staff make up 21.8% of overall NHS staff.

5
Table 2: Hospital and community health services staff, September 2003, whole-time equivalent
Staff Group Total Direct
care ManagersAdmin &
clerical Other%
care%
managers %
admin%
otherAmbulance staff 24,098 14,631 724 2,697 6,045 60.7 3.0 11.2 25.1 Nursing, Midwifery & Health visiting 291,925 285,553 6,372 - 0 97.8 2.2 - 0.0 Scientific, therapeutic and technical 102,912 100,378 2,534 - 0 97.5 2.5 - 0.0 Support to doctors & nurses 226,955 156,814 - 70,053 88 69.1 - 30.9 0.0 Support to scientific, therapeutic and technical 41,481 28,928 - 12,464 88 69.7 - 30.0 0.2 Infrastructure support 167,916 36,574 33,810 86,493 11,040 21.8 20.1 51.5 6.6 Other
512
- -
- - -
- -
Total non-medical 855,798 622,879 43,439 171,707 17,261 72.8 5.1 20.1 2.0 Medical staff 72,200 72,200 - - - - - - - Total 927,998 695,079 43,439 171,707 17,261 74.9 4.7 18.5 1.9Source: Adapted from the HCHS non-medical workforce census, September 2003, published Department of Health 2004. Figure 1: Hospital and community health services staff groups, September 2003, whole-time equivalent
Source: Adapted from the HCHS medical and non-medical workforce censuses, September 2003, published Department of Health 2004.
Medical staff8.5%
Nursing staff30.0%
Senior managers1.5%
Managers2.7%Administrators
21.8%
Professions allied to medicine9.5%
Health care assistants etc10.0%
Other16.1%

6
Table 3: NHS non-medical HCHS staff by organisation
Total staff % of all
staffTotal
managementTotal
administrative%
management %
administrativeSHAs 3,154 0.4% 1601 1521 50.7% 48.2%Trusts 669,781 78.3% 25598 124961 3.8% 18.7%PCTs 169,188 19.8% 13656 35880 8.1% 21.2%Other 13,676 1.6% 1862 6648 13.6% 48.6% Total 855,799 42716 169010 Source: Adapted from the HCHS non-medical workforce census, September 2003, published Department of Health 2004. Figure 3: NHS HCHS staff by organisation
Table 4: Staff in general practice Staff group WTEPractice nurses 12,967Direct patient care staff 3,031Community nurses 130Admin and clerical 52,250Other staff 891Total non-medical 69,270Medical staff 30,100Total all staff 99,370Percentage admin and clerical 53Source: GP census 2003, published Department of Health 2004
1%
51%48%
77%
4%
19%
71%
8%
21%
Direct care and other staffTotal managementTotal administrative
SHAs
Trusts
PCTs
7
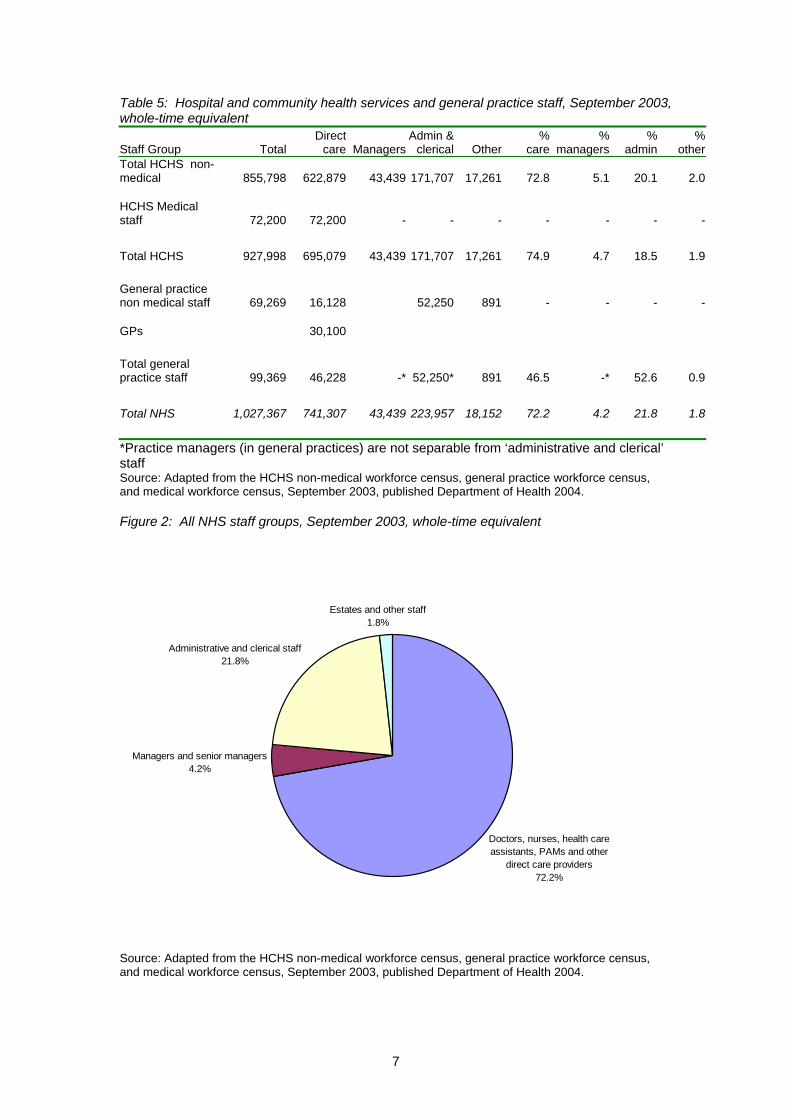
Table 5: Hospital and community health services and general practice staff, September 2003, whole-time equivalent
Staff Group Total Direct
care ManagersAdmin &
clerical Other%
care%
managers %
admin%
otherTotal HCHS non-medical 855,798 622,879 43,439 171,707 17,261 72.8 5.1 20.1 2.0 HCHS Medical staff 72,200 72,200 - - - - - - - Total HCHS 927,998 695,079 43,439 171,707 17,261 74.9 4.7 18.5 1.9 General practice non medical staff 69,269 16,128 52,250 891 - - - - GPs 30,100 Total general practice staff 99,369 46,228 -* 52,250* 891 46.5 -* 52.6 0.9 Total NHS 1,027,367 741,307 43,439 223,957 18,152 72.2 4.2 21.8 1.8 *Practice managers (in general practices) are not separable from ‘administrative and clerical’ staff Source: Adapted from the HCHS non-medical workforce census, general practice workforce census, and medical workforce census, September 2003, published Department of Health 2004. Figure 2: All NHS staff groups, September 2003, whole-time equivalent
Source: Adapted from the HCHS non-medical workforce census, general practice workforce census, and medical workforce census, September 2003, published Department of Health 2004.
Doctors, nurses, health care assistants, PAMs and other
direct care providers72.2%
Managers and senior managers4.2%
Administrative and clerical staff21.8%
Estates and other staff1.8%
8
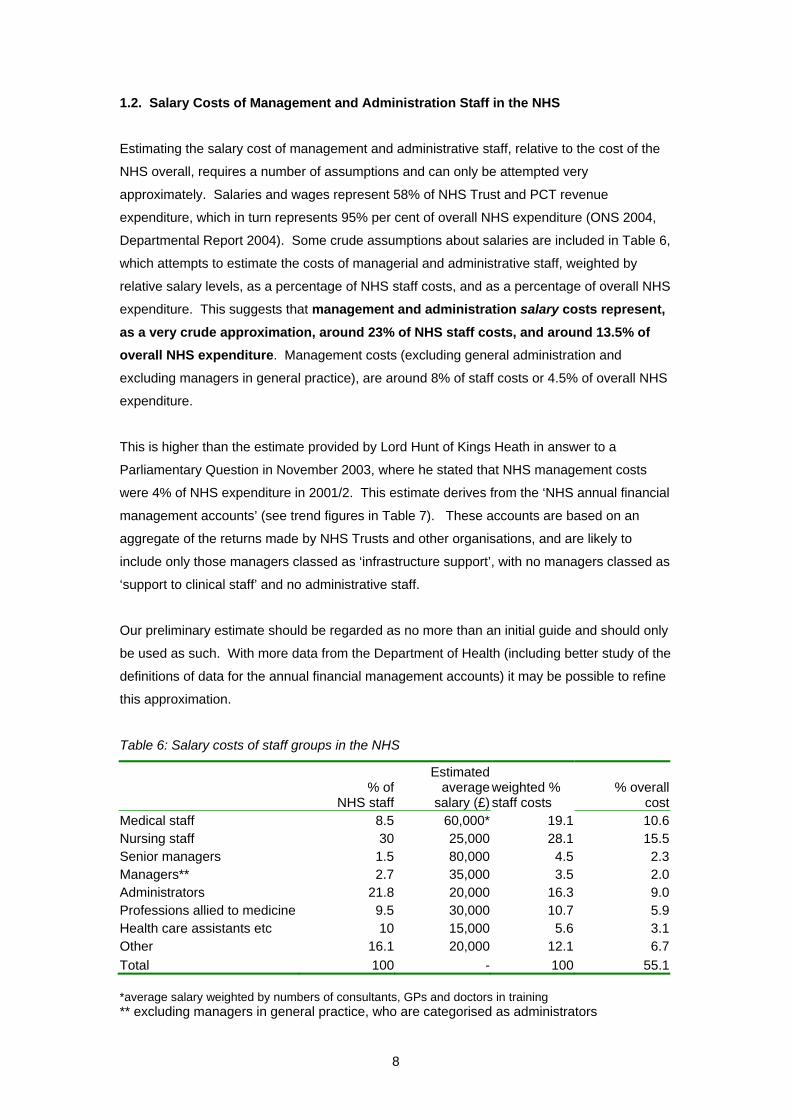
1.2. Salary Costs of Management and Administration Staff in the NHS
Estimating the salary cost of management and administrative staff, relative to the cost of the
NHS overall, requires a number of assumptions and can only be attempted very
approximately. Salaries and wages represent 58% of NHS Trust and PCT revenue
expenditure, which in turn represents 95% per cent of overall NHS expenditure (ONS 2004,
Departmental Report 2004). Some crude assumptions about salaries are included in Table 6,
which attempts to estimate the costs of managerial and administrative staff, weighted by
relative salary levels, as a percentage of NHS staff costs, and as a percentage of overall NHS
expenditure. This suggests that management and administration salary costs represent, as a very crude approximation, around 23% of NHS staff costs, and around 13.5% of overall NHS expenditure. Management costs (excluding general administration and
excluding managers in general practice), are around 8% of staff costs or 4.5% of overall NHS
expenditure.
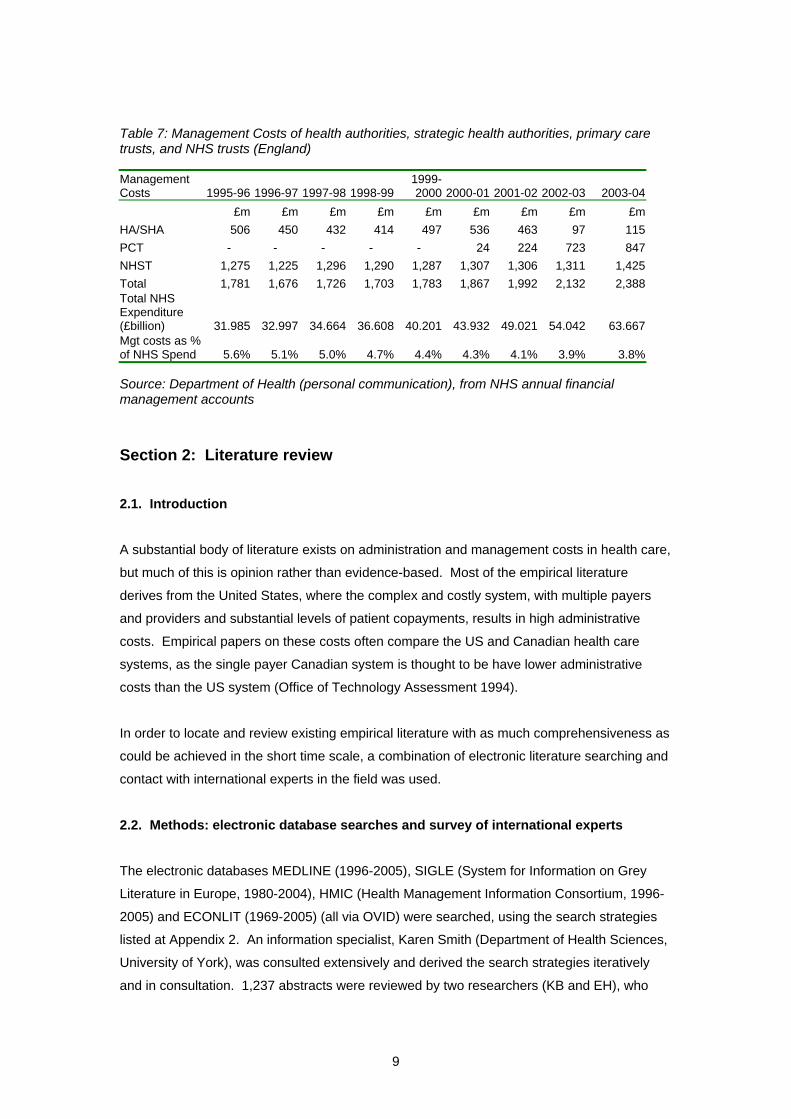
This is higher than the estimate provided by Lord Hunt of Kings Heath in answer to a
Parliamentary Question in November 2003, where he stated that NHS management costs
were 4% of NHS expenditure in 2001/2. This estimate derives from the ‘NHS annual financial
management accounts’ (see trend figures in Table 7). These accounts are based on an
aggregate of the returns made by NHS Trusts and other organisations, and are likely to
include only those managers classed as ‘infrastructure support’, with no managers classed as
‘support to clinical staff’ and no administrative staff.
Our preliminary estimate should be regarded as no more than an initial guide and should only
be used as such. With more data from the Department of Health (including better study of the
definitions of data for the annual financial management accounts) it may be possible to refine
this approximation.
Table 6: Salary costs of staff groups in the NHS
% of
NHS staff
Estimated average
salary (£)
weighted % staff costs
% overall cost
Medical staff 8.5 60,000* 19.1 10.6Nursing staff 30 25,000 28.1 15.5Senior managers 1.5 80,000 4.5 2.3Managers** 2.7 35,000 3.5 2.0Administrators 21.8 20,000 16.3 9.0Professions allied to medicine 9.5 30,000 10.7 5.9Health care assistants etc 10 15,000 5.6 3.1Other 16.1 20,000 12.1 6.7Total 100 - 100 55.1 *average salary weighted by numbers of consultants, GPs and doctors in training ** excluding managers in general practice, who are categorised as administrators
9
Table 7: Management Costs of health authorities, strategic health authorities, primary care trusts, and NHS trusts (England)
Management Costs 1995-96 1996-97 1997-98 1998-99
1999-2000 2000-01 2001-02 2002-03 2003-04
£m £m £m £m £m £m £m £m £m HA/SHA 506 450 432 414 497 536 463 97 115 PCT - - - - - 24 224 723 847 NHST 1,275 1,225 1,296 1,290 1,287 1,307 1,306 1,311 1,425 Total 1,781 1,676 1,726 1,703 1,783 1,867 1,992 2,132 2,388 Total NHS Expenditure (£billion) 31.985 32.997 34.664 36.608 40.201 43.932 49.021 54.042 63.667 Mgt costs as % of NHS Spend 5.6% 5.1% 5.0% 4.7% 4.4% 4.3% 4.1% 3.9% 3.8% Source: Department of Health (personal communication), from NHS annual financial management accounts
Section 2: Literature review
2.1. Introduction
A substantial body of literature exists on administration and management costs in health care,
but much of this is opinion rather than evidence-based. Most of the empirical literature
derives from the United States, where the complex and costly system, with multiple payers
and providers and substantial levels of patient copayments, results in high administrative
costs. Empirical papers on these costs often compare the US and Canadian health care
systems, as the single payer Canadian system is thought to be have lower administrative
costs than the US system (Office of Technology Assessment 1994).
In order to locate and review existing empirical literature with as much comprehensiveness as
could be achieved in the short time scale, a combination of electronic literature searching and
contact with international experts in the field was used.
2.2. Methods: electronic database searches and survey of international experts
The electronic databases MEDLINE (1996-2005), SIGLE (System for Information on Grey
Literature in Europe, 1980-2004), HMIC (Health Management Information Consortium, 1996-
2005) and ECONLIT (1969-2005) (all via OVID) were searched, using the search strategies
listed at Appendix 2. An information specialist, Karen Smith (Department of Health Sciences,
University of York), was consulted extensively and derived the search strategies iteratively
and in consultation. 1,237 abstracts were reviewed by two researchers (KB and EH), who

10
agreed on the relevant papers to be retrieved. Ninety-one papers were sought from the
results of this search, and the reviewers also scanned reference lists of retrieved papers.
We contacted over 40 people in nine countries and some international organisations, who
have expertise in this area, asking for advice, further contacts, articles, government reports or
data on the subject of management and administration costs in their country or countries of
interest. We list these individuals and organisations in the Acknowledgements.
Although literature searching and screening was conducted systematically, due to time
constraints, no attempt has been made to review papers themselves systematically (i.e. with
agreed inclusion and exclusion criteria and explicit assessment of quality). Due to
heterogeneity in the papers, no attempt was made to pool the results of the retrieved studies.
Instead a purely narrative descriptive review is presented.
2.3. Results of literature search
2.3.1. Published international comparisons of expenditure on health care management and
administration
It is important to note that the separation in UK staffing and expenditure between
‘management’ and ‘administration’ is not a feature of international literature or classification.
The two terms are, in our experience, either used interchangeably, not collected separately
(e.g. in OECD figures there is no ‘management’) or are simply pooled as ‘administration’.
A number of international studies (e.g. Anderson et al 2003, Annell and Willis 2000, Tuohy et
al 2004) use OECD health data to compare health systems. We have not reported these
studies here due to the limitations of the OECD data in comparing management and
administrative costs (see section 3).
2.3.1.1. NHS Confederation comparisons
In the UK, a vigorous defender of managers in the NHS is the NHS Confederation. In a
number of their publications and speeches (e.g. Morgan, cited in The Guardian 25/6/2003,
Edwards, 2004) they cite ‘international comparisons of management costs’. For example:
‘International comparisons suggest that NHS management costs are modest. In 2001/2 the service spent almost £2bn on management – about 4% of the total budget. In Australia the private health sector spent 11% and the state Medicare 4%. The US spent 17% of total healthcare budgets on management, and in Canada the figure was 10%.’ (The Guardian: Team Talk; 25/6/03, quoting Dame Gillian Morgan, NHS Confederation)
11
It is difficult to trace the sources of these encouraging figures. In a footnote of another NHS
Confederation report (Edwards 2004) some of these figures are repeated with sources:
‘While it is difficult to make direct comparisons, the available data does suggest that the NHS spends less on management than many other health care systems. For example, Professor Bruce Fetter of the University of Wisconsin, Milwaukee, has calculated that England’s 4% spend on management costs compares with 10% in Canada and 17% in USA hospitals (Healthcare costs: Draining Us Dry, Fetter, Milwaukee Journal Sentinel, February 1 2003)
The 4% NHS figure appears to relate not to Professor Fetter’s article, which nowhere
mentions NHS costs, but to Lord Hunt’s response to a parliamentary question in November
2003 (see section 1). Professor Fetter (2003) does indeed state that ‘Conservative estimates
suggest that U.S. hospitals spend about 17% of their total budgets on management. This
compares with a little over 10% in Canadian hospitals’, but no data is provided or cited in the
2003 article to support this claim, as the article is an editorial rather than a piece of original
research. We contacted Professor Fetter to enquire about the source of these figures. His
reply was that he relied on Woolhandler and Himmelstein’s research, (described in more
detail below), with an amended (conservative) figure for ‘administration and management’ that
excludes some of the ‘mixed administrative and clinical’ categories (e.g. time spent on
administration by clinical staff, housekeeping, laundry etc.).
“I like the direction of their work but fear that they exaggerate their case against excessive administrative expenses in US medicine by including categories of expenditure which should not be counted. … I reduced their estimate of administration costs of hospital spending from 24.8% [using the 1993 article] to 17% by eliminating the last three (of four) categories in their calculation.”
(B Fetter, personal communication)
This clarifies the figures used by Fetter (and then by the NHS Confederation), but it becomes
very clear that these estimates refer to both management and administration, whereas the 4% cited by Lord Hunt and by the NHS Confederation refers to management alone.
In order to make appropriate comparisons it is necessary to include administration costs in
the English health care system.
The figures quoted by the NHS Confederation for Australian costs (11% for the private health
industry and 4% for Medicare) apparently originate from the Australian Medical Association,
but again no precise source is cited. We contacted the Australian Medical Association (AMA),
who referred us to a published report on private sector costs (Private Health Insurance
Administration Council (PHIAC) 2005 Operations of the Registered Health Benefits
Organisations Annual Report 2003-04, PHIAC, Canberra, Australia), which does report
management expenses on average for the industry (the mean of reported costs per private
sector insurance company) to be 11.2% of benefits or 9.9% of contribution income. This
translates to a cost of AUS$183 per average contributor and AUS$86 per covered person. It
12
is inappropriate to make any comparison between these private sector insurance industry
costs and the English NHS, particularly when there is no clear record of the methods used to
derive these costs, and this is a financial reporting exercise rather than research or policy
exploration into management costs. The AMA had no knowledge of the source of the 4%
Medicare figure. We have contacted the Medicare offices of the Australian Health Insurance
Commission and await a reply.
2.3.1.2. US comparisons: Himmelstein, Woolhandler, Campbell and colleagues
The most often cited authors in the field of research in administrative costs across health
systems are Himmelstein, Woolhandler, Campbell and colleagues. Their most recently
published study (Woolhandler et al NEJM, 2003), compared the costs of health care
administration in the United States and Canada using 1999 data. The figures on hospital
administrative costs were based on a classification system used by the U.S.Medicare
program. The authors were contacted regarding whether or not they included hospital
management in their definition of administration, and the classification of clinical managers,
and received the following response:
“Virtually all hospital managers' salaries would be classified as administrative costs. A hospital-based doctor or hospital-based nurse who spent most of their time as a manager would also have their salary categorized as an administrative cost. We actually verified the Medicare classification system by looking up job titles and Medicare cost classifications for a series of managers within our own hospital (several of whom had RN or MD degrees) whose jobs and work we were personally familiar with. The Medicare classification system was reasonable accurate in classifying administrative personnel as administrative and clinical personnel as clinical.” (Woolhandler, personal communication)
The authors calculated the administrative costs of health insurers (using insurance overheads
and administration costs of government programmes), employers' health benefit programs
(using the employers’ costs of managing benefits), administrative costs of hospitals,
practitioners' offices (including estimates of the value of physicians’ own time devoted to
administration as well as estimates of office expenses attributable to administrative work),
nursing homes, and home care agencies. They found that health administration costs were at
least US$294.3 billion in the United States, or US$1,059 per capita, as compared with
US$307 per capita in Canada. They estimated that administration accounted for 31.0 percent of health care expenditures in the United States and 16.7 percent of health care expenditures in Canada.
Earlier studies (e.g. Woolhandler and Himmelstein 1991, Woolhandler et al 1993,
Himmelstein et al 1996, Woolhandler and Himmelstein 1997) derived similar results, and the
proportion of health expenditure that is taken up by administrative costs has been increasing
over time, particularly in the US. The authors also found that for-profit hospitals tended to
13
have higher administrative costs than not-for-profit hospitals. The US figures were updated
recently in Himmelstein et al 2004, simply by applying the proportion of administrative costs
as calculated in 1999 to 2003 expenditure data. This results in US administrative costs of
US$1389 per capita. The authors speculate that ‘implementing single-payer national health
insurance could cover the uninsured and upgrade coverage for most Americans without
increasing costs; savings on insurance overhead and other bureaucracy would fully offset the
costs of improved care’ (Himmelstein and Woolhandler 2003).
These studies, though interesting and influential, have been criticised. The estimates depend
critically on assumptions of which costs should be allocated to administration, and
international comparisons – with different accounting conventions and institutional
arrangements – are extremely difficult (Aaron 2003). Fetter (2003) apparently reduced the
proportion spent on administration by removing categories where there is a blurred distinction
between ‘clinical’ and ‘administrative’, or where the categories are mixed. However, it seems
unarguable that US health administration costs are very high, and indeed are much higher
than those in Canada. Even Aaron (2003), a critic of Woolhandler et al, describes the US
health care system as ‘an administrative monstrosity’.
Blumenthal (1993), commenting on the 1993 Woolhandler study, thought it might confirm US
physicians views on what he calls the ‘“suits and suites” syndrome – the apparent proliferation
of well-appointed administrators and their office space in health care facilities of all varieties’.
Blumenthal does, however, advise physicians to ‘avoid the temptation to personalize the
breakdown of the health care system by seeing administrators and administration as the root
cause. Blaming the problems of American health care on its administration is as useful as
attributing a patient’s septic shock to his or her fever. … The administrative expenses of our
health care system are a symptom, not the cause, of our system’s profound and worsening
illness. The surest way to eliminate administrative waste is to attack its underlying cause
through comprehensive health care reform’. In comparing the health care systems of different
countries it is essential to keep in mind that administrative costs reflect the structure of the
health care system itself.
2.3.1.3. Australian replication of Woolhandler et al
A recent Australian monograph (Hall et al, unpublished) attempts to replicate the Woolhandler
et al 2003 study to explore costs of administration of health care in Australia. The authors
speculate that Australia, with a complex mix of public and private health care finance and
provision, should create administrative costs that fall between those of the US and those of
Canada. Published data on some health administration expenditure (AIHW 2003) suggests
that health administration costs around AUS$97 per capita, or 3.07% of total health spending,
much lower than the Woolhandler estimates for both the US and Canada, but this figure does
14
not include many of the cost categories that are included in Woolhandler. Hall et al’s more
detailed (although still approximate) estimate using similar cost categories to Woolhandler
finds an Australian administrative cost per capita of US$201 in 1999, still lower than both the
Canadian and US figures. The Australian authors also discuss the immense difficulty of
obtaining detailed data and of what constitutes ‘administration’, and they highlight the impact
in Australia of new technology, particularly IT, which can shift administrative costs away from
secretarial and clerical workers to higher paid IT support workers, instead of making cost
savings (as occurred with a recent Australian IT reform). This is a cautionary tale with regard
to the current NHS national programme for information technology.
2.3.1.4. Appoximate comparison with the English NHS
Comparable costs for the English NHS can only be made by an extremely crude
approximation. The population of England (from the 2001 census) is 49.14 million. Overall
NHS expenditure per capita in 2003 was therefore around £1295, with 13.5% (around £175)
made up of the staff costs of management and administration. This is approximately US$280.
It is necessary to remove nursing home and home care figures from the US and Canadian
figures, as these are not in the English estimate. This leaves $955 for the US and $265 for
Canada. Inflating the US and Canadian figures to 2003 prices, US administration costs are
around US$1054 and Canadian costs around US$292. This is still not directly comparable as
the US and Canada estimates include the time of physicians and other clinicians in
administrative tasks. This might reasonably be expected to take up between 10 and 25 per
cent of English clinicians’ time, thus adding between 3.2% and 7.9% to the percentage of
overall costs that are made up of administration and management in England, to be
comparable with the Woolhandler figures. This means that between £216 and £277, or
between US$346 and US$443 per capita is spent on management and administration in
England, exceeding the Canadian costs. In addition, the costs of office space and capital are
not included in the English approximation, but the US and Canada estimates do not include
insurance industry personnel, which underestimates the overall administrative costs of their
health systems. The 17% and 10% cited by Fetter (2003), who uses Woolhandler and
Himmelstein but eliminates mixed categories of cost that are not very clearly ‘administrative’
is an alternative figure to use for comparisons, and this supports the above approximation,
where English management and administration costs (at 13.5% of overall costs) lie between
Canadian management and administration costs (10%) and US costs (17%).
We urge extreme caution around all these tentative and approximate comparisons. The method of calculating administrative costs was much more detailed in the US and
Canadian figures, and costs were estimated in a completely different way. Given more time
and further access to expenditure data it may be possible to approximate a figure more
comparable with the Woolhandler methods, but until this is attempted we recommend

15
extreme caution around the use of this crude approximation. The lack of clear definition
between ‘managers’ (those with clear responsibility for budgets and personnel) and
‘administrators’ (non-clinical staff with less budget and staff responsibility) is also a limitation
when comparing the US and Canada with the English NHS. Comparing across countries
without ensuring clear and comparable methods is unsatisfactory, but using crude
approximations it appears that English management and administration costs are likely to
exceed those of Canada and Australia, but remain substantially lower than the US.
Figure 3: Expenditure per capita (US$, 2003 prices) on management and administration in health care NB: Excluding nursing home and home care, assuming 10% of clinician time is admin (in UK)
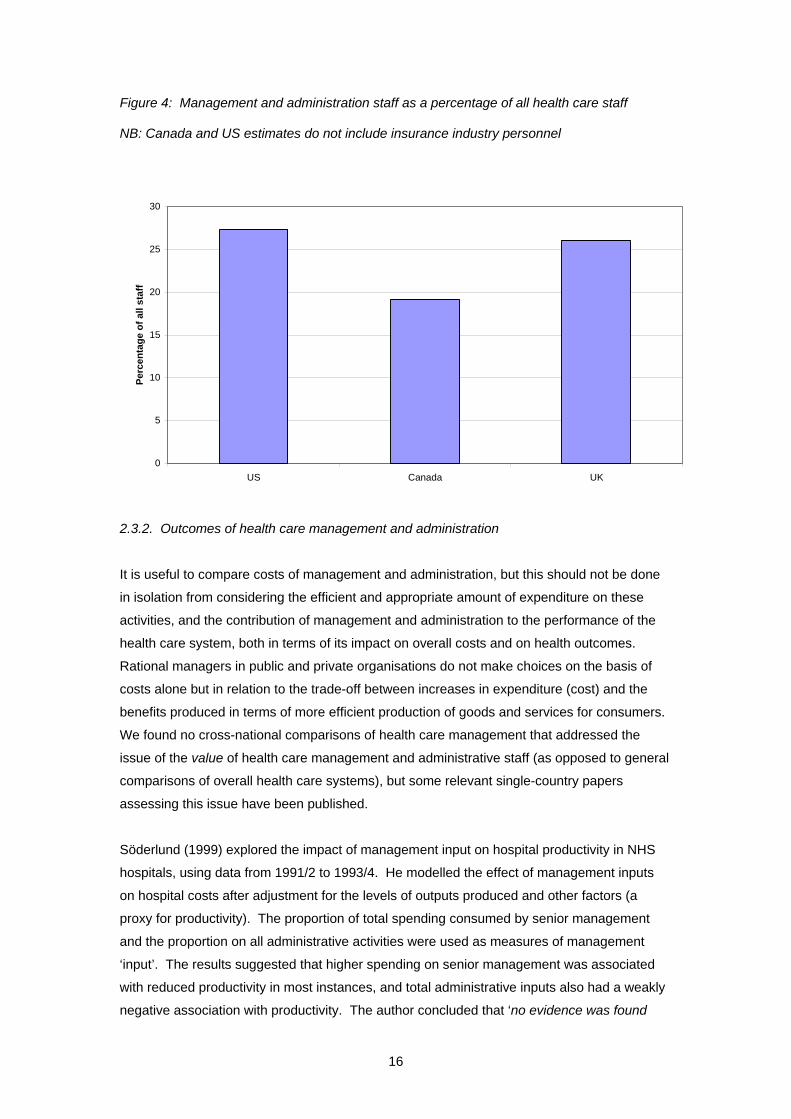
As the estimates of administrative costs for England are so approximate, it might be more
appropriate to use workforce comparisons. Woolhandler et al report that 27.3% of the US
health workforce (in 1999) and 19.1% of the Canadian health workforce (in 1998) worked in
administrative and clerical positions. In Australia Hall et al report that in 2001 administrative
staff accounted for 21.3% of the health labour force. The English administrative workforce, at
around 21.8% of the health workforce (excluding managers) or 26% (including managers),
again exceeds that in Canada and Australia, but remains less than the US.
0
200
400
600
800
1000
1200
US Canada UK
US$
per
cap
ita
16
Figure 4: Management and administration staff as a percentage of all health care staff NB: Canada and US estimates do not include insurance industry personnel
2.3.2. Outcomes of health care management and administration
It is useful to compare costs of management and administration, but this should not be done
in isolation from considering the efficient and appropriate amount of expenditure on these
activities, and the contribution of management and administration to the performance of the
health care system, both in terms of its impact on overall costs and on health outcomes.
Rational managers in public and private organisations do not make choices on the basis of
costs alone but in relation to the trade-off between increases in expenditure (cost) and the
benefits produced in terms of more efficient production of goods and services for consumers.
We found no cross-national comparisons of health care management that addressed the
issue of the value of health care management and administrative staff (as opposed to general
comparisons of overall health care systems), but some relevant single-country papers
assessing this issue have been published.
Söderlund (1999) explored the impact of management input on hospital productivity in NHS
hospitals, using data from 1991/2 to 1993/4. He modelled the effect of management inputs
on hospital costs after adjustment for the levels of outputs produced and other factors (a
proxy for productivity). The proportion of total spending consumed by senior management
and the proportion on all administrative activities were used as measures of management
‘input’. The results suggested that higher spending on senior management was associated
with reduced productivity in most instances, and total administrative inputs also had a weakly
negative association with productivity. The author concluded that ‘no evidence was found
0
5
10
15
20
25
30
US Canada UK
Perc
enta
ge o
f all
staf
f
17
that increasing management inputs was associated with improved productivity. On the
contrary, spending more on top level managers appeared in fact to be associated with lower
productivity levels … Quality differences could not be measured, however, and it is possible
that management input is associated with quality improvements which might reduce or
reverse observed productivity losses’ (Söderlund 1999).
Street et al (1999) used routinely available NHS data from acute hospital trusts in 1994/95
and 1995/96 to explore the question of whether the proportion of a hospital’s income spent on
management is related to the performance of the hospital. The hypothesis tested was that as
management costs increase, as a proportion of total income, performance improves up to a
point and then declines. This implies that managerial investment is subject to diminishing
returns. The authors used routine performance measures including achievement of financial
targets, achievement of waiting time standards and costs of service provision. They found no
general relationship between management costs and hospital performance, but some
evidence of a quadratic relationship between management expenditure and the operating
surplus generated, and performance against the three-month waiting time target. These
results support the hypothesis, suggesting that returns to investment in management improve
up to a point and then decline. The authors suggest that the optimum management
expenditure may be around 5-6% of hospital income (Street et al 1999).
In the US, Himmelstein and Woolhandler (2002) used health maintenance organisations’
administrative costs and quality measures including the Health Plan Employer Data and
Information Set (HEDIS) for the years 1997-2000. HEDIS scores include clinical targets such
as immunisation and screening rates, beta-blocker prescriptions after myocardial infarction,
cholesterol levels below a threshold level in patients hospitalised for acute cardiac events and
advising smokers to quit. Correlation coefficients were used to examine the relationship
between these quality measures and the ‘administrative loss ratio (ALR), defined as a plan’s
total administrative costs divided by its total premium revenues’ (Himmelstein and
Woolhandler 2002). Higher administrative costs were associated with worse quality for
virtually every quality measure in each of the four years. The authors conclude that ‘health
maintenance organizations with higher administrative overhead deliver worse-quality care.
Nor does more administration appear to cut overall costs. Any clinical savings from greater
administrative oversight are fully offset by the costs of the administrators themselves. Excess
bureaucracy isn’t just wasteful, it’s harmful’.
One of the few prospective studies that explores management costs in relation to outcomes
(in terms of achieving stated objectives) is the evaluation of the Total Purchasing Pilots
(Goodwin et al 1998). Objectives included measurable outcomes like reduced length of
hospital stay and reduced emergency admissions, and stated achievements were checked
using routine data (from hospital episode statistics). Of the 52 total purchasing pilots (the

18
forerunners to current Primary Care Trusts), the authors found that the pilots with the highest
direct management costs per capita were the most likely schemes to meet their objectives.
Most of the highest achieving multi-practice pilots were in the top quartile of direct
management costs (Goodwin et al 1998).
Summarising these papers, although there are some conflicting results, all are consistent with
the general hypothesis that returns to investment in management may increase at low levels
of input, and then diminish and eventually decrease. The English NHS, with relatively low
levels of management input, at least before the 1990s, shows some evidence that increasing
management inputs might have created a return on investment (Street et al 1999), if carefully
targeted and used efficiently, in terms of better performing services. In the US, however,
where management and administration costs are high, it may be that there are diminishing or
even decreasing returns to further investment in most parts of the system. The precise
nature of this curvilinear relationship may be function- and system-specific, and can only be
determined by carefully designed microeconomic studies of the costs and benefits of policy
initiatives. Such research in this field is rare, as confirmed by this literature review.
Section 3: International data sources on components of health expenditure
Various sources of international data were searched, including the World Bank, European
Union (Eurostat) and the Organisation of Economic Cooperation and Development (OECD).
The only source of international comparative data on components of health care expenditure
(including administrative expenditure) we found was OECD. Table 8 lists expenditure on
health administration and insurance (as a percentage of total, public and private expenditure)
in a number of OECD countries. For the only year that UK data exists (1999) this shows the
UK as having relatively high administrative costs (ranking 17th out of the 24 countries, with the
lowest administrative costs as ranked 1). A number of problems arise in using this data to
compare the UK with other health systems.
The definition of ‘administrative costs’ is outlined in box 1 below, and its limitations in terms of
international comparisons are evident. Firstly, and perhaps particularly for the purposes of
this project, hospital management costs and the costs of patient records and other
administration of public health systems are explicitly excluded. This limits its usefulness in
comparing public health systems (like the NHS) with each other. In addition, the attempts to
make administrative costs comparable, as undertaken in the ‘system of health accounts’ do
not include the UK. Contact with OECD and with the Office of National Statistics suggests
that there were plans to include the NHS in the system of health accounts, but these plans
are no longer being pursued. The 1999 figure is therefore unlikely to be a particularly good
reflection, and no more recent comparable data exist.

19
Box 1: OECD Definition of administrative costs Expenditure on health administration and insurance (Total, Public, Private)
Health administration and insurance are activities of private insurers and central and local authorities and social security. Included are the planning, management, regulation, and collection of funds and handling of claims of the delivery system. (ICHA function HC.7).
Note: Public administrative costs borne by health care providers such as patient records and hospital management are allocated to the providing institutions, not to general administrations.
General Government administration of health (except social security) comprises a variety of activities of over-all Government administration of health that can not be assigned to HC.1- HC.6: activities such as formulation, administration co-ordination and monitoring of overall health policies, plans, programmes and budgets. Administration, operation and support activities of social security funds comprises the administration, operation and support of social security funds covering health services. Health administration and health insurance of social insurance comprises the administration and operation of private social insurance. Private social insurance is defined in chapters 6 and 11 in A System of Health Accounts.
Health administration and health insurance of other private comprises the administration and operation of all other private health and accident insurance including private health and accident insurance including private for profit insurance.
Source: OECD (2000) A System of Health Accounts, chapter 9.

20
Table 8: Expenditure on health administration and insurance as a percentage of total expenditure on health, THE Countries 1999 2000 2001 2002 2003 Public Private Total Public Private Total Public Private Total Public Private Total Public Private TotalAustralia 2.2 1.0 3.1 2.3 0.9 3.2 2.1 0.8 2.9 Austria 3.7 Canada 0.4 1.5 1.9 0.4 1.6 2.0 0.4 1.9 2.3 0.4 2.1 2.5 0.4 2.2 2.6 Czech Rep 3.1 Denmark 0.9 0 0.9 0.9 0 0.9 0.9 0 0.9 1.0 0 1.0 Finland 2.1 France 0.3 1.6 1.8 0.3 1.7 1.9 0.3 1.7 1.9 0.3 1.6 1.9 0.3 Germany 4.0 1.4 5.4 4.0 1.4 5.4 4.0 1.4 5.4 4.1 1.4 5.5 Hungary 2.1 Iceland 1.7 Italy 0.3 Japan 1.9 Korea 2.7 Luxembourg 5.5 Mexico 8.5 Netherlands 5.1 4.9 4.6 4.4 Portugal 0.1 Slovak Rep 2.9 Spain 2.1 Sweden 0.5 Switzerland 5.2 Turkey 1.9 UK 1.8 1.5 3.3 US 2.1 3.9 6.1 2.2 4.0 6.3 2.2 4.3 6.5 2.2 4.7 6.9 Copyright OECD HEALTH DATA 2004, 1st edition

21
Section 4: International comparisons
4.1. Methods
To overcome the problems of published statistics on management and administration costs, a
template of questions was derived (see Appendix 3) and sent to international experts in this
field from five countries: Australia, Denmark, France, Germany and the Netherlands. We
considered including Canada and US, but decided that the published data from these
countries was better than that available for Europe, so focused our resource on a variety of
European health systems, and the mixed public-private Australian system. The questionnaire
was based on three main sections: firstly a background of systems of finance and delivery of
health care, for context; secondly the overall national management and administration
workforce and costs (structured in a way that was comparable to the published NHS figures);
and finally the international informants were asked to describe and list the management and
administration of a ‘typical’ hospital. This final section represented an attempt to move away
from often variably defined and collected national data and explore real local resources.
The responses to the questionnaire are listed in Appendix 4 and summarised very briefly
below. It is important to remember that responses were solicited in a very short timescale,
and therefore the comprehensiveness of the responses is mixed. It is as always extremely
difficult to derive accurate comparisons of international data, as definitions and interpretations
vary, and all results should be viewed very much as preliminary.
4.2. Country summaries
Country descriptions and answers to the questionnaire are included in Appendix 4. Much
more detail is available in these responses than is presented in the brief summaries and
comparisons below.
4.2.1. Australia
The Australian health care system is a complex mix of publicly and privately funded and
provided services. It has been subjected to reform with the principal aim of increasing the
role of the private insurance industry, with generous tax subsidies (e.g. 30% tax rebate on
premiums) boosting this role, and population personal coverage rising from 30 to almost 50
per cent in recent years (Hall & Maynard, 2005). Seventy per cent of funding is public, with
the Commonwealth Government providing two thirds of this finance and the states, territory
and local governments providing the other third.

22
The Commonwealth-Federal Government subsidises two national schemes, Medicare and
the Pharmaceutical Benefit Scheme (PBS) that provide doctors’ services and
pharmaceuticals. For many, GP services are not free, with fees charged above publicly
reimbursed rates. The Commonwealth-State-Territory governments finance ‘free’ public
hospital care.
The ‘patient journey’ through this system generally starts with a visit to the GP, which may be
free of charge or involve top up charges to the patient, depending on the practices of the
practitioner. Hospital emergency and outpatient care is free in the public sector. Patients in a
public hospital can elect to be public or private. If a patient receives private care in Medicare
(public sector) or in the private sector, fees are charged. Medicare subsidises the fees of
doctors in this case and private insurers pays for accommodation and surgical supplies. The
Government has encouraged ‘no gap’ insurance policies, so generally no user charges are
made for private hospital care.
The complexities of this system should, a priori, have increased administrative costs in
Australia in the last decade. However, as elsewhere in the world, this cost inflation is difficult
to identify, measure and value. With private insurers being unable to control costs and
premium inflation, Government subsidies (in terms of tax foregone) are increasing, putting
pressure on public expenditure and generating political debate. Further reform of regulatory
controls appears likely in the near future and there seems every likelihood that administrative
costs will rise further.
4.2.2. Denmark
The organisation and funding of the Danish health care system has been remarkably stable
over the past 25 years and current market orientated reforms are cautious and marginal. The
system is largely publicly funded and publicly provided: very similar to the traditional, pre-
1990s National Health Service. The public system is managed by local government –
particularly 14 county authorities – which raise revenue from local property and income taxes,
and receive central government grants aimed at equalising financial capacity. Over 80 per
cent of all health expenditure is tax financed. Co-payments provide the remaining 18 per cent
of revenue.
Hospitals are publicly owned and operated and their staff, including medical staff, are all
salaried. Primary care is provided by self-employed professionals (as in the UK) who contract
with the counties. Care is provided free at the point of use.
The private sector is very small. Less than one per cent of hospital beds are provided by the
private sector. Private insurance is similarly marginal.

23
Reform in the Danish health care system is relatively slow, and is creating an increased role
for central government. A public desire to reduce differences in county finance and provision
is evident and it seems likely that in 2006, the number of health financers will be reduced and
the current 14 counties will be replaced by five regions, with a national health tax funding the
system by state block grants. These changes in a simple and stable system appear unlikely
to produce significant inflation in management and administrative costs.
4.2.3. France
The French health care system is basically Bismarckian in structure, with social insurance
funds collecting revenue and care being provided by public and private institutions. In
France, as in Germany, the autonomy of the medical profession, particularly in ambulatory
care, is very pronounced, causing expenditure inflation and inefficiency in the use of, e.g.
pharmaceuticals.
Although Bismarckian in principle, the French system, currently consuming nearly 11 per cent
of GDP, underwent radical change at the hands of the former Socialist Government. Whilst
employer and employee contributions to social insurance remain the largest source of
revenue (54 per cent), solidarity income and excise taxes are now a substantial source of
revenue, funding 34 per cent of expenditure.
Ambulatory care in France is dominated by the principle of ‘liberal medicine’, whereby doctors
are free to set fees and consumers are free to choose their doctors. The consequence of the
former is that patients may be charged in excess of nationally determined fees, while the
latter allows patients to consult many doctors with the same complaint and be reimbursed.
Doctors are salaried in the hospital sector. This is more highly regulated, though without any
substantial degree of efficiency. For example, the ‘hospital map’ constrains the opening of
new facilities in ‘over-provided areas’, but there is little effective management of medical
practice and hospital performance.
Patients using ambulatory health care may face a co-payment (avance de frais). Typically, in
ambulatory and hospital care they will be charged the full, regulated fee for care and then be
reimbursed 70 per cent of the cost from the social insurance office. For practically all the
population, the remaining 30 per cent of the fees (ticket moderateur) is reimbursed by not-for-
profit provident and mutual insurance organisations. The theory behind this complex and
bureaucratic system is that it creates consumer awareness and economy. In practice, there is
no evidence of this effect and doctors, the pharmaceutical industry and consumers drive the
system to high levels of expenditure inflation.
24
Private health insurance in France is limited mostly to complementary insurance, covering
what social insurance does not. One of the largest international firms in the industry (AXA) is
French-owned and continues to advocate the private insurance ‘solution’.
Determining the full administrative costs of generating finance, providing care and recycling
money around the ‘ticket moderateurs’ and ‘avance de frais’ is very difficult. For over a
decade, reformers have sought rationalisation but achieved limited success (Rochaix, 2005).
4.2.4. Germany
The German health care system consists of over 300 sickness funds and the provision of
health care by independent ambulatory practitioners and hospitals owned and operated by
the Länder (states).
The Sickness Funds collect contributions from employees and employers, covering the 90%
of the population who are below an income ceiling. The richest 10% purchase private
insurance. The independence of practitioners and the difficulty of capping expenditure have
led to excessive medical provision in ambulatory care, where there is duplication and
underutilisation of diagnostic capacity, and lengths of stay in hospitals that are excessive by
international standards and manufactured due to perverse incentive payments.
Attempts by the Government to change ambulatory care reimbursement and introduce DRGs
in the hospital system have seen fierce resistance from provider groups and, as a
consequence, Government is having increasing recourse to co-payments as a means of
constraining patient demand and creating an alternative revenue source.
The complex system of negotiating insurance and reimbursement rates is resource-intensive
in management terms. Reformers from the ‘right’ of the political spectrum advocate familiar
insurance and market competition solutions, but the rigidity of the German system is
considerable.
4.2.5. The Netherlands
In its Bismarckian structure, the Dutch health care system exhibits ‘solidarity’ and renewed
attempts at reform, based on the introduction of competitive markets. The Netherlands, like
the UK in the 1990s, experienced an initial period of market reform (following the ‘Dekker
report’). This was eventually abandoned, but more recently the Dutch have reintroduced
competition on both the demand (finance) and supply (provision) sides of the market. In both
25
the UK and the Netherlands, the use of the ‘market’ is likely to alter the configuration and level
of administrative costs.
The principal source of health care funding is health insurance contributions, paid by the
insured and their employers. There is a national system of insurance for exceptional medical
expenses (e.g. chronic heart diseases, cancer etc.) compulsory social insurance for all the
population below an income ceiling and private insurance for the most affluent above this
ceiling.
Hospital provision is in public and private, mostly not for profit institutions. The primary care
physician is the ‘gatekeeper’ to the hospital system (except for emergency care).
Radical reform is under way in the Netherlands. For instance, a system of ‘diagnostic
treatment combinations’ for inpatient and outpatient care is being introduced and, like the
English ‘payment by results’, will determine institutional income. The other radical reform is to
be implemented in 2006 and will introduce regulated competition in both insurance funding
and health care provision. This legislation will abolish the distinction between the public-
social insurance sickness funds and private insurers, allowing any insurer, public or private, to
offer coverage for a basic package, provided it is community rated. Consumers will be able to
switch insurers annually.
In addition to this insurance reform, the Government plans to deregulate health care in order
to provide more flexibility in the negotiation of price, volume and the quality of health service.
The maintenance of any such “flexibility” as uncertain in the Netherlands as elsewhere, as
generally it creates expenditure inflation and the reimposition of regulatory controls.
The Dutch health care system is highly regulated and reform of its structures and processes
are unlikely to reduce administrative burdens. Indeed, market type innovation is likely to raise
the share of such expenditure.
4.3. Summary of results
Global figures on the administration and management workforce in the health care system
were derived, although definitional differences might limit their application. These are listed in
Table 9 and illustrated in Figure 5. In France the management and administration workforce
is approximated as around 14% of all health staff, in Australia 21.3%, in the Netherlands 18%,
in Germany 13%, in Denmark 7% and in the UK (using the figures from section 1 and
including management and administration) around 26% of workforce. The UK figure is
dominated by administration not management, but other countries were unable to distinguish
these roles at national level.
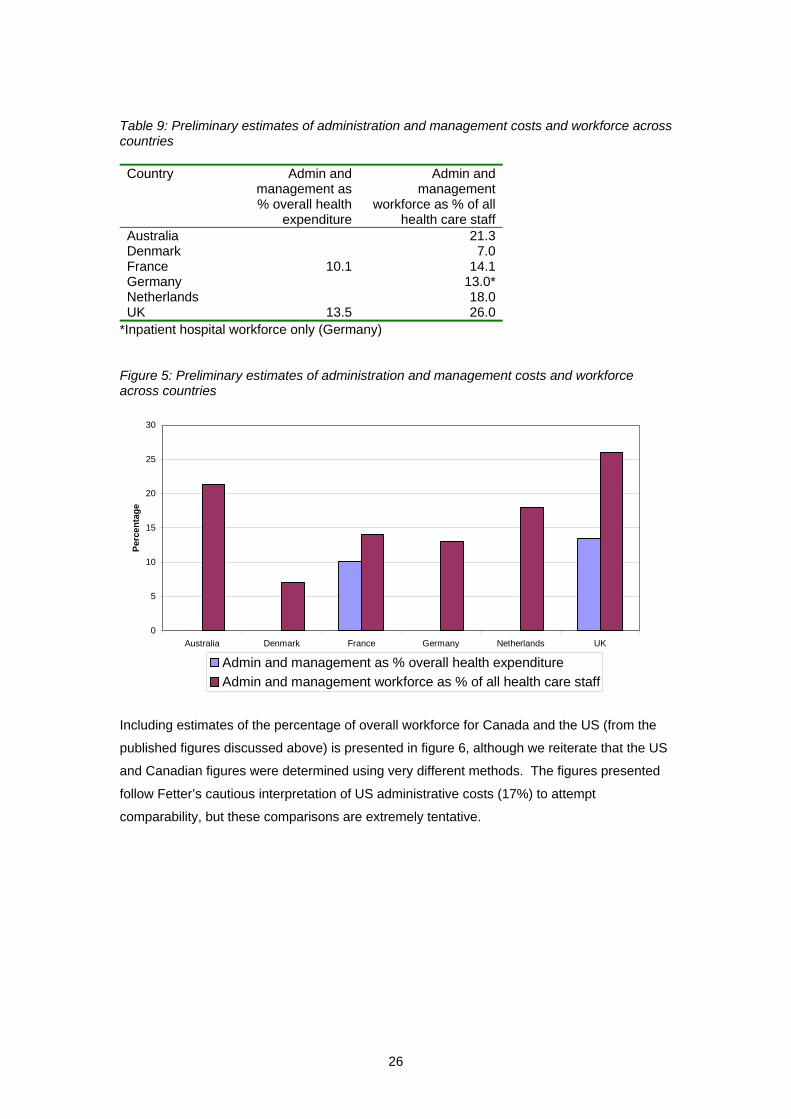
26
Table 9: Preliminary estimates of administration and management costs and workforce across countries Country Admin and
management as % overall health
expenditure
Admin and management
workforce as % of all health care staff
Australia 21.3Denmark 7.0France 10.1 14.1Germany 13.0*Netherlands 18.0UK 13.5 26.0
*Inpatient hospital workforce only (Germany)
Figure 5: Preliminary estimates of administration and management costs and workforce across countries
Including estimates of the percentage of overall workforce for Canada and the US (from the
published figures discussed above) is presented in figure 6, although we reiterate that the US
and Canadian figures were determined using very different methods. The figures presented
follow Fetter’s cautious interpretation of US administrative costs (17%) to attempt
comparability, but these comparisons are extremely tentative.
0
5
10
15
20
25
30
Australia Denmark France Germany Netherlands UK
Perc
enta
ge
Admin and management as % overall health expenditureAdmin and management workforce as % of all health care staff

27
Figure 5: Preliminary estimates of administration and management costs and workforce across countries (including published figures for US and Canada)
0
5
10
15
20
25
30
Austra
lia
Canad
a
Denmark
France
German
y
Netherl
ands UK US
Perc
enta
ge
Admin and management as % overall health expenditureAdmin and management workforce as % of all health care staff
Four of the five countries questioned (and the UK) produced preliminary approximations from
a ‘typical’ general hospital on management and administrative staffing levels. For similar size
hospitals (in terms of number of beds, in the UK this was an average sized English District
General Hospital Trust), French and English hospitals had administration costs of around
15%, a Dutch hospital had higher administrative costs at around 23% and Australian and
Danish hospitals (the Danish hospital was smaller) had much lower administrative costs, at
7% and 3.5% respectively. The number of senior management staff was comparable
between the hospitals where figures were available.
Section 5: Costs of management and administration in private health care insurers and providers in the UK
It is difficult to derive published data at sector level on the costs of administration for the
private health sector in the UK, particularly in any way that is comparable with the NHS
figures above. We explored the published accounts of a number of private health insurers
and providers, as well as published aggregated data from sources like Laing’s Health Care
Marke Review (Laing and Buisson 2004) and found no separable data that identified
management and administrative costs or staffing.
One private health insurer and provider responded to a questionnaire similar to that in
Appendix 3. The response suggested that around 1.6% of their hospital staff are managers
or senior managers, and around 5% of their hospital staff are administrators. In addition, 8%

28
of the overall workforce is employed on the insurance side of the business and 2% in the
group head office. An average private hospital (76 beds) has perhaps 470 staff of whom four
are senior managers and 15 other managers.
Any comparison between the private health sector and the NHS in the UK would be
inappropriate. Private hospitals are much smaller (an average sized NHS hospital is likely to
have around 600 beds), they focus on elective surgery in relatively younger and healthier
patients and have a much more homogeneous case mix in a small number of service areas.
Emergencies tend to be dealt with by the NHS and complex and chronic cases are rare. The
management task and the organisational structure is much more straightforward due to the
limited range of services provided.
Section 6: Cross-sectoral comparisons: costs of management and administration in schools and higher education.
It is pertinent to consider comparisons between different sectors and examine whether
management and administration costs in health care are different from those in other sectors.
Finding an appropriate comparator is challenging – although the costs of management in
private sector profit making companies might intuitively be thought much different (imagine,
for example, the likely costs of managing a big food retailer), the structured and hierarchical
nature of these line managed systems, along with the profit motive and the difference in skill
levels between ‘management’ and ‘workers’ makes it difficult to imagine them as comparable
organisations with the NHS. In health care, the direct care providers (particularly the medical
profession) have much more freedom of action and decision making than employees
providing services in the private sector, and are less directly accountable to line managers for
their performance. Managers cannot possibly have expertise in every area of health care,
and instead must trust the professionalism of their employees. So a private sector company
(e.g. a retail supermarket chain) might have more managers at each level of the organisation,
but also has a workforce that is likely to be less heterogeneous in terms of skills and roles,
and also more used to a line managed and performance managed approach. Performance is
more easily measured (e.g. sales, volumes, profits), managers are more likely to have direct
knowledge and expertise in the roles carried out by their staff, and incentives for performance
are more directly present (performance related pay is more likely to be used, and inadequate
performance may result in termination of employment, both incentives much less likely in
public sector service organisations).
A more comparable sector might be education – this is largely in the public sector, and is led
by a ‘profession’ rather than a line management structure. Interestingly, senior managers in
education are likely to be education professionals – school head teachers are indeed
teachers, and university heads of department and vice chancellors are academics. While
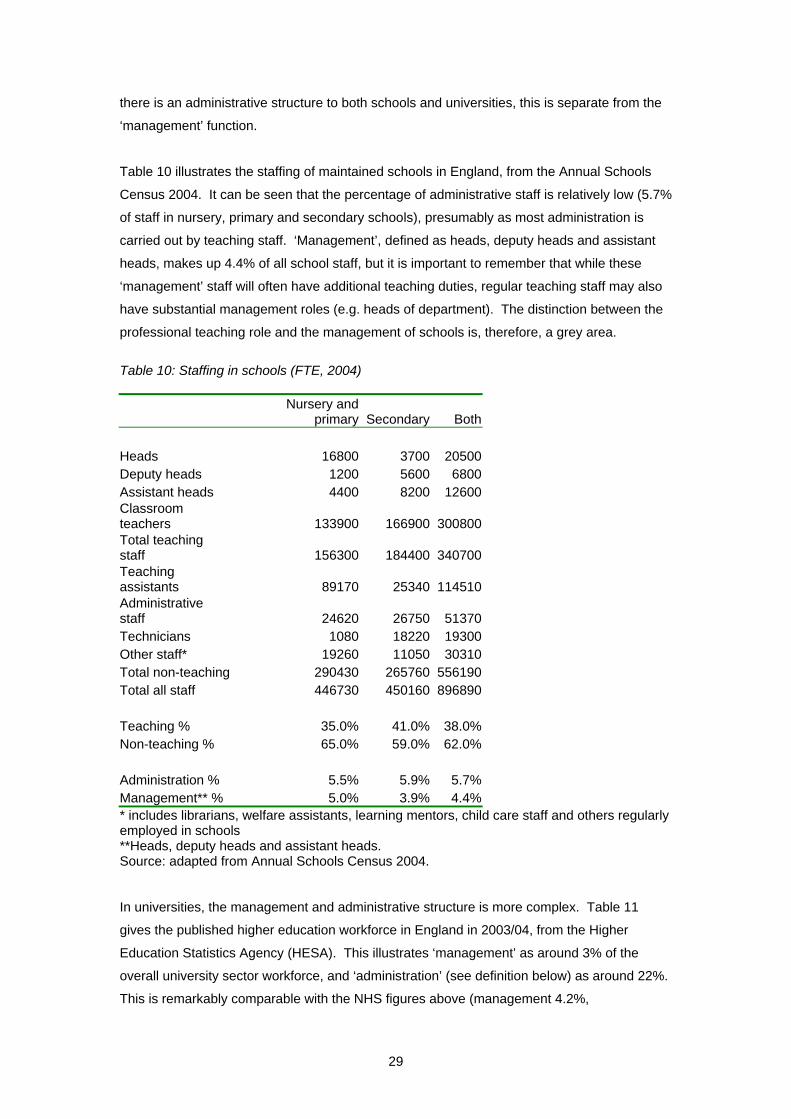
29
there is an administrative structure to both schools and universities, this is separate from the
‘management’ function.
Table 10 illustrates the staffing of maintained schools in England, from the Annual Schools
Census 2004. It can be seen that the percentage of administrative staff is relatively low (5.7%
of staff in nursery, primary and secondary schools), presumably as most administration is
carried out by teaching staff. ‘Management’, defined as heads, deputy heads and assistant
heads, makes up 4.4% of all school staff, but it is important to remember that while these
‘management’ staff will often have additional teaching duties, regular teaching staff may also
have substantial management roles (e.g. heads of department). The distinction between the
professional teaching role and the management of schools is, therefore, a grey area.
Table 10: Staffing in schools (FTE, 2004)
Nursery and
primary Secondary Both Heads 16800 3700 20500Deputy heads 1200 5600 6800Assistant heads 4400 8200 12600Classroom teachers 133900 166900 300800Total teaching staff 156300 184400 340700Teaching assistants 89170 25340 114510Administrative staff 24620 26750 51370Technicians 1080 18220 19300Other staff* 19260 11050 30310Total non-teaching 290430 265760 556190Total all staff 446730 450160 896890 Teaching % 35.0% 41.0% 38.0%Non-teaching % 65.0% 59.0% 62.0% Administration % 5.5% 5.9% 5.7%Management** % 5.0% 3.9% 4.4%* includes librarians, welfare assistants, learning mentors, child care staff and others regularly employed in schools **Heads, deputy heads and assistant heads. Source: adapted from Annual Schools Census 2004. In universities, the management and administrative structure is more complex. Table 11
gives the published higher education workforce in England in 2003/04, from the Higher
Education Statistics Agency (HESA). This illustrates ‘management’ as around 3% of the
overall university sector workforce, and ‘administration’ (see definition below) as around 22%.
This is remarkably comparable with the NHS figures above (management 4.2%,
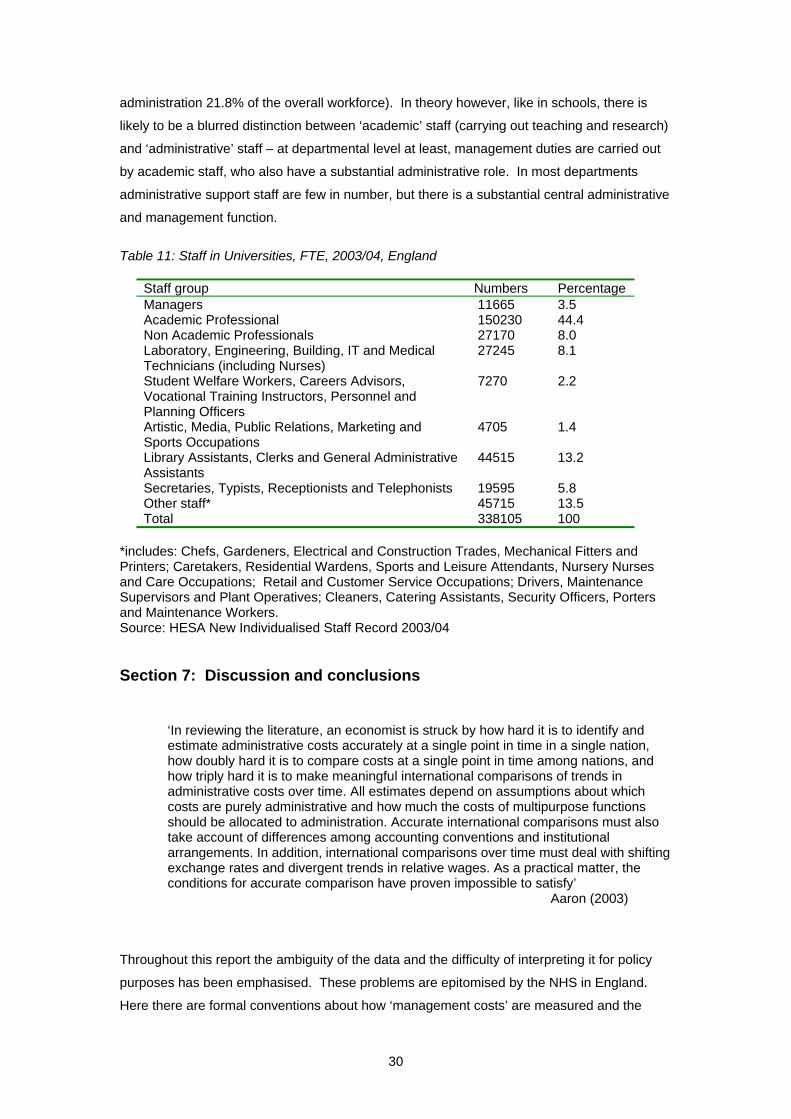
30
administration 21.8% of the overall workforce). In theory however, like in schools, there is
likely to be a blurred distinction between ‘academic’ staff (carrying out teaching and research)
and ‘administrative’ staff – at departmental level at least, management duties are carried out
by academic staff, who also have a substantial administrative role. In most departments
administrative support staff are few in number, but there is a substantial central administrative
and management function.
Table 11: Staff in Universities, FTE, 2003/04, England
Staff group Numbers Percentage Managers 11665 3.5 Academic Professional 150230 44.4 Non Academic Professionals 27170 8.0 Laboratory, Engineering, Building, IT and Medical Technicians (including Nurses)
27245 8.1
Student Welfare Workers, Careers Advisors, Vocational Training Instructors, Personnel and Planning Officers
7270 2.2
Artistic, Media, Public Relations, Marketing and Sports Occupations
4705 1.4
Library Assistants, Clerks and General Administrative Assistants
44515 13.2
Secretaries, Typists, Receptionists and Telephonists 19595 5.8 Other staff* 45715 13.5 Total 338105 100
*includes: Chefs, Gardeners, Electrical and Construction Trades, Mechanical Fitters and Printers; Caretakers, Residential Wardens, Sports and Leisure Attendants, Nursery Nurses and Care Occupations; Retail and Customer Service Occupations; Drivers, Maintenance Supervisors and Plant Operatives; Cleaners, Catering Assistants, Security Officers, Porters and Maintenance Workers. Source: HESA New Individualised Staff Record 2003/04 Section 7: Discussion and conclusions
‘In reviewing the literature, an economist is struck by how hard it is to identify and estimate administrative costs accurately at a single point in time in a single nation, how doubly hard it is to compare costs at a single point in time among nations, and how triply hard it is to make meaningful international comparisons of trends in administrative costs over time. All estimates depend on assumptions about which costs are purely administrative and how much the costs of multipurpose functions should be allocated to administration. Accurate international comparisons must also take account of differences among accounting conventions and institutional arrangements. In addition, international comparisons over time must deal with shifting exchange rates and divergent trends in relative wages. As a practical matter, the conditions for accurate comparison have proven impossible to satisfy’
Aaron (2003)
Throughout this report the ambiguity of the data and the difficulty of interpreting it for policy
purposes has been emphasised. These problems are epitomised by the NHS in England.
Here there are formal conventions about how ‘management costs’ are measured and the

31
Chief Executives of NHS organisations have strict targets against which their performance is
assessed. However these conventions take a very limited view of the opportunity cost of
management. For example they exclude in the hospital setting the role of administration and
the contribution of clinical directors and other routine management practice of doctors and
nurses, e.g. is the writing of a referral letter by a GP, ward records by a nurse or a discharge
report by a consultant part of a practitioner’s clinical, management or administrative role?
Even if greater clarity could be achieved in the identification, measurement and valuation of
administrative costs, the consequent pertinent question is, so what?
If for instance it can be shown that tax financed public health care systems such as the UK-
NHS have lower administrative costs than Bismarckian social insurance systems such as
those in Germany, France and the Netherlands, and they in turn have lower cost than private
insurance systems such as those operating as component parts of the US, German and
Dutch health care systems. What are the implications for a country such as England where
the role of the private sector in health care provision is set to rise to 15 per cent by 2008? Can
simplistic estimates of private sector management costs be used to model the consequences
of such a policy shift when parallel policy changes such as national tariffs, ‘choose and book’,
new contracts for consultants and GPs, Agenda for Change, reforming all job functions, and
the creation of excess capacity to facilitate patient choice are affecting the administrative
costs of public and private providers and PCT commissioners? While all these policy
interventions may at the intuitive level lead to increased administrative costs in the NHS
because, for instance, of the need to collect and code activity data much more accurately, the
exact cost of such changes cannot be inferred accurately from private sector data.
The efficient management of health care is essential and largely absent in all countries. In
particular, micro-management of clinical activity and patient outcomes by the medical
profession and non-clinical managerial colleagues is yet to be planned let alone resourced
and implemented in any nation.
Expenditure on management and administration, in the NHS and in all other health care
systems, must be seen as a means to an end: its purpose is to improve patient care. The
relatively ill-informed and superficial debates around whole system ‘bureaucracy’ make little
attempt to assess the value of management and administration, or accept that some such
expenditure is essential to ensure the appropriate and efficient delivery of care. The primary
policy issue should not be overall management staffing levels or costs, but how investments
of this type affect the performance of the health care system. Levels of management and
administration reflect systems of finance and delivery and the structure of the health care
system: they are symptoms rather than causes of inefficiency in health care delivery.
32
There are no agreed definitions of ‘administration’ and ‘management’ in health care between
(and sometimes even within) countries’ health care systems. Substantial ambiguity exists
around any comparisons, particularly as definitions shift as groups of workers are
recategorised. Consequently, all cross-national and cross-sectoral figures must be viewed
with extreme caution. Particularly limiting to this review is the emphasis in England on
‘management’ whereas other countries do not separate management from administration.
A literature review revealed useful studies comparing administration costs in the US
(predictably high) and Canada (substantially lower), and some single country attempts to
relate management inputs to outcomes (in terms of health sector performance). These
studies may be consistent with the hypothesis that returns to investment in management may
increase at low levels of input, and then returns may diminish to zero and eventually
decrease. In the US, where management and administration costs are high, it may be that
there are diminishing or even decreasing returns to further investment in many parts of the
system.
Historically, Beveridge-type systems like the ‘old’ NHS (pre-1991 reform) have been relatively
inexpensive to manage and administer. The existence of a single payer, in conjunction with
simple resource allocation mechanisms, has substantially limited the number of transactions
needed in the health system and the consequent information and resource requirements.
This has permitted cost control and limited the need for administration costs. General
reluctance to confront clinical freedom has meant that management costs have also
historically been relatively low. Bismarck-type social insurance systems, by having more than
one payer (e.g. multiple sickness funds in Germany) and distinctions between funding and
provision, have historically created more expensive systems, both in general and in terms of
administration costs. Private systems, with a plurality of payers and providers, and a mix of
public and private finance generate a substantial need for information (for billing and
contracting) and systems like the US have historically been expensive to manage and
administer.
As we move towards mixed systems in the UK and elsewhere in Europe, these old
distinctions begin to break down, and current management and administrative inputs (in terms
of staffing and costs) appear to vary less between England, France, Germany and the
Netherlands than might be expected. Inputs in Australia and Denmark appear on first
impressions lower than the other four countries surveyed, but these conclusions are tentative.
In the English NHS, the purchaser-provider split, private finance, national tariffs and other
policies aiming to stimulate efficiency in the system and create a mix of public and private
finance and provision mean almost unavoidably that the more information is needed to make
contracts, hence transactions costs of providing care have increased, and may continue to
increase. At the same time, policy makers, focusing on better monitoring of performance,

33
have also created a need for information systems and management to detect whether
improvements in health care delivery are taking place.
The challenge to research and policy is how to identify the impact of incremental investments
in management and administration on improving system performance and patient outcomes.
The evidence base for the impact of management investment is very limited, largely because
of the apparent obsession of policy makers and researchers with ideological perspectives,
and with overall system administrative costs. Identifying returns to management and
administrative investment can only be achieved by disaggregated analysis, accepting that
different sectors and different objectives require different levels of management and
administration, not by the current focus on ambiguous global sums. The current level of
debate is unhelpful and inappropriate in addressing this more relevant policy question.

34
References
Aaron, H. J. 2003, "The costs of health care administration in the United States and Canada--questionable answers to a questionable question.[comment]", New England Journal of Medicine, vol. 349, no. 8, pp. 801-803.
Anderson, G. F., Reinhardt, U. E., Hussey, P. S., & Petrosyan, V. 2003, "It's the prices, stupid: Why the United States is so different from other countries", Health Affairs, vol. 22, no. 3, pp. 89-105.
Anell, A. & Willis, M. 2000, "International comparison of health care systems using resource profiles. [Review] [16 refs]", Bulletin of the World Health Organization, vol. 78, no. 6, pp. 770-778.
AIHW 2003
Blumenthal, D. 1993, "Administrative Issues In Health Care Reform.[Editorial]", New England Journal of Medicine, vol. 329, no. 6, pp. 428-429.
Department of Health 2004, Staff in the NHS: results of the annual workforce census, September 2003.
Department of Health 2004, GP Census, September 2003.
Department of Health 2004, Departmental Report 2004 Cm 6204.
Edwards N 2004. NHS managers: can we manage without them? NHS Confederation, 2004.
Fetter, B. “Healthcare costs: Draining Us Dry: Don’t assign blame, seek solutions”, Milwaukee Journal Sentinel, February 1 2003.
Goodwin, N., Mays, N., McLeod, H., Malbon, G., & Raftery, J. 1998, "Evaluation of total purchasing pilots in England and Scotland and implications for primary care groups in England: personal interviews and analysis of routine data. The Total Purchasing National Evaluation Team", BMJ, vol. 317, no. 7153, pp. 256-259.
Hall J, Maynard A. Healthcare lessons from Australia: what can Michael Howard learn from John Howard? BMJ, Feb 2005; 330: 357 - 359.
Himmelstein, D. U., Lewontin, J. P., & Woolhandler, S. 1996, "Who administers? Who cares? Medical administrative and clinical employment in the United States and Canada", American Journal of Public Health, vol. 86, no. 2, pp. 172-178.
Himmelstein, D. U. 1999, "Quality of care in investor-owned vs not-for-profit HMOs.[Article]", JAMA, vol. 282, no. 2, pp. 159-163.
Himmelstein, D. U. & Woolhandler, S. 2002, "Taking care of business: HMOs that spend more on administration deliver lower-quality care.", International Journal of Health Services, vol. 32, no. 4, pp. 657-67.
Himmelstein, D. U. & Woolhandler, S. 2003, "National health insurance or incremental reform: aim high, or at our feet?", American Journal of Public Health, vol. 93, no. 1, pp. 102-105.
Himmelstein, D. U., Woolhandler, S., & Wolfe, S. M. 2004, "Administrative waste in the U.S. health care system in 2003: The cost to the nation, the States, and the district of Colombia, with State-specific estimates of potential savings.", International Journal of Health Services, vol. 34, no. 1, pp. 79-86.

35
Himmelstein, D. U., Woolhandler, S., & Wolfe, S. M. 2004, "Administrative waste in the U.S. health care system in 2003: the cost to the nation, the States, and the District of Columbia, with State-specific estimates of potential savings", International Journal of Health Services, vol. 34, no. 1, pp. 79-86.
Jewell B 2005. Lessons with the Prof – are management costs in the NHS excessive? Available at http://www.airedaletrust.nhs.uk/Lessonswiththeprof/ (accessed 14 March 2005)
Laing W (2004). Laing’s Health Care Marke Review (Laing and Buisson, 2004)
Morgan G, 2004. “This supporting life”. Health Service Journal coverage of the Labour Party Conference. Available at http://www.labourconference.hsj.co.uk/policy9.shtml (accessed 14 March 2005)
Office of National Statistics. Health and Personal Social Services Statistics for England 2004.
Office of Technology Assessment 1994. International comparisons of administrative costs in health care. OTA, US Congress, 1994.
Organisation for Economic Cooperation and Development (OECD). OECD Health Data 2004, 1st edition.
Organisation for Economic Cooperation and Development (OECD) (2000) A System of Health Accounts.
Private Health Insurance Administration Council (PHIAC) 2005 Operations of the Registered Health Benefits Organisations Annual Report 2003-04, PHIAC, Canberra, Australia
Soderlund, N. 1999, "Do managers pay their way? The impact of management input on hospital productivity in the NHS internal market", Journal of Health Services & Research Policy, vol. 4, no. 1, pp. 6-15.
Street, A., Carr-Hill, R., & Posnett, J. 1999, "Is hospital performance related to expenditure on management?", Journal of Health Services Research and Policy, vol. 4, no. 1, pp. 16-23.
Tuohy, C. H. 1999, "Dynamics of a changing health sphere: the United States, Britain, and Canada", Health Affairs, vol. 18, no. 3, pp. 114-134.
Tuohy, C. H., Flood, C. M., & Stabile, M. 2004, "How does private finance affect public health care systems? Marshaling the evidence from OECD nations. [Review] [51 refs]", Journal of Health Politics, Policy & Law, vol. 29, no. 3, pp. 359-396.
Woolhandler, S., Himmelstein, D. U., & Lewontin, J. P. 1993, "Administrative costs in U.S. hospitals.[Article]", New England Journal of Medicine, vol. 329, no. 6, pp. 400-403.
Woolhandler, S. & Himmelstein, D. U. 1997, "Costs of care and administration at for-profit and other hospitals in the United States.[Article]", New England Journal of Medicine, vol. 336, no. 11, pp. 769-774.
Woolhandler, S. & Himmelstein, D. U. 1997, "Costs of care and administration at for-profit and other hospitals in the United States.[see comment][erratum appears in N Engl J Med 1997 Dec 11;337(24):1783]", New England Journal of Medicine, vol. 336, no. 11, pp. 769-774.
Woolhandler, S., Campbell, T., & Himmelstein, D. U. 2003, "Costs of health care administration in the United States and Canada", New England Journal of Medicine, vol. 349, no. 8; August 21, pp. 768-775.

36
Woolhandler, S., Campbell, T., & Himmelstein, D. U. 2003, "Costs of health care administration in the United States and Canada.[see comment]", New England Journal of Medicine, vol. 349, no. 8, pp. 768-775.
Woolhandler, S., Campbell, T., & Himmelstein, D. U. 2003, "Costs of health care administration in the United States and Canada [Correspondence]", New England Journal of Medicine, vol. 349, no. 25, pp. 2461-2464.
Woolhandler, S., Campbell, T., & Himmelstein, D. U. 2004, "Health care administration in the United States and Canada: micromanagement, macro costs", International Journal of Health Services, vol. 34, no. 1, pp. 65-78.
Woolhandler, S., Campbell, T., & Himmelstein, D. U. 2004, "Health care administration in the United States and Canada: micromanagement, macro costs", International Journal of Health Services, vol. 34, no. 1, pp. 65-78.