Embed Size (px)
Citation preview

NHS BOLTON CLINICAL COMMISSIONING GROUP Public Board Meeting AGENDA ITEM NO: ………9……………… Date of Meeting: …………..25th August 2017………. TITLE OF REPORT:
CCG Corporate Performance Report
AUTHOR:
Melissa Laskey – Director of Service Transformation Mike Robinson – Associate Director Integrated Governance & Policy Victoria Preston – Senior Information Analyst Melissa Surgey – Head of Planning, Performance and Policy
PRESENTED BY:
Melissa Laskey, Director of Service Transformation
PURPOSE OF PAPER: (Linking to Strategic Objectives)
The purpose of the attached report is to highlight performance against all the key delivery priorities for the CCG in 2017/18 against which NHS Bolton Clinical Commissioning Group is nationally measured
LINKS TO CORPORATE OBJECTIVES (tick relevant boxes):
Deliver Year 2 of the Bolton Locality Plan. Ensure compliance with the NHS statutory duties and NHS Constitution.
X
Deliver financial balance. Regulatory Requirement. Standing Item. X
RECOMMENDATION TO THE BOARD: (Please be clear if decision required, or for noting)
Members are requested to note the content of the report and actions being taken where required to improve performance
COMMITTEES/GROUPS PREVIOUSLY CONSULTED:
Performance is reported to: CCG Clinical Executive Contract Performance Group Quality and Safety Committee
REVIEW OF CONFLICTS OF INTEREST:
N/A
VIEW OF THE PATIENTS, CARERS OR THE PUBLIC, AND THE EXTENT OF THEIR INVOLVEMENT:
Patients’ views are not specifically sought as part of this monthly report, but it is recognised that many of these targets such as waiting times are a priority for patients. The report does include performance against the ‘Friends and Family Test’ at Bolton FT
1

OUTCOME OF EQUALITY IMPACT ASSESSMENT (EIA) AND ANY ASSOCIATED RISKS:
N/A
2
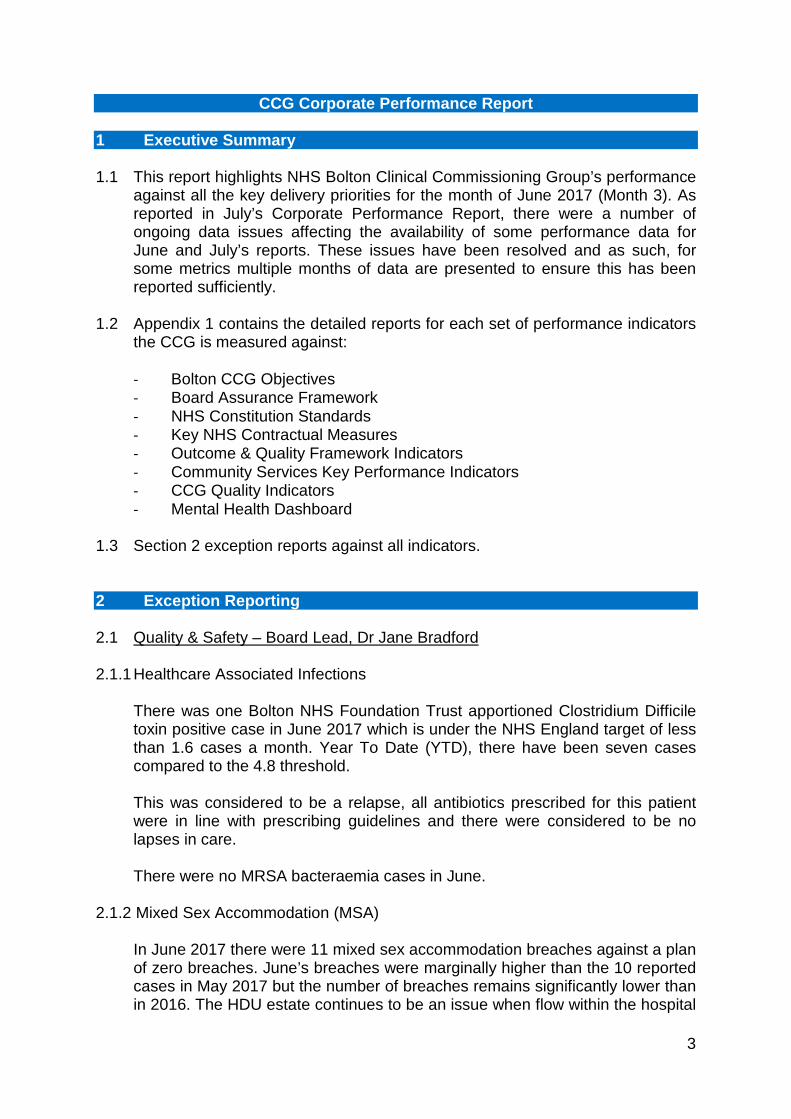
CCG Corporate Performance Report 1 Executive Summary 1.1 This report highlights NHS Bolton Clinical Commissioning Group’s performance
against all the key delivery priorities for the month of June 2017 (Month 3). As reported in July’s Corporate Performance Report, there were a number of ongoing data issues affecting the availability of some performance data for June and July’s reports. These issues have been resolved and as such, for some metrics multiple months of data are presented to ensure this has been reported sufficiently.
1.2 Appendix 1 contains the detailed reports for each set of performance indicators the CCG is measured against: - Bolton CCG Objectives - Board Assurance Framework - NHS Constitution Standards - Key NHS Contractual Measures - Outcome & Quality Framework Indicators - Community Services Key Performance Indicators - CCG Quality Indicators - Mental Health Dashboard
1.3 Section 2 exception reports against all indicators. 2 Exception Reporting 2.1 Quality & Safety – Board Lead, Dr Jane Bradford 2.1.1 Healthcare Associated Infections
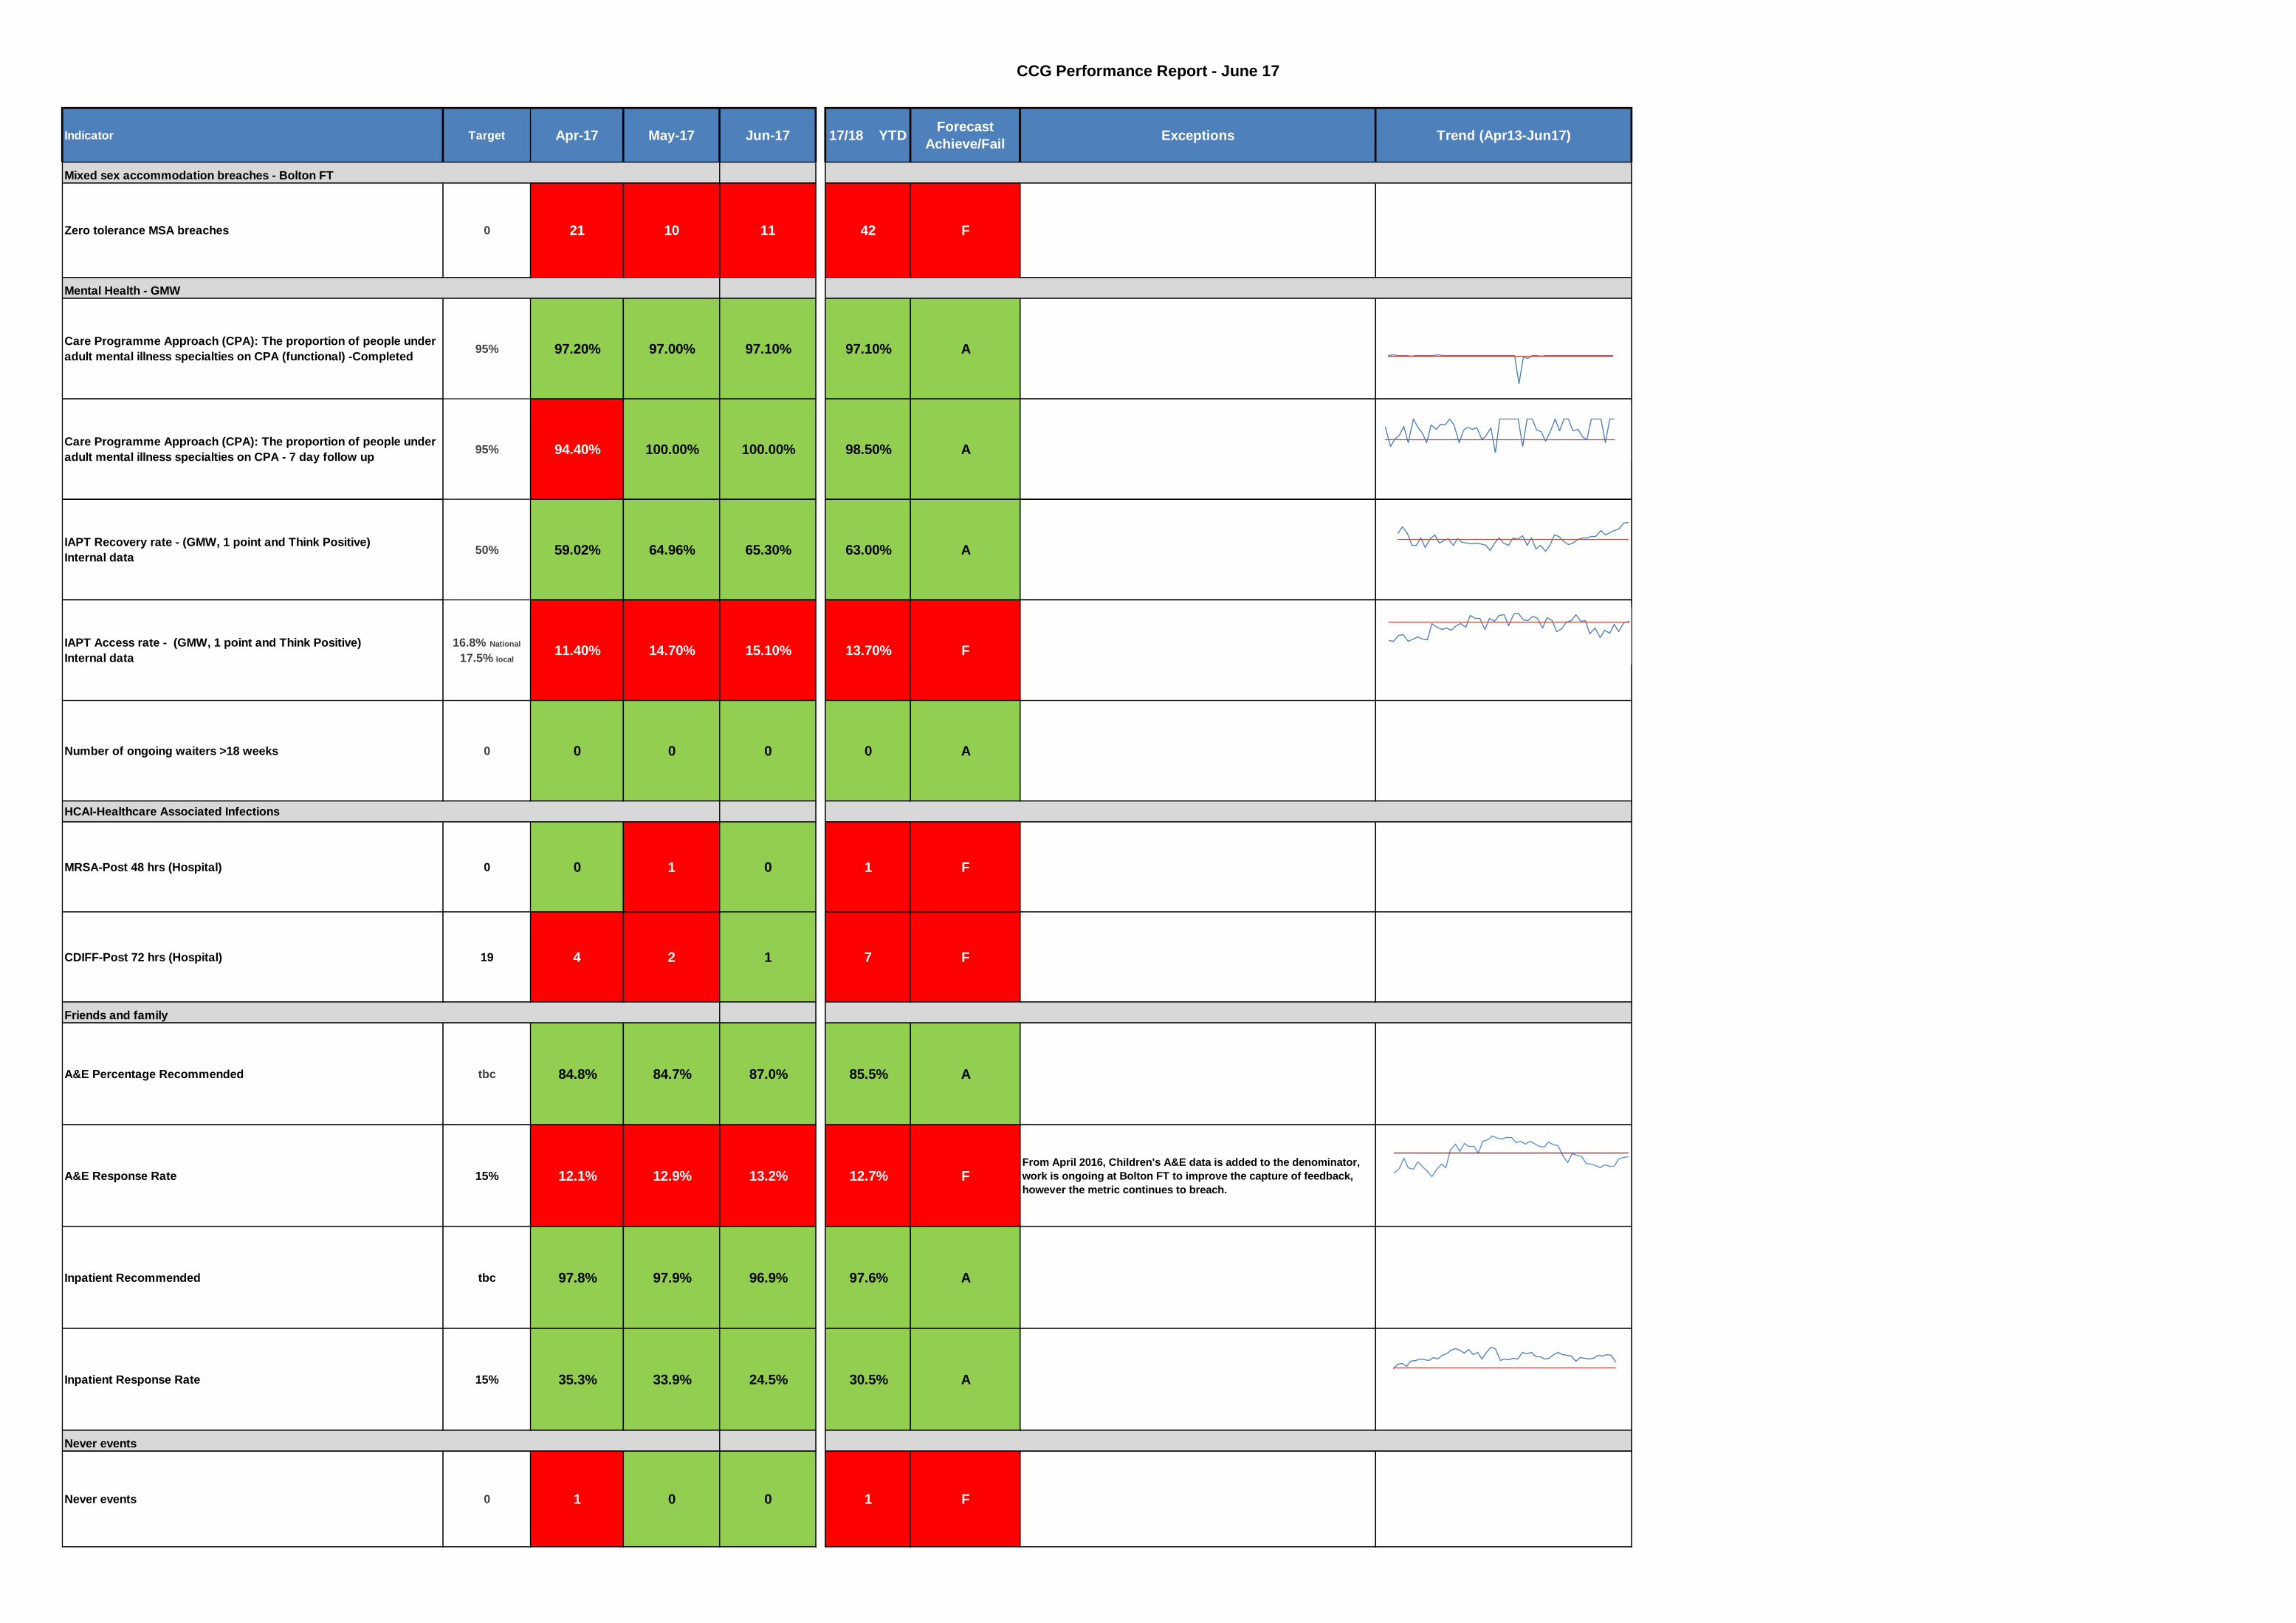
There was one Bolton NHS Foundation Trust apportioned Clostridium Difficile toxin positive case in June 2017 which is under the NHS England target of less than 1.6 cases a month. Year To Date (YTD), there have been seven cases compared to the 4.8 threshold. This was considered to be a relapse, all antibiotics prescribed for this patient were in line with prescribing guidelines and there were considered to be no lapses in care.
There were no MRSA bacteraemia cases in June.
2.1.2 Mixed Sex Accommodation (MSA)
In June 2017 there were 11 mixed sex accommodation breaches against a plan of zero breaches. June’s breaches were marginally higher than the 10 reported cases in May 2017 but the number of breaches remains significantly lower than in 2016. The HDU estate continues to be an issue when flow within the hospital
3
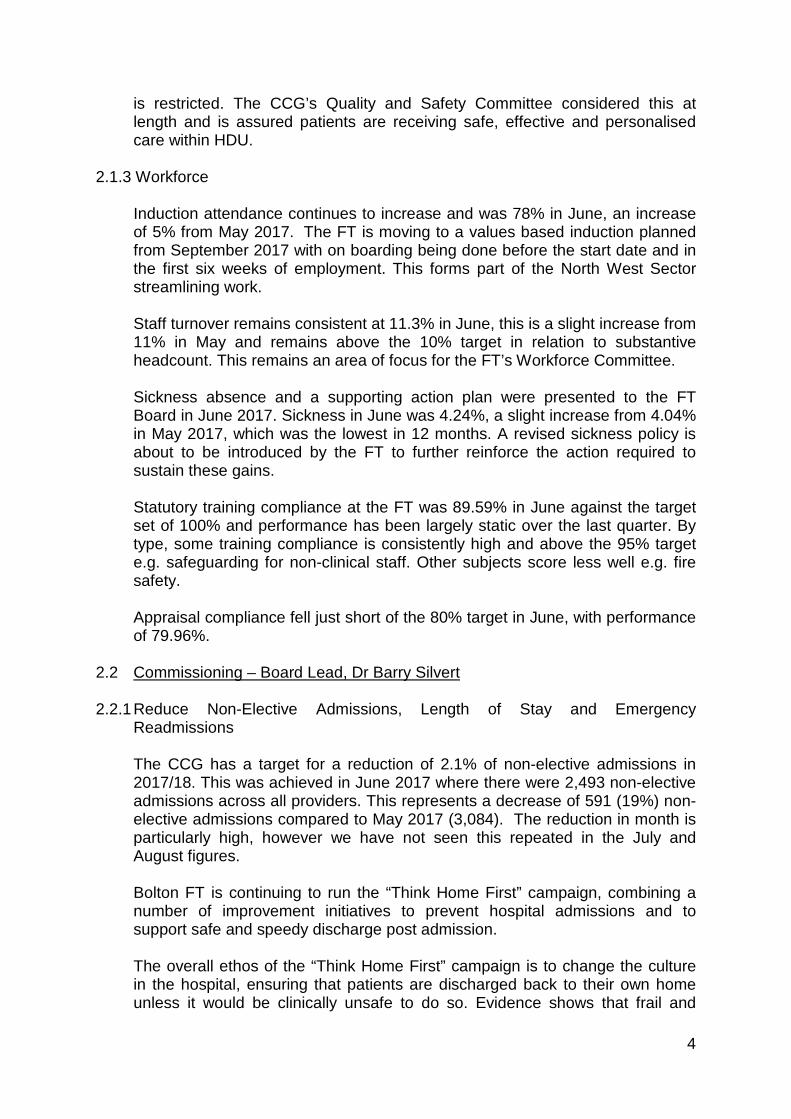
is restricted. The CCG’s Quality and Safety Committee considered this at length and is assured patients are receiving safe, effective and personalised care within HDU.
2.1.3 Workforce
Induction attendance continues to increase and was 78% in June, an increase of 5% from May 2017. The FT is moving to a values based induction planned from September 2017 with on boarding being done before the start date and in the first six weeks of employment. This forms part of the North West Sector streamlining work. Staff turnover remains consistent at 11.3% in June, this is a slight increase from 11% in May and remains above the 10% target in relation to substantive headcount. This remains an area of focus for the FT’s Workforce Committee.
Sickness absence and a supporting action plan were presented to the FT Board in June 2017. Sickness in June was 4.24%, a slight increase from 4.04% in May 2017, which was the lowest in 12 months. A revised sickness policy is about to be introduced by the FT to further reinforce the action required to sustain these gains. Statutory training compliance at the FT was 89.59% in June against the target set of 100% and performance has been largely static over the last quarter. By type, some training compliance is consistently high and above the 95% target e.g. safeguarding for non-clinical staff. Other subjects score less well e.g. fire safety. Appraisal compliance fell just short of the 80% target in June, with performance of 79.96%.
2.2 Commissioning – Board Lead, Dr Barry Silvert 2.2.1 Reduce Non-Elective Admissions, Length of Stay and Emergency
Readmissions
The CCG has a target for a reduction of 2.1% of non-elective admissions in 2017/18. This was achieved in June 2017 where there were 2,493 non-elective admissions across all providers. This represents a decrease of 591 (19%) non-elective admissions compared to May 2017 (3,084). The reduction in month is particularly high, however we have not seen this repeated in the July and August figures.
Bolton FT is continuing to run the “Think Home First” campaign, combining a number of improvement initiatives to prevent hospital admissions and to support safe and speedy discharge post admission. The overall ethos of the “Think Home First” campaign is to change the culture in the hospital, ensuring that patients are discharged back to their own home unless it would be clinically unsafe to do so. Evidence shows that frail and
4

elderly patients decondition quickly when admitted to hospital, with national evidence showing that 50% of older patients become incontinent within 24 hours of admission and every 10 days in a hospital bed age muscles by 10 years. Therefore the locality is focusing efforts on reducing the number of days patients spend in a hospital bed when they could be appropriately cared for in their own home. This campaign is running for six weeks embedding and supporting staff to deliver on improvements such as:
• Delivering the SAFER bundle – which focuses on the five key elements of best practice to improve patient safety, reduce time away from home and fully involves patients in their own care.
• Red 2 Green – putting patients at the centre of care, proactively addressing delays in hospital processes such as waiting for diagnostics.
• #EndPJParalysis – promoting patients to be dressed where possible in “normal” clothes as opposed to nightwear, preserving dignity, individuality and facilitating quicker recovery where appropriate.
2.2.2 NHS Constitution Targets
A&E 4 hour performance (target 95%) for July 2017 was 82.96%, which is a reduction in performance since June (at 84.7%). Previous Board reports have included details on initiatives underway to support progress towards the 95% target. The pilot model of streaming primary care-appropriate patients within the A&E Department continues and has streamed 8,263 patients to primary care, between the 15th December 2016 and the 13th August 2017. Further variations of the model have been tested in June and July, which are due to be evaluated to aid decision making for the longer term model. In June, NWAS failed the national target for Emergency Response arriving within 8 minutes with performance of 62.53% (against the Red 1 target of 75%). This is a further deterioration from May’s performance of 65.92%. The two other national targets were also failed; Red 2 performance for June was 64.68% (against a target of 75%) and the Category A 19 minute response performance was 89.39% (against a target of 95%). June’s performance for NWAS ‘see and treat’ as an alternative to ambulance conveyances to A&E has remained consistent at 22.6%. NWAS ‘hear and treat’ performance in June has increased to 12.6% (compared with 10.5% in May). Both targets compare positively across Greater Manchester. NWAS launched the National Ambulance Response Programme (ARP) on the 7th August 2017, which changes the way in which the service responds to 999 calls in the future. After a completed national pilot, evidence has been gathered to demonstrate improved patient outcomes as a result of this new model of working, therefore this is being rolled out to ambulance services across the country.
5
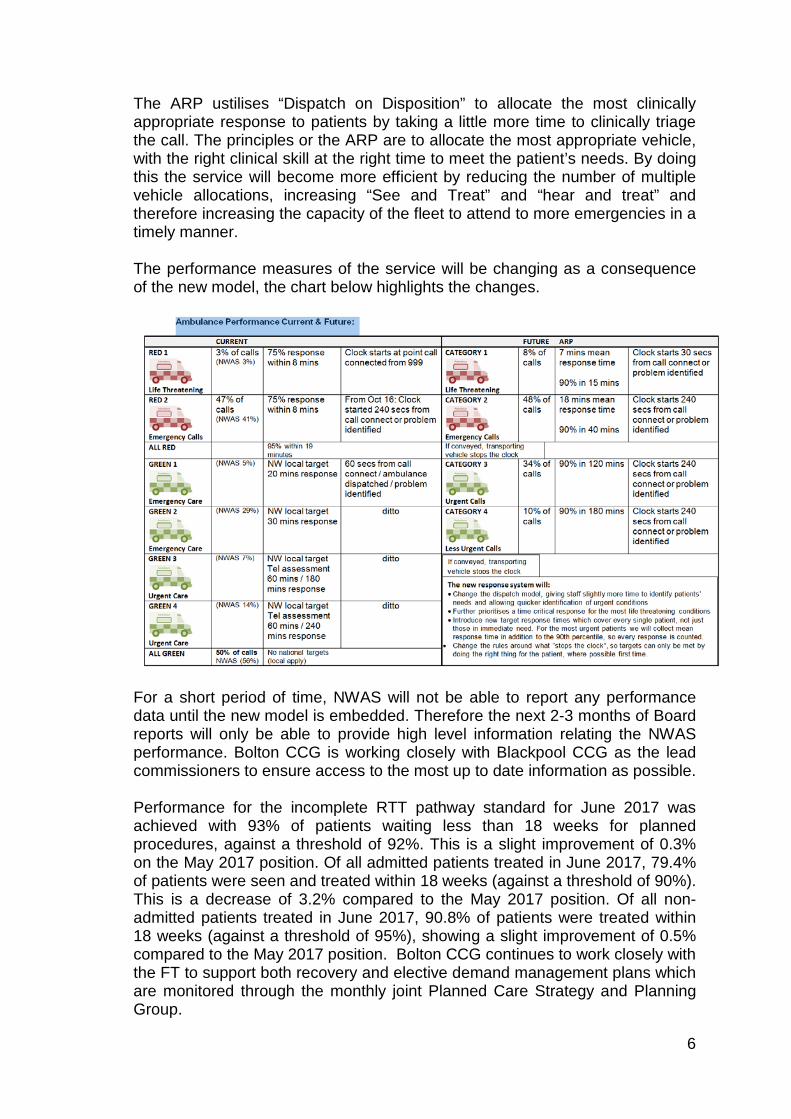
The ARP ustilises “Dispatch on Disposition” to allocate the most clinically appropriate response to patients by taking a little more time to clinically triage the call. The principles or the ARP are to allocate the most appropriate vehicle, with the right clinical skill at the right time to meet the patient’s needs. By doing this the service will become more efficient by reducing the number of multiple vehicle allocations, increasing “See and Treat” and “hear and treat” and therefore increasing the capacity of the fleet to attend to more emergencies in a timely manner. The performance measures of the service will be changing as a consequence of the new model, the chart below highlights the changes.
For a short period of time, NWAS will not be able to report any performance data until the new model is embedded. Therefore the next 2-3 months of Board reports will only be able to provide high level information relating the NWAS performance. Bolton CCG is working closely with Blackpool CCG as the lead commissioners to ensure access to the most up to date information as possible.
Performance for the incomplete RTT pathway standard for June 2017 was achieved with 93% of patients waiting less than 18 weeks for planned procedures, against a threshold of 92%. This is a slight improvement of 0.3% on the May 2017 position. Of all admitted patients treated in June 2017, 79.4% of patients were seen and treated within 18 weeks (against a threshold of 90%). This is a decrease of 3.2% compared to the May 2017 position. Of all non-admitted patients treated in June 2017, 90.8% of patients were treated within 18 weeks (against a threshold of 95%), showing a slight improvement of 0.5% compared to the May 2017 position. Bolton CCG continues to work closely with the FT to support both recovery and elective demand management plans which are monitored through the monthly joint Planned Care Strategy and Planning Group.
6

The six week diagnostic waiting time standard was achieved in June 2017 with 0.73% of patients waiting longer than six weeks for their diagnostic procedure, against a threshold of 1%. The target was achieved for Quarter 1, however this remains a challenge for the locality (and across GM).
The number of patients waiting more than 52 weeks failed in June 17 with 3 confirmed breaches at Bolton FT. An internal process review is currently underway to mitigate the risks of future breaches. Bolton CCG is working closely with Bolton FT to support performance improvements. The CCG has further maintained its strong performance for the cancer 2week wait, 31 day and 62 day targets and continues to exceed the national target. Bolton CCG was the top performing CCG nationally for the 62 day target in quarter 4 of 2016/17. Performance for 2 two week wait symptomatic breast target (where symptoms do not initially suggest cancer) deteriorated significantly in June to 44.7% against a target of 93%. This is as a direct result of ongoing capacity issues in breast services at Bolton FT. This has been raised with the Elective Care Division and at the joint CCG and FT Quality and Performance Group in August. Consultant cover remains a challenge, particularly in peak holiday season. The service has been prioritising 2 week wait referrals where cancer is suspected, hence the longer waits for those whose symptoms are not suggestive of cancer. The FT is supporting a consultant on a phased return to work and an internal business case for an additional consultant to regain capacity has been produced, however performance is expected to remain below target for July and August 2017.
2.2.3 NWAS 111 Performance/OOH
2,812 calls were triaged through the NHS 111 system in July 2017. This is an increase of 124 calls from June 2017 (2,688 calls). Of the 2,812 patients triaged, 305 (11%) were recommended to attend A&E, 437 (16%) resulted in an ambulance being dispatched, 1,486 (53%) were referred to primary or community care services and 542 (19%) were advised for no further treatment or services. The development of the Acute Prioritisation Assessment Service (APAS) model will help to stream appropriate patients to other services to meet their needs rather than A&E. The signed Memorandum of Understanding (MOU) was approved through Transformation Advisory Group on 20th July and APAS is expected to go live in Bolton on 21st August 2017.
2.2.4 Contractual Performance In July there were 199 patient handovers (from ambulances to A&E) where patients
waited between 30 and 59 minutes and 82 handovers where patients waited more than 60 minutes (against a target of 0 for both). Although these targets continue to fail, July has seen further improvement in the reduction of patients who have been waiting between 30 and 59 minutes for handover. Bolton FT are working with NWAS currently on a 90 day improvement event for handover, involving testing a number of different initiatives in relation to ambulance handover.
7
In May 2017, Stroke services failed both targets with 66.7% of patients spending at least 90% of their stay on a stroke unit against the target of >80% and the performance for patients arriving within a designated stroke bed within 4 hours of arrival also failed at 66.7% against the target of >80%. Data for June is not yet available.
2.2.5 Mental Health
CPA performance for June achieved at 100%. There were no 7 day CPA follow up breaches in June. Performance against the Improving Access to Psychological Therapies (IAPT) recovery rate (combined figures for GMMH and 1 Point) was achieved in June with performance of 65.3% against a target of 50%. The access rate increased from 14.7% in May to 15.1% in June. The IAPT service achieved 15% access rate target in June for the first time in 9 consecutive months, however, the current national target in 17/18 is 16.8% and the local stretch target is 17.5% as part of the 2 year ambition to achieve 20% by the end of 2018/19. The local IAPT service continued to achieve both the 6 week and 18 week access targets in June with 75% of people beginning treatment within 6 weeks (against a target of 75%) and 100% beginning treatment within 18 weeks (against a target of 95%). Key performance highlights from the mental health dashboard for June include:
• Out of Area Placements (OAPs) – there were 5 acute OAPs, all of whom have since been repatriated. Ongoing work is in progress with GMMH and Bolton Council to look at current bed pressures, alternatives to hospital admission and a review of the respite/crisis house currently commissioned through Bolton Cares which has resulted in the number of crisis beds being increased to 2 whilst the review continues. It must be noted that acute psychiatric bed pressures are being experienced nationally at present.
• The Bolton RAID team responded to 66% of all referrals received within 1 hour which falls short of the 75% target. This is due to the team continuing to receive high levels of referrals at times of reduced capacity (out of hours), with the team experiencing sickness and ongoing vacancies. The service does not expect to be fully staffed until November 2017. However the RAID team continue to provide comprehensive mental health assessments and work closely with the Royal Bolton clinical teams. Further work continues with the Sanctuary to divert anyone not requiring a clinical intervention away from A&E. Work also continues with GMMH on wider alternatives to A&E for mental health presentations.
• For RAID referrals discharged from A&E within 2 hours, performance was 85.7%, and 4 hour discharge performance was 91.7%, with both 95% targets failing to be achieved. This again is impacted on by the issues created out of hours where RAID capacity is limited. The Trust continues to work with the CCG on an all age RAID expansion, which
8
would provide greater economies and cover the out of hours with an additional practitioner. The team anticipate a greater number of referrals in coming months based upon the activity
experienced through last year’s summer months. • The Early Intervention in Psychosis (EIP) service exceeded the 50%
access target, achieving 90% of people accessing the service within two weeks during June 2017.
2.2.6 Children’s and Maternity The national 12+6 target is for 90% of women to receive a full health and social care risk assessment and booking by a midwife before 12 weeks and 6 days of pregnancy. Performance at a trust level for July 2017 was 84.4%, a slight improvement from June’s performance of 83.3%. At a CCG level, performance in July improved slightly to 89.4% from 88.1% in June. The CCG and FT continue to discuss actions to ensure the 90% target is achieved at both CCG and Trust level.
2.2.7 Community Services Dashboard
Detailed below are the key highlights from the overarching community services dashboard for June 2017. Waiting times for community services (adults) have seen a slight improvement during June when compared with the previous monthly position of 71.0%, with performance across the services at aggregate level now at 73.5% for referrals seen within agreed targets. This aggregated total waits measure does not take into account the priority referrals which are mostly seen within target and the routine referrals which slip outside the tolerance range. Children’s services wait times YTD are closer to plan at 79.0% against the default 90% target. Referrals to children’s community teams have progressively increased over the last few months with a further increase seen in June (2,359 GP and “Other” source against a target of 2,141). Referrals to Adult services from a GP source are above plan in June 2017 at 2,923 compared to a target of 2,601. ‘Other’ sourced referrals are above plan also in June at 5,065 compared to an expected 3,622. Referrals to the Integrated Neighbourhood Teams reduced in June 2017 to 136 (from 171 in May) and remains significantly below the monthly target of 293 however these targets are under review in line with the redesign of the Neighbourhood INT model. Cumulative YTD referral activity is 430 referrals against a plan of 879 (48.9%). The Integrated Care KLOE report includes data on Delayed Transfers of Care (DTOC) and the total number of DTOCs in June 2017 has reduced to 15 compared to 31 in May and the total number of delayed days reduced from 943 in May to 436 in June. The Spring Unit beds commissioned as part of discharge to assess (D2A) at Four Seasons are contributing to reducing DTOCs as there is a visible reduction in the trend when Four Seasons D2A unit is running at high occupancy.
9
The community services report for June 2017 highlights other areas of concern and also some positive improvements seen. Admission Avoidance Team (AAT) referrals seen within 48 hour are performing at 97.8% YTD against a plan of 90% however the volume of referrals being made to AAT are 30% below levels seen in Q1 of 16/17. The Care Homes service continues to achieve all performance targets and is seeing increased activity. Wait times for Dermatology, Rheumatology and Nutrition Support are consistently higher than target for both urgent and routine referrals, with no significant difference to volumes of activity seen. Average length of stay for intermediate beds at Darley Court and Laburnum lodge are showing good reductions in June at 26.7 days and 22.1 days respectively compared to 36 days at each site in May 2017.
2.2.8 CCG Improvement Assessment Framework 2016/17
The CCG has received its results for the 2016/17 CCG Improvement Assessment Framework (IAF) in July. A summary was presented to the July Board. The CCG was rated “good” overall for 2016/17, good for cancer and mental health and outstanding for dementia. There were a number of areas of challenge for the CCG to address:
• Attendance of structured education course • Inequality Chronic – ACS • AMR: appropriate prescribing • Quality of life of carers • One-year survival from all cancers • Neonatal mortality and stillbirths • A&E admission, transfer, discharge within 4 hours
The CCG IAF is produced quarterly and reports will be routinely provided to Board moving forwards. The next scheduled report will be September 2017.
3 Recommendations 3.1 The Board is asked to note the performance for June 2017 and the actions
being taken to rectify areas of performance which are below standard. Melissa Laskey – Director of Service Transformation 18th August 2017
10

Appendix 1
2 Bolton CCG Objectives
3 Board Assurance Framework
4-5 NHS Constitution Standards
6-8 Key NHS Contractual Measures
9 Outcome & Quality Framework Indicators
10-13 Community Services Key Performance Indicators
14-17 CCG Quality Indicators
18-21 Mental Health Dashboard
Appendix 2
22-25 Integrated Care Performance Report
Index
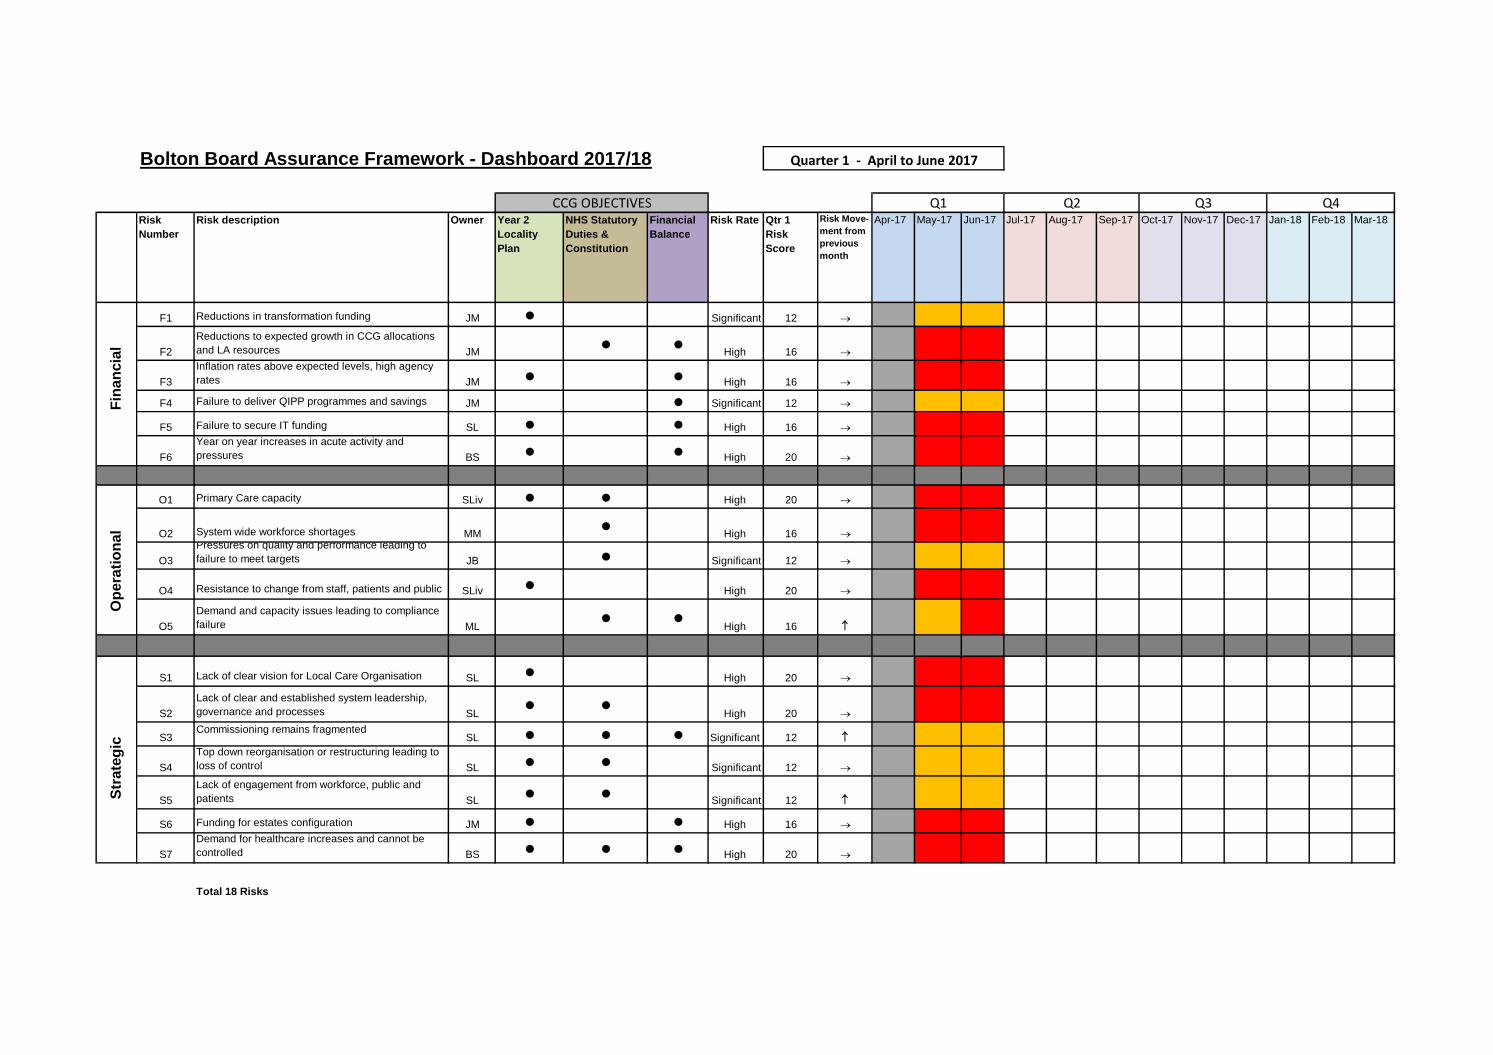
Bolton Board Assurance Framework - Dashboard 2017/18
Risk
Number
Risk description Owner Year 2
Locality
Plan
NHS Statutory
Duties &
Constitution
Financial
Balance
Risk Rate Qtr 1
Risk
Score
Risk Move-
ment from
previous
month
Apr-17 May-17 Jun-17 Jul-17 Aug-17 Sep-17 Oct-17 Nov-17 Dec-17 Jan-18 Feb-18 Mar-18
F1 Reductions in transformation funding JM ● Significant 12
F2
Reductions to expected growth in CCG allocations
and LA resources JM● ●
High 16
F3
Inflation rates above expected levels, high agency
rates JM ● ● High 16
F4 Failure to deliver QIPP programmes and savings JM ● Significant 12
F5 Failure to secure IT funding SL ● ● High 16
F6
Year on year increases in acute activity and
pressures BS ● ● High 20
O1 Primary Care capacity SLiv ● ● High 20
O2 System wide workforce shortages MM●
High 16
O3
Pressures on quality and performance leading to
failure to meet targets JB ● Significant 12
O4 Resistance to change from staff, patients and public SLiv ● High 20
O5
Demand and capacity issues leading to compliance
failure ML● ●
High 16
S1 Lack of clear vision for Local Care Organisation SL ● High 20
S2
Lack of clear and established system leadership,
governance and processes SL● ●
High 20
S3Commissioning remains fragmented
SL ● ● ● Significant 12
S4
Top down reorganisation or restructuring leading to
loss of control SL ● ● Significant 12
S5
Lack of engagement from workforce, public and
patients SL● ●
Significant 12
S6 Funding for estates configuration JM ● ● High 16
S7
Demand for healthcare increases and cannot be
controlled BS ● ● ● High 20
Total 18 Risks
Q2 Q3 Q4
Quarter 1 - April to June 2017
S
trate
gic
F
inan
cia
l O
pera
tio
nal
CCG OBJECTIVES Q1

NHS Constitution Indicators June 17
Indicator Target Apr-17 May-17 Jun-17 YTDForecast
Achieve/FailExceptions Trend (Apr13-Jun17)
Admitted patients to start treatment within a maximum
of 18 weeks from referral 90% 79.5% 82.7% 79.4% 80.7% F
Aggregated target failed (304 breaches out of 1,508).
Specialties breached are Cardiology (83%), General
Surgery (76%), Gynae (83%), Plastics (63%),
Orthopaedics (75.4%), Urology (69.2%), ENT (79%) and
Other (80%). Bolton FT failed the target for the CCG
(77.9%)
with all breached specilaties significantly below the
target of 90%.
Non-admitted patients to start treatment within a
maximum of 18 weeks from referral95% 91.0% 90.3% 90.8% 90.7% F
Aggregated target failed (478 breaches out of 5196),
specialties failed for June are Cardiology, Dermatology,
Gastro, General Surgery, General Medicine, Neurology,
Ophthalmology, Plastics, Thoracic Medicine, Urology
and Orthopaedics . Bolton FT failed the target for Bolton
CCG ( 89.7%).
Patients on incomplete non emergency pathways (yet
to start treatment) 92% 92.1% 92.7% 93.0% 92.6% A
Specialties breached are Cardiology, General Surgery,
Plastics, Ophthalmology, Urology and Orthopaedics.
Patients waiting for a diagnostic test should have been
waiting less than 6 weeks from referral 1% 1.17% 1.01% 0.73% 0.96% A Achieved quarter 1, however target is still a challenge
Patients should be admitted, transferred or discharged
within 4 hours of their arrival at an A&E department -
Bolton FT
95% 82.54% 86.40% 84.70% 84.50% F
Maximum two-week wait for first outpatient
appointment for patients referred urgently with
suspected cancer by a GP
93% 94.6% 98.7% 98.8% 97.5% A
Maximum two week wait for first out patient
appointment for patients referred urgently with breast
symptoms (where cancer was not initially suspected)
93% 89.4% 91.3% 44.7% 74.6% ACapacity issues at Bolton FT, however suspected breast
cancer patients have been prioritised, as expected, with all
patients being see within the 2 weeks.
Maximum one month (31 day) wait from diagnosis to
first definitive treatment for all cancers 96% 99.0% 99.1% 99.1% 99.1% A
Maximum 31 day wait for subsequent treatment where
that treatment is surgery 94% 100.0% 100.0% 95.2% 98.4% A
Maximum 31 day wait for subsequent treatment where
the treatment is an anti-cancer drug regimen98% 96.4% 100.0% 100.0% 98.8% A
Maximum 31 day wait for subsequent treatment where
the treatment is a course of radiotherapy 94% 100.0% 100.0% 97.3% 99.0% A
Referral to Treatment waiting times for non urgent consultant led
treatment - All Providers
Cancer patients - 2 week wait -All Providers
Cancer patients - 31 day wait -All Providers
Diagnostic test waiting times All providers
A & E waits - Bolton FT

NHS Constitution Indicators June 17
Indicator Target Apr-17 May-17 Jun-17 YTDForecast
Achieve/FailExceptions Trend (Apr13-Jun17)
Referral to Treatment waiting times for non urgent consultant led
treatment - All Providers
Maximum two month (62 day) wait from urgent GP
referral to first definitive treatment for cancer 85% 90.2% 88.5% 92.2% 90.2% A
Maximum 62 day wait from referral from an NHS
screening service to first definitive treatment for all
cancers
90% 100.0% 100.0% 100.0% 100.0% A
Maximum 62 day wait for first definitive treatment
following a consultants decision to upgrade the
priority of the patients (all cancers)
None set 83.3% 70.0% 72.7% 74.1% A
Category A calls resulting in an emergency response
arriving within 8 minutes (Red 1) 75% 70.08% 65.92% 62.53% 66.10% F
Category A calls resulting in an emergency response
arriving within 8 minutes (Red 2)75% 68.94% 64.43% 64.68% 66.00% F
Category A calls resulting in an ambulance arriving at
the scene within 19 minutes 95% 92.54% 90.08% 89.39% 90.60% F
Cancer waits - 62 days - All Providers
Category A ambulance calls NWAS

CCG Performance Report - June 17
Commissioner Performance Dashboard
Indicator Target Apr-17 May-17 Jun-17 17/18 YTDForecast
Achieve/FailExceptions Trend (Apr13-Jun17)
Admitted patients to start treatment within a maximum of 18 weeks
from referral 90% 79.5% 82.7% 79.4% 80.7% F
Aggregated target failed (304 breaches out of 1,508). Specialties
breached are Cardiology (83%), General Surgery (76%), Gynae (83%),
Plastics (63%), Orthopaedics (75.4%), Urology (69.2%), ENT (79%) and
Other (80%). Bolton FT failed the target for the CCG (77.9%)
with all breached specilaties significantly below the target of 90%.
Non-admitted patients to start treatment within a maximum of 18
weeks from referral95% 91.0% 90.3% 90.8% 90.7% F
Aggregated target failed (478 breaches out of 5196), specialties failed
for June are Cardiology, Dermatology, Gastro, General Surgery,
General Medicine, Neurology, Ophthalmology, Plastics, Thoracic
Medicine, Urology and Orthopaedics . Bolton FT failed the target for
Bolton CCG ( 89.7%).
Patients on incomplete non emergency pathways (yet to start
treatment, includes 'with decision to admit') 92% 92.1% 92.7% 93.0% 92.6% A
Specialties breached are Cardiology, General Surgery, Plastics,
Ophthalmology, Urology and Orthopaedics.
Number of patients waiting more than 52 weeks - (Bolton FT only)
Incomplete0 5 1 3 8 F
Number of patients who are not offered another binding date within
28 days0 7 3 3 10 F
Patients waiting for a diagnostic test should have been waiting less
than 6 weeks from referral 1% 1.17% 1.01% 0.73% 0.96% Achieved quarter 1, however target is still a challenge
Patients should be admitted, transferred or discharged within 4
hours of their arrival at an A&E department - Bolton FT95% 82.54% 86.40% 84.70% 84.50% F
Maximum two-week wait for first outpatient appointment for
patients referred urgently with suspected cancer by a GP 93% 94.6% 98.7% 98.8% 97.5% A
Maximum two week wait for first out patient appointment for
patients referred urgently with breast symptoms (where cancer
was not initially suspected)
93% 89.4% 91.3% 44.7% 74.6%Capacity issues at Bolton FT, however suspected breast cancer
patients have been prioritised, as expected, with all patients being
see within the 2 weeks.
Number of patients who are not offered another binding date within 28 days Bolton FT
Referral to Treatment waiting times for non urgent consultant led treatment - All
Providers
Diagnostic test waiting times All providers
A & E waits - Bolton FT
Cancer patients - 2 week wait -All Providers

CCG Performance Report - June 17
Indicator Target Apr-17 May-17 Jun-17 17/18 YTDForecast
Achieve/FailExceptions Trend (Apr13-Jun17)
Maximum one month (31 day) wait from diagnosis to first definitive
treatment for all cancers 96% 99.0% 99.1% 99.1% 99.1% A
Maximum 31 day wait for subsequent treatment where that
treatment is surgery 94% 100.0% 100.0% 95.2% 98.4% A
Maximum 31 day wait for subsequent treatment where the
treatment is an anti-cancer drug regimen98% 96.4% 100.0% 100.0% 98.8% A
Maximum 31 day wait for subsequent treatment where the
treatment is a course of radiotherapy 94% 100.0% 100.0% 97.3% 99.0% A
Maximum two month (62 day) wait from urgent GP referral to first
definitive treatment for cancer 85% 90.2% 88.5% 92.2% 90.2% A
Maximum 62 day wait from referral from an NHS screening service
to first definitive treatment for all cancers90% 100.0% 100.0% 100.0% 100.0% A
Maximum 62 day wait for first definitive treatment following a
consultants decision to upgrade the priority of the patients (all
cancers)
none set 83.3% 70.0% 72.7% 74.1% A
Category A calls resulting in an emergency response arriving within
8 minutes (Red 1) 75% 70.08% 65.92% 62.53% 66.10% F
Category A calls resulting in an emergency response arriving within
8 minutes (Red 2)75% 68.94% 64.43% 64.68% 66.00% F
Category A calls resulting in an ambulance arriving at the scene
within 19 minutes 95% 92.54% 90.08% 89.39% 90.60% F
All handovers between ambulance and A&E must take place within
15 minutes (no of patients waiting >30 mins<59 mins) Bolton FT0 270 245 235 750 F
All handovers between ambulance and A&E must take place within
15 minutes (no of patients waiting >60 mins) Bolton FT0 133 64 83 280 F
Cancer patients - 31 day wait -All Providers
Cancer waits - 62 days - All Providers
Category A ambulance calls NWAS position
CCG Performance Report - June 17
Indicator Target Apr-17 May-17 Jun-17 17/18 YTDForecast
Achieve/FailExceptions Trend (Apr13-Jun17)
Zero tolerance MSA breaches 0 21 10 11 42 F
Care Programme Approach (CPA): The proportion of people under
adult mental illness specialties on CPA (functional) -Completed95% 97.20% 97.00% 97.10% 97.10% A
Care Programme Approach (CPA): The proportion of people under
adult mental illness specialties on CPA - 7 day follow up95% 94.40% 100.00% 100.00% 98.50% A
IAPT Recovery rate - (GMW, 1 point and Think Positive)
Internal data50% 59.02% 64.96% 65.30% 63.00% A
IAPT Access rate - (GMW, 1 point and Think Positive)
Internal data
16.8% National
17.5% local11.40% 14.70% 15.10% 13.70% F
Number of ongoing waiters >18 weeks 0 0 0 0 0 A
HCAI-Healthcare Associated Infections
MRSA-Post 48 hrs (Hospital) 0 0 1 0 1 F
CDIFF-Post 72 hrs (Hospital) 19 4 2 1 7 F
A&E Percentage Recommended tbc 84.8% 84.7% 87.0% 85.5% A
A&E Response Rate 15% 12.1% 12.9% 13.2% 12.7% FFrom April 2016, Children's A&E data is added to the denominator,
work is ongoing at Bolton FT to improve the capture of feedback,
however the metric continues to breach.
Inpatient Recommended tbc 97.8% 97.9% 96.9% 97.6% A
Inpatient Response Rate 15% 35.3% 33.9% 24.5% 30.5% A
Never events 0 1 0 0 1 F
Friends and family
Never events
Mixed sex accommodation breaches - Bolton FT
Mental Health - GMW
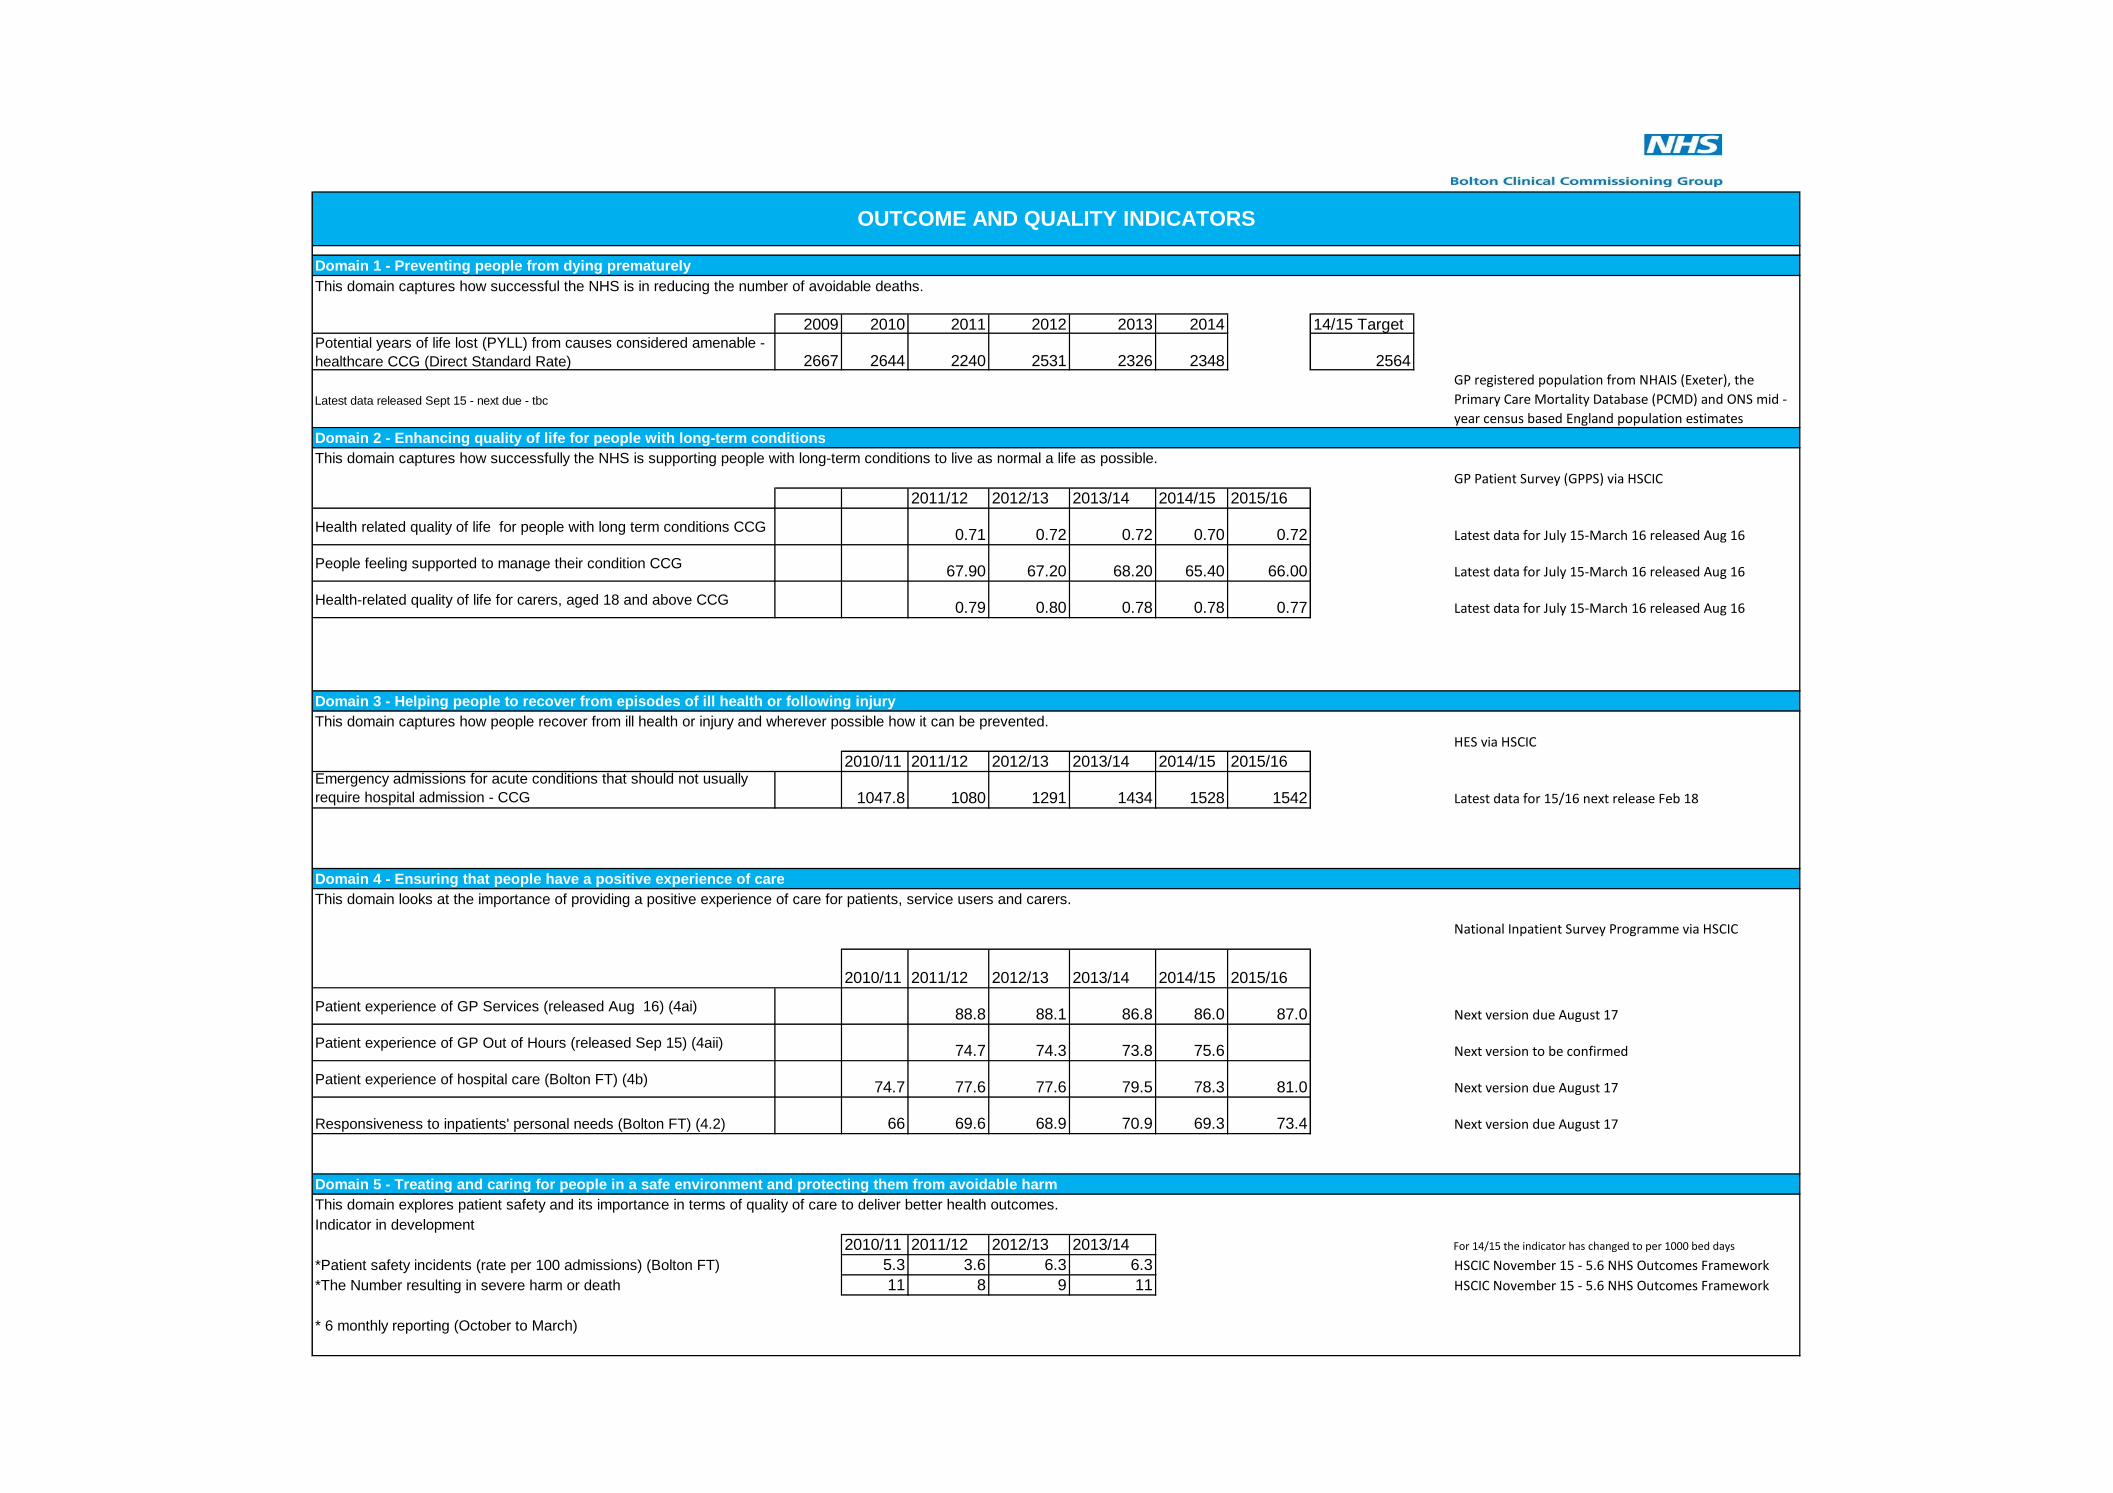
Domain 1 - Preventing people from dying prematurely
This domain captures how successful the NHS is in reducing the number of avoidable deaths.
2009 2010 2011 2012 2013 2014 14/15 TargetPotential years of life lost (PYLL) from causes considered amenable -
healthcare CCG (Direct Standard Rate) 2667 2644 2240 2531 2326 2348 2564
Latest data released Sept 15 - next due - tbc
Domain 2 - Enhancing quality of life for people with long-term conditions
This domain captures how successfully the NHS is supporting people with long-term conditions to live as normal a life as possible.
GP Patient Survey (GPPS) via HSCIC
2011/12 2012/13 2013/14 2014/15 2015/16
Health related quality of life for people with long term conditions CCG0.71 0.72 0.72 0.70 0.72 Latest data for July 15-March 16 released Aug 16
People feeling supported to manage their condition CCG67.90 67.20 68.20 65.40 66.00 Latest data for July 15-March 16 released Aug 16
Health-related quality of life for carers, aged 18 and above CCG0.79 0.80 0.78 0.78 0.77 Latest data for July 15-March 16 released Aug 16
Domain 3 - Helping people to recover from episodes of ill health or following injury
This domain captures how people recover from ill health or injury and wherever possible how it can be prevented.
HES via HSCIC
2010/11 2011/12 2012/13 2013/14 2014/15 2015/16Emergency admissions for acute conditions that should not usually
require hospital admission - CCG 1047.8 1080 1291 1434 1528 1542 Latest data for 15/16 next release Feb 18
Domain 4 - Ensuring that people have a positive experience of care
This domain looks at the importance of providing a positive experience of care for patients, service users and carers.
2010/11 2011/12 2012/13 2013/14 2014/15 2015/16
Patient experience of GP Services (released Aug 16) (4ai)88.8 88.1 86.8 86.0 87.0 Next version due August 17
Patient experience of GP Out of Hours (released Sep 15) (4aii)74.7 74.3 73.8 75.6 Next version to be confirmed
Patient experience of hospital care (Bolton FT) (4b)74.7 77.6 77.6 79.5 78.3 81.0 Next version due August 17
Responsiveness to inpatients' personal needs (Bolton FT) (4.2) 66 69.6 68.9 70.9 69.3 73.4 Next version due August 17
Domain 5 - Treating and caring for people in a safe environment and protecting them from avoidable harm
This domain explores patient safety and its importance in terms of quality of care to deliver better health outcomes.
Indicator in development
2010/11 2011/12 2012/13 2013/14 For 14/15 the indicator has changed to per 1000 bed days
*Patient safety incidents (rate per 100 admissions) (Bolton FT) 5.3 3.6 6.3 6.3 HSCIC November 15 - 5.6 NHS Outcomes Framework
*The Number resulting in severe harm or death 11 8 9 11 HSCIC November 15 - 5.6 NHS Outcomes Framework
* 6 monthly reporting (October to March)
OUTCOME AND QUALITY INDICATORS
GP registered population from NHAIS (Exeter), the
Primary Care Mortality Database (PCMD) and ONS mid -
year census based England population estimates
National Inpatient Survey Programme via HSCIC

Indicator Jul Aug Sep Oct Nov Dec Jan Feb Mar Apr May Jun Jul YTD Current
Target Actual Target Actual
Community Services - Adults
Referrals
Referrals - GP 2,445 2,654 2,729 2,680 2,671 2,167 2,384 2,376 2,765 2,675 3,028 2,923 2,914 10,411 11,540 2,601 2,914
Referrals - Other 4,654 4,537 4,573 4,914 4,761 4,131 4,919 4,140 4,826 4,502 5,015 5,065 4,792 14,496 19,374 3,622 4,792
Re-referrals < 90 Days 731 766 759 765 816 708 806 615 747 654 845 733 627 - 2,859 - 627
Re-referrals < 90 Days Rate 11.0% 11.4% 11.0% 10.7% 11.6% 12.0% 11.8% 10.0% 10.4% 10.5% 10.9% 9.4% 8.5% - 9.8% - 8.5%
Waiting Times
Referrals Seen < Target 63.1% 62.8% 63.0% 68.3% 72.4% 78.8% 74.3% 76.9% 74.5% 75.2% 71.0% 73.5% 71.6% 90.0% 72.8% 90.0% 71.6%
Activity and Access
Activity - First 11,858 12,804 13,337 13,245 13,590 10,468 13,544 11,165 13,097 8,602 10,285 9,835 9,742 29,781 38,464 7,444 9,742
DNA - First 750 837 836 884 836 739 1,059 878 1,052 624 782 796 730 - 2,932 - 730
DNA Rate - First 5.9% 6.1% 5.9% 6.3% 5.8% 6.6% 7.2% 7.3% 7.4% 6.8% 7.1% 7.5% 7.0% 5.0% 7.1% 5.0% 7.0%
Activity - Follow-up 45,903 46,871 45,709 44,946 46,931 41,021 42,847 38,745 39,746 36,091 40,399 35,388 30,933 179,644 142,811 44,911 30,933
DNA - Follow-up 2,151 2,061 1,869 1,967 2,078 1,880 1,656 1,497 1,741 1,341 1,513 1,583 1,569 - 6,006 - 1,569
DNA Rate - Follow-up 4.5% 4.2% 3.9% 4.2% 4.3% 4.4% 3.7% 3.7% 4.2% 3.6% 3.6% 4.3% 4.8% 8.0% 4.0% 8.0% 4.8%
Telephone Clinics 1,309 1,190 1,161 1,022 920 904 1,131 1,034 992 915 1,073 1,132 1,055 4,269 4,175 1,066 1,055
Appointments Cancelled < 1 Week of Due Date
0.6% 0.7% 0.7% 0.9% 0.9% 0.8% 0.8% 0.7% 0.7% 0.9% 1.0% 1.1% 1.1% 3.0% 1.0% 3.0% 1.1%
Patient Experience and Outcomes
Friends and Family - Recommend Rate 90.2% 91.1% 94.4% 95.0% 94.3% 94.3% 95.1% 94.8% 97.0% 96.3% 96.8% 99.1% 98.5% 85.0% 97.4% 85.0% 98.5%
Complaints 1 1 1 0 1 2 1 0 1 1 1 1 2 - 5 - 2
Complaints - Responded < 35 Days 100% 100% 100% 0% 100% 100% 100% 0% 100% 0% 100% 100% 0% 95.0% 100% 95.0% 0%
Compliments 1,245 912 306 283 331 282 349 553 700 721 414 383 - 1,518 - 383
XRBH\SLeePage: 1 of 415/08/2017 16:34
Community Summary 2017/2018

Indicator Jul Aug Sep Oct Nov Dec Jan Feb Mar Apr May Jun Jul YTD Current
Target Actual Target Actual
Staffing
WTE in Post 699.02 713.79 715.58 719.31 717.17 718.28 721.18 724.46 729.43 763.55 754.59 754.82 749.43 - 749.43 - 749.43
WTE v Establishment 92.8% 93.3% 93.1% 93.6% 93.3% 93.5% 93.8% 94.6% 95.2% 95.3% 94.1% 94.1% 93.4% 95.0% 94.2% 95.0% 93.4%
Sickness Absence Rate 5.1% 4.3% 3.3% 5.5% 6.0% 5.3% 6.1% 5.6% 4.7% 5.3% 4.1% 4.5% 4.2% 4.6% 4.2% 4.5%
Staff Turnover 11.2% 11.1% 13.2% 12.8% 13.6% 13.2% 13.0% 13.1% 13.5% 13.9% 13.3% 13.4% 14.0% 10.0% 13.6% 10.0% 14.0%
Appraisals 82.1% 84.5% 82.9% 82.6% 86.4% 86.7% 82.8% 85.4% 84.8% 82.4% 82.4% 79.4% 84.7% 85.0% 82.2% 85.0% 84.7%
Mandatory Training Compliance 89.9% 90.0% 91.0% 92.0% 92.5% 92.7% 93.1% 93.7% 92.7% 92.2% 92.6% 93.2% 93.5% 85.0% 92.9% 85.0% 93.5%
Statutory Training Compliance 91.0% 91.6% 92.5% 93.9% 94.7% 94.8% 95.6% 95.6% 94.4% 94.8% 94.2% 95.3% 94.9% 95.0% 94.8% 95.0% 94.9%
Safeguarding Compliance 89.9% 91.4% 92.8% 94.1% 94.8% 94.7% 95.3% 96.1% 94.3% 95.5% 96.1% 97.7% 97.9% 95.0% 96.8% 95.0% 97.9%
Harm-free Care
Incidents 234 190 213 221 211 215 232 213 207 198 202 212 231 - 843 - 231
Incidents - Moderate or Severe Rate 1.7% 2.1% 0.5% 1.8% 3.3% 2.3% 1.3% 2.8% 0.5% 0.5% 1.5% 0.9% 0% 3.0% 0.7% 3.0% 0%
Pressure Damage - Grade 2 7 14 8 7 6 3 8 3 9 11 7 7 6 0 31 0 6
Pressure Damage - Grade 3 2 5 6 2 6 4 10 4 2 0 9 2 0 0 11 0 0
Pressure Damage - Grade 4 1 1 2 2 0 0 0 2 4 1 1 1 1 0 4 0 1
Patient Falls 22 8 12 18 12 19 19 16 9 15 18 5 12 0 50 0 12
Hand Hygiene 99.0% 98.5% 99.1% 99.5% 97.7% 99.6% 99.6% 99.7% 99.9% 99.5% 99.1% 99.0% 99.5% 98.0% 99.3% 98.0% 99.5%
XRBH\SLeePage: 2 of 415/08/2017 16:34
Community Summary 2017/2018

Indicator Jul Aug Sep Oct Nov Dec Jan Feb Mar Apr May Jun Jul YTD Current
Target Actual Target Actual
Community Services - Children
Referrals
Referrals - GP 535 506 522 534 572 459 570 581 670 471 612 533 525 2,173 2,141 541 525
Referrals - Other 1,668 1,491 1,669 1,898 2,012 1,681 1,667 1,736 1,702 1,438 1,869 1,826 1,974 6,438 7,107 1,607 1,974
Re-referrals < 90 Days 177 153 150 188 187 190 181 160 156 175 259 195 165 - 794 - 165
Re-referrals < 90 Days Rate 8.7% 8.2% 7.4% 8.3% 7.7% 9.7% 8.7% 7.6% 7.2% 9.8% 11.2% 9.0% 7.1% - 9.3% - 7.1%
Waiting Times
Referrals Seen < Target 77.7% 75.9% 74.2% 80.5% 78.9% 77.8% 71.4% 78.9% 79.3% 75.7% 75.7% 79.0% 80.0% 90.0% 77.6% 90.0% 80.0%
Activity and Access
Activity - First 2,698 2,813 2,778 2,687 2,900 2,649 2,681 2,471 2,721 2,658 2,922 2,963 2,796 10,679 11,339 2,668 2,796
DNA - First 121 134 136 112 124 144 131 104 142 105 125 110 105 - 445 - 105
DNA Rate - First 4.3% 4.4% 4.7% 4.0% 4.1% 5.2% 4.7% 4.0% 5.0% 3.8% 4.1% 3.6% 3.6% 5.0% 3.8% 5.0% 3.6%
Activity - Follow-up 12,349 10,696 17,803 13,724 15,995 10,333 17,161 12,359 14,576 13,649 13,810 14,158 11,182 49,364 52,799 12,339 11,182
DNA - Follow-up 570 592 602 451 465 502 475 423 428 366 439 434 338 - 1,577 - 338
DNA Rate - Follow-up 4.4% 5.2% 3.3% 3.2% 2.8% 4.6% 2.7% 3.3% 2.9% 2.6% 3.1% 3.0% 2.9% 8.0% 2.9% 8.0% 2.9%
Telephone Clinics 1,278 1,124 1,349 1,222 1,533 1,407 1,570 1,394 1,610 1,334 1,632 1,446 1,413 4,465 5,825 1,114 1,413
Appointments Cancelled < 1 Week of Due Date
0.3% 0.3% 0.2% 0.5% 0.3% 0.3% 0.2% 0.2% 0.2% 0.2% 0.4% 0.2% 0.4% 3.0% 0.3% 3.0% 0.4%
Patient Experience and Outcomes
Friends and Family - Recommend Rate 94.2% 93.9% 80.5% 92.6% 92.7% 90.0% 96.2% 92.9% 95.5% 82.5% 100% 100% 100% 85.0% 97.5% 85.0% 100%
Complaints 1 0 0 0 1 0 1 0 0 0 1 2 0 - 3 - 0
Complaints - Responded < 35 Days 100% 0% 0% 0% 100% 0% 100% 0% 0% 0% 100% 100% 0% 95.0% 100% 95.0% 0%
Compliments 104 35 6 19 18 14 12 16 41 13 23 19 0 - 55 - 0
XRBH\SLeePage: 3 of 415/08/2017 16:34
Community Summary 2017/2018

Indicator Jul Aug Sep Oct Nov Dec Jan Feb Mar Apr May Jun Jul YTD Current
Target Actual Target Actual
Staffing
WTE in Post 265.28 264.69 265.19 265.47 263.26 264.00 264.31 264.35 263.46 247.36 247.54 254.33 252.07 - 252.07 - 252.07
WTE v Establishment 94.9% 92.6% 93.7% 93.8% 93.0% 93.3% 93.4% 93.4% 93.1% 93.3% 93.3% 95.6% 94.8% 95.0% 94.3% 95.0% 94.8%
Sickness Absence Rate 4.6% 2.4% 2.5% 3.5% 4.3% 3.7% 3.3% 2.7% 3.0% 5.0% 4.0% 4.3% 4.2% 4.4% 4.2% 4.3%
Staff Turnover 11.4% 12.0% 11.4% 12.0% 11.9% 11.3% 9.8% 11.0% 11.3% 11.4% 9.8% 10.2% 11.8% 10.0% 10.8% 10.0% 11.8%
Appraisals 91.1% 88.7% 90.2% 94.6% 96.6% 95.7% 93.7% 94.0% 94.2% 94.4% 91.0% 92.6% 91.2% 85.0% 92.3% 85.0% 91.2%
Mandatory Training Compliance 96.9% 95.5% 94.6% 95.8% 96.4% 95.6% 96.8% 95.8% 95.0% 94.8% 95.0% 95.1% 95.4% 85.0% 95.1% 85.0% 95.4%
Statutory Training Compliance 97.2% 97.3% 96.9% 97.2% 97.6% 97.6% 98.0% 97.6% 96.9% 96.1% 96.0% 96.7% 96.9% 95.0% 96.4% 95.0% 96.9%
Safeguarding Compliance 98.0% 98.0% 98.2% 97.7% 98.0% 98.2% 98.4% 97.7% 97.5% 97.0% 97.9% 97.5% 98.1% 95.0% 97.7% 95.0% 98.1%
Harm-free Care
Incidents 23 17 19 15 15 22 17 18 37 13 40 16 9 - 78 - 9
Incidents - Moderate or Severe Rate 0% 0% 0% 0% 0% 0% 0% 0% 0% 0% 0% 0% 0% 3.0% 0% 3.0% 0%
Pressure Damage - Grade 2 0 0 0 0 0 0 0 0 0 0 0 0 0 0 0 0 0
Pressure Damage - Grade 3 0 0 0 0 0 0 0 0 0 0 0 0 0 0 0 0 0
Pressure Damage - Grade 4 0 0 0 0 0 0 0 0 0 0 0 0 0 0 0 0 0
Patient Falls 0 0 0 0 1 0 0 0 0 0 0 0 0 0 0 0 0
Hand Hygiene 100% 100% 100% 100% 100% 100% 100% 100% 100% 100% 100% 100% 100% 98.0% 100% 98.0% 100%
XRBH\SLeePage: 4 of 415/08/2017 16:34
Community Summary 2017/2018

Area Performance Indicator 2017/18 Annual
Target Apr-17 May-17 Jun-17 Cumulative YTD Trend
REDUCING MORTALITY
Summary Hospital Mortality Indicator (SHMI) <1.1 1.046 1.046 1.046 1.046
PATIENT SAFETY
MRSA bacteraemia 0 0 1 0 1
Rates of C Difficile maximum 19 for full
year4 2 1 7
Number of falls (all patient falls safeguard) 982 100 86 53 239
Moderate 1 0 0 1
Severe 2 0 0 2
Fatal 0 0 0 0
Percentage of Harm (Safety thermometer) GM (rolling 12 months) <5% Harm 2.80% 2.61% 2.14% 2.14%
Percentage of Harm (Safety thermometer) Bolton FT (rolling 12 months) <5% Harm 4.45% 4.38% 4.42% 4.42%
% of adults who receive a falls screening within 6 hours of admission (5.3) 90% 98.0% 91.0% 98.0% 95.7%
All patients will receive a Waterlow risk assessment within 6 hours of
admission (8.2)90% 97.0% 95.0% 100.0% 97.3%
All patients identified as being at risk will have a body map completed and
appropriate individualised care plan (8.3)90% 97.0% 90.0% 97.0% 93.5%
All patients will have a nutritional assessment within 6 hours of admission
(6.3)90% 95.0% 91.0% 98.0% 94.70%
Medication Incidents 1200 FYE 100 114 100 314
Total Incidents 12,000 1378 1249 1322 3949
% Total incidents with no harm(Apr13-Sept13) NPSA
50%64.4% 82.4% awaiting data 73.4%
Nursing (nurses/midwifes) shifts (% Actual Vs Planned) Day need to agree tolerance 85.3 89.2 87.4 87.3
Nursing shifts (% Actual Vs Planned) Night need to agree tolerance 92.4 94.2 93.6 93.4
Care Staff shifts (% Actual Vs Planned) Day need to agree tolerance 99.4 96.7 97.7 97.9
Care Staff shifts (% Actual Vs Planned) Night need to agree tolerance 102.7 98.8 99.3 100.2
Number of SUIs 0 3 0 0 3
Number of never events 0 1 0 0 1
Incidents reported - patients affected 79 98 67 146 28 out of 67 for self harm
Never Events 0 0 0 0 0
Falls and Incidents - GMMH
QUALITY REPORT
HCAI - Trust only
Falls and Incidents - Bolton FT
Falls with at least moderate harm

Area Performance Indicator 2017/18 Annual
Target Apr-17 May-17 Jun-17 Cumulative YTD Trend
Complaints Responded to within time period 95% 91.0% 100.0% 100.0% 97.0%
A&E Percentage recommended 84.8% 84.7% 87.0% 85.5%
A&E Response Rate 15% 12.1% 12.9% 13.2% 12.7%
Inpatient Percentage recommended 97.8% 97.9% 96.9% 97.6%
Inpatient Response Rate 15% 35.3% 33.9% 24.5% 30.5%
Maternity Q1 Antenatal Care % recommended No target set 98.6% 99.1% 98.7% 98.8%
Maternity Q2 Birth % recommended No target set 92.5% 96.2% 97.0% 95.2%
Maternity Q2 Birth Response Rate No target set 16.7% 22.9% 32.4% 24.0%
Maternity Q3 Postnatal % recommended No target set 92.7% 92.7% 95.8% 93.7%
Maternity Q4 Postnatal Community % recommended No target set 100.0% 95.8% 94.9% 96.9%
Friends and family staff (Quarterly)Percentage recommended - work No target set 69.0%
latest data Q4 2016/17
Friends and family staff (Quarterly)Percentage recommended - Care No target set 82.0%
latest data Q4 2016/17
Friends and family - Outpatient Percentage Recommended No target set 97.8% 92.0% 92.8% 94.9%
Customer Care Complaints in month No target set 10 9 12 31
Concerns in month No target set 9 4 2 15
Compliments in month No target set 1 2 0 3
Percentage of complaints resonded to within negotiated timescales 95% 100.0% 100.0% 100.0% 100.0%
Friends and family - GMW Acute Percentage Recommended No target set 79.6% 78.9% 69.9% 76.1%
Friends and family - GMW Primary Care Percentage Recommended No target set 81.7% 78.9% 88.1% 82.9%
Complaints 0 0 0 0 0
Capturing patient experience: The % of patients referred to the service who
have their experience of using that service formally captured using
commissioner agreed tools, including the Friends and Family Test
20% 33.9% 29.4% 31.6% 31.6%
Patient satisfaction with the service provided: The % of patients who report
that they’ve had a positive experience of the service they’ve received 85% 81.8% 87.5% 91.7% 87.0%
Family/carer satisfaction with the service provided: The % of family
members/carers who report that they’ve had of a positive experience of the
service they’ve received.
85% 93.8% 100.0% 92.6% 95.5%
Complaints and Friends & Family (GMMH)
Complaints and Friends & Family (CAMHS)
69.0%
82.0%
PATIENT EXPERIENCE (Bolton FT)
Complaints and Friends & Family
(Bolton FT only)

Area Performance Indicator 2017/18 Annual
Target Apr-17 May-17 Jun-17 Cumulative YTD Trend
STAFFING
Sickness Absence 3.75% 4.40% 4.04% 4.24% 4.23%
Mandatory Training - Compliance 100% 88.90% 89.27% 89.59% 89.59%
Appraisals Completed 80% 79.9% 80.3% 79.96% 79.96%
Induction Attendance 100% 69.40% 74.23% 78.19% 78.19%
Substantive staff turnover Headcount (rolling average 12 months) <=10% 12.30% 11.02% 11.32% 11.32%
Staff in post FTE tba 390.7 388.7 390.6 390.6
Sickness Absence Rate - In Month 5.75% 5.96% 5.19% 7.79% 7.79%Hot spots for sickness are Older adult CMHT and
inpatient staff
Staffing levels 95% 79.40% 80.00% 97.20% 79.70%
Sickness Absence Rate 4.2% 2.40% 1.00% 1.70%
1 month in arrears
Mandatory Training 95% 89.90% 91.90% 90.60% 90.80%
Statutory Training 95% 91.70% 95.00% 94.50% 93.73%
Staff turnover (The % of staff who have remained in post for over a year) 90% 80.80% 84.20% 85.40% 83.50%
Quality Impact Indicators - CAMHS
Quality Impact Indicators - GMMH
Quality Impact Indicators - Bolton FT

Area Performance Indicator 2017/18 Annual
Target Apr-17 May-17 Jun-17 Cumulative YTD Trend
Theatre list team INBRIEF 99% 100.0% 100.0% 98.0% 100.0%
Theatre SIGN IN 99% 100.0% 100.0% 100.0% 100.0%
Theatre TIME OUT 99% 99.0% 99.0% 98.0% 98.7%
Theatre SIGN OUT 99% 100.0% 100.0% 100.0% 99.0%
Theatre list team OUTBRIEF 99% 97.0% 98.0% 97.0% 98.0%
BEAUMONT
Number of SUIs 0 0 0 0 0
Number of never events 0 0 0 0 0
Friends and family - Inpatient Percentage Recommended 0 99.0% 99.0% 99.1% 99.0%
Friends and family - Outpatient Percentage Recommended 0 99.4% 99.3% 98.7% 99.1%
PRIMARY CARE
Number of practices with a review identified (General Practice Outcome
Standards)Running Total 4 4 4 4
10 practices approaching review, 4 with review
identified
Number of patients registered at a GP Practice with a diagnosis of
Dementia (deined by the QOF dementia register code cluster) >=65 years
Need to agree
denominator and
tolerance
2,329 2,314 2,310 2,310Dementia diagnosis rate 78.3% compared to
national rate of 68%
Primary Care
CLINICAL EFFICIENCY AND EFFECTIVENESS
Better Care, Better Value
Bolton FT
Independent Sector

NHS BOLTON CCG MENTAL HEALTH PERFORMANCE DASHBOARD 2017/18
BASELINE
2016/17
TARGET
2017/18Apr-17 May-17 Jun-17 Jul-17 Aug-17 Sep-17 Oct-17 Nov-17 Dec-17 Jan-18 Feb-18 Mar-18
2017/18
TOTALEXCEPTIONS Trendline
Care Programme Approach (CPA): The proportion of
people under adult mental illness specialties on CPA -
7 day follow up MH004
98.0% 95.0% 94.9% 100.0% 100.0% 98.3%
No issues target met.
The proportion of those on CPA for at least 12
months who had a CPA review completed within
the last 12 months MH003
96.9% 95.0% 97.2% 97.0% 97.1% 97.1%
No issues target met.
Improving Access to Psychological Therapies (IAPT)
Access Rate
(Combined GMW and 1Point) MH006
13.4% 17.5% 11.3% 14.7% 15.1% 13.7%
The IAPT service achieved the 15% access rate target in July for the first time in 9 consecutive
months however the current national target in 1718 is 16.8% and the local stretch target is 17.5%
as part of the 2 year ambition to achieve 20% by the end of 2018/19
Improving Access to Psychological Therapies (IAPT)
Recovery Rate
(Combined GMW and 1Point) MH005
51.8% 50.0% 59.0% 65.0% 65.3% 51.8%
No issues target met, the team are significantly above the 50% target at 65% in month. This has
been supported by the recruitment to the vacant Psychological Wellbeing Practitioners posts
early on in the year.
Improving Access to Psychological Therapies (IAPT)
75% treated within 6 weeks of referral (GMW and
1Point)
87.5% 75.0% 75.4% 75.4% 75.0% 75.3%
The IAPT service hit both of the access targets in 2016/17 with 75% of people completing
treatment in month having had their 1st appointment within 6 weeks and 100% having had their
1st appointment within 18 weeks.
Improving Access to Psychological Therapies (IAPT)
95% treated within 18 weeks of referral (GMW and
1Point)
99.9% 95.0% 99.2% 100.0% 100.0% 99.7%
The IAPT service hit both of the access targets in 2016/17 with 75% of people completing
treatment in month having had their 1st appointment within 6 weeks and 100% having had their
1st appointment within 18 weeks.
EIP
Early Intervention Psychosis (EIP)
% treated with a NICE approved care package within
two weeks of referral.
90.1% 50.0% 90.0% 100.0% 90.0% 93.3%
No issues to report in relation to the EI service.
RA
ID
Rapid Assessment Interface and Discharge model
(RAID) - % of A&E emergency referrals assessed
within 1 hour MH001
82.5% 75.0% 70.8% 75.4% 66.0% 70.6%
The Bolton RAID team responded to 66% of all referrals received within 1 hour short of the 75%
target. This is due to the team experiencing continued high levels of referrals at times of reduced
capacity (Out of Hours) with the team experiencing sickness and vacancies which are currently
going through the recruitment process. The RAID team continue to provide comprehensive
DEM
06
5 Estimated dementia diagnosis rate for people with
dementia of the total estimated prevalence (ages
65+)
80.2% 80.0% 79.6% 79.1% 79.1% 80.2%
Dementia diagnosis rate exceeded target in 2016/17. The target increases to 80% for 2017/18
and with a refreshed estimated dementia population size of over 65s the April and May updates
have shown a reduction to 79% however this value is expected to rise monthly to above 80% by
year end. June totals on Dementia register were 2,314 which is the same as in May 2017 for
MH
MD
S
National HSCIC Mental Health Minimum Data Set
(MHSDS) data completeness (NHS Number)99.9% 97.0% 100.0% 100.0% 100.0% 100.0%
MHSDS reporting is now consistently above 90% for all sub categories of the dataset including
employment and accommodation status which were previously identified as lower than expected
throughout 2016/17
Total SPOA Referrals received
(GP, SELF, OTHER)3983 - 167 206 191 564
from Oct 2017 this has been BAS data only and only the ones put through as eligible from SPOA.
GMMH Bi team to report on all SPOA and use BAS as a reporting line.
87% GP sourced referrals, 3.3% self referral, 10% other source referral
% Emergency referrals seen within 24hrs 100.0% 95.0% 100.0% 100.0% 95.0% 98%
(from GMMH report) - A data reporting error has affected the BAS result on the report,
incorrectly showing 95% as opposed to the actual 100%. The admin teams are working to
identify and resolve the reporting error going forward. All emergency referrals were seen within
target timeframe and the ssessment team accepted a total of 191 referrals from Primary Care
Average wait (days) for Emergency Referrals 0.6 1.0 0.3 0.4 0.5 0.4
Average wait (days) for Urgent
Referrals5.6 7.0 2.0 2.3 5.4 3.2
Average wait (days) for Routine
Referrals18.4 28.0 8.9 8.4 12.1 9.8
Total number of emergency referrals 145 - 13 20 21 54
RAID Rapid Assessment Interface and Discharge
No of completed assessments 3959 - 343 352 332 1,027
91.7% of RAID referrals were discharged from A&E within 4 hours. This again is effected by the
issues created out of hours where RAID capacity is limited. The Trust continue to work with the
CCG on an all age RAID expansion, which would provide greater economies and cover the out of
hours with an additional practitioner.
INDICATOR DESCRIPTION
NHS England » The Forward View into actionC
PA
IAP
T
SINGLE POINT OF ACCESS (SPOA)

NHS BOLTON CCG MENTAL HEALTH PERFORMANCE DASHBOARD 2017/18
BASELINE
2016/17
TARGET
2017/18Apr-17 May-17 Jun-17 Jul-17 Aug-17 Sep-17 Oct-17 Nov-17 Dec-17 Jan-18 Feb-18 Mar-18
2017/18
TOTALEXCEPTIONS TrendlineINDICATOR DESCRIPTION
CAMHS Child and Adolescent Mental Health Services
Staffing levels 82.4% 95.0% 79.4% 80.0% 97.2% 85.5%
Staffing shown great improvement in June
Sickness Absence Rate 0.8% 4.2% 2.4% 1.0%Reported 1
month in
arrears1.7%
Monthly figure reported 1 month in arrears
Sickness Absence Rate 1.2% 4.2% 2.4% 1.1%Reported 1
month in
arrears1.8%
YTD value
Mandatory Training 98.4% 95.0% 89.9% 91.9% 90.6% 90.8%
Potential dip due to increase in staffing levels
Statutory Training 98.2% 95.0% 91.7% 95.0% 94.5% 93.7%
Potential dip due to increase in staffing levels
Staff turnover (The % of staff who have remained in
post for over a year)81.6% 90.0% 80.8% 84.2% 85.4% 83.5%
improving position, takes several months to recover as it’s a moving average.
Staff turnover (The % of staff leaving in month) 1.1% 5.0% 0.0% - - 0.0%
This measure has been left blank in the data for past 2 months activity
Tier 3 Activity 11523 774 973 961 2,708
Combined first and follow up activity, appears to exclude telephone contacts (156 x more)
1:FUP ratio of 1:7 in Apr reducing to 1:6.7 in June
Triage of Referrals: All referrals triaged within 1
working day99.5% 98.0% 100.0% 100.0% 100.0% 100.0%
All referrals triaged within 1 day
Referral Wait Time: Emergency within 1 working day 100.0% 90.0% 100.0% 100.0%Reported 1
month in
arrears100%
Monthly figure reported 1 month in arrears
Referral Wait Time: Routine within 20 working days 92.0% 90.0% 100.0% 100.0%Reported 1
month in
arrears100.0%
Monthly figure reported 1 month in arrears
% of patients with ongoing treatment needs who
had a follow-up appt within 28wks after initial appt
/assessment.
100.0% 70.0% 94.0% 99.0%Reported 1
month in
arrears96.5%
Monthly figure reported 1 month in arrears
DNAs - New 5.7% < 5% 4.1% 5.3% 4.0% 4.5%
in a recent meeting between CCG and Provider the CAMHS Provider suggested that the
threshold KPI of 5% is not in line with national averages for a service of this nature and would like
the commissioners to review the target as nationally Bolton FT CAMHS is recognised as
performing well in this area for DNA NEW and DNA Follow Ups
DNAs - FU 7.4% < 5% 8.2% 6.9% 7.8% 7.6%
DNA FUP consistently above plan however this target is the same across all community services
and due to the nature of this service there is a higher expected DNA FUP rate. Bolton FT Camhs
DNA FUP understood to be quite low in comparison to similar provider trusts.
% of Clinic appointments cancelled within 1 week of
the due date1.8% < 3% 2.2% 1.4% 1.8% 1.8%
Cancellations below plan
% of Patients who have their experience captured 29.7% >20% 33.9% 29.4% 31.6% 31.6%
Patient Satisfaction with the service 84.6% >85% 81.8% 87.5% 91.7% 87.0%
Family / Carer Satisfaction 94.1% >85% 93.8% 100.0% 92.6% 95.5%
Complaints 2 0 0 0 1 1
acknowledged and responded to within agreed timescales
% of young people 10 point improvement on CGAS 60.0% >50% 74.0% 56.0% 63.0% 64.3%

NHS BOLTON CCG MENTAL HEALTH PERFORMANCE DASHBOARD 2017/18
BASELINE
2016/17
TARGET
2017/18Apr-17 May-17 Jun-17 Jul-17 Aug-17 Sep-17 Oct-17 Nov-17 Dec-17 Jan-18 Feb-18 Mar-18
2017/18
TOTALEXCEPTIONS TrendlineINDICATOR DESCRIPTION
GREATER MANCHESTER WEST (GMW) Mental Health NHS Foundation Trust
PHQ9 / GAD7 - Percent of Clients showing Reliable
Improvement65.9% > 66% 71.9% 76.0% 72.4% 73.4%
This measure has been included as an indicator of reliable improvement based on the entry to
IAPT psychological questionnaires about their condition and again on discharge to assess how
great the outcome score has improved
ACP - (Psychiatric Adult Functional) Readmissions as
a % of discharges9.9% 10.7% 11.9% 17.6%
Reported 1
month in
arrears11.9%
There where 9 re-admissions in month out of 51 discharges all of which are itemised below: 1 -
Patient requested discharge, agreed partner then found her taking OD so was readmitted 2 -
Self presented intoxicated, vulnerable therefore detained on section 2. 3 - Non compliant with
conditions of CTO so recalled 4 - significant self harm admission to manage risk 5 - admission to
ACP - Directorate average length of stay (days) 37 - 23 44 25 37
YTD Average for 17/18 YTD is 37 days. Older adult organic account for the longest stays within
month
Total delayed discharges as % of occupied bednights 0.4% < 7.5% 0.0% 0.0% 0.0% 0.00%
There have been no delayed discharges reported since June 2016
Gatekeeping % of Admissions (18 - 65yr) to Inpatient
services with access to Crisis Resolution Home
Treatment teams.
100.0% 95.0% 100.0% 100.0% 100.0% 100%
all 32 admissions were gatekept in June
% of Clients discharged from Inpatient Services that
had a Discharge Notification finalised within 24
hours of discharge.
93.5% 90.0% 80.5% 85.7% 81.8% 82.7%
The service has identified particular operational issues in the first quarter effecting performance,
conserted efforts are being made to streamline the junior doctor's change over process and to
ensure the service is not negatively impacted during future transition periods. The team has
recruited Senior Clinical Pharmacist to lead on improvements within the pharmacy service, with a
Young People Under 18 Admitted to Adult Wards 1 0 1 2 0 3
No comments in GMMH report explaining these 3 breaches in year
Dementia (MATS)
MATS - Total number of referrals accepted 770 - 11 2 5 18
MATS - Clients offered assessment within 28 days 182 - 7 0 0 7
MATS - Number on waiting list 92 - 60 51 40 92
Number of waiters has reduced from a peak of 103 reported in March 2017 and is currently
lower than the same period in 1617
MATS - Average Wait to First Appointment (Weeks) 5.5 6 weeks 6.4 6.5 5.3 6.1
Delays at Bolton Ft with available spaces and admin time required are impacting on the ability to
meet the 6wk targets
MATS - Average Wait to Diagnosis (Weeks) 5.9 - 7.0 7.8 7.9 7.6
The team met the 12 week targets in month.
MATS - Diagnosed MCI as % of total Diagnosed 26% - 26% 27% 18% 24.5%
Mild cognitive impairment (MCI) is a condition in which someone has minor problems with
cognition.
NWAS Ambulance Service Mental Health / Behavioural activity
Mental Health related condition Ambulance callouts
for Bolton CCG to all A&E depts1361 < 1,361 114 131 245
Reduction of 6.7% in 2016/17
% of Mental Health related condition Ambulance
callouts for Bolton CCG which are classed as Red
(Emergency)
12.3% < 10% 7.9% 8.4% 12.3%
Increase of 2.3% above baseline performance for the requirement of a more urgent emergency
callout. Reduction seen YTD in 2017/18
Mental Health related condition Ambulance callouts
for Bolton CCG as a % of total calls for all conditions
and callouts.
5.1% < 5.1% 5.2% 5.4% 5.1%
Reduction of 0.4% below baseline performance at 2016/17 yr end,
The MATS service continues to hit the 12 weeks to diagnosis target but due to the one stop shop
approach whereby the team gathers all scan and test info possible ahead of the appointment we
struggle to meet the 6 week first contact target.Work continues with RBH collegues to develop
ways to speed up the scanning process and we endeavour to see everybody referred as quickly
as possible.
No comments in GMMH report available on the performance in July 2017 to use in this section

NHS BOLTON CCG MENTAL HEALTH PERFORMANCE DASHBOARD 2017/18
BASELINE
2016/17
TARGET
2017/18Apr-17 May-17 Jun-17 Jul-17 Aug-17 Sep-17 Oct-17 Nov-17 Dec-17 Jan-18 Feb-18 Mar-18
2017/18
TOTALEXCEPTIONS TrendlineINDICATOR DESCRIPTION
STTB Board MeasuresR
AID
Rapid Assessment Interface and Discharge model
(RAID) - % of A&E emergency referrals assessed
within 1 hour
82.5% 75.0% 70.8% 75.4% 66.0% 70.6%
The Bolton RAID team responded to 66% of all referrals received within 1 hour short of the 75%
target. This is due to the team experiencing continued high levels of referrals at times of reduced
capacity (Out of Hours) with the team experiencing sickness and vacancies which are currently
going through the recruitment process. The RAID team continue to provide comprehensive
ACP - Directorate percentage bed occupancy 94.0% 80-90% 93.0% 95.6% 103.0% 97.0%
Organic older adults YTD average 123.6%, Older adults functional 86.4%.
Attempted Suicides (proxy measure using ICD10 codes
X6-X8 in TIS data up to 12th Diagnosis level) Bolton CCG to
all providers
695 - 53 69 54 176
note: excludes suicide attempts where patient was brought into hospital already deceased
FOT for 1718 is currently 26% higher than baseline
Suicide Mortality (proxy measure using ICD10 codes X6-
X8 in TIS data up to 12th Diagnosis level and outcome was
patient died) as above
3 - 1 0 0 1
note: excludes suicide mortality where patient was brought into hospital already deceased
Sickness absence % rate
(rolling 12m ending total)
GMW report 6.020
0 5.80% 6.12% 6.13% 6.39% 6.2%
Sickness in month has turned to red at 7.79%. The hotspots for sickness identified are Older
Adult CMHT staff and In-patient staff; these continue to be managed in accordance with the
Trust absence policy. Overall the 12 month rolling sickness position remains in the red at 6.39%
against the 5.75% target level.
ACP - Incidents Level 4/5 59 - 8 4 6 18
YTD 2017/18
Community x 17
Inpatient Adult Functional x 1
Usage of section 136 suite
(GMW report section 4.091) MH002215 - 12 28 33 73
There were 33 x S136 detentions co-ordinated by GMMH staff in June. This is a high level of
activity with the cause unknown, however, the trend has been heightened since the Manchester
terror attack. There were no detentions that waited over 24 hours for assessment and 63.6% of
discharges required mental health input. The urgent care teams continue to promote the use of
Outcomes of section 136 suite -
Assessed and Discharged as % of total
(GMW report section 4.093)
34% - 17% 46% 36% 33%
The remaining 57% of activity is split between formal and informal admissions or signposted on
to other GMMH Services
Out of area Placements (OAPs) NEW 8 - 1 2 5 8
Out of area Transfers (OATs) NEW 0 - 0
Out of area Transfers (OATs) EXISTING 55 - tbc
% SPOA Emergency referrals
seen within 24hrs100.0% 100.0% 100.0% 100.0% 95.0% 98%
(from GMMH report) - A data reporting error has affected the BAS result on the report,
incorrectly showing 95% as opposed to the actual 100%. The admin teams are working to
identify and resolve the reporting error going forward. All emergency referrals were seen within
target timeframe and the ssessment team accepted a total of 191 referrals from Primary Care
EIP
Early Intervention Psychosis (EIP)
% treated with a NICE approved care package within
two weeks of referral.
90.1% 50.0% 90.0% 100.0% 90.0% 93.3%
No issues to report in relation to the EI service.
Home Based Treatment Services - Treatment
Episodes
(Referrals plus two contacts) (GMW 4.082)
1227 1,227 116 84 104 304
78% increase on plan seen in 16/17. FOT 1718 in line with 1617 at present.
Friends & Family test (GMW directorate) MH008 87.1% > 87.1% 84.6% 79.9% 77.3% 80.6%
2016/17 FFT performance is just below national average (89%)
ACP - Directorate average length of stay for current
inpatients (days) (GMW 4.022)64 - 80 69 73 74
Average length of stay is based on the average number of days that clients spend in designated
wards as at end of each reporting month. Figures to date are refreshed each month. Overall
trend since April 2016 has been increasing to a peak of 80 days for discharges in April 2017
ACP - Total number of complaints 113 - 10 9 12 31
Q1 1718 (31) in line with Q1 1617 (30)
There were 5 OAP's in June all of which are itemised below;
1 - On the 1st June 2017, one female patient was admitted to Cheadle Royal in an acute bed as
there were no female beds available. She was repatriated on the 9th of June 2017.
2- On the 12th of June 2017, one male patient was admitted to NHS Chester and Wirral due to
no male beds available and he was repatriated on 14th June 2017
3- On the 25th June 2017, one male patient was admitted to Cygnet Harrogate due to no male
beds being available and he returned on 27th June 2017.
4 - On the 26th June 2017, one female was admitted to Cheadle Royal Hospital due to there
being no female beds available. She was repatriated on the 7th of July 2017.
5 - On the 30th June 2017, one female was admitted to Cheadle Royal due to no female beds
and she was returned on the 13th of July 2017.
Awaiting Update-
further work on Broadcare
reporting to split the OAPs
OATs and existing placements

Bolton Integrated Care Key Lines of Enquiry (KLOE) Performance Report 2017/18
INDICATOR DESCRIPTIONBASELINE
2016/17
TARGET
2017/18Metric Apr-17 May-17 Jun-17 Jul-17 Aug-17 Sep-17 Oct-17 Nov-17 Dec-17 Jan-18 Feb-18 Mar-18
2017/18
TOTALCOMMENTS/EXCEPTIONS TRENDLINE
High Level PerformancePrev Yr 7,982 8,560 8,006 8,489 7,929 8,025 8,210 7,745 7,714 7,408 6,818 7,847 94,733
2017/18 7,692 8,452 7,905 24,049Var% -3.6% -1.3% -1.3% -74.6%
Prev Yr 2,636 2,801 2,682 2,754 2,563 2,707 2,723 2,867 2,803 2,706 2,512 2,729 32,4832017/18 2,369 2,676 2,458 7,503
Var% -10.1% -4.5% -8.4% -76.9%
BCF PerformancePlan 3.3% 3.3% 3.3% 3.3% 3.3% 3.3% 3.3% 3.3% 3.3% 3.3% 3.3% 3.3% 3.3%
Actual 5.6% 5.7% 2.9% 4.7%Var% 2.3% 2.4% 1.4%Plan 635 656 635 656 656 635 656 627 648 648 586 648 7,686
Actual 793 943 436 2,172Var% 24.9% 43.8% -31.3% -71.7%Plan - - - - - - - - - - - -
Actual 737.9 721.2 708.7 708.7Var%
Plan
Actual TBCVar%
Prev Yr 173 180 168 132 164 136 151 191 183 175 166 211 2,030Actual 169 175 177 344
Var% -2.3% -2.8% 5.4% -83.1%
Bolton & GM Priority MeasuresPrev Yr 12.5% 12.8% 11.6% 12.4% 11.7% 11.3% 10.2% 10.8% 11.5% 12.6% 12.1% 11.8% 12.7%Actual 13.0% 14.3% 13.2% 13.5%
Var% 0.5% 1.5% 1.6% 0.8%Prev Yr 9.3% 10.1% 8.9% 9.3% 9.0% 8.3% 8.3% 7.4% 8.7% 8.3% 7.8% 7.5% 9.3%Actual 8.7% 8.5% 8.1% 8.40%
Var% -0.6% -1.6% -0.9%Prev Yr 4.60 4.33 4.46 4.01 4.64 4.39 4.20 4.35 4.41 4.67 4.64 4.41 4.37Actual 5.29 4.86 4.90 5.02
Var% 15.0% 12.4% 9.8%Prev Yr 4.75 4.69 4.62 4.15 4.68 4.54 4.58 4.69 4.60 4.75 4.64 4.67Actual 4.70 TBC TBC 4.7
Var% -1.0%Prev Yr 540 520 525 507 475 513 561 677 620 610 525 483Actual 487 443 TBC 930
Var%
Prev Yr 84 68 58 52 73 75 68 82 96 67 68 71Actual 83 60 TBC 143
Var%
Plan 95.0% 95.0% 95.0% 95.0% 95.0% 95.0% 95.0% 95.0% 95.0% 95.0% 95.0% 95.0% 95.0%Actual 92.3% 95.7% TBC 94.0%
Var% -2.7% 0.7% -1.0%Plan
Actual TBCVar%
Plan
Actual 2,689Var%
Plan
Actual 27.8%Var%
Plan
Actual TBCVar%
Plan
Actual TBCVar%
Plan
Actual TBCVar%
Plan
Actual TBCVar%
Reported in Sep 2017
Reported 'Autumn' 2017
- - -
Performance year to date is on average -2.5% below the same
period in 2016/17. Data from TNR was refreshed in August 2017
due to SUS data issues which are now resolved.
A&E Attendances
All Types A&E from Bolton CCG (TNR Data)94,733
Up to 7%
reduction
required
Performance year to date is on average -8.0% below the same
period in 2016/17. Data from TNR was refreshed in August 2017
due to SUS data issues which are now resolved.
Total Non-Elective Admissions
All NELs from Bolton CCG (TNR Data)32,483
Up to 5%
reduction
required
Delayed transfers of care (DTOC)
DTOC Beds - Bolton FT Position6.0%
3.3% of
Occupied Bed
Base
Issues identified around the numerator and denominator used to
calculate the DTOC daily and DTOC monthly totals have now been
resolved so performance expected to improve from Q2
Delayed transfers of care (DTOC)
Total number of delayed days
10,994 (4,990 per
100,000)
Based on
prescribed
GM Targets
Issues identified around the numerator and denominator used to
calculate the DTOC daily and DTOC monthly totals have now been
resolved so performance expected to improve from JunePermanent admissions of older people
(rate per 100,000) aged 65yrs+ to residential &
nursing care homes
801.7 TBCTargets for 2017/18 are under review between the CCG, Bolton FT
and Bolton Council as the old targets were based on carefirst
activity which is captured differently in Liquid Logic now.
% of older people still at home 91 days after
discharge from reablement/rehab services
88.6% (Q2 16/17)
TBC-
TBC- - - Data for this measure is not yet available from Liquid Logic
reporting system, Bolton Council are working on this and will be
reported as soon as available.Referrals to home based intermediate care
(incl. referrals to IMC at home plus AAT discharges to
Darley Court & Laburnum Lodge)
2,030 TBCMethodology under review for this measure as it may not be
highlighting the overall performance. The total referrals to home
based care exceeded baseline by 7.7% in 2016/17 FY
This data comes from TNR and due to SUS data issues this is
unavailable at present for June 2017. Work is underway by Bolton
FT to resolve this as soon as possible
30 day emergency readmissions
Bolton CCG8.7% Reduce
This data comes from TNR and due to SUS data issues this is
unavailable at present for May and June 2017. Work is underway by
Bolton FT to resolve this as soon as possible
30 day emergency readmissions
Bolton FT Catchment11.7% Reduce
Non Elective Average Length of Stay
Bolton FT Catchment
4.37 (days)
ReduceThe average LOS for Bolton FT in Qrt1 2017/18 was equal to the
2016/17 target of 4.3 days and lower than the 4.46 days
performance as reported in Qtr1 of 2016/17
Non Elective Average Length of Stay
Bolton CCG
4.61 (days)
ReduceThis data comes from TNR and due to SUS data issues this is
unavailable at present for May and June 2017. Work is underway by
Bolton FT to resolve this as soon as possible
Avoidable emergency admissions
Composite total of 4 x supporting measures6,556 Reduce
This data comes from TNR and due to SUS data issues this is
unavailable at present for June 2017. Work is underway by Bolton
FT to resolve this as soon as possible
Number of NEL admissions due to falls and
fall related injuries (ages 65yrs+)862 Reduce
This data comes from TNR and due to SUS data issues this is
unavailable at present for June 2017. Work is underway by Bolton
FT to resolve this as soon as possible
- - In the rolling 12m to Dec 2016, 45.3% of deaths occurred in usual
place of residence. Deaths in hospital are reducing, however
Hospice is absorbing the reduction instead of home
Performance has dipped in April due to the addition of Bolton
Hospice and GMMH into the combined average for Bolton CCG
however only the Hospice and 2 care homes failed 95%
% of people that die in their usual
place of residence.
45.3%(Q3 16/17)
Increase- -
% of Patients experiencing harm-free care
Average of Bolton FT, Nursing Homes, BMI,
Bolton Hospice and GMMH trust
96.4% 95.0%
Increase-
Reported in Sep 2017
Proportion of people using social care
receiving direct payments29.7% Increase
-
2,689- - - Quarterly: those receiving a service at end of quarter. Indicator to
be removed from future reporting following discussions between
CCG and Bolton Council regarding relevance.
Number receiving residential care, nursing
care and community based services (65+)2,826
-
27.8%- - - The latest reported position in June 2017 is 27.8% which is a
reduction from the previous quarter performance of 29.7% and
reduction from 31.2% as reported in 2016/17 Qtr1
Health-related quality of life for carers76.7%
(July 15 to
Mar 16)
Increase-
TBC- - - As Intermediate care data is not yet available from Liquid Logic
reporting system, Bolton Council are developing a manual update
for this indicator for year end reporting purposes.
% of people receiving reablement or
intermediate care at the point of discharge6.5% Increase
Data reported up to 2 years in arrears, next update expected to be
published on NHS Digital in September 2017 covering the period;
July 2016 to March 2017
People feeling supported to manage their
condition (Annual GP Patient Survey)
65.9%(Jan-Mar17)
Increase-
- - - Data reported up to 2 years in arrears, next update expected to be
published on NHS Digital in Autumn 2017 covering the period;
2015/16 FY
Carer reported overall quality of life8.4
(14/15 Latest)Increase
-
- - - GP Survey is now published annually in July and is based on a
snapshot Qtr4 performance. The previous two ratings were scored
66.7% in 15/16 and 66.2% in 16/17 - declining trend
Annual GP Survey measure reported next in July 2018 based on Qtr4 of 2017/18 responses received

Bolton Integrated Care Key Lines of Enquiry (KLOE) Performance Report 2017/18
INDICATOR DESCRIPTIONBASELINE
2016/17
TARGET
2017/18Metric Apr-17 May-17 Jun-17 Jul-17 Aug-17 Sep-17 Oct-17 Nov-17 Dec-17 Jan-18 Feb-18 Mar-18
2017/18
TOTALCOMMENTS/EXCEPTIONS TRENDLINE
Intermediate Tier - Admission Avoidance Team (AAT)Prev Yr 174 209 213 237 203 172 236 205 177 143 124 176 2,269
2017/18 154 168 170 162 654Var% -11% -20% -20% -32% -71.2%
Prev yr 172 206 204 201 178 160 186 178 155 142 120 159 2,061Actual 144 154 138 115 551
Var% -16% -25% -32% -43% -73.3%Prev yr 99% 99% 96% 85% 88% 93% 79% 87% 88% 99% 97% 90% 90.8%Actual 94% 92% 81% 71% 84.3%
Var% -5% -7% -15% -14% -6.5%Plan 3.3 3.3 3.3 3.3 3.3 3.3 3.3 3.3 3.3 3.3 3.3 3.3 3.3
Actual 3.2 2.6 3.2 2.8 3.0Var% -2% -21% - - - - -10.4%
Prev yr 2 3 9 36 25 12 50 27 22 1 4 17 208Actual 10 14 32 47 103
Var% 400% 367% 256% 31% -50.5%
Integrated Neighbourhood Teams (INT)Plan 293 293 293 293 293 293 293 293 293 293 293 293 879
Actual 123 171 136 430Var% -58.0% -41.6% -53.6% -51%Plan 99% 99% 99% 99% 99% 99% 99% 99% 99% 99% 99% 99% 99%
Actual 33.3% 36.6% 32.6% 34.2%Var% -66% -62% -66%Plan 90% 90% 90% 90% 90% 90% 90% 90% 90% 90% 90% 90% 90%
Actual 4.2% 4.5% 5.6% 4.8%Var% -85.8% -85.5% -84.4% -85.2%Plan 15% 15% 15% 15% 15% 15% 15% 15% 15% 15% 15% 15% 15%
Actual 0% 0.6% 1.5% 0.7%Var% -15.0% -14.4% -13.5% -14.3%Plan 98% 98% 98% 98% 98% 98% 98% 98% 98% 98% 98% 98% 98%
Actual 69.9% 69.6% 75.7% 71.7%Var% -28% -28% -22% -26.3%Plan 1,172 1,172 1,172 1,172 1,172 1,172 1,172 1,172 1,172 1,172 1,172 1,172 1,172
Actual 2,203 2,293 2,323 2,323Var% 88% 96% 98% 98.2%Plan 12.0 12.0 12.0 12.0 12.0 12.0 12.0 12.0 12.0 12.0 12.0 12.0 12.0
Actual 15.9 18.4 22.6 18.9Var% 33% 53% 88% 57.5%Plan 293 293 293 293 293 293 293 293 293 293 293 293 3,516
Actual 81 83 106 270Var% -72% -72% -64% -92%Plan 0 0 0 0 0 0 0 0 0 0 0 0 0
Actual 0 1 0 1Var% - - - 2%Plan 100% 100% 100% 100% 100% 100% 100% 100% 100% 100% 100% 100% 100%
Actual 100% 97.7% 98.5% 98.6%Var% 0.0% -2.3% -1.5% -1.4%Plan 100% 100% 100% 100% 100% 100% 100% 100% 100% 100% 100% 100% 100%
Actual 100% 100.0% 100.0% 100.0%Var% 0.0% 0.0% 0.0% 0.0%Plan
Actual TBC TBC TBC TBCVar%
Plan
Actual TBC TBC TBC TBCVar%
Care Homes ServicePlan 149 149 149 149 149 149 149 149 149 149 149 149 1,788
Actual 257 288 161 706Var% 72.5% 93.3% 8.1% -60.5%Plan 90% 90% 90% 90% 90% 90% 90% 90% 90% 90% 90% 90% 90%
Actual 100% 99% 100% 99.7%Var% 10% 1% 10% 0.3%Plan - - -
Actual -26 3 -17 -40Var% - - -Plan - - -
Actual -14 7 1 -6Var% - - -
% of INT patients allocated a Key Worker 67.0% 98.0%This includes 117 (28%) with no data entered and only 4 people are
coded as having no key worker. Completing the forms corerectly
would instantly improve this performance measure
% of patients who decline INT offer 4.1% 15.0%
Number of patients admitted onto caseload 2,061 IncreaseAverage of 149 per month who are added to caseload. As a % this
equates to 93% of referrals available whch is higher than the 91.5%
accepted to caseload in 2016/17
Total AAT referrals
from Intermediate Care Metrics Performance Report2,269 Increase
AAT referrals total for 2016/17 in the community performance
report were 2,322 (2.3% higher). 32% of referrals in community
performance report to AAT are GP sourced.
Average length of stay on caseload
(Days)3.2 < 3.3
Overall reduction in Ave LOS on caseload however notable peaks
in Sept 2016 and Feb 2017 where sickness and staff turnover may
have impacted on the performance.
% of referrals admitted onto caseload 91.5% > 91.5%Measure based on total referrals minus patients declining the AAT
service. Measure is same as reported in the Urgent Care
Dashboard.
Number of patients not admitted to caseload 208 ReduceAverage of 15 declines per month which rose to an average of 25
per month throughout July to December however rates have since
returned to expected levels.
% of Referrals Seen within 5 days 22.0% 90.0%Target to be reviewed in line with new model of care for
neighbourhood integrated teams. Face to face seen within 5 days
may relate only to urgent priority referrals and not all INT
Total INT Referrals
from INT Dashboard2,330 3,516
Targets shown here based on 16/17 targets and under review by
Bolton CCG and Bolton FT and LA in relation to the locality plan
requirements for 17/18 and 18/19
New measure for capturing initial contact regardless of method as
all new referrals should be contacted within 5 days of receiving
referral.
% of Referrals Contacted within 5 working
days (new measure to be considered for INT Dash)TBC 99.0%
3 patients are recorded as refusing the INT service offer year to
date however only 27 patients have been recorded accepting the
service with 93% of the rest of activiity left blank.
Average Length of Stay on Caseload
(Weeks)12.3 12.0
Ave LOS on caseload remains over the 12 week guidance target
and median LOS was 22.2 weeks in June and year to date median
is 17.7 weeks against the 12 week guide target
Number of patients stepped down
Discharged / Stepped Down, RIP, Other1,013 3,516
Total Caseload remains at 2,223 in June 2017 with just 106 patients
stepped down or discharged. There is a known issue around the
closure of patients on social care affecting this.
Number of patients on Caseload 1,809 1,172New measure for capturing number of people on caseload and the
target of 1,172 is based on 293 referrals for a 12wk average LOS
however this measure needs reviewing with INT service.
% of patients with NHS number recorded 96.2% 100.0%Actual number missing NHS number year to date is 4 of 421
referrals seen. The capture of NHS number is vital to assess
before/after INT and practice level referral activity
Number of INT patients on EOL register 9 TBCThis measure is to monitor the movement of activity between the
upper tier of the risk stratification list. There is an assumption that
the EOL GSF pathway will already be involved with MDTs
A&E Attendances Avoided TBC TBC
Number of patients with a care plan
or admission avoidance plan in place100.0%
Data for this indicator is sourced from the Community Services
Performance report where a care plan of some form is recorded
against every service user upon assessment.
Methodology to be signed off and once TNR SUS data issues are
resolved these will start to be populated in 6 month arrears to allow
for enough before/after activity to be analysed
Total Care Homes Service Referrals
from Community Performance Report3,832 1,788
Referrals to Care Home Service are 58% above plan YTD however
this data is based on the community and referrals dataset which is
still being developed into automated reports.
NEL Admissions Avoided TBC TBCMethodology to be signed off and once TNR SUS data issues are
resolved these will start to be populated in 6 month arrears to allow
for enough before/after activity to be analysed
A&E Attendances Avoided* (method 1) 0 TBC
% of Referrals seen within 4 weeks 99.6% 90.0%As above the community and referrals dataset is still being
developed however there has only been one incidence of a patient
waiting to be seen longer than 4 weeks in Qtr 1 17/18
This crude method is based on monthly A&E attends compared to
same month in previous year. The Care Home Excellence
dashboard contains more measures around activity and CQC
NEL Admissions Avoided* (method 1) 0 TBCThis crude method is based on monthly NEL admissions compared
to same month in previous year. See the Care Home Excellence
dashboard for measures around NWAS calls & NEL

Bolton Integrated Care Key Lines of Enquiry (KLOE) Performance Report 2017/18
INDICATOR DESCRIPTIONBASELINE
2016/17
TARGET
2017/18Metric Apr-17 May-17 Jun-17 Jul-17 Aug-17 Sep-17 Oct-17 Nov-17 Dec-17 Jan-18 Feb-18 Mar-18
2017/18
TOTALCOMMENTS/EXCEPTIONS TRENDLINE
Intermediate Tier - Total Home Based and Bed BasedPrev Yr 382 405 407 367 361 299 322 375 363 401 317 397 4,396Actual 347 372 356 1,075
Var% -9.2% -8.1% -12.5% -76%Intermediate Tier Home-Based Services
Prev Yr 162 167 161 125 158 131 141 188 178 175 161 208 1,955Actual 161 172 176 509
Var% -0.6% 3.0% 9.3% -74%Prev Yr 165 124 139 107 135 132 113 157 150 158 127 148 1,655Actual 136 138 125 399
Var% -17.6% 11.3% -10.1% -76%Prev Yr 101.9% 74.3% 86.3% 85.6% 85.4% 100.8% 80.1% 83.5% 84.3% 90.3% 78.9% 71.2% 85.2%Actual 84.5% 80.2% 71.0% 79%
Var% -17.4% 6.0% -15.3% -8%Prev Yr 48.8% 53.3% 50.9% 58.4% 50.0% 54.2% 49.6% 41.5% 43.8% 50.3% 50.9% 46.6% 49.9%Actual 53.4% 51.7% TBC 53%
Var% 4.7% -1.5% 5%Prev Yr 26.6 32.0 33.4 30.0 29.3 30.3 29.2 29.1 29.1 28.7 29.3 29.0 29.7Actual 34.3 28.9 22.5 28.6
Var% 29% -10% -3.8%Prev Yr 122 120 109 127 88 105 91 98 92 105 78 98 1,233Actual 102 110 98 310
Var% -16.4% -8.3% -10.1% -75%Prev Yr 115 102 95 89 91 86 84 92 84 81 73 68 1,060Actual 64 80 87 231
Var% -44.3% -21.6% -8.4% -78%Prev Yr 94.3% 85.0% 87.2% 70.1% 103.4% 81.9% 92.3% 93.9% 91.3% 77.1% 93.6% 69.4% 86.6%Actual 62.7% 72.7% 88.8% 75%
Var% -31.5% -12.3% -14%Prev Yr 55.7% 65.0% 52.3% 67.7% 61.4% 66.7% 48.4% 60.2% 48.9% 55.2% 44.9% 52.0% 56.5%Actual 56.9% 47.3% TBC 52%
Var% 1.1% -17.7% -8%Prev Yr 28.6 28.0 33.1 38.1 36.5 41.2 48.4 36.9 36.9 38.9 44.1 39.9 29.9Actual 24.4 25.4 26.3 25.4
Var% -15% -9% -21% -15.2%Intermediate Tier Bed-Based Services
Prev Yr 48 78 88 81 115 63 90 89 93 121 78 91 1,035Actual 84 90 82.0 256
Var% 75.0% 15.4% -6.8% -75%Prev Yr 29 31 33 28 30 26 30 25 32 27 35 22 348Actual 25 21 24 70
Var% -13.8% -32.3% -27.3% -80%Prev Yr 63.3% 51.7% 49.6% 53.0% 53.9% 95.2% 65.6% 64.0% 66.7% 51.2% 74.4% 54.9% 62.0%Actual 75.0% 54.4% 56.1% 62%
Var% 11.7% 2.7% 0%Prev Yr 26.9 26.9 34.8 28.1 24.9 36.7 34.5 32.1 36.0 32.0 33.9 36.3 31.9Actual 20.6 36.3 25.3 27.4
Var% -23.6% 34.8% -14%Prev Yr 87.6% 91.1% 88.8% 95.8% 93.5% 89.5% - - - - - - 91%Actual TBC TBC TBC TBC
Var%
Prev Yr 50 40 49 34 0 0 0 0 0 0 0 0 173Actual 0 0 0 0
Var% -100.0% -100.0% -100.0% -100%Prev Yr 33 30 35 33 32 34 29 32 30 35 23 28 374Actual 38 28 22.0 88
Var% 15.2% -6.7% -37.1% -76%Prev Yr 63.3% 51.7% 49.6% 53.0% 53.9% 95.2% 65.6% 64.0% 66.7% 51.2% 74.4% 54.9% 62.0%Actual 75.0% 54.4% 56.1% 62%
Var% 11.7% 2.7% 6.5% 0%Prev Yr 30.7 25.0 30.8 26.3 28.8 26.9 29.3 35.6 27.7 31.1 37.4 37.2 30.6Actual 31.7 37.9 12.8 27.5
Var% 3.2% 52.0% -58.4% -10%Prev Yr 95.7% 88.2% 82.9% 90.9% 94.8% 99.2% - - - - - - 92%Actual TBC TBC TBC TBC
Var%
Total referrals to Home-Based and Bed-Based
Intermediate Tier Services4,396 TBC
Total value for 2016/17 is just 3 referrals below the baseline year
outturn. Bed based showed a reduction of 6% and Home Based
showed and increase of 2.5%.
INTE
RM
EDIA
TE C
AR
E A
T H
OM
E
Total referrals Intermediate Care at Home 1,955 TBCReferrals to IMC at Home are 15% higher than baseline year and
have increased in volume from November onwards which can be
seen in the trendline to the right
Number of new patients admitted onto
caseload1,655 TBC
Admission to caseload is 11% higher than baseline year and an
increase is visible in the trendline since November 2017 onwards
only dipping slightly once before year end.
Step up referrals as % of total referrals 49.9% TBCStep up referrals increased in the early months of 2016/17 and
dropped as expected around winter months when Step Down
referrals increased.
% of new patients admitted onto caseload 84.7% TBC% Admission to caseload is lower than baseline year however this is
likely due to an increase in referrals compared to baseline year.
Number of new patients admitted onto
caseload1,248 TBC
Admission to caseload is 15% lower than baseline year and a
steady decline is visible in the trendline since a peak of 115 in April
2016 to a low of 68 in March 2017
HO
ME
SUP
PO
RT
REA
BLE
MEN
T
Total referrals Home Support Reablement 1,408 TBCReferrals to reablement are 12% lower than baseline year and have
decreased in volume from August onwards which can be seen in
the trendline to the right
Average length of stay on caseload
(Days)29.7 TBC
Average LOS on caseload has increased from the 24.7 days
baseline with a steady reduction becoming apparent since July
2016 to just below the FY total in March 2017
Step up referrals as % of total referrals 55.5% TBCStep up referrals increased in the early months of 2016/17 and
dropped as expected around winter months when Step Down
referrals increased.
% of new patients admitted onto caseload 88.6% TBC% Admission to caseload is lower than baseline year which due to a
reduction in referrals would have led to an expected increase in
capacity available to accept more referrals.
Number of patients admitted to caseload 348 TBCNumbers admitted to caseload are lower for Darley Court than
levels seen in baseline year. This will be linked to the increased Ave
LOS as shown in the measure below in the report.
DA
RLE
Y C
OU
RT
Total referrals to Darley Court 1,035 TBCNote - From August 2016, all bed based referrals are received by
Darley Court therefore the referral totals appear much higher for
this measure alone,
Average length of stay on caseload
(Days)29.9 TBC
Average LOS on caseload has increased from the 29.9 baseline
with a peak of 48.4 days in October which has not yet reduced to
levels seen before this increase.
Average length of stay on caseload
(Days)31.9 TBC
Average LOS on caseload has increased from the 21.1 baseline and
is higher than the guide optimum level of 27 days which is based
on NAIC outcomes.
% of patients admitted onto caseload
(DC and LL Combined Total)59.8% TBC
% admitted to caseload are lower for Darley Court than levels seen
in baseline year. This will be linked to the increased Ave LOS as
shown in the measure below in the report.
Number of patients admitted to caseload 374 TBCNumbers admitted to caseload are lower forLaburnum Lodge than
levels seen in baseline year. This will be linked to the increased Ave
LOS as shown in the measure below
LAB
UR
NU
M L
OD
GE
Total referrals to Laburnum Lodge173
(to Jul 17)TBC
Note - From August 2016, all bed based referrals are received by
Darley Court therefore the referral totals appear much lower for
this measure alone,
Occupancy rate %91.0%
(to Sep 17)TBC
Note - From August 2016, all bed based referrals are received by
Darley Court therefore the occupancy rate % is incomplete for the
whole year at Darley Court and Laburnum Lodge
Average length of stay on caseload
(Days)30.6 TBC
Average LOS on caseload has increased from the 26.5 baseline and
is higher than the guide optimum level of 27 days which is based
on NAIC outcomes.
% of patients admitted onto caseload
(DC and LL Combined Total)
77.4%(to Jul 17)
TBC% admitted to caseload are lower forLaburnum Lodge than levels
seen in baseline year. This will be linked to the increased Ave LOS
as shown in the measure below
Occupancy rate %92.0%
(to Sep 17)TBC
Note - From August 2016, all bed based referrals are received by
Darley Court therefore the occupancy rate % is incomplete for the
whole year at Darley Court and Laburnum Lodge
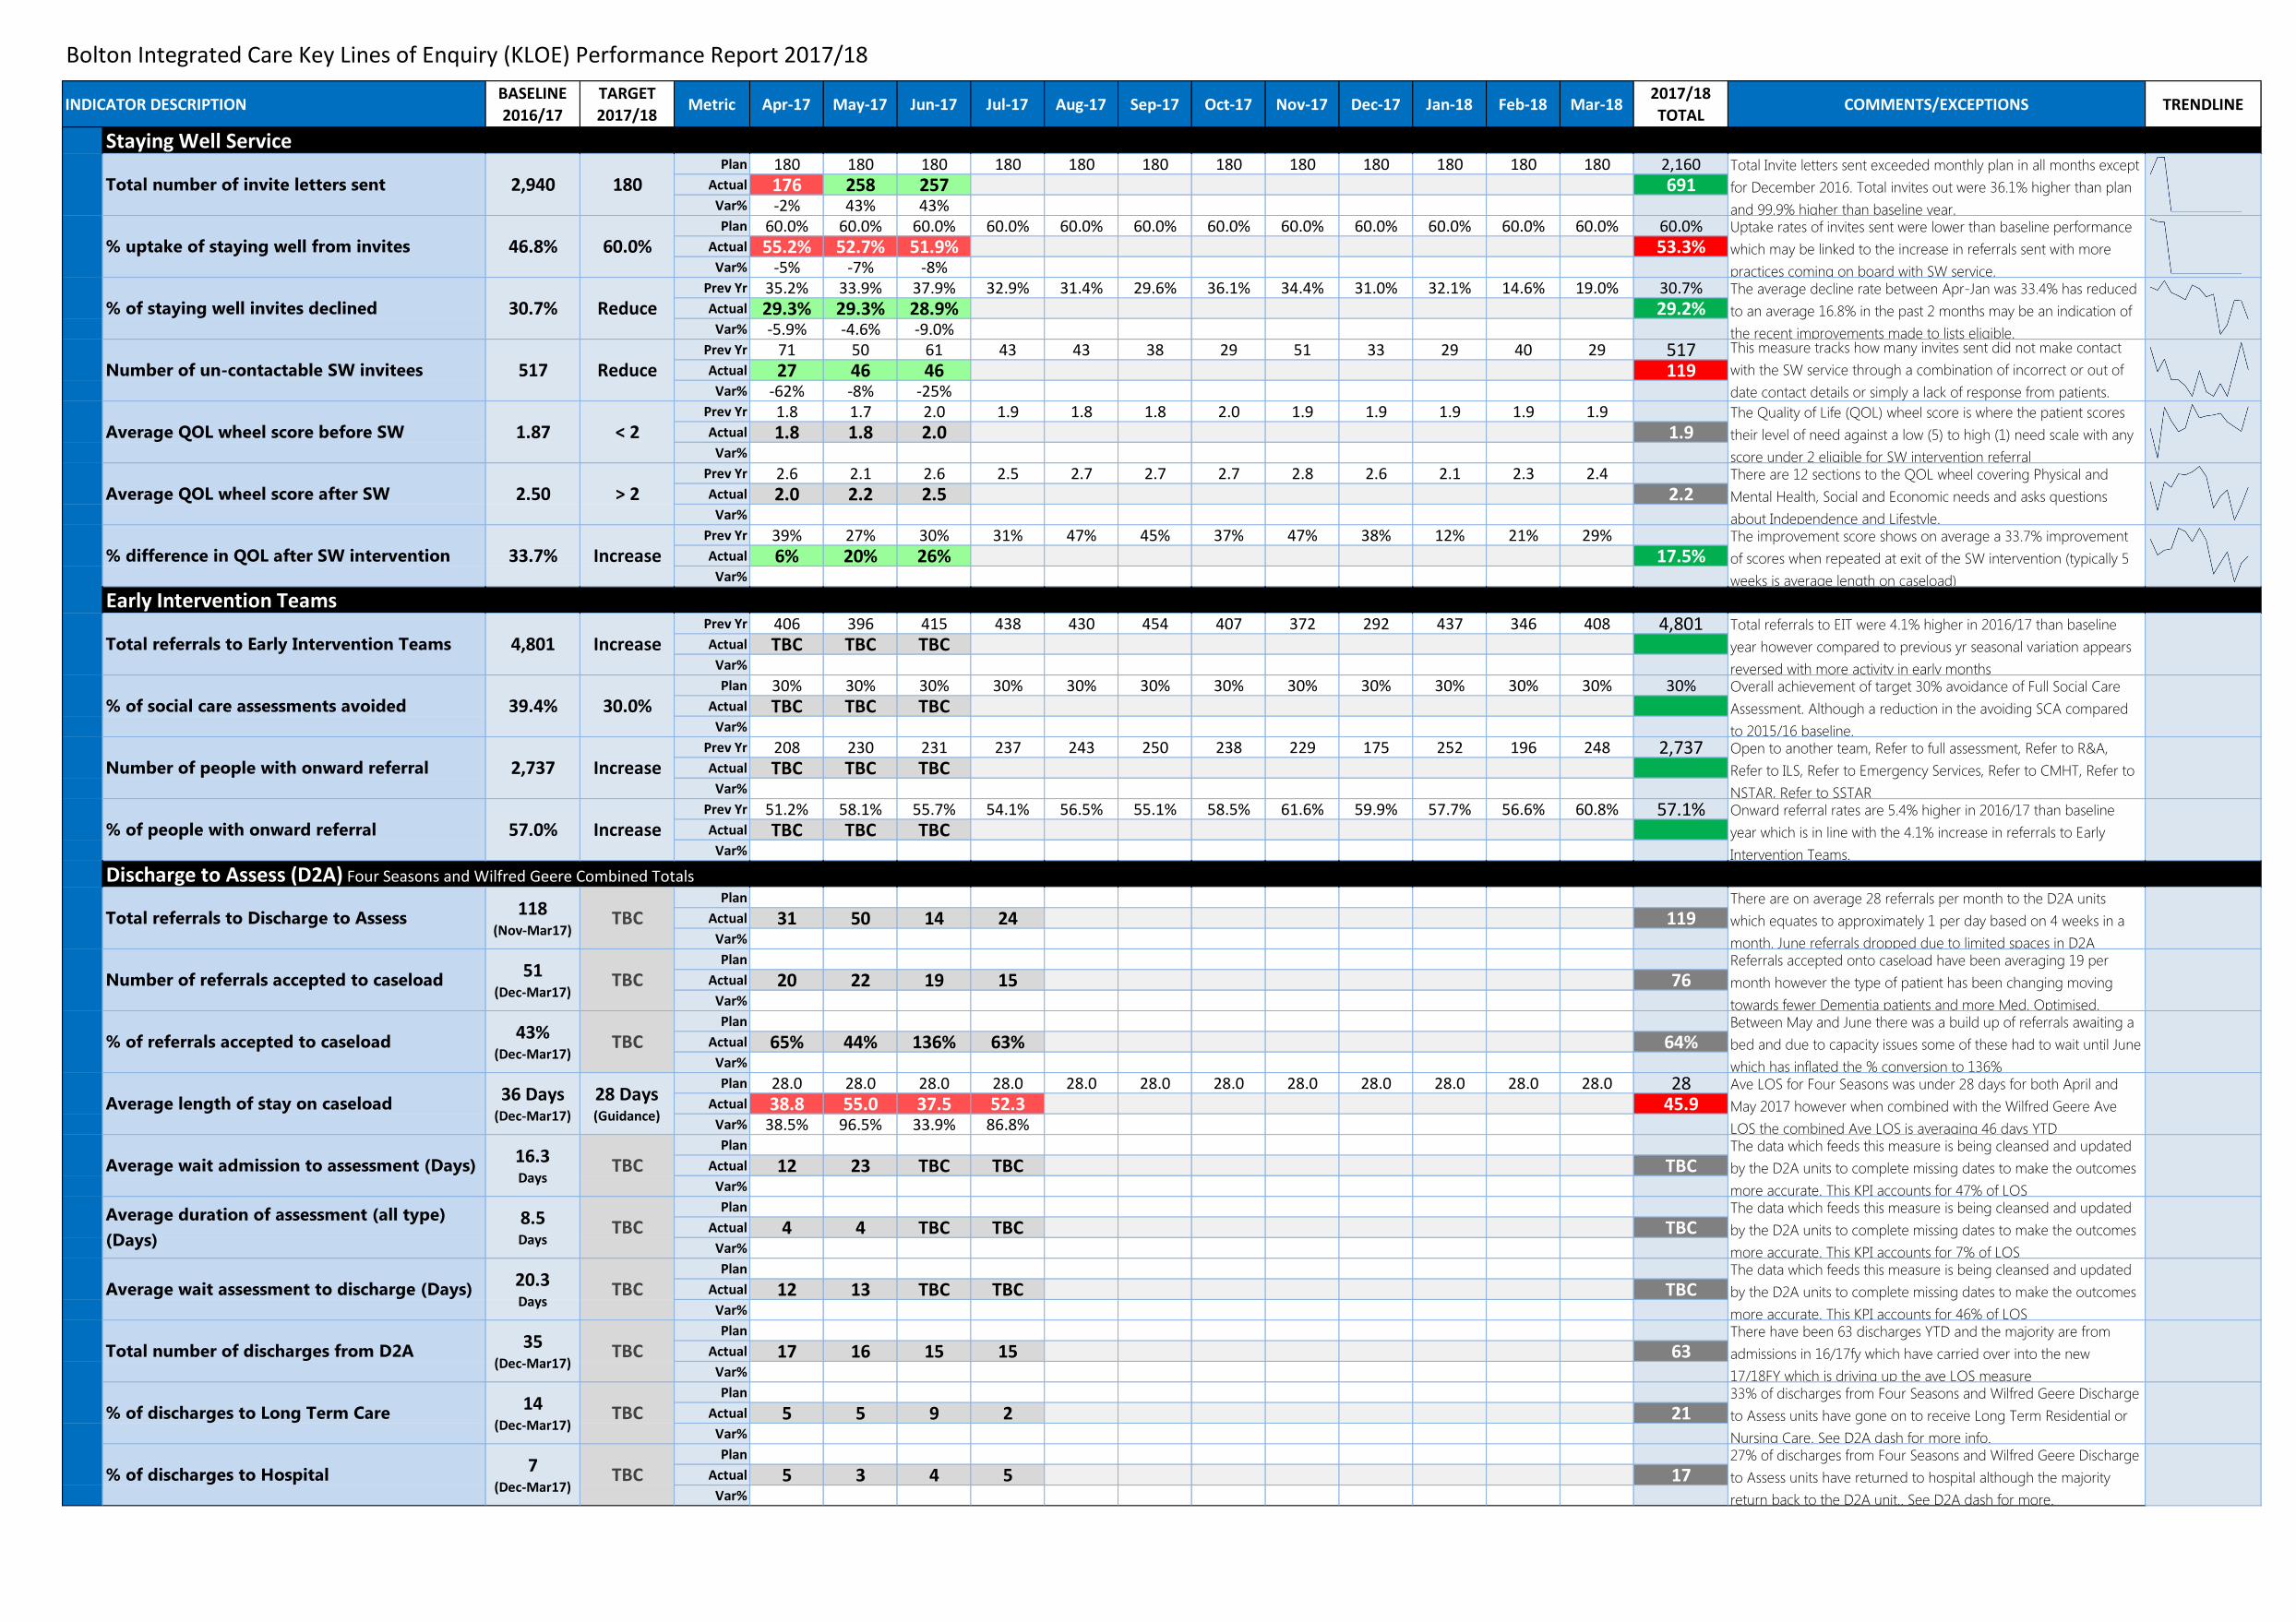
Bolton Integrated Care Key Lines of Enquiry (KLOE) Performance Report 2017/18
INDICATOR DESCRIPTIONBASELINE
2016/17
TARGET
2017/18Metric Apr-17 May-17 Jun-17 Jul-17 Aug-17 Sep-17 Oct-17 Nov-17 Dec-17 Jan-18 Feb-18 Mar-18
2017/18
TOTALCOMMENTS/EXCEPTIONS TRENDLINE
Staying Well ServicePlan 180 180 180 180 180 180 180 180 180 180 180 180 2,160
Actual 176 258 257 691Var% -2% 43% 43%Plan 60.0% 60.0% 60.0% 60.0% 60.0% 60.0% 60.0% 60.0% 60.0% 60.0% 60.0% 60.0% 60.0%
Actual 55.2% 52.7% 51.9% 53.3%Var% -5% -7% -8%
Prev Yr 35.2% 33.9% 37.9% 32.9% 31.4% 29.6% 36.1% 34.4% 31.0% 32.1% 14.6% 19.0% 30.7%Actual 29.3% 29.3% 28.9% 29.2%
Var% -5.9% -4.6% -9.0%Prev Yr 71 50 61 43 43 38 29 51 33 29 40 29 517Actual 27 46 46 119
Var% -62% -8% -25%Prev Yr 1.8 1.7 2.0 1.9 1.8 1.8 2.0 1.9 1.9 1.9 1.9 1.9Actual 1.8 1.8 2.0 1.9
Var%
Prev Yr 2.6 2.1 2.6 2.5 2.7 2.7 2.7 2.8 2.6 2.1 2.3 2.4Actual 2.0 2.2 2.5 2.2
Var%
Prev Yr 39% 27% 30% 31% 47% 45% 37% 47% 38% 12% 21% 29%Actual 6% 20% 26% 17.5%
Var%
Early Intervention TeamsPrev Yr 406 396 415 438 430 454 407 372 292 437 346 408 4,801Actual TBC TBC TBC
Var%
Plan 30% 30% 30% 30% 30% 30% 30% 30% 30% 30% 30% 30% 30%Actual TBC TBC TBC
Var%
Prev Yr 208 230 231 237 243 250 238 229 175 252 196 248 2,737Actual TBC TBC TBC
Var%
Prev Yr 51.2% 58.1% 55.7% 54.1% 56.5% 55.1% 58.5% 61.6% 59.9% 57.7% 56.6% 60.8% 57.1%Actual TBC TBC TBC
Var%
Discharge to Assess (D2A) Four Seasons and Wilfred Geere Combined TotalsPlan
Actual 31 50 14 24 119Var%
Plan
Actual 20 22 19 15 76Var%
Plan
Actual 65% 44% 136% 63% 64%Var%
Plan 28.0 28.0 28.0 28.0 28.0 28.0 28.0 28.0 28.0 28.0 28.0 28.0 28Actual 38.8 55.0 37.5 52.3 45.9
Var% 38.5% 96.5% 33.9% 86.8%Plan
Actual 12 23 TBC TBC TBCVar%
Plan
Actual 4 4 TBC TBC TBCVar%
Plan
Actual 12 13 TBC TBC TBCVar%
Plan
Actual 17 16 15 15 63Var%
Plan
Actual 5 5 9 2 21Var%
Plan
Actual 5 3 4 5 17Var%
Total number of invite letters sent 2,940 180Total Invite letters sent exceeded monthly plan in all months except
for December 2016. Total invites out were 36.1% higher than plan
and 99.9% higher than baseline year.
% of staying well invites declined 30.7% ReduceThe average decline rate between Apr-Jan was 33.4% has reduced
to an average 16.8% in the past 2 months may be an indication of
the recent improvements made to lists eligible.
% uptake of staying well from invites 46.8% 60.0%Uptake rates of invites sent were lower than baseline performance
which may be linked to the increase in referrals sent with more
practices coming on board with SW service.
Average QOL wheel score before SW 1.87 < 2The Quality of Life (QOL) wheel score is where the patient scores
their level of need against a low (5) to high (1) need scale with any
score under 2 eligible for SW intervention referral
Number of un-contactable SW invitees 517 ReduceThis measure tracks how many invites sent did not make contact
with the SW service through a combination of incorrect or out of
date contact details or simply a lack of response from patients.
% difference in QOL after SW intervention 33.7% IncreaseThe improvement score shows on average a 33.7% improvement
of scores when repeated at exit of the SW intervention (typically 5
weeks is average length on caseload)
Average QOL wheel score after SW 2.50 > 2There are 12 sections to the QOL wheel covering Physical and
Mental Health, Social and Economic needs and asks questions
about Independence and Lifestyle.
% of social care assessments avoided 39.4% 30.0%Overall achievement of target 30% avoidance of Full Social Care
Assessment. Although a reduction in the avoiding SCA compared
to 2015/16 baseline.
Total referrals to Early Intervention Teams 4,801 IncreaseTotal referrals to EIT were 4.1% higher in 2016/17 than baseline
year however compared to previous yr seasonal variation appears
reversed with more activity in early months
% of people with onward referral 57.0% IncreaseOnward referral rates are 5.4% higher in 2016/17 than baseline
year which is in line with the 4.1% increase in referrals to Early
Intervention Teams.
Number of people with onward referral 2,737 IncreaseOpen to another team, Refer to full assessment, Refer to R&A,
Refer to ILS, Refer to Emergency Services, Refer to CMHT, Refer to
NSTAR, Refer to SSTAR
Number of referrals accepted to caseload51
(Dec-Mar17)TBC
Referrals accepted onto caseload have been averaging 19 per
month however the type of patient has been changing moving
towards fewer Dementia patients and more Med. Optimised.
Total referrals to Discharge to Assess118
(Nov-Mar17)TBC
There are on average 28 referrals per month to the D2A units
which equates to approximately 1 per day based on 4 weeks in a
month. June referrals dropped due to limited spaces in D2A
Average length of stay on caseload36 Days
(Dec-Mar17)
28 Days (Guidance)
Ave LOS for Four Seasons was under 28 days for both April and
May 2017 however when combined with the Wilfred Geere Ave
LOS the combined Ave LOS is averaging 46 days YTD
% of referrals accepted to caseload43%
(Dec-Mar17)TBC
Between May and June there was a build up of referrals awaiting a
bed and due to capacity issues some of these had to wait until June
which has inflated the % conversion to 136%
Average wait assessment to discharge (Days)20.3Days
TBCThe data which feeds this measure is being cleansed and updated
by the D2A units to complete missing dates to make the outcomes
more accurate. This KPI accounts for 46% of LOS
Average duration of assessment (all type)
(Days)
8.5Days
TBCThe data which feeds this measure is being cleansed and updated
by the D2A units to complete missing dates to make the outcomes
more accurate. This KPI accounts for 7% of LOS
Average wait admission to assessment (Days)16.3 Days
TBCThe data which feeds this measure is being cleansed and updated
by the D2A units to complete missing dates to make the outcomes
more accurate. This KPI accounts for 47% of LOS
Total number of discharges from D2A35
(Dec-Mar17)TBC
There have been 63 discharges YTD and the majority are from
admissions in 16/17fy which have carried over into the new
17/18FY which is driving up the ave LOS measure
% of discharges to Hospital7
(Dec-Mar17)TBC
27% of discharges from Four Seasons and Wilfred Geere Discharge
to Assess units have returned to hospital although the majority
return back to the D2A unit.. See D2A dash for more.
% of discharges to Long Term Care14
(Dec-Mar17)TBC
33% of discharges from Four Seasons and Wilfred Geere Discharge
to Assess units have gone on to receive Long Term Residential or
Nursing Care. See D2A dash for more info.