Embed Size (px)
Citation preview
NH State Revenue Options and Consequences
NH Children’s Summit
December 8, 2008
Dennis DelayDeputy Director, NHCPPS
“…to raise new ideas and improve policy debates through quality information and analysis on issues shaping New Hampshire’s future.”

All of our reportsare available on the web:
www.nhpolicy.orgwww.nhpolicy.org
New Hampshire Center New Hampshire Center for Public Policy Studiesfor Public Policy Studies
Board of Directors
Donna Sytek, Chair
John B. Andrews
John D. Crosier
William H. Dunlap
Shelia T. Francoeur
Chuck Morse
Todd Selig
Stuart Smith
James Tibbetts
Brian Walsh
Kimon S. Zachos
Martin Gross
Staff
Steve Norton
Dennis Delay
Ryan Tappin
“…to raise new ideas and improve policy debates through quality information and analysis on issues shaping New Hampshire’s future.”

State Revenue Options
Revenue Sources Then and Now How have they changed over time? How did the State respond to the
last two recessions? What are the revenue options now?

First, some history:
Balancing the NH General Fund, 1979-2007
$0
$200
$400
$600
$800
$1,000
$1,200
$1,400
$1,60019
79
1981
1983
1985
1987
1989
1991
1993
1995
1997
1999
2001
2003
2005
2007
State Fiscal Year
Mill
ion
s o
f D
olla
rs
Non-tax Revenue:Medicaid EnhancementTobacco Settlement (2002 & 03)Flexible Federal Grant (2003)
General Fund Expenditures
Merrill
Gregg
Sununu
Gallen
Shaheen
Lynch
Benson
Regular General Fund Taxes and Revenues

First, some history:
Balancing the NH General Fund & Education Trust Fund, 1979-2007
$0
$250
$500
$750
$1,000
$1,250
$1,500
$1,750
$2,000
$2,250
1979
1981
1983
1985
1987
1989
1991
1993
1995
1997
1999
2001
2003
2005
2007
State Fiscal Year
Mil
lio
ns
of
Do
llar
s
Non-tax GF Revenue:Medicaid EnhancementTobacco Settlement (2002 & 03)Flexible Federal Grant (2003)
GF + ETF Expenditures
Merrill
GreggSununu
Gallen
Shaheen
Benson
Regular General Fund Taxes and Revenues
Statewide Property Tax
Other ETF Taxes
Lynch

General Fund over 18 Years
Beer Tax $12.2 $12.7Board and Care Fees $14.5 $18.4Business Profits Tax $111.0 $287.4Business Enterprise Tax $0.0 $79.3Estate & Legacy Tax $24.3 $0.6Insurance Tax $43.1 $97.9Securities Revenue $0.0 $33.0Interest & Dividends Tax $40.7 $108.1Liquor Sales $55.1 $124.7Meals & Rooms Tax $83.8 $202.6Park Revenue $7.3 $0.0Dog & Horse Racing $10.5 $3.1Real Estate Transfer Tax $32.3 $91.7Communications Tax $12.8 $73.0Tobacco Tax $38.2 $65.3Utility Tax $8.2 $5.8Court Fines & Fees $22.6 $30.5Savings Bank Tax $12.6 $0.0Other $33.1 $104.3"Medicaid Enhancement" $0.0 $83.3Total $562.2 $1,421.6
1990 2007Revenue Source
Compound annual
Rate of increase
5.6%
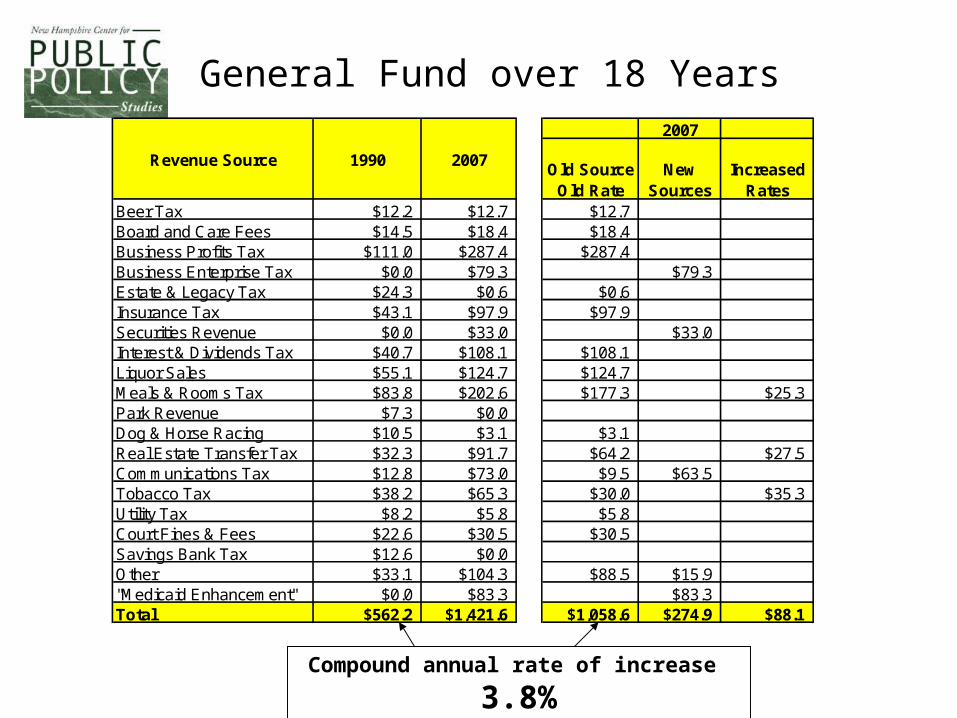
General Fund over 18 Years
Compound annual rate of increase 3.8%
2007
Old Source Old Rate
New Sources
Increased Rates
Beer Tax $12.2 $12.7 $12.7Board and Care Fees $14.5 $18.4 $18.4Business Profits Tax $111.0 $287.4 $287.4Business Enterprise Tax $0.0 $79.3 $79.3Estate & Legacy Tax $24.3 $0.6 $0.6Insurance Tax $43.1 $97.9 $97.9Securities Revenue $0.0 $33.0 $33.0Interest & Dividends Tax $40.7 $108.1 $108.1Liquor Sales $55.1 $124.7 $124.7Meals & Rooms Tax $83.8 $202.6 $177.3 $25.3Park Revenue $7.3 $0.0Dog & Horse Racing $10.5 $3.1 $3.1Real Estate Transfer Tax $32.3 $91.7 $64.2 $27.5Communications Tax $12.8 $73.0 $9.5 $63.5Tobacco Tax $38.2 $65.3 $30.0 $35.3Utility Tax $8.2 $5.8 $5.8Court Fines & Fees $22.6 $30.5 $30.5Savings Bank Tax $12.6 $0.0Other $33.1 $104.3 $88.5 $15.9"Medicaid Enhancement" $0.0 $83.3 $83.3Total $562.2 $1,421.6 $1,058.6 $274.9 $88.1
1990 2007Revenue Source
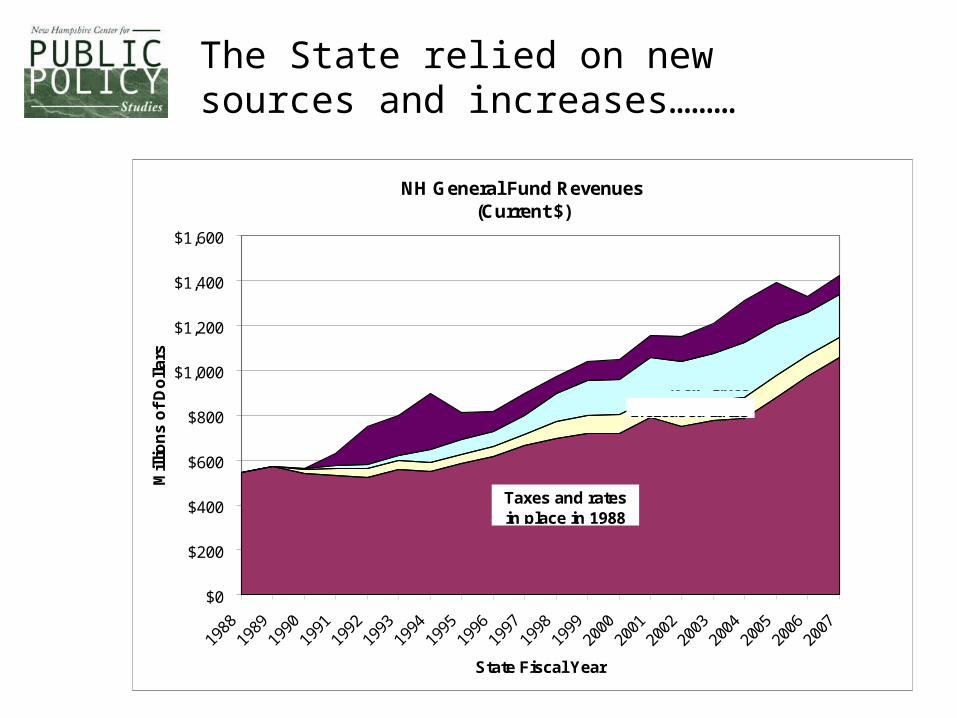
The State relied on new sources and increases………
NH General Fund Revenues (Current $)
$0
$200
$400
$600
$800
$1,000
$1,200
$1,400
$1,600
1988
1989
1990
1991
1992
1993
1994
1995
1996
1997
1998
1999
2000
2001
2002
2003
2004
2005
2006
2007
State Fiscal Year
Mil
lio
ns
of
Do
llar
s
Taxes and rates in place in 1988
Medicaid Enhancement New taxes
Increased rates
$543
$1,058
$1,422

…to keep pace with overall economic growth.
NH General Fund Revenues as % of Gross State Product
0.0%
0.5%
1.0%
1.5%
2.0%
2.5%
3.0%
3.5%
1988
1989
1990
1991
1992
1993
1994
1995
1996
1997
1998
1999
2000
2001
2002
2003
2004
2005
2006
2007
State Fiscal Year
Per
cen
t
Taxes and rates in place in 1988
Medicaid Enhancement
Increased ratesNew taxes

The General Fund in 2008 (est):
Business Enterprise Tax5%
Meals & Rooms Tax14%
Liquor Sales9%
Insurance Tax7%
Tobacco Settlement1%Beer Tax
1%
Communications Tax5%
Securities Revenue2%
Court Fines & Fees2%
Board and Care Fees1%
Dog & Horse Racing0%
Utility Tax0%
Business Profits Tax21%
Tobacco Tax4%
Real Estate Transfer Tax5%
Other5%
"Medicaid Enhancement"
8%
Interest & Dividends Tax8%
Total:$1,464.1 million

NH Volume (per unit) taxes don’t keep pace with economy.
Growth in Comparison to the GSP, 1988-2007
0%
20%
40%
60%
80%
100%
120%
140%
1988
1989
1990
1991
1992
1993
1994
1995
1996
1997
1998
1999
2000
2001
2002
2003
2004
2005
2006
2007
State Fiscal Year
Rel
ativ
e to
Gro
ss S
tate
Pro
du
ct
Real Expenditures 1988=1.00 Beer TaxBoard and Care Fees Dog & Horse RacingCourt Fines & Fees

A NH per unit tax with rate changes.Tobacco Tax Growth in Comparison to the GSP, 1988-2008
-10%
40%
90%
140%
190%
240%
1988
1989
1990
1991
1992
1993
1994
1995
1996
1997
1998
1999
2000
2001
2002
2003
2004
2005
2006
2007
2008
State Fiscal Year
Rel
ativ
e to
Gro
ss S
tate
Pro
du
ct
Real Expenditures 1988=1.00 At Actual Rate At 1988 Tax Rate
1990:increased to
21¢/pack
1998:increased to
37¢/pack
1991:increased to
25¢/pack
1988-89:17¢/pack
2006:increased to
80¢/pack
2008:increased to 108¢/pack
Note: Includes Amount Going to Education Trust Fund
2000:increased to
52¢/pack

Does the rate effect the volume?Estimated Packs of Cigarettes Sold in New Hampshire (millions)
0
50
100
150
200
250
1988
1989
1990
1991
1992
1993
1994
1995
1996
1997
1998
1999
2000
2001
2002
2003
2004
2005
2006
2007
2008
2008 based on $165m revenue and $1.08 tax
rate
1998:increased to
37¢/pack1991:
increased to 25¢/pack
2006:increased to
80¢/pack
2000:increased to
52¢/pack

NH Ad Valorem (value based) taxes move with the economy.
Growth in Comparison to the GSP, 1988-2008
0%
20%
40%
60%
80%
100%
120%
140%
160%
1988
1989
1990
1991
1992
1993
1994
1995
1996
1997
1998
1999
2000
2001
2002
2003
2004
2005
2006
2007
2008
State Fiscal Year
Rel
ativ
e to
Gro
ss S
tate
Pro
du
ct
Real Expenditures 1988=1.00 Combined Business Taxes
Interest & Dividends Tax

How do the business taxes perform over business cycles?
General Fund Revenue from BPT & BET(In Millions)
$0
$50
$100
$150
$200
$250
$300
$350
$400
$450
1988
1989
1990
1991
1992
1993
1994
1995
1996
1997
1998
1999
2000
2001
2002
2003
2004
2005
2006
2007
2008
State Fiscal Year
Tax
Rev
en
ue
($
mil
lio
n)
Business Profits Tax
Business Enterprise Tax
$91.6
$143.3
$391
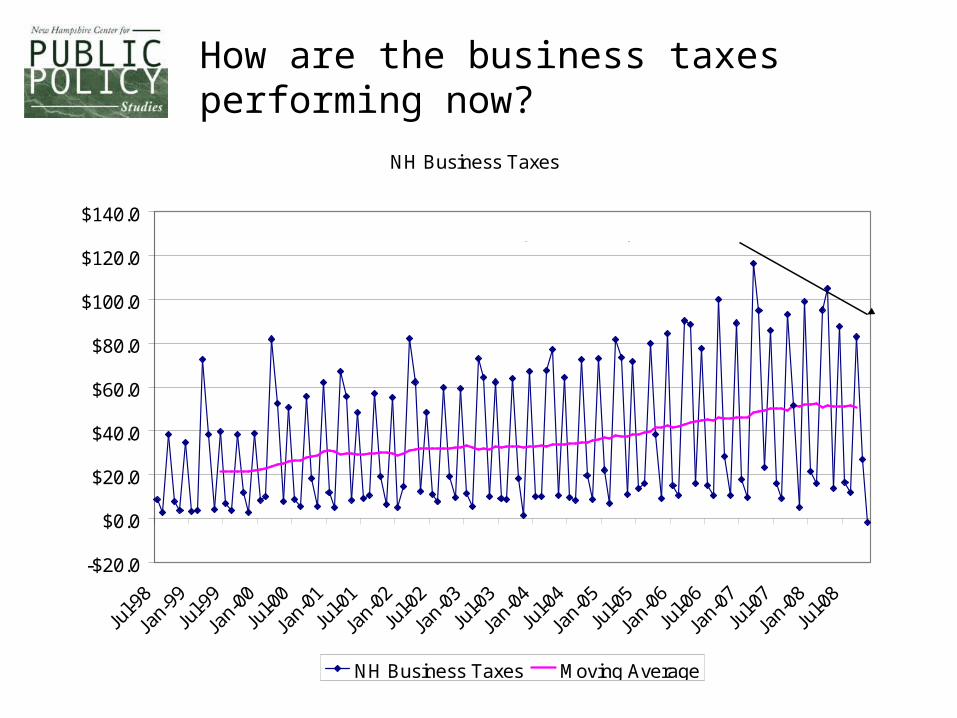
How are the business taxes performing now?
NH Business Taxes
-$20.0
$0.0
$20.0
$40.0
$60.0
$80.0
$100.0
$120.0
$140.0
Jul-9
8
Jan-
99
Jul-9
9
Jan-
00
Jul-0
0
Jan-
01
Jul-0
1
Jan-
02
Jul-0
2
Jan-
03
Jul-0
3
Jan-
04
Jul-0
4
Jan-
05
Jul-0
5
Jan-
06
Jul-0
6
Jan-
07
Jul-0
7
Jan-
08
Jul-0
8
NH Business Taxes Moving Average
Note the steep decline in peak months

NH Ad Valorem (value based) taxes move with the economy.
Growth in Comparison to the GSP, 1988-2008
0%
20%
40%
60%
80%
100%
120%
140%
1988
1989
1990
1991
1992
1993
1994
1995
1996
1997
1998
1999
2000
2001
2002
2003
2004
2005
2006
2007
2008
State Fiscal Year
Rel
ativ
e to
Gro
ss S
tate
Pro
du
ct
Real Expenditures 1988=1.00 Meals & Rooms Tax Real Estate Transfer Tax
"temporary" surcharge added in 1990

Revenue Risks in an Economic Downturn*
Business Profits Tax ($381m)• Fell by 36% in 1990’s recession.
Business Enterprise Tax ($230m)• More stable, larger base, but grows slowly.
Meals and Rooms ($214m)• Stable, but also follows the economy.
Interest and Dividends($118)• Was very strong, but faltering now!
Real Estate Transfer Tax ($116m)• Was $160m at the peak in 2006, how much lower?
*(Estimates for 2008 include GF+ETF)

NHCPPS Model Showing a $300m+ Revenue Shortfall
Projection of 2009 Combined General Fund & Education Trust Fund Revenues
(in millions of $)
-$400
-$300
-$200
-$100
$0
$100
$200Ju
ly
Au
g
Se
pt
Oct
No
v
De
c
Jan
Fe
b
Ma
r
Ap
r
Ma
y
Jun
e
Month of Fiscal Year Completed
Ab
ov
e (
Be
low
) B
ud
ge
t

How Did the State Respond in the Last Two Recessions?
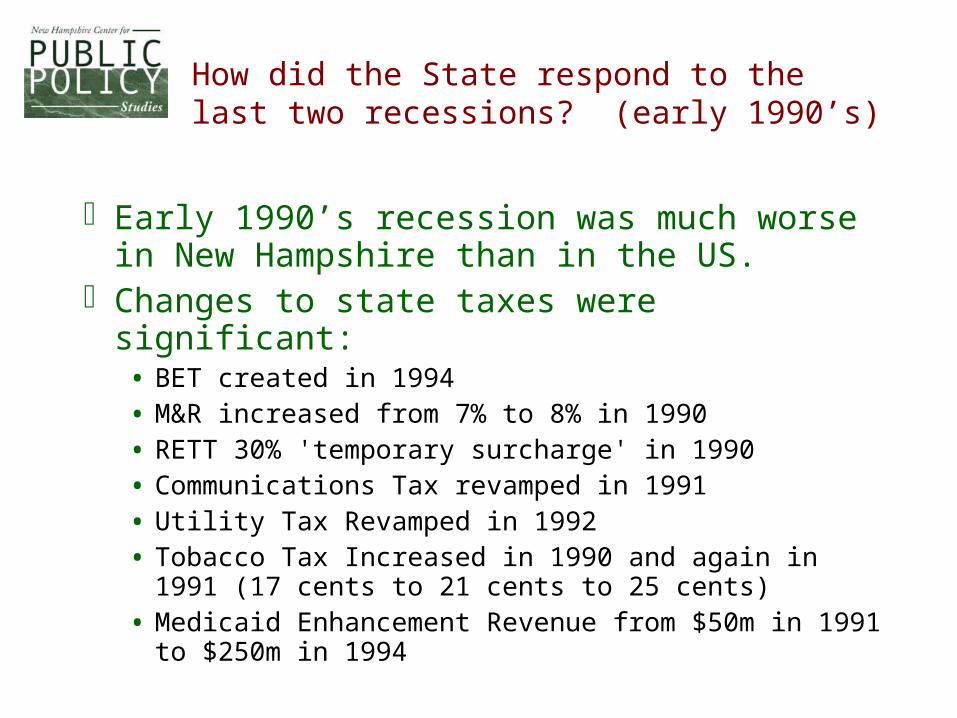
How did the State respond to the last two recessions? (early 1990’s)
Early 1990’s recession was much worse in New Hampshire than in the US.
Changes to state taxes were significant:• BET created in 1994
• M&R increased from 7% to 8% in 1990
• RETT 30% 'temporary surcharge' in 1990
• Communications Tax revamped in 1991
• Utility Tax Revamped in 1992
• Tobacco Tax Increased in 1990 and again in 1991 (17 cents to 21 cents to 25 cents)
• Medicaid Enhancement Revenue from $50m in 1991 to $250m in 1994

A 1990-1991 style recession, without tax changes, equalsno State Revenue growth for five+ years
$400.000
$450.000
$500.000
$550.000
$600.000
$650.000
$700.000
1988 1989 1990 1991 1992 1993 1994
Total Real Taxes/Revenues Total Revenue, w /o New , Changes

In 2001 to 2003, State Revenue would have recovered the peakin three years, without changes to existing taxes or new taxes.
$600.0
$800.0
$1,000.0
$1,200.0
$1,400.0
$1,600.0
$1,800.0
2000 2001 2002 2003 2004 2005 2006
Subtotal Total Revenue, w/o New, Changes

What are the Revenue Options Now?

New Hampshire State Revenue Options:
Increase Ad Valorem Tax Rates Index per Unit Taxes to Inflation Increase the Tobacco Tax Federal ‘Bail-Out’ including Medicaid
Enhancement Revenue or FMAP increase New State Revenue Sources
• Estate & Legacy
• Amusement Tax
• Luxury Tax
• Gambling
• Capital Gains

5% Increase in Ad Valorem Taxes (2008 Revenues)
All data in Millions of 2008 Dollars
Business Profits Tax $19.1
Business Enterprise Tax $11.5
Meals and Rooms Tax $10.7
Interest and Dividends Tax $6.7
Real Estate Transfer Tax $5.8
Communication Service Tax $4.0
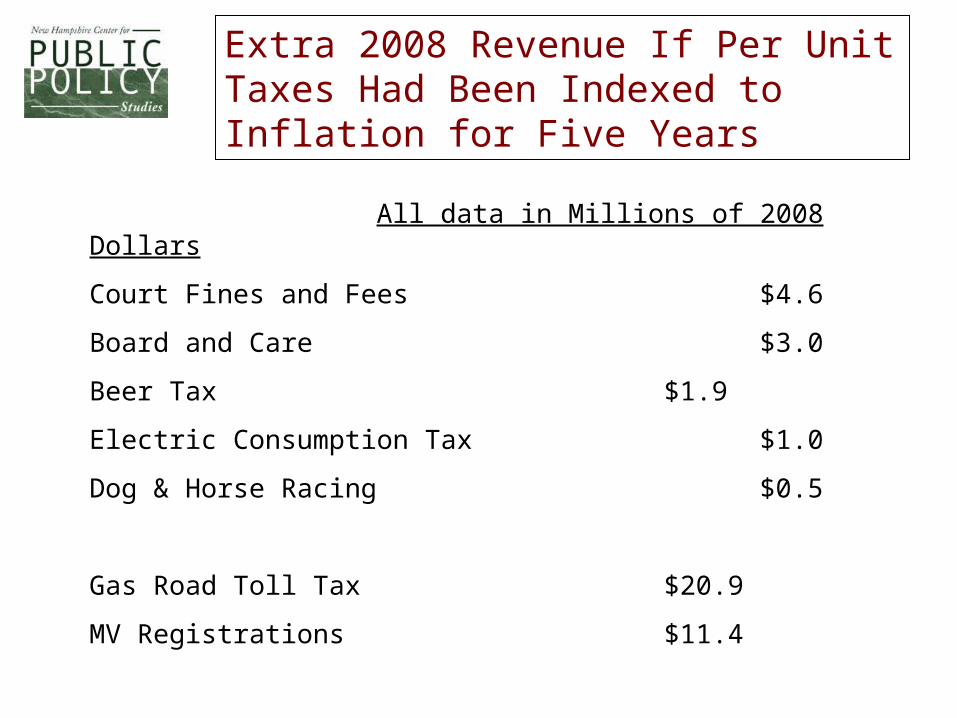
Extra 2008 Revenue If Per Unit Taxes Had Been Indexed to Inflation for Five Years
All data in Millions of 2008 Dollars
Court Fines and Fees $4.6
Board and Care $3.0
Beer Tax $1.9
Electric Consumption Tax $1.0
Dog & Horse Racing $0.5
Gas Road Toll Tax $20.9
MV Registrations $11.4

NH Cigarette Tax Increase of 25 cents.
Increase in the Tobacco Tax on Cigarettes at Current Annual Sales
Cents per Pack Increase $0.25 =$38m

New (and Renewed) Revenue
All data in Millions of 2008 Dollars
Estate & Legacy tax at 8% $24.0
Amusement Tax at 5% $32.0
Luxury Tax (Example 10% on Luxury Homes, $500K) $60.0
Gambling (Video Slot Machines) in New Hampshire $100-200
Capital Gains Tax at 5%$181.7

New Revenue May Not Come in as Expected
NH Capital Gains 1997-2006 (IRS SOI data)
$0
$1,000,000
$2,000,000
$3,000,000
$4,000,000
$5,000,000
1997 1998 1999 2000 2001 2002 2003 2004 2005 2006
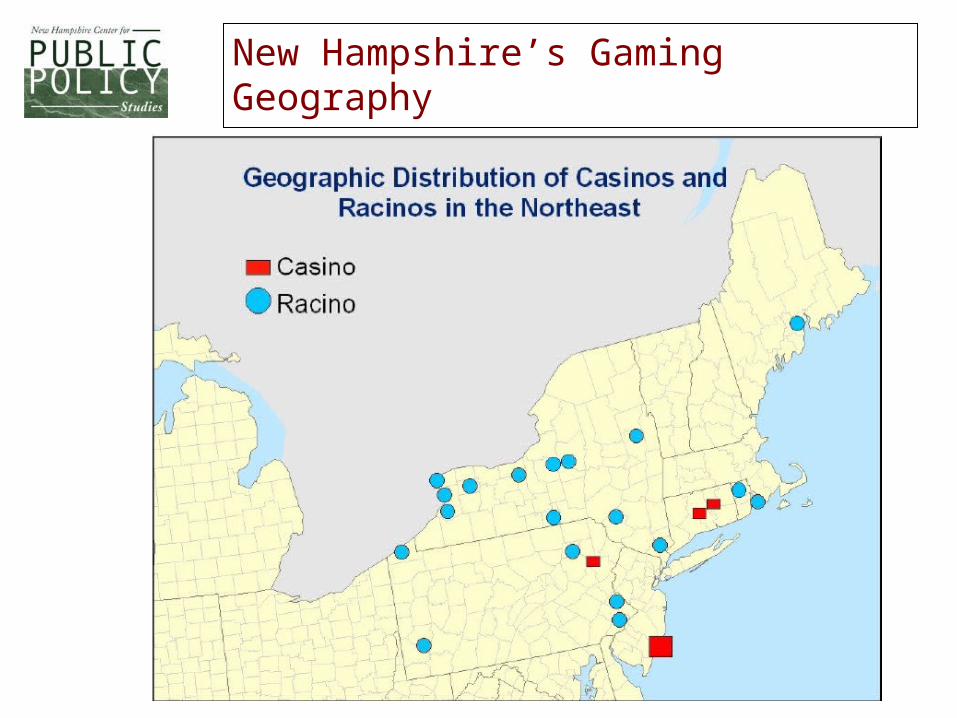
New Hampshire’s Gaming Geography

Questions?