Embed Size (px)
Citation preview
Page 1 IEEE 802.3 NGEABT Study Group – Atlanta, GA Jan 2015
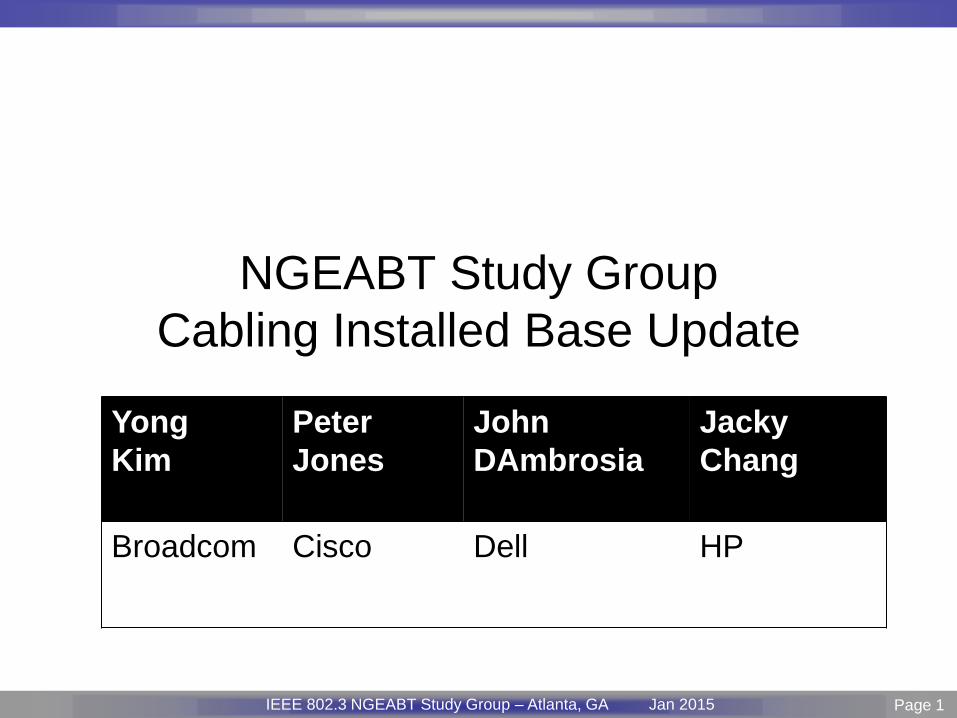
NGEABT Study Group
Cabling Installed Base Update
Yong
Kim
Peter
Jones
John
DAmbrosia
Jacky
Chang
Broadcom Cisco Dell HP

Page 2 IEEE P802.3 Maintenance report – July 2008 Plenary Version 1.0 IEEE 802.3 NGEABT Study Group – Atlanta, GA Jan 2015 Page 2
Background
• During the CFI leadup, four companies (Broadcom, Cisco, Dell and HP) commissioned BSRIA (Lone Hansen, www.bsria.co.uk ) to provide current data on the installed base for copper structured cabling.
• This deck includes the data shown at CFI (as a refresher), and the more recently available data from BSRIA.
– The CFI data (Cable Install&Maint Feb 14) was a survey asking “What do you have?”
• BSRIA Objective and method: – The aim is to provide an estimate of “what cabling is behind the wall” in
2014 worldwide.
– To provide this information BSRIA will look at annual cabling sales by Category (5e, 6, 6A and 7/7A) per year and per region. Assumptions will be applied (per region) regarding replacement rates and average meters per drop.
– “Outlet” means the same as “drop”, and number of outlets is computed based on volume of cable and average meters per drop.
• These are very different ways to measure installed base, and the results are not directly comparable.

Page 3 IEEE P802.3 Maintenance report – July 2008 Plenary Version 1.0 IEEE 802.3 NGEABT Study Group – Atlanta, GA Jan 2015 Page 3
Data Presented at the CFI.
• Enterprise access links (aka horizontal links ) are dominated by 1000BASE‐T over Cat 5e/Cat 6 – Source: Cable Install&Maint Feb14
– Survey participants were asked to identify all major cable types in their Horizontal Links
– The chart shows the proportions of cable types for BASE-T links
Cat 5e 46%
Cat 6 28%
Cat 6A 16%
Cat 7 5% Cat 7A 4%
Enterprise Horizontal BASE-T cabling
Source: Cabling Installation & Maintenance Magazine, Cabling Market
Outlook Consumption Trends and Analysis Enterprise and Data Center Organizations, February 2014
Type Proportion
Cat 5e 46%
Cat 6 28%
Cat 6A 16%
Cat 7 5%
Cat 7A 4%

Page 4 IEEE P802.3 Maintenance report – July 2008 Plenary Version 1.0 IEEE 802.3 NGEABT Study Group – Atlanta, GA Jan 2015 Page 4
BSRIA REPORT SUMMARY

Page 5 IEEE P802.3 Maintenance report – July 2008 Plenary Version 1.0 IEEE 802.3 NGEABT Study Group – Atlanta, GA Jan 2015 Page 5
Methodology
The base will be annual sales of cables by Category and region.
The cable volume will be converted to number of drops/outlets per year by Category (5e, 6, 6A and 7/A)
using the assumed average meters per drop.
The amount of cabling being replaced will be estimated for 2003 – 2016 by region.
The replacement rates by type of category of cabling will be estimated based on assumptions.
Sales per year will be aggregated minus replacement of cabling to estimate the total installed base.
Total cable shipped has been used as copper cables in DCs only accounts for around 4% (6% by value)
globally in 2013.
Copper cable sales
(million meters)
Europe
North America
Mexico & Latin America
Cat 5e
Asia Pac
Cat 6
Cat 6A
Cat 7/7A
Metres per drop
Replacement rate
An average of 40 – 50 metres is the norm
Overall and by Category.
The replacement rate vary region
Number of drops
ME
Page 6 IEEE P802.3 Maintenance report – July 2008 Plenary Version 1.0 IEEE 802.3 NGEABT Study Group – Atlanta, GA Jan 2015 Page 6
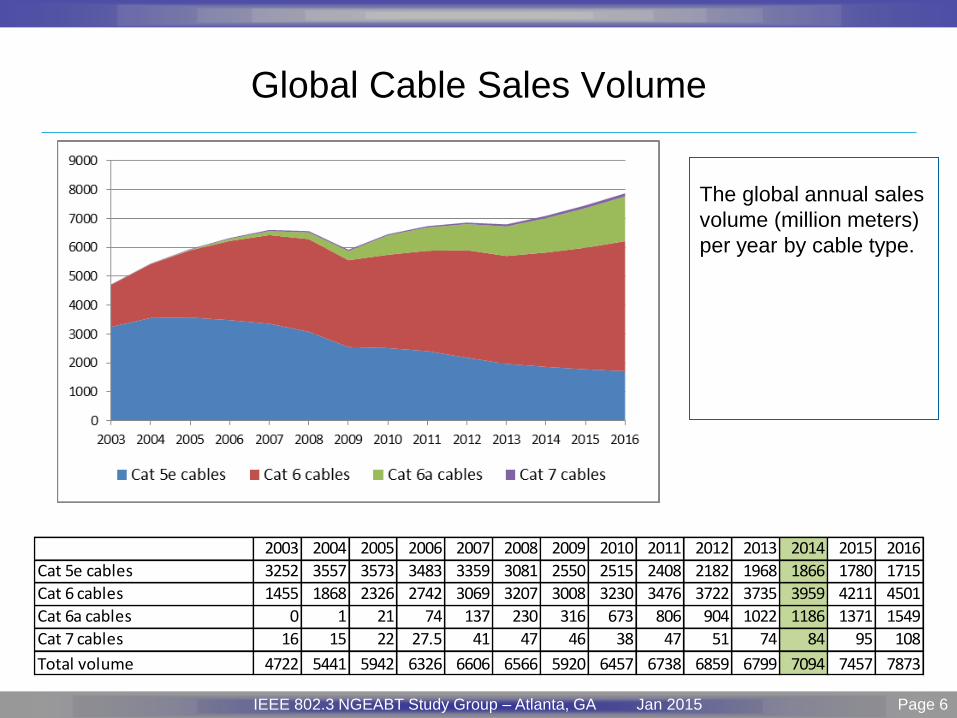
Global Cable Sales Volume
2003 2004 2005 2006 2007 2008 2009 2010 2011 2012 2013 2014 2015 2016
Cat 5e cables 3252 3557 3573 3483 3359 3081 2550 2515 2408 2182 1968 1866 1780 1715
Cat 6 cables 1455 1868 2326 2742 3069 3207 3008 3230 3476 3722 3735 3959 4211 4501
Cat 6a cables 0 1 21 74 137 230 316 673 806 904 1022 1186 1371 1549
Cat 7 cables 16 15 22 27.5 41 47 46 38 47 51 74 84 95 108
Total volume 4722 5441 5942 6326 6606 6566 5920 6457 6738 6859 6799 7094 7457 7873
The global annual sales
volume (million meters)
per year by cable type.
Page 7 IEEE P802.3 Maintenance report – July 2008 Plenary Version 1.0 IEEE 802.3 NGEABT Study Group – Atlanta, GA Jan 2015 Page 7
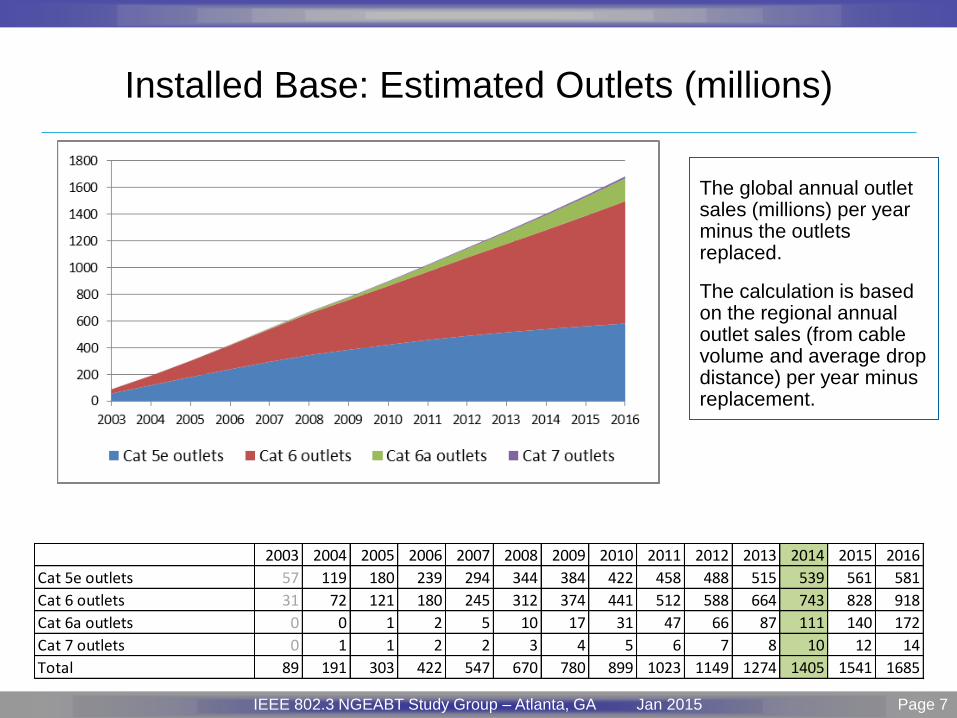
Installed Base: Estimated Outlets (millions)
The global annual outlet sales (millions) per year minus the outlets replaced.
The calculation is based on the regional annual outlet sales (from cable volume and average drop distance) per year minus replacement.
2003 2004 2005 2006 2007 2008 2009 2010 2011 2012 2013 2014 2015 2016
Cat 5e outlets 57 119 180 239 294 344 384 422 458 488 515 539 561 581
Cat 6 outlets 31 72 121 180 245 312 374 441 512 588 664 743 828 918
Cat 6a outlets 0 0 1 2 5 10 17 31 47 66 87 111 140 172
Cat 7 outlets 0 1 1 2 2 3 4 5 6 7 8 10 12 14
Total 89 191 303 422 547 670 780 899 1023 1149 1274 1405 1541 1685

Page 8 IEEE P802.3 Maintenance report – July 2008 Plenary Version 1.0 IEEE 802.3 NGEABT Study Group – Atlanta, GA Jan 2015 Page 8
Installed Base: Estimated Outlet Split 2014
Just over half the 2014
installed base outlets are
Cat 6.
38% are Cat 5e, almost
9% Cat 6a outlets and
1% Cat 7/7A.
2003 2004 2005 2006 2007 2008 2009 2010 2011 2012 2013 2014 2015 2016
Cat 5e outlets 64% 62% 59% 56% 54% 51% 49% 47% 45% 42% 40% 38% 36% 34%
Cat 6 outlets 35% 37% 40% 43% 45% 47% 48% 49% 50% 51% 52% 53% 54% 54%
Cat 6a outlets 0% 0% 0% 1% 1% 2% 2% 3% 5% 6% 7% 8% 9% 10%
Cat 7 outlets 0% 0% 0% 0% 0% 1% 1% 1% 1% 1% 1% 1% 1% 1%

Page 9 IEEE P802.3 Maintenance report – July 2008 Plenary Version 1.0 IEEE 802.3 NGEABT Study Group – Atlanta, GA Jan 2015 Page 9
Notes, Observations & Conclusions
• Notes
– There is additional data in the backup slides, please review.
– The data collection methodology is very different (“what types of cable do you have” vs “how much cable of type xx was sold”). As a result, the results are not directly comparable.
• Observations
– Relative to the CFI presentation, Cat 6 went from 28% to 53%, Cat 5e from 46% to 38%, and Cat 6a from 16% to 8%.
– Proportion of Cat 5e is declining (~2% per year), but outlets are still growing (~20 million per year). Cat5e is not going away any time soon.
• Note: the backup slides show large regional variations, NA, LA, AP still buying lots of Cat 5e.
• Conclusion – Both Cat 5e (539 million) and Cat 6 (743 million) are still growing,
and together they represent ~1.3 billion ports today.

Page 10 IEEE P802.3 Maintenance report – July 2008 Plenary Version 1.0 IEEE 802.3 NGEABT Study Group – Atlanta, GA Jan 2015 Page 10
THANK YOU
Page 11 IEEE P802.3 Maintenance report – July 2008 Plenary Version 1.0 IEEE 802.3 NGEABT Study Group – Atlanta, GA Jan 2015 Page 11
BACKUP

Page 12 IEEE P802.3 Maintenance report – July 2008 Plenary Version 1.0 IEEE 802.3 NGEABT Study Group – Atlanta, GA Jan 2015 Page 12
Annual sales of cable by region,
million meters, 2003 - 2016 Copper cables sales by region, million meters
2003 2004 2005 2006 2007 2008 2009 2010 2011 2012 2013 2014 2015 2016
Europe 1,613 1,675 1,791 1,865 1,951 1,932 1,722 1,748 1,768 1,795 1,748 1,771 1,811 1,869
Middle East 42 46 58 76 80 121 139 148 151 148 146 149 152 157
North America 1,704 1,905 1,983 2,100 1,993 1,895 1,414 1,687 1,710 1,654 1,662 1,692 1,730 1,771
Latin America 201 270 331 366 437 423 430 497 525 501 443 457 471 489
Asia Pac 1,162 1,545 1,779 1,919 2,146 2,195 2,215 2,378 2,583 2,762 2,800 3,026 3,292 3,586
Global 4,722 5,441 5,942 6,326 6,606 6,566 5,920 6,457 6,738 6,859 6,799 7,094 7,457 7,873
2014
Europe 25%
Middle East 2%
North America 24%
Latin America 6%
Asia Pac 43%
Global 100%
Copper cables sales by volume
by region, % split , 2014
Page 13 IEEE P802.3 Maintenance report – July 2008 Plenary Version 1.0 IEEE 802.3 NGEABT Study Group – Atlanta, GA Jan 2015 Page 13
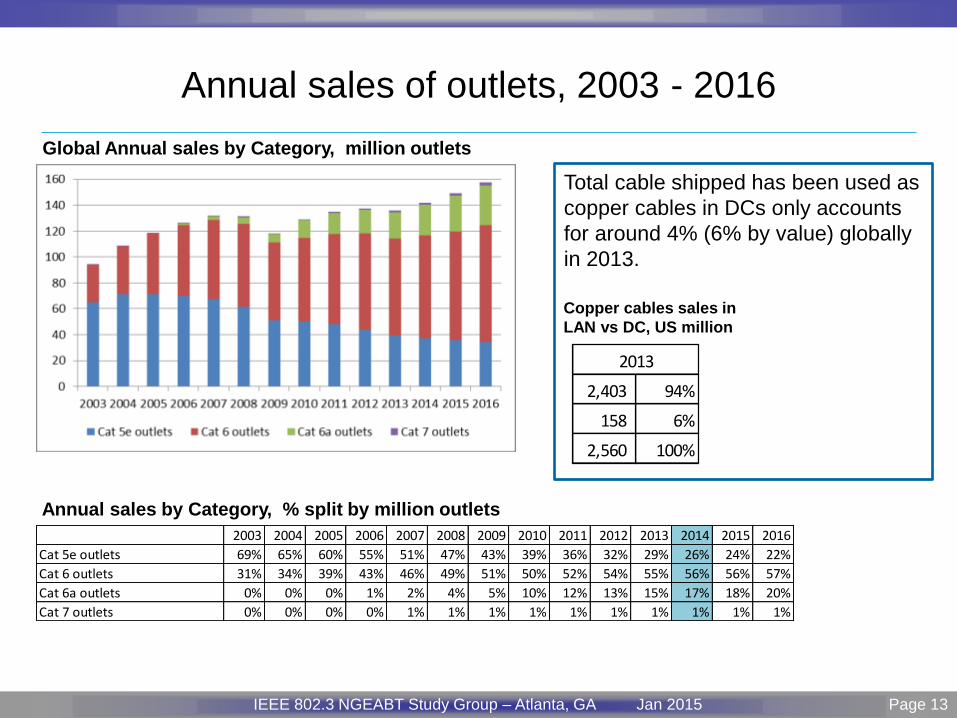
Annual sales of outlets, 2003 - 2016
Global Annual sales by Category, million outlets
2003 2004 2005 2006 2007 2008 2009 2010 2011 2012 2013 2014 2015 2016
Cat 5e outlets 69% 65% 60% 55% 51% 47% 43% 39% 36% 32% 29% 26% 24% 22%
Cat 6 outlets 31% 34% 39% 43% 46% 49% 51% 50% 52% 54% 55% 56% 56% 57%
Cat 6a outlets 0% 0% 0% 1% 2% 4% 5% 10% 12% 13% 15% 17% 18% 20%
Cat 7 outlets 0% 0% 0% 0% 1% 1% 1% 1% 1% 1% 1% 1% 1% 1%
Annual sales by Category, % split by million outlets
Total cable shipped has been used as
copper cables in DCs only accounts
for around 4% (6% by value) globally
in 2013.
2,403 94%
158 6%
2,560 100%
2013
Copper cables sales in
LAN vs DC, US million
Page 14 IEEE P802.3 Maintenance report – July 2008 Plenary Version 1.0 IEEE 802.3 NGEABT Study Group – Atlanta, GA Jan 2015 Page 14
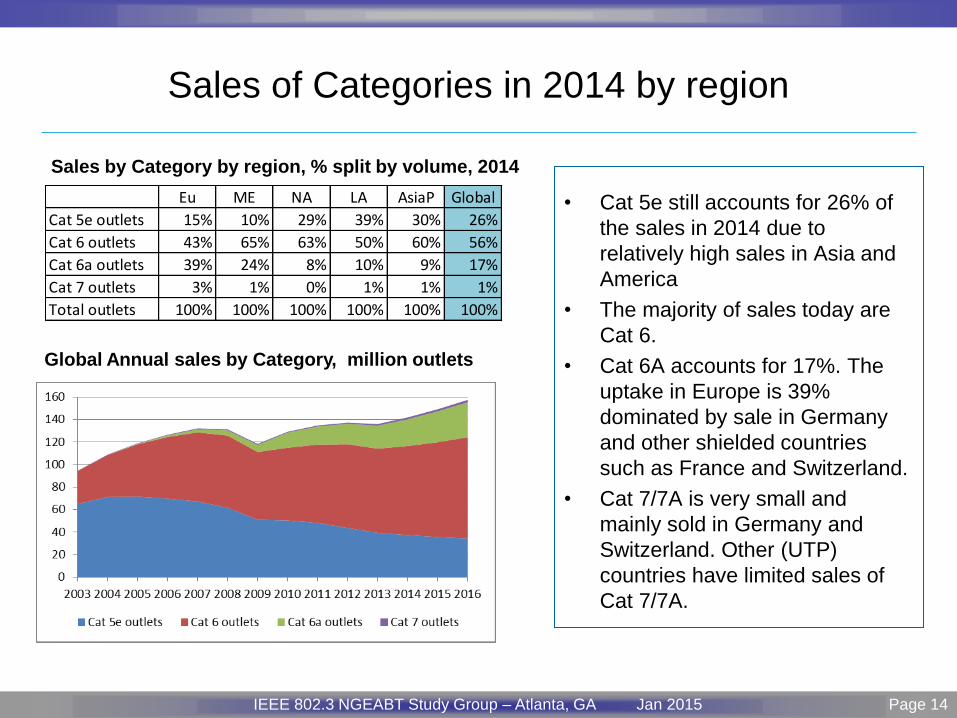
Sales of Categories in 2014 by region
Eu ME NA LA AsiaP Global
Cat 5e outlets 15% 10% 29% 39% 30% 26%
Cat 6 outlets 43% 65% 63% 50% 60% 56%
Cat 6a outlets 39% 24% 8% 10% 9% 17%
Cat 7 outlets 3% 1% 0% 1% 1% 1%
Total outlets 100% 100% 100% 100% 100% 100%
Sales by Category by region, % split by volume, 2014
• Cat 5e still accounts for 26% of
the sales in 2014 due to
relatively high sales in Asia and
America
• The majority of sales today are
Cat 6.
• Cat 6A accounts for 17%. The
uptake in Europe is 39%
dominated by sale in Germany
and other shielded countries
such as France and Switzerland.
• Cat 7/7A is very small and
mainly sold in Germany and
Switzerland. Other (UTP)
countries have limited sales of
Cat 7/7A.
Global Annual sales by Category, million outlets

Page 15 IEEE P802.3 Maintenance report – July 2008 Plenary Version 1.0 IEEE 802.3 NGEABT Study Group – Atlanta, GA Jan 2015 Page 15
Assumptions:
Replacement rates and meters per drop
Region Refurbishment rates Avg. meter per drop
Europe 40% 50 meters
Middle East 30% 48 meters
North America 40% 40 meters
Latin America 35% 50 meters
Asia Pac 30% 50 meters
The average length per drop is typically 40 – 50 metres.
40 meters are used in US and Canada.
Most of Europe use 50 meters with the exception of a few of the smaller markets.
The Middle East use 50 meters with the exception of UAE, where 40 meters per
drop is used.

Page 16 IEEE P802.3 Maintenance report – July 2008 Plenary Version 1.0 IEEE 802.3 NGEABT Study Group – Atlanta, GA Jan 2015 Page 16
Assumptions:
Replacement rates by Category and by region
The sales per year is split by
new build, moves & changes
and retrofit.
The replacement is estimated
for each Category adding up
to the 30%, 35% and 40%
replacement rate.
Replacement (%) 40% 35% 30%
% replacement rates EU+NA LA AsiaP, ME
Global Cat 5e % replacing Cat 5 or less 25% 10% 5%
Global Cat 5e % replacing Cat 5e 15% 25% 25%
Global Cat 6 % replacing Cat 5 or less 10% 1% 1%
Global Cat 6 % replacing Cat 5e 26% 32% 27%
Global Cat 6 % replacing Cat 6 4% 2% 2%
Global Cat 6a % replacing Cat 5 or less 1% 0% 0%
Global Cat 6a % replacing Cat 5e 20% 20% 16%
Global Cat 6a % replacing Cat 6 19% 15% 14%
Global Cat 7 % replacing Cat 5 or less 1% 0% 0%
Global Cat 7 % replacing Cat 5e 14% 10% 10%
Global Cat 7 % replacing Cat 6 25% 25% 20%

Page 17 IEEE P802.3 Maintenance report – July 2008 Plenary Version 1.0 IEEE 802.3 NGEABT Study Group – Atlanta, GA Jan 2015 Page 17
END