Embed Size (px)
Citation preview

Please see General Disclaimers on the last page of this report.
Current Environment ............................................................................................ 1
Industry Profile .................................................................................................... 14
Industry Trends ................................................................................................... 14
How the Industry Operates ............................................................................... 30
Key Industry Ratios and Statistics ................................................................... 39
How to Analyze a Natural Gas Company ........................................................ 40
Glossary ................................................................................................................ 46
Industry References ........................................................................................... 49
Comparative Company Analysis ...................................................................... 51
This issue updates the one dated January 2014.
Industry Surveys Natural Gas Distribution Stewart Glickman, CFA, Group Head–Energy, Materials and Utilities Sectors
JULY 2014
CONTACTS:
INQUIRIES & CLIENT RELATIONS 800.852.1641 clientrelations@ standardandpoors.com
SALES 877.219.1247 [email protected]
MEDIA Michael Privitera 212.438.6679 [email protected]
S&P CAPITAL IQ 55 Water Street New York, NY 10041

Topics Covered by Industry Surveys
Aerospace & Defense
Airlines
Alcoholic Beverages & Tobacco
Apparel & Footwear: Retailers & Brands
Autos & Auto Parts
Banking
Biotechnology
Broadcasting, Cable & Satellite
Chemicals
Communications Equipment
Computers: Commercial Services
Computers: Consumer Services & the Internet
Computers: Hardware
Computers: Software
Electric Utilities
Environmental & Waste Management Financial Services: Diversified
Foods & Nonalcoholic Beverages
Healthcare: Facilities
Healthcare: Managed Care
Healthcare: Pharmaceuticals
Healthcare: Products & Supplies
Heavy Equipment & Trucks
Homebuilding
Household Durables
Household Nondurables
Industrial Machinery
Insurance: Life & Health
Insurance: Property-Casualty
Investment Services
Lodging & Gaming
Metals: Industrial
Movies & Entertainment
Natural Gas Distribution
Oil & Gas: Equipment & Services
Oil & Gas: Production & Marketing
Paper & Forest Products
Publishing & Advertising
Real Estate Investment Trusts
Restaurants
Retailing: General
Retailing: Specialty
Semiconductor & Equipment
Supermarkets & Drugstores
Telecommunications
Thrifts & Mortgage Finance
Transportation: Commercial
Global Industry Surveys
Airlines: Asia
Autos & Auto Parts: Europe
Banking: Europe
Food Retail: Europe
Foods & Beverages: Europe
Media: Europe
Oil & Gas: Europe
Pharmaceuticals: Europe
Telecommunications: Asia
Telecommunications: Europe
S&P Capital IQ Industry Surveys 55 Water Street, New York, NY 10041
CLIENT SUPPORT: 1-800-523-4534
VISIT THE S&P CAPITAL IQ WEBSITE: www.spcapitaliq.com
S&P CAPITAL IQ INDUSTRY SURVEYS (ISSN 0196-4666) is published weekly. Redistribution or reproduction in whole or in part (including inputting into a computer) is prohibited without written permission. To learn more about Industry Surveys and the S&P Capital IQ product offering, please contact our Product Specialist team at 1-877-219-1247 or visit getmarketscope.com. Executive and Editorial Office: S&P Capital IQ, 55 Water Street, New York, NY 10041. Officers of McGraw Hill Financial: Douglas L. Peterson, President, and CEO; Jack F. Callahan, Jr., Executive Vice President, Chief Financial Officer; John Berisford, Executive Vice President, Human Resources; D. Edward Smyth, Executive Vice President, Corporate Affairs; Charles L. Teschner, Jr., Executive Vice President, Global Strategy; and Kenneth M. Vittor, Executive Vice President and General Counsel. Information has been obtained by S&P Capital IQ INDUSTRY SURVEYS from sources believed to be reliable. However, because of the possibility of human or mechanical error by our sources, INDUSTRY SURVEYS, or others, INDUSTRY SURVEYS does not guarantee the accuracy, adequacy, or completeness of any information and is not responsible for any errors or omissions or for the results obtained from the use of such information. Copyright © 2014 Standard & Poor's Financial Services LLC, a part of McGraw Hill Financial. All rights reserved. STANDARD & POOR’S, S&P, S&P 500, S&P MIDCAP 400, S&P SMALLCAP 600, and S&P EUROPE 350 are registered trademarks of Standard & Poor’s Financial Services LLC. S&P CAPITAL IQ is a trademark of Standard & Poor’s Financial Services LLC.

INDUSTRY SURVEYS NATURAL GAS DISTRIBUTION / JULY 2014 1
CURRENT ENVIRONMENT
Natural gas prices still volatile
Henry Hub spot prices of natural gas have exhibited high levels of volatility over the past decade, as evidenced by the dips and swells of market prices. How long the price spike will continue remains unpredictable as volatility lingers. For the natural gas industry, several factors may contribute to the sudden swing in demand: weather conditions, natural catastrophes, changing demographics, level of storage, pipeline capacity, current legislations affecting import and export activities, the state of the economy (particularly currency valuation), and other significant events that impact gas prices.
The significant development in the natural gas market coincides with the robust development of shale gas and the increase in global liquefied natural gas (LNG) imports (considering the production declines in many older fields associated with the liquefaction in the existing facilities in North Africa and Southeast Asia, according to the Energy Information Administration’s (EIA) International Energy Outlook 2013). This phenomenon has brought the US into a potentially strong competitive position for LNG production, although we note that most planned US liquefaction plants have yet to be built, raising the prospect of execution risk. (For more details, see the “Industry Profile” section of this Survey).
Based on data from the EIA, a statistical agency within the US Department of Energy, natural gas prices fell to a record low of $1.83 per million British thermal units (MMBtu, Henry Hub spot price) on September 4,
2009. According to Reuters, the average $3.99 per MMBtu in 2009 was the lowest in seven years. The sudden plunge in natural gas spot prices was due to the deep recession that sharply cut demand for natural gas, particularly in the industrial sector. As the economy recovered, so did demand, and one would have expected natural gas prices to have regained past losses. For the most part, however, this is not the case. Henry Hub prices have largely remained range-bound, in a $3 per MMBtu to $5 per MMBtu channel, despite most oil and gas producers choosing to focus on liquids production. The culprit: liquids production also brings with it ‘associated gas’, which enters the supply stream. As a result, the only real breakouts from this channel were in early 2012 (when much of the US experienced a fairly mild winter) and in early 2014 (when the US experienced an extremely cold winter). According to Platts, a division of McGraw Hill Financial, bidweek volumes for 2013 (January to August) averaged only above 10 million MMBtu (compared with 12.2 million MMBtu and 12.5 million MMBtu in 2011 and 2012, respectively). In 2014, bidweek volumes have averaged 7.59 million MMBtu
each month, down 23% from last year. The decline in bidweek volumes was brought about by the declining profitability of intermediation, and the subsequent departure of the investment banks from gas and power
Chart H02: HENRY HUB NATURAL GAS PRICE
0
1
2
3
4
5
6
7
8
Jan Feb Mar Apr May Jun Jul Aug Sep Oct Nov Dec
2011 2012 2013 2014
HENRY HUB NATURAL GAS PRICE(Dollars per million Btu)
First trading day of month
Btu-British thermal units.Source: US Energy Information Administration; Commodity Research Bureau.
2.5
3.5
4.5
5.5
6.5
7.5
Apr May Jun Jul Aug Sep Oct Nov Dec Jan Feb Mar Apr
Daily
2013 2014

2 NATURAL GAS DISTRIBUTION / JULY 2014 INDUSTRY SURVEYS
trading. S&P Capital IQ (S&P) foresees that this trend will continue to remain low, given the new players entering the market.
We expect prices to continue rising to reach $4.11 per MMBtu in 2015, 2.9% above 2011 prices, partly due to the disruption in oil supply from Iraq giving rise to higher gasoline prices. Barring any weather-driven catastrophe or dramatic decline in inventories, Standard & Poor’s Economics (which operates separately from S&P Capital IQ) projects that annual average Henry Hub bidweek prices will remain below the 10-year average through at least 2015, with some volatility during winter caused by surges in natural gas demand, albeit less than in 2008. As winter progressed in 2014, Henry Hub natural gas spot price spiked at the beginning of the year, with February averaging $5.15 per MMBtu ($0.74 per MMBtu higher than the average bidweek price in January). The EIA’s projected Henry Hub bidweek price average is $4.17 per MMBtu in 2014 and $4.11 MMBtu in 2015. In EIA’s Annual Energy Outlook 2014 (AEO2014), projected Henry Hub spot natural gas prices are $4.80 per MMBtu (2012 dollars) in 2018 and $4.38 per MMBtu in 2020.
WINTER HEATING SEASON ABOVE NORMAL IN 2013–2014
In the 2013–2014 season (October 2012 through March 2013), US heating degree days were 3.5% above normal (using the population-weighted gas home heating data), and 16.8% higher than the winter season in 2011–2012. The winter heating season was 17.3% warmer than normal in the 2011–2012 season and 1.4% warmer than normal in the 2010–2011 season.
US heating degree days totaled 4,539 in the 2013–2014 winter season, up 11.6% from 4,069 in the 2012–2013 winter season, which was up 16.8% from the 2011–2012 season. Heating degree days totaled 3,484 in the 2011–2012 season, down 18.5%. (One heating degree day is counted for every degree by which the daily average temperature falls below 65 degrees Fahrenheit).
According to the National Weather Service’s Climate Prediction Center (CPC), the winter season heating degree days in 2013–2014 were above normal. Further, CPC heating degree days data showed a total of 3,432 in winter 2013-2014 (December to February) compared with 3,027 in winter 2012–2013. In its May 6, 2014 Short-Term Energy Outlook (STEO), the EIA forecast that the heating degree days during the winter heating season in 2014–2015 would fall 7.2%.
Summer cooling season above normal in 2010–2012, but more typical in 2013–2014 According to CPC data, summer cooling degree days (April through September) in 2010 climbed 21.5% from a relatively normal year in 2009. The summer heat continued in 2011 and 2012, with cooling degree days dropping only 0.5% in 2011 and 1.4% in 2012 (which was 22.6% above normal for the period). Cooling degree days in 2013 were down 10.3% from the same period in 2012, but still 10.4% warmer than normal. During April to September 2010, electric power consumption of natural gas was up 9.1% compared with the year-earlier period, also due to the hot weather in that year. In 2011, electric power consumption of gas rose 1.5% during the summer cooling season. However, due to extremely low natural gas prices in the summer of 2012 leading to higher electricity production from natural gas–fired power plants, as well as the hot weather, electric power consumption of gas rose 22.9% during the 2012 summer cooling season.
According to EIA, projected electric power consumption of natural gas will remain flat at 23.9 billion cubic feet per day (Bcf/d) from April through October 2014. Last year’s electric power consumption (April to July 2013) averaged 23.4 Bcf/d, decreasing 18% from the same period in 2012 due to milder weather and higher natural gas prices that made the fuel slightly less competitive with coal. In late 2011 and 2012, the amount of gas used for electric power production rose dramatically in response to low gas prices. In November and December 2011, electric power consumption of natural gas was 8.9% higher than in the same two-month period in 2010; in 2012, electric power consumption of natural gas increased by 21% over 2011. In 2012, 42% of natural gas consumption by electric power occurred from June through September (with 23% in July and August alone); cooling degree days from June through September were 19% above normal.
In its May 6, 2014 STEO, the EIA stated that it expects cooling degree days for 2014 to rise 5.7% from the summer of 2013, when average summer temperatures in the US were lower than normal. It also predicts that US residential electricity sales will increase 1.5% from the summer of 2013. Further, as a result of

INDUSTRY SURVEYS NATURAL GAS DISTRIBUTION / JULY 2014 3
increasing natural gas prices and the cooler summer weather, the EIA expects an average annual growth rate of 0.9% in total electricity consumption.
Higher consumption seen in 2013 and 2014 On June 2, 2014, EIA reported total US energy production of 81.7 quadrillion British thermal units (Btu) in 2013, which satisfies 84% of the total US energy demand of 97.5 quadrillion Btu. According to the EIA, total natural gas consumption in 2012 was up 4.6% from the prior year. The EIA said that natural gas consumption in 2012 averaged 69.7 Bcf/d, up 4.3% from 2011. Further, in its May 30, 2014 report, Natural Gas Consumption by End-Use for 2013, the EIA said it expects end-use demand (i.e., total demand less
lease and plant fuel, pipeline use, and distribution use) to increase by 2% in 2014. Driving this gain is a 16.7% increase in combined residential and commercial demand, partly offset by a drop of 10.5% in electric power demand due to higher natural gas prices. In 2014, the EIA expects a 1.5% rise in industrial demand, offset by a combined 6.2% decrease in residential and commercial demand and a 0.7% drop in electric power fuel demand, to drive a 1.9% decrease in end-use consumption.
In 2012, end-use natural gas consumption rose by 4.5%, driven by a 20.6% increase in electric power fuel consumption and a 3.4% rise in industrial consumption. However, residential consumption declined 11.3%, and commercial
consumption was down 7.8%. Residential consumption took a hit due to a large decline in 2012 heating degree days, while electric power fuel demand was helped by a second consecutive year of hot summer weather and low natural gas prices. Industrial demand, up 3.4% (versus a rise of 1.2% in 2011), was aided by improving economic conditions.
Natural gas usage by electric power generators has grown 4.9% annually for the past 10 years, more than offsetting a 0.5% average annual decline for industrial users. Demand declines in the commercial segment have
averaged 0.8% annually for the past 10 years. Of natural gas delivered to end users in 2012, power generation accounted for 39.1%; industrial, 30.5%; residential, 17.9%; commercial, 12.4%; and vehicle fuel, 0.1%.
From a policy perspective, some energy industry participants question the wisdom of using natural gas for electric power generation: efficiency rates range from 30% to 60%, depending on the type of power plant. Steam generation and gas turbines have ranges in the low end, while combined-cycle plants have ranges near the high end. In contrast, modern home furnaces can achieve efficiencies of up to 96%, water heaters up to 90%, and clothes dryers up to 80%. As a result, these people ask whether limited natural gas resources should be squandered on generating electricity when other inexpensive methods of generating power exist.
The bottom line for the natural gas industry is that, as overall energy demand continues to rise, consumption of other forms of energy has also been rising to fill the gap, but the future is uncertain. The
Chart H08 projected US Energy Demand 0
5
10
15
20
25
30
35
40
45
2000 05 10 15 20 25 30 35 2040
LEFT UNCHANGED FROM PRIOR VERSIONLiquid fuelsLEFT UNCHANGED FROM PRIOR VERSIONNatural gas
PROJECTED US ENERGY DEMAND (Quadrillion Btu)
Btu-British thermal units.Source: US Energy Information Administration.
Chart H07: US Natural Gas Consumption
0
0.5
1
1.5
2
2.5
3
3.5
Jan Feb Mar Apr May Jun Jul Aug Sep Oct Nov Dec
2011 2012 2013 2014
US NATURAL GAS CONSUMPTION—MONTHLY(Trillion cubic feet)
Source: US Energy Information Administration.

4 NATURAL GAS DISTRIBUTION / JULY 2014 INDUSTRY SURVEYS
EIA, in its AEO2014 released in April 2014, projects that gas demand will grow slowly, rising from 25.5 trillion cubic feet (Tcf) in 2012 to 29.5 Tcf in 2040, a cumulative annual growth rate of just 0.5%. The EIA forecasts that the increase through 2040 will be driven by the various factors. In its AEO2014 Reference case, EIA expects industrial demand to rise 0.5% annually, higher than the Annual Energy Outlook 2013 (AEO2013) Reference case projection or 30.2 quadrillion Btu in 2040—1.5 quadrillion Btu. In addition, EIA expects transportation fuel demand to rise 13.1% annually, or 1.00 Tcf in total, to 1.04 Tcf. It also predicts that commercial consumption will rise by 0.7% annually. These forecasts are sharply higher than those made in early 2008. The EIA projects demand to rise in all categories between 2012 and 2040, except residential, which is expected to remain more or less constant.
Industrial demand expected to grow steadily In 2010, industrial demand had a healthy rebound of 5.7%, rose 3.9% in 2011, dropped 3.1% in 2012, and then rose 3% in 2013. In S&P’s view, industrial consumption will grow steadily as the economy strengthens and as new chemical plants are placed into service starting in 2015.
In the longer term, several supply-side factors—including increased production and more pipeline capacity—may maintain downward pressure on prices, thus leading to increased industrial use. (See the “Industry Trends” section of this Survey for more details on these issues.) These factors may also generate increased demand for gas if they improve the reliability of supply and eliminate periodic shortages on the distribution end. Some large chemical companies have said that they are considering adding new capacity in the US to plants that use natural gas as a feedstock because of low natural gas pricing in the US and expanding availability.
US PRODUCTION INCREASING
In 2013, total dry natural gas production increased 1% (the lowest annual growth since 2005), following gains of 5.1% in 2012, 7.4% in 2011, and 3.4% in 2010, according to the EIA. (Dry natural gas is defined as the natural gas that remains after liquefiable hydrocarbons—propane, butane, etc.—and sufficient contaminant gases—carbon dioxide, hydrogen sulfide, etc.—have been removed.) The EIA also measures
natural gas “gross withdrawals,” a figure that includes gas produced from gas and oil wells before various processing steps (including repressuring and the removal of non-hydrocarbon gas) take place. The total dry natural gas production figure is calculated after the extraction loss is deducted from the marketed production figure.
Dry gas production totaled 24.3 Tcf in 2013, up from 24.1 Tcf in 2012 and exceeding by 12% the 1973 record (that held until 2011) production level of 21.7 Tcf. From 1970 through 1974, annual production exceeded 21.0 Tcf in each year. In fact, production levels since 2008 represent the first time since 1974 that dry gas production exceeded 20 Tcf; it was also the highest level since a more
recent peak of 19.6 Tcf in 2001. In Today in Energy (released March 13, 2014), the EIA expected dry gas production to reach 68.1 Bcf/d from April to October, a 2% increase from same period last year.
According to the EIA’s AEO2013, dry gas production was estimated to remain nearly flat in 2013, but then would fall 0.6% to 23.9 Tcf in 2014. Beyond that, the EIA expects dry gas production to rise at a fairly steady pace through 2040. The EIA forecast for 2013 was lower than the 5.1% growth in dry gas production in 2012 largely because it expected a drop in new drilling projects due to low prices. In our view, production in 2014 will be slightly higher than the EIA’s forecast because oil drilling in areas with associated gas remains high. Through September 2013, dry gas production increased 0.6% over the same
Chart H04: US Natural Gas Supply
0
5
10
15
20
25
30
00 02 04 06 08 10 12 *2014
US NATURAL GAS SUPPLY(Trillion cubic feet)
Net importsDomestic dry gas productionImports as a % of production
* data available is Jan-Feb 2014 only.Source: US Energy Information Administration.

INDUSTRY SURVEYS NATURAL GAS DISTRIBUTION / JULY 2014 5
period last year. However, according to Baker Hughes Inc. (BHI), an oilfield services company, total US oil and gas rig counts declined 0.6% to 1,751 as of January 3, 2014, from 1,762 on January 4, 2013.
Gas rig counts remain low… US annual average gas rig counts increased steadily from 691 in 2002 to 1,491 in 2008, according to data from BHI. The five-year average rig count also increased over the same period. US gas rig counts reached a peak of 1,606 rigs in late August 2008. From that point until mid-July 2009, US gas rig counts quickly dwindled to 665, a drop of nearly two-thirds. This is largely due to the US credit crisis and its influence on operators, many of whom, especially smaller operators, depend on debt financing when cash from operations habitually fall short of capital spending needs. After a brief recovery, the gas rig count fell further, to a level of 350 (in May 10, 2013), 78.2% below the all-time high. Since May 2013, rig levels appeared to have stabilized, with gas rig levels of 372 on January 3, 2014. However, as of May 9, 2014, natural gas rig count dropped by 49, or 13%, and remained flat week-over-week at 323 as compared with rig count increase for the first quarter of the year. We think that gas rig counts will remain fairly low so long as returns from liquids drilling remain superior to those from gas drilling, which will be the case for the foreseeable future.
Low gas rig counts are due, in part, to efficiency gains in drilling. Using horizontal and directional drilling techniques, along with pad drilling, operators are now able to drill more wells per rig. According to a report from energy information provider Platts, which, like S&P, is a unit of McGraw Hill Financial, the average number of wells per rig increased to 1.5 in early 2009, from 1.0 in 2005. Data from BHI indicate that in the third quarter of 2013, the average number of wells per each land-based rig was 5.4, up 14% from 4.7 in the first quarter of 2012. The EIA attributes the continued strong production since 2009 to new supplies from unconventional gas fields, such as shale plays, and a return of some Gulf of Mexico production that was shut in due to damage from Hurricanes Gustav and Ike in 2008, as well as the production of associated gas (i.e., gas that is captured from an oil well).
Further, BHI data shows that the increase in the first quarter of 2014 rig counts was due to Permian activity. With the expected 10% increase in rig counts in the Permian Basin over 2014, a continued 4% overall increase in the US rig counts is also expected, resulting in a prediction of an average rig count of about 1,830. However, (as stated earlier) rigs count dropped due to low natural gas prices. When natural gas prices are low, producers tend to stop drilling for natural gas. This trend started in mid-2011. US working gas in storage is currently at one Tcf below the five-year average. An additional two Tcf of gas are required to get the storage back to its average level before next winter’s drawdown, and this would require injection levels to approach record levels every week between now and then. At that level of gas storage, prices would tend to rise.
According to EIA’s report on May 12, 2014, the six regions, Bakken, Eagle Ford, Haynesville, Marcellus, Niobrara, and Permian, are the most prolific areas (all of which are located in the Lower 48 states)—accounting for nearly 90% of domestic oil production growth and virtually all domestic natural gas production growth during 2011–2012. Natural gas production during that year totaled 67.7 Bcf/d, up from 65.1 Bcf/d. The contrast between natural gas rigs falling and production climbing lies in the fact that while rigs have declined, oil drilling has remained active (for example, the development of the areas in Marcellus Shale, which has encouraged more drilling activity).
…and some companies reconsider drilling plans… With strong US natural gas production and low storage withdrawals during the 2012–2013 winter heating season, which resulted in a glut and decline in natural gas prices, some producers have announced plans to curtail production. For instance, in its 2012 fourth-quarter earnings call in January 2013, Energen Corp. said that its net income in 2012 declined 18.9%, year on year, primarily due to a 30% decline in realized natural gas prices. The gas price used to calculate the company’s year-end reserves fell to $2.76 per million cubic feet (Mcf) in 2012 from $4.12 per Mcf in 2011, resulting in a significant downward revision of the company’s gas reserves.
Energen Corp.’s consolidated budget of $975 million in 2013 focused primarily on the exploration and development in the Permian Basin. In the second half of 2013, the company added a horizontal rig in the

6 NATURAL GAS DISTRIBUTION / JULY 2014 INDUSTRY SURVEYS
Midland Basin, and increased the number of wells drilled from six to nine. For 2014, Energen Corp. plans to add 23 wells, equivalent to $250 million of additional capital to be invested in the Permian Basin.
…even as gas production from oil-producing shale wells is picking up in a big way Advances in US science and engineering—in seismic, horizontal drilling, and hydraulic fracturing (or “fracking”)—are enabling the exploitation of new sources of unconventional gas resources (such as tight gas, shale gas, and coal bed methane (CBM) in North America. In many cases, the costs are below conventional resources, as well as unconventional sources of oil (such as shale oil, deepwater oil, and heavy oil). If these US-based engineering technologies can be applied to unconventional resources worldwide (including large gas deposits in Europe and Asia), the implications for the recoverable global resource base would be enormous—a game-changer.
This concept received a big endorsement by ExxonMobil when it purchased XTO Energy Inc. in June 2010 to provide a complementary platform to expand its unconventional oil and gas production technologies worldwide. Likewise, Chevron Corp. merged with Atlas Energy Inc. in February 2011 to acquire its unconventional Marcellus Shale gas holdings in the Appalachian Basin of the US. In August 2011, BHP Billiton also jumped on the unconventional gas bandwagon by acquiring Petrohawk Energy, a major operator in the Eagle Ford Shale play. In another significant development, Kinder Morgan Inc. acquired El Paso Corp. in May 2012. The combined entity owns the largest natural gas pipeline network in the US. In May 2013, Kansas-based Inergy Midstream LP and Texas-based Crestwood Midstream Partners LP agreed to merge to form a new company worth $7 billion. The deal was completed on October 7, 2013. The combined company, Crestwood Midstream Partners LP, has a diverse platform of midstream assets to provide a broad range of services in the shale gas regions in North America.
In May 2013, MidAmerican Energy Holdings Company announced its plan to acquire NV Energy, Inc. to join forces in the exploration of greater renewable energy generation options. To facilitate upstream growth, Rice Energy Inc. acquired Marcellus Shale gathering assets from M3 Appalachia Gathering, LLC. The transaction was expected to close in March 2014.
Shale production to help some utilities Many new areas of gas production are beginning to ramp up operations. In the West, well gas has typically been considered wet gas—gas that needs to be processed to remove natural gas liquids, such as butane or propane, before the gas is sent into a standard natural gas transmission pipeline. These wells typically connect to natural gas gathering pipeline systems that direct the gas to a central processing facility. Operators of the gas gathering and processing plant can face certain commodity price risks, depending on the kind of contract that they sign with the wet gas provider. As a result, companies associated more with oil and gas exploration and production or natural gas pipeline companies more typically own these gas gathering systems, rather than distribution utilities. Nonetheless, several distribution utilities have ownership stakes in gas gathering businesses.
However, in the East, the Marcellus Shale could benefit local utilities more directly. The gas in the Marcellus Shale in northern Pennsylvania and southern New York needs no processing, as it is already relatively dry, thus lending itself to the rapid increase in natural gas and oil production. As a result, several utilities have plans to build or are building the infrastructure required to move the gas directly from the wells into pipelines, and are building additional pipeline extensions to get the gas to end markets more efficiently.
In its Annual Energy Outlook 2011(AEO2011), the EIA had estimated unproved technically recoverable reserves of 410 Tcf, but in the AEO2012, it lowered that estimate to 141 Tcf. (No update was given in the AEO2013 or AEO2014.) This is still higher than the 84 Tcf estimated by the US Geological Survey in October 2012. Other shale basins also contain significant quantities of gas, including the Greater Green River Basin (84 Tcf) in Wyoming and the Utica Basin (38 Tcf) in the Appalachian region.
S&P thinks that gas utilities and pipelines that operate in the Marcellus Shale region will benefit from increasing shale production. All northeastern utilities are likely to benefit from having a large nearby source of natural gas present that will help to keep pressure on gas prices, thereby helping to reduce the impact of one of the factors that has led to conservation in the past decade. Since operations in the Marcellus Shale

INDUSTRY SURVEYS NATURAL GAS DISTRIBUTION / JULY 2014 7
are still relatively new, a fair amount of research still needs to be done to determine how much gas each well is able to produce in the long term.
LNG: WILL US CHANGE FROM IMPORTER TO EXPORTER?
In the early- to mid-2000s, it was widely held that the US was going to need to import LNG in increasing amounts to meet the country’s future energy needs. Far more LNG import terminals were built and proposed than would be needed in this century. Yet now, many companies are building and proposing LNG export terminals.
In 2008, imports of LNG averaged 0.96 Bcf/d, the lowest level since 2002 and down 54% from 2007. LNG imports rose 28.5% to 1.24 Bcf/d in 2009, but were still 41% below 2007 levels. In 2010, LNG imports fell once again, dropping 4.6% to 1.18 Bcf/d, while in 2011 they fell by as much as 19% to 0.96 Bcf/d. In 2012, LNG imports fell even faster, at a 50% pace, to 0.48 Bcf/d. In January and February 2014, imports of LNG totaled 8,536 Mcf and 3,783 Mcf, respectively—a drastic decrease signaling that the US may be on the way to being LNG import-free.
Furthermore, in its annual medium-term gas-market report, the EIA stated that China’s power, industrial and transport sectors will push Chinese demand to 315 billion cubic meters (Bcm) in 2019, an increase of 90% over the forecast period. With the new LNG pipeline projects being built, private-sector operators in Australia, Canada and the US are taking the lead in the expansion of LNG trade, which is expected to grow by 40% to reach 450 Bcm by 2019. Half of all new LNG exports are expected to originate in Australia, while 8% are expected to come from North America.
In its December 2013 STEO, the EIA predicted US LNG imports would remain at minimal levels of around 0.3 Bcf/d in 2013 and 0.2 Bcf/d in 2014. According to the EIA, the US has become “a market of last resort” for a majority of LNG exporters, given the lower LNG prices in the US. Further, most LNG imports are due to fulfillment of long-term obligations or temporarily high local prices due to cold snaps and supply disruptions. Reasons for the EIA’s expectations for a low level of LNG imports include high domestic production and inventories, and low gas prices in the US relative to Asian and European countries. In Asia, Japanese LNG demand increased to fuel electric power production following the loss of nuclear capacity as a result of the destruction of the Fukushima nuclear plant in March 2011 and the subsequent closings of other nuclear plants as a result of a change in Japan’s energy policy. (For more details about new LNG facilities, see the LNG expansion discussion in the “Industry Trends” section of this Survey.)
First LNG export terminal approved by FERC On April 16, 2012, the Federal Energy Regulatory Commission (FERC) approved the construction of the first-ever LNG export facility to be built in the US. Cheniere Energy Inc., which will build the facility in Louisiana for around $10 billion, will become the only large-scale exporter of LNG operating in the US. The export facilities will be built at the presently operating Sabine Pass LNG import terminal. The FERC has allowed Cheniere to export LNG for 20 years and the company has already signed contracts with leading oil and gas companies such as BG Group, Gas Natural Fenosa, GAIL (India), and Korea Gas Corp. The proposed facility will be constructed and operated by Cheniere’s subsidiaries, Sabine Pass Liquefaction and Sabine Pass LNG, and will have the capacity to liquefy and export around 2.2 billion cubic feet (bcf), or 16 million tons per annum (mtpa), of natural gas.
The project will be executed in two stages, each including two LNG process trains capable of liquefying 4.0 mtpa of natural gas. The process trains will be equipped with gas treatment facilities, gas turbine–driven refrigerant compressors, cold boxes, and heat exchangers for cooling and liquefying natural gas, and waste heat recovery systems, along with other facilities. The FERC order mandates that the proposed facilities be fully functional within five years of the date of the order. Cheniere will finance the project with $4 billion of debt and $2 billion of equity. The equity portion will be raised from a private placement of units with Blackstone Energy Partners and Blackstone Capital Partners.
In its second-quarter 2013 results, Cheniere LNG International announced that it is ahead of schedule with the construction of the export terminal and expects to start production by late 2015. Cheniere, which is required to submit a monthly progress update to the FERC, has offered a bonus incentive to the engineering

8 NATURAL GAS DISTRIBUTION / JULY 2014 INDUSTRY SURVEYS
firm Bechtel Oil, Gas and Chemicals Inc. if it completes construction before the planned timelines. As of May 20, 2014, Cheniere’s Trains 1 & 2 project was 65.2% complete against a plan of 66.6%, while Trains 3 & 4 were 29.7% complete against a plan of 27.2%.
LNG operators request export permits… As of April 18, 2014, the US Department of Energy (DOE) had received 43 applications for permits to export domestically produced LNG from the Lower 48 states, of which seven have already been approved, while the rest are pending DOE review.
Dominion Resources. In early 2011, Dominion Resources Inc. announced its plans to build LNG export facilities at its existing import terminal at Cove Point, Maryland. In September 2013, the company received approval from the DOE to export LNG to non-free trade agreement (FTA) countries. The FERC granted approval for exports from the terminal on September 11, 2013. The company started constructing the export facility and received an environmental review clearance from the FERC on May 15, 2014. The export facility will be ready for operation by 2017, with a capacity to liquefy 0.750 Bcf/d, and conditional approval from the Energy Department last year to export 0.77 Bcf/d of natural gas.
Golden Pass LNG. In January 2012, Golden Pass LNG Terminal LLC also announced its plans to file for permission to start re-export services at its LNG terminal in Sabine Pass, Louisiana, through a $10 billion export project. The terminal company, owned 70% by Qatar Petroleum, 17.6% by Exxon Mobil, and 12.4% by Total S.A., plans to store the LNG it receives for re-export to other countries. Further, given the design of the plant, any alterations or changes would not be required at the plant, though the operating design and procedures would need some modifications. Currently, the terminal has the capacity to receive around 15.6 mtpa of LNG. Given the current trend in the industry, it is likely that the terminal plans to export domestically produced LNG in place of re-exporting imported LNG.
On October 4, 2012, the DOE granted permission to Golden Pass to export LNG to countries having FTAs with the US. Golden Pass then filed an application for long-term authorization to export LNG to non-FTA countries. The DOE will make case-by-case decisions on the 21 pending export applications filed by various companies.
Freeport LNG. In May 2013, Freeport LNG Development L.P., which is jointly owned by Cheniere, Dow Chemical, Osaka Gas, and ConocoPhillips received DOE approval for exporting LNG to non-FTA countries and expanding the liquefaction capacity at its terminal in Freeport, Texas, by 1.8 billion cubic feet a day.
Sempra Energy. On January 17, 2012, Cameron LNG (owned by Sempra Energy) received approval from the DOE to export up to 12 mtpa (or 1.7 Bcf/d) of LNG. The company’s natural gas liquefaction export facility is under construction (comprising three liquefaction trains), and it received conditional authorization on February 11, 2014 from the DOE to export domestically produced LNG from its proposed terminal in Hackberry, Louisiana. Full commercial operation is planned for 2019.
More being built, but not all will get built Over the years, a number of natural gas and oil companies have requested permits to build export facilities and to operate (either to import LNG or to export the imported LNG). Some were granted clearance to build and the process went ahead smoothly, while other companies that had already applied for permits and were approved, were left hanging due to compliance overlaps and juridical conflicts.
Applications for another three onshore terminals with a capacity of 1.4 Bcf/d are pending FERC review. There are many proposed projects and previously approved projects that appear to have met their demise. We think more cancellations will occur in the future and we do not think any more import terminals will be built in North America in the near future. There was even one operating project, the Gulf Gateway, decommissioned in 2012 due to a lack of demand. The low capital cost of that facility made it easier for the owner to redeploy its resources.
Despite the large amount of existing, approved, and applied-for North American capacity (total of 33.2 Bcf/d), the three LNG terminals that have been proposed are unlikely to be built. Unapproved US plants
INDUSTRY SURVEYS NATURAL GAS DISTRIBUTION / JULY 2014 9
face a host of obstacles beyond federal approval, including local opposition and lack of demand for so many projects. For that matter, even the existing facilities with a total capacity of 7.9 Tcf per year face a lack of demand. South Jersey Gas. In February 21, 2014, South Jersey Gas received approvals from the New Jersey Board of Public Utilities and other regulatory bodies to install a 22-mile pipeline to deliver clean burning, efficient natural gas to the BL England electric generation facility, with a construction plan expected to take place this year. However, in January, the Pinelands Commission denied the company rights to build a pipeline through 15 miles of protected pinelands on the premise that the proposed pipeline would run under and adjacent to already paved roadways. On May 09, 2014, the company filed a suit against Pinelands Commission’s pipeline rejection. Calhoun LNG. On February 21, 2014, the FERC approved Calhoun LNG’s decision not to proceed with an import terminal in Texas (after the company had filed to vacate the authorization on December 14, 2012). In 2007, Calhoun LNG received authorization from the FERC to build and operate a terminal and associated infrastructure within five years of the final approval (which would have been by September 20, 2012).
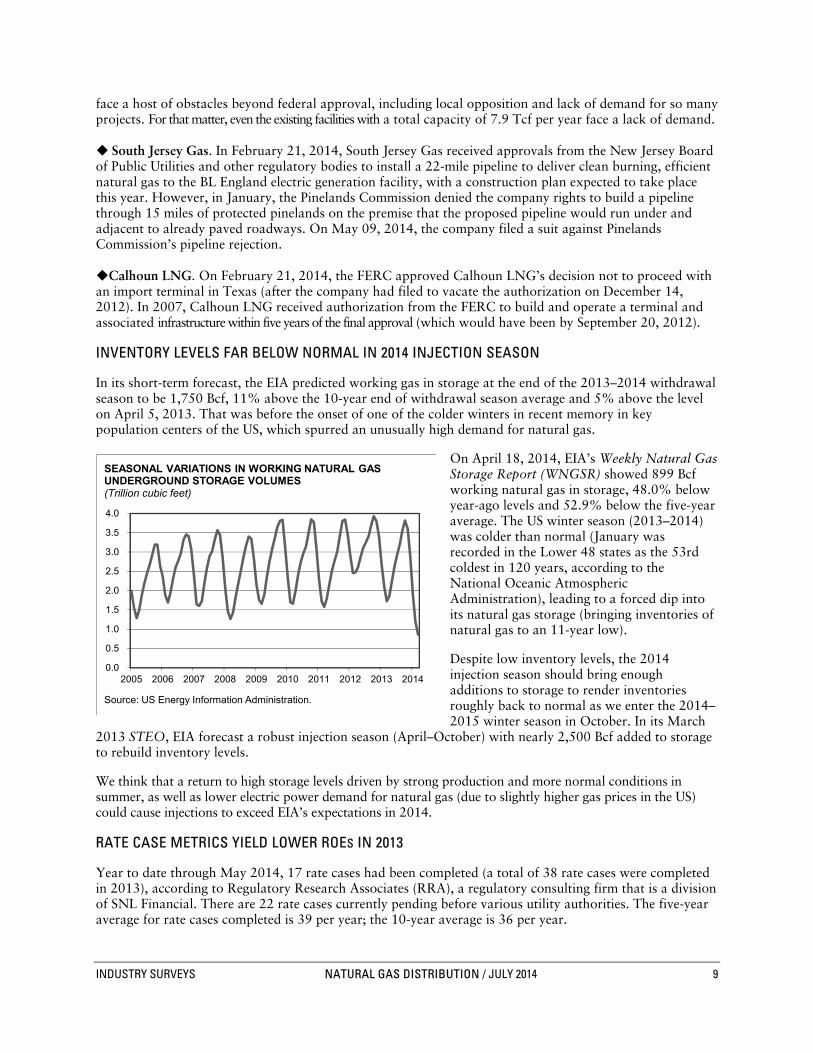
INVENTORY LEVELS FAR BELOW NORMAL IN 2014 INJECTION SEASON
In its short-term forecast, the EIA predicted working gas in storage at the end of the 2013–2014 withdrawal season to be 1,750 Bcf, 11% above the 10-year end of withdrawal season average and 5% above the level on April 5, 2013. That was before the onset of one of the colder winters in recent memory in key population centers of the US, which spurred an unusually high demand for natural gas.
On April 18, 2014, EIA’s Weekly Natural Gas Storage Report (WNGSR) showed 899 Bcf working natural gas in storage, 48.0% below year-ago levels and 52.9% below the five-year average. The US winter season (2013–2014) was colder than normal (January was recorded in the Lower 48 states as the 53rd coldest in 120 years, according to the National Oceanic Atmospheric Administration), leading to a forced dip into its natural gas storage (bringing inventories of natural gas to an 11-year low).
Despite low inventory levels, the 2014 injection season should bring enough additions to storage to render inventories roughly back to normal as we enter the 2014–2015 winter season in October. In its March
2013 STEO, EIA forecast a robust injection season (April–October) with nearly 2,500 Bcf added to storage to rebuild inventory levels.
We think that a return to high storage levels driven by strong production and more normal conditions in summer, as well as lower electric power demand for natural gas (due to slightly higher gas prices in the US) could cause injections to exceed EIA’s expectations in 2014.
RATE CASE METRICS YIELD LOWER ROES IN 2013
Year to date through May 2014, 17 rate cases had been completed (a total of 38 rate cases were completed in 2013), according to Regulatory Research Associates (RRA), a regulatory consulting firm that is a division of SNL Financial. There are 22 rate cases currently pending before various utility authorities. The five-year average for rate cases completed is 39 per year; the 10-year average is 36 per year.
Chart H05: Seasonal Variations in Underground Working Natural Gas in Storage
0.0
0.5
1.0
1.5
2.0
2.5
3.0
3.5
4.0
2005 2006 2007 2008 2009 2010 2011 2012 2013 2014
SEASONAL VARIATIONS IN WORKING NATURAL GAS UNDERGROUND STORAGE VOLUMES (Trillion cubic feet)
Source: US Energy Information Administration.

10 NATURAL GAS DISTRIBUTION / JULY 2014 INDUSTRY SURVEYS
The average requested return on equity (ROE) for pending rate cases is 10.6%, with an average requested equity to total capitalization (equity component) of 52.9% and an average requested return on rate base (RORB) of 7.9%. The 10-year averages for completed rate cases include granted ROE of 10.3% (versus 11.4% requested), granted equity component of 49.1% (versus 50.0% requested), and granted RORB of 8.3% (versus 8.9% requested). In observable rate cases from 2003 to 2012, granted rate base was $2.79 billion (or 2.2%) lower than requested rate base. The five-year average ROE of 10.1% (versus 11.1% requested) and RORB of 8.1% (versus 8.7% requested) is lower, but the granted equity component of 49.9% (versus 50.6% requested) is higher. In observable rate cases from 2008 to 2012, granted rate base was $1.72 billion (or 2.3%) lower than requested rate base.
Holding the amount of a rate case increase steady, regulators can raise the allowed ROE by lowering the equity component. Likewise, granting a smaller rate increase and lowering the equity component simultaneously can allow regulators to keep an allowed ROE higher than it would otherwise be, had the equity component remained the same. Additionally, regulators routinely lower the requested rate base, which also would have a positive effect on RORB, holding other items equal; however, this likely would have a negative effect on rates. For 2014, S&P is certain that natural gas companies may slow down in pursuing rate case increases, given the 2.9% decline in the US gross domestic product (GDP) for the first quarter. Local utility regulators may push for lower ROE to align with lower cost of capital; hence, revenue growth for utilities could be suppressed.
Rate case ROEs lower in 2013 In 2013, the average of all rate cases had an ROE of 9.5%, lower than the previous year’s completed rate cases (41 total), which had an ROE of 9.9%, an RORB of 8.0%, and an equity component of 51.1%, versus average requested ROEs of 10.5,% 10.8%, 8.4%, and 51.5%, respectively. The five-year average for completed rate cases and ROE is 39 and 10.1%, respectively, according to the EIA. For these cases, the granted rate base was $320 million (or 2.6%) lower than requested, though $273.2 million of the shortfall was from five companies: Peoples Gas Light & Coke Co. ($113.7 million), Northwest Natural Gas Co.
Table B07: Pending rate cases
PENDING RATE CASES(As of May 2014)
STATE COM PANY FILING DATE
RATEINCREASE
(M IL.$)
RETURN ON
RATE BASE
(%)
RETURN ON
EQUITY(%)
COM M ON EQUITY TO
TOTAL CAP. (%)
RATE BASE(M IL.$)
ACTIONLIKELY BY
Arkansas SourceGas Arkansas Inc 9/9/2013 18.7 6.24 10.25 43.14 275.71 7/9/2014California Pacif ic Gas and Electric Co. 12/19/2013 555.0 NA NA NA 3,560.00 12/31/2014California Southw est Gas Corp. 12/20/2012 5.6 7.32 10.70 57.00 170.90 6/12/2014California Southw est Gas Corp. 12/20/2012 3.2 8.61 10.70 57.00 67.70 6/12/2014California Southw est Gas Corp. 12/20/2012 2.8 8.61 10.70 57.00 23.70 6/12/2014California Pacif ic Gas and Electric Co. 11/15/2012 451.5 NA NA NA 3,758.72 5/15/2014Illinois North Shore Gas Co. 2/26/2014 7.1 NA 10.25 50.41 210.80 1/20/2015Illinois Peoples Gas Light & Coke Co. 2/26/2014 128.9 7.36 10.25 50.31 1,869.63 1/20/2015Kansas Black Hills Kansas Gas Utility 4/29/2014 7.3 7.52 10.60 50.34 131.19 12/29/2014Kansas Atmos Energy Corp. 1/9/2014 8.8 8.44 10.53 51.24 184.20 9/8/2014Maryland Columbia Gas of Maryland Inc 4/1/2014 0.7 NA NA NA 3.27 NAMaryland Washington Gas Light Co. 11/7/2013 17.0 NA NA NA 109.58 NAMinnesota Minnesota Energy Resources 9/30/2013 12.2 8.01 10.75 50.31 199.19 9/30/2014Missouri Liberty Utilities (Midstates) 2/6/2014 7.6 8.12 10.50 58.34 87.48 1/4/2015Missouri Summit Natural Gas of Missouri 1/2/2014 7.5 8.22 12.00 56.96 146.47 10/29/2014New Jersey South Jersey Gas Co. 11/29/2013 65.6 7.97 11.00 54.57 1,333.64 8/29/2014Pennsylvania Columbia Gas of Pennsylvania 3/21/2014 54.1 8.46 11.25 52.17 1,185.80 12/20/2014Washington Avista Corp. 2/4/2014 12.1 7.71 10.10 49.00 242.84 12/31/2014Wisconsin Madison Gas and Electric Co. 4/17/2014 -4.4 7.99 10.20 58.90 157.92 12/31/2014Wisconsin Wisconsin Pow er and Light Co 4/9/2014 -5.0 NA 10.40 50.46 201.44 6/15/2014Wisconsin Wisconsin Public Service Corp. 4/1/2014 -1.6 8.23 10.60 50.50 360.01 12/31/2014Wyoming Cheyenne Light Fuel Pow er Co. 12/2/2013 1.3 8.32 10.25 54.00 56.03 10/31/2014NA-Not available.Source: Regulatory Research Associates.

INDUSTRY SURVEYS NATURAL GAS DISTRIBUTION / JULY 2014 11
($97.5 million), Puget Sound Energy Inc. ($24.8 million), Bay State Gas Co. ($21.5 million), and Mountaineer Gas Co. ($15.7 million). Through May 2014, initial rate case metrics seemed weaker compared with 2013, since the allowed ROE and RORB were lower, but these were partly offset by a lower equity component, leading to an ROE that was not as low as it otherwise would have been. Granted ROE was 9.6% (versus 10.5% requested), granted RORB was 7.3% (versus 7.9% requested), and granted equity component was 50.2% (versus 51.4% requested). Granted rate base was $13.5 billion (3.3%) lower than requested. (See the “How the Industry Operates” section of this Survey for further discussion of rate-setting mechanisms.)
Notable rate cases completed in 2012 included Peoples Gas Light & Coke, which filed for a $112.6 million rate case in Illinois, premised upon a 10.8% ROE, an 8.1% RORB, and an equity-to-capitalization ratio of 56.0%. The company received a $57.8 million increase based on a 9.4% ROE, a 6.9% RORB, and a 49.0% equity-to-capitalization ratio. DTE Gas filed for a $76.7 million increase in Michigan based on an 11.0% ROE, a 6.5% RORB, and an equity-to-capitalization ratio of 38.3%. It received a $19.9 million increase based on a 10.5% ROE (the other metrics were not available). Northwest Natural Gas requested a $43.7 million increase in Oregon based on a 10.3% ROE, an 8.3% RORB, and a 50.0% equity-to-capitalization ratio. It was granted just an $8.7 million increase based on a 9.5% ROE, a 7.8% RORB, and a 50.0% equity-to-capitalization ratio. Pacific Gas & Electric filed for a $23.0 million rate reduction in California, based on an 11.0% ROE, an 8.4% RORB, and an equity-to-capitalization ratio of 52.0%. The company received a $55.8 million cut with a 10.4% ROE, an 8.1% RORB, and the equity component as requested.
Of the 24 rate cases completed through December 5, 2013, the largest was Southern California Gas Co. The company filed for a $239.0 million rate increase, which included a rate base of $3.62 billion. The company was granted an $84.8 million increase based on a rate base of $3.44 billion. Other notable cases included Peoples Gas Light & Coke, which requested a $97.8 million increase and received a $57.2 million increase, and Columbia Gas of Pennsylvania, which requested a $77.3 million increase and received a $55.3 million increase.
Notable pending rate cases include a $451 million rate case (revised down from $486 million) filed by Pacific Gas & Electric, a $151.3 million case filed by the Public Service Co. of Colorado, a $79.8 million case filed by the Piedmont Natural Gas Co., and a $65.6 million rate case filed by South Jersey Gas. SNL Financial expects the Piedmont and Colorado cases to be completed in 2013, and the other two in 2014.
RECENT MERGER ACTIVITY
Significant merger and acquisition (M&A) activity picked up slightly in 2010 and 2011. In 2010, two deals were announced involving foreign utilities and one deal late in the year between two US companies. In 2011–2013, more US utility deals were announced, many of which included gas distribution systems as part or all of the assets involved. In the second quarter of 2013, energy deal activities in the Americas reached around $40 billion, the lowest since the third quarter of 2009, according to S&P’s Sector IQ: Energy, a new publication which explores the energy industry and provides a unique perspective on oil and gas markets by leveraging content and analytics from across McGraw Hill Financial. An emerging trend to form publicly traded master limited partnerships using natural gas gathering, processing, transportation, and storage assets has also led to some merger activity.
ONEOK approves separation of natural gas utility business. On January 8, 2014, ONEOK Inc. approved the separation of its natural gas utility business into a new publicly traded company called ONE Gas, Inc. At close of business on January 21, existing shareholders received one share of ONE Gas for every four shares of ONEOK held. ONE Gas shares were distributed following the close of business on January 31. On February 3, ONE Gas traded on the New York Stock Exchange (NYSE), under the symbol “OGS.”
Laclede Group to acquire Alabama Gas Corporation. On April 7, 2014, Laclede Group Inc., a utility holding company, announced its agreement with Energen Corp. to acquire Alabama Gas Corporation (“Alagasco”) for a total consideration of $1.6 billion with an effective purchase price of $1.34 billion, after taking into account the present value, amounting to approximately $260 million of the tax benefits. The transaction is expected to close within the year.

12 NATURAL GAS DISTRIBUTION / JULY 2014 INDUSTRY SURVEYS
PNG Companies acquires gas utility company. On December 19, 2012, PNG Companies LLC, the parent company of Peoples Natural Gas Co., entered into an agreement to acquire Equitable Gas Co. LLC from Distribution Holdco LLC, a wholly-owned subsidiary of EQT Corp. PNG agreed to pay around $720 million in cash and transfer certain midstream assets to EQT. The transaction closed on December 17, 2013.
Energy Transfer Equity–Southern Union. On March 26, 2012, Energy Transfer Equity LP completed the acquisition of Southern Union Co., the parent company of Missouri Gas Energy and New England Gas. Missouri Gas Energy serves 501,000 customers, while New England Gas serves 50,000. The purchase price of $7.9 billion included $4.2 billion in equity and $3.7 billion in debt.
TECO Energy–New Mexico Gas Intermediate, Inc. On May 28, 2013, TECO Energy agreed to acquire New Mexico Gas Co. for $950 million (including $200 million in assumed debt). New Mexico Gas Co. serves around 509,000 customers in New Mexico. After the acquisition, TECO Energy’s customer base will expand to 1.5 million in Florida and New Mexico. TECO Energy expects the acquisition to close this fall (subject to regulatory approvals) and the transaction to be accretive to earnings in 2015.
International deals Liberty Energy. In December 2013, Liberty Energy Utilities Co., a subsidiary of Toronto-based Algonquin Power & Utilities Corp., announced the completion of its acquisition of Laclede Group’s New England Gas Co. for $74 million (including $19.5 million to assume debt). On April 1, 2013, Liberty Energy announced the completion of its $141 million acquisition of Atmos Energy’s regulated natural gas distribution. Atmos Energy retained distribution utilities in nine other states. In July 2012, Liberty Energy closed a deal to purchase the 43,000-customer Granite State Electric Co. and the 83,000-customer EnergyNorth Natural Gas Inc. from National Grid USA (the US arm of the National Grid Group) for around $290 million.
Fortis–CH Energy Group. On February 21, 2012, Fortis Inc., a distribution utility based in Canada, agreed to acquire CH Energy Group Inc. for around US$1.5 billion, consisting of US$65 per share in cash and the assumption of debt worth US$500 million. The purchase price reflects a premium of around 10.5% over the closing price of the CH Energy shares prior to the announcement of the merger agreement. The transaction closed in June 2013, upon receiving regulatory approvals from the New York Public Service Commission and the FERC.
AltaGas–SEMCO Energy. On February 1, 2012, AltaGas Ltd. entered into an agreement to purchase from Continental Energy Systems LLC its SEMCO Holding Corp. unit for around US$1.14 billion, including US$355 million in assumed debt. SEMCO Holding owns SEMCO Energy Inc., a regulated public utility company in Michigan, and ENSTAR Natural Gas Co., a regulated natural gas distribution utility in Alaska, as well as other natural gas holdings. The transaction closed on August 30, 2012. AltaGas hopes the transaction will help it establish a strong presence in the US in areas with growth potential that are near AltaGas’s current operations.
NATURAL GAS DISTRIBUTION OUTLOOK: NEUTRAL
Gas distribution companies generally have seen slow growth since 2007. As of mid-2014, our fundamental outlook for the natural gas utilities sub-industry for the next 6 months was neutral. For 2014, we estimate double-digit earnings per share (EPS) growth, on average. Recent rate increases for many utilities should help mute the effect of reduced customer growth during the economic slowdown, in our view. In addition, extremely mild weather hurt earnings in 2013, a factor we do not see in 2014. Rate case increases might slow down if GDP continues to decline. In 2014, we expect slightly colder weather to result in mid-single-digit EPS growth.
Temperatures are expected to keep to normal levels throughout 2014. We think continued high storage levels and strong production are likely to keep gas prices in check. We see revenue decoupling mechanisms, which help a utility replace lost revenue due to customer conservation, continuing to gain acceptance. Also, we see accelerated investment and recovery programs becoming more commonplace, where utilities accelerate capital spending on pipeline replacements and are allowed to recover their investments through riders before their next scheduled rate case.

INDUSTRY SURVEYS NATURAL GAS DISTRIBUTION / JULY 2014 13
Vertically integrated natural gas distribution companies with unregulated midstream and upstream operations enjoyed record profits in 2008, benefiting from high commodity prices, but now face the reality of lower prices. This has taken a toll on earnings at utilities that have exposure to natural gas exploration and production. As some of these utilities have shifted their strategies to focus more on liquids production, we expect earnings growth in 2014 to benefit. We also see volume gains as companies drill in various shales. Much longer term, we think an improving regulatory environment will increase access to public lands for drilling and pipeline expansion and will expedite permit procedures, providing for steady long-term production gains. We expect lower production-related costs at utilities’ exploration and production (E&P) operations.
The EIA expects US demand for natural gas in 2014 and 2015 to increase slightly from 2013. According to EIA’s STEO published on May 6, 2014, end-use US natural gas consumption climbed 1.3% from 2013, at an average of 72.3 Bcf/d, and is expected to decline by 0.1 Bcf/d in 2015 due to return to near normal winter weather. S&P believes that end-use consumption will exceed EIA’s 2014 forecast, given the 12.5% increase in residential and 13.9% increase in commercial demand related to space heating partly offset by a 1.2% drop in consumption by power generators in the first quarter of 2014, assuming that weather in the succeeding quarters is similar to that in 2013.
A return to continued historically high natural gas prices could hurt gas companies. In May 6, 2014, (the last forecast change), EIA released the STEO report and forecast that Henry Hub gas spot price, which averaged $3.73 per MMBtu in 2013, would average $4.74 per MMBtu in 2014, $0.30 higher than in last month’s STEO, and $4.33 per MMBtu in 2015. Current gas prices are relatively low compared with recent history. Lower prices tend to attract more new customers to gas (especially when oil prices remain high) and encourage switching from other fuels. Many utilities in the Northeast have discussed how residential customers that switch to natural gas from other fuels for heating are boosting customer growth. Additionally, current high prices for some competing fuels have made gas the more attractive alternative. Low gas prices could decrease the scrutiny that regulators apply to utilities’ requests for gas supply reimbursement or for higher distribution rates.
Of course, economic, natural, political, and geopolitical events could derail the natural gas price and volume forecasts. The slowdown in world economic growth and the strengthening of the US dollar from the summer of 2008 through early 2009, for example, led to oil prices falling from their record highs. Continued relatively slow growth in both the US and global economies could continue to curb gas demand growth. Shale development could introduce large quantities of gas at points much closer to Northeastern end users than the Rockies or the Gulf. Additionally, new pipelines stretching from the Rocky Mountains eastward could reduce price volatility in the Northeast, putting a limited amount of downward pressure on prices. However, on May 26, 2011, the general partner of the Rockies Express Pipeline said that the flow could be reversed in the future to bring Marcellus Shale gas to other parts of the country.
Increasing US LNG liquefaction capacity may lead to more LNG exports, adding new demand to the US markets. We believe that starting in 2016–2017, enough export capability could come on line to put upward pressure on US natural gas prices. Faster-than-expected economic growth could cause natural gas demand to drain some of the gas in storage, leading to an environment that could favor higher prices. The federal government could limit or discourage investment in US gas drilling through measures that would raise the cost of drilling in the US, making LNG and Canadian pipeline imports more attractive. Possible tensions between the US and oil-producing nations could lead to higher oil prices, which may also cause upward pressure on natural gas prices: end users with the capability to switch fuels could increase the demand for gas if it is relatively less expensive than oil. Likewise, a significant increase in coal prices could also put upward pressure on natural gas prices, as electric generators might favor burning gas in combined-cycle plants over burning coal in smaller, less efficient coal plants.

14 NATURAL GAS DISTRIBUTION / JULY 2014 INDUSTRY SURVEYS
INDUSTRY PROFILE
A regulated industry confronts volatile prices
Several kinds of operations are included in natural gas distribution utilities: regulated, investor-owned companies; municipal gas distribution systems owned by cities and counties; and special utility districts. This Survey covers investor-owned gas distribution companies only; it does not cover interstate pipelines or natural gas production companies, nor does it cover any issues related specifically to municipally-owned gas distribution utilities.
According to the Energy Information Administration (EIA), a statistical agency within the US Department of Energy (DOE), local distribution companies (LDCs) served 72.2 million customers in 2012 (latest data available), up only slightly from 71.4 million customers in 2011. Of this total, 66.6 million were residential accounts using gas mostly for home and water heating and cooking. The remaining customers were commercial (5.4 million), industrial (0.2 million), and power generators. (See the “How the Industry Operates” section of this Survey for details.)
A series of regulatory reforms from 1978 (when regulations that set natural gas prices at the wellhead were first loosened) to 2005 (when the repeal of the Public Utilities Holding Company Act (PUHCA), dropped federal restrictions on utility mergers) have created a vastly different operating environment than that which prevailed 35 years ago. Natural gas prices are generally higher and more volatile, energy markets are more competitive, and corporate mergers have created huge, diversified energy companies with trading capabilities across several different energy sources. These developments have generated new risks—as well as new potential rewards—for gas distribution utilities.
Responding to this environment over the past decades, previously independent gas utilities have combined with other regulated utilities, as well as with new, unregulated energy-related businesses, to manage these new risks and profit from new opportunities. As a result, today’s LDCs are usually part of a holding company that operates several different businesses. In some instances, LDC operations are the holding company’s primary business. Secondary operations may include wholesale gas marketing, unregulated power generation, oil and gas exploration and production (E&P), interstate pipelines and storage, or even non–energy-related businesses such as timber or containerized shipping. In many other cases, LDCs are relatively small parts of large multi-utility or multi-industry companies.
INDUSTRY TRENDS
There are several important trends in US energy markets that are having a powerful influence on today’s natural gas distributors. Due to the combination of rising gas demand, a lack of domestic production growth, US natural gas prices were among the highest and most volatile in the world. On occasion, however, local events overseas, such as the shutdown of nuclear plants in Japan on more than one occasion and its using natural gas–fired plants to compensate, can lead to even higher prices there. US gas demand had been increasingly met by imports, and production growth is helping to minimize the need for imports of gas. Additionally, higher prices overseas could lead to fewer LNG imports and potentially the export of gas.
A trend among state regulators—to “unbundle” an LDC’s supply function from its delivery function and thereby introduce retail competition into the supply of natural gas—has generated little interest in serving residential customers. Competitive suppliers are able to make substantially more money serving large commercial and industrial customers. However, there have been a few recent signs that suppliers are beginning to come back to the New Jersey residential market after a long absence. At the same time, LDCs are likely to remain rate-regulated businesses, with limited opportunities for growth within their service areas. Many LDCs have taken advantage of industry deregulation to acquire other kinds of businesses in hopes that diversification will drive stronger profit growth.

INDUSTRY SURVEYS NATURAL GAS DISTRIBUTION / JULY 2014 15
NATURAL GAS PRICES HIGHER AND MORE VOLATILE
There have been substantial changes in natural gas industry in recent decades. Since regulatory reforms to the long-distance pipeline industry began in 1984, market forces have created a much more efficient supply system than existed previously. In the initial years of pipeline deregulation, increased efficiencies reduced transportation charges and inflation-adjusted gas prices. Lower and more transparent market prices fueled demand growth, while the elimination of structural constraints allowed natural gas supplies to be more fully developed, thus reducing levels of untapped capacity. Demand expanded to meet the limits of available supply.
Long-term forecasts for slowly increasing demand, growing production from more expensive wells, and steady domestic production are contributing to higher natural gas prices. Increasing summertime usage by power generators had reduced or eliminated storage additions during the summer months; this, combined with constrained natural gas pipeline and storage capacity in certain regions, has led to much more volatile natural gas prices.
This phenomenon has complicated the short-term operations and long-term investment planning for the entire natural gas industry, including regulated LDCs. Since December 2000, when cold weather blanketed the eastern United States and exhausted available gas supplies in some areas, natural gas prices have become noticeably more volatile; prices surged again to near-record levels during two subsequent winters. From 2000 until 2009, when prices slipped briefly below the $2 mark per million British thermal units (MMBtu), natural gas prices have been sustained throughout the year at higher levels than had been experienced in the past. However, peak fall storage levels have been climbing steadily higher as new storage caverns are built. Record storage levels in the past three years have had a dampening effect on natural gas prices. Despite this development, the increasing costs of getting gas out of the ground appear to be keeping average gas prices in the $3.00–$4.00 per MMBtu range.
Price spikes Since 2000, US natural gas prices have experienced severe spikes caused by cold winter weather, as well as one caused by hurricane damage to offshore production platforms and a spike that began toward the end of the 2008 heating season and culminated with an unusual mid-summer peak. In 2014, an explosion and fire resulted to a temporary supply shortage and caused the price increase.
Cold weather spikes early in the 2000s. In December 2000, cold weather blanketed demand centers in the eastern and Midwestern United States, causing demand to spike and gas inventories to decline. By the end of that month, gas in storage was 10% less than the previous record low recorded in 1976. After averaging what was (at the time) an outstandingly high price of $4.50 per MMBtu in early November 2000, natural gas for delivery at the Henry Hub (the national benchmark) in Louisiana more than doubled in December, reaching a then-record $10.49 per MMBtu on the New York Mercantile Exchange (NYMEX) on December 21.
Prices for gas delivered at the city gate (which is where LDCs take delivery from interstate pipelines) rose much more. With all available gas being committed to the frozen North, there was precious little to send to other demand centers. On December 11, 2000, the price for natural gas delivered to the southern California border reached a previously unimaginable $68 per MMBtu. At the time, the Energy Information Administration (EIA), a statistical agency within the US Department of Energy (DOE), estimated that the average residential heating bill would rise by 70% for the winter—the biggest season-to-season gain since 1975.
After a relatively mild winter in 2001–2002, another spike occurred when a cold snap hit in February 2003, driving the Henry Hub spot price on February 25 to $18.48 per MMBtu—nearly twice the level in 2000. However, prices dropped back to less than $6.00 per MMBtu the following week. Later that year, a blast of cold weather in December 2003 drove futures prices on the NYMEX up by 50% in two weeks, even though storage levels were above their five-year average and demand was running well short of peak levels. More cold air in the winter of 2003–2004 pushed futures prices to $8.75 per MMBtu in February 2004, while gas delivered to New York City reached $40 per MMBtu.
16 NATURAL GAS DISTRIBUTION / JULY 2014 INDUSTRY SURVEYS
Hurricane-related spike in 2005. A sharp spike in prices occurred in September 2005, when two massive hurricanes, Katrina and Rita, struck a direct blow to the Gulf of Mexico’s oil and gas industry over a four-week period beginning in late August. Together, the storms destroyed 115 offshore production platforms and damaged 52 other platforms and 183 pipelines. Damage was so severe that half of the Gulf’s output, which provides about 25% of the US gas supply, was still out of operation two months later. The loss of supply drove gas futures prices above their previous record, set in December 2000, to $15.38 per MMBtu in December 2005.
Oil price spike. Another longer-lasting price spike occurred initially in concert with record high oil prices, with prices starting their spike upwards after a short-term low of $5.30 per MMBtu (Henry Hub) on September 4, 2007. However, the upward run of prices paused during the last two months of 2007 in the $7.00 range. From the start of 2008 until the market peak of $13.31 per MMBtu on July 2, 2008, gas prices rose dizzyingly fast, even though inventory levels were only 3% below their five-year average. (In fact, inventory levels were likely lower than the average as a direct result of the high gas prices.) Following the July peak, natural gas prices plunged even faster than they went up and faster than oil prices fell, reaching a low of $1.83 per MMBtu by September 4, 2009.
Cold weather spike in 2010. In early 2010, prices hit a high of $7.51 per MMBtu (Henry Hub) on January 7 due to cold weather, before generally retreating into a range between $3.00 and $5.00 per MMBtu.
Fire-related spike. In April 2014, Williams Company’s natural gas processing plant in Opal, Wyoming exploded and caught on fire. A day after the dramatic blast, gas at the Opal Hub rose six cents to $4.63 per MMBtu. The Opal processing plant has a capacity of 1.5 Bcf/day, about 2% of US daily gas supply of some 70 Bcf/d. The explosion took place at a time of weak demand, and hence the price hike was temporary and did not have a lasting impact.
What do these price spikes mean? These price spikes made national headlines and caused considerable anxiety among regulators, politicians, and LDCs, and spawned at least one Senate committee hearing. Were suppliers gouging consumers? Had speculators driven up prices unnecessarily? Was there a gas crisis? The Commodity Futures Trading Commission, a government agency, investigated some of the spikes and found no evidence of market manipulation. Another investigation in the wake of the hurricanes had similar findings. However, a congressional committee investigating high energy prices in the summer of 2008 heard testimony that blamed the 2008 oil price spike on foreign currency changes and to substantially increased participation of speculative funds in the oil markets.
High gas prices are an area of concern for gas utilities—even though their earnings are not tied directly to gas prices in the way that those of the exploration and production (E&P) companies are—because they spur customers to conserve energy or search for other, cheaper sources of energy. Higher gas prices also invite closer regulatory scrutiny of gas purchases that, in hindsight, may be occasionally difficult to justify. A study on price volatility released in 2003 by the American Gas Foundation, an industry research group, said that volatility “has become the most significant issue facing the natural gas industry and its companies.”
WILL THE SUPPLY/DEMAND BALANCE IMPROVE IN THE FUTURE?
In the recent past, a supply/demand imbalance appeared to be building, with demand exceeding production and availability of Canadian pipeline imports being called into question. This led to an expansion of LNG capacity that would allow the US to receive overseas imports. However, new demand and production forecasts from the EIA suggest that there is plentiful supply and raise the question: how much gas will be exported? According to EIA forecasts, all of the total 2040 consumption, 29.7 trillion cubic feet (Tcf), will be met by gas produced in the US. In addition, the EIA expects the US to export gas via pipelines and LNG (3.6 Tcf).
In 2013, the EIA predicted that 93.3% (24.1 Tcf) of total consumption (25.3 Tcf) would be produced in the US (the projection was satisfied by actual energy produced in 2013, as discussed in the “Current Environment” section of this Survey). LNG imports (0.1 Tcf) are expected to account for only 0.7%. S&P

INDUSTRY SURVEYS NATURAL GAS DISTRIBUTION / JULY 2014 17
Capital IQ (S&P) thinks that there are ample and growing supplies of natural gas and, if supplies continue to grow, then the possibility of the US becoming a natural gas exporter could become reality.
Tighter supply/demand balance in the 2000s… Although the spikes in prices alarmed gas consumers, they were all relatively short-lived. More worrisome, however, was a parallel development of sustained increases in average annual gas prices occurring for most of the past decade. Between 2000 and 2010, average US natural gas prices rose in every year except 2002, 2006, and 2009.
Behind the previous rise was a fundamental tightening of the gas supply/demand balance. For the past several years, natural gas production in the US has been stagnant—due, in large part, to declining output from the nation’s largest and cheapest gas fields, and producers’ growing reluctance to invest in expensive new production.
During 1998 and 1999, slumping global demand in the wake of the Asian economic meltdown in 1997 depressed oil and gas prices. The losses suffered by many large producers from the drop in prices left them extremely cautious about making new investments to expand production. The fact that they were becoming increasingly reliant on gas produced from risky and more expensive, deepwater wells, each of which cost hundreds of millions of dollars to drill, only added to the caution.
Moreover, through 2008 the average rig count had nearly doubled since 2000, indicating that newer wells are producing at only a fraction of the rate for older wells. Adding to this, the relatively modest declines in 2009 total demand led to a dramatic drop in rig count in summer 2009. However, by year-end 2010, North American gas rig counts rebounded to 64% of average 2008 levels, 12% higher than at year-end 2009, as production started to increase, helped by more widespread use of new drilling techniques. However, North American gas rig counts are declining, with the average count for 2011 dropping 11% from 2010 and that for 2012 sliding a steep 43% from 2011. As of January 3, 2014, North American gas rig counts seemed to be stabilizing. Despite the lower gas rig counts, the EIA expects dry gas production to increase by 1.6% in 2013 and 1.3% in 2014, according to its December 10, 2013, Short-Term Energy Outlook (STEO). Production now is increasing largely due to associated gas being produced from oil wells. We think continued development of oil wells will lead to more associated gas being produced and think gas production could increase more than the EIA expects.
…but domestic supplies are growing quickly Despite low storage withdrawals during the winter of 2013–2014, which plummeted to the lowest levels in over a decade due to spike in demand in the residential and commercial sectors, natural gas storage has started to rise in the past several weeks. According to EIA, gross withdrawals of natural gas in the Lower 48 states increased by 1.6% in March, compared with the previous month, with most of the country’s regions making progress and recovering from freeze-offs that started in April. Shale gas provides the largest source of growth in US natural gas supply, resulting in a 56% increase in total natural gas production from 2012 to 2040 in the AEO2014 Reference case.
According to the EIA, the Lower 48 states and Gulf of Mexico produced a monthly record 67 billion cubic feet per day (Bcf/d) of dry gas in July 2013. In June 2, 2012, an article in The Economist, stated that the share of shale gas in overall US gas production has risen from only 4% in 2005 to 24%. The EIA reports that shale gas accounted for 39% of all dry gas produced in 2012. Further, between 2005 and 2010, the shale gas industry in the US grew at a staggering 45% per year. The production of natural gas from shale rock has been made possible through the use of a technology known as hydraulic fracturing (or fracking), whereby the shale rock is subjected to pressure with water and chemicals. A number of players have resorted to fracking to produce gas from modestly productive oil shale formations.
With this trend picking up, the natural gas supply in the US is growing at a solid rate, leading to a domestic glut and a decline in LNG imports. High production and supply, coupled with weak demand due to mild winter weather, have led to a steep fall in natural gas prices. As of month-end January 2012, natural gas spot prices were hovering near a decade low of $2.50 per thousand cubic feet (Mcf), from which they fell further to $1.84 per Mcf in the second half of April. In June 2012, prices, though slightly higher, remained

18 NATURAL GAS DISTRIBUTION / JULY 2014 INDUSTRY SURVEYS
at a low level of around $2.32 per Mcf, from which they rose to $3.44 at the end of 2012. In April 2013, the prices reached a high of $4.38 per Mcf, before falling to $3.27 in August 2013, then hovering in the upper $3 range until December 2013 when a cold spell across portions of the US drove prices into the low to mid–$4 range. Volatility in natural gas spot prices has continued in 2014, from $3.95 per MMBtu on January 10, to a high of $8.15 per MMBtu on February 27, and then bounced back to $7.98 per MMBtu on March 4. EIA expects that the Henry Hub natural gas spot price, which averaged $3.73 per MMBtu in 2013, will average $4.44 in 2014 and $4.11 per MMBtu in 2015.
Higher prices and greater volatility have brought increased attention to risk management techniques that can help prevent sudden and temporary natural gas price spikes from raising residential heating bills. LDCs can sign long-term (12 months or longer) supply contracts and use futures contracts as a financial hedge. When prices are much higher than now, LDCs are wary of signing longer-term contracts, lest prices move lower and regulators rule such contracts imprudent. This has happened in the past. After the relatively mild winter of 2001–2002, which followed the record high prices reached the previous winter, many gas utilities were forced to explain why they had hedged their fuel cost at higher prices.
Substantial amounts of associated gas is being flared. Gas flaring is a process in which natural gas that is released from an oil well is burned off because it cannot be collected and transported economically. Flaring was extremely common in the oil industry for decades, but in the past few decades, efforts have been made to capture natural gas from oil wells and sell it in the market. However, in new oil fields where no economically feasible infrastructure exists to capture the released gas, it is burned to reduce atmospheric damage. With increasing well density, there is also increasing likelihood that the gas would eventually be captured.
According to Ceres, a coalition of investors and advocacy groups that promotes sustainability leadership, gas flaring has increased considerably because of low natural gas prices, the substantial time required to build the pipeline network, the shale gas boom in the US, and in an effort to prevent a dangerous buildup of methane at a drilling site. Burning this by-product could be profitable if there were adequate infrastructures to capture and sell the natural gas that comes up with oil. According to Reuters, North Dakota’s Bakken shale field flared nearly a third of the natural gas drilled to burn off into the air. This amounts to a loss in revenue of around $100 million per month due to flaring.
Although oil production continues to remain a lucrative business versus natural gas, natural gas production is expected to double by 2025, leading to an increase in flaring, according to projections by state officials in North Dakota.
Gas demand from power generators rising Demand for gas from electric power generators has increased since the mid-1990s, as environmental regulations and high electricity prices encouraged the development of new power-generation capacity fueled by natural gas. According to EIA data, the amount of gas used to generate electricity in 2012 had risen by 125% since 1997, when the DOE first started tracking this statistic, or a 5.5% compound annual growth rate (CAGR).
The rise in gas-fired generation capacity has not only kept the overall demand for gas from falling dramatically, thus tightening the supply/demand balance, but has also made demand more volatile. Much of the gas-fired generation capacity that was built is “peaking” capacity—used only for short periods of time when electric power demand is highest. These plants, which are cheaper and faster to build and more responsive to demand changes than coal-fired or nuclear power plants, are designed to be started and stopped on very short notice, thereby producing sudden increases and decreases in gas consumption.
Natural gas use by generators increased 7.4% in 2010 due to cold weather and relatively low gas prices that made it more advantageous for power producers to run natural gas plants rather than some of their lower-efficiency coal plants. However, in 2011, the consumption of natural gas by electric power consumers increased at a slower 2.5%. In 2012, gas used for electric power generation increased 20.6% compared with 2011. In its May 2014 Annual Energy Outlook 2014 (AEO2014), the EIA said that it expected consumption of natural gas in the electric power sector to grow by about two Tcf and account for 33% of the increase in total natural gas consumption by 2040. The EIA forecast is due to a much milder summer in 2013 combined with slightly higher natural gas prices. According to the National Weather Service’s Climate

INDUSTRY SURVEYS NATURAL GAS DISTRIBUTION / JULY 2014 19
Prediction Center, in the 2013 summer season (April to August), cooling degree days declined 10.3% compared with 2012, but were still 10.4% higher than normal. S&P considers that the amount of gas used for power production is likely to decline more than estimated by the EIA in 2013, based on the 15.6% decline through September 2013 and summer weather that was cooler than last year. However, we expect gas usage by generators to rise over time, in part due to programs that encourage the use of renewable fuel.
Demand forecasts higher in 2014 versus 2013 In the AEO2014 Early Release, the EIA forecast US natural gas consumption growth as driven by electric power, industrial, and transportation use at 11.0%, 11.2%, and 1.7%, respectively. Projected electric power usage of natural gas increased from 9.3 Tcf in 2012 to 11.2 Tcf in 2040, with growth attributable to the retirement of 50 gigawatts of coal-fired capacity by 2021. It expected industrial demand to grow to 30.2 quadrillion Btu in 2040 (1.5 quadrillion Btu, or 5% higher than the Annual Energy Outlook 2013 (AEO2013) Reference case).
EIA’s residential forecast expects a rise from 25.6 Tcf in 2012 to 31.6 Tcf in 2040 (about 2.1 Tcf higher than in the AEO2013 Reference case). The EIA forecasts commercial demand on the average of roughly around 0.7% per year from 2012 to 2040, similar to the AEO2013 Reference case. Due to the higher level of industrial shipments, industrial demand forecast increased from 8.7 quadrillion Btu in 2012 to 10.6 quadrillion Btu in EIA’s AEO2014, compared with 9.8 quadrillion Btu in 2025 in its AEO2013. In its AEO2013, the EIA raised its forecast of electric power usage of natural gas to a range of 8.1 Tcf to 8.3 Tcf between 2012 and 2023, followed by a steady rise to 9.4 Tcf in 2035 and 9.5 Tcf in 2040—a 6% increase from its 2012 forecast. It expects annual industrial demand for natural gas to rise slowly to 7.8 Tcf in 2022, remain flat until 2032, then rise again to 7.9 Tcf in 2040.
The EIA lowered its long-term demand forecast for residential and kept its commercial consumption forecast. The EIA now sees residential demand declining steadily from 4.8 Tcf in 2013 to 4.2 Tcf in 2035 and 4.1 Tcf in 2040. Commercial demand would rise slowly from 3.3 Tcf in 2013 to 3.5 Tcf in 2035 and 3.6 Tcf in 2040.
Demand for natural gas as a transportation fuel is forecasted to increase from 0.05 Tcf in 2013 to 1.0 Tcf in 2040. Due to higher electric power demand and relatively steadily increasing demand in areas other than residential, total end-use demand is now expected to rise steadily from 23.4 Tcf in 2012 to 26.2 Tcf in 2035 and 26.9 Tcf in 2040. Total consumption is forecast to rise to 29.5 Tcf in 2040.
Chart H03 CHANGES IN NATURAL GAS CONSUMPTION FORRECASTS
0
1
2
3
4
5
6
7
8
9
10
2010 2015 2020 2025 2030 2035 2040
Source: US Energy Information Administration.
CHANGES IN NATURAL GAS CONSUMPTION FORECASTS(Trillions of cubic feet)
2013 CONSUMPTION FORECAST
-0.60
-0.45
-0.30
-0.15
0.00
0.15
0.30
0.45
0.60
0.75
0.90
2010 2015 2020 2025 2030 2035
Residential Commercial Industrial Electric Power Transportation
CHANGE FROM 2012 FORECAST

20 NATURAL GAS DISTRIBUTION / JULY 2014 INDUSTRY SURVEYS
Is production set to start rising… The EIA also made a dramatic change to its long-term domestic dry gas production forecasts. In its Annual Energy Outlook 2008 (AEO2008), it predicted that production would rise gradually from 19.0 Tcf in 2007, reaching a plateau of 20.0 Tcf in 2021 and 2022, before gradually declining to 19.4 Tcf (85.5% of forecast total consumption) in 2030. In its AEO2013, however, the EIA expected a steady rise in dry gas production from 24.1 Tcf in 2012 to 31.3 Tcf (109% of forecast total consumption) in 2035 and 33.1 Tcf (112% of forecast total consumption) in 2040. In the AEO2014 Early Release report, the natural dry gas production (including supplemental gas) forecast for 2011, 2012, 2025 (AEO2014), 2025 (AEO2013), 2040 (AEO2014), and 2040 (AEO2013) showed 22.61 Tcf, 24.12 Tcf, 31.93 Tcf, 28.65 Tcf, 37.61 Tcf, and 33.21 Tcf, respectively. Meanwhile, forecasts for consumption in 2011, 2012, 2025 (AEO2014), 2025 (AEO2013), 2040 (AEO2014), and 2040 (AEO2013) showed 24.38 Tcf, 25.64 Tcf, 28.35 Tcf, 26.87 Tcf, 31.63 Tcf, and 29.54 Tcf, respectively.
S&P supposes that the increased shale gas discoveries, tight oil industry performance, and associated gas production estimates are responsible for much of the increase in total production estimates. This dramatic turn of events means that the US will have excess natural gas supplies starting as early as 2020, though it forecasts gas going to storage every year.
…and imports to turn into exports? US natural gas utilities had been relying increasingly on imported natural gas to meet growth in demand, a trend that is losing momentum. Since the early 1970s, when long-term growth in US natural gas production ended, imports—mostly from Canada, but also in the form of liquefied natural gas (LNG) from Africa and the Caribbean—have increased steadily, both in overall terms and as a percentage of US supply, until 2007. A combination of a weak economy, high storage levels, and increasing production led net imports to fall quickly to 11% of total consumption by 2010. In 2011, net imports fell even further, to 8% of total consumption. In 2012, imports fell to 6% of total consumption.
In its AEO2008, the EIA estimated that net imported natural gas would represent about 16.9% of US gas consumption in 2009, but shrink to 14.0% by 2030. However, in the AEO2010 forecast, the EIA expected net imports to fall to 10.9% of total consumption by 2014 and then rising temporarily to 11.7% of consumption by 2017, before continuing its fall to 5.9% of total consumption by 2035. In its AEO2011, the EIA sees net imports falling from 2.7 Tcf in 2010 to 0.2 Tcf in 2035, or just 0.5% of total consumption. In an even more dramatic change, in the AEO2013, net imports fall to near zero Tcf and the US would become a net exporter by 2020. The net exports are expected to increase steadily from 0.1 Tcf in 2020 to 2.1 Tcf in 2030 and 3.6 Tcf in 2040. The EIA expects the US to export LNG starting in 2016.
With projected strong growth in domestic crude oil and natural gas production, the use of imported fuels in the US will fall drastically. In EIA’s AEO2014 Reference case, US domestic energy production is projected to increase from 79.1 quadrillion British thermal unit (Btu) in 2012 to 102.1 quadrillion Btu in 2040, and net use of imported energy sources, which was 30% in 2005, was projected to fall from 16% of total consumption in 2012 to 4% in 2040. In the AEO2013 Reference case, domestic energy production reached 98.5 quadrillion Btu, and energy imports are projected to decline as a percentage of consumption to 9% in 2040. The larger increase in domestic energy production in the AEO2014 is primarily a consequence of a higher projected production of natural gas and biomass/other renewables. S&P sees that this trend will continue as new applications for permits to operate LNG terminals continue to grow.
While oil imports can easily be increased to accommodate rising demand, the same is not true for natural gas. Transportation is a major cost component of natural gas, whereas it is generally incidental to the cost of oil. As a result, the favored source of gas is domestic production. However, transportation of liquefied natural gas has made natural gas transportation far more economical than in the past as LNG is far more compact than natural gas. While this is not as important for imports due to the new resurgence in production, it could become important to US exports of natural gas.

INDUSTRY SURVEYS NATURAL GAS DISTRIBUTION / JULY 2014 21
Canadian import growth slowing During the period from 1985 until 1995, increased net imports from Canada served to fill most of the supply gap left by stagnating US production, rising at a CAGR of 11.7%, versus a CAGR of 1.3% for production. Imports from Canada rose every year from 1987 to 2002 and accounted for about 16% of total US consumption in 2007.
Net imports of Canadian natural gas dropped 1.1% in 2010 and then fell another 14.2% in 2011. In 2012, Canadian gas net imports declined by 8.8%. The falling imports are all likely related to strong production, weak economic conditions, and high storage levels.
Moreover, growth in Canada’s domestic demand is beginning to erode the nation’s export capacity. In 2003, gross natural gas exports to the United States fell by 9.2%, the first annual decline since 1986. Imports rose again in 2004 and in 2005, but did not regain the level reached in 2002. In 2006, imports from Canada declined 3.0% from 2005, as less natural gas was available for export, despite a slight rise in production. In 2007, levels rose 5.4%, approaching the imports seen in 2002.
As was the case in the US, most of Canada’s gas fields are mature. Forecasts show that production growth in Canada will fail to keep pace with higher consumption in the decades ahead, leaving less gas available to export. According to the latest available data from Canada’s National Energy Board (NEB), 68% of Canada’s 2011 natural gas production came from Alberta, down from 74% in 2010 as production from British Columbia increases. There is growing local demand for natural gas in Alberta to power development of the massive oil sands deposits. (In this process, natural gas is used to make steam, which is then used to separate the heavy oil deposits from the sands.) In July 2013, a report on “Canada’s Oil Sands: Opportunities and Challenges to 2015,” the NEB said it expects development of the oil sands to consume between 1.4 Bcf/d and 1.6 Bcf/d by 2015, up from 0.6 Bcf/d in 2003. Total 2011 Canadian natural gas production was 14.5 Bcf/d, or 5.3 Tcf, up 7.3% from 2010. In 2012, marketable natural gas production stood at 14.0 Bcf/d, down about 5% from 2011. Further, the NEB forecasts total natural gas production to decline further to 13.1 Bcf/d in 2014, but increase to 18.0 Bcf/d in 2035. Project developers continue to look for alternative fuels, such as bitumen gasification, according to the NEB.
In its International Energy Outlook 2013, the EIA estimated that Canadian natural gas demand would rise at a CAGR of 1.7% by 2040 from 2010, while Canadian total natural gas production would rise at a CAGR of 1.1%. While Canadians are using more gas, which makes less gas available for export over time, increases in US production are also reducing demand for natural gas from Canada. The AEO2014 Reference case has projected that natural gas will continue to lower its price, hence making it a very attractive fuel for new generating capacity. Projections indicate that by 2040, natural gas will account for 35% of total electricity generation, while coal will account for 32%. EIA further estimates a 3.5 Tcf increase in 2029, remaining at that level through 2040. Pipeline exports of US natural gas to Mexico are estimated to grow by 6% per year, from 0.6 Tcf in 2012 to 3.1 Tcf in 2040, and pipeline exports to Canada by 1.2% per year, from 1.0 Tcf in 2012 to 1.4 Tcf in 2040. Over the same period, US pipeline imports from Canada are expected to fall 30%, from 3.0 Tcf in 2012 to 2.1 Tcf in 2040, as more US demand is met by domestic production.
LNG TERMINALS BEGIN CONVERSIONS FOR EXPORTS
As of May 21, 2014, the Federal Energy Commission (FERC) has approved the building of seven LNG import terminals, but none is under construction at this point due to higher North American production and storage levels, resulting in less need for imported gas. LNG facilities had been able to contract their capacity for decades. This meant that after the facility was built, the owner/operator of the facility would be paid whether or not any LNG was processed back into natural gas. The new EIA forecasts represent a major shift in its outlook, in our view, and if the economy has a strong recovery, the new forecasts might have to be revised to incorporate higher-than-expected economic activity.
With older forecasts showing that Canadian exports were unlikely to meet growing US demand for gas, many companies determined that they could meet the demand imbalance by increasing imports of LNG by tanker. Many companies—ranging from holding companies that own LDCs to energy giants—were vying to

22 NATURAL GAS DISTRIBUTION / JULY 2014 INDUSTRY SURVEYS
take part in the growing LNG import industry. So far, most LNG plants that have been built in North America have multi-decade contracts for a majority of the output from the plants.
Imports increased 29.0% to 452 Bcf in 2009, but in 2010, imports dropped by 4.6% to 431 Bcf, but were still 23.0% higher than in 2008. The drop in imports continued at an even steeper 19.0% in 2011 to 349
Bcf; the slide escalated further in 2012, with LNG imports falling by a drastic 49.9% to 175 Bcf from 349 Bcf in 2011. The trend continued through September 2013, with imports at 86 Bcf, down 36% from 133 Bcf in the year-earlier period. According to EIA’s release on May 28, 2014, US natural gas net imports fell by 14% to 1,311 Bcf in 2013 (the lowest since 1989). Total imports showed a decrease of 8% to 2,883 Bcf in 2013 from the previous year’s level, with LNG imports recorded at a 45% decrease to 97 Bcf.
Although global liquefaction capacity has increased considerably since 2005—as the result of capacity additions in Egypt, Trinidad and Tobago, Nigeria, Qatar, and Yemen, among other countries—maintenance delays and lack of available feedstock gas caused LNG production to grow at a lower rate, according to the EIA. In recent years, there has also been strong demand for LNG in other countries, including Spain, France, Belgium, and the United Kingdom. In 2008, for example, LNG traders with options to deliver to multiple destinations found higher prices and more attractive markets in Europe and Asia.
The EIA had expected that limited natural gas storage in those countries should allow the US to attract cargoes during the storage injection season (typically April through September) and that new liquefaction capacity may only have the opportunity to go to the US. Several terminals in the US have applied for re-export permits, which would allow the facilities to essentially act as LNG storage during periods of low demand overseas and re-export the cargoes received in months when prices overseas are higher. The EIA forecasts that LNG imports to the United States will remain very low until 2015, after which LNG begins to be exported, rising to 1.5 Tcf exported in 2030, where it remains steady through 2040, according to its AEO2013.
According to a May 19, 2014 Business Wire report, a number of new liquefaction terminals are being levied following the success of shale gas production in the North American markets, led by companies in the
Table B04 North American LNG terminals
NORTH AMERICAN LNG EXPORT TERMINALSCAPACITY SUBTOTAL
UNDER CONSTRUCTION LOCATION (BCF/DAY) (BCF/DAY)
Cheniere/Sabine Pass LNG Sabine, LA 2.76 2.76
PROPOSED TO FERC
Southern Union/Trunkline LNG Lake Charles, LA 2.20Cheniere/Corpus Christi LNG Corpus Christi, TX 2.10ExxonMobil – Golden Pass Sabine Pass, TX 2.10Freeport LNG Dev/Freeport LNG
Expansion/FLNG Liquefaction Freeport, TX 1.80Sempra/Cameron LNG Hackberry, LA 1.70Gulf LNG Liquefaction Pascagoula, MS 1.50Sabine Pass Liquefaction Sabine Pass; LA 1.40Excelerate Liquefaction Lavaca Bay, TX 1.38Oregon LNG Astoria, OR 1.25Magnolia LNG Lake Charles, LA 1.07CE FLNG Plaquemines Parish, LA 1.07Jordan Cove Energy Project Coos Bay, OR 0.90Dominion/Cove Point LNG Cove Point, MD 0.82Southern LNG Company Elba Island, GA 0.35
ALL PROPOSED - USA 19.64
PROPOSED – CANADA
LNG Canada Kitimat, BC 3.23Apache Canada Ltd. Kitimat, BC 1.28BC LNG Export Cooperative Douglas Island, BC 0.23
ALL PROPOSED - CANADA 4.74ALL PROPOSED - NORTH AMERICA 24.38
POTENTIAL EXPORT S ITES IDENTIFIED BY PROJECT SPONSORS
US SITES
Main Pass/Freeport-McMoran Gulf of Mexico 3.22Eos LNG/Barca LNG Brow nsville, TX 3.20Gulf Coast LNG Export Brow nsville, TX 2.80Delfin LNG Gulf of Mexico 1.80Pangea LNG North America Ingleside, TX 1.09Annova LNG Brow nsville, TX 0.94Venture Global Cameron Parish, LA 0.67SCT&E LNG Cameron Parish, LA 0.54Louisiana LNG Plaquemines Parish, LA 0.28Texas LNG Brow nsville, TX 0.27Gasfin Development Cameron Parish, LA 0.20WesPac/Gulfgate Terminal Port Arthur, TX 0.20Waller LNG Services Cameron Parish, LA 0.16
ALL POTENTIAL - USA 15.37
CANADIAN SITES
Canada Stew art Energy Group Stew art, BC 4.10ExxonMobil/Imperial Prince Rupert, BC 4.00Aurora LNG Prince Rupert, BC 3.12BG Group Prince Rupert, BC 2.91Pacif ic Northw est Energy Prince Rupert, BC 2.74Kitsault Energy Kitsault, BC 2.70H-Energy Melford, NS 1.80Pieridae Energy Canada Goldboro, NS 1.40Triton LNG Kitimat/Price Rupert, BC 0.32Woodfibre LNG Export Squamish, BC 0.29
ALL POTENTIAL - CANADA 23.38ALL POTENTIAL - NORTH AMERICA 38.75LNG-Liquefied natural gas. Bcf-Billion cubic feet.Source: Federal Energy Regulatory Commission (FERC).

INDUSTRY SURVEYS NATURAL GAS DISTRIBUTION / JULY 2014 23
US and Canada (17 planned liquefaction terminals, which will add a liquefaction capacity of 154.9 million tons per annum (mtpa) by 2020). This will bring the total LNG exports from North America to 3.4 million tons by 2020. Growth in exports is expected to increase from 2015 with the realization of the Douglas Channel LNG (Canada) and Sabine Pass Liquefaction Plant (US).
US LNG import infrastructure has grown… Dozens of new projects to increase LNG supplies to the US through expanded import infrastructure had been proposed through 2011. As of September 12, 2013, 11 LNG import terminals with a combined send out capacity of 18.5 Bcf/d (6.8 Tcf annually) were operating in the US. In addition, there were three operating terminals in Mexico, with a combined send out capacity of 2.2 Bcf/d (0.8 Tcf annually), and one in Canada with a send out capacity of 1.0 Bcf/d (0.4 Tcf a year). As of May 21, 2014, the FERC had approved plans for seven new import terminals, including one expansion project with a capacity of 2.5 Bcf/d (already under construction).
The MARAD/Coast Guard authorities approved three offshore terminals with a total capacity of 3.6 Bcf/d. (MARAD is the Maritime Administration, which operates as part of the US Department of Transportation.) Mexican and Canadian officials have approved a total of three terminals with a capacity of 2.5 Bcf/d.
…but now we see export capacity being added With idle import capacity, near-record amounts of natural gas in storage, production from various shale plays increasing, and natural gas prices at relatively low levels, several companies have decided to add export capability to existing facilities. Because we think that more companies will add export capability to their existing LNG import facilities, we see the potential for the creation of a glut of export capacity. If natural gas prices eventually rise enough due to gas exports and other factors, even export capacity could potentially sit idle.
Cheniere Energy Inc. is adding export capability to its LNG terminal in Louisiana (operated by Sabine Pass LNG) and has applied to the FERC to add export capability to its Texas terminal (operated by Freeport LNG). The company got approval from the DOE in May 2011. FERC approved Cheniere’s Louisiana export terminal on April 16, 2012, and it was under construction as of May 21, 2014. The company expects exports through these terminals to start in 2017. Once operational, these plants would be the US mainland’s first export plants. North American export capacity would increase by 4.7 Bcf/d.
Companies are seeking approval for 23 (13 US and 10 Canadian) other export terminals. Five of these terminals are located in Louisiana (two in Lake Charles, and one each in Hackberry, Plaquemines Parish, and Sabine Pass), four in Texas (one each in Corpus Christi, Freeport, Sabine Pass, and Lavaca Bay), two in Oregon (Astoria and Coos Bay), one in Maryland (Cove Point), and one in Georgia (Elba Island). Together, they would have a sendout capacity of 18.2 Bcf/d, bringing the total capacity to 20.8 Bcf/d in the US, if all are approved and built. In addition, three LNG terminals, all of them located in British Columbia, have announced plans to build export terminals with a capacity of 4.18 Bcf/d.
Eight more LNG export terminals have been announced, but are not yet seeking formal FERC or MARAD approval. These eight projects, would add an additional 12.84 Bcf/d in export capacity. Four Canadian export terminals in British Columbia and two in Nova Scotia also have been announced as potential new export sites, with export capacity of 13.24 Bcf/d. If all announced potential projects are built, North American export capacity would reach 51.1 Bcf/d (18.7 Tcf—more than two-thirds of actual 2012 natural gas produced in the US).
OTHER NEW SOURCES OF GAS SUPPLY
As LNG’s share of US natural gas imports may change, so too can the composition of domestic onshore gas production. LDCs must consider this fact as they formulate their views on future market conditions and prices. With gas output from traditional oil and gas wells declining, producers are increasing their investment in new, “unconventional” sources of supply: gas found in oil shale, coal beds, and “tight sands” gas—geologic formations that hold low concentrations of gas. These new sources have somewhat different production characteristics than traditional wells, as each well produces lower daily volumes but has a longer lifetime.

24 NATURAL GAS DISTRIBUTION / JULY 2014 INDUSTRY SURVEYS
One shale in particular is worthy of mention. The Marcellus Shale is located in Pennsylvania, West Virginia, New York, and Ohio. One recent estimate by a University of Pennsylvania professor said that the Marcellus Shale could contain more than 500 Tcf of gas, according to an article on Geology.com. Further, the article stated that the use of horizontal drilling and hydraulic fracturing techniques could make about 10%, or 50 Tcf, of that gas accessible. Additionally, the United States Geological Survey said in October 2012 that undiscovered technically recoverable natural gas in the shale is around 206 Tcf, given current technology. However, in its AEO2013, the EIA said that as of January 1, 2011, the US possessed 2,327 Tcf of proved and unproved natural gas resources, 25% (543 Tcf) of which is shale gas.
The 2014 Bureau of Ocean Energy Management (BOEM) “Assessment of Undiscovered Technically Recoverable Oil and Gas Resources of the Atlantic Continental Shelf” update showed an increase of 43% in Atlantic undiscovered oil, and a 20% increase in undiscovered gas. This growth in shale development leads to growth in gas production, prompting the US to transition from being an importer of 1.5 Tcf of natural gas in 2012 to a net exporter of natural gas before 2020, according to the EIA.
Further, the AEO2013 showed that shale gas accounted for 14% of total US gas production in 2009, 23% in 2010, and 30% in 2011. It projects that it will be 42% in 2020, and then slowly grow to 48% by 2030 and 50% by 2040. In addition, the EIA projects that shale gas will be the only source to see significantly increased production over this period. The forecast also calls for onshore non-associated conventional gas production to fall from 16% of total domestic production in 2011 to 6% in 2040.
Even including the new sources, total US dry gas production is expected to increase by an important but still weak average annual rate of 1.2% between 2012 and 2040. This low growth rate has led to calls from a variety of sources—including both energy-producing and energy-consuming groups—for the United States to open up more of the country for E&P. However, we believe that this push will be unsuccessful in the near future due to the record oil spill in the Gulf and the current price environment. Additionally, those calls will likely be made for oil drilling rather than for gas, given the increase in shale gas production. Calls for additional natural gas drilling have quieted with the development of shale drilling.
MAP: RECOVERABLE SHALE GAS RESOURCES
RECOVERABLE SHALE GAS RESOURCES(Trillions of cubic feet)
Source: US Geological Survey.
Denver Basin0.98
Michigan Basin7.48
Anadarko Basin22.82
Permian Basin35.13 Gulf Coast
Basin124.89
Fort Worth Basin26.23
Arkoma Basin26.67
Appalachian Basin88.07
Illinois Basin3.79
TOTAL :388 trillion cubic feet
Alaska North Slope42.01
Paradox Basin11.42

INDUSTRY SURVEYS NATURAL GAS DISTRIBUTION / JULY 2014 25
PIPELINE CAPACITY EXPANSION SLOWING
From 1996 through 2011, interstate pipeline capacity for natural gas expanded by an average of 1,707 miles per year and intrastate pipeline capacity expanded by an average of 378 miles per year, in part to bring gas to the northeastern US, based on EIA data. The average annual cost of these pipelines was $4.2 billion. Some of the new pipelines allow expected LNG imports to move from LNG terminals to major gas pipelines, while others help to move new gas discoveries in the western and mid-continent US supply regions to distributors and end users in the Northeast and on the West Coast. These new pipelines could have helped to reduce city-gate price volatility in the Northeast, but now, shale gas from the Marcellus Shale has reduced the need to transport gas to the Northeast from other areas.
According to data from the EIA, only 368 miles of interstate and 135 miles of intrastate pipelines were completed in 2012; in 2013 (through the end of the third quarter), just 154 interstate and 105 intrastate pipeline miles were completed (latest available data). The pipelines entering service in 2012 cost $1.9 billion and those entering service so far in 2013 cost just $449 million.
The sharp drop off in pipeline projects appears set to continue through 2016. In 2014, only 194 interstate miles and 66 intrastate miles were expected to be completed, partly due to the 500-mile interstate Pony Express pipeline being taken out of gas service to be converted to an oil pipeline. The EIA data show that 408 interstate miles and six intrastate miles are expected to be completed in 2015. As of May 12, 2014, the Northeast Gas Association (NGA), a trade association, summarized 18 planned enhancements in the northeast natural gas pipeline systems, with estimated in-service from the second half of 2014 until 2018.
In 2016, 1,084 interstate miles and 125 intrastate miles are expected to be completed. Announced projects scheduled for 2016 completion include a 400-mile North Dakota and Montana pipeline announced by MDU Resources Group, and a 250-mile pipeline through Ohio, Michigan, and Canada, and a 230-mile Alabama and Georgia pipeline—both announced by Spectra Energy.
FERC approvals are a good indicator of near-term pipeline construction activity and also show a drop off in activity in recent years. New pipeline projects approved by FERC include 2,782 miles of new pipeline in 2007, 2,084 in 2008, 1,133 in 2009, 1,551 in 2010, 305 in 2011, and 189 in 2012. Of the 35 projects that were approved in 2007, only 11 were longer than 100 miles. In 2008, nine projects were approved, of which five were in excess of 100 miles. In 2009, only seven projects were approved, with half of them over 100 miles. There was a slight rebound in 2010, with 19 projects approved, of which five were longer than 100 miles. However, in 2011, of the 14 projects approved, only one was longer than 100 miles; and, in 2012, of the 14 projects approved, none was longer than 100 miles (the longest being 79.3 miles). Shorter projects include smaller new pipeline projects, expansions, extensions, interconnections, and laterals to reach new LNG or storage facilities or other pipelines, as well as compressor additions. There are 10 projects pending before the FERC that include one project of 0.1 miles applied for in 2011, 150 miles of projects in 2012, and one project of 3.2 miles in 2013, as of February 2013 (latest available data).
The FERC said that there were an additional 1,822 miles of pipeline projects “on the horizon” as of February 2013 (latest available data). On June 19, 2014, the FERC authorized Cameron LNG to construct and operate the proposed liquefication project (approximately 21 miles) located in Cameron Parish, Louisiana. The project is expected to be made available within five years. Transcontinental Gas Pipe Line Co., LLC (Transco) also received approval from the FERC on April 25, 2014, to expand a new eight-mile, 36-inch lateral pipeline, expected to be in service by 2017. The most recent major pipeline projects (over 500 miles) are detailed below.
Rockies Express Pipeline. Jointly owned by Kinder Morgan Energy Partners, Sempra Energy, and Conoco Phillips, the Rockies Express Pipeline is a 1,679-mile, 1.8 Bcf/d natural gas pipeline system that runs from Rio Blanco County, Colorado, to Monroe County, Ohio. The Rockies Express–West portion (713 miles) was approved in April 2007 and was placed in service on May 20, 2008. The Rockies Express–East part (638 miles) was approved in May 2008 and entered full service in November 2009, after several weather-related delays. The Entrega (328 miles) segment of the Rockies Express Pipeline was fully operational by February 2007.

26 NATURAL GAS DISTRIBUTION / JULY 2014 INDUSTRY SURVEYS
Mid-Continent Express Pipeline. Jointly owned by Kinder Morgan Energy Partners and Energy Transfer Partners, the Midcontinent Express Pipeline is a 507-mile, 1.5 Bcf/d natural gas pipeline system that runs from the southeast corner of Oklahoma across northeast Texas, northern Louisiana, and central Mississippi into Alabama. The pipeline was approved in July 2008 and entered full service in August 2009.
Bison Pipeline. TransCanada Corp.’s Bison project, with a capacity of 0.5 Bcf/d, will extend 302 miles from Gillette, Wyoming, into North Dakota, where it will connect with the NBPL, which can carry gas to the Midwest. The Bison pipeline, which received FERC approval on April 9, 2010, commenced operations in January 2011.
Florida Gas Transmission Extension Project. Owned by Southern Union’s Panhandle Energy subsidiary, this pipeline expansion project added 483.2 miles of new pipelines, with 365.8 miles built next to the existing pipeline. The new pipe adds about 820,000 MMBtu/d of new capacity and entered service in April 2011.
Ruby Pipeline. This project, owned jointly by El Paso and Global Infrastructure Partners, is a 678-mile, 1.5 Bcf/d natural gas pipeline system that starts at the Opal Hub in Wyoming and terminates at the Malin, Oregon, interconnect near California’s northern border. The FERC application was filed on January 27, 2009, and approved on April 5, 2010. Ruby received FERC permission to begin construction in August and the pipeline was placed in service in July 2011.
Pre-filings with FERC include no major pipelines The number of pipelines slated for expansion has been on a decline this year. According to the May 2014 pre-filings report by the FERC for the 2014 fiscal year, the number of pre-filings for pipeline, storage and LNG capacity expansion in 2014 was down versus 2013. The FERC received only 11 pre-filings—all were commission pre-filings, except for one that was withdrawn on May 5, 2014.
CUSTOMER CHOICE PROGRAMS FALL FLAT
The drive to introduce competition to the utility industry during the 1990s led several states to order their LDCs to “unbundle” (formally separate) their supply function from their distribution function in order to allow other independent suppliers to enter the market and retail competition to develop. The idea was that customers would end up paying less for their natural gas supply if they were allowed to shop among different suppliers for the best price, rather than simply buying from the distribution utility at the utility’s cost. While the idea seemed logical in theory, in many cases it is clear that, at the residential level, retail unbundling has failed to generate the competition and related advantages that regulators expected.
Except for the largest gas consumers—industrial companies and power generators for whom natural gas is a major expense—customer interest in switching suppliers has been disappointingly low. Even more discouraging for the proponents of retail-level gas supply competition, the number of active retail suppliers competing for customers had been shrinking through 2005, rather than expanding as they had expected. However, in 2009 (latest available data), the number of active suppliers increased meaningfully for the third year in a row, seemingly reversing this trend.
Across the US, about 35 million gas customers in 21 states and the District of Columbia—just over half the US total—are able to switch suppliers, but only 14.7% of those eligible for customer choice programs were participating in the programs in 2009, according to the latest available data from the EIA. Just three states—Georgia, Ohio, and New York—now account for 74% of the customers who have switched suppliers.
The number of gas customers buying their gas from a source other than their LDC increased by 327,000 in 2006, 459,000 in 2007, 49,000 in 2008, and 445,000 in 2009 (latest available data). The tepid response to customer choice programs led the EIA to stop publishing data.
COMPANIES CHANGE COURSE
In recent years, several utility companies have changed course on ownership of non-utility businesses. In many cases, these businesses had high capital requirements due to required collateral postings. Some have

INDUSTRY SURVEYS NATURAL GAS DISTRIBUTION / JULY 2014 27
sold these businesses outright, one scaled back its operations while trying to sell, and one placed its business into a joint venture in an effort to reduce risk and refocus the companies on their core equity businesses. In most cases, the companies have used the cash from asset sales for share repurchases and dividend hikes. In some cases, companies have paid down debt, but in others, the business risk of the overall company has dropped, allowing them to increase their debt load.
Merger activity There was very little significant merger and acquisition (M&A) activity among key gas utility companies in 2007, 2008, and 2009. In 2007, some deals took longer than expected to close, while others were cancelled. In addition, companies divested exploration and production (E&P) businesses. In 2008, only two significant transactions took shape. Activity likely slowed due to stock price weakness (companies often use stock as currency in acquisitions) at the same time that companies cut capital spending plans, borrowing costs rose, and access to capital became more difficult.
On October 1, 2008, Sempra Energy completed its purchase of EnergySouth for $510 million in cash. In addition to a small distribution utility in Alabama (93,000 customers), Sempra gained two large, high-cycle underground natural gas storage facilities that, when fully developed, will have capacity of 57 Bcf. At the time of the deal’s closing, only 11.4 Bcf of storage was operational; more came into service during 2010 and the rest was slated for future years.
A $970 million deal in 2007 for the sale of two natural gas utilities owned by Dominion Resources was cancelled in 2008 after resistance from the Federal Trade Commission on antitrust grounds. On July 2, 2008, a private equity fund agreed to purchase the same assets for $910 million. However, regulatory issues forced the sale of one of the utilities to be cancelled. The other sale was completed in February 2010 for $737 million.
Transaction activity picked up slightly in 2010, 2011, and 2012, but fell again in 2013, when no major deals were announced. In 2012, Energy Transfer Equity announced an agreement to buy Southern Union Co., the parent company of Missouri Gas Energy and New England Gas. In 2013, the volume and value of merger deals declined in the first half by about 29%, according to a mid-year report by Deloitte. (For more details, see the “Current Environment” section of this Survey.)
Should gas prices return and remain at high levels, we think that a resumption of industry consolidation could occur. For a utility with no or very small non-utility businesses, we believe that growth through merger savings could be their only viable option to achieve higher-than-industry-average earnings per share (EPS) growth. Recent moves by international owners of US utilities to exit the US have led to several recent deals. There also have been some discussions of spinning off utility businesses from companies whose unregulated E&P businesses now dwarf their utility operations.
Cross-border deals In August 2007, National Grid PLC acquired KeySpan (with 2.6 million gas customers in New York, Massachusetts, and New Hampshire) for $7.3 billion in cash. In September 2008, Spanish firm Iberdrola SA purchased Energy East Corp. (with 1.8 million electricity customers and 900,000 natural gas customers in New York, Maine, and Connecticut) for $4.5 billion. These deals are of particular interest because they may augur similar deals in which large foreign utility companies seek to diversify through the acquisition of US utility businesses. Iberdrola has stated that it viewed the US as one of its best opportunities for growth, but we believe the company is more interested in electric companies than gas, which has led the company to sell the three gas utilities that were acquired in its Energy East acquisition.
In February 2012, Fortis Inc., a distribution utility based in Canada, agreed to acquire CH Energy Group Inc. for around US$1.5 billion. The transaction closed in June 2013. In August 2012, AltaGas, a gas utility serving consumers in Alberta, Nova Scotia, and British Columbia, purchased SEMCO Holding Corp. from Continental Energy Systems LLC for around US$1.14 billion. Also in August 2012, Liberty Energy Utilities purchased Atmos Energy’s regulated natural gas distribution systems in Missouri, Iowa, and Illinois for $124 million. In July 2012, Liberty purchased Granite State Electric Co. and EnergyNorth Natural Gas Inc. from National Grid USA (the US arm of the National Grid Group) for around $290 million.

28 NATURAL GAS DISTRIBUTION / JULY 2014 INDUSTRY SURVEYS
In February 2013, Liberty Energy Utilities Co., a subsidiary of Toronto-based Algonquin Power & Utilities Corp., agreed to purchase New England Gas Co. for $74 million, including $19.5 million to assume debt. The transaction closed in December 2013.
S&P believes that European cross-border deals are not likely in the near future due to a challenging economic environment. However, we believe more international utility acquisitions will be announced in the event of an economic recovery. We also see a longer-term potential for a decline in the value of the US dollar against other currencies if European countries are able to implement austerity measures while maintaining economic health. A strengthening euro may make US utilities cheaper to buy, but earnings from the US purchases would decline over time given continued weakening of the dollar. Foreign acquisitions have the potential to spur domestic consolidation: local companies may combine to avoid becoming takeover targets for larger foreign utilities. The economic strength in Canada has buoyed the strength of the Canadian dollar, which has encouraged some buying of US companies, such as the deals mentioned above.
LDCs slow diversification efforts Because their returns are regulated and their industry mature, natural gas distribution utilities traditionally have had severely limited growth prospects. Historically, earnings for US LDCs have grown with the help of only population growth and rate increases. As a result, share prices have tended to lag shifts in the larger market.
Until the 1990s, there was little that executives of LDC companies could do to raise their growth rates and boost shareholder returns, and investors usually held their shares for current income rather than growth. That changed, however, during the latter half of that decade, when regulatory reforms began allowing LDCs to form holding companies that could invest in other, unrelated businesses offering stronger growth prospects—accompanied by greater risks.
For several years, gas and power utilities embarked on a campaign of often-indiscriminate spending, negotiating mergers, building and buying new unregulated, “merchant energy” power-generation assets, acquiring overseas operations, and establishing (and funding) trading desks, as well as expanding into novel areas such as telecommunications, construction, and even healthcare. This strategy of diversification proved to be far less profitable than originally envisioned, however, forcing many companies to sell or even abandon recently purchased assets in order to reduce their crippling debt loads.
The frenzied corporate realignment of the 1990s came to a halt in 2001, when the bankruptcy of Enron Corp. and the power crisis in California undermined investor confidence in the benefits of asset diversification. During 1998 and 1999, companies announced a total of 18 mergers involving US LDCs; between 2000 and 2004, there were only six.
This wave of activity changed the face of the natural gas industry, but no dominant business model has emerged. Large multi-industry companies or multi-utility companies, such as Dominion Resources, Sempra Energy, Equitable Resources, and MDU Resources Group, own many gas distribution companies. These companies have a broadly diversified asset base, which includes regulated gas and electricity distribution utilities (domestic and foreign), unregulated power generation assets, E&P operations, long-distance pipelines and storage, LNG import terminals, and even construction materials supply. Another group—which includes Nicor Inc., AGL Resources (which has agreed to acquire Nicor), and WGL Holdings Inc.—is more gas-focused, combining regulated gas distribution utilities with long-distance pipelines and unregulated businesses of varying sizes.
In recent years, several companies have exited some of their non-utility businesses in an effort to refocus on their utility operations. We believe these moves indicate a realization among executives that many of these businesses were using capital that could otherwise be redeployed within the companies for growth in the utility businesses or to fund dividends and/or share repurchases.
In April 2010, Questar Corp. announced a move similar to Duke Energy Corp.’s 2007 spin-off of its Field Services unit into Spectra Energy Corp. In July 2010, Questar separated its Questar E&P Company, Questar Gas Management, and Questar Energy Trading units into a separate publicly traded company, but retained its utility business and Wexpro (an E&P company that serves its utility). In July 2013, ONEOK announced

INDUSTRY SURVEYS NATURAL GAS DISTRIBUTION / JULY 2014 29
plans to spin off its utility business into a new publicly traded company called ONE Gas Inc. This action would effectively separate the unregulated businesses from the LDC. On March 14, 2014, Bloomberg reported that Sempra Energy and AGL Resources, Inc. have expressed interest to buy Energen Corp.’s natural gas utility for more than $1 billion, although no official announcement comes yet from both companies. Further, Sempra was also deemed interested in acquiring Alagasco to expand its reach across the state. In January, Dow Jones reported that Energen is trying to sell Alagasco at more than $1 billion.
CAP & TRADE LEGISLATION SIDELINED, EXPORT BILL ON THE OTHER SIDE
In 2010, a proposed piece of legislation—the Clean Energy Jobs and American Power Act, also known as ‘Cap and Trade’—failed to pass at the US House of Representatives.
Among other things, the bill would have established a cap-and-trade system for carbon dioxide and carbon dioxide equivalents. As emissions are produced, emissions source surrenders the allowances equal to its emissions. Coal plants produce large quantities of carbon dioxide; thus, a cap-and-trade system would likely result in a shift away from coal-fired power production toward renewable energy and natural gas–fired power production.
The bill would have provided 85% of allowances at no charge and auctioned the remainder. However, due to the sharp decline in the number of allowances allowed by the bill over the years, S&P believes emission allowance limits would have eventually made it unprofitable to produce electricity from natural gas, use natural gas for manufacturing purposes, and prohibitively expensive to use natural gas for space heating. Passage of such a bill could have thrown the gas industry for a loop. S&P believes problems would have likely started much sooner, if not immediately, as scarcity of allowances would have drastically increased energy prices, in our view.
S&P thinks that the bill’s failure was good for the natural gas industry over the long term. The bill’s passage could have initially benefited gas utilities, as power generators would likely have shifted their fuel to natural gas from coal. However, as the number of available allowances would have continued to decline under provisions within the bill, prices of traded and auctioned credits would have skyrocketed due to competition between use of allowances for natural gas, coal, and industrial purposes, in our view. The increased use of natural gas by power generators would also have likely put upward pressure on natural gas prices.
Over the longer term, increasing and then soaring energy prices would have likely lead to extreme conservation efforts, thus decreasing throughput on natural gas utility distribution systems, in S&P’s opinion. From a commercial standpoint, S&P believes businesses that could not have purchased enough allowances to manufacture their products might have shifted production overseas, especially for goods that would have been exported from the US, further reducing natural gas throughput on distribution systems. Over time, the result would have been much lower demand for natural gas as it becomes much more expensive to use.
On April 30, 2014, the House panel approved a bill that will help fast-track US natural gas exports. The DOE must adhere to a timetable (90 days after the close of public comment periods for each proposal) when deciding whether to approve or deny permit applications from LNG operators to export natural gas. As of that date, the DOE has two-dozen applications under review, which need to be approved or denied within three months after the bill becomes law.
In our view, the export bill will be caught between two opposing sides. It will be beneficial and popular among those who are interested in the new revolution the US is now facing, i.e. being the promising export hub for LNG. On the other hand, publicly owned natural gas distribution companies may see this bill as a threat, considering the cost implication to domestic gas users, while civic and non-government organizations are likely to oppose the bill on the grounds of environmental safety and protection. Moreover, we think the bill will not do a lot to hasten exports to the Ukraine (the infrastructure is not in place yet, and it would have to be price-competitive to make any sense at all). The US has way more proposed LNG export capacity than it can economically make work.

30 NATURAL GAS DISTRIBUTION / JULY 2014 INDUSTRY SURVEYS
On June 2, 2014, the EPA proposed its first guidelines to cut carbon pollution from existing power plants—the Clean Power Plan, which is intended to protect public health. It is expected that by 2030, carbon emission from the power sector will be lowered by 30%, while particle pollution, nitrogen oxides, and sulfur dioxide will be lowered by more than 25%. Moreover, electricity bills are expected to shrink by 8% through increased energy efficiency and reduced demand. In our view, it will take some time before any such rule can be implemented. Until these issues are settled, uncertainty will continue to prevail in business planning, corporate investment decisions, and ownership investment decisions. Regulatory bodies like the EPA are now wary about the environmental effects of the developments in natural gas industry, a trade-off that must be considered along with the economic growth the LNG production could bring in the future.
HOW THE INDUSTRY OPERATES
Natural gas is a colorless, odorless fuel composed primarily of methane and ethane. It burns more cleanly than many other fossil fuels—emitting less carbon dioxide than coal or oil, and little sulfur or particulates—making it one of the most popular sources of energy today. According to estimates by the Energy Information Administration (EIA), part of the US Department of Energy (DOE), natural gas provided about 27.3% of the US net energy supply in 2012, a share that the EIA expects to rise to 27.7% by 2040, following a relatively flat period through 2027.
THE NATURAL GAS SUPPLY CHAIN
The natural gas supply chain comprises three distinct segments: upstream, midstream, and downstream. Parts of the chain include wells, processing plants, pipelines, liquefied natural gas (LNG) facilities, storage facilities, and distribution facilities.
E&P: the upstream segment Exploration and production (E&P) companies search for gas underground and bring it to the surface through wells. The supply of natural gas in the United States comes chiefly from domestic E&P operations. Domestic dry gas production accounted for 94.8%, or 24.3 trillion cubic feet (Tcf), of total US gas supply in 2013, according to the EIA, while net imports via pipeline contributed 4.8%, or 97 billion cubic feet per day (Bcf)—the lowest level since 1998. Net LNG imports made up the remaining 0.7%.
Companies typically move raw gas from underground reservoirs through a series of feeder (gas gathering) pipes to processing plants that remove impurities and natural gas liquids (NGLs—such as propane or butane). The propane and butane can be stored and sold on site or moved through NGL pipelines to other locations. Processing plants then send the almost pure methane gas that results—known as “pipeline gas”—to long-distance transmission pipelines. In some cases, the gas withdrawn from the ground is considered pipeline gas and can be moved directly from gas gathering pipes into pipelines without the need for processing.
Pipelines: the midstream The midstream segment comprises interstate pipeline, or “transmission,” companies, which build and operate pipelines to transport gas from producing regions to demand centers. The Federal Energy Regulatory Commission (FERC), which has jurisdiction over interstate commerce in natural gas, regulates transmission companies. The EIA estimated there were 217,306 miles of interstate pipelines in the Lower 48 states at the end of 2008 (latest available data as of September 2013) and an additional 88,648 miles of intrastate pipelines.
Attached to the pipeline systems are many natural gas storage facilities, which store gas during periods of nonpeak demand in order to be able to maintain supply during peak demand times. As of November 2013 (latest available data), there were 407 active storage facilities with a 2% growth in storage capacity and 4.3 Bcf of working gas capacity, according to the EIA. Working gas capacity is total gas minus base gas capacity. Base gas capacity is an amount of gas needed to maintain adequate pressure in a storage reservoir during the withdraw season.
Although US gas storage capacity is located in 30 states, eight states (Michigan, Illinois, Texas, Pennsylvania, Louisiana, Ohio, California, and West Virginia) account for more than two-thirds of the

INDUSTRY SURVEYS NATURAL GAS DISTRIBUTION / JULY 2014 31
total. Numerous gas storage projects are in the works to accommodate increased gas usage and to improve reliability. The added storage capacity is likely to result in additional gas purchases during off-peak months to refill the storage fields in advance of the winter season, thus helping to smooth seasonal price fluctuations by increasing nonpeak demand and decreasing peak demand.
LNG terminals and ships: another piece of the midstream LNG is simply gas that has been cooled to 260 degrees below zero on the Fahrenheit scale; at this temperature, it condenses into a liquid from a gas. Liquefaction facilities condense the gas in countries that export the gas. Once condensed, the liquid takes up about 1/600 the space of the gas at atmospheric pressure.
Specially made ships transport the LNG from the exporting facility to the importing facility. Small amounts of the liquefied gas stored on the ships boils, returning to a gaseous form. The ship’s propulsion plant or the LNG cooling system on board the ship uses the boiled gas for fuel. At the end of its journey, in most cases, the LNG is transferred to a regasification facility, where the gas is warmed (and thus returned to a gaseous state) and then either stored in storage facilities or put directly into gas pipelines for transportation to other markets. Some ships regasify the LNG on board and transfer the gas directly to pipelines via undersea risers.
In recent years, companies have proposed the construction of numerous LNG terminals (which include regasification facilities). Many proposed for locations outside of the Gulf states have run into local opposition and may not be built. A few are under construction; however, others are not likely to be built in the near future, in our view.
International competition for LNG is strong, with the ships serving the highest-priced markets first. However, most US LNG regasification facilities have long-term contracts that guarantee payment to the facilities’ owners whether the facility is used or not.
LDCs: the downstream segment Local distribution companies (LDCs) occupy the downstream segment of the gas industry, taking gas from interstate pipelines and distributing it to a broad range of customers, including residential, commercial, industrial, and power generation. They perform this service under a monopoly concession and are subject to rate regulation.
Companies sometimes run LDCs as stand-alone operations, but independent LDCs have become increasingly rare in recent years. Following regulatory reforms that eased restrictions on mergers by gas and other utilities, most LDCs are now owned by larger holding companies that also own other businesses, including other regulated gas and electric utilities, as well as unregulated businesses that may or may not be related to energy.
It is important to remember that LDCs perform two related, but distinct, services: the delivery of gas, as well as the procurement and sale of gas to the customer. LDCs deliver gas to customers through pipeline networks they build and maintain, and attempt to earn a profit for providing that service. In addition, they procure gas and sell it to customers at cost, a service for which no profit is earned. In both cases, state officials regulate the rates that LDCs can charge, and they have no guarantee that state regulators will allow them to recover fully the cost of gas sold to customers.
REGULATION: A PART OF DOING BUSINESS
LDCs operate under monopolies that are granted by a state or municipality and cover a particular service area. State utility commissions regulate just about every aspect of an LDC’s activities, including what it can charge for delivery and for gas supply. Often known as public utility commissions (PUCs) or public service commissions (PSCs), state regulators are responsible for ensuring the safe and reliable access to gas on an equitable basis and, in some cases, for promoting competition.
State utility commissions usually consist of a board of three or more members appointed by the state’s governor and confirmed by the legislature. (Some states elect utility commissioners by popular vote.) The commissions often employ a large staff, including attorneys and accountants, to evaluate information filed by utilities regarding potential rate changes and to assist commissioners in making decisions. Utility

32 NATURAL GAS DISTRIBUTION / JULY 2014 INDUSTRY SURVEYS
commissions may regulate one or more natural gas utilities as well as other businesses, such as electric and water utilities, telecommunications providers, and cable television operators.
In addition to setting rates of service, a state utility commission issues regulations covering other important aspects of an LDC’s operations. It oversees environmental performance, monitors the LDC’s operations to ensure that it complies with relevant laws, and enforces universal service obligations. It has authority to approve or deny corporate mergers, the sale of facilities from one party to another, and even such financing activities as bond issues or intracompany fund transfers.
Ratemaking The greatest power that state utility commissions hold over LDCs is the ability to set the rates that LDCs charge for delivery and for gas supply. As a practical matter, the delivery charge is the more complex to set, since it must allow the LDC to earn a profit. Gas supply charges, while not free of controversy, are more an issue of reimbursement, though disputes can and often do arise over whether a gas supply charge was prudently incurred. In 2007, most states created rate frameworks that seek to minimize disagreements and allow customer charges to reflect volatile natural gas prices more closely.
A natural gas utility’s rates for its delivery service are mostly set on a “cost of service” basis; that is, rates are calculated to generate enough revenue for the utility to recover its operating costs and earn a fair return for shareholders. This makes the relationship between a utility and its regulatory commission an important determinant of both its current profitability and its long-term growth prospects.
In general, the ratemaking process begins with a regulated utility’s request for a change in rates when the current rate schedule expires. The process of deciding a utility’s allowed rates is known as a “rate case.” In addition to the change in rates requested, there may be simultaneous negotiations between the company and the commission on any other issues that one or both sides want to address, such as customer complaints, infrastructure investment, environmental issues, or reliability problems.
The first step in the rate case is determining the cost to maintain and operate the distribution system as well as the cost of any needed capital improvements. Companies calculate this amount by totaling their operating and maintenance expenses, asset depreciation, and taxes over a hypothetical period known as a “test year” that has been normalized to eliminate any unusual or one-time incidents. The commission must decide whether to allow each expense item submitted by the LDC. If the commission denies an item, its cost must be borne by the utility’s shareholders. Disputes often arise over whether ratepayers should or should not reimburse a particular cost.
Setting a utility’s rate of return Once the utility’s expenses have been determined, the utility’s management and regulators must then negotiate an appropriate rate of return for the utility, a rate that will provide an adequate incentive for investors to own equity in the LDC and thus ensure it is adequately capitalized to provide acceptable service. Deciding what level of return the company should receive is often the most controversial part of the rate case—and a process that is as much art as it is science.
For investor-owned utilities, the return is usually calculated as the percentage of the utility’s assets used to deliver service that is needed to cover the utility’s cost of capital. Cost of capital is defined as the sum of the cost of debt service, preferred stock dividends, and a fair return for common stockholders. While the cost of debt service and preferred stock dividends is easy to establish, the appropriate return for common stockholders is more difficult to ascertain. Commissions use such methods as comparable company analysis, discounted cash flow, and risk premium analysis (such as the capital asset pricing model) to determine an appropriate return on common equity. In some instances, a utility commission may desire to set a rate of return that is not equivalent to the utility’s cost of capital, as either a reward or punishment for management decisions and operating performance.
It is important to remember that in setting the rate of return, the utility commission does not guarantee that the LDC will actually earn that rate, but instead gives the LDC the opportunity to earn that rate. Achieving

INDUSTRY SURVEYS NATURAL GAS DISTRIBUTION / JULY 2014 33
the allowed rate of return requires sound management and operating skill, and poor decisions can leave the realized rate of return significantly below the allowed rate.
Once the utility’s full revenue requirement (costs, plus a fair return) has been identified, that sum must then be allocated among the different classes of gas consumer: industrial, residential, commercial, and power generators. Industrial rates tend to be the lowest, because industrial customers are high-volume users and are easier to service than residential accounts. Allocations can be controversial, since one customer group may argue that it is being forced to subsidize another.
After it has been determined how much each class of customer will pay in total, the structure of the charges is determined in a process known as “rate design.” Rate designs vary considerably and can include fixed per-customer charges, minimum bills, charges per therm (a unit of heating value), or some combination of these.
Alternatives to cost-of-service ratemaking Cost-of-service ratemaking has several important disadvantages when it comes to the incentives it offers for efficient utility performance. Just determining the actual cost of service is cumbersome, time-consuming, and adversarial, and is complicated by the fact that many investor-owned utilities operate more than one LDC—thus raising issues about what costs should be allocated to what operation. Furthermore, cost-of-service ratemaking provides a strong incentive for a utility to inflate the size of its asset base by so-called gold plating: overinvesting in assets that are either unnecessarily expensive or redundant, because the larger the rate base, the higher the return.
To counter this problem, some states have begun to experiment with incentive-based rates that seek to promote efficiency, either through rewards for the attainment of performance goals or through punishments for the failure to achieve expected standards. Various kinds of performance-based structures exist, each with unique advantages and disadvantages.
Regulatory lag. One of the simplest ways to create more incentives for improved performance is known as “regulatory lag,” or the extension of the minimum time between rate changes. This produces a strong incentive to cut costs, because utilities will keep 100% of any cost savings made during the period; they also would bear 100% of any additional costs incurred.
Price cap. Another kind of incentive-based ratemaking formula is the price cap, in which the charge for distribution is set through a formula that adjusts the previous charge according to inflation (usually based on the consumer price index) and also according to expected gains in productivity. This has the effect of forcing a utility to make productivity gains—because prices already are calculated to reflect them. Further gains, however, would increase the utility’s return, providing a strong incentive to increase productivity beyond the set target. The success of this formula depends on the correct setting of the expected productivity gain factor in determining future prices. A factor set too low would allow the utility to earn above-normal profits, while a factor set too high might prevent it from fully recovering its costs. Price caps are more common outside the United States.
Revenue cap. An alternative to the price cap is the revenue cap, which can take the form of either an absolute revenue cap or a revenue-per-customer cap. With revenues fixed, companies can increase profits only by cutting costs.
Earnings sharing. Another kind of incentive-based rate that has gained popularity in recent years is “earnings sharing.” When regulators determine a utility’s rate of return for a given period, the specified return is actually a target return that the rate schedule is designed to produce.
Because actual events may lead to a different return, regulators may designate an “allowed rate of return” band that includes an acceptable variation from the target. If actual returns fall below that band, the utility may be allowed to petition for a rate change. If returns are above the target band, companies share the “excess” earnings, in part or in whole, with customers in the form of future rebates. This protects the utility from unexpectedly low returns and lets customers benefit from improved efficiency.
Each of these alternatives has potential drawbacks, and studies examining alternative regulatory regimes have found it difficult to determine their overall effects. Because incentive-based rate designs do not offer a

34 NATURAL GAS DISTRIBUTION / JULY 2014 INDUSTRY SURVEYS
clear opportunity to enhance returns and usually entail some risk, some utilities have preferred to remain under traditional regulation.
Helping utilities to encourage efficiency Some states have acknowledged that increasing efficiency in appliances that use natural gas has led to declining consumption of gas per customer over time. As a result, the fixed-cost component of a utility’s expenses has been increasing over time relative to its revenues. Since rates typically are largely tied to utilities’ throughput, utilities have been having a harder time recovering the fixed investments that they make in distribution pipeline and service connections. Therefore, a utility with rates mostly tied to variable usage is averse to helping customers to conserve gas.
As a result, some states have implemented revenue decoupling mechanisms (RDMs) that increase the fixed charges on customers’ bills. In exchange for this concession, utilities that have RDMs in their rates have agreed to invest in programs that may give rebates to customers for installing more efficient, but more expensive appliances, thus encouraging conservation. The higher fixed charges on customers’ bills are designed to allow utilities with this rate mechanism to collect enough for maintenance costs, new connections, and a fair return on fixed plant investment.
WEATHER INFLUENCES EARNINGS
With delivery rates typically tied to the volume of gas delivered, and costs that are mostly fixed, LDCs’ earnings traditionally have been highly sensitive to changes in the weather. Colder-than-normal winter weather has the effect of increasing volume (and therefore, sales), while warmer-than-normal weather can cut volumes significantly, eroding profitability.
In setting rates, regulators assume a particular level of demand and gas distribution volumes. Unusual weather patterns can make this assumption either too high, leaving the utility with a revenue shortfall, or too low, giving the utility a revenue windfall. To smooth these peaks and valleys, many states have started to include “weather normalization” clauses that serve to reduce weather-related effects and redress earnings volatility. A shift in weather patterns that causes a greater- or less-than-expected number of degree days (a measure of the variation of the mean daily temperature from a reference temperature) triggers a surcharge (in the case of unusually warm weather) or credit (when the weather is cold), applied to customer bills to offset the effect of weather. A more recent option for utilities seeking to minimize the effects of weather on earnings is to use weather-based financial derivatives.
Because revenues are tied to delivered volumes, LDCs have a strong incentive to discourage energy efficiency and conservation, something state regulators would like to change as natural gas prices rise. In recent years in some states, a new “conservation tariff” has been used that decouples an LDC’s revenue from its delivery volumes by protecting profit margins in the event that delivery volumes decline. This is accomplished by mechanisms that change the price of gas delivered according to actual volumes delivered, or by “deferral accounts” that keep track of the impact of conservation measures and provide for deferred collections or refunds at set times.
MANAGING GAS SUPPLY
In addition to maintaining a pipeline network, an LDC is responsible for managing the supply of gas moving through its network, in order to maintain adequate pressure in the system and meet the full requirements of customers during times of peak demand. LDCs are responsible for delivering gas that customers have purchased from an independent competitive supplier, as well as supplying gas to customers that are either unable to choose a competitive supplier or fail to do so. When supplying gas directly to customers, an LDC must purchase the gas itself, as well as pay for transportation of the gas to the LDC’s network (and possibly for storage as well).
Deregulation creates choices Before 1984, when deregulation of the interstate pipeline industry first began, LDCs were forced to buy their gas directly from the transmission pipeline company that served their area as part of a package that included

INDUSTRY SURVEYS NATURAL GAS DISTRIBUTION / JULY 2014 35
both the gas itself and pipeline transportation to the LDC’s city gate. LDCs made these purchases under long-term contracts that obliged them to pay for a certain amount of gas even if the LDC did not need the gas.
In 1984, FERC’s Order 380 freed LDCs of those “take-or-pay” contractual obligations, thereby allowing them to start buying gas directly from producers on the spot market, once their take-or-pay obligations were satisfied. The FERC went on to issue a series of orders dismantling pipeline regulations. This process culminated in 1992 with Order 636, known as “The Restructuring Rule,” which required pipelines to offer transportation service as a separate service on terms equal to those given customers buying gas from the pipeline.
Since that time, a wholesale market for natural gas has developed in the United States; it allows LDCs to purchase gas on a variety of terms and from a variety of different sources. A new class of independent gas marketer sprang up to compete with gas producers and pipelines by offering different products that allow LDCs to create their own supply portfolios, reflecting each LDC’s individual circumstances and needs. LDCs have taken advantage of the shift to diversify their sources of supply away from pipeline companies; now they source a significant amount of their supply either directly from a producer, a producer’s marketing affiliate, or from an independent marketer.
According to an American Gas Association (AGA) survey of its members on hedging and supply procurement practices in the winter season of 2005–2006, most LDCs now buy the majority of their supply directly from the marketing affiliate of a gas producer or from an independent marketer. Of the 29 companies responding to a question about their source of gas supply during their peak day of consumption, just two reported buying any portion of their supply directly from a pipeline company, while seven said they purchased from the marketing affiliate of a pipeline company. In both cases, only one company reported purchasing more than 25% of its peak day supply from a pipeline company or its marketing affiliate. Only four respondents said they did not purchase any supply from an independent marketer, and just six said they had no dealings at all with a producer.
Supply contract options LDCs purchase natural gas using a number of different kinds of contractual arrangements, the terms of which can have a significant impact on the ultimate cost of the gas paid by customers. LDCs can enter supply contracts for different durations: long-term contracts stretching for a year or longer, mid-term contracts of more than a month but less than a year, or monthly or even daily periods. For their peak-month supplies, LDCs tend to rely primarily on mid-term contracts (one to 12 months), though more than half of the respondents to the AGA survey reported using long-term contracts for as much as 50% of their peak-month supply.
In addition to differing timeframes, gas supply contracts can include one of several different pricing mechanisms, including a fixed price for the contract’s duration, a weekly average price, a daily price, a first-of-the-month index, a three-day average, or the price of futures contracts traded on the New York Mercantile Exchange (NYMEX). The AGA survey showed that 20 of 22 LDC survey respondents used first-of-the-month pricing for their long-term contracts, and only a few used other pricing mechanisms. For mid-term contracts, first-of-the-month pricing was still the most common, though LDCs also used fixed, daily, and NYMEX-based pricing mechanisms.
In addition to their physical supply contracts, LDCs often will use financial derivatives to hedge the cost of gas for their customers. These financial instruments—futures, options, and swaps—are available through an organized, regulated exchange (such as NYMEX), as well as in the “over-the-counter” market, from trading desks at various commercial banks, investment banks, marketers, and other natural gas intermediaries.
The type of regulatory regime under which an LDC operates often heavily influences how an LDC purchases its supply, and whether it uses financial futures to hedge risk. LDCs must convince regulators that their gas purchases were prudent and reasonable, or the commission may not grant full reimbursement to the LDC.
Recovering gas supply costs LDCs supply natural gas to customers who have not arranged to buy gas from an independent marketer. While recovering the cost of gas appears simple enough in theory, in practice it can be quite complicated.

36 NATURAL GAS DISTRIBUTION / JULY 2014 INDUSTRY SURVEYS
Gas prices fluctuate from day to day and from month to month, whereas rates may be set for years into the future. This timing mismatch creates a risk that utilities may not fully recover the cost of gas purchased if what they collect for gas supplied is insufficient to cover their costs. Even more worrisome is the fact that regulators may not allow utilities to collect the full cost of gas if their initial cost estimates prove unreliable.
States have widely varying procedures in place for LDCs to recover the cost of gas supplied to customers. Some have automatic pass-through mechanisms linking customer prices to gas price indices that change prices monthly. In other states, however, LDCs must wait until the season is over and then apply to regulators to recoup undercharges. They then run the risk that regulators will not permit full recovery of their gas procurement costs in the next rate case. During times of high gas prices, even delayed recovery of gas supply costs can hurt an LDC’s liquidity, forcing it to increase its borrowings (thus raising its interest expense); in extreme cases, this can hurt its credit rating.
Transportation The physical properties of natural gas make it difficult to transport by any means except a dedicated pipeline. While a few LDCs have their own gas production that can be used to supply customers, long-distance pipelines are the only realistic way for most LDCs to secure enough supply to satisfy full customer demand.
Until the mid-1980s, LDCs purchased their gas directly from the transmission pipeline serving their area, paying a single price for the gas together with any additional charges for transportation and storage. While this arrangement worked well in assuring stability of supply, it was inefficient, as it required LDCs to contract enough gas to meet their peak demand levels throughout the year, even if the pipeline capacity went unused. LDCs passed these costs along to gas customers.
The regulatory reforms that began in 1984 and finished in 1992 allowed LDCs to shop around for their gas from producers, instead of forcing LDCs to buy from pipeline companies. The reforms also permitted LDCs to sell unused pipeline transportation capacity to others in what is known as a “capacity release market.” As a result, LDCs now use a range of options to meet their transportation requirements, including gas released from storage, short-term firm transportation rights, interruptible transportation, released capacity, and “gray market” services (capacity repackaged with supply or other services by LDCs or independent marketers).
The AGA’s survey found that most LDCs still used firm transportation for the majority of their peak-month supply: 16 of 31 responding companies said that they buy between 50% and 75% of their peak-month supplies via firm transportation. Only two of 30 companies reported purchasing peak-month supplies via interruptible transportation, and then for less than 25% of their supply.
Storage Natural gas is bulky and expensive to transport. Because pipelines cannot increase transportation capacity to large demand centers on short notice, gas storage facilities play an important role in LDCs’ efforts to secure supply. In particular, storage is most important during times of peak demand, when demand exceeds pipeline transmission capacity. About 20% of the gas used during winter months comes from storage, according to the AGA, while 50% or more of the gas burned on an extremely cold day may come from storage.
For these reasons, gas storage facilities have become extremely important to LDCs. Gas can be stored in one of several types of facilities, including salt caverns, disused mines, aquifers, hard rock caverns, or depleted gas reservoirs. LNG also can be stored in specially constructed insulated containers near regasification terminals. Small volumes of compressed gas can be stored in tanks commonly referred to as gas holders. LDCs use such storage facilities for shipments to or from areas where pipelines are not available.
Owning or controlling storage reservoirs allows LDCs to guarantee future deliveries and to manage inventories actively against fluctuating natural gas prices. Control or ownership also reduces the reliance on transmission pipeline capacity and limits the potential effect of a pipeline outage. Owners can manage inventory by purchasing gas during times of weak demand, when prices are low, and storing it for use during periods of peak consumption. Storage owners can also lease capacity to third parties, providing an additional source of revenue.

INDUSTRY SURVEYS NATURAL GAS DISTRIBUTION / JULY 2014 37
Because US natural gas consumption peaks in the winter, producers store gas during the months when temperatures and demand are moderate (April through October) and withdraw gas during the heating season (November through March). The US government, commodity traders, and LDCs track storage levels extremely closely to determine demand levels, supply availability, and likely future price trends.
Storage facilities may be classified as either seasonal supply reservoirs or high-deliverability sites. Seasonal supply sites are designed to be filled during the 214-day non–heating season and to be drawn down slowly during the 151-day heating season. In comparison, high-deliverability sites are situated to provide a rapid drawdown or rebuilding of inventory to respond to such needs as volatile peaking demands, emergency backup, and/or system load balancing. High-deliverability sites can be drawn down in 20 days or less and refilled in 40 days or less.
Gas storage capacity is an important tool for LDCs to manage price volatility. A report by the FERC in October 2004 said that improving storage infrastructure was the best way to manage volatile prices. The FERC concluded that existing storage capacity was adequate, but that the industry would benefit from additional capacity because it would help smooth price spikes by increasing the amount of supply close to demand centers. The further a demand center is removed from supply sources, the more that storage will help, the FERC report concluded.
END MARKETS
Residential, commercial, and industrial customers, as well as electric power plants, use natural gas for a variety of purposes, including heat, power generation, and as the raw material for products such as chemicals and fertilizer. Each group displays markedly different responses to changing weather patterns, price levels, and economic activity. Before the gas even reaches these customers, however, some are used for other purposes: processors used 5.4% for lease and plant fuel in gas processing plants, and pipelines used 2.9% for fuel to power compressors used to move the gas in 2013. Thus, of the 26. Tcf of gas consumed in the US during 2013, 91.7% (or 23.9 Tcf) reached the end markets.
LDCs classify their customers as either firm or interruptible. Industrial customers, as well as some commercial customers, have the option of choosing firm gas supply, regardless of their level of demand, for a correspondingly higher price. For customers that can accommodate temporary interruptions or switch to alternative fuels, interruptible service and its corresponding price advantage may be preferable. Residential customers always receive firm service.
Electricity generation In 2013, electric power generators were the largest class of natural gas customer, with relatively few customers accounting for about 34.1% of US gas delivered to consumers. Gas-fired power-generation capacity has grown rapidly in the United States in recent years, for several reasons. Shorter construction times and lower capital investment requirements than other types of power plants made gas-fired power plants an attractive investment during a time of rising electricity prices. New combined-cycle technology has increased the efficiency of gas-fired generation, and concern over the environmental impact of coal-fired and nuclear generation has encouraged more gas-fired plants.
Power generators are even more sensitive to changing natural gas prices than industrial users, operating only when electricity prices are high enough to make burning gas for power profitable. Gas consumption by power generators fell by almost 10% in 2003, when rising gas prices made it less profitable to burn as a fuel for generating power. However, generator consumption of natural gas rose by 6.4% in 2004, 7.4% in 2005, 6.0% in 2006, and 10.0% in 2007—even though prices were still high—due both to increasing power prices and new gas-fueled generation capacity. However, in 2008, consumption fell by 2.5%, reflecting a cooler summer than in 2007. Consumption rose by 3.3% in 2009 and by 7.4% in 2010, due to hotter summer weather in 2010, followed by a 2.9% increase in 2011. Low natural gas prices and hot summer temperatures combined to drive demand by electric producers up by 20.6% in 2012.
The EIA data indicate that gas-fueled power plant additions provided an additional 3.8 gigawatts (GW) of net summer capacity in 2009, 5.8 GW in 2010, and 8.1 GW in 2011, according to the latest available data.

38 NATURAL GAS DISTRIBUTION / JULY 2014 INDUSTRY SURVEYS
However, for the 2007 to 2009 period, new non-hydro renewable capacity increased more than any other type, adding 6.0 GW of capacity in 2007, 8.4 GW in 2008, and 10.1 GW in 2009. The vast majority of that new capacity came from wind turbines. The 2007 increase in non-hydro renewable generation represents the first time ever that this happened. In both 2010 and 2011, the increases in renewable non-hydro capacity nearly matched the increases in natural gas capacity (5.8 GW of natural gas capacity added in 2010 and 8.2GW in 2011). However, these increases were dwarfed by the 59.7 GW of natural gas–fired capacity that was added in 2001. In the EIA’s AEO2014 Reference case, expected capacity additions from 2013 to 2040 total 351 GW, including new plants in the power sector as well as end-use generators.
Several factors other than price can affect short-term natural gas demand patterns for electric power generators. Weather-related events—as well as other developments, such as plant outages, that can raise or lower electricity prices—can cause sudden spikes in gas demand. The rising share of gas demand from electric power producers has created a new “summer peak” in demand, as gas-fired power generators increase their use during periods of hot weather to meet higher power demand for air conditioning.
The industrial market Industrial consumers were a very close second largest source of demand for natural gas in 2013, accounting for about 31.2% of the total consumer volumes. In 2012 (latest available), about 189,330 different industrial customers used natural gas as fuel to produce heat and steam, or as feedstock for chemicals and fertilizer. Chemical makers are the largest group of industrial gas users, with total energy consumption of 5.5 quadrillion British thermal unit (Btu) in 2012 to 7.0 quadrillion Btu in 2040, according to data from the American Chemistry Council and the EIA (AEO2014 Reference case). Along with makers of paper, aluminum, iron and steel, glass, and building materials, the chemical industry helps improve US natural gas industry competitiveness.
Consumption by industrial users tends to be more sensitive than commercial or residential demand to changes in economic activity and price, because industrial customers have greater ability—and incentive—to alter their consumption as market forces dictate. Because demand per customer is much larger than it is for commercial or residential users, one industrial customer’s decision will have a larger impact on total demand.
The residential market Residential gas users numbered about 66.6 million in 2012 (latest available) and accounted for about 20.7% of gas volumes delivered to customers in 2013. While residential customers are more expensive to supply because of the billing and customer service infrastructure required, they pay substantially higher prices than industrial or commercial customers and thus supply the lion’s share of utility profits. Based on data from the EIA, the 2013 yearly average for residential natural gas prices was about $10.31 per million cubic feet (Mcf)—27% higher than commercial prices
($8.12/Mcf), 121% above-average industrial prices ($4.66/Mcf).
A little over two-thirds of residential natural gas demand is for space heating, though that demand is confined mainly to winter months. Residential consumers also use gas to power home appliances such as water heaters, stoves, clothes dryers, and fireplaces. Although residential customers’ overall natural gas demand rises and falls with the severity of winter weather, and is subject to other factors, such as population growth and housing trends, the use of natural gas per residential customer is in a long-term decline.
From 1978 through 2011, natural gas demand per residential customer has exhibited a 1.4% annual compound
Chart H09: THE US RESIDENTIAL NATURAL GAS MARKET
0
1
2
3
4
5
6
7
0
20
40
60
80
100
120
140
2000 04 08 2012
Total residential consumption (Bil. Btu, right scale)Customers (Millions, left scale)Average use (Million Btu, left scale)
THE US RESIDENTIAL NATURAL GAS MARKET
Btu-British thermal units.Source: US Energy Information Administration; S&P Capital IQ estimates.

INDUSTRY SURVEYS NATURAL GAS DISTRIBUTION / JULY 2014 39
average shrink rate, according to calculations using data from the EIA. S&P believes demand per customer is likely to continue to drop by about 1% each year through 2020, assuming normal weather patterns, due mainly to continuing penetration of efficient gas furnaces and appliances.
The commercial market Commercial customers comprise nonmanufacturing businesses such as hotels, restaurants, wholesalers, retailers, and other service-oriented businesses. Natural gas used by state and federal agencies for nonmanufacturing purposes is also counted as commercial demand. The commercial market, with about 5.4 million customers in 2012 (latest available), is smaller than the industrial, residential, or power-generation markets; it accounted for 13.8% of total consumer demand in 2013.
Gas demand is somewhat less seasonal for commercial customers than for residential customers. Slightly more than half of all commercially consumed gas is used for space heating, with the remainder used for water heating, cooking, and a variety of other purposes. Between 1987 and 2012, commercial customers’ CAGR was 0.7%, though per-customer usage fell 0.6% annually during that period. More efficient space- and water-heating appliances accounted for most of the decline; gas customers switching to electricity for cooling purposes also contributed. Change in energy intensity of commercial businesses as new businesses emerge and others close down can also account for some fluctuation.
Other uses Small amounts of natural gas (less than 1% in 2013) are used as vehicle fuel and as a component of fuel cell technology. Many decades from now, these markets could become significant consumers of natural gas. The number of natural gas vehicles in use in the United States has been rising, helped by technological advances in natural gas–fired engines. Since 1997 (the first year this category was tracked by the EIA), the CAGR for other gas usage has been 9.6%. Natural gas vehicles may provide a bridge to the fuel cell vehicle of the future, which has the potential to create enormous demand for natural gas. Natural gas contains high concentrations of hydrogen and already is supported by a vast distribution system.
KEY INDUSTRY RATIOS AND STATISTICS
Heating and cooling degree days. Natural gas is consumed in proportion to extremes in temperature. Residential, commercial, and industrial markets typically use gas for heating enclosed spaces (space heating). In the United States, the heating season generally is considered to last from November through March, though it is somewhat longer in the northern part of the country and somewhat shorter in the South.
Cooling degree days occur during the warm summer months when customers run air conditioning units. This measure also is gaining importance as a barometer of natural gas consumption because electric utilities are increasingly operating gas-fired power plants.
Space heating accounts for approximately two-thirds of residential gas demand and half of commercial use. Consequently, shifts in the relative severity of weather during the heating season affect year-to-year changes in natural gas consumption in these sectors.
When analysts make projections of future gas demand, they assume “normal” weather, quantified in terms of heating and/or cooling degree days. A degree day is a measure of the relative warmth or coldness of the air, based on how far the daily mean temperature falls above or below a reference temperature, usually 65 degrees Fahrenheit. For example, a day with a mean outdoor temperature of 35 degrees Fahrenheit would be counted as a 30-degree heating day. The National Oceanic and Atmospheric Administration (NOAA), an agency of the US Department of Commerce, calculates reference temperatures on a monthly basis. Given the variability of the weather, natural gas demand always will be subject to some unpredictable volatility.
Real gross domestic product (GDP). Although weather is the main cause of swings in gas consumption, weather-normalized gas demand historically has tended to follow the overall economy. Average annual growth in US natural gas demand has typically run at a pace of slightly less than three-quarters of real GDP growth. Real GDP is the market value of the nation’s output of goods and services, adjusted for inflation; the Department of Commerce reports the figure quarterly.

40 NATURAL GAS DISTRIBUTION / JULY 2014 INDUSTRY SURVEYS
The economy affects all three sectors of the gas market. In the residential sector, economic conditions influence the number of housing starts. For commercial and industrial customers, an increase in business activity translates into greater energy consumption, despite increasingly energy-efficient equipment. For an individual utility or energy merchant, demand growth depends heavily on economic trends within its geographic region. These can vary somewhat from GDP trends.
Housing starts. The residential market offers the widest margins and the lion’s share of profits for natural gas distributors. For this reason, housing starts—the number of residences on which construction has begun in a given period—are significant for the natural gas industry. These figures, reported as seasonally adjusted annualized rates (SAAR), are available from the Department of Commerce on a monthly basis.
The residential market accounted for almost two-thirds of natural gas utility profits. It is characterized by a larger number of customers who individually consume much less fuel than is the case in industrial and commercial markets. Accordingly, residential customers pay more on a per-unit basis than industrial and commercial customers do.
The most important factors contributing to changes in demand in the residential market are new housing, conversions from alternate fuel heating to natural gas, and weather. Growth in space heating installations is not the only benefit of a robust housing market. The gas industry also benefits from the increase in appliance shipments. However, appliance design improvements have reduced per-unit natural gas consumption over time.
Interest rates. The regulated and capital-intensive nature of the utility industry makes a utility’s financial performance very sensitive to the level of interest rates and available returns. State regulatory agencies determine utility rates based on operating costs, capital investments, and the cost of capital. Changes in overall interest rates affect utility rates via the allowed cost of debt and the allowed return on equity (ROE). When interest rates drop substantially, the rates that utilities are allowed to charge are likely to be lowered as financing cost savings are passed on to customers.
Income-oriented investors are sensitive to interest rates when they evaluate a utility company’s shares. If interest rates are rising, investors can receive comparable returns elsewhere. To invest in a utility, income-oriented investors look for a large dividend yield or consistently growing dividend distributions to compensate for the risk of owning stock versus a fixed-income security. The dividend tax cut of 2003 makes dividends more attractive relative to fixed-income securities and other investment alternatives.
HOW TO ANALYZE A NATURAL GAS COMPANY
The performance of natural gas companies depends heavily on the mix of their operations. The owners of local distribution companies (LDCs) typically have other operations—both regulated (long-distance pipelines and electricity distribution) and unregulated (“merchant energy” power-generation assets and wholesale gas marketing desks). Each of these businesses has a unique competitive position, financial condition, and exposure to changing market prices and regulatory regimes.
The earnings streams from unregulated generation and trading businesses are much more volatile, as they can be subject to wild swings in commodity prices. Pipelines are more similar to LDCs, but they are more loosely regulated and subject to more competition. Analytical considerations for LDCs, merchant energy assets, and pipelines are described separately following.
LOCAL DISTRIBUTION COMPANIES
In analyzing individual LDCs, it is important to consider a number of issues related to energy markets and company management.
Competitive position To assess where an LDC stands competitively, first compare the rates it charges its customers with those of neighboring utilities and the national average. Favorable comparisons generally indicate a company’s focus

INDUSTRY SURVEYS NATURAL GAS DISTRIBUTION / JULY 2014 41
on cost controls. Traditional utility regulation (versus “performance-based ratemaking”) does not allow an LDC to profit from cost-savings initiatives associated with pass-through ratepayer expenses. However, low rates can engender healthy relationships with regulators and help fend off competitive threats.
Regulatory reforms have made it vital to track competitive threats. Independent gas marketers have proliferated, making inroads into the utilities’ service areas by competing for large gas customers. Increasingly, interstate pipeline companies are trying to bypass the LDCs by distributing gas directly to large-volume industrial users.
Note how an LDC faces these challenges. Has it secured at-risk customers through long-term contracts or flexible pricing agreements? Does it offer bundled services? Has it formed its own marketing arm to compete directly with gas marketers? Has it obtained performance-based regulation (PBR) mechanisms that permit an LDC to share efficiencies between shareholders and ratepayers?
Location and customer mix Demand growth occurs in several ways: an increase in customers in a company’s service area, increased consumption by existing customers, or both. An expanding economy and above-average population growth within an LDC’s service territory are generally favorable characteristics.
Customer growth does not necessarily translate into greater total volumes delivered, however, because the rate of gas consumption per household has been declining for years due to energy-efficient appliances. If state regulatory commissions do not compensate LDCs appropriately for declining consumption patterns, it could slow the capital investment a company needs to make to provide gas utility connections to a growing population.
It is important to note the proportion of an LDC’s residential customers to total customers in a service territory. A greater percentage of residential customers will yield a more stable and predictable revenue stream. Industrial customers and electric utilities that use gas tend to be more price-sensitive. It is also preferable for an LDC to limit the percentage of its business that comes from any single large customer. If one customer accounts for a significant portion of a utility’s sales, the analysis must focus on that customer’s stability and the utility’s competitive position in retaining its business.
While a greater proportion of residential customers generally confers stability, excessive residential exposure has its drawbacks. Residential customers are “full-service” customers, meaning that the LDC must always fulfill all customer demand, however great or small. This creates both inventory management and commodity price risks for the LDC. If an LDC has excess gas after the heating season, it must store or sell the excess, which can reduce earnings.
A further complication is that residential demand tends to be greatest when gas prices are high (during a very cold winter, for example). State public utility commissions (PUCs) often subject the commodity pass-through expenses incurred by LDCs to “prudency” reviews. If regulators find an LDC’s gas procurement strategy to be insufficiently judicious, the company can be required to absorb some commodity costs. In addition, residential bad debt expense tends to increase when higher commodity prices and increased consumption drive up monthly bills. Analysts can gauge an LDC’s susceptibility to inventory management and commodity price risks by evaluating its gas procurement and price hedging strategy, its relationship with regulators, and its management of bad debt.
The penetration rate for residential gas heating in a utility’s service territory is important. For example, in many older communities in the Northeast, the conversion of customers from oil to gas heating has boosted revenue growth.
Regulatory environment LDCs are subject to rate of return regulations controlled by state utility commissions. Thus, it is important to study trends at the regulatory commission(s) with jurisdiction over an LDC’s service territories. Compare authorized rates of return with the rates allowed industry peers. Are there automatic “true-up” mechanisms that allow LDCs to pass pension, bad debt, and other costs through to ratepayers automatically? When will the next rate filing take place? Has the state utility commission approved PBR, or could they approve it?

42 NATURAL GAS DISTRIBUTION / JULY 2014 INDUSTRY SURVEYS
Timing requests for rate reviews are important. Even if an LDC seeks higher rates based on reasonable capital expenditures, if interest rates are low (affecting the allowed return on equity or ROE) and commodity costs are high (affecting ratepayer pocketbooks), regulators may be unwilling to grant relief.
Diversified utility companies must consider regulatory issues affecting other utility operations, such as electric or water. The impact that the 2000–2001 power crisis had on California’s diversified utilities exemplifies this.
Gas supply and demand To determine its need for gas supply and transportation capacity, an LDC must decide how much gas to contract on a firm basis. Conversely, how much should it buy on the spot market, and how much capacity should be interruptible? How much storage capacity does it need to meet demand on peak days?
A well-run LDC is likely to obtain gas from various producers or marketers, from different gas basins in the United States and Canada, and/or from different pipeline routes. It generally will have firm purchase contracts—preferably for an intermediate term—with minimal take-or-pay provisions (which require it to purchase specified quantities of natural gas whether needed or not). A distribution company must carefully manage its storage requirements, as well as its gas supply and transportation arrangements. If it is not successful in these regards, an LDC faces a greater risk of hindsight prudence reviews by regulators and potential disallowance of its purchased gas and transportation costs.
Storage An LDC’s access to storage capacity helps it control both the supply and cost of its gas. Storage helps it to meet increased demand on peak days and allows it to purchase gas during off-season months, when prices are lower.
Whether the LDC owns or leases storage space is another consideration. While the creation of storage operations represents a major capital commitment, an LDC that owns storage facilities can lease any unneeded capacity to others. In contrast, an LDC that does not own storage facilities must continually ask how much gas it needs and how much it should pay for the gas. The problems associated with not owning storage facilities can lead to unstable costs. Thus, it is not surprising that larger gas utilities, with more customers and volume demand, tend to take greater advantage of the storage option.
Unregulated activities To remain viable in a market-driven environment, an LDC’s management team must develop strategies to address competitive pressures. These strategies could involve the introduction of wholesale trading and marketing operations, investment in competitive retail distribution, or the development of natural gas exploration and production (E&P) operations.
Every foray into unregulated activities carries greater potential for risks and rewards than do regulated utility operations. The risks are even higher, however, when utility managers move into business lines in which they have little experience. Investments in unregulated operations may put undue strains on a utility’s credit and could dissuade state regulators from approving mergers, new PBRs, or other utility initiatives.
Looking at the income statement Due to the vagaries of weather and the constraints of regulation, two common profitability measures—net income and earnings per share (EPS)—are not as important in analyzing a utility as in analyzing some other companies. For a better gauge of value and performance, analysts look at how a company manages its financial resources and at its overall health. The three most important items to examine in analyzing a gas distribution company’s income statement are net revenues, operating expenses, and interest expense.
Net revenues. For utilities, growth in net revenue (revenues, less fuel expense) is somewhat predictable because of the regulatory constraints on rates. Nonetheless, past sales trends should be evaluated. Did growth come from a rate increase? An improving economy? Rising weather-related demand? Expectations for the future also should be considered.

INDUSTRY SURVEYS NATURAL GAS DISTRIBUTION / JULY 2014 43
Operating expenses. As competition among gas utilities grows, cost-containment and productivity efforts are crucial to earnings performance. Because fuel costs fluctuate widely, the analyst should pay close attention to nonfuel operating and maintenance costs. Changes in expenses from one period to the next should be noted, along with whether expenses are trending up or down as a percentage of net revenues. The number of customers served per employee is an effective means of tracking trends in operating efficiency.
Interest expense. The utility industry is extremely capital-intensive, so interest payments are a utility’s most significant non-operating expense. Analysts calculate the pretax interest coverage ratio, which indicates how much of the company’s pretax income is needed to meet interest payments. This measure becomes increasingly important as a company engages in greater levels of unregulated operations, due to the uncertainty of earnings derived from such activities.
Evaluating the balance sheet When looking at an LDC’s balance sheet, pay close attention to the company’s capitalization ratio: long-term debt as a percentage of total capital.
Because public utilities require a substantial investment in long-term assets, they traditionally have had significantly more long-term debt on their balance sheets than companies in other industries. Investors usually have accepted these higher debt levels because of the regulated nature of the industry (which ensures income that largely covers the cost of the debt) and utilities’ relatively stable earnings (which consistently provided sufficient funds to cover interest payments). Greater exposure to unregulated activities, however, increases the risk associated with heavy indebtedness.
It is important to compare an LDC’s capitalization ratio with its own historic levels, as well as with those of its peers. These findings then should be analyzed in the context of changes in the LDC’s mix of regulated and unregulated operations.
Assessing cash flow A review of cash flow trends often can give clues to a utility’s health. The company should generate sufficient cash to meet all ongoing expenses. It also needs cash to fund business expansion and, in most cases, to pay dividends.
A firm’s ability to tap capital markets on an ongoing basis must be considered. Therefore, it is important to look at the company’s cash flow relative to its debt. A positive and growing cash flow lets the utility finance more of its expansion internally and reduces its dependence on the capital markets.
PERFORMANCE AND VALUATION MEASURES
These measures include return on equity (ROE), return on assets, the ratio of earnings to fixed charges, the price-to-book ratio, the price/earnings ratio, and dividend payments.
Return on equity (ROE). This performance measure reveals how well a company invests its capital. It is calculated by dividing net income (less preferred dividend requirements) by average shareholders’ equity.
Return on assets (ROA). This performance measure shows how efficiently a company uses its assets. It is calculated by dividing utility operating income by total plant assets less accumulated depreciation.
The ratio of earnings to fixed charges. This calculation reveals a company’s ability to cover fixed charges (amortization and interest expense) with pretax earnings.
Price-to-book (P/B) ratio. Comparing the market price of the company’s shares with its book value indicates how much investors are willing to pay for the company’s assets. LDCs usually do not have high levels of goodwill. In selected cases, though, growth-oriented LDCs that have made significant acquisitions may appear to have disproportionately higher book values (and lower P/B multiples) than their peers, due to their goodwill balances.

44 NATURAL GAS DISTRIBUTION / JULY 2014 INDUSTRY SURVEYS
Price/earnings (P/E) ratio. Another way to evaluate the current market price of the utility’s shares is to look at the P/E ratio. Compare company’s current P/E (based on both trailing and future estimated earnings) with that of its industry peers and with its own historical range. Given their lower EPS growth rates, utility stocks normally trade at a discount to the overall market P/E. When making comparisons of companies within the utility sector, investors tend to pay a higher P/E for, and accept a lower dividend yield from, shares of a utility company with above-average earnings growth potential.
A useful related measure is the P/E to growth (PEG) ratio: the stock’s P/E, divided by the present (or future) earnings growth rate. Is the PEG ratio higher than, lower than, or equal to the industry overall? How does it compare with the company’s historical PEG ratios?
Dividend payments. In general, most utility shareholders do not view a utility stock as a high-growth investment; rather, they are most interested in the stock’s total return potential—its share appreciation combined with its dividend yield. Dividend yield is a larger component of total expected return on a utility stock than for the typical industrial company stock. Consequently, a utility’s ability to pay a dividend—and to provide steady dividend increases—is of paramount importance. To determine if a dividend is secure, the analyst should check the payout ratio (the annual dividend divided by earnings per share). A utility that is paying out too high a percentage of its earnings may need to cut future payments if earnings weaken.
When looking at an individual company, it is important to determine the utility’s dividend policy. As many utilities began investing in unregulated activities, they sought to reduce their payout ratios by either immediately cutting the dividend or holding it constant as earnings rose over time. In cases where the dividend payout ratio is falling, investors must analyze the potential returns from growth-oriented unregulated investments versus the value of the forgone dividend stream.
MERCHANT ENERGY OPERATIONS
Unregulated power generation, wholesale gas marketing, and other merchant energy operations need a stronger balance sheet than LDC businesses. Energy marketing and trading activities demand high levels of financial security in order to assure both trading counterparties and credit rating agencies that a company can survive volatile swings in the energy markets. In contrast to regulated utilities, the value of unregulated assets owned by energy merchants can fluctuate wildly, exposing otherwise healthy balance sheets to asset write-downs during bad times. To safeguard against such volatility, many companies have attempted to lock in favorable prices with long-term customer contracts.
An analyst must evaluate the proportion of merchant energy business that is exposed to short-term market risk and the ability of the company’s liquidity and balance sheet to persevere through industry downturns. Furthermore, one also must evaluate the credit profile of a company’s major contractual counterparties. Hedging unregulated assets through long-term contracts with weak counterparties may provide very limited protection against a cyclical downturn.
The volatility of merchant energy operations has cast a light on company growth initiatives as well. Business plans that require years of capital spending far in excess of operating cash flows can become a liability during an industry downturn, when financial liquidity takes on increased importance. An analyst must evaluate the quality of a company’s new merchant energy investments and the flexibility of capital spending commitments.
It is important to evaluate the energy merchant’s risk management control. This concept covers asset management, trading limits and monitoring, and debt management. Only recently have merchant energy managers begun to develop consistent industry-wide reporting practices. Disclosure and transparency have increased with the backlash against the sector in recent periods. An analyst must make use of these disclosures (including value-at-risk measures, proportion of hedges, credit exposure, debt maturity schedules, and the like) to evaluate the true risk/reward opportunities presented by each unregulated merchant energy business.

INDUSTRY SURVEYS NATURAL GAS DISTRIBUTION / JULY 2014 45
PIPELINES
Interstate pipelines have both utility and merchant energy characteristics. They are similar to monopoly utilities in that they require significant capital expenditures, involve a permitting process, and are subject to price controls. However, an interstate pipeline company can expand its service territory through new permitting and construction, whereas this is not usually the case for LDCs. Pipelines and LDCs are subject to competition from other pipelines that are built close enough to contend for institutional customers.
Pipelines differ from LDCs in that their business generally relies on a limited number of large institutional customers (including wholesale marketers, exploration and production (E&P) companies, LDCs, and large industrial companies). Such high customer concentration increases the risks associated with bad debt expense. When evaluating a pipeline company, an analyst must investigate demand and supply growth along a pipeline’s footprint, opportunities for pipeline expansion, applications for competitive pipeline developments, and the growth prospects and credit quality of shippers along the pipeline’s system.
The location of natural gas supply sources and shifts in consumption patterns affect pipeline capacity utilization. A change in source means new pipelines are needed to transmit gas from growing production centers (such as the Rockies). The use of LNG imported or exported via tanker also affects the need for and utilization of pipeline assets.
The demand side of the equation is subject to potential secular shifts. For example, growth in the number of gas-fired electric generating plants has had a major impact on geographical demand patterns. The analyst must be aware of longer-term supply and demand trends that could increase or decrease the value of pipeline assets.
Many pipeline companies historically have engaged in various unregulated merchant energy activities through subsidiary operations. Thus, the analyst must be careful not to assume that a company has a low-risk profile just because it owns substantial regulated pipeline assets.
A number of pure-play pipeline businesses are owned by master limited partnerships (MLPs). MLPs trade on exchanges just like common stocks, but the businesses avoid income taxation by paying out nearly all free cash flows to shareholders. These income-oriented investments generally trade based on their yield, distribution growth potential, and volatility of cash flows.
Because MLPs cannot use operating cash flows for growth-oriented capital expenditures, they depend on the ability to raise fresh debt and equity capital to fund new investment. Unlike other pipeline companies, pension funds generally cannot hold MLPs due to current tax obligations generated from their partnership structure. Accordingly, smaller retail investors generally hold shares of publicly traded MLPs.
The general partners (GPs) for MLPs often have performance participation awards that provide the GPs with larger and larger interests in MLP distributions as the MLP raises its dividend. An analyst needs to evaluate an MLP’s capacity to raise distributions in light of growth opportunities, access to capital markets, and GP performance participation awards.

46 NATURAL GAS DISTRIBUTION / JULY 2014 INDUSTRY SURVEYS
GLOSSARY
Adjustment clause—A provision in a utility tariff that provides for changes in gas rates charged to a customer in the event of increases or decreases in certain costs incurred by the seller. These include purchased gas cost, transportation costs, and advance payments made for gas.
Base load—The minimum constant level of natural gas or power required in a given time period by a utility or power company.
Bidweek prices— A blend of spot and contract prices in the last week of every month, which is when the largest volume of trading occurs.
British thermal unit (Btu)—The amount of heat required to increase the temperature of a pound of water by one degree Fahrenheit; about equal to the energy of a kitchen match. Used as a common measure of heating value for different fuels; one Btu equals 252 calories or 0.293 watt hours. A commonly used multiple is MMBtu (one million British thermal units).
Burnertip—Refers to the ultimate point of consumption: customers’ gas-fueled equipment.
Bypass—The direct sale of natural gas to end users by producers or pipelines, avoiding the local distribution company (LDC).
City gate—The physical connection between an interstate pipeline and a local gas utility’s pipes.
Class of service—A utility’s sales categories: residential, commercial, industrial, and gas for resale.
Combined cycle—The utilization of waste heat from large gas turbines to generate steam for conventional steam turbines, thus extracting the maximum amount of useful work from fuel combustion.
Compressor station—Any permanent combination of facilities that supplies the energy to move gas at increased pressure from fields, in transmission lines, or into storage.
Cooling season—The period from May through September. The term sometimes includes April and October, but when these months are excluded, they are regarded as transition or “shoulder” months between the heating and cooling season.
Cost of service—In public utility regulation, the dollar amount required to supply any total utility service. It includes: operation and maintenance expenses; other necessary costs not covered by ordinary maintenance, such as taxes, depreciation, depletion, and amortization of property; and a fair return to maintain the utility’s financial integrity, attract new capital, and compensate its owners for the risks involved. Cost of service is the chief determinant of allowed rate of return.
Cubic foot—The amount of gas required to fill a volume of one cubic foot at standard atmospheric pressure and 60 degrees Fahrenheit; the most common measurement of gas volume. One cubic foot of natural gas contains about 965.9 Btu of energy. Commonly used multiples are Mcf (one thousand cubic feet), MMcf (one million cubic feet), Bcf (one billion cubic feet), and Tcf (one trillion cubic feet).
Curtailment—Reducing the amount of natural gas delivered to customers in response to supply shortfalls. May require certain customers to cut back or eliminate their gas intake, depending on their type of service (firm or interruptible) and the severity of the shortfall.
Degree day—A measure of the variation of the mean daily temperature from a reference temperature, usually 65 degrees Fahrenheit. Mean temperatures less than 65 degrees Fahrenheit result in heating degree days; mean temperatures higher than 65 degrees Fahrenheit result in cooling degree days. Each degree above or below the benchmark equals one degree day; thus, a day on which the mean temperature was 55 degrees is considered a 10-degree heating day.
Deliverability—The volume of gas that a well, field, pipeline, storage reservoir, or distribution system can supply in a given period of time.
Distribution—The movement of gas from a city gate or plant to consumers. Alternatively, the part of a utility plant used for delivering gas from the city gate or plant to consumers. Can also refer to expenses related to the operation and maintenance of a distribution plant.

INDUSTRY SURVEYS NATURAL GAS DISTRIBUTION / JULY 2014 47
Downstream—Refers to the distribution of natural gas to end users. Downstream is always understood to include local distribution companies (LDCs) and often includes interstate pipeline transmission.
Dry natural gas—The natural gas that remains after liquefiable hydrocarbons (propane, butane, etc.) and sufficient contaminant gases (carbon dioxide, hydrogen sulfide, etc.) have been removed.
Heating season—According to the American Gas Association (AGA), the winter heating season officially begins on November 1 and ends on March 31 of the following year.
Hedging—The process of using physical resources or contracts to mitigate financial exposures. For example, utilities may hedge commitments to deliver gas through storage, bilateral contracts, and derivative instruments.
Hub—A pipeline interchange used as a standard delivery point for figuring natural gas futures contracts. There are four major hubs: the Henry Hub in Southern Louisiana, the Katy Hub near Houston, the Waha Hub in West Texas, and the Midwest Exchange Hub near Chicago.
Incentive regulation—A method of determining a utility’s rates, based on its costs and/or quality of service compared with some predefined expectation; also known as performance-based regulation (PBR).
Independent power producer (IPP)—A non-utility power generator that produces electricity for sale in the wholesale market.
Industrial fuel switching—The practice by industrial customers of switching between fuels—for example, from natural gas to oil, or vice versa—motivated primarily by the fuels’ relative prices.
Integrated gas company—A company that does everything necessary to bring gas to the consumer. Such a firm explores for and produces gas, transports it over long distances, and distributes it directly to customers.
Interruptible service—Low-cost gas service offered to users under contracts that permit interruption on short notice, generally in peak-load season, so as to supply firm customers and high-priority users. Unlike off-peak service, it is available year-round.
Local distribution company (LDC)—A utility that owns and operates a natural gas distribution system for the delivery of gas supplies from interstate pipelines at the city gate to the customer; also known as a gas utility.
Market-based rate—A form of regulatory pricing for pipeline transportation services. The price is based on the pipeline’s assessment of market forces, in order to achieve an allowed rate of return. The Federal Energy Regulatory Commission (FERC) will not approve market-based rate plans for pipeline companies that have “excessive market power.”
Marketing and trading—The process of acquiring control or ownership of gas, electricity, or other commodities, and selling them to third parties.
Methane—The first of the paraffin series of hydrocarbons, methane is the chief component of natural gas. Pure methane has a heating value of 1,012 Btu per cubic foot.
Midstream—The gathering of natural gas after exploration and production (E&P)—that is, its processing and storage for later transmission and distribution. The term is sometimes meant to include pipeline transmission services, which supply LDCs and large industrial customers.
Natural gas—A naturally occurring mixture of gases found in porous geological formations beneath the Earth’s surface, often in association with petroleum. Its principal component is methane.
Normalization—For ratemaking purposes, adjustments to historic test-year sales, revenues, and expenses to reflect differences from expected normal weather patterns.
Off-peak service—Gas service made available to some customers on special schedules or contracts, for specified periods of weak demand.
Peak load—The greatest demand on a pipeline or distribution system during a specified period.

48 NATURAL GAS DISTRIBUTION / JULY 2014 INDUSTRY SURVEYS
Pipeline—The physical facilities through which gas is transported, including pipes, compressor units, metering stations, regulator stations, delivery stations, holders, and fabricated assemblies.
Public utility commission (PUC)—A state regulatory authority set up to monitor the monopolies granted to intrastate and local natural gas pipelines; it regulates the rates charged by privately owned utilities involved in intrastate commerce; sometimes called a public service commission (PSC).
Rate base—The value, established by a regulatory authority, upon which a utility is permitted to earn a specified rate of return. The rate base may provide for the inclusion of cash, working capital, and materials and supplies, as well as deductions for accumulated provisions for depreciation, contributions in aid of construction, accumulated deferred income taxes, and accumulated deferred investment tax credits. In short, the rate base consists of the total net investment (in dollars) in the facilities that the utility needs to provide service.
Rate case—The process through which a utility’s regulated natural gas billing rates are negotiated with a PUC.
Rate of return (ROR)—The return that regulators allow a utility enterprise to earn, including interest, preferred dividends, and return on common equity. Calculated as a percentage of the rate base, ROR is regulated by state PUCs.
Spot market—Short-term contract sales of natural gas, crude oil, refined petroleum products, liquid petroleum gas, or electricity.
Storage, local—Storage facilities (not underground) that are an integral part of a distribution system. Whether for manufactured, mixed, natural, liquefied petroleum, or liquefied natural gas (LNG), these facilities are on the distribution side of the city gate.
Storage, underground—Subsurface facilities for storing gas that has been transferred from its original location for purposes of load balancing. Such facilities usually consist of natural geological reservoirs, such as depleted oil or gas fields or water-bearing sands, sealed on the top by an impermeable cap rock. They also may include manmade or natural caverns.
Straight fixed variable (SFV) rate design—A rate design in which LDCs pay pipeline companies fixed transportation charges that are not adjusted for volume levels.
Take-or-pay clause—In gas supply contracts, a clause providing that a purchaser must pay for a specified minimum quantity of gas for a specific time period, whether it takes delivery or not. Some contracts let the buyer take later delivery without penalty.
Tariff—A schedule of rates or charges permitted for a common carrier, utility, or pipeline.
Test year—The 12-month base period selected for presenting data in a case or hearing before a regulatory agency.
Therm—A unit of heating value equivalent to 100,000 Btu.
Throughput—The total of all gas volumes delivered in a certain period.
Transmission company, gas—A firm that delivers natural gas across longer distances than does a distribution company and classifies the majority of its mains (other than service pipes) for transmission or storage; also known as a pipeline company.
Unbundling—The process of separating the supply of the natural gas or power commodity from the delivery function provided by utilities.
Upstream—Refers to the exploration and production (E&P) of natural gas and other fossil fuels.
Utility—In the US, a government-sanctioned monopoly business that has the exclusive right (and obligation) to deliver natural gas, electricity, or water to homes using pipes and wires installed along public rights of way. A combination utility (or “multi-utility”) provides more than one commodity delivery service.
Wellhead—The point of origin in the gas supply process. Refers to the valves and controls at the well containing the natural gas reservoir.
Wellhead price—The price that a pipeline company pays for natural gas or petroleum at the well; also known as the field price.

INDUSTRY SURVEYS NATURAL GAS DISTRIBUTION / JULY 2014 49
INDUSTRY REFERENCES
PERIODICALS
Inside FERC Gas Daily LNG Daily http://www.platts.com Inside FERC is a weekly newsletter providing an authoritative source of information on the workings of the Federal Energy Regulatory Commission (FERC) and its impact on the regulated industry and industry news. Gas Daily provides detailed daily coverage of natural gas prices, and LNG Daily delivers expert and respected benchmark price assessments for the global LNG market. (Platts is a unit of McGraw Hill Financial.)
Natural Gas Week http://www.energyintel.com Weekly newsletter; covers industry news.
Public Utilities Fortnightly http://www.fortnightly.com Monthly magazine; covers the electric and gas utility industries.
The Waterborne LNG Report http://www.waterbornelng.com A twice-a-month report; gives data and estimates of liquefied natural gas (LNG) import and export volumes to the US and Europe.
TRADE ASSOCIATIONS
American Gas Association (AGA) http://www.aga.org Natural gas industry association that conducts technical research, compiles authoritative statistics, and helps create standards for industry equipment and products.
American Public Gas Association (APGA) http://www.apga.org Represents municipal gas systems.
Center for Liquefied Natural Gas http://www.lngfacts.org Represents LNG asset owners and operators, gas transporters, and natural gas end users.
Gas Technology Institute (GTI) http://www.gastechnology.org Not-for-profit technology organization that conducts research, development, and commercialization programs for the natural gas industry.
Industrial Energy Consumers of America http://www.ieca-us.com Represents energy-intensive manufacturing industries.
Interstate Natural Gas Association of America (INGAA) http://www.ingaa.org Advocates regulatory and legislative positions for the North American natural gas pipeline industry.
National Association of Regulatory Utility Commissioners (NARUC) http://www.naruc.org Represents individual states’ viewpoints on regulation.
The Natural Gas Supply Association http://www.ngsa.org Represents US natural gas producers.
CONSULTANTS
Baker Hughes Inc. http://www.bakerhughes.com Firm providing various oil and gas industry consulting services to its clients. It is also considered to be the authority on rig count data and publishes weekly and monthly rig count information.
IHS Inc. http://www.ihs.com/products/global-insight Research firm providing economic data, forecasts, analysis, and consulting. Among its many publications is the Monthly Natural Gas Price Outlook.
Platts http://www.platts.com Strategic energy information, consulting, and publishing firm. Platts is a unit of McGraw Hill Financial.
SNL Financial http://www.SNL.com Research firm providing regulatory, financial, market, and M&A data on several industries, including energy.

50 NATURAL GAS DISTRIBUTION / JULY 2014 INDUSTRY SURVEYS
GOVERNMENTAL AND REGULATORY BODIES
Energy Information Administration (EIA) http://www.eia.doe.gov Agency within the US Department of Energy (DOE); supplies publications and statistics on the natural gas industry, as well as on power, coal, and a variety of other energy areas, including supply, consumption, and transportation issues.
Federal Energy Regulatory Commission (FERC) http://www.ferc.gov Agency within the US Department of Energy (DOE) that exercises regulatory control over the electric power and natural gas industries. It also regulates producer sales of natural gas in interstate commerce and, for each of several categories of natural gas, establishes uniform ceiling prices that apply to all sales nationwide.
Federal Trade Commission (FTC) http://www.ftc.gov Independent agency reporting to the US Congress, the FTC is charged with maintaining competition and safeguarding consumers’ interests. Reviews proposed mergers involving electric and gas utility companies; may analyze regulatory or legislative proposals affecting energy market competition or the efficiency of resource allocation.
National Energy Board (NEB) http://www.neb-one.gc.ca Independent federal agency established in 1959 by the Parliament of Canada to regulate international and interprovincial aspects of the oil, gas and electric utility industries in Canada.
US Department of Energy (DOE) http://www.energy.gov Federal science and technology agency whose research supports the nation’s energy security, national security, and environmental quality. Introduced to the US Cabinet in 1977, the DOE includes the Office of the Secretary of Energy, the FERC, and other agencies.

INDUSTRY SURVEYS NATURAL GAS DISTRIBUTION / JULY 2014 51
COMPARATIVE COMPANY ANALYSIS
Operating Revenues
Million $ CAGR (%) Index Basis (2003 = 100)
Ticker Company Yr. End 2013 2012 2011 2010 2009 2008 2003 10-Yr. 5-Yr. 1-Yr. 2013 2012 2011 2010 2009
GAS UTILITIES‡GAS [] AGL RESOURCES INC DEC 4,617.0 F 3,922.0 F 2,338.0 F 2,373.0 F 2,317.0 F 2,800.0 F 983.7 C,F 16.7 10.5 17.7 469 399 238 241 236ATO † ATMOS ENERGY CORP SEP 3,886.3 F 3,438.5 D,F 4,347.6 D,F 4,789.7 F 4,969.1 F 7,221.3 F 2,799.9 C,F 3.3 (11.7) 13.0 139 123 155 171 177LG § LACLEDE GROUP INC SEP 1,017.0 A,F 1,125.5 F 1,603.3 F 1,735.0 F 1,895.2 F 2,209.0 D,F 1,050.3 F (0.3) (14.4) (9.6) 97 107 153 165 180NFG † NATIONAL FUEL GAS CO SEP 1,829.6 F 1,626.9 F 1,778.8 F 1,760.5 D,F 2,057.9 A,F 2,400.4 F 2,035.5 F (1.1) (5.3) 12.5 90 80 87 86 101NJR § NEW JERSEY RESOURCES CORP SEP 3,198.1 F 2,248.9 F 3,009.2 F 2,639.3 F 2,592.5 F 3,816.2 F 2,544.4 F 2.3 (3.5) 42.2 126 88 118 104 102
NWN § NORTHWEST NATURAL GAS CO DEC 777.5 F 749.0 F 848.8 F 812.1 F 1,012.7 F 1,037.9 F 611.3 F 2.4 (5.6) 3.8 127 123 139 133 166OGS † ONE GAS INC DEC 1,690.0 1,376.6 1,621.3 NA NA NA NA NA NA 22.8 ** ** ** ** NAPNY § PIEDMONT NATURAL GAS CO OCT 1,278.2 1,122.8 1,433.9 1,552.3 1,638.1 2,089.1 1,220.8 A 0.5 (9.4) 13.8 105 92 117 127 134STR † QUESTAR CORP DEC 1,220.0 1,098.9 1,194.4 1,123.6 D 3,038.0 3,465.1 1,463.2 (1.8) (18.8) 11.0 83 75 82 77 208SJI § SOUTH JERSEY INDUSTRIES INC DEC 731.4 F 706.3 F 828.6 F 925.1 D,F 845.4 D,F 962.0 D,F 696.8 C,D 0.5 (5.3) 3.6 105 101 119 133 121
SWX § SOUTHWEST GAS CORP DEC 1,950.8 F 1,927.8 F 1,887.2 F 1,830.4 F 1,893.8 F 2,144.7 F 1,231.0 F 4.7 (1.9) 1.2 158 157 153 149 154UGI † UGI CORP SEP 7,194.7 F 6,519.2 A,F 6,091.3 F 5,591.4 F 5,737.8 F 6,648.2 F 3,026.1 F 9.0 1.6 10.4 238 215 201 185 190WGL † WGL HOLDINGS INC SEP 2,466.1 F 2,425.3 F 2,751.5 F 2,708.9 F 2,706.9 F 2,628.2 F 1,301.1 6.6 (1.3) 1.7 190 186 211 208 208
MULTI-UTILITIES‡LNT † ALLIANT ENERGY CORP DEC 3,276.8 F 3,094.5 D,F 3,665.3 F 3,416.1 D,F 3,432.8 F 3,681.7 F 3,128.2 C,D 0.5 (2.3) 5.9 105 99 117 109 110AEE [] AMEREN CORP DEC 5,838.0 D 6,828.0 7,531.0 7,638.0 7,090.0 7,839.0 4,593.0 A,C 2.4 (5.7) (14.5) 127 149 164 166 154AVA § AVISTA CORP DEC 1,618.5 F 1,547.0 F 1,619.8 A,F 1,558.7 F 1,512.6 F 1,676.8 A,F 1,123.4 C,D 3.7 (0.7) 4.6 144 138 144 139 135BKH † BLACK HILLS CORP DEC 1,275.9 F 1,173.9 F 1,272.2 D,F 1,307.3 A,F 1,269.6 D,F 1,005.8 A,C 1,136.1 C,D 1.2 4.9 8.7 112 103 112 115 112CMS [] CMS ENERGY CORP DEC 6,566.0 F 6,312.0 D,F 6,503.0 D,F 6,432.0 D,F 6,205.0 D,F 6,821.0 F 5,513.0 C,D 1.8 (0.8) 4.0 119 114 118 117 113
CNP [] CENTERPOINT ENERGY INC DEC 8,106.0 F 7,452.0 F 8,450.0 F 8,785.0 F 8,281.0 F 11,322.0 F 9,760.1 C,D (1.8) (6.5) 8.8 83 76 87 90 85ED [] CONSOLIDATED EDISON INC DEC 12,354.0 F 12,188.0 F 12,938.0 F 13,325.0 F 13,032.0 F 13,583.0 F 9,827.0 C,F 2.3 (1.9) 1.4 126 124 132 136 133DTE [] DTE ENERGY CO DEC 9,661.0 F 8,791.0 D,F 8,897.0 F 8,557.0 F 8,014.0 F 9,329.0 D,F 7,041.0 C,D 3.2 0.7 9.9 137 125 126 122 114D [] DOMINION RESOURCES INC DEC 13,120.0 D,F 13,093.0 D,F 14,379.0 F 15,197.0 D,F 15,131.0 F 16,290.0 D,F 12,078.0 C,D 0.8 (4.2) 0.2 109 108 119 126 125TEG [] INTEGRYS ENERGY GROUP INC DEC 5,634.6 A,F 4,212.4 D,F 4,708.7 A,F 5,203.2 F 7,499.8 F 14,047.8 D,F 4,321.3 C,D 2.7 (16.7) 33.8 130 97 109 120 174
MDU † MDU RESOURCES GROUP INC DEC 4,462.4 F 4,075.4 A,F 4,050.5 F 3,909.7 F 4,176.5 F 5,003.3 F 2,352.2 C,F 6.6 (2.3) 9.5 190 173 172 166 178NI [] NISOURCE INC DEC 5,657.3 F 5,061.2 D,F 6,019.1 F 6,422.0 D,F 6,649.4 D,F 8,874.2 D,F 6,246.6 D,F (1.0) (8.6) 11.8 91 81 96 103 106NWE § NORTHWESTERN CORP DEC 1,154.5 F 1,070.3 F 1,117.3 F 1,110.7 F 1,141.9 F 1,260.8 F 1,027.4 D,F 1.2 (1.7) 7.9 112 104 109 108 111PCG [] PG&E CORP DEC 15,598.0 15,040.0 14,956.0 13,841.0 13,399.0 14,628.0 D 10,435.0 C,D 4.1 1.3 3.7 149 144 143 133 128PEG [] PUBLIC SERVICE ENTRP GRP INC DEC 9,968.0 F 9,781.0 F 11,343.0 F 11,793.0 D,F 12,406.0 F 13,807.0 D,F 11,116.0 D,F (1.1) (6.3) 1.9 90 88 102 106 112
SCG [] SCANA CORP DEC 4,495.0 F 4,176.0 F 4,409.0 F 4,601.0 F 4,237.0 F 5,319.0 F 3,416.0 F 2.8 (3.3) 7.6 132 122 129 135 124SRE [] SEMPRA ENERGY DEC 10,557.0 F 9,647.0 F 10,036.0 F 9,003.0 F 8,106.0 F 10,758.0 F 7,887.0 C,F 3.0 (0.4) 9.4 134 122 127 114 103TE [] TECO ENERGY INC DEC 2,851.3 F 2,996.6 D,F 3,343.4 F 3,487.9 F 3,310.5 F 3,375.3 F 2,740.0 C,D 0.4 (3.3) (4.8) 104 109 122 127 121VVC † VECTREN CORP DEC 2,491.2 F 2,232.8 F 2,325.2 F 2,129.5 F 2,088.9 F 2,484.7 F 1,587.7 F 4.6 0.1 11.6 157 141 146 134 132WEC [] WISCONSIN ENERGY CORP DEC 4,519.0 F 4,246.4 F 4,486.4 F 4,202.5 D,F 4,127.9 D,F 4,431.0 F 4,054.3 F 1.1 0.4 6.4 111 105 111 104 102
INDEPENDENT POWER PRODUCERS & ENERGY TRADE‡AES [] AES CORP DEC 15,891.0 D 18,046.0 D 17,274.0 A,C 16,647.0 D 14,119.0 D 16,102.0 D 8,415.0 D 6.6 (0.3) (11.9) 189 214 205 198 168NRG [] NRG ENERGY INC DEC 11,295.0 F 8,422.0 A,F 9,079.0 A,F 8,849.0 A,F 8,952.0 A,F 6,885.0 D,F 1,936.9 D,F 19.3 10.4 34.1 583 435 469 457 462
OTHER COMPANIES WITH SIGNIFICANT NATURAL GAS OPERATIONSTRP TRANSCANADA CORP DEC 8,270.2 8,040.8 8,988.0 8,056.7 8,570.9 7,041.7 A 4,145.3 D 7.2 3.3 2.9 200 194 217 194 207
Note: Data as originally reported. CAGR-Compound annual grow th rate. ‡S&P 1500 index group. []Company included in the S&P 500. †Company included in the S&P MidCap 400. §Company included in the S&P SmallCap 600. #Of the follow ing calendar year. **Not calculated; data for base year or end year not available. A - This year's data ref lect an acquisition or merger. B - This year's data ref lect a major merger resulting in the formation of a new company. C - This year's data ref lect an accounting change. D - Data exclude discontinued operations. E - Includes excise taxes. F - Includes other (nonoperating) income. G - Includes sale of leased depts. H - Some or all data are not available, due to a fiscal year change.

52 NATURAL GAS DISTRIBUTION / JULY 2014 INDUSTRY SURVEYS
Net Income
Million $ CAGR (%) Index Basis (2003 = 100)
Ticker Company Yr. End 2013 2012 2011 2010 2009 2008 2003 10-Yr. 5-Yr. 1-Yr. 2013 2012 2011 2010 2009
GAS UTILITIES‡GAS [] AGL RESOURCES INC DEC 313.0 271.0 172.0 234.0 222.0 217.0 135.7 8.7 7.6 15.5 231 200 127 172 164ATO † ATMOS ENERGY CORP SEP 230.7 192.2 198.9 205.8 191.0 180.3 79.5 11.2 5.0 20.0 290 242 250 259 240LG § LACLEDE GROUP INC SEP 52.8 62.6 63.8 54.0 64.3 57.6 34.6 4.3 (1.7) (15.8) 152 181 184 156 185NFG † NATIONAL FUEL GAS CO SEP 260.0 220.1 258.4 219.1 100.7 268.7 187.8 3.3 (0.7) 18.1 138 117 138 117 54NJR § NEW JERSEY RESOURCES CORP SEP 114.8 92.9 101.3 117.5 27.2 113.9 65.4 5.8 0.2 23.6 176 142 155 180 42
NWN § NORTHWEST NATURAL GAS CO DEC 60.5 59.9 63.9 72.7 75.1 69.5 46.0 2.8 (2.7) 1.1 132 130 139 158 163OGS † ONE GAS INC DEC 99.2 96.5 86.8 NA NA NA NA NA NA 2.8 ** ** ** ** NAPNY § PIEDMONT NATURAL GAS CO OCT 134.4 119.8 113.6 142.0 122.8 110.0 74.4 6.1 4.1 12.2 181 161 153 191 165STR † QUESTAR CORP DEC 161.2 212.0 207.9 192.3 393.3 683.8 179.2 (1.1) (25.1) (24.0) 90 118 116 107 219SJI § SOUTH JERSEY INDUSTRIES INC DEC 82.4 92.8 89.9 67.3 58.5 77.2 34.6 9.1 1.3 (11.2) 238 269 260 195 169
SWX § SOUTHWEST GAS CORP DEC 145.3 133.3 112.3 103.9 87.5 61.0 38.5 14.2 19.0 9.0 377 346 292 270 227UGI † UGI CORP SEP 278.1 199.4 232.9 261.0 258.5 215.5 98.9 10.9 5.2 39.5 281 202 235 264 261WGL † WGL HOLDINGS INC SEP 81.6 141.1 118.4 111.2 121.7 117.8 113.7 (3.3) (7.1) (42.2) 72 124 104 98 107
MULTI-UTILITIES‡LNT † ALLIANT ENERGY CORP DEC 382.1 340.8 320.6 308.0 129.4 298.7 176.6 8.0 5.0 12.1 216 193 182 174 73AEE [] AMEREN CORP DEC 512.0 (974.0) 519.0 139.0 612.0 615.0 517.0 (0.1) (3.6) NM 99 (188) 100 27 118AVA § AVISTA CORP DEC 111.1 78.2 100.2 92.4 87.1 73.6 50.6 8.2 8.6 42.0 219 154 198 183 172BKH † BLACK HILLS CORP DEC 115.8 88.5 40.4 68.7 78.8 (52.2) 57.0 7.4 NM 30.9 203 155 71 121 138CMS [] CMS ENERGY CORP DEC 452.0 375.0 413.0 363.0 209.0 300.0 (40.0) NM 8.5 20.5 NM NM NM NM NM
CNP [] CENTERPOINT ENERGY INC DEC 311.0 417.0 770.0 442.0 372.0 447.0 419.7 (3.0) (7.0) (25.4) 74 99 183 105 89ED [] CONSOLIDATED EDISON INC DEC 1,062.0 1,141.0 1,062.0 1,003.0 879.0 933.0 536.0 7.1 2.6 (6.9) 198 213 198 187 164DTE [] DTE ENERGY CO DEC 661.0 666.0 711.0 630.0 532.0 526.0 480.0 3.3 4.7 (0.8) 138 139 148 131 111D [] DOMINION RESOURCES INC DEC 1,789.0 324.0 1,408.0 2,963.0 1,287.0 1,853.0 964.0 6.4 (0.7) 452.2 186 34 146 307 134TEG [] INTEGRYS ENERGY GROUP INC DEC 350.1 294.2 230.9 223.8 (70.6) 124.8 110.6 12.2 22.9 19.0 317 266 209 202 (64)
MDU † MDU RESOURCES GROUP INC DEC 279.2 (14.3) 226.0 244.0 (123.3) 293.7 182.9 4.3 (1.0) NM 153 (8) 124 133 (67)NI [] NISOURCE INC DEC 490.9 410.6 303.8 294.6 231.2 369.8 430.2 1.3 5.8 19.6 114 95 71 68 54NWE § NORTHWESTERN CORP DEC 94.0 98.4 92.6 77.4 73.4 67.6 (86.5) NM 6.8 (4.5) NM NM NM NM NMPCG [] PG&E CORP DEC 828.0 830.0 858.0 1,113.0 1,234.0 1,184.0 791.0 0.5 (6.9) (0.2) 105 105 108 141 156PEG [] PUBLIC SERVICE ENTRP GRP INC DEC 1,243.0 1,275.0 1,407.0 1,557.0 1,592.0 987.0 856.0 3.8 4.7 (2.5) 145 149 164 182 186
SCG [] SCANA CORP DEC 471.0 420.0 387.0 376.0 357.0 353.0 289.0 5.0 5.9 12.1 163 145 134 130 124SRE [] SEMPRA ENERGY DEC 1,009.0 865.0 1,365.0 749.0 1,129.0 1,123.0 705.0 3.7 (2.1) 16.6 143 123 194 106 160TE [] TECO ENERGY INC DEC 197.8 246.0 272.6 239.0 213.9 162.4 (14.7) NM 4.0 (19.6) NM NM NM NM NMVVC † VECTREN CORP DEC 136.6 159.0 141.6 133.7 133.1 129.0 111.2 2.1 1.2 (14.1) 123 143 127 120 120WEC [] WISCONSIN ENERGY CORP DEC 577.4 546.3 512.8 454.4 377.2 358.6 245.5 8.9 10.0 5.7 235 223 209 185 154
INDEPENDENT POWER PRODUCERS & ENERGY TRADE‡AES [] AES CORP DEC 284.0 (915.0) 458.0 (86.0) 729.0 1,216.0 336.0 (1.7) (25.2) NM 85 (272) 136 (26) 217NRG [] NRG ENERGY INC DEC (386.0) 559.0 197.0 477.0 942.0 1,016.0 2,960.5 NM NM NM (13) 19 7 16 32
OTHER COMPANIES WITH SIGNIFICANT NATURAL GAS OPERATIONSTRP TRANSCANADA CORP DEC 1,679.0 1,359.7 1,577.5 1,292.8 1,340.2 1,194.4 636.8 10.2 7.0 23.5 264 214 248 203 210
Note: Data as originally reported. CAGR-Compound annual grow th rate. ‡S&P 1500 index group. []Company included in the S&P 500. †Company included in the S&P MidCap 400. §Company included in the S&P SmallCap 600. #Of the follow ing calendar year. **Not calculated; data for base year or end year not available.

INDUSTRY SURVEYS NATURAL GAS DISTRIBUTION / JULY 2014 53
Return on Revenues (%) Return on Assets (%) Return on Equity (%)
Ticker Company Yr. End 2013 2012 2011 2010 2009 2013 2012 2011 2010 2009 2013 2012 2011 2010 2009
GAS UTILITIES‡GAS [] AGL RESOURCES INC DEC 6.8 6.9 7.4 9.9 9.6 2.2 1.9 1.6 3.2 3.2 8.9 8.1 6.7 13.0 12.9ATO † ATMOS ENERGY CORP SEP 5.9 5.6 4.6 4.3 3.8 3.0 2.6 2.8 3.1 3.0 9.3 8.3 9.0 9.5 9.0LG § LACLEDE GROUP INC SEP 5.2 5.6 4.0 3.1 3.4 2.1 3.4 3.5 3.0 3.6 6.4 10.7 11.5 10.3 12.8NFG † NATIONAL FUEL GAS CO SEP 14.2 13.5 14.5 12.4 4.9 4.3 3.9 5.0 4.4 2.3 12.5 11.4 14.2 13.1 6.3NJR § NEW JERSEY RESOURCES CORP SEP 3.6 4.1 3.4 4.5 1.1 4.0 3.4 3.9 4.8 1.1 13.5 11.7 13.5 16.6 3.8
NWN § NORTHWEST NATURAL GAS CO DEC 7.8 8.0 7.5 8.9 7.4 2.1 2.2 2.4 2.9 3.1 8.2 8.3 9.1 10.7 11.7OGS † ONE GAS INC DEC 5.9 7.0 5.4 NA NA 2.7 2.8 NA NA NA 8.3 8.3 NA NA NAPNY § PIEDMONT NATURAL GAS CO OCT 10.5 10.7 7.9 9.1 7.5 3.3 3.4 3.6 4.6 4.0 12.1 11.8 11.6 15.0 13.5STR † QUESTAR CORP DEC 13.2 19.3 17.4 17.1 12.9 4.1 5.8 6.0 3.1 4.5 14.4 20.5 20.1 8.5 11.4SJI § SOUTH JERSEY INDUSTRIES INC DEC 11.3 13.1 10.8 7.3 6.9 3.0 3.8 4.2 3.5 3.3 10.5 13.6 15.0 12.1 11.1
SWX § SOUTHWEST GAS CORP DEC 7.4 6.9 5.9 5.7 4.6 3.2 3.0 2.7 2.6 2.3 10.7 10.5 9.4 9.2 8.2UGI † UGI CORP SEP 3.9 3.1 3.8 4.7 4.5 2.8 2.4 3.6 4.2 4.4 11.8 9.5 12.3 15.3 17.2WGL † WGL HOLDINGS INC SEP 3.3 5.8 4.3 4.1 4.5 1.9 3.5 3.1 3.1 3.7 6.3 11.3 9.9 9.8 11.2
MULTI-UTILITIES‡LNT † ALLIANT ENERGY CORP DEC 11.7 11.0 8.7 9.0 3.8 3.3 3.2 3.2 3.2 1.3 11.4 10.6 10.2 10.2 4.0AEE [] AMEREN CORP DEC 8.8 NM 6.9 1.8 8.6 2.4 NM 2.2 0.6 2.6 7.8 NM 6.6 1.8 8.3AVA § AVISTA CORP DEC 6.9 5.1 6.2 5.9 5.8 2.6 1.8 2.5 2.4 2.4 8.7 6.4 8.7 8.5 8.5BKH † BLACK HILLS CORP DEC 9.1 7.5 3.2 5.3 6.2 3.0 2.3 1.0 2.0 2.4 9.1 7.2 3.5 6.3 7.4CMS [] CMS ENERGY CORP DEC 6.9 5.9 6.4 5.6 3.4 2.6 2.2 2.6 2.2 1.3 13.6 12.1 14.2 12.9 7.8
CNP [] CENTERPOINT ENERGY INC DEC 3.8 5.6 9.1 5.0 4.5 1.4 1.9 3.7 2.2 1.9 7.2 9.8 20.8 15.1 15.9ED [] CONSOLIDATED EDISON INC DEC 8.6 9.4 8.2 7.5 6.7 2.6 2.8 2.8 2.8 2.6 8.8 9.8 9.3 9.3 8.7DTE [] DTE ENERGY CO DEC 6.8 7.6 8.0 7.4 6.6 2.5 2.5 2.8 2.6 2.2 8.6 9.3 10.4 9.7 8.7D [] DOMINION RESOURCES INC DEC 13.6 2.5 9.8 19.5 8.5 3.7 0.7 3.2 6.9 3.0 16.1 2.9 12.0 25.6 12.1TEG [] INTEGRYS ENERGY GROUP INC DEC 6.2 7.0 4.9 4.3 NM 3.2 2.9 2.3 2.0 NM 11.0 9.7 7.8 7.7 NM
MDU † MDU RESOURCES GROUP INC DEC 6.3 NM 5.6 6.2 NM 4.1 NM 3.5 4.0 NM 10.2 NM 8.3 9.3 NMNI [] NISOURCE INC DEC 8.7 8.1 5.0 4.6 3.5 2.2 1.9 1.5 1.5 1.2 8.6 7.8 6.1 6.0 4.8NWE § NORTHWESTERN CORP DEC 8.1 9.2 8.3 7.0 6.4 2.6 2.9 3.0 2.7 2.6 9.6 11.0 11.0 9.6 9.5PCG [] PG&E CORP DEC 5.3 5.5 5.7 8.0 9.2 1.5 1.6 1.8 2.5 2.9 5.9 6.5 7.2 10.2 12.4PEG [] PUBLIC SERVICE ENTRP GRP INC DEC 12.5 13.0 12.4 13.2 12.8 3.9 4.1 4.7 5.3 5.5 11.1 12.1 14.1 16.9 19.2
SCG [] SCANA CORP DEC 10.5 10.1 8.8 8.2 8.4 3.2 3.0 2.9 3.0 2.9 10.7 10.4 10.2 10.6 10.8SRE [] SEMPRA ENERGY DEC 9.6 9.0 13.6 8.3 13.9 2.7 2.5 4.3 2.5 4.1 9.4 8.5 14.4 8.2 13.2TE [] TECO ENERGY INC DEC 6.9 8.2 8.2 6.9 6.5 2.7 3.4 3.8 3.3 3.0 8.6 10.8 12.3 11.2 10.5VVC † VECTREN CORP DEC 5.5 7.1 6.1 6.3 6.4 2.7 3.2 2.9 2.8 2.9 8.9 10.6 9.8 9.4 9.7WEC [] WISCONSIN ENERGY CORP DEC 12.8 12.9 11.4 10.8 9.1 4.0 3.9 3.8 3.5 3.0 13.8 13.5 13.2 12.3 10.9
INDEPENDENT POWER PRODUCERS & ENERGY TRADE‡AES [] AES CORP DEC 1.8 NM 2.7 NM 5.2 0.7 NM 1.1 NM 2.0 6.4 NM 7.4 NM 17.5NRG [] NRG ENERGY INC DEC NM 6.6 2.2 5.4 10.5 NM 1.8 0.7 1.9 3.8 NM 6.3 2.4 6.0 13.2
OTHER COMPANIES WITH SIGNIFICANT NATURAL GAS OPERATIONSTRP TRANSCANADA CORP DEC 20.3 16.9 17.6 16.0 15.6 3.2 2.7 3.2 2.8 3.5 10.2 8.3 9.6 8.2 10.5
Note: Data as originally reported. ‡S&P 1500 index group. []Company included in the S&P 500. †Company included in the S&P MidCap 400. §Company included in the S&P SmallCap 600. #Of the follow ing calendar year.

54 NATURAL GAS DISTRIBUTION / JULY 2014 INDUSTRY SURVEYS
Debt as a % ofCurrent Ratio Debt / Capital Ratio (%) Net Working Capital
Ticker Company Yr. End 2013 2012 2011 2010 2009 2013 2012 2011 2010 2009 2013 2012 2011 2010 2009
GAS UTILITIES‡GAS [] AGL RESOURCES INC DEC 0.9 0.8 0.9 0.9 1.1 41.7 39.8 42.6 39.2 44.2 NM NM NM NM 865.8ATO † ATMOS ENERGY CORP SEP 0.7 0.6 1.2 0.8 1.1 48.8 45.3 49.4 45.4 49.9 NM NM NM NM NMLG § LACLEDE GROUP INC SEP 1.3 1.4 1.6 1.2 1.2 39.0 26.1 29.0 30.5 33.4 743.8 373.4 265.6 453.8 558.9NFG † NATIONAL FUEL GAS CO SEP 1.5 0.5 0.7 1.5 2.4 31.8 27.5 24.0 29.1 35.6 NM NM NM 417.8 272.4NJR § NEW JERSEY RESOURCES CORP SEP 0.9 1.0 1.0 1.1 1.2 28.8 30.9 27.8 29.8 32.6 NM NM NM 541.5 355.8
NWN § NORTHWEST NATURAL GAS CO DEC 0.8 0.8 0.8 0.7 0.8 47.6 48.5 47.3 46.1 47.7 NM NM NM NM NMOGS † ONE GAS INC DEC 0.8 0.8 0.9 NA NA 34.2 36.3 34.4 NA NA NM NM NM NA NAPNY § PIEDMONT NATURAL GAS CO OCT 0.5 0.5 0.5 0.7 0.9 38.6 37.5 30.9 32.5 35.9 NM NM NM NM NMSTR † QUESTAR CORP DEC 0.6 0.6 0.6 0.6 0.9 40.3 41.0 39.3 37.3 30.1 NM NM NM NM NMSJI § SOUTH JERSEY INDUSTRIES INC DEC 0.6 0.6 0.6 0.7 0.8 37.9 37.8 32.7 29.1 29.1 NM NM NM NM NM
SWX § SOUTHWEST GAS CORP DEC 1.1 0.9 0.5 0.7 0.9 49.4 49.2 43.2 49.1 53.5 NM NM NM NM NMUGI † UGI CORP SEP 1.1 1.0 1.2 0.7 1.1 50.6 51.3 43.9 37.1 49.2 NM NM 924.8 NM NMWGL † WGL HOLDINGS INC SEP 0.9 1.1 1.3 1.3 1.1 20.9 23.3 24.9 26.3 27.8 NM 777.9 396.8 342.3 NM
MULTI-UTILITIES‡LNT † ALLIANT ENERGY CORP DEC 0.7 1.0 1.0 1.3 1.3 46.1 48.4 45.7 46.3 44.4 NM NM NM NM 793.0AEE [] AMEREN CORP DEC 0.8 1.4 1.3 1.5 1.7 35.7 40.8 36.8 40.3 42.6 NM 987.5 NM 726.9 702.3AVA § AVISTA CORP DEC 0.9 0.9 1.0 1.0 0.8 51.1 50.7 50.3 50.6 50.0 NM NM NM NM NMBKH † BLACK HILLS CORP DEC 0.9 0.6 0.9 0.9 1.0 51.6 43.2 51.4 51.9 48.4 NM NM NM NM NMCMS [] CMS ENERGY CORP DEC 1.3 1.3 1.1 1.4 1.4 58.4 61.5 59.9 66.6 65.8 NM NM NM 899.2 773.1
CNP [] CENTERPOINT ENERGY INC DEC 0.9 0.8 0.9 1.0 1.0 46.8 66.0 67.2 59.4 62.7 NM NM NM NM NMED [] CONSOLIDATED EDISON INC DEC 0.8 0.9 1.2 1.5 1.1 33.6 33.2 34.6 37.4 38.1 NM NM NM 935.8 NMDTE [] DTE ENERGY CO DEC 0.9 1.1 1.2 1.2 1.1 39.0 39.8 41.4 42.9 46.6 NM NM NM NM NMD [] DOMINION RESOURCES INC DEC 0.8 0.7 0.8 0.9 1.0 61.9 60.9 59.8 56.3 57.5 NM NM NM NM NMTEG [] INTEGRYS ENERGY GROUP INC DEC 1.2 0.9 1.1 1.2 1.1 38.3 30.8 31.2 35.9 39.9 844.4 NM NM 550.6 656.8
MDU † MDU RESOURCES GROUP INC DEC 1.4 1.3 1.3 1.5 1.6 39.5 37.8 31.7 34.7 36.6 555.3 579.5 434.4 359.3 376.9NI [] NISOURCE INC DEC 0.7 0.7 0.6 0.7 0.7 45.3 44.4 45.3 45.3 46.3 NM NM NM NM NMNWE § NORTHWESTERN CORP DEC 0.7 0.7 0.6 1.0 0.9 53.5 53.8 52.2 57.2 56.4 NM NM NM NM NMPCG [] PG&E CORP DEC 0.8 0.8 0.8 0.8 0.8 46.6 48.4 48.8 49.6 51.4 NM NM NM NM NMPEG [] PUBLIC SERVICE ENTRP GRP INC DEC 1.2 1.0 1.3 1.4 1.1 29.6 27.9 32.2 44.8 46.3 NM NM 782.1 499.3 NM
SCG [] SCANA CORP DEC 1.0 0.8 0.9 0.9 1.2 45.7 45.9 45.8 44.6 49.1 NM NM NM NM NMSRE [] SEMPRA ENERGY DEC 0.9 0.9 0.6 0.9 0.6 44.8 48.1 46.6 45.4 41.4 NM NM NM NM NMTE [] TECO ENERGY INC DEC 1.1 1.4 0.8 1.0 0.8 50.5 53.5 52.5 59.2 60.6 NM NM NM NM NMVVC † VECTREN CORP DEC 1.2 0.9 0.9 0.8 0.8 43.9 41.8 43.3 42.3 45.3 NM NM NM NM NMWEC [] WISCONSIN ENERGY CORP DEC 1.0 0.9 1.0 0.8 0.8 50.6 51.7 53.6 43.9 45.4 NM NM NM NM NM
INDEPENDENT POWER PRODUCERS & ENERGY TRADE‡AES [] AES CORP DEC 1.0 1.0 1.1 1.2 1.3 77.3 75.9 73.2 69.2 75.5 NM NM NM NM 828.4NRG [] NRG ENERGY INC DEC 1.8 1.7 1.3 1.7 1.7 61.5 60.4 51.6 49.4 44.7 464.8 479.8 506.0 344.5 320.8
OTHER COMPANIES WITH SIGNIFICANT NATURAL GAS OPERATIONSTRP TRANSCANADA CORP DEC 0.6 0.5 0.6 0.6 0.6 49.9 47.7 47.5 48.1 48.6 NM NM NM NM NM
Note: Data as originally reported. ‡S&P 1500 index group. []Company included in the S&P 500. †Company included in the S&P MidCap 400. §Company included in the S&P SmallCap 600. #Of the follow ing calendar year.

INDUSTRY SURVEYS NATURAL GAS DISTRIBUTION / JULY 2014 55
Price / Earnings Ratio (High-Low) Dividend Payout Ratio (%) Dividend Yield (High-Low, %)
Ticker Company Yr. End 2013 2012 2011 2010 2009 2013 2012 2011 2010 2009
GAS UTILITIES‡GAS [] AGL RESOURCES INC DEC 19 - 15 18 - 16 20 - 16 13 - 11 13 - 8 71 75 89 58 60 4.8 - 3.8 4.8 - 4.1 5.6 - 4.3 5.1 - 4.4 7.2 - 4.6ATO † ATMOS ENERGY CORP SEP 19 - 14 18 - 14 16 - 13 14 - 12 14 - 10 55 65 62 60 63 4.0 - 3.0 4.5 - 3.7 4.8 - 3.8 5.2 - 4.2 6.6 - 4.4LG § LACLEDE GROUP INC SEP 24 - 18 16 - 13 15 - 11 16 - 13 16 - 10 84 59 56 65 53 4.5 - 3.5 4.5 - 3.8 4.9 - 3.8 5.1 - 4.2 5.3 - 3.2NFG † NATIONAL FUEL GAS CO SEP 23 - 16 21 - 16 24 - 14 25 - 16 41 - 21 48 54 45 50 105 3.1 - 2.0 3.5 - 2.5 3.1 - 1.8 3.2 - 2.0 4.9 - 2.5NJR § NEW JERSEY RESOURCES CORP SEP 17 - 14 22 - 17 21 - 16 16 - 12 65 - 46 59 69 59 48 191 4.1 - 3.4 4.0 - 3.1 3.6 - 2.9 4.1 - 3.1 4.1 - 2.9
NWN § NORTHWEST NATURAL GAS CO DEC 21 - 18 23 - 18 20 - 17 19 - 15 16 - 13 81 80 73 62 57 4.6 - 3.9 4.4 - 3.5 4.4 - 3.6 4.1 - 3.3 4.2 - 3.4OGS † ONE GAS INC DEC NA - NA NA - NA NA - NA NA - NA NA - NA NA NA NA NA NA NA - NA NA - NA NA - NA NA - NA NA - NAPNY § PIEDMONT NATURAL GAS CO OCT 20 - 17 21 - 17 22 - 16 15 - 12 19 - 12 68 71 73 57 64 4.0 - 3.5 4.2 - 3.4 4.4 - 3.3 4.7 - 3.7 5.2 - 3.3STR † QUESTAR CORP DEC 28 - 22 18 - 14 17 - 14 48 - 14 19 - 11 77 55 53 50 22 3.6 - 2.7 3.9 - 3.1 3.8 - 3.1 3.6 - 1.0 2.0 - 1.2SJI § SOUTH JERSEY INDUSTRIES INC DEC 24 - 20 19 - 15 19 - 14 24 - 17 21 - 16 70 55 50 60 62 3.6 - 2.9 3.6 - 2.8 3.5 - 2.6 3.6 - 2.5 3.8 - 3.0
SWX § SOUTHWEST GAS CORP DEC 18 - 13 16 - 13 18 - 13 16 - 11 15 - 9 41 40 43 43 48 3.1 - 2.3 2.9 - 2.5 3.3 - 2.4 3.8 - 2.7 5.5 - 3.2UGI † UGI CORP SEP 18 - 13 19 - 15 16 - 12 14 - 10 12 - 9 45 60 49 38 33 3.4 - 2.6 4.1 - 3.2 4.2 - 3.0 3.8 - 2.8 3.7 - 2.9WGL † WGL HOLDINGS INC SEP 30 - 24 17 - 13 20 - 15 18 - 14 15 - 12 106 58 67 69 60 4.3 - 3.5 4.4 - 3.5 4.4 - 3.4 4.8 - 3.7 5.1 - 4.1
MULTI-UTILITIES‡LNT † ALLIANT ENERGY CORP DEC 16 - 13 16 - 14 16 - 12 14 - 11 31 - 20 57 61 62 60 149 4.3 - 3.5 4.3 - 3.8 5.0 - 3.8 5.4 - 4.2 7.4 - 4.8AEE [] AMEREN CORP DEC 18 - 15 NM- NM 16 - 12 52 - 40 13 - 7 76 NM 72 266 55 5.2 - 4.3 5.6 - 4.5 6.1 - 4.6 6.7 - 5.2 7.9 - 4.4AVA § AVISTA CORP DEC 16 - 13 21 - 17 15 - 12 14 - 11 14 - 8 66 88 64 60 51 5.1 - 4.2 5.1 - 4.1 5.2 - 4.1 5.4 - 4.4 6.4 - 3.6BKH † BLACK HILLS CORP DEC 21 - 14 18 - 15 35 - 26 20 - 15 14 - 7 58 73 145 82 70 4.1 - 2.8 4.9 - 4.0 5.7 - 4.2 5.6 - 4.2 9.8 - 5.1CMS [] CMS ENERGY CORP DEC 18 - 14 17 - 15 14 - 10 13 - 9 19 - 11 60 67 51 44 57 4.1 - 3.4 4.5 - 3.8 5.0 - 3.8 4.7 - 3.4 5.0 - 3.1
CNP [] CENTERPOINT ENERGY INC DEC 35 - 26 22 - 18 12 - 8 16 - 5 15 - 8 114 83 44 72 75 4.3 - 3.2 4.5 - 3.7 5.2 - 3.7 13.8 - 4.6 8.8 - 5.1ED [] CONSOLIDATED EDISON INC DEC 18 - 15 17 - 14 17 - 14 15 - 12 15 - 10 68 62 67 68 75 4.5 - 3.8 4.5 - 3.7 4.9 - 3.8 5.7 - 4.7 7.2 - 5.1DTE [] DTE ENERGY CO DEC 19 - 16 16 - 13 13 - 10 13 - 11 14 - 7 69 62 55 58 65 4.3 - 3.5 4.6 - 3.9 5.4 - 4.2 5.3 - 4.4 9.1 - 4.7D [] DOMINION RESOURCES INC DEC 22 - 17 98 - 86 22 - 17 9 - 7 18 - 13 73 370 80 36 81 4.3 - 3.3 4.3 - 3.8 4.7 - 3.7 5.1 - 4.1 6.4 - 4.4TEG [] INTEGRYS ENERGY GROUP INC DEC 15 - 12 17 - 14 19 - 15 19 - 14 NM- NM 62 74 94 95 NM 5.2 - 4.3 5.4 - 4.4 6.4 - 5.0 6.7 - 5.0 14.0 - 6.0
MDU † MDU RESOURCES GROUP INC DEC 21 - 15 NM- NM 20 - 15 19 - 13 NM- NM 47 NM 55 49 NM 3.2 - 2.2 3.4 - 2.9 3.6 - 2.7 3.7 - 2.6 4.9 - 2.6NI [] NISOURCE INC DEC 21 - 16 19 - 16 22 - 16 17 - 13 19 - 9 62 67 85 87 110 3.9 - 2.9 4.2 - 3.6 5.2 - 3.8 6.5 - 5.1 11.8 - 5.8NWE § NORTHWESTERN CORP DEC 19 - 14 14 - 12 14 - 11 14 - 11 13 - 9 62 55 56 64 66 4.3 - 3.2 4.5 - 3.9 5.3 - 3.9 5.7 - 4.4 7.3 - 5.0PCG [] PG&E CORP DEC 27 - 22 24 - 21 23 - 18 17 - 12 14 - 10 99 95 87 63 51 4.6 - 3.8 4.6 - 3.9 4.9 - 3.8 5.2 - 3.7 4.9 - 3.7PEG [] PUBLIC SERVICE ENTRP GRP INC DEC 15 - 12 14 - 11 13 - 10 11 - 9 11 - 8 59 56 49 44 42 4.8 - 3.9 4.9 - 4.2 4.9 - 3.9 4.7 - 3.9 5.6 - 3.9
SCG [] SCANA CORP DEC 16 - 13 16 - 14 15 - 12 14 - 11 14 - 9 60 62 64 64 66 4.5 - 3.7 4.6 - 3.9 5.6 - 4.3 5.6 - 4.5 7.2 - 4.9SRE [] SEMPRA ENERGY DEC 23 - 17 20 - 15 10 - 8 19 - 15 12 - 8 61 67 34 52 34 3.6 - 2.7 4.4 - 3.3 4.3 - 3.4 3.6 - 2.8 4.3 - 2.7TE [] TECO ENERGY INC DEC 21 - 18 17 - 14 15 - 12 16 - 13 17 - 8 96 77 67 73 80 5.4 - 4.6 5.5 - 4.5 5.4 - 4.3 5.6 - 4.5 9.5 - 4.8VVC † VECTREN CORP DEC 23 - 18 16 - 14 18 - 14 17 - 13 16 - 11 86 72 80 83 82 4.8 - 3.8 5.1 - 4.6 5.9 - 4.5 6.3 - 4.9 7.4 - 5.0WEC [] WISCONSIN ENERGY CORP DEC 18 - 15 18 - 14 16 - 12 16 - 12 16 - 11 57 51 47 41 42 3.9 - 3.2 3.6 - 2.9 3.9 - 2.9 3.4 - 2.6 3.7 - 2.7
INDEPENDENT POWER PRODUCERS & ENERGY TRADE‡AES [] AES CORP DEC 41 - 28 NM- NM 23 - 15 NM- NM 14 - 4 42 NM 0 NM 0 1.5 - 1.0 0.4 - 0.3 0.0 - 0.0 0.0 - 0.0 0.0 - 0.0NRG [] NRG ENERGY INC DEC NM- NM 10 - 6 33 - 22 14 - 10 8 - 4 NM 8 0 0 0 2.0 - 1.5 1.3 - 0.8 0.0 - 0.0 0.0 - 0.0 0.0 - 0.0
OTHER COMPANIES WITH SIGNIFICANT NATURAL GAS OPERATIONSTRP TRANSCANADA CORP DEC 22 - 19 26 - 21 21 - 17 22 - 14 17 - 10 77 95 78 88 67 4.2 - 3.6 4.4 - 3.7 4.6 - 3.7 6.1 - 4.1 6.7 - 3.9
Note: Data as originally reported. ‡S&P 1500 index group. []Company included in the S&P 500. †Company included in the S&P MidCap 400. §Company included in the S&P SmallCap 600. #Of the follow ing calendar year.
20092013 2012 2011 2010

56 NATURAL GAS DISTRIBUTION / JULY 2014 INDUSTRY SURVEYS
Earnings per Share ($) Tangible Book Value per Share ($) Share Price (High-Low, $)
Ticker Company Yr. End 2013 2012 2011 2010 2009 2013 2012 2011 2010 2009 2013 2012 2011 2010 2009
GAS UTILITIES‡GAS [] AGL RESOURCES INC DEC 2.65 2.32 2.14 3.02 2.89 13.21 12.56 11.97 17.88 17.57 49.31 - 38.86 42.88 - 36.59 43.69 - 34.08 40.08 - 34.21 37.52 - 24.02ATO † ATMOS ENERGY CORP SEP 2.54 2.12 2.18 2.22 2.10 20.29 17.93 16.78 15.95 15.52 47.44 - 34.87 37.33 - 30.39 35.55 - 28.51 31.99 - 25.86 30.32 - 20.07LG § LACLEDE GROUP INC SEP 2.03 2.80 2.87 2.43 2.93 24.44 26.69 25.56 24.02 23.32 48.50 - 37.43 44.04 - 36.53 42.81 - 32.90 37.82 - 30.81 48.33 - 29.26NFG † NATIONAL FUEL GAS CO SEP 3.11 2.65 3.13 2.70 1.26 26.17 23.46 22.78 21.19 19.41 72.53 - 48.51 56.97 - 41.57 75.98 - 44.51 66.52 - 42.83 52.00 - 26.67NJR § NEW JERSEY RESOURCES CORP SEP 2.76 2.24 2.45 2.84 0.65 21.15 19.55 18.74 17.62 16.59 47.60 - 39.06 50.28 - 38.51 50.48 - 39.60 44.10 - 33.49 42.37 - 29.95
NWN § NORTHWEST NATURAL GAS CO DEC 2.24 2.23 2.39 2.73 2.83 27.77 27.23 26.70 25.99 24.88 46.55 - 39.96 50.80 - 41.01 48.98 - 39.63 50.86 - 41.05 46.47 - 37.71OGS † ONE GAS INC DEC NA NA NA NA NA NA NA NA NA NA NA - NA NA - NA NA - NA NA - NA NA - NAPNY § PIEDMONT NATURAL GAS CO OCT 1.80 1.67 1.58 1.96 1.68 14.98 13.54 13.11 12.67 12.00 35.53 - 30.89 34.63 - 28.51 34.74 - 25.86 30.10 - 23.87 31.98 - 20.68STR † QUESTAR CORP DEC 0.92 1.20 1.17 1.09 2.26 6.79 5.86 5.75 5.81 19.66 26.01 - 19.99 21.47 - 17.20 20.06 - 16.36 52.55 - 14.86 43.46 - 24.85SJI § SOUTH JERSEY INDUSTRIES INC DEC 2.58 3.02 3.00 2.25 1.97 25.28 J 23.26 J 20.66 J 19.08 J 18.24 J 62.28 - 50.52 57.99 - 45.81 58.03 - 42.85 54.24 - 37.19 40.78 - 31.98
SWX § SOUTHWEST GAS CORP DEC 3.14 2.89 2.45 2.29 1.95 30.51 28.39 26.68 25.60 24.44 56.03 - 42.02 46.08 - 39.01 43.20 - 32.12 37.25 - 26.28 29.48 - 17.08UGI † UGI CORP SEP 2.44 1.77 2.09 2.38 2.38 (8.64) (11.04) 2.39 1.01 (1.44) 43.24 - 32.90 33.58 - 26.01 33.53 - 24.07 32.49 - 23.83 27.38 - 21.14WGL † WGL HOLDINGS INC SEP 1.55 2.71 2.29 2.17 2.40 24.62 24.60 23.42 22.63 21.89 46.96 - 37.96 44.97 - 35.96 44.99 - 34.71 40.00 - 31.00 35.52 - 28.59
MULTI-UTILITIES‡LNT † ALLIANT ENERGY CORP DEC 3.29 2.93 2.73 2.62 1.01 29.58 28.25 27.14 26.07 25.03 54.18 - 43.73 47.65 - 41.86 44.49 - 33.91 37.65 - 29.20 31.53 - 20.31AEE [] AMEREN CORP DEC 2.11 (4.01) 2.15 0.58 2.78 25.19 25.51 30.92 30.42 29.04 37.31 - 30.64 35.30 - 28.43 34.10 - 25.55 29.89 - 23.09 35.35 - 19.51AVA § AVISTA CORP DEC 1.85 1.32 1.73 1.66 1.59 19.68 19.01 19.03 18.90 18.36 29.26 - 24.10 28.05 - 22.78 26.53 - 21.13 22.81 - 18.46 22.44 - 12.67BKH † BLACK HILLS CORP DEC 2.62 2.02 1.01 1.76 2.04 21.37 19.80 19.40 18.88 18.65 55.09 - 36.89 37.00 - 30.29 34.85 - 25.83 34.49 - 25.65 27.98 - 14.54CMS [] CMS ENERGY CORP DEC 1.71 1.43 1.65 1.50 0.87 12.98 12.10 11.92 11.19 11.42 29.98 - 24.60 24.98 - 21.12 22.37 - 16.96 19.25 - 14.09 16.13 - 9.98
CNP [] CENTERPOINT ENERGY INC DEC 0.73 0.98 1.81 1.08 1.02 8.13 6.62 5.93 3.53 2.41 25.65 - 19.33 21.81 - 18.07 21.47 - 15.09 17.00 - 5.67 14.87 - 8.66ED [] CONSOLIDATED EDISON INC DEC 3.62 3.88 3.59 3.49 3.16 40.33 39.05 37.57 36.45 34.96 64.03 - 54.17 65.98 - 53.63 62.74 - 48.55 51.03 - 41.52 46.35 - 32.56DTE [] DTE ENERGY CO DEC 3.76 3.89 4.19 3.75 3.24 32.64 30.29 29.05 27.36 25.39 73.32 - 60.33 62.56 - 52.46 55.28 - 43.22 49.06 - 41.25 44.96 - 23.32D [] DOMINION RESOURCES INC DEC 3.09 0.57 2.46 5.03 2.17 13.76 11.98 13.45 14.14 11.92 67.97 - 51.92 55.62 - 48.87 53.59 - 42.06 45.12 - 36.12 39.79 - 27.15TEG [] INTEGRYS ENERGY GROUP INC DEC 4.37 3.70 2.90 2.85 (0.96) 31.98 29.89 28.98 28.92 28.65 63.58 - 52.55 61.92 - 50.80 54.61 - 42.76 54.45 - 40.53 45.10 - 19.44
MDU † MDU RESOURCES GROUP INC DEC 1.47 (0.08) 1.19 1.29 (0.67) 11.40 10.49 11.15 10.71 10.10 30.97 - 21.50 23.21 - 19.59 24.05 - 18.00 24.15 - 17.11 24.22 - 12.79NI [] NISOURCE INC DEC 1.57 1.41 1.08 1.06 0.84 6.20 5.13 3.63 3.36 3.10 33.48 - 24.85 26.15 - 22.32 23.97 - 17.71 17.96 - 14.13 15.82 - 7.79NWE § NORTHWESTERN CORP DEC 2.46 2.67 2.55 2.14 2.03 17.44 15.55 13.89 12.84 12.00 47.18 - 35.06 37.96 - 32.98 36.61 - 27.38 30.60 - 23.77 26.85 - 18.48PCG [] PG&E CORP DEC 1.83 1.92 2.10 2.88 3.32 31.41 J 30.21 29.20 28.37 27.64 48.50 - 39.91 47.03 - 39.40 47.99 - 36.84 48.63 - 34.95 45.79 - 34.50PEG [] PUBLIC SERVICE ENTRP GRP INC DEC 2.46 2.52 2.78 3.08 3.15 22.85 21.21 20.01 18.74 17.09 37.00 - 29.70 34.07 - 28.92 35.48 - 27.97 34.93 - 29.01 34.14 - 23.65
SCG [] SCANA CORP DEC 3.40 3.20 3.01 2.99 2.85 33.08 31.47 29.92 29.15 27.71 54.41 - 44.75 50.34 - 43.32 45.48 - 34.64 41.97 - 34.23 38.64 - 26.01SRE [] SEMPRA ENERGY DEC 4.10 3.56 5.66 3.02 4.60 39.10 36.04 34.82 35.30 34.41 93.00 - 70.61 72.87 - 54.69 55.97 - 44.78 56.61 - 43.91 57.18 - 36.43TE [] TECO ENERGY INC DEC 0.92 1.14 1.27 1.12 1.00 10.74 10.58 10.25 9.84 9.47 19.22 - 16.15 19.41 - 16.12 19.66 - 15.82 18.11 - 14.46 16.71 - 8.41VVC † VECTREN CORP DEC 1.66 1.94 1.73 1.65 1.65 15.36 15.37 14.69 14.65 14.24 37.88 - 29.47 30.75 - 27.46 30.65 - 23.65 27.85 - 21.66 26.90 - 18.08WEC [] WISCONSIN ENERGY CORP DEC 2.54 2.37 2.20 1.95 1.62 16.78 16.12 15.28 14.37 13.37 45.00 - 37.03 41.48 - 33.62 35.38 - 27.00 30.51 - 23.42 25.31 - 18.16
INDEPENDENT POWER PRODUCERS & ENERGY TRADE‡AES [] AES CORP DEC 0.38 (1.21) 0.59 (0.11) 1.09 3.34 2.88 2.15 5.95 4.29 15.54 - 10.66 14.01 - 9.52 13.50 - 9.00 14.24 - 8.82 15.44 - 4.80NRG [] NRG ENERGY INC DEC (1.22) 2.37 0.78 1.86 3.70 20.00 21.26 18.38 17.84 15.91 30.28 - 22.60 23.78 - 14.29 25.66 - 17.47 25.70 - 18.22 29.26 - 15.19
OTHER COMPANIES WITH SIGNIFICANT NATURAL GAS OPERATIONSTRP TRANSCANADA CORP DEC 2.28 1.85 2.14 1.78 2.02 17.30 17.41 17.40 17.12 16.00 49.65 - 42.39 47.78 - 39.74 45.09 - 36.12 38.59 - 25.80 34.59 - 20.01
Note: Data as originally reported. ‡S&P 1500 index group. []Company included in the S&P 500. †Company included in the S&P MidCap 400. §Company included in the S&P SmallCap 600. #Of the follow ing calendar year. J-This amount includes intangibles that cannot be identif ied.
The analysis and opinion set forth in this publication are provided by S&P Capital IQ Equity Research and are prepared separately from any other analytic activity of Standard & Poor’s.
In this regard, S&P Capital IQ Equity Research has no access to nonpublic information received by other units of Standard & Poor’s.
The accuracy and completeness of information obtained from third-party sources, and the opinions based on such information, are not guaranteed.

INDUSTRY SURVEYS NATURAL GAS DISTRIBUTION / JULY 2014 57
General Disclaimers S&P Capital IQ’s Industry Surveys Reports (the “Industry Surveys”) have been prepared and issued by S&P Capital IQ and/or one of its affiliates. In the United States and United Kingdom, the Industry Surveys are prepared and issued by Standard & Poor’s Financial Services LLC; in Hong Kong, by Standard & Poor’s Investment Advisory Services (HK) Limited, which is regulated by the Hong Kong Securities Futures Commission; in Singapore, by McGraw Hill Financial Singapore Pte. Limited, which is regulated by the Monetary Authority of Singapore; in Malaysia, by Standard & Poor’s Malaysia Sdn Bhd, which is regulated by the Securities Commission of Malaysia; in Australia, by Standard & Poor’s Information Services (Australia) Pty Ltd, which is regulated by the Australian Securities & Investments Commission; and in Japan, by McGraw Hill Financial Japan KK, which is registered by Kanto Financial Bureau. No content (including ratings, credit-related analyses and data, valuations, model, software or other application or output therefrom) or any part thereof (Content) may be modified, reverse engineered, reproduced or distributed in any form by any means, or stored in a database or retrieval system, without the prior written permission of Standard & Poor’s Financial Services LLC or its affiliates (collectively, S&P). The Content shall not be used for any unlawful or unauthorized purposes. S&P and any third-party providers, as well as their directors, officers, shareholders, employees or agents (collectively S&P Parties) do not guarantee the accuracy, completeness, timeliness or availability of the Content. S&P Parties are not responsible for any errors or omissions (negligent or otherwise), regardless of the cause, for the results obtained from the use of the Content, or for the security or maintenance of any data input by the user. The Content is provided on an “as is” basis. S&P PARTIES DISCLAIM ANY AND ALL EXPRESS OR IMPLIED WARRANTIES, INCLUDING, BUT NOT LIMITED TO, ANY WARRANTIES OF MERCHANTABILITY OR FITNESS FOR A PARTICULAR PURPOSE OR USE, FREEDOM FROM BUGS, SOFTWARE ERRORS OR DEFECTS, THAT THE CONTENT’S FUNCTIONING WILL BE UNINTERRUPTED OR THAT THE CONTENT WILL OPERATE WITH ANY SOFTWARE OR HARDWARE CONFIGURATION. In no event shall S&P Parties be liable to any party for any direct, indirect, incidental, exemplary, compensatory, punitive, special or consequential damages, costs, expenses, legal fees, or losses (including, without limitation, lost income or lost profits and opportunity costs or losses caused by negligence) in connection with any use of the Content even if advised of the possibility of such damages. Credit-related and other analyses, including ratings, and statements in the Content are statements of opinion as of the date they are expressed and not statements of fact. S&P’s opinions, analyses and rating acknowledgment decisions (described below) are not recommendations to purchase, hold, or sell any securities or to make any investment decisions, and do not address the suitability of any security. S&P assumes no obligation to update the Content following publication in any form or format. The Content should not be relied on and is not a substitute for the skill, judgment and experience of the user, its management, employees, advisers and/or clients when making investment and other business decisions. S&P does not act as a fiduciary or an investment adviser except where registered as such. While S&P has obtained information from sources it believes to be reliable, S&P does not perform an audit and undertakes no duty of due diligence or independent verification of any information it receives. S&P keeps certain activities of its business units separate from each other in order to preserve the independence and objectivity of their respective activities. As a result, certain business units of S&P may have information that is not available to other S&P business units. S&P has established policies and procedures to maintain the confidentiality of certain non-public information received in connection with each analytical process. S&P provides a wide range of services to, or relating to, many organizations, including issuers or underwriters of securities or obligors, investment advisers, broker-dealers, investment banks, other financial institutions and financial intermediaries. As a result, S&P may receive fees or other economic benefits from organizations whose securities or services it may recommend, analyze, rate, include in model portfolios, evaluate, price or otherwise address. The Industry Surveys are not intended to be investment advice and do not constitute any form of invitation or inducement by S&P Capital IQ to engage in investment activity. This material is not intended as an offer or solicitation for the purchase or sale of any security or other financial instrument. Any opinions expressed herein are given in good faith, are subject to change without notice, and are only current as of the stated date of their issue. Past performance is not necessarily indicative of future results. For details on the S&P Capital IQ conflict-of-interest policies, please visit: www.spcapitaliq.com/Policies
Notice to all Non-US Residents: S&P Capital IQ’s Industry Surveys may be distributed in certain localities, countries and/or jurisdictions (“Territories”) by independent third parties or independent intermediaries and/or distributors (the “Intermediaries” or “Distributors”). Intermediaries are not acting as agents or representatives of S&P Capital IQ. In Territories where an Intermediary distributes S&P Capital IQ’s Industry Surveys, the Intermediary, and not S&P Capital IQ, is solely responsible for complying with all applicable regulations, laws, rules, circulars, codes and guidelines established by local and/or regional regulatory authorities, including laws in connection with the distribution of third-party investment research, licensing requirements, supervisory and record keeping obligations that the Intermediary may have under the applicable laws and regulations of the territories where it distributes the Industry Surveys. Industry Surveys are not directed to, or intended for distribution to or use by, any person or entity who is a citizen or resident of or located in any locality, state, country or other jurisdiction where such distribution, publication, availability or use would be contrary to law or regulation or which would subject S&P Capital IQ or its affiliates to any registration or licensing requirements in such jurisdiction. Industry Surveys are not directed to, or intended for distribution to or use by, any person or entity who is not in a class qualified to receive Industry Surveys (e.g., a qualified person and/or investor), as defined by the local laws or regulations in the country or jurisdiction where the person is domiciled, a citizen or resident of, or the entity is legally registered or domiciled. S&P Capital IQ’s Industry Surveys are not intended for distribution in or directed to entities, residents or investors in: Albania, Belarus, Bosnia, Burma, Cote d’Ivoire, Croatia, Cuba, Democratic Republic of the Congo, Former Yugoslav Republic of Macedonia, Herzegovina, Iran, Iraq, Kosovo, Lebanon, Libya, Montenegro and Serbia, North Korea, Somali, Sudan, Syria, Taiwan, Yemen and Zimbabwe. For residents of Australia: Industry Surveys are issued and/or distributed in Australia by SPIS. Any express or implied opinion contained in an Industry Survey is limited to “General Advice” and based solely on consideration of the investment merits of the financial product(s) alone. The information in an Industry Survey has not been prepared for use by retail investors and has been prepared without taking account of any particular investor’s financial or investment objectives, financial situation or needs. Before acting on any advice, any investor using the advice should consider its appropriateness having regard to their own or their clients’ objectives, financial situation and needs. Investors should obtain a Product Disclosure Statement relating to the product and consider the statement before making any decision or recommendation about whether to acquire the product. Each opinion must be weighed solely as one factor in any investment decision made by or on behalf of any adviser and any such adviser must accordingly make their own assessment taking into account an individual’s particular circumstances. SPIS holds an Australian Financial Services License Number 258896. Please refer to the SPIS Financial Services Guide for more information at: www.spcapitaliq.com/FinancialServicesGuide For residents of China: Industry Surveys are not distributed in or directed to residents in The People’s Republic of China. Neither S&P Capital IQ nor its affiliates target investors in China. For residents of Kuwait: The Distributor, and not S&P Capital IQ, is responsible for complying with all relevant licensing requirements as set forth by the Kuwait Capital Markets Law (“CML”) and Kuwait Capital Markets Authority (“CMA”) and with all relevant rules and regulations set out in the CML and CMA rule books. For residents of Malaysia: All queries in relation to Industry Surveys should be referred to Ahmad Halim at [email protected]. For residents of Mexico: S&P Capital IQ is not regulated or supervised by the Mexican National Banking and Securities Commission (“CNBV”). S&P Capital IQ has a licensed rating agency affiliate in Mexico (Standard & Poor’s, S.A. De C.V.), of which S&P maintains firewalls and seeks to avoid conflicts of interest, pursuant to approved policies. For residents of Qatar: The Distributor, and not S&P Capital IQ, is responsible for complying with all relevant licensing requirements as set forth by the Qatar Financial Markets Authority or the Qatar Central Bank, and with all relevant rules and regulations set out in the Qatar Financial Markets Authority’s rule book, including third-party branded investment research distribution of securities that are admitted for trading on a Qatari securities exchange (Admitted Securities). Copyright © 2014 Standard & Poor’s Financial Services LLC. All rights reserved. STANDARD & POOR’S, S&P, S&P 500, S&P EUROPE 350 and STARS are registered trademarks of Standard & Poor’s Financial Services LLC. S&P CAPITAL IQ is a trademark of Standard & Poor’s Financial Services LLC.