Embed Size (px)
Citation preview
Effects of Alpha/Theta Neurofeedback
Training for Women with Moderate to Severe
Trait Anxiety:
A Randomized, Single-Blind, Clinical Trial
Dissertation
der Mathematisch-Naturwissenschaftlichen Fakultät der
Eberhard Karls Universität Tübingen
zur Erlangung des Grades eines Doktors der
Naturwissenschaften
(Dr. rer. nat.)
vorgelegt von
Dipl.-Psych. Bettina Viereck, M.Sc., M.F.A.
aus Lüneburg
Tübingen
2018

ii
Gedruckt mit Genehmigung der Mathematisch-Naturwissenschaftlichen Fakultät der Eberhard Karls Universität Tübingen.
iii
Tag der mündlichen Prüfung: 11.7.2018
Dekan: Prof. Dr. Wolfgang Rosenstiel
1. Berichterstatter: PD Dr. Ute Strehl
2. Berichterstatter: Prof. Dr. Martin Hautzinger
Declaration
I hereby declare that I have produced the work entitled: “Effects of Alpha/Theta
Neurofeedback Training for Women with Moderate to Severe Trait Anxiety: A Randomized,
Single-Blind, Clinical Trial”, submitted for the award of a doctorate, on my own (without
external help), have used only the sources and aids indicated and have marked passages included
from other works, as such, whether verbatim or in content. I swear upon oath that these
statements are true and that I have not concealed anything. I am aware that making a false
declaration under oath is punishable by a term of imprisonment of up to three years or by a fine.
a
iv
Abstract
Introduction: Alpha/Theta neurofeedback treatment (A/T NFT) has been administered
to adults with anxiety disorders since the late 1960s, yet the efficacy of this treatment remains
unclear. The present, single-blind study, for the first time, uses an active placebo NFT control
group to test the A/T NFT protocol for trait anxiety on prodromal and clinical adult female
participants. The effects this treatment has on activation and arousal states, self-perceived
anxiety levels, neural oscillations, and other parameters were assessed.
Methods: Twenty-seven women ranging in age from 19 through 69 who had scored
higher than the 66th percentile in the STAI trait anxiety sub-scale (75% of whom had previously
been diagnosed with an anxiety disorder) were randomly assigned to either the experimental
(EG) or the control group (CG). The EG (n = 14) received ten sessions of A/T NFT in which
alpha and theta EEG amplitudes were uptrained at Pz. The CG (n = 13) received ten sessions of
active placebo NFT at Pz. During successive sessions beta- (15–19 Hz) and high beta amplitudes
(20- 24 Hz) were uptrained or downtrained. Growth curve modeling (GCM) and traditional 2x5
repeated measures ANOVA were performed on the NFT sessions data to model individual and
average group learning curves. Cognitive variables, such as treatment outcome expectancy,
personal attribution styles, use, types, and efficacy of cognitive strategies in NFT, and
correlations between NFT learning performance, time of day the NFT sessions were held, and a
participant’s best or worst time to learn, were also investigated.
Results: The analysis of individual learning curves, GCM, and ANOVA all confirmed
that the majority of participants of the EG up-regulated absolute and relative A+T amplitudes
within a NFT session, but so did the participants of the CG. However, a non-significant trend for
the EG to have steeper learning curves was observed. Participants of both the EG and the CG felt
significantly more deactivated by the end of a NFT session and reduced their self-perceived

v
anxiety on all anxiety measures (STAI, BAI, GAD-7) by the end of the NFT trial. Although a
trend could be observed that the EG reduced anxiety scores more than the CG, these differences
did not rise to statistical significance. Lastly, no significant changes in the pre-post trial QEEG
were found, although a trend of higher combined relative A+T power at the end of the trial was
observed in the EG. In the EG the use of mental strategies was correlated with lower T/A ratio
difference scores between the beginning and the end of the NFT trial but not with increased
relative and absolute T+A amplitudes. The Time-of-day participants prefer or avoid learning did
not correlate significantly with alpha or theta NFT amplitudes, i.e., NFT sessions being held
during sub-optimal times of day were not associated with poorer learning performance.
Conclusions: For both EG and CG absolute and relative T+A amplitudes increased
within sessions and absolute and relative alpha increased across sessions although the CG
protocol had not included an uptraining of alpha or theta amplitudes, nor low beta amplitudes
(below 15 Hz) which may have represented upper alpha peak frequency in some of the younger
participants. Thus, upregulation of beta and upper beta in NFT may be associated with alpha
frequency uptraining due to functional coupling of alpha and beta EEG frequencies or it may be
due to placebo and other non-specific effects such as EEG frequency drifts, alpha’s idling mode
and inhibitory role during task performance, or perhaps simply that some frequency bands
(alpha) are more susceptible to change and easier to train. Especially the inhibition of flanking
bands in the NFT protocol, i.e., beta bands in A+T training, to prevent frequency drifts, will be
necessary along with detailed GCM modeling of all frequency bands to see if and how the bands
change over time and how those processes relate to NFT learning curves.
Keywords: neurofeedback, EEG biofeedback, quantitative EEG, trait / state anxiety,
anxiety disorders, active placebo control, alpha/theta protocol, growth curve modeling.
vi
Zusammenfassung
Einleitung: Alpha/Theta-Neurofeedback-Behandlung (A/T-NFT) wird seit Ende der
1960er Jahre zur Behandlung Angststörungen bei Erwachsenen verwendet, doch es ist nicht klar,
ob diese Therapie wirksam ist. In der vorliegenden Single-Blind-Studie wird zum ersten Mal
eine aktive Plazebo-Kontrollgruppe verwendet, um das A/T-NFT-Protokoll an Frauen mit pro-
dromalen und klinischen Trait-Angst zu testen. Die Auswirkungen dieser Behandlung auf
Aktivierung, das empfundene Angstniveau, neuronale Oszillationen und andere Faktoren wurden
erhoben.
Methoden: Siebenundzwanzig Frauen im Alter von 19 bis 69, die höher als 66 Prozent
im STAI-Trait-Angst-Test abgeschnitten hatten (75% waren zuvor mit einer Angststörung
diagnostiziert worden), wurden zufällig auf Experimental- (EG) oder Kontrollgruppe (KG)
verteilt. Die EG (n = 14) erhielt zehn Sitzungen A/T NFT, in denen Alpha- und Theta-Ampli-
tuden an der Pz-Elektrode verstärkt wurden. Die KG (n = 13) bekam zehn Sitzungen aktives
Placebo-Training an der Pz-Elektrode, in denen in aufeinanderfolgenden NFT-Sitzungen jeweils
Beta- (15–19 Hz) und High-Beta-Amplituden (20- 24 Hz) verstärkt oder vermindert wurden.
Wachstumskurvenmodellierung (WKM) und traditionelle 2x5 ANOVA mit wiederholter
Messung wurden mit den Daten der NFT-Sitzungen durchgeführt, um individuelle und durch-
schnittliche Gruppenlernkurven zu modellieren. Kognitive Variablen wie Behandlungerwartung,
persönliche Attributionsstile, Verwendung, Typen und Wirksamkeit kognitiver Strategien in der
NFT und Korrelationen zwischen der NFT-Lernleistung, Tageszeit der NFT-Sitzungen und
bester oder schlechtester Lernzeit der Probandinnen wurden auch untersucht.
Ergebnisse: Die Analysen der individuellen Lernkurven, WKM und ANOVA
bestätigten, dass nicht nur die Mehrheit der Teilnehmerinnen der EG gelernt hatten, die abso-
luten und relativen A + T-Amplituden innerhalb einer NFT-Sitzung hochzuregulieren, sondern
vii
auch die Probandinnen der KG. Jedoch hatte die EG nicht-signifikante tendenziell steilere Lern-
kurven. Die Teilnehmerinnen, sowohl der EG als auch der CG, fühlten sich am Ende einer NFT-
Sitzung signifikant mehr deaktiviert und hatten am Ende der Studie signifikant verringerte
Angstwerte in allen Angstfragebögen (STAI, BAI, GAD-7). Obwohl die EG Angstwerte ten-
denziell stärker reduzierten als die CG, waren diese Unterschiede nicht statistisch signifikant.
Auch wurden keine signifikanten Veränderungen im EEG zwischen Anfang und Ende der Studie
gefunden, obwohl ein Trend zu höherer kombinierter relativer A+T-Amplituden am Ende der
Studie in der EG beobachtet wurde. In der EG waren die Verwendung mentaler Strategien mit
niedrigeren T/A-Differenzwerten zwischen Anfang und Ende der NFT-Studie korreliert, jedoch
nicht mit erhöhten relativen und absoluten T+A-Amplituden. Außerdem waren die Tageszeiten,
die Probandinnen zum Lernen bevorzugen oder vermeiden, nicht signifikant mit Alpha- oder
Theta-NFT-Amplituden assoziiert, d.h. NFT-Sitzungen, die während suboptimaler Tageszeiten
stattfanden, waren nicht mit einer schlechteren Lernleistung verbunden.
Schlussfolgerungen: Sowohl für die EG, als auch für die KG, stiegen die absoluten und
relativen T+A-Amplituden innerhalb der Sitzungen an und das absolute und relative Alpha nahm
über die Sitzungen hinweg zu, obwohl das KG-Protokoll keine Verstärkung der Alpha- und
Theta-Amplituden beinhaltete. Auch wurden Low-Beta-Amplituden (unter 15 Hz) nicht ver-
stärkt, die bei den jüngeren Teilnehmerinnen die obere Alpha-Peak-Frequenz repräsentiert haben
könnte. Daher kann die Hochregulation von Beta- und High-Beta-Amplituden in NFT mit einer
Alpha-Frequenzhochregulierung aufgrund funktioneller Kopplung von Alpha- und Betafre-
quenzen assoziiert sein oder aber die Folge eines Plazebo- und anderen unspezifischen Effekten,
wie z.B. EEG-Frequenzdrift, Alpha-Leerlaufmodus, Alphas hemmende Rolle während Auf-
gabenbewältigungen, oder vielleicht einfach, dass einige Frequenzbänder (Alpha) anfälliger für
Veränderungen und einfacher zu trainieren sind. Besonders die Hemmung flankierender
viii
Frequenzbänder im NFT-Protokoll, d.h. Betabänder im A+T-Training, um Frequenzdrift zu
verhindern, werden zusammen mit detaillierten WKM-Modellen aller Frequenzbänder benötigt,
um herauszufinden, ob und wie diese sich mit voranschreitenden Sitzungen verändern und wie
diese Prozesse mit NFT Lernkurven zusammenhängen.
Schlüsselwörter: Neurofeedback, EEG-Biofeedback, quantitatives EEG, Trait / State
Angst, Angststörungen, aktive Placebo-Kontrolle, Alpha/Theta-Protokoll, Wachstumskurven-
modellierung.
ix
This dissertation is dedicated to my parents,
Irmtraud (1933 – ) and Peter (1934 – 1976) Viereck.
Metamorphosis
Referent Atlantis, metaphor. Metamorphosis.
Shards and lavender footpaths in sea salted winds
spiraling utterance
chambered nautilus pulling
its buoyant, gas-filled shell upright
on top of the coral sea
swims in those easy lights, turns, faces greater
blacknesses beneath possibilities of absence – and
gradually descends with the day into that unknowable,
its inside mother of pearl brighter than ever
by Donna M. Fleischer
x
Acknowledgements
My deepest gratitude is with Dr. John Saksa who not only supervised the day-to-day
operation of this clinical trial but who provided me with ongoing encouragement, an office, and
all the necessary neurofeedback and EEG equipment. John, without your help this study would
have never gotten off the ground!
My heartfelt gratitude goes out to Ute Strehl, Boris Kotchoubey, and Martin Hautzinger,
who served on my dissertation committee. Moreover, they allowed for me to complete this
dissertation as an external doctoral student so that I could proceed with the actual study from my
place of residence in the State of Connecticut, USA. I want to especially thank Ute who, in
writing and in person, “plead my case” with different administrative units at the University of
Tuebingen for an external dissertation. Thank you, Ute, for not giving up; without your generous
help I would have never been able to complete this dissertation! … and thank you so much, Ute
and Boris, for your thoughtful and detailed feedback on all aspects of my dissertation which
helped me tremendously to improve this manuscript.
A big thank you to Jason Anastas for teaching me more about Growth Curve Modeling,
for helping with the R-Studio GCM scripts, and for always being available to answer any
advanced statistical procedure questions I had. Thank you so much, Jason, for your generosity! I
am thankful, as well, to the University of Hartford for permission to run this study through their
IRB, for its Barbara Cooke Award with which I purchased the necessary software, and for the
use of office supplies and copies for this study. Thank you to John Mehm and Jack Powell, my
supervisors at the University of Hartford, for agreeing to a somewhat flexible work schedule for
me during the data collection phase of this study, and to Alyssa Nett and Kayla Kleinman, who
administered about one-third of the Neurofeedback Sessions in this study with enthusiastic
professionalism, and to all the participants of this study.
xi
Thank you so much to my mom! You contributed some of your meager savings to this
study when I needed an extra EEG analysis program and had a difficult time raising the funds
with which to pay all my participants. I am grateful to my oldest friend, Inge Seiler-Päpper, who
I have known since age 4, for her great sense of humor, interesting conversations, pep-talks, and
practical suggestions.
My biggest thanks, though, go to Donna Fleischer, my spouse. She put up with several
years of my 70-hour work weeks, ‘picked up the slack’ at home, offered support and generosity
when I needed it most, proofread multiple versions of this dissertation, and granted permission to
include her poem “Metamorphosis” in this manuscript. Donna, I couldn’t have done it without
you!
xii
Table of Contents
Declaration iii
Abstracts (English and German) iv
Dedication and Acknowledgements ix
Table of Contents xii
List of Abbreviations xvi
List of Tables xviii
List of Figures xix
1. Introduction and Background 1
1.1 Trait Anxiety and Anxiety Disorders 2
1.1.1 Definition of trait anxiety and anxiety disorders. 2
1.1.2 Epidemiology of anxiety disorders. 7
1.1.3 Etiology. 9
1.1.4 Treatment. 14
1.2 Neurofeedback 15
1.2.1 Basis for EEG-based neurofeedback: EEG, brain oscillations, and
associated states.
15
1.2.2 Neurofeedback definition and general principles. 19
1.2.3 Mechanisms of neurofeedback learning. 20
1.2.4 EEG-based neurofeedback protocols. 22
1.2.5 Neurofeedback treatments for anxiety. 24
1.2.5.1 Critical literature review of neurofeedback for anxiety disorders. 24
1.3 Considerations Regarding the Study Planning 31
1.3.1 Neurofeedback protocol. 31
1.3.2 Control for non-specific effects. 34
2. Objectives and Hypotheses 40
2.1 Study Objectives 40
2.2 Hypotheses 41
2.2.1 Primary hypotheses. 41
2.2.2 Secondary hypotheses (treatment effect hypotheses). 41
2.3 Control for Treatment Expectations and Self-Efficacy 42

xiii
3. Methods 43
3.1 Procedure 43
3.1.1 Recruitment of participants. 44
3.1.2 Screening criteria. 45
3.1.3 Participants. 46
3.1.4 Randomization. 47
3.1.5 Trial schedule and progression. 47
3.2 Psychometric Assessments 51
3.2.1 Demographic and medical questionnaire. 51
3.2.2 Patient Health Questionnaire (PHQ-9). 51
3.2.3 Beck’s Depression Inventory (BDI-II). 52
3.2.4 Beck’s Anxiety Inventory (BAI). 52
3.2.5 Spielberger’s State Trait Anxiety Inventory (STAI). 53
3.2.6 Generalized Anxiety Disorder questionnaire (GAD-7). 53
3.2.7 Stanford Expectation of Treatment Scale (SETS). 54
3.2.8 Thayer’s Activation Deactivation Checklist (AD-ACL). 54
3.2.9 Neurofeedback Session Coding List. 55
3.2.10 Rotter’s Locus of Control questionnaire (LOC). 55
3.2.11 Neurofeedback Strategies and Treatment Satisfaction questionnaire. 56
3.3 Pre- and Post-Treatment QEEG 57
3.4 Neurofeedback Training 58
3.4.1 Experimental group: Alpha/Theta neurofeedback training. 61
3.4.2 Placebo control group: Successive beta up- and down-training. 62
3.5 Statistical Data Analysis 64
3.5.1 Demographic and psychometric data analysis. 64
3.5.1.1 STAI, BAI, and GAD-7. 64
3.5.1.2 AD-ACL. 64
3.5.2 Correlation of neurofeedback change scores with psychometric measures,
neurofeedback strategies, and treatment satisfaction.
64
3.5.3 QEEG data analysis. 65
3.5.4 Neurofeedback data analysis.
67
xiv
4. Results 71
4.1 Participants 71
4.2 Psychometric Results (ANOVAs) 74
4.2.1 Anxiety questionnaires: STAI, BAI, and GAD-7. 75
4.2.2 Stanford Expectation of Treatment Scale (SETS). 76
4.2.3 Activation Deactivation Checklist (AD-ACL). 77
4.2.3.1 Traditional 2x5 ANOVAs for AD-ACL activation and
deactivation scales and four sub-scales.
77
4.2.3.2 Growth curve modeling for AD-ACL activation and deactivation
scales and four sub-scales.
81
4.3 Neurofeedback Training Results 83
4.3.1 Growth curve modeling with absolute and relative alpha, theta, T+A, and
T/A ratio.
84
4.3.2 Traditional 2x5 ANOVAs for absolute and relative alpha, theta, T+A, and
T/A ratio.
88
4.4 QEEG Results 91
4.4.1 Theta and alpha absolute power. 92
4.4.2 Alpha and theta relative power. 92
4.4.3 Theta / alpha power ratio. 93
4.4.4 Theta + alpha absolute power. 93
4.4.5 Theta + alpha relative power. 93
4.5 Correlations 94
4.5.1 Participant demographic correlations. 96
4.5.2 Duration of treatment and sessions per week correlations. 96
4.5.3 Anxiety questionnaires correlations. 97
4.5.4 Activation and deactivation (AD-ACL) correlations. 97
4.5.5 QEEG-related correlations. 100
4.5.6 Cognitive strategies and time-of-day of neurofeedback. 101
4.6 Treatment Satisfaction and Self-Efficacy (SETS, LOC, Belief-in-Treatment) 103
4.7 Successful A+T Amplitude Learner Analysis 105
5. Discussion 113
5.1 Primary Outcomes (H 1 – H 2) 114
xv
5.1.1 Up-training of alpha and theta amplitudes within session (H 1a) and
across sessions (H 1b).
114
5.1.2 Reduction of trait anxiety and other anxiety measures (H 2). 124
5.2 Other Treatment Effects (H 3 – H 7) 127
5.2.1 Activation and deactivation within session (H 3a) and across sessions
(H 3b).
127
5.2.2 Correlations: NFT measures and activation / deactivation difference
scores (H 4).
131
5.2.3 Correlations: NFT measures and anxiety measures difference scores (H 5). 134
5.2.4 Physiological results: Pre–post differences in QEEG (H 6). 134
5.2.5 Qualitative results: Behavioral and cognitive effects (H 7). 136
5.3 Control for Unspecific Effects (H 8 – H 9) 138
5.3.1 Control for experimenter bias. 138
5.3.2 Control for treatment satisfaction and self-efficacy (H 8). 139
5.3.3 Time-of-day of neurofeedback training (H 9). 141
5.4 Limitations 143
6. Future Directions 150
7. Summary and Conclusions 153
8. References 156
9. Appendices 196
Appendix A: IRB Approval Forms, NIH Protocol Publication
(Clinicaltrials.gov), and Recruitment Materials
196
Appendix B: Screening and Trial Participation Consent Forms 199
Appendix C: Selected Questionnaires 206
Appendix D: Neurofeedback Session Checklist 209
Appendix E: Additional Statistical Tables and Graphs 210
xvi
List of Abbreviations
A % Relative Alpha Amplitude
ACE Adverse Childhood Event
AD Anxiety Disorders
AD-ACL Thayer’s Activity-Deactivity Adjective Checklist
ADHD Attention Deficit Hyperactivity Disorder
ANI Applied Neuroscience, Inc.: A Proprietary Normative QEEG Database
ANS Autonomic Nervous System
APF Alpha Peak Frequency
A/T Alpha/Theta NFT (Experimental Group)
B u/d Alternate Beta Up- and Down-NFT (Control Treatment)
BAI Beck Anxiety Inventory
BDI-II Beck Depression Inventory, Version II
CBT Cognitive Behavioral Therapy
CEN Central Executive Network
CO Control NFT Treatment: Beta Up- and Down-Training
ACC
dACC
rACC
Anterior Cingulate Cortex,
Dorsal ACC,
Rostral ACC
ACE Adverse Childhood Event
DMN Default Mode Network
DSM-IV-TR Diagnostic and Statistical Manual of Mental Disorder, fourth edition, Text
Revision (2000)
DSM-5 Diagnostic and Statistical Manual of Mental Disorder, fifth edition (2013)
EBT Empirically-Based Treatment
EEG Quantitative Electroencephalography
ESEMed European Study of the Epidemiology of Mental Disorders (2004)
ERD Event-Related Desynchronization
ERS Event-Related Synchronization
fMRI Functional Magnetic Resonance Imaging; rt-fMRI: real-time fMRI
Fm-theta Frontal-Midline Theta
GAD Generalized Anxiety Disorder
GAD-7 General Anxiety Disorder 7-Item Inventory
H Research Hypothesis (e.g., H 1 = hypothesis 1)
HEG Hemoencephalography

xvii
HRV Heart Rate Variability
IAF Individualized Alpha Frequency
ICD-10 International Statistical Classification of Diseases and Related Health Problems;
10th revision (1992); in the U.S. currently: ICD-10-CM (2010)
LTP Long-Term Potentiation
LE Linked Ears Reference in EEG and NFT
LENS Low Energy Neurofeedback System
Mini-Q Mini-Quantitative Electroencephalography, Proprietary Program of
BrainMaster, Inc. Recording of the10-20 EEG Sites (five times four channels)
NCS-R U. S. National Comorbity Survey-Replication (2004)
NFT Neurofeedback Training
OCD Obsessive Compulsive Disorder
PFC
mPFC
dlPFC
vlPFC
Prefrontal Cortex
Medial PFC
Dorsolateral PFC
Ventrolateral PFC
PD Panic Disorder
PSD Power Spectrum Density
PTSD Post-Traumatic Stress Disorder
PHQ-9 Patient Health Questionnaire-9 Depression Scale
QEEG Quantitative Electroencephalography
RCT Randomized Controlled Trial
SAD Social Anxiety Disorder
SETS Stanford Expectation of Treatment Scale
SD Standard Deviation
SN Salience Network
SNS Sympathetic Nervous System
SSRI Selective Serotonin Reuptake Inhibitors
STAI Spielberger State-Trait Anxiety Inventory
STAI-S 20-item, STAI Sub-scale for State Anxiety
STAI-T 20-item, STAI Sub-scale for Trait Anxiety
T % Relative Theta Amplitude
T+A % Summation of Theta Plus Relative Alpha Amplitudes
WM Working Memory

xviii
List of Tables
Table 3.1 NFT sessions per week, number of days, and weeks of total NFT. 48
Table 4.1 a Descriptive participant demographics. 72
Table 4.1 b Descriptive statistics of interval variables of the participant sample by
group.
73
Table 4.1 c Descriptive statistics of categorical variables: Mental strategies used?,
Mental Strategies successful?, Change in feelings, thinking and behavior
due to NFT? of the participant sample by group.
74
Table 4.2 a Descriptive statistics for the AD-ACL scores: Pre-post- NFT session
results for EG and CG.
78
Table 4.2 b 2 x 2 ANOVA for AD-ACL Pre-post NFT session results for EG and CG. 79
Table 4.3 2 x 5 AD-ACL NFT session difference scores for sessions 1+2, 3+4,
5+6, 7+8, and 9+10 for EG and CG.
80
Table 4.4 a Results from GCM regression analyses predicting AD-ACL Activation
from across sessions, and group (EG, CG).
82
Table 4.4 b Results from GCM regression analyses predicting AD-ACL Activation
from across sessions, and group (EG, CG).
82
Table 4.4 c Results from GCM regression analyses predicting AD-ACL energy
sub-scale from across sessions, and group (EG, CG).
83
Table 4.4 d Results from GCM regression analyses predicting AD-ACL Tired sub-
scale from across sessions, and group (EG, CG).
83
Table 4.4 e Results from GCM regression analyses predicting AD-ACL Calm sub-
scale from across sessions, and group (EG, CG).
83
Table 4.4 f Results from GCM regression analyses predicting AD-ACL Tense sub-
scale from across sessions, and group (EG, CG).
83
Table 4.5 a Results from GCM regression analyses predicting absolute alpha
amplitude from run (within session), trial (across sessions), and group
(EG, CG).
86
Table 4.5 b Results from GCM regression analyses predicting relative alpha
amplitude from run (within session), trial (across sessions), and group
(EG, CG)
86
Table 4.5 c Results from GCM regression analyses by successively adding
predictors for T/A amplitude ratio from run (within session), trial
(across sessions), and group (EG, CG).
86
Table 4.5 d Results from GCM regression analyses predicting absolute A+T
amplitudes from run (within session), trial (across sessions), and group
(EG, CG).
87
xix
Table 4.5 e Results from GCM regression analyses predicting relative A+T amplitudes
from run (within session), trial (across sessions), and group (EG, CG).
87
Table 4.5 f Results from GCM regression analyses predicting absolute theta amplitude
from run (within session), trial (across sessions), and group (EG, CG).
87
Table 4.5 g Results from GCM regression analyses by successively adding predictors
for relative theta amplitude from run (within session), trial (across
sessions), and group (EG, CG).
88
Table 4.6 2 x 5 EEG parameter NFT session difference scores (post- pre-session
scores).
90
Table 4.7 a Pearson bivariate significant correlations between psychometric and NFT
pre-post-difference scores between session 1 + 2 and 9 +10 and participant
characteristics.
95
Table 4.7 b EG only: Pearson bivariate significant correlations between AD-ACL
measures and EEG-based NFT pre-post-difference scores between session
1 + 2 and 9 +10.
99
Table 4.8 Pearson bivariate significant correlations between QEEG-based pre-post-
difference scores and NFT pre-post-difference scores between session 1 +
2 and 9 + 10.
100
Table 4.9 Results from GCM regression analyses from run (within session), trial
(across sessions), and group (EG, CG).
101
List of Figures
Figure 1.1 Demographics of life time prevalence of AD by age group. 8
Figure 1.2 Raw signal processing into wavebands by frequency (Hz) and the
associated power of the wavebands (µV²) over 5 seconds of time.
16
Figure 1.3 a RCTs: Research design, sample, and results of NFT for anxiety-related
disorders.
27
Figure 1.3 b Studies with CG but no randomization. 28
Figure 1.3 c Studies without control and no randomization. 28
Figure 3.1 Overview of all assessment and treatment sessions of the study. 50
Figure 3.2 Flow chart of trial progression. 51
Figure 3.3 Post-trial EEG from a study participant after concatenation of Brainmaster
data in the Neuroguide software with four time-locked channels at a time.
58
xx
Figure 3.4 Computer screen shot for NFT: Visual feedback was given via Flying
Vulcan video on the Brainmaster multi-media player.
61
Figure 3.5 Electrode locations and switch positions for the Brainmaster Atlantis, 4-
channel 5-position MINI-Q 2.
66
Figure 4.1 Mean SETS negative expectancy test score differences for EG (solid line)
and CG (dotted line).
77
Figure 4.2 AD-ACL deactivation pre–post session difference score changes for EG
(solid line) and CG (dotted line) over the course of the NFT trial.
81
Figure 4.3 Learning curve for single participant for relative A+T amplitude per minute
(24 minutes) for ten NFT sessions.
107
Figure 4.4 Regression equation (without error term). Learning curve for single
participant for relative A+T amplitude per minute (24 minutes) for ten NFT
sessions.
108
Figure 4.5 Individual EG participants’ linear regression lines with associated
individual regression equations for relative A+T amplitudes in µV for the
course of the ten NFT sessions.
110
1
1. Introduction
Anxiety disorders (AD) rank as the most common of mental health disorders in the
United States, have a high prevalence globally, and are one of the leading causes of disability in
western countries (Craske et al., 2017; Wittchen et al., 2010). They tend to be under-recognized,
particularly in primary care settings, and under-treated (Sartorius, Üstün, Lecrubier, & Wittchen,
1996; Vermani, Marcus, & Katzman, 2011). In the European Study of the Epidemiology of
Mental Disorders (ESEMed; Alonso et al., 2004) only 21% of those interviewed who had an
anxiety disorder sought medical help for their disorder. Anxiety disorders are often chronic, in
part due to dysregulated neurocircuits of stress response (Teicher, Samson, Anderson, & Ohashi,
2016), fear avoidance, lack of affordable access to treatment, and / or associated stigma
(Andrade et al., 2014). Other psychiatric disorders, such as depression, substance use disorder,
and schizophrenia often include a significant anxiety component or are comorbid with AD.
Furthermore, between 50-67% of patients with AD show a clinically significant improvement
after the most commonly used treatments of Cognitive Behavioral Therapy (CBT) and / or
medication (SSRIs) are applied (Taylor, Abromowitz, & McKay, 2012). Hence, it is important to
find efficacious, non-invasive, evidence-based treatments (EBTs) with little or no side effects to
lower anxiety levels for clinical and sub-clinical populations, especially for women, who are
twice as likely to experience an anxiety disorder in their lifetime (Bandelow & Michaelis, 2015).
Extraordinary advances in the field of neuroscience in the past ten years have led to a
shift toward a new paradigm. No longer are mental disorders seen only as disorders of abnormal
neurotransmitters, genetic vulnerabilities, defense mechanisms, and learned cognitive and
behavioral responses. Rather, medical and psychological mechanisms are unified in a model of
the nervous system as a neuronal network organized into nodes, hubs, and networks that can be
partially mapped onto anatomical and functional parts of the brain, or what Kirk (2015) calls a
2
paradigm shift from a neurochemical to a neuroelectrical model. Neurofeedback treatment (NFT)
is uniquely suited within this new model to potentially effect long-term changes in neurocircuits
of the brain.
NFT has been used since the late 1960s for a variety of conditions, including anxiety
disorders. The efficacy of NFT for some conditions, such as Attention-Deficit / Hyperactivity
Disorder (ADHD), has been well-researched (Arns, de Ridder, Strehl, Breteler, & Coenen, 2009;
Cortese, et al., 2016; Monastra, Lynn, & Linden, 2005). However, not only have there been only
few well-designed research studies on the efficacy of NFT for anxiety conditions, the results of
these studies have been mixed, and the U.S. National Institutes of Health’s National Center for
Complementary and Integrative Health (NCCIH) at this time does not endorse NFT as an
efficacious treatment for anxiety problems. A real need exists for rigorously controlled clinical
trials with clinical samples for the NFT treatment of AD. This dissertation is an attempt to bridge
that gap.
1. 1 Trait Anxiety and Anxiety Disorders
1.1.1 Definition of trait anxiety and anxiety disorders.
Anxiety per se is a normal and evolutionarily adaptive emotion that all humans
experience from time to time in response to dangerous events. It alerts a person to a perceived,
ambiguous threat via diffuse nervousness and unease which prepare the individual for a
potentially adverse future situation. It is accompanied by autonomic nervous system arousal,
variously presenting as perspiration, tachycardia, syncope, tremors, upset stomach, and
restlessness (Nebel-Schwalm & Davis, 2013; Saddock, Saddock, & Ruiz, 2015). However, if
anxiety persists over an extended period—over six months—according to the DSM-5, it is
disproportionate to the threat presented and is perceived as “excessive and unreasonable” (ICD-
10) by the individual and a diagnosis of AD is likely.

3
The concepts of state and trait anxiety developed by Spielberger in 1961 were updated in
2015. A personality trait is defined as a “disposition to behave consistently in a particular way”
across situations and time (Feist & Feist, 2008). Since the mid-1990s a broad consensus exists
that personality can be hypothesized as a hierarchical framework of personality traits. The “Big
Five” traits of neuroticism, extraversion, conscientiousness, agreeableness, and openness are
higher order traits and a larger number of lower order traits (Digman, 1997) include trait anxiety.
Individuals with lower order traits such as trait anxiety, rumination, self-criticism, and negative
evaluation, are particularly vulnerable to certain anxiety and depressive disorders (Mahaffey,
Watson, Clark, & Kotov, 2016).
Spielberger defines trait anxiety (T-Anxiety) and its relationship to state anxiety (S-
Anxiety) as:
“… relatively stable individual differences in anxiety-proneness, that is, to differences
between people in the tendency to perceive stressful situation [sic] as dangerous or
threatening and to respond to such situations with elevations in the intensity of their state
anxiety (S-Anxiety) reactions. T-Anxiety may also reflect individual differences in the
frequency and intensity with which anxiety have been manifested in the past, and in the
probability that S-Anxiety will be experienced in the future. The stronger the anxiety
trait, the more probable that the individual will experience more intense elevations in S-
Anxiety in a threatening situation” (Spielberger, 2015, p. 5).
However, the concept of trait anxiety is often imprecisely defined and operationalized in
clinical psychology and neuroscience research, especially in relation to trait fear, which is often
used interchangeably with trait anxiety. Sylvers, Lilienfeld, and LaPrairie (2011) characterize
trait anxiety as the disposition to react with “persistent hyper-vigilance and prolonged hyper-
arousal” (p.128), apprehension, and rumination to ambiguous situations. The threat potential of a
4
situation tends to be overestimated due in large part to a hypersensitive appraisal circuit. In
contrast, trait fear is characterized by avoidance responses such as flight, fight or freeze. Craske
et al. (2009) delineate the difference between anxiety and fear, aligning themselves with
Barlow’s (2004) definition by which fear is defined as an alarm response to a real or perceived
concrete threat whereas anxiety “is a future-oriented mood state associated with preparation for
possible, upcoming negative events” (Craske, p. 1067). However, they do admit that there exists
an overlap of symptoms between anxiety and fear.
Clinically, anxiety disorders are most commonly categorized according to the American
Psychiatric Association’s Diagnostic and Statistical Manual of Mental Disorders (DSM-5, 2013)
as mental disorders in which fear and anxiety deemed as persistent and out of proportion to the
norm are caused by a variety of different situations or objects, depending on the type of anxiety
disorder a person has. As anxiety is very likely to be comorbid, a person often has several
anxiety disorders that developed during childhood, and if not treated early, remain throughout
adulthood. The DSM-5 clearly distinguishes between fear and anxiety:
“Fear is the emotional response to real or perceived imminent threat, whereas anxiety is
anticipation of future threat. Obviously, these two states overlap, but they also differ,
with fear more often associated with surges of autonomic arousal necessary for fight or
flight, thoughts of immediate danger, and escape behaviors, and anxiety more often
associated with muscle tension and vigilance in preparation for future danger and
cautious or avoidant behaviors” (DSM-5, American Psychiatric Association, 2013,
p. 189).
If the attribution of excessively anxious or fearful thinking and behaviors are
consequences of medication or other substances, or could be better explained by another
disorder, such as Alzheimer Disease, AD will not be diagnosed. The DSM-5 (2013) defines the
5
following disorders under the category of anxiety disorders: separation anxiety disorder,
selective mutism, special phobia, social anxiety disorder (SAD), panic disorder (PD),
agoraphobia, generalized anxiety disorder (GAD), substance / medication-induced anxiety
disorder, anxiety disorder due to another medical condition, other specified anxiety disorder,
and unspecified anxiety disorder. In contrast to the fourth edition of the DSM (DSM-IV-TR,
2000), in use for clinical research and practice up to late 2013, the DSM-5 no longer classifies
obsessive compulsive disorder (OCD), post-traumatic stress disorder (PTSD), or acute stress
disorders as AD, but rather newly created categories of obsessive-compulsive and related
disorders and trauma- and stressor-related disorders, respectively. Furthermore, separation
anxiety disorder and selective mutism are moved from the category of disorders usually first
diagnosed in infancy, childhood, or adolescence to the category of anxiety disorders in the DSM-
5. Due to this recent DSM re-classification some of the conditions for which NFT was studied as
potential evidence-based treatment (EBT) are no longer classified as AD. Nevertheless, these are
evaluated in the literature review of this dissertation because there is a large anxiety component
present, especially in PTSD and OCD, that is extremely relevant in addressing the potential
efficacy of NFT treatment to alleviate the anxiety-related symptoms of these disorders.
As 75% of participants in this clinical trial had a self-reported medical diagnosis of AD,
(the majority of whom had a GAD diagnosis, followed by anxiety disorder diagnosed but not
specified / remembered, SAD, and specific phobia), the cardinal DSM-5 (2013) diagnostic
distinguishing characteristics for AD of adulthood are briefly described below. All AD include
the presence of persistent symptoms for six months or more (but one month for PD) and cause
the individual “clinically significant distress or impairment” (pp.189). The criterion that the AD
cannot be explained better by another medical condition must also be present:
1. GAD: Excessive anxiety and worry in multiple areas (such as work, school and social
6
environment) that are difficult to control and at least three out of six symptoms that are
present most days: restlessness, easily fatigued, difficulty concentrating or mind going
blank, irritability, muscle tension, and sleep disturbance;
2. SAD (formerly social phobia): anxiety and / or avoidance of social situations, especially
those that involve judgment and scrutiny by others, such as speaking and performing; fear
of embarrassing oneself, being humiliated or rejected;
3. Specific phobias: excessive fear or anxiety and avoidance of specific objects or situations,
such as specific animals, natural environment, blood-injection-injury-related, or
situational;
4. Agoraphobia: excessive anxiety and / or avoidance of places or situations in which
“escape might be difficult, or help might not be available in the event of ….
incapacitating or embarrassing symptoms” (p. 218), such as panic or falling; or
5. PD: recurring unexpected panic attacks, i.e., “an abrupt surge of intense fear or intense
discomfort” (pp. 208) which reach their peak within minutes and involve at least four of
the following 13 symptoms: heart palpitations, perspiration, trembling or shaking,
sensations of shortness of breath, feeling of choking, chest pain, nausea or abdominal
distress, feeling dizzy, chills or heat sensations, paresthesias, derealization, and
depersonalization.
Trait anxiety is a construct stemming from the fields of personality and differential
psychology whereas the constructs of anxiety disorders are classifications from the fields of
psychiatry and clinical psychology. Consequently, different frameworks and interests inform the
constructs of trait anxiety and anxiety disorders and while there is a significant correlation
between high trait anxiety and an anxiety disorder they are not synonymous. However, for the
purposes of this study, trait anxiety as a selection criterion is the more useful concept for the
7
following reasons:
1. The number of individuals with moderate to high trait anxiety is likely much higher than
those diagnosed with an anxiety disorder. This includes possible participants who have a
less severe form of anxiety symptoms, such as people with a prodromal anxiety disorder
as well as those who have an anxious personality trait and are less likely to have
comorbid non-AD-related mental disorders, which is an exclusionary criterion for this
study;
2. Having moderate to high trait anxiety is not as stigmatizing for people to admit than an
actual mental disorder diagnosis. Consequently, people might be less hesitant to
volunteer for a NFT trial; and
3. Using a DSM-IV-TR or DSM-5 definition of anxiety disorder, would likely require a
further breakdown for which of the five major anxiety disorders NFT will be evaluated in
the clinical trial, to avoid having confounding variables of different, dissimilar anxiety
disorders in the study. One could include the difference in anxiety disorder in the
statistical analysis as a variable. In order for the statistical analysis to be meaningful, all
three groups would have to include a much larger number of participants and preferably a
similar number of participants with each anxiety disorder, which would be beyond the
scope of this study.
1.1.2 Epidemiology of anxiety disorders.
It is estimated that the lifetime prevalence of anxiety disorders in the United States is
33.7% and in Europe 14.5% according to the latest available large-scale studies, the National
Comorbidity Survey in the U.S. (NCS-R; Kessler et al., 2005) and the European Study of the
Epidemiology of Mental Disorders (ESEMed; Alonso et al., 2004), respectively. The Mental
Health Surveillance Study of the Substance Abuse and Mental Health Services Administration
8
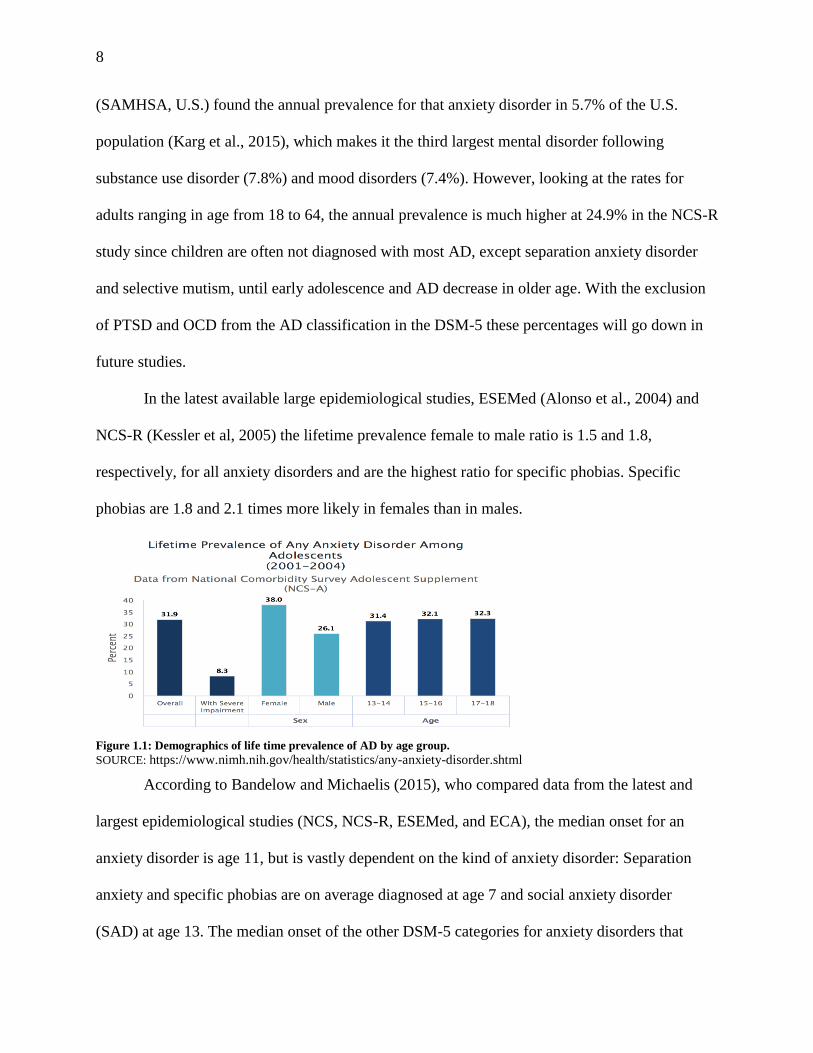
(SAMHSA, U.S.) found the annual prevalence for that anxiety disorder in 5.7% of the U.S.
population (Karg et al., 2015), which makes it the third largest mental disorder following
substance use disorder (7.8%) and mood disorders (7.4%). However, looking at the rates for
adults ranging in age from 18 to 64, the annual prevalence is much higher at 24.9% in the NCS-R
study since children are often not diagnosed with most AD, except separation anxiety disorder
and selective mutism, until early adolescence and AD decrease in older age. With the exclusion
of PTSD and OCD from the AD classification in the DSM-5 these percentages will go down in
future studies.
In the latest available large epidemiological studies, ESEMed (Alonso et al., 2004) and
NCS-R (Kessler et al, 2005) the lifetime prevalence female to male ratio is 1.5 and 1.8,
respectively, for all anxiety disorders and are the highest ratio for specific phobias. Specific
phobias are 1.8 and 2.1 times more likely in females than in males.
Figure 1.1: Demographics of life time prevalence of AD by age group.
SOURCE: https://www.nimh.nih.gov/health/statistics/any-anxiety-disorder.shtml
According to Bandelow and Michaelis (2015), who compared data from the latest and
largest epidemiological studies (NCS, NCS-R, ESEMed, and ECA), the median onset for an
anxiety disorder is age 11, but is vastly dependent on the kind of anxiety disorder: Separation
anxiety and specific phobias are on average diagnosed at age 7 and social anxiety disorder
(SAD) at age 13. The median onset of the other DSM-5 categories for anxiety disorders that

9
begin in adulthood, are agoraphobia at age 20, panic disorder (PD) at age 24, and Generalized
Anxiety Disorder (GAD) at age 31.
Furthermore, moderate to large cross-cultural differences in prevalence rates of anxiety
disorders were found by Wittchen and Jacobi (2005) who compared 27 studies from 16 European
countries with highly heterogeneous rates. For instance, annual prevalence of GAD ranged
between 0.2% and 4.3%, depending on the country and could only be partially explained by
different sample collections and methodology.
Moreover, there is a high comorbidity among different AD and between AD and other
mental disorders, particularly between SAD and agoraphobia (r = 0.68), PD and agoraphobia (r =
0.64), GAD and SAD (r = .55), and GAD and major depression (r = 0.62), GAD and dysthymia
(r = .55) (Bandelow & Michaels, 2015a). Kessler et al. (2005) found that 27% of the
respondents from the NCS-R had three or more of the DSM-IV-TR classified mental disorders.
Data from large epidemiological studies and long-term longitudinal studies indicate that AD “are
quite persistent throughout the life course ... and [the persistence] is usually due to a recurrent-
intermittent course that often features waxing and waning of episodes of different comorbid
anxiety disorders” (Kessler, Ruscio, Shear, & Wittchen, 2009, pp. 25-26).
1.1.3 Etiology.
Neurofeedback is based on the principles of learning theory (see section 1.2.1).
Consequently, it is important to look at a comprehensive learning theory model that can be used
in the explanation of the etiology of AD. To date, Mineka and Zinbarg (2006) have proposed the
most elaborate learning theory model for anxiety disorders. They postulate a five-domains model
with two domains of vulnerability—one that is genetic or temperament-based and the other one
based on previous learning experiences (such as a person’s history with mastery and control over
one’s circumstances)—as well as three contextual domains: (1) direct or vicarious conditioning,
10
(2) properties of the unconditioned stimulus (US), and (3) perceptions of the predictability and
controllability of a learning situation. In this study, the personality trait of perceived control over
anxiety-related events is measured with the Rotter (1966) Locus of Control scale (LOC) and the
Stanford Expectancy of Treatment Scale (SETS). One strength of Mineka and Zinbarg’s theory
is that it incorporates post-conditioning factors that influence learning, such as re-evaluation of
the US and possible inflation of the US, as well as the presence of excitatory or inhibitory
conditioned stimuli. For instance, they describe the occurrence of an inflation effect that can
occur when a person initially experiences a minor trauma that does not cause a phobia (e.g.,
being bitten by a dog), yet later a more severe trauma (e.g., traumatic car accident) which does
not necessarily relate to the previous minor trauma may lead to a dog phobia (Mineka & Zinbarg,
2006).
Barlow’s triple vulnerability model (Barlow, 2000) is a more general model of the
etiology of mental disorders that combines factors from the bio-psycho-social sphere, including
genetics and physiological, personality, developmental, and cognitive psychology. It consists of
three major vulnerabilities that contribute in varying degrees to the etiology of AD:
(1) a general biological vulnerability that includes a genetically-based disposition (high in
personality trait of neuroticism) and reactivity to negative emotions;
(2) a general psychological vulnerability shaped by early childhood adverse events and
parenting styles, such as overprotective parents, for some anxiety disorders, and may lead to
constantly elevated arousal of the sympathetic nervous system (SNS) and an experience of
life events as unpredictable and uncontrollable; and
(3) a disorder-specific psychological vulnerability linked to learning experiences, especially of
parents and caretakers modeling anxious or fearful behavior incommensurate with the actual
11
danger of the situation or object and for the child receiving disproportionate attention to
experienced somatic sensations.
As this study is concerned primarily with the EEG-based NFT to improve trait anxiety or
clinical anxiety symptoms, I will focus my review of current research on those findings that
relate directly to brain structure and functionality, namely, neural circuits, neuroendocrinology,
structural and functional abnormality of specific brain structures, and autonomic nervous system
(ANS)-regulated physiological processes influenced by A/T NFT. These outcomes may be used
in the discussion section to further elucidate this study’s findings.
The AD, a heterogeneous group of disorders, have shown distinct neural circuits in recent
studies, dependent on whether the disorder is more fear- or anxiety-based. Duval, Javanbakht,
and Liberzon (2015) thoroughly review recent randomized controlled trials (RCTs). They
classify PD, SAD, and phobias as primarily fear-based disorders, and GAD and PTSD as
primarily anxiety-based (see section 1.1.1). Lueken et al. (2016) analyzed 60 out of 4,787
reviewed RCTs, 27 of which included genetic markers, 17 neuroimaging, and 16 markers
associated with autonomic functioning. This review was to identify biomarkers that could predict
risk for anxiety disorder and differential clinical treatment outcome for AD. Both meta-analyses
took publication bias into consideration when analyzing the effect size for biomarkers across
studies. In both, fear- and anxiety-based circuits, the thalamus receives and integrates input from
the primary sensory cortices and sends output to the amygdala, the anterior cingulate cortex
(ACC), and the hippocampus. Most functional imaging studies show that, in general, amygdala,
hippocampus, and dorsal anterior cingulate cortex (dACC) appear to be hyper-activated, whereas
the sub-genual and rostral ACC (sg and rACC) and the mPFC are hypo-activated in most AD.
Connectivity across neurocircuits, between the regions responsible for emotion processing, such
as the amygdala and insula, and regions of emotion modulation, such as the mPFC and the rostral
12
ACC (rACC), appear to be decreased. Hypo-activation of the sgACC and rACC and the mPFC
may be translated as a possible failure to adequately inhibit the threat response in AD (Duval et
al., 2015). The evidence on this concept is mixed at best. A hyper-activated hypothalamic-
pituitary adrenal axis (HPA) can be observed in AD in most studies, but particularly in PTSD,
which leads to a reduced plasma concentration of cortisol among other effects coupled with the
pituitary gland being hypersensitive to glucocorticoids, such as cortisol.
Williams (2016) proposed an interesting taxonomy regarding anxiety and depressive
disorders after evaluating a multitude of experimental studies on neural circuit dysfunctions and
progress in the Human Connectome Project (http://www.humanconnectomeproject.org/). She
then related the circuit dysfunctions with typical symptoms for anxiety (and depressive)
disorders and suggested specific types of therapeutic interventions depending on which brain
circuits are most affected, an individualized precision-psychiatry. For instance, she suggests that
anxious avoidance was associated primarily with circuit abnormalities of the salience network
(SN), specifically with the hypoconnectivity between left and right anterior insula and the
sublenticular extended amygdala, and the hyperactivation of the amPFC. These SN network
abnormalities according to recent research reviewed by Williams respond particularly well to
Deep Brain Stimulation and Selective Serotonin Reuptake Inhibitors (SSRIs). Hyperactivation of
the default mode network (DMN) associated with rumination common in GAD and depressive
disorders on the other hand, may respond better to transcranial magnetic stimulation,
mindfulness and self-context therapies. This dissertation proposes that NFT may be another
treatment alternative used to target and normalize the afore-mentioned areas in the SN and
DMN.
13
The review of possible physiological markers that might predict AD proved especially
interesting; the autonomic regulation of the heart rate by the vagus nerve and its variability
(HRV), beat to beat changes in the heart rhythm, has been extensively researched and led to the
Polyvagal Theory by Porges (1995, 2009) and the neurovisceral model of cardiac and emotion
regulation by Friedman (2007). Porges postulated that a cardiopulmonary oscillator is controlled
by the dorsal motor nucleus of the vagus nerve in the medulla oblongata and and proposed “a
neural process that evaluates risk and modulates vagal output via higher brain structures”
(Porges, 2007, p. 6); primary emotions directly interact with autonomic functions when the
physiological state is fed back to brain structures via afferent nerves in reaction to environmental
stimuli. A reduced HRV and higher heart rate were associated with less flexibility and
adaptability to environmental stimuli (Lyonfields, Borkovec, & Thayer, 1995). Lueken et al.
(2017), for instance, analyzed several RCTs and found that patients with AD who had high heart
rates and low HRV, had better treatment outcomes after CBT psychotherapy compared to
psychopharmaceutical treatment or placebo.
Lastly, there is accumulating evidence that the number and intensity of adverse childhood
events (ACEs), as well as the time of the exposure to ACEs during sensitive periods of brain
development in areas associated with the anxiety and fear circuits can predict the development,
severity, and treatment response to various pharmacological, psychotherapeutic, and other
adjunctive therapies, such as NFT, EMNDR (Teicher et al., 2016; Fonzo et al., 2016; Hein &
Monk, 2017). Hence, ACEs should be assessed, for instance, with the Maltreatment and Abuse
Chronology of Exposure (MACE) scale (Teicher & Parigger, 2015) as potential mediators of
therapy outcomes in research and prior to treatment planning.
1.1.4 Treatment.
The most researched and empirically supported psychotherapy treatment (EBT) for AD is
14
cognitive-behavioral therapy (CBT), compared to psychodynamic, client-centered, or acceptance
and commitment therapy. CBT includes a multitude of different techniques that are used
according to the symptomatology of the AD (Bandelow et al., 2015b; Craske, et al. 2015;
Schneider, Arch, & Wolitzky-Taylor, 2015). For example, systematically and repeatedly
exposing a client to a phobic stimulus is a particularly fruitful technique for fear-based AD, such
as phobias or PD (i.e., graduated exposure or other repeated techniques to produce habituation).
Cognitive restructuring techniques are especially useful for anxiety-based AD, such as GAD and
SAD. Self-monitoring physical manifestations of feelings, thoughts and behaviors and exercises
targeting the ANS, such as breathing and relaxation, are useful for most AD. A/T NFT targets
the ANS indirectly via increasing alpha and theta oscillations in the brain at Pz, and inhibition of
high beta oscillations potentially leads to relaxed calmness, which would make a potentially
excellent adjunctive therapy with CBT.
However, a meta-analysis by Hofmann, Asnaani, Vonk, Sawyer, and Fang (2012)
revealed that even CBT, in comparison to other psychotherapy techniques, whether placebo or
control, was only approximately 50% successful for most investigated AD. A thorough meta-
analysis of 234 RCTs on the efficacy of diverse medication treatments, psychotherapy, and
combined treatments for anxiety was conducted by Bandelow et al. (2015) and revealed a more
differentiated picture. In general, most psychological interventions (CBT, mindfulness therapies,
psychodynamic, internet-based therapies, group CBT, and relaxation types), all the tested
medication classes (SSRIs, SNRIs, benzodiazepines, tricyclic depressants), as well as the
combination of pharmacological and psychotherapeutic interventions were associated with
significant improvement of anxiety, in comparison to psychological placebos and waitlist. But
SNRIs, SSRIs, benzodiazepines, and combined CBT / medications treatments were associated
with the highest effect sizes. However, long-term data of treatment effectiveness were not

15
available for most studies which poses a serious limitation because AD have high reoccurrence
rates, especially the AD associated with the fear-circuit, where extinguished responses can be
reversed by excessive stress or traumatic events (see section 1.1.3).
1.2 Neurofeedback
1.2.1 Basis for EEG-based NFT: EEG, brain oscillations, and associated states.
Different distinct rhythms of brain oscillations can be found and attributed to different
mental states (Hermann, Strueber, Helfrich, & Engel, 2016). The following major frequency
bands have been identified and are distinguished by their sinusoidal rhythms (oscillation
frequency) in cycles per second (Hz). The frequency bands have slightly different ranges
depending on the author. The ranges used in this study are congruent with the ones Collura
(2013) uses in his Brainmaster Avatar and MiniQ software systems since those systems were
used in this study for EEG and NFT recording:
delta waves (0.5-4 Hz),
theta waves (4-8 Hz),
alpha waves (8-12 Hz),
beta waves (12-30 Hz); which are commonly divided into two or three subdivisions:
o beta 1 [13-20 Hz] and beta 2 [21-30 Hz], (Kropotov, 2016),
o low beta [12-16 Hz], beta [16- 20 Hz], and high beta [20 – 30 Hz)], (Collura,
2013) which will be used in this study.
gamma waves (30-100 Hz).
Delta waves are the dominant wave form during NREM sleep (deep sleep), whereas a
mix of theta and delta waves may be observed during drowsiness and early NREM sleep. Delta
waves may also play a role as inhibiting oscillations during attention tasks, as attention is shifted

16
to one stimulus while other stimuli are inhibited (Hermann et al., 2016). Furthermore, dominant
delta oscillations and, especially slow wave activity around 1 Hz are associated with memory
consolidation and may “represent the cyclical variations in the excitability of the neuronal pool
represented by multiple unit activity and the network state and might amplify (in case of high-
excitability phase) or suppress (in case of low-excitability phase) the input signals” (Cheron et
al., 2016, p. 6).
Figure 1.2: Raw signal processing into wavebands by frequency (Hz) and the associated power of the wavebands (µV²)
over 5 seconds of time. (Adapted by B. Viereck from Park, Fairweather, and Donaldson, 2015).
Theta waves, prominent during memory functions of the hippocampus, regulate activity in
other structures of the brain with inhibitory processes (Hermann et al., 2016) and are also
associated with the recall of pleasant memories in the frontal midline area (Sammler et al., 2007,
as cited in Cheron, 2016). According to Horschig et al. (2014) predominant theta oscillations may
indicate internal orientation, and encoding, and retrieval of memory in the temporal lobes; it is
also related to increased drowsiness before stage 1 NREM sleep. According to Arns et al. (2015)
two forms of theta need to be distinguished: phasic frontal midline (fm) theta, likely to stem from
the r-ACC areas, and a “tonic drowsiness theta” (p. 1191), which originates in a large variety of
cortical areas. Enriquez-Geppert et al. (2014) elaborates that functionally fm-theta is associated
with mental tasks responsible for communication of large functional brain networks whereas tonic
17
theta is not task-related but rather related to general drowsiness before stage 1 NREM sleep.
Dominant alpha waves are associated with relaxed wakefulness and with the idling mode
of the default mode network (see section 1.1.3). Klimesch, Sauseng, and Hanslmayer (1999)
describe that alpha rhythm hinders simultaneous processes that are unnecessary for a present task
via increasing the signal-to-noise ratio. Klimesch et al. (2012) posits that increased alpha-band
amplitudes represent event-related synchronization (ERS) associated with inhibition of areas not
relevant to the task at hand, while decreased alpha-band amplitudes represent event-related
desynchronization (ERD) associated with release from inhibition toward a focused attention to
the task. In other words, areas of the brain that are activated in a task experience higher beta
amplitudes and desynchronized alpha oscillations. Moreover, Cheron et al. (2016) report that
alpha rhythm of spindle-shaped episodes around 10 Hz is the predominant spontaneous brain
rhythm for a relaxed individual in an eyes-closed state, whereas a relaxed eyes-open state is
associated with faster alpha oscillations of smaller amplitudes.
Beta waves, especially high beta waves, are dominant during concentrated cognitive or
motor task performance and outward focus. Enhanced high beta waves can also be found during
rumination in individuals with AD and depressive disorders.
Gamma oscillations have been observed as a dominant frequency during meditation in a
famous study of Tibetan monks (Lutz, Greischar, Rawlings, & Davidson (2004); and these are
especially pronounced during concentrated information-processing (Hermann et al., 2016),
especially tying together information from different areas of the brain (Horschig, 2014).
Furthermore, several local cortical oscillations are not considered frequency bands of
their own; for instance, the mu rhythm, also called wicket or comb rhythm (8-13 Hz), is only
generated over the sensorimotor cortex and is related to voluntary motor activity. Sensory motor
rhythm (SMR, 12-15 Hz) is most pronounced over the sensorimotor cortex during quiet alert
18
wakefulness and during light NREM sleep, and synchronized when motor behavior is inhibited
(Sterman, 1981). Slow cortical potentials (SCP; < 1 Hz) are event-related changes in direct
electrical current, from negative to positive polarization and can be observed in anticipation of a
mental or motor task (Walter, Cooper, Aldridge, McCallum, & Winter, 1964).
Lastly, it is important to point out the complexity of interactions in the various EEG
oscillation parameters (amplitude, frequency, phase, and coherence) involved in cognition and
mental processes. Particularly, neuronal oscillators must be taken into consideration; these are
systems of neurons which generate spontaneous rhythmic brain wave patterns that are stable
against minor disturbances (Cheron et al., 2016) and consist not only of one waveband.
Furthermore, Hermann et al. (2016) emphasize that there is no 1:1 congruence between a specific
kind of waveband and the various cognitive processes of the brain:
“It is more likely that EEG oscillations contribute to different cognitive functions
depending on where in the brain and with what parameters (amplitude, frequency, phase,
coherence) they occur. Four important assumptions support this notion:
1. Different brain regions may perform different but specific functions … .
2. EEG oscillations of slow frequency may represent the cooperative activity of large-
scale neuronal networks in the brain whereas high-frequency oscillations may
predominantly reflect the activity of local neuronal populations … .
3. Coherent EEG oscillations in two distant brain regions may reflect the functional
cooperation of these two regions … .
4. Combining assumptions 2 and 3, it has been suggested that cooperation between
nearby cortical regions may be reflected by coherent high-frequency oscillations,
whereas cooperation by distant brain regions may require coherent low-frequency
oscillations” (Hermann et al., 2016, pp. 12-13).
19
1.2.2 Neurofeedback definition and general principles.
In Neurofeedback treatment (NFT) individuals are fed back measures of brain activity —
such as neuroelectrical activity (EEG), oxygenation levels (rt-fMRI; NIRS), or low energy
electromagnetic pulses (LENS)—to learn how to modulate brain activity. Principles of classical
and instrumental conditioning are used for the person to up- or down-regulate their own non-
perceivable brain oscillation amplitudes or other functional patterns of the brain via auditory and
/ or visual feedback. The premise of the use of this behavioral technique for psychological and
certain neurological disorders is that brain oscillations in certain areas of the brain—or in certain
structural or functional networks of the brain (see section 1.1.3) for anxiety disorders —are
abnormal or dysregulated and that normalizing brain waves patterns in these areas will lead to an
improvement in the symptoms of the disorder (Berger & Davelaar, 2017; Budzynski, Budzynski,
& Abarbanel, 2009; Chow, Javan, Ros, & Frewen, 2017; Murphy & Bassett, 2017; Schabus et
al., 2017; Thibault, Lifshitz, & Raz, 2016). Several general neurocircuits for anxiety and fear
have been identified (see section 1.1.3 and Ledoux, 2011), but the search for general EEG
endophenotypes of brain structure and activity distinguishing mental disorders has been less
fruitful (Gunkelman, 2008; Johnstone, Gunkelman, & Lunt, 2005; Murphy & Bassett, 2017;
Olbrich, van Dinteren, & Arns, 2015). As this study uses EEG-based NFT, also called EEG-
biofeedback, the review of physiological and technical principles is limited to EEG-NFT.
In EEG-based NFT the individual’s electrophysiological brain oscillations are recorded
via EEG, amplified, and processed so that the brain activity bands of interest can be continuously
fed back to the person in real time. While the individual tries to influence the amplitude or
desired brain oscillations ratio, a feedback signal will be given. The goal for the individual is to
learn to up- or down-regulate the oscillation parameters continuously with the help of feedback
and positive reinforcement (rewards).

20
The NFT research to modulate electrical brain activity via EEG goes back to the 1930s
but has been more systematically studied since 1941 (Arns et al., 2017) when Jasper and Shagass
used classical conditioning with an auditory stimulus to change occipital alpha rhythm. It was
not until the 1960s, when Kamiya trained people to control their EEG alpha frequency (1966)
and Wyrwicka and Sterman (Wyrwicka & Sterman, 1968; Sterman, 1970) were able to train cats
to increase their SMR oscillations, that clinically applied research in this area began. There is
evidence and meta-analyses of RCTs for the efficacy of NFT for some disorders, such as ADHD
(Arns et al., 2009; Sonuga-Barke et al., 2013; Micoulaud-Franchi et al., 2014; Cortese et al.,
2016); epilepsy (Tan et al., 2009); some evidence for Autism Spectrum Disorder (Holtmann,
Steiner, Hohmann, et al., 2011; Kouijzer, van Schie, de Moor, et al., 2010; Pineda, Brang, Hecht,
et al., 2008); and depression (Johnston, Linden, Healy, et al., 2010; Young, Misaki, Harmer, et
al., 2017). The evidence for the efficacy of NFT for AD or high trait anxiety in general is sparse
and is reviewed next.
1.2.3 Mechanisms of neurofeedback learning.
To both create an effective, efficient NFT protocol, and predict who may or may not
respond to NFT, it is vital to understand what mechanisms are responsible for successful learning
of brain regulation patterns. Until the early 1990s mechanisms of NFT were almost exclusively
explained by classical conditioning (Pavlov,1960; Watson, 1920), and more importantly, by
operant conditioning, which relied on the research of Thorndike (1911) and Skinner (1948,
1992). During operant conditioning, the individual learns to associate an immediate consequence
of an action (here: NFT feedback signal) with a behavior (here: regulated brain activity) and this
behavior becomes more likely if it is perceived as rewarding (positive reinforcement) and less
likely if the the action does not reach the predefined goal (threshold). The closer the temporal
proximity of the feedback signal after the successful regulation of brain activity, the stronger the

21
association learning will be. The individual learns to regulate specific brain activity, the fastest if
every correct response is reinforced.
Transfer trials are sometimes integrated into NFTs to generalize newly learned brain
regulation from experimental (or therapy setting) to other contexts so that a reduction in anxiety
symptoms can be achieved in everyday life. During transfer trials feedback is not given; only at
the end of a trial is feedback given at to whether the regulation of brain activity was successful.
In relation to the conditioning of EEG parameters, Jasper & Shagass’ (1941) study is vital. The
authors demonstrated that an unconditioned visual stimulus of a light signal (unconditioned
stimulus) in a dark room leads to a suppression of occipital alpha rhythm (unconditioned
reaction) during the eyes-open condition. They then paired the light signal with a sound stimulus
and thus classically conditioned that the quasi-reflexive reaction of alpha-blocking would take
place (conditioned reaction) when participants heard the sound (conditioned stimulus).
The other two prominent models or mechanisms of NFT learning are the dual process
theory (LaCroix, 1981; Smith & DeCoster, 2000) and skill learning (Yin, Mulcare, Hilario, et al.,
2009). The dual-process theory divides mental activity into automatic unconscious (capacity-free
processes; type I) and more controlled conscious processes (capacity-limited processes; type II).
Wood (2014) states that
“… type I processes are usually unconscious and difficult to control by self-instruction.
Type II processes reflect the activity of a supervisory attention system, specialized in
monitoring and regulating the activity in other cognitive systems …, [and] are usually in
the center of our focus of attention … are regulated mainly by self-instruction and are
fundamental for executive functions and metacognitive abilities ... both automatic and
controlled processes have control of behavior as well as of different aspects of cognition
… but both learn from and react to different aspects of the task at hand. Automatic
22
systems learn only through cumulative reward while controlled systems are more
flexible, context-oriented and learn fast from instructions” (Wood, 2014, p. 2).
By contrast, the skill learning model involves two distinct phases of learning. During the
early phase, changes in performance are rapid, whereas in the late phase learning is marked by
the consolidation of the skill and a more gradual improvement of the skill until the skill is
learned and changes are minute. Structural and functional changes in the dorsomedial striatum
can be observed in the initial phase of learning while changes in the dorsolateral striatum were
found during the late phase of skill acquisition (Sitaram, Ros, Stoeckel, et al., 2017).
1.2.4 EEG-based neurofeedback protocols.
A number of different NFT protocols are available. They may be differentiated by what
brain frequency bands (gamma, beta, alpha, theta, delta), specialty frequencies (SMR, SCP, mu,
or infraslow), or brain frequency ratios (e.g., alpha/theta, theta/beta) are being trained and how
many and which electrode locations on the scalp are used to measure the electrophysiological
activity. The most common protocols will be briefly described. To treat AD, or anxiety in
general, alpha, alpha/theta, alpha symmetry, and QEEG-based individualized NFT have
primarily been used.
In alpha and alpha/theta protocols alpha power, alpha and theta power, or theta/alpha
ratio are up-regulated to counter hyperarousal, associated with PTSD, PD, and phobias. These
protocols may also enhance creativity (Niv, 2013).
Alpha asymmetry protocols (ALAY), introduced by Baehr, Rosenfeld, and Baehr in
1997, focus on increasing alpha power symmetry between the left and right PFC as alpha
asymmetry in the PFC correlates highly with approach / withdrawal motivation and internalizing
negative emotions of AD and depression (Mennella, 2017).
Beta / SMR NFT uptrains beta and SMR power are associated with alertness, active

23
concentration, sustained attention, and semantic processing. SMR training is linked to heightened
thalamic inhibition and as such is especially efficacious for individuals with ADHD and epilepsy
(Niv, 2013). Beta and Beta / SMR protocols are also combined with Theta down-training in
order to increase attention.
In slow cortical potential (SCP) protocols individuals are trained to regulate their
negative and positive SCP shifts. Originally developed for patients with epilepsy to decrease the
probability of seizures (Rockstroh et al., 1993; Kotchoubey et al., 1999 and 2001) they are now
effectively used to treat individuals with ADHD as well (Strehl et al., 2017).
The individualized QEEG-based NFT compares a client’s average resting EEG
oscillations for all 19-24 electrode sites to measurements of the same sites from a normative
EEG database (from the Applied Neuroscience Institute or from New York University). The
databases include EEGs of 600-3000 “normal” individuals and are stored by sex and age group.
The client’s EEG parameters, such as individual waveband powers for each electrode location,
connectivity, and coherence between different electrodes, are compared with the normed results
according to the client’s sex and age range. The NFT protocol is individualized to normalize the
client’s wavebands, connectivity, or coherence that are at least three standard deviations from the
norm (z-scores). The validity and reliability of the databases have been called into question
because the EEGs collected in the database are not a representative sample of the U. S. popu-
lation and the ideal of the “QEEG normalized brain” has not yet been adequately addressed.
A fairly new protocol is the infra-slow frequency protocol that uses 0.01-1 Hz oscillations
to “re-normalize the functional connectivity of our resting state networks” (Othmer et al., 2013,
p. 246) and is a promising treatment for PTSD and performance optimization (Smith, Collura,
Ferrera, et al., 2014). Randomized controlled studies have yet to be published.
24
1.2.5 Neurofeedback treatments for anxiety.
As detailed more fully in the next section, a comprehensive review of the relevant
literature found that very few randomized single- or double-blind studies have been conducted.
Moreover, most used sample sizes of ten participants or less per experimental or control group
and results have been mixed. Orne and Paskewitz (1974) and Watson and Herder (1980) found
no significant effects for anxiety symptom reduction and Egner, Strawson, and Gruzelier (2002)
did not find a significant difference in subjective activation level between alpha/theta NFT and
the sham group. On the other hand, a number of studies, such as Hardt and Kamiya (1978),
Plotkin and Rice (1981), Sargunaraj, Kumaraiah, Mishra, and Kumar (1987), Rice, Blanchard,
and Purcell (1993), Vanathy, Sharma, and Kumar (1998), Sarkar, Rathee, and Neera (1999),
Eismont, Lutsyuk, and Pavlenko (2011), and Gruzelier, Thompson, Redding, Brandt and Steffert
(2013) did find a significant anxiety symptom reduction through NFT.
Most of the reviewed NFT studies used an Alpha/Theta (or alpha) NFT protocol, during
which increasing alpha and theta amplitudes or increasing the theta/alpha ratio or alpha
amplitudes at parietal electrode locations (Pz), at occipital locations (O1 and O2, or Oz), and
central locations (Cz) were most often used.
1.2.5.1 Critical literature review of neurofeedback for anxiety disorders.
Since the late 1960s NFT has been used to treat adult individuals with AD; yet, most
studies were conducted between the mid-1970s and mid-2000s. To investigate the quality of the
experimental design and statistical analysis of NFT for AD, an exhaustive literature search of peer-
reviewed articles on MEDLINE (1850-2017), PsycINFO (1894-2017), PsycARTICLES, Google
Scholar (up to October 2017), as well as hand searches through the “Journal of Biofeedback and
Self-Regulation” (from 1976- 2004) and its successor “Applied Psychophysiology and
Biofeedback” (2005-2015) were performed.

25
In most NFT studies an alpha and theta up-training protocol was used (Peniston and
Saxby, 1995; Dadashi et al., 2015; Glueck & Strobel, 1975; Sadjadi & Hashemian, 2014; Cheon
Koo, & Choi, 2015; Green, 1974; Peniston & Kulkosky, 1991) alpha, theta and beta up-training
or a theta/alpha ratio uptraining (Eismont et al., 2011; Egner et al., 2002; Raymond et al., 2005;
Egner & Gruzelier, 2003; Gruzelier et al., 2009, 2013, 2014 a and b). Almost equally frequently
an alpha uptraining protocol was used (Bhat, 2012; Agnihotri, Sandhu, & Paul, 2007; Rice et al.,
1993; Sarkar & Rathee, 1999; Vanathy et al., 1998; Plotkin & Rice, 1981; Hardt & Kamiya,
1978; Walker, 2009; Garrett & Silver, 1976; Dekker, Van den Berg, Denissen, Sitskoorn, & Van
Boxtel, 2014). Some researchers preferred a theta uptraining protocol to reduce anxiety
(Sittenfeld et al., 1976; Vernon et al., 2002) and two studies downtrained alpha (Kluetsch et al.,
2013, Orne and Paskewitz, 1974), (See Table 1.1).
In the past 50 years only six studies were conducted with a clinical population and
control group (i.e., not with healthy volunteers): Dadashi et al. (2015), Sadjadi and Hashemian
(2014), Vanathy et al. (1998), Rice et al. (1993), Peniston and Kulkosky (1991), Glueck and
Strobel (1975); out of those six studies only Vanathy et al. (1998) used a pre- and post EEG to
measure if significant changes in brain oscillations could be found. While all authors except
Dadashi et al. (2015) used an active control group, only Vanathy et al. (1998) and Rice et al.
(1993) used a NFT-based active placebo group. The following three studies with control groups
were conducted with healthy adults regarding reduction of anxiety: Garrett and Silver (1974),
Plotkin and Rice (1981), and Kluetsch et al. (2013). Kluetsch’s study was a one session proof of
principle studies, and Garrett and Silver (1974), and Plotkin and Rice (1981) did not use pre-
post trial EEG measurements.
The results vary widely (see above), depending on what parameters were used to measure
changes in anxiety symptoms. Some studies exclusively used subjective self-report measures for
26
general anxiety symptoms, such as the Spielberger State Trait Anxiety Inventory (STAI), the
Beck Anxiety Inventory (BAI), and the Hamilton Anxiety Rating List (HARS), or specialized
questionnaires for specific anxiety disorders, such as the Social Phobia Scale (SPS). These will
not be reviewed here due to poor operationalization. However, most studies used multiple
instruments to assess changes in anxiety. These included the aforementioned self-report
inventories and self-report relaxation measures (e.g., Thayer’s Activation-Deactivation Adjective
Checklist [AD-ACL]), physiological measures such as heart rate, galvanic skin response, pre-
and post-trial QEEG results, NFT EEG T/A ratio, absolute or relative theta, alpha, and /or T+A
amplitude changes between the beginning and at the end of the NFT trial — sometimes for 1-3
additional measurements in the middle of the study. Nevertheless, none of the reviewed studies
used a general linear mixed effects Growth Curve Model (GCM) – a type of advanced regression
model that calculates a regression for each participant (random effect) and uses all NFT data
points within and across NFT sessions to compare how the EEG parameters change for each
participant within each session and across sessions and comparing them to experimental and
control groups. A few studies that were administered in a hospital setting also included a report
measure filled out by the clinicians or family members – pre- and post-trial, and during follow-
up – for example in Glueck and Strobel, 1975 and Saxby and Peniston, 1995.

27
Figure 1.3 a: RCTs: Research design, sample, and results of NFT for anxiety-related disorders. Light green high light= studies with clinical
population. Bue print = significant results of self –report anxiety measures; red print= significant results in EEG-based NFT measures; green print =
significant results in de/activation scales.

28
Figure 1.3 b: Studies with CG but no randomization: Research design, sample, and results of NFT for anxiety-related disorders. Light green
high light= studies with clinical population. Bue print = significant results of self –report anxiety measures; red print= significant results in EEG-
based NFT measures.
Table 1.3 c: Studies without control and no randomization: Research design, sample, and results of NFT for anxiety-related disorders.
29
Differences in the significant versus non-significant results in these studies are partially
due to different participant populations. Many studies with non-significant results had used
healthy college students only (Hardt & Kamiya, 1978; Orne & Paskewitz, 1974; Egner et al.,
2002). As these participants had no AD, a reduction of already normal anxiety symptoms would
have been less likely than in a clinical population. Furthermore, differences in the measures
administered pre- and post-NFT might be responsible for differing results. Most studies
administered only one to several self-report anxiety scales which were more or less reliable, such
as the STAI, Taylor’s Manifest Anxiety Scale, Welsh Anxiety Scale, and the GAD-7; whereas
some used exclusively clinical observer measures, such as the Hamilton Anxiety Rating List, and
less objective unstructured and semi-structured clinical interviews. Moreover, different feedback
and reward criteria, NFT electrode locations, and most importantly studies differed regarding the
use of CG – from no use of CG, wait-list CG, other treatment CG, to pseudo-NFT were used.
Studies that did not use a CG or had a wait-list CG had been very likely to show significant effects.
Many studies did not have any kind of control group (Baehr & Rosenfeld, 2001; Gurnee,
2003; Kluetsch et al., 2013; Mills & Solyom, 1974; Saxby & Peniston, 1995), and quite a few
that did not have a NFT control group did have a wait-list or a relaxation group, or a group with
another treatment modality such as medication (e.g., Bhat, 2012; Dadashi, Birashk, Taremian, et
al., 2015; Peniston & Kulkosky, 1989; Sarkar, Rathee, & Neera, 1999). Other studies had not
been controlled for combination of NFT with other treatments, such as psychotherapy,
medications, meditation, and breathing and hand warming exercises (e.g., Bhat, 2010; Glueck &
Stroebel, 1975; Green, 1974; Peniston and Kulkosky, 1991; Saxby and Peniston, 1995); and
some studies with a control group did not have a randomization procedure (Cheon, Koo, Seo, et
al., 2015; Green, 1976; Gurnee, 2003; Sargunaraj, Kumaraiah, Mishra, et al., 1987; Saxby &
Peniston, 1995). Only two studies had a single- or double-blind research design (Dekker et al.,
30
2014; Egner & Gruzelier, 2003, respectively). Other studies were an accumulation of a limited
number of case studies with individualized NFT treatment (e.g., Hammond, 2003; Moradi et al.,
2011; Singer, 2004).
Furthermore, studies had a limited amount of treatment sessions – one to six sessions –
(for instance, Chisholm, DeGood, & Hartz, 1977; Egner et al., 2002; Hardt & Kamiya, 1978;
Kirschbaum & Gistl, 1973; Orne & Paskewitz, 1974;) or were one session proof-of-principle
studies (Kluetsch et al., 2013; Peeters, Bodar, Ronner, van Os, & Lousberg, 2014).
Participant characteristics such as age, education, ethnicity / race range, and socio-
economic status were homogeneous; many studies had 18- to 25-year old Caucasian under-
graduate students as participants, such as Chisholm et al. (1977), Egner et al. (2002), Gruzelier,
Thompson, Redding, et al. (2013) Gruzelier et al. (2014), and Kirschbaum & Gistl, 1973.
Furthermore, while generalizations were made about mechanisms of anxiety reduction for people
with anxiety disorders, all study subjects were healthy individuals without anxiety diagnoses
(e.g., Kirschbaum & Gistl, 1973; Eismont, Lutsyuk, & Pavlenko, 2011; Orne & Paskewitz, 1974;
Peeters et al., 2014; and Raymond, Varney, Parkinson, & Gruzelier, 2005). Other mental
disorders or chronic diseases that might have influenced the NFT results were not addressed,
assessed, or used as an exclusion criterion.
Problems with the statistical analysis of the study data were prevalent. The sample size
for many studies of less than 10 for control or experimental groups, respectively, can lead to
large confidence intervals. Consequently, incorrect inferences of a population from the sample
may occur which would seriously impede the statistical power of the study (e.g., Eismont et al.,
2011; Egner, Strawson, & Gruzelier, 2002; Raymond et al., 2005; Gruzelier, Hirst, Holmes, &
Leach, 2014; Sargunaraj et al., 1987; Vanathy et al., 1998). Also, traditional averaging of
multiple NFT sessions data leads to excessive loss of information, especially in the studies where
31
only pre-and post- of NFT data, such as alpha and theta amplitudes, were analyzed (e.g.,
Dadashi, Birashk, Taremian, et al., 2015; Plotkin & Rice, 1981; Vanathy et al., 1998). Moreover,
many studies did not address and appropriately factor out the experimenter effect on the results
of the study, such as the studies of Sadjadi & Hashemian (2014) and Sargunaraj et al. (1987).
1.3 Considerations Regarding the Study Planning
1.3.1 Neurofeedback protocol.
After reviewing the studies, especially those whose results showed a significant decrease
in anxiety symptoms in self-report measure and a significant change in EEG- and NFT-related
parameters (see sections 1.2.5.1 and 1.2.4), the NFT protocol that was most efficacious for AD
and trait anxiety was the alpha/theta protocol.
Unfortunately, many of the reviewed studies, especially studies before 2010, failed to
divulge details of electrode placements, as well as details about how reward criteria were
operationalized. For studies that did provide electrode placement locations, Pz or Cz were the
most common placements for electrodes. However, the rationale for why an electrode location
was chosen often remained unclear in all of the reviewed studies, except for Gruzelier et al.
(2009). The Pz electrode placement corresponds most closely to Brodmann area 7.
Neuroanatomically, this area corresponds to the caudal superior parietal lobule Gruzelier and
colleagues (2009) describe that the A/T training at the Pz location is connected with enhanced
hippocampal activity involving the following mechanisms:
“The ascending mescencephalic-cortical arousal system, and limbic circuits subserving
cognitive as well as affective/motivational functions, and including coupling between
frontal and posterior cortices, exemplifying a role for theta and alpha waves in mediating
the interaction between distal and widely distributed connections. It is theorized that the
long-distance connections, afforded by slow rhythms in the brain during a state of deep
32
relaxation facilitates associative connections in memory and subsequent retrieval in
performance” (p. 108).
Hippocampal activity is integrally involved in memory consolidation and retrieval,
(Sauseng, Klimisch, Schabus, et al., 2005; Reiner, Rozengurt, & Barnea, 2014), including
memory with associated emotions. Furthermore, Angel, Oviedo, Paloutzian, Runehov, & Seitz
(2017) describe that, among other functions, the central parietal area below Pz seems to be
involved in self-related functions
“in mismatch between actual and predicted feedback of actions, (ii) in the parietofrontal
network active in conscious access and exocognitation, (iii) in the autobiographical self,
underpinned by PMC, as well as (iv) in the default network (and its probable self-related
function)” (p. 258).
Consequently, Pz-LE appeared to be a beneficial location for the active NFT electrode,
particularly in combination with an A/T NFT protocol for subjects with high anxiety; it might
potentially produce enhanced memory consolidation and retrieval and activation of self-related
functions that can be used to achieve a relaxed calmness, and down-regulation of the HPA axis,
and in combination with CBT or other psychotherapy methods retrieve and restructure
maladaptive thought patterns, and effectively encode more adaptive ones (Sections 1.1.1 and
1.1.4).
Regarding visual and auditory feedback conditions for alpha and A/T NFT, Vernon et al.
(2005) concluded that the most common ways to create an alpha or A/T feedback protocol by
utilizing alpha (and theta) amplitude, percent, or T/A ratio measurements, mostly via auto-
thresholding, i.e., as long as the alpha measurements (or T/A ratio) was above a threshold for 60-
80% (depending on the study) for a pre-defined time segment an auditory, visual, or combined
visual and auditory feedback was given. However, many A/T studies did not report if manual or
33
automatic thresholding was used in their study protocol (Agnihotri, et al., 2007; Bhat et al., 2012;
Eismont et al., 2011; Faridnia et al., 2012), some used automatic thresholding (Lu et al., 2017;
Peeters et al., 2014) while the group at the Gruzelier lab used manual thresholding (Egner et al.,
2002 and 2003; Gruzelier et al., 2013; Raymond et al., 2005). In the area of NFT research several
research groups had used autothresholding as well, such as Gevensleben et al. (2012), van
Dongen-Boomsma et al. (2013), and Schoenenberg et al. (2017) mainly to minimize variability
of reinforcement protocol by more or less accurate timing to manually change the threshold by
the individual experimenters (reliability) and to maximize the replicability of the study.
However, a distinct disadvantage of any automatic thresholding protocol is that while it
reinforces any upregulation of alpha and theta from the baseline it may also lead to positive
punishment — “the addition of a stimulus to decrease the probability that a behavior will recur”
(Grison, Heatherton, & Gazzaniga, 2017; p. 214) — in other words, in cases where alpha and
theta oscillations are up from the past minute measurements but still below the baseline a
feedback signal may actually decrease alpha and theta oscillations even more. This study used
alpha and theta amplitude changes from baseline and 65% thresholding for the reward criteria
was used.
The session lengths in reviewed NFT studies targeting AD in adults showed average
sessions of 30 minutes in length, divided into 2 -10 training segments (Ghaziri et al., 2013;
Hammond, 2003; Vanathi, Sharma, & Kumar, 1998). After reviewing NFT studies Vernon
(2009) comes to the conclusion that a temporary change in EEG wave bands can be successfully
achieved by a 20 to 30-minute session of NFT but that those changes are likely transient unless
more sessions solidify the learning.
Vernon (2009) adds that evidence regarding the spacing of NFT sessions—from a high
frequency of sessions within a short amount of time, over double-sessions within the same day,
34
to spaced-out sessions over the course of days or weeks— is mixed. In the area of A/T NFT 2-3
sessions per week seemed be most successful (Agnihotri et al., 2007; Egner et al. 2003; Gruzelier
et al., 2009).
The number of NFT sessions among all NFT for trait anxiety or AD varied widely, from
one session for proof of principle studies (Kluetsch et al., 2013; Peeters et al., 2014) to 40
sessions (Deng et al., 2014). Most studies with significant results used between 5 and 12 session
protocols and 2-3 sessions per week within a + / – two-hour timeframe of sessions (Agnihotri et
al., 2007; Egner et al., 2003; Gruzelier et al., 2009; Hardt & Kamiya, 1978; Rice et al., 1993;
Watson & Herder, 1980) and had a combined audiovisual feedback signal with eyes-open
condition. Hence, ten NFT sessions with a combined audiovisual feedback signal, each with
three training segments of eight minutes each and with two short, 1-2 minute breaks (30 minutes
total), and 2-3 NFT sessions per week were scheduled within the same time of day (+ / – 1.5
hours) were deemed adequate to reach significant results in this study.
1.3.2 Control for non-specific effects.
To differentiate if effects of the NFT were specific to the experimental condition or
resulted from the non-specific general environment of the study and participants’ expectations, it
is vital to create an active CG that mimics the experience of the EG as closely as possible.
According to Geuter, Koban, and Wager (2017), a placebo is “a sham medical or therapeutic
treatment that appears similar to an actual treatment and evokes expectations of benefit” (p. 168).
Consequently, any effects that an individual who receives a placebo treatment in a RCT trial
shows can only be due to an individual’s “beliefs and expectations, perceptions of the social and
physical environment, and generalization from past experiences” (p. 168). In addition, Finniss,
Kaptchuk, Miller, and Benedetti (2010) emphasize that the placebo effect is attributable to the
“overall therapeutic context" (p. 2) which includes the patient-treatment provider relationship.
35
Placebo effects are powerful effects responsible for between 66% - 80% of a treatment
effect (Roberts, Kewman, Mercier, et al., 1993; Wager & Atlas, 2015), but vary depending on
disorders and outcome treatment measures. For instance, a meta-analysis of 114 medical and
psychotherapeutical studies by Hrøbjartsson and Gøtzsche, (2001, as quoted in Stewart-Williams
& Podd, 2004) showed that not only were placebo effects less widespread and smaller than
previously reported but were found only in studies that used subjective self-reports and
continuous assessment of improvement.
Learning theory and cognitive expectancy theory explain the two major mechanisms
involved with placebo effects. Geuter and colleagues (2017) use learning theory to define the
placebo effect as “a form of classical conditioning, which can influence pain, hormone release,
and other behaviors …a treatment’s reinforcement history… Pairing treatment cues (e.g., an
intravenous injection) with a real drug induces associations between the cues and drug effects
that can be elicited by the cues alone” (p. 171). Moreover, they describe how cognitive
expectancy influences perception, which in turn leads to a placebo effect.
Consequently, to test if effects of the treatment are specific to the active experimental
treatment in this study (A/T NFT), the reduction in subjective measures (i.e., self-reported
anxiety scores and AD-ACL scores) and objective measures (i.e., EEG-based learning curves
and pre-and post-trial QEEGs), would have to be significantly higher for the EG than for the
placebo CG. The experimental design called for a control condition that was as closely related as
possible to the experimental condition in, invested time, mode of application, treatment
expectancy, and learning activity, i.e., actual NFT learning, because the non-specific factors in
this placebo NFT would be equal to the unspecific factors in the experimental A/T condition and
ensure at least a single-blind study, in which the participants do not know throughout the trial if
they are in the experimental or the placebo NFT condition.
36
Arns and colleagues (2013) define three types of CG conditions: semi-active, active, and
placebo control conditions. Active CGs compare two different active conditions regarding the
study’s parameter of interest. For instance, infraslow frequency training and anxiolytic
medication could be used as active CGs for a study concerned with the reduction of anxiety
symptoms. However, a control for unspecific effects is not possible when comparing such
dissimilar treatment modalities. In a semi-active CG, non-specific treatment effects, such as time,
type of energy spent, and amount of interaction with the study personnel, are very similar to the
NFT EG. But instead of training brain waves via feedback, participants train muscle activity via
EMG biofeedback, or interact with a computer. A placebo CG is identical to the EG in number
of sessions, set-up, and reward signals, except that the placebo CG brain oscillations (or other
parameters) that are trained are not related to the brain oscillations of interest for the study. It is
believed that this CG design will ensure blinding of the CG participant and therefore adequately
control non-specific treatment expectancy effects.
There are different approaches to create a successful placebo-controlled CG. Arns and
colleagues (2013) state that “some recent neurofeedback studies (mainly pilot and feasibility
studies) have employed a placebo-controlled design and failed to provide clear evidence for the
superiority of ‘real’ neurofeedback compared to sham-neurofeedback” (p. 4). The studies which
Arns and colleagues quote to back up their claim used NFT protocols that randomly gave
children feedback independent of the child’s brain oscillations (Arnold, Lofthouse, Hersch, et al.,
2013), gave feedback based either on a simulated EEG and not the individual’s EEG recording
(Lansbergen et al., 2011), or based on a pre-recorded EEG of one of the authors (Perreau-Linck,
Lessard, Levesque, & Beauregard, 2010); one study failed to mention what kind of CG protocol
was used (Dongen-Boomsma et al., 2013). A variation of the Perreau-Linck protocol, for
instance, matches each EG member with a CG group member and plays the NFT feedback from
37
an individual in the EG group to the CG group member. However, these fake NFT CGs are
problematic because self-regulation learning does not occur during the NFT sessions. This will
lead to motivational problems and frustration quickly, especially after no changes can be
observed by the participant over the course of several sessions. In the case of inactive electrodes
being attached to subjects’ scalp, participants will likely learn very quickly that no matter what
they do it will not cause any artifacts in the EEG, which would be especially suspicious after
they had the experience of being instructed to sit still during the pre-trial EEG for good signal
receptivity and that eye blink, teeth clenching, slight movements in the chair, or even greasy hair,
or scalp perspiration cause observable changes in the EEG. The realization that one is part of the
placebo group will have consequences, such as frustration and anger, learned helplessness,
negative treatment expectations, worsening of symptoms (nocebo effect) and potentially
dropping out of the study, as well as a skewing of any study results in regard to group
comparison for non-specific effects (Benedetti, Lopiano, & Colloca, 2007). This would be
especially detrimental when working with a clinical population.
Doppelmayr and Weber (2011) found a novel approach to set up a placebo NFT training
in their SMR and Theta / Beta NFT study alternately using the same inhibit bands of the EG but
up-and down-training of specific and differing beta frequency bins, hence allowing the
participants of the CG to learn how to actively regulate frequencies that did not interfere with the
training frequencies of the EG and alternating up-and down-regulating randomly changing
frequency bins each session—a condition they named randomized broadband feedback—that
minimized the probability of learning and NFT training effects to occur in the CG.
Another important aspect of any RCT research study is to use at least a single-blinded
protocol, ideally a triple-blinded protocol in which not only the participant does not know if s/he
is part of the control or experimental group (single-blind design) but the clinician and personnel
38
involved with participant contact (double-blind design) and the person analyzing the data (triple-
blind design) are not aware of the assignment to which treatment or protocol. A triple-blind
design is impossible for a study like this one, whereby all functions—from randomization to
performing NFT sessions to the analysis of the data—are conducted by the same person. Triple-
and even double-blind studies require a multi-person team with separate and specialized roles,
such as one person who randomizes participants not involved with the NFT or the data analysis
of study data. Consequently, this study could only be a single-blinded study in which the
participants were not informed if they were in the EG or CG until the end of the study.
Participant response to the NFT may certainly be influenced by the expectation of
treatment outcome. This might be particularly true for treatments involving technology that is
perceived as cutting edge. The Stanford Expectations of Treatment Scale (SETS; Younger,
Gandhi, Hubbard, & Mackey, 2012) measures participant outcome expectancy in clinical trials,
thereby allowing the researcher to factor out individual differences in this measure. Related to
this issue is a person’s belief as to how much they can influence the outcome of events. One
locus of control scale used in a few NFT studies, such as in Kotchoubey et al. (2001), is
Levenson’s Locus of Control Scale (1981). However, most NFT studies including the current
one utilized Rotter’s (1966) Locus of Control scale (LOC). It can be used to measure this
construct in which individuals with internal LOC attribute results of their own actions to internal
sources, whereas individuals with an external LOC link results of their own actions to external
sources, such as luck, chance, or unpredicTable circumstances.
As humans are social beings who develop relationships over the ten NFT sessions, and
react to subtle emotional cues, interactions with the NFT technicians will certainly have an
effect, especially on anxious participants’ general levels of comfortability, trust, motivation, and
level of focus on the NFT treatment. A standard protocol of procedures and scripts on how to
39
explain possible questions, as well as recording any unusual circumstances during each
individual NFT session is prudent (see Appendix D: Neurofeedback Session Checklist). The data
may be statistically analyzed to exclude the non-specific effect of varying experimenter
personalities, varying degrees of professionalism, and potential experimenter bias.
Lastly, it is important to randomize the sample to ensure that EG and CG have
participants that are as similar as possible and evenly distributed, regarding sex, age, education,
SES, and in the characteristics to be analyzed in the study (here: trait anxiety scores and AD
diagnosis). In this study the term active placebo will be used to classify the CG based on the
understanding of Rief, Hofmann, and Nesturioc (2008). These authors described in the context of
acupuncture research where, like in the EG, acupuncture needles in the sham CG were placed.
However, the locations of the needles in the sham group were not placed along the course of the
meridian, as in the EG. Rief et al. (2008) explain that the CG in the aforementioned acupuncture
study “is not an example of a pure placebo condition, but an example of an active placebo
condition, because the placebo conditions induced the same side effects and the same
expectations than the verum group”. (p. 5) Similarily, the present study uses exactly the same
procedures for EG and CG — an active NFT training protocol at Pz with the same two auditory
and visual feedback signals for the same amount of time. The only difference in the EG and CG
protocols is that in the EG alpha and theta amplitudes are uptrained in all ten NFT sessions
whereas in the CG two wavebands, beta and high beta, are successively up- and downtrained
each session. Thus, while learning beta and upper beta regulation within one NFT session can
take place in the next NFT the opposite learning takes place via downregulating beta and upper
beta.
40
2. Objectives and Hypotheses
Due to rapid advances in neurotechnology and neuroscience new mechanisms underlying
AD have been discovered (see section 1.1.3). Of particular interest is the way the neuronal
system transmits, prioritizes, analyzes electrophysiological signals, and organizes information in
nodes, hubs, and networks that can in turn be mapped onto anatomical and functional parts of the
brain. Because NFT may cause long-term changes in neurocircuits of the brain via LTP and LTD
(see section 1.1.3) it is uniquely suited to become an EBT method for individuals with high trait
anxiety or AD. However, there is a paucity of placebo-condition-controlled trials for clinical
populations of various ages regarding NFT in general, and for AD in particular. Furthermore,
statistical analysis methods of most clinical trials in the field of NFT are fraught with insufficient
statistical analysis methods that do not take individual NFT learning curves within and between
sessions into account and measure NFT outcome by session means between two to five time
points, thereby reducing the wealth of data.
2.1 Study Objectives
The primary objective of this study was to create a rigorous, placebo-controlled, clinical
trial with a (sub)clinical sample of women for the NFT treatment of AD to investigate if A/T
NFT at Pz is an efficacious method for anxiety symptom reduction. A secondary objective of this
study was to search for and implement better statistical analyses methods for NFT trials in
general and to investigate cognitive variables involved in NFT, yet often not assessed, such as
treatment outcome expectancy, personal attribution styles, the use, types, and efficaciousness of
cognitive strategies in NFT.
41
2.2 Hypotheses
2.2.1 Primary hypotheses.
Hypothesis 1 (H 1a and b): A ten-session NFT protocol of up-training alpha (8-11 Hz)
and theta (5-7.5 Hz) frequency bands at Pz will significantly elevate mean absolute and relative
theta and alpha amplitudes and absolute and relative theta + alpha (T+A) amplitudes within (H
1a) and across (H 1b) NFT sessions. NFT. These measures will not change significantly in the
placebo group.
Hypothesis 2 (H 2): A ten-session NFT protocol of up-training alpha (8-11 Hz) and theta (5-7.5
Hz) frequency bands at Pz will significantly lower the subjective experience of trait anxiety.
These measures will not change significantly in the placebo group.
2.2.2 Secondary hypotheses (Treatment effect hypotheses).
Hypotheses 3 (H 3a and 3b): The treatment group will feel significantly more deactivated
(as assessed by Thayer’s AD-ACL check list) within a NFT session (H 3a) and will subjectively
become significantly more deactivated across NFT sessions (H 3b) while the placebo group will
not.
Hypothesis 4 (H 4): The treatment group will show significant increase in absolute and
relative theta and alpha amplitudes and absolute and relative theta + alpha (T+A) amplitudes
across sessions which will correlate with higher deactivation and lower activation scores of the
AD-ACL, while the placebo group will not.
Hypothesis 5 (H 5): The treatment group will show a significant increase in absolute and
relative theta and alpha amplitudes and absolute and relative theta + alpha (T+A) amplitudes
across sessions which will correlate with a decrease in trait anxiety as measured by the STAI-T
inventory.
42
Hypothesis 6 (H 6): The treatment group will have a significant increase in absolute and
relative theta and alpha amplitudes and absolute and relative theta + alpha (T+A) amplitudes on
the mini-QEEG in the Pz region while the placebo control group will not.
Hypothesis 7 (H 7): Self-perceived successful cognitive strategies to modulate brain
waves will be significantly correlated with learning as specified by the A/T NFT protocol.
2.2.3 Control for treatment expectations and self-efficacy.
Hypothesis 8 (H 8): No significant differences between the treatment and the placebo
group in treatment expectations / self-efficacy as measured by the Stanford Expectations of
Treatment Scale (SETS) and the Rotter Locus of Control Scale (LOC) will be observed in the
study. There will not be significant differences between the treatment and the placebo group’s
pre-and post-treatment satisfaction as measured by the SETS modified outcome scale.
Hypothesis 9 (H 9): Participants’ NFT learning will be significantly correlated with each
participant’s self-identified time-of day best, worst or neutral period for learning.
43
3. Methods
3.1 Procedure
To determine the number of required participants for this study with the adequate power to detect
moderate effects between EG and CG a power analysis was performed. The overall design of the
study called for a mixed ANOVA where treatment condition (A/T vs. B u/d control) serves as
the between-subjects, and pre/post levels of anxiety, as the within-subjects factor. Treatment
effectiveness (across both groups) would be reflected in a significant within-subjects effect and
the efficacy of NFT specifically would be reflected in an interaction whereby significantly more
improvement (i.e., lowered trait anxiety) would be found in the A/T NFT in contrast to the B u/d
control condition. A power analysis using G*Power, version 3.1 for Mac (Faul, Erdfelder, Lang,
& Buchner, 2007; http://www.psycho.uni-duesseldorf.de/abteilungen/aap/gpower3) using the
partial eta squared from prior A/T NFT studies with significant results revealed that in a
respeated measures 2x2 ANOVA a total of 27 participants (N = 27) was required to detect
moderate sized (f = .25) interaction effects and within-subject’s effects with adequate power
(.80), and was subsequently recruited for this study.
This study was designed to have an experimental and an active placebo group. While I
would have gladly offered the placebo group participants the experimental treatment after the
end of the trial this was not done due to time and budget constraints. This study was completely
self-financed, apart from the office space, NFT, and EEG equipment which Dr. John Saksa
graciously supplied me with for free. Furthermore, La Vaque and Rossiter (2001) reported that
most participants who initially were in the CG were not interested in receiving the active NFT
after the end of the trial.

44
3.1.1 Recruitment of participants.
The participants were recruited from the greater Hartford, CT area through the
publication of the study protocol in ClinicalTrial.gov, the National Institutes of Health online
trial database (Appendix C). Participants were further recruited via word of mouth and repeated
articles in 16 local online publications of The PatchUSA (patch.com) for 16 towns within a 20-
mile driving radius to the site of this study, as well as in U-Notes, the University of Hartford’s
daily publication for faculty, staff, students, and alumni. Flyers were posted on approved bulletin
boards at two universities’ student psychological counseling centers, in a local public library, on
event boards, at a psychotherapy practice, a local coffee house, and two grocery stores with
communal gathering areas. A list with venues, locations and exact dates may be found in
Appendix B. The information flyer and online news articles were checked and edited by the
Word for Windows reading level analysis until the document was congruent with the 8th grade
reading level required by the University of Hartford’s Institutional Review Board, the Human
Subjects Committee. To recruit people via word of mouth a response template was used to
standardize the way information was given.
Potential participants were asked to read and sign a pre-screening consent form informing
them of the study, including a description of the procedures, risks and inconveniences, benefits,
confidentiality, voluntary participation, and potential questions. They were then given the link to
fill out the encrypted surveymonkey screening questionnaire (Appendix C). Interested individuals
were given further information about the study: one general interest article from the Scientific
American magazine (Kraft, 2006) and one scientific review article from the Journal of
Neurotherapy (Hammond, 2011) were emailed to them.
Participants of the study received $5 cash at the beginning of each of the ten NFT
45
sessions to offset the costs of travel. In addition, they received a $100 gift card of their
choice from a local grocery store, restaurant, or any one of various online stores, for their time
and expense once they completed all ten NFT sessions, QEEG, and other post-trial
questionnaires.
3.1.2 Screening criteria.
Participants were included in the study if they scored in the moderate to severe anxiety
range on the State-Trait Anxiety Inventory (STAI-T; Spielberger, Gorsuch, Lushene, Vagg, &
Jacobs, 2015), the Beck Anxiety Inventory (BAI), and the GAD-7. Furthermore, their scores on
the Beck Depression Inventory (BDI-II, Beck, Steer, & Brown, 1996) and the PHQ-9 had to
indicate either no or mild depression, and they could not have self-reported severe psychiatric or
neurological disorders (such as schizophrenia, major depression, substance use disorder,
Parkinson’s disease, epilepsy, or ALS) as assessed by the Demographic and Medical Screening
Questionnaire (Appendix C). They may or may not have been diagnosed with an anxiety
disorder.
The cut-off score for trait anxiety of above the 66th percentile of the respective
normative group was defined as moderate to high trait anxiety and was used to determine if
the subject should be included in the study. For the general population of females ages 19-39,
scores of > 39, ages 40-49 scores of > 37, and ages 50-69, scores of > 43 were considered
accepTable. Traditionally-aged female undergraduate students with a total score of > 43 were
included. For the BAI and the GAD-7 the cut-off scores were >15 and >11, respectively,
which corresponded with a score of at least moderate anxiety.
To avoid the confounding factor of the frequently observed comorbid condition of
depression with anxiety, the BDI-II and the PHQ-9, two reliable depression inventories, were

46
administered to exclude potential participants whose scores indicated a moderate, moderately
severe, or severe depression. Participants with scores of > 19 on the BDI-II and scores of > 9 for
the PHQ-9 were screened out.
The use of prescription medications is ubiquitous in the United States; the most recent
U.S. Center of Disease Control and Prevention (www.cdc.gov/nchs/data/hus/hus15.pdf#079)
Study (2015) reports that 65% of U.S. adults have taken prescription medication within the past
30 days. Moore and Mattison (2017) write that in the 2013 Medical Expenditure Panel Survey
17% of U.S. adults report that they currently take psychotropic medications, with higher
percentages for women and Caucasians. For this reason, the customary exclusionary criterion of
prescription drugs was not enforced in this study, but a less restrictive parameter was used:
prescription medication use had to remain the same for the duration of the study so that
difference scores for NFT between sessions and pre- and post-treatment scores on the QEEG and
the psychometric measures could be calculated without confounding variable. However, illicit
drug and excessive alcohol consumption remained exclusionary criterion for this study.
The initial screening was done through the online platform surveymonkey after
converting the demographic and medical questionnaire, the GAD-7, and the STAI into online
format for potential participants to take whenever they wanted. The two depression measures
were taken in the presence of the experimenter and with Dr. John Saksa, an APA-licensed
clinical psychologist, in case of any adverse reactions to questions in the depression inventories,
such as expressing a desire to commit suicide.
3.1.3 Participants.
All subjects provided both written consent before taking part in the screening and a more
detailed written consent form before participating in the experiment (Appendix B). In the consent

47
form the study procedures, risks and inconveniences, benefits, economic considerations,
confidentiality, and voluntary participation were described. Any identifiable information about
participants, collected in this study remained confidential and was not stored with personal
identifiers, but rather with the subject number. The master list connecting subject number with
name was stored a a paper copy in the primary investigator’s office in a locked cabinet.
This study was conducted in accordance with Title 45 of the United States Code of
Federal Regulation (CFR 46) and the Declaration of Helsinki. It was approved by the Human
Subjects Committee (IRB) of the University of Hartford, CT, USA (study number PRO
15070009).
3.1.4 Randomization.
The study participants were randomly assigned to one of two groups: either the
experimental group of alpha/theta frequency band uptraining (A/T; n = 15) or the control group
of alternating beta/high beta up- and down-training (B u/d; n = 13) without stratification. The
randomization was created in Matlab 9.0 (MathWorks, R 2016a). Seven random four-integer
zero-one vectors, defined as 2 zeros and 2 ones in random order were created and matched in
numerical order with participant numbers 001 to 028. Participants matched with the number zero
were assigned to the control group; participants matched with the number one were assigned to
the experimental group (see Appendix E 1).
3.1.5 Trial schedule and progression.
After filling out the study consent form participants were scheduled to come in for their
initial appointment. At the end of the appointment the schedule for the remaining nine
appointments was set up for two to three appointments per week with one day between two
consecutive NFT sessions at approximately the same time of day (+/– 1.5 hours). Appointments
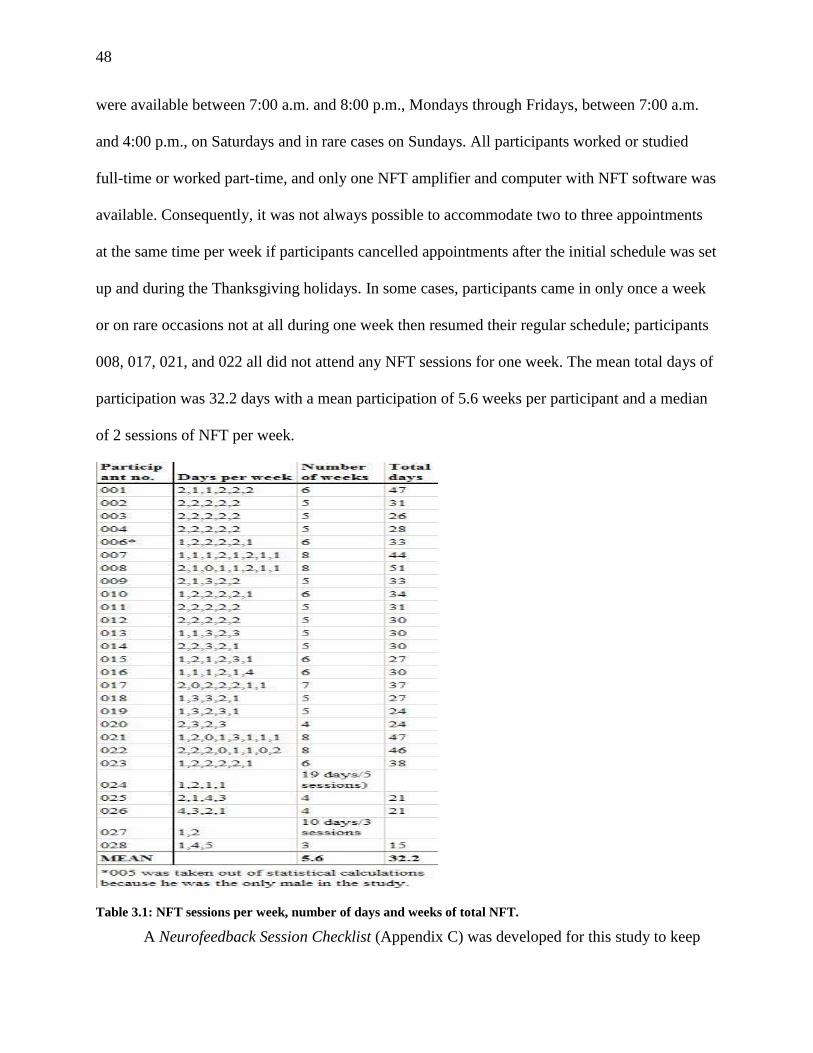
48
were available between 7:00 a.m. and 8:00 p.m., Mondays through Fridays, between 7:00 a.m.
and 4:00 p.m., on Saturdays and in rare cases on Sundays. All participants worked or studied
full-time or worked part-time, and only one NFT amplifier and computer with NFT software was
available. Consequently, it was not always possible to accommodate two to three appointments
at the same time per week if participants cancelled appointments after the initial schedule was set
up and during the Thanksgiving holidays. In some cases, participants came in only once a week
or on rare occasions not at all during one week then resumed their regular schedule; participants
008, 017, 021, and 022 all did not attend any NFT sessions for one week. The mean total days of
participation was 32.2 days with a mean participation of 5.6 weeks per participant and a median
of 2 sessions of NFT per week.
Table 3.1: NFT sessions per week, number of days and weeks of total NFT.
A Neurofeedback Session Checklist (Appendix C) was developed for this study to keep
49
the preparation for and process of each NFT session as standardized as possible, as well as to
record date, time and name of the NFT technician who administered the respective session,
observations and potential interferences for each NFT session. The information from all
individual Checklists was entered into a master spread sheet (Appendix E). The principal
investigator administered 68% percent of the NFT sessions, including all but two of the initial
sessions (session 1 with pre-treatment QEEGs) and all last sessions (session 10 with post-
treatment QEEGs). The remaining 32% of sessions were administered by two trained graduate
assistants, for 14% and 18% of the sessions, respectively.
Forty-six individuals, 38 women and 8 men filled out the initial study consent form and
the initial screening questionnaires: Demographic and Medical Questionnaire, STAI, and an
abbreviated version of the PHQ-9 on surveymonkey, an online survey tool. The PHQ-9
depression screening was administered to screen out individuals that had high depression scores
on a short depression measure before they came in for an appointment to take the BDI-II and
additional tests. While three men qualified for the study, two decided not to participate after the
screening. By the time the first 17 participants had been recruited and started the trial only one
male was included. It was decided to continue recruiting women only for the remaining ten
participants, allow the only male to finish the trial but replace his data with data from a 28th
female participant. Participants were randomly assigned to either the experimental (1) or control
group (0) by random 0-1 vector creation in Matlab (Appendix E). All fourteen participants from
the EG finished the trial and two participants from the CG dropped out, one after three sessions
of NFT and one after five sessions of NFT.
All trial procedures were the same for participants from the EG and CG, except that the
EG received an A/T protocol for all ten NFT sessions, whereas the CG received alternating beta

50
up- and down-training (see 3.4.2).
Pre-Screening: Total time:
30 minutes
Fill out Screening Questionnaire (demographic, medical, STAI, and
abbreviated PHQ-9) on surveymonkey.
20 minutes
IF qualified, THEN fill out BDI-II and PHQ-9 in person. 10 minutes
IF BDI-II scores were below cut-off, THEN invite to participate in study.
↓ Assign participant a three-digit number (001-028) and randomly assign her to
either A/T or control NFT group.
Session 1: Total time:
90 minutes
Welcome, explain procedures, and answer broad questions. 10 minutes*
Fill out the following questionnaires on surveymonkey:
1. Pre-treatment Stanford Expectations of Treatment Scale (SETS),
2. Pre-treatment BAI,
3. Pre-treatment GAD-7.
10 minutes*
Pre-treatment mini-QEEG: 5x4 channels for 2 minutes each. 30 minutes*
1. Fill out pre-session AD-ACL Questionnaire on surveymonkey,
2. A/T or control NFT on Pz for 3 x 8 minutes with two 30-60 second
breaks in between sets,
3. Fill out post-session AD-ACL Questionnaire on surveymonkey.
40 minutes*
Sessions 2-9: Total time: 8 x 40 minutes =
320 minutes
1. Fill out pre-session AD-ACL Questionnaire,
2. A/T or control NFT on Pz for 3 x 8 minutes with two 30-60 second,
breaks in between sets,
3. Fill out post-session AD-ACL Questionnaire.
40 minutes*
Session 10: Total time:
100 minutes
1. Fill out pres-session AD-ACL Questionnaire,
2. A/T OR control NFT on Pz for 3 x 8 minutes with two 30-60 second
breaks in between sets,
3. Fill out post-session AD-ACL Questionnaire.
40 minutes*
Post-treatment mini-QEEG: 5x4 channels for 2 minutes each. 30 minutes*
Fill out the following questionnaires on surveymonkey (in stacked order):
post-treatment STAI,
Post-treatment BAI,
Post treatment GAD-7,
Post-Treatment SETS,
NFT Strategies and Feedback Questionnaire,
Rotter LOC Questionnaire.
25 minutes
Debriefing 5 minutes
Total Time investment per participant for clinical trial:
510 minutes = 8 .5 hours = 1 x 90 minutes + 8 x 40 minutes + 1 x 100 minutes.
*All times were tested on three healthy adult volunteers before the start of the study and averaged.
Figure 3.1: Overview of all assessment and treatment sessions of the study.
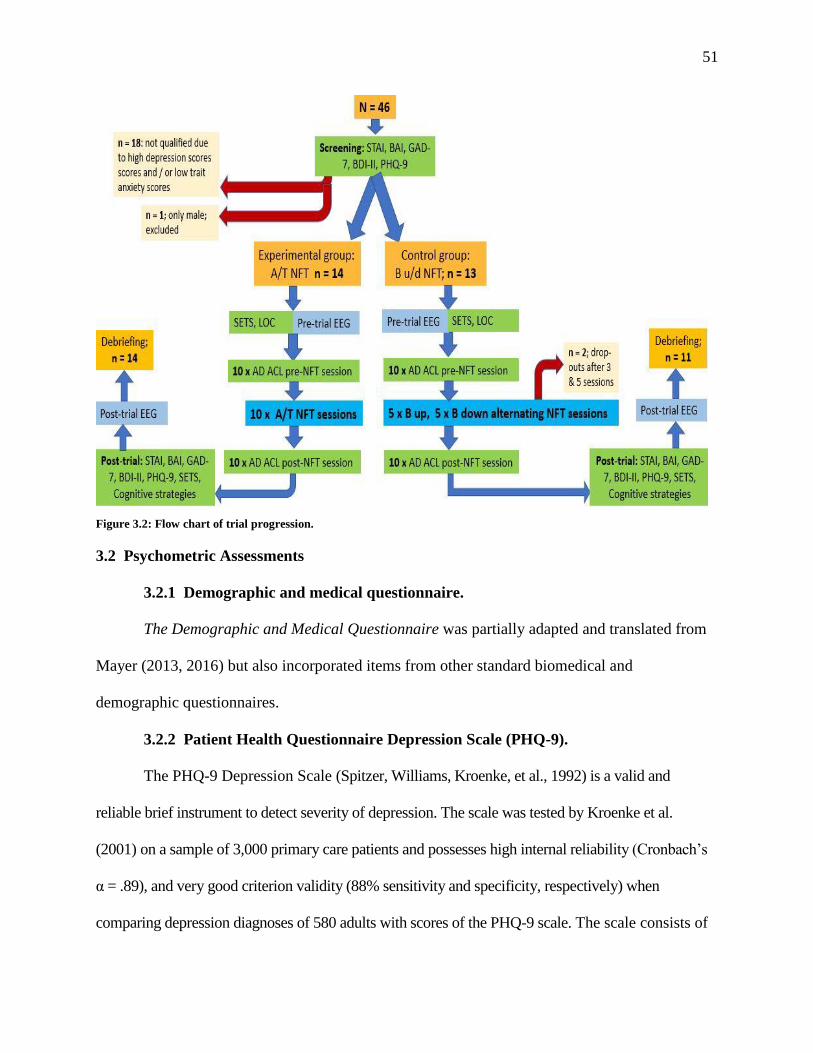
51
Figure 3.2: Flow chart of trial progression.
3.2 Psychometric Assessments
3.2.1 Demographic and medical questionnaire.
The Demographic and Medical Questionnaire was partially adapted and translated from
Mayer (2013, 2016) but also incorporated items from other standard biomedical and
demographic questionnaires.
3.2.2 Patient Health Questionnaire Depression Scale (PHQ-9).
The PHQ-9 Depression Scale (Spitzer, Williams, Kroenke, et al., 1992) is a valid and
reliable brief instrument to detect severity of depression. The scale was tested by Kroenke et al.
(2001) on a sample of 3,000 primary care patients and possesses high internal reliability (Cronbach’s
α = .89), and very good criterion validity (88% sensitivity and specificity, respectively) when
comparing depression diagnoses of 580 adults with scores of the PHQ-9 scale. The scale consists of

52
nine items with four-point Likert–type questions: (0) not at all, (1) several days, (2) more than
half the days, (3) nearly every day. The total scores for the items range from 0 to 27 with higher
scores indicating a higher depression severity: Scores of 1-4 (no depression), 5-9 (mild
depression), 10-14 (moderate depression), 15-19 (moderately severe depression), and 20-27
(severe depression).
3.2.3 Beck’s Depression Inventory (BDI-II).
The BDI-II (Beck et al., 1997) contains 21 Likert scale self-report items to assess
depression and its severity during the current week. As with the PHQ-9, the scale ranges from
almost never to almost always, with higher scores indicating more severe depressive symptoms:
minimal depression (0-13 points); mild depression (14-19); moderate depression (20-28); and
severe depression (29-63). According to Beck (2015) the BDI-II has a high internal reliability; it
was tested on a sample of 500 psychiatric outpatients and sample of 120 college students with
Cronbach α of .92 and .93, respectively. The convergent and discriminant validity of the BDI-II
was assessed by correlating it with other depression and anxiety scales and showed a high
correlation (r =.71) with the Revised Hamilton Psychiatric Rating Scale for Depression (HRSD-
R).
3.2.4 Beck’s Anxiety Inventory (BAI).
The BAI is a “measure of dispositional anxiety not contaminated by dispositional
depression” (Kohn et al., 2008, p. 499). This self-report questionnaire contains 21 Likert-scale
questions representing symptoms frequently associated with anxiety, such as being able to relax,
being terrified, and fear of losing control. For each symptom, the respondent decides how much
it has bothered him or her within the last week on a 4-point rating scale: Not at all; Mildly, it did
not bother me much; Moderately, it was very unpleasant, but I could stand it; and Severely, I
53
could barely stand it. The scores are added up from zero points for Not at all to three points for
severly with higher scores indicating more sever anxiety: minimal anxiety (scores of 0-7), mild
anxiety (scores of 8-15), moderate anxiety (scores of 16-25), and severe anxiety
(scores of 26-63).
3.2.5 Spielberger’s State Trait Anxiety Inventory (STAI).
The State-Trait Anxiety Inventory (2015) consists of two scales of 20 self-rated Likert–
type items each, for assessing trait (STAI-T) and state anxiety (STAI-S). Each item is rated
between one and four in intensity. STAI-S items include: I am tense; I am worried; I feel calm;
and I feel secure. Participants choose the number that best describes the intensity of their
feelings: not at all (1), somewhat (2), moderately so (3), or very much so (4). STAI-T include: I
worry too much over something that really doesn’t matter; I am content; and I am a steady
person and subjects choose how they generally feel by rating the frequency of their feelings of
anxiety: almost never (1), sometimes (2), often (3), or almost always (4).
The scales are normed for the general and student populations by biological sex and age
range. For this study, cut-off scores for inclusion in the study were scores of > 66.9th
percentile or trait anxiety for the respective normed group —which equals moderate to high
trait anxiety. For the general population of females age 19-39, scores of 40 or higher were
considered, for females, ages 40-49 a score of 38 or higher was sufficient, and for females
ages 50-69 a score of 44 or higher was considered accepTable. Average-aged female
undergraduate students with a total score of 44 or higher were included.
3.2.6 Generalized Anxiety Disorder questionnaire (GAD-7).
The GAD-7 is a seven item self-report scale that was developed and validated on a
sample of 2,740 primary care patients by Spitzer, Williams, Kroenke, et al. in 1992 to screen for
GAD (89% sensitivity), but according to its manual has good sensitivity to diagnose PD, SAD, and
54
PTSD (82% sensitivity). The four-point Likert–type response scale has the following anchors: (0)
not at all, (1) several days, (2) more than half the days, (3) nearly every day and total scores
range from 0 to 21, with the following anxiety severities: No anxiety (scores of 0-5), mild anxiety
(6-10), moderate anxiety (11-15), and severe anxiety (16-21). When screening for anxiety
disorders, a recommended cut-off point for further evaluation is a score of 10 or greater (Löwe,
Decker, Müller et al., 2008).
3.2.7 Stanford Expectation of Treatment Scale (SETS).
The Stanford Expectation of Treatment Scale (SETS) was developed by Younger,
Gandhi, Hubbard, and Mackey in 2012 as a measurement instrument for clinical trials to quantify
participants’ positive or negative treatment outcome expectancies, which are influenced by the
participants preconceived opinions, information from the experimenters, mass media coverage,
etc. The SETS is a six-item scale with a seven-point Likert–type response with the following
anchors (1) strongly disagree, (2) moderately disagree, (3) slightly disagree, (4) neither agree
nor disagree, (5) slightly agree, (6) moderately agree, and (7) strongly agree. Items 1, 3, and
5 are averaged for positive expectancy, and items 2, 4, and 6 for negative expectancy.
3.2.8 Thayer’s Activation Deactivation Checklist (AD-ACL).
The Activation Deactivation Checklist (AD-ACL) was devised by Thayer (1986, 1989)
and is a valid and reliable 20-item Likert–type scale that uses adjectives to describe feelings or
mood and activated or deactivated state (energy) levels. Each item is rated on a four-point scale
ranging from zero to three: Definitely do not feel (0), cannot decide (1), feel slightly (2), and
definitely feel (3). The twenty adjectives are divided into four sub-scales: (1) energy (General
Activation) represented by the adjectives: active, energetic, vigorous, lively, full of pep; (2)
tiredness (Deactivation-Sleep) depicted by the adjectives sleepy, tired, drowsy, wide-awake,

55
wakeful; (3) tension (High Activation) represented by the adjectives jittery, intense, fearful,
clutched-up, tense); and (4) calmness (General Deactivation), depicted by the adjectives placid,
calm, at rest, still, quiet. The factors Energy and Tension can be combined into the higher order
factor, Activation and the factors Tiredness and Calmness into the higher order factor,
Deactivation.
3.2.9 Neurofeedback Session Coding List.
Motivation and mood are two powerful factors that influence learning, especially in the
NFT and BCI domains (Nijboer, 2008). Consequently, assessing participants motivation and
their positive and negative affect before and after NFT sessions and asking them how they
thought they performed could have been a useful tool to check for lacking challenge (Mirifar,
Beckmann, & Ehrlenspiel, 2017), frustration and even learned helplessness that may mediate
NFT learning performance. In this study any unusual circumstances, such as participants
reporting lack of sleep, headache, or frustration with no perceived NFT improvement was
recorded on the NFT Session Coding List (see Appendix D).
3.2.10 Rotter’s Locus of Control Questionnaire (LOC).
The Locus of Control Questionnaire by Rotter (1966) is a 29-item forced-choice scale
where a participant must choose between two value statements and six filler forced choice items
that are not counted toward a test score. Each item scores as one or zero. The scale measures
whether a person attributes a positive or negative outcome as contingent upon her own behavior,
such as skill or due to external circumstances, like chance or luck. Related to this attribution a
subject may also differ in generalized expectancies for internal versus external control. A high
score on the LOC represents an external locus of control. A low score represents an internal
locus of control, the mean score across several general populations is 8.19 (SD = 3.47).
56
3.2.11 Neurofeedback Strategies and Treatment Satisfaction questionnaire.
In every NFT study there are individuals, so-called non-learners, who, even after many
sessions, are not able to learn how to modulate their brain waves. This issue has been attracting
much research interest of late. It is estimated that between 33% and 50% participants of NFT
studies are non-learners, depending on the calculations of change parameters, NFT protocol, and
target group of participants (Alkoby, Abu-Rmileh, Shriki, & Todder, 2017). Non-learning of
neuromodulation via NFT has various reasons, such as complexity or type of the feedback signal,
differences in trainability of certain brain wave amplitudes, poor EEG signal processing (Jeunet,
Jahanpour, & Lotte, 2016), but also using cognitive strategies (Hardman, Gruzelier, Cheesman, et
al., 1997; Kober, Witte, Ninaus, et al., 2013). Kober and colleagues (2013) hypothesize that the use
of strategies might actually “hinder the implicit learning of neuromodulation due to overburdening
limited cognitive resources” (p. 7).
Therefore, a questionnaire (Appendix D) was administered after completion of the ten NFT
sessions that asked about which mental strategies if any were used during the NFT training and
how effective these strategies had been for the respective participants. Furthermore, participants
were asked what specific changes (if any) in thoughts, feelings and behavior in everyday life they
perceived, and as a measure to control treatment expectancies subjects were asked what group they
believed they were part of, EG or CG. Lastly, cognitive tasks, even unconscious ones, such as
NFT, involve attention, learning, and memory; they are dependent on the degree of wakefulness of
the participant (Knight & Mather, 2013). Hence, questions regarding times-of-day for optimal
learning, worst learning and “neutral times” were included.

57
3.3 Pre- and Post-Treatment QEEG
An EEG was recorded before and after the completion of ten NFT sessions. Participants
had been instructed before the start of the study to wash their hair before EEG and NFT sessions
and not to use any hair products, such as crème rinse, spray or gel in their hair, as sweat, sebum,
and hair products alter the EG signal acquisition. Electro-Cap™ with 19 pure tin electrodes, were
positioned on the scalp according to the international 10-20 electrode EEG system and linked ear
sensors were used for the recording. The scalp and forehead were prepared with Weaver’s
Nuprep skin prep gel to remove any dead skin cells and other products that might interfere with
the EEG signal and ECI’s Electro-Gel was inserted into each electrode with a syringe.
The Brainmaster Atlantis I, 4×4 Module ® 3.0 amplifier and Brain Avatar miniQ
software (Brainmaster Technologies, Inc.; http://www.brainmaster.com/) were used to record
EEG brain oscillations (in Hz) for 120 seconds during standardized condition (relaxed, eyes
closed, chin lightly placed on a chin and forehead rest) with linked ears as the reference. The raw
electrical potential and wave frequency bands (in Hz) were amplified, fed digitally into the
Brainmaster software, and transformed. Artifacts, such as movements, eye blinks, heart rate,
respiration, and other corrupting factors were removed during the software calibration process.
The sampling rate was 250 datapoints/second at 256 Hz. To filter out artifacts from the standard
120 Hz AC/DC electricity in the United States a 60 Hz notch filter was used. Furthermore, an
IIR Butterworth filter with a high pass filter at 1 Hz and a low pass filter at 40 Hz with a filter
order of 6 was used and the artifact removal was set at 200 microV.
Before statistical analysis, the raw EEG data were fast-fourier transformed (FFT) in
Neuroguide which allowed an analysis of the data from the 19 channels in term of relative and
absolute power of delta, theta, alpha, and beta (Beta 1-3) waves, as well as all combinations of
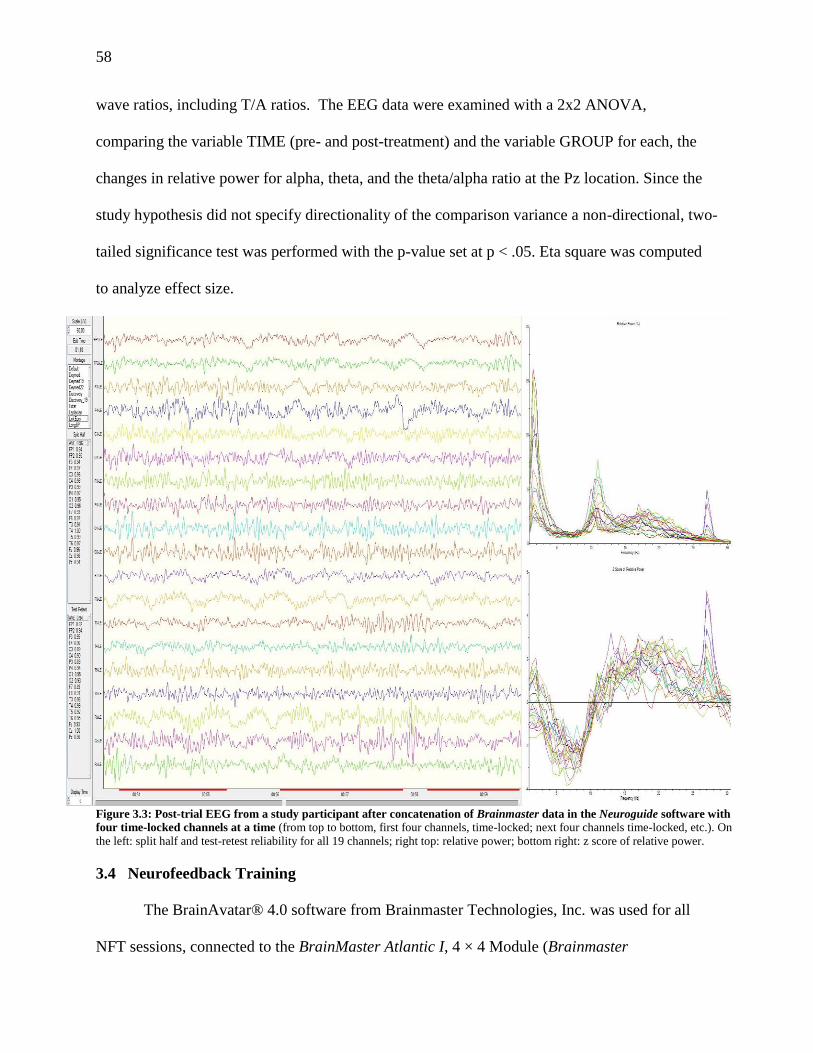
58
wave ratios, including T/A ratios. The EEG data were examined with a 2x2 ANOVA,
comparing the variable TIME (pre- and post-treatment) and the variable GROUP for each, the
changes in relative power for alpha, theta, and the theta/alpha ratio at the Pz location. Since the
study hypothesis did not specify directionality of the comparison variance a non-directional, two-
tailed significance test was performed with the p-value set at p < .05. Eta square was computed
to analyze effect size.
Figure 3.3: Post-trial EEG from a study participant after concatenation of Brainmaster data in the Neuroguide software with
four time-locked channels at a time (from top to bottom, first four channels, time-locked; next four channels time-locked, etc.). On
the left: split half and test-retest reliability for all 19 channels; right top: relative power; bottom right: z score of relative power.
3.4 Neurofeedback Training
The BrainAvatar® 4.0 software from Brainmaster Technologies, Inc. was used for all
NFT sessions, connected to the BrainMaster Atlantic I, 4 × 4 Module (Brainmaster
59
Technologies, Inc.; http://www.brainmaster.com/). The Pz location from 10-20 international
EEG location system was selected as the active EEG recording site for both, A/T (EG) and B u/d
(CG) training with a reference electrode on the right earlobe and a ground electrode on the left
earlobe. The rationale for the respective NFT protocol and the Pz electrode site are described in
Section 1.3.1. The ongoing EEG recording at Pz was sampled at 256 Hz per second at a
resolution of <0.01 Hz, and 10,000 amplification. Impedance was maintained below 7 kOhm.
Band pass filter (80 Hz high and 60 Hz low pass) and an A/D low pass filter (allowing 0.1-30 Hz
activity) were used. Global smoothing time was set at 500 ms at 3 dB with a text damping factor
at 100 ms and frequency band changes on the fly at .005. The artifact rejection threshold was set
at 200 microV to control for eye and muscle artifacts. Amplitude values for delta, theta, alpha
and beta bands were extracted from the raw EEG and then Fast Fourier transformed (FFT).
Each NFT session used a standardized Neurofeedback Session Checklist (Appendix D)
and lasted for approximately 45 minutes including, filling out the AD-ACL questionnaire pre-
and post- NFT session, connecting and disconnecting the EEG leads to the participant, recording
of a one- minute baseline EEG at the Pz location and three eight-minute NFT blocks with two,
one to two- minute breaks between the blocks. The lengths of the breaks depended on each
participant’s preference. Participants were seated in a comforTable chair, approximately three
feet from the computer monitor giving audio-visual feedback during the NFT sessions. The room
in which all QEEG and NFT sessions were administered was windowless, and shortly before the
start of the EEG and NFT recording the lights were dimmed to keep distraction to a minimum.
The experimenter sat quietly at a second computer screen perpendicular and approximately five
feet away from the participants, so as not to distract the subject from the NFT tasks and to
monitor artifacts and record participant behaviors and concerns.
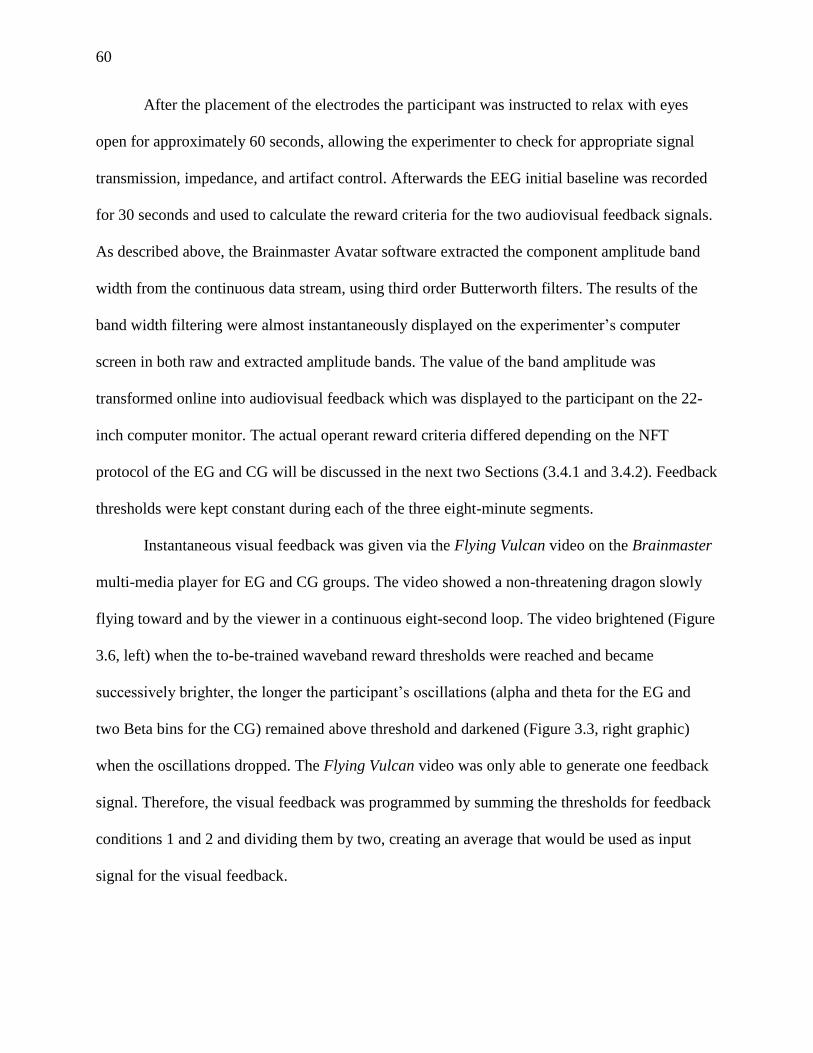
60
After the placement of the electrodes the participant was instructed to relax with eyes
open for approximately 60 seconds, allowing the experimenter to check for appropriate signal
transmission, impedance, and artifact control. Afterwards the EEG initial baseline was recorded
for 30 seconds and used to calculate the reward criteria for the two audiovisual feedback signals.
As described above, the Brainmaster Avatar software extracted the component amplitude band
width from the continuous data stream, using third order Butterworth filters. The results of the
band width filtering were almost instantaneously displayed on the experimenter’s computer
screen in both raw and extracted amplitude bands. The value of the band amplitude was
transformed online into audiovisual feedback which was displayed to the participant on the 22-
inch computer monitor. The actual operant reward criteria differed depending on the NFT
protocol of the EG and CG will be discussed in the next two Sections (3.4.1 and 3.4.2). Feedback
thresholds were kept constant during each of the three eight-minute segments.
Instantaneous visual feedback was given via the Flying Vulcan video on the Brainmaster
multi-media player for EG and CG groups. The video showed a non-threatening dragon slowly
flying toward and by the viewer in a continuous eight-second loop. The video brightened (Figure
3.6, left) when the to-be-trained waveband reward thresholds were reached and became
successively brighter, the longer the participant’s oscillations (alpha and theta for the EG and
two Beta bins for the CG) remained above threshold and darkened (Figure 3.3, right graphic)
when the oscillations dropped. The Flying Vulcan video was only able to generate one feedback
signal. Therefore, the visual feedback was programmed by summing the thresholds for feedback
conditions 1 and 2 and dividing them by two, creating an average that would be used as input
signal for the visual feedback.
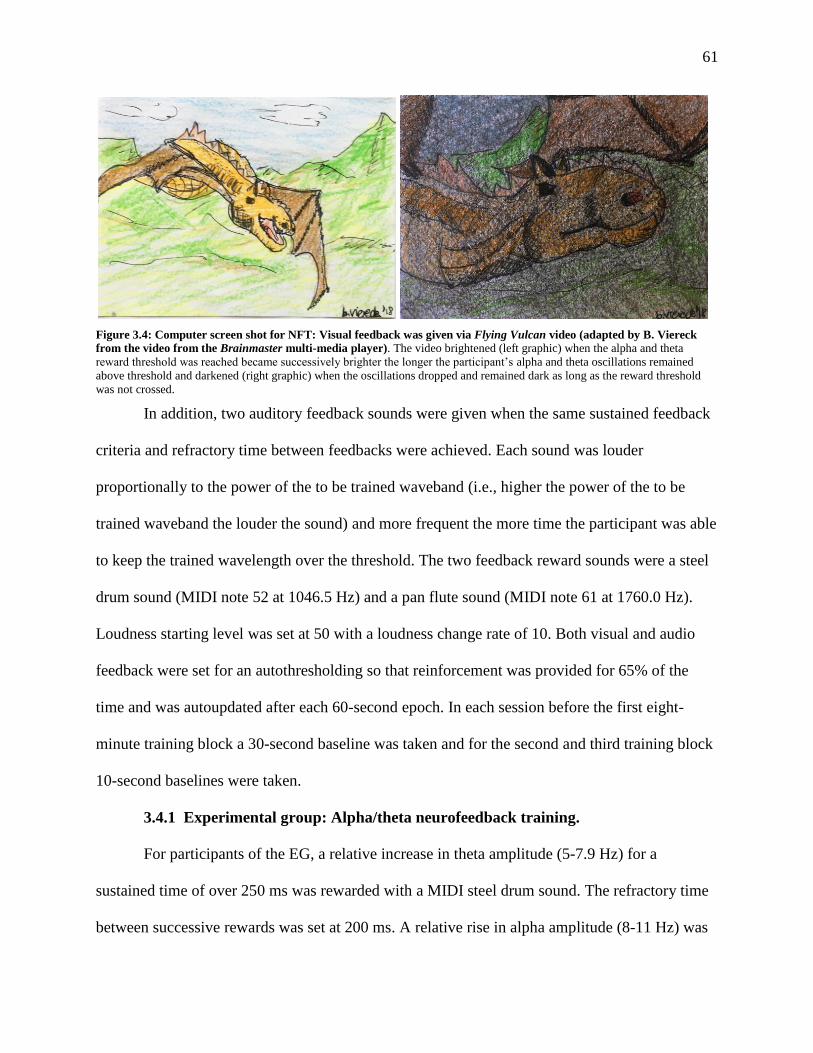
61
Figure 3.4: Computer screen shot for NFT: Visual feedback was given via Flying Vulcan video (adapted by B. Viereck
from the video from the Brainmaster multi-media player). The video brightened (left graphic) when the alpha and theta
reward threshold was reached became successively brighter the longer the participant’s alpha and theta oscillations remained
above threshold and darkened (right graphic) when the oscillations dropped and remained dark as long as the reward threshold
was not crossed.
In addition, two auditory feedback sounds were given when the same sustained feedback
criteria and refractory time between feedbacks were achieved. Each sound was louder
proportionally to the power of the to be trained waveband (i.e., higher the power of the to be
trained waveband the louder the sound) and more frequent the more time the participant was able
to keep the trained wavelength over the threshold. The two feedback reward sounds were a steel
drum sound (MIDI note 52 at 1046.5 Hz) and a pan flute sound (MIDI note 61 at 1760.0 Hz).
Loudness starting level was set at 50 with a loudness change rate of 10. Both visual and audio
feedback were set for an autothresholding so that reinforcement was provided for 65% of the
time and was autoupdated after each 60-second epoch. In each session before the first eight-
minute training block a 30-second baseline was taken and for the second and third training block
10-second baselines were taken.
3.4.1 Experimental group: Alpha/theta neurofeedback training.
For participants of the EG, a relative increase in theta amplitude (5-7.9 Hz) for a
sustained time of over 250 ms was rewarded with a MIDI steel drum sound. The refractory time
between successive rewards was set at 200 ms. A relative rise in alpha amplitude (8-11 Hz) was
62
rewarded with a MIDI pan flute sound. The visual reward was given when the activity for both
alpha and theta was above the supra-threshold at approximately 65% of the time (A+T)/2. Beta
(15-30 Hz) and delta (2-4 Hz, inhibited for eye blink artifacts) were inhibited which meant that if
relative beta or delta increased no reward would be given, even if alpha or theta amplitudes
improved.
3.4.2 Placebo control group: Successive sessions beta up- and down-training.
Participants from the placebo CG received successive sessions of beta and high beta
bands up- and down-training. In all uneven NFT (protocol a: sessions 1, 3, 5, 7, and 9) an
increase in beta (15-19 Hz) and high beta (20-24 Hz) amplitudes over the supra-threshold of 650
ms and 130 ms with a refractory period of 200 ms between feedback sounds were rewarded with
a steel drum and pan flute sound, respectively. In all even NFT sessions (protocol b: sessions 2,
4, 6, 8, 10) a decrease in beta (15-19 Hz) and high beta (20-24 Hz) amplitudes over the supra-
threshold of 350 ms and 750 ms with a refractory of 200 ms between feedback sounds were
rewarded with a steel drum and pan flute sound, respectively. Delta at 2-4 Hz was inhibited for
eye blink artifacts.
This protocol follows Doppelmayr’s (2011) general idea of successively up-and down
training different beta bins to allow learning within session but not between sessions. However,
in Doppelmayr’s so called, randomized broadband placebo feedback randomly selected training
frequencies within the beta band changed every session and participants were informed to either
increase the amplitudes of 1-Hz broad bands between 6 and 35 Hz for half the blocks during a
training session and decrease the same band for the other half of each session. Those bins that
interfered with the frequencies of the SMR and theta/beta ratio training of the two experimental
groups were inhibited. But Doppelmayr’s protocol had technical difficulties with maintaining
63
appropriate reward levels when switching from increase to decrease of bins and in order to keep
participants motivated had to manually change reward thresholds between training blocks. Thus,
this researcher made the decision not to switch between up- and down-training of certain beta
and high beta bins for half of a session each.
The placebo protocol was used with three healthy volunteers before the start of the
clinical trial; the protocol was programmed to have the same sustained time criteria as reward
criteria. The trial run showed that beta-up training and high beta down-training received such
high reward rate that the reward sounds were almost continuous, and volunteers were easily
capable of distinguishing between control conditions a and b due to very high reward rates for
beta up training in the uneven sessions and much lower reward rates for the even sessions. This
was not a surprising result; high beta band, in this case 20-24 Hz bins, can be easily down-
trained just by not thinking too hard and beta band (15-19 Hz) can be fairly easily up-trained
according to the instruction that was given to all participants of relaxing and letting yourself be
to thinking without much effort. In addition, the almost continuous reward rate was perceived as
an unpleasant sound that made volunteers nervous and stressed and might thus artificially inflate
the differences in sample between experimental and control groups in de-activation, anxiety
level, and treatment satisfaction. To avoid this potential error the reward sound percentage and
loudness the placebo protocols a and b were re-programmed to approximately emulate the
reward rates of the experimental group. This was achieved by having the three healthy volunteers
sit for all three conditions repeatedly and changing the programming for the sustained reward
criterion condition met on the Brainavatar software so that volunteers in all three conditions,
experimental group and placebo groups a and b, had approximately the same amount of rewards.
64
3.5 Statistical Data Analysis
Descriptive statistics and inferential statistics for the psychometric instruments were
performed in SPSS (version 24.0, IBM Corporation, NY). QEEG data and the regression growth
curve modeling for the neurofeedback data was performed in R Studio (version 1.0.136,
http://www.R-project.org) with the additionally installed packages (lme4, lmertest, car, ggplot2,
lattice).
3.5.1 Demographic and psychometric data analysis.
3.5.1.1 STAI, BAI, and GAD.
A two-factor repeated measure ANOVA was performed with the within-subject factor
TIME (pre–post–treatment) and between-subject factor GROUP (A/T, CO) for the STAI-T, the
STAI-S, the BAI, and the GAD-7, respectively.
3.5.1.2 AD-ACL.
Thayer’s Activation-Deactivation Adjective Checklist (AD-ACL) was administered before
and after each NFT session. Four two-factor repeated measure ANOVAs for the AD-ACL sub-
scale factors activated and deactivated were performed with the within-subject factor TIME
(pre–post NFT session) and between-subject factor GROUP (A/T, CO).
3.5.2 Correlation of neurofeedback change scores with psychometric measures and
neurofeedback strategies and treatment satisfaction.
Pearson correlation calculations were performed to assess the strength of a linear
relationship between the change scores of theta and alpha amplitudes, relative theta and alpha
and theta/alpha ratio and the change scores of the psychometric measures of activation and
deactivation (AD-ACL), treatment expectancy change, trait and state anxiety change, and change
scores in the BAI and GAD-7, and Rotter’s LOC scores. Additionally, a point-biserial correlation
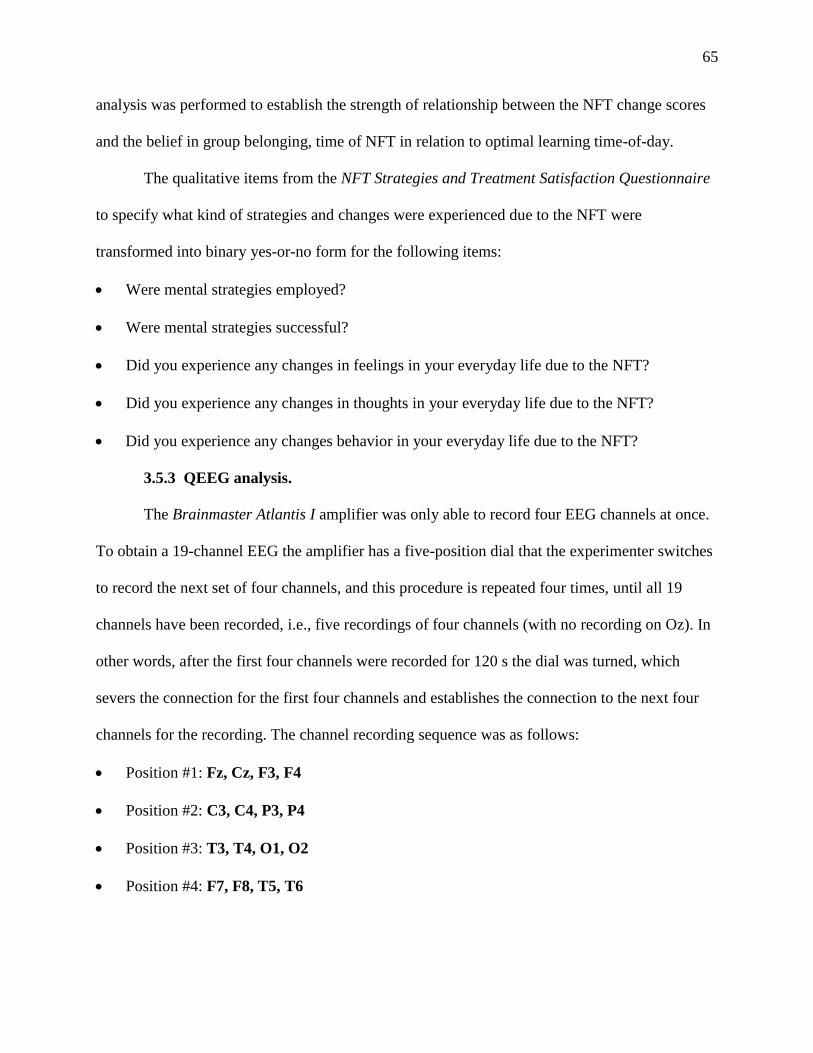
65
analysis was performed to establish the strength of relationship between the NFT change scores
and the belief in group belonging, time of NFT in relation to optimal learning time-of-day.
The qualitative items from the NFT Strategies and Treatment Satisfaction Questionnaire
to specify what kind of strategies and changes were experienced due to the NFT were
transformed into binary yes-or-no form for the following items:
Were mental strategies employed?
Were mental strategies successful?
Did you experience any changes in feelings in your everyday life due to the NFT?
Did you experience any changes in thoughts in your everyday life due to the NFT?
Did you experience any changes behavior in your everyday life due to the NFT?
3.5.3 QEEG analysis.
The Brainmaster Atlantis I amplifier was only able to record four EEG channels at once.
To obtain a 19-channel EEG the amplifier has a five-position dial that the experimenter switches
to record the next set of four channels, and this procedure is repeated four times, until all 19
channels have been recorded, i.e., five recordings of four channels (with no recording on Oz). In
other words, after the first four channels were recorded for 120 s the dial was turned, which
severs the connection for the first four channels and establishes the connection to the next four
channels for the recording. The channel recording sequence was as follows:
Position #1: Fz, Cz, F3, F4
Position #2: C3, C4, P3, P4
Position #3: T3, T4, O1, O2
Position #4: F7, F8, T5, T6
66
Position #5: Fp1, Fp2, Pz (Oz shows on the screen but there is no electrode on the standard
Electro-Cap™ at Oz)
As only four channels each were time-locked (due to the limitations in the Brainmaster EEG
recording system) Neuroguide’s automatic algorithms for artifact removal for those artifacts that
the Brainmaster system had not picked up, could not be used. The Brainmaster Atlantis I system
did not remove artifacts appropriately, despite correct programming and several consultations
with Brainmaster’s technical support team.
Figure 3.5: Electrode locations and switch positions for the Brainmaster Atlantis, 4-channel 5-position MINI-Q 2 EEG (Adapted by B. Viereck from BrainMaster MINIQ II User’s Manual, 2007, p. 36; https://brainmaster.com/software/pubs/m-qII.pdf).
Thus, each participant’s EEG files had to be imported into the Neuroguide software
program (NeuroGuide 2.8.8, Applied Neuroscience, Inc., USA) and be concatenated into a full
19-channel EEG data set, for additional artifact removal. Since only four channels of each EEG
data set were time-locked Neuroguide’s automatic artifact removal did not work and artifact
removal had to be manually obtained through visual inspection of each of the four time-locked
EEG channels at a time. The following textbooks were used to guide the artifact analysis:
Ebersole’s Current Practice of Clinical EEG (2014), Hammond and Gunkelman’s The Art of
Artifacting (2001), and Niedermeyer & Lopes da Silva’s (2003, Electroencephalography—Basic
67
Principles, Clinical Applications, and Related Fields (1999). Both split-half and test-retest
reliability tests were conducted on the edited, artifact-free EEG segments. The records with >
95% split half reliability, > 90% test-retest reliability, and a total measurement of over 60
seconds were used for further statistical analyses. For all EEG recordings the average
measurements split-half and test-retest reliability was > .90. The reliability for individual
channels was > .90, except for 29 out of 988 channels recordings (total EEG recordings: 52)
where the Brainmaster computer screen showed active oscillations of all channels on the monitor
but the ASCII transcript of the channel’s EEG had no data recorded. The channels with faulty
recordings varied which made it unlikely that there was an electrode malfunction. For seven
participants one channel did not record in the pre- and/or post treatment EEG, for three
participants two channels, and for two participants three channels did not record correctly under
the pre- and/or post-treatment condition.
The raw EEG data were fast-fourier transformed (FFT) which allowed an analysis of the
data from the 19 channels in term of relative and absolute power of delta, theta, alpha, and beta
(Beta 1-3) waves, as well as all combinations of wave ratios, including T/A ratios. The EEG
data were examined with a 2x2 ANOVA, comparing the variable TIME (pre- and post-treatment)
and the variable GROUP for the changes in relative power for alpha, theta, and the theta/alpha
ratio at Pz. Since the study hypothesis did not specify directionality of the comparison variance a
non-directional, a two-tailed significance test was performed with the p-value set at p < .05. Eta
square was computed to analyze effect sizes.
3.5.4 Neurofeedback data analysis.
The Brainmaster Atlantis I provided delta, theta, alpha, low beta, beta, high beta, and
gamma amplitude means, mean fraction of EEG energy in each waveform after FFT and the
68
standard deviation for all values after automatic artifact removal. Mean values were recorded
every 15 seconds of the three eight-minute blocks during the NFT training and for a 30 second
baseline recording before and after each eight-minute block of NFT. Most artifacts where
automatically filtered out by the Brainmaster software algorithms. To capture and remove
additional artifacts due to oculomotor, temporalis and frontalis muscles more accurately EMG
electrodes at respective muscle sites would have been helpful. Unfortunately, this study had no
funding to acquire this additional equipment. According to Goncharova, McFarland, Vaughan,
and Wolpaw (2003) the contamination of the EEG by electromyographic artifacts is not very
likely at the Pz location as the attachment sites of the temporalis and frontalis muscles, as well as
the oculomotor sites are far away from Pz and Oz. Additional artifacts were removed by visually
inspecting each NFT session record and excluding all data points for delta, theta, alpha and beta
that had a measurement of over 100 Hz, after the initial artifact removal was done by the
Brainmaster software. Any recordings over 100 Hz are very likely artifacts, except in epileptic
seizures (Ebersole, 2014), which none of participants experienced during the trial. The data were
averaged every 15 seconds so that four data points per minute were obtained for the 24 minutes of
each NFT session and a 10-second baseline recording without feedback was recorded after minute 24.
The NFT session data were analyzed in R Studio with a hierarchical linear mixed model
growth curve modeling (GCM) using the R statistical program with the lme4 package (Bates &
Sakar, 2013) testing for main effects of within participant change (individual learning curves)
and group membership (control or experimental group) and interaction between the two main
effects. GCM is particularly well suited to analyze mixed effects time series data and to
document learning curves because it can simultaneously analyze within subject effects, as well as
between-subjects effects over multiple time points (Mirman, Dixon, & Magnuson, 2008). In
comparison to a repeated measures ANOVA or traditional regression analysis for longitudinal

69
data, GCM regression has the advantage of building a separate regression model for each
participant, accounting for individual differences in responding to the NFT, calculated as the
random effects in each of the GCM regression models. In contrast, the traditional regression
model assumes all participants respond the same to the treatment and the standard error
represents differences in treatment response.
A predictor that varies in time (here absolute and relative alpha, theta, and T+A
amplitudes, and T/A ratio) is modeled as the weighted sum of main effects between the criterion
variables and their interactions with the second predictor being treatment group (A/T) versus
control group (B u/d) membership. Predictor variables were added to the initial regression model
(model a) in successive steps. In all successive models (b through e) added predictor variables
were centered to lessen the collinearity between main effects and interactions. According to
Mirman (2014) the strength of the growth curve model in comparison to the traditional
multilinear regression model is that the researcher does not have to transform a continuous
process arbitrarily into few discrete time bins to do the statistical thresholding. In other words, a
lot of information regarding a learning curve is lost by using the mean for each session, or even
means for the three eight-minute NFT session averages, instead of all 96 means for each session.
Furthermore, GCM is very robust regarding missing data. Data from participants who did not
finish the treatment can be included in the GCM. In this study two participants from the control
group quit after three and five sessions, respectively.
The equation for the NFT component of this study can be modeled as follows: T/A ratio (or
alpha or theta amplitudes) ~ time effect (run or trial) + participant (within subject effect) +
condition effect (experimental or control) + interaction effect (time x condition) + error.
All analyses modeled were started with a null model (model A): lmer(y~1 +

70
(1|participant)). This model added the log likelihood (logLik) of the random intercept for each
participant, i.e., a different intercept is assumed for each participant. The time variables time
within session (RUN) and time across sessions (TRIAL) were centered, which means that the
first-time measurement is defined as point zero, to make the interpretation of the variable
coefficients easier. Each model added one of the effect variables seen above into the model and
run and an ANOVA was run, comparing the effects of one model with the effects of the new
model regarding goodness of fit of the log likelihood (logLik) via the 2 test, in other words has
the likelihood in the new model increased enough to the predict variable y to warrant the addition
of the new parameter (for complete R coding script see Appendix E).
71
4. Results
4.1 Participants
Twenty-seven subjects had been randomly assigned to the treatment condition (A/T NFT,
n = 14) or to the control condition (B u/d NFT, n = 13). Two women from the control group
dropped out; one after five NFT sessions due to time constraints with work and the other one, a
student, after three sessions due to a six-week university holiday break that made the interval
between individual sessions too long to be included in the study. Thus, 14 participants from the
experimental group and 11 participants from the experimental group completed the study. The
existing neurofeedback and AD-ACL data for the two dropouts was included in the study as
GCM is very robust regarding missing data.
The participant sample was heterogeneous but normally distributed with a mean age of
the women (n = 14) in the control group of 32. 23 years (SD = 12.76 years) with an age range of
19 to 56 years. The mean age of the women in the control group was 36.21 years (SD = 16.62
years) with an age range of 20 to 69 years.
Unfortunately, as Table 4.1a indicates, the participant sample was very homogeneous
regarding race / ethnicity and education level: 89% of the participating women were White /
Caucasian and 11% Hispanic; no African American, Asian / Pacific Islanders or Native
American women participated. In comparison to the U.S. Census Bureau’s 2016 data for the
United States (https://www.census.gov/quickfacts/fact/table/US/PST045217) 77% of the country
identify themselves as white, 18% Hispanic, 13% African American, 6% Asian, 3% multiracial,
and 1% as American Indian. The Census further reports that 87% of the population of age 25 and
above graduated from high school (or had higher education) and 30% of the population had a
bachelor degree (or higher education). All participants had at least a high school diploma; 14.8%

72
of the participants had some college credits but no degree; 3.7% had an associate degree; 37.0%
had a bachelor degree; 29.6% had a master degree; and 14.8% had a doctoral degree.
The 25.9% of women had not been formally diagnosed with any AD. 33.3% of the
participants had been diagnosed with GAD, 25.9% with an AD diagnosed but not specified,
11.1% had been diagnosed with SAD, and 3.7% with phobia. There was no option given of
marking more than one AD to force participants to choose the AD most prevalent for them.
Additional descriptive statistics of the participant sample by group membership (CG or EG) can
be found in Table 4.1b.
Table 4.1 a: Descriptive participant demographics. (*No multiple AD selection was allowed.)
Lastly, Table 4.1 c illustrates that most participants used mental strategies over the course
of the NFT trial to regulate their respective brain wave bands (84%) and little difference was
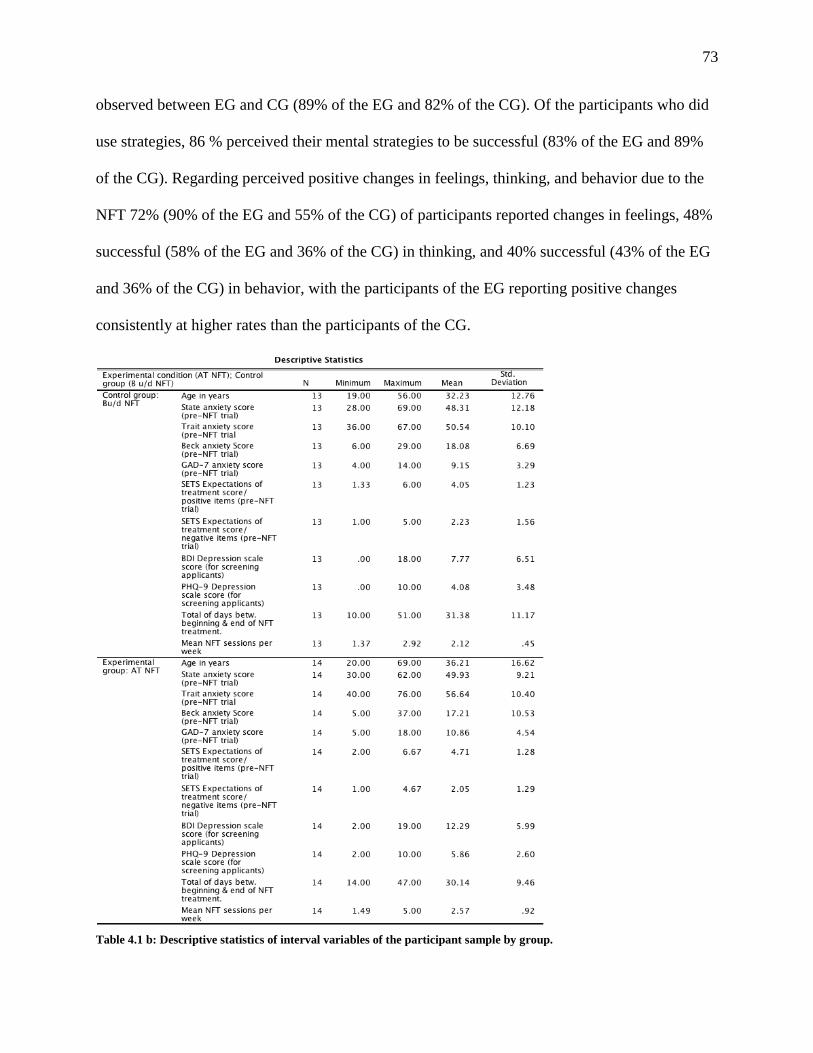
73
observed between EG and CG (89% of the EG and 82% of the CG). Of the participants who did
use strategies, 86 % perceived their mental strategies to be successful (83% of the EG and 89%
of the CG). Regarding perceived positive changes in feelings, thinking, and behavior due to the
NFT 72% (90% of the EG and 55% of the CG) of participants reported changes in feelings, 48%
successful (58% of the EG and 36% of the CG) in thinking, and 40% successful (43% of the EG
and 36% of the CG) in behavior, with the participants of the EG reporting positive changes
consistently at higher rates than the participants of the CG.
Table 4.1 b: Descriptive statistics of interval variables of the participant sample by group.
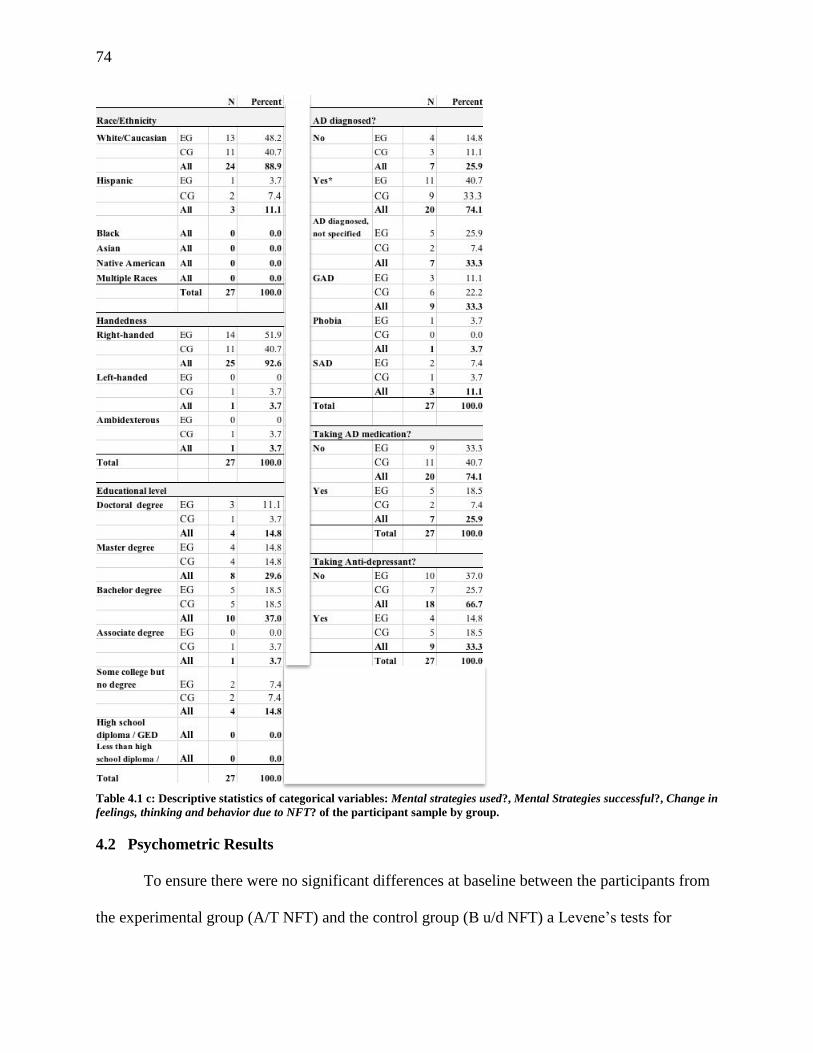
74
Table 4.1 c: Descriptive statistics of categorical variables: Mental strategies used?, Mental Strategies successful?, Change in
feelings, thinking and behavior due to NFT? of the participant sample by group.
4.2 Psychometric Results
To ensure there were no significant differences at baseline between the participants from
the experimental group (A/T NFT) and the control group (B u/d NFT) a Levene’s tests for
75
equality of variances and independent samples t- tests for equality of means were performed for
the variables age, education level, pre-trial STAI, BAI, and GAD-7, AD-ACL, and SETS
expectations of treatment. All Levene and t-tests had non-significant results which means that
experimental and control groups had similar variances and means, respectively, and did not
significantly differ from each other for all analyzed variables at baseline.
4.2.1 Anxiety questionnaires: STAI, BAI, and GAD-7.
Two-way mixed model ANOVAs were performed with the within-subject factor TIME
(pre–post treatment) and the between-subject factor GROUP (A/T, CO) for the STAI (sub-scales
STAI-T and STAI-S), the BAI, and the GAD-7. Assumptions were tested before running each
ANOVA. A Shapiro-Wilk test to check for normality of distribution for each cell of the design
was performed. The equality of variances and the equality of covariance matrices were tested
with the Levene and Box Test, respectively. All tests had non-significant results which means
that all necessary statistical assumptions for the 2x2 ANOVA were met.
For the analyses of all self-report anxiety measures the factor time was significantly
reducing participants’ scores in the various anxiety measures and an associated large effect size
as measured by partial η2. For the STAI, sub-scale state anxiety (STAI-S), the anxiety scores
decreased significantly between the beginning (M = 53.70, SD = 10.53) and the end of the trial
(M = 46.63, SD = 8.52) for F(1, 25) = 9.518, p = .005, partial η2 = .276; for the STAI, sub-scale
trait anxiety (STAI-T), the anxiety scores decreased significantly between the beginning (M =
49.15, SD = 10.56) and the end of the trial (M = 41.63, SD = 9.32) for F(1, 25) = 22.988, p =
.0001, partial η2 = .479; for the BAI the anxiety scores decreased significantly between the
beginning (M = 17.63, SD = 8.73) and the end of the trial (M = 12.41, SD = 6.59) for F(1, 25) =
11.524, p = .002, partial η2 = .316; and for the GAD-7 the anxiety scores decreased significantly

76
between the beginning (M = 10.04, SD = 4.00) and the end of the trial (M = 7.48, SD = 4.52) for
F(1, 25) = 22.988, p = .0001, partial η2 = .479. However, none of the interactions between TIME
and GROUP were significant: STAI-S (F(1, 25) = .41, n.s.); STAI-T (F(1, 25) = .09, n.s.); BAI
(F(1, 25) = .15, n.s.), and GAD-7 (F(1, 25) = .18, n.s.), i.e., no differences between scores of the
experimental and the control groups regarding the reduction in self-reported anxiety measures
were observed.
4.2.2 Stanford Expectation of Treatment scale (SETS).
Repeated measures ANOVA were conducted with the within-subject factor TIME (pre–
post-treatment) and between-subject factor GROUP (A/T, CO) for Cronbach’s α = .05 for the
SETS-positive and the SETS-negative items sub-scales (Figure 4.2). A Shapiro Wilk test to
check for normality of distribution for each cell of the design was performed. The equality of
variances and the equality of covariance matrices were tested with the Levene and Box Test,
respectively. All preliminary tests had non-significant results which means that all necessary
statistical assumptions for the 2x2 ANOVA were met.
Figure 4.1: Mean SETS negative expectancy test score differences for EG (solid line) and CG (dotted line). Pre- and post-
treatment: A significant reduction of scores in the negative treatment expectancy sub-scale were observed between beginning and
end of the trial. However, no significant difference between the EG and CG was observed.
77
While a significant reduction in the SETS-negative sub-scale could be observed between
the beginning (M = 2.14, SD = 1.40) and the end of the NFT trial (M = 1.42, SD = .94) for F(1,
25) = 5.809, p = .024, partial η2 = .189), the GROUP x TIME interaction for SETS-negative
(F(1, 25) = .01, n.s.) was not significant. For the SETS-positive sub-scale, neither factor TIME
(F(1, 25) = .25, n.s.) nor the TIME x GROUP (F(1, 25) = 1.09, n.s.) were significant.
4.2.3 Activation Deacktivation Checklist (AD-ACL).
All preliminary tests had non-significant results which means that all necessary statistical
assumptions for the 2x2 ANOVA were met, except for the AD-ACL sub-scale tension for the
pre-trial measurement; the Box test had a significant result (p = .027) for this sub-scale. As all
other assumptions for the ANOVA were met no additional one-way repeated measures ANOVA
for each group of the between-subjects factor tension were run.
4.2.3.1 Traditional 2x2 and 2x5 ANOVAs for AD-ACL activation and deactivation
scales and four sub-scales
Repeated measure 2x2 ANOVAs were conducted with the within-subject factor TIME
(pre–post-treatment) and between-subject factor GROUP (A/T, CO) for Cronbach’s α = .05 for
the activation and deactivation scales, as well as for each of the four sub-scales (energy, tension,
tiredness, calmess). Activation, comprised of the tension and energy sub-scales, decreased
significantly between the beginning (M = 3.951, SD = 1.126) and the end of a NFT session (M =
3.280, SD = .968), F(1, 256) = 157.295, p < .0001, partial η2 = .381. Activation decreased
significantly more for the CG (M pre = 4.059, SD pre = .979; M post = 3.263, SD post = .790), p <
.034, partial η2 = .017)) than the EG (M pre = 3.859, SD pre = 1.232; M post = 3.295, SD post =
1.098), F(1, 256) = 4.539, p < .034, partial η2 = .017) between the beginning and the end of a
NFT session. Deactivation, made up of the tiredness and calmness sub-scales, increased
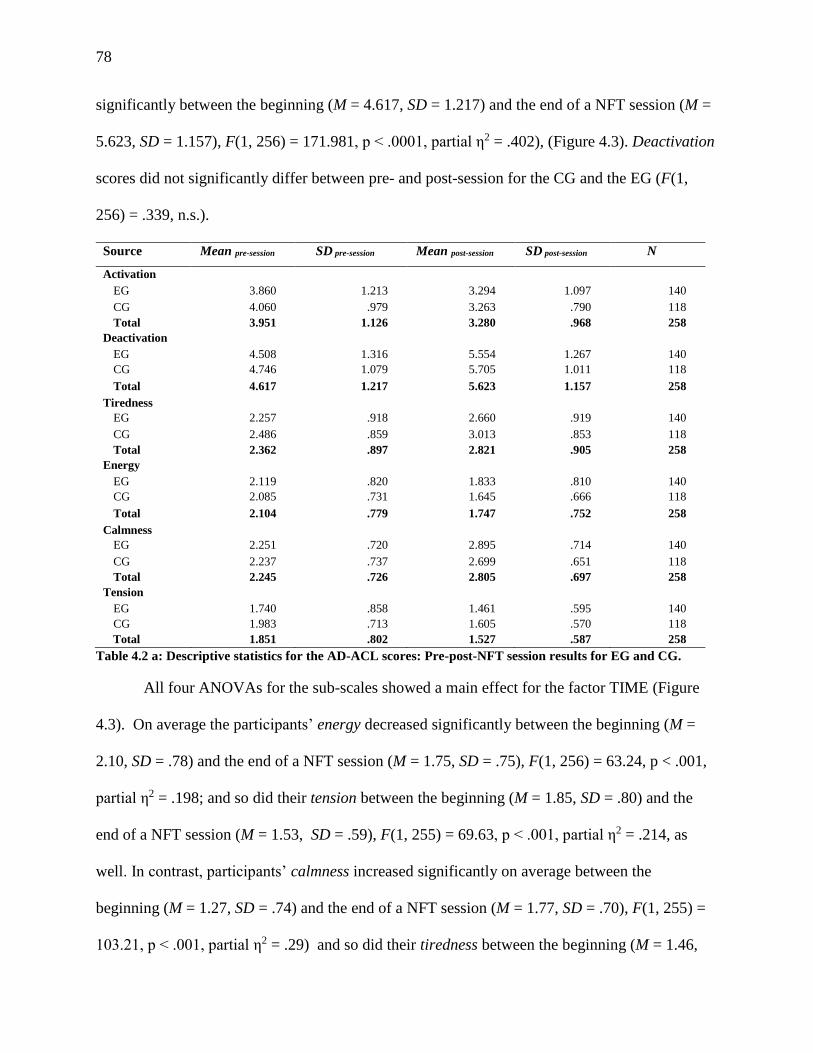
78
significantly between the beginning (M = 4.617, SD = 1.217) and the end of a NFT session (M =
5.623, SD = 1.157), F(1, 256) = 171.981, p < .0001, partial η2 = .402), (Figure 4.3). Deactivation
scores did not significantly differ between pre- and post-session for the CG and the EG (F(1,
256) = .339, n.s.).
Source Mean pre-session SD pre-session Mean post-session SD post-session N
Activation
EG 3.860 1.213 3.294 1.097 140
CG 4.060 .979 3.263 .790 118
Total 3.951 1.126 3.280 .968 258
Deactivation
EG 4.508 1.316 5.554 1.267 140
CG 4.746 1.079 5.705 1.011 118
Total 4.617 1.217 5.623 1.157 258
Tiredness
EG 2.257 .918 2.660 .919 140
CG 2.486 .859 3.013 .853 118
Total 2.362 .897 2.821 .905 258
Energy
EG 2.119 .820 1.833 .810 140
CG 2.085 .731 1.645 .666 118
Total 2.104 .779 1.747 .752 258
Calmness
EG 2.251 .720 2.895 .714 140
CG 2.237 .737 2.699 .651 118
Total 2.245 .726 2.805 .697 258
Tension
EG 1.740 .858 1.461 .595 140
CG 1.983 .713 1.605 .570 118
Total 1.851 .802 1.527 .587 258
Table 4.2 a: Descriptive statistics for the AD-ACL scores: Pre-post-NFT session results for EG and CG.
All four ANOVAs for the sub-scales showed a main effect for the factor TIME (Figure
4.3). On average the participants’ energy decreased significantly between the beginning (M =
2.10, SD = .78) and the end of a NFT session (M = 1.75, SD = .75), F(1, 256) = 63.24, p < .001,
partial η2 = .198; and so did their tension between the beginning (M = 1.85, SD = .80) and the
end of a NFT session (M = 1.53, SD = .59), F(1, 255) = 69.63, p < .001, partial η2 = .214, as
well. In contrast, participants’ calmness increased significantly on average between the
beginning (M = 1.27, SD = .74) and the end of a NFT session (M = 1.77, SD = .70), F(1, 255) =
103.21, p < .001, partial η2 = .29) and so did their tiredness between the beginning (M = 1.46,

79
SD = .66) and the end of a NFT session (M = 1.74, SD = .58), F(1, 255) = 39.01, p < .001, partial
η2 = .13).
Source: Pre-post-NFT
session difference scores
SS df MS F p partial η2
Activation
Time 59.278 1 59.278 157.295 <.001** .381
Time* group 1.711 1 1.711 4.539 .034* .017 Error 96.476 256 .377
Deactivation
Time 128.531 1 128.531 171.981 <.001** .402
Time* group .253 1 .253 .339 .561 .001
Error 191.323 256 .747
Tiredness
Time 27.644 1 27.644 67.228 <.001** .208
Time* group .483 1 .483 1.74 .280 .005 Error 105.268 256 .411
Energy
Time 16.896 1 16.896 63.239 <.001** .198
Time* group .760 1 .760 2.843 .093 .011
Error 68.399 256 .267
Calmness
Time 39.087 1 39.087 147.745 <.001** .366
Time* group 1.051 1 1.051 3.974 .047* .015 Error 67.717 256 .265
Tension
Time 13.789 1 13.789 69.628 <.001** .214
Time* group .315 1 .315 1.589 .209 .006 Error 50.699 256 .198
Table 4.2 b: 2 x 2 ANOVA for AD-ACL Pre-post-NFT session results for EG and CG.
The interaction of group and calmness was significant (F(1, 256) =3.94, p = .047, partial
η2 = .015) with the EG experiencing significantly larger increase in calmness than the
CG, but the effect size is small. The interaction of group and energy neared significance (F(1,
256) =2.84, p = .093, partial η2 = .011) with the EG experiencing a not quite significantly larger
decrease in energy than the CG. The interactions of group and tension (F(1, 255) =1.59, n.s.),
and group and tiredness (F(1, 255) =1.174, n.s.) were not significant, indicating that on average
no significant differences in the reduction in tension and the increase in tiredness from before to
after the NFT sessions between the experimental and control groups were found.
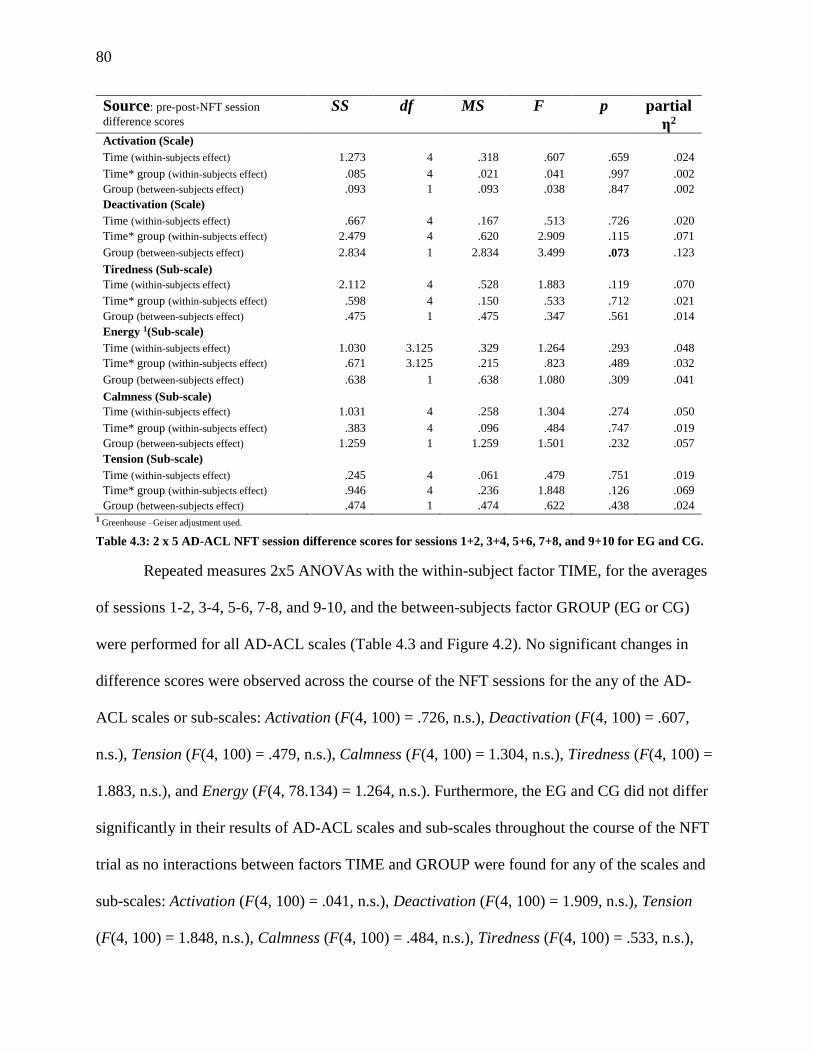
80
Source: pre-post-NFT session
difference scores SS df MS F p partial
η2 Activation (Scale)
Time (within-subjects effect) 1.273 4 .318 .607 .659 .024
Time* group (within-subjects effect) .085 4 .021 .041 .997 .002
Group (between-subjects effect) .093 1 .093 .038 .847 .002
Deactivation (Scale)
Time (within-subjects effect) .667 4 .167 .513 .726 .020
Time* group (within-subjects effect) 2.479 4 .620 2.909 .115 .071
Group (between-subjects effect) 2.834 1 2.834 3.499 .073 .123
Tiredness (Sub-scale)
Time (within-subjects effect) 2.112 4 .528 1.883 .119 .070
Time* group (within-subjects effect) .598 4 .150 .533 .712 .021
Group (between-subjects effect) .475 1 .475 .347 .561 .014
Energy 1(Sub-scale)
Time (within-subjects effect) 1.030 3.125 .329 1.264 .293 .048
Time* group (within-subjects effect) .671 3.125 .215 .823 .489 .032
Group (between-subjects effect) .638 1 .638 1.080 .309 .041
Calmness (Sub-scale)
Time (within-subjects effect) 1.031 4 .258 1.304 .274 .050
Time* group (within-subjects effect) .383 4 .096 .484 .747 .019
Group (between-subjects effect) 1.259 1 1.259 1.501 .232 .057
Tension (Sub-scale)
Time (within-subjects effect) .245 4 .061 .479 .751 .019
Time* group (within-subjects effect) .946 4 .236 1.848 .126 .069
Group (between-subjects effect) .474 1 .474 .622 .438 .024 1 Greenhouse –Geiser adjustment used.
Table 4.3: 2 x 5 AD-ACL NFT session difference scores for sessions 1+2, 3+4, 5+6, 7+8, and 9+10 for EG and CG.
Repeated measures 2x5 ANOVAs with the within-subject factor TIME, for the averages
of sessions 1-2, 3-4, 5-6, 7-8, and 9-10, and the between-subjects factor GROUP (EG or CG)
were performed for all AD-ACL scales (Table 4.3 and Figure 4.2). No significant changes in
difference scores were observed across the course of the NFT sessions for the any of the AD-
ACL scales or sub-scales: Activation (F(4, 100) = .726, n.s.), Deactivation (F(4, 100) = .607,
n.s.), Tension (F(4, 100) = .479, n.s.), Calmness (F(4, 100) = 1.304, n.s.), Tiredness (F(4, 100) =
1.883, n.s.), and Energy (F(4, 78.134) = 1.264, n.s.). Furthermore, the EG and CG did not differ
significantly in their results of AD-ACL scales and sub-scales throughout the course of the NFT
trial as no interactions between factors TIME and GROUP were found for any of the scales and
sub-scales: Activation (F(4, 100) = .041, n.s.), Deactivation (F(4, 100) = 1.909, n.s.), Tension
(F(4, 100) = 1.848, n.s.), Calmness (F(4, 100) = .484, n.s.), Tiredness (F(4, 100) = .533, n.s.),
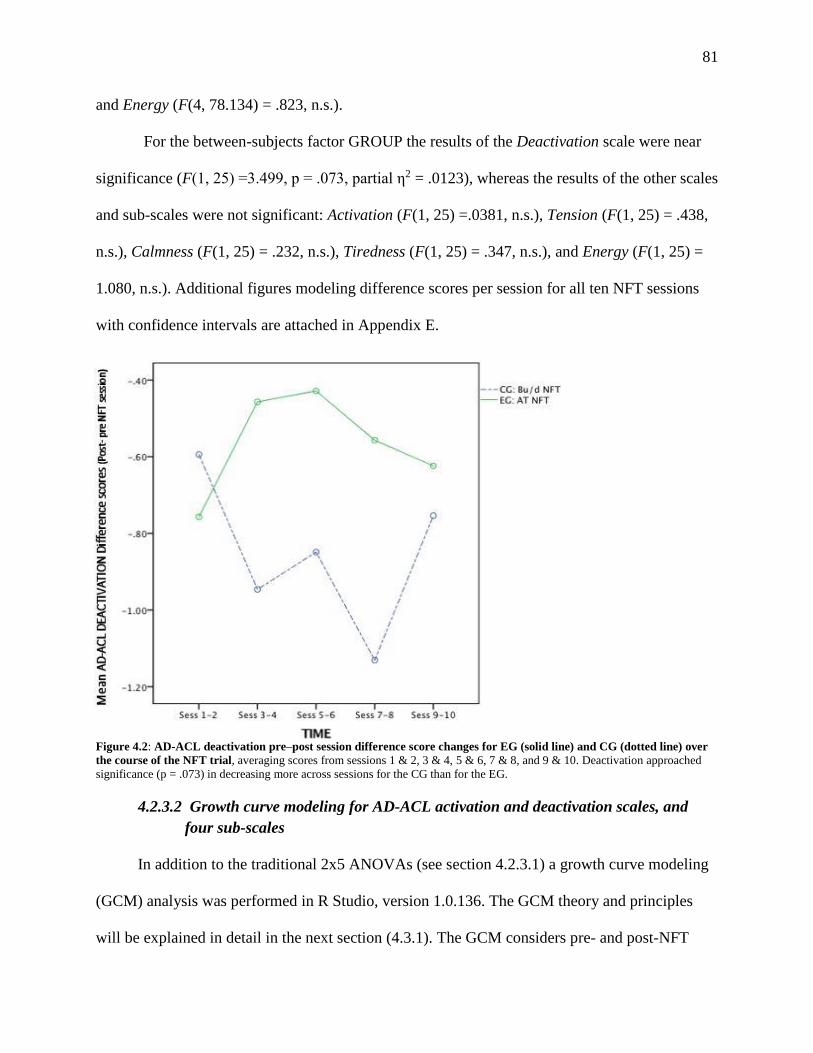
81
and Energy (F(4, 78.134) = .823, n.s.).
For the between-subjects factor GROUP the results of the Deactivation scale were near
significance (F(1, 25) =3.499, p = .073, partial η2 = .0123), whereas the results of the other scales
and sub-scales were not significant: Activation (F(1, 25) =.0381, n.s.), Tension (F(1, 25) = .438,
n.s.), Calmness (F(1, 25) = .232, n.s.), Tiredness (F(1, 25) = .347, n.s.), and Energy (F(1, 25) =
1.080, n.s.). Additional figures modeling difference scores per session for all ten NFT sessions
with confidence intervals are attached in Appendix E.
Figure 4.2: AD-ACL deactivation pre–post session difference score changes for EG (solid line) and CG (dotted line) over
the course of the NFT trial, averaging scores from sessions 1 & 2, 3 & 4, 5 & 6, 7 & 8, and 9 & 10. Deactivation approached
significance (p = .073) in decreasing more across sessions for the CG than for the EG.
4.2.3.2 Growth curve modeling for AD-ACL activation and deactivation scales, and
fffour sub-scales
In addition to the traditional 2x5 ANOVAs (see section 4.2.3.1) a growth curve modeling
(GCM) analysis was performed in R Studio, version 1.0.136. The GCM theory and principles
will be explained in detail in the next section (4.3.1). The GCM considers pre- and post-NFT

82
AD-ACL session difference scores of all ten sessions instead of combining pre-post session
difference results of two sessions each and therefore offers a more nuanced statistical analysis
than ANOVAs.
The GCM confirmed the results from the 2x5 ANOVAs of AD-ACL scales and sub-scales
in that across NFT sessions there was no significant change in scores in any of the scales or sub-
scales, except for the activation scale (Table 4.4 a) which neared significance ( = 0.280, SE =
0.149, p = .071) with participants of the CG getting nearly significantly less activated as they
progressed throughout the NFT sessions. As an interaction effect between factors TIME and
GROUP was detected as well in this scale ( = 0.054, SE = 0.026), p < .05) a difference in
patterns of activation across sessions is suggested. This makes an interpretation of the GROUP
factor results difficult. Visually inspecting Figure 4.5 elucidates that while EG and CG have
relatively similar difference scores in the activation scale in the first and last 2 sessions, in the in
between 6 sessions members of the CG group were far less activated than in beginning or end of
the 10 NFT sessions whereas EG group members were more activated remaining in those 6
sessions.
Predictor for AD-ACL Activation scale (SE) p
MODEL C: TIME ACROSS SESSIONS (ten NFT sessions)
Intercept -0.006 (0.019) -0.676 (0.109)
.742 < .001***
MODEL D: GROUP: group across sessions 0.280 (0.149) .071
MODEL E: TIME ACROSS SESSIONS x GROUP 0.054 (0.026) < .0.5*
Table 4.4 a: Results from GCM regression analyses predicting AD-ACL Activation from across sessions, and group (EG,
CG). Note: Standard errors are given in parentheses. Intercept information is only shown for significant models. Significant
results are shown in bold red.
Predictor for AD-ACL Deactivation scale (SE) p
MODEL C: TIME ACROSS SESSIONS (ten NFT sessions)
Intercept 0.004 (0.022) -0.986 (0.175)
.853 < .001***
MODEL D: GROUP: group across sessions 0.064 (0.260) .808
MODEL E: TIME ACROSS SESSIONS x GROUP -0.009 (0.032) .788
Table 4.4 b: Results from GCM regression analyses predicting AD-ACL Activation from across sessions, and group (EG,
CG). Note: Standard errors are given in parentheses. Intercept information is only shown for significant models. Significant
results are shown in bold red.
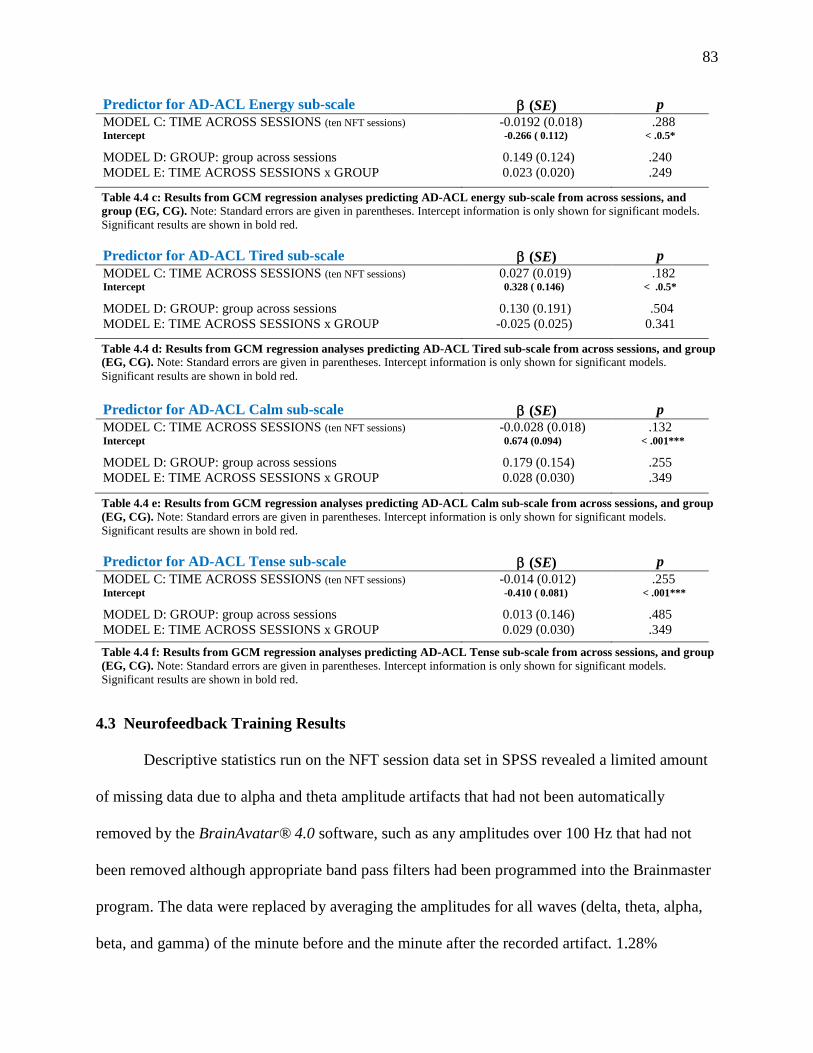
83
Predictor for AD-ACL Energy sub-scale (SE) p
MODEL C: TIME ACROSS SESSIONS (ten NFT sessions)
Intercept -0.0192 (0.018) -0.266 ( 0.112)
.288 < .0.5*
MODEL D: GROUP: group across sessions 0.149 (0.124) .240
MODEL E: TIME ACROSS SESSIONS x GROUP 0.023 (0.020) .249
Table 4.4 c: Results from GCM regression analyses predicting AD-ACL energy sub-scale from across sessions, and
group (EG, CG). Note: Standard errors are given in parentheses. Intercept information is only shown for significant models.
Significant results are shown in bold red.
Predictor for AD-ACL Tired sub-scale (SE) p
MODEL C: TIME ACROSS SESSIONS (ten NFT sessions)
Intercept 0.027 (0.019) 0.328 ( 0.146)
.182 < .0.5*
MODEL D: GROUP: group across sessions 0.130 (0.191) .504
MODEL E: TIME ACROSS SESSIONS x GROUP -0.025 (0.025) 0.341
Table 4.4 d: Results from GCM regression analyses predicting AD-ACL Tired sub-scale from across sessions, and group
(EG, CG). Note: Standard errors are given in parentheses. Intercept information is only shown for significant models.
Significant results are shown in bold red.
Predictor for AD-ACL Calm sub-scale (SE) p
MODEL C: TIME ACROSS SESSIONS (ten NFT sessions)
Intercept -0.0.028 (0.018) 0.674 (0.094)
.132 < .001***
MODEL D: GROUP: group across sessions 0.179 (0.154) .255
MODEL E: TIME ACROSS SESSIONS x GROUP 0.028 (0.030) .349
Table 4.4 e: Results from GCM regression analyses predicting AD-ACL Calm sub-scale from across sessions, and group
(EG, CG). Note: Standard errors are given in parentheses. Intercept information is only shown for significant models.
Significant results are shown in bold red.
Predictor for AD-ACL Tense sub-scale (SE) p
MODEL C: TIME ACROSS SESSIONS (ten NFT sessions)
Intercept -0.014 (0.012) -0.410 ( 0.081)
.255 < .001***
MODEL D: GROUP: group across sessions 0.013 (0.146) .485
MODEL E: TIME ACROSS SESSIONS x GROUP 0.029 (0.030) .349
Table 4.4 f: Results from GCM regression analyses predicting AD-ACL Tense sub-scale from across sessions, and group
(EG, CG). Note: Standard errors are given in parentheses. Intercept information is only shown for significant models.
Significant results are shown in bold red.
4.3 Neurofeedback Training Results
Descriptive statistics run on the NFT session data set in SPSS revealed a limited amount
of missing data due to alpha and theta amplitude artifacts that had not been automatically
removed by the BrainAvatar® 4.0 software, such as any amplitudes over 100 Hz that had not
been removed although appropriate band pass filters had been programmed into the Brainmaster
program. The data were replaced by averaging the amplitudes for all waves (delta, theta, alpha,
beta, and gamma) of the minute before and the minute after the recorded artifact. 1.28%
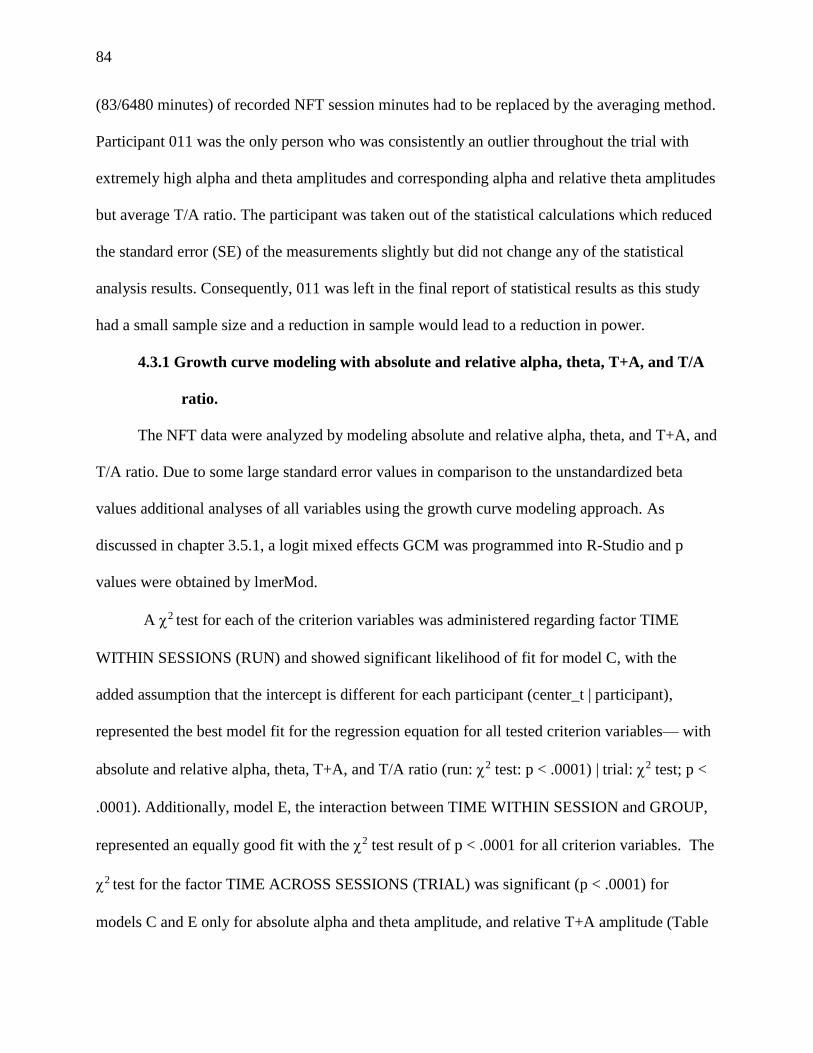
84
(83/6480 minutes) of recorded NFT session minutes had to be replaced by the averaging method.
Participant 011 was the only person who was consistently an outlier throughout the trial with
extremely high alpha and theta amplitudes and corresponding alpha and relative theta amplitudes
but average T/A ratio. The participant was taken out of the statistical calculations which reduced
the standard error (SE) of the measurements slightly but did not change any of the statistical
analysis results. Consequently, 011 was left in the final report of statistical results as this study
had a small sample size and a reduction in sample would lead to a reduction in power.
4.3.1 Growth curve modeling with absolute and relative alpha, theta, T+A, and T/A
rratio.
The NFT data were analyzed by modeling absolute and relative alpha, theta, and T+A, and
T/A ratio. Due to some large standard error values in comparison to the unstandardized beta
values additional analyses of all variables using the growth curve modeling approach. As
discussed in chapter 3.5.1, a logit mixed effects GCM was programmed into R-Studio and p
values were obtained by lmerMod.
A 2 test for each of the criterion variables was administered regarding factor TIME
WITHIN SESSIONS (RUN) and showed significant likelihood of fit for model C, with the
added assumption that the intercept is different for each participant (center_t | participant),
represented the best model fit for the regression equation for all tested criterion variables— with
absolute and relative alpha, theta, T+A, and T/A ratio (run: 2 test: p < .0001) | trial: 2 test; p <
.0001). Additionally, model E, the interaction between TIME WITHIN SESSION and GROUP,
represented an equally good fit with the 2 test result of p < .0001 for all criterion variables. The
2 test for the factor TIME ACROSS SESSIONS (TRIAL) was significant (p < .0001) for
models C and E only for absolute alpha and theta amplitude, and relative T+A amplitude (Table

85
4.3 a, e, d). For relative alpha and theta amplitude, and T/A amplitude ratio (Table 4.5 b, f, c)
only model C presented the best fit, i.e., the 2 test was only significant for model C and not for
model for the factor TIME ACROSS SESSIONS. Interestingly, model E represented an
alternative best fit model for prediction of all criterion variable scores within sessions (run) and
most of the criterion variables between sessions although none of the interactions showed
significant fixed effects in any of the criterion variables. The only criterion variable where the
interaction between TIME x GROUP is at least remotely approaching significance is for TIME
WITHIN SESSIONS for the T/A amplitude ratio (p = .114). All other p values are between .231
and .918. The Bayesian Information Criteria (BIC) values for model C were slightly lower for all
variables than for model E. The BIC is an estimate of how probable each of a number of finite
models is of being true, with a lower BIC value representing a better fit model. Consequently,
model C represents a better fit and the best model to predict NFT alpha and theta amplitudes, as
well as for the Relative T+A amplitude.
TIME WITHIN SESSIONS was a significant predictor for all tested criterion variables,
which means that on average over the course of a session a significant increase in absolute alpha
amplitude ( = 0.066, SE = 0.012, p < .0001), T/A amplitude ratio ( = -0.004, SE = 0.001, p =
.002), relative alpha amplitude ( = 0.067, SE = 0.010, p < .0001), relative theta amplitude ( =
0.007, SE = 0.0003, p < .001), and relative A+T amplitude ( = 0.074, SE = 0.0017, p < .0001)
could be observed within NFT sessions and nearing significance for absolute theta amplitude (
= 0.026, SE = 0.015, p < .094). The analysis of TIME ACROSS SESSIONS revealed that as time
passed between sessions absolute alpha amplitude ( =0.134, SE = 0.048, p = .011) and relative
alpha amplitude ( =0.121, SE = 0.013, p < .0001) increased significantly on average. But no
such significant trend could be observed for T/A ratio ( = -0.006, SE = 0.004, p = .109, n.s.),
86
absolute theta amplitude ( =0.029, SE = 0.053, p = .589, n.s.), relative theta amplitude (
=0.013, SE = 0.036, p = .735, n.s.), or relative T+A amplitude ( =0.019, SE = 0.014, p = .171,
n.s.). The analysis of the GROUP factor did not reveal any significant change for the factor
TIME WITHIN SESSION, nor for TIME ACROSS SESSIONS for T/A amplitude ratio.
Predictor for ABSOLUTE alpha amplitude (in µV) (SE) p
MODEL C: TIME WITHIN SESSIONS (24 one-minute runs per NFT session)
Intercept
0.066 (0.012)
9.442 (0.739)
< .0001 ***
< .0001 ***
MODEL C: TIME ACROSS SESSIONS (ten NFT sessions)
Intercept 0.134 (0.048) 9.691 (0.755)
.011 * < .0001 ***
MODEL D: GROUP: within session 0.165 (1.172) .889
MODEL D: GROUP: group across sessions 0.439 (1.464) .767
MODEL E: TIME WITHIN SESSIONS x GROUP 0.012 (0.019) .556
MODEL E: TIME ACROSS SESSIONS x GROUP 0.055 (0.093) .560
Table 4.5 a: Results from GCM regression analyses predicting absolute alpha amplitude from run (within session), trial
(across sessions), and group (EG, CG). Note: Standard errors are given in parentheses. Intercept information is only shown for
significant models. Significant results are shown in bold red.
Predictor for RELATIVE alpha amplitude (in %) (SE) p
MODEL C: TIME WITHIN SESSIONS (24 one-minute runs per NFT session)
Intercept
0.067 (0.010)
17.585 (0.613)
< .0001 ***
< .0001 ***
MODEL C: TIME ACROSS SESSIONS (ten NFT sessions)
Intercept 0.121 (0.013) 17.709 (0.589)
< .0001 *** < .0001 ***
MODEL D: GROUP: within session -0.065 (1.149) .955
MODEL D: GROUP: group across sessions 0.376 (1.164) .749
MODEL E: TIME WITHIN SESSIONS x GROUP 0.022 (0.018) .244
MODEL E: TIME ACROSS SESSIONS x GROUP 0.014 (0.115) .901
Table 4.5 b: Results from GCM regression analyses predicting relative alpha amplitude from run (within session), trial
(across sessions), and group (EG, CG).Note: Standard errors are given in parentheses. Intercept information is only shown for
significant models. Significant results are shown in bold red.
Predictor for T/A RATIO (SE) p
MODEL C: TIME WITHIN SESSIONS (24 one-minute runs per NFT session)
Intercept
-0.004 (0.001)
0.993 (0.037)
.002 **
< .0001 ***
MODEL C: TIME ACROSS SESSIONS (ten NFT sessions) -0.006 (0.004) .109
MODEL D: GROUP: within session -0.033 (0.071) .647
MODEL D: GROUP: group across sessions -0.023 (0.068) .739
MODEL E: TIME WITHIN SESSIONS x GROUP -0.003 (0.002) .114
MODEL E: TIME ACROSS SESSIONS x GROUP -0.001 (0.007) .918
Table 4.5 c. Results from GCM regression analyses by successively adding predictors for T/A amplitude ratio from
run (within session), trial (across sessions), and condition (EG, CG). Note: Standard errors are given in parentheses.
Intercept information is only shown for significant models. Sigificant results are shown in bold red.
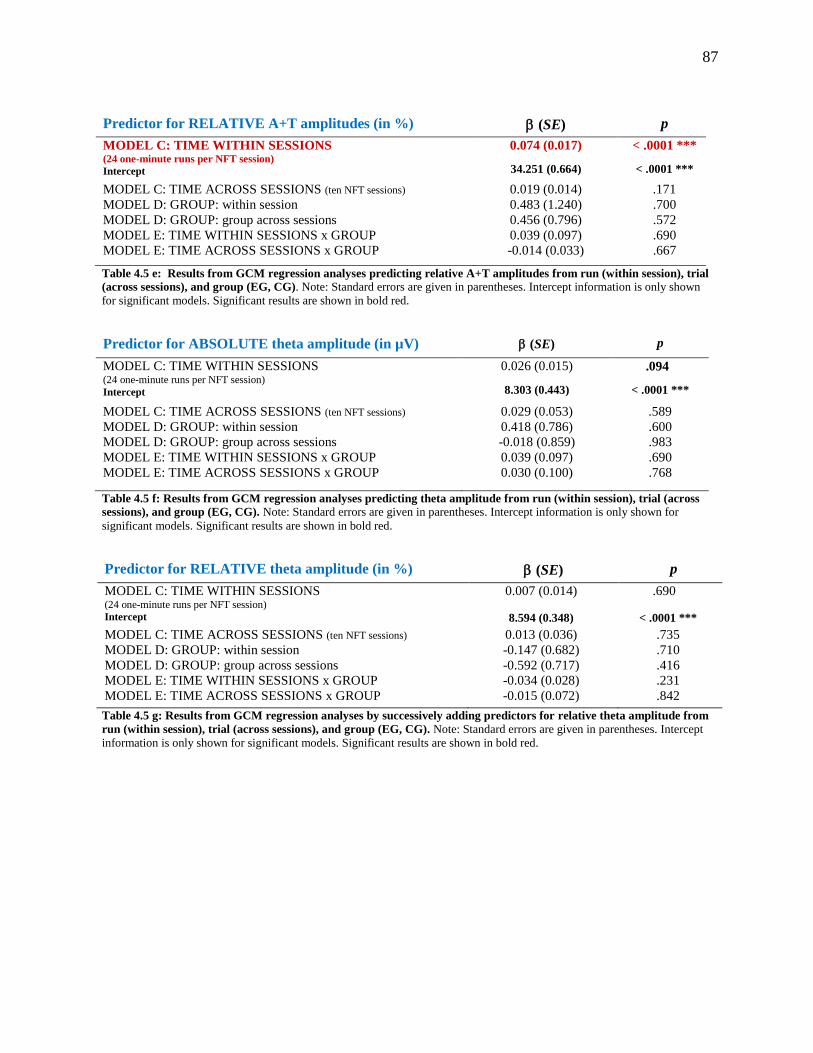
87
Predictor for RELATIVE A+T amplitudes (in %) (SE) p
MODEL C: TIME WITHIN SESSIONS (24 one-minute runs per NFT session)
Intercept
0.074 (0.017)
34.251 (0.664)
< .0001 ***
< .0001 ***
MODEL C: TIME ACROSS SESSIONS (ten NFT sessions) 0.019 (0.014) .171
MODEL D: GROUP: within session 0.483 (1.240) .700
MODEL D: GROUP: group across sessions 0.456 (0.796) .572
MODEL E: TIME WITHIN SESSIONS x GROUP 0.039 (0.097) .690
MODEL E: TIME ACROSS SESSIONS x GROUP -0.014 (0.033) .667
Table 4.5 e: Results from GCM regression analyses predicting relative A+T amplitudes from run (within session), trial
(across sessions), and group (EG, CG). Note: Standard errors are given in parentheses. Intercept information is only shown
for significant models. Significant results are shown in bold red.
Predictor for ABSOLUTE theta amplitude (in µV) (SE) p
MODEL C: TIME WITHIN SESSIONS (24 one-minute runs per NFT session)
Intercept
0.026 (0.015)
8.303 (0.443)
.094
< .0001 ***
MODEL C: TIME ACROSS SESSIONS (ten NFT sessions) 0.029 (0.053) .589
MODEL D: GROUP: within session 0.418 (0.786) .600
MODEL D: GROUP: group across sessions -0.018 (0.859) .983
MODEL E: TIME WITHIN SESSIONS x GROUP 0.039 (0.097) .690
MODEL E: TIME ACROSS SESSIONS x GROUP 0.030 (0.100) .768
Table 4.5 f: Results from GCM regression analyses predicting theta amplitude from run (within session), trial (across
sessions), and group (EG, CG). Note: Standard errors are given in parentheses. Intercept information is only shown for
significant models. Significant results are shown in bold red.
Predictor for RELATIVE theta amplitude (in %) (SE) p
MODEL C: TIME WITHIN SESSIONS (24 one-minute runs per NFT session)
Intercept
0.007 (0.014)
8.594 (0.348)
.690
< .0001 ***
MODEL C: TIME ACROSS SESSIONS (ten NFT sessions) 0.013 (0.036) .735
MODEL D: GROUP: within session -0.147 (0.682) .710
MODEL D: GROUP: group across sessions -0.592 (0.717) .416
MODEL E: TIME WITHIN SESSIONS x GROUP -0.034 (0.028) .231
MODEL E: TIME ACROSS SESSIONS x GROUP -0.015 (0.072) .842
Table 4.5 g: Results from GCM regression analyses by successively adding predictors for relative theta amplitude from
run (within session), trial (across sessions), and group (EG, CG). Note: Standard errors are given in parentheses. Intercept
information is only shown for significant models. Significant results are shown in bold red.
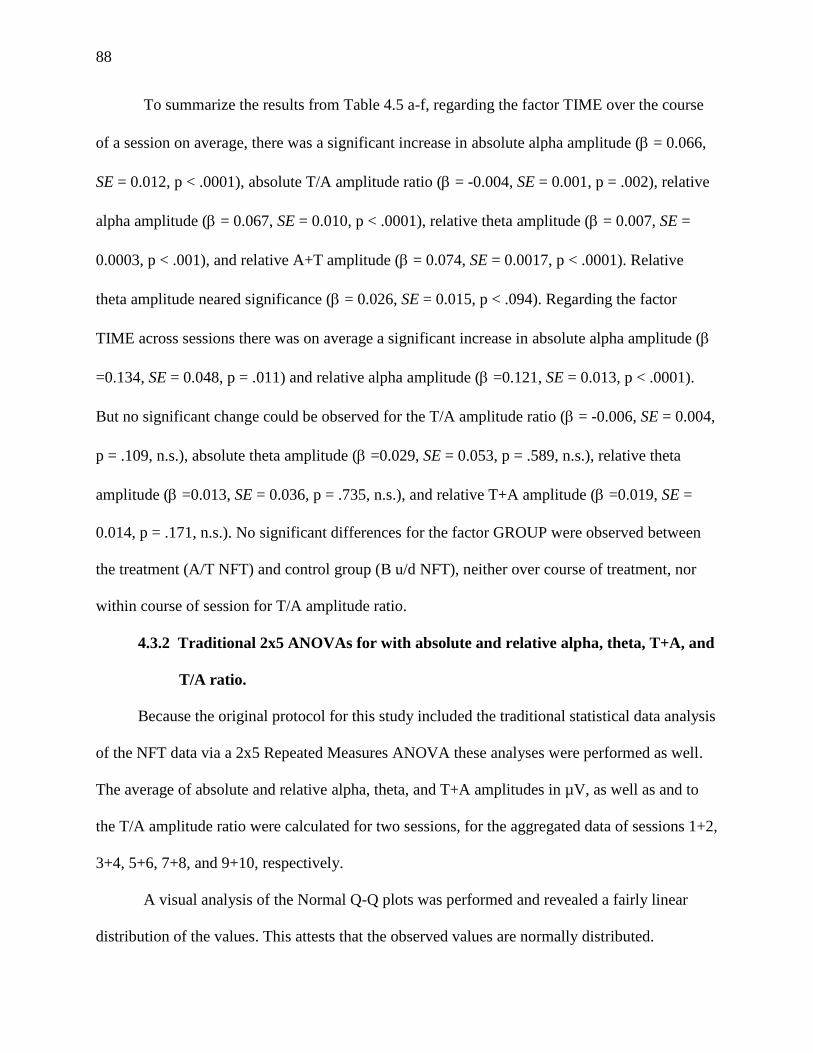
88
To summarize the results from Table 4.5 a-f, regarding the factor TIME over the course
of a session on average, there was a significant increase in absolute alpha amplitude ( = 0.066,
SE = 0.012, p < .0001), absolute T/A amplitude ratio ( = -0.004, SE = 0.001, p = .002), relative
alpha amplitude ( = 0.067, SE = 0.010, p < .0001), relative theta amplitude ( = 0.007, SE =
0.0003, p < .001), and relative A+T amplitude ( = 0.074, SE = 0.0017, p < .0001). Relative
theta amplitude neared significance ( = 0.026, SE = 0.015, p < .094). Regarding the factor
TIME across sessions there was on average a significant increase in absolute alpha amplitude (
=0.134, SE = 0.048, p = .011) and relative alpha amplitude ( =0.121, SE = 0.013, p < .0001).
But no significant change could be observed for the T/A amplitude ratio ( = -0.006, SE = 0.004,
p = .109, n.s.), absolute theta amplitude ( =0.029, SE = 0.053, p = .589, n.s.), relative theta
amplitude ( =0.013, SE = 0.036, p = .735, n.s.), and relative T+A amplitude ( =0.019, SE =
0.014, p = .171, n.s.). No significant differences for the factor GROUP were observed between
the treatment (A/T NFT) and control group (B u/d NFT), neither over course of treatment, nor
within course of session for T/A amplitude ratio.
4.3.2 Traditional 2x5 ANOVAs for with absolute and relative alpha, theta, T+A, and
T/A ratio.
Because the original protocol for this study included the traditional statistical data analysis
of the NFT data via a 2x5 Repeated Measures ANOVA these analyses were performed as well.
The average of absolute and relative alpha, theta, and T+A amplitudes in µV, as well as and to
the T/A amplitude ratio were calculated for two sessions, for the aggregated data of sessions 1+2,
3+4, 5+6, 7+8, and 9+10, respectively.
A visual analysis of the Normal Q-Q plots was performed and revealed a fairly linear
distribution of the values. This attests that the observed values are normally distributed.
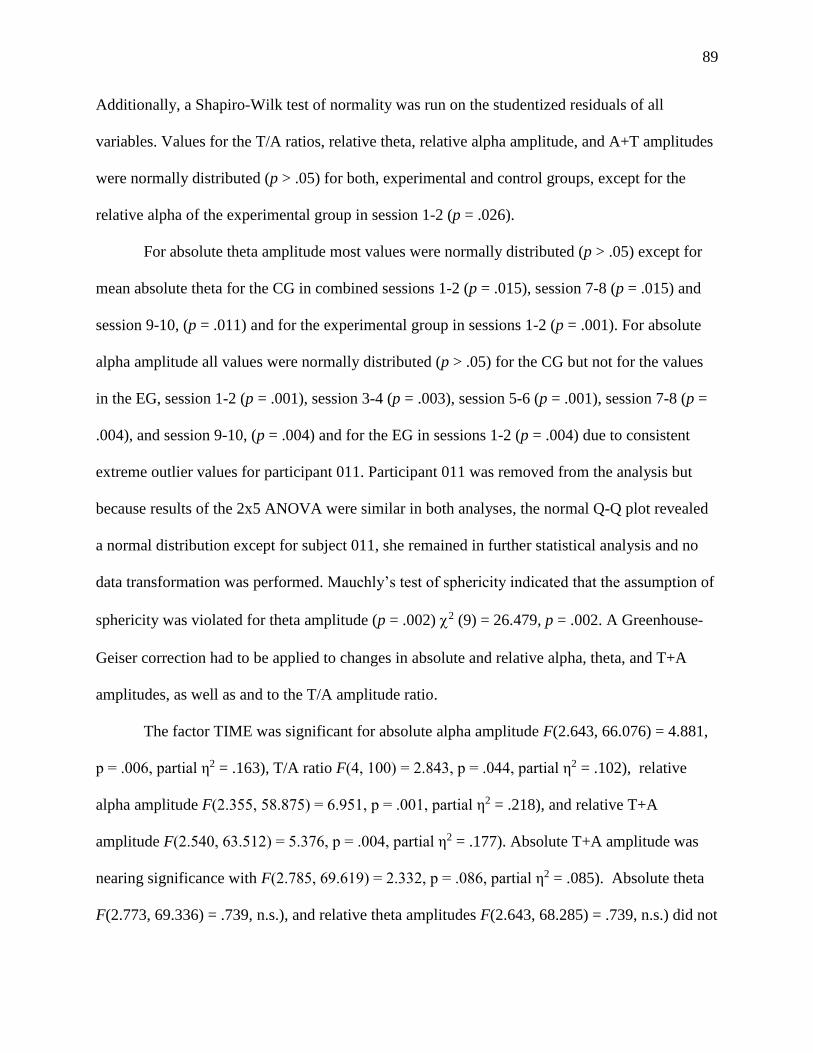
89
Additionally, a Shapiro-Wilk test of normality was run on the studentized residuals of all
variables. Values for the T/A ratios, relative theta, relative alpha amplitude, and A+T amplitudes
were normally distributed (p > .05) for both, experimental and control groups, except for the
relative alpha of the experimental group in session 1-2 (p = .026).
For absolute theta amplitude most values were normally distributed (p > .05) except for
mean absolute theta for the CG in combined sessions 1-2 (p = .015), session 7-8 (p = .015) and
session 9-10, (p = .011) and for the experimental group in sessions 1-2 (p = .001). For absolute
alpha amplitude all values were normally distributed (p > .05) for the CG but not for the values
in the EG, session 1-2 (p = .001), session 3-4 (p = .003), session 5-6 (p = .001), session 7-8 (p =
.004), and session 9-10, (p = .004) and for the EG in sessions 1-2 (p = .004) due to consistent
extreme outlier values for participant 011. Participant 011 was removed from the analysis but
because results of the 2x5 ANOVA were similar in both analyses, the normal Q-Q plot revealed
a normal distribution except for subject 011, she remained in further statistical analysis and no
data transformation was performed. Mauchly’s test of sphericity indicated that the assumption of
sphericity was violated for theta amplitude (p = .002) 2 (9) = 26.479, p = .002. A Greenhouse-
Geiser correction had to be applied to changes in absolute and relative alpha, theta, and T+A
amplitudes, as well as and to the T/A amplitude ratio.
The factor TIME was significant for absolute alpha amplitude F(2.643, 66.076) = 4.881,
p = .006, partial η2 = .163), T/A ratio F(4, 100) = 2.843, p = .044, partial η2 = .102), relative
alpha amplitude F(2.355, 58.875) = 6.951, p = .001, partial η2 = .218), and relative T+A
amplitude F(2.540, 63.512) = 5.376, p = .004, partial η2 = .177). Absolute T+A amplitude was
nearing significance with F(2.785, 69.619) = 2.332, p = .086, partial η2 = .085). Absolute theta
F(2.773, 69.336) = .739, n.s.), and relative theta amplitudes F(2.643, 68.285) = .739, n.s.) did not
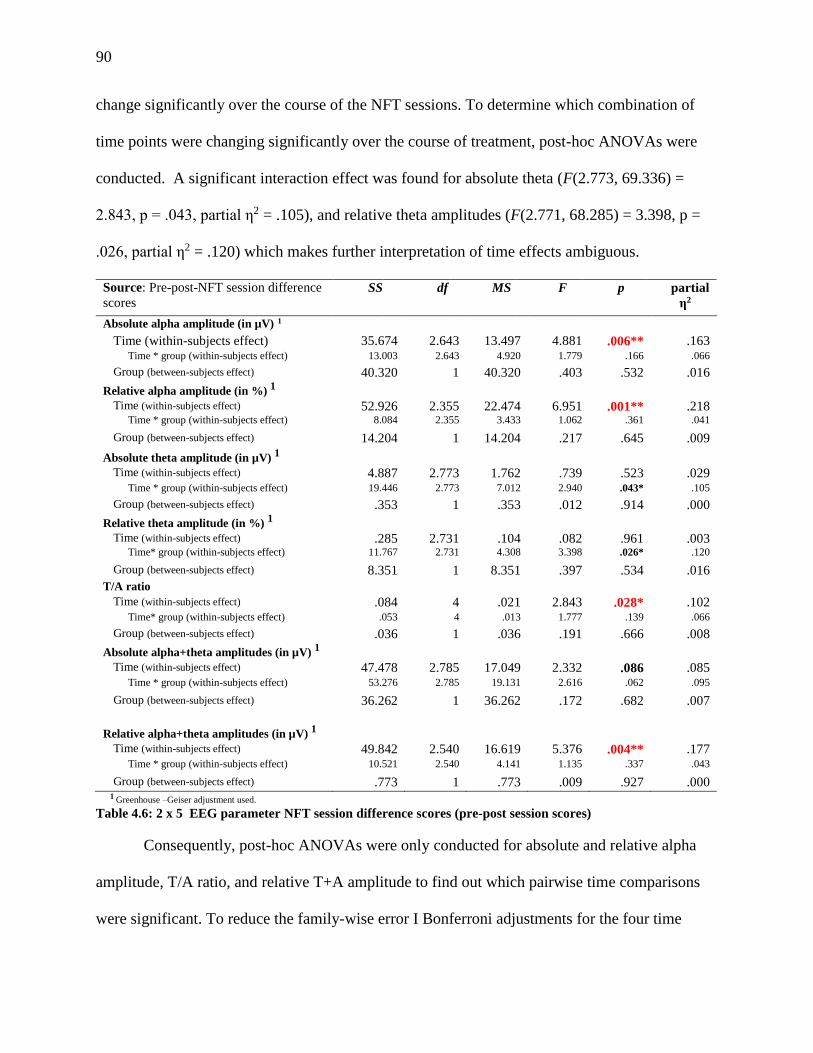
90
change significantly over the course of the NFT sessions. To determine which combination of
time points were changing significantly over the course of treatment, post-hoc ANOVAs were
conducted. A significant interaction effect was found for absolute theta (F(2.773, 69.336) =
2.843, p = .043, partial η2 = .105), and relative theta amplitudes (F(2.771, 68.285) = 3.398, p =
.026, partial η2 = .120) which makes further interpretation of time effects ambiguous.
Source: Pre-post-NFT session difference
scores
SS df MS F p partial
η2
Absolute alpha amplitude (in µV) 1
Time (within-subjects effect) 35.674 2.643 13.497 4.881 .006** .163 Time * group (within-subjects effect) 13.003 2.643 4.920 1.779 .166 .066
Group (between-subjects effect) 40.320 1 40.320 .403 .532 .016
Relative alpha amplitude (in %) 1
Time (within-subjects effect) 52.926 2.355 22.474 6.951 .001** .218 Time * group (within-subjects effect) 8.084 2.355 3.433 1.062 .361 .041
Group (between-subjects effect) 14.204 1 14.204 .217 .645 .009
Absolute theta amplitude (in µV) 1
Time (within-subjects effect) 4.887 2.773 1.762 .739 .523 .029 Time * group (within-subjects effect) 19.446 2.773 7.012 2.940 .043* .105
Group (between-subjects effect) .353 1 .353 .012 .914 .000
Relative theta amplitude (in %) 1
Time (within-subjects effect) .285 2.731 .104 .082 .961 .003 Time* group (within-subjects effect) 11.767 2.731 4.308 3.398 .026* .120
Group (between-subjects effect) 8.351 1 8.351 .397 .534 .016
T/A ratio Time (within-subjects effect) .084 4 .021 2.843 .028* .102
Time* group (within-subjects effect) .053 4 .013 1.777 .139 .066
Group (between-subjects effect) .036 1 .036 .191 .666 .008
Absolute alpha+theta amplitudes (in µV) 1
Time (within-subjects effect) 47.478 2.785 17.049 2.332 .086 .085 Time * group (within-subjects effect) 53.276 2.785 19.131 2.616 .062 .095
Group (between-subjects effect) 36.262 1 36.262 .172 .682 .007
Relative alpha+theta amplitudes (in µV) 1
Time (within-subjects effect) 49.842 2.540 16.619 5.376 .004** .177 Time * group (within-subjects effect) 10.521 2.540 4.141 1.135 .337 .043
Group (between-subjects effect) .773 1 .773 .009 .927 .000
1 Greenhouse –Geiser adjustment used.
Table 4.6: 2 x 5 EEG parameter NFT session difference scores (pre-post session scores)
Consequently, post-hoc ANOVAs were only conducted for absolute and relative alpha
amplitude, T/A ratio, and relative T+A amplitude to find out which pairwise time comparisons
were significant. To reduce the family-wise error I Bonferroni adjustments for the four time
91
comparisons were run. Absolute alpha amplitude increased significantly between sessions 1+2
and 5+6, as well as between sessions 1+2 and 7+8, with adjusted p = .024 in both cases. Relative
alpha amplitude decreased significantly between sessions 1+2 and 3+4 (adjusted p = .012),
sessions 1+2 and 5+6 (adjusted p = .001), and sessions 1+2 and 7+8 (adjusted p = .008); sessions
1+2 and 9+10 approached significance (adjusted p = .064). T/A ratio decreased significantly
between sessions 1+2 and 3+4 (adjusted p = .012),but was not significant for the other three
session comparisons. Relative T+A amplitude increased significantly between sessions 1+2 and
5+6 (adjusted p = .001), sessions 1+2 and 7+8 (adjusted p = .001; sessions 1+2 and 9+10
approached significance (adjusted p = .068) and the comparison between sessions 1+2 and 3+4
was not significant (p = .116), (Figure 4.6).
No differences between the EG and CG regarding changes in absolute alpha amplitude
F(1, 25) = .403, n.s.), relative alpha amplitude (F(1, 25) = .217, n.s.), absolute theta amplitude
F(1, 25) = .012, n.s.), relative theta amplitude F(1, 25) = .397, n.s.), T/A ratio F(1, 25) = .191,
n.s.), absolute T+A amplitudes (F(1, 25) = .172, n.s.), and relative T+A amplitude F(1, 25) =
.009, n.s.) were observed.
4.4 QEEG Results
A 2x2 repeated-measures ANOVA with the within-subjects factor TIME and factor
GROUP were performed for theta, alpha, T+A absolute and relative power, and T/A ratio at Pz.
A visual analysis of the Normal Q-Q plots was performed for all variables which revealed a
fairly linear distribution of the values which attests that the observed values are normally
distributed. Only one extreme outlier (SD > 2.5) was found for the T/A ratio (participant 025)
and few other outliers (SD > 1.0): for relative theta power (participants 012 and 025), for
absolute theta (participants 021 and 023), absolute alpha (participant 007), and for T/A ratio
92
(participant 23). None of the variables showed a statistically significant change between pre- and
post-treatment and no differences between EG and CG was observed for any of the variables,
either.
4.4.1 Theta and alpha absolute power.
The 2x2 ANOVA for absolute theta power revealed that the factor TIME was not
statistically significant, indicating that no significant change in theta power was observed at Pz
between the beginning and the end of the trial (pre-trial (M = 19.169, SD = 16.626); post-trial (M
= 19.178, SD = 14.292); F(1, 25) = 0.000, p = .985, partial η2 = .000; n.s.). The TIME*GROUP
interaction exhibited no statistically significant difference between the EG and CG for absolute
theta power at Pz between pre- and post-trial (F(1, 25) = 0.426, p = .520, partial η2 = .066; n.s.)
which suggests that no differential treatment effect for the A/T NFT (or for the placebo NFT)
was observed for absolute theta.
The 2x2 ANOVA uncovered no statistically significant change for absolute alpha power
in the EEG at Pz between pre- and post-trial (F(1, 25) = 0.179, p = .676, partial η2 = .007; n.s.).
Moreover, no statistically significant difference between the EG and CG for absolute alpha
power at Pz between pre- and post-trial was observed (F(1, 25) = 0.004, p = .953, partial η2 =
.000; n.s.).
4.4.2 Theta and alpha relative power.
The 2x2 ANOVA indicated that no statistically significant change in relative theta
power in the EEG at Pz between pre-and post-treatment (F(1, 25) = 0.705, p = .409, partial η2
= .027; n.s.) and no statistically significant difference in relative theta power between the EG
and CG and time of the EEG was found (F(1, 25) = 1.763, p = .196, partial η2 = .066; n.s.).
The 2x2 ANOVA revealed no significant change for relative alpha power in the EEG at
93
Pz between the pre- and post-trial (F(1, 25) = 0.224, p = .640, partial η2 = .009; n.s.) and no
statistically significant difference between the EG and CG and time of the EEG was observed
(F(1, 25) = 0.435, p = .515, partial η2 = .017; n.s.).
4.4.3 Theta / alpha power ratio.
The 2x2 ANOVA showed no significant change for the theta / alpha power ratio in the
EEG at Pz between pre-and post-treatment (F(1, 25) = 0.916, p = .348, partial η2 = .035; n.s.) and
no significant interaction between the EG and CG and time of the EEG could be observed (F(1,
25) = 0.172, p = .682, partial η2 = .007; n.s.).
4.4.4 Theta + alpha absolute power.
The 2x2 ANOVA revealed no statistically significant change in (T+A) absolute power in
the EEG at Pz between pre-and post-treatment (F(1, 25) = 0.151, p = .701, partial η2 = .006; n.s.)
and no significant difference between the EG and CG and time of the EEG (F(1, 25) = 1.944, p =
.317, partial η2 = .040; n.s.) µV
4.4.5 Theta + alpha relative power.
The 2x2 ANOVA did not indicate a statistically significant change for the (T+A) relative
power in the EEG at Pz between pre-and post-treatment (F(1, 25) = 1.117, p = .330, partial η2 =
.043; n.s.). The TIME*GROUP interaction was not significant, either, which suggests that no
difference in treatment effect between the EG and CG could be observed (F(1, 25) = 2.442, p =
.131, partial η2 = .089; n.s.). However, relative T+A power between groups shows a slight trend
toward significance (p = .131) with a medium effect size.
94
4.5 Correlations
Quantitative variables of the study were analyzed via Pearson correlation matrix (Tables
4.7 to 4.9). For any measure that was assessed pre-and post- trial (i.e., BAI, STAI-T, STAI-S,
GAD-7, and QEEG measures) difference scores were calculated by subtracting the post-session
score from the pre-session score. For measures that were gaged before and after each NFT
session (i.e., NFT EEG measures and ADACL scores) mean difference scores of sessions 1 and 2
and sessions 9 and 10 were subtracted from each other, i.e., (sessions 9+10) / 2 – (sessions 1+2) /
2 = difference score. Hence, the higher the difference score was the higher the post treatment
score was. The examination of the bivariate relationships showed, as was expected, higher
correlations within groups of related variables, such as between the different anxiety instruments
and between EEG alpha and NFT alpha measurements.
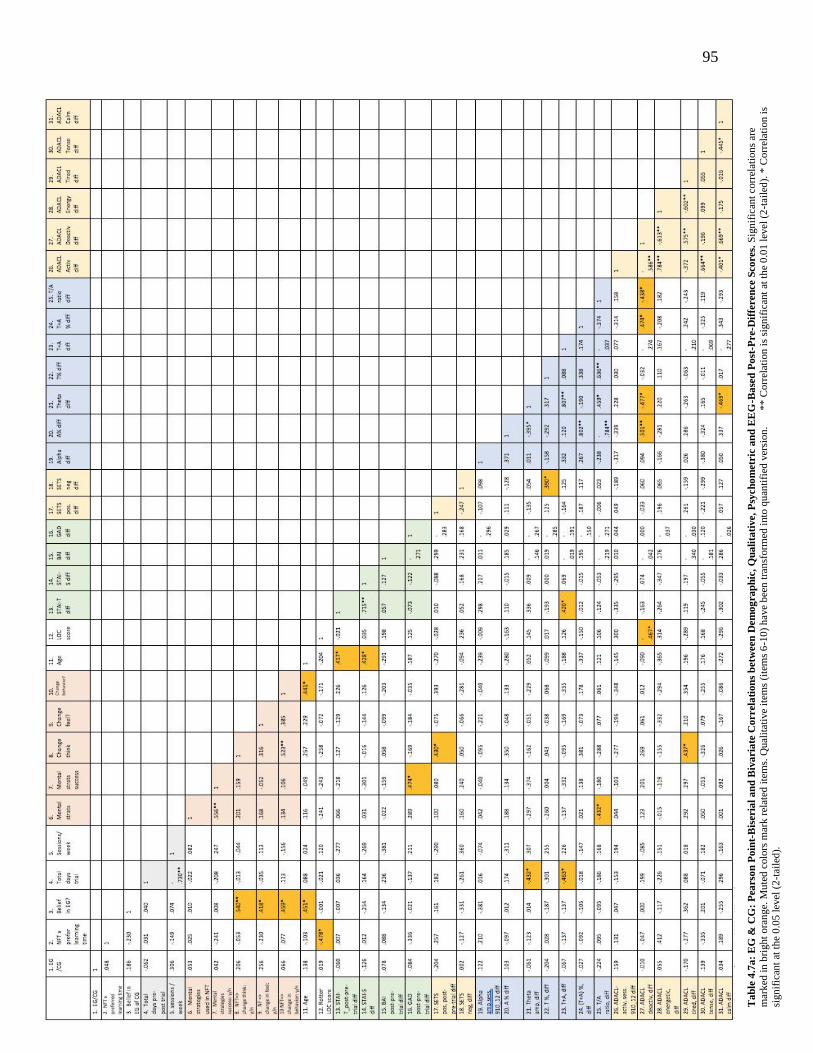
95
Ta
ble
4.7
a:
EG
& C
G:
Pea
rso
n P
oin
t-B
iser
ial
an
d B
iva
ria
te C
orrel
ati
on
s b
etw
een
Dem
og
ra
ph
ic,
Qu
ali
tati
ve,
Psy
ch
om
etr
ic a
nd
EE
G-B
ase
d P
ost
-Pre-D
iffe
ren
ce S
cores.
Sig
nif
ican
t co
rrel
atio
ns
are
mar
ked
in
bri
ght
ora
nge.
Mu
ted
colo
rs m
ark r
elat
ed i
tem
s. Q
ual
itat
ive
item
s (i
tem
s 6
-10
) h
ave
bee
n t
ran
sform
ed i
nto
qu
anti
fied
ver
sion
. *
* C
orr
elat
ion
is
sign
ific
ant
at t
he
0.0
1 l
evel
(2
-tai
led
). *
Corr
elat
ion i
s
sign
ific
ant
at t
he
0.0
5 l
evel
(2
-tai
led
).

96
4.5.1 Participant demographic correlations.
The participants age in years correlated significantly with the STAI-T (r = .417; p = .030)
and STAI-S (r =.428; p = .026) difference scores (Table 4.7 a); higher age was significantly
related to higher post-treatment scores in state and trait anxiety; in other words, the older
participants did not exhibit as high of a reduction in anxiety by the end of the NFT as younger
participants. Related to this finding is that older individuals were not able to reduce their level of
calmness, as evidenced by the AD-ACL calmness sub-scale, as much as younger individuals
between start and end of NFT sessions (r = -.434, p = .024). Age was also significantly correlated
with lower learning rates of alpha and theta, as signified by lower theta (r = -.426, p = .027) and
alpha (r = -.531, p = .004) amplitude differences from the beginning to the end of a NFT
trial, but not significantly correlated with T/A (r = -.103, p > .05, n.s.), and (T+A) relative
amplitude differences (r = -.338, p > .05, n.s.). However, higher age did significantly relate to
higher relative alpha measurements in the QEEG between pre- and post-trial (r = -.432, p =
.024).
Education level correlated positively with GAD-7 difference scores (r = .409, p = .034)
pre- and post-treatment; in other words, the higher the education level was the greater the
reduction in anxiety, as measured by the GAD-7. However, the other anxiety measures, STAI-T
(r = .261, p > .05, n.s.), STAI-S (r = .153, p > .05, n.s.), and BAI (r = -.030, p > .05, n.s.) did not
show a significant correlation between perceived anxiety and education level.
4.5.2 Duration of treatment and sessions per week correlations.
The duration of treatment for ten NFT sessions significantly correlated negatively with
97
theta amplitude difference (r = -.426, p = .027) and T/A ratio difference (r = -.482, p = .011) from
beginning to end of a NFT session; i.e., more days between NFT sessions were associated with
poorer learning of theta amplitudes up-regulation and less change in T/A ratio difference
between beginning and end of the trial (Table 4.7 a). Confirming these results was, sessions of
NFT per week was only related to T/A ratio difference (r = .443, p = .021), i.e., the less sessions
per week (the longer the duration of the NFT trial) the lower their T/A ratio difference score
between the beginning and the end of the NFT trial. However, number of sessions per week did
not significantly relate to theta amplitude differences.
4.5.3 Anxiety questionnaires correlations.
Age significantly correlated with both the STAI-S (r = .417, p < .05) pre-post difference
scores and the STAI-T (r = .428, p < .05): The younger participants were the more state and trait
anxiety was reduced after the ten NFT sessions (Table 4.3). Furthermore, GAD-7 pre-post
difference scores were significantly related to the perceived success of mental strategies used to
elevate the EEG parameters of the NFT protocols (r = .474, p < .05): The more successful the
mental strategies were perceived the lowerwas the reduction in perceived anxiety at the end of
the NFT trial. Lastly, STAI-T difference scores were significantly associated with absolute T+A
amplitude increases between the means of sessions 1 and 2 in comparison to the mean of
sessions 9 and 10 (r = .420, p < .05). All other parameters of the matrix did not significantly
correlate with any of the study’s anxiety parameters.
4.5.4 Activation and deactivation (AD-ACL) correlations.
The AD-ACL mean difference scores of sessions 9 +10 subtracted from sessions 1 + 2
for deactivation and activation scales and the tiredness, calmness, tenseness, and energy sub-
scales did not significantly correlate with any other measure, except for the AD-ACL calmness
98
sub-scale which significantly related to age (see above), including all anxiety self-report
questionnaires and the participant perceiving their mental strategies as success (r = .437, p =
.031), i.e., the more tired participants felt across sessions the more successful they perceived
their mental strategies (Table 4.7 a).
Furthermore, a correlation matrix was calculated that simply used the pre-post difference
score of all sessions in its relationship to the other study parameters. No significant correlations
were observed between the AD-ACL scales and sub-scales and any of the anxiety scales. But
most of the AD-ACL scales and sub-scales significantly correlated to the item whether any
change of behavior was observed in everyday life due to the NFT training; a change in behavior
(positive change regarding anxiety symptomology in all cases) was significantly associated with
lower perceived deactivation (r = -.565, p > .01), lower tension (r = -.467, p > .05), less
tiredness (r = -.661, p > .01), and higher energy (r = .642, p > .01) post-NFT session; and a
perceived change in thinking was associated with less perceived tiredness (r = -.462, p > .05)
post-NFT session.
As the CG protocol did not uptrain alpha and theta amplitudes, a bivariate correlation
matrix was calculated for the EG only. The results of this new matrix were then compared to the
correlation matrix for all study participants and (Table 4.7 b). Higher significant correlations for
the AD-ACL deactivation scale for relative alpha differences between sessions 1+2 and last
sessions 9+10 (r = .676, p < .01, instead of r = .501, p < .01), absolute theta (r = -.613, p < .05,
instead of r = -.474, p < .05), relative T+A (r = .714, p < .01, instead of r = .474, p < .05) and T/A
ratio (r = -.591, p < .05, instead of r = -.438, p < .05) were observed. Thus, the higher the relative
alpha and relative T+A amplitudes were in sessions 9+10 in comparison to the sessions 1+2
(larger difference score) the more deactivated participants felt. The higher the absolute theta

99
amplitudes and T/A ratio difference scores between sessions 1+2 and 9+10 were the less
deactivated subjects felt. These trends were significant for both EG and CG but even more
pronounced for participants of the the EG. However, no significant correlations were observed
between AD-ACL deactivation and absolute alpha, absolute T+A, and relative theta, neither for
the correlation matrix for the EG only nor for all participants.
Table 4.7 b: EG only: Pearson bivariate significant correlations between AD-ACL measures and EEG-based NFT pre-
post-difference scores between session 1 & 2 and 9 & 10. Significant correlations are marked in orange or red: orange = are
significant for both, EG & CG, red = only significant when looking at EG only. ** Correlation is significant at the 0.01 level (2-
tailed). * Correlation is significant at the 0.05 level (2-tailed).
Analyzing the correlation between the AD-ACL mean difference scores (of sessions 9 +
10 subtracted from sessions 1 + 2) for scales and sub-scales and EEG-based measures revealed a
more nuanced picture on deactivation and activation. While the AD-ACL difference scores in
energy did not significantly correlate with any of the NFT measures, the other AD-ACL sub-
scales did: tired (r = .553, p < .05), tense (r = -.539, p < .05), and calm (r = .543, p < .05), sub-
scales significantly correlated with relative alpha. The AD-ACL tired significantly correlated
with relative T+A (r = .578, p < .05) and absolute theta (r = -.631, p < .05); and T/A ratio (r = -
.566, p < .05) correlated with the AD-ACL calm sub-scale (Table 4.4). All but the absolute theta
correlations were significant for the EG only (not for EG and CG combined), i.e., for the EG the
higher the relative and absolute alpha amplitude became over the course of the ten-session NFT
trial, the less tense they felt; the higher the relative alpha amplitude became the more tired and
calm participants felt; the lower the T/A ratio became the calmer EG participants felt.

100
4.5.5 QEEG-related correlations.
Several QEEG pre- and post-treatment differences correlated with psychometric
difference scores and demographic participant characteristics. The theta relative power
difference between pre- and post-treatment correlated with two of the anxiety measures but in
opposite ways: BAI (r = .417, p = .031) and GAD-7 (r = -.449, p = .019) (Table 4.9); for the BAI
an increase in relative theta amplitude was associated with an increase in perceived BAI anxiety
scores post treatment, whereas an increase in relative theta amplitude post treatment was
associated with a decrease in post-treatment perceived anxiety scores on the GAD-7 (Table 4.5).
Higher absolute theta power was associated with higher perceived anxiety scores in the BAI (r =
.564, p = .002) and higher education level was associated with higher post-treatment absolute
alpha power (r = .410, p = .034). Alpha relative power was positively related to age and
education level (Section 4.5.1) and T/A ratio was not significantly correlated with any measure,
except, like expected, with other EEG-related measures.
Table 4.8: Pearson bivariate significant correlations between psychometric and EEG-based pre-post-difference scores and
participant characteristics. Significant correlations are marked in grey. ** Correlation is significant at the 0.01 level (2-tailed).
* Correlation is significant at the 0.05 level (2-tailed).
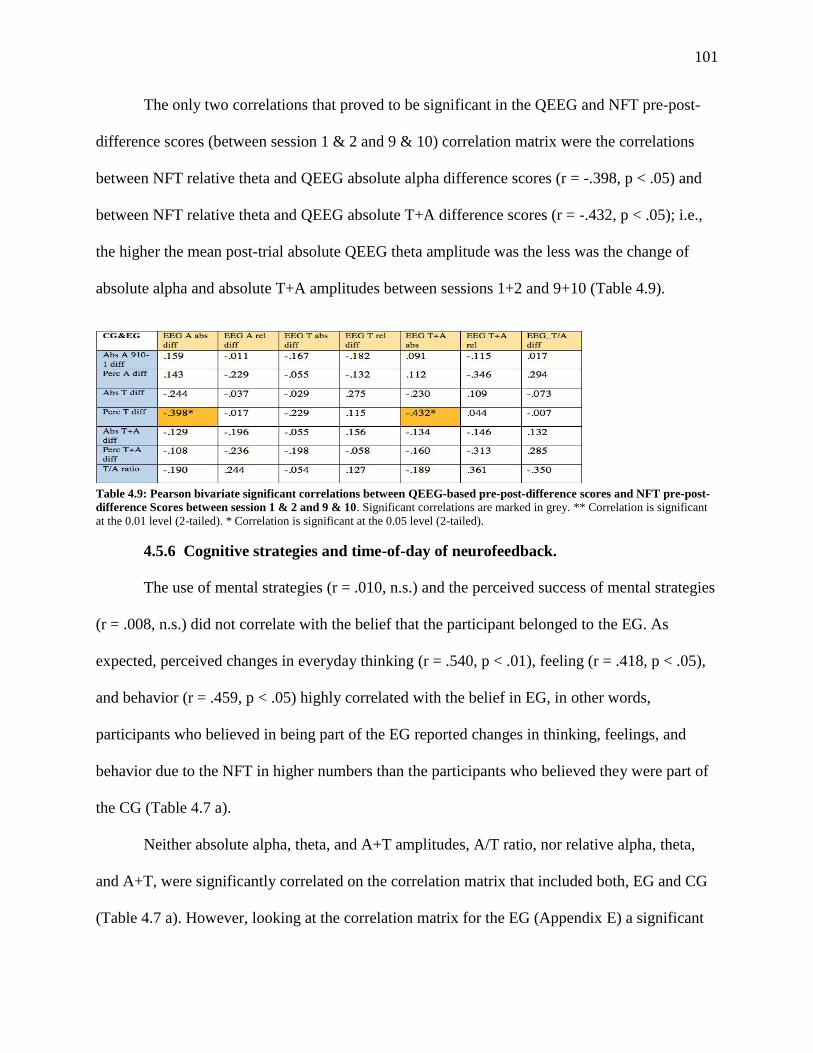
101
The only two correlations that proved to be significant in the QEEG and NFT pre-post-
difference scores (between session 1 & 2 and 9 & 10) correlation matrix were the correlations
between NFT relative theta and QEEG absolute alpha difference scores (r = -.398, p < .05) and
between NFT relative theta and QEEG absolute T+A difference scores (r = -.432, p < .05); i.e.,
the higher the mean post-trial absolute QEEG theta amplitude was the less was the change of
absolute alpha and absolute T+A amplitudes between sessions 1+2 and 9+10 (Table 4.9).
Table 4.9: Pearson bivariate significant correlations between QEEG-based pre-post-difference scores and NFT pre-post-
difference Scores between session 1 & 2 and 9 & 10. Significant correlations are marked in grey. ** Correlation is significant
at the 0.01 level (2-tailed). * Correlation is significant at the 0.05 level (2-tailed).
4.5.6 Cognitive strategies and time-of-day of neurofeedback.
The use of mental strategies (r = .010, n.s.) and the perceived success of mental strategies
(r = .008, n.s.) did not correlate with the belief that the participant belonged to the EG. As
expected, perceived changes in everyday thinking (r = .540, p < .01), feeling (r = .418, p < .05),
and behavior (r = .459, p < .05) highly correlated with the belief in EG, in other words,
participants who believed in being part of the EG reported changes in thinking, feelings, and
behavior due to the NFT in higher numbers than the participants who believed they were part of
the CG (Table 4.7 a).
Neither absolute alpha, theta, and A+T amplitudes, A/T ratio, nor relative alpha, theta,
and A+T, were significantly correlated on the correlation matrix that included both, EG and CG
(Table 4.7 a). However, looking at the correlation matrix for the EG (Appendix E) a significant
102
negative correlation was observed between the T/A ratio and the use of mental strategies (r = -
.556, p < .05); i.e., mental strategies use in the EG was associated with lower T/A ratios in
sessions 9+10 in comparison to sessions 1+2. Furthermore, relative alpha (r = .546, p < .05), and
relative T+A (r = .609, p < .05), amplitudes were positively correlated, meaning that a reduction
in anxious thinking after the NFT trial was associated with higher relative alpha and T+A
amplitudes by the end of the trial.
As detailed in section 4.5.5, GAD-7 pre-post-difference scores were significantly related
to the perceived success of mental strategies improving NFT reward rate (r = .474, p < .05): The
more successful that mental strategies were perceived by the participant the greater the reduction
in perceived anxiety at the end of the NFT trial.
The correspondence of the time-of-day of the NFT sessions (Appendix D: Neurofeedback
Session Checklist) with the times-of-day of best learning did not correlate significantly with the
difference scores between session 1+2 and 9+10 differences in absolute alpha (r = .210, n.s.) or
theta (r = -.123, n.s.) amplitudes, nor relative alpha (r = -.097, n.s.) or theta (r = .028, n.s.), T/A
ratio (r = .095, n.s.), nor relative (r = -.137, n.s.), or absolute T+A ratio (r = -.092, n.s.), meaning
NFT sessions being held during a time of worst or preferred learning was not associated with a
significant improvement in regulation of the parameters in the EG, nor was it associated
significantly with any of the AD-ACL pre–post session difference scores, except for a difference
in energy (r = .412, p <.10) and tension (r = -.335, p <.10) which were approaching significance.
In other words, participants who had NFT sessions during their “worst time for learning” (which
can be seen as a measure of tiredness, inattentiveness, and exhaustion) reported less energy and
more tension throughout the NFT sessions in comparison to participants who had their NFT
sessions scheduled during a neutral or best time for learning. The only other item preferred
103
learning time correlated with significantly was Rotter’s Locus of Control scale (r = -.478, p
<.05); worst time of learning highly correlated with participants who had a more internal locus of
control (higher LOC score), which may be a spurious correlation.
4.6 Treatment Satisfaction and Self-Efficacy (SETS, LOC, Belief in Treatment)
The SETS negative and positive expectations of treatment analyses were performed with
a 2x2 ANOVA. A significant decrease in negative treatment expectations was observed between
the beginning of the NFT trial and the end of the trial (pre-trial (M = 2.047, SD = 16.626); post-
trial (M = 1.419, SD = .937); F(1, 25) = 5.809, p = .024, partial η2 = .189) with a large effect size.
The TIME*GROUP interaction exhibited no statistically significant difference between the
groups for both negative (F(1, 25) = 0.001, p = .993, partial η2 = .001; n.s.) and positive (F(1, 25)
= 1.090, p = .306, partial η2 = .042; n.s.) treatment expectations between pre- and post-trial.
Change in treatment expectancy as a measure of treatment satisfaction shows that both, EG and
CG participants, who had moderately high treatment expectancy (4.6 /7.0) at the beginning of the
trial (EG: M = 4.714, SD = 1.280; CG: M = 4.501, SD = 1.280) experienced no significant drop
in treatment expectations over the course of the treatment.
The Rotter Locus of Control Scale was administered at the end of the NFT trial to gauge
the participants’ self-efficacy. On average, study participants had an above the mean LOC score
(EG: M = 12.429, SD = 3.502; CG: M = 12.308, SD = 3.172). In fact, only three or the 27
participants had a score below the mean for women of the Rotter scale (M = 8.42 = 58th
percentile; SD = 4.06) and 11 participants scored at least one SD higher than the mean ( > 12.48
= 88th percentile). A low score represents an internal locus of control. Hence, participants of this
study tended to have an external locus of control on average, which means that they tended to
attribute successes or failures to external circumstances rather than their own efforts. However,
104
the standardization scores for the LOC have not been updated in more than fifty years and results
need to be interpreted with caution. A one-way ANOVA was performed to investigate if
differences in means could be detected between participants from the EG in comparison to
members of the CG. No significant differences between the two groups were found (F(1, 25) =
0.009, p = .926; n.s.). Point-biserial correlations were performed between the LOC score and all
QEEG measures (e.g., Alpha and theta absolute and relative power and NFT measures (e.g.,
theta and alpha amplitudes and relative amplitudes /percent), as well as for the various anxiety
measures (BAI, STAI, and GAD) and no correlation was significant (see correlation matrix in
Appendix E).
Belief in EG participation is another variable closely aligned with treatment satisfaction;
19/27 participants (70.4%) believed that they were in the EG and were receiving an active
treatment (11/14 members of the EG (78.6%) and 8/13 members of the CG (61.5%). Conversely,
no belief in EG participation aligns with treatment dissatisfaction; 8/27 participants (29.6%)
believed that they were part of the placebo group (5/13 participants from the CG (38.5%) and
3/14 participants of the EG (21.4%). While differences in Belief in EG participation could be
observed between the EG and CG with more participants from the EG believing in EG
participation these differences were neither significantly associated with any of the QEEG and
NFT EEG-related parameters, nor with any of the anxiety measure differences or AD-ACL
measures.
A point-biserial correlation was performed for the Belief in EG participation. All
participants were asked at the end of the trial if they believed they had been part of the
experimental or control group. Belief in EG participation was significantly correlated with
participants reporting a change in thinking (r = .540, p < .01), change in feelings (r = .418,

105
p < .05), and change in behaviors (r = .459, p < .05) due to the NFT trial. It comes as no surprise
that participants who reported that they believed to be part of the EG reported change in
thinking, feelings, and behaviors significantly more often than participants who did not believe
that they had been part of the EG. Furthermore, Belief in EG participation was associated with
age (r = .451, p < .05), i.e., the older the participants were the more they believed that they had
been part of the EG, although no significant differences in the age distribution between EG and
CG had been observed after the initial randomization of participants.
4.7 Successful A+T Amplitude Learner Analysis
According to a position paper by Uryniak, Chan, Fedorov, et al. (2011) the main purpose
of a clinical trial is not only to demonstrate that a treatment effect is statistically significant but
more importantly that this effect reveals a clinically relevant improvement of the primary
outcome measure, i.e., a clinically relevant reduction in disease symptoms. A common way to
show that there is a significant clinical improvement is to dichotomize the continuous primary
outcome measure of a study into responders and non-responders and re-analyze the data;
statistically significant data is likely to achieve a larger effect size and the associated
improvement in effect size after re-analysis. One frequently used method is to define a clinically
relevant change from baseline in the primary outcome variable apriori; participants are
henceforth considered responders if they exceed this threshold. Some clinical societies and
regulatory boards even require this method (Lin, 2016; Uryiak et al., 2011). Furthermore, a
responder analysis is often used in a post-hoc analysis after statistical significance of the primary
outcome measure has been established; it is in fact recommended by the European Medicines
Agency (2002, as cited by Uryniak et al., 2011).
However, a responder analysis “cannot rescue otherwise disappointing results in the

106
primary variables” (Uryniak et al., 2011, p. 478). It is important to point out that responders in
the above discussed medical literature are defined as clinical responders, trial participants who
experience a significant improvement of reduction in illness symptoms. In NFT literature the
term “responder” is in some studies used interchangeably with the term “learner” or “regulator”.
In this study “responder” is understood as a participant who shows improvements of anxious
cognitive emotional and behavioral components of anxiety as well as a reduction in tension
(higher deactivation). In comparison, “learners” are those participants who significantly enhance
their A+T brain wave amplitudes at Pz.
Learner analyses are used in some NFT studies after the primary outcome measures were
not significant, for instance by median split (e.g., Studer et al., 2014). However, when a learner
threshold value is chosen post-hoc without a valid reason this might constitute a potentially
“inappropriate manipulation of the data” (Lin, 2016, p. 66). There seems to be no consensus of a
definition on what exactly constitutes a responder to treatment; definitions depend on the area of
disease and more careful research is needed to define a responder in NFT. Zuberer et al. (2015),
for instance, elucidate in their meta-analysis of ADHD-related NFT studies of how each of the
respective 15 research teams define the criterion of a learner differently regarding successful
regulation of brain activity. In general, three approaches are used. A “good performer” might be
defined by a predefined criterion, such percentage cut-off (where learners are classified as such if
they reached the learning goal in a predetermined percentage of sessions). Another approach is to
define participants as learners if the wave bands they trained were significantly improved in the
last NFT session in comparison to the first session or when they increased across all or most
sessions. The last type of approach was the median split which divides participants into halves
depending on the improvement on the training parameter which, in the case of uneven

107
distribution of learners and non-learners, leads to a mis-classification of participants.
Figure 4.3: Learning curve for single participant for relative A+T amplitude per minute (24 minutes) for ten NFT
sessions. The bold orange line represents the first session learning curve, the bold dark green line, the last / tenth session learning
curve. Left: Participant 019 of the EG is a learner: learning curves within and between sessions mostly improve from first to last
session. Right: Participant 011 of the EG is a non-learner; learning curves between first and last session remain flat.
One goal of the current study was to review commonly used methods of
operationalization and statistical analysis in NFT studies and find alternatives that might
potentially help with NFT data analysis but more importantly to start a conversation about
methodological considerations in this field. However, the current study revealed neither
traditional statistical analysis with ANOVAs nor growth curve modeling, significantly better
accounted for learning results in up-regulating alpha and theta for the EG than for the CG.
Consequently, it would be inappropriate to use the method of learner analysis for a study in
which general results are not significant. A learner (or responder) analysis, as explained above,
should only be used to make an already statistically significant trial result more clinically
significant by re-running the analysis with participants from the EG in comparison to the CG
who had a (sufficiently) positive response to the treatment. The learner analysis in the current
paper is included as a general example of how to define learners in NFT research, apart from the
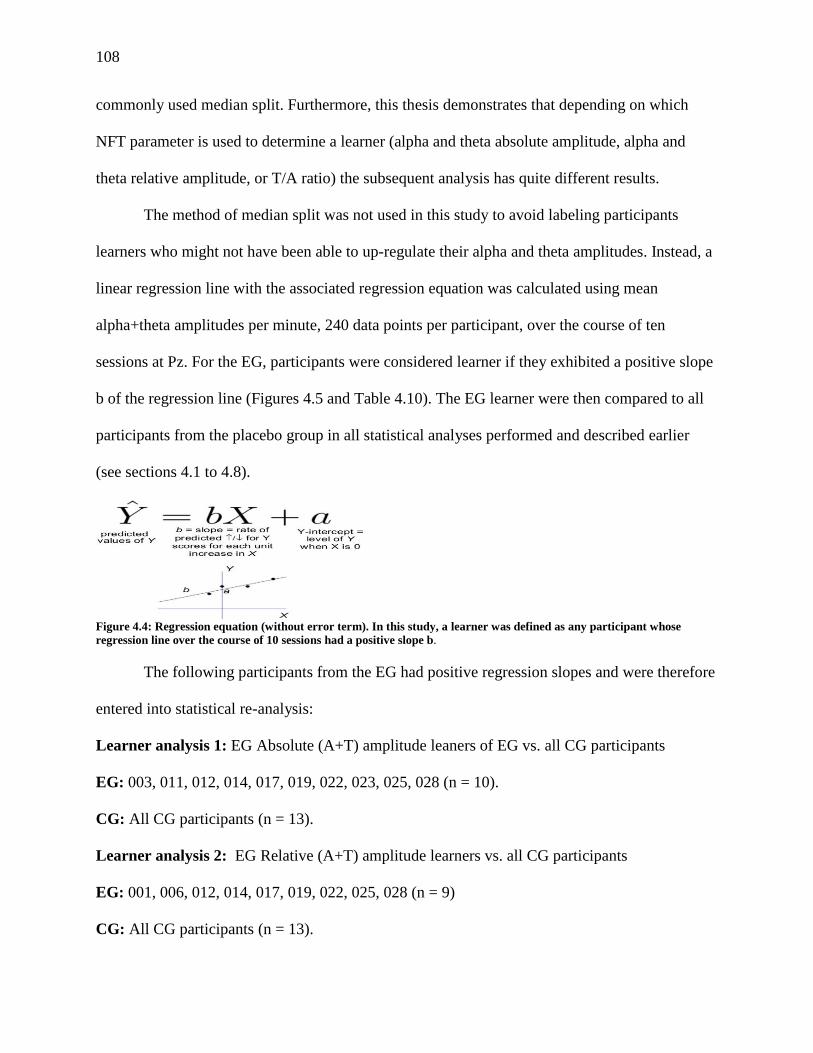
108
commonly used median split. Furthermore, this thesis demonstrates that depending on which
NFT parameter is used to determine a learner (alpha and theta absolute amplitude, alpha and
theta relative amplitude, or T/A ratio) the subsequent analysis has quite different results.
The method of median split was not used in this study to avoid labeling participants
learners who might not have been able to up-regulate their alpha and theta amplitudes. Instead, a
linear regression line with the associated regression equation was calculated using mean
alpha+theta amplitudes per minute, 240 data points per participant, over the course of ten
sessions at Pz. For the EG, participants were considered learner if they exhibited a positive slope
b of the regression line (Figures 4.5 and Table 4.10). The EG learner were then compared to all
participants from the placebo group in all statistical analyses performed and described earlier
(see sections 4.1 to 4.8).
Figure 4.4: Regression equation (without error term). In this study, a learner was defined as any participant whose
regression line over the course of 10 sessions had a positive slope b.
The following participants from the EG had positive regression slopes and were therefore
entered into statistical re-analysis:
Learner analysis 1: EG Absolute (A+T) amplitude leaners of EG vs. all CG participants
EG: 003, 011, 012, 014, 017, 019, 022, 023, 025, 028 (n = 10).
CG: All CG participants (n = 13).
Learner analysis 2: EG Relative (A+T) amplitude learners vs. all CG participants
EG: 001, 006, 012, 014, 017, 019, 022, 025, 028 (n = 9)
CG: All CG participants (n = 13).
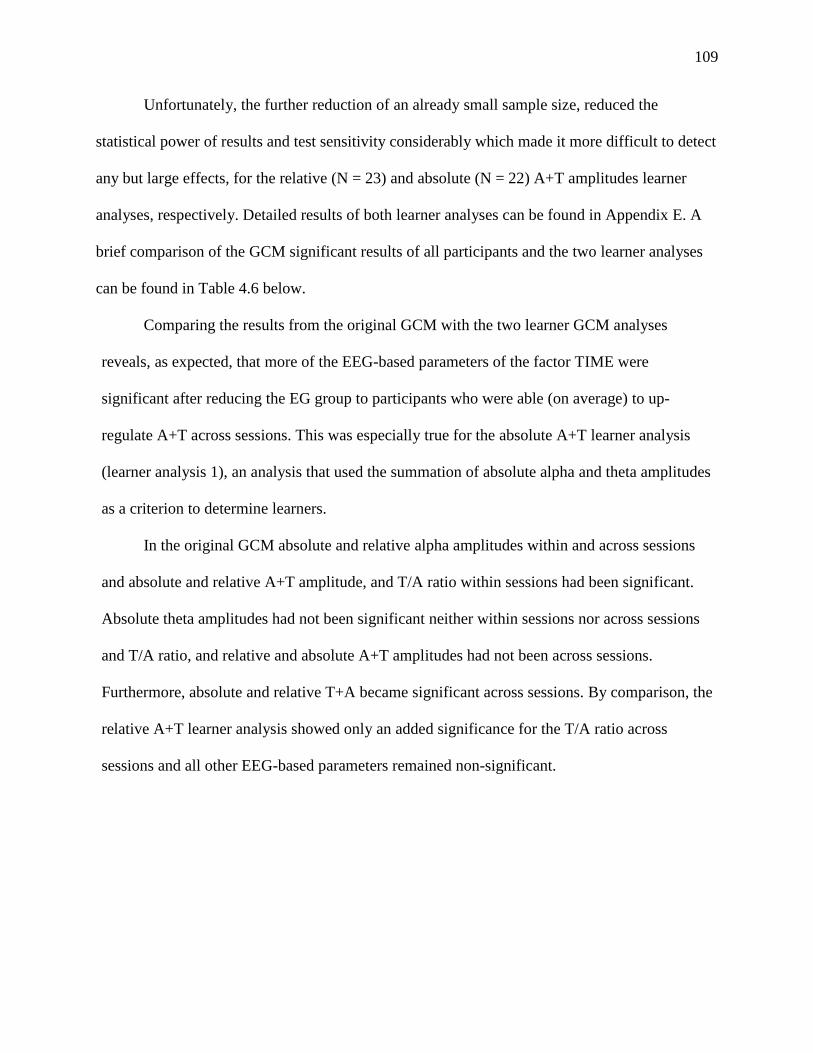
109
Unfortunately, the further reduction of an already small sample size, reduced the
statistical power of results and test sensitivity considerably which made it more difficult to detect
any but large effects, for the relative (N = 23) and absolute (N = 22) A+T amplitudes learner
analyses, respectively. Detailed results of both learner analyses can be found in Appendix E. A
brief comparison of the GCM significant results of all participants and the two learner analyses
can be found in Table 4.6 below.
Comparing the results from the original GCM with the two learner GCM analyses
reveals, as expected, that more of the EEG-based parameters of the factor TIME were
significant after reducing the EG group to participants who were able (on average) to up-
regulate A+T across sessions. This was especially true for the absolute A+T learner analysis
(learner analysis 1), an analysis that used the summation of absolute alpha and theta amplitudes
as a criterion to determine learners.
In the original GCM absolute and relative alpha amplitudes within and across sessions
and absolute and relative A+T amplitude, and T/A ratio within sessions had been significant.
Absolute theta amplitudes had not been significant neither within sessions nor across sessions
and T/A ratio, and relative and absolute A+T amplitudes had not been across sessions.
Furthermore, absolute and relative T+A became significant across sessions. By comparison, the
relative A+T learner analysis showed only an added significance for the T/A ratio across
sessions and all other EEG-based parameters remained non-significant.
110
Figure 4.5: Individual EG participants’ linear regression lines with associated individual regression equations for mean
alpha + relative theta amplitude in percent for the course of the ten NFT (240 data points per participant). Green thick line
represents the mean learning regression line across sessions. R2 represents how close each participants’ data points are to the
mean regression line.
In learner analysis 1, absolute theta amplitude neared significance within sessions ( =
0.031, SE = 0.017, p = .076), and absolute A+T amplitude ( = 0.249, SE = 0.086, p < .01), and
relative A+T amplitude ( = 0.210, SE = 0.072, p < .01**), became significant across sessions
in comparison to the original statistical analysis. In learner analysis 2, absolute A+T amplitude

111
( = -.009, SE = 0.003, p < .01), and T/A ratio ( = 0.210, SE = 0.072, p < .01), became
significant across sessions in comparison to the original statistical analysis.
Table 4.10: Results from GCM regression analyses from run (within session), trial (across sessions), and group (EG, CG).
112
Unexpectedly, all statistical results regarding the factor GROUP remained non-significant
in both learner analyses. In other words, the NFT protocol was not associated with a
significantly better regulation of alpha and theta up-regulation. One significant interaction effect
was observed in absolute A+T up-regulation ( = 0.347, SE = 0.148, p < .05), in comparison to
the original analysis (see section 4.3.1), which indicates that while there are no differences
overall between the EG and CG regarding up-regulation of theta and alpha there are significant
differences in how the up-regulation took place over the ten NFT sessions. This result relates
well to the 2x5 ANOVA performed in Section 4.3.1 which confirms the differences in learning
curves across NFT sessions.
113
5. Discussion
The primary objective of this study was to create a rigorous, placebo-controlled, clinical
trial with a (sub)clinical sample of variously aged adults for the NFT treatment of AD in order to
investigate if A/T NFT at Pz is an efficacious method for anxiety symptom reduction in women,
as shown by neurophysiological changes in the EEG, changes in NFT learning curves, and
changes in subjectively experienced anxiety symptoms. A secondary objective was to search for
potentially better analyses methods for NFT trials in general that would not limit the aggregate
amount of NFT EEG data to 2 to 5 time points, but, instead use GCM modeling to analyze
individual learning curves. A variety of parameters are used in A/T and alpha NFT protocols
(i.e., alpha and theta amplitudes, T/A ratio, relative alpha and theta values) to investigate how
diverse types of statistical analyses with varying study parameters may influence the outcome of
a study. The GCM analysis of each participant’s learning curve was then used to separate
learners and non-learners. Models different from linear regression, specifically quadratic and
cubic regression curves, were investigated as well. This type of analysis is, to the best of my
knowledge, a novel application of statistical methodology in the field of NFT research. The third
and last last objective of this study was to investigate cognitive variables involved in NFT, such
as treatment outcome expectancy, personal attribution styles, use, types, and efficacy of
cognitive strategies in NFT, which are rarely assessed in NFT trials. Also new to this
investigation into whether there is a significant correlation between NFT learning performance,
time of day the NFT sessions were held, and a participant’s best or worst time to learn.
The present study, to my knowledge, was the first single-blind trial to test the A/T NFT
protocol for trait anxiety in a clinical adult population with a placebo NFT control group, instead
of a waitlist CG, other treatment modality CG (e.g., anxiolytics, EMG, meditation), or fake NFT
114
EG. Moreover, this trial was one of the first studies to use growth curve modeling for NFT data
analysis and to define individual learners by positive regression curve slope.
5.1 Primary Outcomes (H 1- H 2)
5.1.1. Up-training of alpha and theta amplitudes within session (H 1a) and across
sessions (H 1b).
Hypothesis 1 (H 1a and H 1b): A ten-session NFT protocol of up-training alpha (8-11
Hz) and theta (5-7.5 Hz) frequency bands at Pz will significantly elevate mean absolute and
relative theta and alpha amplitudes and absolute and relative theta + alpha (T+A) amplitudes
within (H 1a) and across (H 1b) NFT sessions of the NFT. These measures will not change
significantly in the placebo group.
H 1 was only partially confirmed. Contrary to expectations, both, A/T NFT training at Pz
(EG) and active placebo B u/d NFT training improved the participants’ absolute and relative
alpha amplitudes, absolute and relative T+A measures, and absolute theta amplitude neared
significance within sessions (while absolute alpha, theta and T+A amplitudes did not change
substantially). Across sessions only absolute and relative alpha amplitudes increased (and not
absolute and relative theta, absolute and relative T+A, nor the T/A ratio), i.e., there was no
significant difference on average between the EG and CG when increasing the alpha- and theta-
related parameters. Significant learning curves for the relative values within sessions were found
for the EG as well as the CG, i.e., while there was a trend for the EG to have steeper learning
curves there was no significant difference between the EG and CG in increasing the alpha and
theta related parameters.
This result is especially surprising because the CG protocol neither included feedback
within the theta or in the alpha frequency range. Nor did it include feedback from the low beta
115
frequencies below 15 Hz that might have been upper alpha peak frequency in some of the
younger participants. A fair amount of research indicates large interindividual differences in
alpha peak frequency (APF) depending on biological trait and age (Niedermeyer & Lopes da
Silva, 1999; Klimesch, 1999) and intraindividual differences depending on tasks (Klimesch,
1999; Mierau, Klimesch, and Lefebvre, 2017) with younger age routinely being associated with
higher individual APF.
After the GCM a re-analysis of the data regarding time across NFT sessions (H 1b) with
the traditional repeated measures 2x5 ANOVA was performed because this had been the method
of choice for all previous NFT studies investigating ADs with post-hoc one-way ANOVAs for
significant results. In the analyses for the current study EEG training data from only five data
points per participant are used by aggregating data for each EEG parameter from two NFT
sessions into one measurement point: sessions 1 + 2 (measurement 1), sessions 3 + 4 (2),
sessions 5 + 6 (3), sessions 7 + 8 (4), and sessions 9 + 10 (5). Alpha amplitude, relative alpha
amplitude, and relative T+A amplitude all increased significantly between most measurement
points with large effect sizes for absolute and relative alpha amplitude and medium effect sizes
for relative T+A. Absolute T+A amplitude was nearing significance (p = .086; medium effect
size) but absolute and relative theta amplitude did not change significantly over the course of the
NFT sessions. Furthermore, a significant interaction effect was found for absolute and relative
theta amplitude (medium effect size) which made further interpretation of time effects
ambiguous. Post-hoc one-way ANOVAs were only conducted for absolute and relative alpha
amplitude, T/A ratio, and relative T+A to find out which pairs of time comparisons were
significant. A significant increase of relative alpha amplitude in three of four measurement
comparisons (measurements 1 and 2, 1 and 3, 1 and 4) and the last comparison nearing
116
significance (measurement 1 and 5) was observed. Absolute alpha amplitude increased in two of
the four comparisons (measurements 1 and 3, 1 and 4). A+T across two of the four comparisons
(measurements 1 and 3, 1 and 4, and 1 and 5 nearing significance). It also showed an interaction
effect between TIME and GROUP for absolute and relative theta that had not been observed in
the GCM, i.e., no overall difference between the EG and CG regarding changes in absolute and
relative theta over the course of the ten-session NFT trial was observed but the time course of
theta changes was significantly different between EG and CG (see Appendix E). Generally,
interaction effects are either due to different baseline values of the groups or due to a genuine
effect of the treatment. Initial t-tests between EG and CG of absolute and relative alpha, theta,
and T+A, as well as for T/A ratio proved no significant differences at baseline (4.3.2) leaving a
treatment effect as a possibility, but as this result could not be confirmed by the more detailed
GCM analysis, skewed artificial significance due to data point aggregation may be assumed.
Consequently, GCM may be the approach of choice to keep spurious results to a minimum.
Another possible explanation for the difference in time course of the change between EG and CG
is that this might have been due to successive sessions of beta up-and down-training. However,
aggregating data of subsequent sessions averages the results of one beta up-training session with
the results of one beta-down-training session.
Reducing the EG group to the 10 out of 14 participants who were able to (on average) up-
regulate A+T across sessions (H 1b) showed a more nuanced picture. In this learner analysis, in
comparison to the previous analysis which had included all EG participants, revealed that
absolute theta amplitude neared significance within sessions, and that on average, absolute and
relative alpha increased significantly over the course of the ten NFT sessions and so did the
summation of relative and absolute alpha and theta amplitudes. Unexpectedly, all statistical
117
results regarding the factor GROUP remained non-significant in both learner analyses: i.e., the
A/T-NFT protocol was not associated with a significant better regulation of alpha and theta.
The A+T learner analysis showed a significant interaction effect in absolute A+T up-
regulation in comparison to the original analysis which indicates that while there are no
differences overall between the EG and CG regarding up-regulation of A+T there are significant
differences in how the up-regulation took place over the course of the ten NFT sessions. This
result is similar to those of the 2x5 ANOVA performed in Section 4.3.1 which confirm the
differences in learning curves across NFT sessions. As explained in 5.1.2, the difference in the
course of the changes between EG and CG for the aggregation of two successive sessions of beta
up-and down-training for the 2x5 ANOVA should have eradicated any gains, i.e., the results of a
session of uptrained beta which may have been associated uptraining of interdependent alpha
waves should have been negated by downtraining beta and interdependent beta in the next
session. Unfortunately, the GCM analysis models the 60 second aggregations of all 240 time
points over the ten NFT sessions (24 minutes for 10 sessions) and as such does not offer CG and
EG means per session to be compared for significant differences between EG and CG per
session.
As the 30-second baseline reading was confounded with the first minute of NFT training,
it could not be used for further analysis. While the missing baseline values were of concern to
pre- post-difference measurements of alpha and theta analyzed by ANOVAs, it had negligible
effect on the statistics as GCM is a continuous model of alpha and theta band changes within and
across all sessions.
Similar results to the current study were found by Egner et al. (2002 and 2003) for
healthy adults, although Egner and colleagues (2002) reported that EG and CG differed in T/A
118
ratio increase within sessions but not across sessions. Unfortunately, in a few studies which used
active placebo NFT in the CG, the EEG amplitudes of participants from the CG were not
recorded nor included in the later analysis (e.g., Raymond et al., 2005). These analyses did not
take into consideration the effect that mock NFT may have on brain wave modulation and
calculated only whether there was a significant improvement of alpha and theta amplitudes. This
method is rather questionable, particularly considering the results of my study: if I had only
analyzed the EG’s improvement in A/T regulation within and across sessions the result would
have been that participants learn to successfully up-regulate their absolute and relative alpha, and
T/A ratio within and across sessions and theta brain waves within sessions with a clinically
relevant large effect size. Yet, comparing the NFT results to a placebo NFT group shows that
although the EG is better at up-regulating alpha and theta than the CG, but not significantly.
Consequently, it is possible that the observed NFT effects are non-specific in nature rather than
the product of a specific NFT protocol.
The only way to assure that there is a causal relationship between the particular NFT
protocol and participants’ modulation of brain waves is to use an active placebo NFT protocol
for the CG, which is as similar as possible in all parameters (i.e., reward frequency, reward
sounds and visuals, length of each training session and number of sessions) to the EG protocol.
Furthermore, the frequency bands to be trained in the CG cannot interfere with the target
frequency bands of the EG. There is a lack of such study protocols in NFT for AD. Of course,
there are some experimental studies that report significant changes in EEG parameters for
individuals with AD throughout the NFT trial (Dadashi et al., 2012; Garrett & Silver, 1978;
Glueck & Strobel, 1975; Lu et al., 2017) but all are questionable because they the lack the kind
of analysis described above. The same can be said for studies regarding anxiety in healthy

119
participants (mostly university students), such as Chisholm (1977), Eismont et al. (2011),
Gruzelier et al. (2014a, b), and Sittenfeld (1976).
Some critics assert that NFT active placebo CG are not necessary or cannot be
successfully performed (Hammond, 2011 b), partially due to changes in some frequency bands in
the control condition that may lead to other unintended consequences for the frequency bands
trained in the experimental condition. Ros and colleagues (2013), for instance, observed in an
fMRI study that used an alpha amplitude downregulation NFT protocol that the “within-subject
amplitude correlations between theta, alpha, and beta bands during NFB were consistently
positive within a statistically significant range of 0.5 to 0.7 suggesting a broader effect of NFB
training on [non-trained] flanking frequency bands” (Ros et al., 2013, p. 328). More research is
needed to understand what kind and how much of an effect specific NFT protocols may have on
neighboring frequency bands. Moreover, Rogala (2016) states that there might be differences in
the trainability of certain frequencies, as was evident in research with macaque monkeys
(Carmina, 2003).
The most plausible explanation for the surprising result regarding H1 is that uptraining
beta and upper beta in NFT may lead to alpha frequency uptraining due to interdependency of
alpha and beta bands, a concept that was not commonly known during the design and study
protocol phase of this study (2015-2016). Only few researchers in the NFT realm, such as Ros et
al. (2013), acknowledged that uptraining of certain beta bins may possibly lead to an increase in
certain alpha bins. But not until very recently in a study by Jurewicz, Paluch, Kublik, Rogala,
Mikicin, and Wróbel (2018) was this issue in my study were better at up-regulating alpha
amplitudes within sessions they were also nearing significance of up-regulate theta within
sessions. Furthermore, Rogala et al. (2016) report that especially changes in upper alpha
120
amplitudes were observed when subjects were told they were in the alpha inducing group. The
individual learning curves (Figure 4.5) show that ten of fourteen participants in the EG learned
how to increase their A+T amplitudes which corresponds to a 71.43% success rate. However,
looking at individual alpha and theta amplitudes one of the ten successful A+T regulator actually
did not upregulate their theta amplitude but instead had a real large increase in alpha, so only
nine out of fourteen participants were able to increase their theta and alpha amplitudes across the
NFT sessions (64.29%). Yet, while the EG’s amplitudes improved generally more, no
statistically significant difference was found between the EG and the CG.
In addition, the effectiveness of both groups heightening T and A amplitude within a
session could be caused by participants’ fatigue which lead to decreased beta activity and
increased alpha, theta, and delta activity rather than by learning. This explains individual
learning curves in some sessions for some participants. However, the majority of women did not
follow this pattern but significantly increased their absolute and relative alpha and T+A
amplitudes across sessions, which would be unlikely if little or no learning took place within
sessions. Tiredness could definitely be a contributing factor to why the CG up-regulated their
absolute and relative alpha, and T+A amplitudes with no active feedback since alpha and
especially theta amplitudes increase when people get tired (see section 1 2.1). While tiredness
was qualitatively tracked with the NFT Session Coding List, the AD-ACL pre-and post-session
questionnaire, and participants’ best and worst time of day for learning, it would have been
helpful to ask participants directly before each NFT session how many hours they slept the night
before and how sleepy they currently felt.
The decrease in energy over the course of a NFT session may be explained by mental
fatigue, especially in conjunction with specific changes in alpha and theta band power in the

121
mid-parietal region. Mental fatigue in this context can be defined as subjective feelings of low
energy, motivation, and drowsiness with additional difficulties of difficulties of performing
continuous mental tasks (Trejo, Kubitz, Rosipal, Kochavi, & Montgomery, 2015). Trejo et al.
(2015) analyzed spontaneous EEG power spectrum densities (PSD; obtained by decomposing an
EEG time series into a voltage/frequency graph via FFT (Niedermeyer & Lopes da Silva, 1999)
of continuous simple mental arithmetic tasks of 22 healthy volunteers until they felt fatigued.
They investigated the occurrence of fatigue and its EEG correlates, as well as subjectively
experienced moods and energy levels assessed by the AD-ACL and other measures. The authors
discovered that in as little as 15 - 30 minutes of continuous performance mental fatigue occurred
and “produced decreased general activation (i.e., self-reported energy) and preparatory arousal
(i.e., self-reported calmness) and increased general deactivation (i.e., self-reported tiredness) but
did not significantly influence other moods” (Trejo et al., 2015; p. 582). Lengthening response
times and decreasing alertness were also reported but but did not lead to changes in the response
accuracy of the mental tasks.
The NFT sessions in the current study also involved a continuous rather complex mental
task of learning to regulate EEG frequencies via feedback may be comparable to the Trejo study
and shows that even a relatively short amount of time, such as the 25-minutes of the NFT session
can cause mental fatigue. But even more interesting are the changes in PSD Trejo and colleagues
(2015) found associated with mental fatigue. A significant and distinctive increase of alpha+theta
PSD across subjects during fatigued states was observed, especially in frontal midline theta (Fz)
and midline parietal (Pz) alpha activity, which increased as a function of time on task, without
changes in other frequency bands. These results had previously been observed in extended
performances of air traffic controllers (Krishnan, Dasari, & Ding, 2014; as quoted in Trejo et al.,

122
2015). Trejo and colleagues relate these decreases in performance and increases in alpha activity
during mental fatigue to Pfurtscheller’s (1999) model how coherent (increase in) alpha band
activity likely indicates decreased cognitive processing of the neuronal populations underlying
the area (Lim et al., 2010; as quoted in Trejo et al., 2015). Furthermore, Trejo asserts “spatially
diffuse theta rhythms associated with sleepiness, spatially focused, theta rhythms associated with
cognitive effort and WM (working memory) load, lower alpha rhythms (8 - 10 Hz) associated
with relaxed wakefulness, and focused higher alpha rhythm (10 - 12 Hz) suppression associated
with spatial and non-spatial shifts of attention.” (Trejo et al., 2015; p. 585). In general, these
research results seem to point to mental fatigue being associated with a shift toward the DMN
which is accompanied by a low alpha idling mode (8-10 Hz) and lowered activities in the
executive and attention networks. Both, EG and CG experienced mental fatigue and an
upregulation of theta and especially alpha at Pz as each NFT progressed, as evidenced by the
AD-ACL changes between beginning and end of the NFT session. Consequently, it is not clear if
any learning had actually taken place, especially in light of the fact that the CG upregulated A+T
without being trained for it, or if upregulating A+T is the result of mental fatigue alone.
The EG and CG being able to uptrain relative and absolute alpha within and across
sessions could be a sign that A/T NFT is an elaborate placebo and that sitting in front of a
computer in a relaxed position while attempting to not think of anything in a quiet room with
dim lighting has the unspecific effect causing alpha waves and even theta waves to increase. This
might be especially true when one looks at the participants’ busy lives trying to balance work,
family, and study. NFT sessions provide a refuge from the noisy stressful environment outside
the lab.
123
Unfortunately, due to financial limitations and because this trial was essentially a one-
researcher and time-limited operation the scheduling of at least one or several follow-up
appointments to re-assess QEEG and self-report anxiety scales and qualitative questions about
changes in thinking, feeling and behavior was not feasible. Additional follow-up appointments
would have allowed to analyze if and which long-term changes resulted after the NFT concludes,
as well as if any differences between the EG and CG could be observed. Especially in NFT
studies, which had used transfer trials, participants in the area of ADHD and epilepsy maintained
the gains through the NFT in follow-up appointments (Strehl et al., 2014; Gevensleben et al.,
2009 and 2010; Leins et al., 2007). Furthermore, Engelbregt (2016) studied the short- and long-
term effects of frontal beta NFT on healthy adults by re-testing all subjects 36 months after the
end of the NFT and showed that the gained increase in beta oscillations was maintained for the
EG even after three years although the cognitive improvement originally observed right after the
completion of the NFT were no longer observed.
Lastly, as discussed in chapter 1.3.1, EG and CG were both trained at the Pz-LE locations
which (beside Cz-LE) were the most used often used electrode placements in A/T NFT for ADs.
The Pz electrode placement corresponds to the caudal superior parietal lobule which is connected
with enhanced hippocampal activity which may be especially beneficial for enhanced memory
consolidation and retrieval and activation of self-related functions that can be used to achieve a
relaxed calmness, and down-regulation of the HPA axis according to Gruzelier et al. (2009). Yet,
Olejarczyk, Bogucki, and Sobieszek (2017) in their study on the underlying mechanisms of split
alpha peaks found that, depending on the choice of reference electrodes, alpha rhythm generators
were not just found at the regular occipital (O1 and O2) and frontal locations but were also found
at Pz (10 Hz) in some healthy participants. While Olejarczyk and colleagues were more
124
interested in finding out how alpha generators outside the occipital and frontal areas may
influence the creation of overlapping double alpha peaks (split alpha) due to frequency
differences between two alpha generator locations, the result of their study may offer another
possible explanation why in the current study alpha amplitudes were raised even in the CG that
did not uptrain alpha. If Olejarczyk and collegues’ (2017) results are replicable in a majority of
individuals it may mean that independent of the NFT protocol, as long as the active electrode is
placed at Pz rising alpha amplitudes are to be expected in cases of heightened attention which
enhances alpha rhythm production (Klimesch, 1999). Thus, in future research it may be
beneficial to consider different electrode locations, especially for the CG.
5.1.2 Reduction of trait and other anxiety measures (H 2).
Hypothesis 2 (H 2): A ten-session NFT protocol of up-training alpha (8-11 Hz) and theta
(5-7.5 Hz) frequency bands at Pz will significantly lower the subjective experience of trait
anxiety. These measures will not change significantly in the placebo group.
H 2 was partially confirmed. Contrary to expectations, both, A/T NFT training at Pz (EG)
and active placebo B u/d NFT training (CG) led to a significant reduction in anxiety in all self-
report anxiety scales anxiety (STAI-T and STAI-S, BAI, and GAD-7), including trait with large
effect size. Yet a trend was observed that the A/T NFT protocol reduced anxiety measures more
than the active placebo protocol of the CG.
The most plausible explanation for EG and CG showing significantly decreased scores in
trait anxiety as well as in all other anxiety measurements is that both groups increased relative
A+T amplitudes. Increasing alpha and theta oscillations targets the ANS indirectly and
potentially leads to relaxed calmness and reduced anxiety symptoms (see chapter 1.1.4).
Predominant theta oscillations may indicate internal orientation and increase drowsiness among
125
others (Horschig et al., 2014) whereas dominant alpha waves are associated with relaxed
wakefulness and reduction of simultaneous processes that are unnecessary for a present task via
increasing the signal-to-noise ratio (Klimesch et al., 2012).
Furthermore, this study had an active placebo group which made sure that all parameters
were exactly the same for CG and EG except for the frequency bins trained. Consequently, a
placebo effect may have been observed that caused both groups to feel less anxious, as
elaborated above. Participants developed relationships with the experimenter and NFT
technicians which most certainly influenced the individual’s general level of comfortability,
trust, motivation, and level of focus on the NFT treatment. This may be especially relevant for
research with individuals with GAD and SAD as they often are uncomforTable with social
situations. Also, having 45 minutes twice a week for ten sessions in a quiet pleasant room where
participants are welcomed and receive undivided attention by the NFT trainer from the often
busy often stressful lives trying to balance work, family, and study may serve as refuge and
lessen anxiety.
A possible explanation of the results is offered by social psychologist Leon Festinger’s
theory of cognitive dissonance (Festinger, 1962). Festinger postulated that having conflicting
cognitions cause an aversive arousal, the so-called dissonance, which a person attempts to reduce
by choosing one of the inconsistent cognitions and devaluing and rejecting the other. Redelmeyer
and Dickinson (2011) apply Festinger’s theory to the medical field by hypothesizing that when
patients choose and endure a lengthy and /or unpleasant medical procedure they may reduce their
dissonance by exaggerating the benefits of the treatment and downplay the negative parts of the
procedure. Similarly, to participate in a ten session NFT clinical trial, with associated EEG
sessions, and a multitude of self-report measures constitutes a lengthy time commitment,
126
especially for working women. Enhancing the positive effects of the NFT and downplay negative
parts of the trial may be the result, specifically thoughts that such lengthy time investment might
not have led to the reduction in anxiety symptoms that participants had hoped for.
In addition, the participants’ reduced self-perceived anxiety scores may certainly have
been influenced by the expectation of treatment outcome and by a person’s belief as to how
much they can influence the outcomes of events in general. This might be particularly true for
treatments involving technology that is perceived as cutting edge (Beier; 1999 and 2004)
The studies of Bhat et al. (2012), Garrett & Silver (1978), and Rice et al. (1993) were the
only three that had an active CG; Bhat compared NFT to pharmacological treatment, whereas
Garrett & Silver (1978) and Rice used a semi-active control as they compared alpha NFT and
frontal EMG-Feedback. In contrast, Agnihotri et al. (2007), Dadashi et al. (2015), and Vanathy et
al. (1988) used wait-list participants. Only Lu et al. (2017) reported that even though an active
treatment of anxiolytics was used for the CG the EG that received A/T NFT decreased anxiety
symptoms significantly more than the CG. However, the sample size of this study was very small
(N = 18).
Another reason for the current study not significantly differentiating between EG and CG
regarding the reduction in self-perceived anxiety may be the small sample size in this study (N =
27) as a larger sample size would have been more sensitive to differences between groups.
However, Lu (2017; EG: n = 10, CG: n = 8), Faridnia (2012; EG: n = 10, CG: n = 10), and
Vanathy (1998; EG 1: n = 6, EG 2: n = 6, CG: n = 8) all had even smaller sample sizes and were
still able to show significant differences in reduction of anxiety between EG and CG. Other
studies found no significant difference between EG and CG reduction of anxiety for EG and CG
after NFT: Bhat et al. (2012) with a larger sample of participants (N = 100) who had been

127
diagnosed with anxiety and depressive disorders, Rice et al. (1993) for participants with GAD,
and Watson and Herder (1980) for psychiatric patients with multiple Disorders. While Bhat et al.
(2012) used standard anxiolytic treatment as CG, Watson and Herder (1980) used a sham NFT,
and Rice et al. (1993) used active opposite NFT protocols. Raymond et al. (2005) came to the
same conclusion in a study with healthy adults. In contrast, other RCTs reported that the EG had
a significantly larger drop in self-reported anxiety scores than the CG, such as Lu et al. (2017),
Faridnia et al. (2012), Garrett and Silver (1978), and Vanathy et al. (1998), for participants with
PD, athletic performance anxiety, test anxiety, and GAD, respectively. None of the above studies
used an active placebo group; one used mock NFT, while the others used wait list, no
intervention, or treatment as usual (anxiolytics).
Most NFT studies discovered significantly decreased anxiety scores on self-report tests
for the EG for adults with AD (Agnihotri et al., 2007; Dadashi et al., 2015; Faridnia et al., 2012;
Lu et al., 2017; Vanathy et al., 1998) and for a non-clinical population (Eismont et al, 2011; and
Plotkin & Rice, 1981). Yet, only Bhat et al., (2012), Garrett & Silver (1978), and Rice et al.,
(1993) reported decreased anxiety symptoms for both, the EG and CG, as was the result in this
study.
5.2 Other Treatment Effects (H 3– H 8)
5.2.1 Activation and deactivation within session (H 3a) and across sessions (H 3b).
Hypothesis 3 (H 3a and 3b): The treatment group will feel significantly more deactivated
(as assessed by Thayer’s AD-ACL check list) within a NFT session (H 3a) and will subjectively
become significantly more deactivated across NFT sessions (H 3b) while the placebo group will
not.
H 3a was partially confirmed. A repeated measure 2x2 ANOVAs to test pre-and post-

128
NFT session differences in AD-ACL scores revealed that general activation (consisting of sub-
scales energy and tension) decreased significantly between the beginning and the end of a NFT
session (large effect size) and decreased significantly more for the CG than the EG (large effect
size). General deactivation (composed of sub-scales calmness and tiredness) increased for both,
EG and CG, significantly between the beginning and the end of a NFT session (large effect size)
but no significant differences between EG and CG were observed. An analysis of the four AD-
ACL sub-scales showed that in both groups, EG and CG, participants’ energy and tension
decreased significantly between the beginning and the end of a NFT session (large effect sizes)
and their calmness and tiredness increased significantly (large and medium effect sizes,
respectively). However, the EG experienced a significantly larger increase in calmness than the
CG (small effect size) and an almost significant larger decrease in energy (p = .093; small effect
size). No differences between groups were observed for the sub-scales energy and tension. Thus,
to summarize the results, participants in EG and CG experienced significant changes in the
activation and deactivation scales and all four sub-scales of the AD-ACL pre-to post NFT
session. The CG additionally experienced a significantly larger decrease in general activation
than the EG and the EG felt a significantly larger decrease in energy and increase in calmness
than the CG.
H 3b was not confirmed. A 2x5 repeated measures ANOVA that aggregated two pre- and
post-session AD-ACL difference scores into one measurement point: sessions 1 + 2
(measurement 1), sessions 3 + 4 (2), sessions 5 + 6 (3), sessions 7 + 8 (4), and sessions 9 + 10
(5) were performed. Differences between the EG and CG were detected for the activation scale
where results approached significance with the CG being less activated than the EG (p = .073,
medium effect size), i.e., across sessions the CG became more deactivated than the EG. No
129
significant changes across the five time-point comparisons were observed for the AD-ACL
scales activation and deactivation and the individual sub-scales calmness, tiredness, tension, and
energy. To summarize the results, neither EG nor CG experienced any significant changes in any
of the scales and sub-scales of the of AD-ACL across sessions, but the CG was almost more
deactivated than the EG across sessions.
The GCM confirmed the results from the 2x5 ANOVAs of AD-ACL scales and sub-
scales. However, an interaction effect between factors TIME and GROUP was detected in this
scale which suggests a difference in patterns of activation across sessions and makes an
interpretation of the GROUP factor difficult. Visually inspecting Figure 4.5 elucidates that while
EG and CG have relatively similar difference scores in the activation scale in the first two
sessions of the NFT and in the last two sessions in the remaining six sessions members of the CG
group are far less activated than in beginning or end of the ten NFT sessions whereas EG group
members are more activated in the remaining six sessions.
The results of the current trial were not surprising as they had been observed in a number
of other studies regarding within session change (H 3a), such as by Egner et al. (2002; A/T NFT
study) and by Gruzelier et al. (2014; SMR study) who showed that activation (as measured by
the AD-ACL) decreased significantly between the beginning and the end of a NFT session and
deactivation increased significantly although not differentiated analyses of the sub-scales were
performed, which in the current study showed differences between EG and CG. Thus, no
comparison to other studies regarding these additional parameters were possible. Additionally,
the current study analyzed pre-and post- AD ADCL difference scores across sessions in which
no significant changes over the course of the 10 sessions were observed and neither were group
differences (although a reduction of activation in the CG approached significance). None of the
130
reviewed NFT studies had performed an across sessions statistical analysis of the AD-ACL
scores. NFT studies in the realm of anxiety and emotion regulation that had utilized a mood and
energy scale comparable to the AD-ACL were also reviewed, such as Raymond et al. (2005) and
Chow et al. (2017), who had used the Profile of Mood States (POMS). The POMS has sub-scales
for tension, depression, anger, vigor, fatigue, and confusion (McNair, Lorr, and Droppleman,
1971) is very similar to the AD-ACL. The tension, vigor, and fatigue sub-scales correspond to
some degree with the tense, energy, and tired sub-scales of the AD-ACL, respectively. But in
these studies no across sessions comparisons had been performed, either.
As described in chapter 5.1.1, the decrease in activation over the course of a NFT session
may be explained by mental fatigue, Trejo et al. (2015) found that already 15 - 30 minutes of
continuous performance, such as in a NFT session, could cause mental fatigue in a participant
associated with decreased energy and increased calmness and tiredness as measured by the AD-
ACL. Especially the increase of alpha+theta amplitudes associated with mental fatigue serve as a
likely explanation why both EG and CG experienced a significant reduction in general activation
and a significant increase in general deactivation over the course of the NFT.
However, why the CG experienced significantly higher decrease in general activation than
the EG over the course of a NFT session may not be explained by the mental fatigue model and
remains unclear. Perhaps, not being able to continuously learn a protocol over the course of the
NFT sessions but subsequent up-and down-training of beta and high beta is frustrating to
participants, causes tension, and questions their self-efficacy which in turn may lead to disen-
gagement from any kind of conscious techniques in trying to regulate their brain oscillations
which reduces tension more than the continuous reinforcement of the same oscillation bands in
the EG. Clearly, more research in this area is needed.
131
Furthermore, the EG showed a significantly larger increase in calmness between the
beginning and the end of a NFT session which could be explained by the intended A/T NFT
working as intended, as enhanced A+T amplitudes were supposed to cause a decrease in
participants’ anxiety levels via increase in calmness (and decrease in general tension which the
protocol did not do in the current study).
Across NFT sessions none of the AD-ACL scales had reached significance which was
expected (if one assumes that an increase in A+T amplitudes is associated with a reduction in
general activation and an increase in general deactivation) because absolute and relative A+T did
not significantly increase across sessions, only absolute and relative alpha amplitudes did.
5.2.2 Correlations: NFT measures and activation / deactivation difference scores (H 4).
Hypothesis 4 (H 4): The treatment group will show significant increase in absolute and
relative theta and alpha amplitudes and absolute and relative theta + alpha (T+A) amplitudes
across sessions which will correlate with higher deactivation and lower activation scores of the
AD-ACL, while the placebo group will not.
H 4 was partially confirmed. The bivariate EG-CG correlation matrix revealed that higher
relative alpha and relative T+A amplitudes, signaling more learning between sessions 1+2 and
9+10, were significantly associated with higher deactivation scores on the AD-ACL for both, the
EG and the CG. The correlations were even more pronounced in the EG-only correlation matrix.
However, in contrast to H 3 higher absolute theta amplitudes and T/A ratio were associated with
lower deactivation scores, and negative correlations were even stronger in the EG-only matrix.
Analyzing the correlation between the AD-ACL sub-scales and NFT measures revealed a
more nuanced picture. In the bivariate EG-CG correlation matrix the only AD-ACL sub-scale
that showed a significant correlation with any of the NFT parameters was the significant negative
correlation of the calm scale with the absolute theta amplitude, i.e., the greater the absolute theta
132
amplitude increase between sessions 1 + 2 and 9 + 10 was, the less calm participants felt. This
was even more pronounced in the EG-only correlation matrix. However, analysis of the EG-only
correlation matrix revealed that AD-ACL tired, tense, and calm sub-scales significantly
correlated with relative alpha amplitudes. A larger increase of the relative alpha amplitude over
the course of the NFT study was associated with an increase of tiredness, a decrease in tenseness,
and an increase in calmness. In contrast, a reduction in tenseness was the only sub-scale
dimension that was significantly associated with higher absolute alpha amplitudes. These results
indicate that perceived energy and mood changes might not be so much associated with an
increase in absolute alpha amplitude but perhaps more with a reduction of other waves such as
beta and high beta waves which are traditionally associated with rumination, especially in GAD
and SAD (Section 1.2.1).
Furthermore, in comparison to the EG-CG correlation matrix, the tired sub-scale of the
EG-only matrix significantly correlated with relative T+A, and the calm sub-scale significantly
correlated with the T/A ratio; i.e., for the EG, an increase of the relative T+A amplitude over the
course of the NFT study was associated with an increase in tiredness, and an increase of the T/A
ratio was correlated with a reduction in calmness. Relative theta and relative T+A still were not
significantly associated with any of the AD-ACL scales or sub-scales.
While an increase in tiredness over the course of a session was reported in most of the
reviewed studies on A/T NFT (Table 1.4 a-c) no statistical analyses regarding differences in
tiredness throughout the trial, via AD-ACL, POMS, or other scales, have been analyzed in any of
the more than 40 studies. Particularly perplexing in our study is that increased tiredness was not
significantly correlated with relative T+A amplitudes in the EG and CG correlation matrix but
was significantly related in the EG-only matrix. Both CG and EG had a similar age distribution,

133
so age-related mental fatigue, associated with higher frontal midline theta for older people
(Arnau, Moeckel, Rinkenauer, & Wascher, 2017) could not have played a leading role.
Furthermore, an increase in mental task demand due to longer training periods, or
different time of day of training is often associated with mental fatigue and increase of frontal
midline theta for people regardless of age (Arnau et al., 2017); yet, in this study the duration of
the training remained constant across sessions, so did (for the most part) time of day of the
training, and most importantly, the NFT did not increase in difficulty but auditory and visual
rewards were given for relative increases in in theta (5-7.9 Hz) and alpha amplitude (8-11 Hz). It
would have been helpful to have further information on what dimensions of tiredness
participants felt; mental or physical fatigue and fatigue due to reduced motivation potentially
differ in origin and associated physiological parameters, with mental fatigue being directly
related to the concentration on the NFT task, whereas physical tiredness may be only tangentially
related to the task and more related to time of day, amount of sleep the night before, stress and
amount of work during the work day and other unspecific effects. Age, belief of being part of the
EG, and preferred learning time, factors that are routinely related to mental tiredness, did not
significantly correlate with the AD-ACL tired sub-scale, neither in the CG-EG nor for the EG-
only correlation matrices. Reduced motivation on the other hand is likely related to participants’
perceptions of not improving and associated frustration. In future studies the Multidimensional
Fatigue Inventory by Smets, Garssen, Bonke, & De Haes (1995) can further illuminate this issue.
Lastly, age, belief of being part of the EG, and preferred learning time, factors that are routinely
related to mental tiredness, did not significantly correlate with the AD-ACL tired sub-scale,
neither in the CG-EG nor for the EG-only correlation matrices.

134
5.2.3 Correlations: NFT measures and anxiety measures difference scores (H 5).
Hypothesis 5 (H 5): The treatment group will show a significant increase in absolute and
relative theta and alpha amplitudes and absolute and relative theta + alpha (T+A) amplitudes
across sessions which will correlate with a decrease in trait anxiety as measured by the STAI-T
inventory.
H 5 was partially confirmed. The STAI-T difference scores were significantly associated
with absolute T+A amplitude increases between the means of sessions 1 and 2 in comparison to
the mean of sessions 9 and 10; i.e., an increase in absolute T+A amplitudes was significantly
associated with a reduction in trait anxiety. However, as seen in section 5.1.1.2, no significant
differences between the EG and CG were observed and all other correlations between NFT EEG
parameters and the STAI-T (and STAI-S, BAI, and GAD-7) were not significant. The only RCT
study that reviewed NFT parameters and anxiety self-report scales and reported significant
correlations was Lu et al. (2017) for patients with PD. Here an improvement of alpha amplitude
from beginning to end of a twenty-session NFT trial was associated with a reduction in BAI
scores. However, Lu and colleagues did not use an active placebo NFT placebo group but
another active treatment modality, anxiolytic medication, as CG. Therefore, their results offer
limited comparability with the current study.
5.2.4 Physiological results: Pre–post differences in QEEG (H 6).
Hypothesis 6 (H 6): The treatment group will have a significant increase in absolute and
relative theta and alpha amplitudes and absolute and relative theta + alpha (T+A) amplitudes
on the mini-QEEG in the Pz region while the placebo control group will not.
H 6 was not confirmed. A 2x2 repeated-measures ANOVA with the within-subjects
factor TIME and factor GROUP was performed for theta and alpha absolute power, theta and

135
alpha relative power, theta / alpha ratio, and theta + alpha absolute and relative powers at Pz.
None of the variables showed a statistically significant change between pre- and post-treatment
and no differences between EG and CG could be observed for any of the variables, except for
A+T relative power with a small trend toward significance (p = .131) for time and group
interaction with the EG having higher combined relative alpha and relative theta amplitudes in
comparison to the CG with medium effect size.
Furthermore, the only two correlations that proved to be significant in the QEEG and
NFT pre-post-difference score correlation matrix (between session 1 + 2 and 9 + 10) were the
associations between NFT relative theta and QEEG absolute alpha difference scores and between
NFT relative theta and QEEG absolute T+A difference scores. The larger the mean post-trial
absolute QEEG theta amplitude was, the smaller was the change of absolute alpha and absolute
T+A amplitudes between sessions 1 + 2 and 9 + 10 (Table 4.6).
Observing non-significant results in QEEG recordings between pre-and post-treatment
seems to be common in NFT trials of anxiety DO (e.g., Vanathy et al., 1998; Dreis et al., 2015),
and especially the older reviewed RCT studies did not even use pre- and post-treatments QEEG
to measure improvements, such as Garrett & Silver (1978), Glueck & Strobel (1975), Peniston &
Kulkosky (1991), Egner et al. (2002 and 2003), Gruzelier et al. (2013 and 2014 a, b), and
Faridnia et al. (2012). Walker et al. (2009), Dadashi et al. (2015), Dekker et al. (2014), and
Dreis et al. (2015) analyzed pre-post EEG but only Dadashi reported significantly increased
alpha and theta amplitudes in the EEG recording post-trial in the occipital area for the EG.
However, Dadashi et al. (2015) used a waitlist group as their CG which is not able to take a
placebo effect into consideration which, as elucidated in chapter 1.3.2, contributes significantly
to people’s perception of treatment success, as well as to changes in physiological parameters for
136
participants of a CG. There was no significant correlation in the current study between
participants’ belief that they were part of the CG and any of the measured anxiety, NFT, pre-
post-QEEG measures. This means that the active placebo condition was associated with a large
placebo effect that would mitigate the treatment effect of the EG.
5.2.5 Qualitative Results: Behavioral and cognitive effects (H 7).
Hypothesis 7 (H 7): Self-perceived successful cognitive strategies to modulate brain
waves will be significantly correlated with learning as specified by the A/T NFT protocol.
H 7 was not confirmed. Neither absolute alpha, theta, and A+T amplitudes, nor relative
alpha, theta, and A+T, were significantly correlated in the correlation matrix that included only
the EG as well as the matrix that included both, EG and CG. However, the correlation matrix for
the EG did reveal a significant negative correlation between the T/A ratio and the use of mental
strategies; i.e., for the EG the use of mental strategies was associated with lower T/A ratios in
the difference scores of sessions 9+10 and 1+2 but was not correlated significantly with any of
the other NFT EEG parameters (increase of absolute and relative alpha, theta, and A +T).
To date, none of the NFT studies for AD has assessed participants’ use and type of
cognitive strategies and their relation to learning of the NFT protocol. A review of NFT studies
regarding other disorders garnered almost no results regarding the influence of mental strategies
on NFT performance, either. Only four studies addressing cognitive strategies were found.
Hardman et al. (1997) report from a three session NFT trial to improve left and right hemisphere
activation across F3 and F4 via slow cortical potentials negativity shifts towards the left or the
right hemisphere The group that was given instructions to use positive emotional strategies to
improve left hemisphere activation and negative emotional strategies to activate the right
hemisphere did not better than the control group that received no instructions. Moreover, within
137
session improvement were larger in the no strategy group, particularly in the last third of each
session.
Kober and colleagues (2013) came to a similar result in a ten-session NFT study to
uptrain either SMR or gamma power. Twenty healthy participants were initially instructed to
stay focused on the computer screen and remain relaxed during the NFT. After their first and last
NFT session participants were asked to write down the cognitive strategies they had used. These
strategies were classified as breathing, conscious relaxation, concentration, visual, auditory, and
cheering strategies. The four participants of the SMR group who had reported no specific mental
strategies were the only ones who significantly improved their SMR performance. The other six
participants in the SMR condition did not, but neither did any of the participants in the gamma
condition, even if they had not used any mental strategy. However, only one of the ten
participants of the gamma group had reported using no strategies. As the number of participants
of this study was small results should be interpreted with caution, though, especially regarding
the gamma group. The authors of the study interpret the results as an indication that the use of
elaborate strategies to increase SMR may overburden the finite amount of cognitive resources
and may lead to no significant learning of SMR over the course of the NFT sessions.
Furthermore, Witte et al. (2013) performed a study with ten NFT sessions in which 10
healthy participants underwent sham NFT whereas the other 10 participants were trained to
increase their SMR power. An increase of SMR power over the ten sessions was significantly
correlated with lower scores in the expectancy to control technological devices. Witte et al.
hypothesized that the expectation of controlling the device may consume additional cognitive
resources and lead to pressure or “forced mastery” (p. 1) that is not congruent with the effortless
relaxation that may improve SMR power. Thus, Kober et al. (2013) and Witte et al. (2013) agree
138
in their interpretation that mental strategies may lead to a reduction in available finite resources
which in turn may lead to worse learning of NFT parameters.
Lastly, Nan et al. (2012), in a twenty-session NFT trial to improve memory functions
with 32 healthy students, found that thinking about positive categories, particularly about friends,
love, and family improved the ability to increase relative alpha amplitudes during and across
NFT sessions, in comparison to thinking about neutral or negative strategies. All participants of
this study had been instructed to use whatever mental strategies worked for them or use no
mental strategies, if they so chose, to increase the respective wavebands that were trained.
Taking the results of these studies mentioned above into account, the non-significant results of
this study are not in line with any of their results, although non-significant results regarding
mental strategies were observed in the gamma power group of the Kober et al. (2013) study.
However, although the NFT protocol for the EG in this study uptrained both alpha and theta and
not the T/A ratio it is interesting to observe that the use of mental strategies lead to significantly
lower theta uptraining in comparison to the rise of alpha amplitude which in turn led to a lower
T/A ratio. This observation may be in line with the results of the aforementioned three studies;
considering that it is more difficult to uptrain theta than alpha, as mentioned above, a lower T/A
ratio may point to limited resources not being used as efficiently to uptrain theta in relation to
alpha while theta amplitude uptraining on its own had not been significant.
5.3 Control for Unspecific Effects (H 8 - H 9)
Hypothesis 8 (H 8): No significant differences between the treatment and the placebo
group in treatment expectations / self-efficacy as measured by the Stanford Expectations of
Treatment Scale (SETS) and the Rotter Locus of Control Scale (LOC) will be observed in the
study. There will not be significant differences between the treatment and the placebo group’s
139
pre-and post-treatment satisfaction as measured by the SETS modified outcome scale.
5.3.1 Control for Experimenter Bias
Humans are complex social beings who react to subtle emotional cues and develop
relationships over the course of a ten-session trial. Consequently, interactions with the three NFT
technicians certainly may influence the participant’s level of comfortability, trust, motivation,
and focus. This would be an especially sensitive issue because all the women participating in this
trial had moderate to high trait anxiety and 75% of them had a diagnosed AD. An unknown
psychotherapeutic / medical environment with an unfamiliar technical procedure may bring up
former negative experiences about medical illness. Therefore, the two NFT technicians who
administered one third of the NFT sessions had been trained with a standard protocol of
procedures and scripts on how to explain possible questions and practiced trial sessions before
they administered NFT sessions. Unusual circumstances during each NFT session, such as
excessive sleepiness, fidgeting, and unusual artifacts and equipment malfunctions were recorded
in the Session Coding List. The NFT data was analyzed with t-tests before any other statistical
analysis was performed to exclude the non-specific effect of varying experimenter personalities,
varying degrees of professionalism, and potential experimenter bias. No significant differences
between the three experimenters and the NFT session EEG parameters, as well as the
experimenters and the pre-and post session AD-ACL results were found. Consequently, no
experimenter bias influenced the results of the NFT sessions significantly.
5.3.2 Control for Treatment Satisfaction and Self-Efficacy (H 8).
No significant differences between the treatment and the placebo group in treatment
expectations / self-efficacy as measured by the Stanford Expectations of Treatment Scale (SETS)
and the Rotter Locus of Control Scale (LOC) were observed in the study. The use of mental
140
strategies and the perceived success of mental strategies did not correlate with the belief in EG
participation. As expected, perceived changes in everyday thinking, feeling, and behavior highly
correlated with the belief in EG participation. Participants who believed in being part of the EG
were significantly more likely to report changes in thinking, feelings, and behavior due to the
NFT than participants who believed they were part of the CG (Table 4.7 a).
A significant decrease in negative treatment expectations was observed between the
beginning of the NFT trial and the end of the trial with large effect size. The TIME*GROUP
interaction exhibited no statistically significant difference between the EG and CG for both
negative treatment expectations between pre- and post-trial which suggests that no significant
differences between the EG and CG were observed in the reduction of negative treatment
expectations regarding A/T NFT.
Positive treatment expectancy did not significantly change between the beginning and the
end of the NFT trial. Change in treatment expectancy as a measure of treatment satisfaction
shows that both, EG and CG participants, who had moderately high treatment expectancy,
reported no significant drop in treatment satisfaction over the course of the treatment.
The Rotter Locus of Control Scale was administered at the end of the NFT trial to gauge
the participants’ self-efficacy. Participants of this study tended to have an external locus of
control on average, attributing successes or failures to external circumstances rather than their
own efforts. A one-way ANOVA was performed to investigate if differences in means could be
detected between participants from the EG in comparison to members of the CG. No significant
differences between the two groups were found. Point-biserial correlations were performed
between the LOC score and all QEEG measures (i.e., absolute and relative alpha, theta, T+A
power and T/A ratio) and NFT measures (i.e., absolute and relative theta, alpha, and T+A
141
amplitudes, and T/A ratio), as well as for the various anxiety measures (BAI, STAI, and GAD)
and no correlation was significant (see Table 4.7 a; correlation matrix).
Belief in EG participation is another variable closely aligned with treatment expectation;
19/27 participants (70.4%) believed that they were in the EG and were receiving an active
treatment (11/14 members of the EG (78.6%) and 8/13 members of the CG (61.5%). Conversely,
belief in CG participation empirically aligns with treatment dissatisfaction; 8/27 participants
(29.6%) believed that they were part of the placebo group (5/13 participants from the CG
(38.5%) and 3/14 participants of the EG (21.4%).
While differences in Belief in EG participation were observed between the EG and CG,
these differences were neither significantly associated with any of the QEEG and NFT EEG-
related parameters, nor with any of the anxiety measure differences or AD-ACL measures, i.e.,
the Belief in EG participation had no impact on any of the measured parameters.
Belief in EG participation was significantly correlated with participants reporting
changes in thinking, feelings, and behaviors attributed to the NFT trial. It comes as no surprise,
that participants who reported that they believed to be part of the EG reported change in
thinking, feelings, and behaviors significantly more often than participants who did not believe
that they had been part of the EG. Furthermore, Belief in EG participation was associated with
age with older participants being more likely to believe that they had been part of the EG,
although no significant differences in the age distribution between EG and CG had been
observed after the initial randomization of participants.
5.3.3 Time-of-day of NFT (H 9).
Hypothesis 9 (H 9): Participants’ NFT learning will be significantly correlated with each
participant’s self-identified time-of day best, worst or neutral period for learning.
142
The correspondence of the time-of-day of the NFT sessions with the times-of-day of best
learning did not correlate significantly with the difference scores between session 1+2 and 9+10
differences in absolute alpha or theta amplitudes, nor relative alpha or theta, T/A ratio, nor
relative, or absolute T+A ratio. This means NFT sessions being held during a time of worst or
preferred learning were not associated with a significant improvement in regulation of the
parameters in the EG, nor was it associated significantly with any of the AD-ACL pre- post-
session difference scores, except for a difference in energy and tension which was approaching
significance. Participants who had NFT sessions during their worst time for learning (which can
be seen as a measure of tiredness, inattentiveness, and exhaustion) reported less energy and more
tension throughout the NFT sessions in comparison to participants who had their NFT sessions
scheduled during a neutral or best time for learning. The variable worst time for learning was
significantly associated with participants who had a more internal locus of control (higher LOC
score), which may be explained by participants with more internal control being more likely to
use mental strategies to influence the outcome of a NFT session and the use of mental strategies
are more exhausting than not using any strategies. Hence, those participants using mental
strategies are prone to be more impacted by less favorable learning times.
As Cheon et al. (2016) point out, there are complex interactions between amplitude,
frequency, phase, and coherence in mental processes. Especially neuronal oscillators are of
concern which generate spontaneous rhythmic wave patterns that are sTable against minor
disturbances and consist of more than one waveband, a continuum of brain oscillatory flux that
changes from slow to fast rhythms during the daily cycle. Hence, depending on time of the day
there may be different over-arching rhythmic patterns picked up by the EEG at Pz that may skew
results between sessions if the time of the NFT session was changed during the trial, which had
143
to be done on occasion due to changes participants’ schedules. For statistical comparison of
standardized conditions, testing within the same +/- 1.5 hours throughout the trial should
definitely be observed. However, to transfer the newly learned waveband training to other
situations, especially during times of day where one is not as alert, may be beneficial in later
training sessions. But upregulation of alpha and theta wavebands will have to have been
sufficiently learned to apply it to new (time) conditions. A similar concept guides transfer trials
in later sessions of NFT for ADHD (Drechsler et al., 2007; Mayer et al., 2015; Strehl et al.,
2006) as mentioned above.
5.4 Limitations
Many of the hypotheses of this study, most notably the primary hypothesis, were only
partially confirmed and some were not confirmed at all. Several weaknesses of the study design
may be responsible for this. The study was a single-blind RCT design. The participants did not
know if they were part of the CG or EG. However, the experimenters knew which group each
participant belonged to because they saw the summary of protocol parameters when the NFT
program was opened for each pre-programmed participant session and the person setting up and
analyzing the data was this study’s prinicipal investigator. Consequently, a double or triple-blind
design was impossible for a study like this one, whereby all functions were conducted by the
same person. Triple-and double-blind studies require a multi-person team with separate and
specialized roles.
Moreover, the number of NFT sessions was limited to ten sessions. There are NFT
studies, such as in the area of NFT for ADHD, that used between 20 and 40 NFT sessions and
showed significant results (Arns et al., 2009), but in the area of NFT for AD most studies with
significant results employed 5 to 12 session protocols (Watson & Herder, 1980; Hardt &
144
Kamiya, 1978; Rice et al., 1993; Egner et al., 2003; Gruzelier et al., 2009; Agnihotri et al., 2007)
and reported significant results in at least some of the examined parameters. After reviewing
existing studies in the field of A/T NFT it remains unclear how many sessions might be needed
for participants to learn alpha and especially theta wave uptraining to significantly differentiate
their absolute relative A+T amplitude up-regulation from the results of the CG.
Definitions for boundaries between various EEG bands are not set in stone and vary
slightly amount depending on the research study. A fair amount of research indicates large
interindividual differences in alpha peak frequency depending on biological trait and age
(Niedermeyer & Lopes da Silva, 1999; Klimesch, 1999) and intraindividual differences
depending on tasks (Klimesch, 1999; Mierau, Klimesch, & Lefebvre, 2017). Mierau et al. (2017)
had suggested to use individual alpha peak (APF) frequency, i.e., the spectral component of
alpha with the largest power estimate (between 6 and 13 Hz) to define an individual’s alpha
frequency for different scalp locations rather than using fixed frequency bands for all study
participants. This procedure would have prevented from participants’ being accidently uptrained
on a low beta frequency if their APF was on the low end (around 8 Hz) in some of the older
participants and the beta frequency starting lower than normal, for instance at around 11 Hz.
Unfortunately, this adds a level of complexity to the study design that was beyond this
dissertation. Every participant would have had to be reliably tested (more than once as APF is
quite sensitive to change) for their APF at rest at Pz via EEG and complex FFT functions in
Matlab or Neuroguide and an individualized NFT protocol for the specific APF would have had
to be added.
Furthermore, having a larger number of participants in the study would have been more
sensitive to detect differences between EG and CG and thus could have potentially led to
145
significant results, especially in those analyses where trends toward significance had been
observed, such as the self-reported, post-treatment anxiety being more reduced in the STAI-T in
the EG and small tendency toward significance (p = .131) of the EG having a higher A+T
relative power increase in the QEEG at the end of the NFT trial. As specified in chapter 3.1 a
power analysis was performed to find out how many participants would be necessary to detect
moderate effects between EG and CG. This study enlisted 14 participants for the EG and 13
participants for the CG. A total of 27 participants had been determined by power analysis to be
sufficient to detect moderate sized (f = .25) interaction effects and within-subject’s effects with
adequate power (.80). Furthermore, the results of the power analysis were compared with the
number of subjects of other clinical NFT trials in AD that found significant effects. Eleven out of
the nineteen (58%) RCTs which reported an effect in any variable had considerable less
participants (N=5-11) in the EG than the current RTC (Egner et al. 2002, Eismont et al., 2011;
Faridnia et al., 2012; Gruzelier et al., 2014a and b; Lu et al., 2017; Plotkin & Rice, 1981;
Raymond et al., 2005; Rice et al., 1993; Sittenfeld et al., 1976; and Vanathy et al., 1998). Five
(26%) RCTs had 12-16 participants per EG, approximately the same number as the current study
(n EG= 14); i.e., Agnihotri et al., 2007; Chisholm et al., 1977; Dadashi et al., 2015; and Gruzelier
et al., 2013. Only four studies (21%) enlisted significantly more participants (Bhat et al., 2012 [n
EG = 50]; Egner et al., 2003 [n EG = 18]; Sarkar et al., 1999 [n EG = 25]; and Garrett and Silver,
1978 [n EG = 18). However, the probability that recruiting more than 14 participants in the EG
(and 13 for the CG) for this study would have shown significant differences between the EG and
CG regarding A+T upregulation and pre- and post-trial QEEG results is small. A power analysis
of those NFT RCT with significant results showed that moderate sized interaction effects and
within subject effects of adequate power could be detected with a total number of 27 subjects.
146
Moreover, while larger samples are more sensitive to show significant changes in statistical
analyses they may also reduce the power of the results to the point where statistical changes are
not clinically relevant (Mertler & Vannatta, 2013; Aron, Coups, & Aron, 2013).
As Engelbregt and colleagues (2016) point out that the short-term versus long-term
effects as well as the generalized versus specific effects of A/T NFT for AD need to be addressed
better. Long-term effectiveness of treatments is not available for most studies which poses a
serious limitation, especially for AD associated with the fear-circuit, where extinction responses
can be reversed to excessive stress or traumatic events (see section 1.1.3).
Several limitations regarding the characteristics of study participants were observed. As it
was very difficult to recruit a sufficient number of male participants this trial was conducted with
women only and thus does not allow generalizations to be made to both biological sexes.
However, no significant differences had been found between men and women in any of the
reviewed RCT NFT studies for ADs (see chapter 1.2.5.1). Consequently, biological sex had not a
significant factor in former studies regarding learning outcomes in NFT and was thus not a likely
serious limitation of this study. Furthermore, the participant sample was very homogeneous
regarding race/ethnicity and education level. Thus, generalizing results to ethnic minorities and
less educated population is questionable. However, the majority of NFT studies to date suffer
from these limitations. In many studies 18- to 25-year old (mostly Caucasian) undergraduate
students served as participants (Kirschbaum & Gistl, 1973; Chisholm et al., 1977; Egner et al.,
2002; Gruzelier, Thompson, Redding, et al., 2013; Gruzelier et al, 2014) whereas this study’s age
range was heterogeneous and normally distributed (range = 19 to 69 years). Furthermore,
participants were included in this study who were taking various prescription medication and
caffeine daily but participants were asked not to change their medication and caffeine during the

147
course of the trial so that difference scores remained same between pre- and post-tests remained
the same. Ideally, only participants not taking any medication or caffeine that might change brain
oscillations should have been recruited but this would have been an unrealistic aim because
caffeine consumption and prescription drug taking is ubiquitous in the United States. According
it a recent study by Mitchell et al. (2014) 85% of the U.S. population consume at least one
caffeinated beverage per day and 65% of the population have taken at least one prescription drug
within the the past 30 days (Kantor et al., 2015).
The most important technical limitation of this study regarding the pre-and post-EEG
recordings, though, was that the Brainmaster Atlantis I, 4×4 Module ® 3.0 amplifier which only
allowed the recording of four EEG channels at a time, i.e., 5 x 4 channels had to be recorded
which resulted in only 4 channels being time-locked. Consequently, coherence, phase differences
between hemispheres and different cortical areas and comodulation of brain waves throughout
the brain could not be assessed in the EEG. Furthermore, Neuroguide’s automatic algorithms for
artifact removal for those artifacts that the Brainmaster system had not picked up, could not be
used and artifact removal had to be manually obtained through visual inspection of each of the
four time-locked EEG channels at a time and records with >95% split half reliability, >90% test-
retest reliability, and a total measurement of over 60 seconds were used for further statistical
analyses. An additional technical limitation of this study was that no ocular and temporalis or
frontalis EMG sensors to measure eye movement and blinking artifacts or jaw tensing were
available. Goncharova et al. (2003) point out that the EMG of temporalis and frontalis muscles
can mimic EEG alpha, mu, or beta rhythms over the entire scalp and contaminate the EEG but
that contamination of the EEG by EMG is not very likely at the Pz location as the attachment
sites of the temporalis and frontalis muscles, as well as the oculomotor sites are far away from Pz
148
and Oz. Furthermore, the Brainavatar software has built in algorithms to detect EMG artifacts,
although no studies exist, to my knowledge, on how effective these algorithms are in detecting
and removing artifacts.
In addition, the 30-second baseline reading for the beginning segment of each NFT
session was included within the first minute of NFT training recording, i.e., half of the first
minute was baseline recording and thereafter the feedback began and thus could not be used for
further analysis. While the missing baseline values were of concern to pre-post-difference
measurements of alpha and theta analyzed by ANOVAs, it had negligible effect on the statistics
as GCM is a continuous model of alpha and theta band changes within and across all sessions.
Procedural limitations of this study also need to be addressed. First, participants’
responses to NFT may be influenced by the expectation of treatment outcome and by their belief
as to how much they can influence the outcomes of events in general. This may be particularly
true for treatments involving technology that is perceived as cutting edge. The Stanford Expect-
ations of Treatment Scale (Younger et al., 2012) was used to measure the general outcome
expectancy in this trial and the Rotter (1966) Locus of Control scale was assessed to control for
participants’ general internal or external locus of control beliefs. Both scales revealed no
differences between CG and EG and showed no significant correlations to other measures. It
would have been helpful to administer the LOC pre- and post-trial to investigate if the A/T NFT
treatment caused any changes in participants’ belief as to how much they can influence outcomes
of events. Second, hours and quality of sleep per night during the course of the NFT trial were not
formally assessed, although it was noted on the NFT Session Checklist form for the respective
session if a participant mentioned that she was excessively tired. Significant sleep reduction, sleep
deprivation, and poor quality of sleep may lead to be irritability, tension, inattentiveness, and
149
reduced learning due to reduced memory consolidation of dendritic spine formations via LTP
during sleep (Yang, Lai, Cichon, Ma, et al., 2014). The lack of so-called transfer trials may have
made it difficult for study participants to generalize study gains to regular life circumstances.
Such trials, while not used in NFT for AD in the past, have been used in NFT studies for children
and adults with ADHD (e.g., Drechsler et al., 2007; Mayer et al., 2015; Strehl et al., 2006) and in
these studies are correlated with a reduction in reduction in ADHD symptoms.
150
6. Future Directions
In order to gain a clearer understanding if A/T NFT is an efficacious treatment changes in
the operationalization of the research design and the NFT protocol need to be instituted. As
mentioned before, few NFT researchers acknowledged that uptraining of certain beta bins may
lead to increase in alpha bins (Ros et al., 2013; Jurewicz et al., 2018). Thus, the analysis of CG
beta band data in relation to theta and alpha band data will be necessary to evaluate how
successful participants were in the upregulation of beta bins and if this upregulation of beta bins
is associated with the upregulation of certain alpha and / or theta bins. Similarly, it is important
to find out how successful participants were in learning to downtrain beta bins and associated
changes in other wave bands or if a slow rise of beta and alpha are observed in both beta up-and
downtraining protocols which would indicate non-specific factors, as in Jurewicz et al. (2018)
study, and learning did not take place. In future studies inhibits for alpha and theta should be
built into the NFT protocols of a CG to prevent the simultaneous rise of alpha and or theta.
Measuring each participant’s alpha peak frequency and using it for an individualized A/T
NFT protocol instead of the standard fixed EEG frequency ranges used in this study because as
Bazanova (2016) points “…low and upper frequency range alpha factors with identical peak
frequencies, which relate to different neuronal functions” (p. 1).
Furthermore, integration of a learner analysis using each EG participant’s increase (or
decrease) in linear regression equation slope before the start of a study could be added. A cut-off
value for the slope can be determined below which a study participant is considered a non-
learner regarding the study-specific EEG training parameter and would be excluded from the
study – although this may have unintended emotional and ethical consequences for participants
which needs to be discussed further.
151
Moreover, using a more homogenous group of study participants based on what type of
AD they have may be beneficial. Williams (2016) provided a detailed taxonomy for AD and
depression regarding neural circuit dysfunctions and relates them to associated brain networks.
Thus, targeting networks associated with a specific AD with an A+T protocol protocols would be
helpful. For instance, a future study may recruit only participants with SAD or phobias, two AD
that have symptoms of anxious avoidance at their center. Anxious avoidance, according to
Williams (2016) is associated primarily with circuit abnormalities of the salience network,
specifically the hypoconnectivity between left and right anterior insula and the sublenticular
extended amygdala, and the hyperactivation of the amPFC. NFT training electrodes could be
placed over the areas of the anterior insulae at the FC5, FT7 and FC6, FT8 electrode locations
and A+T could be uptrained in both right and left insula or the less activated insula could be
uptrained alternatively. Associated with a more precise NFT electrode locations would be to
record to have an electrode cap with 60 leads, including FC5, FT7 and FC6, FT8 available for
the EEG. According to Lau, Gwin, and Ferris (2012) the analysis of 35 timelocked EEG
channels for pre-and post EEGs for reliably recording EEGs should be sufficient. In addition,
ocular and temporalis or frontalis EMG sensors to measure eye movement and blinking artifacts
or jaw tensing to limit artifacts during the EEG recordings and during NFT sessions would be
helpful.
Another consideration is to change the location of the NFT electrode location from Pz-LE
– the location used for EG and CG in this study – to another location. (The Pz-LE and Cz-LE
locations had been the most commonly used electrode placement in A/T NFT for AD). Yet, as
discussed before, Olejarczyk, Bogucki, and Sobieszek (2017) found that alpha rhythm
generators, beside the occipital and frontal locations, were also found at Pz in some healthy

152
participants which may indicate independence of the NFT protocol, as long as the active
electrode is placed at Pz enhanced alpha rhythm production is to be expected in cases of
heightened attention. Thus, in future A/T NFT research it may be beneficial to consider different
electrode locations, especially for the CG.
Participants developed relationships with the experimenter and NFT technicians which
most certainly influenced the individual’s general level of comfortability, trust, motivation, and
level of focus on the NFT treatment. This may be especially relevant for research with
individuals with GAD and SAD as they often are uncomfortable with social situations.
Development of a standardized method of recording and description of subject interaction with
NFT technicians of interactions would ensure the recording and better factoring out of the NFT
trainer / participant interactions. The English translation of the Fragebogen zur Erfassung
relevanter Therapiebedingungen (FERT), developed by Vollmann et al. (2009), administered
after each NFT session may be helpful to assess this variable and factor out these influences via
co-variate analysis. Secondly, standardized structured NFT strategies tools to assess mental
strategies used by participants after each session may be helpful.
Lastly, scheduling at least one or several follow-up appointments, for instance after 6
months, 12 months and 24 months to re-assess QEEG and self-report anxiety scales and
qualitative questions about changes in thinking, feeling and behavior will be beneficial to
analyze if and what long-term changes resulted due to continued practice of A/T self-regulation
in vivo after the NFT concludes.
153
7. Summary and Conclusions
The present study, to my knowledge, is the first single-blind trial to test the A/T NFT
protocol for trait anxiety in a highly anxious adult female population with an active placebo NFT
control group and was one of the first NFT studies to use GCM for statistical NFT data analysis.
The primary objective of this study was the design and implementation of a rigorous,
placebo-controlled clinical trial to investigate if A/T NFT is an efficacious treatment method for
women with moderate to high trait anxiety. Twenty-seven women ranging in age from 19
through 69 who had scored higher than the 66th percentile in the STAI trait anxiety sub-scale
(75% of which had previously been diagnosed with an anxiety disorder) were randomly
distributed to either a ten-session alpha/theta NFT EG (n = 14) in which alpha and theta
amplitudes were uptrained at Pz. The rest of the participants (CG) were given a ten-session
active placebo training (n = 13) at Pz during which they received successive NFT sessions of up-
and downtraining beta and high beta.
Growth curve modeling (and traditional 2x5 repeated measures ANOVA) were
performed on the NFT sessions data to model individual and average group learning curves and
to separate learners and non-learners. Cognitive variables, such as treatment outcome
expectancy, personal attribution styles, use, types, and efficacy of cognitive strategies in NFT,
and correlations between NFT learning performance, time of day the NFT sessions were held,
and a participant’s best or worst time to learn, which are rarely assessed in NFT trials, were also
investigated.
The study’s primary hypothesis that A/T NFT is an efficacious treatment method for
women with moderate to high trait anxiety could only be partially confirmed as for both, EG and
CG a significant rise in A+T amplitudes and a reduction in self-perceived anxiety was observed.
154
An analysis of individual learning curves, GCM, and ANOVA all confirmed that the majority of
women of the EG up-regulated absolute and relative A+T amplitudes within a NFT session, but
so did the participants of the CG who had not received any A+T uptraining. Participants of the
EG and CG felt significantly more deactivated at the end of a NFT session in comparison to the
beginning; the AD-ACL sub-scales energy and tension decreased significantly while calmness
and tiredness increased significantly but no significant gains in deactivation across NFT sessions
were made. In both groups participants’ anxiety was significantly reduced on all anxiety
measures. Although a trend could be observed that the EG reduced anxiety scores more than the
CG these differences did not rise to statistical significance. Lastly, no significant changes in the
pre-post trial QEEG were found pre-post, although a trend of higher combined relative A+T
power at the end of the trial was observed in the EG.
In the EG the use of mental strategies was associated with lower T/A ratio difference
scores between the beginning and the end of the NFT trial. However, it was not correlated with
the T+A parameter trained in the EG. Belief in EG group membership, not surprisingly was
highly correlated with reported changes in everyday thinking, feeling, and behavior at the end of
the NFT trial. Time-of-day participants prefer for learn for learning activities in life and time-of-
day participants avoid for learning activities did not correlate significantly with alpha or theta
NFT parameters, i.e., NFT sessions being held during sub-optimal times of day were not
associated with poorer learning performance.
The failure of the A/T protocol to lead to significantly better results than the active
placebo group could be due to an elaborate placebo effect: sitting in front of a computer in a
relaxed position in a quiet, dimly-lit room while attempting to not think of anything is a refuge
from the stressful busy lives of participants. It is an unspecific effect that causes alpha waves and
155
even theta waves to increase. Regarding the anxiety AD-ACL scales, participants could also
have both engaged in the largely unconscious process of reducing cognitive dissonance by
enhancing the positive effects of the NFT trial — which constitutes a significant time
investment— and downplayed negative parts of the trial. More well-designed RTCs are needed
to conclude if A/T NFT is an efficacious treatment method for anxiety disorders or if the effects
of this NFT method are largely due to non-specific effects, such as placebo effects, EEG
frequency drifts, alpha’s idling mode and inhibitory role during task performance, functional
coupling of certain EEG frequencies in general, or perhaps simply that some frequency bands
(alpha) are more susceptible to change and easier to train. Especially inhibiting flanking non-
trained bands in the NFT protocol, i.e., beta bands in A+T training upregulation and alpha and
theta bands in beta upregulation, to prevent frequency drifts will be necessary along with larger
sample sizes and detailed GCM modeling of all frequency bands, not just the frequency band/s
trained via NFT protocol, and how they change over the time of the NFT will be necessary to
find an answer to this question.
156
8. References
Agnihotri, H., Sandhu, J. S., & Paul, M. (2007). Biofeedback approach in the treatment of
generalized anxiety disorder. Iranian Journal of Psychiatry, 2(3), 90-95.
Aliño, M., Gadea, M., & Espert, R. (2016). A Critical View of Neurofeedback Experimental
Designs: Sham and Control as Necessary Conditions. Int J Neurol Neurother, 3, 041.
Alkoby, O., Abu-Rmileh, A., Shriki, O., & Todder, D. (2017). Can we predict who will respond
to neurofeedback? A review of the inefficacy problem and existing predictors for
successful EEG neurofeedback learning. Neuroscience (in press).
Alonso, J., Angermeyer, M. C., Bernert, S., Bruffaerts, R., Brugha, T. S., Bryson, H., ... & Haro,
J. M. (2004). Prevalence of Mental Disorders in Europe: Results from the European
Study of the Epidemiology of Mental Disorders (ESEMeD) project. Acta Psychiatrica
Scandinavica, 109(s420), 21-27.
American Psychiatric Association (2000). Diagnostic and Statistical Manual of Mental
Disorders: DSM-IV-TR (Fourth ed.) Text revision. Arlington, VA: American Psychiatric
Publishing.
American Psychiatric Association (2013). Diagnostic and Statistical Manual of Mental
Disorders: DSM-5 (Fifth ed.). Arlington, VA: American Psychiatric Publishing.
American Psychiatric Association (2015). Anxiety Disorders. Retrieved on 6/12/2015 at
http://www.psychiatry.org/anxiety-disorders.
American Psychological Association (2010). Publication Manual of the American Psychological
Association (sixth edition). Washington, DC: APA.
Andrade, L. H., Alonso, J., Mneimneh, Z., Wells, J. E., Al-Hamzawi, A., Borges, G., ... &
Florescu, S. (2014). Barriers to mental health treatment: results from the WHO World

157
Mental Health surveys. Psychological Medicine, 44(6), 1303-1317.
Angel, H. F., Oviedo, L., Paloutzian, R. F., Runehov, A. L., & Seitz, R. J. (Eds.). (2017).
Processes of Believing: The Acquisition, Maintenance, and Change in Creditions.
(Vol.1). New York, Heidelberg, Germany: Springer.
Arnau, S., Möckel, T., Rinkenauer, G., & Wascher, E. (2017). The interconnection of mental
fatigue and aging: An EEG study. International Journal of Psychophysiology, 117, 17-25.
Arnold, L. E., Lofthouse, N., Hersch, S., Pan, X., Hurt, E., Bates, B., ..., & Grantier, C. (2013).
EEG neurofeedback for ADHD: Double-blind sham-controlled randomized pilot
feasibility trial. Journal of Attention Disorders, 17(5), 410-419.
Arns, M. W. (2011). Personalized medicine in ADHD and depression: A quest for EEG
treatment predictors (Doctoral dissertation, Utrecht University, Netherlands).
Arns, M., Etkin, A., Hegerl, U., Williams, L. M., DeBattista, C., Palmer, D. M. … & Gordon, E.
(2015). Frontal and rostral anterior cingulate (rACC) theta EEG in depression:
Implications for treatment outcome? European Neuropsychopharmacology, 25(8), 1190-
1200.
Arns, M., de Ridder, S., Strehl, U., Breteler, M., & Coenen, A. (2009). Efficacy of
neurofeedback treatment in ADHD: The effects on inattention, impulsivity and
hyperactivity: a meta-analysis. Clinical EEG and Neuroscience, 40(3), 180-189.
Arns, M., Heinrich, H., & Strehl, U. (2014). Evaluation of neurofeedback in ADHD: The long
and winding road. Biological Psychology, 95, 108-115.
Arns, M., Heinrich, H., Ros, T., Rothenberger, A., & Strehl, U. (2015). Neurofeedback in
ADHD. Frontiers in Human Neuroscience, 9.
Arns, M., Batail, J. M., Bioulac, S., Congedo, M., Daudet, C., Drapier, D., ..., & Mehler, D.
158
(2017). Neurofeedback: One of today's techniques in psychiatry? L'Encéphale, 43(2),
135-145.
Aron, A., Aron, E. N., & Coups, E. J. (2013). Statistics for psychology (6th ed.). Upper Saddle
River, NJ: Pearson.
Baehr, E., Rosenfeld, J. P., & Baehr, R. (2001). Clinical use of an alpha asymmetry neuro-
feedback protocol in the treatment of mood disorders: Follow-up study one to five years
post therapy. Journal of Neurotherapy, 4(4), 11-18.
Bagdasaryan, J., & Le Van Quyen, M. (2013). Experiencing your brain: Neurofeedback as a new
bridge between neuroscience and phenomenology. Frontiers in Human Neuroscience, 7.
Baker, M. (2016). Is there a reproducibility crisis? A Nature survey lifts the lid on how researchers
view the crisis rocking science and what they think will help. Nature, 533(7604), 452-455.
Bandelow, B., & Michaelis, S. (2015a). Epidemiology of anxiety disorders in the 21st
century. Dialogues in Clinical Neuroscience, 17(3), 327.
Bandelow, B., Reitt, M., Röver, C., Michaelis, S., Görlich, Y., & Wedekind, D. (2015b).
Efficacy of treatments for anxiety disorders: A meta-analysis. International Clinical
Psychopharmacology, 30(4), 183-192.
Barlow, D. H. (2000). Unraveling the mysteries of anxiety and its disorders from the perspective
of emotion theory. The American Psychologist, 55(11), 1247.
Barlow, D. H. (2004). Anxiety and its disorders: The nature and treatment of anxiety and panic.
Hoboken, NJ: Guilford Press.
Bates, D., Maechler, M., & Bolker, B. (2013). lme4: Linear mixed-effects models using S4
classes. R package version 0.999999-0. 2012. URL: http://CRAN. R-project.
org/package= lme4.
159
Baxter, A. J., Scott, K. M., Vos, T., & Whiteford, H. A. (2013). Global prevalence of anxiety
disorders: A systematic review and meta-regression. Psychol Med, 43: 897-910.
Bazanova, O. M. & Vernon, D. (2014). Interpreting EEG alpha activity. Neuroscience &
Biobehavioral Reviews, 44, 94-110.
Bazanova, O. M., & Aftanas, L. I. (2010). Individual EEG alpha activity analysis for enhance-
ment neurofeedback efficiency: Two case studies. Journal of Neurotherapy, 14(3), 244-
253.
Bazanova O. M. (2016). Workshop “Individualized Neurofeedback”. Front. Hum. Neurosci.
Conference Abstract: SAN2016 Meeting.
Beck, A. T., Steer, R. A., & Brown, G. K. (1996). Manual for the Beck Depression Inventory-II.
San Antonio, TX: Psychological Corporation.
Beier, G. (1999). Kontrollüberzeugungen im Umgang mit Technik. Report Psychologie. 9, 684–
693.
Beier, G. (2004). Kontrollüberzeugungen im Umgang mit Technik: Ein Persönlichkeitsmerkmal
mit Relevanz für die Gestaltung technischer Systeme (Doctoral thesis). Available from
GESIS database, Record No. 20040112708.
Benedetti, F., Lanotte, M., Lopiano, L., & Colloca, L. (2007). When words are painful:
Unraveling the mechanisms of the nocebo effect. Neuroscience, 147(2), 260-271.
Benioudakis, E. S., Kountzaki, S., Batzou, K., Markogiannaki, K., Seliniotaki, T., Darakis, E., ...
& Nestoros, J. N. (2016). Can Neurofeedback Decrease Anxiety and Fear in Cancer
Patients? A Case Study. Postępy Psychiatrii i Neurologii, 25(1), 59-65.
Berger, H. (1929). Über das Elektroenkephalogramm des Menschen. Arch. Psychiatr. Nervenkr.
87, 527–570. As cited in C. S. Herrmann, D. Strüber, R. F. Helfrich, & A. K. Engel, A.
160
(2016). EEG oscillations: from correlation to causality. International Journal of
Psychophysiology, 103, 12-21.
Bhat, P. (2010) Efficacy of Alfa EEG wave biofeedback in the management of anxiety.
Industrial Psychiatry Journal, 19(2), 111.
Bienvenu, O. J., Wuyek, L. A., & Stein, M. B. (2009). Anxiety disorders diagnosis: Some history
and controversies. In: Behavioral Neurobiology of Anxiety and Its Treatment (pp. 3-19).
Berlin, Heidelberg, Germany: Springer.
Buckholtz, J. W., & Meyer-Lindenberg, A. (2012). Psychopathology and the human connection:
toward a transdiagnostic model of risk for mental illness. Neuron, 74: 990-1004.
Button, K. S., Ioannidis, J. P., Mokrysz, C., Nosek, B. A., Flint, J., Robinson, E. S., & Munafò,
M. R. (2013). Power failure: why small sample size undermines the reliability of neuro-
science. Nature Reviews Neuroscience, 14(5), 365-376.
Candidate gene. (n.d.). In Wikipedia. Retrieved November 20, 2017 from https://en.wikipedia.org
/wiki/Candidate_gene.
Carlson, N. R., & Birkett, M. A. (2016). Physiology of Behavior (12th edition). Boston, MA:
Pearson.
Carmena, J. M., Lebedev, M. A., Crist, R. E., O'Doherty, J. E., Santucci, D. M., Dimitrov, D. F.,
... & Nicolelis, M. A. (2003). Learning to control a brain–machine interface for reaching
and grasping by primates. PLoS Biology, 1(2), e42.
Chapin, T. J., & Russell-Chapin, L. A. (2013). Neurotherapy and neurofeedback: Brain-based
treatment for psychological and behavioral problems. London, GB: Routledge.
Cheon, E. J., Koo, B. H., & Choi, J. H. (2016). The efficacy of neurofeedback in patients with
major depressive disorder: An open labeled prospective study. Applied Psychophysiology

161
and Biofeedback, 41(1), 103-110.
Cheron, G., Petit, G., Cheron, J., Leroy, A., Cebolla, A., Cevallos, C., ... & Dan, B. (2016). Brain
oscillations in sport: Toward EEG biomarkers of performance. Frontiers in psychology, 7.
Chisholm, R. C., DeGood, D. E., & Hartz, M. A. (1977). Effects of alpha feedback training on
occipital EEG, heart rate, and experiential reactivity to a laboratory stressor. Psycho-
physiology, 14(2), 157-163.
Chow, T., Javan, T., Ros, T., & Frewen, P. (2017). EEG Dynamics of Mindfulness Meditation
Versus Alpha Neurofeedback: A Sham-Controlled Study. Mindfulness, 8(3), 572-584.
Cohen, M. X. (2014). Analyzing neural time series data: Theory and practice. Cambridge, MA:
MIT Press.
Collura, T. (2007). BrainMaster MINIQ II User’s Manual. Brainmaster Technologies, Inc.
(https://brainmaster.com/software/pubs/m-qII.pdf)
Cortese, S., Ferrin, M., Brandeis, D., Holtmann, M., Aggensteiner, P., Daley, D., ... , & Sonuga-
Barke, E. J. (2016). Neurofeedback for attention-deficit / hyperactivity disorder: Meta-
analysis of clinical and neuropsychological outcomes from randomized controlled
trials. Journal of the American Academy of Child & Adolescent Psychiatry, 55(6), 444-455.
Craske, M. G., Stein, M. B., Eley, T. C., Milad, M. R., Holmes, A., Rapee, R. M., & Wittchen,
H. U. (2017). Anxiety Disorders. Nat.Rev.Dis. Primers, 317024.
Craske, M. G., Rauch, S. L., Ursano, R., Prenoveau, J., Pine, D. S., & Zinbarg, R. E. (2009).
What is an anxiety disorder? Depression and Anxiety, 26(12), 1066-1085.
Dadashi, M., Birashk, B., Taremian, F., Asgarnejad, A. A., & Momtazi, S. (2015). Effects of
Increase in Amplitude of Occipital Alpha & Theta Brain Waves on Global Functioning
Level of Patients with GAD. Basic and Clinical Neuroscience, 6(1), 14.
162
Dayan, P., & Berridge, K. C. (2014). Model-based and model-free Pavlovian reward learning:
revaluation, revision, and revelation. Cognitive, Affective, & Behavioral Neuro-
science, 14(2), 473-492.
Dekker, M. K., van den Berg, B. R., Denissen, A. J., Sitskoorn, M. M., & van Boxtel, G. J.
(2014). Feasibility of eyes open alpha power training for mental enhancement in elite
gymnasts. Journal of Sports Sciences, 32(16), 1550-1560.
Demos, J. (2005). Getting started with neurofeedback. New York, NY: Norton.
Dempster, T., & Vernon, D (2009). Identifying indices of learning for alpha neurofeedback
training. Applied Psychophysiology and Biofeedback, 34(4). 309.
Deng, X., Wang, G., Wa, L., Zhou, Z., ... & Liu, B.(2014). Randomized controlled trial of
adjunctive EEG-biofeedback treatment of obsessive-compulsive disorder. Shanghai
Archives of Psychiatry, 26(5), 272.
De Vos, M., Kroesen, M., Emkes, R., & Debener, S. (2014). P300 speller BCI with a mobile
EEG system: Comparison to a traditional amplifier. Journal ofNeural Engineering,
11(3), 036008.
Digman, J. M. (1997). Higher-order factors of the Big Five. Journal of Personality and Social
Psychology, 73, 1246–1256.
Dong, M. Y., Sandberg, K., Bibby, B. M., Pedersen, M. N., & Overgaard, M. (2015). The
development of a sense of control scale. Frontiers in Psychology, 6.
Doppelmayr, M., & Weber, E. (2011). Effects of SMR and theta/beta neurofeedback on reaction
times, spatial abilities, and creativity. Journal of Neurotherapy, 15(2), 115-129.
Drechsler, R., Straub, M., Doehnert, M., Heinrich, H., Steinhausen, H. C., & Brandeis, D.
(2007). Controlled evaluation of a neurofeedback training of slow cortical potentials in
163
children with attention deficit/hyperactivity disorder (ADHD). Behavioral and Brain
Functions, 3(1), 35.
Dreis, S. M., Gouger, A. M., Perez, E. G., Russo, G. M., Fitzsimmons, M. A., & Jones, M. S.
(2015). Using neurofeedback to lower anxiety symptoms using individualized QEEG
protocols: A pilot study. NeuroRegulation, 2(3), 137.
Duval, E. R., Javanbakht, A., & Liberzon, I. (2015). Neural circuits in anxiety and stress
disorders: A focused review. Therapeutics and Clinical Risk Management, 11, 115.
Ebersole, J. S., Husain, A. M., & Nordli, D. R. (2014). Current practice of clinical electro-
encephalography. Philadelphia, PA: Lippincott, Williams, & Wilkins.
Egner, T., Strawson, E., & Gruzelier, J. H. (2002). EEG signature and phenomenology of
Alpha/Theta neurofeedback training versus mock feedback. Applied Psychophysiology
and Biofeedback, 27(4), 261-270.
Egner, T., & Gruzelier, J. H. (2003). Ecological validity of neurofeedback: Modulation of slow
wave EEG enhances musical performance. Neuroreport, 14(9), 1221-1224.
Eismont, E.V., Lutsyu, N.V., & Pavlenko, V.B. (2011). Moderation of increased anxiety in
children and teenagers with the use of neurotherapy: Estimation of efficacy. Neuro-
physiology, 43: 25-32.
Emmert, K., Kopel, R., Sulzer, J., Brühl, A. B., Berman, B. D., Linden, D. E., ... & Johnston, S.
(2016). Meta-analysis of real-time fMRI neurofeedback studies using individual
participant data: How is brain regulation mediated? Neuroimage, 124, 806-812.
Enriquez-Geppert, S., Huster, R. J., Scharfenort, R., Mokom, Z. N., Zimmermann, J., &
Herrmann, C.S. (2014). Modulation of frontal-midline theta by neurofeedback. Biological
Psychology, 95, 59-69.
164
Enriquez-Geppert, S., Huster, R. J., & Herrmann, C. S. (2017). EEG-neurofeedback as a tool to
modulate cognition and behavior: A review tutorial. Frontiers in Human Neuro-
science, 11.
European Medicines Agency (CPMP/EWP/908/99) (2002c). Points to Consider on Multiplicity
Issues in Clinical Trials. (as cited in T. I. Uryniak, S. F. Chan, V. V. Fedorov, Q. Jiang,
L. Oppenheimer, S. M. Snapinn, C. H. Teng, & J. Zhang (2011): Responder Analyses—
A PhRMA Position Paper, Statistics in Biopharmaceutical Research, 3:3, 476-487).
Faridnia, M., Shojaei, M., & Rahimi, A. (2012). The effect of neurofeedback training on the
anxiety of elite female swimmers. Annals of Biological Research, 3(2), 1020-1028.
Faul, F., Erdfelder, E., Lang, A.-G., & Buchner, A. (2007). G*Power 3: A flexible statistical
power analysis program for the social, behavioral, and biomedical sciences. Behavior
Research Methods, 39, 175-191.
Feist, J., & Feist, G. J. (2008). Theories of Personality. New York, NY: McGraw-Hill.
Ferreira, A., Celeste, W. C., Cheein, F. A., Bastos-Filho, T. F., Sarcinelli-Filho, M., & Carelli, R.
(2008). Human-machine interfaces based on EMG and EEG applied to robotic systems.
Journal of NeuroEngineering and Rehabilitation, 5(1), 10.
Festinger, L. (1962). A theory of cognitive dissonance (Vol. 2). Palo Alto, CA: Stanford
University Press.
Fetz, E. E. (1969). Operant conditioning of cortical unit activity. Science, 163(3870), 955-958.
Fetz, E. E. (2007). Volitional control of neural activity: Implications for brain–computer
interfaces. The Journal of Physiology, 579(3), 571-579.
Finniss, D. G., Kaptchuk, T. J., Miller, F., & Benedetti, F. (2010). Biological, clinical, and
ethical advances of placebo effects. The Lancet, 375(9715), 686-695.

165
Freeman, S., Yu, R., Egorova, N., Chen, X., Kirsch, I., Claggett, B., ... & Kong, J. (2015).
Distinct neural representations of placebo and nocebo effects. Neuroimage, 112, 197-207.
Freund, P. A., Kuhn, J. T., & Holling, H. (2011). Measuring current achievement motivation
with the QCM: Short form development and investigation of measurement invariance.
Personality and Individual Differences, 51(5), 629-634.
Friedman, B. H. (2007). An autonomic flexibility–neurovisceral integration model of anxiety and
cardiac vagal tone. Biological Psychology, 74(2), 185-199.
Friedrich, E. V., Wood, G., Scherer, R., & Neuper, C. (Eds.). (2015). Mind Over Brain, Brain
Over Mind: Cognitive Causes and Consequences of Controlling Brain Activity.
Lausanne, Switzerland: Frontiers Media, SA.
Fonzo, G. A., Ramsawh, H. J., Flagan, T. M., Simmons, A. N., Sullivan, S. G., Allard, C. B., ...
& Stein, M. B. (2016). Early life stress and the anxious brain: Evidence for a neural
mechanism linking childhood emotional maltreatment to anxiety in adulthood.
Psychological Medicine, 46(5), 1037-1054.
Fovet, T., Micoulaud-Franchi, J. A., Vialatte, F. B., Lotte, F., Daudet, C., Batail, J. M., ... &
Ros, T. (2017). On assessing neurofeedback effects: should double-blind replace
neurophysiological mechanisms? Brain, 140(10), e63-e63.
Gaume, A., Vialatte, A., Mora-Sánchez, A., Ramdani, C., & Vialatte, F. B. (2016). A
psychoengineering paradigm for the neurocognitive mechanisms of biofeedback and
neurofeedback. Neuroscience & Biobehavioral Reviews, 68, 891-910.
Gallagher, M. W., Naragon-Gainey, K., & Brown, T. A. (2014). Perceived control is a trans-
diagnostic predictor of cognitive–behavior therapy outcome for anxiety disorders.
Cognitive Therapy and Research, 38(1), 10-22.
166
Gallagher, M. W., Bentley, K. H., & Barlow, D. H. (2014). Perceived control and vulnerability
to anxiety disorders: A meta-analytic review. Cognitive Therapy and Research, 38(6),
571-584.
Garrett B. L., & Silver, M. P. (1976). The use of EMG and alpha biofeedback to relieve test
anxiety in college students. In: Wickramasekera, I., (ed.). Biofeedback, behavior therapy,
and hypnosis. Chicago, IL: Nelson-Hall.
Geuter, S., Koban, L., & Wager, T. D. (2017). The cognitive neuroscience of placebo effects:
Concepts, predictions, and Physiology. Annual Review of Neuroscience, (in press).
Gevensleben, H., Holl, B., Albrecht, B., Schlamp, D., Kratz, O., Studer, P., ... & Heinrich, H.
(2009). Distinct EEG effects related to neurofeedback training in children with ADHD: A
randomized controlled trial. InternationalJjournal of Psychophysiology, 74(2), 149-157.
Gevensleben, H., Holl, B., Albrecht, B., Schlamp, D., Kratz, O., Studer, P., ... & Heinrich, H.
(2010). Neurofeedback training in children with ADHD: 6-month follow-up of a
randomised controlled trial. European Child & Adolescent Psychiatry, 19(9), 715-724.
Gevensleben, H., Albrecht, B., Lütcke, H., Auer, T., Dewiputri, W. I., Schweizer, R., ... &
Rothenberger, A. (2014). Neurofeedback of slow cortical potentials: neural mechanisms
and feasibility of a placebo-controlled design in healthy adults. Frontiers in Human
Neuroscience, 8.
Ghaziri, J., Tucholka, A., Larue, V., Blanchette-Sylvestre, M., Reyburn, G., Gilbert, G., ... &
Beauregard, M. (2013). Neurofeedback training induces changes in white and gray
matter. Clinical EEG and Neuroscience, 44(4), 265-272.
Gidron, Y. (2013). Trait anxiety. In Encyclopedia of behavioral medicine (pp. 1989-1990). New
York, NY: Springer.
167
Glover, E. M., Mercer, K. B., Norrholm, S. D., Davis, M., Duncan, E., Bradley, B., ….. &
Jovanovic, T. (2013). Inhibition of fear is differentially associated with cycling estrogen
levels in women. Journal of Psychiatry & Neuroscience: JPN, 38(5), 341.
Glueck, B., & Stroebel, C. (1975). Biofeedback and meditation in the treatment of psychiatric
illnesses. Comprehensive Psychiatry, 16, 303–321.
Goncharova, I. I., McFarland, D. J., Vaughan, T. M., & Wolpaw, J. R. (2003). EMG contamin-
ation of EEG: Spectral and topographical characteristics. Clinical neurophysiology,
114(9), 1580-1593.
Green, E. (1974). Society for Neurofeedback and research, Annual meeting. (as cited in Soutar,
R. G., and Longo, R. E. (2011). Doing neurofeedback: An introduction. San Rafael, CA:
ISNR Research Foundation.
Grosse Holtforth, M., & Grawe, K. (2003). Der Inkongruenzfragebogen (INK). Zeitschrift für
klinische Psychologie und Psychotherapie, 32(4), 315-323.
Groth-Marnat, G. (2009). Handbook of psychological assessment (fifth ed.). Hoboken, NJ:
Wiley.
Gruzelier, J., Egner, T., & Vernon, D. (2006). Validating the efficacy of neurofeedback for
optimising performance. Progress in Brain Research, 159, 421-431.
Gruzelier, J. (2009). A theory of Alpha/Theta neurofeedback, creative performance enhance-
ment, long distance functional connectivity and psychological integration. Cognitive
Processing, 10(1), 101-109.
Gruzelier, J. H., Thompson, T., Redding, E., Brandt, R., & Steffert, T. (2014). Application of
Alpha/Theta neurofeedback and heart rate variability training to young contemporary
dancers: State anxiety and creativity. International Journal of Psychophysiology, 93(1),

168
105-111.
Gruzelier, J. H., Hirst, L., Holmes, P., & Leach, J. (2014). Immediate effects of Alpha/Theta and
sensory-motor rhythm feedback on music performance. International Journal of Psycho-
physiology, 93(1), 96-104.
Gruzelier, J. H., Holmes, P., Hirst, L., Bulpin, K., Rahman, S., Van Run, C., & Leach, J. (2014).
Replication of elite music performance enhancement following Alpha/Theta neuro-
feedback and application to novice performance and improvisation with SMR
benefits. Biological Psychology, 95, 96-107.
Gunkelman, J. D., & Johnstone, J. (2005). Neurofeedback and the brain. Journal of Adult
Development, 12(2), 93-98.
Gurnee, R. (2003). QEEG subtypes of anxiety. Abstract. International Society for Neurofeedback
and Research. Annual Meeting 2003. (as cited in J. E. Walker. Anxiety associated with
post-traumatic stress disorder—The role of quantitative electro-encephalograph in
diagnosis and in guiding neurofeedback training to remediate anxiety.
Biofeedback, 37(2), 67-70.
Halder, S., Varkuti, B., Bogdan, M., Kübler, A., Rosenstiel, W., Sitaram, R., & Birbaumer, N.
(2013). Prediction of brain-computer interface aptitude from individual brain structure.
Frontiers in Human Neuroscience, 7.
Hammer, E. M., Halder, S., Blankertz, B., Sannelli, C., Dickhaus, T., Kleih, S., ... & Kübler, A.
(2012). Psychological predictors of SMR-BCI performance. Biological Psych., 89(1),
80-86.
Hammond, D.C., & Gunkelman J. (2001). The art of artifacting. Corpus Christi, TX: Inter-
national Society for Neuronal Regulation.

169
Hammond, D. C. (2003). QEEG-guided neurofeedback in the treatment of obsessive compulsive
disorder. Journal of Neurotherapy, 7(2), 25-52.
Hammond, D.C. (2008). “Comprehensive Neurofeedback Bibliography: 2007 Update”. Journal
of Neurotherapy, 11:3, 45-60.
Hammond, D. C. (2011a). What is neurofeedback: An update. Journal of Neurotherapy, 15(4),
305-336.
Hammond, D. C. (2011b). Placebos and neurofeedback: A case for facilitating and maximizing
placebo response in neurofeedback treatments. Journal of Neurotherapy, 15(2), 94-114.
Hardman, E., Gruzelier, J., Cheesman, K., Jones, C., Liddiard, D., Schleichert, H., & Birbaumer,
N. (1997). Frontal interhemispheric asymmetry: Self regulation and individual
differences in humans. Neuroscience Letters, 221(2), 117-120.
Hardt, J. V., & Kamiya, J. (1978). Anxiety change through electroencephalographic alpha
feedback seen only in high anxiety subjects. Science, 201: 79-81.
Hebb, D. O. (1949, reprint 2013). The Organization of Behavior a Neuropsychological Theory.
New York, NY: John Wiley; London: Great Britain: Chapman and Hall, Ltd.
Hein, T. C., & Monk, C. S. (2017). Research Review: Neural response to threat in children,
adolescents, and adults after child maltreatment–a quantitative meta‐analysis. Journal of
Child Psychology and Psychiatry, 58(3), 222-230.
Herrmann, C. S., Strüber, D., Helfrich, R. F., & Engel, A. K. (2016). EEG oscillations: From
correlation to causality. International Journal of Psychophysiology, 103, 12-21.
Hinterberger, T., Weiskopf, N., Veit, R., Wilhelm, B., Betta, E., & Birbaumer, N. (2004). An
EEG-driven brain-computer interface combined with functional magnetic resonance
imaging (fMRI). IEEE Transactions on Biomedical Engineering, 51(6), 971-974.
170
Hockey, R. (2013). The Psychology of Fatigue. Cambridge, UK: Cambridge University Press.
(as cited in L. J. Trejo, K. Kubitz, R. Rosipal, R. L. Kochavi, & L. D. Montgomery,
(2015). EEG-based estimation and classification of mental fatigue. Psychology, 6(05),
572.
Hoedlmoser, K., Pecherstorfer, T., Gruber, G., Anderer, P., Doppelmayr, M., Klimesch, W., &
Schabus, M. (2008). Instrumental conditioning of human sensorimotor rhythm (12-15
Hz) and its impact on sleep as well as declarative learning. Sleep, 31(10), 1401-1408.
Hofmann, S. G., Asnaani, A., Vonk, I. J., Sawyer, A. T., & Fang, A. (2012). The efficacy of
cognitive behavioral therapy: A review of meta-analyses. Cognitive Therapy and
Research, 36(5), 427-440.
Holtmann, M., Steiner, S., Hohmann, S., Poustka, L., Banaschewski, T., & Bölte, S. (2011).
Neurofeedback in autism spectrum disorders. Developmental Medicine & Child
Neurology, 53(11), 986-993.
Holtmann, M., Pniewski, B., Wachtlin, D., Wörz, S., & Strehl, U. (2014). Neurofeedback in
children with attention-deficit/hyperactivity disorder (ADHD)–A controlled multicenter
study of a non-pharmacological treatment approach. BMC Pediatrics, 14(1), 202.
Horschig, J. M., Zumer, J. M., & Bahramisharif, A. (2014). Hypothesis-driven methods to
augment human cognition by optimizing cortical oscillations. Frontiers in Systems
neuroscience, 8.
Huang-Storms, L., Bodenhamer-Davis, E., Davis, R., & Dunn, J. (2007). QEEG-guided
neurofeedback for children with histories of abuse and neglect: Neurodevelopmental
rationale and pilot study. Journal of Neurotherapy, 10(4), 3-16.
Hughes, J.R., & John, E.R. (1999). Conventional and quantitative electroencephalography in
171
psychiatry. J Neuropsychiatry Clin Neurosci, 11: 190-2006.
ICD-10 (1992). See World Health Organization entry.
Jasper, H., & Shagass, C. (1941). Conditioning of the occipital alpha rhythm in man. Journal of
Experimental Psychology, 28(5), 373-388.
Jasper, H. H. (1957). Report of the committee on methods of clinical examination in electro-
encephalography. Electroenceph. Clin. Neurophysiol, 10 (2), 370-375.
Jeunet, C., Jahanpour, E., & Lotte, F. (2016). Why standard brain-computer interface (BCI)
training protocols should be changed: An experimental study. Journal of Neural
Engineering, 13(3), 036024.
Johnston, S. J., Boehm, S. G., Healy, D., Goebel, R., & Linden, D. E. (2010). Neurofeedback: A
promising tool for the self-regulation of emotion networks. Neuroimage, 49(1), 1066-
1072.
Johnston, S., Linden, D. E., Healy, D., Goebel, R., Habes, I., & Boehm, S. G. (2011). Up-
regulation of emotion areas through neurofeedback with a focus on positive mood.
Cognitive, Affective, & Behavioral Neuroscience, 11(1), 44-51.
Johnstone, J., Gunkelman, J., & Lunt, J. (2005). Clinical database development: Characterization
of EEG phenotypes. Clinical EEG and Neuroscience, 36(2), 99-107.
Jurewicz, K., Paluch, K., Kublik, E., Rogala, J., Mikicin, M., & Wróbel, A. (2018). EEG-neuro-
feedback training of beta band (12–22 Hz) affects alpha and beta frequencies–A
controlled study of a healthy population. Neuropsychologia, 108, 13-24.
Kamiya, J. (1966). Trained control of EEG Alpha Frequency in Humans. Invited presentation,
California: Stanford University, Palo Alto. (as cited in Strehl, U. (2014). What learning
theories can teach us in designing neurofeedback treatments. Frontiers in Human

172
Neuroscience, 8.)
Kantor, E. D., Rehm, C. D., Haas, J. S., Chan, A. T., & Giovannucci, E. L. (2015). Trends in
prescription drug use among adults in the United States from 1999-2012. Jama, 314(17),
1818-1830.
Karg, R. S., Bose, J., Batts, K. R., Forman-Hoffman, V. L., Liao, D., Hirsch, E., Pemberton, M.
R., Colpe, L. J., & Hedden, S. L. (2014). CBHSQ Data Review: Past year mental
disorders among adults in the United States: Results from the 2008–2012 Mental Health
Surveillance Study. Rockville, MD: Center for Behavioral Health Statistics and Quality,
Substance Abuse and Mental Health Services Administration.
Kerson, C., Sherman, R. A., & Kozlowski, G. P. (2009). Alpha suppression and symmetry
training for generalized anxiety symptoms. Journal of Neurotherapy, 13(3), 146-155.
Kerson, C. (2013). Neurofeedback Bibliography. San Jose, CA: Attention and Achievement
Center.
Kessler, R. C., Chiu, W. T., Demler, O., & Walters, E. E. (2005). Prevalence, severity, and
comorbidity of 12-month DSM-IV disorders in the National Comorbidity Survey
Replication. Archives of General Psychiatry, 62(6), 617-627.
Kessler, R.C., Berglund, P., Demler, O., Jin, R., Merikangas, K.R., & Walters, E.E. (2005).
Lifetime prevalence and age-of-onset distributions of DSM-IV disorders in the National
Comorbidity Survey Replication. Arch. Gen. Psychiatry, 62: 593–602.
Kessler, R. C., Ruscio, A. M., Shear, K., & Wittchen, H.-U. (2009). Epidemiology of anxiety
disorders. In Behavioral Neurobiology of Anxiety and its Treatment (pp. 21-35). Heidel-
berg, Germany: Springer.
Kirk, H. W. (2015). Changing the paradigm from neurochemical to neuroelectrical models. In:
173
Restoring the Brain: Neurofeedback as an Integrative Approach to Health. Boca Raton,
Fl: CRC Press.
Kirschbaum, J., & Gistl, E. (1973). Correlations of relative alpha amplitude in EEG, alpha
feedback, anxiety scores from MAS and MMQ. Archiv für Psychologie, 125: 263-273.
Kleih, S. C., & Kübler, A. (2013). Empathy, motivation, and P300 BCI performance. Frontiers
in human neuroscience, 7.
Klimesch, W. (1999). EEG alpha and theta oscillations reflect cognitive and memory perfor-
mance: a review and analysis. Brain Research Reviews, 29(2-3), 169-195.
Klimesch, W., Sauseng, P., & Hanslmayr, S. (2007). EEG alpha oscillations: the inhibition–
timing hypothesis. Brain Research Reviews, 53(1), 63-88.
Klimesch, W. (2012). Alpha-band oscillations, attention, and controlled access to stored infor-
mation. Trends in Cognitive Sciences, 16(12), 606-617.
Kluetsch, R. C., Ros, T., Théberge, J., Frewen, P. A., Calhoun, V. D., Schmahl, C., ... & Lanius,
R. A. (2014). Plastic modulation of PTSD resting‐state networks and subjective well-
being by EEG neurofeedback. Acta Psychiatrica Scandinavica, 130(2), 123-136.
Knight, M., & Mather, M. (2013). Look out – It’s your off-peak time of day! Time of day
matters more for alerting than for orienting or executive attention. Exp. Aging Res. 39,
305–321.
Knyazev, G. G., Savostyanov, A. N., & Levin, E. A. (2004). Alpha oscillations as a correlate of
trait anxiety. International Journal of Psychophysiology, 53(2), 147-160.
Knyazev, G. G., Savostyanov, A. N., & Levin, E. A. (2006). Alpha synchronization and anxiety:
Implications for inhibition vs. alertness hypotheses. International Journal of Psycho-
physiology, 59(2), 151-158.
174
Kober, S. E., Witte, M., Ninaus, M., Neuper, C., & Wood, G. (2013). Learning to modulate one’s
own brain activity: The effect of spontaneous mental strategies. Frontiers in Human
Neuroscience, 7, 695.
Kober, S. E., Witte, M., Stangl, M., Väljamäe, A., Neuper, C., & Wood, G. (2015). Shutting
down sensorimotor interference unblocks the networks for stimulus processing: An SMR
neurofeedback training study. Clinical Neurophysiology, 126(1), 82-95.
Kohn, P. M., Kantor, L., DeCicco, T. L., & Beck, A. T. (2008). The Beck Anxiety Inventory-
Trait (BAIT): A measure of dispositional anxiety not contaminated by dispositional
depression. Journal of Personality Assessment, 90: 499–506.
Kotchoubey, B., Strehl, U., Holzapfel, S., Blankenhorn, V., Fröscher, W., & Birbaumer, N.
(1999). Negative potential shifts and the prediction of the outcome of neurofeedback
therapy in epilepsy. Clinical Neurophysiology, 110(4), 683-686.
Kotchoubey, B., Strehl, U., Uhlmann, C., Holzapfel, S., König, M., Fröscher, W., ... &
Birbaumer, N. (2001). Modification of slow cortical potentials in patients with refractory
epilepsy: a controlled outcome study. Epilepsia, 42(3), 406-416.
Kouijzer, M. E., de Moor, J. M., Gerrits, B. J., Congedo, M., & van Schie, H. T. (2009).
Neurofeedback improves executive functioning in children with autism spectrum dis-
orders. Research in Autism Spectrum Disorders, 3(1), 145-162.
Kraft, U. (2006). Train Your Brain-Mental exercises with neurofeedback may ease symptoms of
attention-deficit disorder, epilepsy and depression--and even boost cognition in healthy
brains. Scientific American MIND. February 1, 2006.https://www.scientificamerican.com/
article/train-your-brain-2007-06/.
Krishnan, V. K., Dasari, D., & Ding, L. (2014). EEG Correlates of Fluctuation in Cognitive
175
Performance in an Air Traffic Control Task. Technical Report DOT/FAA/AM-14/12.
Washington DC: Office of Aerospace Medicine, Federal Aviation Administration; (as
cited in L. J. Trejo, K. Kubitz, R. Rosipal, R. L. Kochavi, & L. D. Montgomery. (2015).
EEG-based estimation and classification of mental fatigue. Psychology, 6(05), 572).
Kroenke, K., Spitzer, R. L., & Williams, J. B. (2001). The PHQ‐9. Journal of General Internal
Medicine, 16(9), 606-613.
Kroenke, K., & Spitzer, R. L. (2002). The PHQ-9: A new depression diagnostic and severity
measure. Psychiatric Annals, 32(9), 509-515.
Laborde, S., Mosley, E., & Thayer, J. F. (2017). Heart Rate Variability and Cardiac Vagal Tone
in Psychophysiological Research–Recommendations for Experiment Planning, Data
Analysis, and Data Reporting. Frontiers in Psychology, 8.
Lacroix, J. M. (1981). The Acquisition of Autonomic Control through Biofeedback: The Case
Against an Afferent Process and a Two‐Process Alternative. Psychophysiology, 18(5),
573-587.
Lambos, W. A., & Williams, R. A. (2015). Treating Anxiety Disorders Using Z-Scored EEG
Neurofeedback. In R. W. Thatcher, & J. F. Lubar (Eds.), (2014). Z score neurofeedback:
Clinical applications. Cambridge, MA: Academic Press. (pp. 189-217).
Lansbergen, M. M., van Dongen-Boomsma, M., Buitelaar, J. K., & Slaats-Willemse, D. (2011).
ADHD and EEG-neurofeedback: A double-blind randomized placebo-controlled
feasibility study. Journal of Neural Transmission, 118(2), 275-284.
Lau, T. M., Gwin, J. T., & Ferris, D. P. (2012). How many electrodes are really needed for EEG-
based mobile brain imaging? Journal of Behavioral and Brain Science, 2(03), 387.
La Vaque, T. J., & Rossiter, T. (2001). The ethical use of placebo controls in clinical research:
176
The Declaration of Helsinki. Applied Psychophysiology and Biofeedback, 26(1), 23-37.
La Vaque, T. J., Hammond, D. C., Trudeau, D., Monastra, V., Perry, J., Lehrer, P., ... &
Sherman, R. (2002). Template for developing guidelines for the evaluation of the clinical
efficacy of psychophysiological interventions. Applied Psychophysiology and
Biofeedback, 27(4), 273.
LeDoux, J. (2012). Rethinking the emotional brain. Neuron, 73(4), 653-676.
Leins, U., Goth, G., Hinterberger, T., Klinger, C., Rumpf, N., & Strehl, U. (2007). Neurofeed-
back for children with ADHD: A comparison of SCP and Theta/Beta protocols. Applied
Psychophysiology and Biofeedback, 32(2), 73-88.
Levenson, H. (1981). Differentiating among internality, powerful others, and chance. In H. M.
Lefcourt, (1981). Research with the locus of control construct, vol.1: Assessment
methods. pp. 15-63. New York, NY: Academic Press.
Levine, J. C., Fleming, R., Piedmont, J. I., Cain, S. M., & Chen, W. J. (2016). Heart rate
variability and generalized anxiety disorder during laboratory-induced worry and
aversive imagery. Journal of Affective Disorders, 205, 207-215.
Lin, Y. (2016). Robust inference for responder analysis: Innovative clinical trial design using a
minimum p-value approach. Contemporary Clinical Trials Communications, 3, 65-69.
Lotte, F., & Jeunet, C. (2015, January). Towards improved BCI based on human learning
principles. In Brain-Computer Interface (BCI), 2015 3rd International Winter
Conference on (pp. 1-4). IEEE.
Löwe, B., Decker, O., Müller, S., Brähler, E., Schellberg, D., Herzog, W., & Herzberg, P. Y.
(2008). Validation and standardization of the Generalized Anxiety Disorder Screener
(GAD-7) in the general population. Medical Care, 46(3), 266-274.

177
Lu, Y., Wang, C, Su, L., Ma, Z., Li, S., & Fan, Y. (2017). Effects of Neurofeedback on Panic
Disorder Patients’ Anxiety. NeuroQuantology, 15(3).
Lueken, U., Zierhut, K. C., Hahn, T., Straube, B., Kircher, T., Reif, A., ... & Domschke, K.
(2016). Neurobiological markers predicting treatment response in anxiety disorders: A
systematic review and implications for clinical application. Neuroscience and Bio-
behavioral Reviews, 66, 143-162.
Lutz, A., Greischar, L. L., Rawlings, N. B., Ricard, M., & Davidson, R. J. (2004). Long-term
meditators self-induce high-amplitude gamma synchrony during mental practice.
Proceedings of the National Academy of Sciences of the United States of America,
101(46), 16369-16373.
Lyonfields, J. D., Borkovec, T. D., & Thayer, J. F. (1995). Vagal tone in generalized anxiety
disorder and the effects of aversive imagery and worrisome thinking. Behavior
Therapy, 26(3), 457-466.
McLean, C. P., Asnaani, A., Litz, B. T., & Hofmann, S. G. (2011). Gender differences in anxiety
disorders: prevalence, course of illness, comorbidity and burden of illness. Journal of
Psychiatric Research, 45(8), 1027-1035.
Maeng, L. Y., Cover, K. K., Taha, M. B., Landau, A. J., Milad, M. R., & Lebrón‐Milad, K.
(2017). Estradiol shifts interactions between the infralimbic cortex and central amygdala
to enhance fear extinction memory in female rats. Journal of Neuroscience Research,
95(1-2), 163-175.
Majda, A. J., & Harlim, J. (2012). Physics constrained nonlinear regression models for time
series. Nonlinearity, 26(1), 201.
Malmo, R.B. (1957). Anxiety and behavioral arousal. Psychological Review, 64: 276-287. (as

178
cited in J. V. Hardt & J. Kamiya, (1978). Anxiety change through electroencephalo-
graphic alpha feedback seen only in high anxiety subjects. Science, 201: 79-81).
Marzbani, H., Marateb, H. R., and Mansourian, M. (2016). Neurofeedback: A comprehensive
review on system design, methodology and clinical applications. Basic and Clinical
Neuroscience, 7(2), 143.
Mayer, K. (2013). Neurofeedback of Slow Cortical Potentials for Adults with Attention Deficit-
/Hyperactivity Disorder (Unpublished Doctoral Dissertation). University of Tuebingen,
Tuebingen, Germany.
Mayer, K., Blume, F., Wyckoff, S. N., Brokmeier, L. L., & Strehl, U. (2016). Neurofeedback of
slow cortical potentials as a treatment for adults with Attention Deficit-/Hyperactivity
Disorder. Clinical Neurophysiology, 127(2), 1374-1386.
McNair, D. M., Lorr, M., & Droppleman, L. F. (1971). Manual: Profile of mood states. San
Diego: Educational and Industrial Testing Service.
Mennella, R., Patron, E., & Palomba, D. (2017). Frontal alpha asymmetry neurofeedback for the
reduction of negative affect and anxiety. Behaviour Research and Therapy, 92, 32-40.
Menon, V. (2011). Large-scale brain networks and psychopathology: A unifying triple network
model. Trends in Cognitive Sciences, 15(10), 483-506.
Mertler, C. A. & Vannatta, R. A. (2013). Advanced and multivariate statistical methods:
Practical application and interpretation (5th ed.). Glendale, CA: Pyrczak Publishing.
Micoulaud-Franchi, J. A., Geoffroy, P. A., Fond, G., Lopez, R., Bioulac, S., & Philip, P. (2014).
EEG neurofeedback treatments in children with ADHD: an updated meta-analysis of
randomized controlled trials. Frontiers in Human Neuroscience, 8.
Mills, G. K., & Solyom, L. (1974). Biofeedback of EEG alpha in the treatment of obsessive
179
ruminations: An exploration. Journal of Behavior Therapy and Experimental Psychiatry,
5(1), 37-41.
Mineka, S., & Zinbarg, R. (2006). A contemporary learning theory perspective on the etiology of
anxiety disorders: It's not what you thought it was. American Psychologist, 61(1), 10.
Mierau, A., Klimesch, W., & Lefebvre, J. (2017). State-dependent alpha peak frequency shifts:
Experimental evidence, potential mechanisms and functional implications. Neuroscience,
360, 146-154.
Mirifar, A., Beckmann, J., & Ehrlenspiel, F. (2017). Neurofeedback as Supplementary Training
for Optimizing Athletes’ Performance: A Systematic Review with Implications for Future
Research. Neuroscience & Biobehavioral Reviews.
Mirman, D., Dixon, J. A., & Magnuson, J. S. (2008). Statistical and computational models of the
visual world paradigm: Growth curves and individual differences. Journal of Memory
and Language, 59(4), 475-494.
Mirman, D. (2014). Growth curve analysis and visualization using R (p. 168). Boca Raton, FL:
CRC Press.
Mitchell, D. C., Knight, C. A., Hockenberry, J., Teplansky, R., & Hartman, T. J. (2014).
Beverage caffeine intakes in the US. Food and Chemical Toxicology, 63, 136-142.
Monastra, V.J., Lynn, S., & Linden, M. (2005). Electroencephalographic Biofeedback in the
Treatment of Attention-Deficit/Hyperactivity Disorder. Applied Psychophysiology and
Biofeedback, 30: 95-114.
Moore, N. C. (2000). A review of EEG biofeedback treatment of anxiety disorders. Clinical
Electroencephalography, 31: 1– 6
Moore, T. J., & Mattison, D. R. (2017). Adult utilization of psychiatric drugs and differences by

180
sex, age, and race. JAMA Internal Medicine, 177(2), 274-275.
Moradi, A., Pouladi, F., Pishva, N., Rezaei, B., Torshabi, M., & Mehrjerdi, Z. A. (2011). Treat-
ment of anxiety disorder with neurofeedback: Case study. Procedia-Social and
Behavioral Sciences, 30, 103-107.
Moriyama, T. S., Polanczyk, G., Caye, A., Banaschewski, T., Brandeis, D., & Rohde, L. A.
(2012). Evidence-based information on the clinical use of neurofeedback for ADHD.
Neurotherapeutics, 9(3), 588-598.
Murphy, A. C., & Bassett, D. S. (2017). A network neuroscience of neurofeedback for clinical
translation. Current Opinion in Biomedical Engineering.
Nebel-Schwalm, M. S., & Davis III, T. E. (2013). Nature and etiological models of anxiety
disorders. In: Handbook of treating variants and complications in anxiety disorders (pp.
3-21). New York, NY: Springer.
Nijboer, F., Birbaumer, N., & Kübler, A. (2010). The influence of psychological state and
motivation on brain–computer interface performance in patients with amyotrophic lateral
sclerosis–a longitudinal study. Frontiers in Neuroscience, 4.
Ninaus, M., Kober, S. E., Witte, M., Koschutnig, K., Neuper, C., & Wood, G. (2015). Brain
volumetry and self-regulation of brain activity relevant for neurofeedback. Biological
Psychology, 110, 126-133.
Ninaus, M., Kober, S. E., Witte, M., Koschutnig, K., Stangl, M., Neuper, C., & Wood, G. (2013).
Neural substrates of cognitive control under the belief of getting neurofeedback training.
Frontiers in Human Neuroscience, 7.
Niv, S. (2013). Clinical efficacy and potential mechanisms of neurofeedback. Personality and
Individual Differences, 54(6), 676-686.
181
Niedermeyer, E., & Lopes da Silva, F. H. (1999). Electroencephalography: Basic principles,
clinical applications and related fields, 4th edition. Philadelphia, PA: Lippincott, Williams,
& Wilkins.
O'Connor, P. J. (2004). Evaluation of four highly cited energy and fatigue mood measures. Journal
of Psychosomatic Research, 57(5), 435-441.
Olbrich, S., van Dinteren, R., & Arns, M. (2015). Personalized medicine: Review and
perspectives of promising baseline EEG biomarkers in major depressive disorder and
attention deficit hyperactivity disorder. Neuropsychobiology, 72(3-4), 229-240.
Olejarczyk, E., Bogucki, P., & Sobieszek, A. (2017). The EEG split alpha peak: Phenomeno-
logical origins and methodological aspects of detection and evaluation. Frontiers in
Neuroscience, 11, 506.
Orne, M. T., & Paskewitz, D. A. (1974). Aversive situational effects on alpha feedback training
Science, 186 (4162), 458-460.
Othmer, S., Othmer, S. F., Kaiser, D. A., & Putman, J. (2013). Endogenous neuromodulation at
infra-low frequencies. Seminars in Pediatric Neurology, 20, 246–260.
Paluch, K., Jurewicz, K., Rogala, J., Krauz, R., Szczypińska, M., Mikicin, M., & Kublik, E.
(2017). Beware: Recruitment of Muscle Activity by the EEG-Neurofeedback Trainings
of High Frequencies. Frontiers in Human Neuroscience, 11.
Paul, M., Ganesan, S., & Sandhu, J. S. (2011). Effect of sensory motor rhythm neurofeedback on
psycho-physiological, electro-encephalographic measures and performance of archery
players. Ibnosina Journal of Medicine and Biomedical Sciences, 4(2), 32-39.
Pavlov, I. P. (1960). Conditioned reflex: An investigation of the physiological activity of the
cerebral cortex (G.V. Anrep, Ed. and trans.). New York, NY: Dover. (Originally
182
published in 1927).
Peeters, F., Ronner, J., Bodar, L., van Os, J., & Lousberg, R. (2014). Validation of a neurofeed-
back paradigm: manipulating frontal EEG alpha-activity and its impact on mood.
International Journal of Psychophysiology, 93(1), 116-120.
Pedersen, C.B., Mors, O., Bertelsen, A, Waltoft, B.L., Agerbo, E., … & Eaton, W. A. (2014).
Comprehensive Nationwide Study of the Incidence Rate and Lifetime Risk for Treated
Mental Disorders. JAMA Psychiatry, 71(5):573–581.
Peniston, E. G., & Kulkosky, P. J. (1989). α‐θ Brainwave Training and β‐Endorphin Levels in
Alcoholics. Alcoholism: Clinical and Experimental Research, 13(2), 271-279.
Peniston, E. G., & Kulkosky, P. J. (1991). Alpha-theta brainwave neurofeedback for Vietnam
veterans with combat-related post-traumatic stress disorder. Medical Psychotherapy,
4(1), 47-60.
Peniston, E. G., & Saxby, E. (1995). Alpha-theta brainwave neurofeedback training: An effective
treatment for male and female alcoholics with depressive symptoms. Journal of Clinical
Psychology, 51(5).
Perreau-Linck, E., Lessard, N., Lévesque, J., & Beauregard, M. (2010). Effects of neurofeedback
training on inhibitory capacities in ADHD children: A single-blind, randomized, placebo-
controlled study. Journal of Neurotherapy, 14(3), 229-242.
Pfurtscheller, G. (1999). Event-Related Desynchronization (ERD) and Event-Related Synchroni-
zation (ERS). In: E. Niedermeyer, & F. H. Lopes da Silva (Eds.), Electroencephalo-
graphy: Basic Principles, Clinical Applications and Related Fields, Fourth Edition (pp.
958-968). Philadelphia, PA: Lippincott, Williams, & Wilkins.
Phneah, S. W., & Nisar, H. (2017). EEG-based alpha neurofeedback training for mood enhance-
183
ment. Australasian Physical and Engineering Sciences in Medicine, 1-12.
Pineda, J. A., Brang, D., Hecht, E., Edwards, L., Carey, S., Bacon, M., ... & Rork, A. (2008).
Positive behavioral and electrophysiological changes following neurofeedback training in
children with autism. Research in Autism Spectrum Disorders, 2(3), 557-581.
Plotkin, W. B., & Rice, K. M. (1981). Biofeedback as a Placebo: Anxiety Reduction Facilitated
by Training in Either Suppression or Enhancement of Alpha Brainwaves. Journal of
Counseling and Clinical Psychology, 49: 590-596.
Porges S.W. (1995). Orienting in a defensive world: Mammalian modifications of our evolut-
ionary heritage: A Polyvagal Theory. Psychophysiology. 32:301–318.
Porges, S. W. (2007). The polyvagal perspective. Biological Psychology, 74(2), 116-143.
Raymond, J., Varney, C., Parkinson, L. A., & Gruzelier, J. H. (2005). The effects of Alpha/Theta
neurofeedback on personality and mood. Cognitive Brain Research, 23(2), 287-292.
Raz, A., & Michels, R. (2007). Contextualizing specificity: Specific and non-specific effects of
treatment. American Journal of Clinical Hypnosis, 50(2), 177-182.
Redelmeier, D. A., & Dickinson, V. M. (2011). Determining whether a patient is feeling better:
pitfalls from the science of human perception. Journal of General Internal Medicine,
26(8), 900-906.
Reiner, M., Rozengurt, R., & Barnea, A. (2014). Better than sleep: Theta neurofeedback training
accelerates memory consolidation. Biological Psychology, 95, 45-53.
Reiter, K., Andersen, S. B., & Carlsson, J. (2016). Neurofeedback treatment and posttraumatic
stress disorder: Effectiveness of neurofeedback on posttraumatic stress disorder and the
optimal choice of protocol. The Journal of Nervous and Mental Disease, 204(2), 69-77.
Rheinberg, F., Vollmeyer, R., & Burns, B. D. (2001). FAM: Ein Fragebogen zur Erfassung
184
aktueller Motivation in Lern-und Leistungssituationen (Langversion, 2001).
Diagnostica, 2, 57-66.
Rice, K. M., Blanchard, E.B., & Purcell, M. (1993). Biofeedback treatment of generalized
anxiety disorder: Preliminary results. Biofeedback and Self-Regulation, 18: 93-105.
Rief, W., Hofmann, S. G., & Nestoriuc, Y. (2008). The power of expectation – Understanding
the placebo and nocebo phenomenon. Social and Personality Psychology Compass, 2(4),
1624-1637.
Rockstroh, B., Elbert, T., Birbaumer, N., Wolf, P., Düchting-Röth, A., Reker, M., ... & Dichgans,
J. (1993). Cortical self-regulation in patients with epilepsies. Epilepsy Research, 14(1),
63-72.
Roberts, A. H., Kewman, D. G., Mercier, L., & Hovell, M. (1993). The power of non-specific
effects in healing: Implications for psychosocial and biological treatments. Clinical
Psychology Review, 13(5), 375-391.
Rogala, J., Jurewicz, K., Paluch, K., Kublik, E., Cetnarski, R., & Wróbel, A. (2016). The Do's
and Don'ts of Neurofeedback Training: A Review of the Controlled Studies Using
Healthy Adults. Frontiers in Human Neuroscience, 10.
Ros, T., Théberge, J., Frewen, P. A., Kluetsch, R., Densmore, M., Calhoun, V. D., & Lanius, R.
A. (2013). Mind over chatter: plastic up-regulation of the fMRI salience network directly
after EEG neurofeedback. Neuroimage, 65, 324-335.
Ros, T., Baars, B. J., Lanius, R. A., & Vuilleumier, P. (2014). Tuning pathological brain oscilla-
tions with neurofeedback: A systems neuroscience framework. Frontiers in Human
Neuroscience, 8.
Rotter, J. B. (1966). Generalized expectancies for internal versus external control of reinforce-
185
ment. Psychological Monographs: General and Applied, 80(1), 1.
Sadjadi, S. A., & Hashemian, P. (2014). Effectiveness of Neurofeedback Therapy in Children
with Separation Anxiety Disorder. J Psychiatry, 17(1000149), 2.
Sadock, B., Sadock, V., & Ruiz, P. (Eds.) (2015). Kaplan & Sadock’s Synopsis of Psychiatry.
Philadelphia, PA: Lippinott, Wiliams, & Wilkins.
Sartorius, N., Üstün, T. B., Lecrubier, Y., & Wittchen, H. U. (1996). Depression comorbid with
anxiety: Results from the WHO study on pychological disorders in primary health care.
The British Journal of Psychiatry. (as cited in B. Bandelow, & S. Michaelis (2015).
Epidemiology of anxiety disorders in the 21st century. Dialogues in Clinical Neuro-
science, 17(3), 327).
Sarkar, P., Rathee, S. P., & Neera, N. (1999). Comparative Efficacy of Pharmacotherapy and
Biofeedback among Cases of Generalised Anxiety Disorder. Journal of Projective
Psychology and Mental Health, 6: 69-77.
Sargunaraj, D., Kumaraiah, V., Mishra, H., & Kumar, K.A. (1987). A Comparison of the
efficacy of electromyograph and alpha biofeedback therapy in anxiety neurosis.
NIMHANS Journal, 5:103-107.
Sauseng, P., Klimesch, W., Schabus, M., & Doppelmayr, M. (2005). Fronto-parietal EEG
coherence in theta and upper alpha reflect central executive functions of working
memory. International Journal of Psychophysiology, 57(2), 97-103.
Schabus, M., Heib, D., Lechinger, J., Griessenberger, H., …& Hoedlmoser, K. (2014).
Enhancing sleep quality and memory in insomnia using instrumental sensorimotor
rhythm conditioning. Biological Psychology 95: 126-134.
Schabus, M., Griessenberger, H., Gnjezda, M. T., Heib, D. P., Wislowska, M., & Hoedlmoser,
186
K. (2017). Better than sham? A double-blind placebo-controlled neurofeedback study in
primary insomnia. Brain, 140(4), 1041-1052.
Scheinost, D., Stoica, T., Saksa, J., Papademetris, X., ConsTable, R. T., Pittenger, C., &
Hampson, M. (2013). Orbitofrontal cortex neurofeedback produces lasting changes in
contamination anxiety and resting-state connectivity. Translational Psychiatry, 3(4), e250.
Schneider, R. L., Arch, J. J., & Wolitzky-Taylor, K. B. (2015). The state of personalized treat-
ment for anxiety disorders: A systematic review of treatment moderators. Clinical
Psychology Review, 38, 39-54.
Schoenberg, P. L., & David, A. S. (2014). Biofeedback for psychiatric disorders: A systematic
review. Applied Psychophysiology and Biofeedback, 39(2), 109-135.
Schönenberg, M., Wiedemann, E., Schneidt, A., Scheeff, J., Logemann, A., Keune, P. M., &
Hautzinger, M. (2017). Neurofeedback, sham neurofeedback, and cognitive-behavioural
group therapy in adults with attention-deficit hyperactivity disorder: A triple-blind,
randomised, controlled trial. The Lancet Psychiatry, 4(9), 673-684.
Sheiner, E. O., Lifshitz, M., & Raz, A. (2016). Placebo response correlates with hypnotic
suggestibility. Psychology of Consciousness: Theory, Research, and Practice, 3(2), 146.
Sherlin, L. H., Arns, M., Lubar, J., Heinrich, H., Kerson, C., Strehl, U., & Sterman, M. B.
(2011). Neurofeedback and basic learning theory: implications for research and
practice. Journal of Neurotherapy, 15(4), 292-304.
Sherman, S. M., Buckley, T. P., Baena, E., & Ryan, L. (2016). Caffeine enhances memory
performance in young adults during their non-optimal time of day. Frontiers in
psychology, 7.
Simkin, D.R., Thatcher, R.W., & Lubar, L. (2014). Quantitative EEG and Neurofeedback in

187
Children and Adolescents: Anxiety Disorders, Depressive Disorders, Comorbid
Addiction and Attention-deficit/Hyperactivity Disorder, and Brain Injury. Child Adolesc
Psychiatric Clin N Am, 23: 427-464.
Singer, K. (2004). The effect of neurofeedback on performance anxiety in dancers. Journal of
Dance, Medicine, & Science, 8(3), 78-81.
Sitaram, R., Lee, S., Ruiz, S., Rana, M., Veit, R., & Birbaumer, N. (2011). Real-time support
vector classification and feedback of multiple emotional brain states. Neuroimage, 56(2),
753-765.
Sitaram, R., Ros, T., Stoeckel, L., Haller, S., Scharnowski, F., Lewis-Peacock, J., ... &
Birbaumer, N. (2017). Closed-loop brain training: The science of neurofeedback. Nature
Reviews Neuroscience, 18(2), 86-100.
Sittenfeld, P., Budzynski, T., & Stoyva, J. (1976). Differential shaping of EEG theta rhythms.
Applied Psychophysiology and Biofeedback, 1(1), 31-46.
Skinner, B. F. (1948, 1992 reprint). "Superstition" in the pigeon. Journal of Experimental
Psychology: General, 121(3), 273.
Smets, E. M. A., Garssen, B., Bonke, B. D., & De Haes, J. C. J. M. (1995). The Multidimen-
sional Fatigue Inventory (MFI) psychometric qualities of an instrument to assess
fatigue. Journal of Psychosomatic Research, 39(3), 315-325.
Smith, E. R., & DeCoster, J. (2000). Dual-process models in social and cognitive psychology:
Conceptual integration and links to underlying memory systems. Personality and social
psychology review, 4(2), 108-131.
Smith, M. L., Collura, T. F., Ferrera, J., & de Vries, J. (2014). Infra-slow fluctuation training in
clinical practice: A technical history. NeuroRegulation, 1(2), 187.
188
Snapinn, S. M., & Jiang, Q. (2007). Responder analyses and the assessment of a clinically
relevant treatment effect. Trials, 8(1), 31.
Sonuga-Barke, E. J., Brandeis, D., Cortese, S., Daley, D., Ferrin, M., Holtmann, M., ... &
Dittmann, R. W. (2013). Nonpharmacological interventions for ADHD: Systematic
review and meta-analyses of randomized controlled trials of dietary and psychological
treatments. American Journal of Psychiatry, 170(3), 275-289.
Soutar, R. G., & Longo, R. E. (2011). Doing neurofeedback: An introduction. San Rafael, CA:
ISNR Research Foundation.
Spielberger, C. D., Gorsuch, R. L., Lushene, P. R., Vagg, P. R., & Jacobs, A. G. (2015). State-
Trait Anxiety Inventory for Adults Manual. Palo Alto, CA: Mind Garden.
Spitzer, R. L., Kroenke, K., Williams, J. B., & Löwe, B. (1999). Patient Health Questionnaire
Primary Care Study Group: Validation and utility of a self-report version of PRIME-MD:
the PHQ primary care study. Jama, 282(18), 1737-1744.
Sterman, M. B., Howe, R. C., & MacDonald, L. R. (1970). Facilitation of spindle-burst sleep by
conditioning of electroencephalographic activity while awake. Science, 167(921), 1146-
1148.
Sterman, M. B. (1981). EEG biofeedback: Physiological behavior modification. Neuroscience &
Biobehavioral Reviews, 5(3), 405-412.
Sterman, M. B. (1996). Physiological origins and functional correlates of EEG rhythmic
activities: Implications for self-regulation. Applied Psychophysiology and Biofeedback,
21(1), 3-33.
Stewart-Williams, S., & Podd, J. (2004). The placebo effect: dissolving the expectancy versus
conditioning debate. Psychological Bulletin, 130(2), 324.
189
Stoeckel, L. E., Garrison, K. A., Ghosh, S. S., Wighton, P., Hanlon, C. A., Gilman, J. M., ... &
Thompson, T. (2014). Optimizing real time fMRI neurofeedback for therapeutic
discovery and development. NeuroImage: Clinical, 5, 245-255.
Strehl, U., Aggensteiner, P., Wachtlin, D., Brandeis, D., Albrecht, B., Arana, M., ... & Freitag, C.
M. (2017). Neurofeedback of Slow Cortical Potentials in Children with Attention-Deficit/
Hyperactivity Disorder: A Multicenter Randomized Trial Controlling for Unspecific
Effects. Frontiers in Human Neuroscience, 11.
Strehl U., Leins U., Goth G., Klinger C., Hinterberger T., & Birbaumer N. (2006). Self-regula-
tion of slow cortical potentials: A new treatment for children with attention-deficit/
hyperactivity disorder. Pediatrics;118(5).
Strehl, U., Kotchoubey, B., & Birbaumer, N. (2011). Epilepsien. In W. Rief and N. Birbaumer
(Eds.), Biofeedback, 3rd ed., pp. 262-280. Stuttgart, Germany: Schattauer.
Strehl, U. (2014). What learning theories can teach us in designing neurofeedback treatments.
Frontiers in Human Neuroscience, 8.
Strehl, U. (2013). Lerntheoretische Grundlagen und Überlegungen zum Neurofeedback. In
Neurofeedback, 1st ed. Stuttgart, Germany: Kohlhammer, 13-30.
Strehl, U. (2014). What learning theories can teach us in designing neurofeedback treatments. In
Heinrich, H., Strehl, U., Arns, M., Rothenberger, A., and Ros, T. (Eds.), (2016). Neuro-
feedback in ADHD. Lausanne, Switzerland: Frontiers Media, SA.
Studer, P., Kratz, O., Gevensleben, H., Rothenberger, A., Moll, G. H., Hautzinger, M., &
Heinrich, H. (2014). Slow cortical potential and theta/beta neurofeedback training in
adults: effects on attentional processes and motor system excitability. Frontiers in Human
Neuroscience, 8.
190
Sylvers, P., Lilienfeld, S. O., & Laprairie, J. L. (2011). Differences between trait fear and trait
anxiety: Implications for psychopathology. Clinical Psychology Review, 31(1), 122-137.
Tan, G., Thornby, J., Hammond, D. C., Strehl, U., Canady, B., Arnemann, K., & Kaiser, D. A.
(2009). Meta-analysis of EEG biofeedback in treating epilepsy. Clinical EEG and
Neuroscience, 40(3), 173-179.
Taylor, S., Abramowitz, J. S., & McKay, D. (2012). Non-adherence and non-response in the
treatment of anxiety disorders. Journal of Anxiety Disorders, 26(5), 583-589.
Teicher, M. H., & Parigger, A. (2015). The ‘Maltreatment and Abuse Chronology of Exposure’
(MACE) scale for the retrospective assessment of abuse and neglect during develop-
ment. PLoS One, 10(2), e0117423.
Teicher, M. H., Samson, J. A., Anderson, C. M., & Ohashi, K. (2016). The effects of childhood
maltreatment on brain structure, function and connectivity. Nature Reviews Neuro-
science, 17(10), 652-666.
Thatcher, R. W., & Lubar, J. F. (2008). History of the scientific standards of QEEG normative
databases. In T. Budzinsky, H. Budzinsky, J. Evans, and A. Abarbanel (Eds.).
Introduction to QEEG and neurofeedback: Advanced theory and applications. San
Diego, CA: Academic Press.
Thayer, R. E. (1986). Activation-deactivation adjective check list: Current overview and
structural analysis. Psychological Reports, 58(2), 607-614.
Thayer, R. E. (1989). The Biopsychology of Mood and Arousal. New York, NY: Oxford
University Press.
Thibault, R. T., Lifshitz, M., Birbaumer, N., & Raz, A. (2015). Neurofeedback, self-regulation,
and brain imaging: clinical science and fad in the service of mental disorders. Psycho-
191
therapy and Psychosomatics, 84(4), 193-207.
Thibault, R. T., Lifshitz, M., & Raz, A. (2017). Neurofeedback or neuroplacebo? Brain, 140(4),
862-864.
Thorndike, E. L. (1911). Animal intelligence: Experimental studies. New York, NY: Macmillan.
Trejo, L. J., Kubitz, K., Rosipal, R., Kochavi, R. L., & Montgomery, L. D. (2015). EEG-based
estimation and classification of mental fatigue. Psychology, 6(05), 572.
Uryniak, T., Chan, I. S., Fedorov, V. V., Jiang, Q., Oppenheimer, L., Snapinn, S. M., … &
Zhang, J. (2011). Responder analyses—A PhRMA position paper. Statistics in Bio-
pharmaceutical Research, 3(3), 476-487.
U.S. Census Bureau (2016). Population Estimates, 2012 - 2016. https://www.census.gov/
quickfacts/ fact/table/US/PST045217.
Vanathy, S., Sharma, P. S. V. N., & Kumar, K. B. (1998). “The efficacy of alpha and theta
neurofeedback training in treatment of generalised anxiety disorder”. Indian Journal of
Clinical Psychology, 25: 136-143.
Van Dongen-Boomsma, M., Vollebregt, M. A., Slaats-Willemse, D., & Buitelaar, J. K. (2013). A
randomized placebo-controlled trial of electroencephalographic (EEG) neurofeedback in
children with attention-deficit/hyperactivity disorder. J Clin Psychiatry, 74(8), 821-827.
Vermani, M., Marcus, M., & Katzman, M. A. (2011). Rates of detection of mood and anxiety
disorders in primary care: A descriptive, cross-sectional study. The Primary Care
Companion to CNS disorders, 13(2).
Vernon, D., Egner, T., Cooper, N., Compton, T., Neilands, C., Sheri, A., & Gruzelier, J. (2003).
The effect of training distinct neurofeedback protocols on aspects of cognitive
performance. International Journal of Psychophysiology, 47(1), 75-85.
192
Vernon, D. J. (2005). Can neurofeedback training enhance performance? An evaluation of the
evidence with implications for future research. Applied psychophysiology and Bio-
feedback, 30(4), 347.
Vernon, D., Dempster, T., Bazanova, O., Rutterford, N., Pasqualini, M., & Andersen, S. (2009).
Alpha neurofeedback training for performance enhancement: Reviewing the
methodology. Journal of Neurotherapy, 13(4), 214-227.
Vollebregt, M. A., Dongen‐Boomsma, M., Buitelaar, J. K., & Slaats‐Willemse, D. (2014). Does
EEG‐neurofeedback improve neurocognitive functioning in children with attention‐
deficit/hyperactivity disorder? A systematic review and a double‐blind placebo‐controlled
study. Journal of Child Psychology and Psychiatry, 55(5), 460-472.
Vollmann, K., Hautzinger, M., & Strehl, U. (2009). Entwicklung und Überprüfung eines Frage-
bogens zur Erfassung relevanter Therapiebedingungen (FERT) (Unpublished
dissertation). University of Tuebingen, Tuebingen, Germany.
Wager, T. D., & Atlas, L. Y. (2015). The neuroscience of placebo effects: connecting context,
learning and health. Nature Reviews Neuroscience, 16(7), 403-418.
Walker, J. E. (2009). Anxiety associated with post-traumatic stress disorder—The role of
quantitative electro-encephalograph in diagnosis and in guiding neurofeedback training to
remediate the anxiety. Biofeedback, 37(2), 67-70.
Walter, W. G., Cooper, R., Aldridge, V. J., McCallum, W. C., & Winter, A. L. (1964). Con-
tingent negative variation: An electric sign of sensorimotor association and expectancy in
the human brain. Nature, 203(4943), 380-384.
Wang, S., Zhao, Y., Chen, S., Lin, G., Sun, P., & Wang, T. (2013). EEG biofeedback improves
attentional bias in high trait anxiety individuals. BMC Neuroscience, 14(1), 115.
193
Watson, C. G., & Herder, J. (1980). Effectiveness of alpha biofeedback therapy: Negative
results. Journal of Clinical Psychology, 36: 508-513.
Watson, D., Clark, L. A., & Tellegen, A. (1988). Development and validation of brief measures
of positive and negative affect: The PANAS scales. Journal of Personality and Social
psychology, 54(6), 1063.
Watson, J. B., & Rayner, R. (1920). Conditioned emotional reactions. Journal of Experimental
Psychology, 3(1), 1.
Weber, E., Köberl, A., Frank, S., & Doppelmayr, M. (2011). Predicting successful learning of
SMR neurofeedback in healthy participants: Methodological considerations. Applied
Psychophysiology and Biofeedback, 36(1), 37-45.
White, E. K., Groeneveld, K. M., Tittle, R. K., Bolhuis, N. A., Martin, R. E., Royer, T. G., &
Fotuhi, M. (2017). Combined neurofeedback and heart rate variability training for
individuals with symptoms of anxiety and depression: A retrospective study.
NeuroRegulation, 4(1), 37.
Williams, L. M. (2016). Precision psychiatry: A neural circuit taxonomy for depression and
anxiety. The Lancet Psychiatry, 3(5), 472-480.
Wittchen, H. U., & Jacobi, F. (2005). Size and burden of mental disorders in Europe—A critical
review and appraisal of 27 studies. European Neuropsychopharmacology, 15(4), 357-
376.
Wittchen, H. U., Jacobi, F., Rehm, J., Gustavsson, A., Svensson, M., Jönsson, B., ... &
Fratiglioni, L. (2011). The size and burden of mental disorders and other disorders of the
brain in Europe 2010. European Neuropsychopharmacology, 21(9), 655-679.
Witte, M., Kober, S. E., Ninaus, M., Neuper, C., & Wood, G. (2013). Control beliefs can predict
194
the ability to up-regulate sensorimotor rhythm during neurofeedback training. Frontiers
in Human Neuroscience, 7.
Wood, G., Kober, S. E., Witte, M., & Neuper, C. (2014). On the need to better specify the
concept of “control” in brain-computer-interfaces/neurofeedback research. Frontiers in
Systems Neuroscience, 8.
World Health Organization. (1992). The ICD-10 classification of mental and behavioural
disorders: Clinical descriptions and diagnostic guidelines. Geneva, Switzerland: World
Health Organization.
Wyckoff, S., & Birbaumer, S. (2014). Neurofeedback. In J. A. Dozois (Ed.): The Wiley
Handbook of Cognitive Therapy. Princeton, NJ: Wiley and Sons.
Wyrwicka, W., & Sterman, M. B. (1968). Instrumental conditioning of sensorimotor cortex EEG
spindles in the waking cat. Physiology & Behavior, 3(5), 703-707.
Yang, G., Lai, C. S. W., Cichon, J., Ma, L., Li, W., & Gan, W. B. (2014). Sleep promotes
branch-specific formation of dendritic spines after learning. Science, 344(6188), 1173-
1178.
Yin, H. H., Mulcare, S. P., Hilário, M. R., Clouse, E., Holloway, T., Davis, M. I., ... & Costa, R.
M. (2009). Dynamic reorganization of striatal circuits during the acquisition and
consolidation of a skill. Nature Neuroscience, 12(3), 333-341.
Young, K. D., Misaki, M., Harmer, C. J., Victor, T., Zotev, V., Phillips, R., ... & Bodurka, J.
(2017). Real-Time Functional Magnetic Resonance Imaging Amygdala Neurofeedback
Changes Positive Information Processing in Major Depressive Disorder. Biological
Psychiatry, 82(8), 578-586.
Younger, J., Gandhi, V., Hubbard, E., & Mackey, S. (2012). Development of the Stanford
195
Expectations of Treatment Scale (SETS): A tool for measuring patient outcome
expectancy in clinical trials. Clinical Trials, 9(6), 767-776.
Yucha, C., & Montgomery, D. (2008). Evidence-based practice in biofeedback and neuro-
feedback. Wheat Ridge, CO: AAPB.
Zoefel, B., Huster, R. J., & Herrmann, C. S. (2011). Neurofeedback training of the upper alpha
frequency band in EEG improves cognitive performance. Neuroimage, 54(2), 1427-1431.
Zuberer, A., Brandeis, D., & Drechsler, R. (2015). Are treatment effects of neurofeedback
training in children with ADHD related to the successful regulation of brain activity? A
review on the learning of regulation of brain activity and a contribution to the discussion
on specificity. Frontiers in Human Neuroscience, 9, 135.
Zumer, J. M., Brookes, M. J., Stevenson, C. M., Francis, S. T., & Morris, P. G. (2010). Relating
BOLD fMRI and neural oscillations through convolution and optimal linear weighting.
Neuroimage, 49(2), 1479-1489.

196
9. Appendices
Appendix A: IRB Approval Forms, NIH Protocol Publication, and Recruitment Materials
A.1 Institutional Review Board Approval
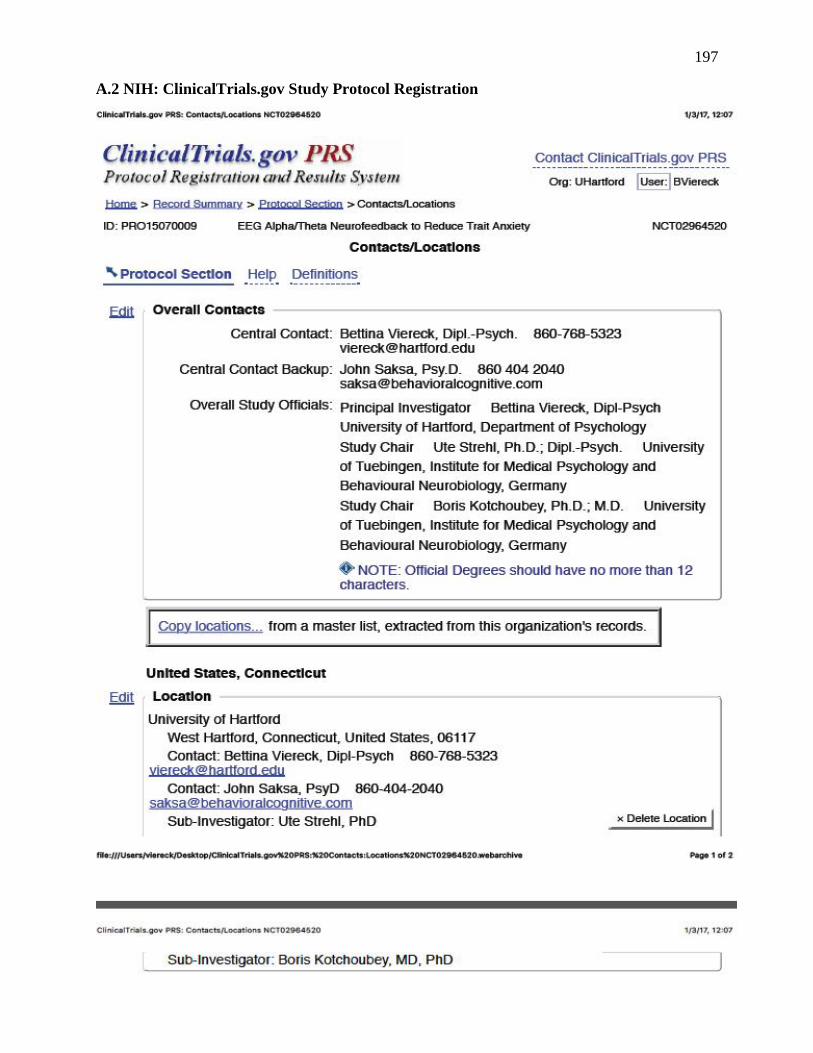
197
A.2 NIH: ClinicalTrials.gov Study Protocol Registration
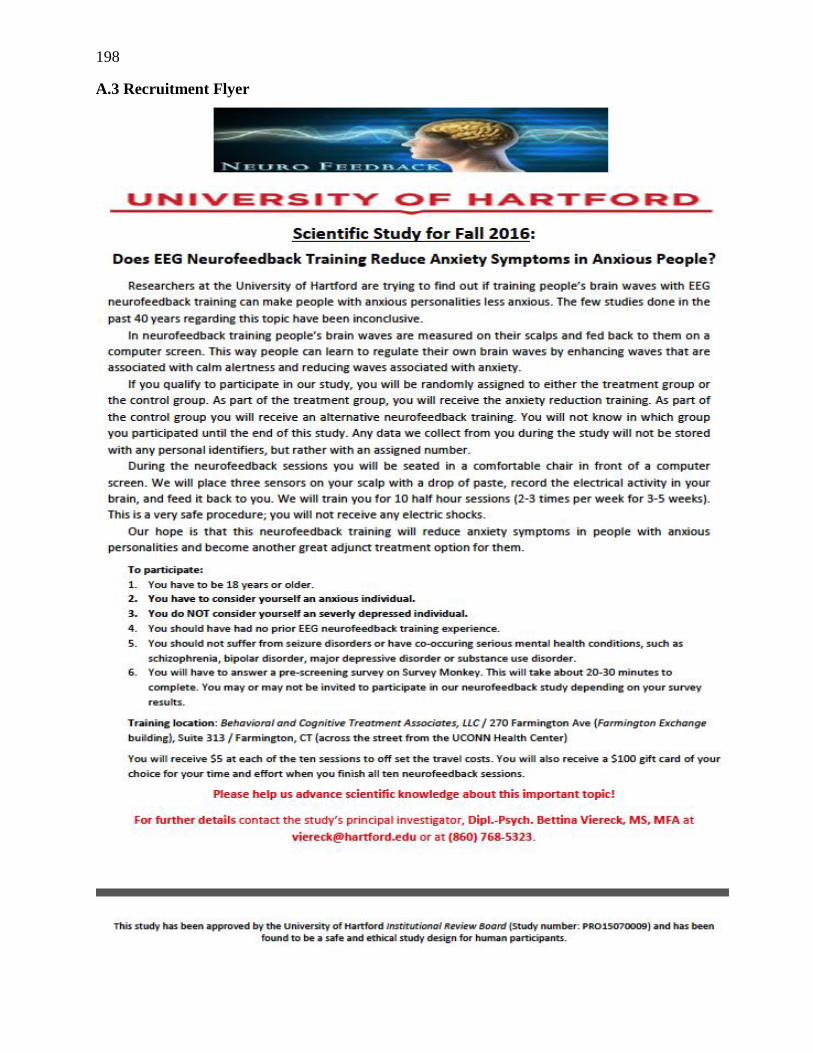
198
A.3 Recruitment Flyer
199
Appendix B: Screening and Trial Participation Consent Forms
B.1 Screening Consent Form

200

201

202
B.2 Trial Participation Consent Form
203
204
205
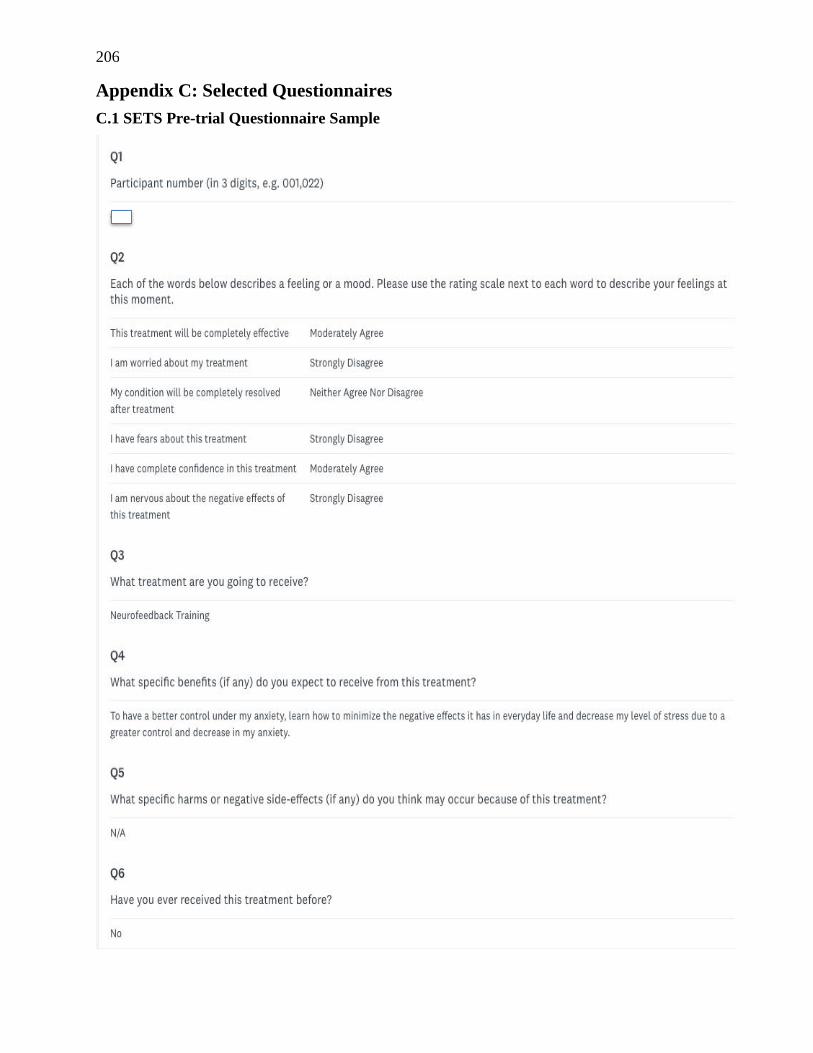
206
Appendix C: Selected Questionnaires
C.1 SETS Pre-trial Questionnaire Sample
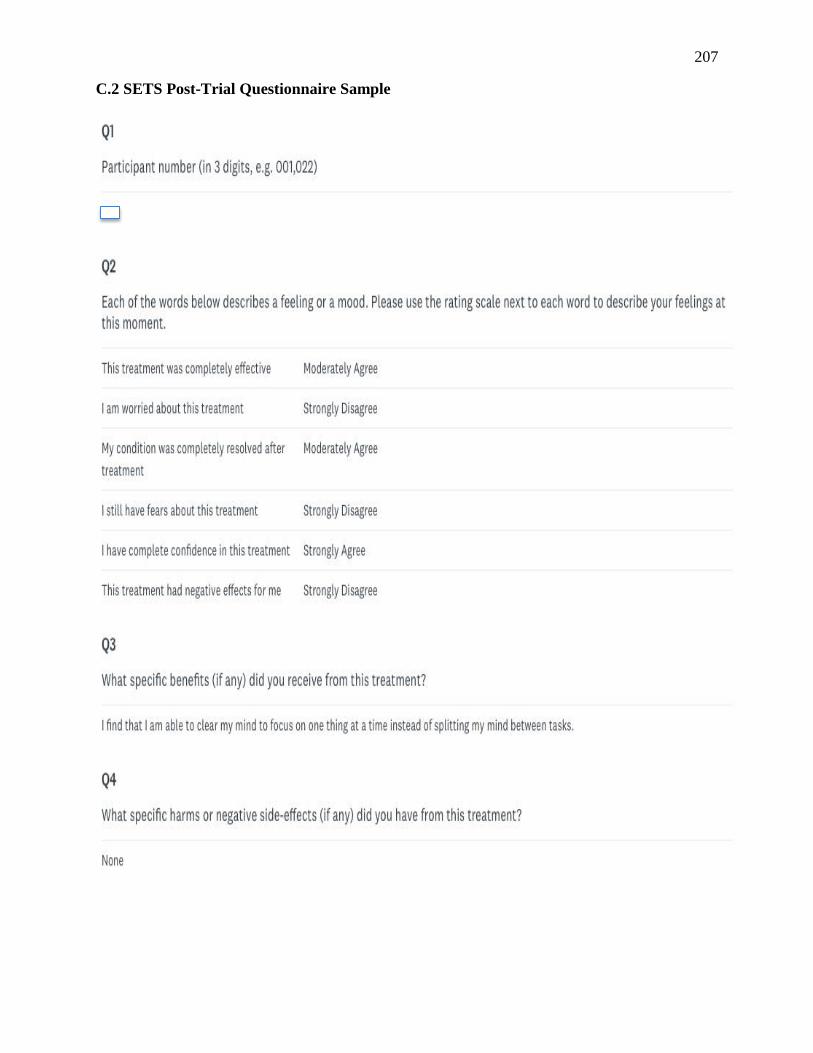
207
C.2 SETS Post-Trial Questionnaire Sample
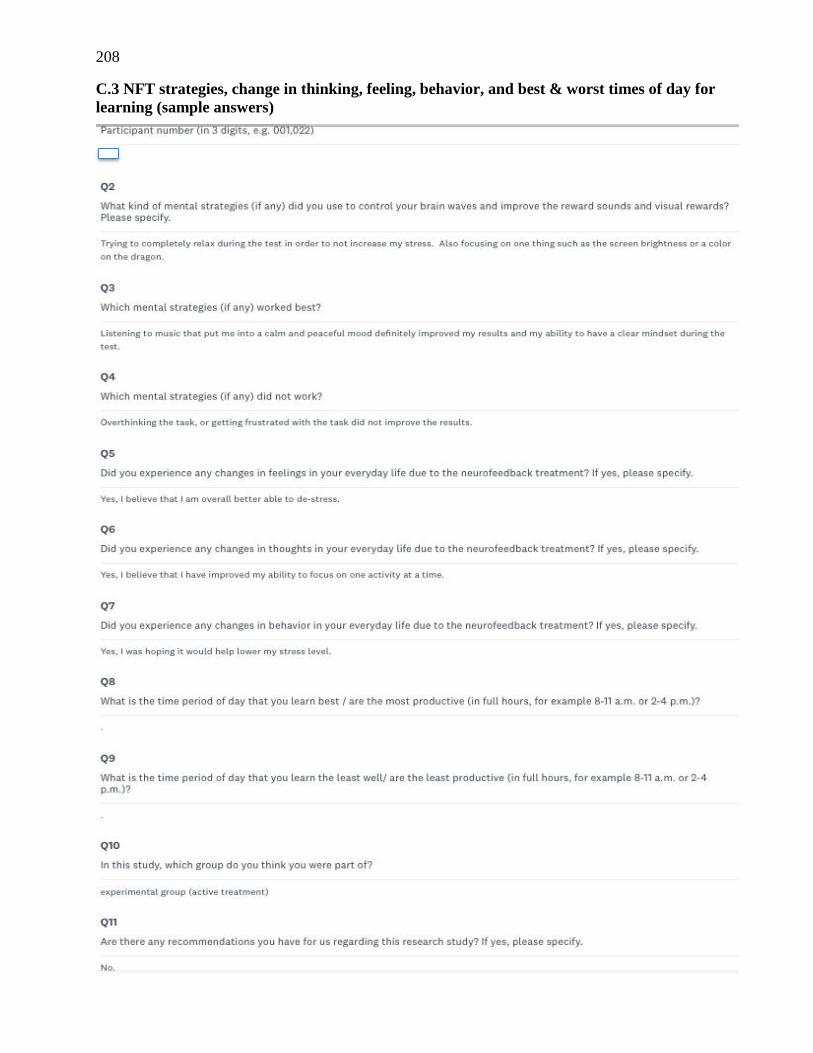
208
C.3 NFT strategies, change in thinking, feeling, behavior, and best & worst times of day for
learning (sample answers)

209
Appendix D: Neurofeedback Session Checklist
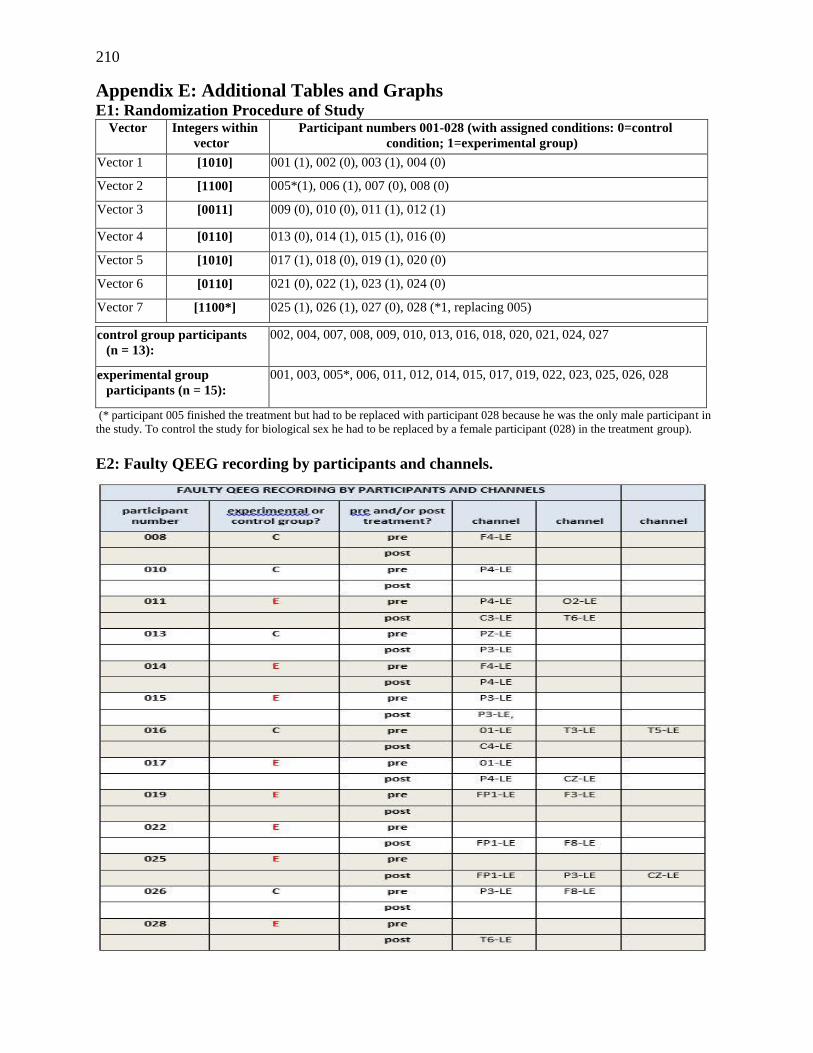
210
Appendix E: Additional Tables and Graphs E1: Randomization Procedure of Study
Vector Integers within
vector
Participant numbers 001-028 (with assigned conditions: 0=control
condition; 1=experimental group)
Vector 1 [1010] 001 (1), 002 (0), 003 (1), 004 (0)
Vector 2 [1100] 005*(1), 006 (1), 007 (0), 008 (0)
Vector 3 [0011] 009 (0), 010 (0), 011 (1), 012 (1)
Vector 4 [0110] 013 (0), 014 (1), 015 (1), 016 (0)
Vector 5 [1010] 017 (1), 018 (0), 019 (1), 020 (0)
Vector 6 [0110] 021 (0), 022 (1), 023 (1), 024 (0)
Vector 7 [1100*] 025 (1), 026 (1), 027 (0), 028 (*1, replacing 005)
control group participants
(n = 13):
002, 004, 007, 008, 009, 010, 013, 016, 018, 020, 021, 024, 027
experimental group
participants (n = 15):
001, 003, 005*, 006, 011, 012, 014, 015, 017, 019, 022, 023, 025, 026, 028
(* participant 005 finished the treatment but had to be replaced with participant 028 because he was the only male participant in
the study. To control the study for biological sex he had to be replaced by a female participant (028) in the treatment group).
E2: Faulty QEEG recording by participants and channels.

211
E.3: Session Checklist Results
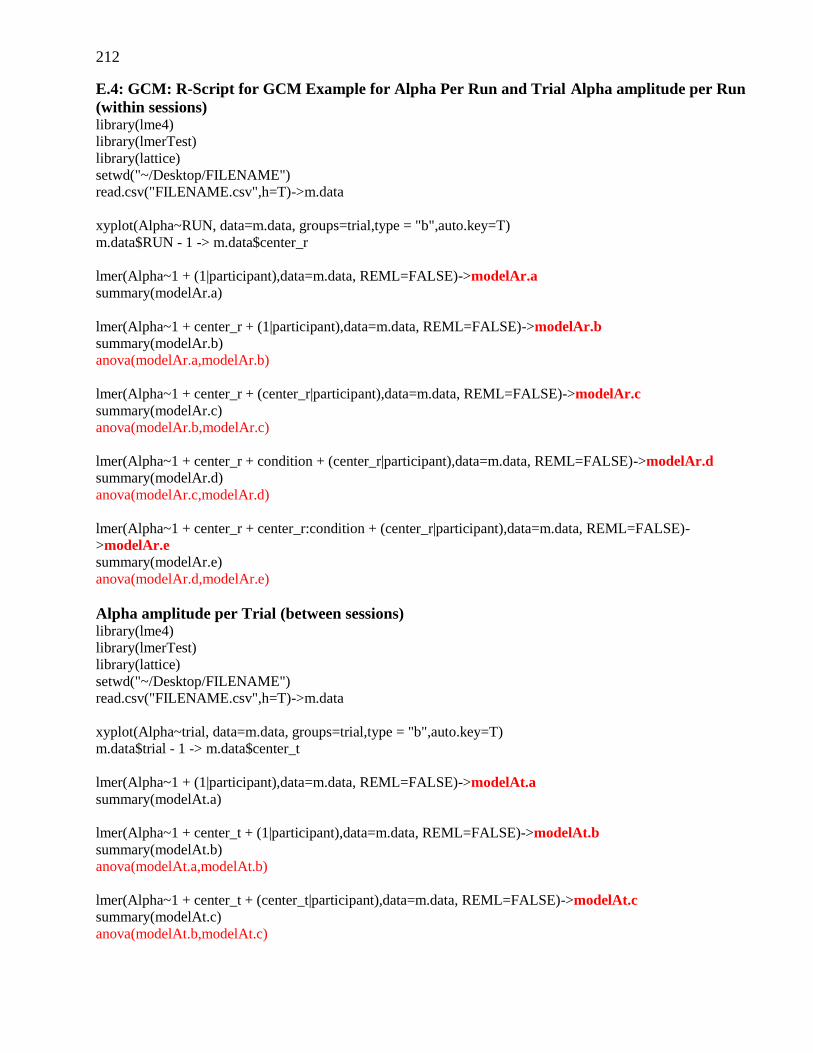
212
E.4: GCM: R-Script for GCM Example for Alpha Per Run and Trial Alpha amplitude per Run
(within sessions) library(lme4)
library(lmerTest)
library(lattice)
setwd("~/Desktop/FILENAME")
read.csv("FILENAME.csv",h=T)->m.data
xyplot(Alpha~RUN, data=m.data, groups=trial,type = "b",auto.key=T)
m.data$RUN - 1 -> m.data$center_r
lmer(Alpha~1 + (1|participant),data=m.data, REML=FALSE)->modelAr.a
summary(modelAr.a)
lmer(Alpha~1 + center_r + (1|participant),data=m.data, REML=FALSE)->modelAr.b
summary(modelAr.b)
anova(modelAr.a,modelAr.b)
lmer(Alpha~1 + center_r + (center_r|participant),data=m.data, REML=FALSE)->modelAr.c
summary(modelAr.c)
anova(modelAr.b,modelAr.c)
lmer(Alpha~1 + center_r + condition + (center_r|participant),data=m.data, REML=FALSE)->modelAr.d
summary(modelAr.d)
anova(modelAr.c,modelAr.d)
lmer(Alpha~1 + center_r + center_r:condition + (center_r|participant),data=m.data, REML=FALSE)-
>modelAr.e
summary(modelAr.e)
anova(modelAr.d,modelAr.e)
Alpha amplitude per Trial (between sessions) library(lme4)
library(lmerTest)
library(lattice)
setwd("~/Desktop/FILENAME")
read.csv("FILENAME.csv",h=T)->m.data
xyplot(Alpha~trial, data=m.data, groups=trial,type = "b",auto.key=T)
m.data$trial - 1 -> m.data$center_t
lmer(Alpha~1 + (1|participant),data=m.data, REML=FALSE)->modelAt.a
summary(modelAt.a)
lmer(Alpha~1 + center_t + (1|participant),data=m.data, REML=FALSE)->modelAt.b
summary(modelAt.b)
anova(modelAt.a,modelAt.b)
lmer(Alpha~1 + center_t + (center_t|participant),data=m.data, REML=FALSE)->modelAt.c
summary(modelAt.c)
anova(modelAt.b,modelAt.c)

213
lmer(Alpha~1 + center_t + condition + (center_t|participant),data=m.data, REML=FALSE)->modelAt.d
summary(modelAt.d)
anova(modelAt.c,modelAt.d)
lmer(Alpha~1 + center_t + center_t:condition + (center_t|participant),data=m.data, REML=FALSE)-
>modelAt.e
summary(modelAt.e)
anova(modelAt.d,modelAt.e)
E.5: GCM: EG Absolute A+T amplitude responders vs. all CG participants
Predictor for ABSOLUTE alpha amplitude (in µV) (SE) p
MODEL C: TIME WITHIN SESSIONS (24 one-minute runs per NFT session)
Intercept
0.070 (0.847)
9.699 (0.847)
< .0001 ***
< .0001 ***
MODEL C: TIME ACROSS SESSIONS (ten NFT sessions)
Intercept 0.177 (0.050)
9.812 (0.847)
< .01** < .0001 ***
MODEL D: GROUP: within session 0.536 (1.367) 0.699
MODEL D: GROUP: group across sessions 0.312 (1.702) 0.856)
MODEL E: TIME WITHIN SESSIONS x GROUP 0.017 (0.023) 0.460
MODEL E: TIME ACROSS SESSIONS x GROUP 0.175 (0.085) 0.055
Table 4.10 a: Results from GCM regression analyses predicting alpha amplitude from run, trial, and group. Note: Standard errors are given in parentheses. *p < .05, **p< .01, ***p< .001. Intercept information is only shown for significant models. Significant results are shown in bold
red.
Predictor for RELATIVE alpha amplitude (in %) (SE) p
MODEL C: TIME WITHIN SESSIONS (24 one-minute runs per NFT session)
Intercept
0.068 (0.011)
17.976 (0.651)
< .0001 ***
< .0001 ***
MODEL C: TIME ACROSS SESSIONS (ten NFT sessions)
Intercept 0.188 (0.067)
18.043 (0.651)
< .01** < .0001 ***
MODEL D: GROUP: within session 0.880 (1.280) 0.499
MODEL D: GROUP: group across sessions 1.189 (1.280) 0.366
MODEL E: TIME WITHIN SESSIONS x GROUP 0.025 (0.023) 0.225
MODEL E: TIME ACROSS SESSIONS x GROUP 0.057 (0.133) 0.673
Table 4.10 b: Results from GCM regression analyses predicting relative alpha amplitude from run, trial, and group. Note: Standard errors are given in parentheses. *p < .05, **p< .01, ***p< .001. Intercept information is only shown for significant models. Significant results are shown
in bold red.
Predictor for ABSOLUTE A+T amplitude (in µV) (SE) p
MODEL C: TIME WITHIN SESSIONS (24 one-minute runs per NFT session)
Intercept
0.100 (0.028)
18.560 (1.229)
< .01**
< .0001 ***
MODEL C: TIME ACROSS SESSIONS (ten NFT sessions)
Intercept 0.249 (0.086)
18.784 (1.324)
< .01** < .0001 ***
MODEL D: GROUP: within session 1.919 (2.253) .403
MODEL D: GROUP: group across sessions 0.899 (2.664) .739
MODEL E: TIME WITHIN SESSIONS x GROUP 0.003 (0.051) .960
MODEL E: TIME ACROSS SESSIONS x GROUP Intercept
0.347 (0.148) 18.802 (1.322)
< .05* < .0001 ***
Table 4.10 c: Results from GCM regression analyses by successively adding predictors for T/A amplitude ratio from run, trial, and group.
Note: Standard errors are given in parentheses. *p < .05, **p< .01, ***p< .001. Intercept information is only shown for significant models. Significant results are shown in bold red.
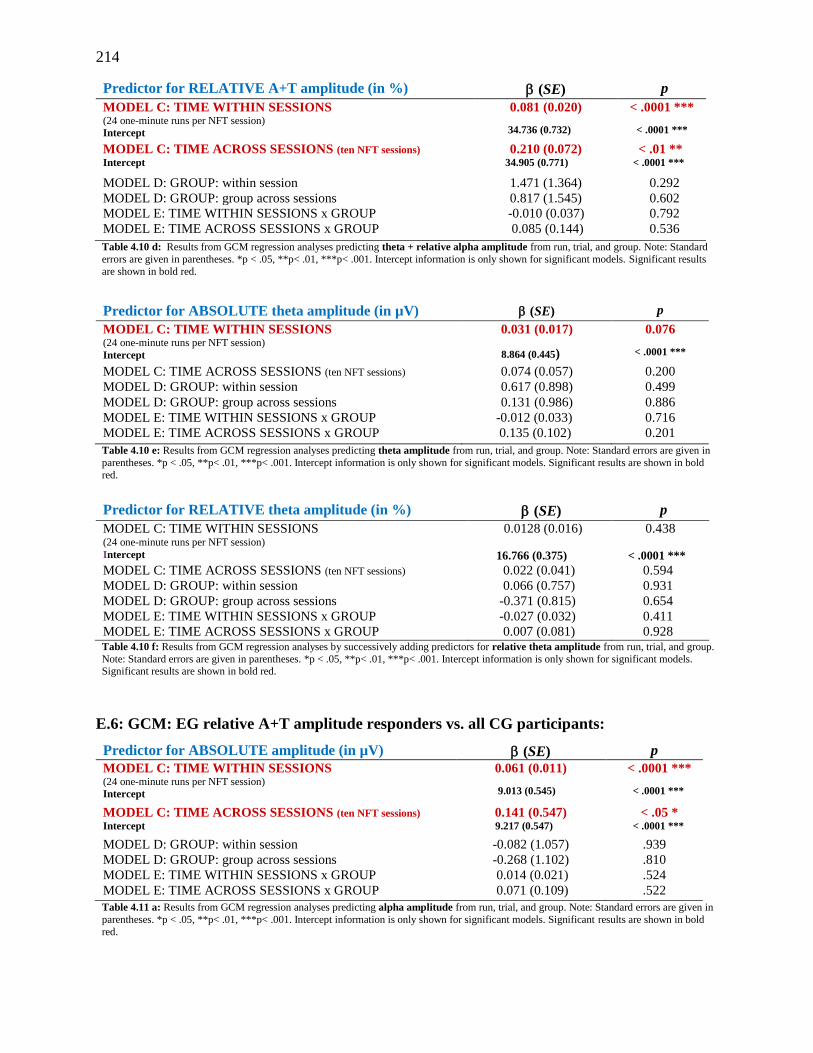
214
Predictor for RELATIVE A+T amplitude (in %) (SE) p
MODEL C: TIME WITHIN SESSIONS (24 one-minute runs per NFT session)
Intercept
0.081 (0.020)
34.736 (0.732)
< .0001 ***
< .0001 ***
MODEL C: TIME ACROSS SESSIONS (ten NFT sessions)
Intercept 0.210 (0.072)
34.905 (0.771)
< .01 ** < .0001 ***
MODEL D: GROUP: within session 1.471 (1.364) 0.292
MODEL D: GROUP: group across sessions 0.817 (1.545) 0.602
MODEL E: TIME WITHIN SESSIONS x GROUP -0.010 (0.037) 0.792
MODEL E: TIME ACROSS SESSIONS x GROUP 0.085 (0.144) 0.536
Table 4.10 d: Results from GCM regression analyses predicting theta + relative alpha amplitude from run, trial, and group. Note: Standard
errors are given in parentheses. *p < .05, **p< .01, ***p< .001. Intercept information is only shown for significant models. Significant results
are shown in bold red.
Predictor for ABSOLUTE theta amplitude (in µV) (SE) p
MODEL C: TIME WITHIN SESSIONS (24 one-minute runs per NFT session)
Intercept
0.031 (0.017)
8.864 (0.445)
0.076
< .0001 ***
MODEL C: TIME ACROSS SESSIONS (ten NFT sessions) 0.074 (0.057) 0.200
MODEL D: GROUP: within session 0.617 (0.898) 0.499
MODEL D: GROUP: group across sessions 0.131 (0.986) 0.886
MODEL E: TIME WITHIN SESSIONS x GROUP -0.012 (0.033) 0.716
MODEL E: TIME ACROSS SESSIONS x GROUP 0.135 (0.102) 0.201
Table 4.10 e: Results from GCM regression analyses predicting theta amplitude from run, trial, and group. Note: Standard errors are given in
parentheses. *p < .05, **p< .01, ***p< .001. Intercept information is only shown for significant models. Significant results are shown in bold
red.
Predictor for RELATIVE theta amplitude (in %) (SE) p
MODEL C: TIME WITHIN SESSIONS (24 one-minute runs per NFT session)
Intercept
0.0128 (0.016)
16.766 (0.375)
0.438
< .0001 ***
MODEL C: TIME ACROSS SESSIONS (ten NFT sessions) 0.022 (0.041) 0.594
MODEL D: GROUP: within session 0.066 (0.757) 0.931
MODEL D: GROUP: group across sessions -0.371 (0.815) 0.654
MODEL E: TIME WITHIN SESSIONS x GROUP -0.027 (0.032) 0.411
MODEL E: TIME ACROSS SESSIONS x GROUP 0.007 (0.081) 0.928 Table 4.10 f: Results from GCM regression analyses by successively adding predictors for relative theta amplitude from run, trial, and group.
Note: Standard errors are given in parentheses. *p < .05, **p< .01, ***p< .001. Intercept information is only shown for significant models. Significant results are shown in bold red.
E.6: GCM: EG relative A+T amplitude responders vs. all CG participants:
Predictor for ABSOLUTE amplitude (in µV) (SE) p
MODEL C: TIME WITHIN SESSIONS (24 one-minute runs per NFT session)
Intercept
0.061 (0.011)
9.013 (0.545)
< .0001 ***
< .0001 ***
MODEL C: TIME ACROSS SESSIONS (ten NFT sessions)
Intercept 0.141 (0.547)
9.217 (0.547) < .05 *
< .0001 ***
MODEL D: GROUP: within session -0.082 (1.057) .939
MODEL D: GROUP: group across sessions -0.268 (1.102) .810
MODEL E: TIME WITHIN SESSIONS x GROUP 0.014 (0.021) .524
MODEL E: TIME ACROSS SESSIONS x GROUP 0.071 (0.109) .522
Table 4.11 a: Results from GCM regression analyses predicting alpha amplitude from run, trial, and group. Note: Standard errors are given in
parentheses. *p < .05, **p< .01, ***p< .001. Intercept information is only shown for significant models. Significant results are shown in bold
red.
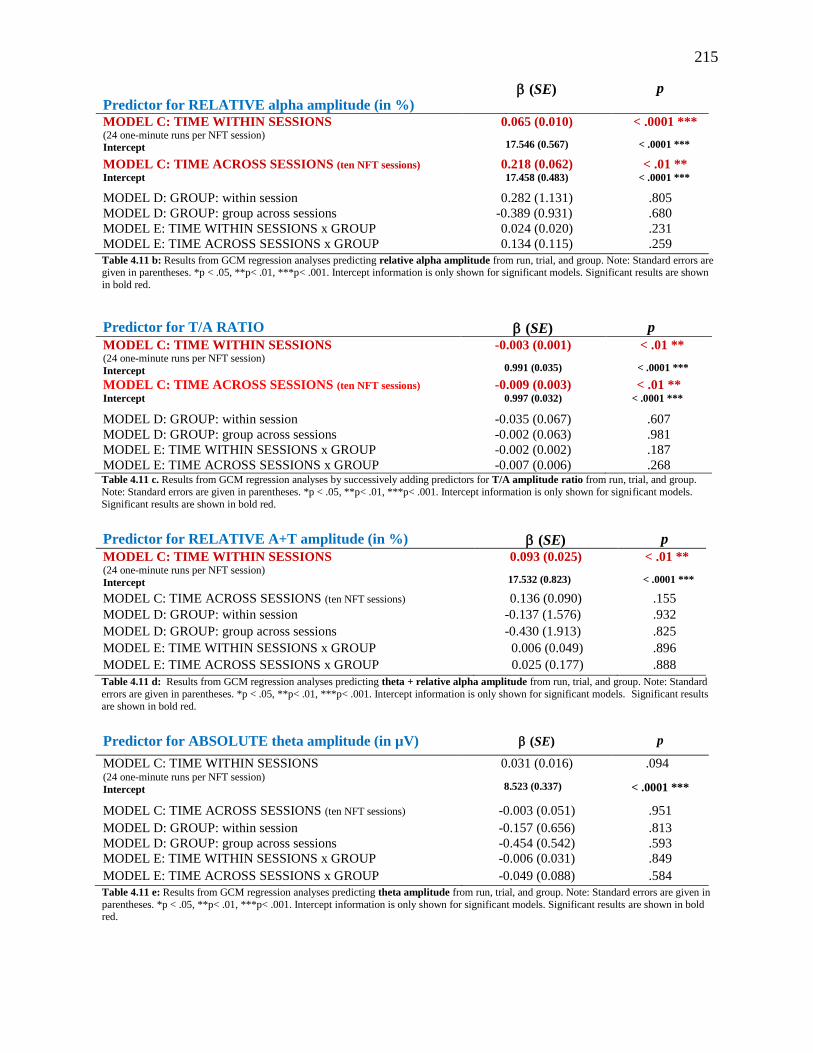
215
Predictor for RELATIVE alpha amplitude (in %) (SE) p
MODEL C: TIME WITHIN SESSIONS (24 one-minute runs per NFT session)
Intercept
0.065 (0.010)
17.546 (0.567)
< .0001 ***
< .0001 ***
MODEL C: TIME ACROSS SESSIONS (ten NFT sessions)
Intercept 0.218 (0.062) 17.458 (0.483)
< .01 ** < .0001 ***
MODEL D: GROUP: within session 0.282 (1.131) .805
MODEL D: GROUP: group across sessions -0.389 (0.931) .680
MODEL E: TIME WITHIN SESSIONS x GROUP 0.024 (0.020) .231
MODEL E: TIME ACROSS SESSIONS x GROUP 0.134 (0.115) .259
Table 4.11 b: Results from GCM regression analyses predicting relative alpha amplitude from run, trial, and group. Note: Standard errors are given in parentheses. *p < .05, **p< .01, ***p< .001. Intercept information is only shown for significant models. Significant results are shown
in bold red.
Predictor for T/A RATIO (SE) p
MODEL C: TIME WITHIN SESSIONS (24 one-minute runs per NFT session)
Intercept
-0.003 (0.001)
0.991 (0.035)
< .01 **
< .0001 ***
MODEL C: TIME ACROSS SESSIONS (ten NFT sessions)
Intercept -0.009 (0.003)
0.997 (0.032) < .01 **
< .0001 ***
MODEL D: GROUP: within session -0.035 (0.067) .607
MODEL D: GROUP: group across sessions -0.002 (0.063) .981
MODEL E: TIME WITHIN SESSIONS x GROUP -0.002 (0.002) .187
MODEL E: TIME ACROSS SESSIONS x GROUP -0.007 (0.006) .268 Table 4.11 c. Results from GCM regression analyses by successively adding predictors for T/A amplitude ratio from run, trial, and group.
Note: Standard errors are given in parentheses. *p < .05, **p< .01, ***p< .001. Intercept information is only shown for significant models.
Significant results are shown in bold red.
Predictor for RELATIVE A+T amplitude (in %) (SE) p
MODEL C: TIME WITHIN SESSIONS (24 one-minute runs per NFT session)
Intercept
0.093 (0.025)
17.532 (0.823)
< .01 **
< .0001 ***
MODEL C: TIME ACROSS SESSIONS (ten NFT sessions) 0.136 (0.090) .155
MODEL D: GROUP: within session -0.137 (1.576) .932
MODEL D: GROUP: group across sessions -0.430 (1.913) .825
MODEL E: TIME WITHIN SESSIONS x GROUP 0.006 (0.049) .896
MODEL E: TIME ACROSS SESSIONS x GROUP 0.025 (0.177) .888
Table 4.11 d: Results from GCM regression analyses predicting theta + relative alpha amplitude from run, trial, and group. Note: Standard
errors are given in parentheses. *p < .05, **p< .01, ***p< .001. Intercept information is only shown for significant models. Significant results
are shown in bold red.
Predictor for ABSOLUTE theta amplitude (in µV) (SE) p
MODEL C: TIME WITHIN SESSIONS (24 one-minute runs per NFT session)
Intercept
0.031 (0.016)
8.523 (0.337)
.094
< .0001 ***
MODEL C: TIME ACROSS SESSIONS (ten NFT sessions) -0.003 (0.051) .951
MODEL D: GROUP: within session -0.157 (0.656) .813
MODEL D: GROUP: group across sessions -0.454 (0.542) .593
MODEL E: TIME WITHIN SESSIONS x GROUP -0.006 (0.031) .849
MODEL E: TIME ACROSS SESSIONS x GROUP -0.049 (0.088) .584
Table 4.11 e: Results from GCM regression analyses predicting theta amplitude from run, trial, and group. Note: Standard errors are given in
parentheses. *p < .05, **p< .01, ***p< .001. Intercept information is only shown for significant models. Significant results are shown in bold red.

216
Predictor for RELATIVE theta amplitude (in %) (SE) p
MODEL C: TIME WITHIN SESSIONS (24 one-minute runs per NFT session)
Intercept
0.014 (0.016)
16.743 (0.377)
.401
< .0001 ***
MODEL C: TIME ACROSS SESSIONS (ten NFT sessions) 0.014 (0.041) .742
MODEL D: GROUP: within session 0.014 (0.761) .986
MODEL D: GROUP: group across sessions -0.346 (0.813) .674
MODEL E: TIME WITHIN SESSIONS x GROUP -0.025 (0.032) .447
MODEL E: TIME ACROSS SESSIONS x GROUP -0.012 (0.082) .884
Table 4.11 f: Results from GCM regression analyses by successively adding predictors for relative theta amplitude from run, trial, and group Note: Standard errors are given in parentheses. *p < .05, **p< .01, ***p< .001. Intercept information is only shown for significant models.
Significant results are shown in bold red.
E.7: Mean anxiety test score differences for EG (Solid Line) and CG (Dotted Line) pre- and
post-treatment
Clockwise from upper right: STAI-T, STAI-S, GAD-7, and BAI. All anxiety test scores decreased significantly between
beginning and end of the NFT trial but no significant differences in reduction could be observed between EG and CG.

217
E.8: Mean NFT measures for EG (Solid Line) and CG (Dotted Line) over the course of the NFT Trial averaging scores from sessions 1 & 2, 3 & 4, 5 & 6, 7 & 8, and 9 & 10 and corresponding mean NFT measures for EG (dark bold line) and CG (light thin line) over the
course of ten sessions with 95% CI bars. By row from upper left: alpha amplitude for combined sessions and 10 sessions; theta amplitude for combined sessions and 10 sessions; T/A ratio for combined sessions and 10 sessions; relative theta amplitude for combined sessions and 10 sessions; relative alpha amplitude for combined sessions
and 10 sessions; Relative T+A amplitude for combined sessions and 10 sessions.
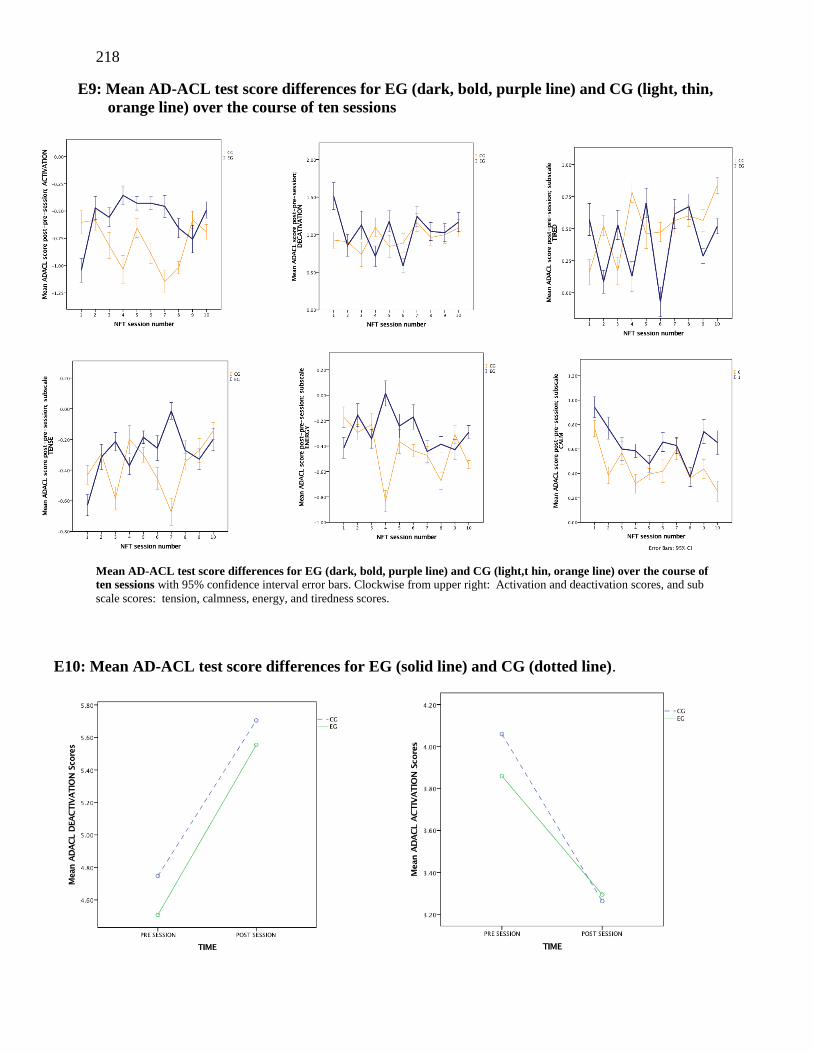
218
E9: Mean AD-ACL test score differences for EG (dark, bold, purple line) and CG (light, thin,
orange line) over the course of ten sessions
Mean AD-ACL test score differences for EG (dark, bold, purple line) and CG (light,t hin, orange line) over the course of
ten sessions with 95% confidence interval error bars. Clockwise from upper right: Activation and deactivation scores, and sub
scale scores: tension, calmness, energy, and tiredness scores.
E10: Mean AD-ACL test score differences for EG (solid line) and CG (dotted line).
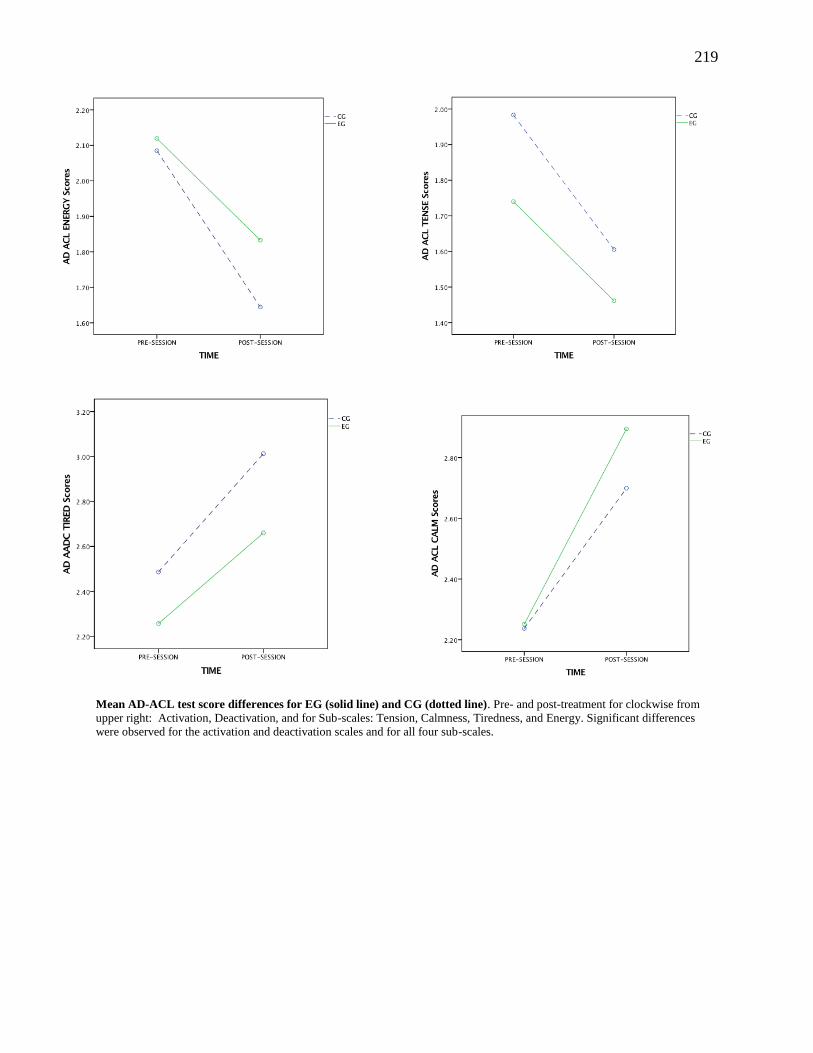
219
Mean AD-ACL test score differences for EG (solid line) and CG (dotted line). Pre- and post-treatment for clockwise from
upper right: Activation, Deactivation, and for Sub-scales: Tension, Calmness, Tiredness, and Energy. Significant differences
were observed for the activation and deactivation scales and for all four sub-scales.
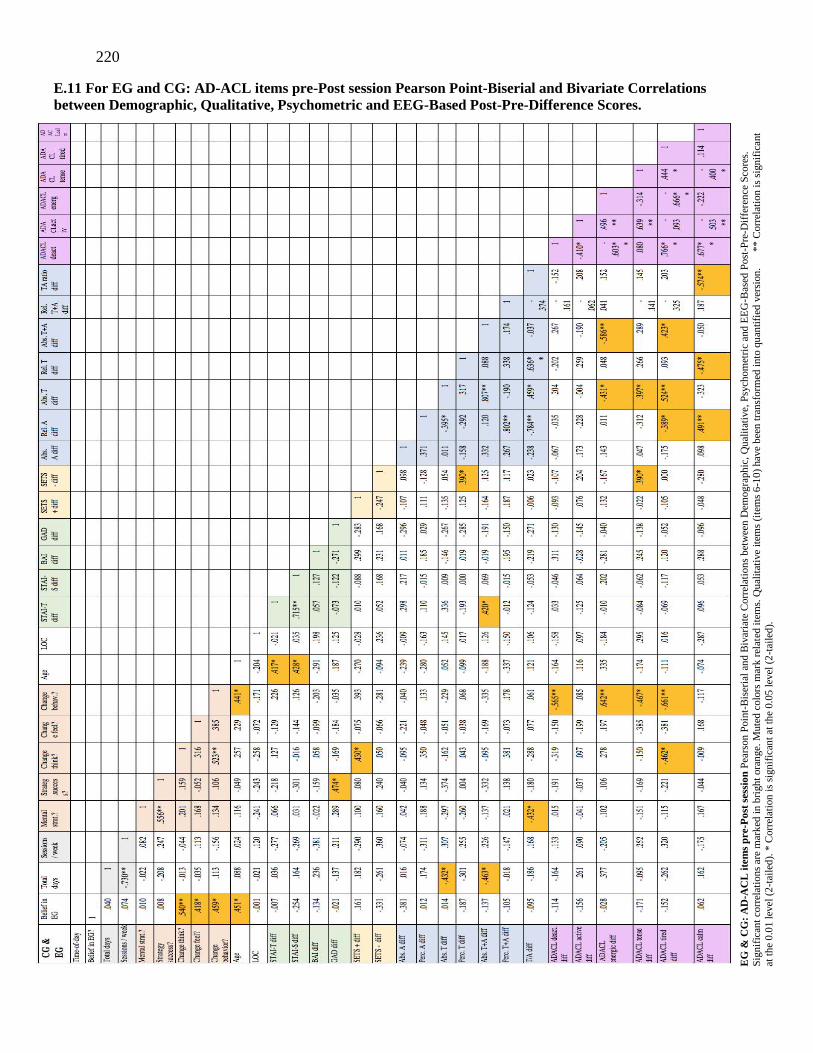
220
E.11 For EG and CG: AD-ACL items pre-Post session Pearson Point-Biserial and Bivariate Correlations
between Demographic, Qualitative, Psychometric and EEG-Based Post-Pre-Difference Scores.
EG
& C
G:
AD
-AC
L i
tem
s p
re-P
ost
ses
sio
n P
ears
on P
oin
t-B
iser
ial
and B
ivar
iate
Corr
elat
ion
s b
etw
een
Dem
og
raph
ic,
Qu
alit
ativ
e, P
sych
om
etri
c an
d E
EG
-Bas
ed P
ost
-Pre
-Dif
fere
nce
Sco
res.
Sig
nif
ican
t co
rrel
atio
ns
are
mar
ked
in b
righ
t ora
nge.
Mute
d c
olo
rs m
ark r
elat
ed i
tem
s. Q
ual
itat
ive
item
s (i
tem
s 6
-10
) hav
e b
een
tra
nsf
orm
ed i
nto
qu
anti
fied
ver
sion
. *
* C
orr
elat
ion
is
signif
ican
t
at t
he
0.0
1 l
evel
(2
-tai
led
). *
Corr
elat
ion
is
signif
ican
t at
th
e 0.0
5 l
evel
(2
-tai
led
).

221
E.12 For EG only: AD-ACL items pre-Post session Pearson Point-Biserial and Bivariate Correlations
between Demographic, Qualitative, Psychometric and EEG-Based Post-Pre-Difference Scores.
EG
on
ly:
Poin
t-B
iser
ial
and
Biv
aria
te C
orr
elat
ion
s b
etw
een
Dem
ogra
ph
ic, Q
ual
itat
ive,
Psy
chom
etri
c an
d E
EG
-Bas
ed P
ost
-Pre
-Dif
fere
nce
Sco
res.
Sig
nif
ican
t co
rrel
atio
ns
are
mar
ked
in
bri
gh
t
ora
nge.
Mu
ted c
olo
rs m
ark
rel
ated
ite
ms.
Qual
itat
ive
item
s (i
tem
s 6
-10
) hav
e b
een
tra
nsf
orm
ed i
nto
qu
anti
fied
ver
sion
.
** C
orr
elat
ion
is
signif
ican
t at
th
e 0
.01 l
evel
(2
-tai
led
). *
Corr
elat
ion i
s si
gn
ific
ant
at t
he
0.0
5 l
evel
(2
-tai
led
).