Embed Size (px)
Citation preview

3 0 n o v e m b e r 2 0 1 7 | v o L 5 5 1 | n A T U r e | 6 3 9
LeTTerdoi:10.1038/nature24637
NFS1 undergoes positive selection in lung tumours and protects cells from ferroptosisSamantha W. Alvarez1,2*, vladislav o. Sviderskiy1,2*, erdem m. Terzi1,2, Thales Papagiannakopoulos1,2, Andre L. moreira1,2, Sylvia Adams1,2, David m. Sabatini3,4,5,6,7, Kıvanç birsoy3,4,5,6,7,8† & richard Possemato1,2,3,4,5,6,7†
Environmental nutrient levels impact cancer cell metabolism, resulting in context-dependent gene essentiality1,2. Here, using loss-of-function screening based on RNA interference, we show that environmental oxygen levels are a major driver of differential essentiality between in vitro model systems and in vivo tumours. Above the 3–8% oxygen concentration typical of most tissues, we find that cancer cells depend on high levels of the iron–sulfur cluster biosynthetic enzyme NFS1. Mammary or subcutaneous tumours grow despite suppression of NFS1, whereas metastatic or primary lung tumours do not. Consistent with a role in surviving the high oxygen environment of incipient lung tumours, NFS1 lies in a region of genomic amplification present in lung adenocarcinoma and is most highly expressed in well-differentiated adenocarcinomas. NFS1 activity is particularly important for maintaining the iron–sulfur co-factors present in multiple cell-essential proteins upon
exposure to oxygen compared to other forms of oxidative damage. Furthermore, insufficient iron–sulfur cluster maintenance robustly activates the iron-starvation response and, in combination with inhibition of glutathione biosynthesis, triggers ferroptosis, a non-apoptotic form of cell death. Suppression of NFS1 cooperates with inhibition of cysteine transport to trigger ferroptosis in vitro and slow tumour growth. Therefore, lung adenocarcinomas select for expression of a pathway that confers resistance to high oxygen tension and protects cells from undergoing ferroptosis in response to oxidative damage.
To understand differences in metabolic pathway requirements between breast cancer cells in a tumour (in vivo) or in tissue culture (in vitro), we performed parallel loss-of-function screens in a trans-formed breast cell line (MCF10DCIS.com) using a metabolism- restricted short hairpin RNA (shRNA) library (Fig. 1a), and identified
1Department of Pathology, New York University School of Medicine, New York, New York 10016, USA. 2Laura & Isaac Perlmutter Cancer Center, New York University School of Medicine, New York, New York 10016, USA. 3Whitehead Institute for Biomedical Research, Nine Cambridge Center, Cambridge, Massachusetts 02142, USA. 4Howard Hughes Medical Institute, Department of Biology, Massachusetts Institute of Technology, Cambridge, Massachusetts 02139, USA. 5The David H. Koch Institute for Integrative Cancer Research, 77 Massachusetts Avenue, Cambridge, Massachusetts 02139, USA. 6Department of Biology, Massachusetts Institute of Technology, Cambridge, Massachusetts 02139, USA. 7Broad Institute of Harvard and Massachusetts Institute of Technology, Seven Cambridge Center, Cambridge, Massachusetts 02142, USA. 8Laboratory of Metabolic Regulation and Genetics, The Rockefeller University, 1230 York Avenue, New York 10065, USA. †Present addresses: Laboratory of Metabolic Regulation and Genetics, The Rockefeller University, 1230 York Avenue, New York, New York 10065, USA (K.B.); Department of Pathology, New York University School of Medicine, New York, New York 10016, USA (R.P.). *These authors contributed equally to this work.
a
15,997 shRNAs2,752 metabolic genes
28 pools
Transformed breast cells
Pooledinfection
In vitro cultureOrthotopicxenograft
Deep sequencing for shRNA abundance
b
In vivo depleted In vitro depleted<–4 –3 –2 –1 0 1 2 3 4 >4
Pro
por
tion
of s
hRN
As
Differentially depleted in 3% O2Differentially depleted in 21% O2
21% O2 3% O2
0.3
0.2
0.1
0
c
13,185 gene-targeting shRNAs
271 (20%overlap)
NFS1 (6/8)ABCB7 (3/5)
d
e
4
3
2
1
0Pop
ulat
ion
dou
blin
gs
0 5 10 15
shRFPshNFS1_1
4
3
2
1
0
Pop
ulat
ion
dou
blin
gs
RPS6
NFS1
R N1 R N1 R N1VC NFS1res
NFS1resCD
f
g
shGFP
shNFS
1_1
shGFP
shNFS
1_1
shGFP
shNFS
1_1
400
300
200
100
0Tum
our
wei
ght
(mg)
500
600
NS
h
40
20
0
Num
ber
of m
etas
tase
s
60i
shG
FPsh
NFS
1_1
shG
FPsh
NFS
1_1
75
25
0Mic
rom
etas
tase
s p
er s
ectio
n 100
50
1,353 in vitrospeci�c
1,384 high O2speci�c
O2 concentration (%)
Sel
ectio
n (2
4 d
ays)
4 × 10–11 3 × 10⁻⁸ 7 × 10⁻⁸
P = 2 × 10⁻² P = 1 × 10⁻²
20
3 ×
10–2
3 ×
10–3
4 ×
10–3
3 ×
10–6
5 ×
10–5
2 ×
10–3
P =
P =
+ ++
+++
+++ +++ +++
+++
ABCB7
NFS1
Fe–Scluster
MitochondrialFe–S proteins
Fe–S containing proteins
Figure 1 | The requirement for NFS1 is strongly dependent on environmental oxygen concentration. a, Schematic of the overall experimental methodology. b, Depletion score histogram. shRNAs are divided into low O2 depleted (red), or high O2 depleted (black). Bin-range upper bounds are indicated. For shRNAs differentially depleted in 3% O2, 7.7% scored higher in vivo than in vitro, and 10.5% scored higher in vitro than in vivo, the median score was 0.17. For shRNAs differentially depleted in 21% O2, 3.8% scored higher in vivo than in vitro, and 19.6% scored higher in vitro than in vivo, the median score was 0.66. c, Venn diagram of shRNAs with improved viability scores in low O2 (red) or animals (grey). d, Schematic of the ISC biosynthesis process. e, Five-day proliferation assay of MDA-MB-231 cells stably transduced with shRNAs targeting NFS1 (shNFS1_1) or RFP (shRFP) as a control. Data are mean ± s.e.m. from three independent biological triplicates. f, Five-day proliferation assay at atmospheric O2 of MDA-MB-231 stably transduced with either shRFP (R) or shNFS1_1 (N1) and either a vector control (VC), resistant NFS1 cDNA (NFS1res) or catalytically inactive mutant cDNA (NFS1resCD) (top). Data are mean ± s.e.m. from three independent biological replicates. Immunoblots for NFS1 (ribosomal protein S6 (RPS6) included for comparison), images are representative of three replicates (bottom). g, Tumour xenograft weight at 4 weeks, cells transduced as in e but with shRNAs targeting GFP (shGFP) as the control. Data are mean ± s.e.m., n = 25. h, Representative whole mount immunofluorescence of lung lobes (left) and metastasis quantification (right), 6 weeks after tail vein injection with cells transduced as in g. Scale bars, 1 mm. i, Sections from h, tdTomato stain (brown) (left) and quantification of micrometastases per section (right). Scale bars, 100 μ m. Quantification data in h and i are from five independent biological replicates, entire experiment repeated three times with similar results. e–f, P values obtained by heteroscedastic two-sided t-test. NS, not significant.
© 2017 Macmillan Publishers Limited, part of Springer Nature. All rights reserved.
6 4 0 | n A T U r e | v o L 5 5 1 | 3 0 n o v e m b e r 2 0 1 7
LetterreSeArCH
those which scored as differentially depleted1 (Supplementary Table 1). shRNAs targeting enzymes catalysing oxygen-consuming reactions (Supplementary Table 2) were significantly more likely to be differen-tially depleted in vivo (Extended Data Fig. 1a, b).
Oxygen levels affect the activity of oxygen-consuming enzymes, resulting in altered dependence3. Because oxygen levels vary consider-ably between in vivo and in vitro environments4, we performed screens at atmospheric (21%) or tissue level oxygen (3%). shRNAs differentially depleted in 21% oxygen (Supplementary Table 3) were more likely to be differentially depleted in vitro, resulting in a significantly shifted distribution (median of 0.66 versus 0.17, P < 1 × 10⁻¹³, Fig. 1b). Of the 1,384 shRNAs specifically depleted in 21% oxygen, 271 were differen-tially essential in vitro versus in vivo, a highly significant overlap of 20% (P < 1 × 10⁻⁵, Fig. 1c and Supplementary Table 4). Notably, shRNAs targeting the cysteine desulfurase NFS1 were among the most depleted in vitro at 21% oxygen, but exhibited little depletion at 3% oxygen or in vivo, indicative of a specific oxygen-dependent requirement (six out of eight shRNAs scoring, Fig. 1c).
NFS1 is an essential enzyme in eukaryotes that harvests sulfur from cysteine for the biosynthesis of iron–sulfur clusters (ISCs), protein co-factors sensitive to oxidative damage that are present in at least 48 human enzymes5–7 (Fig. 1d and Supplementary Discussion). Transduction of MCF10DCIS.com or transformed breast cell line MDA-MB-231 with shRNAs targeting NFS1 (shNFS1) reduced protein levels by 80–95% and blocked proliferation in 21% oxygen, an effect reversed at 3% oxygen or in tumour xenografts (Extended Data Fig. 2a, b). Indeed, sensitivity to suppression of NFS1 begins at oxygen
concentrations above 3–5% (Fig. 1e and Extended Data Fig. 2c). To verify that NFS1 dependence requires its catalytic activity, we generated a shRNA-resistant NFS1 cDNA (NFS1res), and modified a predicted catalytic residue (C381, NFS1resCD)8. Expression of NFS1res, but not NFS1resCD, completely rescued the proliferative defect induced by shNFS1 (Fig. 1f and Extended Data Fig. 2d). ABCB7, which exports ISCs synthesized in mitochondria to the cytosol9, also scored as differentially essential in 21% oxygen (three out of five shRNAs scoring, Fig. 1c, d). Suppression of ABCB7 or other genes required for ISC biosynthesis (ISCU and FXN) impacted proliferation at 21% oxygen without affecting proliferation at 3% oxygen or tumour xenograft growth (Extended Data Fig. 2e, f), whereas suppression of processes requiring NFS1 for ISC biosynthesis-independent activities10 did not impact viability (Extended Data Fig. 2g). Therefore, the oxygen- dependent sensitivity observed upon NFS1 suppression is a conse-quence of decreasing ISC biogenesis.
Breast tumours are hypoxic compared to normal breast tissue11. However, the oxygen level encountered by a cancer cell seeding a lung metastasis is unknown, and could drive dependence on path-ways required under high environmental oxygen. We found that MDA-MB-231 cells expressing tdTomato and either shNFS1 or shGFP control robustly form primary mammary tumours (Fig. 1g), but shNFS1-expressing cells cannot colonize the lung efficiently, as revealed by analysis of macrometastases (Fig. 1h and Extended Data Fig. 3a), micrometastases (Fig. 1i and Extended Data Fig. 3a–c), and competi-tion assays (Extended Data Fig. 3d, e). NFS1 protein levels are increased in cells grown at 21% oxygen versus 3% or 0.5% oxygen in vitro, and
a
d e
f gCopynumber ≤12≥4 3 1.5
Ch. 20
~60
0 kb
Non-small-cell lung tumours and cell lines
NFS1RBM12
CPNE1SPAG4
FER1L4ERICG3C20orf173
CEP250GDF5
UQCC
ROMO1RBM39
PHF20
NFS1
RPS6
MDA-M
B-231
MCF1
0DCIS
SW90
0
NCI-H19
6
A549NCI-H
2170
NCI-H64
7
SK-MES-1
NCI-H32
2
NFS1amp:
++ ++– +–––– –
NFS1
RPS6
NCI-H322crNFS1
NFS1 cDNA +––++–
0.8
0.6
0.4
0.2
0
Rel
ativ
e pr
olife
ratio
n
1.0
crNFS1NFS1 cDNA +––
++–
1.2
200
100
0
Sof
t ag
ar c
olon
ies
300
crNFS1NFS1 cDNA
400
h
Nfs1
RPS6
7
43210P
opul
atio
n d
oub
lings
shRFP
shNfs
1
21% O2 3% O2
shRFP
shNfs
1
56
i
600
400
200
05 10 15 20
Time (days)
1,000
shRFP shNfs1
Tum
our
volu
me
(mm
3 )
Rad
ianc
e (1
08 p
hoto
ns s
–1 c
m–2
sr–1
)
j
1.41.21.00.8
00 5 15 20
Time (days)
1.6
shRFP
shRFP
shNfs1
shNfs1
10 25
P = 0.02
0.20.40.6
shR
FPsh
Nfs
1
Day 2 Day 16 Day 21 Day 24
b
200
100
0
NFS
1 H
-sco
re
300
Small
-cell
Squam
ous
Adeno.
200
100
0
300
Poor
Mod
erat
eW
ell
Sm
all-
cell
Sq
uam
ous
Wel
l-d
iffer
entia
ted
Poo
rly-
diff
eren
tiate
d
Ad
enoc
arci
nom
a
c
+––++–
2.0
1.5
1.0
0.5
0.0
Rad
ianc
e (1
08 p
hoto
ns s
–1 c
m–2
sr–1
)
P = 1 × 10⁻⁴
8 × 10⁻³
P = 2 × 10⁻³
P = 1 × 10⁻⁵ 4 × 10⁻⁵
1 × 10⁻²
3 × 10⁻² P = 6 × 10⁻⁵ 6 × 10⁻⁶
2 × 10⁻²
2 × 10⁻²
+ ++
+ ++
+
++
+++
+
++++
++++
+
+++
++ +
++ +++
800
1,5002.4
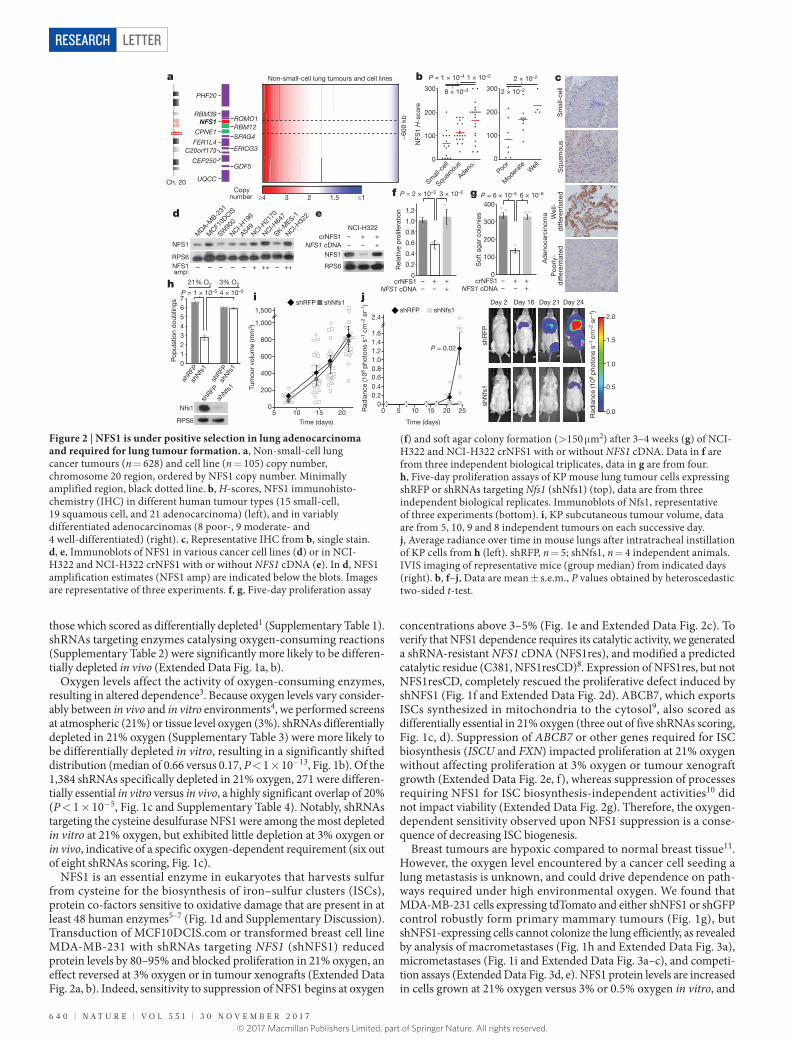
Figure 2 | NFS1 is under positive selection in lung adenocarcinoma and required for lung tumour formation. a, Non-small-cell lung cancer tumours (n = 628) and cell line (n = 105) copy number, chromosome 20 region, ordered by NFS1 copy number. Minimally amplified region, black dotted line. b, H-scores, NFS1 immunohisto-chemistry (IHC) in different human tumour types (15 small-cell, 19 squamous cell, and 21 adenocarcinoma) (left), and in variably differentiated adenocarcinomas (8 poor-, 9 moderate- and 4 well-differentiated) (right). c, Representative IHC from b, single stain. d, e, Immunoblots of NFS1 in various cancer cell lines (d) or in NCI-H322 and NCI-H322 crNFS1 with or without NFS1 cDNA (e). In d, NFS1 amplification estimates (NFS1 amp) are indicated below the blots. Images are representative of three experiments. f, g, Five-day proliferation assay
(f) and soft agar colony formation (> 150 μ m2) after 3–4 weeks (g) of NCI-H322 and NCI-H322 crNFS1 with or without NFS1 cDNA. Data in f are from three independent biological triplicates, data in g are from four. h, Five-day proliferation assays of KP mouse lung tumour cells expressing shRFP or shRNAs targeting Nfs1 (shNfs1) (top), data are from three independent biological replicates. Immunoblots of Nfs1, representative of three experiments (bottom). i, KP subcutaneous tumour volume, data are from 5, 10, 9 and 8 independent tumours on each successive day. j, Average radiance over time in mouse lungs after intratracheal instillation of KP cells from h (left). shRFP, n = 5; shNfs1, n = 4 independent animals. IVIS imaging of representative mice (group median) from indicated days (right). b, f–j, Data are mean ± s.e.m., P values obtained by heteroscedastic two-sided t-test.
© 2017 Macmillan Publishers Limited, part of Springer Nature. All rights reserved.
3 0 n o v e m b e r 2 0 1 7 | v o L 5 5 1 | n A T U r e | 6 4 1
Letter reSeArCH
in lung metastases compared with primary tumours (Extended Data Fig. 3f, g). This regulation of NFS1 protein levels occurs by a post- transcriptional, prolyl hydroxylase-independent mechanism, consistent with a cellular response to high environmental oxygen that involves NFS1 (Extended Data Fig. 3g). Therefore, breast cancer cells depend upon NFS1 to initiate metastatic lung tumours, which may be due to high environmental oxygen levels.
We next assessed whether NFS1 undergoes genetic alteration in primary human lung cancer. Public datasets reveal increased NFS1 mRNA in lung adenocarcinoma versus normal lung, and in non-small-cell lung cancer cell lines versus other lines, in contrast to other core ISC biosynthetic components (Extended Data Fig. 4a, b). Interestingly, the NFS1 locus is under significant positive selection in non-small-cell lung cancer12. The amplification peak contains only two other genes and is present focally in 7.4% of tumours and cell lines, or either focally or non-focally at an overall frequency of 38% (Fig. 2a). Immunohistochemical analysis revealed that human lung adenocarcinomas exhibited the strongest NFS1 staining followed by squamous cell carcinoma and small-cell lung cancer, which exhib-ited staining similar to tumour-adjacent normal tissue (Fig. 2b, c). Within adenocarcinomas, NFS1 staining was heterogeneous: well- differentiated, low-grade regions and regions of carcinoma in situ exhibited the highest staining, versus poorly differentiated, high-grade regions (Fig. 2b, c). These data are consistent with increased NFS1 expression in early lung adenocarcinomas at a location or time when cells would have the greatest exposure to the high oxygen envi-ronment of the lung. Because 50% of lung adenocarcinoma samples analysed had NFS1 staining similar to amplified lines (NCI-H322, Extended Data Fig. 4c), multiple mechanisms are likely to exist to upregulate NFS1 expression.
Cell lines harbouring NFS1 amplification (NCI-H322, NCI-H647, and NCI-H2170) had increased levels of NFS1 protein (Fig. 2d), and expression data show significant correlation between NFS1 mRNA and copy number (Extended Data Fig. 4d). Transient expression of Streptococcus pyogenes Cas9 and a short guide RNA targeting NFS1 in NCI-H322 cells produced isogenic clones with the loss of many, but not all, of the 7–8 NFS1 copies and NFS1 protein levels similar to non-amplified lines (NCI-H322 crNFS1) (Extended Data Fig. 4e–g). NCI-H322 crNFS1 cells have impaired proliferation in 21% oxygen and diminished matrix-independent growth, phenotypes reversed by NFS1 re-expression via transduction with NFS1res (Fig. 2 e–g), demon-strating that NFS1 amplification drives these phenotypes under atmos-pheric oxygen.
Because NFS1-amplified human lung cancer lines did not form lung tumour xenografts, we used a KRAS G12D mutant and Trp53 deleted mouse lung cancer line, KrasG12D/+Trp53−/− (KP), to assess the require-ment for NFS1 in a system with robust NFS1 expression (Extended Data Fig. 4h). In vitro suppression of Nfs1 in KP cells by shRNA targeting Nfs1 (shNfs1) reduced Nfs1 protein levels and slowed proliferation in 21%, but not 3%, oxygen (Fig. 2h). KP cells expressing shNfs1 or shRFP were equally capable of forming subcutaneous tumours, whereas cells expressing shNfs1 instilled intratracheally formed lung tumours poorly (Fig. 2i, j and Extended Data Fig. 4h). Thus, we conclude that robust NFS1 expression is required for the growth of primary lung tumours.
We next assessed the mechanism by which cancer cells are sensitive to NFS1 suppression. We confirmed the NFS1 requirement persists in VHL- and LKB1 (also known as STK11)-null cells (Extended Data Fig. 5a). In low oxygen conditions, metabolism rewires to decrease reliance on oxidative phosphorylation (OXPHOS), a pathway
VC
NFS
1res
NFS
1res
CD
VC
NFS
1res
NFS
1res
CD
shRFP shNFS1_1
1.5
1.0
0.5
0
shRFP
shNFS
1_1
shRFP
shNFS
1_1
3% O221% O2
1.5
1.0
0.5
0
shRFP
shNFS
1_1
Aco
nita
se a
ctiv
ity
shRFP
shNFS
1_1
VC NFS1res
3
2
1
0
4
shRFP shNFS1_1
Measurement
FCCP Ant.
3
2
1
0
4
Measurement
FCCP Ant.3% O2 21% O2
0.8
0.6
0.4
0.2
0Rel
ativ
e ox
ygen
con
s.
1.0
shRFP shNFS1_1
21% 3% MDA-MB-231 DCIS.com
a
4
3
2
1
0
Pop
ulat
ion
dou
blin
gs
Trolox
3% O2 21% O2
Fer-1 NAC
c d e
1.0
0.5
0
shRFP shNFS1
tbHP: + +– –
f g h
3% O2
R R N N R R N N
tbHP
RPS6
NFS1
TFRCshRNA: R N R N
3% O221% O2
100
50
0
Cou
nts
(% o
f max
)
DCFDA �uorescence (log10)101 102 103 104 101 102 103 104
ROS (DCFDA)shRFP
100
50
0
shNFS1_1
3% O2 21% O2 3% O2 + tbHPRel
ativ
e ac
onita
se a
ctiv
ity
b
4
3
2
1
0Pop
ulat
ion
dou
blin
gs
6
5
shRFP shNFS1_1shRFP shNFS1_1
21% 3% [O2]:Cybrid: CYTB WT
4
3
2
1
0
Py/UrNS
MDA-MB-231
i Low O2, breast tumours
NFS1
Fe–S clusters Fe–S clusters Fe–S clusters
Cell essentialfunctions
High O2, incipient lung tumours
O2 O2 O2
NFS1 NFS1
Cell essentialfunctions
Cell essentialfunctions
RNAi RNAi
21% 3%
O2
cons
ump
tion
rate
(pm
ol m
in–1
per
1,0
00 c
ells
)
RPS6
NFS1
TFRC
21% 3%
+
++++
+
++++
++ ++
++++
++++
+
+ ++
+
+++
++
++ +++ +
+ +
++ +
+ ++
+++
+++++
+ ++ ++
+ +
+
+ +
+
+ ++++
+
+ ++
++
+
+++++
+
+ ++
+
+
+ ++
+ ++
+ ++
+++
+++
+
++
++ +
1.2 + +
+
+
+ +
+
+
+
++
+
+++ +++ ++ +++
+++
+ ++
++ +
+++
+++ +++
+++ ++
+
+++ +++ ++
++++ ++
+ +++
+++ ++
++++
+++ ++
+ ++++++ ++
++++
+++
+++
+++
+++
+++
+++
+++
+++
+++
+++ ++
+ ++++++ +
++ +++
+++
+++
++++++
+++
+++
P =P =
P =
6 ×
10–3
P = P =
P =
3 ×
10–4
2 ×
10–5 4
× 1
0–48
× 1
0–4
5 ×
10–3
2 ×
10–4
3 ×
10–3
3 ×
10–5
3 ×
10–3
3 ×
10–4
5 ×
10–4
3 ×
10–2
4 ×
10–3
2 ×
10–3
4 ×
10–3
RPS6
NFS1
TFRC
shRNA:
3% O2
[O2]:
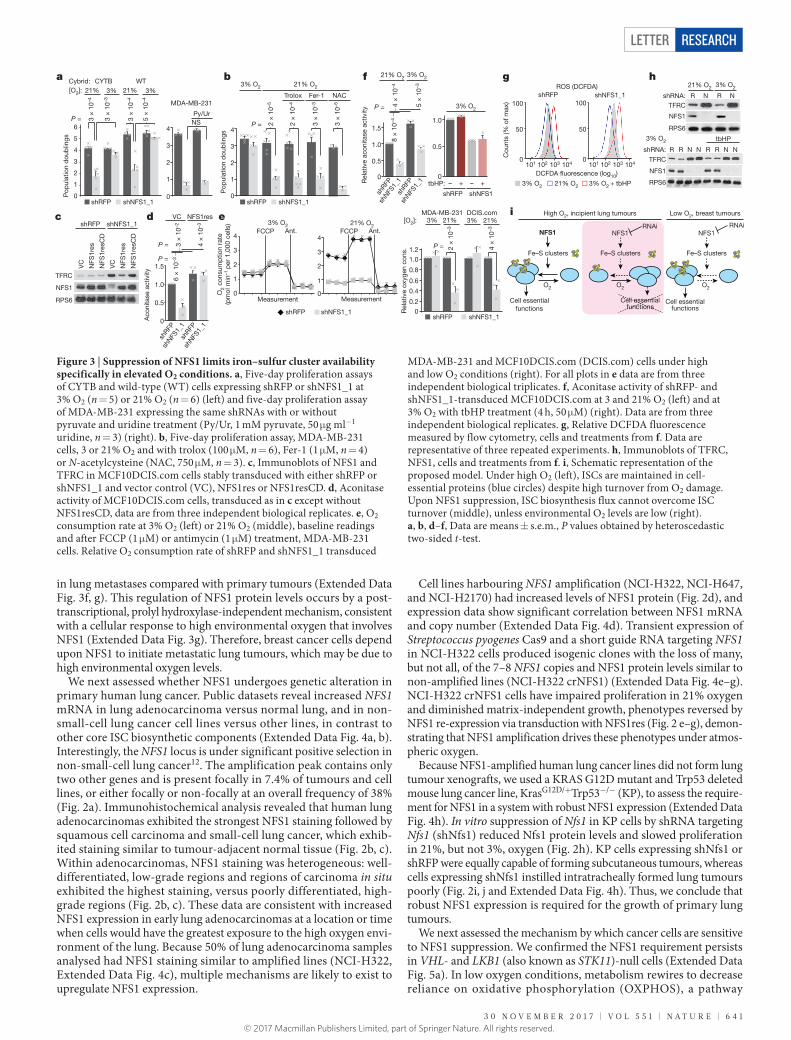
Figure 3 | Suppression of NFS1 limits iron–sulfur cluster availability specifically in elevated O2 conditions. a, Five-day proliferation assays of CYTB and wild-type (WT) cells expressing shRFP or shNFS1_1 at 3% O2 (n = 5) or 21% O2 (n = 6) (left) and five-day proliferation assay of MDA-MB-231 expressing the same shRNAs with or without pyruvate and uridine treatment (Py/Ur, 1 mM pyruvate, 50 μ g ml−1 uridine, n = 3) (right). b, Five-day proliferation assay, MDA-MB-231 cells, 3 or 21% O2 and with trolox (100 μ M, n = 6), Fer-1 (1 μ M, n = 4) or N-acetylcysteine (NAC, 750 μ M, n = 3). c, Immunoblots of NFS1 and TFRC in MCF10DCIS.com cells stably transduced with either shRFP or shNFS1_1 and vector control (VC), NFS1res or NFS1resCD. d, Aconitase activity of MCF10DCIS.com cells, transduced as in c except without NFS1resCD, data are from three independent biological replicates. e, O2 consumption rate at 3% O2 (left) or 21% O2 (middle), baseline readings and after FCCP (1 μ M) or antimycin (1 μ M) treatment, MDA-MB-231 cells. Relative O2 consumption rate of shRFP and shNFS1_1 transduced
MDA-MB-231 and MCF10DCIS.com (DCIS.com) cells under high and low O2 conditions (right). For all plots in e data are from three independent biological triplicates. f, Aconitase activity of shRFP- and shNFS1_1-transduced MCF10DCIS.com at 3 and 21% O2 (left) and at 3% O2 with tbHP treatment (4 h, 50 μ M) (right). Data are from three independent biological replicates. g, Relative DCFDA fluorescence measured by flow cytometry, cells and treatments from f. Data are representative of three repeated experiments. h, Immunoblots of TFRC, NFS1, cells and treatments from f. i, Schematic representation of the proposed model. Under high O2 (left), ISCs are maintained in cell-essential proteins (blue circles) despite high turnover from O2 damage. Upon NFS1 suppression, ISC biosynthesis flux cannot overcome ISC turnover (middle), unless environmental O2 levels are low (right). a, b, d–f, Data are means ± s.e.m., P values obtained by heteroscedastic two-sided t-test.
© 2017 Macmillan Publishers Limited, part of Springer Nature. All rights reserved.

6 4 2 | n A T U r e | v o L 5 5 1 | 3 0 n o v e m b e r 2 0 1 7
LetterreSeArCH
containing many ISC proteins. To assess whether NFS1 dependence results from inhibiting OXPHOS, we used patient-derived cytoplas-mic hybrid lines harbouring a deletion in cytochrome b (CYTB), a key complex III component13. These cells maintain mitochondrial ISC pro-teins, but are devoid of respiratory chain activity. Suppression of NFS1 reduced proliferation of CYTB-null cells and wild-type counterparts; proliferation was restored by culture in 3% oxygen (Fig. 3a). Similarly, supplementation of MDA-MB-231 cells with pyruvate and uridine, which support viability in OXPHOS-deficient cells, did not rescue the proliferative effects of NFS1 suppression (Fig. 3a). Therefore, the pro-liferative effects of NFS1 suppression cannot be explained solely by the loss of ISCs from respiratory chain proteins, indicating that NFS1 sup-pression has effects that extend beyond OXPHOS and the electron trans-port chain. Indeed, analysis of CRISPR–Cas9 genetic screening datasets reveals several cell-essential ISC proteins (Extended Data Fig. 5b).
Atmospheric oxygen is toxic to cells with defects in management of reactive oxygen species (ROS)14,15. However, the antiproliferative effects of NFS1 suppression are not affected by antioxidant treatment, and levels of the antioxidant glutathione are not decreased (Fig. 3b and Extended Data Fig. 5c, d). NFS1 suppression does not increase cytoplasmic ROS, in contrast to the suppression of the cytosolic or mitochondrial superoxide dismutases (SOD1 or SOD2, respectively), and 3% oxygen culture only partially rescues the antiproliferative effects of SOD1 and SOD2 (Extended Data Fig. 5e, f), consistent with a specific effect of oxygen on ISCs. These data do not support the hypothesis that sensitivity to NFS1 suppression in high oxygen is due to ROS induction.
ISCs undergo degradation upon exposure to oxygen and other oxidants in biochemical assays16 (Supplementary Discussion). We assessed ISC turnover in ACO1 by monitoring cytoplasmic aconitase activity, and OXPHOS components by monitoring oxygen consumption. We also monitored the iron-starvation response, activated by loss of the ACO1 ISC, the apo form of which functions as an iron-responsive protein (IRP1), stabilizing transferrin receptor 1 (TFRC) mRNA and inhibiting translation of ferritin heavy chain (FTH1)17. NFS1 suppression induced TFRC expression and repressed FTH1 and cytoplasmic aconitase activity, phenotypes rescued by NFS1res expression (Fig. 3c, d and Extended Data Fig. 5g), consistent with previous work on IRP1 mRNA binding18. NFS1 suppression did not affect oxygen consumption of cells cultured in 3% oxygen, but markedly reduced oxygen consumption in cells grown at 21% oxygen (Fig. 3e). NFS1 suppression and culture in 21% oxygen had an additive effect on cytosolic aconitase activity (Fig. 3f). This fine-tuned modulation of ISC occupancy in IRP1 is consistent with its role as an iron or ISC sensor.
These results highlight the sensitivity of ISCs to oxygen, leading us to investigate sensitivity to ROS. Culture at 21% oxygen does not increase ROS levels (Fig. 3g), whereas aconitase activity is reduced (Fig. 3f) and TFRC expression is increased (Fig. 3h). By contrast, treatment with tert-butyl hydroperoxide (tbHP) increases ROS levels without affecting aconitase activity or TFRC expression in NFS1-suppressed or control cells (Fig. 3f–h). Therefore, oxygen and tbHP have divergent effects on ROS levels and ISC proteins. Indeed, levels of mitochondrial ROS are increased in 0.5% oxygen19, yet cells expressing an NFS1 shRNA proliferate well in this condition (Fig. 1e). These results support a model in which oxygen present in the cell routinely encounters and oxidizes ISCs, whereas ROS encounter cellular antioxidant defences and are neutralized. Therefore, NFS1 suppression results in proliferative arrest upon exposure to atmos-pheric oxygen because the ISC biosynthetic machinery cannot meet the increased demand caused by specific damage to ISCs by oxygen, leading to the loss of ISCs from essential proteins (Fig. 3i).
Although treatment with tbHP does not impact ISC protein activity (Fig. 3f, h), surprisingly we observed that NFS1 suppression sensitizes MDA-MB-231 cells to tbHP, agents that induce mitochondrial ROS (paraquat) or inhibit glutathione biosynthesis (buthionine sulfoximine, BSO), but not to compounds (etoposide and doxorubicin) that inhibit growth by other mechanisms (Fig. 4a and Extended Data Fig. 6a, b). Therefore, a downstream consequence of NFS1 suppression is likely to
be responsible for increased ROS sensitivity, rather than further damage to ISCs. Indeed, NFS1 suppression blocks proliferation at 21% oxygen, whereas addition of ROS-inducing compounds at 3% oxygen ostensibly
a
shRFPshNFS1_1
1.0
0.8
0.6
0.4
0
Rel
ativ
e vi
abili
ty
0.2
BSO tbHP ErastinCtl Fer-1DFO Ctl Ctl
shR
FP
shN
FS1_
1
Control Erastin Erastin + Fer-1e
c
Cou
nts
(% o
f max
)
DCFDA �uorescence (log10)101 102 103 104 101 102 103 104 101 102 103 104 101 102 103 104
ROS (DCFDA)shRFP shNFS1_1
100
50
0
100
50
0
100
50
0
100
50
0 Cou
nts
(% o
f max
)
BODIPY �uorescence (log10)
Lipid ROS (BODIPY)shRFP shNFS1_1
1.7± 0.7%
35.8± 1.8%
3.6± 1.1%
30.7± 9.6%
f
xCTCys–Cys
Cys NFS1
Glutathione Fe–S clusters
Iron
IRP IRP
O2
Iron-starvationresponse
TFRC
Tfn+ ironIron
Erastin
Lipid ROS + soluble ROS
GPX4
Ferroptosis
b
Rel
ativ
e vi
abili
ty
g
3
2
1
0 4 9 14Time (days)
4
shGFP
Rel
ativ
e c
hang
e in
tum
our
volu
me
shGFPshNFS1_1 shNFS1_1
d
0.8
0.6
0.4
0.2
[tbHP] (μM)
1.0
0.8
0.6
0.4
0.2
0
[Paraquat] (mM)
1.0
0.8
0.6
0.4
0.2
0
[BSO] (μM)
1.0
Control Erastin Erastin + Fer-1
shRFPshNFS1_1
+++
++ +
Fer-1DFO Fer-1DFO
+++ ++ + +++
+++ +++
+++
++++++
++++++
++
+
+++
++++++
++++++
4 ×
10–5
1 ×
10–4
3 ×
10–4
2 ×
10–4
2 ×
10–6
6 ×
10–7
2 ×
10–4
1 ×
10–4
3 ×
10–5
57
+Cyst(e)inaseControl reaction
P =
P =
2 ×
10–3
3 ×
10–3
7 ×
10–5
7 ×
10–5
4 ×
10–6
4 ×
10–3
5 ×
10–4
3 ×
10–4
3 ×
10–4
8 ×
10–4
3 ×
10–2
0 10 15 20 25 0 0.1 0.2 0.3 0.40 10 20 40 5
Control BSO Fer-1 BSO + Fer-1
3 ×
10–3
1 ×
10–2
3 ×
10–4
5 ×
10–3
7 ×
10–3
P =
Figure 4 | Suppression of NFS1 predisposes cancer cells to ferroptosis. a, Relative viability (2 days, 3% O2) of MDA-MB-231 cells, expressing shRFP or shNFS1_1, treated with varying concentrations of BSO, tbHP or paraquat. Data are from three biologically independent replicates. b, Relative viability (2 days, 3% O2) of cells from a treated with BSO (5 μ M), tbHP (10 μ M) or erastin (2.5 μ M) and deferoxamine (DFO, 100 μ M), Fer-1 (1 μ M) or no treatment control (ctl). Data are from three biologically independent triplicates. c, d, Relative DCFDA (c) or BODIPY (d) fluorescence measured by flow cytometry of MDA-MB-231 cells from a, after 48 h treatment with either BSO (20 μ M), Fer-1 (1 μ M) or both. Red text indicates the percentage ± s.e.m. cells in the bracketed region. Data are from three biological replicates. e, Representative images from triplicate experiments, overnight erastin (5 μ M), Fer-1 (1 μ M). f, MDA-MB-231 tumour growth. Once palpable (day 0), animals were treated every 3 days (50 mg kg−1 PEG-cyst(e)inase). Change in volume reported, caliper measurement. Data are from six independent replicate tumours. g, Schematic of the proposed model. NFS1 suppression results in loss of IRP ISCs, upregulation of iron-starvation response (increased transferrin receptor (TFRC), decreased ferritin), and increased free intracellular iron. High iron promotes ferroptosis by increasing lipid peroxidation. a, b, f, Data are mean ± s.e.m., P values obtained by heteroscedastic two-sided t-test. Tfn, transferrin; xCT, cystine-glutamate antiporter.
© 2017 Macmillan Publishers Limited, part of Springer Nature. All rights reserved.

3 0 n o v e m b e r 2 0 1 7 | v o L 5 5 1 | n A T U r e | 6 4 3
Letter reSeArCH
results in cell death. Because NFS1 suppression robustly activates the iron-starvation response (Fig. 3c, h), we assessed the effect of activating this pathway on ROS-induced cell death.
Iron promotes the production of superoxide radicals via the Fenton reaction, which can result in lipid peroxidation20. Ferroptosis, a form of cell death, has been characterized by iron accumulation and cyto-plasmic and lipid ROS induction21. Erastin, a ferroptosis inducer, can inhibit cystine import, and depresses glutathione levels22. Consistent with erastin inducing iron accumulation via inhibition of ISC biosynthesis, erastin treatment activated the iron-starvation response, although the effect of NFS1 suppression was far more robust (Extended Data Fig. 6c). However, NFS1 suppression alone cannot induce ferrop-tosis because NFS1 suppression does not decrease glutathione levels or increase ROS. Furthermore, ferrostatin (Fer-1), iron chelators, suppres-sion of lysosomal acidification, and antioxidants do not rescue the pro-liferation defect caused by NFS1 suppression, despite being suppressors of ferroptosis23 (Fig. 3b, g and Extended Data Fig. 5c–e). We therefore hypothesized that induction of the iron-starvation response upon NFS1 suppression promotes ferroptosis when cells encounter ROS. Indeed, cell death induced by BSO or tbHP treatment of NFS1 suppressed cells is rescued by iron chelators and Fer-1, but not by inhibitors of apop-tosis, necrosis, or autophagy (Fig. 4b and Extended Data Fig. 6b, d). Moreover, in cells expressing shNFS1 and treated with BSO, tbHP, or erastin, cellular and lipid ROS increased, phenotypes rescued by Fer-1 (Fig. 4c, d and Extended Data Fig. 6e–h).
Although some cell lines respond to erastin by undergoing ferroptosis in under 24 h, many exhibit relative resistance22. Erastin treatment of four lines (MDA-MB-231, A549, NCI-H838, or NCI-H460), resulted in widespread cell death specifically in NFS1 suppressed cells (Fig. 4b, e and Extended Data Fig. 6i). Cystine deprivation and inhibi-tion of a downstream target of erastin, GPX4, also cooperate with NFS1 suppression to induce cell death (Extended Data Fig. 6j, k). We then evaluated two recently described methods for inducing oxidative stress in vivo: treatment with cyst(e)inase, a cyst(e)ine-degrading enzyme24, or a combination of cystine transport inhibitor sulfasalazine (SSA) and BSO25. MDA-MB-231 tumour xenografts expressing an NFS1 shRNA are specifically sensitive to cyst(e)inase, with tumours initially regressing (range, 5–65%; median, 21 ± 8% (s.e.m.)) before resuming growth (Fig. 4f). Tumours in this group exhibited NFS1 re-expression, consistent with NFS1 conferring resistance to treatment (Extended Data Fig. 7a, b). Combined administration of SSA and BSO generally impacts tumour growth, but tumours expressing an NFS1 shRNA exhibit additional toxicity (Extended Data Fig. 7c). Therefore, inhi-bition of ISC biosynthesis promotes induction of ferroptosis in vitro, and sensitizes cells to oxidative stress in vivo (Fig. 4g). In summary, although atmospheric oxygen and cystine transport inhibitors both increase the iron-starvation response, suppression of NFS1 does so to a much greater extent. These observations lead to the hypothesis that one can trick cancer cells into taking up large quantities of iron and releasing intracellular iron stores via modulation of NFS1 or down-stream effectors, such as IRPs, leaving them at increased risk of ROS-mediated cell death mechanisms such as ferroptosis.Online Content Methods, along with any additional Extended Data display items and Source Data, are available in the online version of the paper; references unique to these sections appear only in the online paper.
received 12 May 2016; accepted 10 October 2017.
Published online 22 November 2017.
1. Birsoy, K. et al. Metabolic determinants of cancer cell sensitivity to glucose limitation and biguanides. Nature 508, 108–112 (2014).
2. Davidson, S. M. et al. Environment impacts the metabolic dependencies of Ras-driven non-small cell lung cancer. Cell Metab. 23, 517–528 (2016).
3. Kamphorst, J. J. et al. Hypoxic and Ras-transformed cells support growth by scavenging unsaturated fatty acids from lysophospholipids. Proc. Natl Acad. Sci. USA 110, 8882–8887 (2013).
4. Vaupel, P., Kallinowski, F. & Okunieff, P. Blood flow, oxygen and nutrient supply, and metabolic microenvironment of human tumors: a review. Cancer Res. 49, 6449–6465 (1989).
5. Stehling, O., Wilbrecht, C. & Lill, R. Mitochondrial iron–sulfur protein biogenesis and human disease. Biochimie 100, 61–77 (2014).
6. Netz, D. J., Mascarenhas, J., Stehling, O., Pierik, A. J. & Lill, R. Maturation of cytosolic and nuclear iron-sulfur proteins. Trends Cell Biol. 24, 303–312 (2014).
7. Imlay, J. A. Iron–sulfur clusters and the problem with oxygen. Mol. Microbiol. 59, 1073–1082 (2006).
8. Marchler-Bauer, A. et al. CDD: NCBI’s conserved domain database. Nucleic Acids Res. 43, D222–D226 (2015).
9. Paul, V. D. & Lill, R. Biogenesis of cytosolic and nuclear iron–sulfur proteins and their role in genome stability. Biochim. Biophys. Acta 1853, 1528–1539 (2015).
10. Marelja, Z., Stöcklein, W., Nimtz, M. & Leimkühler, S. A novel role for human Nfs1 in the cytoplasm: Nfs1 acts as a sulfur donor for MOCS3, a protein involved in molybdenum cofactor biosynthesis. J. Biol. Chem. 283, 25178–25185 (2008).
11. Vaupel, P., Schlenger, K., Knoop, C. & Höckel, M. Oxygenation of human tumors: evaluation of tissue oxygen distribution in breast cancers by computerized O2 tension measurements. Cancer Res. 51, 3316–3322 (1991).
12. Zack, T. I. et al. Pan-cancer patterns of somatic copy number alteration. Nat. Genet. 45, 1134–1140 (2013).
13. De Coo, I. F. et al. A 4-base pair deletion in the mitochondrial cytochrome b gene associated with parkinsonism/MELAS overlap syndrome. Ann. Neurol. 45, 130–133 (1999).
14. van Loon, A. P., Pesold-Hurt, B. & Schatz, G. A yeast mutant lacking mitochondrial manganese-superoxide dismutase is hypersensitive to oxygen. Proc. Natl Acad. Sci. USA 83, 3820–3824 (1986).
15. Bilinski, T., Krawiec, Z., Liczmanski, A. & Litwinska, J. Is hydroxyl radical generated by the Fenton reaction in vivo? Biochem. Biophys. Res. Commun. 130, 533–539 (1985).
16. Flint, D. H., Emptage, M. H., Finnegan, M. G., Fu, W. & Johnson, M. K. The role and properties of the iron-sulfur cluster in Escherichia coli dihydroxy-acid dehydratase. J. Biol. Chem. 268, 14732–14742 (1993).
17. Casey, J. L. et al. Iron-responsive elements: regulatory RNA sequences that control mRNA levels and translation. Science 240, 924–928 (1988).
18. Meyron-Holtz, E. G., Ghosh, M. C. & Rouault, T. A. Mammalian tissue oxygen levels modulate iron-regulatory protein activities in vivo. Science 306, 2087–2090 (2004).
19. Chandel, N. S. et al. Mitochondrial reactive oxygen species trigger hypoxia-induced transcription. Proc. Natl Acad. Sci. USA 95, 11715–11720 (1998).
20. Minotti, G. & Aust, S. D. The role of iron in oxygen radical mediated lipid peroxidation. Chem. Biol. Interact. 71, 1–19 (1989).
21. Yang, W. S. & Stockwell, B. R. Ferroptosis: death by lipid peroxidation. Trends Cell Biol. 26, 165–176 (2016).
22. Yang, W. S. et al. Regulation of ferroptotic cancer cell death by GPX4. Cell 156, 317–331 (2014).
23. Dixon, S. J. et al. Ferroptosis: an iron-dependent form of nonapoptotic cell death. Cell 149, 1060–1072 (2012).
24. Cramer, S. L. et al. Systemic depletion of l-cyst(e)ine with cyst(e)inase increases reactive oxygen species and suppresses tumor growth. Nat. Med. 23, 120–127 (2017).
25. Harris, I. S. et al. Glutathione and thioredoxin antioxidant pathways synergize to drive cancer initiation and progression. Cancer Cell 27, 211–222 (2015).
Supplementary Information is available in the online version of the paper.
Acknowledgements We thank members of the laboratories of D.M.S., K.B. and R.P.; G. Georgiou and E. Stone for cyst(e)inase; C. Moraes, and I. F. M. de Coo for wild-type 143B and CYTB 143B cells; P. Thiru for bioinformatic support; C. Loomis, L. Chiriboga, and B. Zeck for histology. Research was supported by a gift from Agios Pharmaceuticals to D.M.S., National Institutes of Health (NIH) (T32GM007308 and T32GM115313 supporting V.O.S.; CA168940 to R.P., CA193660 to K.B., and CA103866, CA129105, and AI07389 to D.M.S.), Starr Cancer Consortium and Broad Institute SPARC to D.M.S., Leukemia and Lymphoma Society Special Fellow Award to K.B., V Foundation to R.P., Pew-Stewart Scholar Grant to R.P., Susan G. Komen for the Cure to R.P. D.M.S. is an investigator of the Howard Hughes Medical Institute. Experimental Pathology Resource Center supported by the NIH (P30CA016087, S10 OD010584-01, and S10 OD018338). Immune Monitoring Core supported by the NIH (S10 OD016304).
Author Contributions R.P., K.B., and D.M.S conceived the project and designed the experiments. R.P. and K.B. performed RNAi screens. T.P. assisted with the KP model and performed intratracheal instillations. A.L.M. and S.A. evaluated histopathology. S.W.A., V.O.S., E.M.T., and R.P. performed follow-up validation experiments. R.P., K.B., and D.M.S wrote and edited the manuscript.
Author Information Reprints and permissions information is available at www.nature.com/reprints. The authors declare no competing financial interests. Readers are welcome to comment on the online version of the paper. Publisher’s note: Springer Nature remains neutral with regard to jurisdictional claims in published maps and institutional affiliations. Correspondence and requests for materials should be addressed to R.P. ([email protected]), K.B. ([email protected]) or D.M.S. ([email protected]).
reviewer Information Nature thanks P. Storz and the other anonymous reviewer(s) for their contribution to the peer review of this work.
© 2017 Macmillan Publishers Limited, part of Springer Nature. All rights reserved.
LetterreSeArCH
MethOdSReagents. Reagents were obtained from the following sources. Antibodies: NFS1 (sc-365308) from Santa Cruz; CD31 (77699), RPS6 (2217), TFRC (13208), FTH1 (3998), SOD1 (2770), and SOD2 (13141) from Cell Signaling Technologies; Ki67 (M3062) from Spring Biosciences; and RFP (600-401-379) from Rockland. Cells: MCF10DCIS.com from the Karmanos Cancer Center; MDA-MB-231, SW900, NCI-H196, A549, NCI-H2170, NCI-H647, 786-O, A498 NCI-H838, NCI-H460 and SK-MES-1 from ATCC; NCI-H322 from Sigma. Chemicals: GFR Matrigel from Corning; RPMI-1640 from US Biological; Phusion DNA polymerase from New England Biolabs; BCA Protein Assay from Pierce; GSH-Glo Glutathione Assay from Promega (V6911); Aconitase Assay Kit (MAK051), tert-butyl hydroperoxide (458139), paraquat (methyl viologen, 856177), antimycin (A8674), carbonyl cyanide 4-(trifluoromethoxy)phenylhydrazone (C2920), 6-hydroxy-2,5,7,8-tetramethylchromane-2-carboxylic acid (Trolox, 238813), deferoxamine mesylate (D9533), ferrostatin-1 (SML0583), buthionine sulfoximine (B2515), and 1,10-phenanthroline (320056) from Sigma; intratra-cheal instillation platform (MSTAND-AH-1) from Laboratory Inventions; CM-H2DCFDA (C6827) from Life Technologies; BODIPY 581/591 C11 Lipid Peroxidation Sensor (D3861) from Life Technologies; 3-MA (189490) and MG-132 (474790) from Millipore; Z-VAD-FMK Caspase Inhibitor (550377) from BD biosciences; Necrostatin (2324/11) from R & D Systems; Erastin (S7242) from Selleckchem; sulfasalazine (sc-204312) from Santa Cruz; Ebselen (524510), Bafilomycin A1 (133410U), and DMOG (440810) from Fisher Scientific; RSL3 (A15865) from AdooQ; ML162 (20455) from Cayman Chemical Company; Lentiviral shRNAs were obtained from the The RNAi Consortium (TRC) collection of the Broad Institute, or identical sequences cloned into the TRC vector (pLKO.1PS). The TRC website is: https://portals.broadinstitute.org/gpp/public/. The TRC numbers for the shRNAs used are: shRFP, TRCN0000072203; shGFP, TRCN0000072186; shNFS1_1, TRCN0000229753; shNFS1_2, TRCN0000229755; shABCB7_1, TRCN0000059355; shABCB7_2, TRCN0000059356; shSOD1, TRCN0000018344; shSOD2, TRCN0000005943; shISCU, TRCN0000289988; shFXN_1, TRCN0000006138; shFXN_2, TRCN0000006137; MOCS3_1, TRCN0000045642; MOCS3_2, TRCN0000045640. The shRNAs used for the mini-screen targeting NFS1 are shNFS1_1, shNFS1_2, TRCN0000229756, and TRCN0000180881, with control shRNAs shRFP, shGFP, TRCN0000072208, TRCN0000072210, TRCN0000072225, and TRCN0000072236. The shRNA targeting mouse Nfs1 was cloned into the TRC pLKO.1P vector using the following o li go nu cl eo tidess: C CG GA GA AC AC CA AG TT GT AT TA AA CT CG AG TT TA AT A C AACTTGGTGTTCTTTTTTG and A AT TCAAAAAAGAACACCAAGTTGTATTAAACTCGAGTTTAATACAACTTGGTGTTCT.
All individual pLKO.1 shRNA plasmids and expression vectors used in this study are deposited at Addgene (https://www.addgene.org) for distribution.Cell culture. Cells were tested for the presence of mycoplasma by PCR-based methods and the authenticity of cell lines not ordered and used within one year was verified by STR profiling (Duke University). Cells were cultured in RPMI supplemented with 10% IFS (Sigma) and penicillin and streptomycin, except MCF10DCIS.com cells, which were cultured in 50:50 DMEM and F12 media with 5% horse serum (Invitrogen) and penicillin and streptomycin. O2 concentration was controlled by placing cells in a hypoxic incubator (InVivo2 400, Baker; or HeraCell 150i, Thermo Fisher). Cells were equilibrated to the O2 concentration indicated in each panel for at least 5 days unless otherwise stated. To generate clones in which the copy number of the NFS1 locus was reduced, we transiently expressed S. pyogenes Cas9 and a single guide RNA targeting the NFS1 genomic locus (target sequence GCGGATTTGCAGTTCCAGAA cloned into pLENTIC-RISPR) in NCI-H322 cells, and obtained clones derived from single cells (NCI-H322 crNFS1). Several clones exhibited a decrease in NFS1 protein to a level similar to non-amplified cell lines, consistent with loss of many, but not all, of the 7–8 NFS1 copies as verified by Sanger sequencing (Extended Data Fig. 4e–g).Analysis of metabolic enzymes by reaction performed. Reactants and products for metabolic enzyme reactions were extracted from the UniProt database. Those enzymes whose chemical reactions were not found in UniProt were curated manually from available databases and publications. The 25 most highly used metabolites were selected for analysis and the number of scoring shRNAs computed. Significance was assigned on the basis of a Fisher’s exact test comparing these data to the number of scoring shRNAs for all other enzymes for which a reaction had been annotated.Pooled shRNA screening. In vivo shRNA screening was performed as described26 using a previously published shRNA library1 (sequences provided in Supplementary Table 1). In brief, MCF10DCIS.com cells were infected with shRNAs in groups of 28 functional pools and selected for 3 days with 0.5 μ g ml−1 puromycin, followed by withdrawal of puromycin for 2 days. For the in vivo screen, 500,000 cells in 33% growth factor-reduced matrigel were injected into the fourth mouse mammary fat pad of NOD.CB17 Scid/J mice and tumours
were harvested 4 weeks after implantation. At the same time, cells were cultured in vitro and harvested for the in vitro screen after 4 weeks. For the high versus low O2 comparison, a second in vitro screen was performed in the same fashion except that cells were cultured at 21% O2 or 3% O2 in a single pool. In vivo screens were performed in replicates of 8–12 tumours, and in vitro screens were in replicates of four. Pool deconvolution and calculation of log2 fold change scores were performed as described1. To combine data across multiple pools, the median shRNA log2 fold change scores of the control shRNAs for each pool was normalized to 0. For differ-ential essentiality, a log2 fold change cut-off of ± 2 was used. The mini-screen was conducted using the same protocol except MDA-MB-231 cells were used with a pool of 4 shRNAs targeting NFS1 and 6 non-targeting controls. In addition to cells in culture and orthotopic tumours, lungs were also harvested for genomic DNA and processed together with the other samples. Average log2 fold change values are reported for each shRNA and normalized to the difference observed in 3% O2.
For competition assays involving two shRNAs, genomic DNA was harvested and the region containing the shRNAs was amplified and sequenced by Sanger sequencing. The relative abundance of each shRNA was calculated by measuring the proportion of shRFP or shNFS1_1 signal at the first six nucleotide positions that differ between the two shRNAs, and taking the average.Cell proliferation and viability assays. Cells were plated at 25,000 cells per well in a six-well dish and infected with lentiviral shRNAs at a multiplicity of infection of 2.5 in 1 μ g ml−1 polybrene by 30 min spin infection at 1,178g in Beckman Coulter Allegra X-12R centrifuge with an SX4750 rotor and Microplate Carrier attachment followed by an overnight incubation, 1 μ g ml−1 puromycin selection for three days, and one day recovery without puromycin. Cells were then plated out at 25,000 per well in triplicate and counted three days later, or protein harvested for western blotting or qPCR analysis. Cells were moved to the indicated O2 conditions after spin infection. Viability assays were carried out by plating 1,000–2,000 cells in replicates of four in 96-well clear bottom plates (Greiner 655098) one day before adding the indicated drug. Viability was assessed four days after drug treatment by Cell Titer Glo (Promega) and normalized to an untreated control. Soft agar assay was performed in 6-cm dishes by plating 100,000 cells in 0.4% noble agar (Sigma) in RPMI on a bed of 0.6% noble agar in RPMI. Colonies were counted after 3–4 weeks of growth by imaging plates at low magnification using a dissecting microscope (Leica M165), colony size and number were analysed using CellProfiler software27.Immunoblotting and immunohistochemistry. Immunoblotting was performed by washing cells in cold PBS followed by addition of lysis buffer (50 mM Tris pH 7.4, 150 mM NaCl, 1% NP-40, 0.1% sodium deoxycholate, 0.1% SDS, 2 mM EDTA) containing a protease inhibitor cocktail (Roche). Lysates were incubated on ice for 10 min and cleared by centrifugation at 21,000g for 10 min. Protein levels were quantified using a BCA protein assay kit (Pierce) and 15 μ g protein was loaded onto Bolt 4–12% Bis–Tris polyacrylamide gels (Thermo Fisher), electrophoresed at 100 V for 2 h, and transferred in transfer buffer (2.2 g l−1 CAPS, 0.45 g l−1 NaOH, 10% ethanol) to a PVDF membrane (Millipore IPVH00010) at 40 V for 2 h. Metastatic foci were counted from RFP stained sections by a blinded researcher.
For RFP and tdTomato immunohistochemistry, deparaffinization and staining were carried out on a Ventana XT using a DISCOVERY DAB Map Detection Kit. Slides were treated with Protease 3 for 12 min, antibody was applied at a 1:1,600 dilution and incubated for 60 min, secondary antibody (Vector BA-1000) was applied at a 1:200 dilution and incubated for 30 min. For NFS1 immunohisto-chemistry, deparaffinization and staining was carried out on a Ventana XT using a DISCOVERY ChromoMap DAB Kit. Slides were treated with CC1S (Tris-based buffer antigen retrieval for 36 min). Primary antibody was applied at a 1:100 dilu-tion and incubated for 3 h. Secondary antibody (DISCOVERY OmniMap anti-Ms HRP) was applied neat for 8 min. All slides were haematoxylin counterstained following the IHC assay. For comparisons of NFS1 level in primary tumour and lung metastases, formalin-fixed paraffin-embedded tissue was cut fresh and com-pared side-by-side on the same slide. Cultured cells expressing high (NCI-H322) and low (MDA-MB-231) levels of NFS1 were used to calibrate the dynamic window of staining intensity. Cultured cells were processed in conditions used to mimic formalin fixation and paraffin embedding, by plasma–thrombin embedding and sectioning. NFS1 H-score was scored by a blinded pathologist on a standard 0–300 point scale based on NFS1 mitochondrial staining intensity and area. Human studies were approved by the NYU School of Medicine Institutional Review Board.O2 consumption assays. O2 consumption was measured using the Seahorse Extracellular Flux Analyzer (XFe24). Cells were seeded at 35,000 per well on the day before measurement and the assay was conducted in Seahorse media with 10 mM glucose and 1 mM glutamine. At the indicated time points FCCP (1 μ M) or antimycin (1 μ M) were added. For experiments conducted at 3% O2, cells were infected, selected in puromycin, and plated on Seahorse plates in 3% O2; however, the O2 consumption measurements themselves were conducted at ambient O2 conditions.
© 2017 Macmillan Publishers Limited, part of Springer Nature. All rights reserved.

Letter reSeArCH
qPCR. RNA was isolated by column purification (RNeasy Kit, Qiagen) and cDNA synthesis was performed by reverse transcription of 1 μ g of total RNA by reverse transcriptase (Superscript III, 18080044, Invitrogen) in a reaction containing 1 μ l RNase OUT (10777019, Invitrogen). qPCR was performed on cDNA using SYBR green quantification (Maxima qPCR master mix, K0222, Thermo Fisher). ABCB7, ISCU and FXN expression was quantified relative to ACTB, MOCS3, NFS1, ENO2, and SLC2A3 were quantified relative to RPL13A using the fol-lowing primers: ABCB7 forward: GCAGTCACACGGTGGAGAACT, ABCB7 reverse: TTGACCAAAGTTCAGCATAGCC; ACTB forward: AAGGGACTTCC TGTAACAATGCA, ACTB reverse: CTGGAACGGTGAAGGTGACA; ISCU forward: CCAGCATGTGGTGACGTAATG, ISCU reverse: AGCTCCTTGGCG ATATCTGTG; FXN forward: CTTGCAGACAAGCCATACACG, FXN reverse: ACACCCAGTTTTTCCCAGTCC; NFS1 forward: CACTCCCGGACACA TGCTTAT, NFS1 reverse: TGTCTGGGTGGTGATCAAGTG; SLC2A3 forward: AGTCATGATCCCAGCGAGAC, SLC2A3 reverse: GCCGATTGTAGCAA CTGTGA; ENO2 forward: AGCTGGCCATGCAGGAGTTC, ENO2 reverse: GGCTTCCTTCACCAGCTCCA; MOCS3 forward: CGCTCCCTGCAAC TACTGA, MO CS3 reverse : CAGTCGCT TATAGTCGGTGACA; RPL13A forward: CATAGGAAGCTGGGAGCAAG, RPL13A reverse: GCCCTCCAATCAGTCTTCTGAnalysis of NFS1 copy number and expression. Copy number data shown in Fig. 2a were downloaded from the Broad Institute Tumorscape website (http://www.broadinstitute.org/tumorscape/pages/portalHome.jsf) and contain both cell line and primary tumour data. The minimum amplified region reported in Fig. 2a was identified from the website Broad TCGA website (https://www.broadinsti-tute.org/tcga/home) using the ‘2015-06-01 stddata__2015_04_02 regular peel-off ’ analysis version and the previously analysed ‘lung adenocarcinoma’ cancer subset28. Gene expression data reported in Extended Data Fig. 4a were downloaded from Oncomine using published data29. Gene expression data reported in Extended Data Fig. 4b, d were downloaded from https://www.broadinstitute.org/ccle, which is based on published data30.Flow cytometry with reactive O2 species probes. Cells were plated in 6-well plates the day before incubation with indicated treatments. For all flow experiments involving MCF10DCIS.com cells, 150,000 cells per well were plated. For MDA-MB-231 cells, 200,000 cells per well were plated for experiments involving BSO, and 100,000 cells per well were plated for all other experiments. With the exception of experiments involving tbHP, cells were incubated under indicated conditions, washed twice with 1× PBS and stained with 10 μ M of CM-H2DCFDA or 10 μ M BODIPY 581/591 C11 (diluted in PBS) for 20 min in an incubator at 37 °C and 21% O2. Following staining, cells were washed with PBS, trypsinized, and collected in 500 μ l of PBS. For tbHP experiments, cells were washed twice, stained with the indicated probes, treated with tbHP in serum-containing media for 4 h, washed again, trypsinized, and collected. For experiments performed at 3% O2, cells were equilibrated for 1 week before assessing ROS level. Flow cytometry data were collected on an Attune NxT Flow Cytometer with an excitation wavelength of 488 nm using the BL1 collection channel. Analysis of data was performed using FlowJo v.10 software.Aconitase assay. Aconitase activity was measured using an Aconitase Assay Kit (Sigma, MAK051). For each condition, 600,000 MCF10DCIS.com cells were plated in a 5-cm plate. The next day cells were washed with PBS and harvested by trypsinization. To determine the aconitase activity of harvested cells, the manufacturer’s protocol was followed without the addition of the activating solution.Competition Assays. Competition assay as reported in Extended Data Figure 3d uses six control (shCON) and four NFS1-targeting shRNAs in small pools in MDA-MB-231 cells. Transduced cell pools were grown at 21% O2 or 3% O2 in vitro, or injected orthotopically into the mammary fat pad and allowed to form primary tumours and lung metastases. Cells, primary tumours, and lungs were harvested 6 weeks after initiation of in vitro cultures or tumours, and isolated DNA was subjected to deep sequencing. Differential abundance of each shRNA is reported relative to the 3% O2 condition for samples grown in the indicated O2 concentrations, primary tumours, or lungs derived from mice harbouring these tumours after 6 weeks. Competition assay as reported in Extended Data Figure 3e uses MDA-MB-231 cells expressing a control vector or NFS1res, and subsequently transduced with either shRFP or shNFS1_1. Equal numbers of cells transduced with shRFP or shNFS1_1 were mixed before tail vein injection, and the relative abundance of each shRNA in both groups are reported relative to NFS1res.
Animal experiments. Tumours were initiated in 4–8-week-old female NOD.CB17 Scid/J mice. Orthotopically in the mouse mammary gland, by implantation of 500,000 cells in 25 μ l 33% Matrigel into the fourth mouse mammary fat pad; subcutaneously, by injection of 500,000 cells in 100 μ l 33% Matrigel into the left or right flank of the mouse; via tail vein by injection of 500,000 cells in 150 μ l RPMI into the mouse tail vein; and via intratracheal instillation by instilling 200,000 cells in 50 μ l 2 mM EDTA as described31. Cancer cells were transduced with viral shRNAs, selected for 3 days with puromycin, and allowed to recover for one day before introduction into mice. For experiments comparing subcutaneous and lung tumour formation, shRNA transduced cells were prepared at the same time and injected on the same day. Animals were imaged by IVIS (Perkin Elmer) 15 min following injection subcutaneously into the neck scruff with XenoLight d-Luciferin (165 mg per kg body weight, Perkin Elmer). Average luminescence was quantified per mouse from equal sized bins covering the mouse thorax. For experiments in which tumour growth was measured upon drug treatment, MDA-MB-231 cells, implanted as described above, were allowed to form palpable tumours (~ 4 mm diameter) and mice were sorted into treatment groups as described below. PEG-Cyst(e)inase was delivered via intraperitoneal injection at 50 mg per kg body weight every 3 days, SSA was delivered by daily intraperitoneal injection at 250 mg per kg body weight, and BSO was delivered in the drinking water at 20 mM with 5 mg ml−1 sucralose. Tumours were measured by caliper and tumour volume calculated by 0.5 × length × weight2. Lungs were fixed by slow infusion with 10% formalin before paraffin embedding and sectioning. Whole-mount lung images were captured using a fluorescent dissecting microscope (Leica M165) and lung foci were quantified by a blinded researcher. All experiments involving mice were carried out with approval from the Committee for Animal Care and under super-vision of the Department of Comparative Medicine at MIT and NYU Langone Medical Center. The maximal tumour volume permitted is 2 cm3 and in none of the experiments were these limits exceeded.Statistical analysis. Experiments were repeated at least three times in the laboratory with the following exceptions, the RNAi screen and deep sequencing based com-petition assays (Fig. 1a–b and Extended Data Fig. 1 c, d), immunohisto chemical staining of NFS1 in human/mouse tissue (Fig. 2b, c and Extended Data Fig. 4), and effects of cyst(e)inase or SSA/BSO on tumour growth (Fig. 4), which were performed once. t-tests were heteroscedastic to allow for unequal variance and distributions assumed to follow a Student’s t distribution, and these assumptions are not contradicted by the data. No samples or animals were excluded from analysis, sample size estimates were not used, and replicate measurements were taken from distinct samples. To study the effects of cyst(e)inase or SSA/BSO on tumour growth, animals were randomly assigned into a treatment group with the constraint that the starting tumour burden in the treatment and control groups were similar. Studies were not conducted blinded except as otherwise noted above (analysis of the number of metastatic foci, immunohistochemical analysis of NFS1 levels in human tissue).Data availability. The data that support the findings of this study are available from the corresponding authors upon reasonable request.
26. Possemato, R. et al. Functional genomics reveal that the serine synthesis pathway is essential in breast cancer. Nature 476, 346–350 (2011).
27. Carpenter, A. E. et al. CellProfiler: image analysis software for identifying and quantifying cell phenotypes. Genome Biol. 7, R100 (2006).
28. Beroukhim, R. et al. The landscape of somatic copy-number alteration across human cancers. Nature 463, 899–905 (2010).
29. Okayama, H. et al. Identification of genes upregulated in ALK-positive and EGFR/KRAS/ALK-negative lung adenocarcinomas. Cancer Res. 72, 100–111 (2012).
30. Barretina, J. et al. The Cancer Cell Line Encyclopedia enables predictive modelling of anticancer drug sensitivity. Nature 483, 603–607 (2012).
31. DuPage, M., Dooley, A. L. & Jacks, T. Conditional mouse lung cancer models using adenoviral or lentiviral delivery of Cre recombinase. Nat. Protocols 4, 1064–1072 (2009).
32. Lee, M. et al. AMP-activated protein kinase activity is critical for hypoxia-inducible factor-1 transcriptional activity and its target gene expression under hypoxic conditions in DU145 cells. J. Biol. Chem. 278, 39653–39661 (2003).
33. Maxwell, P. H. et al. The tumour suppressor protein VHL targets hypoxia-inducible factors for oxygen-dependent proteolysis. Nature 399, 271–275 (1999).
34. Wang, T. et al. Identification and characterization of essential genes in the human genome. Science 350, 1096–1101 (2015).
© 2017 Macmillan Publishers Limited, part of Springer Nature. All rights reserved.

LetterreSeArCH
Extended Data Figure 1 | Analysis of screening results by reaction reactants and products. a, Histogram of shRNA depletion scores. shRNAs (11,370) were scored based on their differential abundance in the in vitro and in vivo screens. shRNAs were further subdivided into those which targeted enzymes that consume O2 (red, 1,035 shRNAs) and to those targeting other genes (black, 10,335 shRNAs). Bin size = 1 log2 fold change unit with the upper end of the range indicated on the x axis. The shRNAs in the shaded region are scored, and the percentage of these shRNAs falling in the indicated categories and the median of the entire distribution are reported. b, Enzymes were classified based on whether they catalysed reactions involving specific metabolites, and the most commonly used 25
metabolites are reported. The number of shRNAs differentially depleted in vivo versus in vitro with a log2 fold change cut-off > 2 are reported (scoring shRNAs), as are the total number of shRNAs targeting enzymes in each category. The percentage of scoring shRNAs for each metabolite is reported, and those significantly exceeding the percentage scoring in ‘all enzymes’ or ‘all genes’ classes are indicated. O2 and water classes were further subdivided (top right) to indicate that shRNAs targeting O2-consuming enzymes were significantly enriched, whereas shRNAs targeting O2 producing reactions or reactions that utilize water but do not consume O2 were not significantly enriched. * P < 0.05, Fisher’s exact test. Raw data are reported in Supplementary Table 2.
© 2017 Macmillan Publishers Limited, part of Springer Nature. All rights reserved.

Letter reSeArCH
Extended Data Figure 2 | Core components of the ISC machinery exhibit differential requirements, dependent on O2 concentration. a, Five-day proliferation assays of the indicated cell lines upon introduction of shRFP (black) or shRNAs targeting NFS1 (shNFS1_1 or shNFS1_2, grey) at the indicated O2 concentrations. Data are from three biological replicates. Significant P values (asterisks) are as follows: MCF10DCIS.com bar 1 versus bar 2, 5 × 10⁻⁶; bar 1 versus bar 3, 9 × 10⁻⁷; bar 2 versus bar 5, 5 × 10⁻⁶; bar 3 versus bar 6, 2 × 10⁻⁶; bar 5 versus bar 8, 2 × 10⁻⁶; bar 6 versus bar 9, 3 × 10⁻⁶; MDA-MB-231 (right) bar 1 versus bar 2, 5 × 10⁻⁸; bar 1 versus bar 3, 3 × 10⁻⁸; bar 2 versus bar 5, 1 × 10⁻⁷; bar 3 versus bar 6, 9 × 10⁻⁵. b, Weight or volume of orthotopic tumour xenografts derived from MCF10DCIS.com cells expressing shRFP, shNFS1_1, or shRNA targeting ABCB7 (shABCB7_2), 4 weeks of growth. Data are from four independent biological replicates. ns, not significant. c, Five-day proliferation assays of MCF10DCIS.com cells expressing shRFP (black) or shNFS1_1 (grey) (top). Data are from three independent biological triplicates. Immunoblots of NFS1 and RPS6 (bottom). Images are representative of three experiments. Significant P values (asterisks) are as follows: 6% O2, 2 × 10⁻²; 10% O2, 4 × 10⁻⁵; 14.5% O2, 3 × 10⁻⁴; 21% O2, 5 × 10⁻⁶. d, Five-day proliferation assays at atmospheric O2, MCF10DCIS.com cells stably transduced with vector control (VC), NFS1 cDNA (NFS1res), or catalytically inactive mutant cDNA (NFS1resCD) (left). Immunoblots of NFS1 and RPS6 upon
introduction of shRFP (R) or shNFS1_1 (N1), right. Data are from three independent biological replicates. e, Five-day proliferation assays as in a upon introduction of shRFP or shRNAs targeting ABCB7 (shABCB7_1, shABCB7_2) (left, centre).* , Significant P values: MCF10DCIS.com bar 1 versus bar 2, 1 × 10⁻⁷; bar 1 versus bar 3, 5 × 10⁻⁷; bar 2 versus bar 5, 4 × 10⁻⁷; bar 3 versus bar 6, 2 × 10⁻⁷; MDA-MB-231 bar 1 versus bar 2, 3 × 10⁻⁶; bar 1 versus bar 3, 3 × 10⁻⁶; bar 2 versus bar 5, 7 × 10⁻⁶; bar 3 versus bar 6, 1 × 10⁻⁶. ABCB7 mRNA levels normalized to ACTB mRNA and relative to shRFP, (right). Data are from three independent biological replicates. f, Five-day proliferation assays of MCF10DCIS.com cells upon introduction of shRFP (black) or shRNAs targeting FXN (shFXN_1 or shFXN_2, grey) or ISCU (shISCU, blue) at the indicated O2 concentrations or upon addition of the antioxidant trolox (100 μ M). Data are from three independent biological triplicates (left). FXN or ISCU mRNA levels normalized to ACTB mRNA and relative to shRFP (right). g, Proliferation assay (left, data from three independent biological triplicates) and mRNA levels (right, data from three independent biological replicates) as in d upon introduction of RFP (shRFP, black), or shRNAs targeting MOCS3 (shMOCS3_1 or shMOCS3_2). MOCS3 is an enzyme essential for molybdenum co-factor biosynthesis, a process in which NFS1 has been proposed to play a critical role independent of ISC biosynthesis10. a–g Data are mean ± s.e.m., P values obtained by heteroscedastic two-sided t-test.
© 2017 Macmillan Publishers Limited, part of Springer Nature. All rights reserved.

LetterreSeArCH
Extended Data Figure 3 | NFS1 is required for breast cancer cell metastasis to the lung. a, Lung sections stained by immunohistochemistry for tdTomato (left) and whole-mount immunofluorescence (right) from samples analysed in Fig. 1h, i. Sections stained for tdTomato (RFP) show low power images of entire coronal lung sections. Whole-mount immunofluorescence shows tdTomato positive tumours (pseudocoloured red) in the right lung lobe. Images are paired, the lung sections from panels on the left match the whole-mount images on the right. Samples express shGFP or shNFS1_1 in each column, as indicated, collected 6 week post-injection, via tail vein, with MDA-MB-231 cells expressing tdTomato and the indicated shRNAs. Scale bars, 1 mm. Entire experiment repeated three times with similar results. b, Representative histology of tumours stained for NFS1, initiated in the lung either by tail vein injection in the same manner as a (left, representative of five independent biological replicates) or as metastases from primary mammary tumours (middle, representative of ten independent biological replicates), or in the mammary fat pad as xenografts (right, representative of ten independent biological replicates). Two images for each group are shown to reflect heterogeneity in NFS1 staining. Tumours were initiated from MDA-MB-231 cells expressing shGFP or shNFS1_1 and tissue was harvested 6–8 weeks after injection or implantation. Primary tumours derived from cells expressing shNFS1_1 display a clear reduction in NFS1 levels, whereas lung metastases derived from these cells can display low, moderate, or strong NFS1 staining. Scale bars, 50 μ m. c, Histology of primary tumours initiated in the mammary fat pad as in b and stained for NFS1, the proliferation marker Ki67, or the endothelial marker CD31. Images are representative of ten independent biological replicates. Differences in Ki67 staining or CD31 density were not observed. Scale bars, 100 μ m. d, Competition assay using six control (shCON) and four NFS1-targeting shRNAs in small pools in MDA-MB-231 cells. Differential abundance of each shRNA is
reported relative to the 3% O2 condition. Black bar is population mean. Tumour formation, data are from ten independent biological replicates; lung metastases, data are from five independent biological replicates; in vitro cultures, data are from three independent biological replicates. e, Competition assay of MDA-MB-231 cells expressing a control vector or NFS1res, and subsequently transduced with either shRFP or shNFS1_1. Data are from five independent biological replicates. f, Histology of primary mammary tumours and paired lung metastases, stained for NFS1, images are representative of eight independent biological replicates. Tumours were initiated by injecting MDA-MB-231 cells orthotopically in the mammary fat pad and harvested 8 weeks after injection. Scale bars, 25 μ m. g, Immunoblot (top) or relative mRNA abundance (bottom) of lysates from MDA-MB-231 cells grown at the indicated O2 concentration and with no treatment (control), dimethyloxalylglycine (DMOG, 1 mM, 24 h) or the proteasome inhibitor MG-132 (10 μ M, 2 h). Significant P values (asterisks) are as follows: bar 2 versus bar 5, 1 × 10⁻⁵; bar 3 versus bar 6, 2 × 10⁻⁴; bar 1 versus bar 4, 3 × 10⁻²; bar 2 versus bar 5, 7 × 10⁻³; bar 3 versus bar 6, 1 × 10⁻³; bar 8 versus bar 11, 4 × 10⁻⁴; bar 9 versus bar 12, 2 × 10⁻³; bar 2 versus bar 14 2 × 10⁻⁴; bar 3 versus bar 15, 1 × 10⁻³. Immunoblots are representative of three replicates and show the level of NFS1, which is dependent on O2 concentration in a manner independent of prolyl hydroxylase or proteasomal inhibition, compared to RPS6. Relative mRNA abundance determined by qPCR and normalized to RPL13A, demonstrates that NFS1 mRNA levels (black bars) are not impacted by changes in O2 level or prolyl hydroxylase inhibition, in contrast to known hypoxia-inducible factor target genes (SLC2A3 and ENO2, grey bars). Data are from three biologically independent experiments. e, g, Data are mean ± s.e.m. d, e, g P values obtained by two-sided heteroscedastic Student’s t-tests.
© 2017 Macmillan Publishers Limited, part of Springer Nature. All rights reserved.
Letter reSeArCH
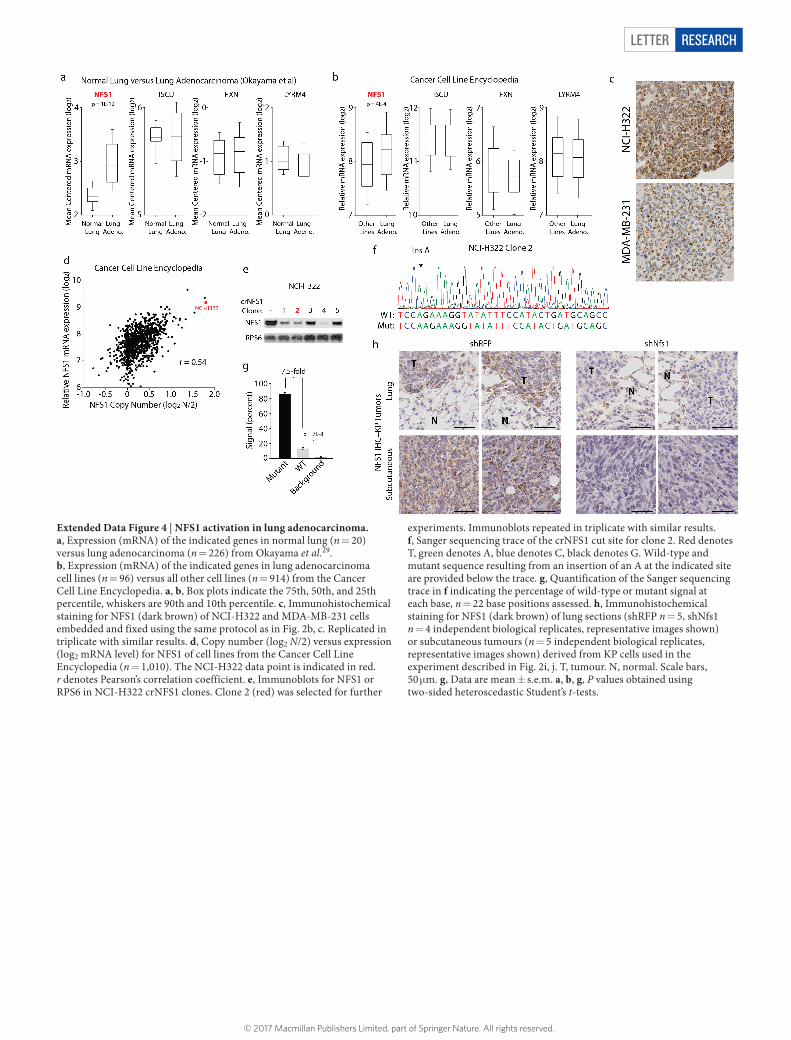
Extended Data Figure 4 | NFS1 activation in lung adenocarcinoma. a, Expression (mRNA) of the indicated genes in normal lung (n = 20) versus lung adenocarcinoma (n = 226) from Okayama et al.29. b, Expression (mRNA) of the indicated genes in lung adenocarcinoma cell lines (n = 96) versus all other cell lines (n = 914) from the Cancer Cell Line Encyclopedia. a, b, Box plots indicate the 75th, 50th, and 25th percentile, whiskers are 90th and 10th percentile. c, Immunohistochemical staining for NFS1 (dark brown) of NCI-H322 and MDA-MB-231 cells embedded and fixed using the same protocol as in Fig. 2b, c. Replicated in triplicate with similar results. d, Copy number (log2 N/2) versus expression (log2 mRNA level) for NFS1 of cell lines from the Cancer Cell Line Encyclopedia (n = 1,010). The NCI-H322 data point is indicated in red. r denotes Pearson’s correlation coefficient. e, Immunoblots for NFS1 or RPS6 in NCI-H322 crNFS1 clones. Clone 2 (red) was selected for further
experiments. Immunoblots repeated in triplicate with similar results. f, Sanger sequencing trace of the crNFS1 cut site for clone 2. Red denotes T, green denotes A, blue denotes C, black denotes G. Wild-type and mutant sequence resulting from an insertion of an A at the indicated site are provided below the trace. g, Quantification of the Sanger sequencing trace in f indicating the percentage of wild-type or mutant signal at each base, n = 22 base positions assessed. h, Immunohistochemical staining for NFS1 (dark brown) of lung sections (shRFP n = 5, shNfs1 n = 4 independent biological replicates, representative images shown) or subcutaneous tumours (n = 5 independent biological replicates, representative images shown) derived from KP cells used in the experiment described in Fig. 2i, j. T, tumour. N, normal. Scale bars, 50 μ m. g, Data are mean ± s.e.m. a, b, g, P values obtained using two-sided heteroscedastic Student’s t-tests.
© 2017 Macmillan Publishers Limited, part of Springer Nature. All rights reserved.
LetterreSeArCH
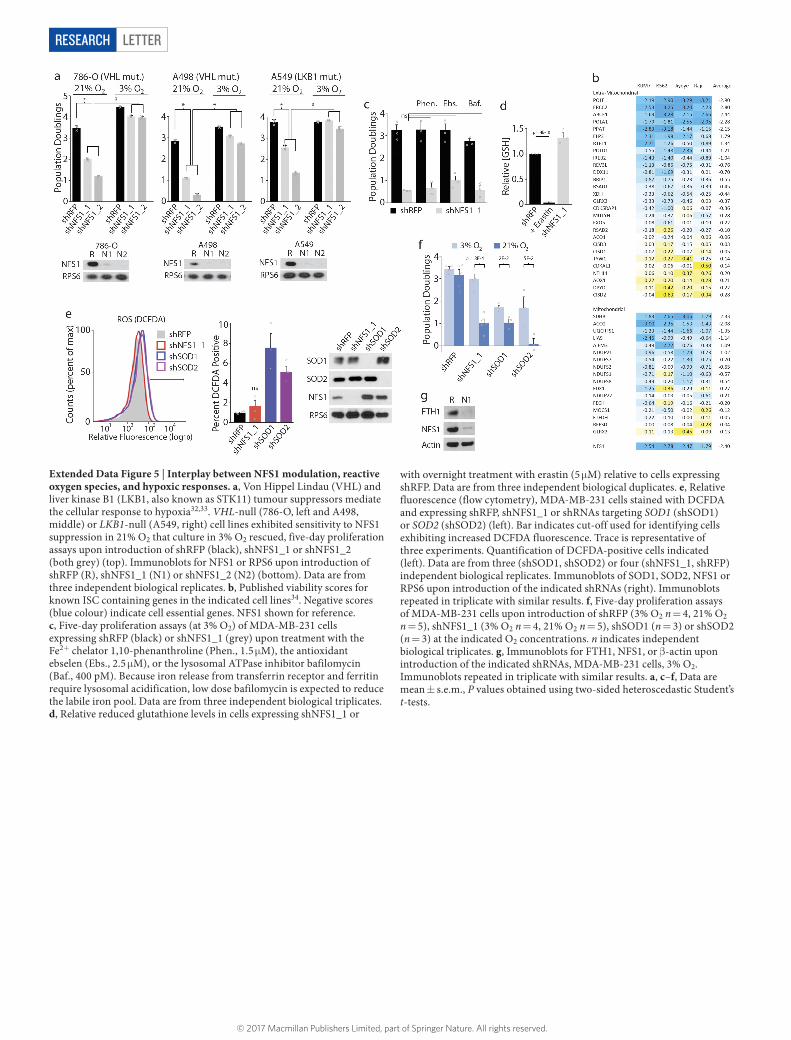
Extended Data Figure 5 | Interplay between NFS1 modulation, reactive oxygen species, and hypoxic responses. a, Von Hippel Lindau (VHL) and liver kinase B1 (LKB1, also known as STK11) tumour suppressors mediate the cellular response to hypoxia32,33. VHL-null (786-O, left and A498, middle) or LKB1-null (A549, right) cell lines exhibited sensitivity to NFS1 suppression in 21% O2 that culture in 3% O2 rescued, five-day proliferation assays upon introduction of shRFP (black), shNFS1_1 or shNFS1_2 (both grey) (top). Immunoblots for NFS1 or RPS6 upon introduction of shRFP (R), shNFS1_1 (N1) or shNFS1_2 (N2) (bottom). Data are from three independent biological replicates. b, Published viability scores for known ISC containing genes in the indicated cell lines34. Negative scores (blue colour) indicate cell essential genes. NFS1 shown for reference. c, Five-day proliferation assays (at 3% O2) of MDA-MB-231 cells expressing shRFP (black) or shNFS1_1 (grey) upon treatment with the Fe2+ chelator 1,10-phenanthroline (Phen., 1.5 μ M), the antioxidant ebselen (Ebs., 2.5 μ M), or the lysosomal ATPase inhibitor bafilomycin (Baf., 400 pM). Because iron release from transferrin receptor and ferritin require lysosomal acidification, low dose bafilomycin is expected to reduce the labile iron pool. Data are from three independent biological triplicates. d, Relative reduced glutathione levels in cells expressing shNFS1_1 or
with overnight treatment with erastin (5 μ M) relative to cells expressing shRFP. Data are from three independent biological duplicates. e, Relative fluorescence (flow cytometry), MDA-MB-231 cells stained with DCFDA and expressing shRFP, shNFS1_1 or shRNAs targeting SOD1 (shSOD1) or SOD2 (shSOD2) (left). Bar indicates cut-off used for identifying cells exhibiting increased DCFDA fluorescence. Trace is representative of three experiments. Quantification of DCFDA-positive cells indicated (left). Data are from three (shSOD1, shSOD2) or four (shNFS1_1, shRFP) independent biological replicates. Immunoblots of SOD1, SOD2, NFS1 or RPS6 upon introduction of the indicated shRNAs (right). Immunoblots repeated in triplicate with similar results. f, Five-day proliferation assays of MDA-MB-231 cells upon introduction of shRFP (3% O2 n = 4, 21% O2 n = 5), shNFS1_1 (3% O2 n = 4, 21% O2 n = 5), shSOD1 (n = 3) or shSOD2 (n = 3) at the indicated O2 concentrations. n indicates independent biological triplicates. g, Immunoblots for FTH1, NFS1, or β -actin upon introduction of the indicated shRNAs, MDA-MB-231 cells, 3% O2. Immunoblots repeated in triplicate with similar results. a, c–f, Data are mean ± s.e.m., P values obtained using two-sided heteroscedastic Student’s t-tests.
© 2017 Macmillan Publishers Limited, part of Springer Nature. All rights reserved.

Letter reSeArCH
Extended Data Figure 6 | Additional model systems demonstrating that NFS1 suppression sensitizes cells to ferroptosis versus other forms of cell death. a, Relative viability, MDA-MB-231 cells, expressing shRFP or shNFS1_1 upon treatment with doxorubicin (left), etoposide (middle) or erastin (right), 3% O2. Data are from three independent biological triplicates. b, Viability, relative to untreated, of MDA-MB-231 cells stably transduced with control vector or NFS1res, expressing the indicated shRNAs, treated with BSO (5 μ M), tbHP (10 μ M), or erastin (2.5 μ M). Data are from four independent biological triplicates. c, Immunoblots, MDA-MB-231 cells expressing shRFP (R) or shNFS1_1 (N), erastin 5 μ M, 24 h treatment. Immunoblots repeated in triplicate with similar results. d, Viability after 2 days, relative to untreated cells, of MDA-MB-231 cells expressing the indicated shRNAs. Cells were cultured at 3% O2 and treated with BSO (10 μ M) combined with mitochondrially targeted antioxidant mitoTEMPO (MitoT., 2 μ M), Phen. (5 μ M), Ebs. (7.5 μ M) or Baf. (800 pM) (top) or BSO (5 μ M) combined with Fer-1 (Ferop., 1 μ M), apoptosis inhibitor Z-VAD-FMK (Apop., 184 μ M), necrosis inhibitor necrostatin (Nec., 9.7 μ M), or autophagy inhibitor 3-methyladenine (Autoph., 6.25 mM) (bottom). Significant P values (asterisks): (top) bar 1 versus bar 2, 4 × 10⁻⁶; bar 2 versus bar 4, 3 × 10⁻⁶; bar 2 versus bar 6, 6 × 10⁻⁵; bar 2 versus bar 8, 9 × 10⁻⁴; bar 2 versus bar 10, 7 × 10⁻⁶; (bottom) bar 2 versus bar 4, 4 × 10⁻³. Data are from three independent biological triplicates. e, f, Relative fluorescence (flow cytometry), MDA-MB-231 cells stained with DCFDA (e, left) or BODIPY (f, left) expressing shRFP or shNFS1_1 and treated with tbHP (50 μ M), Fer-1 (1 μ M) or both for four hours. Bar indicates cut-off used for identifying DCFDA or BODIPY positive cells, reported in red text. Traces are representative of triplicate
experiments. Quantification of mean fluorescence, relative to untreated, (e, right and f, right). Data are from three independent biological replicates. g, h, As in e, f but treatment with erastin (5 μ M), Fer-1 (1 μ M) or both for 20 h. Traces are representative, data are from experiments performed in quadruplicate (g) or triplicate (h). i, Relative viability at 3% O2 of cell lines expressing indicated shRNAs and treated with BSO (20 μ M), erastin (5 μ M, MDA-MB-231 or A549; 10 μ M NCI-H838 or NCI-H460), and/or Fer-1 (1 μ M). NCI-838 and NCI-H460, data are from three independent biological replicates; MDA-MB-231, data are from three independent biological triplicates; A549, n = 5, 5, 4, 4, 5, 5, 4, 4, 3, 3, 4 and 4 for each bar from left to right, independent biological triplicates. Representative images, MDA-MB-231 cells (right). j, Relative viability of MDA-MB-231 cells expressing the indicated shRNAs relative to 50 μ M added cystine (typical human plasma levels). Cells were cultured at 3% O2 in complete medium before switching to medium containing the indicated level of cystine added to base medium (RPMI lacking cystine with 10% serum, non-dialysed). x axis is log2 scale, data are from three independent biological replicates. Significant P values (asterisks) are as follows: (left to right) 3 × 10⁻², 9 × 10⁻⁵, 2 × 10⁻². k, Relative viability of MDA-MB-231 cells expressing the indicated shRNAs upon treatment with GPX4 inhibitors RSL3 (top, 20 h) or ML162 (bottom, 48 h), 3% O2. Data are from three independent biological triplicates. Significant P values (asterisks) are as follows: (left to right, top) 4 × 10⁻², 8 × 10⁻³, 2 × 10⁻³, 3 × 10⁻², (left to right, bottom) 1 × 10⁻², 6 × 10⁻⁴, 3 × 10⁻³. a, b, d–k, Data are mean ± s.e.m. a, b, d, i–k, P values obtained using two-sided heteroscedastic Student’s t-tests.
© 2017 Macmillan Publishers Limited, part of Springer Nature. All rights reserved.

LetterreSeArCH
Extended Data Figure 7 | Effects of NFS1 suppression on tumours in animals given treatments altering cystine metabolism. a, Representative histology of six independent tumours in each group from samples reported in Fig. 4f and stained for NFS1 (brown). Control, left two columns; cyst(e)inase, right two columns. Three representative tumours (in columns) are shown to reflect heterogeneity in staining. Tumours expressing shGFP and shNFS1_1 harvested from the same animal and stained on the same slide. Tumours derived from cells expressing shNFS1_1 display a reduction in NFS1 levels in the control treatment group, whereas tumours derived from cells expressing shNFS1_1 in mice treated with cyst(e)inase display NFS1 staining similar to shGFP tumours, consistent with cyst(e)inase treatment selecting for NFS1-expressing cells. Scale bars, 100 μ m. b, Representative histology of a single MDA-MB-231-derived tumour pair (shGFP versus shNFS1_1) from an animal treated with cyst(e)inase as in a. The shNFS1_1-expressing tumour from this pair exhibited the strongest regression upon cyst(e)inase treatment and the least overall tumour
growth. Staining for NFS1 (left column) or Ki67 (right column) revealed a clearly delineated region of elevated NFS1 and Ki67 staining (middle), similar to the control tumour expressing shGFP (top), when compared to a separate region of low NFS1 and Ki67 staining (bottom). Scale bars, 100 μ m. c, Growth of six independent biological replicate xenograft tumours in each group, derived from MDA-MB-231 cells expressing shGFP or shNFS1_1. Upon formation of palpable tumours (day 0), mice were treated by daily injection of SSA (250 mg kg−1) and BSO via drinking water (20 mM). Change in tumour volume relative to day 0 reported. Data from untreated tumours identical to Fig. 4f. Significant P values (asterisks) are as follows: shGFP control treatment versus the shGFP SSA/BSO treatment, 5 × 10⁻³ (day 4), 5 × 10⁻³ (day 7), 3 × 10⁻² (day 9), 5 × 10⁻² (day 11), 2 × 10⁻² (day 14); shGFP SSA/BSO treatment versus shNFS1 SSA/BSO treatment, 5 × 10⁻² (day 4), 7 × 10⁻² (day 7), 2 × 10⁻² (day 9), 6 × 10⁻² (day 11). Data are mean ± s.e.m., P values obtained using two-sided heteroscedastic Student’s t-tests.
© 2017 Macmillan Publishers Limited, part of Springer Nature. All rights reserved.

1
nature research | life sciences reporting summ
aryJune 2017
Corresponding author(s): Possemato R, Birsoy K, Sabatini DM
Initial submission Revised version Final submission
Life Sciences Reporting SummaryNature Research wishes to improve the reproducibility of the work that we publish. This form is intended for publication with all accepted life science papers and provides structure for consistency and transparency in reporting. Every life science submission will use this form; some list items might not apply to an individual manuscript, but all fields must be completed for clarity.
For further information on the points included in this form, see Reporting Life Sciences Research. For further information on Nature Research policies, including our data availability policy, see Authors & Referees and the Editorial Policy Checklist.
Experimental design1. Sample size
Describe how sample size was determined. No statistical methods were used to predetermine samples sizes.
2. Data exclusions
Describe any data exclusions. None
3. Replication
Describe whether the experimental findings were reliably reproduced.
Experiments were repeated at least three times in the laboratory with the following exceptions, the RNAi screen and deep sequencing based competition assays (Fig. 1a-b, Extended Data Figure 1 c,d), immunohistochemical staining of NFS1 in human/mouse tissue (Fig 2b,c, Extended Data Fig. 4), and effects of cyst(e)inase or SSA/BSO on tumour growth (Fig. 4), which were performed once.
4. Randomization
Describe how samples/organisms/participants were allocated into experimental groups.
To study the effects of cyst(e)inase or SSA/BSO on tumour growth, animals were randomly assigned into a treatment group with the constraint that the starting tumour burden in the treatment and control groups were similar.
5. Blinding
Describe whether the investigators were blinded to group allocation during data collection and/or analysis.
Studies were not conducted blind except analysis of the number of metastatic foci and immunohistochemical analysis of NFS1 levels in human tissue.
Note: all studies involving animals and/or human research participants must disclose whether blinding and randomization were used.
6. Statistical parameters For all figures and tables that use statistical methods, confirm that the following items are present in relevant figure legends (or in the Methods section if additional space is needed).
n/a Confirmed
The exact sample size (n) for each experimental group/condition, given as a discrete number and unit of measurement (animals, litters, cultures, etc.)
A description of how samples were collected, noting whether measurements were taken from distinct samples or whether the same sample was measured repeatedly
A statement indicating how many times each experiment was replicated
The statistical test(s) used and whether they are one- or two-sided (note: only common tests should be described solely by name; more complex techniques should be described in the Methods section)
A description of any assumptions or corrections, such as an adjustment for multiple comparisons
The test results (e.g. P values) given as exact values whenever possible and with confidence intervals noted
A clear description of statistics including central tendency (e.g. median, mean) and variation (e.g. standard deviation, interquartile range)
Clearly defined error bars
See the web collection on statistics for biologists for further resources and guidance.

2
nature research | life sciences reporting summ
aryJune 2017
SoftwarePolicy information about availability of computer code
7. Software
Describe the software used to analyze the data in this study.
Microsoft Excel, Prism, R, FlowJo
For manuscripts utilizing custom algorithms or software that are central to the paper but not yet described in the published literature, software must be made available to editors and reviewers upon request. We strongly encourage code deposition in a community repository (e.g. GitHub). Nature Methods guidance for providing algorithms and software for publication provides further information on this topic.
Materials and reagentsPolicy information about availability of materials
8. Materials availability
Indicate whether there are restrictions on availability of unique materials or if these materials are only available for distribution by a for-profit company.
No restrictions
9. Antibodies
Describe the antibodies used and how they were validated for use in the system under study (i.e. assay and species).
Antibodies to NFS1 (sc-365308) from Santa Cruz, CD31 (77699), RPS6 (2217), TFRC (13208), FTH1 (3998), SOD1 (2770), and SOD2 (13141) from Cell Signaling Technologies, Ki67 (M3062) from Spring Biosciences; and RFP (600-401-379) from Rockland. Antibodies were validated by suppression of the intended target gene by RNAi and verification of the loss of a band of the predicted molecular weight by immunoblotting.
10. Eukaryotic cell linesa. State the source of each eukaryotic cell line used. MCF10DCIS.com cells from the Karmanos Cancer Center, Michigan; MDA-MB-231,
SW900, NCI-H196, A549, NCI-H2170, NCI-H647, 786-O, A498 NCI-H838, NCI-H460 and SK-MES-1 from ATCC; NCI-H322 from Sigma
b. Describe the method of cell line authentication used. STR based profiling
c. Report whether the cell lines were tested for mycoplasma contamination.
Cell lines were tested for mycoplasma contamination
d. If any of the cell lines used are listed in the database of commonly misidentified cell lines maintained by ICLAC, provide a scientific rationale for their use.
None used
Animals and human research participantsPolicy information about studies involving animals; when reporting animal research, follow the ARRIVE guidelines
11. Description of research animalsProvide details on animals and/or animal-derived materials used in the study.
4-8 week old NOD/Scid female mice used in this study were purchased from Jackson Labs
Policy information about studies involving human research participants
12. Description of human research participantsDescribe the covariate-relevant population characteristics of the human research participants.
Not applicable

nature research | flow cytom
etry reporting summ
aryJune 2017
1
Corresponding author(s): Possemato R, Birsoy K, Sabatini DM
Initial submission Revised version Final submission
Flow Cytometry Reporting Summary Form fields will expand as needed. Please do not leave fields blank.
Data presentationFor all flow cytometry data, confirm that:
1. The axis labels state the marker and fluorochrome used (e.g. CD4-FITC).
2. The axis scales are clearly visible. Include numbers along axes only for bottom left plot of group (a 'group' is an analysis of identical markers).
3. All plots are contour plots with outliers or pseudocolor plots.
4. A numerical value for number of cells or percentage (with statistics) is provided.
Methodological details5. Describe the sample preparation. Cells were plated in 6 well plates the day prior to incubation with indicated
treatments. For all flow experiments involving DCIS cells, 150,000 cells/well were plated. For 231 cells, 200,000 cells/well were plated for experiments involving BSO and 100,000 for all other experiments. With the exception of experiments involving tbHP, cells were incubated under indicated conditions, washed twice with 1X PBS and stained with 10 μM of CM-H2DCFDA or 10 μM BODIPY 581/591 C11 diluted in PBS for 20 minutes in an incubator at 37° and 21% O2. Following staining, cells were washed with PBS, trypsinized, and collected in 500 μL of PBS. For tbHP experiments, cells were washed twice, stained with the indicated probes, treated with tbHP in serum-containing media for 4 hrs, washed again, trypsinized, and collected. For experiments performed at 3% oxygen, cells were equilibrated for 1 week prior to assessing ROS level.
6. Identify the instrument used for data collection. Life Technologies Attune NxT Acoustic Focusing Cytometer
7. Describe the software used to collect and analyze the flow cytometry data.
Data was collected using Attune NxT Software v2.5. Analysis of all data was performed on FlowJo V10 software.
8. Describe the abundance of the relevant cell populations within post-sort fractions.
Cells were not sorted.
9. Describe the gating strategy used. Live cells were selected from the starting cell population on a FSC/SSC plot. Live cells were selected from the starting cell population on a FSC/SSC plot. Then, single cells were selected using a FSC-A/FSC-H plot from the population of live cells. Data displayed represents populations of live, singlet cells. To collect ROS measurement data for both CM-H2DCFDA and BODIPY 581/591 C11, an excitation wavelength of 488nm was used with an emission filter of 530/30nm. Percent of cells above the fluorescence of the maximum 1% of the control is indicated.
Tick this box to confirm that a figure exemplifying the gating strategy is provided in the Supplementary Information.