Embed Size (px)
Citation preview

1
Nexus between Product Innovation and Enterprise Survival: Impact of
Competitive Intensity and Competitive Advantage
Lin Lu Zhou1, James Onuche Ayegba1,4*, Peace Maina James2 Emmanuel Onu
Ayegba3, Zhang Xin jie1, Arielle Doris Tetgoum Kachie1
1. School of Management Science and Engineering, Department of Marketing,
Jiangsu University, Jiangsu, 212013, China; [email protected];
[email protected]; [email protected]; [email protected]
2. Department of Accounting, Nasarawa State University, Keffi, 960169,
Nigeria; [email protected]
3. Department of Business Strategy and Planning, Nigerian National Petroleum
Corporation, 900271, Nigeria; [email protected]
4. Department of Business Administration, Faculty of Administration, Ahmadu
Bello University, (Kongo Campus), 810222 Zaria, Nigeria
*Correspondence: [email protected]
Abstract
Product innovation is a crucial factor in enterprise survival. Even though there are sources
from strategic theory that guides the clear comprehension towards appreciating the nexus
between these two variables (product innovation and enterprise survival), there are still
many lacunas that should be addressed and filled. Consequently, the need for additional
empirical corroboration or support is pertinent. This study aimed at verifying the nexus
between product innovation and enterprise survival, and how they are affected by the
existence of antecedent variables such as competitive intensity and competitive advantage.
In the methodology, this study adopts the conduct of explanatory and cross-sectional
investigations through the use of structural equation modelling (SEM) to a sample of
selected food and beverages enterprises in Lagos, Nigeria. Regarding the food and
beverage enterprises in Lagos, Nigeria, this study discovered that competitive intensity has
huge positive implication on product innovation at (0.39; t = 5.69, p < 0.05). This gives
numerical evidence that, in the face of more market competition, enterprises will be
pressured to adopt the model of costs reduction on products which will enhance the
reduction of product prices, and will have significant impact on profit. However, the
findings reveal that there is no significance between competitive advantage and product
Preprints (www.preprints.org) | NOT PEER-REVIEWED | Posted: 31 May 2020 doi:10.20944/preprints202005.0497.v1
© 2020 by the author(s). Distributed under a Creative Commons CC BY license.

2
innovation at (0.002; t = 0.203, p > 0.05), and there is no significance between product
innovation and enterprise survival at (-0.035; t = -1.583, p > .05). As a result, the food and
beverage enterprises should concentrate more on product innovation so that they will be
able to stand the intensity of competition. The results emanated from the study is germane
as it make significant contribution to literature and the body of knowledge and on strategic
management by enlightening that competitive intensity is a necessary inducement for
product innovation.
Keywords: Product innovation; enterprise survival; competitive intensity;
competitive advantage
1.0 INTRODUCTION
Studies of Rosenbusch, Brinckmann, and Bausch [1]; Marín-Idárraga, Hurtado, and
Cabello [2] have shown that product innovation is a value-addition activity for enterprises,
and Keupp, Palmié, and Gassmann [3] noted that it has been an approach for realizing
competitive advantage. Though some in some studies, it was theoretically revealed that
product innovation is a factor that determine enterprise survival [4],[5],[6]. Rosenbusch et
al. [1] noted that empirical results of many studies are contradictory, especially those that
treated small and medium-sized enterprises (SMEs).Some empirical researches reveal a
positive and significant nexus between product innovation and enterprise survival [6],[7],
while other researches reveals negative nexus [8],[9]. From the result obtained in various
studies, there were suggestions that other factors may be affecting the nexus between
product innovation and enterprise survival. In view of this, there is thus a need to embark
on the study based on selected food and beverages enterprises in Lagos,
Nigeria.Furthermore, many studies have been carried out and have analyzed the antecedent
variables that affect the nexus between product innovation and enterprise survival. Among
are the studies of Vermeulen, De Jong, and O'shaughnessy [10]; Chang, Hughes, and Hotho
[11]; Alegre and Chiva [7], but there are some gaps to be filled because of country specific
studies which open a prospect to observe the different variables that have suspect of
influencing this nexus. To embark on this, this study determines whether competitive
intensity and competitive advantage has influence on product innovation, which will result
to improving enterprise survival. This study is therefore rooted on the following questions:
Preprints (www.preprints.org) | NOT PEER-REVIEWED | Posted: 31 May 2020 doi:10.20944/preprints202005.0497.v1

3
What is the nexus between product innovation and enterprise survival as affected by
the antecedent variables of competitive intensity and competitive advantage?
The two variables were selected based on their significance, relevance and effects on the
survival of the enterprise. As a matter of fact, this nature or dynamic of study may not have
been studied in Nigeria and for the large scale enterprises. Competitive intensity is best
identified or known as the nature of contention that an enterprise encounters. It is one of
the major threats to an enterprise most especially the younger or newer enterprises and a
crucial market determinant affecting enterprise survival, it have greater influence on
whether an enterprise will go into the unforeseeable future or not, it also have greater
influence on how the enterprise will sustain the present economic hardship experienced in
the country [12],[13]. If not properly examined, most enterprise will become comatose
during the hard or unfavourable government policy
Enterprise survival is the act of sustaining an enterprise under a harsh, severe, or an unusual
situation. It is usually inevitable when an enterprise failed to fulfil the mandate, especially
during hard-hitting circumstances such as global and national economic recession.
According to Adeniran and Ben [14], the period of recession is usually evidenced by a drop
in the following
economic indices: Real Gross Domestic Product (GDP); Income level of individual and
revenue generation of government; Employment; Manufacturing; and Retail sales. It is
usually better for a company to maintain good standing of survival [15]. The theoretical
underpinning was empirically validated using a sample of selected food and beverages
enterprises in Lagos, Nigeria. This sample of enterprise is particularly significant because
food and beverage industry has huge impact on the viability of the economy.
An explanatory research was achieved through cross-sectional investigation and analyzed
with structural equation model (SEM). The result reveals that, in the situation of tensed
competitive intensity, enterprises looks for survival measures such as product innovation
strategies, which
enhances enterprise survival. Because the study analyzes competitive intensity and
Preprints (www.preprints.org) | NOT PEER-REVIEWED | Posted: 31 May 2020 doi:10.20944/preprints202005.0497.v1

4
competitive advantage as antecedent variables of product innovation resulting to enterprise
survival which may not been studied earlier, therefore, this study is innovative in nature.
2.0 LITERATURE REVIEW
The nomenclature of innovation is rooted around technology and administration.
Technological innovation can be likened to process or product innovation, it is mainly
associated with organization’s tangible activity. While administrative innovation can be
likened to management practices and organizational structure, It has forms the intangible
aspect and most limited to the managerial practices [4]. The management of product
innovation is a functional aspect in the survival of any enterprise [16]. A very good
approach to manage product innovation is to determine whatever will hinder the survival
of the enterprise holistically through critical examination of enterprise operations using
Research and Development strategy [17].
Product innovation according to Drucker [18]; Wolfe [19]; Damanpour [20]; Damanpour
and Gopalakrishnan [21]; Damanpour and Wischnevsky [22]; Gopalakrishnan, Kessler,
and Scillitoe [23] is an activity that is considered as the core strategic inducement and a
crucial element of sustainability. It is also a spring of competitive advantage. Van de Ven
[24] out that product innovation is concerned with the formulation and implementation of
new product ideas over time. They observed that product innovation result to exploring
new opportunities and gaining more strength.
The top and middle managers of enterprises particularly the large scale enterprises make
certain decisions about the structure and design of the enterprise such that it will be able to
thrive in the complex and unpredictable business environment. They get to support the
organizational structure, organizational culture, and business strategy thereby contributing
significantly to value creation and competitive advantage in the face of environmental
forces that seems to threaten the survival of the enterprise [25],[6],[26].
Keupp et al. [3] observed that in the light of environmental factors, enterprises must come
up with endogenous factors that facilitate coping in the face of intense market competition,
where product innovation is seen as a major resource to realizing competitive advantages.
Study of Wang [27] reveals that product innovation is a basis for dynamic capabilities that
can enhance enterprise survival over time. The importance of product innovation as a main
Preprints (www.preprints.org) | NOT PEER-REVIEWED | Posted: 31 May 2020 doi:10.20944/preprints202005.0497.v1

5
factor is emphasized in this study, most especially during competition. Figure 1 show the
conceptual model adopted in the research.
Figure 1: Conceptual model of the study
Source: Author (2020)
MATERIALS AND METHODOLOGY
This research is an explanatory and cross-sectional study, and it is achieved with SEM to
validate the model specified. The SEM is preferred because it explains the nexus between
numerous independent variables and singular dependent variable that, sequentially,
becomes independent for another dependent variable [28] as presented in Figure 1. This
similar design was been adopted in the studies of Ziolkowska [29]. Frankfort-Nachmias
and Nachmias [30] noted that the survey design enhances better possibilities of unfolding
existing phenomenon, situations and dynamics by which primary data are collected. It will
enable the researcher to seek out the opinions of individual so as to reveal answers to or
justify pertinent and specific questions that are comprehensive in the questionnaire
instrument concerning the topic under consideration.
In the year 2014, the Nigerian Stock Exchange (NSE) [31] listed fourteen companies which
comprises of multinational and indigenous companies. The population adopted in this
study will comprise the categories of staff in the top and middle management cadre of the
six (6) selected quoted food and beverages companies located in Lagos State. Six quoted
food and beverages companies will be purposively selected (non probability sampling) for
the study as they are noted to be major players and stakeholders in the Food and Beverages
industry in Nigeria [32],[33]. From previous studies, it was revealed that the other eight
companies were difficult to educing information from them.
According to Zikmund [34], the various error allowances will be determined and the
suitable one will be chosen based on the discretion of the researcher. The chosen error
Competitive intensity
Competitive advantage
Product innovation Enterprise survival
Preprints (www.preprints.org) | NOT PEER-REVIEWED | Posted: 31 May 2020 doi:10.20944/preprints202005.0497.v1

6
allowance of 0.04 will be employed to establish the sample size as shown in the equation
below:
The formulae for achieving sample size n =Z2
4E2
where;
n = Sample size;
Z = Z score for the confidence interval (2.05);
E = Error allowance (0.04)
When inserted into the formula, Sample Size will be 656.6406, and approximately 657. It
is therefore crucial that the questionnaire distribution will target six hundred and fifty seven
respondents whom are middle and top managers in the six food and beverage
manufacturing companies.
Structural Equation Modelling (SEM) of Partial Least Square (PLS) was adopted to
determine the relationship that exists between competitive advantage, product innovation,
and performance of food and beverage enterprises.
Structural equation modelling (SEM) is a multivariate statistical framework that is used to
model complex relationships between directly and indirectly observed (latent) variables. It
is a general framework which simultaneously solves the systems of linear equations and
encompasses other techniques through the incorporation and integration of regression,
factor analysis, path analysis, and latent growth curve modelling [35],[36]. SEM is used to
estimate a system of linear equations to test the fit of a hypothesized “causal” model.
The first step in SEM deals with the visualization of “path diagram” or hypothesized model
which is usually based on prior knowledge of established theories. In path diagrams,
rectangles typically represent observed or directly measured variables, and circles or ovals
typically represent unobserved or latent constructs which are defined by measured
variables. Unidirectional arrows represent causal paths, where one variable influences
another directly, and double-headed arrows represent correlations between variables. As
shown in the studies of McDonald and Ho [37]; Pearl [38], the term “arc” was preferred
than “causal path”.
Figure 2 illustrates an example SEM model. The system of equations can be written as a
number of separate equations or with a general matrix notation.
Preprints (www.preprints.org) | NOT PEER-REVIEWED | Posted: 31 May 2020 doi:10.20944/preprints202005.0497.v1

7
Figure 2: Example of SEM model
Source: Catherine, Nathan, and Nora [36]
SEMs comprises of two sub-models, they are:
1) The measurement model estimates relationships between the observed variables,
also referred to as indicator variables, and latent variables; this is the same
framework used in factor analysis. In regression and other statistical theories,
“indicator variable” implies a binary yes/no sort of variable. Here, as is customary
for SEM, “indicator variable” refers to a variable that is directly associated with a
latent variable such that differences in the values of the latent variable mirror
differences in the value of the indicator [39].
2) The structural model develops the relationships between the latent variables. For
clarity of presentation, the system of equations will be described. The measurement
model consists of the following equations, using standard notation used by Bollen
[35]:
x1 = λ1ζ1 + δ1 y1 = λ3ƞ1 + Ɛ1
x2 = λ2ζ2 + δ2 y2 = λ4ƞ1 + Ɛ2
x3 = λ3ζ3 + δ3 y3 = λ5ƞ1 + Ɛ3
Where the x’s and y’s are observed indicators for latent variables, ζ’s and ƞ’s are latent
variables, the λ’s are the factor loadings, and Ɛ’s and δ’s are the errors or disturbance terms.
In general matrix notation, the measurement model is written as
x = Ʌx ζ + δ
Preprints (www.preprints.org) | NOT PEER-REVIEWED | Posted: 31 May 2020 doi:10.20944/preprints202005.0497.v1

8
y = Ʌy ƞ + Ɛ
From the path diagram, the arrows point to the x’s and y’s, so they are modelled as
dependent variables. Also, the factor loadings for x1 and y1 can be set to 1, which can be
done for two reasons:
i. The model is identifiable; and
ii. The latent variable is on the same statistical scale as the observed variables.
Model identification for SEM can also be achieved in other ways, such as setting the
variance for the latent variable to 1. Generally, the indicator with factor loading set to 1 is
chosen based on
what the analyst deems is the best descriptor of the latent construct, but can be arbitrary.
Finally in respect to model specification for SEM, exogenous variables have been
differentiated from endogenous variables. Exogenous variables have no directed arcs
ending on them, while endogenous variables have at least 1 arc ending on them. The
structural model consists of the following equations:
ƞ1 = γ11ξ1 + ζ1
ƞ2 = β21ξ2 + ζ2
where the γ and β terms are factor loadings for the latent variables and ζ’s are error terms.
Here, the causal relationships between unobserved variables can be evaluated. In general,
the structural model may be rewritten in matrix form as the following:
ƞ = α + B ƞ + гξ + ζ
where ƞ is m * 1 vector of latent endogenous variables, ξ is an n * 1 vector of latent
exogenous variables, α is an n * 1 vector of intercept terms, B is an m * m matrix of
coefficients that give the influence of ƞ on each other, г is an m * n matrix of the
coefficients of the effect of ξ on ƞ, and ζ is m * 1 vector of disturbances that contain the
explained parts of the ƞ’s. Though it may appear counter intuitive to regress on ƞ on itself,
each variable in ƞi is influenced by other variables in ƞi, so this represents relationships
between latent variables and not necessarily feedback loops. It was assumed that Ɛ, δ, and
ζ are mutually uncorrelated.
Conventional regression approaches are robust to measurement errors in the outcome but
not in the predictors. Also, univariate regression approaches cannot model the correlation
between error terms for two different outcomes. SEM allows model measurement error for
Preprints (www.preprints.org) | NOT PEER-REVIEWED | Posted: 31 May 2020 doi:10.20944/preprints202005.0497.v1

9
both the predictor and the outcome, and it allows a high degree of flexibility in modelling
the correlation between the various error terms. In this study, the indicators were the
constructs of dynamic capacities and enterprise performance, the analyst could model the
correlation between one construct separately from another construct. Also, the SEM allows
for the decomposition of effects if the direct and indirect effect of variables on the outcome
is of interest.
For instance, the direct effect of ƞ1 on ƞ2 is estimated by β21, and the indirect effect of ζ1
on ƞ2 is estimated by γ11. Alternatively, one could model the direct effect of ζ1 on ƞ2 with
the model depicted in Figure 3, with corresponding coefficient γ12.
Figure 3: Illustration of SEM diagram, showing the addition of a direct effect in the model
Source: Catherine, Nathan, and Nora [36]
These models are estimated using the variance-covariance matrix of the data. Usually,
maximum likelihood estimation fitting functions are used to fit the system of equations to
the data, but this
method requires that the data be normally distributed and the observations be independent.
Variations that relax the assumption of multivariate normality have been developed,
including the robust weighted least squares estimator (WLSMV), which allows for binary
and categorical dependent variables [40]. To assess the overall model fit, there are a number
of fit statistics, including the root mean squared error (RMSEA) and comparative fit index
(CFI) [35], and for categorical data, the weighted root mean square residual (WRMR) is
appropriate [41]. Hu and Bentler [42] categorize these fit statistics as “comparative” or
“absolute.” One could also compare nested models, as is done with traditional regression
Preprints (www.preprints.org) | NOT PEER-REVIEWED | Posted: 31 May 2020 doi:10.20944/preprints202005.0497.v1

10
models and segregation analysis models, using a likelihood ratio test (LRT) and non-nested
models using Akaike’s AIC; by contrast, the aforementioned fit statistics (RMSEA, CFI,
WRMR, etc.) do not require the models being compared to be nested.
Fursova [43] stated that researchers typically integrate the smart-PLS-SEM technique for
developing theory in investigative research. The main applications of smart-PLS-SEM are
path analysis, confirmatory factor analysis, regression models, covariance structure models,
second-order factor analysis and correlation models as revealed by Hall, Müller, and
Saarinen [44]. The approach of structural equation modelling (SEM) enhances the analysis
of linear relationship between the manifest variables and latent constructs.
The Partial Least Squares (PLS-SEM) method is a multivariate statistical technique for
evaluating a measurement model concurrently such as, the relationship between the four
constructs in this study and its indicators with a structural model to point out the
relationship between the constructs; this is evidenced in the study of Hair and Hult [28]. In
addition to the relationship, it could also manifest obtainable parameter estimates to
determine the relationship between unobserved variables.
Typically, the SEM technique gives way for numerous associations to test and compute at
once in the single proposed models with several associations instead of examining each
connection individually. This present study will adopt the partial least squares (PLS-SEM)
technique to scrutinize and analyze the collected data, as it will enhance the evaluation of
the conceptual model empirically. According to Vinzi, Chin, Henseler and Wang [45];
Astrachan, Patel and Wanzenried [46], PLS-SEM is a path for the statistical modelling
technique, and a complex multivariate analysis for examining the relationships between
latent variables.
In the same vein, the PLS-SEM research approach is a flexible, superior and a robust
technique to design or build a plausible statistical model [47]; Lowry and Gaskin, [48]; and
the PLS-SEM features enhances the achievement of the stated objective. Peterson and Kim
[49]; Astrachan, Patel and Wanzenried [46] made emphasis that reliable and valid
confirmatory factor analysis can be properly achieved with the use of PLS-SEM path
modelling.
PLS-SEM is a statistical tool that has been adopted in different fields including engineering
and technology, social sciences, [47]. The technique is well applicable for analysis that
Preprints (www.preprints.org) | NOT PEER-REVIEWED | Posted: 31 May 2020 doi:10.20944/preprints202005.0497.v1

11
deals with non-normal data because of its assumed flexibility when concerned with the
distribution and normality of variables [48]. According to Lowry and Gaskin [48], the
PLS-SEM method enhances the test of complex models that have multi-stage effects, for
example, mediating role and other complex models’ variables relationships. In line with
the various evidences rooted in the body of scientific literature, this study will adopt the
partial-least-squares (PLS-SEM) technique for testing and examining the designed
conceptual model and achieving the hypothetical statements.
By so doing, it will examine the relationship between the constructs of dynamic capacities
and enterprise performance, and the conforming constructs’ indicators with a structural
model. This study will incorporate the PLS-SEM for data screening, analysis and the
underline assumptions will be taken critically in order to compute loadings, path
coefficients and weights, the study will also employ the bootstrapping method to determine
the significance levels as evidenced in the study of Hair, Hult, Ringle and Sarstedt [28].
Reasons for adopting PLS-SEM are:
i. PLS can be applied to both small and large samples;
ii. It can be adopted in the situation whereby there is no theory or theoretical basis;
iii. It is applicable for both probability and non-probability sampling distribution;
iv. It allows for both reflective and formative latent variables;
v. It requires only the formation of indices or indicators;
The approach will be based on creating latent factors from the questionnaire based on an
exploratory factor analysis. The resulting factors will then be evaluated in terms of their
influence on the dependent variables in the model setup. There are four sets of equations
to be included in the entire model, they are;
i. Measurement of equations: Equation 1 links the measurement indicators (survey
items) to the latent factors;
ii. PLS equations: Equation 2 associates the latent factors with individuals’
background characteristics;
iii. Structural equations: Equation3 relates the explanatory and the mediator variables;
and
iv. Structural equations: Equation 4 links the mediators to the dependent variables.
𝐼𝑟𝑛 = 𝑍*𝑙𝑛𝛼𝑟 + 𝜈𝑟𝑛 and 𝜈𝑛 ~ 𝑁(0, Σ𝜈) for 𝑟 = 1, … , 𝑅 ………. Equation 1
Preprints (www.preprints.org) | NOT PEER-REVIEWED | Posted: 31 May 2020 doi:10.20944/preprints202005.0497.v1

12
𝑍*𝑙𝑛= 𝑆𝑙𝑛𝛽𝑙 + 𝜔𝑙𝑛 and 𝜔𝑛 ~ 𝑁(0, Σ𝜔) for 𝑙 = 1, … , 𝐿 ………… Equation 2
𝑍∗𝑙= 𝑍𝑖𝛽𝑖 + 𝜑𝑙 and 𝜑𝑙 ~ 𝑁(0, Σ𝜑) for 𝑙 = 1, … , 𝐿 , 𝑖 = 1, … , 𝐾 ………… Equation 3
𝑌𝑖𝑛 = 𝑍*𝑙𝑛𝛽𝑧 + 𝜉𝑖𝑛 and 𝜉𝑛 ~ 𝑁(0, Σ𝜉) for 𝑖 = 1, … , 𝐼 ………… Equation 4
where Irnis the value of an indicator r of the latent construct Z*ln will be perceived by
respondent n,Z*ln will be the value of latent construct l for respondent n, Sln will be the
vector of M respondents’ observed individual characteristics, and Yin will be the vector of
enterprise performance levels. Error terms will be presented as elements ωln, νrn, ξin of the
vectors following a normal distribution with respective covariance matrix Σω, Σν, Σξ, while
parameters to be estimated are αr, βl, βi, and βz. Considering R indicators translates into
writing R measurement equations and estimating an (R×1) vector α of parameters (i.e., one
parameter is estimated for each equation), while considering L latent constructs translates
into writing L structural equations and estimating an (M×L) matrix of β parameters (i.e., M
parameters will be estimated for each equation).
DATA ANALYSIS AND RESULTS
The first section of result is the descriptive results of all the four constructs. When
observing
the mean values, it was shown that they are closer to the upper range (4). Therefore, it can
be concluded that food and beverage enterprises in Lagos, Nigeria were able to achieve
product innovative activities, and enterprise survival activities. Furthermore, these
innovative activities are positively and strongly related with the competitive advantage and
competitive intensity. This is shown in Table 1, Table 2, Table 3, and Table 4.
The Table 1 depicts the respondents’ perception on innovation product capacity on the five
point scales of very high, high, not sure, low and very low. By merging the respondents’
responses under very high and high, four hundred and twenty two (422) respondents
representing 78.3 percent acknowledged flexibility practices in organization. Four hundred
and fourteen (414) respondents representing 76.8 percent acknowledged re-engineering
processes in the organization. Three hundred and ninety three (393) respondents
representing 72.9 percent acknowledged that solutions centred investments are essential in
the organization. Four hundred and thirty (430) respondents representing 81.7 percent
Preprints (www.preprints.org) | NOT PEER-REVIEWED | Posted: 31 May 2020 doi:10.20944/preprints202005.0497.v1
13
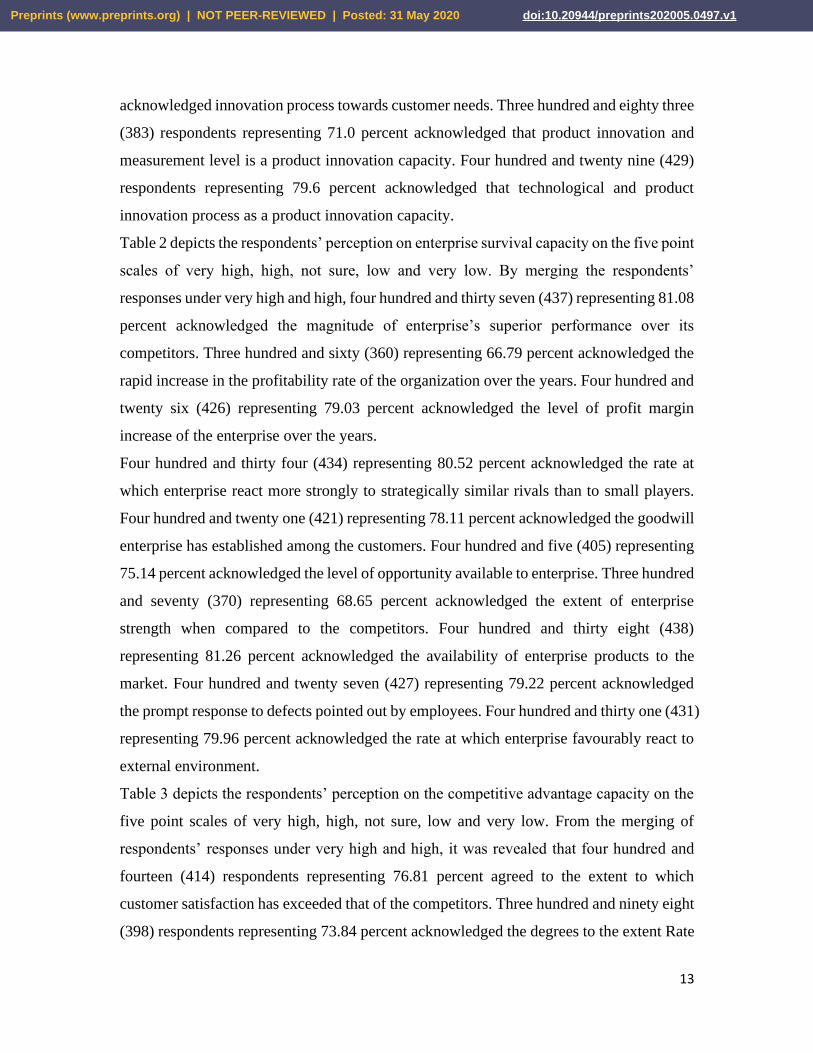
acknowledged innovation process towards customer needs. Three hundred and eighty three
(383) respondents representing 71.0 percent acknowledged that product innovation and
measurement level is a product innovation capacity. Four hundred and twenty nine (429)
respondents representing 79.6 percent acknowledged that technological and product
innovation process as a product innovation capacity.
Table 2 depicts the respondents’ perception on enterprise survival capacity on the five point
scales of very high, high, not sure, low and very low. By merging the respondents’
responses under very high and high, four hundred and thirty seven (437) representing 81.08
percent acknowledged the magnitude of enterprise’s superior performance over its
competitors. Three hundred and sixty (360) representing 66.79 percent acknowledged the
rapid increase in the profitability rate of the organization over the years. Four hundred and
twenty six (426) representing 79.03 percent acknowledged the level of profit margin
increase of the enterprise over the years.
Four hundred and thirty four (434) representing 80.52 percent acknowledged the rate at
which enterprise react more strongly to strategically similar rivals than to small players.
Four hundred and twenty one (421) representing 78.11 percent acknowledged the goodwill
enterprise has established among the customers. Four hundred and five (405) representing
75.14 percent acknowledged the level of opportunity available to enterprise. Three hundred
and seventy (370) representing 68.65 percent acknowledged the extent of enterprise
strength when compared to the competitors. Four hundred and thirty eight (438)
representing 81.26 percent acknowledged the availability of enterprise products to the
market. Four hundred and twenty seven (427) representing 79.22 percent acknowledged
the prompt response to defects pointed out by employees. Four hundred and thirty one (431)
representing 79.96 percent acknowledged the rate at which enterprise favourably react to
external environment.
Table 3 depicts the respondents’ perception on the competitive advantage capacity on the
five point scales of very high, high, not sure, low and very low. From the merging of
respondents’ responses under very high and high, it was revealed that four hundred and
fourteen (414) respondents representing 76.81 percent agreed to the extent to which
customer satisfaction has exceeded that of the competitors. Three hundred and ninety eight
(398) respondents representing 73.84 percent acknowledged the degrees to the extent Rate
Preprints (www.preprints.org) | NOT PEER-REVIEWED | Posted: 31 May 2020 doi:10.20944/preprints202005.0497.v1
14
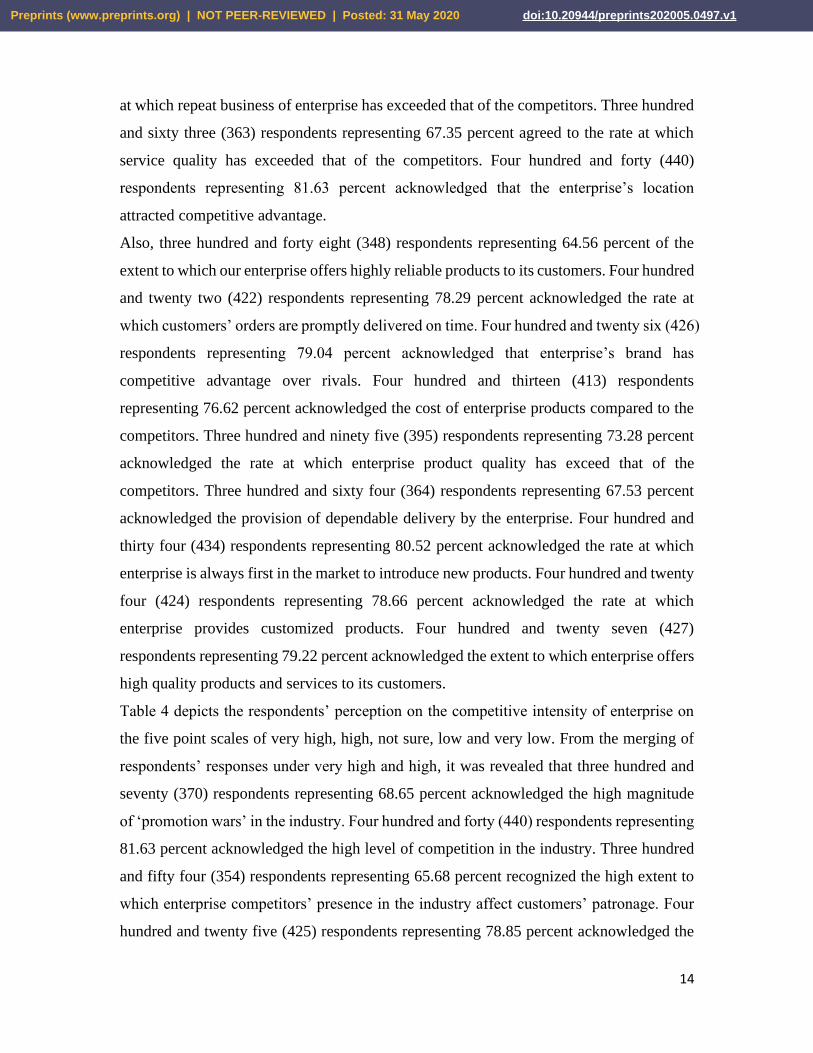
at which repeat business of enterprise has exceeded that of the competitors. Three hundred
and sixty three (363) respondents representing 67.35 percent agreed to the rate at which
service quality has exceeded that of the competitors. Four hundred and forty (440)
respondents representing 81.63 percent acknowledged that the enterprise’s location
attracted competitive advantage.
Also, three hundred and forty eight (348) respondents representing 64.56 percent of the
extent to which our enterprise offers highly reliable products to its customers. Four hundred
and twenty two (422) respondents representing 78.29 percent acknowledged the rate at
which customers’ orders are promptly delivered on time. Four hundred and twenty six (426)
respondents representing 79.04 percent acknowledged that enterprise’s brand has
competitive advantage over rivals. Four hundred and thirteen (413) respondents
representing 76.62 percent acknowledged the cost of enterprise products compared to the
competitors. Three hundred and ninety five (395) respondents representing 73.28 percent
acknowledged the rate at which enterprise product quality has exceed that of the
competitors. Three hundred and sixty four (364) respondents representing 67.53 percent
acknowledged the provision of dependable delivery by the enterprise. Four hundred and
thirty four (434) respondents representing 80.52 percent acknowledged the rate at which
enterprise is always first in the market to introduce new products. Four hundred and twenty
four (424) respondents representing 78.66 percent acknowledged the rate at which
enterprise provides customized products. Four hundred and twenty seven (427)
respondents representing 79.22 percent acknowledged the extent to which enterprise offers
high quality products and services to its customers.
Table 4 depicts the respondents’ perception on the competitive intensity of enterprise on
the five point scales of very high, high, not sure, low and very low. From the merging of
respondents’ responses under very high and high, it was revealed that three hundred and
seventy (370) respondents representing 68.65 percent acknowledged the high magnitude
of ‘promotion wars’ in the industry. Four hundred and forty (440) respondents representing
81.63 percent acknowledged the high level of competition in the industry. Three hundred
and fifty four (354) respondents representing 65.68 percent recognized the high extent to
which enterprise competitors’ presence in the industry affect customers’ patronage. Four
hundred and twenty five (425) respondents representing 78.85 percent acknowledged the
Preprints (www.preprints.org) | NOT PEER-REVIEWED | Posted: 31 May 2020 doi:10.20944/preprints202005.0497.v1

15
high prevalent price competition in the industry. Four hundred and seventeen (417)
respondents representing 77.37 percent recognized the high frequent competitive moves in
the industry.
In addition, four hundred and thirty three (433) respondents representing 80.34 percent
recognized the degree at which the enterprise constantly seek to know rivals’ moves,
analysis and track them for competitive actions and responses. Four hundred and four (404)
respondents representing 74.95 percent acknowledged the rate at which enterprise’s
product range is more attractive to consumers than that of the competitors. Three hundred
and sixty nine (369) respondents representing 68.46 percent recognized the extent to which
enterprises annex opportunities in the external environment. Four hundred and thirty five
(435) respondents representing 80.7 percent recognized the rate at which organization tend
to produce its products at a low cost. Three hundred and fifty four (354) respondents
representing 65.68 percent acknowledged the degree to which one competitor’s product
matches each other’s product offers in the market.
The second section is the findings of SEM as presented in Table 5. Based on SEM
techniques, the unitary model is set up to examine the nexus between product innovation
and enterprise survival variables. Firstly, there was a positive and insignificant outcome
(0.002; t = 0.203, p > 0.05). Afterwards, the first-order and second-order combined
structural models were identified to
establish the hypotheses on the impacts of competitive intensity and competitive advantage
on product innovation, and of their impact on enterprise survival. In this model, the result
was χ2(85) = 389.19 (p < 0.05) with normed chi-square (χ2/gl) of 4.9. Though this value is
greater than the maximum recommended of 2 and the χ2 is not significant. In view of this,
lesson will be drawn from the study of Martínez- López et al. [50] which explain that the
insignificant may be as a result of the fact that the samples is larger than 200 as evidenced
in this research, which implies the absence of multivariate normality that seems to increase
the chi-square statistic. Consequently, there was recommendation that other indicators of
goodness should be adopted. Hence, the following were obtained. CFI = 0.82, IFI = 0.82,
NNFI = 0.78, and RMSEA = 0.08 (which is between 0.07 and 0.09), and the results give
an acceptable model.
Preprints (www.preprints.org) | NOT PEER-REVIEWED | Posted: 31 May 2020 doi:10.20944/preprints202005.0497.v1
16
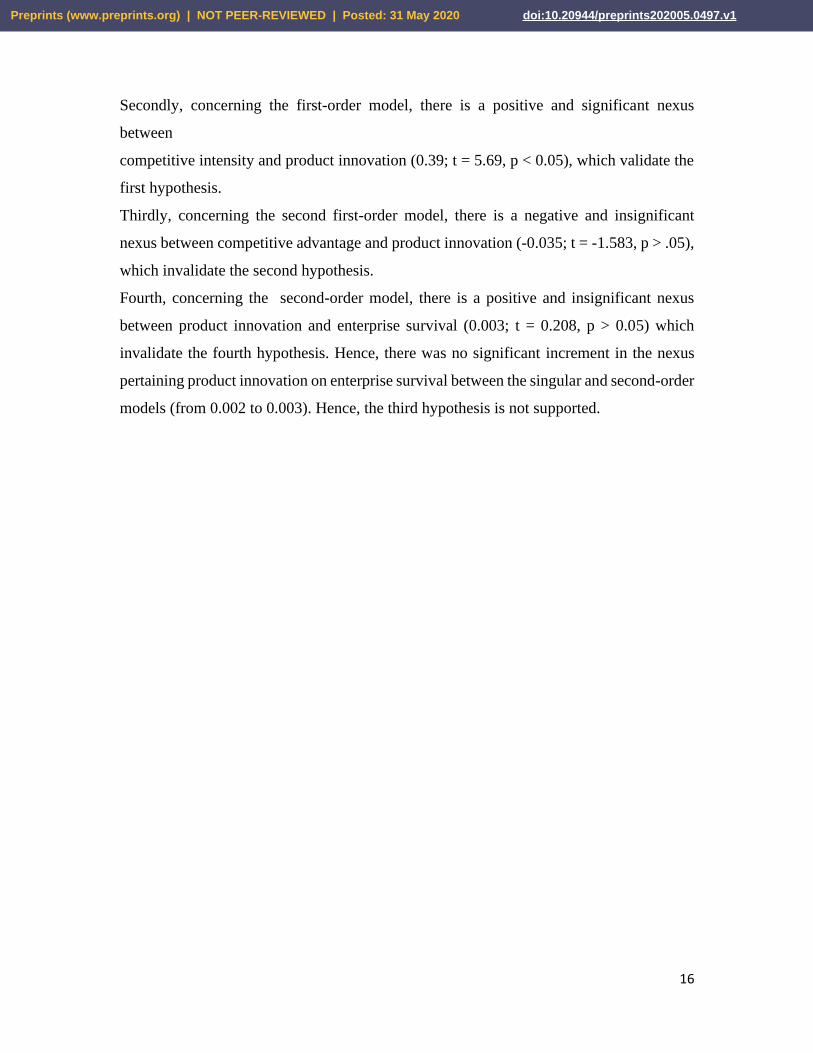
Secondly, concerning the first-order model, there is a positive and significant nexus
between
competitive intensity and product innovation (0.39; t = 5.69, p < 0.05), which validate the
first hypothesis.
Thirdly, concerning the second first-order model, there is a negative and insignificant
nexus between competitive advantage and product innovation (-0.035; t = -1.583, p > .05),
which invalidate the second hypothesis.
Fourth, concerning the second-order model, there is a positive and insignificant nexus
between product innovation and enterprise survival (0.003; t = 0.208, p > 0.05) which
invalidate the fourth hypothesis. Hence, there was no significant increment in the nexus
pertaining product innovation on enterprise survival between the singular and second-order
models (from 0.002 to 0.003). Hence, the third hypothesis is not supported.
Preprints (www.preprints.org) | NOT PEER-REVIEWED | Posted: 31 May 2020 doi:10.20944/preprints202005.0497.v1

17
Table 1. Descriptive analysis of Product innovation
Variables IPC1 IPC2 IPC3 IPC4 IPC5 IPC6 Overall
Mean
Rating Frequency
(Percent)
Frequency
(Percent)
Frequency
(Percent)
Frequency
(Percent)
Frequency
(Percent)
Frequency
(Percent)
Very Low 20 (3.7) 35 (6.5) 25 (4.6) 24 (4.5) 35 (6.5) 24 (4.5)
Low 19 (3.5) 26 (4.8) 48 (8.9) 27 (5.0) 48 (8.9) 30 (5.6)
Not Sure 78 (14.5) 64 (11.9) 73 (13.5) 48 (8.9) 73 (13.5) 56 (10.4)
High 288 (53.4) 280 (51.9) 263 (48.8) 292 (54.2) 261 (48.4) 282 (52.3)
Very High 134 (24.9) 134 (24.9) 130 (24.1) 148 (27.5) 122 (22.6) 147 (27.3)
Total 539 (100) 539 (100) 539 (100) 539 (100) 539 (100) 539 (100)
Mean 3.92 3.84 3.79 3.95 3.72 3.92 3.86
Std.
Deviation
0.93 1.06 1.05 0.98 1.11 0.99 1.02
Table 2. Descriptive analysis of Enterprise survival
Variables ESC1 ESC2 ESC3 ESC4 ESC5 ESC6 ESC7 ESC8 ESC9 ESC10
Ratings Frequency
(Percent)
Frequency
(Percent)
Frequency
(Percent)
Frequency
(Percent)
Frequency
(Percent)
Frequency
(Percent)
Frequency
(Percent)
Frequency
(Percent)
Frequency
(Percent)
Frequency
(Percent)
Very Low 19 (3.53) 35 (6.49) 20 (3.71) 19 (3.53) 17 (3.15) 36 (6.68) 18 (3.34) 18 (3.34) 19 (3.53) 18 (3.34)
Low 20 (3.71) 51 (9.46) 27 (5.01) 22 (4.08) 19 (3.53) 19 (3.53) 53 (9.83) 21 (3.90) 28 (5.20) 22 (4.08)
Not Sure 63 (11.69) 93 (17.25) 66 (12.24) 64 (11.87) 82 (15.21) 79 (14.66) 98 (18.18) 62 (11.50) 65 (12.06) 68 (12.62)
High 291
(53.99)
251 (46.57) 281 (52.13) 294
(54.55)
288
(53.43)
279
(51.76)
253 (46.94) 292 (54.17) 282
(52.32)
292 (54.17)
Preprints (www.preprints.org) | NOT PEER-REVIEWED | Posted: 31 May 2020 doi:10.20944/preprints202005.0497.v1

18
Very High 146
(27.09)
109 (20.22) 145 (26.90) 140
(25.97)
133
(24.68)
126
(23.38)
117 (21.71) 146 (27.09) 145
(26.90)
139 (25.79)
Mean 3.97 3.65 3.94 3.958 3.93 3.82 3.74 3.98 3.94 3.95
Std.
Deviation
0.92 1.10 0.96 0.93 0.91 1.04 1.01 0.92 0.96 0.92
Table 3. Competitive advantage
Variables CA1 CA2 CA3 CA4 CA5 CA6 CA7 CA8 CA9 CA10 CA11 CA12 CA13
Rating Frequency
(Percent)
Frequency
(Percent)
Frequency
(Percent)
Frequency
(Percent)
Frequency
(Percent)
Frequency
(Percent)
Frequency
(Percent)
Frequency
(Percent)
Frequency
(Percent)
Frequency
(Percent)
Frequency
(Percent)
Frequency
(Percent)
Frequency
(Percent)
Very
Low
21 (3.90) 40 (7.42) 17 (3.16) 18 (3.34) 36 (6.68) 18 (3.34) 20 (3.71) 20 (3.31) 36 (6.68) 17 (3.15) 18 (3.34) 18 (3.34) 18 (3.34)
Low 22 (4.08) 22 (4.08) 55 (10.20) 20 (3.71) 57 (10.58) 29 (5.38) 27 (5.01) 24 (4.45) 21 (3.90) 56 (10.39) 21 (3.90) 29 (5.38) 25 (4.64)
Not Sure 82 (15.21) 79 (14.66) 104
(19.30)
61 (11.32) 98 (18.18) 70 (12.99) 66 (12.25) 82 (15.21) 87 (16.14) 102
(18.92)
66 (12.25) 68 (12.62) 69 (12.80)
High 283
(52.51)
274 (50.83) 248
(46.01)
291
(53.99)
244
(45.27)
277
(51.39)
289
(53.62)
282
(52.32)
271
(50.28)
248
(46.01)
291
(53.99)
280
(51.95)
289 (53.62)
Very
High
131
(24.30)
124 (23.01) 115
(21.34)
149
(27.64)
104
(19.29)
145
(26.90)
137
(25.42)
131
(24.30)
124
(23.01)
116
(21.52)
143
(26.53)
144
(26.72)
138 (25.60)
Mean 3.89 3.78 3.72 3.99 3.6 3.93 3.92 3.89 3.79 3.72 3.97 3.93 3.94
Std.
Deviation
0.95 1.08 1.01 0.92 1.11 0.96 0.95 0.95 1.05 1.02 0.92 0.95 0.93
Table 4. Competitive intensity
Variables CA1 CA2 CA3 CA4 CA5 CA6 CA7 CA8 CA9 CA10
Rating Frequency
(Percent)
Frequency
(Percent)
Frequency
(Percent)
Frequency
(Percent)
Frequency
(Percent)
Frequency
(Percent)
Frequency
(Percent)
Frequency
(Percent)
Frequency
(Percent)
Frequency
(Percent)
Very
Low
17 (3.15) 18 (3.34) 38 (7.05) 18 (3.34) 17 (3.15) 18 (3.34) 36 (6.68) 17 (3.15) 19 (3.53) 35 (6.5)
Low 53 (9.83) 19 (3.54) 53 (9.83) 29 (5.38) 22 (4.08) 22 (4.08) 20 (3.71) 53 (9.83) 21 (3.9) 54 (10.02)
Not Sure 99 (18.37) 62 (11.5) 94 (17.44) 67 (12.43) 83 (15.4) 66 (12.24) 79 (14.66) 100 (18.55) 64 (11.9) 96 (17.81)
Preprints (www.preprints.org) | NOT PEER-REVIEWED | Posted: 31 May 2020 doi:10.20944/preprints202005.0497.v1

19
High 253
(46.94)
295
(54.73)
248 (46.01) 280
(51.95)
285 (52.88) 294
(54.55)
277
(51.39)
253 (46.94) 290 (53.8) 248 (46.01)
Very
High
117
(21.71)
145 (26.9) 106 (19.67) 145 (26.9) 132 (24.49) 139
(25.79)
127
(23.56)
116 (21.52) 145 (26.9) 106 (19.67)
Mean 3.74 3.98 3.61 3.94 3.95 3.92 3.81 3.74 3.97 3.62
Std.
Deviation
1.01 0.91 1.12 0.95 0.92 0.92 1.05 1.01 0.93 1.11
Preprints (www.preprints.org) | NOT PEER-REVIEWED | Posted: 31 May 2020 doi:10.20944/preprints202005.0497.v1

20
Table 5. Path analysis
Path Direct effect t-value Hypothesis Supported
Singular model
a. Product innovation Enterprise survival
0.002
0.203*
First-order model
b. Competitive intensity Product innovation
c. Competitive advantage Product innovation
0.39
-0.035
5.69*
-1.583*
H1
H2
Valid
Invalid
Second-order model
d. Product innovation Enterprise survival
0.003
0.208*
H3
Invalid
*p < .05
χ2 = CFI = 0.82, IFI = 0.82, NNFI = 0.78, and RMSEA = 0.08
DISCUSSION OF FINDINGS
Regarding the food and beverage enterprises in Lagos, Nigeria, this study discovered that
competitive intensity has huge positive implication on product innovation at (0.39; t = 5.69, p <
0.05). This gives numerical evidence that, in the face of more market competition, enterprises will
be pressured to adopt the model of costs reduction on products which will enhance the reduction
of product prices, and will have significant impact on profit. This corroborates the findings of
Miller and Friesen [51]; Auh and Menguc [53]; Chang et al. [11]; Abebe and Angriawan [54]
which finds that enterprises adopts product innovation such that they improvement product
development in the face of high competition. However, the findings reveal that there is no
significance between competitive advantage and product innovation at (0.002; t = 0.203, p > 0.05),
and there is no significance between product innovation and enterprise survival at (-0.035; t = -
1.583, p > .05).
In summary, the major finding of the study is that there is a nexus between competitive intensity
and product innovation, and the nexus is affected by other antecedent variables in the food and
beverage enterprises in Lagos, Nigeria. As a result, the food and beverage enterprises should
concentrate more on product innovation so that they will be able to stand the intensity of
competition.
CONCLUSION
Product innovation is a crucial factor in enterprise survival. Even though there are sources from
strategic theory that guides the clear comprehension towards appreciating the nexus between these
Preprints (www.preprints.org) | NOT PEER-REVIEWED | Posted: 31 May 2020 doi:10.20944/preprints202005.0497.v1

21
two variables (product innovation and enterprise survival), there are still many lacunas that should
be addressed and filled. Consequently, the need for additional empirical corroboration or support
is pertinent. This study aimed at verifying the nexus between product innovation and enterprise
survival, and how they are affected by the existence of antecedent variables such as competitive
intensity and competitive advantage.
In the methodology, this study adopts the conduct of explanatory and cross-sectional investigations
through the use of structural equation modelling (SEM) to a sample of selected food and beverages
enterprises in Lagos, Nigeria. Regarding the food and beverage enterprises in Lagos, Nigeria, this
study discovered that competitive intensity has huge positive implication on product innovation at
(0.39; t = 5.69, p < 0.05). This gives numerical evidence that, in the face of more market
competition, enterprises will be pressured to adopt the model of costs reduction on products which
will enhance the reduction of product prices, and will have significant impact on profit. However,
the findings reveal that there is no significance between competitive advantage and product
innovation at (0.002; t = 0.203, p > 0.05), and there is no significance between product innovation
and enterprise survival at (-0.035; t = -1.583, p > .05).
As a result, the food and beverage enterprises should concentrate more on product innovation so
that they will be able to stand the intensity of competition. The results emanated from the study is
germane as it make significant contribution to literature and the body of knowledge and on
strategic management by enlightening that competitive intensity is a necessary inducement for
product innovation.
Finally, since the study is limited to four variables and six food and beverage enterprises across
Lagos, Nigeria, future studies may consider exogenous variables and sample drawn from
enterprises across south-western states.
Author Contributions: Conceptualization, J.O.A., Z.X.J. and T.K.A.D.; Data curation, L.L.Z., and
J.O.A., J.P.M., A.E.O.,and T.K.A.D; Formal analysis, L.L.Z., J.O.A., A.E.O. and T.K.A.D.; Funding acquisition, L.L.Z. and Z.X.J.; Investigation, J.O.A., J.P.M and T.K.A.D.; Methodology, J.O.A., J.P.M, A.E.O. and Z.X.J.; Project administration, L.L.Z. and Z.X.J.; Resources, L.L.Z., J.P.M and A.E.O.; Software, J.O.A. and A.E.O.; Supervision, L.L.Z.; Writing – original draft, J.O.A. and A.E.O.; Writing –
review & editing, L.L.Z., J.O.A., J.P.M and Z.X.J.All authors have read and agreed to the published
version of the manuscript.
Preprints (www.preprints.org) | NOT PEER-REVIEWED | Posted: 31 May 2020 doi:10.20944/preprints202005.0497.v1

22
Funding: This empirical work was supported the National Natural Science Foundation of
China (NSFC),’’71804061’’.
Conflicts of Interest: The authors declare no conflict of interest.
Acknowledgments: We would like to thank the Overseas Educational College of Jiangsu University for all research project supervisory supports rendered throughout the entire research’s development and completion.
References
1. Rosenbusch, N., Brinckmann, J., and Bausch, A. (2011). Is innovation always beneficial?
A meta-analysis of the relationship between innovation and performance in SMEs. Journal
of Business Venturing, 26(4), 441-457. doi:10.1016/j.jbusvent.2009.12.002
2. Marín‐Idárraga, D. A., Hurtado González, J. M., and Cabello Medina, C. (2016). The
antecedents of exploitation‐exploration and their relationship with innovation: A study of
managers’ cognitive maps. Creativity and Innovation Management, 25(1), 18-37.
doi:10.1111/caim.12139
3. Keupp, M. M., Palmié, M., and Gassmann, O. (2012). The strategic management of
innovation: A systematic review and paths for future research. International Journal of
Management Reviews, 14(4), 367- 390. doi:10.1111/j.1468-2370.2011.00321.x
4. Damanpour, F. (1987). The adoption of technological, administrative, and ancillary
innovations: Impact of organizational factors. Journal of Management, 13(4), 675-688.
doi:10.1177/014920638701300
5. Stock, R., and Zacharias, N. (2011). Patterns and performance outcomes of innovation
orientation. Journal of the Academy of Marketing Science, 39(6), 870-888.
doi:10.1007/s11747-010-0225-2
6. Marín-Idárraga, D. A., and Cuartas-Marín, J. C. (2013). Structural coalignment influence
on SMEs performance. International Journal of Business and Management, 8(22), 76-91.
doi:10.5539/ijbm.v8n22p76
7. Alegre, J., and Chiva, R. (2013). Linking entrepreneurial orientation and firm performance:
The role of organizational learning capability and innovation performance. Journal of
Small Business Management, 51(4), 491-507. doi:10.1111/jsbm.12005
8. Heunks, F. J. (1998). Innovation, creativity and success. Small Business Economics, 10(3),
263-272. doi:10.1023/A:1007968217565
Preprints (www.preprints.org) | NOT PEER-REVIEWED | Posted: 31 May 2020 doi:10.20944/preprints202005.0497.v1

23
9. Freel, M. S., and Robson, P. J. (2004). Small firm innovation, growth and performance:
Evidence from Scotland and Northern England. International Small Business Journal,
22(6), 561-575. doi:10.1177/0266242604047410
10. Vermeulen, P. A., De Jong, J. P., and O’shaughnessy, K. (2005). Identifying key
determinants for new product introductions and firm performance in small service firms.
The Service Industries Journal, 25(5), 625-640. doi:10.1080/02642060500100783
11. Chang, Y., Hughes, M., and Hotho, S. (2011).Internal and external antecedents of SMEs’
innovation ambidexterity outcomes. Management Decision, 49(10), 1658-1676.
doi:10.1108/00251741111183816
12. Jaworski, B. J., and Kohli, A. K. (1993). Market orientation: Antecedents and
consequences. Journal of Marketing, 57(3), 53-70. doi:10.2307/1251854
13. Kim, N., and Atuahene-Gima, K. (2010). Using exploratory and exploitative market
learning for new product development. Journal of Product Innovation Management, 27(4),
519-536. doi:10.1111/j.1540-5885.2010.00733.x
14. Adeniran, A. O., and Sidiq, O. B. (2018). Economic recession and the way-out: Nigeria as
case study. Global Journal of Humanities and Social Science: E Economics, 18(1), 1-6.
15. Cyert, R. M., and March, J. G. (1992). A behavioral theory of the firm (2nd ed.). Oxford,
UK: Blackwell Publishing.
16. Lecerf, M. (2012). Internationalization and innovation: The effects of a strategy mix on the
economic performance of French SMEs. International Business Research, 5(6), 2-13.
doi:10.5539/ibr.v5n6p2
17. Nohria, N., and Gulati, R. (1996). Is slack good or bad for innovation? Academy of
Management Journal, 39(5), 1245-1264. doi:10.2307/256998
18. Drucker, P. F. (1985). The discipline of innovation. Harvard Business Review, 63(3), 67-
72.
19. Wolfe, R. A. (1994). Organizational innovation: Review, critique and suggested research.
Journal of Management Studies, 31(3), 405-431. doi:10.1111/j.1467-6486.1994.tb00624.x
20. Damanpour, F. (1996). Bureaucracy and innovation revisited: Effects of contingency
factors, industrial sectors, and innovation characteristics. Journal of High Technology
Management Research, 7(2), 149-173. doi:10.1016/S1047-8310(96)90002-4
Preprints (www.preprints.org) | NOT PEER-REVIEWED | Posted: 31 May 2020 doi:10.20944/preprints202005.0497.v1

24
21. Damanpour, F., and Gopalakrishnan, S. (1999). Organizational adaptation and innovation:
The dynamics of adopting innovation types. In K. Brockoff, A. Chakrabarti, and J.
Hauschildt (Eds.), The dynamics of innovation: Strategic and managerial implications (pp.
57-80). Berlin, Germany: Springer-Verlag.
22. Damanpour, F., and Wischnevsky, D. J. (2006). Research on innovation in organizations:
Distinguishing innovation-generating from innovation-adopting organizations. Journal of
Engineering and Technology Management, 23(4), 269-291. doi:10.1016/j.
jengtecman.2006.08.
23. Gopalakrishnan, S., Kessler, E. H., and Scillitoe, J. L. (2010). Navigating the innovation
landscape: Past research, present practice, and future trends. Organization Management
Journal, 7(4), 262-277. doi:10.1057/omj.2010.36
24. Van de Ven, A. H. (1986). Central problems in the management of innovation.
Management Science, 32(5), 590-607. doi:10.1287/mnsc.32.5.590
25. Burton, R., and Obel, B. (2004). Strategic organizational diagnosis and design: The
dynamics of fit. Norwell, MA: Kluwer Academic Publishers.
26. Ánzola, O., Marín-Idárraga, D. A., and Cuartas, J. C. (2017). Fundamentación teórica de
la cultura, la estructura y la estrategia. Referentes para el análisis y diseño organizacional.
[Theoretical foundation of culture, structure and strategy. Referents for organizational
analysis and design]. Bogotá, Colombia: Universidad Externado de Colombia.
27. Wang, C. (2014). A longitudinal study of innovation competence and quality management
on firm performance. Innovation, 16(3), 392- 403. doi:10.1080/14479338.2014.11081995
28. Hair, J. F., Hult, G. T. M., Ringle, C., and Sarstedt, M. (2013). A Primer on Partial Least
Squares Structural Equation Modeling (PLS-SEM); SAGE Publications: Thousand Oaks,
CA, USA.
29. Ziokowska, M. (2013). Relational resources management as source of company’s
innovativeness and competitive advantage. Journal of Economic, Business and
Management, 2(3), 202-208.
30. Frankfort-Nachmias, C., and Nachmias, D. (2008). Research methods in the social sciences,
(7th Ed.). New York: Worth Publishers.
31. CBN (2003). Contemporary economic policy issues in Nigeria. Abuja, Nigeria: CBN
Publication.
Preprints (www.preprints.org) | NOT PEER-REVIEWED | Posted: 31 May 2020 doi:10.20944/preprints202005.0497.v1

25
32. Akpan, P. L., Ikon, Chukwunonyeand Momoh (2016). Economic environment and
performance of food and beverages sub-sector of a developing economy: Nigeria.
International Journal of Recent Research in Commerce Economics and Management
(IJRRCEM), 3 (3), 85-90.
33. Fornell, C., and Larcker, D. F. (1981). Evaluating structural equation models with
unobservable variables and measurement error. Journal of Marketing Research, 18(1), 39-
50. doi:10.2307/3151312
34. Zikmund, W. G. (2003). Exploring Marketing Research, 8th Edition, Thompson
Learning/Southwestern, Cincinnati, OH.
35. Bollen, K. (1989). Structural Equations with Latent Variables. John Wiley & Sons, New
York.
36. Catherine, M. S., Nathan, J. M., and Nora, L. N. (2012). Structural Equation Modelling,
Chapter 27, Pp. 495-512 in Robert C. Elston et al. (eds.), Statistical Human Genetics:
Methods and Protocols, Methods in Molecular Biology, 850, DOI 10.1007/978-1-61779-
555-8_2
37. McDonald, R. P., and Ho, M. H. (2002). Principles and Practice in Reporting Structural
Equation Analyses. Psychol. Methods, 7: 64-82.
38. Pearl, J. (2000). Causality: Models, Reasoning, and Inference. Cambridge University Press,
New York, New York.
39. Bollen, K. (2001). Structural Equations with Latent Variables. John Wiley & Sons, New
York.
40. Malhotra, N. K. (1999). Marketing research: An applied orientation. London: Prentice-Hall
International.
41. Hooper, D., Coughlan, J., and Mullen, M. R. (2008). Structural equation modelling:
Guidelines for determining model fit. Electronic Journal of Business Research Methods,
6(1), 53-59.
42. Kaplan, R. S., and Norton, D. R. (2005). The balanced scorecard: Measures that drive
performance. Harvard Business Review, 83(7), 172-180.
43. Fursova, J. (2016). The Business of Community Development and the Right to the City:
Reflections on the Neoliberalization Processes in Urban Community Development.
Community Development Journal, 53, 119–135.
Preprints (www.preprints.org) | NOT PEER-REVIEWED | Posted: 31 May 2020 doi:10.20944/preprints202005.0497.v1

26
44. Hall, P. C. M., Müller, D. K., and Saarinen, P. J. (2008). Nordic Tourism: Issues and Cases;
Channel View Publications: Bristol, UK.
45. Vinzi, V. E., Chin, W. W., Henseler, J., and Wang, H. (2010). Handbook of Partial Least
Squares: Concepts, Methods and Applications, 1st ed.; Springer: Berlin/Heidelberg,
Germany, pp. 1–798.
46. Astrachan, C. B., Patel, V. K., and Wanzenried, G. (2014). A Comparative Study of CB-
SEM and PLS-SEM for Theory Development in Family Firm Research. Journal of Family
Business Strategy, 5, 116–128.
47. Ringle, C. M., Sinkovics, R. R., and Henseler, J. (2009). The Use of Partial Least Squares
Path Modelling in International Marketing. In New Challenges to International Marketing;
Emerald Group Publishing Limited: West Yorkshire, UK, Pp. 277–319.
48. Lowry, P. B., and Gaskin, J. (2014). Partial Least Squares (PLS) Structural Equation
Modeling (SEM) for Building and Testing Behavioral Causal Theory: When to Choose It
and How to Use It. IEEE Transportation Professional Communication, 57, 123–146.
49. Peterson, R.; and Kim, Y. (2013). On the Relationship between Coefficient Alpha and
Composite Reliability. Journal of Applied Psychology, 98, 194
50. Neely, A., Gregory, M., and Platts, K. (1995). Performance measurement system design:
A literature review and research agenda. International Journal of Operations and
Production Management, 15(4), 80-116. doi:10.1108/01443579510083622
51. Miller, D., and Friesen, P. H. (1983). Strategy-making and environment: The third link.
Strategic Management Journal, 4(3), 221-235. doi:10.1002/ smj.4250040304
52. Zahra, S. A. (1996). Technology strategy and financial performance: Examining the
moderating role of the firm’s competitive environment. Journal of Business Venturing,
11(3), 189-219. doi:10.1016/0883- 9026(96)00001-8
53. Auh, S., and Menguc, B. (2005). Balancing exploration and exploitation: The moderating
role of competitive intensity. Journal of Business Research, 58(12), 1652-1661.
doi:10.1016/j.jbusres
54. Abebe, M. A., and Angriawan, A. (2014). Organizational and competitive influences of
exploration and exploitation activities in small firms. Journal of Business Research, 67(3),
339-345. doi:10.1016/j. jbusres.2013.01.015
Preprints (www.preprints.org) | NOT PEER-REVIEWED | Posted: 31 May 2020 doi:10.20944/preprints202005.0497.v1