Embed Size (px)
Citation preview

1q
Sloan Trends, Inc.
www.sloantrend.com
760-741-9611
A. Elizabeth Sloan, Ph.D.
Catherine Adams Hutt, Ph.D., R.D., C.F.S.
Protein Trends & Technologies Seminar
May 3 - 4 2016
Next Generation Protein Opportunities
Sustaining the Rush …

Messaging, Positioning
The Protein Market
Health Markets, Priorities
1234 Watch & Work On…..
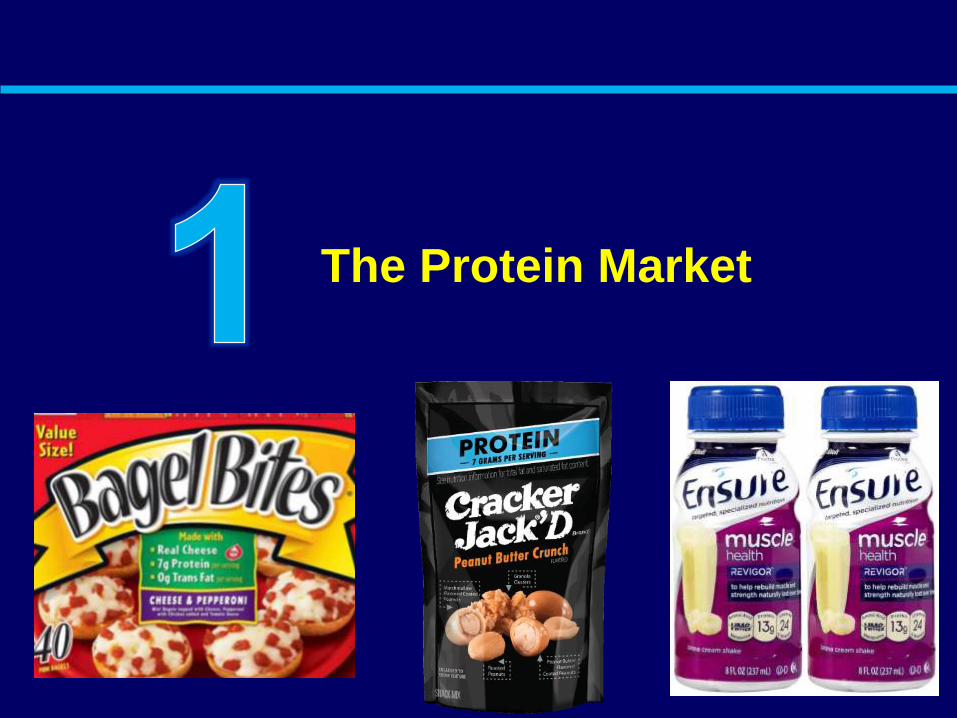
The Protein Market

Protein Among Largest Healthy Ingredient Market Opportunities, Muscle Gen II
Sloan Trends, Inc. 2016
0
200000
400000
600000
800000
1000000
1200000
02 03 04 05 06 07 08 09 10 11 12 13 14 15
Protein Muscle Strength
0
20000
40000
60000
80000
100000
120000
140000
160000
02 03 04 05 06 07 08 09 10 11 12 13 14 15
Protein Muscle Strength
Commercialization – Level 3
Commercialization – Mega Phase
4
Medical/Nutrition Consumer
Muscle & Strength Ready Markets

Top 10 Best-Selling New F/B 2015
Cheerios protein: 11 g protein with milk
IRI, New Products Pacesetter Report, 4/2016
fairlife: nutrient-rich ultra-filtered milk, 50% more protein,
30% more calcium, half sugars typically in milk, lactose free

Rising Stars 2016-17
Up & Coming Predicted
Next Best-sellers
IRI, 2016 Pacesetter Report, Times & Trends, 4/2016
Good Source
of Protein
7 g. of Protein
9 g. of Protein

~ Half Adults Trying to Get More Protein
Protein-Presence Claims $15.3B ’15, +7%
IFIC Food & Health Survey, 2015; Packaged Facts, Food Formulation & Ingredient Trends: Plant Protein, 2/2016; Food Mktg. Institute, U.S. Grocery
Shopper Trends, 2015; Nielsen, Y/E 11/28/15 Nielsen Perishable Group FreshFacts
Believe Consuming higher Amount
Protein is Esp Beneficial for:
Interest Highest Age 25-39, 18-24
#2, Falls with Age > 39
Hispanics, Asians & Blacks >
Likely Seek Out Protein F/B,
Higher Income
% Make Effort to Consumer More 2015
39% Protein Very Important
Food Label, +5% vs. 2011
47% Households with Kids Make
Effort Get More Protein

Boomers Turn 70, > Half U.S. Age 50+ 2017
Hispanics Age 50+ Up 63% by 2021
Manage 9.5 Conditions:
Treat 3.7, Prevent 5.8
U.S. Census; HealthFocus, 2015; Hartman Group, Health & Wellness, 2015; Packaged Facts, Supplement in the U.S. 2014
50+ Very/Ext Concerned
65+ #1 Supplements, +12% 2020

Protein Falls Out Top 10 Bev Trends/Need
States Per Top Beverages Execs 2016
Beverage Industry ‘s 2016 New Product Development Survey; IRI 2016 New Product Pacesetter Report
2015: High Protein #1 in 2015, Fell to #18 Vit/ Min Fortified
#10 & Probiotic/Prebiotic #6 Fell out of Top 10
Country of Origin #6 Ethnic #8 Cognitive #10 Came In
12% Look for
New Bev
with Protein
2016

Serve Non- Meat/Poultry/Seafood Protein Alternatives Occasionally for Dinner
Frequency of Serving
Meat/Poultry
For Dinner
Falls to 3.7 Times
Per Week
44% Serve
Meatless Protein
Meals
1 - 3 X/week
7% 4 or More
Food Marketing Institute, Power of Meat, 2015/16; 2014 Gallup Study of Nutrition Knowledge & Consumption; NRA What’s Hot Chef Survey, 2016
More Plant Based Eating: 76% HH Serve
Meatless Alternatives Dinner, Soy 14%
17% Some Effort Follow Vegetarian Diet
8% Vegetarian, 2% Vegan, 8% Tried 2015
36% Eating Less Meat/Poultry
Meatless/Vegetarian #8 Main Dish Hot
Culinary Trend 2016, Vegan #9
Vegetarian #3 for Appetizers
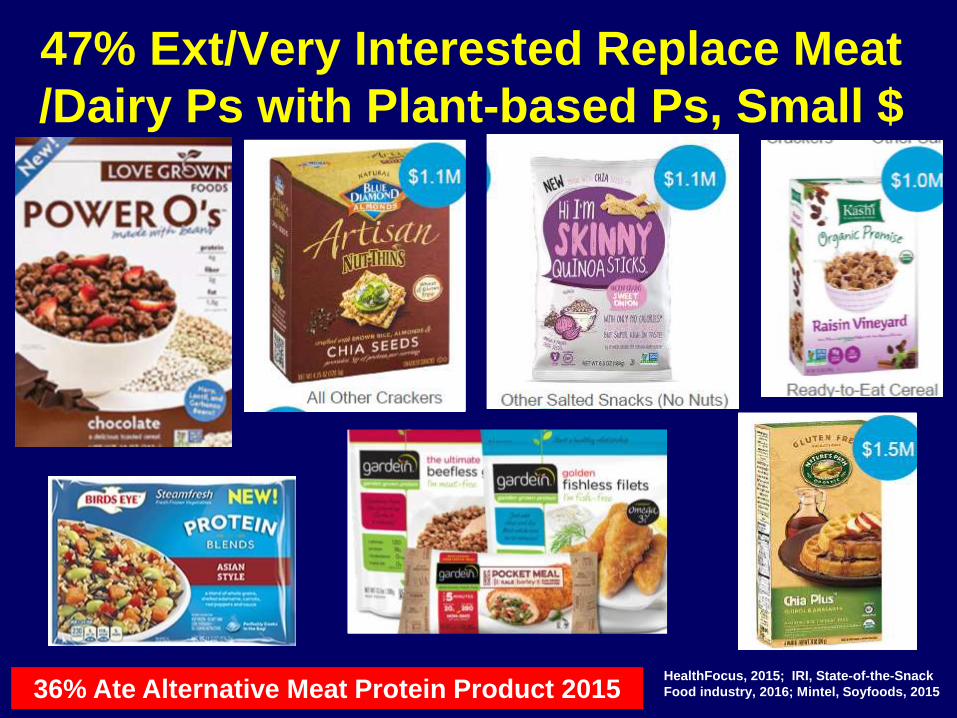
47% Ext/Very Interested Replace Meat
/Dairy Ps with Plant-based Ps, Small $
HealthFocus, 2015; IRI, State-of-the-Snack
Food industry, 2016; Mintel, Soyfoods, 2015 36% Ate Alternative Meat Protein Product 2015

$2.7 Billion Opportunity in Plant-based
Dairy Foods Beyond Beverages
Household Penetration of Plant-based Beverages has Doubled in 5 Years to
more than 30% Nielsen, 2/ 2015; Technomic Commercial Foodservice, 2015
Non-Dairy Milk Drinks Doubled
Last 5 Years to More than 30%
More Plant-Based Smoothies F.S.

Nutrition Business Journal, 2014; IFIC, Food & Nhealth Survey, 2014; Euromonitor
Preference Fortified Food vs.
Naturally-Sourced Nutrition
Global Retail Growth
Whole Foods Movement - Prefer to Get Nutrients/Health
Benefits Naturally from Food; Whole Foods Lifestyle
Consumer
Lifestyles1

Prefer Get Most Ingredients Naturally
Hartman Group, Health & Wellness, 2015

64% Think Fortification Nutrients Not as Healthy
Some Major Marketers Dropping Fortification, In the
Name of Natural Nutrition, Clean Label, etc.
1. HealthFocus, 2015; 2. Hartman Group, Health & Wellness, 2015; 3. Pkg. Facts, Functional Food Trends, 2015
Importance of Nutrition Sources
Not New Hasn’t Changed 28 Years
64% adults regularly looked
for F/B with added Vit/min in 2015;
down 9% over past 5 years2

U.S. Dietary Guidelines: 11 Under
Consumed Nutrients, Irresponsible?
Underconsumed
Iron
– for adolescent
and
premenopausal
women
Vitamin A
Vitamin D
Folate
Vitamin C
Calcium
Magnesium
Choline
Potassium
Fiber
OverconsumedSodium
Saturated Fat
Based on Estimated Average Intake
Based on Adequate Intake Requirements
Pose Public
Health Risk:
Vitamin D
Calcium
Potassium
Fiber
Iron (for
premenopausal women)
2015 Dietary Guidelines Advisory Committee Report, USDA/DHHS

Clean Behaviors Escalate, Future Strong
Food Marketing Institute, U.S. Grocery Shopper Trends, 2015; IFIC, Food & Health Survey, 2015; Mintel, Free-from Food Trends, 5/2015
I Look for in
Food &
Beverages
Purchase of Clean
Foods & Worry
Over Harmful
Ingredients Skews
to Younger Adults
Generation by Age
18 –
24
70+
Generation by Age
Older

Evolving Values Impact 51% Food Purchases
EV = Nutrient Content, Free-From, Natural, Non-GMO,
Less Processed/Preservatives/Artificial Ingredients
Traditional Drivers: 49%
_______________
__________
___________________________
_________________________
Deloitte, FMI, GMA, Capitalizing on the Shifting Consumer
Food Value Equation, 2015
_________ 51% Evolving
Value Drivers

Messaging & Positioning
It has to work!

Don’t Know How Much Protein They
Need, What’s Your Protein #
Caution Long Term: Protein Industry Must Avoid Potential Issue of Over-
Promotion and Over-Consumption (but these numbers are not excessive)

Moderate Protein Intake 25-30g, 3X/Day
Optimizes Weight /Muscle
Protein Breakfast Super Star Status
Current US Diet Only 10 g. Protein at Breakfast;
Typical Breakfast Foods Toast, Cereals, Low in Protein
Total Protein
90 g
Cata
bo
lism
An
ab
oli
sm
10 g
maximum rate of protein synthesis
15 g 65 g
A skewed daily protein distribution fails
to maximize potential for muscle growth
Recommend Moderate Protein Intake Thru Day
~ 1.3 g/kg/day
Paddon-Jones and Rasmussen 2009
Current U.S. Protein Consumption Pattern

72% Agree Distributing Protein Intake
Across Day Is Most Effective, 30% Strongly
IFIC Food & Health Survey, 2015; Nielsen FreshFacts 11./2015
Protein Snacks $19B

Amount, Completeness: Potential Issues
• Not less than 20 g/meal to support positive muscle balance with muscle
synthesis; 20-30 g is ideal.3,4
• Intake of 1.5 g/kg/day (120-200g/day) ideal for weight reduction: increased
thermogenesis, increase body fat loss, spares muscle from energy production,
decreases insulin and regulates glucose.2
• 25% total calories idea support intense exercise, e.g., 176 g/day for 80 kg man
• Include all essential amino acids; complete

0
2000
4000
6000
8000
10000
12000
14000
16000
18000
00 01 02 03 04 05 06 07 08 09 10 11 12 13 14 15
Amino acids
Consumer
Commercialization – Level 1
Commercialization – Level 2
Commercialization – Level 3
Commercialization – Mega Phase
Spike in the TrendSense™ Curve
Due to Report on Macronutrients
By the Institute of Medicine which
Assigned RDIs for 9 Amino Acids
Requirement - mg. per kg. of body weight
Infant Child Adults
Amino acid3 - 6
mo.
10 - 12
yr.
Histidine 33Not
known
not
known
Isoleucine 80 28 12
Leucine 128 42 16
Lysine 97 44 12
S-containing amino
acids45 22 10
Aromatic amino
acids132 22 16
Threonine 63 28 8
Tryptophan 19 4 3
Valine 89 25 14
Leucine: Stimulates Muscle Synthesis
Awareness Aminos 57% 2014
2014 Gallup Study of Dietary Supplements; Sloan Trends, 2016

IRi, State of Snacking, 4/2016; Hartman Compass Database, 2014; Technomic, 2015, Consumer Snacking Trend Report
New Early Morning Snacking Occasion
49% Meal Occasions are SnacksSnacking: Early AM Top Growth
55% HH at Least 1 Brown
Bagger, 20% Bag BreakfastHealthy Snacks +3.5, Indulgent +3.2
+5% 2015-2016

Breakfast Bakery Low Protein; Where
High Protein Breads, Muffins, Bagels?
NRA, What’s Hot Survey, 2016; Bernstein Analysis Wall St, J. Y/E July, 2014; IFIC, 2013 Breakfast Study
#1 Hot Culinary Breakfast Trend 2016 Ethnic Breakfast Foods & Ingredients
40% Eat Breakfast
Pastry
36% Taster Pastries
30% Muffins
Carbs Protein
Motivators Eat A.M. - Energy, Mental, Weight, Feel Full

Nutrients Tops Wellness Goal in AM
Hartman, Compass Database 2014; FMI, U.S. Grocery Shopper Trends, 2014.
Wellness Relevant Dietary Goals Throughout the Day

Nutrition Bars Far Outpace Sales of
Cereal/Snack Bars – Fortification?
28Packaged Facts, Nutrition & Cereal Bars, 2015

Health Markets
Priorities

Consumer Health Linkages for Protein
• 87% builds muscle
• 81% maintain muscle with aging
• 77% aid exercise recovery
• 73% helps feel full
• 68% helps increase lean body mass
• 64% aids weight loss
• 64% energy throughout the day
• 62% helps maintain energy
• 59% suppress hunger between meals
• 38% soy protein aids weight loss
• 33% boosts metabolism
• 32% hair, skin and nails
Consumer Links Protein
IFIC, Food & Health Survey, 2015; Mintel, Performance Foods U.S., 2014; HealthFocus, 2015; 2014 Gallup Study Nutrition Knowledge /Consumption
Body Toning - Sarcopenia – Immunity
Satiety – Long-Lasting Energy, etc.
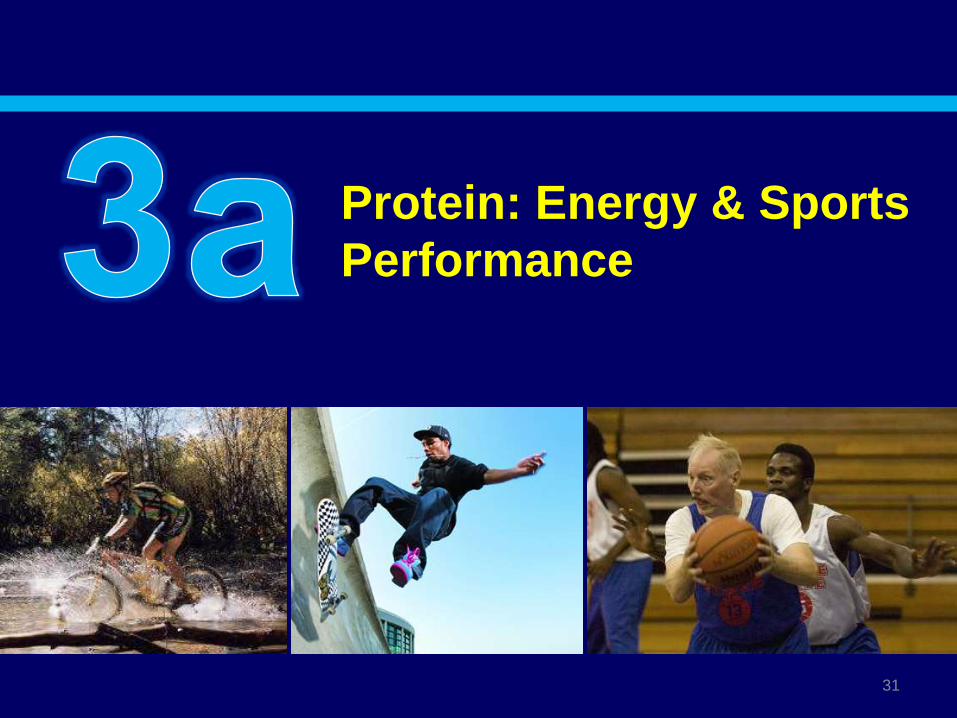
Protein: Energy & Sports
Performance
31

HealthFocus, 2015
Energy
Is Top
Consumer
Target
Consumers Say
“Very Interested In/
Affected By”
Global: #1 HealthConcern Age 18-395th 40-49, 9th 50+

Increasing Interest Issues Affect Every
Day Performance; Women, Millennials
Beverage Marketing Corp 3/29/16; Shots - IRI, Y/E 6/14/15; Packaged Facts, 2015 Functional Foods Rpt; NBJ, 3/2015; Mintel Performance Foods, 2015; IRI, State-of-the-Snack Food Industry 4/2016; IRI
Why Use Protein Bev4 All
Gives me energy50
Physical Performance 49
Curb hunger/feel full 48
Exercise recovery 46
1 serving, balanced nutr. 45
Weight Loss Aid 39
U.S. Energy Drink Sales → 2017
Growth 6% → 2017
Energy Shots Fall -2.8% to $1.2B
60% Seek Snacks that Deliver an Energy Boost

Energy New Concern 50+
Drive Incremental Sales of
Bars, Energy/Sports Drinks
Proj. Annual Growth Fx Food
Categories 2014-16
Mintel, Consumer, 11/2015; IRI Aging in America, 2015, HealthFocus, 2015
Cognition/Attention Span
New Global Sports/Energy
Bev Positioning
Global New Sports/Energy Drinks
Brain/Nervous System Claim
Energy Benefits Most Interested in from F/B
54% 50-64,
46% 65+ Very/
Extremely
Concerned Lack
Of Energy
Women > Men

35
Top 3 Benefits Sought from SNP
KEY BENEFITS SOUGHT
Dietary
Supplement
Sports
Nutrition
Products
Energy boost (49%)
Weight management (48%)
Build lean muscle (37%)
Replace nutrients lost during
exercise (37%)
$31B Sports Nutrition Sector Mainstreams;
More Aggressive Claims; Hormel, Post Enter
Market Mainstreams, Splits High
Performance Athletes vs:
Recreational Sports, Gym Workout
Weekend Warriors
Women: Fitness/Weight
Boomers Aging Well
Moms Kids Nutrition Support
Euromonitor, 2014; TABS 2015 Sports Nutrition Survey; Nutrition Business Journal, 4/2014; Gallup 2014 Study of Sports Nutrition
Sports Nutrition Predicted to be
Top Performing Healthcare
Sector Globally

More Men
&
Women
Exercise
Regularly
Pkg. Facts, Weight Report, 2014; NSGA, 2016; NBJ, 7/2105
Exercise Walking
Exercising with Equip.
Aerobic Exercising
Workout at Club
Running/Jogging
58.7
29.4
26.9
18.8
16.9
Age 50+
Increase
Last 5 Years
Engaged in Regular Exercise, 2004 vs. 2014
Workout at gym
Aerobic Exercising
Exercise Walking
Running/Jogging
+14%
+46%
+25%
+87%
Women in
millions

Exercise 1st Choice Some Health
Solutions; Multi-Functional Products
Hartman Group, Health & Wellness, 2015

Sports Nutrition Powders Top $4.4B 2015,
Project Growth of 8% to 2019
Nutrition Business Journal, 7/2015
Sports Nutrition Powders
Sales & Growth 2017
Sports Nutrition Powders
By Protein Source 2014

Hard Core Sports Drinks $599M, +17% to
$806 2019; Pills $239M, +6.1% to $324 2019
Nutrition Business Journal,7/2015
Hardcore Sports Nutrition Drinks
Sales & Growth 2017
Sports Nutrition Pill Supplement
Growth to 2017

37% Are Sports Nutrition Buyers
Protein #1 Sports Supplement 2015
TABS Sports Supplement Survey, 201 Supplement Survey, 2015
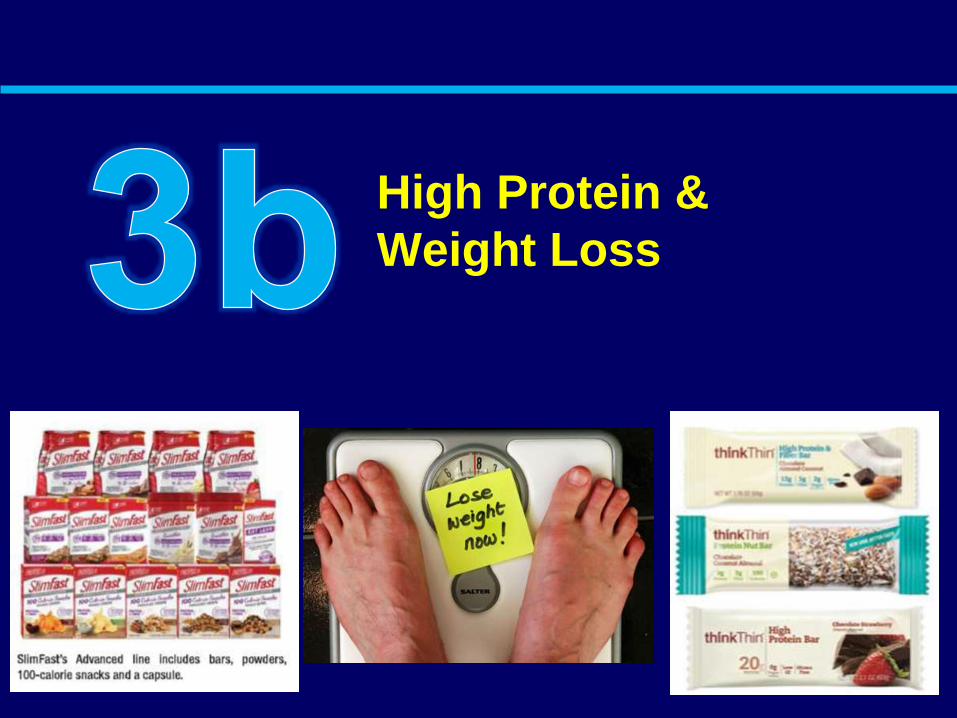
High Protein &
Weight Loss

0
5000
10000
15000
20000
25000
30000
35000
40000
45000
02 03 04 05 06 07 08 09 10 11 12 13 14 15
YearProtein & Weight
Medical Threshold
Medical/Nutrition
0
500
1000
1500
2000
2500
3000
3500
02 03 04 05 06 07 08 09 10 11 12 13 14 15
Year
Protein & Weight Low Carb
Consumer
Commercialization – Level 1
Popularization
TrendSense™ Predictive Model: Protein & Weight (Not Kids)
Commercialization – Level 2
0
200
400
600
800
1000
1200
02 03 04 05 06 07 08 09 10 11 12 13 14 15
Low Carb
Medical Threshold
Sloan trends Inc. 2016

Mass
Channels,
Weight Loss
Nutritional
Meal
Replacements
$6.0B, 13.6%
IRI Y/E 11/ 2/9/15, total U.S. multi-outlet (supermarkets, drug stores, mass market retailers, military commissaries and select club and dollar retail
chains)
IRI Data MULO
Y/E 11/22/15

Slim Fast, Premier Protein, Top 20
Brands Highest Incremental Sales
IRI for the 52 weeks ended Nov. 29, 2015, across total U.S. multi-outlet (supermarkets, drug stores, mass market retailers, military commissaries
and select club and dollar retail chains)

Ensure Pedia Sure Weight, Atkins Bars
Top Diet, Meal Rplc Bars, Energy Shots
IRI for the 52 weeks ended Nov. 29, 2015, across total U.S. multi-outlet (supermarkets, drug stores, mass market retailers, military commissaries
and select club and dollar retail chains); Bars – IRI, Jan. 2016, Taking Stock of CPG Past & Future
Top 5
Intrinsic
Value
Health Bars
MULO

Men = 69% Growth Weight Sector 5 Years;
Men 18-34 Drive Weight Maintenance +34%
Overweight
Men 80M, 73%
Women 75M, 64%
Obese
Men 37M, 34%
Women 42M 36%
Women Drive New Very
High Weight Loss > 30 lbs.
¼ Women 35-54 20-40 lbs.
%Growth Watching Diet for Weight
Weight Goals All
I would like to lose 5-9 lbs 15
I would like to lose 10-19 lbs 23
I would like to lose 20-49 lbs 19
I would like to lose 50 or more lbs 13
Packaged Facts, Weight Management, U.S. Consumer Mindsets, 8/2015; Am. Heart Assn. Stats, 2015
Men Drive Lose Weight
for Health/Medical, Heart

Women 50-64 #1 Try to Lose Weight, 65+ to
Maintain, Women 55+ #3 Heavy Bar Users
Heavy User: 5+ Nutrition Bars/Month
FMI, U.S. Grocery Shopper Trends, 2015; Packaged Facts, IRI, NPD/CREST, Produce for Better Health, Gallup

0
500
1000
1500
2000
2500
3000
3500
4000
4500
02 03 04 05 06 07 08 09 10 11 12 13 14 15
Year
Protein & Satiety Satiety Supress/Curb Hunger
Medical Threshold
Medical/Nutrition
0
200
400
600
800
1000
1200
1400
1600
02 03 04 05 06 07 08 09 10 11 12 13 14 15
Year
Protein & Satiety Satiety Supress/Curb Hunger
Consumer
Commercialization – Level 1
Popularization
39% Very Interested F/B Feel Full Longer; 31% Supplements; Worry What’s Altered
TrendSense™
Sloan Trend, 2016; HealthFocus, 2015

0
1000
2000
3000
4000
5000
6000
02 03 04 05 06 07 08 09 10 11 12 13 14 15
Year
Body Fat Body Composition Increase Muscle Tone
Muscle Tone
Consumer
Commercialization – Level 1
Popularization
Commercialization – Level 2
Commercialization – Level 3
Muscle Tone/Health #11 Health Concern
Timing Good: Market Muscle Tone
Loss of Lean Body
Mass Begins in Your 30s
Sloan Trends, Inc. 2016; L'Oréal Image Survey, 2014
• 73% women body shape a 'major concern'
• 20-30% of women considered plastic surgery

Protein: Mobility and
Healthy Aging &
Sarcopenia

Mobility Platform Interest: Very ConcernedUS Canada China Mexico Australia Brazil
Joint 44% 36% 50% 50% 40% 63%
Bone 51% 37% 53% 25% 35% 68%
Mobility/Age 62% 55% 53% 35% 35% 65%
Muscle 44% 39% 35% 36% 52% 54%
HealthFocus International, ;2015; World Health Organization, 2013
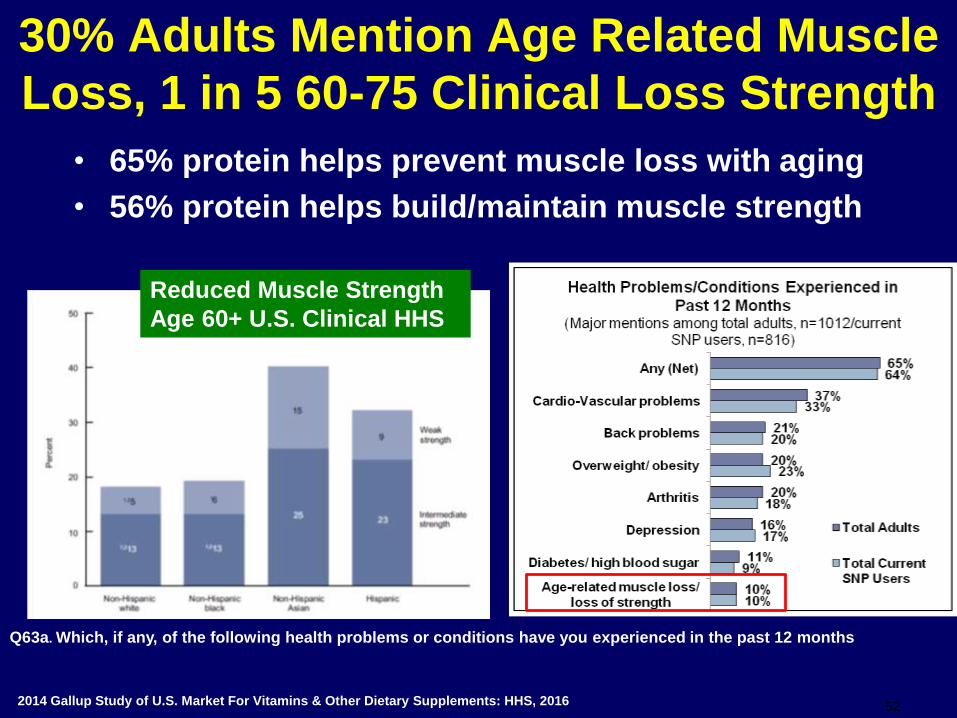
52
Q63a. Which, if any, of the following health problems or conditions have you experienced in the past 12 months
30% Adults Mention Age Related Muscle
Loss, 1 in 5 60-75 Clinical Loss Strength
2014 Gallup Study of U.S. Market For Vitamins & Other Dietary Supplements: HHS, 2016
• 65% protein helps prevent muscle loss with aging
• 56% protein helps build/maintain muscle strength
Reduced Muscle Strength
Age 60+ U.S. Clinical HHS

Sarcopenia/Mobility
Sarcopenia: Prevalent Sr. condition – age-related loss of loss of lean body mass, strength & function
Dynapenia: Age related loss of strength

54
Sarcopenia:~ 44% Women Post Menopause
Muscle Strength
• Relatively stable to age 50
• 15% loss per decade age 50-70; age 70 – 80, 30% loss
• Men age 24-80 lose 40% total skeletal muscle mass; 10% 24-50
• Postural muscle, quadriceps & soleus show age related atrophy
• Weakness back muscles disk herniation, chronic low back pain
• Upper body strength accidents, lifting, pushing, pulling
• US: 45% of 65+
• Japan: 20M sarcopenia patients
• Onset age 40, big repercussions ~ 75
• 20’s: muscle up to 60% fat-free mass
• 70’s muscle < 40%
• Loss: 1 - 2% / yr > 50+
• ~ 50% or more by age 60
Janssen I, J American Geriatrics Society 52;1:80-85, 2004.

Aligning Protein & Muscle & Joint Support
Very Big Idea
Dairy Management Inc. Consumer Protein Tracker Update, 2013
Benefits Associated with Protein by Age
Biggest priority as
you age?
Responses
Stay physically strong &
healthy
58%
Keeping my mind sharp 25%
Look good 11%
Live as long as possible 4%
Healthy muscle to support and aid in proper alignment of bones and joints is an important
– and much overlooked - factor in joint health and in current product offerings. aligning
joints with muscle and protein is a very big idea.

Help Protect Joint with Strong
Muscles
Muscle Recovery and Sport Injury Prevention

Protein & Kids

Kid-Specific F/B to $41B by 2018, 1/3
Moms Strong Effort More Protein Kids
Packaged Facts, Kids Food and Beverage Market, 4/2016; HealthFocus, 2015, Acad. Nutr. & Dietetics Sports Practice Survey, 2014

Protein/Muscle and Children
1/3 Moms Trying Increase Kids’ Protein Level
Sloan Trends Inc. 2016; 2014 Gallup Study of Nutrient Knowledge & Composition
0
5000
10000
15000
20000
25000
30000
02 03 04 05 06 07 08 09 10 11 12 13 14 15
Year
Children & Sports Protein & Children
Medical Threshold
Medical/Nutrition
0
1000
2000
3000
4000
5000
6000
7000
8000
9000
02 03 04 05 06 07 08 09 10 11 12 13 14 15
YearChildren & Sports Protein & Children
Consumer
Commercialization – Level 2
Commercialization – Level 1
Commercialization – Level 3

Youth Sports in America, Women’s Sports Foundation, 2014; Am.
Acad. Pediatrics; Dietetic Assn. Sports Nutrition Practice Study, 2013
72% Boys, 63% Girls Moderate to Highly
Involved in AthleticsChildren’s Athletic
Participation
> 30 Million Participate In
Organized Sports in the US
Each Year
Parents Aware: Protein/Sports
Performance and Muscle Connection
60% parents believe child should eat
lots of high-protein foods to increase
muscle size
37% said a high-protein diet is best for
fueling a child's athletic performance

Immunity, Beauty
Sleep

Immunity Strong “Sleeper” Linkage Protein
27% Unaided, 54% Surveyed
Packaged Facts, Functional Foods Repot, 2015; 2014 Gallup Study of Dietary Supplements

1/3 Adults Believe Protein Promotes
Hair & Nails, Skin Health, Tissue
RepairTotal Adults
%
Health Benefits (NET) 78
Promotes overall health 54
Strengthens immunity 33
Promotes bone health 32
Promotes healthy hair and nails 32
Promotes skin health and tissue repair 29
Helps control blood sugar levels/reduces diabetes risk 22
Lowers cholesterol 18
Build Muscle/Improve Athletic Performance (NET) 61
Helps build/maintain muscle strength 56
Helps improve athletic performance 29
Weight Loss/Satiety (NET) 59
Keeps you feeling full longer/suppresses appetite 41
Boosts metabolism and aids in fat burning 33
Increases energy level 51
None/Don’t know 11
1 in 5 Blood Sugar Control, Reduce Diabetes Risk
On Average
Consumers
Associate
Health
Benefits
with
Protein
MSI, The 2014 Gallup Study of Protein

New Evidence Protein
Aids Sleep: Big Idea
Athletes Replenish Muscle While Sleeping
Malaysia
Condition Specific
Supplement Sales 2015
Nutrition Business Journal Datasheets, 2015

41% Aware of FDA Heart Healthy
Claim for Soy 2015
United Soybean Board, 2015

To Watch & Work
On…

67
2014 Gallup Study of Nutrient Knowledge & Consumption; Nutrition Business J., 2015: Technomic, Healthy Eating
Consumer Trend Report, 2014; NRA, What’s Hot Chef Survey for 2015? 10/2014.
30% Making a Strong Effort Eat More
Minimally Processed Foods, +8% vs. 2010Consumer
LifestylesFood that is ____ is healthy…
Hot Culinary Themes 2016Proj. Annual Fresh Food Eatings1
+20%
2003-13

Those Buying More Fresh,
Minimally Processed Food are
the Same Group Who Buy
Fortified Foods, Want Added
Nutrition & Nutrition Claims
on Fresh/Refrig. Foods
Link Health Benefit Fresh Meat/Poultry1
1. Food Mktg. Inst., Power of Meat, 2015; 2014 Gallup Study of Nutrition Knowledge & Consumption
Fortified Refrigerated Foods

Pet Food: Top 10 Largest CPG Categories
More Households have Dogs > Kids, Yeah!
Type of Pet½ Pop. > Age 50 2019
Packaged Facts, U.S. Pet Market Outlook, 2015-16,; Packaged Facts, Pet Treats & Chews in the U.S. 6/2015; IRI Taking Stock of CPG, 1/2016
Proj. U.S. Pet Food Retail Channel Sales $29B → $35B by 2019$108M Yr-One
51% Dog Parents, 44% Cat Buy
Specialty Nutrition Formula
36g protein→

Hispanics Are At Greater Risk for Some
Chronic Disease
Hispanics
Total Population
AGE
18-34 Years
35-49 Years
50+ Years
Multi-Sponsor Surveys’ 2011 Gallup Study of Hispanic Nutrition And Supplement Use, Fielded March 2012; U.S. Census Bureau, 2010
10 Yrs. Younger < Gen. Pop.
Men < 35 1 in 5 Use Sports
Supplements
Suffer disproportionately from:
• High cholesterol #1 Mex. Am. Men
• Arthritis/joint pain, severe
• Diabetes, stroke
• Liver health issues
• Cold/flu
#1 buy nutrition products for kids
#1 Sports & Energy Drinks
#2 Meal Replacement Bev > 65+
#1 Index Baby Food
Beauty, skin, appearance issues
Sleep & mood key lifestyle issues
Botanicals, natural remedies

Sloan Trends, Inc. 20+ Years of Identifying
Emerging Food/Beverage
Opportunities
Dr. A. Elizabeth
Sloan
Trends, Markets,
Predictions
760-822-4321 (cell)
Dr. Catherine
Adams Hutt
Science, Safety,
Regulatory
630-605-3022 (cell)
A Holistic Approach
760-741-9611
www.sloantrend.com
Sally Reynolds
Market Research &
Strategy
870-926-9290 (cell)