Embed Size (px)
Citation preview

The Next Generation of Thai IndustryThe Next Generation of Thai Industry
Mr. Arkhom Termpittayapaisith Secretary General
Office of the National Economic and Social Development Board (NESDB)
December 2013, Thailand
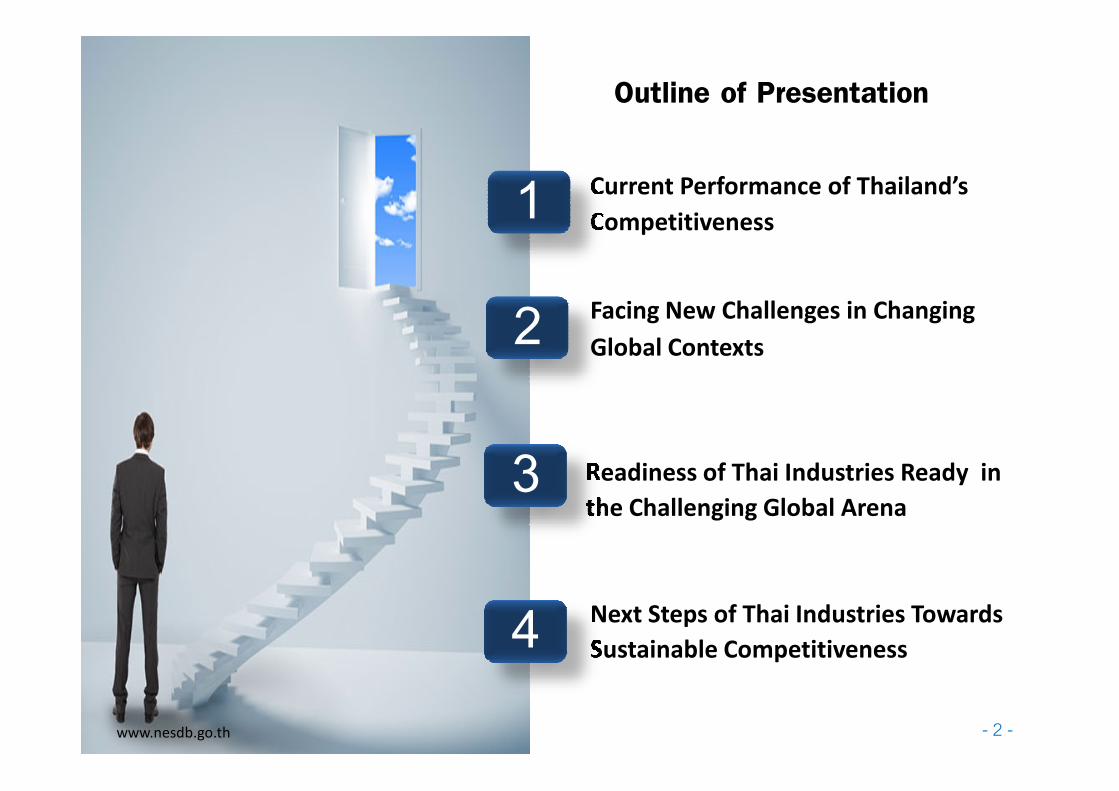
Outline of Presentation
2 Facing New Challenges in Changing
Global Contexts
Current Performance of Thailand’s
Competitiveness1
Readiness of Thai Industries Ready in
the Challenging Global Arena
www.nesdb.go.th - 2 -
Next Steps of Thai Industries Towards
Sustainable Competitiveness
3
4

Outline of Presentation
2 Facing New Challenges in Changing
Global Contexts
Current Performance of Thailand’s
Competitiveness1
Readiness of Thai Industries Ready in
the Challenging Global Arena
www.nesdb.go.th - 3 -
Next Steps of Thai Industries Towards
Sustainable Competitiveness
3
4

Thailand�s economic performance, in comparison with some selected countries
GDP Growth (Q2/ 2013) of Thailand and selected countries
ASEAN BRIC Innovation-led economy
GDP Growth: %
Source : World Bank and and National Economic and Social Development Board
• Thailand’s GDP growth in 2012 ranked the 31st in the world and the 2nd in Asia. Though the GDP
growth in Q2/2013 recorded only 2.8%; declining from 5.4% in Q1/2013, it remained higher than
those of Russia, Japan, and the U.S.
• It is projected that in 2012 the GDP growth rate of ASEAN countries will increase, higher than other
regions, and the Philippines’s growth will reach 7.5%, at the similar level of China’s, representing the
highest rank among Southeast Asian countries.
2.8 4.3 5.8 7.5 3.3 1.2 4.4 7.5 0.9 1.6 3.8
ThaiMalaysia
IndonesiaPhilippines
BrazilRussia
IndiaChina
JapanUSA
Singapore
www.nesdb.go.th - 4 -

2020 20201818
15151212 1212
19191717 1818
28282626 2525
3232 3333
2727 2626 2626 27273030
27273030
3232 3333
2828 2828
34343636
3838 3939 3838 3737
0
5
10
15
20
25
30
35
40
Competitiveness and Ease of doing business of Thailand (2003-2013)
Ham
bu
rge
r C
risi
s
cou
p d
'éta
t
Eu
ro C
risi
s
Flo
od
3838 3939 3838 373740
45
2003 2004 2005 2006 2007 2008 2009 2010 2011 2012 2013
� Thailand’s competitiveness performance has been in the middle tier.
� Over the past 10 years Thailand’s competitiveness ranking remained unchanged, or even
dropped slightly.
� Among ASEAN countries, Thailand’s competitiveness was in the 3rd rank, following Singapore
and Malaysia and advancing only Indonesia and the Philippines.
Source : Doing Business report (EoDB) by world bank [data analysis since 2005], Global Competitiveness Report by World
Economic Forum, and World Competitiveness Yearbook by IMD
Ham
bu
rge
r C
risi
s
cou
p d
'éta
t
Eu
ro C
risi
s
Flo
od
www.nesdb.go.th - 5 -
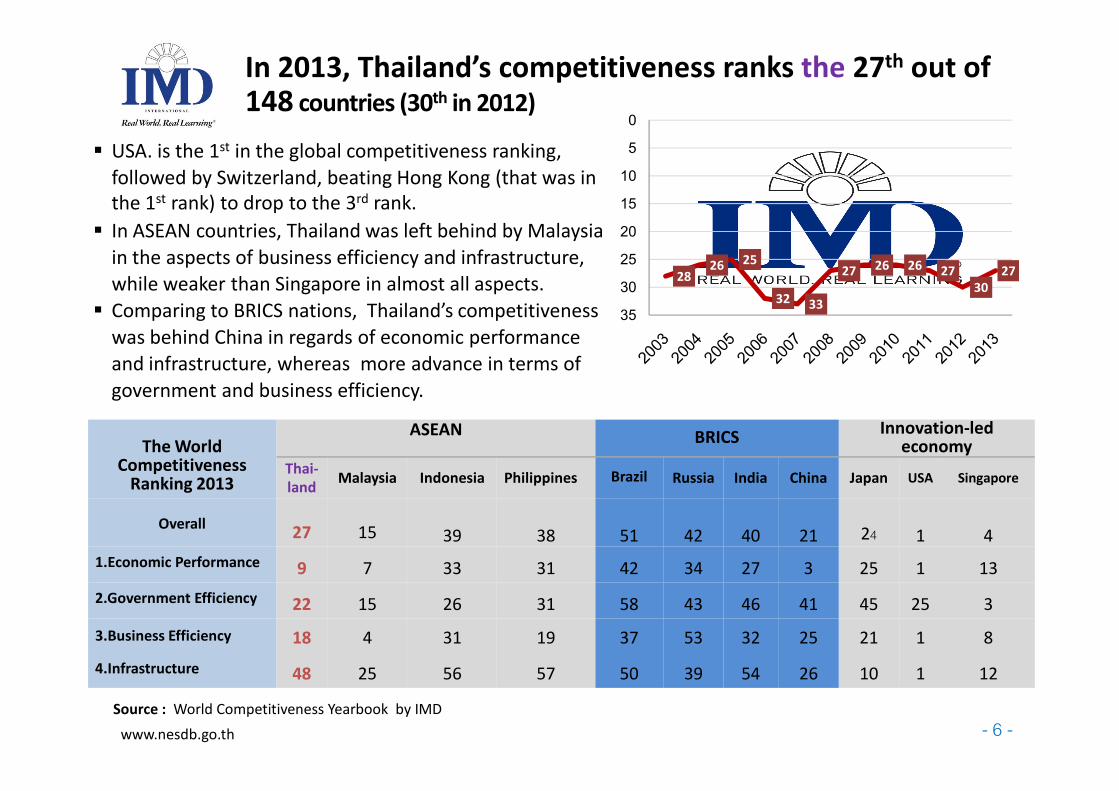
In 2013, Thailand’s competitiveness ranks the 27th out of 148 countries (30th in 2012)
� USA. is the 1st in the global competitiveness ranking,
followed by Switzerland, beating Hong Kong (that was in
the 1st rank) to drop to the 3rd rank.
� In ASEAN countries, Thailand was left behind by Malaysia
in the aspects of business efficiency and infrastructure,
while weaker than Singapore in almost all aspects.
� Comparing to BRICS nations, Thailand’s competitiveness
was behind China in regards of economic performance
and infrastructure, whereas more advance in terms of
government and business efficiency.
2826 25
32 33
27 26 26 27
30
27
0
5
10
15
20
25
30
35
The World Competitiveness
Ranking 2013
ASEAN BRICSInnovation-led
economy
Thai-
landMalaysia Indonesia Philippines Brazil Russia India China Japan USA Singapore
Overall27 15 39 38 51 42 40 21 24 1 4
1.Economic Performance 9 7 33 31 42 34 27 3 25 1 13
2.Government Efficiency 22 15 26 31 58 43 46 41 45 25 3
3.Business Efficiency 18 4 31 19 37 53 32 25 21 1 8
4.Infrastructure 48 25 56 57 50 39 54 26 10 1 12
government and business efficiency.
Source : World Competitiveness Yearbook by IMD
www.nesdb.go.th - 6 -
3434 3636
2828 2828
3434 3636 3838 3939 3838 3737
0
10
20
30
40
50
60
70
80
90
100
2004 2005 2006 2007 2008 2009 2010 2011 2012 2013
Thailand
Malaysia
Indonesia
Philippines
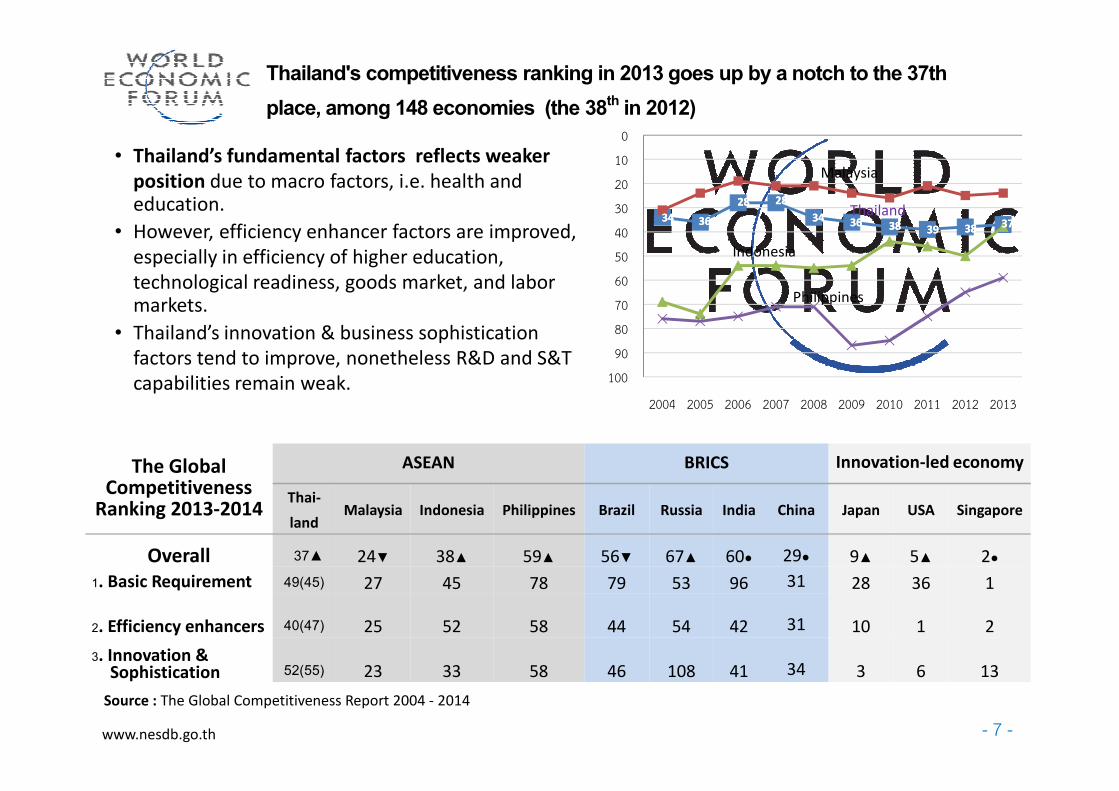
• Thailand’s fundamental factors reflects weaker
position due to macro factors, i.e. health and education.
• However, efficiency enhancer factors are improved,
especially in efficiency of higher education,
technological readiness, goods market, and labor markets.
• Thailand’s innovation & business sophistication
factors tend to improve, nonetheless R&D and S&T
capabilities remain weak.
Thailand's competitiveness ranking in 2013 goes up by a notch to the 37th
place, among 148 economies (the 38th in 2012)
The Global Competitiveness
Ranking 2013-2014
ASEAN BRICS Innovation-led economy
Thai-
landMalaysia Indonesia Philippines Brazil Russia India China Japan USA Singapore
Overall 37▲ 24▼ 38▲ 59▲ 56▼ 67▲ 60● 29● 9▲ 5▲ 2●
1. Basic Requirement 49(45) 27 45 78 79 53 96 31 28 36 1
2. Efficiency enhancers 40(47) 25 52 58 44 54 42 31 10 1 2
3. Innovation & Sophistication 52(55) 23 33 58 46 108 41 34 3 6 13
2004 2005 2006 2007 2008 2009 2010 2011 2012 2013
Source : The Global Competitiveness Report 2004 - 2014
www.nesdb.go.th - 7 -

Ease of Doing Business
Ranking, 2013
Investor Protection
TradingAcross
Borders
Property Registration
Access toCredit
Start-upBusiness
Tax Payment
Start-upBusiness
Singapore 1● 2● 1 36▼ 12▼ 4● 5▼ 2●
Thailand 18▼ 13● 20▼ 26▲ 70▼ 85▼ 96▲ 58▼Malaysia 12▲ 4 11▲ 33 1 54▼ 15▲ 49▼
Brunei 79 117 40 115 129 135 22 46
Vietnam 99 169 74 48 40 108 138 149
128 49 37 98 129 166 131 148
In 2013 Thailand was ranked the 18th in the Ease of Doing Business
Ranking, dropping from the 17th in 2012
AS
EA
N
Indonesia 128 49 37 98 129 166 131 148
Philippines 138 128 53 122 129 161 143 165
Cambodia 133 82 118 115 53 175 66 152
Laos 163 184 160 74 167 81 126 185
Myanmar n.a. n.a. n.a. n.a. n.a. n.a. n.a. n.a.
New Zealand 3 1 25 2 4 1 21 13
South Korea 8 49 3 75 12 24 30 14
Australia 10 70 44 37 4 2 48 18
Japan 24▼ 19▼ 19▼ 64▼ 23▲ 114▼ 127▼ 1●
China 91● 100▼ 68▼ 44▼ 70▼ 151● 122● 82▼
India 132 49 127 94 23 173 152 116
Source : DOING BUSINESS 2013
AS
EA
N
- 8 -
2 Facing New Challenges in Changing
Global Contexts
Current Performance of Thailand’s
Competitiveness1
Outline of Presentation
Readiness of Thai Industries Ready in
the Challenging Global Arena
www.nesdb.go.th - 9 -
Next Steps of Thai Industries Towards
Sustainable Competitiveness
3
4

1 Technological
Change
Six contexts influencing the changes in competition platform, business model and social system.
Emergence of
“the Second
Economy”
(digital economy)
2 Climate
Change
6Political Change
•Conflict
•People
•Disaster•Energy
Major Global Changes
Transforming
Competition
Platform &
Business
Model
(digital economy)
3 International
Economic Platform Change
4 Demographical
Structure
Change
5Cultural
Change
Aging Society
•People
participation
• Social value change
• More individualism
Economic
integration &
connectivity
•Energy & food security
Transforming
Social System
& Interaction
www.nesdb.go.th - 10 -

Physical-based business process
Digital-based business process
Emergence of
Change in Competition
Platform & Business
Model
Changing Global Contexts: Technological Change
• Processes in the physical economy are
being entered into the digital economy.
• New business model: “Internet of
Things”
Emergence of
“the Second
Economy���� Digital
Economy”
Change in Social
System and
Interaction
www.nesdb.go.th - 11 -
• More online interaction and communication
• Create networking and social movement through social media
• Enable the mobilization of limited global resources for better quality of life
o The technology is increasingly more sophisticated and rapidly changing.
o Consumers are more interested in software application than hardware.
o Higher Technology Accessibility: Develop technology to serve diverse and complicated
demands.
o Global sourcing and fiercer competition in acquiring power from occupying sources of
technologies.
Changing Global Contexts : Technological Change
www.nesdb.go.th - 12 -

• In 2030, the increasing demand in energy in Asia, particular in China and India, will create fiercer
competition in seizing scarce source of energy.
• In the meantime, the global energy resources are expected to be available for consumption only
for the next 50-100 years.
Energy consumption by sector (2008-2035)
54.2 Years
Reserves
Oil 1.65 Trillion barrels
Reserves/Production Ratio
Changing Global Contexts : Climate Changes /Energy Crisis
barrels
208.4 Trillion cubic metres
Natural Gas
Coal 860,938Million tonnes
112 Years
63.5 Years
Source : BP Statistical Review of World Energy, June 2012 and Energy policy and planning officewww.nesdb.go.th - 13 -
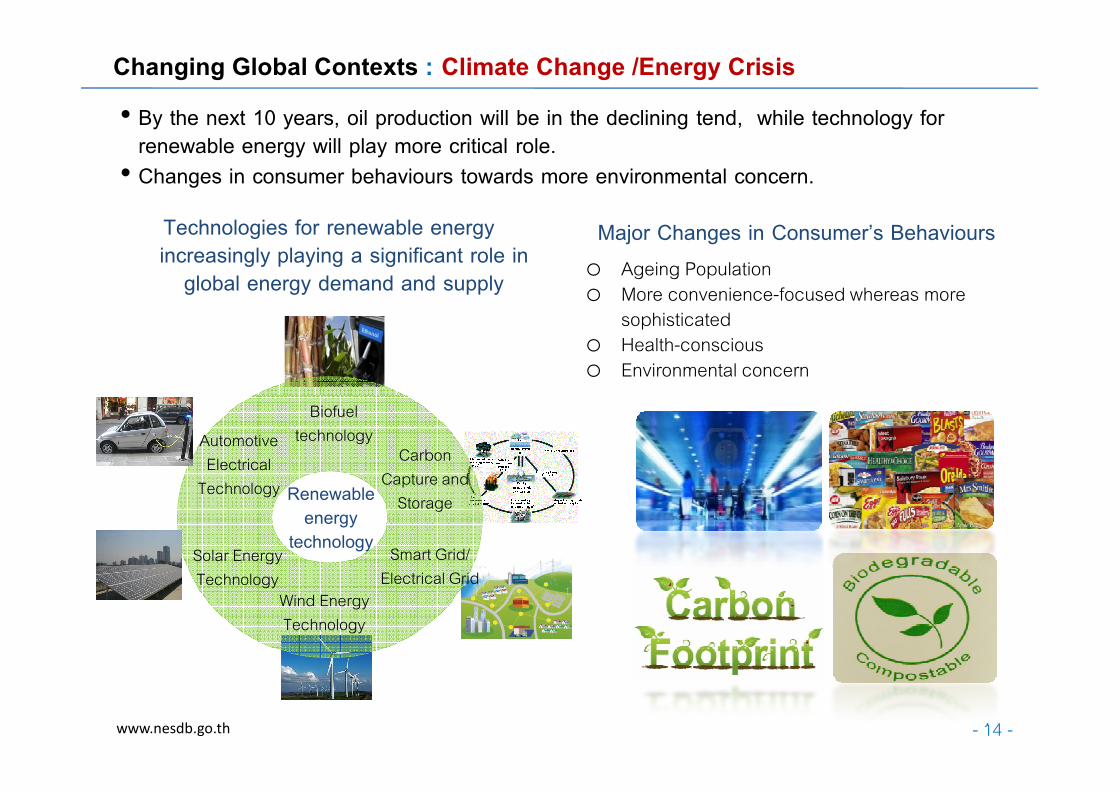
• By the next 10 years, oil production will be in the declining tend, while technology for renewable energy will play more critical role.
• Changes in consumer behaviours towards more environmental concern.
Technologies for renewable energy increasingly playing a significant role in
global energy demand and supply
Biofuel
Major Changes in Consumer2s Behaviourso Ageing Population o More convenience-focused whereas more
sophisticated o Health-consciouso Environmental concern
Changing Global Contexts : Climate Change /Energy Crisis
Biofuel technology
Carbon Capture and
Storage
AutomotiveElectrical
Technology
Solar Energy Technology
Wind Energy Technology
Smart Grid/ Electrical Grid
Renewable energy
technology
www.nesdb.go.th - 14 -

The global economy will more likely to be unstable and complex.
34
35
36
37THB/USD
QE1+
1.25 trillion USD
QE2
600 Thousand USD
Tha
i bat
h/U
SD
QE3
o The emergence of 'Currency War0 in accordance with Quantitative Easing Measures has created
crucial impacts on the fluctuation of exchange rates and Thailand4s competitiveness in goods.
Changing Global Contexts : International Economic Platform Change
28
29
30
31
32
33
34
Nov 08 May 09 Nov 09 May 10 Nov 10 May 11 Nov 11 May 12 Nov 12 May 13
QE1
500 Thousand USD
Source : Bank of Thailand
29.6
28.7
Tha
i bat
h/U
SD
32.1
QE3
40 Thousand USD QE4
45 Thousand USD
www.nesdb.go.th - 15 -
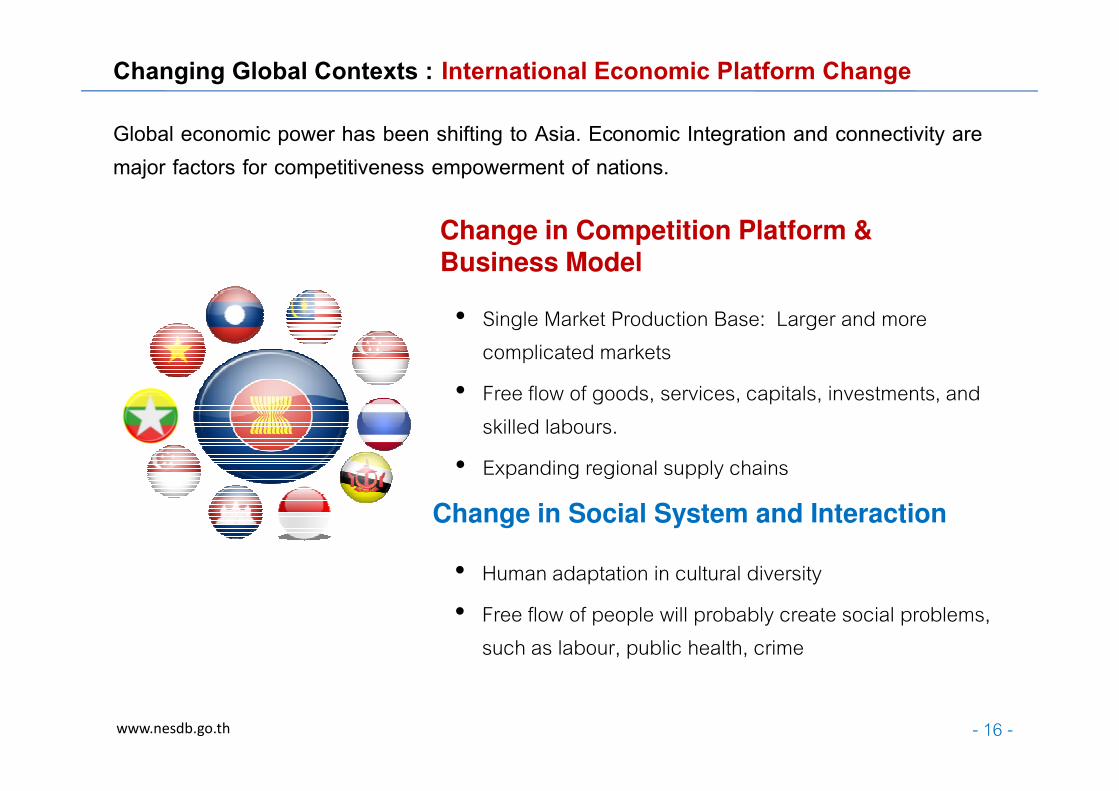
• Single Market Production Base: Larger and more complicated markets
• Free flow of goods, services, capitals, investments, and
Change in Competition Platform & Business Model
Global economic power has been shifting to Asia. Economic Integration and connectivity are major factors for competitiveness empowerment of nations.
Changing Global Contexts : International Economic Platform Change
• Free flow of goods, services, capitals, investments, and skilled labours.
• Expanding regional supply chains
• Human adaptation in cultural diversity
• Free flow of people will probably create social problems, such as labour, public health, crime
Change in Social System and Interaction
www.nesdb.go.th - 16 -

Global demographical structure is changing towards ageing society
o The trend of increasing number of ageing population in global demographical structure becomes
one of the important conditions in economic and social policy planning.
30
35
40
45 The total world population aged over 60%
Changing Global Contexts : Demographical Structure Change
0
5
10
15
20
25
30
2503250825132518252325282533253825432548255325582563256825732578258325882593
Asia World China Indonesia Japan Malaysia Europe USA Thai
Source : UN Statistics Division
www.nesdb.go.th - 17 -

0%
10%
20%
30%
40%
50%
60%
70%
80%
25
43
25
45
25
47
25
49
25
51
25
53
25
55
25
57
25
59
25
61
25
63
25
65
25
67
25
69
25
71
25
73
• Thailand is expected to enter ageing
society within 8 years.
• Proportion of elderly (60 + years) of
Thailand is likely to be higher, while the
proportion of children (0-14 years) and
working age (15-59 years) is decreasing.
• In contrast, industrial sectors are requiring
higher number of labours.
• The more the access to higher levels of
education, the later the labours enter to
market.
Thai population by age Year 2000-2030
Future labour issues in Thailand
60+ yrs
15-59 yrs
0-14 yrs
Changing Global Contexts : Demographical Structure Change
25
43
25
45
25
47
25
49
25
51
25
53
25
55
25
57
25
59
25
61
25
63
25
65
25
67
25
69
25
71
25
73
market.
Source: NESDB, Ministry of Industry, The National Wages and Productivity Commission (NWPC)
$2.0 $2.5 $3.0 $5.0 $8.4 $9.6 $9.7
$61.7
0
10
20
30
40
50
60
70
• Regarding cost of labour, Thailand ranks
the 3rd in ASEAN (higher than that of
Malaysia but at the same level as the
Philippines )
Minimum wages by country in the region. (Unit: USD)
• Problems of cost and quantity of labour
are currently affecting industrial sectors,
especially in labour-intensive ones,
possessing workforce of more than 5.7
million people in August 2012
www.nesdb.go.th - 18 -
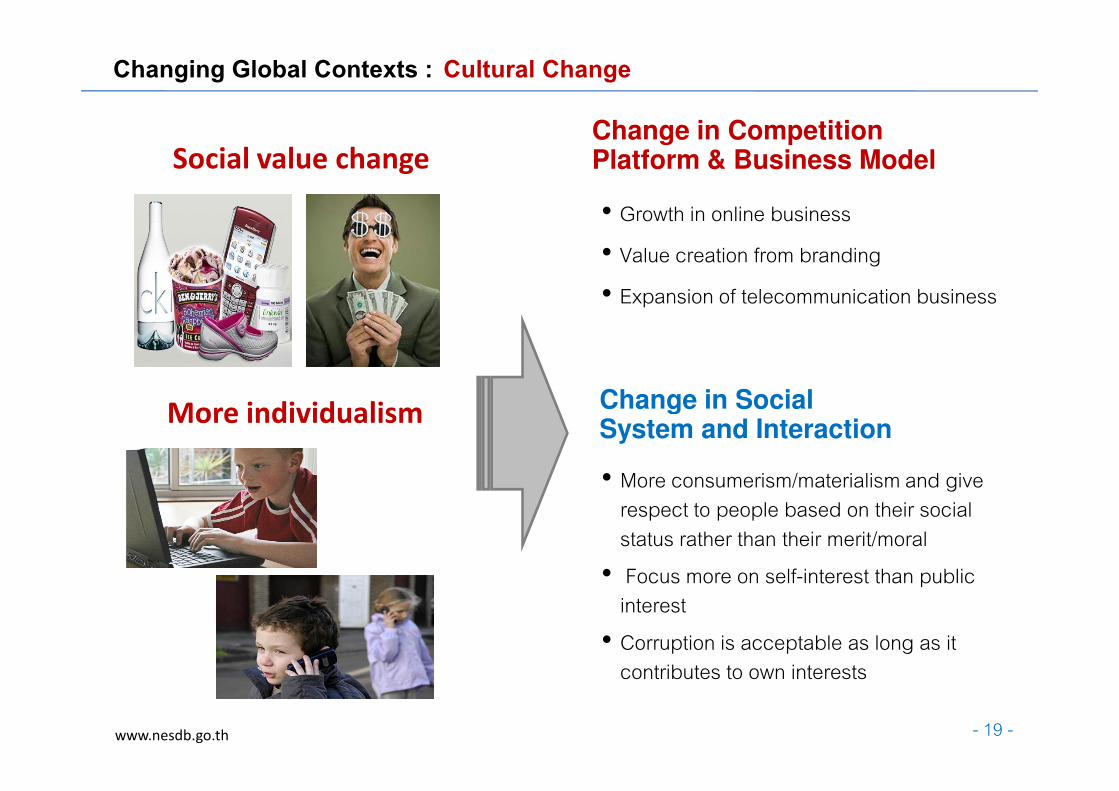
More individualism
Social value change
• Growth in online business
• Value creation from branding
• Expansion of telecommunication business
Change in Competition Platform & Business Model
Change in Social
Changing Global Contexts : Cultural Change
More individualism
• More consumerism/materialism and give respect to people based on their social status rather than their merit/moral
• Focus more on self-interest than public interest
• Corruption is acceptable as long as it contributes to own interests
Change in Social System and Interaction
- 19 -www.nesdb.go.th

• Business / Industry must realize the impact and understanding on the community
Change in Competition Platform & Business Model
Change in Social System and
Changing Global Contexts : Political Change
Globalization affects information access of people including politics and development country
• Political conflict generated serious argument
in Thai society
• Public sector=s role in developing countries
• Inequality reduction and empowering people is a key development issues
Change in Social System and Interaction
- 20 -www.nesdb.go.th

2 Facing New Challenges in Changing
Global Contexts
Current Performance of Thailand’s
Competitiveness1
Outline of Presentation
Readiness of Thai Industries Ready in
the Challenging Global Arena
www.nesdb.go.th - 21 -
Next Steps of Thai Industries Towards
Sustainable Competitiveness
3
4

Critical issues impacting industrial sector in the near future
Stagnation of national
competitiveness and the
delay in infrastructure development projects
Highly susceptible to
changes in the world
economy due to high
dependence on export
• Growth tends to be concentrated only on some particular industries.
• Issues of low productivity and low value added productions remain
The trend of ageing
society brings about
higher risks from labour
1
2
4
5
Environmental problems
create considerable impacts
on ecological systems and quality of life of people
dependence on export
market and weak domestic markets.
higher risks from labour
shortage in the future
Decline of domestic
energy supply affects
on more reliance on
high-cost energy import in the future
3 6
www.nesdb.go.th - 22 -
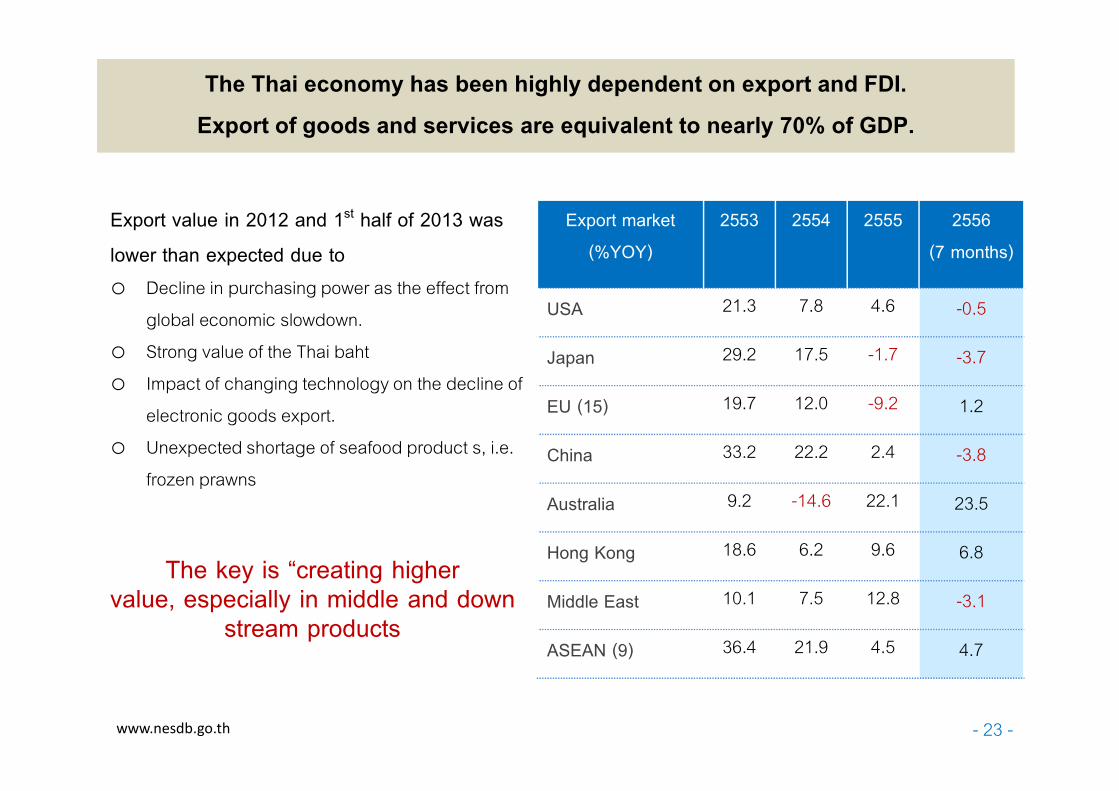
The Thai economy has been highly dependent on export and FDI.
Export of goods and services are equivalent to nearly 70% of GDP.
Export value in 2012 and 1st half of 2013 was
lower than expected due too Decline in purchasing power as the effect from
global economic slowdown. o Strong value of the Thai baht o Impact of changing technology on the decline of
Export market
(%YOY)
2553 2554 2555 2556
(7 months)
USA 21.3 7.8 4.6 -0.5
Japan 29.2 17.5 -1.7 -3.7
EU (15) 19.7 12.0 -9.2 1.2o Impact of changing technology on the decline of
electronic goods export.o Unexpected shortage of seafood product s, i.e.
frozen prawns
EU (15) 19.7 12.0 -9.2 1.2
China 33.2 22.2 2.4 -3.8
Australia 9.2 -14.6 22.1 23.5
Hong Kong 18.6 6.2 9.6 6.8
Middle East 10.1 7.5 12.8 -3.1
ASEAN (9) 36.4 21.9 4.5 4.7
- 23 -www.nesdb.go.th
The key is Acreating higher value, especially in middle and down
stream products

Thailand R&D’s investment is remaining at low level as compared to other economies.
• According to the IMD competitiveness,
out of 144 countries, Thailand’s R&D
expenditure was recorded the 60th rank.
• Thailand’s technological readiness was in the
78th rank, whereas innovation capability was
ranked the 66th.
• The ratio of R&D investment to GDP of
Thailand was lower than many countries,
including Malaysia, only 0.2% of GDP in 2012
0.2
2.8
1.8 1.8
3.4 3.8
2.8 2.7
Thai Singapore Malaysia China Japan South Korea USA Australia
Research and Development Expenditure (% of GDP) in 2012
source: UNESCO Institute for Statistics, July 2011, The World Bank @AB World Competitiveness Yearbook by IMD
www.nesdb.go.th - 24 -
82.173.5
39.4 39.229.8
13.0
7.6
65.2
23.5 28.0
11.8 9.9 10.83.5
0
1020
30
40
50
60
70
80
90
Natural Gas
Oil
USA
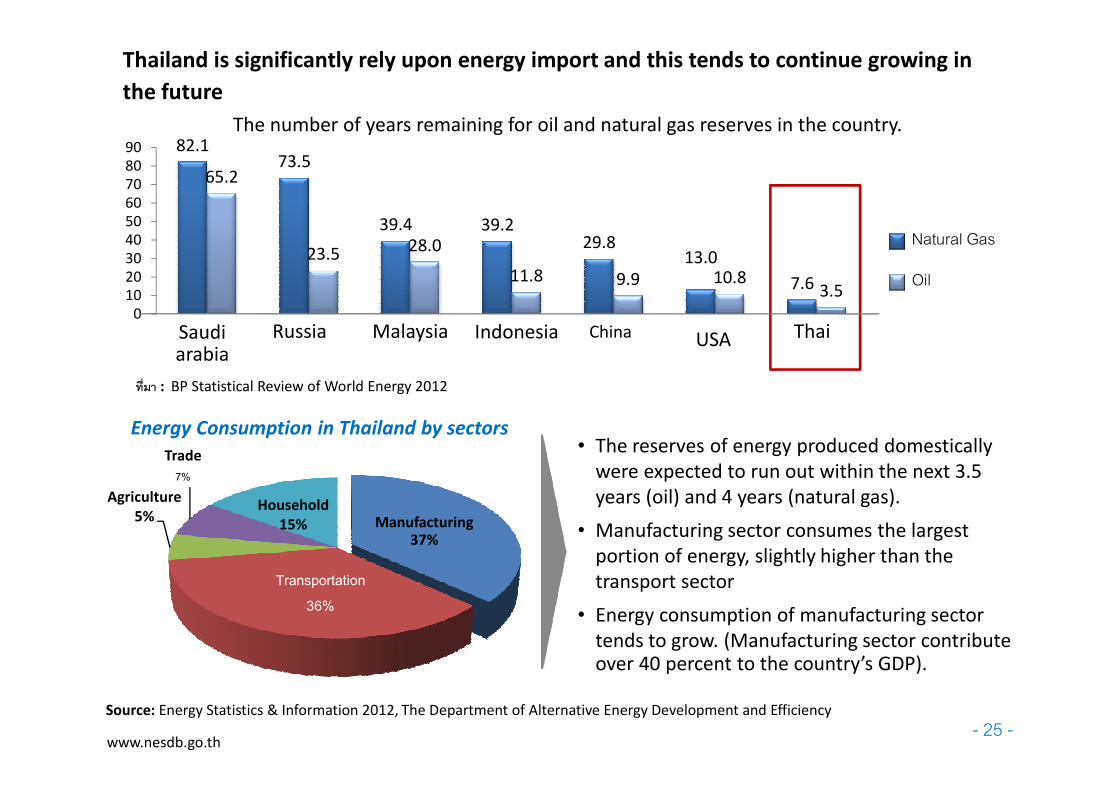
The number of years remaining for oil and natural gas reserves in the country.
Saudi arabia
Russia Malaysia Indonesia China Thai
Thailand is significantly rely upon energy import and this tends to continue growing in
the future
BCDEF : BP Statistical Review of World Energy 2012
Agriculture
5%
Trade
7%
Household
15%
Transportation
36%
Energy Consumption in Thailand by sectors• The reserves of energy produced domestically
were expected to run out within the next 3.5
years (oil) and 4 years (natural gas).
• Manufacturing sector consumes the largest
portion of energy, slightly higher than the
transport sector
• Energy consumption of manufacturing sector
tends to grow. (Manufacturing sector contribute over 40 percent to the country’s GDP).
Source: Energy Statistics & Information 2012, The Department of Alternative Energy Development and Efficiency
BCDEF
www.nesdb.go.th- 25 -
Manufacturing 37%
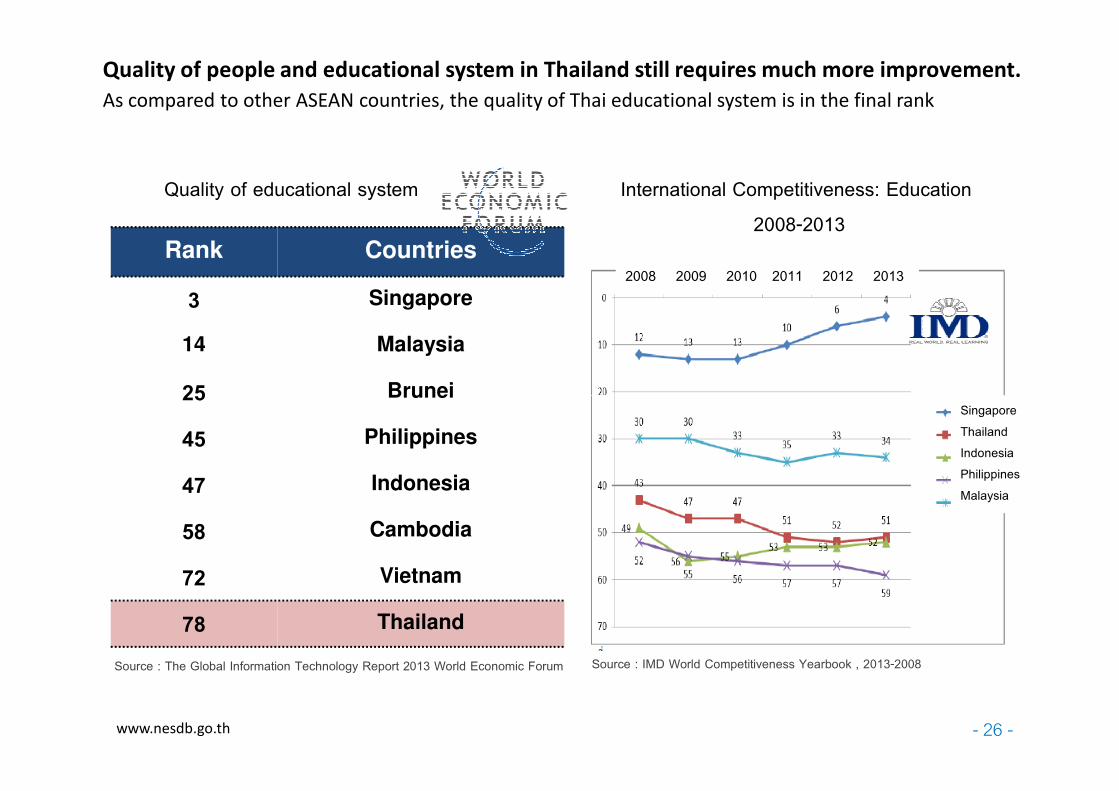
Quality of people and educational system in Thailand still requires much more improvement.
As compared to other ASEAN countries, the quality of Thai educational system is in the final rank
Rank Countries
3 Singapore
14 Malaysia
25 Brunei
Quality of educational system International Competitiveness: Education
2008-2013
2008 2009 2010 2011 2012 2013
25 Brunei
45 Philippines
47 Indonesia
58 Cambodia
72 Vietnam
78 Thailand
Source : The Global Information Technology Report 2013 World Economic Forum Source : IMD World Competitiveness Yearbook , 2013-2008
www.nesdb.go.th - 26 -
SingaporeThailandIndonesiaPhilippinesMalaysia

8.47.4
8.5
13.6
10
15
Average growth rate of labour productivity per GDP of the ASEAN member countries
(Year 2000-2008, 2008, 2009, 2010)
Productivity of Thai labours is in a good position as compared to other ASEAN countries
Labour productivity of Thailand in 2010 was 5.7 percent, higher than the ASEAN average (4.3
percent); however this figure still lags behind that of Singapore (13.6 percent).
3.5 3.4 3.32
0.4
2.6
4.83.6
5.3
0.9
3.5
7.4
2.1
-6.3
0.5
3.4
2.1
-4.5
2.6
-3.9
-1.7-2.9
-4
2.5
0.4
2.1
3.94.6
3.44.6
5.7
4.3 4.3
-10
-5
0
5
Cambodia Indonesia Malaysia Myanmar Philippines Singapore Thailand Vietnam ASEAN
2543-2551
2551
2552
2553
Source : IMD World Competitiveness Yearbook , 2013-2008
www.nesdb.go.th - 27 -
2000-2008
2008
2009
2010
40000
60000
80000
100000
120000
140000
Japan
China
South Korea
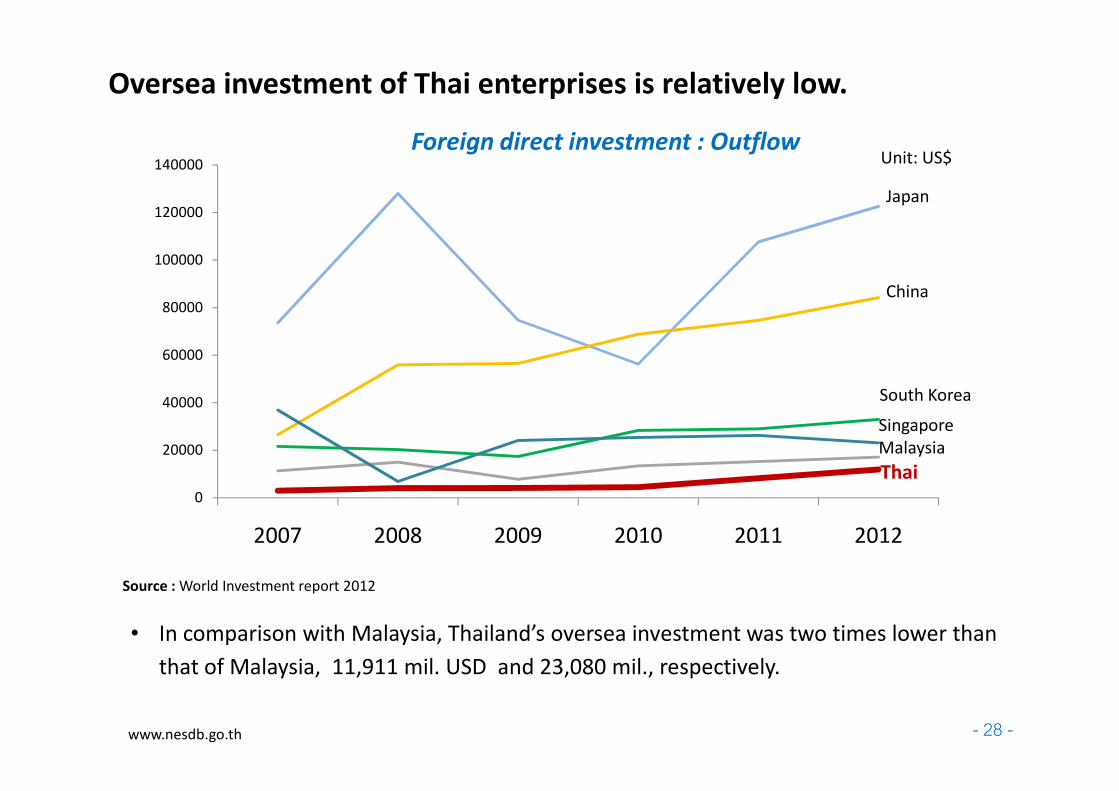
Oversea investment of Thai enterprises is relatively low.
Unit: US$Foreign direct investment : Outflow
0
20000
40000
2007 2008 2009 2010 2011 2012
South Korea
Singapore
Thai
Malaysia
• In comparison with Malaysia, Thailand’s oversea investment was two times lower than
that of Malaysia, 11,911 mil. USD and 23,080 mil., respectively.
Source : World Investment report 2012
www.nesdb.go.th - 28 -

Reasonable Costs
Service & Hospitality
Hi-Technological Hardware
Human Resource Quality1
Competitive Advantage
Although Thailand in overall still has several weaknesses, some manufacturing and service sectors have shown high potentials, e.g. medical service. Thai medical service sector has strong advantage in terms of price, service, friendliness, especially when combining with the attractive locations for tourism.
Thailand Singapore Hong Kong Malaysia India
Human Resource Quality
Human Resource Supply
International Accredited Hospital
Preemptive Move
Synergy/ Strategic Partner
Accessibility/Market Channel
Tourist AttractionRemark: 1 Lower quality in aspect of International Communication onlySource : Data Analysis by private hospital association less more
www.nesdb.go.th- 29 -
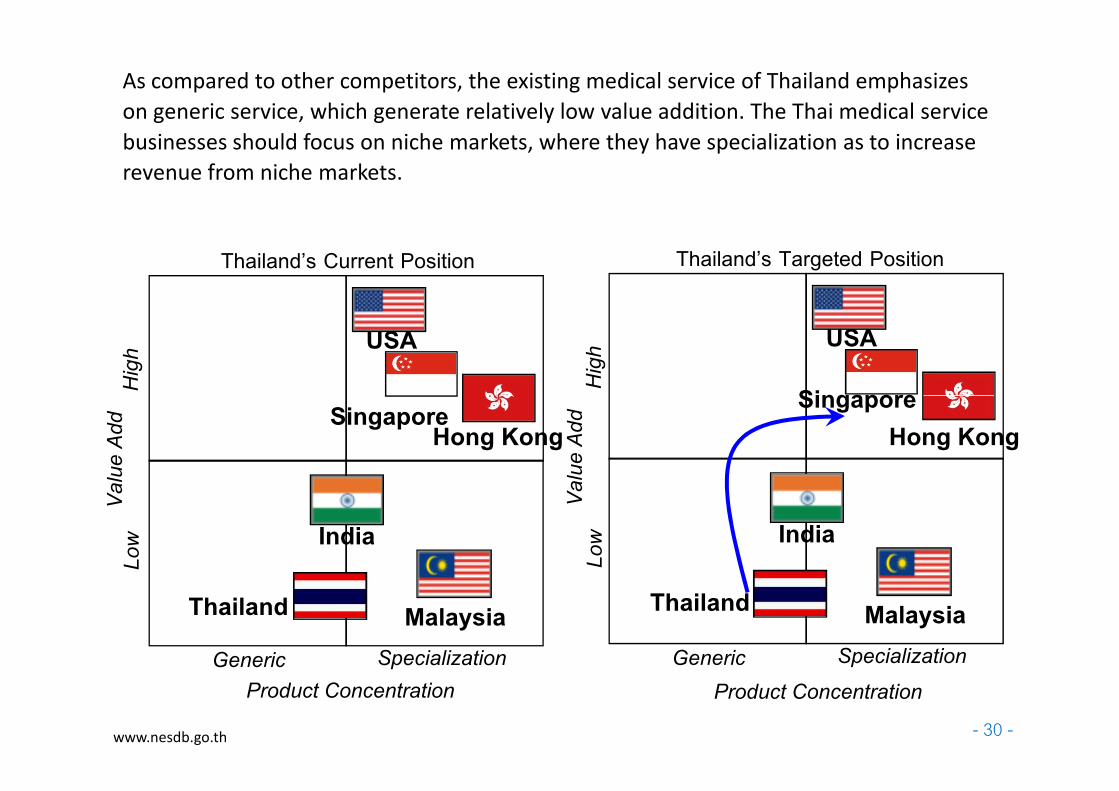
As compared to other competitors, the existing medical service of Thailand emphasizes
on generic service, which generate relatively low value addition. The Thai medical service
businesses should focus on niche markets, where they have specialization as to increase
revenue from niche markets.
High
Singapore
USA
High
Singapore
USA
Thailand2s Current Position Thailand2s Targeted Position
DEFGH : CMU Data Compilation and Analysis
Product Concentration
Generic Specialization
Value Add
Low
Singapore
India
Malaysia
Hong Kong
Generic Specialization
Value Add
Low
Singapore
India
Malaysia
Hong Kong
Product Concentration
- 30 -www.nesdb.go.th
ThailandThailand

58,848
23,874
3,186 2,687 2,392
4,4643,543
4,474
7,759
2,535
10.8
49.8
23.44
16.21
1.4
11.72
18.57
5.01
12.8715.45
0
10,000
20,000
30,000
40,000
50,000
60,000
70,000
0
10
20
30
40
50
60
China Thai UAEIndiaHong Turkey Malay- Viet- Mexico Singapore
4
World Ranking
Top 10 Exporters of Design Products Among Developing Economies, 2008 Growth (%)
Value (million US$)� Thailand is the major exporter
of design products among
developing countries, ranked
the 4th among developing countries in 2008.
Thailand’s creative and design industries are highly competitive internationally.
� Major exported design products
of Thailand include interior
design, graphic design, fashion and jewelry design, and toy
design.
Source: UNCTAD, based on official
data in UN COMTRADE database
China Thailand
UAEIndiaHong Kong
Turkey Malay-sia
Viet-nam
Mexico Singapore
84,807
33,254
5,047 4,7603,524
4,272
9,450
5,3695,0775,167
14.96
9.13
16.92
5.996.33
15.7
10.31
1.05
12.86
44.77
0
10,000
20,000
30,000
40,000
50,000
60,000
70,000
80,000
90,000
0
5
10
15
20
25
30
35
40
45
50
China Thai-land
UAEIndiaHong Kong
Turkey MalaysiaKoreaMexico Singa-pore
6
World Ranking
Growth (%)
Value (mil. US$)
Top 10 Exporters of Creative Products Among Developing Economies, 2008
� Thailand is the 1st exporter of creative goods in ASEAN and the 6th among developing countries, with the export value of 5,077 Mil. USD, accounting 1.25% of market share.
� In terms of growth, Thai export of creative products grew by 10.31% in 2008, higher than that of Malaysia, Singapore, and South Korea
www.nesdb.go.th- 31 -
design.

Outline of Presentation
2 Facing New Challenges in Changing
Global Contexts
Current Performance of Thailand’s
Competitiveness1
Readiness of Thai Industries Ready in
the Challenging Global Arena
www.nesdb.go.th - 32 -
Next Steps of Thai Industries Towards
Sustainable Competitiveness
3
4

The Future of Thailand
Out of middle-income countries
• Increase income per capita
The center of economic linkage in the region.
• The center of trade and investment of the region with modern regional transportation and ICT networks that connect ASEAN to the world.
• Enhance the quality of life and the effective systems of education, health and justice throughout Thailand
Alleviate social inequality
More environmental friendly
• Reduce greenhouse gas emissions
Enhance the national competitiveness
Promote Thailand to be:
• Production source of the quality and safe food, halal food, eventually leading to become the kitchen of the world
• The center of automotive and parts manufacturing, R&D and automotive testing of Asia.
• The hub of medical services, tourism and clean energy production and services in the ASEAN region.
www.nesdb.go.th - 33 -
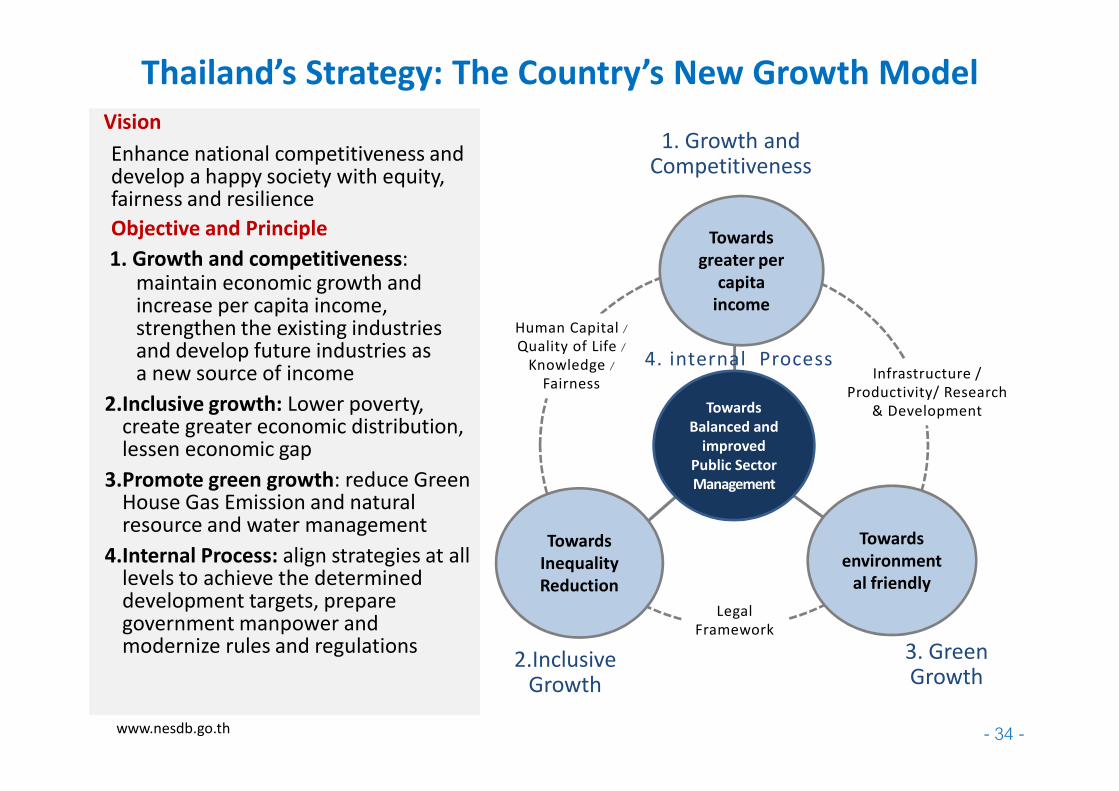
Thailand’s Strategy: The Country’s New Growth Model
Vision
Enhance national competitiveness and develop a happy society with equity, fairness and resilience
Objective and Principle
1. Growth and competitiveness: maintain economic growth and increase per capita income, strengthen the existing industries and develop future industries as a new source of income
2.Inclusive growth: Lower poverty,
Human Capital / Quality of Life /
Knowledge / Fairness
Infrastructure /
Productivity/ Research
1. Growth andCompetitiveness
Towards
greater per
capita
income
4. internal Process
2.Inclusive growth: Lower poverty, create greater economic distribution, lessen economic gap
3.Promote green growth: reduce Green House Gas Emission and natural resource and water management
4.Internal Process: align strategies at all levels to achieve the determined development targets, prepare government manpower and modernize rules and regulations
www.nesdb.go.th - 34 -
Productivity/ Research
& Development
Towards
Inequality
Reduction
Towards
environment
al friendly
Towards
Balanced and
improved
Public Sector
Management
Legal
Framework
2.InclusiveGrowth
3. GreenGrowth

Potential Manufacturing and Service Sectors of Thailand
Tourism
Retails
Rubber
Field Corn
Rice
Agriculture
ServiceRubber products
Petrochemical and Plastic
Develop future industries
Healthcare products(alternative medicines including
Health Herbs Remedies, Cosmetics
& Beauty Supply)
Clean Energy
6655
Strengthen existing industries
Food Processing
Retails
Construction
Fisheries
Bio Energy(Cassava/Sugarcane/Palm oil)
LivestockMedical service
Electrical and
Electronics
Industry
Fruits Biochemical products/Bio-plastics/ Bio Materials
Creative Industry(Fashion/ Design/ Advertisement
/Architecture/ Jewelry/ Robot/ OTOP)
Transportation &Telecommuni-cation
Source: NESDB and Ministry of Industry 2012-2031
Aviation & Aerospace Industries
35
Biodiesel/Ethanol
Automotive and parts
Research and DevelopmentResearch and Development
ProductivityGreen
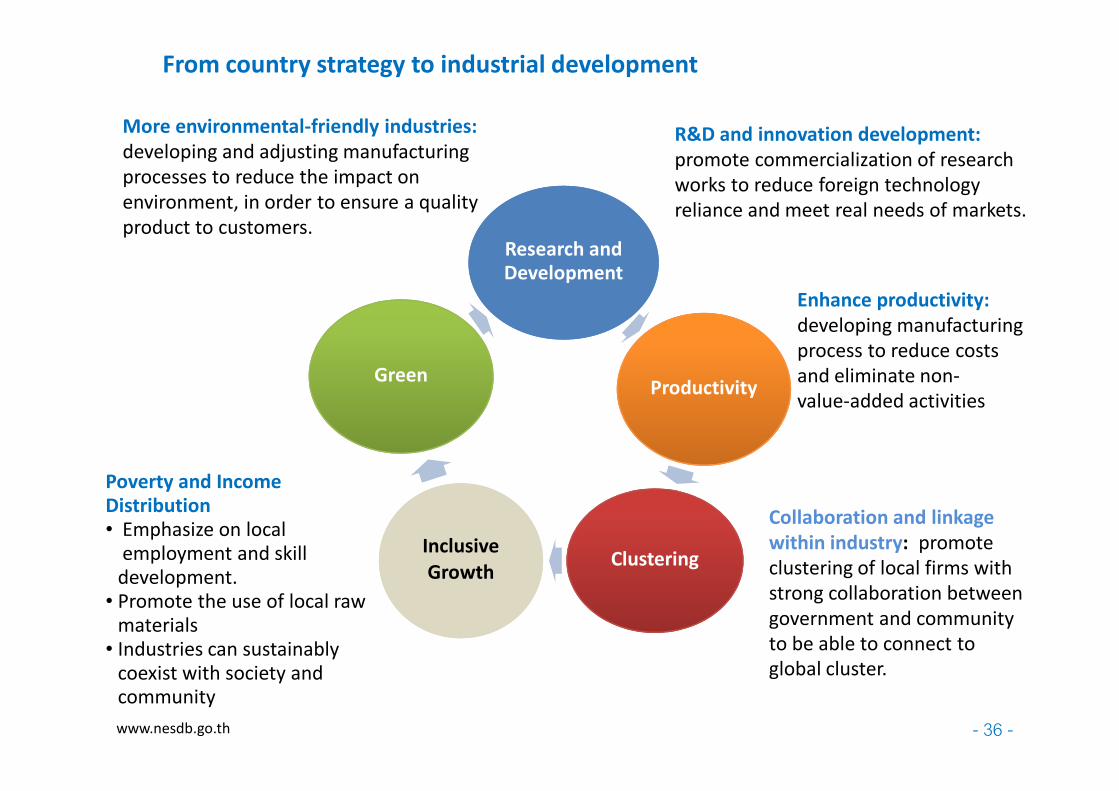
From country strategy to industrial development
More environmental-friendly industries:
developing and adjusting manufacturing
processes to reduce the impact on
environment, in order to ensure a quality
product to customers.
R&D and innovation development:
promote commercialization of research
works to reduce foreign technology
reliance and meet real needs of markets.
Enhance productivity:
developing manufacturing
process to reduce costs
and eliminate non-
value-added activities Productivity
ClusteringInclusive
Growth
Inclusive
Growth
Poverty and Income Distribution• Emphasize on local
employment and skill development.
• Promote the use of local raw materials
• Industries can sustainably coexist with society and community
www.nesdb.go.th - 36 -
value-added activities
Collaboration and linkage
within industry: promote
clustering of local firms with
strong collaboration between
government and community
to be able to connect to
global cluster.

Local Entrepreneurs
Outbound Investment
Joint Venture
ASEAN Player
Combination Strategy
Strategy implementation for production and service sectors should take into account on characteristics of entrepreneurs that are different in terms of capabilities and needs for support. The government should provide appropriate incentives, measures and resources to drive the strategies effectively and efficiently.
Formulate strategies that fits to characteristics of entrepreneurs
Combination Strategy
Strengthening current mechanisms
Integrating several mechanisms towards
more united policy alignment
Collaborating between mechanisms of central government and local
authorities (both in public and private
sectors)
www.nesdb.go.th - 37 -
Implementing mechanism for production and service sector development