Embed Size (px)
Citation preview

See discussions, stats, and author profiles for this publication at: https://www.researchgate.net/publication/233413905
NEXT-100 technical design report (TDR). Executive summary
Article in Journal of Instrumentation · June 2012
DOI: 10.1088/1748-0221/7/06/T06001
CITATIONS
58READS
140
86 authors, including:
Some of the authors of this publication are also working on these related projects:
Education on Robotics Systems View project
T-REX (R&D on TPCs for Rare Event Experiments @ UNIZAR) View project
Vicente Alvarez
University of Valencia
49 PUBLICATIONS 495 CITATIONS
SEE PROFILE
F.I.G.M. Borges
University of Coimbra
89 PUBLICATIONS 722 CITATIONS
SEE PROFILE
Sara Cárcel
University of Valencia
51 PUBLICATIONS 550 CITATIONS
SEE PROFILE
Jose Manuel Carmona
University of Zaragoza
158 PUBLICATIONS 2,658 CITATIONS
SEE PROFILE
All content following this page was uploaded by Luis Serra on 30 May 2014.
The user has requested enhancement of the downloaded file.
Preprint typeset in JINST style - PAPER VERSION
NEXT-100 Technical Design Report (TDR).Executive Summary
A.L. Ferreira, C.A.B. Oliveira, J.F.C.A. VelosoInstitute of Nanostructures, Nanomodelling and Nanofabrication (i3N), Universidade de AveiroCampus de Santiago, 3810-193 Aveiro, Portugal
D. Chan, M. Egorov, A. Goldschmidt, T. Miller, D. Nygren, J. Renner, D. Shuman,T. Weber
Lawrence Berkeley National Laboratory (LBNL)1 Cyclotron Road, Berkeley, CA 94720, USA
E. Gómez, R. M. Gutiérrez, M. Losada, G. NavarroCentro de Investigaciones, Universidad Antonio NariñoCarretera 3 este No. 47A-15, Bogotá, Colombia
F.I.G. Borges, C.A.N. Conde, T.H.V.T. Dias, L.M.P. Fernandes, E.D.C. Freitas,J.A.M. Lopes, C.M.B. Monteiro, H. Natal da Luz, F.P. Santos, J.M.F. dos Santos
Departamento de Fisica, Universidade de CoimbraRua Larga, 3004-516 Coimbra, Portugal
P. Evtoukhovitch, V. Kalinnikov, A. Moiseenko, Z. Tsamalaidze, E. VelichevJoint Institute for Nuclear Research (JINR)Joliot-Curie 6, 141980 Dubna, Russia
M. Batallé, L. Ripoll, J. TorrentEscola Politècnica Superior, Universitat de GironaAv. Montilivi, s/n, 17071 Girona, Spain
J. HauptmanDepartment of Physics and Astronomy, Iowa State University12 Physics Hall, Ames, Iowa 50011-3160, USA
L. Labarga, J. PérezDepartamento de Física Teórica, Universidad Autónoma de MadridCiudad Universitaria de Cantoblanco, 28049 Madrid, Spain
E. Ferrer-Ribas, I. Giomataris, F.J. Iguaz
IRFU, Centre d’Études de Saclay (CEA Saclay)Gif-sur-Yvette, France
J.A. Hernando Morata, D. Vázquez
– 1 –
arX
iv:1
202.
0721
v1 [
phys
ics.
ins-
det]
3 F
eb 2
012
Instituto Gallego de Física de Altas Energías (IGFAE), Universidade de Santiago de CompostelaCampus sur, Rúa Xosé María Suárez Núñez, s/n, 15782 Santiago de Compostela, Spain
C. Sofka, R. C. Webb, J. WhiteDepartment of Physics and Astronomy, Texas A&M UniversityCollege Station, Texas 77843-4242, USA
J.M. Catalá, R. Esteve, V. Herrero, J.M. Monzó, F.J. Mora, J.F. ToledoInstituto de Instrumentación para Imagen Molecular (I3M), Universitat Politècnica de ValènciaCamino de Vera, s/n, Edificio 8B, 46022 Valencia, Spain
V. Álvarez, S. Cárcel, A. Cervera, J. Díaz, P. Ferrario, A. Gil, J.J. Gómez-Cadenas∗,K. González, I. Liubarsky, D. Lorca, J. Martín-Albo, F. Monrabal, J. Muñoz Vidal,M. Nebot, J. Rodríguez, L. Serra, M. Sorel, N. Yahlali
Instituto de Física Corpuscular (IFIC), CSIC & Universitat de ValènciaCalle Catedrático José Beltrán, 2, 46980 Paterna, Valencia, Spain
R. Palma, J.L. Pérez Aparicio
Dpto. de Mecánica de Medios Continuos y Teoría de Estructuras, Univ. Politécnica de ValenciaCamino de Vera, s/n, 46071 Valencia, Spain
J.M. Carmona, J. Castel, S. Cebrián, T. Dafni, H. Gómez, D.C. Herrera,I. G. Irastorza, G. Luzón, A. Rodríguez, L. Seguí, A. Tomás, J.A. Villar
Lab. de Física Nuclear y Astropartículas, Universidad de ZaragozaCalle Pedro Cerbuna, 12, 50009 Zaragoza, Spain
ABSTRACT: In this Technical Design Report (TDR) we describe the NEXT-100 detector that willsearch for neutrinoless double beta decay (ββ0ν) in 136Xe. The document formalizes the ANGELdesign presented in our Conceptual Design Report (CDR). The baseline detector is designed tohold a maximum of about 150 kg of xenon at 15 bar, or 100 kg at 10 bar. This option builds inthe capability to increase the total isotope mass by 50% while keeping the operating pressure at amanageable level.The ANGEL design calls for an asymmetric TPC, with photomultipliers behind a transparent cath-ode and position-sensitive light pixels behind the anode. We have chosen the low backgroundR11410-10 PMTs for energy and timing and Hamamatsu MPPCs (S10362-11-050P model) astracking pixels. Each individual PMT will be isolated from the gas by an individual, pressure resis-tant enclosure and will be coupled to the sensitive volume through a sapphire window coated withterphenyl-butadiene (TPB) . MPPCs will be arranged in Dice Boards (DB) holding 64 sensors eachin an array of 8×8 sensors. The light tube will also be coated with TPB.
KEYWORDS: Time Projection Chambers (TPC).
∗Spokesperson. Email: [email protected]

Contents
1. Introduction 2
2. Neutrinoless double beta decay searches 2
3. The NEXT concept 33.1 Development of the NEXT project: R&D and prototypes 53.2 Major subsystems 6
4. Gas system 7
5. The pressure vessel 12
6. The field cage 15
7. WLS coating 177.1 WLS coating of the tracking plane DBs 177.2 WLS coating of the field cage light tube 17
8. The energy plane 19
9. The tracking plane 21
10. Front-end electronics and DAQ 2310.1 Electronics for the energy plane 2310.2 Electronics for the tracking plane 24
11. Shielding 27
12. NEXT-100 at the LSC 27
13. Radioactive budget 2913.1 Sources of background in NEXT 2913.2 Contribution of the main materials used in NEXT 30
14. Expected sensitivity 3414.1 Signal and background characterization in NEXT 3414.2 The topological signature 35
– 1 –
1. Introduction
Neutrinoless double beta decay (ββ0ν) is a hypothetical, very slow nuclear transition in which twoneutrons undergo β -decay simultaneously and without the emission of neutrinos. The importanceof this process goes beyond its intrinsic interest: an unambiguous observation would establish thatneutrinos are Majorana particles — that is to say, truly neutral particles identical to their antiparti-cles — and prove that total lepton number is not a conserved quantity.
After 70 years of experimental effort, no compelling evidence for the existence of ββ0ν hasbeen obtained. However, a new generation of experiments that are already running or about to runpromises to push forward the current limits exploring the degenerate region of neutrino masses(see [1] for a recent review of the field). In order to do that, the experiments are using massesof ββ isotope ranging from tens of kilograms to several hundreds, and will need to improve thebackground rates achieved by previous experiments by, at least, an order of magnitude. If no signalis found, masses in the ton scale and further background reduction will be required. Only a few ofthe new-generation experiments can possibly be extrapolated to those levels.
The Neutrino Experiment with a Xenon TPC (NEXT) will search for neutrinoless double betadecay in 136Xe. A xenon gas time projection chamber offers scalability to large masses of ββ
isotope and a background rate among the lowest predicted for the new generation of experiments[1]. The experiment was proposed to the Laboratorio Subterráneo de Canfranc (LSC), Spain, in2009 [2], with a source mass of the order of 100 kg. Three years of intense R&D have resultedin a Conceptual Design Report [3] and a Technical Design Report (TDR), summarized in thisdocument, where the final design of the NEXT-100 detector is defined. More detailed reports onthe design of the different subsystems will be forthcoming.
2. Neutrinoless double beta decay searches
Double beta decay (ββ ) is a very rare nuclear transition in which a nucleus with Z protons decaysinto a nucleus with Z + 2 protons and the same mass number A. The decay can occur only if theinitial nucleus is less bound than the final nucleus, and both more than the intermediate one. Thereare 35 naturally-occurring isotopes that can undergo ββ . Two decay modes are usually considered:
• The standard two-neutrino mode (ββ2ν), consisting in two simultaneous beta decays, AZX→
AZ+2Y+ 2 e−+ 2 νe, which has been observed in several isotopes with typical half-lives inthe range of 1018–1021 years (see, for instance, [1] and references therein).
• The neutrinoless mode (ββ0ν), AZX→ A
Z+2Y+ 2 e−, which violates lepton-number conser-vation, and is therefore forbidden in the Standard Model of particle physics. An observationof ββ0ν would prove that neutrinos are massive, Majorana particles [4]. No convincingexperimental evidence of the decay exists to date.
The implications of experimentally establishing the existence of ββ0ν would be profound.First, it would demonstrate that total lepton number is violated in physical phenomena, an obser-vation that could be linked to the cosmic asymmetry between matter and antimatter through theprocess known as leptogenesis [5, 6]. Second, Majorana neutrinos provide a natural explanation tothe smallness of neutrino masses, the so-called seesaw mechanism [7 – 10].
– 2 –

Several underlying mechanisms — involving, in general, physics beyond the Standard Model— have been proposed for ββ0ν , the simplest one being the virtual exchange of light Majorananeutrinos. Assuming this to be the dominant one at low energies, the half-life of ββ0ν can bewritten as:
(T 0ν
1/2)−1 = G0ν
∣∣M0ν∣∣2 m2
ββ. (2.1)
In this equation, G0ν is an exactly-calculable phase-space integral for the emission of two electrons;M0ν is the nuclear matrix element of the transition, that has to be evaluated theoretically; and mββ
is the effective Majorana mass of the electron neutrino:
mββ =∣∣∣∑
iU2
ei mi
∣∣∣ , (2.2)
where mi are the neutrino mass eigenstates and Uei are elements of the neutrino mixing matrix.Therefore, a measurement of the ββ0ν decay rate would provide direct information on neutrinomasses [1].
The detectors used in double beta decay experiments are designed to measure the energy ofthe radiation emitted by a ββ source. In the case of ββ0ν , the sum of the kinetic energies ofthe two released electrons is always the same, and corresponds to the mass difference between theparent and the daughter nuclei: Qββ ≡M(Z,A)−M(Z + 2,A). However, due to the finite energyresolution of any detector, ββ0ν events are reconstructed within a non-zero energy range centeredaround Qββ , typically following a gaussian distribution. Other processes occurring in the detectorcan fall in that region of energies, thus becoming a background and compromising drastically theexperiment’s expected sensitivity to mββ [11].
All double beta decay experiments have to deal with an intrinsic background, the ββ2ν , thatcan only be suppressed by means of good energy resolution. Backgrounds of cosmogenic ori-gin force the underground operation of the detectors. Natural radioactivity emanating from thedetector materials and surroundings can easily overwhelm the signal peak, and consequently care-ful selection of radiopure materials is essential. Additional experimental signatures that allow thedistinction of signal and background are a bonus to provide a robust result.
The Heidelberg-Moscow experiment set the most sensitive limit to the half-life of ββ0ν so far:T 0ν
1/2(76Ge) ≥ 1.9× 1025 years [12]. In addition, a subgroup of the experiment observed evidence
of a positive signal, with a best value for the half-life of 1.5×1025 years [13], corresponding to aMajorana neutrino mass of about 0.4 eV. The claim was very controversial [14], and still awaits anexperimental response. A new generation of ββ experiments — already running or about to do so— will push the current limits down to neutrino masses of about 100 meV or better [1].
3. The NEXT concept
An ideal ββ0ν experiment is one characterized by:
1. An arbitrarily large mass of sensitive, 100% enriched target — e.g, target and detector arethe same, reconstruction efficiency of the signal is one—.
2. An arbitrarily small radioactive budget (thus, not affected by external backgrounds).
– 3 –

100 1000 10000
10
100Ge-76Se-82Te-130Xe-136Nd-150
exposure (kg year)
m!! (
meV
)
Figure 1. Sensitivity of ideal experiments at 90% CL for different ββ isotopes, assuming the PMA nuclearmatrix element [11]. Since the yields are very similar, the sensitivities of 82Se, 130Te and 150Nd overlap.The asymptotic limit (corresponding to a total exposure of 104 kg ·year) on mββ is of the order of 2 meVfor these isotopes, 4 meV for 136Xe and 10 meV for 76Ge. Notice that a different set of NME will yield asomewhat different result. The ideal sensitivity scales with the square root of the total exposure.
3. Perfect resolution, necessary to separate the ββ0ν and ββ2ν modes.
The sensitivity of such an instrument would depend only of the isotope used for the search,since the total yield depends on the nuclear matrix element and phase space available in the decay(Figure 1), and scales with the square root of the total exposure. Notice that reaching “ultimate”sensitivity (few meV) would require a total exposure of 104 kg ·year, even for an ideal experiment.The implication is that a full exploration of the mββ physics range will require an isotope mass of10 ton running for one year, or 1 ton running for 10 years. Exploring the inverse hierarchy wouldrequire a total exposure of 103 kg ·year, or a 100 kg detector running for 10 years.
Therefore, mass is a must for the next and next-to-next ββ0ν experiments, even assuminga magic substance immune to backgrounds. This condition, alone, makes some isotopes (andexperimental techniques) more suitable than others. Arguably, xenon offers the best deal when itcomes to procure a large mass of enriched isotope at a competitive cost. Indeed, there is today about1 ton of xenon enriched at ∼90% in 136Xe available at the World, distributed between KamLAND-Zen (∼800 kg), EXO (200 kg) and NEXT (100 kg).
There are two recipes to reduce the radioactive budget of a ββ0ν experiment to very lowlevels: (a) use of radiopure components, with low contents of uranium and/or thorium, and (b)shielding. All the ββ0ν experiment use a formula that combines both recipes.
Of course, no experiment achieves a null radioactive budget. Therefore, resolution and pos-sibly other handles are a must to suppress both intrinsic (e.g, the ββ2ν channel) and externalbackgrounds.
The NEXT experiment will search for ββ0ν in 136Xe using a high-pressure xenon gas (HPGXe)
– 4 –

time projection chamber (TPC). It is instructive to compare NEXT with an ideal detector:
1. Mass: At 10 bar, 100 kg of xenon occupy 2 m3. NEXT is designed to hold 100 kg of xenonat 10 bar or 150 kg at 15 bar. The total mass of the experiment is then large, and compareswell with the mass deployed by EXO (200 kg of enriched gas), CUORE (200 kg of isotope),or the first phase of KamLAND-Zen (330 kg of enriched gas). A future upgrade to a detectorholding up to 500–1 000 kg of enriched gas operating at 15–20 bar is conceivable. In theabsence of backgrounds, assuming a perfect efficiency, and assuming a 10 year run, NEXTcould qualify to explore the inverse hierarchy in its first phase, and to go beyond in a secondphase.
2. Radiopurity: NEXT uses the Matrioska principle. The full detector is installed in an under-ground lab and shielded from the lab radiation by a layer of ultra-pure lead, 30 cm thick. Theresidual radiation emanating from the lead, as well as the radiation emanating from the pres-sure vessel (made of a rather radiopure steel alloy) is shielded by an internal shield, 12 cmthick, made of ultra-pure copper. The relevant radioactive budget is the residual radioactivityof the copper (very small) and the contributions of the sensors (PMTs, MPPCs), field cage(itself made of radiopure copper) and electronics. The total radioactive budget is smallerthan 1 Bq.
3. Resolution and topology: NEXT offers both good energy resolution — possibly better than0.5% FWHM at Qββ — and event topological information that can be used for backgroundrejection and results in one of the smallest background rates of the market.
To achieve its target resolution, NEXT uses proportional electroluminescent (EL) amplifica-tion of the ionization signal. The detection process is as follows: charged particles propagatingin the gas will produce both primary scintillation ultra-violet (UV) light and ionization electrons.Electroluminescence (EL) is a method to amplify the ionization signal, once it has been drifted tothe TPC anode. When an ionization electron is accelerated in a moderate electric field, of the orderof 3–5 kV/cm/bar, it produces secondary scintillation UV light. The field can be tuned to generatea large number of photons (∼ 103) per electron reaching the TPC anode, thus producing a pro-portional signal. Extremely low fluctuations can be reached with EL, which is crucial for optimalenergy resolution.
3.1 Development of the NEXT project: R&D and prototypes
During the last three years, the NEXT R&D program has focused in the construction, commission-ing and operation of three large prototypes:
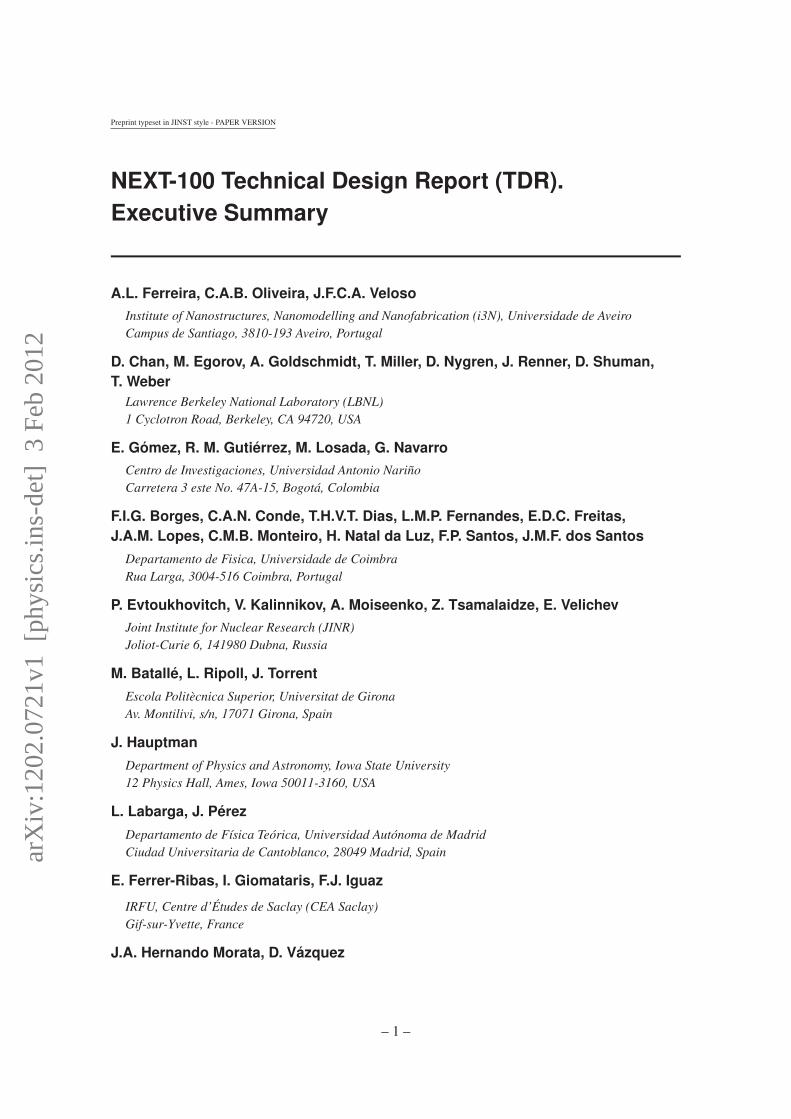
• NEXT-DBDM (figure 3), a prototype equipped with an array of 19 Hamamatsu R7378Aphotomultipliers, sensitive to VUV light and pressure resistant (up to 20 bar). The detectorcan hold 2 kg of xenon at 15 bar. The fiducial volume is a cylinder of 16 cm in length and16 cm in diameter (a proportion similar to the length to diameter ratio of NEXT-100). Themain goal of this prototype was to perform detailed energy resolution studies. The detectoris operating at LBNL.
– 5 –

recorded primarily by the array of PMTs located at the TPC cathode. It also produces ionizationelectrons which drift to the TPC anode and generate EL light (or secondary scintillation), whenentering the region of intense field (E/P ≈ 3 kV/cm.bar) between the transparent EL grids. Thislight is recorded by an array of silicon photomultipliers (SiPM) located right behind the EL gridsand used for tracking measurement. It is also recorded in the PMT plane behind the cathode forenergy measurement. The primary scintillation recorded by PMTs gives the start-of-event time t0.The EL scintillation recorded by SiPMs, provides the transversal coordinates (x,y) of the track’strajectory and the longitudinal coordinate (z) from the time t of the signal.
Figure 1. The Separated Optimized Functions (SOFT) concept in NEXT TPC. EL light generated at theanode is recorded in the photosensor plane right behind it and used for tracking. It is also recorded in thephotosensor plane behind the transparent cathode and used for a precise energy measurement.
Several NEXT prototypes with up to 1 kg of pure gaseous xenon at 10-15 bar, were recentlybuilt. In the NEXT-DBDM prototype [2], the energy of the events from EL signals was measuredwith a near 1% FWHM resolution from the 662 keV gamma rays of 137Cs, using an array of UVsensitive PMTs. The SiPM tracking plane first developed for the NEXT-DEMO prototype [1],[3],will allow to reconstruct the tracks of these gamma ray events and demonstrate that a large-massgaseous xenon TPC, enriched with 136Xe and EL readout, would provide a possible pathway for arobust double-beta decay experiment.
SiPMs or Multi Pixel Photon Counters (MPPC) have been chosen in NEXT for their manyoutstanding features for tracking purposes. SiPMs offer comparable detection capabilities as stan-dard small PMTs and APDs with the additional advantages of ruggedness, radio-purity and cost-effectiveness, essential for a large-scale radiopure detector. Their main drawback however is theirpoor sensitivity in the emission range of the xenon scintillation (peak at 175 nm, see reference [5]).This makes necessary the use of a wavelength-shifter (WLS) to convert the UV light into visiblelight, where these sensors have their optimal photon detection efficiency (PDE).
– 2 –
Figure 2. The Separated Optimized Functions (SOFT) concept in NEXT TPC. EL light generated at theanode is recorded in the photosensor plane right behind it and used for tracking. It is also recorded in thephotosensor plane behind the transparent cathode and used for a precise energy measurement.
• NEXT-DEMO, shown in figure 4. This is a larger prototype, operating at IFIC, whose pres-sure vessel has a length of 60 cm and a diameter of 30 cm. The vessel can withstand apressure of up to 15 bar. The maximum capacity of the detector is 10 kg but in its currentconfiguration (the fiducial volume is an hexagon of 16 cm diameter and 30 cm length) itholds 4 kg at 15 bar. NEXT-DEMO is also equipped with an energy plane made of 19 Hama-matsu R7378A and a tracking plane made of 300 Hamamatsu MPPCs. The main goals ofthis prototype are: (a) to demonstrate track reconstruction and the performance of MPPCs(coated with a wavelength shifter, TPB, to make them sensitive to xenon VUV, [15]); (b)to test long drift lengths and very high voltages (up to 50 kV in the cathode and 25 kV inthe anode), (c) to understand gas recirculation in a large volume, including operation stabil-ity and robustness against leaks; (d) to understand the transmittance of the light tube, withand without TPB. In summary, to demonstrate the technology to be used by the NEXT-100detector.
• NEXT-MM, a prototype initially used to test the Micromegas technology and currently usedto explore new gas mixtures. NEXT-MM operates at the University of Zaragoza.
The initial results of the prototypes show an excellent energy resolution and tracking capabil-ities, as illustrated in figure 5.
3.2 Major subsystems
Figure 6 shows a sketch of the NEXT-100 detector, indicating all the major subsystems. These are:
– 6 –
Figure 3. The NEXT-DBDM prototype.
• The pressure vessel (described in section 5), built in stainless steel and able to hold 20 barof xenon. A copper layer shields the sensitive volume from the radiation originated in thevessel material.
• The field cage, electrode grids, HV penetrators and light tube, described in section 6.
• The energy plane made of PMTs housed in copper enclosures and connected to a vacuummanifold (section 8).
• The tracking plane made of MPPCs arranged into dice boards (DB). The front-end electron-ics is inside the gas, shielded behind a thick copper plate (section 9).
4. Gas system
The gas system must be capable of pressurizing, circulating, purifying, and depressurizing theNEXT-100 detector with xenon, argon and possibly other gases with negligible loss and withoutdamage to the detector. In particular, the probability of any substantial loss of the very expensiveenriched xenon (EXe) must be minimized. The general schematic of the gas system is given infigure 7 (the re-circulation compressor, vacuum pump and cold traps are not shown). A list ofrequirements, in approximate decreasing order of importance, considered during the design is givenbelow:
– 7 –

Figure 4. The NEXT-DEMO prototype. From left to right and from top to bottom: (a) The pressure vessel,showing the HVFT and the mass spectrometer, (b) the field cage, which provides 30 cm drift length, (c)the light tube, made of Teflon pannels, showing the honey comb for the PMT plane, (d) the energy planeequipped with 19 Hamamatsu R7378A PMTs, (e) the PMTs to be used in NEXT-100, (f) the tracking plane,equipped with 300 Hamamatsu MPPCs.
1. Pressurize vessel, from vacuum to 15 bar (absolute).
2. Depressurize vessel to closed reclamation system, 15 bar to 1 bar, on fault, in 10 secondsmaximum.
3. Depressurize vessel to closed reclamation system, 15 bar to 1 bar, in normal operation, in 1hour maximum.
4. Pressure relief (vent to closed reclamation system) for fire or other emergency condition.
5. Maximum leakage of EXe through seals (total combined): 100 g/year.
6. Maximum loss of EXe to atmosphere: 10 g/year.
7. Accomodate a range of gasses, including Ar and N2.
8. Circulate all gasses through the detector at a maximum rate of 200 standard liters per minute(slpm) in axial flow pattern.
9. Purify EXe continuously. Purity requirements: < 1 ppb O2, CO2, N2, CH4
– 8 –

-50 0 50 100-50
0
50
100
150
0.00
0.02
0.04
0.06
0.08
0.10
0.12
0.14
0.16
0.18
0.20
Only one blob
Xe 35 keV X-ray
X (mm)
y (mm)
Cs-137 Photoelectric electron
Cs-137 energy spectrum
Figure 5. (Left): Energy spectrum measured by NEXT-DBDM using a 137Cs radioactive source. Theenergy of the photoelectric peak is 1% FWHM. This energy resolution extrapolates to ∼0.5% FWHM at theenergies of 136Xe decay. (Right):The topological signature of a photoelectric electron produced at 660 keV(the energy of the 137Cs source used by NEXT-DEMO prototype) is a single-blob at one end of the track(Bragg peak) and a separated satellite cluster due to the fluorescence emission of xenon.
NEXT-100 Pressure Vessel Detector Overall Cross Section
Main Cylindrical VesselTorispheric Heads
Energy Plane, PMTsCu Shield
PMT FTs
Vac. Manifold
HV/Press. relief/Flow/Vac. PortsHV Cable Cu Shield Bars
F.C. InsulatorField Cage Rings
Reflectors
Shielding, External, Cu on Pb
EL mesh planes
EL HV F.T.Cathode Tracking Plane, SiPM
Cu Shield
D. Shuman (LBNL) NEXT-100 Pressure Vessel, Nov. 1, 2011 November 2, 2011 13 / 20
Figure 6. The NEXT-100 apparatus.
The most vulnerable component of the gas system is the re-circulation compressor, that musthave sufficient redundancy to minimize the probability of failure and leakage. Furthermore, topreserve the purity of the gas all seals must be metal-to-metal. The Collaboration has chosen a
– 9 –

V22
EmergColdDump
Service line
V23
EmergExpanssionDump
Dome Loaded Reg
Overpressure Relief
Underpressure Relief
Manual Valve
Regulator
Xe Line
Recirculation Pump
Bursting Disk
Check Valve
Servo Valve
V1
Evacuation Alarm
Gas Analyzer
PressureReferenceP-x
Xe
PressureReferenceValue typicallyP=15 bar
Two parallel Getters and a bypas
UPR1
OPR1
BPR1
BD2
VM1
V21
V21
V20V19
V18
V17
V16
V3
V2
RP1
DLR1
C1
R4
R1
Reduce to 1 barGetter
XeColdRecov
RnTrap 2
XeXe
Shielding
Figure 7. Schematic of the NEXT-100 gas system.
compressor manufactured by SERA R©. This compressor is made with metal-to-metal seals on allthe wetted surfaces. The gas is moved through the system by a triple stainless steel diaphragm.Between each of the diaphragms there is tha sniffer port to monitor for gas leakages. In the eventof a leakage, automatic emergency shutdown can be initiated.
MicroTorr cold getter model number MC4500-902FV has been chosen as the purification filterfor the Xe gas. Capable of removing electron negative impurities to less than 1 ppb, the modelchosen has a nominal flow rate of 200 standard liters per minute, well in excess of the required
– 10 –

flow rates for NEXT-100, thus offering sufficient spare capacity. The gas system will contain twosuch getters in parallel with a bypass. This configuration has been developed and used by thesmaller gas systems operating at the Universidad de Zaragoza and IFIC. The second spare getter isplaced in parallel allowing uninterrupted running in the event of accidental contamination of one ofthe getters. Also, the ability to bypass the getters will allow the testing of the purification of the gasand aid in diagnostic and monitoring of the gas system. While cold getter technology is capable ofreaching the required purity levels in water and oxygen, a hot getter can also remove nitrogen andmethane. In that regard, we foresee to upgrade to a hot getter technology for the enriched xenonrun.
An automatic recovery system of the expensive EXe will be needed to evacuate the chamberin case of an emergency condition. A 30-m3 expansion tank will be placed inside the laboratory toquickly reduce the gas pressure in the system. Additionally, we will implement a similar solution tothat proposed by the LUX collaboration, where a permanently chamber cooled by liquid nitrogenwill be used. Two primary conditions to trigger automatic evacuation are foreseen:
• An over-pressure, that can potentially cause an explosion. Because the gas system for NEXT-100 will be operated in a closed mode the overpressure condition could occur only undertwo possible scenarios: a problem during the filling stage of the operation or a thermalexpansion of the gas due to laboratory fire. In the case of overpressure an electromechanicalvalve, activated by a pressure switch, will open a pipe from the chamber to a permanentlycold recovery vessel. This will then cryo-pump xenon into the recovery vessel, causing thegas to freeze in the recovery tank. In the event of the electromechanical valve failing, amechanical spring-loaded relief valve, mounted in parallel to the electromechanical valve,would open and allow the xenon to be collected in the recovery vessel. A bursting disk willalso be mounted in parallel to the electromechanical and spring-loaded valves as a final safetyfeature.
• An under–pressure, indicating a leak in the system. Such condition would require evacuationof the chamber to prevent losses of gas. If this happens an electromechanical valve sensingunder-pressure will open and evacuate the xenon into the recovery vessel.
We have also considered the scenario in which xenon could leak through some of the photo-multipliers enclosures (leaking can). If this happens the use of a cold trap would permit to recoverthe gas.
To insure the cleanliness of the chamber and the Xe gas system prior to the introduction ofXe both the chamber and the Xe gas system need to be vacuum evacuated to as low pressure aspossible. A reasonably good vacuum is in the range of 10−4 to 10−5 mbar. To achieve this, theturbo-molecular pump needs to be positioned as close as possible to the vessel being evacuated.For that reason, the turbo-molecular pump station will be directly connected as close as possible tothe NEXT-100 vessel through a large conductance valve rated for vacuum and pressure. However,many internal structures of the NEXT 100 detector, such as the light pipe surrounding the activevolume, will not allow good conductance for vacuum evacuation. Therefore, instead of evacuatingthe system from a single point, the vacuum manifold will be connected to several points simulta-neously, and the system heated to 200 C to remove water. Also, flushing with argon several times
– 11 –
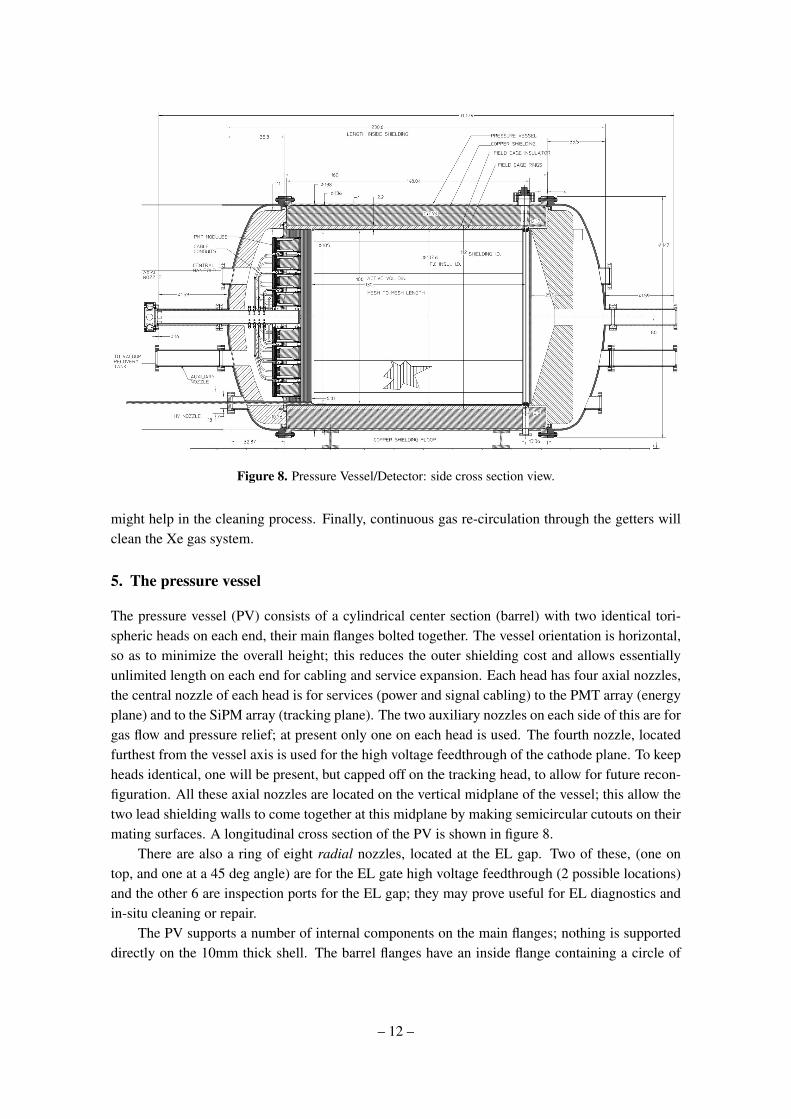
Figure 8. Pressure Vessel/Detector: side cross section view.
might help in the cleaning process. Finally, continuous gas re-circulation through the getters willclean the Xe gas system.
5. The pressure vessel
The pressure vessel (PV) consists of a cylindrical center section (barrel) with two identical tori-spheric heads on each end, their main flanges bolted together. The vessel orientation is horizontal,so as to minimize the overall height; this reduces the outer shielding cost and allows essentiallyunlimited length on each end for cabling and service expansion. Each head has four axial nozzles,the central nozzle of each head is for services (power and signal cabling) to the PMT array (energyplane) and to the SiPM array (tracking plane). The two auxiliary nozzles on each side of this are forgas flow and pressure relief; at present only one on each head is used. The fourth nozzle, locatedfurthest from the vessel axis is used for the high voltage feedthrough of the cathode plane. To keepheads identical, one will be present, but capped off on the tracking head, to allow for future recon-figuration. All these axial nozzles are located on the vertical midplane of the vessel; this allow thetwo lead shielding walls to come together at this midplane by making semicircular cutouts on theirmating surfaces. A longitudinal cross section of the PV is shown in figure 8.
There are also a ring of eight radial nozzles, located at the EL gap. Two of these, (one ontop, and one at a 45 deg angle) are for the EL gate high voltage feedthrough (2 possible locations)and the other 6 are inspection ports for the EL gap; they may prove useful for EL diagnostics andin-situ cleaning or repair.
The PV supports a number of internal components on the main flanges; nothing is supporteddirectly on the 10mm thick shell. The barrel flanges have an inside flange containing a circle of
– 12 –
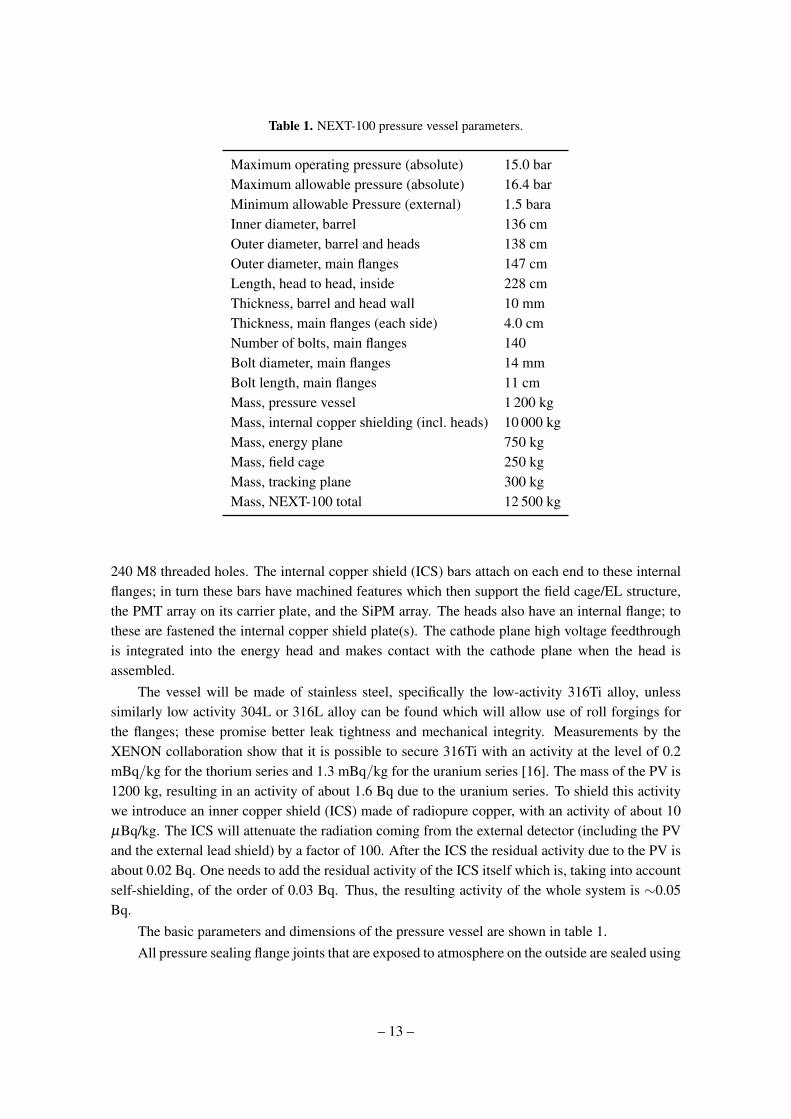
Table 1. NEXT-100 pressure vessel parameters.
Maximum operating pressure (absolute) 15.0 barMaximum allowable pressure (absolute) 16.4 barMinimum allowable Pressure (external) 1.5 baraInner diameter, barrel 136 cmOuter diameter, barrel and heads 138 cmOuter diameter, main flanges 147 cmLength, head to head, inside 228 cmThickness, barrel and head wall 10 mmThickness, main flanges (each side) 4.0 cmNumber of bolts, main flanges 140Bolt diameter, main flanges 14 mmBolt length, main flanges 11 cmMass, pressure vessel 1 200 kgMass, internal copper shielding (incl. heads) 10 000 kgMass, energy plane 750 kgMass, field cage 250 kgMass, tracking plane 300 kgMass, NEXT-100 total 12 500 kg
240 M8 threaded holes. The internal copper shield (ICS) bars attach on each end to these internalflanges; in turn these bars have machined features which then support the field cage/EL structure,the PMT array on its carrier plate, and the SiPM array. The heads also have an internal flange; tothese are fastened the internal copper shield plate(s). The cathode plane high voltage feedthroughis integrated into the energy head and makes contact with the cathode plane when the head isassembled.
The vessel will be made of stainless steel, specifically the low-activity 316Ti alloy, unlesssimilarly low activity 304L or 316L alloy can be found which will allow use of roll forgings forthe flanges; these promise better leak tightness and mechanical integrity. Measurements by theXENON collaboration show that it is possible to secure 316Ti with an activity at the level of 0.2mBq/kg for the thorium series and 1.3 mBq/kg for the uranium series [16]. The mass of the PV is1200 kg, resulting in an activity of about 1.6 Bq due to the uranium series. To shield this activitywe introduce an inner copper shield (ICS) made of radiopure copper, with an activity of about 10µBq/kg. The ICS will attenuate the radiation coming from the external detector (including the PVand the external lead shield) by a factor of 100. After the ICS the residual activity due to the PV isabout 0.02 Bq. One needs to add the residual activity of the ICS itself which is, taking into accountself-shielding, of the order of 0.03 Bq. Thus, the resulting activity of the whole system is ∼0.05Bq.
The basic parameters and dimensions of the pressure vessel are shown in table 1.All pressure sealing flange joints that are exposed to atmosphere on the outside are sealed using
– 13 –

double O-rings in grooves, for both sealing reliability, and to minimize the flange and bolt sizes.The inner O-ring is for pressure sealing; the outer O-ring serves not only as a backup, but also tocreate a sealed annulus which can be continuously monitored for leakage by pulling a vacuum onit with an RGA monitor (sense port). This is the only way to monitor for leakage, however xenonwill permeate through these O-rings and will need to be recovered in a cold trap, the total amountis estimated to be <200 gram/year for butyl or nitrile O-rings, this includes the nozzle flanges andPMT enclosure O-ring leakage. The use of metal C-ring gaskets (special low force design) is beingexplored. The standard sealing force for these gaskets is very high and greatly increases flangethickness and OD. The pressure vessel flanges are being designed with some reserve capacity forthe higher bolt force that would be required for these low force metal gaskets.
The head to vessel flange bolts are Inconel 718; this is the highest strength noncorrosive bolt-ing material allowed in the ASME code. Flange thickness and outer diameter are substantiallyminimized by using the highest possible strength bolting; this mostly compensates for the lowerradiopurity of this material (relative to Inconel 625, the next best alloy) and saves on external shield-ing cost. All nozzles will be as short as possible, with simple flat-faced flanges. This is to reducevessel damage risk, to ease fabrication, and to preserve flexibility in length; extension spools areused to bring services out through the shielding. Nozzle flanges, although being flat-faced (with thedouble O-rings on the spools and caps) use standard CF flange bolt hole pattern; this is to preservethe possibility of using CF components (pressure rated). These could be pre-assembled to doubleO-ring/CF adapter plates, then pressure and leak tested prior to assembling on the nozzle.
The vessel will be built strictly to ASME pressure Vessel Design Code, sec VIII. It has beendesigned almost in full by the collaboration, however the outside fabricator will be required tosupply additional details of fabrication such as weld design for approval, as these can be depen-dent on the in-house capabilities. Fabricator is also responsible for pressure integrity, under ASMErules, and will likely perform their own calculations to verify soundness of design. The Collabo-ration will be specifying many aspects (and approving every aspect) of the design and fabrication,such as: cleaning of joints, weld preparation methods, inspection methods, fabrication sequence,post-weld heat treatments, etc. This is to assure that the unusually high tolerances on dimensionsand radiopurity are met, without needing rework; most pressure vessel manufacturers do not typ-ically deal with these. Our preferred fabricator at this time has experience in vessels for food andpharmaceutical processing, which also typically require a great deal of oversight by the client.
Saddle supports will be welded to the barrel wall, as is standard practice. The barrel willbe bolted through the shielding floor to the seismic platform below. The head/shield assemblieswill first be attached to a precisely adjustable 6-strut support fixture, also known as a hexapod, orStewart Platform. This is a cradle support ring for the head which is connected to a baseplate byadjustable length turnbuckle struts, forming a kinematic mount. This fixture is attached to a set oflinear ball bearing carriages that slide on precision rails that are bolted the shielding floor whenneeded. There is 1 m carriage travel to allow each head to be retracted far enough to clear theCentral Manifold inside. The 6-strut fixture is easily adjusted by hand to mate the head flangesto the barrel flanges with very high precision, whereby they can be bolted together without stress.The adjustments are essentially independent for the three degrees of translation and for roll andyaw about the vessel axis. The pitch adjustment is coupled only with the Z translation (along theaxis) which is easy to deal with since this is also the rail motion direction. This 6-strut fixture will
– 14 –

Table 2. NEXT-100 EL grid parameters
E/P 3.0 kV cm−1 bar−1
Drift field 0.3 kV cm−1
Pressure 15.0 barEL grid gap 0.5 cmDrift length 127 cmGate grid voltage -22.5 kVAnode grid voltage 0Cathode voltage -58 kVOptical gain 2500 photons/e−
also be used to assemble the PMT and SiPM arrays to their attachment points in the barrel.
6. The field cage
The main body of the Field Cage (FC) will be a high density polyethylene (HDPE) cylindrical shellwith a 2.5 cm wall thickness. The drift region will consist of OFHC copper strips connected withlow background resistors. There is also a buffer region between the cathode and PMTs which willbe used to degrade the high cathode voltage safely to ground. Using the parameters in Table 2, theelectric field varies <3% across the fiducial volume.
The light tube (LT) will cover the inner part of the field cage. The presence of a strong electricfield demands, therefore, non conductive material as the substrate for the wavelength shifter. Wehave chosen the same materials studied by the ArDM collaboration. The LT substrate will be ESR(VikuitiTM Enhanced Specular Reflector foil) from the company 3MTM and Tetratex (TTX) fromthe company Donaldson Membranes. The ESR foil is a multilayer specular reflecting polymermeasured to be highly radiopure. Its appearance is that of a polished metal although the materialis non conducting. It has a specular reflection coefficient of practically 100% in a large region ofthe optical spectrum. TTX is an aligned polytetrafluoroethylene (PTFE) fibrous cloth and is nearlya 100% diffuse Lambertian reflector. It is also radiopure (typically less than 1 ppb, which, giventhe very low mass involved, gives a negligible contribution to the radioactive budget) and has lowdegassing. The measured reflectivity of the ESR + TTX foils is about 97% at 430 nm.
The radiopurity of polyethylene has been measured by several collaborations (see Section13). The XENON collaboration has measured a total activity of ∼0.3 mBq/kg. The mass of thepolyethylene is of the order of 100 kg, and thus its contribution to the radioactive budget is orthe order of 0.03 Bq. Adding low background resistors and copper rings we estimate that thecontribution of the field cage will be 0.05 Bq.
The cathode high voltage feedthrough (HVFT) will be constructed using a compression sealapproach as illustrated in Figure 9. A metal rod is pressed into a plastic tube (Tefzel or FEP, whichhave a high dielectric strength) which is then clamped using plastic ferrules from both the pressureside and air side. A sniffer port is placed between the seals to assure that xenon is not leaking. The
– 15 –

Figure 9. Cathode high voltage feedthrough (HVFT) designed for up to 100 kV operating voltage.
Figure 10. EL grids used in NEXT-DEMO.
feedthrough will be attached to a flange located on the energy plane end-cap. A shielded cable willbe connected to the feedthrough and placed through the PMT support plate. The unshielded portionof the cable, with an additional resistive coating, will then run along the inside of the buffer fieldrings and mate with the cathode via a spring loaded junction. This approach, with the exception ofthe resistive coating, has been used in NEXT-DEMO, where a cathode voltage of 45 kV has beenachieved. A smaller prototype was tested to 100 kV in vacuum and 70 kV in nitrogen at 3 bar. Ithas been demonstrated to be leak tight at 10 bar xenon and 10-7 mbar vacuum.
Figure 10 shows the electroluminescent (EL) grids built for the NEXT-DEMO prototype, andTable 2 show the electric parameters. The grids were constructed using a stainless steel mesh witha 0.5 mm pitch and a 30 µm wire diameter, which results in an open area of 88%. The grids are
– 16 –

formed by clamping in a ring with a tongue and groove to hold the mesh and using a tensioningring that is torqued with set screws to achieve the optimum tension. One important issue is that forthe large diameter required in NEXT-100, preliminary estimates show that electrostatic attractionwill cause the EL grids to bow considerably. This can be remedied by using a larger gauge wire.For example, a wire mesh is available with 90 micron wire diameter made from titanium with asimilar open area. We are also investigating the use of titanium or copper grid frames to minimizethe radioactive budget. However, the total mass of the EL and HVFT system is small and the useof low-background steel will be sufficient to keep the radioactive budget acceptable.
7. WLS coating
Xenon scintillates in the VUV range, with a peak at ∼175 nm. On the other hand, the PDE ofMPPCs peaks in the blue region and they have a very low PDE below 200 nm. Furthermore theNEXT PMTs will be enclosed in cans coupled to the gas through sapphire windows which are verytransparent to the visible light but not to UV (UV grade sapphire is extremely expensive). Lastbut not least, the reflectivity of the light tube (made of TTX, a Teflon cloth) is almost 100% in thevisible spectrum and no better than 50% in the VUV region.
Consequently, our strategy in NEXT is to shift the VUV light emitted by xenon to the blueregion using a wavelength shifter molecule, specifically Tetraphenyl-butadiene (TPB) of ≥ 99%purity grade. TPB absorbs light in a wide UV range and re-emits it in the blue with an emissionpeak around 430 nm. The molecule can be applied by vacuum evaporation, and other techniquesfrom crystalline form directly onto surfaces.
7.1 WLS coating of the tracking plane DBs
A TPB procedure to deposit a thin layer of TPB on flat (relatively small) surfaces, such as daughterboards (DBs) and the sapphire windows of the PMT cans has been developed at ICMOL and IFIC.A second procedure to coat large surfaces, such as the NEXT-100 light tube has also been developedat IFIC.
The technique to deposit thin layers in flat surfaces —including glass, quartz, sapphire andteflon— has been developed at the coating facility of the Instituto de Ciencias de Materiales (IC-MOL). Figure 11 shows the evaporator used. As an illustration of the procedure, Figure 12 showsa glass-slice (left) and a prototype DB (right) coated with TPB and illuminated with UV light at240 nm, clearly re-emitting in the blue. The coated glass-slices and DB samples have been testedand characterized at IFIC and ICMOL with different UV light sources. The procedure and resultshave been submitted to publication [15].
7.2 WLS coating of the field cage light tube
The light tubes will consist of thin sheets of TTX, fixed over a 3MTM. The TTX will be vacuumcoated with TPB.
The NEXT collaboration has acquired the large evaporation chamber developed by the ArDMcollaboration, which is currently installed at the IFIC (Figure 13). This is a stainless steel vacuumchamber large enough to house reflector sheets of 120×25 cm2 which have the right size for theNEXT-100 detector. The apparatus consists mainly of two parts, a horizontal tube with pumping
– 17 –

Figure 11. The Evaporator where one can distinguish from bottom to top, the crucibles and the deposition-sensors, the shutter, the sample-holder supported by a spinning disk and the vacuum chamber which is closeddown during evacuation and coating.
Figure 12. Illumination with 240 nm UV light of a glass-slice (left) and a 5-SiPM board (right) both coatedwith TPB.
connection on its closed end and a slide-in array of 13 crucibles mounted onto a Viton-sealed accessflange. The crucibles are electrically connected in series for better uniformity and lower total supplycurrent (∼10A). The reflector sheets are supported by 100µm wires in a crescent arrangement forconstant distance to the crucibles. An evaporation cycle is started by filling the crucibles with TPBpowder and positioning the TTX reflector sheet on its support.
After this preparation the sheets were inspected optically with a UV lamp (Figure 14) showingthe characteristic re-emission in the blue.
– 18 –

evaporator
Figure 13. The large evaporation chamber, details.First results
VikuitiTM 3MTM Foils
Optical inspection shining a 3MTM foil with 260nm lamp.
Left with TPB. Right without TPB
TTX on 3M foil with TPB illuminated with a UV
lamp. Piece of TTX above with out TPB
Figure 14. Response of the light tube foil (ESR+TTX) after coating, showing the characteristic blue lightemission when illuminated by a UV lamp. In the upper part of the picture the same foil without coating.
8. The energy plane
The energy measurement in NEXT is provided by the detection of the electroluminescence light byan array of photomultipliers, the energy plane, located behind the cathode. Those PMTs will alsorecord the scintillation light that indicates the start of the event.
– 19 –

Figure 15. The Hamamatsu R11410-10 photomultiplier. This is a large PMT, 3 inches in diameter, with anaverage radioactivity of 3.3 mBq for the uranium chain and 2.3 mBq for the thorium chain.
A total of 60 low-background, high-QE PMTs, model R11410-10 from Hamamatsu (figure15), covering 32.5% of the cathode area constitute the energy plane. These are large tubes, witha 3” photocathode and low levels of activity of the order of 2.5 mBq per unit in the uranium and2.5 mBq per unit in the thorium series, the only relevant backgrounds for NEXT. The QE of theR11410-10 model is around 25% both in the VUV and in the blue region.
PMTs are sealed into individual pressure resistant, vacuum tight copper enclosures (cans)coupled to sapphire windows. The cans are all connected via individual pressure resistant,vacuumtight tubing conduits to a central manifold. The PMT cans are maintained at vacuum well belowPaschen minimum, avoiding sparks and glow discharge across PMT pins.
The PMT coverage is a compromise between the need to collect as much light a possible forenergy resolution and the measurement of t0 and the need to minimize the number of sensors, toreduce cost, complexity and radioactive budget.
To gain a quantitative idea, let’s first consider the detection of scintillation light. The numberof photons that arrive to the PMT housing windows depends on the properties of the reflector aswell as the transparency of the EL grids. Our simulation shows that a light tube coated with TPBand providing 90% diffuse reflectivity will transfer 9% of the photons.
Assume now that an event is produced near the EL grids (the worst scenario for the detectionof primary scintillation light with the cathode PMTs). A recent measurement of the energy neededto produce a scintillation photon, carried out within the context of the NEXT R&D [17] yields:
Ws = 76±6 eV (8.1)
or 13 158 scintillation photons per MeV. Then the number of photoelectrons (pes) detected by thePMTs at the cathode is:
(13158 photons/MeV)×C×TR×TW ×QE
where C is the cathode coverage, TR is the reflector transfer function, TW is the housing windowtransfer function and QE is the PMT quantum efficiency. Monte Carlo simulation yields TW =
– 20 –
Pressure Vessel HeadCopper Shield
Pressure Relief Nozzle
NozzleCentral Manifold
PMT ModulesHV Cathode Contactor
Module Carrier PlateInternal PV Flange
HV Cable/ReceptacleHV FeedthroughOctagonFeedthrough/vac ports
Conduits
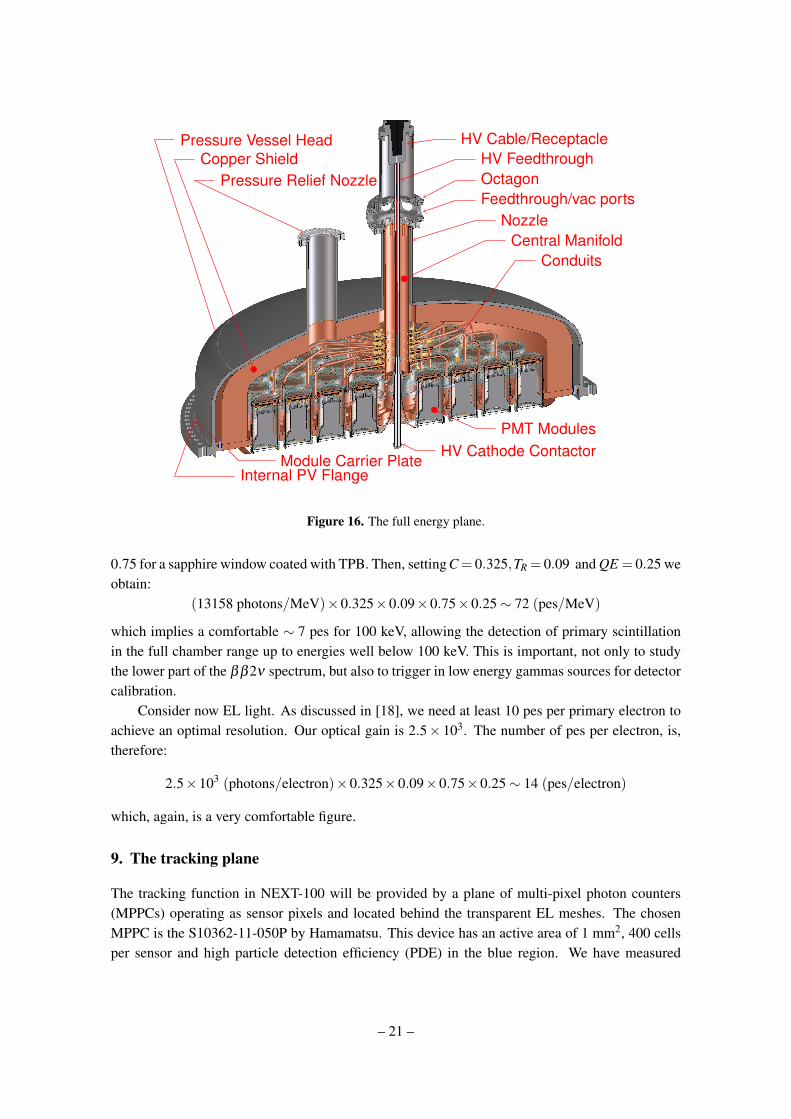
Figure 16. The full energy plane.
0.75 for a sapphire window coated with TPB. Then, setting C = 0.325,TR = 0.09 and QE = 0.25 weobtain:
(13158 photons/MeV)×0.325×0.09×0.75×0.25∼ 72 (pes/MeV)
which implies a comfortable ∼ 7 pes for 100 keV, allowing the detection of primary scintillationin the full chamber range up to energies well below 100 keV. This is important, not only to studythe lower part of the ββ2ν spectrum, but also to trigger in low energy gammas sources for detectorcalibration.
Consider now EL light. As discussed in [18], we need at least 10 pes per primary electron toachieve an optimal resolution. Our optical gain is 2.5× 10³. The number of pes per electron, is,therefore:
2.5×10³ (photons/electron)×0.325×0.09×0.75×0.25∼ 14 (pes/electron)
which, again, is a very comfortable figure.
9. The tracking plane
The tracking function in NEXT-100 will be provided by a plane of multi-pixel photon counters(MPPCs) operating as sensor pixels and located behind the transparent EL meshes. The chosenMPPC is the S10362-11-050P by Hamamatsu. This device has an active area of 1 mm2, 400 cellsper sensor and high particle detection efficiency (PDE) in the blue region. We have measured
– 21 –

Sapphire window EnclosureScrew-down Ring
PEEK RingAntirotation washer
Kapton ShimO-ring PMT
SpringBand Clamp
Clamp Mount
Optical Coupling Pad
Conduit FittingBackplate
Heat SpreaderRetaining Ring
PottingBase
Figure 17. A photomultiplier inside its enclosure.
the spread in gain between the sensors to be less than 4%, while the average in gain is (2.27–2.50)× 105. These values provide a homogeneous response of the plane, and ensure the correctresolution for the reconstruction of ββ events. Last but not least, MPPCs are very cost effectiveand its activity is very low, given its composition (mainly silicon) and very light mass. The levelof the dark current is at about 5 photoelectrons per microsecond, less than 3% of the total chargecollected. In NEXT-100 a digital threshold at the 6 p.e. level should lead to an insignificant noiserate. An automatic system to compensate temperature differences by adjusting the bias voltage hasalso been tested successfully and will be implemented in NEXT-100.
The MPPCs will be mounted in Dice Boards (DB). These are square boards made of cuflon(PTFE fixed to a copper back plane). Figure 18 shows one of the DB of the NEXT-DEMO proto-type, holding 4×4 pixels. NEXT-100 DB will be similar, but containing 8×8 pixels.
The pitch of the NEXT-100 tracking planes is a compromise between several constraints im-posed by physics:
1. An electron moving in dense gas does not behave exactly as a minimum ionizing particle.Instead, it loses a significant part of its energy by the emission of discreet delta rays andbremsstrahlung radiation. The “photon cloud” associated to the electron has an rms distribu-tion of the order of 1 cm.
2. Transverse diffusion in pure xenon is large, and the typical rms of the charge distribution forelectrons produced in the center of the chamber is of the order of 1 cm.
– 22 –

Figure 18. Dice Board containing 16 (4×4) MPPCs.
3. Identifying low-energy photons (e.g, x-rays of 35 keV) nearby the electron track is an extrahandle to label background events (e.g, photoelectric events in the 214Bi peak). Photon-trackseparation is directly proportional to pitch.
A pitch significantly smaller than 1 cm is not useful due to charge dispersion and the photoncloud. Conversely, as the pitch increases, the background rejection capability decreases. MonteCarlo studies show that a reasonable tradeoff may be found for pitches between 1 cm and 1.5 cm.While physics performance appears not to degrade too much with pitch in that region, the numberof pixels decreases with the square of the pitch. A reasonable compromise appears to be 1.1 cm,which in turn requires about 7 000 pixels.
10. Front-end electronics and DAQ
The DAQ follows the modular architecture described in [3], named the Scalable Readout System(SRS). At the top of the hierarchy, a PC farm running the DAQ software, DATE, receives eventdata from the DAQ modules via GbE (gigabit Ethernet) links. The DATE PCs (Local Data Con-centrators, LDCs) assemble incoming fragments into sub-events, which are sent to an additionalPC (Global Data Concentrator, GDC). The GDC builds the complete event and stores it to disk foroffline analysis.
The DAQ modules used are Front-End Concentrator (FEC) cards, which serve as the genericinterface between the DAQ system and application-specific front-end modules. The FEC modulecan interface different kinds of front-end electronics by using the appropriate plug-in card. TheFEC card and the overall SRS concept have been developed within the framework of the CERN RD-51 Collaboration. Three different FEC plug-in cards are used in NEXT-100. The cards responsiblefor the energy plane readout digitization and for the trigger generation are described in Sec. 10.1,where the energy plane analog front-end is also described. The tracking plane readout, describedin Sec. 10.2, uses a third type of plug-in card.
10.1 Electronics for the energy plane
The front-end (FE) electronics for the PMTs in NEXT-100 will be very similar to the system de-
– 23 –

veloped for the NEXT-DEMO and NEXT-DBDM prototypes. The first step in the chain is to shapeand filter the fast signals produced by the PMTs (less than 5 ns wide) to match the digitizer andeliminate the high frequency noise. An integrator is implemented by simply adding a capacitor anda resistor to the PMT base. The charge integration capacitor shunting the anode stretches the pulseand reduces the primary signal peak voltage accordingly.
Our design uses a single amplification stage based on the fully differential amplifier THS4511,which features low noise (2nV/
√Hz) and provides enough gain to compensate for the attenuation
in the following stage, based on a passive RC filter with a cut frequency of 800 kHz. This filteringproduces enough signal stretching to allow acquiring many samples per single photo-electron at40MHz. The front-end circuit for NEXT-DEMO was implemented in 7 channel boards and con-nected via HDMI cables to 12-bit 40-MHz digitizer cards. These digitizers are read out by theFPGA-based DAQ modules (FEC cards) that buffer, format and send event fragments to the DAQPCs. As the FEC card, also the 16-channel digitizer add-in card has been designed as a joint effortbetween CERN and the NEXT Collaboratio within the RD-51 R&D program. These two cardsare edge mounted to form a standard 6U×220 mm eurocard. The energy plane readout system forNEXT-100 will use 4 FEC cards to read 60 PMT channels.
An additional FEC module with a different plug-in card is used as trigger module. Besidesforwarding a common clock and commands to all the DAQ modules, it receives trigger candidatesfrom the DAQ modules, runs a trigger algorithm in the FPGA and distributes a trigger signal. Thetrigger electronics accepts also external triggers for detector calibration purposes.
10.2 Electronics for the tracking plane
The tracking plane will have∼ 7 000 channels. Passing all those wires across feedthroughs, as it hasbeen done for NEXT-DEMO, is possible but challenging, and probably not optimal. Consequentlywe are developing a new in-vessel FE electronics that reduces the total number of feedthroughs toan acceptable level. Here we present the new electronics readout architecture.
Since the electronics will be inside the PV, it must necessarily be very low power to minimizethe heat dissipated inside the vessel. Our design consists of a very simple Front-End Board (FEB,Fig. 19) to be placed inside the detector. The 64-ch FEB takes the input of a single DB (transmittedvia low-crosstalk kapton ribbon cables) and includes the analog stages, ADC converters, voltageregulators and an FPGA that handles, formats, buffers and transmits data to the outer DAQ. LVDSclock and trigger inputs are also needed. A total of 110 FEBs are required.
The low power consumption is achieved by using a passive RC circuit and ultra low poweramplifiers, rather than gated integrators and power-hungry devices as was done in NEXT-DEMO.Figure 20 shows our design for the analog stage. It is a three-stage circuit, with a gain of 10 in eachstage. The first two stages are based on the AD8012 (two amplifiers per package, very low noise)and the last one on the AD8005 (ultra low power, 400 µA quiescent current). The total gain is (Rt isthe input termination resistance) 103×Rt = 5×10⁴, as the first stage is a transimpedance amplifierwith gain of 10×Rt = 5×10². A passive, 2 µs time-constant RC circuit (200 pF, 10 kΩ betweenthe second and the third stage) acts as the circuit integrator. This gain will result in a 1 V outputfor a 250-pe dynamic range. Total electronic noise in the amplifier circuit is very low according tothe simulations: 1.7 mV rms. A preliminary estimation for the power dissipation due to the analogstage yields 30 mW per channel, or 210 W in total. Additional power dissipation in the FEB comes
– 24 –
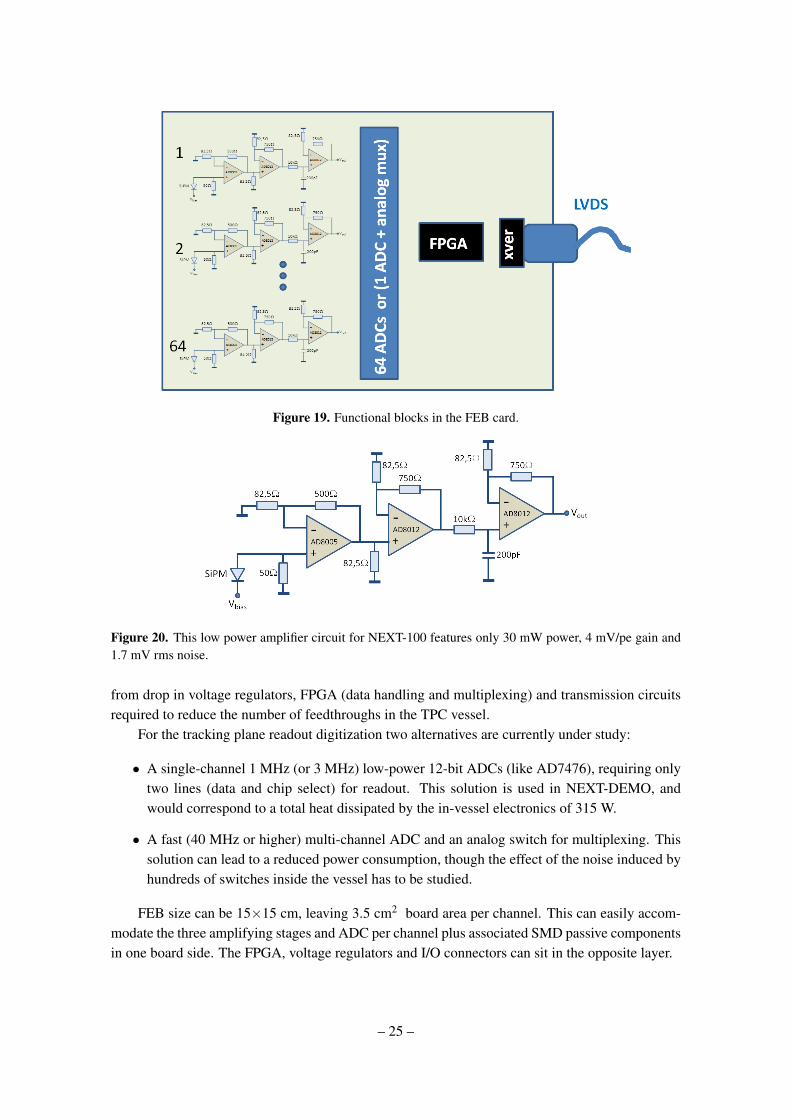
Figure 19. Functional blocks in the FEB card.
Figure 20. This low power amplifier circuit for NEXT-100 features only 30 mW power, 4 mV/pe gain and1.7 mV rms noise.
from drop in voltage regulators, FPGA (data handling and multiplexing) and transmission circuitsrequired to reduce the number of feedthroughs in the TPC vessel.
For the tracking plane readout digitization two alternatives are currently under study:
• A single-channel 1 MHz (or 3 MHz) low-power 12-bit ADCs (like AD7476), requiring onlytwo lines (data and chip select) for readout. This solution is used in NEXT-DEMO, andwould correspond to a total heat dissipated by the in-vessel electronics of 315 W.
• A fast (40 MHz or higher) multi-channel ADC and an analog switch for multiplexing. Thissolution can lead to a reduced power consumption, though the effect of the noise induced byhundreds of switches inside the vessel has to be studied.
FEB size can be 15×15 cm, leaving 3.5 cm2 board area per channel. This can easily accom-modate the three amplifying stages and ADC per channel plus associated SMD passive componentsin one board side. The FPGA, voltage regulators and I/O connectors can sit in the opposite layer.
– 25 –

In addition to power consumption, another key figure of merit is FEB throughput. Datafrom the 6 800 SiPM channels must be sent across the PV. Minimizing the number of vacuumfeedthroughs is a must, and this number is directly proportional to the aggregated throughput. Tothis end, we envisage the FEB readout to be zero suppressed and triggered.
Zero suppression implies that every microsecond (the ADC sampling period), only channelswith a charge readout above an adjustable threshold will send digitized and timestamped data tothe DAQ module, where the data are stored in a circular buffer. Raw data mode of operation, whereno zero suppression occurs at the online level, will also be supported for testing purposes.
Additionally, FEB data will be read in triggered mode. For a 10 Hz trigger rate and a 2 ms eventduration, a triggered FEB readout may further reduce the FEB throughput by a factor of 50 withrespect to a continuous readout. In continuous readout mode, no trigger exists at the front-end level,and (zero-suppressed) data are sent continuously to the DAQ module, every microsecond. Once atimestamped trigger arrives to the DAQ module, the right data time interval is read from the DAQmodule circular buffer and sent to the DATE online system for event building. In triggered readoutmode, on the other hand, FEB data are sent to the DAQ module only in the presence of a trigger.The reduced throughput of the triggered mode comes at the cost of increased complexity, as circular(ring) buffers are needed at the FEB level. Quantitatively, 7 000 channels produce approximately 20MByte/event in raw data mode (no zero suppression). A 10 Hz FEB trigger rate implies thereforea 200 MByte/s, or 1,6 Gb/s, throughput. This is an acceptable number.
The necessary FEB circular buffer size has also been estimated, and possible solutions havebeen identified. One full event (2 000 samples) requires 2.000×64×12 bit, that is 1.5 Mb buffersize. For zero-dead-time operation the buffer must be large enough to be continuously filled. Abuffer of about 10 ms is threfore needed, assuming a 200 Mb/s link speed to read the buffer. Aconservative estimate for the FEB buffer size is therefore 7.5 Mb. This is feasible with Xilinx ArtixFPGAs (XC7A200T), that has an internal 13.5 Mb memory. A trade-off between readout speedand buffer size must be found in order to minimize cost and power: data links must a have a lowspeed for the sake of reduced power consumption, cheaper electronics, reduced FEB noise andenhanced signal integrity. Careful evaluation of copper and optical link solutions will provide theright compromise between buffer size, power dissipation, reliability and cost.
The number of FECs and of Local Data Concentrator (LDC) PCs for the tracking partition ofthe DAQ is determined by the tracking plane throughput and by the speed of the links (from thein-vessel electronics to the FEC card, and from the FEC card to the LDC PC). As discussed above,the tracking plane will produce 1.6 Gb/s data at most (10 Hz triggered mode, no zero suppression).Assuming 400 Mb/s as a comfortable working point for the gigabit Ethernet links between theFECs and the LDCs, 4 LDCs are required. Assuming 200 Mb/s link speed (LVDS over copper)from the in-vessel electronics to the DAQ (the same speed and technology used in NEXT-DEMOfor the SiPM plane readout), the existing 16-link LVDS add-in card for the FEC module can beused. The 110 links coming from the vessel require then 110/16=7 FEC cards. We therefore need7 FECs and 4 LDCs in the tracking DAQ partition, as shown in Fig. 21. This is approximately thesize of the full NEXT-DEMO DAQ system.
– 26 –

Figure 21. The NEXT-100 SiPM plane can be read out with 4 LDCs and 7 FECs.
11. Shielding
A relatively simple lead castle shield has been chosen for simplicity and cost-effectiveness. Thelead wall has a thickness of 20 cm and is made of four layers of staggered lead bricks and copper orsteel sheets. The lead bricks have standard dimensions (200×100×50 mm3), and, by requirement,an activity in uranium and thorium lower than 0.4 mBq/kg.
The detector itself is placed on top of a seismic structure called the detector pedestal, DP,independent of the working platform (WP), and of the lead castle (LC). The DP is anchored tothe ground and supports all the weight of the detector and the LC. The WP is designed to stand auniform load of 300 kg/m2 and a concentrated load of 200 kg/m2.The platform is anchored to thehall ground and walls. Notice that the WP and the DP structured are independent to allow seismicdisplacements in the event of an earthquake. The platform floor tiles are made of galvanized steeland have standard dimension to minimize cost. All beams and pillars of the WP are designed withIPE and HEB cross sections, IPE-100 for pillars, HEB-240 for seismic beams and HEB-500 formain seismic beams.
The movable lead castle has and open and a close position. The open position is used for theinstallation and service of the pressure vessel. The closed position is used normal operations. TheLC itself is made of two halves mounted on a system of wheels that move on tracks with the helpof an electric engine. The system includes a lifting device and a lock for each wheel.
The lifting devices elevates all the wheels from 5 to 10 mm above the guides. Once in thedesired position the lock fixes the movable lead castle to the seismic structure, both in the open andin the closed position, to avoid seismic displacements during an eventual earthquake.
12. NEXT-100 at the LSC
NEXT 100 detector and ancillary systems are intended to commence for installation at the LSC inthe second quarter of 2012. Figure 23 shows an image of Hall A, future location of NEXT 100.The pool-like structure is intended to be a catchment reservoir to hold Xe or Ar1 gas in the event
1ArDM will be the neighbor of NEXT 100 in Hall A.
– 27 –
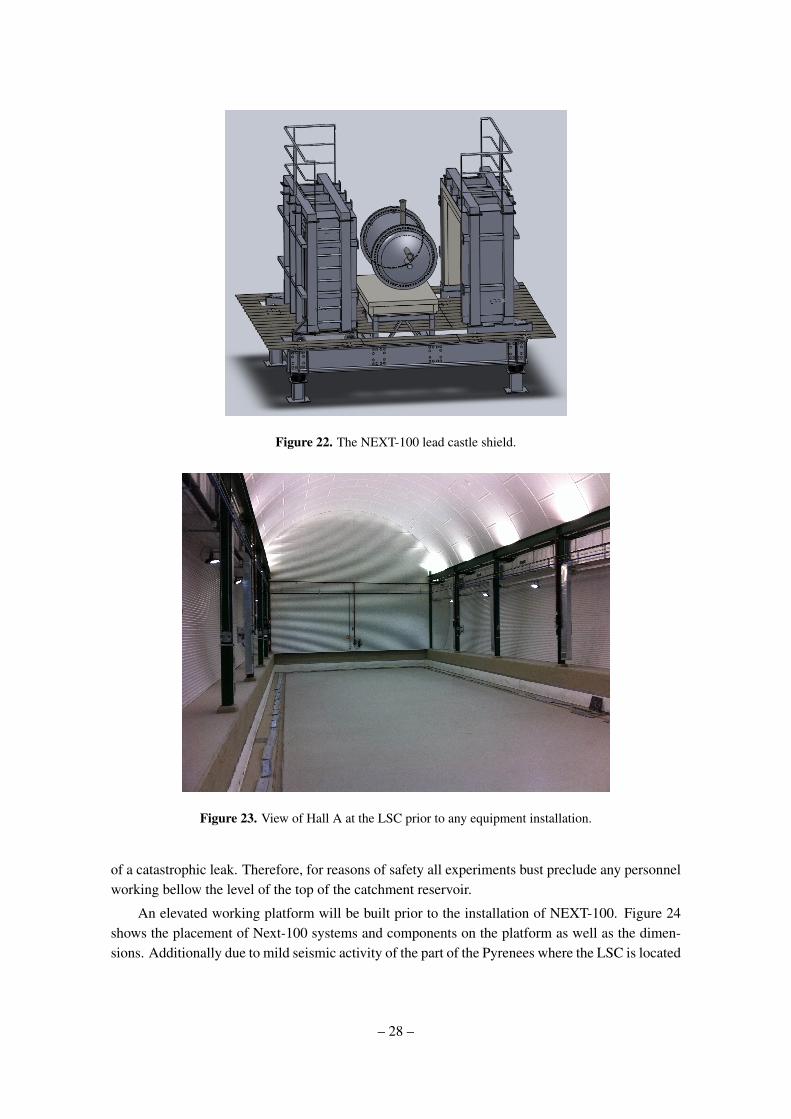
Figure 22. The NEXT-100 lead castle shield.
Figure 23. View of Hall A at the LSC prior to any equipment installation.
of a catastrophic leak. Therefore, for reasons of safety all experiments bust preclude any personnelworking bellow the level of the top of the catchment reservoir.
An elevated working platform will be built prior to the installation of NEXT-100. Figure 24shows the placement of Next-100 systems and components on the platform as well as the dimen-sions. Additionally due to mild seismic activity of the part of the Pyrenees where the LSC is located
– 28 –

Figure 1.35: NEXT-100 lead castle and platform at the LSC
43
f. The xenon expansion tank also described in chapter 8.782
g. Power and DAQ racks.783
h. Other devices (e.g, slow controls).784
i. Gas and cable pipes (not show in the figure).785
In this chapter we present an integrated design of the working platform (WP), the786
seismic structure to hold the detector (a.k.a. detector pedestal, DP) and the lead castle787
(LC) itself.788
Figure 1.36: Top view of the layout
Figure 9.2 shows a top view of the layout, with dimensions. The platform has a789
squared shape, with dimensions of 11 × 11 m2 meters and useful surface of 112 m2. It790
includes a safety area with a length of about 2 meters to provide clear access in case of791
an emergency.792
The DP, WP and LC are composed of modular and standard elements which will793
be manufactured by a supplier. All beam welding and most of the bolting will be done794
44
Figure 24. Left: Intended location of the components and subsystems for the operation of NEXT 100 on theworking platform: (a) NEXT-100; (b) the lead castle in its open configuration; (c) gas purification system;(d) working platform; (e) seismic platform; (f) emergency gas vent tank; (g) data acquisition system; (h)other systems. Right: Top view showing the dimension of the working platform.
the heavy lead castle and NEXT 100 will be placed on seismically isolated platform.Work is underway, in coordination with LSC staff to refine and complete the design of each
relevant element, and the integration of all the systems.
13. Radioactive budget
13.1 Sources of background in NEXT214Bi and 208Tl
The ββ0ν peak of 136Xe is located in the energy region of the naturally-occurring radioactiveprocesses. The half-life of the parents of the natural decay chains, of the order of the age of theuniverse, is, however, very short compared to the desired half-life sensitivity of the new ββ0ν
experiments (∼ 1026 years). For that reason, even small traces of these nuclides create notableevent rates.
The only significant backgrounds for NEXT are the high energy gammas produced in theβ -decays of the isotopes 208Tl and 214Bi, found in the thorium and uranium series, respectively.
The daughter of 208Tl, 208Pb, emits a de-excitation photon of 2614 keV with a 100% intensity.The Compton edge of this gamma is at 2382 keV, well below Qββ . However, the scattered gammacan interact and produce other electron tracks close enough to the initial Compton electron so theyare reconstructed as a single object falling in the energy region of interest (ROI). Photoelectricelectrons are produced above the ROI but can loose energy via bremsstrahlung and populate thewindow, in case the emitted photons escape out of the detector. Pair-creation events are not able toproduce single-track events in the ROI.
After the decay of 214Bi, 214Po emits a number of de-excitation gammas with energies above2.3 MeV. The gamma line at 2447 keV (intensity: 1.57%) is very close to Qββ . The photoelectricpeak infiltrates into the ROI for resolutions worse than 0.5%. The gamma lines above Qββ havelow intensity and their contribution is negligible. The contribution of pair-creation events is alsoinsignificant.
– 29 –

Radon
Radon constitutes a dangerous source of background due to the radioactive isotopes 222Rn (half-lifeof 3.8 d) from the 238U chain and 220Rn (half-life of 55 s) from the 232Th chain. As a gas, it diffusesinto the air and can enter the detector.
214Bi is a decay product of 222Rn, and 208Tl a decay product of 220Rn. In both cases, the radonsuffers from an alpha decay into polonium, producing a negative ion which is drifted towards theanode by the electric field of the TPC. As a consequence, 214Bi and 208Tl contaminations can beassumed to be deposited on the anode surface. Radon may be eliminated from the TPC gas mixtureby recirculation through appropriate filters. There are also ways to suppress radon in the volumedefined by the shielding, whether this is a water tank or a lead castle.
Radon control is a major task for a ββ0ν experiment, and will be of uppermost importancefor NEXT.
Cosmic rays and laboratory rock backgrounds
Cosmic particles can also affect our experiment by producing high energy photons or activatingmaterials. This is the reason why double beta decay experiments are conducted deep underground.At these depths, muons are the only surviving cosmic ray particles, but their interactions with therock produce neutrons and electromagnetic showers. Furthermore, the rock of the laboratory itselfis a rather intense source of 208Tl and 214Bi backgrounds as well as neutrons.
The above backgrounds can be reduced below those intrinsic to the detector by shielding,as described in the previous section. In addition, given the topological capabilities of NEXT theresidual muon and neutron background do not appear to be significant for our experiment.
13.2 Contribution of the main materials used in NEXT
Information on radiopurity of the materials expected to be used in the construction of NEXT100has been compiled, performing specific measurements and also examining data from the literaturefor materials not yet screened. In this executive summary we just present a brief summary of ourdetailed data base. A full report can be found online at the NEXT database web page2.
NEXT has the structure of a Matrioska, or russian doll. The flux of gammas emanating fromthe LSC walls is drastically attenuated by the lead castle (LC), and the residual flux, together withthat emitted by the lead castle itself and the materials of the pressure vessel is further attenuatedby the inner copper shield (ICS). The ICS also attenuates the flux emitted by the tracking planeFE electronics (FEE), which sits behind it. One then needs to add the contributions of the “innerelements” in NEXT: field cage (FC), energy plane (EP), and the elements of the tracking plane(TP) not shielded by the ICS.
Thus, the basic ingredients in the NEXT background model recipe are:
1. The radiation emanating from the Matrioska, which includes the residual radiation emanatingfrom the LSC walls, from the LC, from the PV and from the FEE, after being attenuated bythe ICS.
2http://next.ific.uv.es/cgi-bin/DocDB/public/ShowDocument?docid=76
– 30 –

Table 3. Activity (in mBq/kg) of the most important materials used in NEXT. The numbers are selectedfrom the detailed report available at the NEXT webpage.
Material NEXT system Reference 238U 232ThPb Shield Cometa (supplier) 0.37 0.07Cu ICS Luvata (supplier) <0.012 < 0.004Steel (316Ti) PV XENON [16] < 1.9 < 1Inconel 718 PV LSC <5.6 < 13.8Inconel 625 PV LSC <2.4 <6.0Peek FC/EP/TP Unizar 36 11.7Capacitors (Tantalum) FC/EP/TP Unizar [19] 320 1.23×10³
SMD Resistors, Finechem (per pc) FC Unizar 0.022 0.048Polyethylene FC XENON [16] 0.23 <0.14TTX LT ArDM [20] 12.4 1.6TPB LT/EP/TP A. Chemicals [21] 1.63 0.47PTFE (Teflon) EP/TP/DB GERDA [22] 0.025 0.031PMT (R11410-MOD per pc) EP XENON [16] < 2.5 < 2.5PMT (R11410-MOD per pc) EP LUX [23] < 0.4 < 0.3Sapphire window EP EXO [24] 0.31 0.12CUFLON TP ICPMS [25] 0.36 0.28Kapton cable TP/EP KAPPA [19] 14 39
2. The residual radiation emanating from the ICS, after being attenuated (self-shielding) by theICS itself.
3. The radiation emanating from the inner elements, namely the FC, the EP and the TP.
The only relevant backgrounds for NEXT are the photons emitted by the 208Tl line (2614.5keV) and the 214Bi line (2448 keV). These lines sit very near Qββ and the interaction of the photonsin the gas can fake the ββ0ν signal, as we will discuss in the next section.
Our first step, therefore, is to quantify the number of photons crossing the gas emanating fromthe different sources enumerated above.
The activity for each material is given in Table 3 in terms of 238U or 232Th decays per unit oftime and mass. The high energy photons relevant for NEXT should then be computed by takinginto account the branching ratio of the mother nucleus decaying into 214Bi or 208Tl (that is 1 and∼ 1/3 respectively), plus the branching ratio of the daughter nucleus itself into the dangerousgamma, plus a geometric factor which reflects the fact that photons coming from nuclear decaysare emitted in all directions and not all of them get to reach the gas. The second and the third aspectare included in the rejection factor of background calculated through Monte Carlo (see Section ??).Thus, in the following, the numbers of photons per year are actually the numbers of photons due toa decay of 214Bi or 208Tl (the branching ratio of thorium into thallium is already included), before
– 31 –

the correction for the branching ratio and geometric factor. The only exception is the contributionfrom the LSC walls, which has been measured.
Contribution from the Matrioska
In the following, the contribution to the total activity of each one of the shells of the Matrioska isdescribed and the photon rates are shown in Table 4.
The flux of photons emanating from the LSC walls is[26]:
1. 0.71±0.12 γ/cm2/s from the 238U chain.
2. 0.85±0.07 γ/cm2/s from the 232Th chain.
These measurements include all the emissions in each chain. The flux corresponding to the208Tl line at 2614.5 keV and the flux corresponding to the 214Bi line at 1764.5 keV were alsomeasured (from this last measurement it is possible to deduce the flux corresponding to the 2448keV line). The results are:
1. 0.13±0.01 γ/cm2/s from the 208Tl line.
2. 0.006±0.001 γ/cm2/s from the 214Bi line at 2448 keV.
The photon flux through the surface of the lead castle is 4.3×10¹⁰ and 9.3×10¹¹ photons peryear for 214Bi and for 208Tl respectively.
The LC is made of radiopure lead. The thickness of the shield is 20 cm and the total mass of thecastle is 60 tons, the supplier being most likely COMETA. The activity of the other componentsof the lead castle (e.g, external steel support infrastructure) after self-shielding from the lead isnegligible compared with the contribution of the lead itself. Notice that the photon rate emitted bythe LC is much larger than the residual contribution from the LSC walls in the 214Bi contaminationand about the same in 208Tl.
The PV is made of radiopure 316Ti alloy and its total mass is 1 200 kg. We assume the activitymeasured by the XENON collaboration (measurements of 316Ti samples are currently under way atthe LSC). The PV does not act like a shield, but it still respects the Matrioska principle in the sensethat the background rate that it adds is of the same order of magnitude (actually slightly larger)than the residual background from the outer shell. Other elements of the PV such as the Inconelscrews add a small contribution. Their specific activity adds a 12.5% (20%) extra background ratein 214Bi (208Tl) to the PV itself.
The inner copper shield is the most radiopure shell of the Matrioska. It is made of radiopurecopper and its total mass is 1 200 kg. We consider the activity measured by the supplier (Luvata).The ICS attenuates the radiation coming from the outer shell by two orders of magnitude, andcontributes with a background rate that is almost identical to the residual background. The finalrate is 106 214Bi photons a year and about one order of magnitude less in 208Tl.
Contribution from the inner elements
The contribution to the total activity from the inner elements is summarized in Table 5.The tracking plane is made of the supporting structure for the DBs (a honeycomb made of
PTFE), and the DB themselves, 110 boards made of Cuflon, each weighting about 250 grams. Each
– 32 –

Table 4. Number of photons per year outgoing each shell of the Matrioska. The numbers in bold font arethe residual photons after all the shells.
from previous vol after from current vol totalpassing through current vol (self shielded)214Bi 208Tl 214Bi 208Tl 214Bi 208Tl
LC 8.8×10⁴ 1.9×10⁶ 3.2×10⁷ 2.1×10⁶ 3.2×10⁷ 4.0×10⁶
PV 1.2×10⁷ 1.6×10⁶ 4.5×10⁷ 7.8×10⁶ 5.7×1.12×107 9.4×1.2×106
ICS 5.6×10⁵ 9.8×10⁴ 5.2×10⁵ 5.9×10⁴ 1.0×10⁶ 1.6×10⁵
Table 5. Number of photons per year emitted by the inner elements.
214Bi 208Tl
TP 3.2×10⁵ 8.2×10⁴
EP 8.6×10⁵ 2.8×10⁵
FEE 7.2×10⁵ 5.7×10⁵
FC 8.2×10⁵ 1.7×10⁵
DB has 64 MPPCs (glued to the DB with silver epoxy). Each DB has 1 resistor and 2 capacitors.The dominant contribution comes from the DBs themselves, while the addition due to resistors andcapacitors is more than two orders of magnitude lower, thus negligible. The contribution of thesupport structure is also small.
The energy plane is composed of 60 individual modules plus a vacuum manifold. Each moduleconsists of: (a) one PMT; (b) one PMT base; (c) the can, including its window, support structures,etc. The Hamamatsu R11410-MOD PMTs have been measured by the XENON and the LUXcollaborations, and a new measurement is under way at the LSC. Since both measurements arecompatible (both are upper limits) we take the lowest limit (see Table 3).
The tracking plane front end electronics (FEE) sits behind the ICS and thus its contributionto the radioactive budget is attenuated by a factor 100. The bulk of the FEE are the 110 front endboards (FEBs). Each FEB will have about 750 resistors and 1100 capacitors.
The dominant source of background in the field cage is the polyethylene used as an insulatorand support of the field cage rings. The FC support has a mass of 110 kg. The contribution ofthe metal wires (made of radiopure copper) as well as those of the resistors is negligible comparedwith that of the polyethylene.
Total radioactive budget
Notice that the leading contribution to the budget (e.g, in the 214Bi contamination) of the Matrioska(including LC, PV and ICS), energy plane, field cage and FEE are very similar. An importantconsequence of this is that a substantial reduction of the radioactive budget can only be achieved if
– 33 –

X (mm)0 50 100 150 200
Y (
mm
)
-300
-250
-200
-150
Figure 25. Double beta decay events have a distinctive topological signature in HPGXe: a ionization track,of about 20 cm length at 15 bar, tortuous because of multiple scattering, and with larger depositions or blobsin both ends.
it happens in all the subsystems at the same time. In its current configuration the NEXT radioactivebudget is quite balanced.
The total radioactive budget is 3.7×10⁶ photons per year due to 214Bi and 1.3×10⁶ photonsper year in the 208Tl channel.
14. Expected sensitivity
14.1 Signal and background characterization in NEXT
Double beta decay events have a distinctive topological signature in HPGXe (Figure 25): an ion-ization track, of about 20 cm length at 15 bar, tortuous because of multiple scattering, and withlarger depositions or blobs in both ends.
As the track propagates in the dense gas it emits δ -rays and bremsstrahlung radiation. Thoseare typically low-energy gammas with a mean free path below 1 cm. The convolution of emissionof electromagnetic energy with the effect of diffusion (about 1 cm for a drift of 1 m) results in atrack for ββ0ν events that looks more like a wiggly, wide "stripe" of energy deposition, about 1-2cm wide, than like a well defined “wire”, as usual when tracking high energy muons, for example.The implications are quite clear:
1. Space resolution is not an issue in NEXT. A pitch of about 1 cm is sufficient, given thecombined effect of radiation and diffusion, that blur the track into a stripe. Our final designparameter is 1.1 cm.
2. Instead, identification of low energy gammas nearby the track (at distances of a few cm)is important. This is due to the difference between signal (two electrons of average energyQββ /2) and the dominant background (one electron of energy Qββ ). In the second case the
– 34 –

probability of radiation is higher and the mean free path of the gamma is longer. Topologieswith one or more isolated clusters of energy, corresponding to relatively high energy gam-mas flying distances of 2 or more cm are therefore more likely for the background than forthe signal. Therefore, identifying low-energy satellite clusters is important in NEXT. Thisrequires a sensor with low energy threshold, as the MPPCs.
NEXT has three powerful handles to separate ββ0ν events from backgrounds. These are:
1. Signal events appear with equal probability in the target, that is, the gas that fills the PV.Defining a fiducial volume, separated from the PV walls by a few cm of active target permitseliminating events in which a high energy gamma is accompanied by charged particles thatexit the PV walls. The requirement that the events are strictly contained in the active fiducialvolume guarantees that any event with charged activity is eliminated. Notice that, fromthe point of view of rejecting backgrounds, an HPGXe behaves in a complementary waythan a LXe. While liquid xenon has excellent self-shielding properties, xenon gas, even at(moderately) high pressures, is very transparent to gammas.
2. Signal events have all the same energy. Imposing that the events are in the ROI (taken as0.5% FWHM) eliminates substantially the backgrounds.
3. Signal events have a distinctive topological signature that can be exploited to further suppressthe background. Our calculations yield a rejection factor of 20 at moderate efficiency cost.This is one of the strongest points offered by NEXT technology.
14.2 The topological signature
The initial processing of the event allows the “voxelization” of the track, which is formed in termsof connected 3D “voxels” formed using the 2D position given by the tracking plane and the thirddimension given by time information. The initial voxels are cubes of 1 cm3 in volume, correspond-ing to the pitch between the MPPCs and twice the EL grid distance. The size of isolated photons istypically one voxel, while a ββ0ν “track” will consist of about 20 voxels.
An event is accepted as a ββ0ν candidate if:
1. The event is fully contained in the fiducial volume
2. Only one reconstructed track: That is the BFS algorithm finds only one connected set ofvoxels. Events with more than one object (tracks or disconnected voxels) are rejected.
3. Energy in the ROI: The event is required to be within 1 FWHM of Qββ .
4. ββ0ν signature: the unique track ends in two blobs of high energy, as expected for a ββ
event. This is translated into a cut Eth = 0.4− 0.55 MeV and R = 2.5− 3.0 cm, that al-lows a suppression factor between 10 and 20 for the background at the expense of selectionefficiency between 78% and 55%.
To estimate the performance of NEXT-100 ββ0ν and background data samples have beengenerated with the NEXUS Monte Carlo simulation. Signal events are simulated in the volume
– 35 –
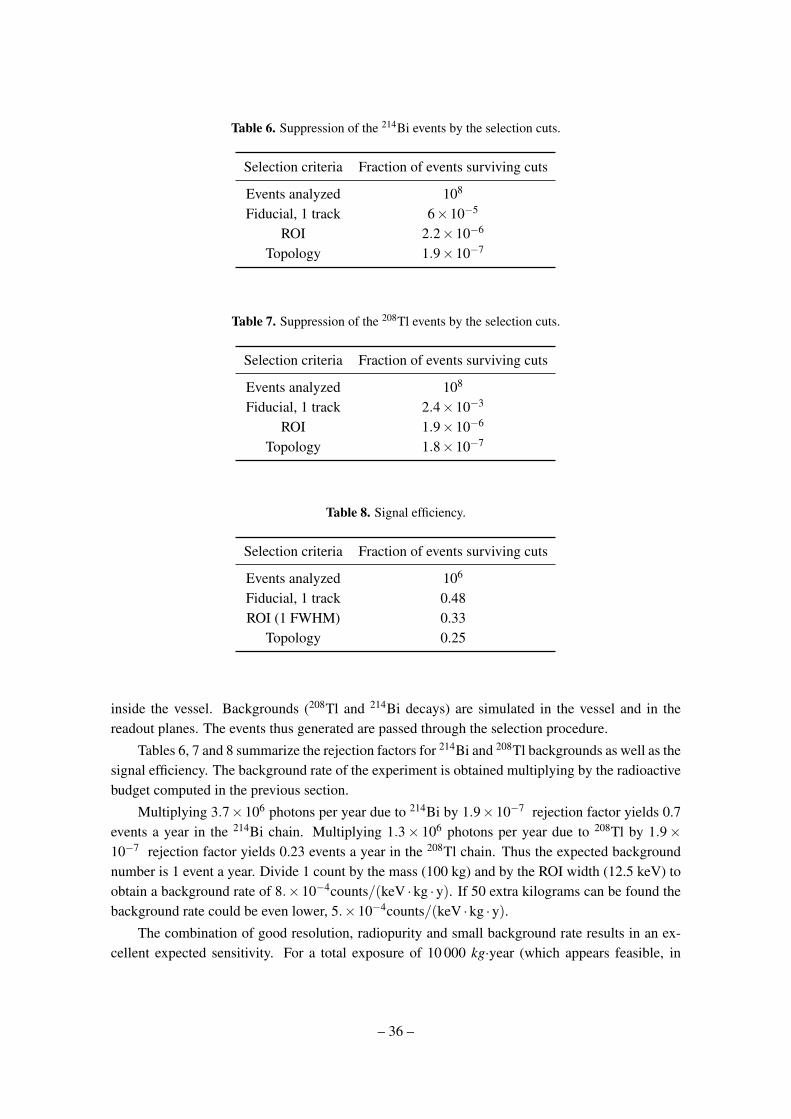
Table 6. Suppression of the 214Bi events by the selection cuts.
Selection criteria Fraction of events surviving cuts
Events analyzed 108
Fiducial, 1 track 6×10⁻⁵
ROI 2.2×10⁻⁶
Topology 1.9×10⁻⁷
Table 7. Suppression of the 208Tl events by the selection cuts.
Selection criteria Fraction of events surviving cuts
Events analyzed 108
Fiducial, 1 track 2.4×10⁻³
ROI 1.9×10⁻⁶
Topology 1.8×10⁻⁷
Table 8. Signal efficiency.
Selection criteria Fraction of events surviving cuts
Events analyzed 106
Fiducial, 1 track 0.48ROI (1 FWHM) 0.33
Topology 0.25
inside the vessel. Backgrounds (208Tl and 214Bi decays) are simulated in the vessel and in thereadout planes. The events thus generated are passed through the selection procedure.
Tables 6, 7 and 8 summarize the rejection factors for 214Bi and 208Tl backgrounds as well as thesignal efficiency. The background rate of the experiment is obtained multiplying by the radioactivebudget computed in the previous section.
Multiplying 3.7×10⁶ photons per year due to 214Bi by 1.9×10−7 rejection factor yields 0.7events a year in the 214Bi chain. Multiplying 1.3× 10⁶ photons per year due to 208Tl by 1.9×10−7 rejection factor yields 0.23 events a year in the 208Tl chain. Thus the expected backgroundnumber is 1 event a year. Divide 1 count by the mass (100 kg) and by the ROI width (12.5 keV) toobtain a background rate of 8.×10−4counts/(keV ·kg ·y). If 50 extra kilograms can be found thebackground rate could be even lower, 5.×10−4counts/(keV ·kg ·y).
The combination of good resolution, radiopurity and small background rate results in an ex-cellent expected sensitivity. For a total exposure of 10 000 kg·year (which appears feasible, in
– 36 –
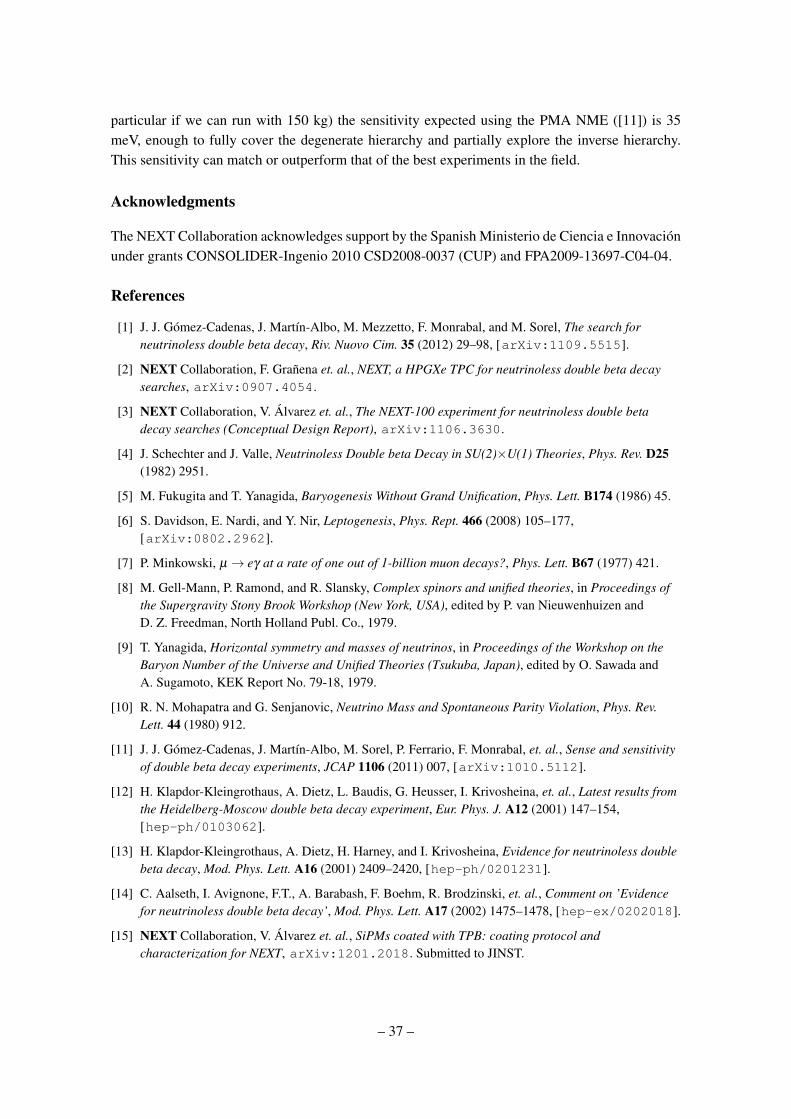
particular if we can run with 150 kg) the sensitivity expected using the PMA NME ([11]) is 35meV, enough to fully cover the degenerate hierarchy and partially explore the inverse hierarchy.This sensitivity can match or outperform that of the best experiments in the field.
Acknowledgments
The NEXT Collaboration acknowledges support by the Spanish Ministerio de Ciencia e Innovaciónunder grants CONSOLIDER-Ingenio 2010 CSD2008-0037 (CUP) and FPA2009-13697-C04-04.
References
[1] J. J. Gómez-Cadenas, J. Martín-Albo, M. Mezzetto, F. Monrabal, and M. Sorel, The search forneutrinoless double beta decay, Riv. Nuovo Cim. 35 (2012) 29–98, [arXiv:1109.5515].
[2] NEXT Collaboration, F. Grañena et. al., NEXT, a HPGXe TPC for neutrinoless double beta decaysearches, arXiv:0907.4054.
[3] NEXT Collaboration, V. Álvarez et. al., The NEXT-100 experiment for neutrinoless double betadecay searches (Conceptual Design Report), arXiv:1106.3630.
[4] J. Schechter and J. Valle, Neutrinoless Double beta Decay in SU(2)×U(1) Theories, Phys. Rev. D25(1982) 2951.
[5] M. Fukugita and T. Yanagida, Baryogenesis Without Grand Unification, Phys. Lett. B174 (1986) 45.
[6] S. Davidson, E. Nardi, and Y. Nir, Leptogenesis, Phys. Rept. 466 (2008) 105–177,[arXiv:0802.2962].
[7] P. Minkowski, µ → eγ at a rate of one out of 1-billion muon decays?, Phys. Lett. B67 (1977) 421.
[8] M. Gell-Mann, P. Ramond, and R. Slansky, Complex spinors and unified theories, in Proceedings ofthe Supergravity Stony Brook Workshop (New York, USA), edited by P. van Nieuwenhuizen andD. Z. Freedman, North Holland Publ. Co., 1979.
[9] T. Yanagida, Horizontal symmetry and masses of neutrinos, in Proceedings of the Workshop on theBaryon Number of the Universe and Unified Theories (Tsukuba, Japan), edited by O. Sawada andA. Sugamoto, KEK Report No. 79-18, 1979.
[10] R. N. Mohapatra and G. Senjanovic, Neutrino Mass and Spontaneous Parity Violation, Phys. Rev.Lett. 44 (1980) 912.
[11] J. J. Gómez-Cadenas, J. Martín-Albo, M. Sorel, P. Ferrario, F. Monrabal, et. al., Sense and sensitivityof double beta decay experiments, JCAP 1106 (2011) 007, [arXiv:1010.5112].
[12] H. Klapdor-Kleingrothaus, A. Dietz, L. Baudis, G. Heusser, I. Krivosheina, et. al., Latest results fromthe Heidelberg-Moscow double beta decay experiment, Eur. Phys. J. A12 (2001) 147–154,[hep-ph/0103062].
[13] H. Klapdor-Kleingrothaus, A. Dietz, H. Harney, and I. Krivosheina, Evidence for neutrinoless doublebeta decay, Mod. Phys. Lett. A16 (2001) 2409–2420, [hep-ph/0201231].
[14] C. Aalseth, I. Avignone, F.T., A. Barabash, F. Boehm, R. Brodzinski, et. al., Comment on ’Evidencefor neutrinoless double beta decay’, Mod. Phys. Lett. A17 (2002) 1475–1478, [hep-ex/0202018].
[15] NEXT Collaboration, V. Álvarez et. al., SiPMs coated with TPB: coating protocol andcharacterization for NEXT, arXiv:1201.2018. Submitted to JINST.
– 37 –

[16] XENON Collaboration, E. Aprile, K. Arisaka, F. Arneodo, A. Askin, L. Baudis, et. al., Materialscreening and selection for XENON100, Astropart.Phys. 35 (2011) 43–49, [arXiv:1103.5831].
[17] L. M. P. Fernandes et. al., Primary and secondary scintillation measurements in a xenon GasProportional Scintillation Counter, JINST 5 (2010) P09006, [arXiv:1009.2719].
[18] R. Nygren, D. Youchison, and K. Hollis, Features of plasma sprayed beryllium armor for the ITERfirst wall, J.Nucl.Mater. 367 (2007) 1325–1329.
[19] “Ilias database.” http://radiopurity.in2p3.fr.
[20] V. Boccone et. al., Development of wavelength shifter coated reflectors for the ardm argon darkmatter detector’, JINST 4 (2009) P06001, [arXiv:0904.0246].
[21] I. Lawson and B. Cleveland, Low background counting at snolab, in Topical Workshop on LowRadioactivity Techniques LRT 2010, pp. 68–77, AIP Conf. Proc. 1338, 2011.
[22] D. Budjas et. al., Gamma-ray spectrometry of ultra low levels of radioactivity within the materialscreening program for the gerda experiment, Applied Radiation and Isotopes 67 (2009) 755.
[23] C. Faham, Performance and radioactivity measurements of the pmts for the lux and lz dark matterexperiments, in TIPP2011, 2011. http://conferences.fnal.gov/tipp11/.
[24] S. Leonard et. al., Systematic study of trace radioactive impurities in candidate construction materialsfor exo-200, NIMA 591 (2008) 490.
[25] S. Nisi et. al., Comparison of inductively coupled mass spectrometry and ultra low-level gamma-rayspectroscopy for ultra low background material selection, Applied Radiation and Isotopes 67 (2009)828.
[26] G. Luzón et. al., Characterization of the Canfranc Underground Laboratory: Status and futureplans", in Proceedings of the 6th International Workshop on Identification of Dark Matter, vol. 514,September, 2006.
– 38 –
View publication statsView publication stats