Embed Size (px)
Citation preview

Newspaper strategiesfor the future.
Searching for value in tomorrow’s publishing world.

Greece in contextNewspaper readership
Newspaper readership Copy penetration and Average issue readership
0 10 20 30 40 50 60 70 80 90 100
RussiaIndia
ThailandPolandTurkey
UkraineItaly
IndonesiaSpain
FranceBrazil
BelgiumMalaysia
KoreaHungaryCzechia
USANew Zealand
GreeceIreland
UK Taiwan
NetherlandsAustralia
Hong KongPortugal
AustriaSwitzerland
GermanySingaporeDenmark
FinlandCanadaNorway
SwedenJapan
Copy penetration
Average issue readership
Sources: World Press Trends, Zenith Optimedia,

Greece in contextReaders per copy
0 2 4 6 8 10
NorwaySwedenFinland
SwitzerlandUnited Kingdom
AustriaLuxembourg
Czech RepublicSlovenia
NetherlandsGermany
ItalyDenmark
PolandLatvia
FranceBelgiumEstonia
SpainIreland
CroatiaSlovakiaPortugalGreece
0 2 4 6 8 10
NorwaySwedenFinland
SwitzerlandUnited Kingdom
AustriaLuxembourg
Czech RepublicSlovenia
NetherlandsGermany
ItalyDenmark
PolandLatvia
FranceBelgiumEstonia
SpainIreland
CroatiaSlovakiaPortugalGreece

Greece in contextAverage circulation
0 100 200 300 400 500 600 700Japan
United KingdomAustria
Netherlands,Singapore
IrelandFrance
ItalyPoland
IndiaMalaysia
South AfricaAustraliaGermanyBelgiumCanada
SwedenHungary
FinlandDenmarkTurkey
USANorway
SpainNew Zealand
MexicoSwitzerland
IndonesiaPortugal
GreeceArgentina
Source: World Press Trends 2004

Greece in contextAdvertising expenditure
0
10
20
30
40
50
60
70
80
90
100
Greece Europe
Newspapers Magazines TV Radio Cinema Outdoor Internet
0
10
20
30
40
50
60
70
80
90
100
Greece Europe
Newspapers Magazines TV Radio Cinema Outdoor Internet

Greece in contextAdvertising expenditure - print
0
10
20
30
40
50
Greece Europe
Newspapers Magazines
0
10
20
30
40
50
Greece Europe
Newspapers Magazines

Greece in contextMagazines share of advertising
0 10 20 30 40
IrelandDenmarkHungaryNorway
LithuaniaEstonia
BelgiumSpain
SwedenItalyUK
LatviaPolandFinland
PortugalSwitzerla
EuropeCzech
GermanyNetherlaAustriaFranceGreece
Source: ZenithOptimedia

Greece in contextNewspaper revenue mix
Armenia
Australia
Belgium
Canada
CroatiaCzech Republic
Denmark
Estonia
FinlandFrance
Germany
Greece
Iceland
Ireland
Italy
JapanLatvia Lebanon
Luxembourg
Macedonia
Netherlands
NorwayPortugal
Slovakia
Spain
Sri Lanka
Sweden
Turkey
United Kingdom
United States
Uruguay
0
500
1000
0 250 500Circulation revenue per copy
Ad
vert
isin
g r
even
ue
per
co
py
Source: World Press Trends / SFN

Greece in contextAdvertising expenditure v Europe
Greece
0
5
10
15
20
25
30
35
40
2001 2002 2003 2004 2005 2006 2007 2008
Magazines Newspapers
Greece
0
5
10
15
20
25
30
35
40
2001 2002 2003 2004 2005 2006 2007 2008
Magazines Newspapers
Europe
0
5
10
15
20
25
30
35
40
Magazines Newspapers
Europe
0
5
10
15
20
25
30
35
40
Magazines Newspapers

Greece v the “8 million” nations Circulation trends
Peer countries - Paid for newspapers - Circulation trends
0
500000
1000000
1500000
2000000
2500000
3000000
3500000
4000000
2001 2002 2003 2004 2005 2006 2007 2008 2009 2010
Benelux Greece Hungary Portugal Sweden

Greece v the “8 million” nations Advertising trends
Peer countries - Paid for newspapers - Advertising trends
-
10.0
20.0
30.0
40.0
50.0
60.0
2001 2002 2003 2004 2005 2006 2007 2008 2009 2010
Belgium Greece Hungary Portugal Sweden Europe

Greece v the “8 million” nations Key indicators
Titles 34 30 39 17 94
Country Greece Belgium Hungary Portugal Sweden
Max circ (k) 75 289 255 121 429
Average circ (k) 24 56 46 47 46
Sales per adults / 000 92 195 211 95 583
Titles per Sales / million 42 17.8 21.7 21.5 21.5
Titles per cap / Million 3.9 3.5 4.6 2 12.6
Readers per copy 9.2 2.6 2.4 8.6 1.5
Total sales (k) 810 1684 1800 791 4368
New titles 05 v 01 2 2 3 2 -3

Mega trends for publishers

Mega trendsInternationalisation
Source: Boeing market outlook 2004

Readership penetration of UK daily newspapers by age over time.
Penetration
1974 1984 1994 2004
15-24 81.0 71.7 58.1 43.8
25-34 79.1 67.9 55.8 43.8
35-44 77.7 70.8 57.6 45.9
45-54 81.1 72.6 62.9 50.9
55-64 77.8 72.4 64.4 58.4
65+ 68.5 62.0 61.5 57.6
Mega trendsAging
Source: iMedia, UK National Readership Survey

Mega trendsAging
% of population below key ages
0 10 20 30 40 50 60
ItalyGermany
GreeceAustria
BulgariaBelgiumFinland
SloveniaEU
DenmarkSweden
SpainPortugal
LatviaLuxembourgNetherlands
United KindomCzech
HungaryEstoniaFrance
LithuaniaMalta
Romaniapoland
SlovakiaCyrpusIreland
< 35
< 25
% of population below key ages
0 10 20 30 40 50 60
ItalyGermany
GreeceAustria
BulgariaBelgiumFinland
SloveniaEU
DenmarkSweden
SpainPortugal
LatviaLuxembourgNetherlands
United KindomCzech
HungaryEstoniaFrance
LithuaniaMalta
Romaniapoland
SlovakiaCyrpusIreland
< 35
< 25

Mega trendsCommunities on the move
• Shift from communities of geography toward communities of interest:• Local mass to distributed niche;
• Increasing examples of “media on the move”• Metro• Mobile
• Context is the new content.• Where? When? Why?• Not what and how?

Mega trendsNew titles attract new readers;
• Record number of new launches underway;
• New generation of management challenging industry traditions:• Brand limited to one line• Factory limited to a single product
• New products reaching out (at last) to the increasingly literate younger generation.

Free dailiesOver 180 titles. Over 25 million copies
Development of free newspapers Annual total global circulation
0
5000
10000
15000
20000
25000
30000
1991 1992 1995 1996 1997 1998 1999 2000 2001 2002 2003 2004 2005 2006
Others
Metro
Development of free newspapers Annual total global circulation
0
5000
10000
15000
20000
25000
30000
1991 1992 1995 1996 1997 1998 1999 2000 2001 2002 2003 2004 2005 2006
Others
Metro
Sources: iMedia, World Press Trends, University of Amsterdam

Free dailiesOne in five European dailies is free
European daily newspapersSplit of paid for and free dailies
-
20,000,000
40,000,000
60,000,000
80,000,000
100,000,000
120,000,000
2000 2001 2002 2003 2004 2005 2006 E
Free
Paid
European daily newspapersSplit of paid for and free dailies
-
20,000,000
40,000,000
60,000,000
80,000,000
100,000,000
120,000,000
2000 2001 2002 2003 2004 2005 2006 E
Free
Paid
Sources: iMedia, World Press Trends, University of Amsterdam

Free dailiesFree dailies dominating many markets
Free circulation as a percentage of total circulation
00
24
5566
78
121313
141515
181919
20202121
2223
262727
29303131
3436
3944
5167
86
0 10 20 30 40 50 60 70 80 90
JapanChina
PhilippinesUSA
MalaysiaMexico
MacedoniaUK
AustriaAustralia
PolandBelgium
UAEEstoniaRussiaIreland
South KoreaHungary
NetherlandsEcuadorSwedenCanadaCzechia
LatviaFinlandFrance
ItalyGreece
ChileLithuaniaArgentina
Hong KongDenmark
SwitzerlandPortugal
SingaporeSpain
IcelandBotswana
Sources: iMedia, World Press Trends, University of Amsterdam

Impact of age – Free dailiesReadership patterns (European Cities)
0
5
10
15
20
25
30
35
13-24's 25-34's
Free daily
Paid daily
Source: Gallup TNS Metro International

What is the impact of the digital world?

Mega trendsOn line advertising v other media
$US Millions Advertising Access
TV 40 59
Internet 65 192
Press 316 65
Advertising dollars per nation hour spent with medium (USA - 2004)
Source: iMedia, Veronis SuhlerSources: Veronis Suhler

Mega trendsOn line advertising v other media
Communication spend per nation hour
0
50
100
150
200
250
300
350
400
1996 1998 2000 2002 2004 2006 2008
TV & Video Internet Newspapers
Communication spend per nation hour
0
50
100
150
200
250
300
350
400
1996 1998 2000 2002 2004 2006 2008
TV & Video Internet Newspapers
Consumer spend per nation hour
0
50
100
150
200
250
300
350
400
1996 1998 2000 2002 2004 2006 2008
TV & Video Internet Newspapers
Consumer spend per nation hour
0
50
100
150
200
250
300
350
400
1996 1998 2000 2002 2004 2006 2008
TV & Video Internet Newspapers
Sources: Veronis Suhler

Mega trendsImpact of internet on print advertising
Impact of Internet penetration on Display and Classified advertising
Austria
Benelux
Czechia
Denmark
Estonia
Finland
France
Germany
Greece
Ireland
Italy
Latvia
Netherlands
Norway
Poland
Portugal
Romania
Spain
Sweden
Switzerland
UK
-60
-50
-40
-30
-20
-10
0
10
20
30
40
50
60
70
80
90
100
110
120
130
140
20 30 40 50 60 70 80
Internet penetration
Va
ria
nc
e in
20
00
-20
05
Classified

Mega trendsImpact of internet on print advertising
Impact of Internet penetration on Display and Classified advertising
UK
Switzerland
Sweden
Spain
Romania
Portugal
Poland
Norway
Netherlands
Latvia
Italy
Ireland
Greece
Germany
France
Finland
Estonia
Denmark
Czechia
Benelux
Austria UK
Switzerland
Sweden
Spain
Romania
Portugal
Poland
Norway
Netherlands
Latvia
Italy
Ireland
Greece
Germany
France
Finland
Estonia
Denmark
Czechia
Benelux
Austria
-60
-50
-40
-30
-20
-10
0
10
20
30
40
50
60
70
80
90
100
110
120
130
140
20 30 40 50 60 70 80
Internet penetration
Va
ria
nc
e in
20
00
-20
05
Display
Classified

Mega trends News on the Internet - Usage and value
Media consumption trends Impact of online experience in reading online newspapers
0%
10%
20%
30%
40%
50%
60%
70%
<1 year 1 year 2 years 3 years 4 years 5 years 5> yrs
years of online experience
% o
f o
nlik
ne
use
rs w
ho
rea
d a
new
spap
er UKGermanyFranceItalySpain
average
Source: iMedia, Forrester Consumer Technographics 2004

Mega trendsService evolution
Fixed internet
Mobile/wireless
Today
time
Servicerange

The New News

The New News
Norway interacts• 10,000 readers now send “content” every day;
• Active programme of polls and participation
• Newsroom established “portal” to handle content management
Austria interacts• 100,000 of 350,000 citizens
appeared in the paper or website last year;
• 1,500 are members of 14 community forums
• Established wireless network through circulation area 350,000 people) enabling free internet access for all subscribers.

The New News The people
• The popularising (and depoliticising) of the process of social debate and inclusion;
• People want to be heard as much as listen;
• The New News is empowering citizens to participate, influence, and direct;
• Multi-media interaction may engage new generations.
The Newspaper / Media ModelThe Newspaper / Media Model
CRMReader knowledge
CRMReader knowledge
ResearchReader needs and attitudes
ResearchReader needs and attitudes
ContactReader interaction
ContactReader interaction
ClubParticipation
ClubParticipation
The Community / Social ModelThe Community / Social Model
CRMReader knowledge
Identifyknowledge
ContactReader interaction
ParticipateInteraction & debate
ClubParticipation
EngageSocial change
ResearchReader needs and attitudes
DefineKey social issues and drivers

Analysis
• Greece has one of the highest numbers of newspapers relative to the size of the market, and therefore one of the lowest average circulations;
• It’s largest newspaper is half what it should be relative to its market;
• Reading demand is high. Purchase is low.
• Relative to key international determinants, the market is a third under developed.

Strategic framework
Advertising Readership Editorial Technology Finance
Knowledge
Strategy
Implementation
Performance

Strategic issues
Why are reader per copy levels so high?
Readership survey is wrong?
Survey is to international standards, in quality and methodology.
Greeks have weird reading behaviour?
No social factors to suggest this.
Circulation is under reported?
Possible that methodologies do not track all sales.
There are copies in the supply chain that are not measured
Possible that copies are “acquired” that are not reported.

Strategic issues
Business proposition• God v mammon?• Circulation is vanity……
…… Advertising is sanity
Market in the gap?• How can newspapers convert “readership”
into a daily reading habit?• Can readership be converted into revenue?
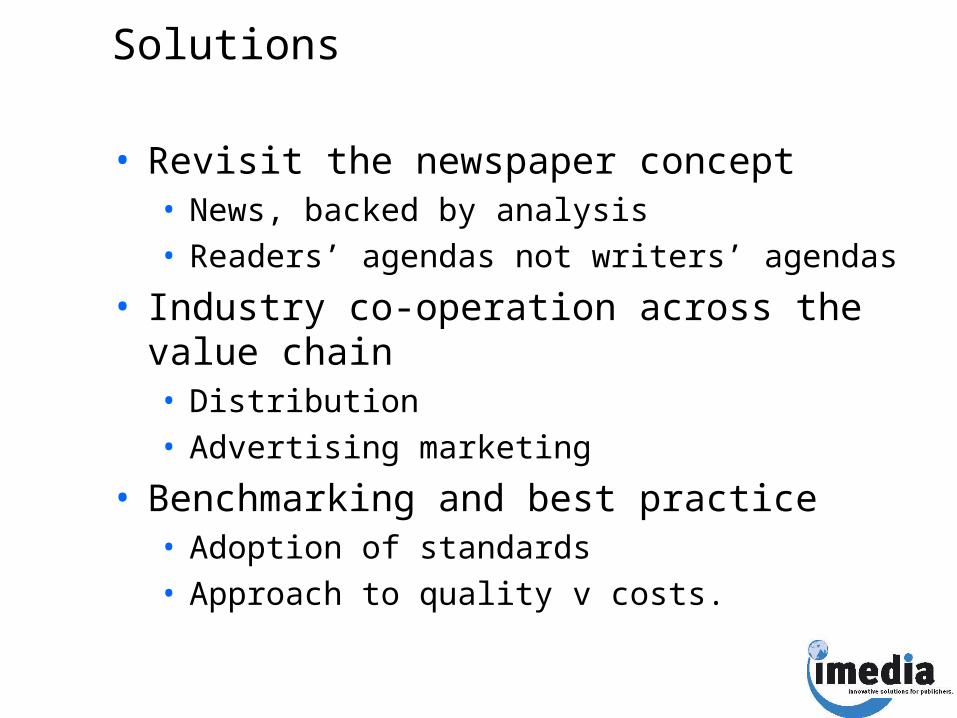
Solutions
• Revisit the newspaper concept• News, backed by analysis• Readers’ agendas not writers’ agendas
• Industry co-operation across the value chain• Distribution• Advertising marketing
• Benchmarking and best practice• Adoption of standards• Approach to quality v costs.

Conclusion
• Demand is under supplied
• Readership can be converted into revenue can be converted into profitability.
• An opportunity awaits.

Thank you


How can newspapers increase their circulation figures to ensure even larger advertising and Subscription revenues?
• Through better editorial? • Better interaction with the readers? • Better marketing techniques? • Can Arab publishers work together on
aggregating their content to increase revenues?

Newspapers at a crossroads

Different media for different markets
Source: Zenith Media/World Bank
TV’s share of advertising falls as prosperity increases
Wealth (Per capita GDP)
Press v TV Influence of prosperity on media usage
10
20
30
40
50
60
70
80
- 5,000 10,000 15,000 20,000 25,000 30,000
Prosperity (per capita GDP
% r
each
NewspapersTV
Sh
are
of a
dve
rtis
ing

Different media for different marketsSegmentation and impact
• Because frequent TV viewers tend to be “down-market”, the more you advertise on TV, the more frequency grows at the bottom of the market.
• Because frequent readers are wealthier, the more you advertise in print, the more often you reach a wealthier audience.
AverageWealth
Impact
TVTV
PrintPrint

Austria in contextNewspapers – the mass medium
• In 1994 there were 40 tradable TV stations in the UK.
• Today there are 250+.
• In 2014 this is expected to be in the region of 400.
Will newspapers become the new mass medium?

Austria in contextNewspapers – the sustainable medium
• In 1994 the UK’s “News at 10” enjoyed an audience of 6.6m. Today it is 3.3m.
• In 1994 ITV enjoyed a share of TV audience of 39.5%. Today that figure is 23.6%.
• All this content is free of charge.

The New News The invisible media

The need for measurement

Promote advertising effectivenessThe agency view
“It is time for the press to catch up with the increasing audience measurement accountability of other major media.”
Frank Harrison. Strategy Director ZenithOptimedia

Promote advertising effectivenessLevels of accountability
Average issue sale or readership
readership of the title
Issue specific sale or readership
readership of a newspaper on a specific day
Page readershipreading traffic that is exposed to an advertisement
Advertisement readership
actual numbers of people who read the advertisement
Advertisement response
number of people who respond to the advertisement.
What we do currently
What the advertiser wants
What the media buyer is seeking

Promote advertising effectivenessAccountability
Publishers currently invest less than 0.5% of ad revenues on evidence of their success.

Promote advertising effectivenessAction points
Newspapers must invest in three forms of advertising research:
• CurrencyBi-annual readership survey measures demographics, interests and attitudes.
• Medium effectiveness
Tracks incremental value of newspapers against other media
• Advertisement effectiveness
Ensures advertisers messages are effective
• Cost: <1.5% of revenue

Manage price Value for money?
The SunReading traffic per page
0
10
20
30
40
50
60
70
80
1
3
5
7
9
11
13
15
17
19
21
23
25
27
29
31
33
35
37
40
42
44
46
48
50
52
TV 2TV 4
MaleFemale
Source: eVolt.Co/Newspaper Society
Equal valueto readers?

Promote advertising effectivenessDifferent categories. Different results
Remodelled size effect (key categories only)
Travel
Motors
Mobile phones
Insurance
HealthFURNITURE MEAN
SuitesMixed Furniture
Beds
ENTS MEAN.
TV progs
Restaurants
Leisure Parks
McDonalds
Concerts
Clubs
Cinema
Cable TV
Electrical
DIY
Dept Stores
R2 = 0.3657
0
2
4
6
8
10
12
14
16
0 10 20 30 40 50 60 70 80 90 100
Ad size (percentage of page)
Rea
der
ship
lev
els
Source: eVolt.Co/Newspaper Society

The media multiplier study

Promote advertising effectivenessUniqueness of the study• Live, in market assessment of six brand
campaigns• Primary Research
• TV in Control market • TV and Print in Test market
• Two rounds of measurements• Pre Campaign Round (to set up benchmarks)• Post Campaign Round (to measure shifts in scores)
• Shifts in Test market measured against Control market to evaluate the Impact Multiplier Effect
• Sample size 14,000.
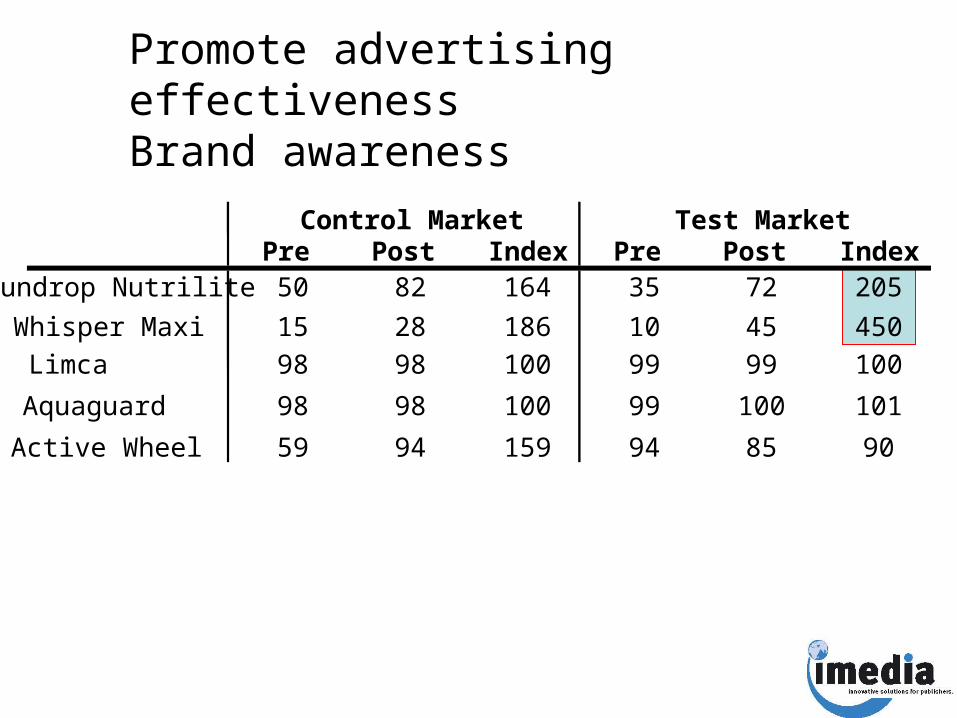
Promote advertising effectivenessBrand awareness
205450
Pre Post IndexSundrop Nutrilite 50 82 164
Whisper Maxi 15 28 186
Limca 98 98 100
Aquaguard 98 98 100
Active Wheel 59 94 159
Control MarketPre Post Index35 72 205
10 45 450
99 99 100
99 100 101
94 85 90
Test Market

Promote advertising effectivenessAd awareness
268833
124
Pre Post IndexSundrop Nutrilite 26 53 203
Whisper Maxi 4 6 150Limca 98 98 100
Aquaguard 73 83 114
Active Wheel 34 9 26
Control MarketPre Post Index19 51 268
3 2599 99 100
87 94 108
42 52 124
Test Market
833

Promote advertising effectivenessPost campaign analysis
Aq
uag
uar
dControl Market
Test Market
On delivery of safe drinking water, I trust this brand 89 94
Kid’s grow great with safe water delivered by this brand 88 92
Brand has a 3 stage water purification system 72 88Protects kids from diseases 84 91
Has a 3-stage Ultra Violet water purification system 56 88Brand forms a part of the healthy upbringing of my child 77 81
Removes stains but keeps colours intact 44 50Removes the toughest of stains 31 50Removes stubborn stains from collar 31 50A
ctiv
e w
hee
lS
un
dro
pN
utr
ilit
e
Superior quality 34 72For health conscious people 34 76
Brand is light….Food cooked in it is not heavy 34 75Brand is a blend of 2 oils 31 61
Brand meant for people who want to stay slim 33 79Healthy oil for healthy people 32 76It keeps you active 32 80
Wh
isp
er M
axi
Gives info. regarding body, hair and skin 36 85Gives a hygienic feeling 44 92For hygiene conscious people 44 89Gives updated info. on menstruation/periods 45 91Created awareness on sanitary protection & hygiene 49 92
+15%
+42%
+95%
+106%

Promote advertising effectivenessAccountability
Advertising
effectiveness
=
The effectiveness
of the medium
x
The effectiveness
of the advertisement
• A high proportion of advertisements don’t work;
• Before we can make the media accountable we have to make the ads accountable;
• Publishers must invest in audience measurement and advertisement measurement.

In conclusion
• Print media are experiencing a renaissance:
• New publishing concepts• New content, marketing and technology solutions
• Digital media will enhance – not diminish – the publishing industry
• Print remains the world’s most effective medium.
• We must all work harder to make the advertising work harder.

To do
• Aura: Free dailies, new launches Zenith update.

• Greece in context• Mega trends for publishers• The value of print• Future developments

Readership penetration of UK daily newspapers by age over time.
Penetration
1974 1984 1994 2004 2014
15-24 81.0 71.7 58.1 43.8 37.1
25-34 79.1 67.9 55.8 43.8 36.9
35-44 77.7 70.8 57.6 45.9 39.5
45-54 81.1 72.6 62.9 50.9 44.8
55-64 77.8 72.4 64.4 58.4 53.1
65+ 68.5 62.0 61.5 57.6 54.6
Mega trendsStrategy to exploit the New News
Print biased
Internet generation
Game boy and mobile

Mega trendsGenerations of technologyMeet the new editor
• Fast• Flexible• Low expenses• Low opinion of himself• Cheap to run.

Ireland in context Circulation trends by world region
Circulation Trends Paid Dailies 2000-2005
-10
-5
0
5
10
15
20
25
30
35
40
Old Europe New EU OtherEurope
Asia LatinAmerica
NorthAmerica
Australasia
Circulation Trends Paid Dailies 2000-2005
-10
-5
0
5
10
15
20
25
30
35
40
Old Europe New EU OtherEurope
Asia LatinAmerica
NorthAmerica
Australasia
Source: World Press Trends / PwC

Ireland in context Circulation trends – Paid dailies
Circulation trendFour year circulation variance - paid dailies
-40
-30
-20
-10
0
10
20
30
40
Paid dailies
Circulation trendFour year circulation variance - paid dailies
-40
-30
-20
-10
0
10
20
30
40
Paid dailies
Source: World Press Trends / PwC

Ireland in context Circulation trends – Paid and free dailies
Circulation trendFour year circulation variance - paid and free dailies
-40
-30
-20
-10
0
10
20
30
40
Paid dailies All dailies
Circulation trendFour year circulation variance - paid and free dailies
-40
-30
-20
-10
0
10
20
30
40
Paid dailies All dailies
Source: World Press Trends / PwC/ University of Amsterdam/ Various