Embed Size (px)
Citation preview

010100101110101001110101100101001101110010100101010100101110101001110101100101001
101110
01
0100101001010010
1010
10010111011001
011 Newsletter
Simulation Based Engineering & SciencesYear n°2 Summer 201512
Accelerating the development of general purpose engines using modeFRONTIER
On the frontier of drilling technologies
The simulation as competitive advantage for a company producing air filtration units
Morphology of membrane formation during solvent evaporation
Tolerance analysis on Emax 2 low voltage air circuit-breakers series
Multi-Objective Optimization of XBA Sentinel Antenna
Ship Innovation is: thinking composite

010100101110101001110101100101001101110010100101010100101110101001110101100101001
101110
01
0100101001010010
1010
10010111011001
011 Newsletter
Simulation Based Engineering & Sciences
Multi-Objective Optimization of Vehicle Handling & Comfort Performances
Structural Optimization of a Car-body High Speed Train:an innovative analysis
Robust Design Optimization of a Bumper System
Mechanical optimization of the injection system in acompression molding machine
Special Issue on
Pioneers in numerical optimization solutions
Parametric FEM model optimization for a pyrolitic oven
EnginSoft Newsletter
DOWNLOAD your free copy on:www.enginsoft.com/mf-newsletter
3 - Newsletter EnginSoft Year 12 n°2 Flash
LASH
I am delighted to announce that the Call for Papers is now open for this year’s International CAE Conference! As we wait in anticipation for this exciting line-up of papers, from an ever growing network of organisations that cross all industry sectors, we are delighted to share with you the ongoing advances being made in simulation technology within EnginSoft and its customer network. Each article shows how the application of simulation technology is being used to improve product performance and foster the spirit of innovation around the world.
In this edition we will be sharing insights into the principal role that simulation is playing within leading companies. Honda shares their aim to accelerate development (Page 8), the CEO of Verme Projects explains their goal in maintaining innovation (Page 6), and TAMA Air Filtration demonstrate the importance of simulation in enhancing competitive advantage (Page 11). The articles highlight how modern engineering companies are committed to new areas of simulation practice in order to achieve their goals.
ABB, a global leader in power and automation technology is no exception. On page 16, we learn how simulation is utilised in the design and development of a high capacity switchgear with a 45% reduction in plan area. In partnership with EnginSoft they were also able to meet all the design objectives, be able to reduce the time to market and benefit from scrap and rework savings.
With many new simulation practices, computational resource can often become stretched and require good simulation process management. Benelli demonstrates how the implementation of modeFRONTIER has enabled them to overcome this challenge by maximising their licence and hardware resources.This has been able to reduce their time to market from 4 months to 1 month. Read the article on page 31 to find out more.
As simulation continues to flourish with ever new techniques and approaches, we are committed to inspiring industry to greater heights by sharing our common challenges and highlighting the new solutions being used in our network of companies. Together, we are better able to exceed current product performance, meet our own design objectives and deliver value driven solutions to our customers.
Stefano Odorizzi, Editor in chief
FFor many industries today, engineering simulation is the most powerful tool used in product development. It is unparalleled in the speed in which designs can be understood and each design requirement met. This fact is no longer in doubt.
Slow and high cost developmental testing has in the large part been replaced by simulation. However, why stop there? Is there an even better method? What is the current ‘game changer’ in engineering? These questions are answered by a tool that allows the engineer to standing back from the problem, explore the whole design space through appropriate data mining tools, while an automated process considers all the relationships between each design variable and drives the design towards its optimum. This tool is modeFRONTIER.
A special edition of the Newsletter, dedicated to modeFRONTIER, highlights how it has impacted many industries in the way they do their design and development; indeed you will be amazed by how many familiar everyday products have benefitted from this approach and are featured in this edition – please enjoy and become part of the growing community of business leaders that are reaping the rewards in an increasingly competitive world market.
Simulation Based Engineering & Sciences
Special Issue on
5 - Newsletter EnginSoft Year 12 n°2 Contents
Contents
Newsletter EnginSoft Year 12 n°2 - 4
INTERVIEW6 Innovation is “thinking composite”, Massimo Verme shares his vision with us8 Accelerating the development of general purpose engines using modeFRONTIER11 The simulation as competitive advantage for a company producing air filtration units
CASE HISTORIES14 On the frontier of drilling technologies16 Tolerance analysis on Emax 2 low voltage air circuit-breakers series21 Implementation of surrogate models to predict the morphology of membrane formation during solvent evaporation24 Multi-Objective Optimization of XBA Sentinel Antenna28 Magnetostatic Analysis on ITER Test Blanket Modules31 Structural optimization of the Benelli Progressive Comfort - Dimensional and weigh optimization under maximum cartridge load34 Coffee Makers and Homecare Products with a Combination of style and performance36 Optimization of the production process of a die-casting component for automotive using MAGMAfrontier40 Structural analysis of Microchannel Condenser Heat Exchangers using Finite Element Techniques43 FE modeling of a composite sandwich laminate with LS-DYNA for Aerospace applications49 Uncertainty in simulations: Polynomial Chaos Expansion
SOFTWARE UPDATE51 Advanced Python Scripting in Kraken Well Placement Optimization Using Genetic Algorithms52 Multi-Body Dynamics for ANSYS54 Advanced IC engine design with ANSYS FORTÉ57 MAGMA 5.3 Fully Optimize
IN-DEPTH STUDIES59 What is System Level Thermo-Fluid Analysis?59 Buckling analysis in ANSYS
RESEARCH64 Growing food for space exploration: EnginSoft is now part of the EDEN ISS project66 MUSIC Project at CO.SUMMIT 2015 last 10/11 March 2015 in Berlin
OUR ACKNOWLEDGEMENT AND THANKS TO ALL THE COMPANIES, UNIVERSITIES AND RESEARCH CENTRES THAT HAVE CONTRIBUTED TO THIS ISSUE OF OUR NEWSLETTER
Contents
Newsletter EnginSoftYear 12 n°2 - Summer 2015To receive a free copy of the next EnginSoft Newsletters, please contact our Marketing office at: [email protected]
All pictures are protected by copyright. Any reproduction of these pictures in any media and by any means is forbidden unless written authorization by EnginSoft has been obtained beforehand. ©Copyright EnginSoft Newsletter.
EnginSoft S.p.A.24126 BERGAMO c/o Parco Scientifico TecnologicoKilometro Rosso - Edificio A1, Via Stezzano 87Tel. +39 035 368711 • Fax +39 0461 97921550127 FIRENZE Via Panciatichi, 40Tel. +39 055 4376113 • Fax +39 0461 97921635129 PADOVA Via Giambellino, 7Tel. +39 049 7705311 • Fax +39 0461 97921772023 MESAGNE (BRINDISI) Via A. Murri, 2 - Z.I.Tel. +39 0831 730194 • Fax +39 0461 97922438123 TRENTO fraz. Mattarello - Via della Stazione, 27Tel. +39 0461 915391 • Fax +39 0461 97920110133 TORINO Corso Marconi, 10Tel. +39 011 6525211 • Fax +39 0461 979218
www.enginsoft.it - www.enginsoft.come-mail: [email protected]
The EnginSoft Newsletter is a quarterly magazine published by EnginSoft SpA
COMPANY INTERESTSEnginSoft GmbH - GermanyEnginSoft UK - United KingdomEnginSoft France - FranceEnginSoft Nordic - SwedenEnginSoft Turkey - TurkeyVSA-TTC3 - Germanywww.enginsoft.com
CONSORZIO TCN www.consorziotcn.it • www.improve.itCascade Technologies www.cascadetechnologies.comReactive Search www.reactive-search.comSimNumerica www.simnumerica.itM3E Mathematical Methods and Models for Engineering www.m3eweb.it
ASSOCIATION INTERESTSNAFEMS International www.nafems.it • www.nafems.orgTechNet Alliance www.technet-alliance.com
ADVERTISEMENTFor advertising opportunities, please contact our
Marketing office at: [email protected]
RESPONSIBLE DIRECTORStefano Odorizzi - [email protected]
ART DIRECTORLuisa Cunico - [email protected]
PRINTING Grafiche Dal Piaz - Trento
Auto
rizza
zione
del
Trib
unal
e di
Tre
nto
n° 1
353
RS d
i dat
a 2/
4/20
08
The EnginSoft Newsletter editions contain references to the following products which are trademarks or registered trademarks of their respective owners: ANSYS, ANSYS Workbench, AUTODYN, CFX, FLUENT, FORTE’ and any and all ANSYS, Inc. brand, product, service and feature names, logos and slogans are registered trademarks or trademarks of ANSYS, Inc. or its subsidiaries in the United States or other countries. [ICEM CFD is a trademark used by ANSYS, Inc. under license]. (www.ANSYS.com) - modeFRONTIER is a trademark of ESTECO Spa (www.esteco.com) - Flowmaster is a registered trademark of Mentor Graphics in the USA (www.flowmaster.com) - MAGMASOFT is a trademark of MAGMA GmbH (www.magmasoft.de) - FORGE, COLDFORM and FORGE Nxt are trademarks of Transvalor S.A. (www.transvalor.com) - LS-DYNA is a trademark of LSTC (www.lstc.com) - Cetol 6s is a trademark of Sigmetrix L.L.C. (www.sigmetrix.com) RecurDyn™ and MBD for ANSYS is a registered trademark of FunctionBay, Inc. (www.functionbay.org) - Kraken is a trademark of ESSS (www.esss.com.br)
Newsletter EnginSoft Year 12 n°2 - 6 Interview7 - Newsletter EnginSoft Year 12 n°2 Interview
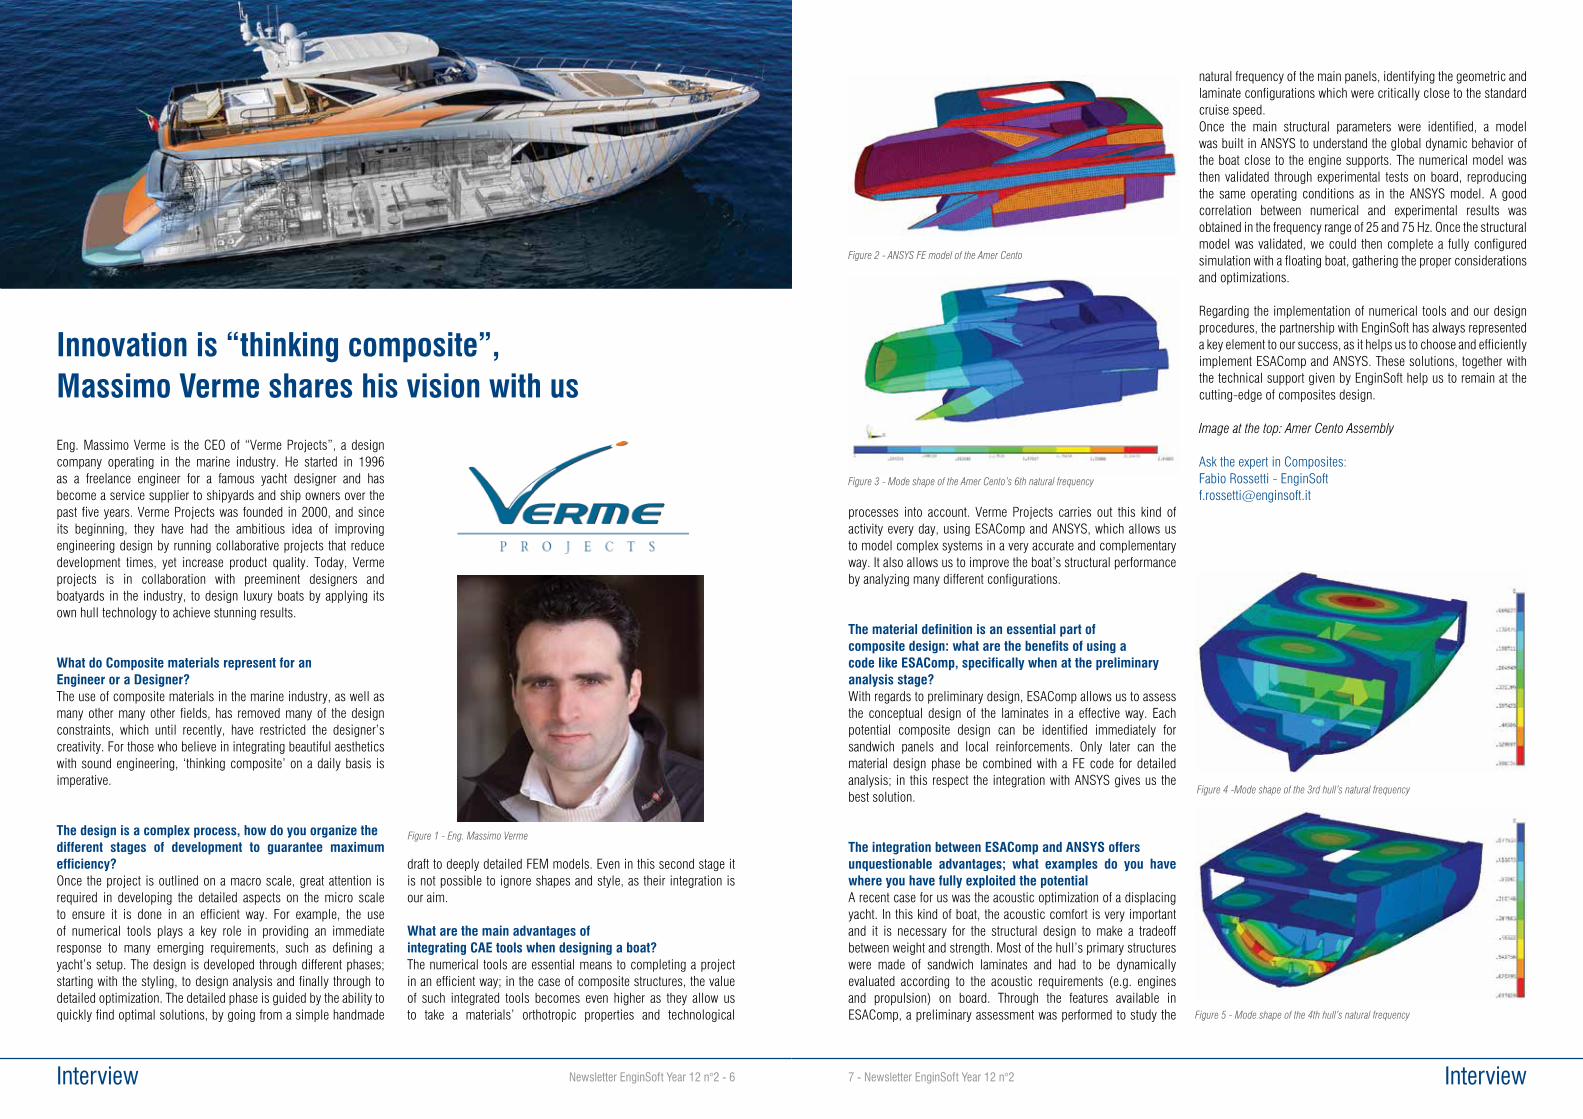
Eng. Massimo Verme is the CEO of “Verme Projects”, a design company operating in the marine industry. He started in 1996 as a freelance engineer for a famous yacht designer and has become a service supplier to shipyards and ship owners over the past five years. Verme Projects was founded in 2000, and since its beginning, they have had the ambitious idea of improving engineering design by running collaborative projects that reduce development times, yet increase product quality. Today, Verme projects is in collaboration with preeminent designers and boatyards in the industry, to design luxury boats by applying its own hull technology to achieve stunning results.
What do Composite materials represent for an Engineer or a Designer?The use of composite materials in the marine industry, as well as many other many other fields, has removed many of the design constraints, which until recently, have restricted the designer’s creativity. For those who believe in integrating beautiful aesthetics with sound engineering, ‘thinking composite’ on a daily basis is imperative.
The design is a complex process, how do you organize the different stages of development to guarantee maximum efficiency?Once the project is outlined on a macro scale, great attention is required in developing the detailed aspects on the micro scale to ensure it is done in an efficient way. For example, the use of numerical tools plays a key role in providing an immediate response to many emerging requirements, such as defining a yacht’s setup. The design is developed through different phases; starting with the styling, to design analysis and finally through to detailed optimization. The detailed phase is guided by the ability to quickly find optimal solutions, by going from a simple handmade
draft to deeply detailed FEM models. Even in this second stage it is not possible to ignore shapes and style, as their integration is our aim.
What are the main advantages ofintegrating CAE tools when designing a boat?The numerical tools are essential means to completing a project in an efficient way; in the case of composite structures, the value of such integrated tools becomes even higher as they allow us to take a materials’ orthotropic properties and technological
Innovation is “thinking composite”, Massimo Verme shares his vision with us
Figure 1 - Eng. Massimo Verme
processes into account. Verme Projects carries out this kind of activity every day, using ESAComp and ANSYS, which allows us to model complex systems in a very accurate and complementary way. It also allows us to improve the boat’s structural performance by analyzing many different configurations.
The material definition is an essential part of composite design: what are the benefits of using a code like ESAComp, specifically when at the preliminary analysis stage? With regards to preliminary design, ESAComp allows us to assess the conceptual design of the laminates in a effective way. Each potential composite design can be identified immediately for sandwich panels and local reinforcements. Only later can the material design phase be combined with a FE code for detailed analysis; in this respect the integration with ANSYS gives us the best solution.
The integration between ESAComp and ANSYS offersunquestionable advantages; what examples do you have where you have fully exploited the potentialA recent case for us was the acoustic optimization of a displacing yacht. In this kind of boat, the acoustic comfort is very important and it is necessary for the structural design to make a tradeoff between weight and strength. Most of the hull’s primary structures were made of sandwich laminates and had to be dynamically evaluated according to the acoustic requirements (e.g. engines and propulsion) on board. Through the features available in ESAComp, a preliminary assessment was performed to study the
natural frequency of the main panels, identifying the geometric and laminate configurations which were critically close to the standard cruise speed.Once the main structural parameters were identified, a model was built in ANSYS to understand the global dynamic behavior of the boat close to the engine supports. The numerical model was then validated through experimental tests on board, reproducing the same operating conditions as in the ANSYS model. A good correlation between numerical and experimental results was obtained in the frequency range of 25 and 75 Hz. Once the structural model was validated, we could then complete a fully configured simulation with a floating boat, gathering the proper considerations and optimizations.
Regarding the implementation of numerical tools and our design procedures, the partnership with EnginSoft has always represented a key element to our success, as it helps us to choose and efficiently implement ESAComp and ANSYS. These solutions, together with the technical support given by EnginSoft help us to remain at the cutting-edge of composites design.
Image at the top: Amer Cento Assembly
Ask the expert in Composites:Fabio Rossetti - [email protected]
Figure 2 - ANSYS FE model of the Amer Cento
Figure 3 - Mode shape of the Amer Cento’s 6th natural frequency
Figure 4 -Mode shape of the 3rd hull’s natural frequency
Figure 5 - Mode shape of the 4th hull’s natural frequency
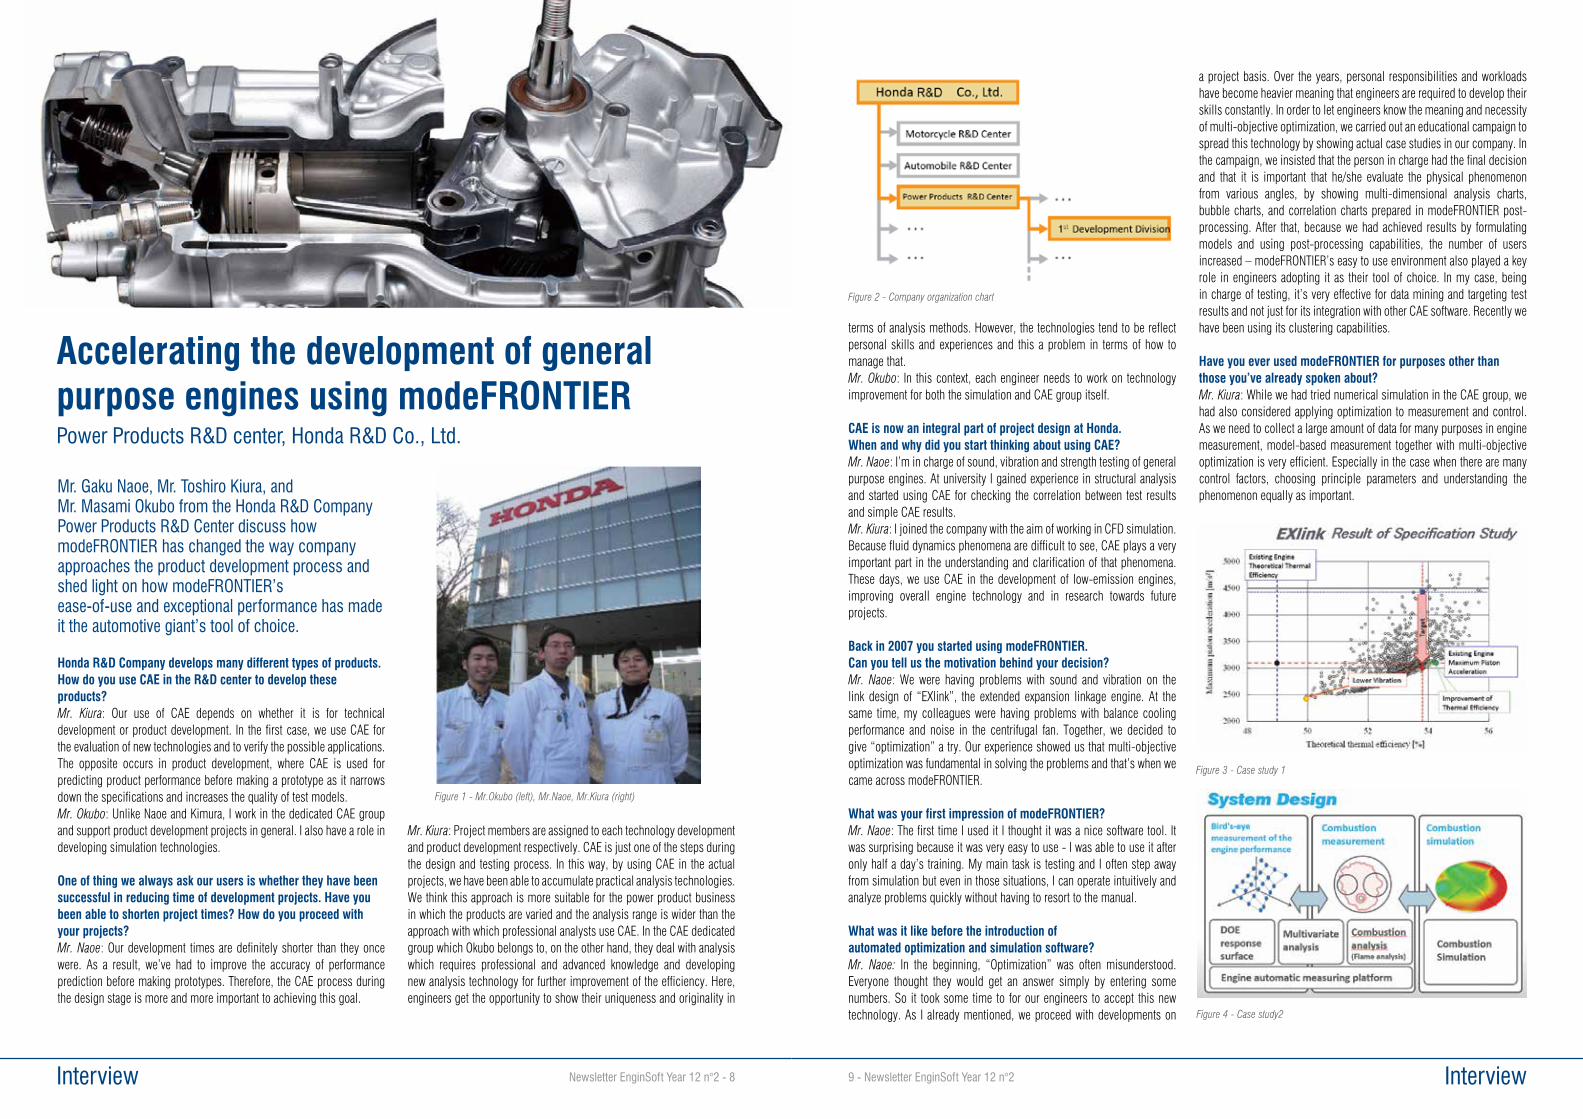
Figure 1 - Mr.Okubo (left), Mr.Naoe, Mr.Kiura (right)
Interview9 - Newsletter EnginSoft Year 12 n°2 Interview Newsletter EnginSoft Year 12 n°2 - 8
Mr. Gaku Naoe, Mr. Toshiro Kiura, and Mr. Masami Okubo from the Honda R&D Company Power Products R&D Center discuss how modeFRONTIER has changed the way company approaches the product development process and shed light on how modeFRONTIER’s ease-of-use and exceptional performance has made it the automotive giant’s tool of choice.
Honda R&D Company develops many different types of products. How do you use CAE in the R&D center to develop these products?Mr. Kiura: Our use of CAE depends on whether it is for technical development or product development. In the first case, we use CAE for the evaluation of new technologies and to verify the possible applications. The opposite occurs in product development, where CAE is used for predicting product performance before making a prototype as it narrows down the specifications and increases the quality of test models.Mr. Okubo: Unlike Naoe and Kimura, I work in the dedicated CAE group and support product development projects in general. I also have a role in developing simulation technologies.
One of thing we always ask our users is whether they have been successful in reducing time of development projects. Have you been able to shorten project times? How do you proceed with your projects?Mr. Naoe: Our development times are definitely shorter than they once were. As a result, we’ve had to improve the accuracy of performance prediction before making prototypes. Therefore, the CAE process during the design stage is more and more important to achieving this goal.
Mr. Kiura: Project members are assigned to each technology development and product development respectively. CAE is just one of the steps during the design and testing process. In this way, by using CAE in the actual projects, we have been able to accumulate practical analysis technologies. We think this approach is more suitable for the power product business in which the products are varied and the analysis range is wider than the approach with which professional analysts use CAE. In the CAE dedicated group which Okubo belongs to, on the other hand, they deal with analysis which requires professional and advanced knowledge and developing new analysis technology for further improvement of the efficiency. Here, engineers get the opportunity to show their uniqueness and originality in
Accelerating the development of general purpose engines using modeFRONTIERPower Products R&D center, Honda R&D Co., Ltd.
terms of analysis methods. However, the technologies tend to be reflect personal skills and experiences and this a problem in terms of how to manage that. Mr. Okubo: In this context, each engineer needs to work on technology improvement for both the simulation and CAE group itself.
CAE is now an integral part of project design at Honda. When and why did you start thinking about using CAE?Mr. Naoe: I’m in charge of sound, vibration and strength testing of general purpose engines. At university I gained experience in structural analysis and started using CAE for checking the correlation between test results and simple CAE results.Mr. Kiura: I joined the company with the aim of working in CFD simulation. Because fluid dynamics phenomena are difficult to see, CAE plays a very important part in the understanding and clarification of that phenomena. These days, we use CAE in the development of low-emission engines, improving overall engine technology and in research towards future projects.
Back in 2007 you started using modeFRONTIER. Can you tell us the motivation behind your decision? Mr. Naoe: We were having problems with sound and vibration on the link design of “EXlink”, the extended expansion linkage engine. At the same time, my colleagues were having problems with balance cooling performance and noise in the centrifugal fan. Together, we decided to give “optimization” a try. Our experience showed us that multi-objective optimization was fundamental in solving the problems and that’s when we came across modeFRONTIER.
What was your first impression of modeFRONTIER?Mr. Naoe: The first time I used it I thought it was a nice software tool. It was surprising because it was very easy to use - I was able to use it after only half a day’s training. My main task is testing and I often step away from simulation but even in those situations, I can operate intuitively and analyze problems quickly without having to resort to the manual.
What was it like before the introduction of automated optimization and simulation software?Mr. Naoe: In the beginning, “Optimization” was often misunderstood. Everyone thought they would get an answer simply by entering some numbers. So it took some time to for our engineers to accept this new technology. As I already mentioned, we proceed with developments on
a project basis. Over the years, personal responsibilities and workloads have become heavier meaning that engineers are required to develop their skills constantly. In order to let engineers know the meaning and necessity of multi-objective optimization, we carried out an educational campaign to spread this technology by showing actual case studies in our company. In the campaign, we insisted that the person in charge had the final decision and that it is important that he/she evaluate the physical phenomenon from various angles, by showing multi-dimensional analysis charts, bubble charts, and correlation charts prepared in modeFRONTIER post-processing. After that, because we had achieved results by formulating models and using post-processing capabilities, the number of users increased – modeFRONTIER’s easy to use environment also played a key role in engineers adopting it as their tool of choice. In my case, being in charge of testing, it’s very effective for data mining and targeting test results and not just for its integration with other CAE software. Recently we have been using its clustering capabilities.
Have you ever used modeFRONTIER for purposes other than those you’ve already spoken about? Mr. Kiura: While we had tried numerical simulation in the CAE group, we had also considered applying optimization to measurement and control. As we need to collect a large amount of data for many purposes in engine measurement, model-based measurement together with multi-objective optimization is very efficient. Especially in the case when there are many control factors, choosing principle parameters and understanding the phenomenon equally as important.
Figure 2 - Company organization chart
Figure 3 - Case study 1
Figure 4 - Case study2
Interview Newsletter EnginSoft Year 12 n°2 - 10 Interview11 - Newsletter EnginSoft Year 12 n°2
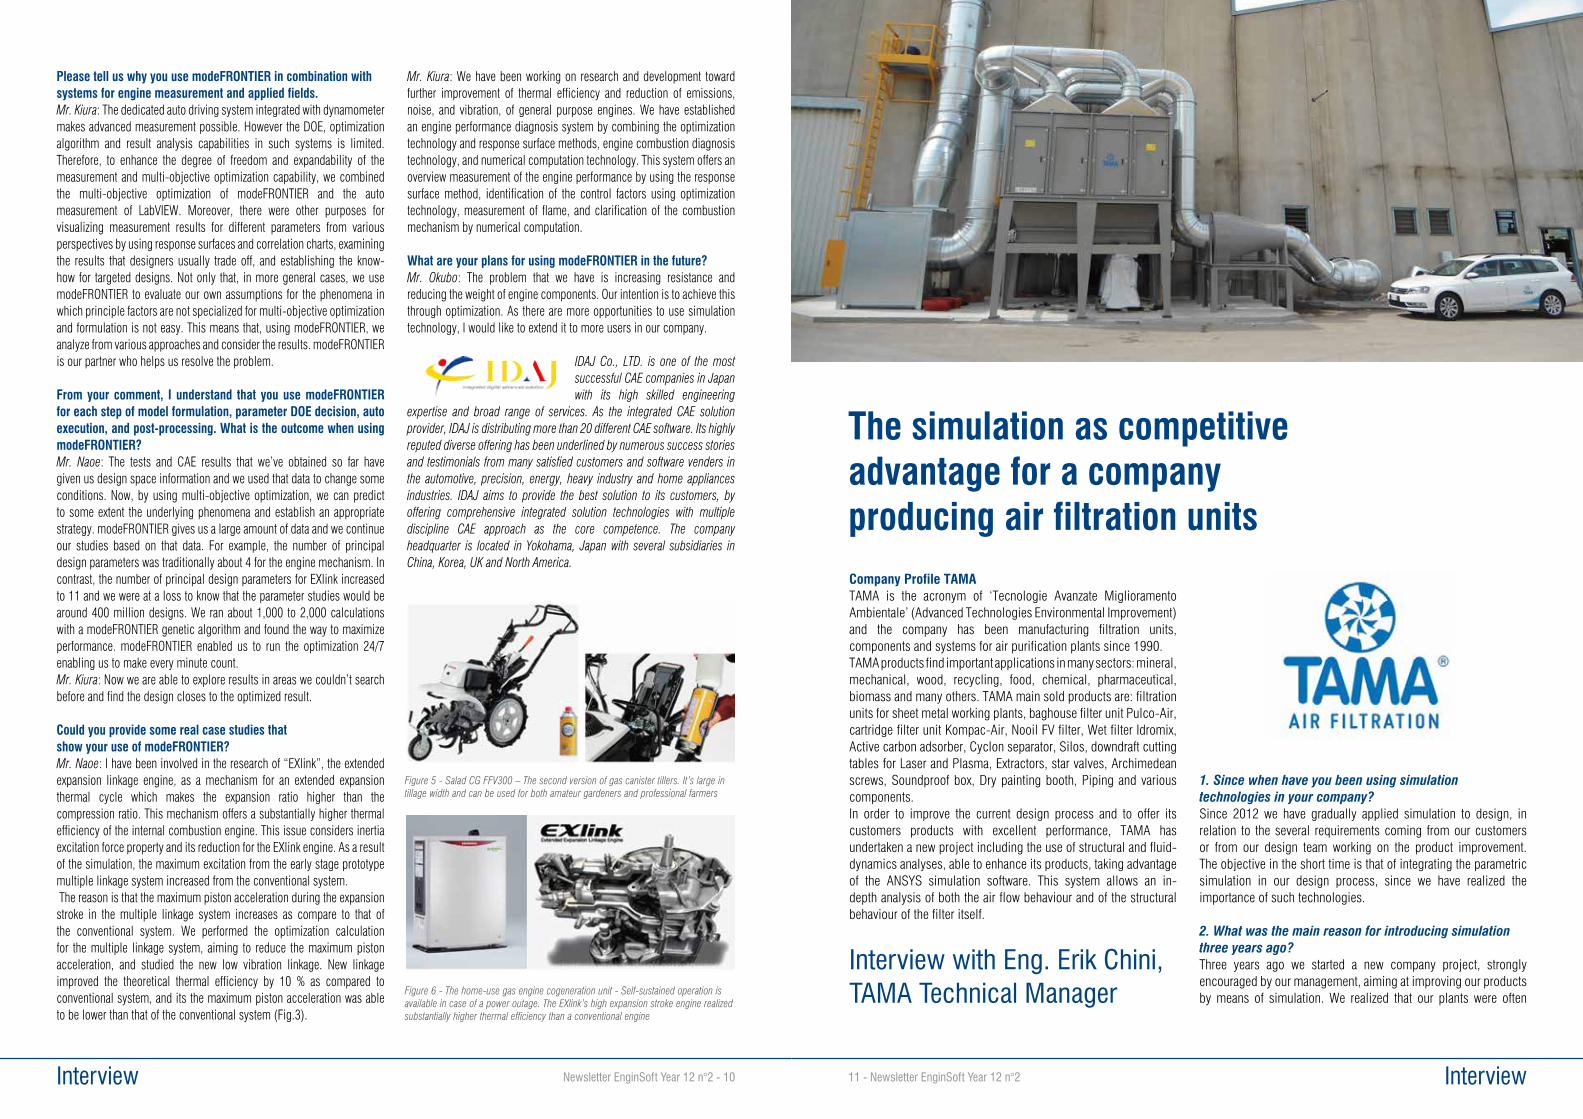
The simulation as competitive advantage for a company producing air filtration unitsCompany Profile TAMATAMA is the acronym of ‘Tecnologie Avanzate Miglioramento Ambientale’ (Advanced Technologies Environmental Improvement) and the company has been manufacturing filtration units, components and systems for air purification plants since 1990.TAMA products find important applications in many sectors: mineral, mechanical, wood, recycling, food, chemical, pharmaceutical, biomass and many others. TAMA main sold products are: filtration units for sheet metal working plants, baghouse filter unit Pulco-Air, cartridge filter unit Kompac-Air, Nooil FV filter, Wet filter Idromix, Active carbon adsorber, Cyclon separator, Silos, downdraft cutting tables for Laser and Plasma, Extractors, star valves, Archimedean screws, Soundproof box, Dry painting booth, Piping and various components.In order to improve the current design process and to offer its customers products with excellent performance, TAMA has undertaken a new project including the use of structural and fluid-dynamics analyses, able to enhance its products, taking advantage of the ANSYS simulation software. This system allows an in-depth analysis of both the air flow behaviour and of the structural behaviour of the filter itself.
Interview with Eng. Erik Chini, TAMA Technical Manager
1. Since when have you been using simulation technologies in your company?Since 2012 we have gradually applied simulation to design, in relation to the several requirements coming from our customers or from our design team working on the product improvement. The objective in the short time is that of integrating the parametric simulation in our design process, since we have realized the importance of such technologies.
2. What was the main reason for introducing simulation three years ago?Three years ago we started a new company project, strongly encouraged by our management, aiming at improving our products by means of simulation. We realized that our plants were often
Please tell us why you use modeFRONTIER in combination with systems for engine measurement and applied fields.Mr. Kiura: The dedicated auto driving system integrated with dynamometer makes advanced measurement possible. However the DOE, optimization algorithm and result analysis capabilities in such systems is limited. Therefore, to enhance the degree of freedom and expandability of the measurement and multi-objective optimization capability, we combined the multi-objective optimization of modeFRONTIER and the auto measurement of LabVIEW. Moreover, there were other purposes for visualizing measurement results for different parameters from various perspectives by using response surfaces and correlation charts, examining the results that designers usually trade off, and establishing the know-how for targeted designs. Not only that, in more general cases, we use modeFRONTIER to evaluate our own assumptions for the phenomena in which principle factors are not specialized for multi-objective optimization and formulation is not easy. This means that, using modeFRONTIER, we analyze from various approaches and consider the results. modeFRONTIER is our partner who helps us resolve the problem.
From your comment, I understand that you use modeFRONTIER for each step of model formulation, parameter DOE decision, auto execution, and post-processing. What is the outcome when using modeFRONTIER?Mr. Naoe: The tests and CAE results that we’ve obtained so far have given us design space information and we used that data to change some conditions. Now, by using multi-objective optimization, we can predict to some extent the underlying phenomena and establish an appropriate strategy. modeFRONTIER gives us a large amount of data and we continue our studies based on that data. For example, the number of principal design parameters was traditionally about 4 for the engine mechanism. In contrast, the number of principal design parameters for EXlink increased to 11 and we were at a loss to know that the parameter studies would be around 400 million designs. We ran about 1,000 to 2,000 calculations with a modeFRONTIER genetic algorithm and found the way to maximize performance. modeFRONTIER enabled us to run the optimization 24/7 enabling us to make every minute count. Mr. Kiura: Now we are able to explore results in areas we couldn’t search before and find the design closes to the optimized result.
Could you provide some real case studies that show your use of modeFRONTIER?Mr. Naoe: I have been involved in the research of “EXlink”, the extended expansion linkage engine, as a mechanism for an extended expansion thermal cycle which makes the expansion ratio higher than the compression ratio. This mechanism offers a substantially higher thermal efficiency of the internal combustion engine. This issue considers inertia excitation force property and its reduction for the EXlink engine. As a result of the simulation, the maximum excitation from the early stage prototype multiple linkage system increased from the conventional system. The reason is that the maximum piston acceleration during the expansion stroke in the multiple linkage system increases as compare to that of the conventional system. We performed the optimization calculation for the multiple linkage system, aiming to reduce the maximum piston acceleration, and studied the new low vibration linkage. New linkage improved the theoretical thermal efficiency by 10 % as compared to conventional system, and its the maximum piston acceleration was able to be lower than that of the conventional system (Fig.3).
Mr. Kiura: We have been working on research and development toward further improvement of thermal efficiency and reduction of emissions, noise, and vibration, of general purpose engines. We have established an engine performance diagnosis system by combining the optimization technology and response surface methods, engine combustion diagnosis technology, and numerical computation technology. This system offers an overview measurement of the engine performance by using the response surface method, identification of the control factors using optimization technology, measurement of flame, and clarification of the combustion mechanism by numerical computation.
What are your plans for using modeFRONTIER in the future?Mr. Okubo: The problem that we have is increasing resistance and reducing the weight of engine components. Our intention is to achieve this through optimization. As there are more opportunities to use simulation technology, I would like to extend it to more users in our company.
IDAJ Co., LTD. is one of the most successful CAE companies in Japan with its high skilled engineering
expertise and broad range of services. As the integrated CAE solution provider, IDAJ is distributing more than 20 different CAE software. Its highly reputed diverse offering has been underlined by numerous success stories and testimonials from many satisfied customers and software venders in the automotive, precision, energy, heavy industry and home appliances industries. IDAJ aims to provide the best solution to its customers, by offering comprehensive integrated solution technologies with multiple discipline CAE approach as the core competence. The company headquarter is located in Yokohama, Japan with several subsidiaries in China, Korea, UK and North America.
Figure 5 - Salad CG FFV300 – The second version of gas canister tillers. It’s large in tillage width and can be used for both amateur gardeners and professional farmers
Figure 6 - The home-use gas engine cogeneration unit - Self-sustained operation is available in case of a power outage. The EXlink’s high expansion stroke engine realized substantially higher thermal efficiency than a conventional engine
Interview13 - Newsletter EnginSoft Year 12 n°2 Interview Newsletter EnginSoft Year 12 n°2 - 12
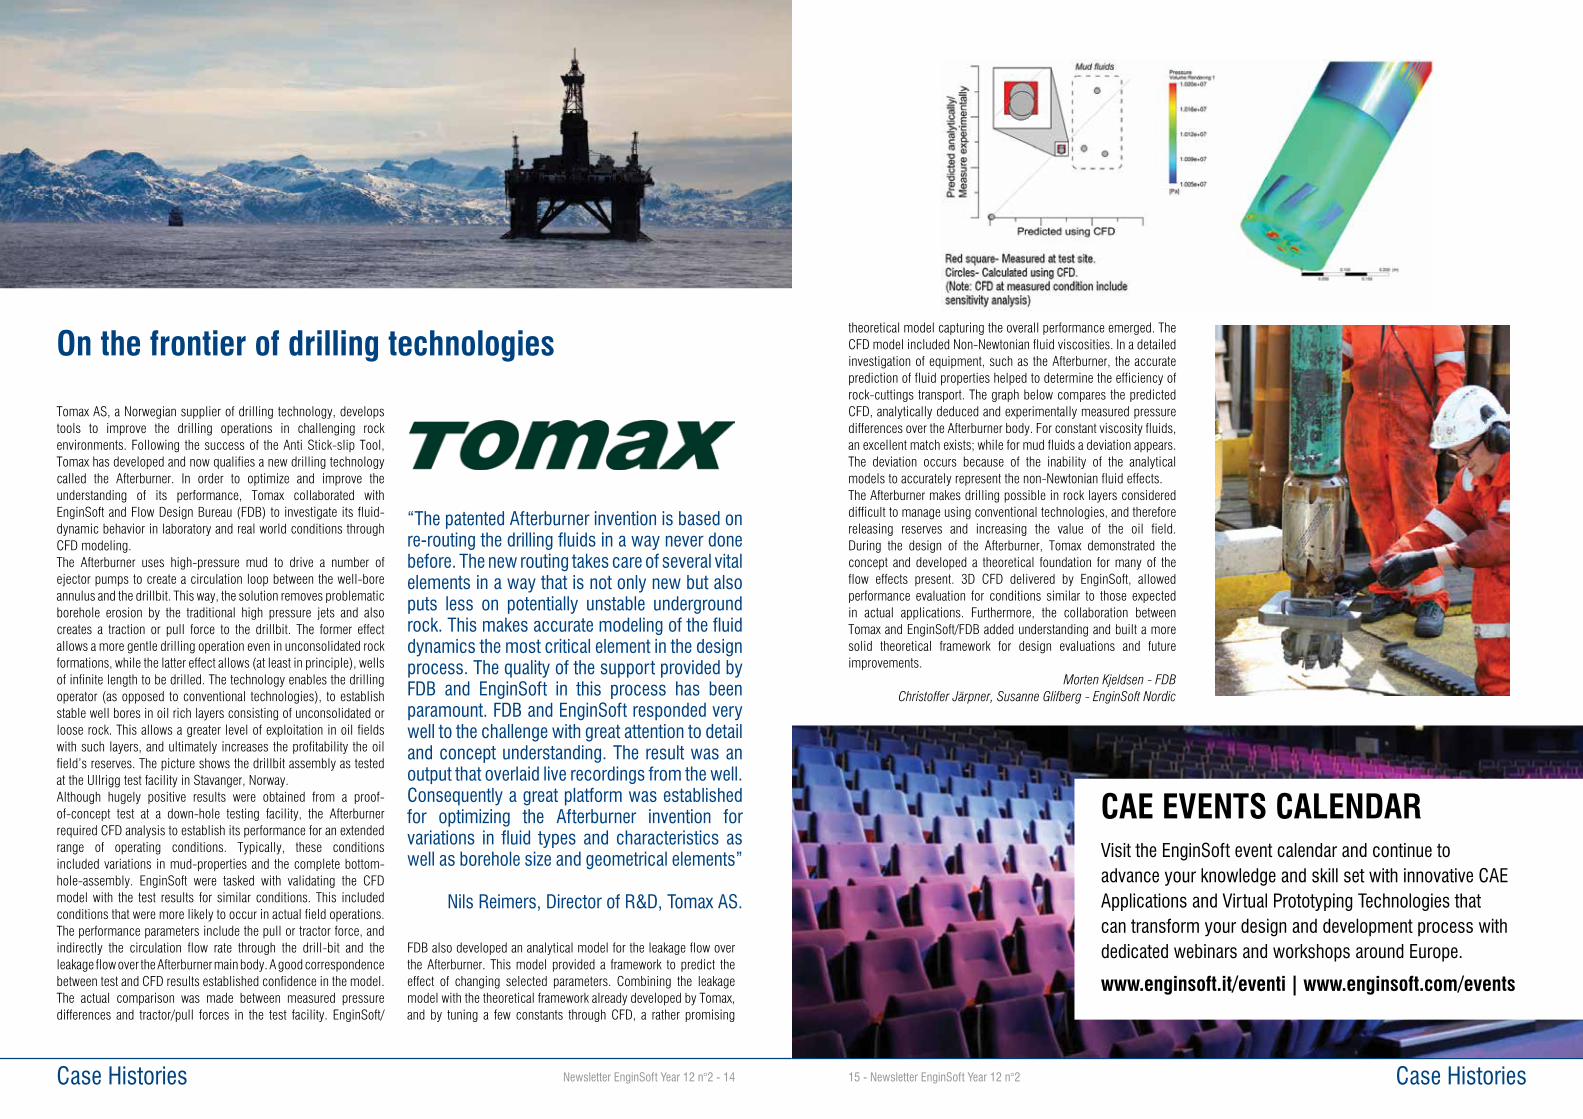
Fluid-dynamic Analysis BOUNDARY CONDITIONS In order to evaluate the flows inside the filtration chamber, the pre-chamber (labyrinth) and to understand where the powder normally accumulates, a CFD analysis has been performed using the following boundary conditions:
• Inlet flow rate equal to 4400 m3/h;• Exit opening;• Filtering elements considers as porous sub-elements; • Momentum source corresponding to the fan as a function to
its characteristic curve;• Shear Stress Transport (SST) turbulence model.
RESULTSA strong asymmetry of the flow can be observed. It occurs in the first chamber of the labyrinth, whose right part is affected only by circular flows and not by the main one; such behaviour has been observed also by experimentally performing some measurements in the section located in the centre of the inspection panel in the first room of the labyrinth.
The strong asymmetry of the flow causes a partial exploitation of the available passing areas, as shown in figure 6. Some fluid screws follow a circular pattern with a very low velocity, while the major part follows the main flow with a much higher speed to those estimated starting from the passing net areas.
This simple analysis highlights the limited efficacy of the labyrinth to increase the time of the air flow path and the dust pre-abatement, as well as the only partial exploitation of the air inlet section.
ConclusionsThanks to simulation, it has been possible to identify the areas where an intervention is necessary to improve the product performance.In particular, as far as the structural analysis is concerned, we have realized that only some panels are really stressed, while others are totally unstressed and therefore thicknesses can be reduced and just few reinforcement plates should be placed where strictly necessary. The immediate consequence is a saving in material and money.From a fluid-dynamic point of view, the achieved results have been particularly interesting since they proved that the chamber of pre-abatement is not so efficient, some internal obstacles increase the pressure drop and the sizing of the filter inlet section is not the correct one.Thanks to these remarks we could modify and improve the product geometry.All these evaluations have been possible thanks to the simulation tools that allows the reduction of design and prototyping time, thus providing an in-depth knowledge of some phenomena that cannot so easily be observed.
Ing. Erik Chini, TAMA Spa
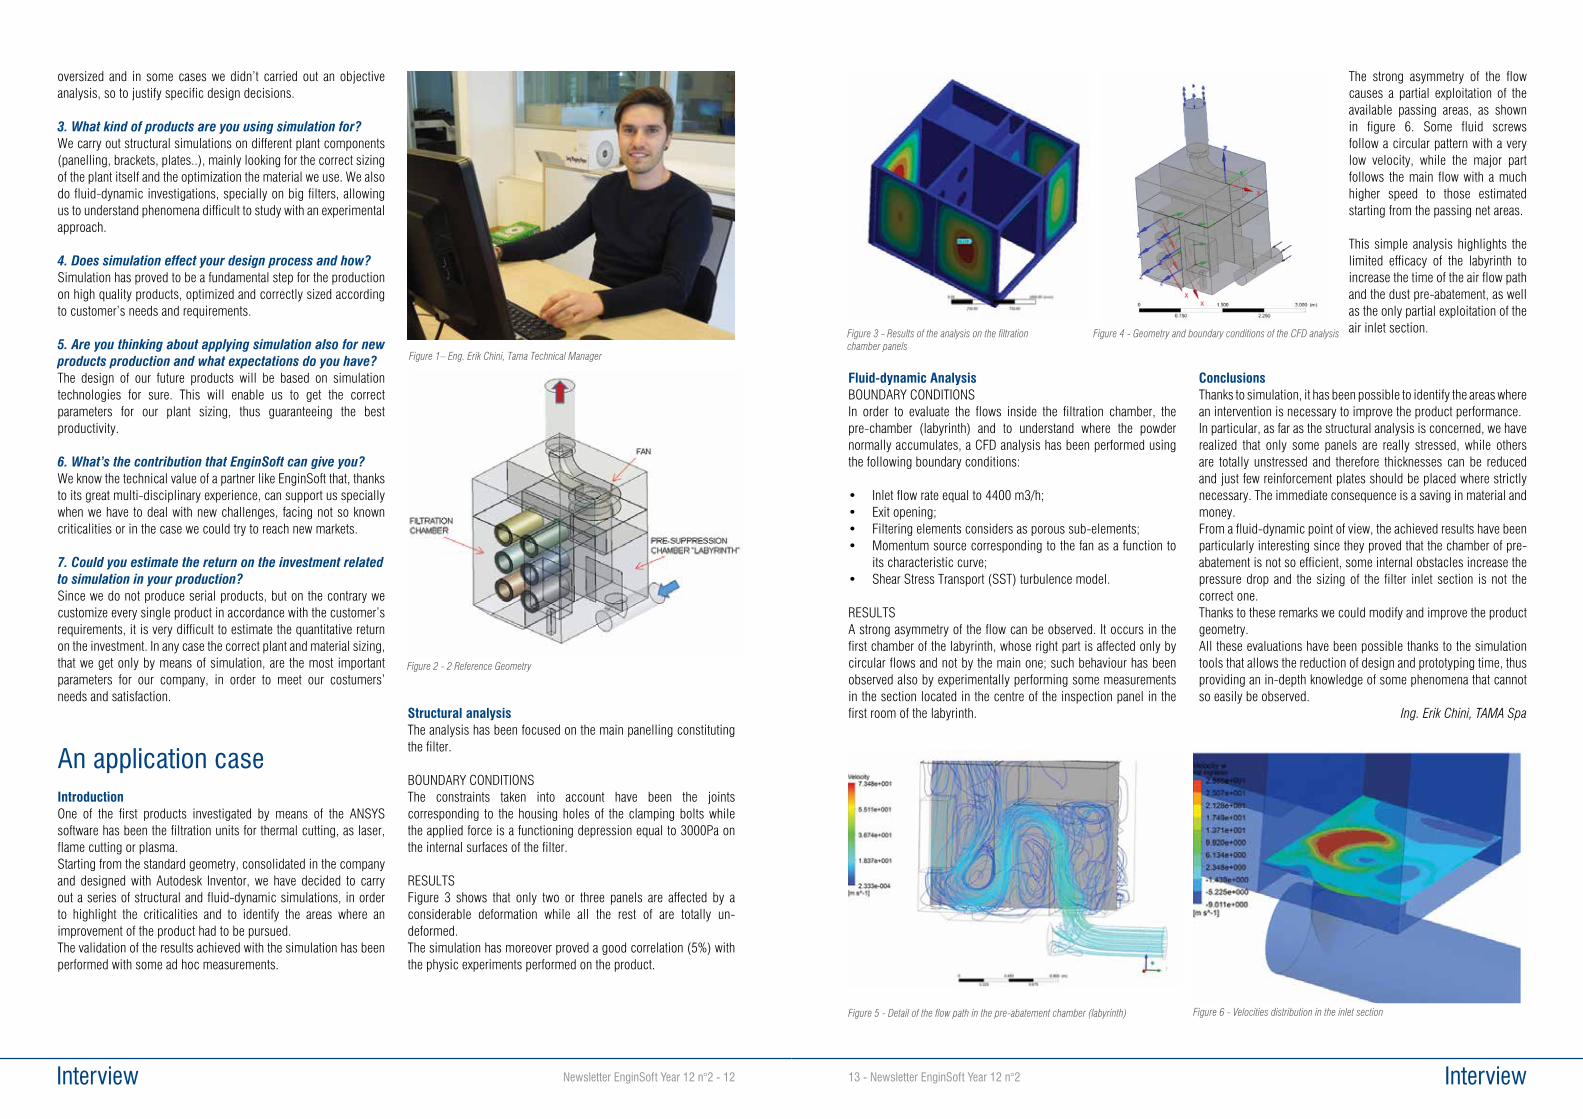
Figure 3 - Results of the analysis on the filtration chamber panels
Figure 5 - Detail of the flow path in the pre-abatement chamber (labyrinth) Figure 6 - Velocities distribution in the inlet section
Figure 4 - Geometry and boundary conditions of the CFD analysis
oversized and in some cases we didn’t carried out an objective analysis, so to justify specific design decisions.
3. What kind of products are you using simulation for?We carry out structural simulations on different plant components (panelling, brackets, plates..), mainly looking for the correct sizing of the plant itself and the optimization the material we use. We also do fluid-dynamic investigations, specially on big filters, allowing us to understand phenomena difficult to study with an experimental approach.
4. Does simulation effect your design process and how?Simulation has proved to be a fundamental step for the production on high quality products, optimized and correctly sized according to customer’s needs and requirements.
5. Are you thinking about applying simulation also for new products production and what expectations do you have?The design of our future products will be based on simulation technologies for sure. This will enable us to get the correct parameters for our plant sizing, thus guaranteeing the best productivity.
6. What’s the contribution that EnginSoft can give you?We know the technical value of a partner like EnginSoft that, thanks to its great multi-disciplinary experience, can support us specially when we have to deal with new challenges, facing not so known criticalities or in the case we could try to reach new markets.
7. Could you estimate the return on the investment related to simulation in your production?Since we do not produce serial products, but on the contrary we customize every single product in accordance with the customer’s requirements, it is very difficult to estimate the quantitative return on the investment. In any case the correct plant and material sizing, that we get only by means of simulation, are the most important parameters for our company, in order to meet our costumers’ needs and satisfaction.
An application caseIntroductionOne of the first products investigated by means of the ANSYS software has been the filtration units for thermal cutting, as laser, flame cutting or plasma.Starting from the standard geometry, consolidated in the company and designed with Autodesk Inventor, we have decided to carry out a series of structural and fluid-dynamic simulations, in order to highlight the criticalities and to identify the areas where an improvement of the product had to be pursued.The validation of the results achieved with the simulation has been performed with some ad hoc measurements.
Structural analysisThe analysis has been focused on the main panelling constituting the filter.
BOUNDARY CONDITIONS The constraints taken into account have been the joints corresponding to the housing holes of the clamping bolts while the applied force is a functioning depression equal to 3000Pa on the internal surfaces of the filter.
RESULTSFigure 3 shows that only two or three panels are affected by a considerable deformation while all the rest of are totally un-deformed.The simulation has moreover proved a good correlation (5%) with the physic experiments performed on the product.
Figure 1– Eng. Erik Chini, Tama Technical Manager
Figure 2 - 2 Reference Geometry
Case Histories15 - Newsletter EnginSoft Year 12 n°2 Case Histories Newsletter EnginSoft Year 12 n°2 - 14
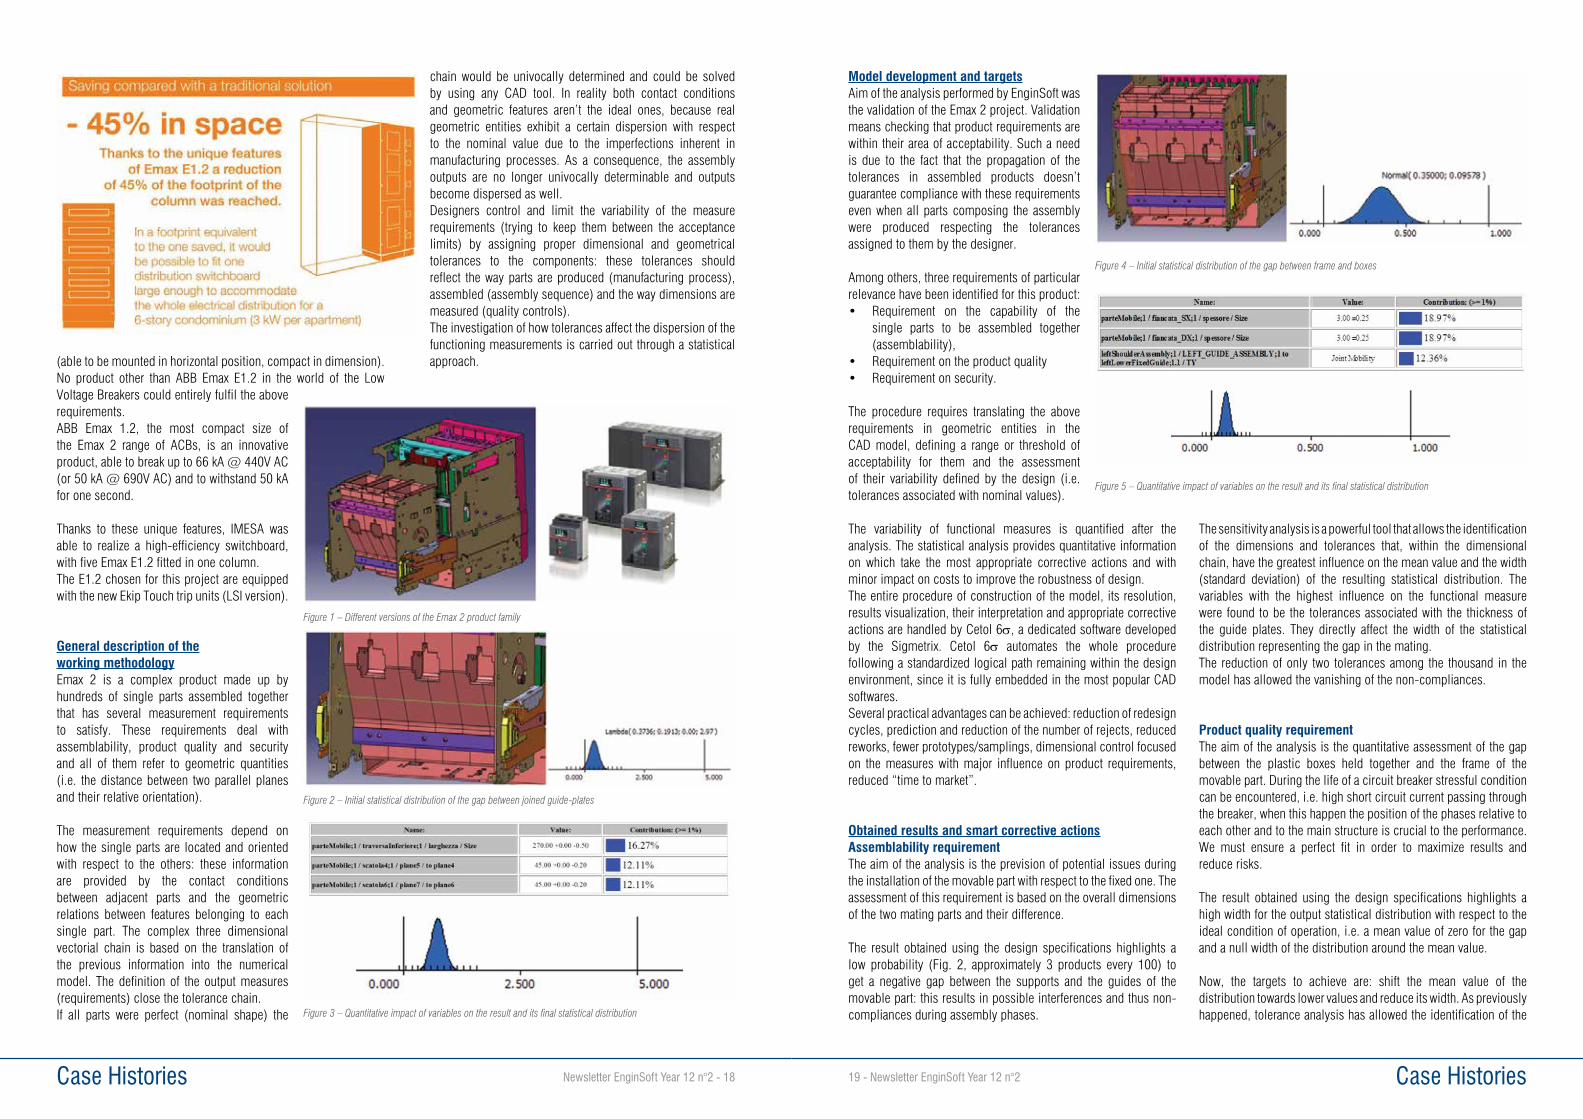
theoretical model capturing the overall performance emerged. The CFD model included Non-Newtonian fluid viscosities. In a detailed investigation of equipment, such as the Afterburner, the accurate prediction of fluid properties helped to determine the efficiency of rock-cuttings transport. The graph below compares the predicted CFD, analytically deduced and experimentally measured pressure differences over the Afterburner body. For constant viscosity fluids, an excellent match exists; while for mud fluids a deviation appears. The deviation occurs because of the inability of the analytical models to accurately represent the non-Newtonian fluid effects.The Afterburner makes drilling possible in rock layers considered difficult to manage using conventional technologies, and therefore releasing reserves and increasing the value of the oil field. During the design of the Afterburner, Tomax demonstrated the concept and developed a theoretical foundation for many of the flow effects present. 3D CFD delivered by EnginSoft, allowed performance evaluation for conditions similar to those expected in actual applications. Furthermore, the collaboration between Tomax and EnginSoft/FDB added understanding and built a more solid theoretical framework for design evaluations and future improvements.
Morten Kjeldsen - FDBChristoffer Järpner, Susanne Glifberg - EnginSoft Nordic
Tomax AS, a Norwegian supplier of drilling technology, develops tools to improve the drilling operations in challenging rock environments. Following the success of the Anti Stick-slip Tool, Tomax has developed and now qualifies a new drilling technology called the Afterburner. In order to optimize and improve the understanding of its performance, Tomax collaborated with EnginSoft and Flow Design Bureau (FDB) to investigate its fluid-dynamic behavior in laboratory and real world conditions through CFD modeling. The Afterburner uses high-pressure mud to drive a number of ejector pumps to create a circulation loop between the well-bore annulus and the drillbit. This way, the solution removes problematic borehole erosion by the traditional high pressure jets and also creates a traction or pull force to the drillbit. The former effect allows a more gentle drilling operation even in unconsolidated rock formations, while the latter effect allows (at least in principle), wells of infinite length to be drilled. The technology enables the drilling operator (as opposed to conventional technologies), to establish stable well bores in oil rich layers consisting of unconsolidated or loose rock. This allows a greater level of exploitation in oil fields with such layers, and ultimately increases the profitability the oil field’s reserves. The picture shows the drillbit assembly as tested at the Ullrigg test facility in Stavanger, Norway. Although hugely positive results were obtained from a proof-of-concept test at a down-hole testing facility, the Afterburner required CFD analysis to establish its performance for an extended range of operating conditions. Typically, these conditions included variations in mud-properties and the complete bottom-hole-assembly. EnginSoft were tasked with validating the CFD model with the test results for similar conditions. This included conditions that were more likely to occur in actual field operations. The performance parameters include the pull or tractor force, and indirectly the circulation flow rate through the drill-bit and the leakage flow over the Afterburner main body. A good correspondence between test and CFD results established confidence in the model. The actual comparison was made between measured pressure differences and tractor/pull forces in the test facility. EnginSoft/
FDB also developed an analytical model for the leakage flow over the Afterburner. This model provided a framework to predict the effect of changing selected parameters. Combining the leakage model with the theoretical framework already developed by Tomax, and by tuning a few constants through CFD, a rather promising
On the frontier of drilling technologies
“The patented Afterburner invention is based on re-routing the drilling fluids in a way never done before. The new routing takes care of several vital elements in a way that is not only new but also puts less on potentially unstable underground rock. This makes accurate modeling of the fluid dynamics the most critical element in the design process. The quality of the support provided by FDB and EnginSoft in this process has been paramount. FDB and EnginSoft responded very well to the challenge with great attention to detail and concept understanding. The result was an output that overlaid live recordings from the well. Consequently a great platform was established for optimizing the Afterburner invention for variations in fluid types and characteristics as well as borehole size and geometrical elements”
Nils Reimers, Director of R&D, Tomax AS.
CAE EVENTS CALENDARVisit the EnginSoft event calendar and continue to advance your knowledge and skill set with innovative CAE Applications and Virtual Prototyping Technologies that can transform your design and development process with dedicated webinars and workshops around Europe.
www.enginsoft.it/eventi | www.enginsoft.com/events

Case Histories17 - Newsletter EnginSoft Year 12 n°2 Case Histories Newsletter EnginSoft Year 12 n°2 - 16
efficiency and environmental performance. The attention to environmental issues and the focus on resource saving, allowed us, over the past two years, also to significantly increase our efficiency. In our business, we aim to reach excellence in management systems covering quality, environment, safety and ethics. We want to give to all employees a safe working environment where people feel gratified and meet society’s expectations on corporate social responsibility.
Product descriptionThe power needed, when neededSACE Emax 2 is a new series of low voltage air circuit-breakers available up to 6300 A and with the ability to efficiently and simply control electrical installations – from the traditional to the more complex – with minimum impact, the new SACE Emax 2 circuit-breakers represent the evolution of a circuit-breaker into a Power Manager.SACE Emax 2 have been designed to increase efficiency in all installations: from industrial and naval applications to traditional and renewable power generation installations, buildings, data centers and shopping centers. Reliable protection and systems managed with competence.
Power ControllerThe exclusive Power Controller function available on the new SACE Emax 2 circuit-breakers monitors the power managed by the circuit-breaker, keeping it below the limit set by the user. As a result of this more effective use, the peak of power consumed can be limited allowing savings on electricity bills.
The Power Controller, patented by ABB, disconnects non-priority utilities, such as for example electric car charging stations, during the times when consumption limits need to be respected, and connects them again as soon as it is appropriate. When required, it automatically activates auxiliary power supplies such as generator sets. No monitoring system is required: it is sufficient to set the required load limit on Emax 2, which can control any circuit-breaker located downstream, even if it is not equipped with a measurement function. In installations that are already equipped with energy management systems, the load limit can also be modified remotely.
Ekip TouchSACE Emax 2 circuit-breakers are equipped with a new generation of protection trip units that are easy to programme and read. The Ekip Touch trip units measure power and energy with precision and save the most recent alarms, events and measurements in order to prevent faults to the installation or trip effectively when necessary.
Network AnalyzerUpon request, the Network Analyzer function is also available, which controls the quality of absorbed power in real time and with extreme precision.In addition, the innovative Ekip Touch and Hi Touch trip units in the G version include all the functions of generator protection switchgear, offering a safe control solution that is ready to use.No external devices, wiring and inspections are required.
Integration is easy. Even from afarSACE Emax 2 series circuit-breakers have been designed to be integrated directly into all types of switchgear and automation and energy management systems to improve productivity and energy consumption. Complete integration into smart grids, in buildings and industrial plants is possible. All circuit-breakers can be equipped with communication units for use with Modbus, Profibus and Devicenet protocols and with the modern Modbus TCP, Profinet and Ethernet IP protocols, which can be installed directly on the terminal box at any time. The integrated IEC61850 communication module enables connection to automation systems and intelligent networks (Smart Grids). Accurate measurements of current, voltage, power and energy are all available by means of the communication modules and allow the trip units to be used as multimeters.
All circuit-breaker functions are also accessible via the Internet, in complete safety, through the Ekip Link switchgear supervision system and the Ekip Control Panel operator panel. The power and auxiliary connections are optimized to simplify connection to the switchgear.The power terminals, which can be oriented horizontally or vertically, have been designed for the most common busbars, while the push-in connections of the auxiliaries ensure immediate and safe wiring.
CASE STUDY: New FerryboatEmax 2 for the highest efficiency in panelbuildingThe customerI.M.E.S.A. (based in Jesi, near Ancona - Italy) is a company that has been operating since 1972 in the field of electromechanical constructions.IMESA is one of the leaders in Europe in the production of Low Voltage and Medium Voltage switchboards, SF6- insulated switch-disconnectors for internal and external installations for MV, supervision and control systems as well as turnkey electrical systems.
The challengeIn the context of a diesel-electric state-of-the-art ferryboat, I.M.E.S.A. faced the challenge of creating a switchgear column – feeding main distribution and motors- able to:• Be fully selective with downstream circuit-breakers (Tmax T4)• Grant a service short-circuit breaking capacity of 50 kA @
600V AC• Have a horizontal bussing distribution system• Realize the most compact solution compatible with the use of
withdrawable circuit-breakers.
These requirements originate by the need for extremely compact switchgear, a typical requirement that can arise from a marine environment.
The ABB solutionThese requirements are really challenging. The first and second requirements clearly call for a category B circuit-breaker, while the third and the fourth are apter for a moulded-case circuit-breaker
ABB SACE company profile ABB (www.abb.com) is a leader in power and automation technologies that enable utility and industry customers to improve performance while lowering environmental impact. The ABB Group of companies operates in around 100 countries and employs about 150,000 people.Technology leadership, global presence, application knowledge and local expertise are key factors in order to offer products, systems and services that enable, ABB’s customers, to improve their business in terms of energy efficiency, reliability of networks and industrial productivity.
ABB was born in 1988 from the merge of two leading European industrial Companies: the Swedish ASEA, founded in 1883, and the Swiss Brown Boveri, founded in 1891, which acquired the oldest electromechanical Italian company in 1903, Tecnomasio Italiano, founded in 1863. In Italy ABB gathered the legacy and the experience of most of the electromechanical Italian sector and of important companies who have contributed to the industrial history of the Country such as Ercole Marelli, SACE, Officine Adda and Ansaldo Trasformatori.
ABB is organized in five divisions called Power Products, Power Systems, Discrete Automation and Motion, Low Voltage Products and Process Automation and in eight regions: North America, South America, Northern Europe, Central Europe, Mediterranean, India, Middle East & Africa (IMA), North Asia, South Asia. In every region there is a regional hub.
ABB in ItalyABB Italy (www.abb.it) has worldwide technological leadership for low voltage moulded case and air circuit breakers, low voltage residual current devices, pressure sensors and transmitters, medium voltage air insulated switchgears and medium voltage
breakers. Moreover ABB Italy has worldwide responsibility of R&D for automation systems products in power generation systems, of development, production and sales of MV asyncronous motors (explosive atmosphere, slip ring and large induction motors) and of the Global Technical Service Center for motors and generators. It is a center of excellence for turn-key plants in the oil and gas field and for advanced automation solutions. ABB Italy invests 2,3% of revenues in R&D.
The principles of the business of ABB ItalyTo build value, leadership and performance in ABB, responsibility, respect and determination are crucial. Take responsibility and act with respect and determination is the way to ensure the development of ABB’s traditional points of strength: technology leadership, pioneering spirit and ability to be at home in any market.
The key to success lies in the ability of ABB’s people to understand and apply the business principles, collected in a Code of Conduct, which demonstrates the commitment to act in an ethical manner with integrity and respect in every situation, while respecting the rights of persons as individuals
Sustainable developmentOur commitment to sustainable development comes from a clear strategic planning that enables us to deliver today, answers to customers seeking products and services with high energy
Tolerance analysis on Emax 2 low voltage air circuit-breakers series
Case Histories19 - Newsletter EnginSoft Year 12 n°2 Case Histories Newsletter EnginSoft Year 12 n°2 - 18
Model development and targetsAim of the analysis performed by EnginSoft was the validation of the Emax 2 project. Validation means checking that product requirements are within their area of acceptability. Such a need is due to the fact that the propagation of the tolerances in assembled products doesn’t guarantee compliance with these requirements even when all parts composing the assembly were produced respecting the tolerances assigned to them by the designer.
Among others, three requirements of particular relevance have been identified for this product:• Requirement on the capability of the
single parts to be assembled together (assemblability),
• Requirement on the product quality• Requirement on security.
The procedure requires translating the above requirements in geometric entities in the CAD model, defining a range or threshold of acceptability for them and the assessment of their variability defined by the design (i.e. tolerances associated with nominal values).
The variability of functional measures is quantified after the analysis. The statistical analysis provides quantitative information on which take the most appropriate corrective actions and with minor impact on costs to improve the robustness of design.The entire procedure of construction of the model, its resolution, results visualization, their interpretation and appropriate corrective actions are handled by Cetol 6s, a dedicated software developed by the Sigmetrix. Cetol 6s automates the whole procedure following a standardized logical path remaining within the design environment, since it is fully embedded in the most popular CAD softwares.Several practical advantages can be achieved: reduction of redesign cycles, prediction and reduction of the number of rejects, reduced reworks, fewer prototypes/samplings, dimensional control focused on the measures with major influence on product requirements, reduced “time to market”.
Obtained results and smart corrective actionsAssemblability requirementThe aim of the analysis is the prevision of potential issues during the installation of the movable part with respect to the fixed one. The assessment of this requirement is based on the overall dimensions of the two mating parts and their difference.
The result obtained using the design specifications highlights a low probability (Fig. 2, approximately 3 products every 100) to get a negative gap between the supports and the guides of the movable part: this results in possible interferences and thus non-compliances during assembly phases.
The sensitivity analysis is a powerful tool that allows the identification of the dimensions and tolerances that, within the dimensional chain, have the greatest influence on the mean value and the width (standard deviation) of the resulting statistical distribution. The variables with the highest influence on the functional measure were found to be the tolerances associated with the thickness of the guide plates. They directly affect the width of the statistical distribution representing the gap in the mating.The reduction of only two tolerances among the thousand in the model has allowed the vanishing of the non-compliances.
Product quality requirementThe aim of the analysis is the quantitative assessment of the gap between the plastic boxes held together and the frame of the movable part. During the life of a circuit breaker stressful condition can be encountered, i.e. high short circuit current passing through the breaker, when this happen the position of the phases relative to each other and to the main structure is crucial to the performance. We must ensure a perfect fit in order to maximize results and reduce risks.
The result obtained using the design specifications highlights a high width for the output statistical distribution with respect to the ideal condition of operation, i.e. a mean value of zero for the gap and a null width of the distribution around the mean value.
Now, the targets to achieve are: shift the mean value of the distribution towards lower values and reduce its width. As previously happened, tolerance analysis has allowed the identification of the
(able to be mounted in horizontal position, compact in dimension).No product other than ABB Emax E1.2 in the world of the Low Voltage Breakers could entirely fulfil the above requirements. ABB Emax 1.2, the most compact size of the Emax 2 range of ACBs, is an innovative product, able to break up to 66 kA @ 440V AC (or 50 kA @ 690V AC) and to withstand 50 kA for one second.
Thanks to these unique features, IMESA was able to realize a high-efficiency switchboard, with five Emax E1.2 fitted in one column.The E1.2 chosen for this project are equipped with the new Ekip Touch trip units (LSI version).
General description of theworking methodologyEmax 2 is a complex product made up by hundreds of single parts assembled together that has several measurement requirements to satisfy. These requirements deal with assemblability, product quality and security and all of them refer to geometric quantities (i.e. the distance between two parallel planes and their relative orientation).
The measurement requirements depend on how the single parts are located and oriented with respect to the others: these information are provided by the contact conditions between adjacent parts and the geometric relations between features belonging to each single part. The complex three dimensional vectorial chain is based on the translation of the previous information into the numerical model. The definition of the output measures (requirements) close the tolerance chain.If all parts were perfect (nominal shape) the
chain would be univocally determined and could be solved by using any CAD tool. In reality both contact conditions and geometric features aren’t the ideal ones, because real geometric entities exhibit a certain dispersion with respect to the nominal value due to the imperfections inherent in manufacturing processes. As a consequence, the assembly outputs are no longer univocally determinable and outputs become dispersed as well.Designers control and limit the variability of the measure requirements (trying to keep them between the acceptance limits) by assigning proper dimensional and geometrical tolerances to the components: these tolerances should reflect the way parts are produced (manufacturing process), assembled (assembly sequence) and the way dimensions are measured (quality controls).The investigation of how tolerances affect the dispersion of the functioning measurements is carried out through a statistical approach.
Figure 5 – Quantitative impact of variables on the result and its final statistical distribution
Figure 4 – Initial statistical distribution of the gap between frame and boxes
Figure 2 – Initial statistical distribution of the gap between joined guide-plates
Figure 3 – Quantitative impact of variables on the result and its final statistical distribution
Figure 1 – Different versions of the Emax 2 product family
Case Histories21 - Newsletter EnginSoft Year 12 n°2 Case Histories Newsletter EnginSoft Year 12 n°2 - 20
variables with the greatest influence on the final requirement: results from sensitivity analysis have provided all the necessary information to act in a targeted manner. The tolerances belonging to the width of each box have the major influence on the dispersion of the gap value around the nominal, as a consequence it is on these that it was decided to take action.The study has increased the robustness of the design through the reduction of only two tolerances (among thousands in the model) along with the change of a nominal value.
Security requirementThe aim of the analysis is the detection of possible risks of locking of the shutters during the extraction of the movable part. The closure of the shutters must always be ensured to avoid contact between the maintenance engineers and the parts under voltage of the switch.
The results obtained using the design specifications shows a potential number of non-compliance of approximately 5%. For these components the external wall of the shutters is in contact with the sliding guides causing friction and the subsequent locking.
The sensitivity analysis has identified the tolerances associated with the placement of two holes as the variables of greatest influence on the dispersion of the gap around the mean value.The previous information could be used to undertake the appropriate corrective actions when products and parts are only on the drawings, avoiding their discovery during the prototyping phase and the costs associated with the production, quality controls and reworks. The reduction of only two tolerances among the thousands in the model allowed the avoidance of the non-compliances for the requirement under investigation.
ConclusionsThe activity performed in collaboration with EnginSoft has allowed ABB to meet all the design requirements for the product under investigation. Through the analysis of the propagation of the tolerances within the dimensional chain it has been possible to identify the dimensions and tolerances with the major impact on the functional measurements and therefore to act in a targeted way for the resolution of potential non-compliances, avoiding the generalization of their treatment. The resulting benefits are multiple, meeting objectives: reduction of the redesign cycles, savings on scraps and reworks, reduced number of prototypes, reduced “time to market”.
Giulio Tribulato - ABB SACE Enrico Boesso - EnginSoft
Figure 7 – Quantitative impact of variables on the result and its final statistical distribution
Fiure 6 – Initial statistical distribution of the distance between the shutters and the external wall
CETOL 6s and Tolerance Analysis
EnginSoft is European distributor of leading Precise Constraint Technology software CETOL 6s, developed by Sigmetrix LLC.CETOL 6s is a tolerance analysis and optimzation software tool providing the invaluable insight needed to address the above issues and to confidently release designs for manufacture. You will be able to assess the manufacturability of your designs long before they reach production.CETOL 6s enables designers and engineers to address multi-dimensional problems, by using a mathematical description of your CAD geometry. This unique method allows you to receive immediate analytical feedback, utilising the easy-to-use modelling, analysis and reporting components. The user is guided through the tolerance analysis and optimization process whilst being informed about missing or erroneous data.Unlike simple 1D stack-up analysis or Monte Carlo Simulation, CETOL 6s pursues a statistical approach employing advanced precise constraint technology, displayed in an intuitive graphical user interface. This approach accelerates the ability to identify part sensitivities and components that have the most significant contribute to the total variation. Discovering critical-to-quality assembly characteristics has never been easier.For more information:http://www.tolerance-analysis.co.uk/products/cetol-60
CONTEXTThe goal of this study is to determine the parametric relationships in the morphology of membrane formation during solvent evaporation. This study will not assess the underlying physical properties, but focus on the steps required to choose the best surrogate model to represent a set of simulation data. To perform this task, modeFRONTIER 2014 is used. The reader will be able to calculate new output values from the surrogate model by using an Excel sheet . In addition, insight will be gained into how the solvent evaporation is affected by the morphology of the membrane formation.
Surrogate ModelSurrogate models or RSMs (Response Surface Model) are statistical and numerical models that approximate the input/output behavior of the system under investigation. It is important to distinguish between interpolating RSMs (which pass exactly through the training points and identify an interpolation coefficient from the system of equations made by this condition) and approximating RSMs which do not pass exactly through the training points (which minimize the extrapolation error on each training point). modeFRONTIER provides several surrogate models (see below) :
Screening Analysis: SS-ANOVAEven though this step is optional, it is very useful for gaining a better understanding of the model. The purpose of the screening is to detect the most important input variables, which is achieved by means of the Smoothing Spline ANOVA (SS-ANOVA) algorithm.
Model ValidationCross-validation is an extremely popular methodology for verifying the prediction capabilities of a model generated from a set of samples. In cross-validation the data set is divided into L subsets, and each of these subsets is sequentially used as a testing set for a surrogate constructed on the other L–1 subsets. The prediction error can be estimated with all the L error measures obtained in this process (for example, as an average value).
METHODOLOGYImport Designs The Data Wizard of modeFRONTIER is used as the tool for importing data saved in Excel worksheets. After the input and output variables are selected, the following workflow is generated as in Figure 2 and is necessary to train the surrogate models.
The database can then be displayed directly within modeFRONTIER as in Figure 3.
Implementation of surrogate models to predict the morphology of membrane formation during solvent evaporation
Figure 1 - List of RSM algorithms available in modeFRONTIER 2014
Case Histories23 - Newsletter EnginSoft Year 12 n°2 Case Histories Newsletter EnginSoft Year 12 n°2 - 22
Partition TablesThe input table is split into two or more partitions (i.e. row-wise). A set of designs for Training and Testing were specified to train the surrogate model and test its validity respectively. 80% designs of the input table were chosen randomly (i.e. 400 designs) as the Training set. The other 20% designs (i.e. 100 designs) have been used to create a Testing set. A K-Fold method is favored with K=5 so that the 10 tables were created (5 Training and 5 Validation set).
RESULTSScreening AnalysisThe screening analysis was performed for each output data using the SS-ANOVA tool as described previously. In order to filter the most important variables, the cumulative effect was set to 90% for both the first and second order effects. The analysis is done with the input table and the results are displayed in Table 1 below.
In Figure 4 the ranking of the input variables for the Feret Ratio only is displayed.
Surrogate ModelsThe training set is generated from the input table imported. Five training tables are created randomly to train the different surrogate models. For each training table, the following surrogate models are trained:1. Smoothing Spline ANOVA2. Stepwise Regression
3. K-Nearest4. Shepard5. Kriging 6. Anisotropic Kriging 7. Radial Basis Functions8. Neural Networks9. Gaussian Processes
Most of these surrogate models are trained with their parameters set to Default. Only the Smoothing Spline ANOVA and the Stepwise Regression were parameterized as follow: 1. Smoothing Spline ANOVA : Internal Optimization activated for the
main and interaction effects modes2. Stepwise Regression : The degree can vary from 1 to 5.As there are multiples outputs, it has been decided to use Default parameters in order to quickly assess which surrogate models are the most efficient. As a consequence, for each output (8) and for each training table (5), 19 surrogate models were trained that is to say a total of 760 surrogate models.
Validation The validation is done via the 5-FOLD approach.After training the whole set of surrogate models, the validation is done with the Testing data. The information is accessible directly from modeFRONTIER via the Validation Table tool. This tool is useful to visualize different kind of errors and to rank the surrogate models with respect to a chosen criterion for the error. In this study, the R-squared was selected as the criterion and the average R-squared of the 5 validation tables is used to select the best surrogate model, i.e. the one for which the R-squared is close to 1.
Export Surrogate Models This section deals with exporting the surrogate model to an Excel spreadsheet and explains how to use it properly.
modeFRONTIER can easily export a surrogate model into different languages : 1. C / Matlab MEX Files2. FORTRAN Files3. JAVA Files4. modeFRONTIER Binary RSM5. Excel Workbook6. Excel Workbook with macro
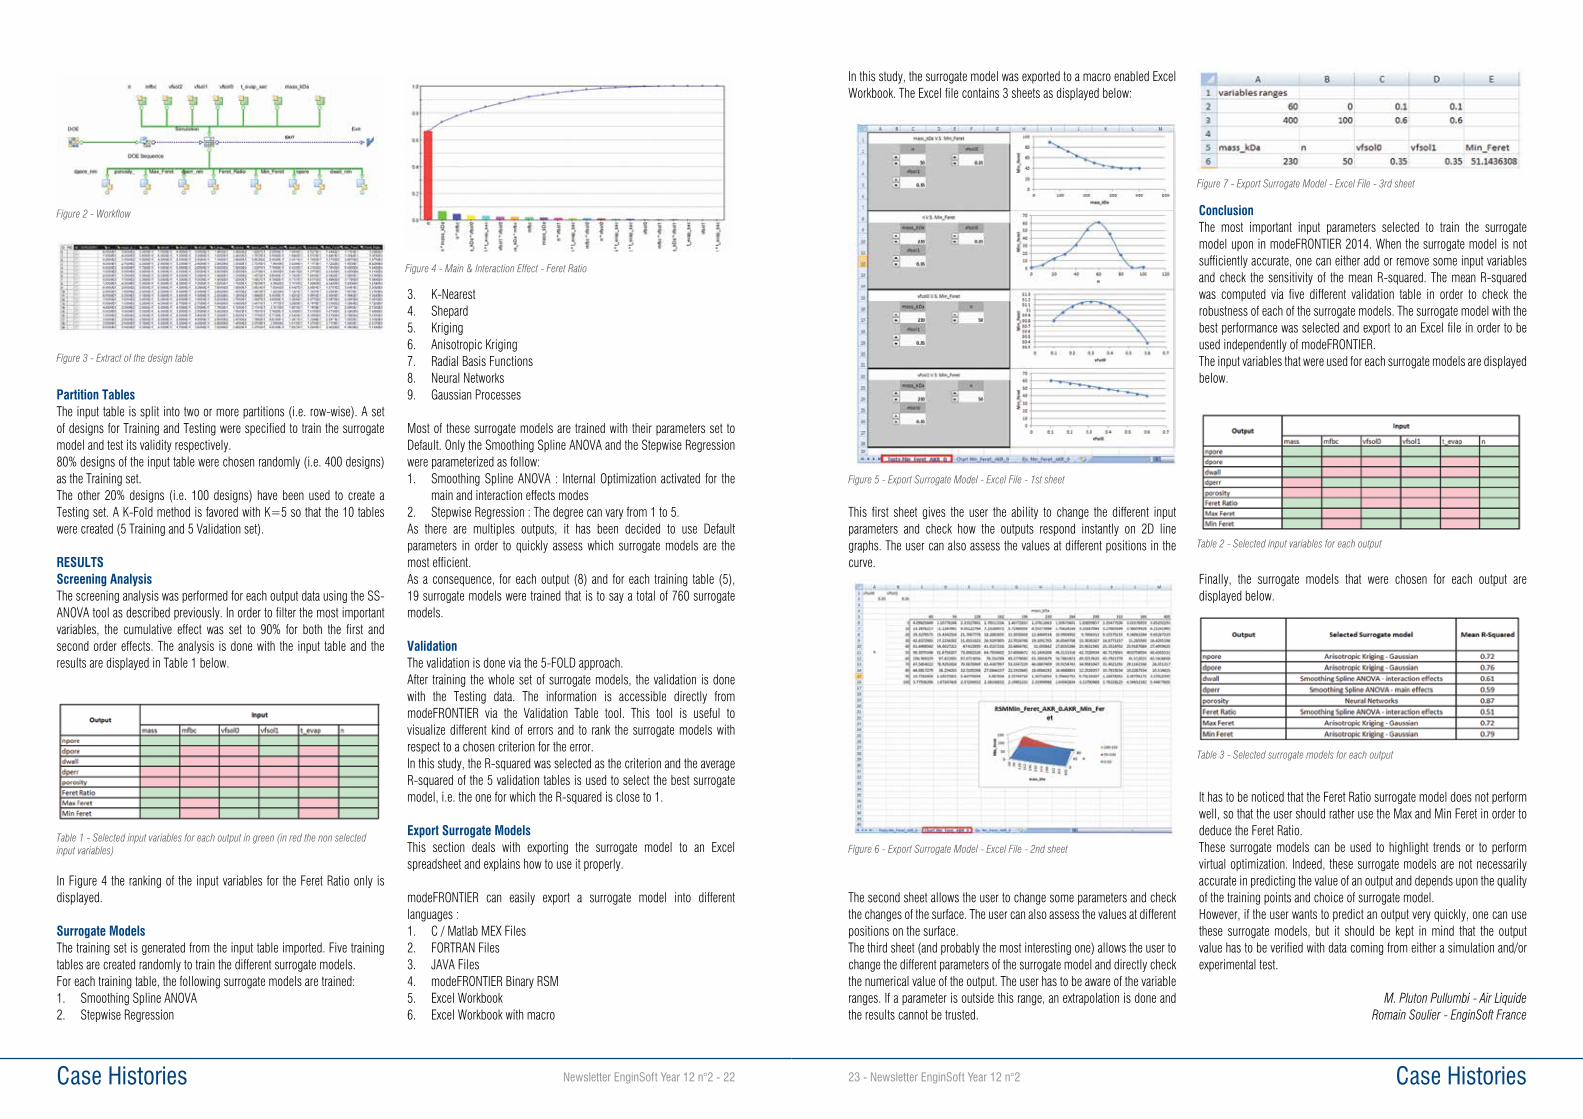
Figure 2 - Workflow
Figure 3 - Extract of the design table
Table 1 - Selected input variables for each output in green (in red the non selected input variables)
Figure 4 - Main & Interaction Effect - Feret Ratio
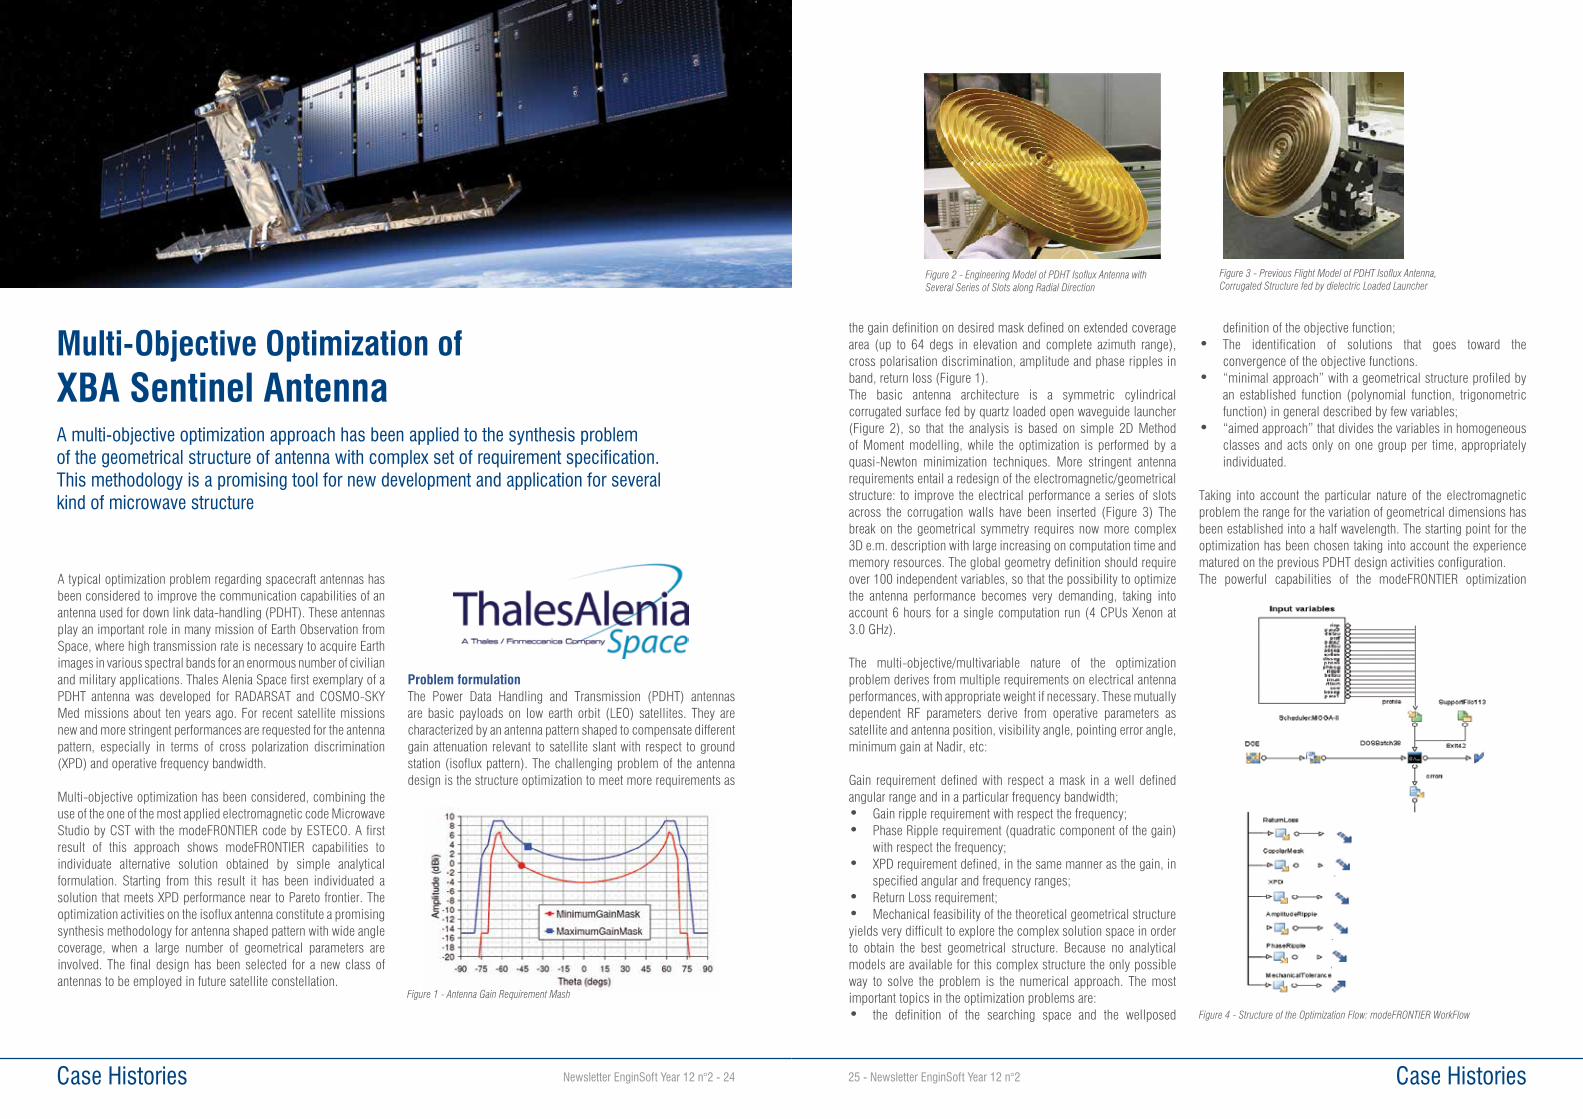
In this study, the surrogate model was exported to a macro enabled Excel Workbook. The Excel file contains 3 sheets as displayed below:
This first sheet gives the user the ability to change the different input parameters and check how the outputs respond instantly on 2D line graphs. The user can also assess the values at different positions in the curve.
The second sheet allows the user to change some parameters and check the changes of the surface. The user can also assess the values at different positions on the surface.The third sheet (and probably the most interesting one) allows the user to change the different parameters of the surrogate model and directly check the numerical value of the output. The user has to be aware of the variable ranges. If a parameter is outside this range, an extrapolation is done and the results cannot be trusted.
ConclusionThe most important input parameters selected to train the surrogate model upon in modeFRONTIER 2014. When the surrogate model is not sufficiently accurate, one can either add or remove some input variables and check the sensitivity of the mean R-squared. The mean R-squared was computed via five different validation table in order to check the robustness of each of the surrogate models. The surrogate model with the best performance was selected and export to an Excel file in order to be used independently of modeFRONTIER. The input variables that were used for each surrogate models are displayed below.
Finally, the surrogate models that were chosen for each output are displayed below.
It has to be noticed that the Feret Ratio surrogate model does not perform well, so that the user should rather use the Max and Min Feret in order to deduce the Feret Ratio. These surrogate models can be used to highlight trends or to perform virtual optimization. Indeed, these surrogate models are not necessarily accurate in predicting the value of an output and depends upon the quality of the training points and choice of surrogate model. However, if the user wants to predict an output very quickly, one can use these surrogate models, but it should be kept in mind that the output value has to be verified with data coming from either a simulation and/or experimental test.
M. Pluton Pullumbi - Air Liquide Romain Soulier - EnginSoft France
Figure 5 - Export Surrogate Model - Excel File - 1st sheet
Figure 6 - Export Surrogate Model - Excel File - 2nd sheet
Figure 7 - Export Surrogate Model - Excel File - 3rd sheet
Table 2 - Selected input variables for each output
Table 3 - Selected surrogate models for each output
Case Histories25 - Newsletter EnginSoft Year 12 n°2 Case Histories Newsletter EnginSoft Year 12 n°2 - 24
Multi-Objective Optimization of XBA Sentinel Antenna
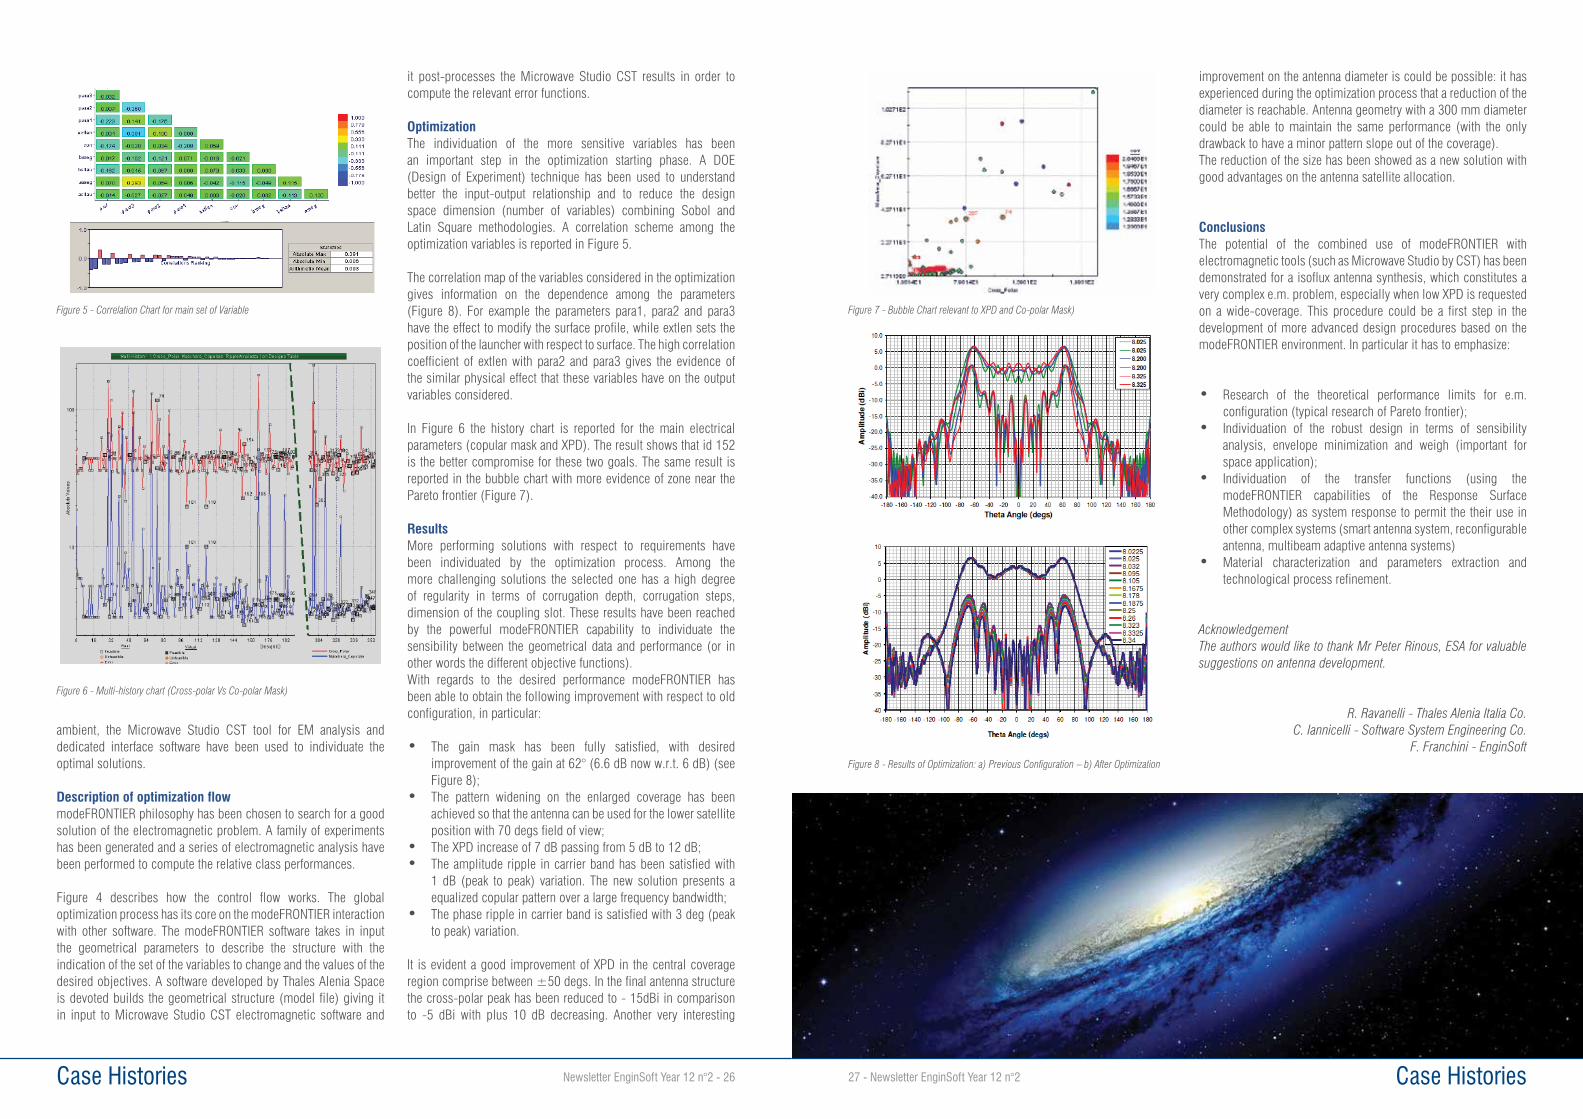
A typical optimization problem regarding spacecraft antennas has been considered to improve the communication capabilities of an antenna used for down link data-handling (PDHT). These antennas play an important role in many mission of Earth Observation from Space, where high transmission rate is necessary to acquire Earth images in various spectral bands for an enormous number of civilian and military applications. Thales Alenia Space first exemplary of a PDHT antenna was developed for RADARSAT and COSMO-SKY Med missions about ten years ago. For recent satellite missions new and more stringent performances are requested for the antenna pattern, especially in terms of cross polarization discrimination (XPD) and operative frequency bandwidth.
Multi-objective optimization has been considered, combining the use of the one of the most applied electromagnetic code Microwave Studio by CST with the modeFRONTIER code by ESTECO. A first result of this approach shows modeFRONTIER capabilities to individuate alternative solution obtained by simple analytical formulation. Starting from this result it has been individuated a solution that meets XPD performance near to Pareto frontier. The optimization activities on the isoflux antenna constitute a promising synthesis methodology for antenna shaped pattern with wide angle coverage, when a large number of geometrical parameters are involved. The final design has been selected for a new class of antennas to be employed in future satellite constellation.
Problem formulationThe Power Data Handling and Transmission (PDHT) antennas are basic payloads on low earth orbit (LEO) satellites. They are characterized by an antenna pattern shaped to compensate different gain attenuation relevant to satellite slant with respect to ground station (isoflux pattern). The challenging problem of the antenna design is the structure optimization to meet more requirements as
Figure 1 - Antenna Gain Requirement Mash
A multi-objective optimization approach has been applied to the synthesis problem of the geometrical structure of antenna with complex set of requirement specification. This methodology is a promising tool for new development and application for several kind of microwave structure
the gain definition on desired mask defined on extended coverage area (up to 64 degs in elevation and complete azimuth range), cross polarisation discrimination, amplitude and phase ripples in band, return loss (Figure 1).The basic antenna architecture is a symmetric cylindrical corrugated surface fed by quartz loaded open waveguide launcher (Figure 2), so that the analysis is based on simple 2D Method of Moment modelling, while the optimization is performed by a quasi-Newton minimization techniques. More stringent antenna requirements entail a redesign of the electromagnetic/geometrical structure: to improve the electrical performance a series of slots across the corrugation walls have been inserted (Figure 3) The break on the geometrical symmetry requires now more complex 3D e.m. description with large increasing on computation time and memory resources. The global geometry definition should require over 100 independent variables, so that the possibility to optimize the antenna performance becomes very demanding, taking into account 6 hours for a single computation run (4 CPUs Xenon at 3.0 GHz).
The multi-objective/multivariable nature of the optimization problem derives from multiple requirements on electrical antenna performances, with appropriate weight if necessary. These mutually dependent RF parameters derive from operative parameters as satellite and antenna position, visibility angle, pointing error angle, minimum gain at Nadir, etc:
Gain requirement defined with respect a mask in a well defined angular range and in a particular frequency bandwidth;• Gain ripple requirement with respect the frequency;• Phase Ripple requirement (quadratic component of the gain)
with respect the frequency;• XPD requirement defined, in the same manner as the gain, in
specified angular and frequency ranges;• Return Loss requirement;• Mechanical feasibility of the theoretical geometrical structureyields very difficult to explore the complex solution space in order to obtain the best geometrical structure. Because no analytical models are available for this complex structure the only possible way to solve the problem is the numerical approach. The most important topics in the optimization problems are:• the definition of the searching space and the wellposed
definition of the objective function;• The identification of solutions that goes toward the
convergence of the objective functions.• “minimal approach” with a geometrical structure profiled by
an established function (polynomial function, trigonometric function) in general described by few variables;
• “aimed approach” that divides the variables in homogeneous classes and acts only on one group per time, appropriately individuated.
Taking into account the particular nature of the electromagnetic problem the range for the variation of geometrical dimensions has been established into a half wavelength. The starting point for the optimization has been chosen taking into account the experience matured on the previous PDHT design activities configuration.The powerful capabilities of the modeFRONTIER optimization
Figure 2 - Engineering Model of PDHT Isoflux Antenna withSeveral Series of Slots along Radial Direction
Figure 3 - Previous Flight Model of PDHT Isoflux Antenna,Corrugated Structure fed by dielectric Loaded Launcher
Figure 4 - Structure of the Optimization Flow: modeFRONTIER WorkFlow
Case Histories27 - Newsletter EnginSoft Year 12 n°2 Case Histories Newsletter EnginSoft Year 12 n°2 - 26
ambient, the Microwave Studio CST tool for EM analysis and dedicated interface software have been used to individuate the optimal solutions.
Description of optimization flowmodeFRONTIER philosophy has been chosen to search for a good solution of the electromagnetic problem. A family of experiments has been generated and a series of electromagnetic analysis have been performed to compute the relative class performances.
Figure 4 describes how the control flow works. The global optimization process has its core on the modeFRONTIER interaction with other software. The modeFRONTIER software takes in input the geometrical parameters to describe the structure with the indication of the set of the variables to change and the values of the desired objectives. A software developed by Thales Alenia Space is devoted builds the geometrical structure (model file) giving it in input to Microwave Studio CST electromagnetic software and
it post-processes the Microwave Studio CST results in order to compute the relevant error functions.
OptimizationThe individuation of the more sensitive variables has been an important step in the optimization starting phase. A DOE (Design of Experiment) technique has been used to understand better the input-output relationship and to reduce the design space dimension (number of variables) combining Sobol and Latin Square methodologies. A correlation scheme among the optimization variables is reported in Figure 5.
The correlation map of the variables considered in the optimization gives information on the dependence among the parameters (Figure 8). For example the parameters para1, para2 and para3 have the effect to modify the surface profile, while extlen sets the position of the launcher with respect to surface. The high correlation coefficient of extlen with para2 and para3 gives the evidence of the similar physical effect that these variables have on the output variables considered.
In Figure 6 the history chart is reported for the main electrical parameters (copular mask and XPD). The result shows that id 152 is the better compromise for these two goals. The same result is reported in the bubble chart with more evidence of zone near the Pareto frontier (Figure 7).
ResultsMore performing solutions with respect to requirements have been individuated by the optimization process. Among the more challenging solutions the selected one has a high degree of regularity in terms of corrugation depth, corrugation steps, dimension of the coupling slot. These results have been reached by the powerful modeFRONTIER capability to individuate the sensibility between the geometrical data and performance (or in other words the different objective functions).With regards to the desired performance modeFRONTIER has been able to obtain the following improvement with respect to old configuration, in particular:
• The gain mask has been fully satisfied, with desired improvement of the gain at 62° (6.6 dB now w.r.t. 6 dB) (see Figure 8);
• The pattern widening on the enlarged coverage has been achieved so that the antenna can be used for the lower satellite position with 70 degs field of view;
• The XPD increase of 7 dB passing from 5 dB to 12 dB;• The amplitude ripple in carrier band has been satisfied with
1 dB (peak to peak) variation. The new solution presents a equalized copular pattern over a large frequency bandwidth;
• The phase ripple in carrier band is satisfied with 3 deg (peak to peak) variation.
It is evident a good improvement of XPD in the central coverage region comprise between ±50 degs. In the final antenna structure the cross-polar peak has been reduced to - 15dBi in comparison to -5 dBi with plus 10 dB decreasing. Another very interesting
Figure 5 - Correlation Chart for main set of Variable
Figure 6 - Multi-history chart (Cross-polar Vs Co-polar Mask)
Figure 7 - Bubble Chart relevant to XPD and Co-polar Mask)
Figure 8 - Results of Optimization: a) Previous Configuration – b) After Optimization
improvement on the antenna diameter is could be possible: it has experienced during the optimization process that a reduction of the diameter is reachable. Antenna geometry with a 300 mm diameter could be able to maintain the same performance (with the only drawback to have a minor pattern slope out of the coverage).The reduction of the size has been showed as a new solution with good advantages on the antenna satellite allocation.
ConclusionsThe potential of the combined use of modeFRONTIER with electromagnetic tools (such as Microwave Studio by CST) has been demonstrated for a isoflux antenna synthesis, which constitutes a very complex e.m. problem, especially when low XPD is requested on a wide-coverage. This procedure could be a first step in the development of more advanced design procedures based on the modeFRONTIER environment. In particular it has to emphasize:
• Research of the theoretical performance limits for e.m. configuration (typical research of Pareto frontier);
• Individuation of the robust design in terms of sensibility analysis, envelope minimization and weigh (important for space application);
• Individuation of the transfer functions (using the modeFRONTIER capabilities of the Response Surface Methodology) as system response to permit the their use in other complex systems (smart antenna system, reconfigurable antenna, multibeam adaptive antenna systems)
• Material characterization and parameters extraction and technological process refinement.
AcknowledgementThe authors would like to thank Mr Peter Rinous, ESA for valuable suggestions on antenna development.
R. Ravanelli - Thales Alenia Italia Co. C. Iannicelli - Software System Engineering Co.
F. Franchini - EnginSoft
Case Histories29 - Newsletter EnginSoft Year 12 n°2 Case Histories Newsletter EnginSoft Year 12 n°2 - 28
ITER (acronym of International Thermonuclear Experimental Reactor) is an international nuclear fusion research and engineering project, which is building the world’s largest experimental Tokamak nuclear fusion reactor in the south of France. The ITER project aims to make the long-awaited transition from experimental studies of plasma physics to full-scale electricity-producing fusion power plants. In Figure 1 a cross section of ITER is depicted. The Tokamak concept is based on the magnetic confinement, in which the plasma is contained in a doughnut-shaped vacuum vessel. The fuel, a mixture of deuterium and tritium, two isotopes of hydrogen, is heated to temperatures in excess of 150 million °C, forming a hot plasma. Inside the plasma the nuclear reaction takes place: due to the high kinetic energy the deuterium and tritium nuclei collide, fuse into heavier helium atoms and release tremendous amounts of energy in the process. In the Figure 2 a simplified reaction scheme is depicted.
Aim of the analysisIn the present document a magnetostatic analysis on new test blanket modules is illustrated. Europe is currently developing two Test Blanket Modules (TBMs): the Helium-Cooled Lithium-Lead (HCLL) concept which uses the Lithium-Lead as both breeder and neutron multiplier, and the Helium-Cooled Pebble-Bed (HCPB) concept which features lithium ceramic pebbles as breeder and beryllium pebbles as neutron multiplier. Both concepts use Reduced Activation Ferritic Martensitic (RAFM) steel as structural material, the EUROFER. The TBMs of both HCLL and HCPB concepts will be inserted in an equatorial Port of ITER and connected to the auxiliary systems through a system of pipes, components, and supporting structures located inside the Port Cell. In Figure 3 the test blanket modules are depicted.In brief the need to feed, during the reaction, the plasma with Tritium led ITER designs to test new blanket modules inside the vacuum vessel made by ferromagnetic materials. Materials that can be magnetized, which are also the ones that are strongly attracted to a magnet, are called ferromagnetic (or ferrimagnetic).
The presence of ferromagnetic material leads to the developing of magnetic forces on the blanket modules surfaces that are exposed to the vacuum vessel due to the difference in magnetic permeability between the ferromagnetic material of blanket modules and air. Thus, it is crucial to assess these forces by means of a FEM calculation.
The Boundary condition.As described, aim of the simulation is the calculation of Forces and Moments on TBMs during operational condition. The calculation is made
Magnetostatic Analysis on ITERTest Blanket Modules
Figure 1 - Cross section of ITER
by ANSYS Maxwell and ANSYS EMAG to further comparison. In this document the Maxwell simulation is described along with a comparison with EMAG solution.
Geometric assumptions for FEM modelling.The two TBMs were modeled as two solid blocks with dimensions as described in Figure 4. The distance between the two TBMs is 0.25 m. The coordinates of the vertex A and B are ρ=8.5m and z= 0.2m, in a cylindrical coordinate system with origin in the centre of the ITER machine. It is assumed that the TBMs are placed inside each one of the 18 equatorial ports (between two consecutive TF coils) in a symmetric position with respect to the port poloidal midplane.
Material properties. The B-H curve data for the TBMs are supplied by EUROFER. It was assumed that in the HCPB the ratio metal/no metal is 0.8, while in the HCLL it is 0.6, therefore equivalent smeared properties were used. To get the smeared BH curve table data the following function has been used:
This function calculates, for each point of the original BH curve, the correspondent value of the smeared BH curve implementing the ratio between metal/no metal of the considered object.Since at the present state of the design TBMs geometry is not completely defined the use of smeared materials property is acceptable for the TBMs feasibility study.
Loads and boundary conditionsTo simulate the operational conditions all the superconducting coil system is modeled along with the plasma current. The coil system is made of three kinds of coils: Poloidal Field (PF), Toroidal Field (TF) and Center Solenoid (CS). In Figure 5 the superconducting coil system is depicted.
The Maxwell modelMaxwell is a software package for low-frequency electromagnetic field simulation. Maxwell can be used to design 3-D/2-D structures, such as motors, actuators, transformers and other electromagnetic and electromechanical devices. Maxwell uses the Ansoft-pioneered automatic adaptive meshing capability which automatically creates and refines the finite element mesh as the solution converges, streamlining the solution process and making the software easy to use.
The modelThe geometry of the model is completely made inside Maxwell. Geometrical parameters are used to take into account, in case, both different dimensions of TBMs and their position compared to plasma current. Due to geometry and load symmetry 20° of the whole machine is considered. In Figure 6 the Maxwell model is depicted along with the applied boundary conditions.
FEM modelThe functionality of the auto-adaptive mesh algorithm is tested. Two mesh models are built. The first one implements only the auto-adaptive meshing. This way 16 passes are computed and the number of 363996 elements is reached. The second model is carried out by the means of mesh settings in order to refine the mesh on blanket modules. In particular a body sizing of 0.08 m is imposed. This way just 3 passes are computed and 754766 elements are used to complete the FEM model.Simulations show the same result between the two models adopted although, due to a lower number of elements, the first method is faster. This example shows the reliability and correctness of the auto-adaptive mesh algorithm that achieves the best compromise between the accuracy of the solution and the speed-up of the simulation. In Figure 7 a comparison between the values of radial force on HCLL blanket module for the two mesh methods adopted is depicted.
ResultsIn Figure 8 a comparison between the B-field calculated by Maxwell and EMAG (the legacy portion of ANSYS FEM code for low frequency electromagnetic analysis) on the whole models is depicted. In Figure 9 the B-field is shown on the blanket modules.
Figure 2 - The fusion between deuterium and tritium (D-T) Figure 3 – Test blanket modules Figure 4 – Simplified geometry of the two TBMs
Figure 5 – Superconducting coil system and plasma current region.
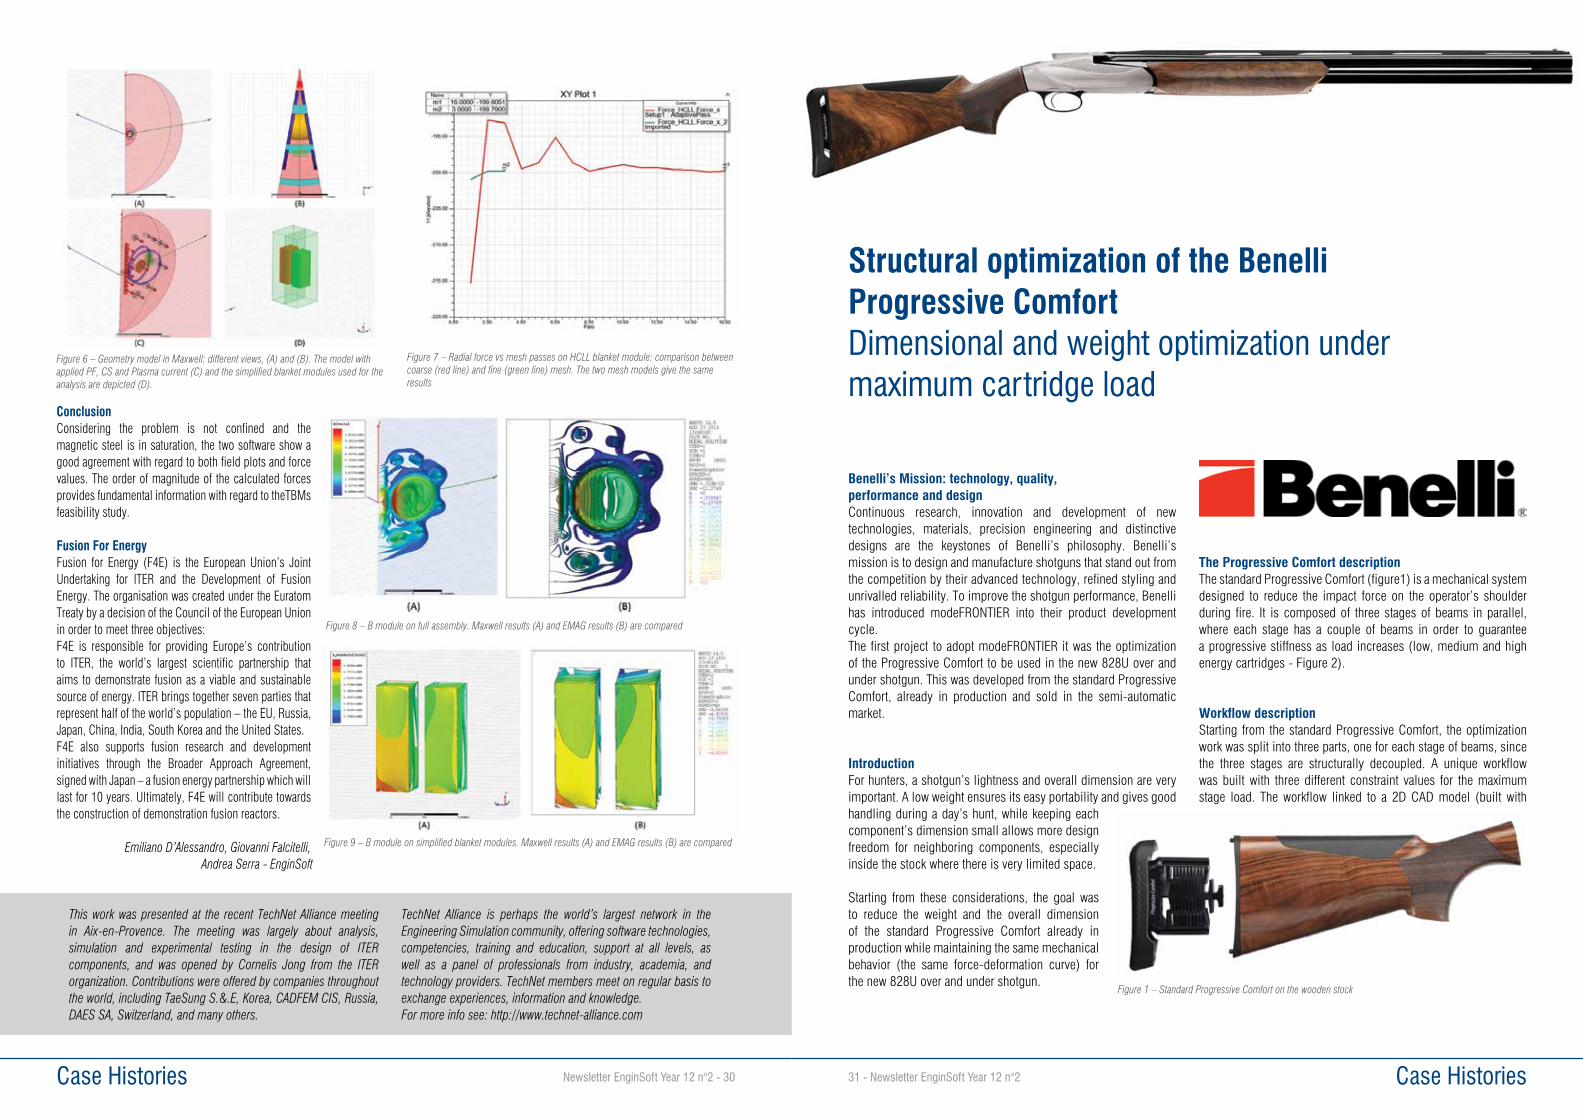
Case Histories31 - Newsletter EnginSoft Year 12 n°2 Case Histories Newsletter EnginSoft Year 12 n°2 - 30
ConclusionConsidering the problem is not confined and the magnetic steel is in saturation, the two software show a good agreement with regard to both field plots and force values. The order of magnitude of the calculated forces provides fundamental information with regard to theTBMs feasibility study.
Fusion For EnergyFusion for Energy (F4E) is the European Union’s Joint Undertaking for ITER and the Development of Fusion Energy. The organisation was created under the Euratom Treaty by a decision of the Council of the European Union in order to meet three objectives:F4E is responsible for providing Europe’s contribution to ITER, the world’s largest scientific partnership that aims to demonstrate fusion as a viable and sustainable source of energy. ITER brings together seven parties that represent half of the world’s population – the EU, Russia, Japan, China, India, South Korea and the United States.F4E also supports fusion research and development initiatives through the Broader Approach Agreement, signed with Japan – a fusion energy partnership which will last for 10 years. Ultimately, F4E will contribute towards the construction of demonstration fusion reactors.
Emiliano D’Alessandro, Giovanni Falcitelli, Andrea Serra - EnginSoft
Figure 6 – Geometry model in Maxwell: different views, (A) and (B). The model with applied PF, CS and Plasma current (C) and the simplified blanket modules used for the analysis are depicted (D).
Figure 7 – Radial force vs mesh passes on HCLL blanket module: comparison between coarse (red line) and fine (green line) mesh. The two mesh models give the same results
Figure 8 – B module on full assembly. Maxwell results (A) and EMAG results (B) are compared
Figure 9 – B module on simplified blanket modules. Maxwell results (A) and EMAG results (B) are compared
Benelli’s Mission: technology, quality, performance and designContinuous research, innovation and development of new technologies, materials, precision engineering and distinctive designs are the keystones of Benelli’s philosophy. Benelli’s mission is to design and manufacture shotguns that stand out from the competition by their advanced technology, refined styling and unrivalled reliability. To improve the shotgun performance, Benelli has introduced modeFRONTIER into their product development cycle.The first project to adopt modeFRONTIER it was the optimization of the Progressive Comfort to be used in the new 828U over and under shotgun. This was developed from the standard Progressive Comfort, already in production and sold in the semi-automatic market.
IntroductionFor hunters, a shotgun’s lightness and overall dimension are very important. A low weight ensures its easy portability and gives good handling during a day’s hunt, while keeping each component’s dimension small allows more design freedom for neighboring components, especially inside the stock where there is very limited space.
Starting from these considerations, the goal was to reduce the weight and the overall dimension of the standard Progressive Comfort already in production while maintaining the same mechanical behavior (the same force-deformation curve) for the new 828U over and under shotgun.
The Progressive Comfort description The standard Progressive Comfort (figure1) is a mechanical system designed to reduce the impact force on the operator’s shoulder during fire. It is composed of three stages of beams in parallel, where each stage has a couple of beams in order to guarantee a progressive stiffness as load increases (low, medium and high energy cartridges - Figure 2).
Workflow descriptionStarting from the standard Progressive Comfort, the optimization work was split into three parts, one for each stage of beams, since the three stages are structurally decoupled. A unique workflow was built with three different constraint values for the maximum stage load. The workflow linked to a 2D CAD model (built with
Structural optimization of the Benelli Progressive Comfort Dimensional and weight optimization under maximum cartridge load
Figure 1 – Standard Progressive Comfort on the wooden stock
This work was presented at the recent TechNet Alliance meeting in Aix-en-Provence. The meeting was largely about analysis, simulation and experimental testing in the design of ITER components, and was opened by Cornelis Jong from the ITER organization. Contributions were offered by companies throughout the world, including TaeSung S.&.E, Korea, CADFEM CIS, Russia, DAES SA, Switzerland, and many others.
TechNet Alliance is perhaps the world’s largest network in the Engineering Simulation community, offering software technologies, competencies, training and education, support at all levels, as well as a panel of professionals from industry, academia, and technology providers. TechNet members meet on regular basis to exchange experiences, information and knowledge. For more info see: http://www.technet-alliance.com
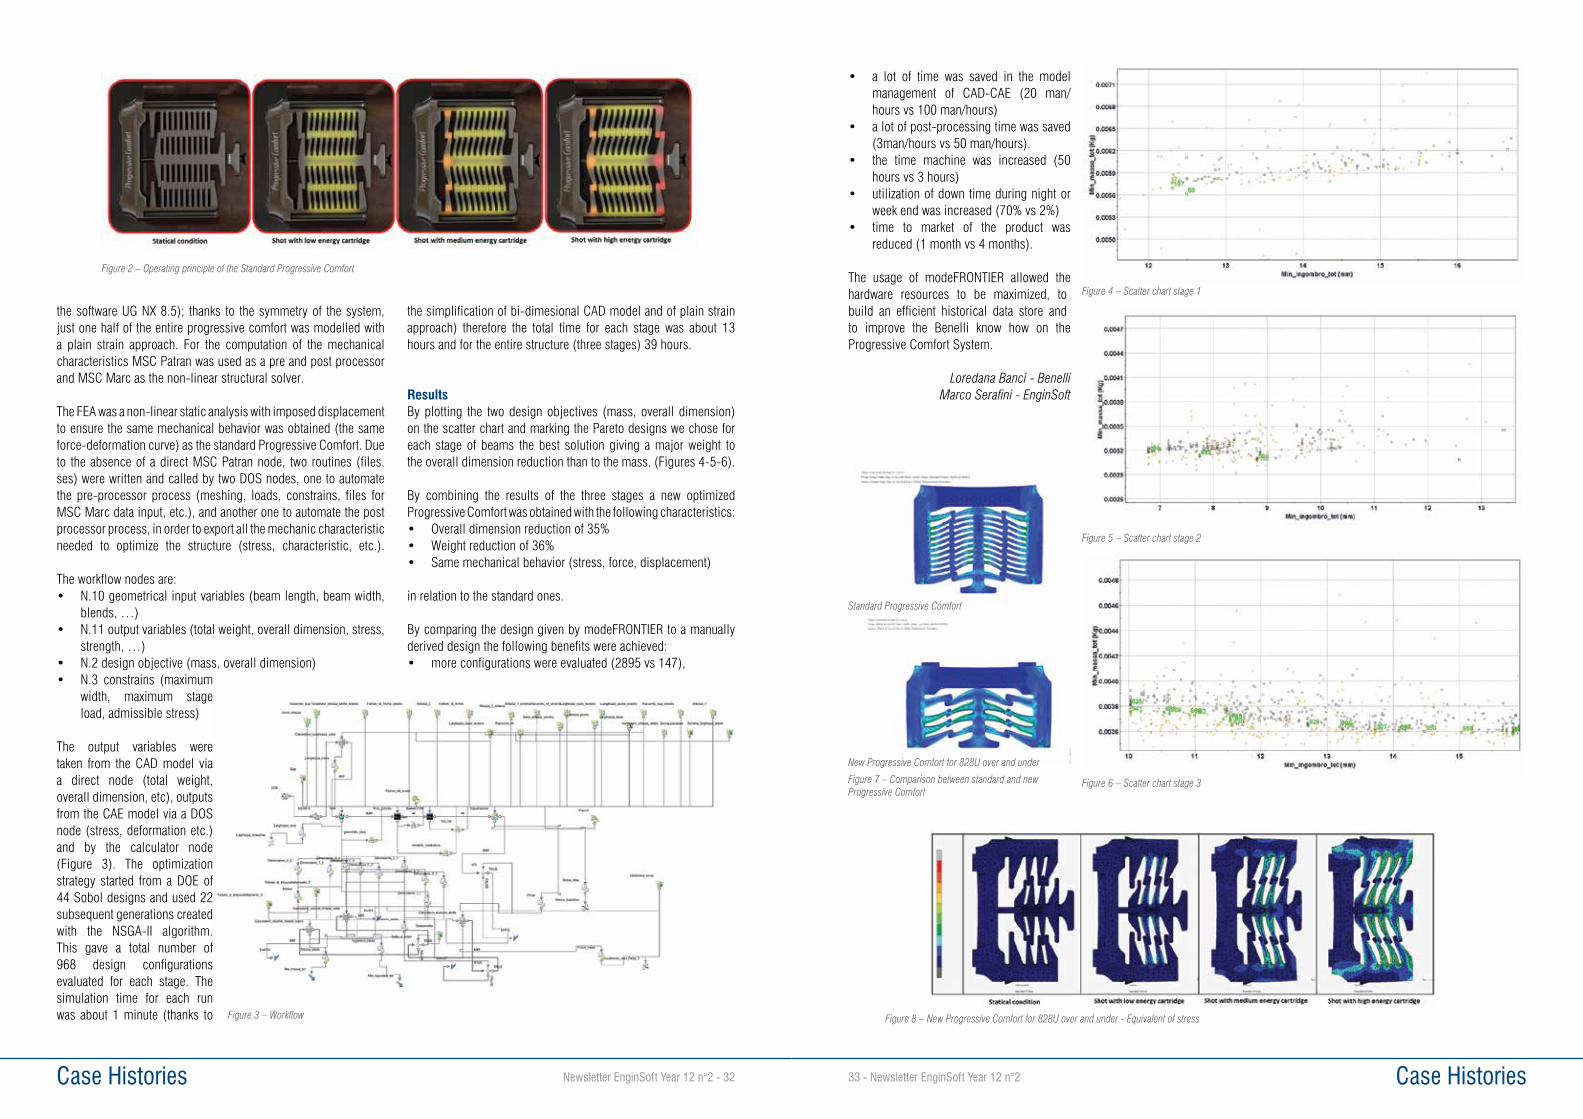
Case Histories33 - Newsletter EnginSoft Year 12 n°2 Case Histories Newsletter EnginSoft Year 12 n°2 - 32
• a lot of time was saved in the model management of CAD-CAE (20 man/hours vs 100 man/hours)
• a lot of post-processing time was saved (3man/hours vs 50 man/hours).
• the time machine was increased (50 hours vs 3 hours)
• utilization of down time during night or week end was increased (70% vs 2%)
• time to market of the product was reduced (1 month vs 4 months).
The usage of modeFRONTIER allowed the hardware resources to be maximized, to build an efficient historical data store and to improve the Benelli know how on the Progressive Comfort System.
Loredana Banci - BenelliMarco Serafini - EnginSoft
the software UG NX 8.5); thanks to the symmetry of the system, just one half of the entire progressive comfort was modelled with a plain strain approach. For the computation of the mechanical characteristics MSC Patran was used as a pre and post processor and MSC Marc as the non-linear structural solver.
The FEA was a non-linear static analysis with imposed displacement to ensure the same mechanical behavior was obtained (the same force-deformation curve) as the standard Progressive Comfort. Due to the absence of a direct MSC Patran node, two routines (files.ses) were written and called by two DOS nodes, one to automate the pre-processor process (meshing, loads, constrains, files for MSC Marc data input, etc.), and another one to automate the post processor process, in order to export all the mechanic characteristic needed to optimize the structure (stress, characteristic, etc.).
The workflow nodes are:• N.10 geometrical input variables (beam length, beam width,
blends, …)• N.11 output variables (total weight, overall dimension, stress,
strength, …)• N.2 design objective (mass, overall dimension)• N.3 constrains (maximum
width, maximum stage load, admissible stress)
The output variables were taken from the CAD model via a direct node (total weight, overall dimension, etc), outputs from the CAE model via a DOS node (stress, deformation etc.) and by the calculator node (Figure 3). The optimization strategy started from a DOE of 44 Sobol designs and used 22 subsequent generations created with the NSGA-II algorithm. This gave a total number of 968 design configurations evaluated for each stage. The simulation time for each run was about 1 minute (thanks to
the simplification of bi-dimesional CAD model and of plain strain approach) therefore the total time for each stage was about 13 hours and for the entire structure (three stages) 39 hours.
Results By plotting the two design objectives (mass, overall dimension) on the scatter chart and marking the Pareto designs we chose for each stage of beams the best solution giving a major weight to the overall dimension reduction than to the mass. (Figures 4-5-6).
By combining the results of the three stages a new optimized Progressive Comfort was obtained with the following characteristics:• Overall dimension reduction of 35%• Weight reduction of 36%• Same mechanical behavior (stress, force, displacement)
in relation to the standard ones.
By comparing the design given by modeFRONTIER to a manually derived design the following benefits were achieved:• more configurations were evaluated (2895 vs 147),
Figure 2 – Operating principle of the Standard Progressive Comfort
Figure 8 – New Progressive Comfort for 828U over and under - Equivalent of stress
Figure 7 – Comparison between standard and new Progressive Comfort
Figure 3 – Workflow
Figure 4 – Scatter chart stage 1
Figure 5 – Scatter chart stage 2
Figure 6 – Scatter chart stage 3
Standard Progressive Comfort
New Progressive Comfort for 828U over and under
Case Histories35 - Newsletter EnginSoft Year 12 n°2 Case Histories Newsletter EnginSoft Year 12 n°2 - 34
Why ANSYS and ANSYS CFX in De’ LonghiWe use the ANSYS NLS code to verify and optimize components for coffee makers and ironing systems. ANSYS is applied in the first phases of the product design or to enhance existing products, guaranteeing that the project complies with the necessary performance requirements before its production starts. We carry out structural, thermal and non-linear analyses, mainly on components made of polymeric material. ANSYS CFX is instead used to optimize the heat exchange in our heating appliances with the aim of reducing the service temperatures and in particular on those surfaces that could get in contact with the customer. ANSYS CFX allow us to reduce the number of prototypes which are necessary to guarantee the correct attaining to the regulation and to validate the project functionality at the same time.Apart from the above-mentioned advantage, having a new tool of this kind in our working chain, enables us to reduce the time to market for a new product. Furthermore, the variety of scenarios that this tool can investigate, allows to limit the number of returned goods in warranty.
De’ Longhi is a great Italian group, growing in the world thanks to its innovative products, its style and quality of materials. It is a global market leader operating in the comfort sector with four different business units: heating, air conditioning, air treatment, kitchen appliances, home care and ironing. De’ Longhi is a successful brand thanks to its ideas and innovation and the company has been able to extend its products portfolio from portable heating (oil filled radiators, convector heaters, fan heaters, gas and kerosene heaters, etc.) to air conditioning, a sector in which De’ Longhi offers the widest range of possible products, from Pinguino till the chilling and air conditioning systems for industrial and civil uses (shopping malls, hospitals, banks and hotels). De’ Longhi products now include air treatment systems, homecare products, household appliances for food preparation and cooking
(coffee makers, fryers, electric and microwave ovens, grills, multi-cookers, etc.), free-standing gas and electric cookers, built-in ovens, water heating bodies for centralized heating systems. Modern and automatized plants, great specialization and complementarity: these elements make De’ Longhi Group plants highly innovative and able to produce, at competitive costs, high quality products for worldwide customers.
The wide range of De’ Longhi products is the result of a mixture of productive, technological and commercial synergies and its evolution is
supported by strong investments for Research & Development and Industrial Design, so
to make an idea to become a product. Our strength mainly lays in the constant technological improvement of the single
productive units and in the great care for the most critical phases of the industrial process, so to maximize productivity and quality, while
differentiating the products and reducing their time-to-market. In such a scenario, the
use of top class technologies like ANSYS and ANSYS CFX, also thanks to EnginSoft’s
experience, has allowed us to move forward our objectives of innovation and quality even in
the experimental phase.
Stefano Quaresimin, Raffaele Toffolo, Marco FrassonResearch & Development, De’ Longhi Spa
Coffee Makers and Homecare Products with a Combination of style and performance
EnginSoft in the food&beverage industryIn addition to the previous case, mainly focused on structural problems in beverage dispensing, EnginSoft works with the world’s leading players in the food&beverage industry. For these companies, food safety, process robustness and productivity are the most important factors of their research and development. Food safety for the consumer is the first priority. Bottles, packaging, dispensers, machines have to be washed and in some cases also sterilized. Moreover, aseptic or non-oxidant conditions have to be assured for perishable food. All these issues can be addressed and food safety can be guaranteed with the support of simulation. Computational fluid dynamics can give an insight in all these processes, to study for example the interaction of chemical species with packaging, machines and food. Thermal management is another topic that is relevant for many applications, it involves several disciplines from electromagnetism to structural and thermo fluid dynamics. Also, process robustness is a key factor which leading companies in these sectors that use industrial lines to fill bottles and packaging with their products, have to guarantee to their customers. Each component, the whole line and the process itself, have to be reliable and robust. Last but not least, productivity has to be maximized. The production rate can reach 20.000 packages/bottles per hour depending on the type of food. Hence, every step has to be optimized in terms of efficiency, which means reducing time and keeping the process quality at the maximum level. The ANSYS technologies and EnginSoft’s expertise in engineering simulation can build synergy, to cover multidisciplinary applications and to give simulation the right role, which is to support and drive the design process in advance with respect to physical prototyping thus reducing development time and costs.
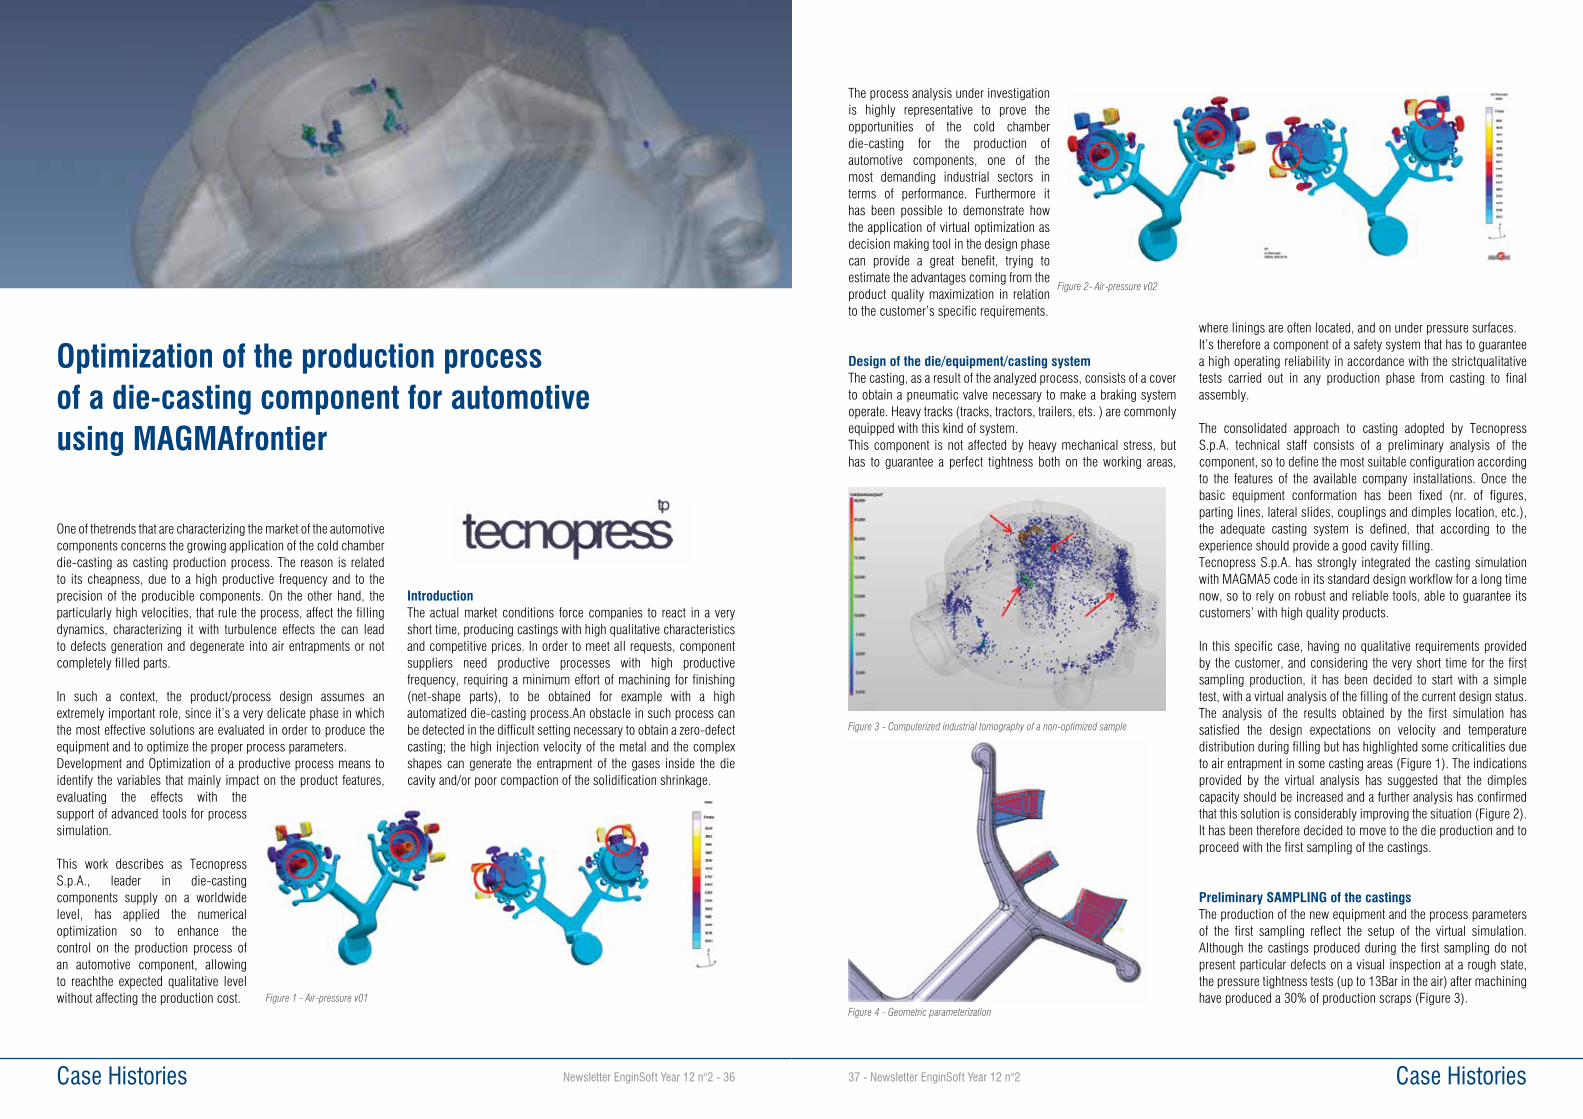
Case Histories37 - Newsletter EnginSoft Year 12 n°2 Case Histories Newsletter EnginSoft Year 12 n°2 - 36
The process analysis under investigation is highly representative to prove the opportunities of the cold chamber die-casting for the production of automotive components, one of the most demanding industrial sectors in terms of performance. Furthermore it has been possible to demonstrate how the application of virtual optimization as decision making tool in the design phase can provide a great benefit, trying to estimate the advantages coming from the product quality maximization in relation to the customer’s specific requirements.
Design of the die/equipment/casting systemThe casting, as a result of the analyzed process, consists of a cover to obtain a pneumatic valve necessary to make a braking system operate. Heavy tracks (tracks, tractors, trailers, ets. ) are commonly equipped with this kind of system.This component is not affected by heavy mechanical stress, but has to guarantee a perfect tightness both on the working areas,
where linings are often located, and on under pressure surfaces.It’s therefore a component of a safety system that has to guarantee a high operating reliability in accordance with the strictqualitative tests carried out in any production phase from casting to final assembly.
The consolidated approach to casting adopted by Tecnopress S.p.A. technical staff consists of a preliminary analysis of the component, so to define the most suitable configuration according to the features of the available company installations. Once the basic equipment conformation has been fixed (nr. of figures, parting lines, lateral slides, couplings and dimples location, etc.), the adequate casting system is defined, that according to the experience should provide a good cavity filling.Tecnopress S.p.A. has strongly integrated the casting simulation with MAGMA5 code in its standard design workflow for a long time now, so to rely on robust and reliable tools, able to guarantee its customers’ with high quality products.
In this specific case, having no qualitative requirements provided by the customer, and considering the very short time for the first sampling production, it has been decided to start with a simple test, with a virtual analysis of the filling of the current design status.The analysis of the results obtained by the first simulation has satisfied the design expectations on velocity and temperature distribution during filling but has highlighted some criticalities due to air entrapment in some casting areas (Figure 1). The indications provided by the virtual analysis has suggested that the dimples capacity should be increased and a further analysis has confirmed that this solution is considerably improving the situation (Figure 2). It has been therefore decided to move to the die production and to proceed with the first sampling of the castings.
Preliminary SAMPLING of the castingsThe production of the new equipment and the process parameters of the first sampling reflect the setup of the virtual simulation. Although the castings produced during the first sampling do not present particular defects on a visual inspection at a rough state, the pressure tightness tests (up to 13Bar in the air) after machining have produced a 30% of production scraps (Figure 3).
Figure 2- Air-pressure v02
Figure 3 - Computerized industrial tomography of a non-optimized sample
Figure 4 - Geometric parameterization
One of thetrends that are characterizing the market of the automotive components concerns the growing application of the cold chamber die-casting as casting production process. The reason is related to its cheapness, due to a high productive frequency and to the precision of the producible components. On the other hand, the particularly high velocities, that rule the process, affect the filling dynamics, characterizing it with turbulence effects the can lead to defects generation and degenerate into air entrapments or not completely filled parts.
In such a context, the product/process design assumes an extremely important role, since it’s a very delicate phase in which the most effective solutions are evaluated in order to produce the equipment and to optimize the proper process parameters.Development and Optimization of a productive process means to identify the variables that mainly impact on the product features, evaluating the effects with the support of advanced tools for process simulation.
This work describes as Tecnopress S.p.A., leader in die-casting components supply on a worldwide level, has applied the numerical optimization so to enhance the control on the production process of an automotive component, allowing to reachthe expected qualitative level without affecting the production cost.
IntroductionThe actual market conditions force companies to react in a very short time, producing castings with high qualitative characteristics and competitive prices. In order to meet all requests, component suppliers need productive processes with high productive frequency, requiring a minimum effort of machining for finishing (net-shape parts), to be obtained for example with a high automatized die-casting process.An obstacle in such process can be detected in the difficult setting necessary to obtain a zero-defect casting; the high injection velocity of the metal and the complex shapes can generate the entrapment of the gases inside the die cavity and/or poor compaction of the solidification shrinkage.
Optimization of the production process of a die-casting component for automotive using MAGMAfrontier
Figure 1 - Air-pressure v01
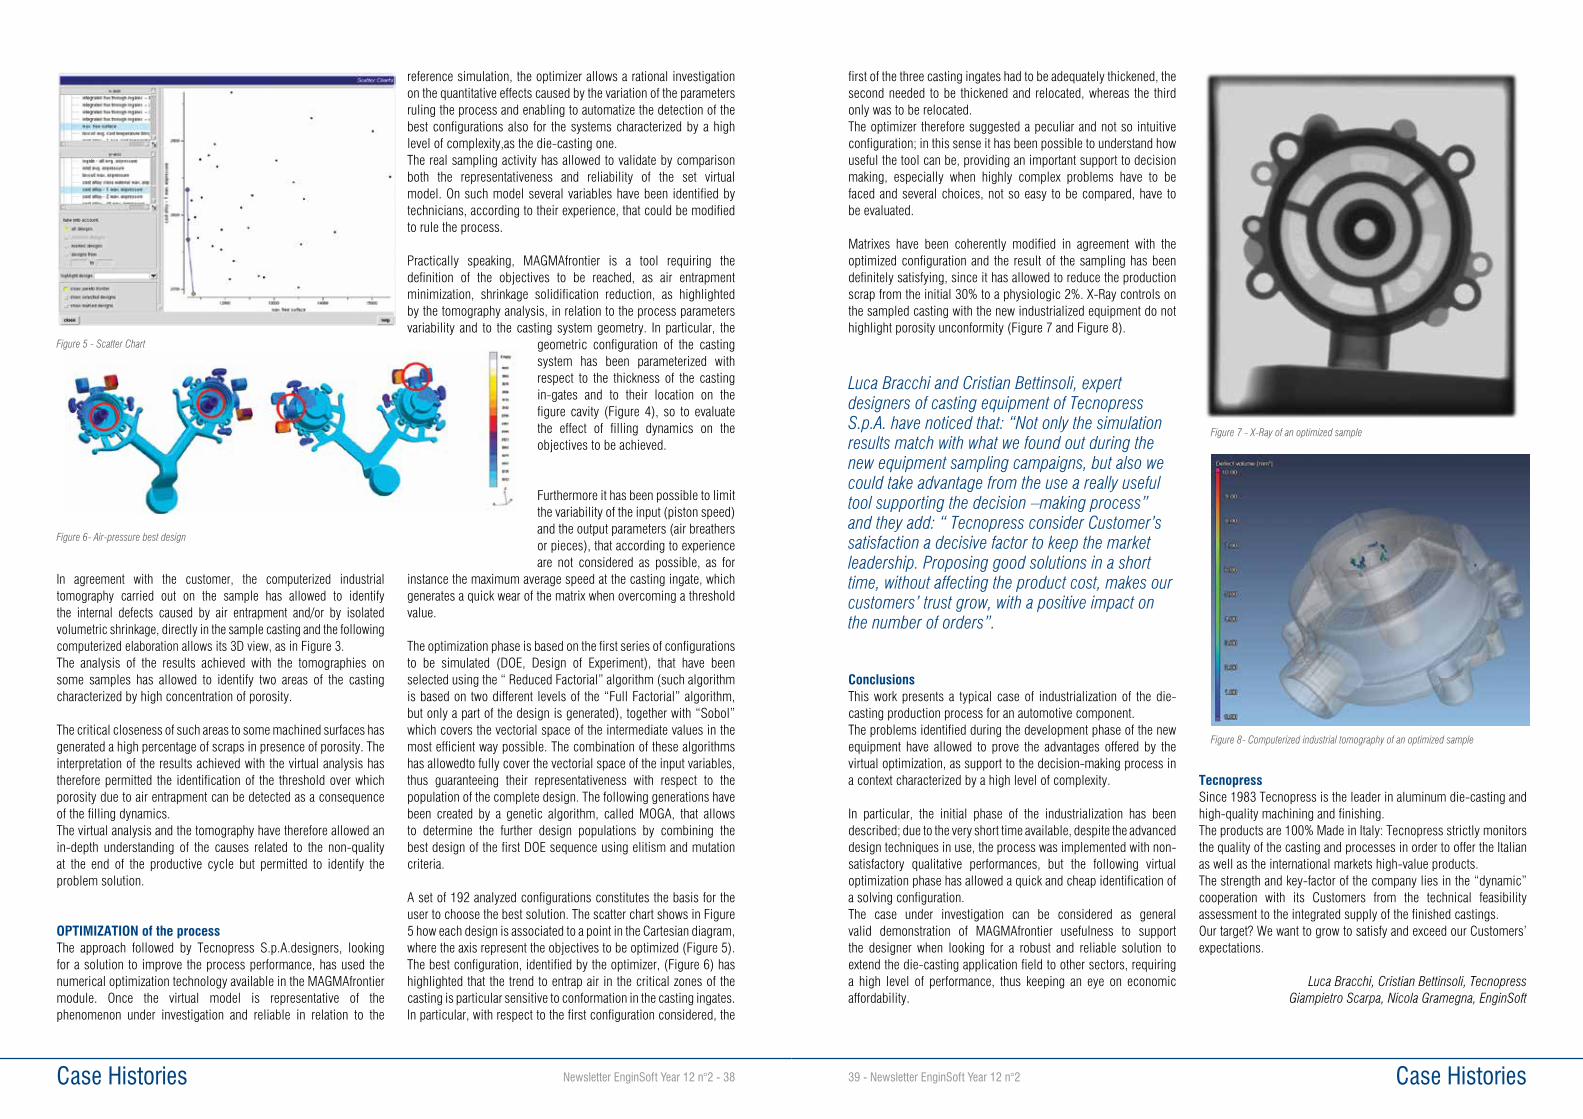
Case Histories39 - Newsletter EnginSoft Year 12 n°2 Case Histories Newsletter EnginSoft Year 12 n°2 - 38
first of the three casting ingates had to be adequately thickened, the second needed to be thickened and relocated, whereas the third only was to be relocated.The optimizer therefore suggested a peculiar and not so intuitive configuration; in this sense it has been possible to understand how useful the tool can be, providing an important support to decision making, especially when highly complex problems have to be faced and several choices, not so easy to be compared, have to be evaluated.
Matrixes have been coherently modified in agreement with the optimized configuration and the result of the sampling has been definitely satisfying, since it has allowed to reduce the production scrap from the initial 30% to a physiologic 2%. X-Ray controls on the sampled casting with the new industrialized equipment do not highlight porosity unconformity (Figure 7 and Figure 8).
Luca Bracchi and Cristian Bettinsoli, expert designers of casting equipment of Tecnopress S.p.A. have noticed that: “Not only the simulation results match with what we found out during the new equipment sampling campaigns, but also we could take advantage from the use a really useful tool supporting the decision –making process” and they add: “ Tecnopress consider Customer’s satisfaction a decisive factor to keep the market leadership. Proposing good solutions in a short time, without affecting the product cost, makes our customers’ trust grow, with a positive impact on the number of orders”.
ConclusionsThis work presents a typical case of industrialization of the die-casting production process for an automotive component.The problems identified during the development phase of the new equipment have allowed to prove the advantages offered by the virtual optimization, as support to the decision-making process in a context characterized by a high level of complexity.
In particular, the initial phase of the industrialization has been described; due to the very short time available, despite the advanced design techniques in use, the process was implemented with non-satisfactory qualitative performances, but the following virtual optimization phase has allowed a quick and cheap identification of a solving configuration.The case under investigation can be considered as general valid demonstration of MAGMAfrontier usefulness to support the designer when looking for a robust and reliable solution to extend the die-casting application field to other sectors, requiring a high level of performance, thus keeping an eye on economic affordability.
TecnopressSince 1983 Tecnopress is the leader in aluminum die-casting and high-quality machining and finishing.The products are 100% Made in Italy: Tecnopress strictly monitors the quality of the casting and processes in order to offer the Italian as well as the international markets high-value products. The strength and key-factor of the company lies in the “dynamic” cooperation with its Customers from the technical feasibility assessment to the integrated supply of the finished castings.Our target? We want to grow to satisfy and exceed our Customers’ expectations.
Luca Bracchi, Cristian Bettinsoli, TecnopressGiampietro Scarpa, Nicola Gramegna, EnginSoft
Figure 7 - X-Ray of an optimized sample
Figure 8- Computerized industrial tomography of an optimized sample
In agreement with the customer, the computerized industrial tomography carried out on the sample has allowed to identify the internal defects caused by air entrapment and/or by isolated volumetric shrinkage, directly in the sample casting and the following computerized elaboration allows its 3D view, as in Figure 3.The analysis of the results achieved with the tomographies on some samples has allowed to identify two areas of the casting characterized by high concentration of porosity.
The critical closeness of such areas to some machined surfaces has generated a high percentage of scraps in presence of porosity. The interpretation of the results achieved with the virtual analysis has therefore permitted the identification of the threshold over which porosity due to air entrapment can be detected as a consequence of the filling dynamics.The virtual analysis and the tomography have therefore allowed an in-depth understanding of the causes related to the non-quality at the end of the productive cycle but permitted to identify the problem solution.
OPTIMIZATION of the process The approach followed by Tecnopress S.p.A.designers, looking for a solution to improve the process performance, has used the numerical optimization technology available in the MAGMAfrontier module. Once the virtual model is representative of the phenomenon under investigation and reliable in relation to the
reference simulation, the optimizer allows a rational investigation on the quantitative effects caused by the variation of the parameters ruling the process and enabling to automatize the detection of the best configurations also for the systems characterized by a high level of complexity,as the die-casting one.The real sampling activity has allowed to validate by comparison both the representativeness and reliability of the set virtual model. On such model several variables have been identified by technicians, according to their experience, that could be modified to rule the process.
Practically speaking, MAGMAfrontier is a tool requiring the definition of the objectives to be reached, as air entrapment minimization, shrinkage solidification reduction, as highlighted by the tomography analysis, in relation to the process parameters variability and to the casting system geometry. In particular, the
geometric configuration of the casting system has been parameterized with respect to the thickness of the casting in-gates and to their location on the figure cavity (Figure 4), so to evaluate the effect of filling dynamics on the objectives to be achieved.
Furthermore it has been possible to limit the variability of the input (piston speed) and the output parameters (air breathers or pieces), that according to experience are not considered as possible, as for
instance the maximum average speed at the casting ingate, which generates a quick wear of the matrix when overcoming a threshold value.
The optimization phase is based on the first series of configurations to be simulated (DOE, Design of Experiment), that have been selected using the “ Reduced Factorial” algorithm (such algorithm is based on two different levels of the “Full Factorial” algorithm, but only a part of the design is generated), together with “Sobol” which covers the vectorial space of the intermediate values in the most efficient way possible. The combination of these algorithms has allowedto fully cover the vectorial space of the input variables, thus guaranteeing their representativeness with respect to the population of the complete design. The following generations have been created by a genetic algorithm, called MOGA, that allows to determine the further design populations by combining the best design of the first DOE sequence using elitism and mutation criteria.
A set of 192 analyzed configurations constitutes the basis for the user to choose the best solution. The scatter chart shows in Figure 5 how each design is associated to a point in the Cartesian diagram, where the axis represent the objectives to be optimized (Figure 5).The best configuration, identified by the optimizer, (Figure 6) has highlighted that the trend to entrap air in the critical zones of the casting is particular sensitive to conformation in the casting ingates. In particular, with respect to the first configuration considered, the
Figure 5 - Scatter Chart
Figure 6- Air-pressure best design
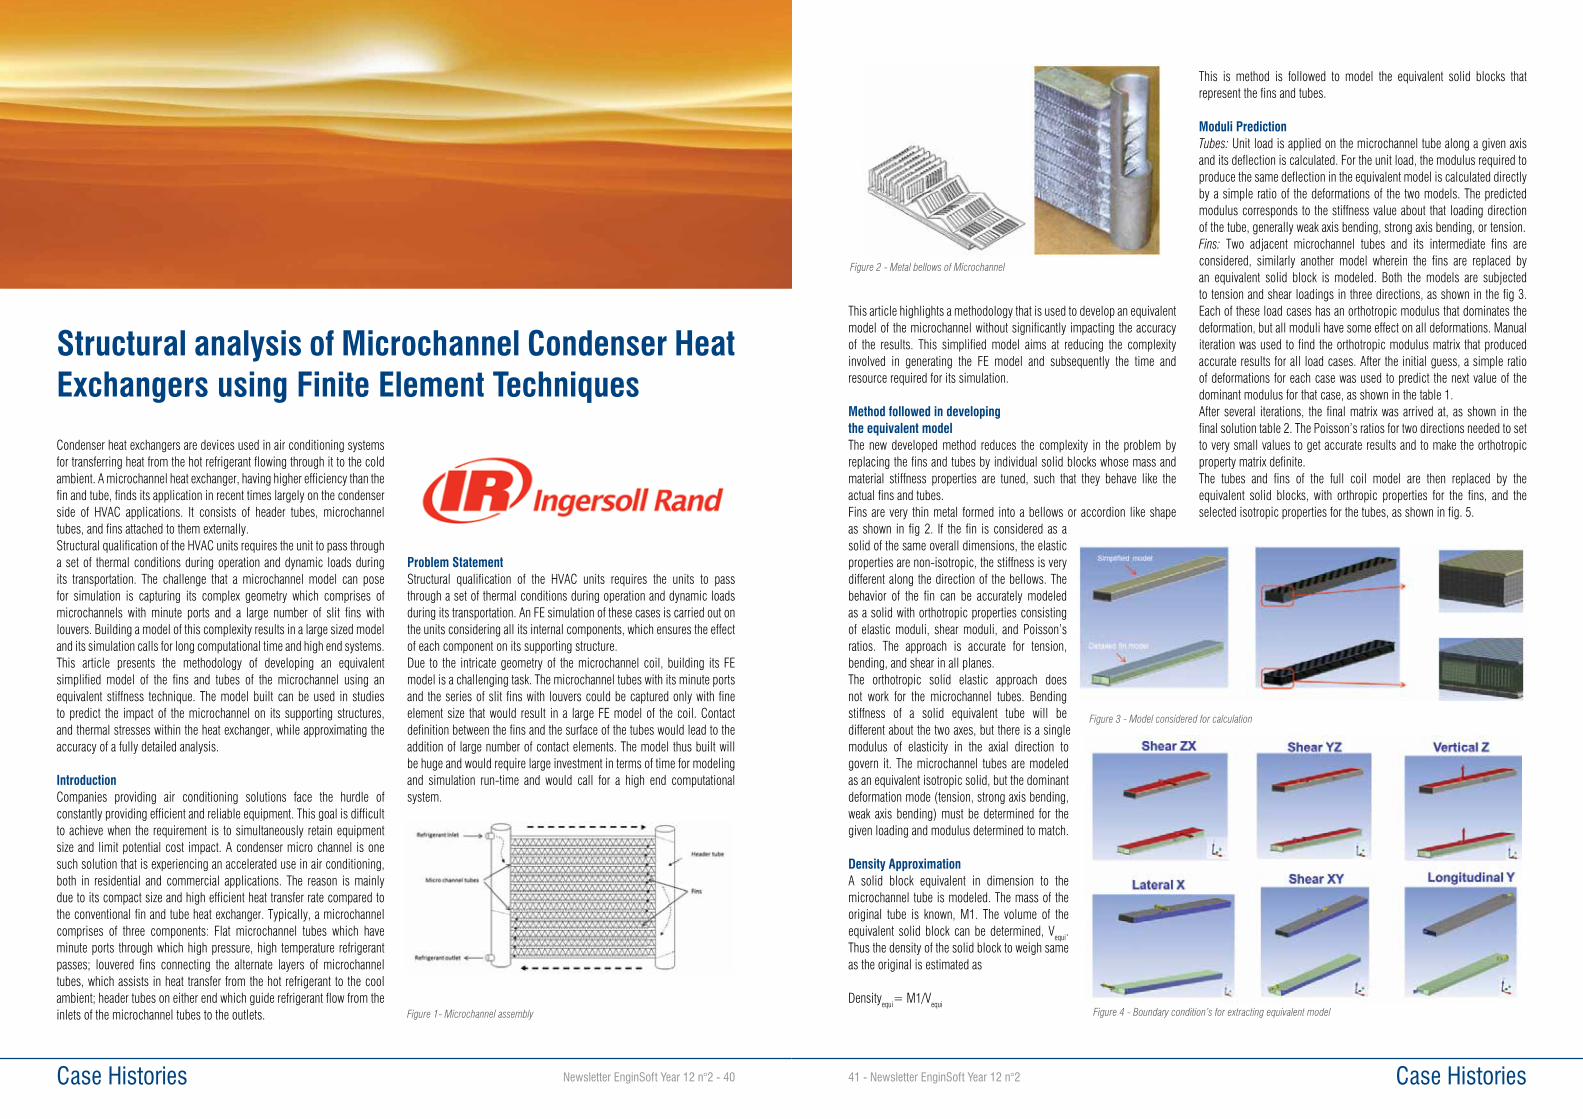
Case Histories41 - Newsletter EnginSoft Year 12 n°2 Case Histories Newsletter EnginSoft Year 12 n°2 - 40
Condenser heat exchangers are devices used in air conditioning systems for transferring heat from the hot refrigerant flowing through it to the cold ambient. A microchannel heat exchanger, having higher efficiency than the fin and tube, finds its application in recent times largely on the condenser side of HVAC applications. It consists of header tubes, microchannel tubes, and fins attached to them externally. Structural qualification of the HVAC units requires the unit to pass through a set of thermal conditions during operation and dynamic loads during its transportation. The challenge that a microchannel model can pose for simulation is capturing its complex geometry which comprises of microchannels with minute ports and a large number of slit fins with louvers. Building a model of this complexity results in a large sized model and its simulation calls for long computational time and high end systems. This article presents the methodology of developing an equivalent simplified model of the fins and tubes of the microchannel using an equivalent stiffness technique. The model built can be used in studies to predict the impact of the microchannel on its supporting structures, and thermal stresses within the heat exchanger, while approximating the accuracy of a fully detailed analysis.
IntroductionCompanies providing air conditioning solutions face the hurdle of constantly providing efficient and reliable equipment. This goal is difficult to achieve when the requirement is to simultaneously retain equipment size and limit potential cost impact. A condenser micro channel is one such solution that is experiencing an accelerated use in air conditioning, both in residential and commercial applications. The reason is mainly due to its compact size and high efficient heat transfer rate compared to the conventional fin and tube heat exchanger. Typically, a microchannel comprises of three components: Flat microchannel tubes which have minute ports through which high pressure, high temperature refrigerant passes; louvered fins connecting the alternate layers of microchannel tubes, which assists in heat transfer from the hot refrigerant to the cool ambient; header tubes on either end which guide refrigerant flow from the inlets of the microchannel tubes to the outlets.
Problem StatementStructural qualification of the HVAC units requires the units to pass through a set of thermal conditions during operation and dynamic loads during its transportation. An FE simulation of these cases is carried out on the units considering all its internal components, which ensures the effect of each component on its supporting structure.Due to the intricate geometry of the microchannel coil, building its FE model is a challenging task. The microchannel tubes with its minute ports and the series of slit fins with louvers could be captured only with fine element size that would result in a large FE model of the coil. Contact definition between the fins and the surface of the tubes would lead to the addition of large number of contact elements. The model thus built will be huge and would require large investment in terms of time for modeling and simulation run-time and would call for a high end computational system.
Structural analysis of Microchannel Condenser Heat Exchangers using Finite Element Techniques
Figure 1- Microchannel assembly
This article highlights a methodology that is used to develop an equivalent model of the microchannel without significantly impacting the accuracy of the results. This simplified model aims at reducing the complexity involved in generating the FE model and subsequently the time and resource required for its simulation.
Method followed in developing the equivalent modelThe new developed method reduces the complexity in the problem by replacing the fins and tubes by individual solid blocks whose mass and material stiffness properties are tuned, such that they behave like the actual fins and tubes. Fins are very thin metal formed into a bellows or accordion like shape as shown in fig 2. If the fin is considered as a solid of the same overall dimensions, the elastic properties are non-isotropic, the stiffness is very different along the direction of the bellows. The behavior of the fin can be accurately modeled as a solid with orthotropic properties consisting of elastic moduli, shear moduli, and Poisson’s ratios. The approach is accurate for tension, bending, and shear in all planes.The orthotropic solid elastic approach does not work for the microchannel tubes. Bending stiffness of a solid equivalent tube will be different about the two axes, but there is a single modulus of elasticity in the axial direction to govern it. The microchannel tubes are modeled as an equivalent isotropic solid, but the dominant deformation mode (tension, strong axis bending, weak axis bending) must be determined for the given loading and modulus determined to match.
Density ApproximationA solid block equivalent in dimension to the microchannel tube is modeled. The mass of the original tube is known, M1. The volume of the equivalent solid block can be determined, Vequi. Thus the density of the solid block to weigh same as the original is estimated as
Densityequi= M1/Vequi
This is method is followed to model the equivalent solid blocks that represent the fins and tubes.
Moduli PredictionTubes: Unit load is applied on the microchannel tube along a given axis and its deflection is calculated. For the unit load, the modulus required to produce the same deflection in the equivalent model is calculated directly by a simple ratio of the deformations of the two models. The predicted modulus corresponds to the stiffness value about that loading direction of the tube, generally weak axis bending, strong axis bending, or tension. Fins: Two adjacent microchannel tubes and its intermediate fins are considered, similarly another model wherein the fins are replaced by an equivalent solid block is modeled. Both the models are subjected to tension and shear loadings in three directions, as shown in the fig 3. Each of these load cases has an orthotropic modulus that dominates the deformation, but all moduli have some effect on all deformations. Manual iteration was used to find the orthotropic modulus matrix that produced accurate results for all load cases. After the initial guess, a simple ratio of deformations for each case was used to predict the next value of the dominant modulus for that case, as shown in the table 1.After several iterations, the final matrix was arrived at, as shown in the final solution table 2. The Poisson’s ratios for two directions needed to set to very small values to get accurate results and to make the orthotropic property matrix definite.The tubes and fins of the full coil model are then replaced by the equivalent solid blocks, with orthropic properties for the fins, and the selected isotropic properties for the tubes, as shown in fig. 5.
Figure 2 - Metal bellows of Microchannel
Figure 3 - Model considered for calculation
Figure 4 - Boundary condition’s for extracting equivalent model
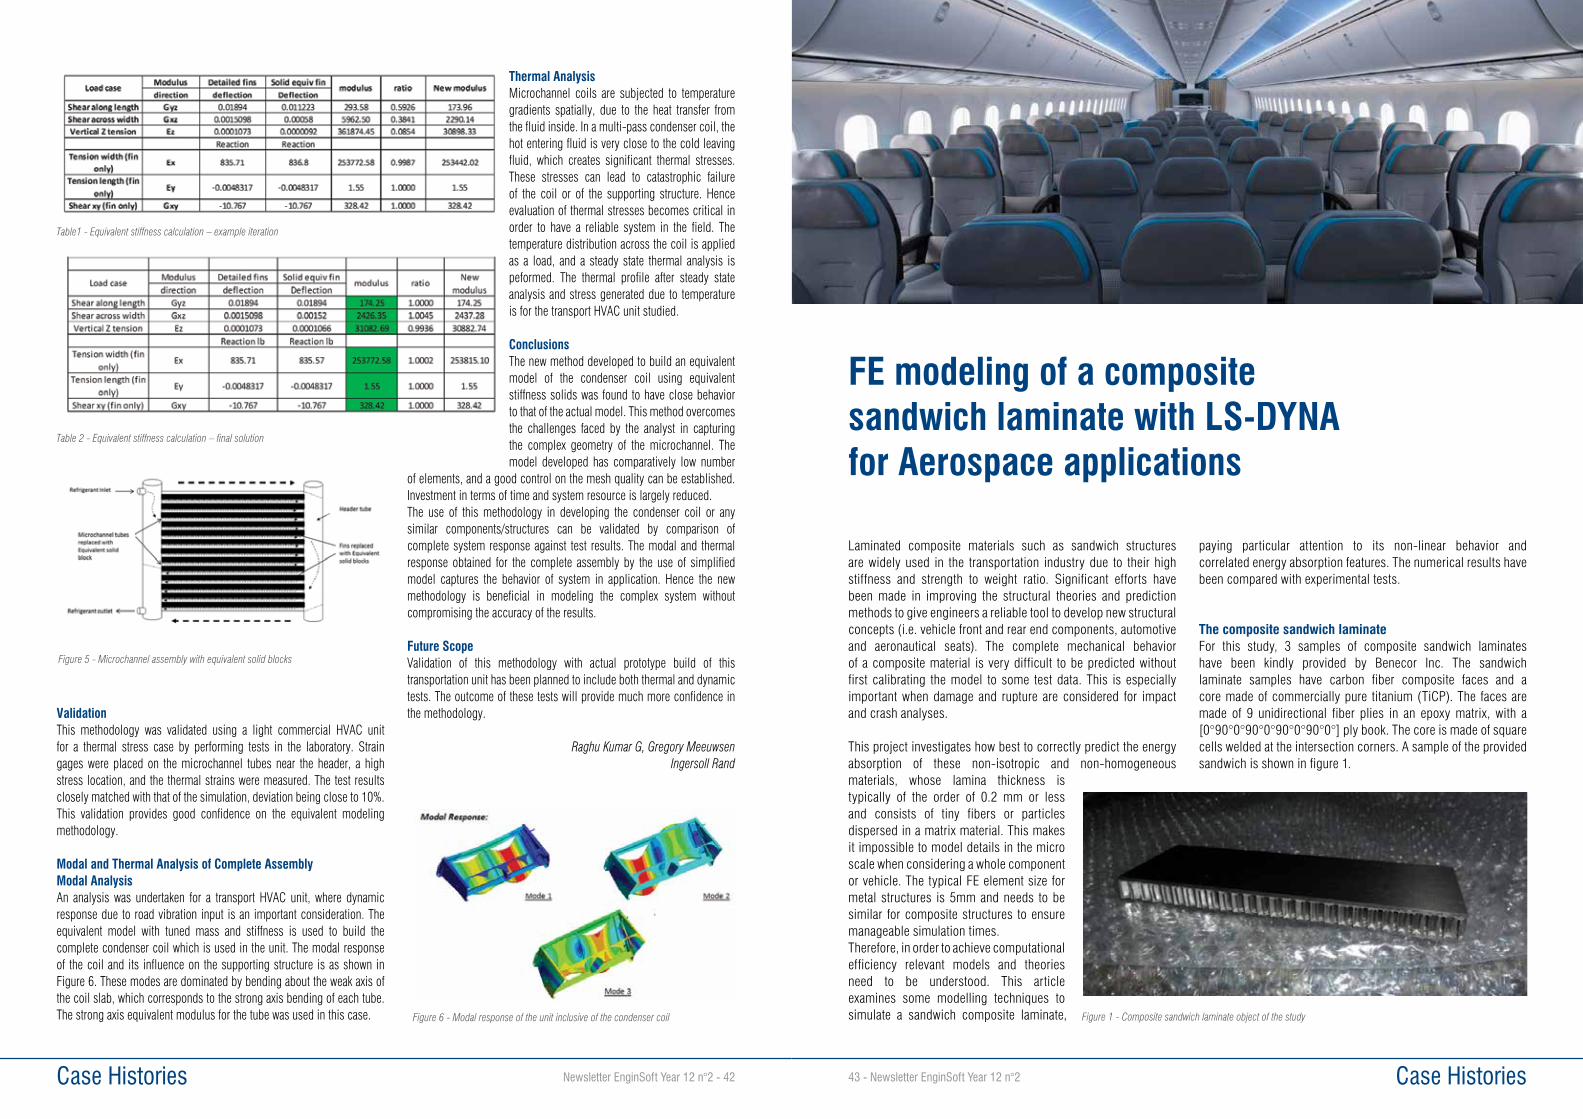
43 - Newsletter EnginSoft Year 12 n°2 Case HistoriesCase Histories Newsletter EnginSoft Year 12 n°2 - 42
Laminated composite materials such as sandwich structures are widely used in the transportation industry due to their high stiffness and strength to weight ratio. Significant efforts have been made in improving the structural theories and prediction methods to give engineers a reliable tool to develop new structural concepts (i.e. vehicle front and rear end components, automotive and aeronautical seats). The complete mechanical behavior of a composite material is very difficult to be predicted without first calibrating the model to some test data. This is especially important when damage and rupture are considered for impact and crash analyses.
This project investigates how best to correctly predict the energy absorption of these non-isotropic and non-homogeneous materials, whose lamina thickness is typically of the order of 0.2 mm or less and consists of tiny fibers or particles dispersed in a matrix material. This makes it impossible to model details in the micro scale when considering a whole component or vehicle. The typical FE element size for metal structures is 5mm and needs to be similar for composite structures to ensure manageable simulation times.Therefore, in order to achieve computational efficiency relevant models and theories need to be understood. This article examines some modelling techniques to simulate a sandwich composite laminate,
paying particular attention to its non-linear behavior and correlated energy absorption features. The numerical results have been compared with experimental tests.
The composite sandwich laminate For this study, 3 samples of composite sandwich laminates have been kindly provided by Benecor Inc. The sandwich laminate samples have carbon fiber composite faces and a core made of commercially pure titanium (TiCP). The faces are made of 9 unidirectional fiber plies in an epoxy matrix, with a [0°90°0°90°0°90°0°90°0°] ply book. The core is made of square cells welded at the intersection corners. A sample of the provided sandwich is shown in figure 1.
FE modeling of a composite sandwich laminate with LS-DYNA for Aerospace applications
Figure 1 - Composite sandwich laminate object of the study
ValidationThis methodology was validated using a light commercial HVAC unit for a thermal stress case by performing tests in the laboratory. Strain gages were placed on the microchannel tubes near the header, a high stress location, and the thermal strains were measured. The test results closely matched with that of the simulation, deviation being close to 10%. This validation provides good confidence on the equivalent modeling methodology.
Modal and Thermal Analysis of Complete Assembly Modal Analysis An analysis was undertaken for a transport HVAC unit, where dynamic response due to road vibration input is an important consideration. The equivalent model with tuned mass and stiffness is used to build the complete condenser coil which is used in the unit. The modal response of the coil and its influence on the supporting structure is as shown in Figure 6. These modes are dominated by bending about the weak axis of the coil slab, which corresponds to the strong axis bending of each tube. The strong axis equivalent modulus for the tube was used in this case.
Thermal Analysis Microchannel coils are subjected to temperature gradients spatially, due to the heat transfer from the fluid inside. In a multi-pass condenser coil, the hot entering fluid is very close to the cold leaving fluid, which creates significant thermal stresses. These stresses can lead to catastrophic failure of the coil or of the supporting structure. Hence evaluation of thermal stresses becomes critical in order to have a reliable system in the field. The temperature distribution across the coil is applied as a load, and a steady state thermal analysis is peformed. The thermal profile after steady state analysis and stress generated due to temperature is for the transport HVAC unit studied.
ConclusionsThe new method developed to build an equivalent model of the condenser coil using equivalent stiffness solids was found to have close behavior to that of the actual model. This method overcomes the challenges faced by the analyst in capturing the complex geometry of the microchannel. The model developed has comparatively low number
of elements, and a good control on the mesh quality can be established. Investment in terms of time and system resource is largely reduced. The use of this methodology in developing the condenser coil or any similar components/structures can be validated by comparison of complete system response against test results. The modal and thermal response obtained for the complete assembly by the use of simplified model captures the behavior of system in application. Hence the new methodology is beneficial in modeling the complex system without compromising the accuracy of the results.
Future ScopeValidation of this methodology with actual prototype build of this transportation unit has been planned to include both thermal and dynamic tests. The outcome of these tests will provide much more confidence in the methodology.
Raghu Kumar G, Gregory MeeuwsenIngersoll Rand
Table1 - Equivalent stiffness calculation – example iteration
Table 2 - Equivalent stiffness calculation – final solution
Figure 5 - Microchannel assembly with equivalent solid blocks
Figure 6 - Modal response of the unit inclusive of the condenser coil
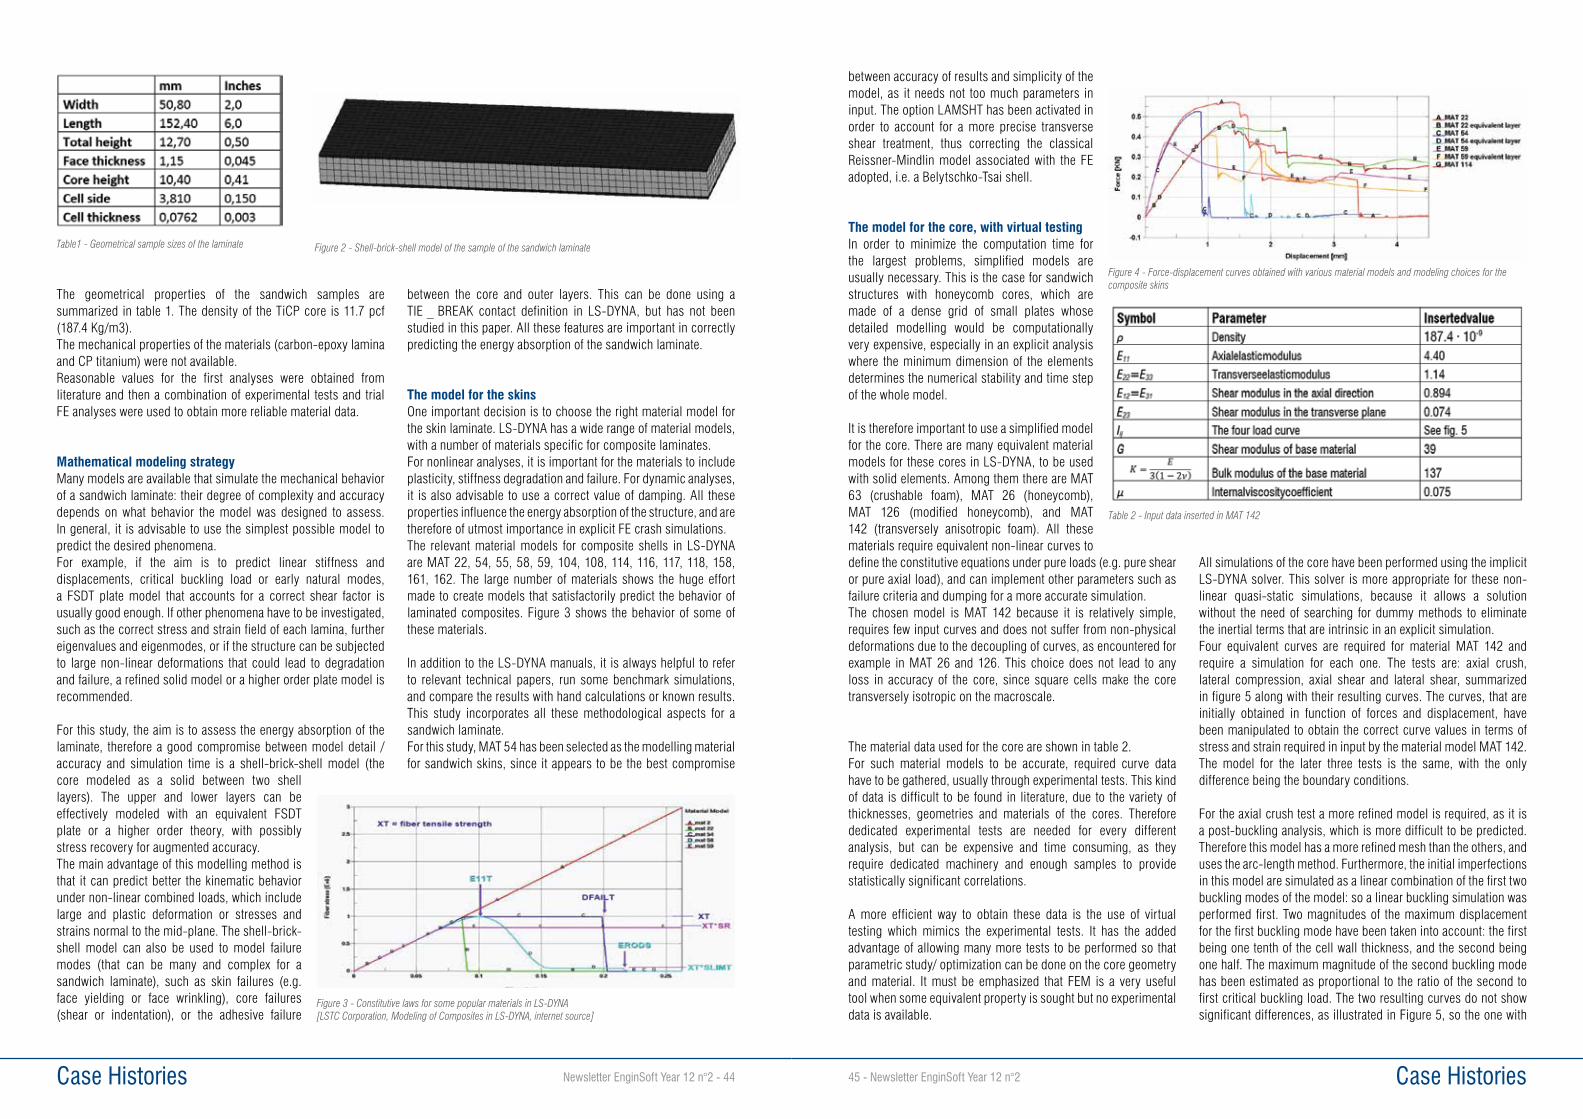
Case Histories45 - Newsletter EnginSoft Year 12 n°2 Case Histories Newsletter EnginSoft Year 12 n°2 - 44
between accuracy of results and simplicity of the model, as it needs not too much parameters in input. The option LAMSHT has been activated in order to account for a more precise transverse shear treatment, thus correcting the classical Reissner-Mindlin model associated with the FE adopted, i.e. a Belytschko-Tsai shell.
The model for the core, with virtual testingIn order to minimize the computation time for the largest problems, simplified models are usually necessary. This is the case for sandwich structures with honeycomb cores, which are made of a dense grid of small plates whose detailed modelling would be computationally very expensive, especially in an explicit analysis where the minimum dimension of the elements determines the numerical stability and time step of the whole model.
It is therefore important to use a simplified model for the core. There are many equivalent material models for these cores in LS-DYNA, to be used with solid elements. Among them there are MAT 63 (crushable foam), MAT 26 (honeycomb), MAT 126 (modified honeycomb), and MAT 142 (transversely anisotropic foam). All these materials require equivalent non-linear curves to define the constitutive equations under pure loads (e.g. pure shear or pure axial load), and can implement other parameters such as failure criteria and dumping for a more accurate simulation.The chosen model is MAT 142 because it is relatively simple, requires few input curves and does not suffer from non-physical deformations due to the decoupling of curves, as encountered for example in MAT 26 and 126. This choice does not lead to any loss in accuracy of the core, since square cells make the core transversely isotropic on the macroscale.
The material data used for the core are shown in table 2.For such material models to be accurate, required curve data have to be gathered, usually through experimental tests. This kind of data is difficult to be found in literature, due to the variety of thicknesses, geometries and materials of the cores. Therefore dedicated experimental tests are needed for every different analysis, but can be expensive and time consuming, as they require dedicated machinery and enough samples to provide statistically significant correlations.
A more efficient way to obtain these data is the use of virtual testing which mimics the experimental tests. It has the added advantage of allowing many more tests to be performed so that parametric study/ optimization can be done on the core geometry and material. It must be emphasized that FEM is a very useful tool when some equivalent property is sought but no experimental data is available.
All simulations of the core have been performed using the implicit LS-DYNA solver. This solver is more appropriate for these non-linear quasi-static simulations, because it allows a solution without the need of searching for dummy methods to eliminate the inertial terms that are intrinsic in an explicit simulation.Four equivalent curves are required for material MAT 142 and require a simulation for each one. The tests are: axial crush, lateral compression, axial shear and lateral shear, summarized in figure 5 along with their resulting curves. The curves, that are initially obtained in function of forces and displacement, have been manipulated to obtain the correct curve values in terms of stress and strain required in input by the material model MAT 142.The model for the later three tests is the same, with the only difference being the boundary conditions.
For the axial crush test a more refined model is required, as it is a post-buckling analysis, which is more difficult to be predicted. Therefore this model has a more refined mesh than the others, and uses the arc-length method. Furthermore, the initial imperfections in this model are simulated as a linear combination of the first two buckling modes of the model: so a linear buckling simulation was performed first. Two magnitudes of the maximum displacement for the first buckling mode have been taken into account: the first being one tenth of the cell wall thickness, and the second being one half. The maximum magnitude of the second buckling mode has been estimated as proportional to the ratio of the second to first critical buckling load. The two resulting curves do not show significant differences, as illustrated in Figure 5, so the one with
Figure 4 - Force-displacement curves obtained with various material models and modeling choices for the composite skins
Table 2 - Input data inserted in MAT 142
The geometrical properties of the sandwich samples are summarized in table 1. The density of the TiCP core is 11.7 pcf (187.4 Kg/m3).The mechanical properties of the materials (carbon-epoxy lamina and CP titanium) were not available.Reasonable values for the first analyses were obtained from literature and then a combination of experimental tests and trial FE analyses were used to obtain more reliable material data.
Mathematical modeling strategyMany models are available that simulate the mechanical behavior of a sandwich laminate: their degree of complexity and accuracy depends on what behavior the model was designed to assess. In general, it is advisable to use the simplest possible model to predict the desired phenomena.For example, if the aim is to predict linear stiffness and displacements, critical buckling load or early natural modes, a FSDT plate model that accounts for a correct shear factor is usually good enough. If other phenomena have to be investigated, such as the correct stress and strain field of each lamina, further eigenvalues and eigenmodes, or if the structure can be subjected to large non-linear deformations that could lead to degradation and failure, a refined solid model or a higher order plate model is recommended.
For this study, the aim is to assess the energy absorption of the laminate, therefore a good compromise between model detail / accuracy and simulation time is a shell-brick-shell model (the core modeled as a solid between two shell layers). The upper and lower layers can be effectively modeled with an equivalent FSDT plate or a higher order theory, with possibly stress recovery for augmented accuracy.The main advantage of this modelling method is that it can predict better the kinematic behavior under non-linear combined loads, which include large and plastic deformation or stresses and strains normal to the mid-plane. The shell-brick-shell model can also be used to model failure modes (that can be many and complex for a sandwich laminate), such as skin failures (e.g. face yielding or face wrinkling), core failures (shear or indentation), or the adhesive failure
between the core and outer layers. This can be done using a TIE _ BREAK contact definition in LS-DYNA, but has not been studied in this paper. All these features are important in correctly predicting the energy absorption of the sandwich laminate.
The model for the skinsOne important decision is to choose the right material model for the skin laminate. LS-DYNA has a wide range of material models, with a number of materials specific for composite laminates.For nonlinear analyses, it is important for the materials to include plasticity, stiffness degradation and failure. For dynamic analyses, it is also advisable to use a correct value of damping. All these properties influence the energy absorption of the structure, and are therefore of utmost importance in explicit FE crash simulations.The relevant material models for composite shells in LS-DYNA are MAT 22, 54, 55, 58, 59, 104, 108, 114, 116, 117, 118, 158, 161, 162. The large number of materials shows the huge effort made to create models that satisfactorily predict the behavior of laminated composites. Figure 3 shows the behavior of some of these materials.
In addition to the LS-DYNA manuals, it is always helpful to refer to relevant technical papers, run some benchmark simulations, and compare the results with hand calculations or known results. This study incorporates all these methodological aspects for a sandwich laminate.For this study, MAT 54 has been selected as the modelling material for sandwich skins, since it appears to be the best compromise
Table1 - Geometrical sample sizes of the laminate Figure 2 - Shell-brick-shell model of the sample of the sandwich laminate
Figure 3 - Constitutive laws for some popular materials in LS-DYNA[LSTC Corporation, Modeling of Composites in LS-DYNA, internet source]
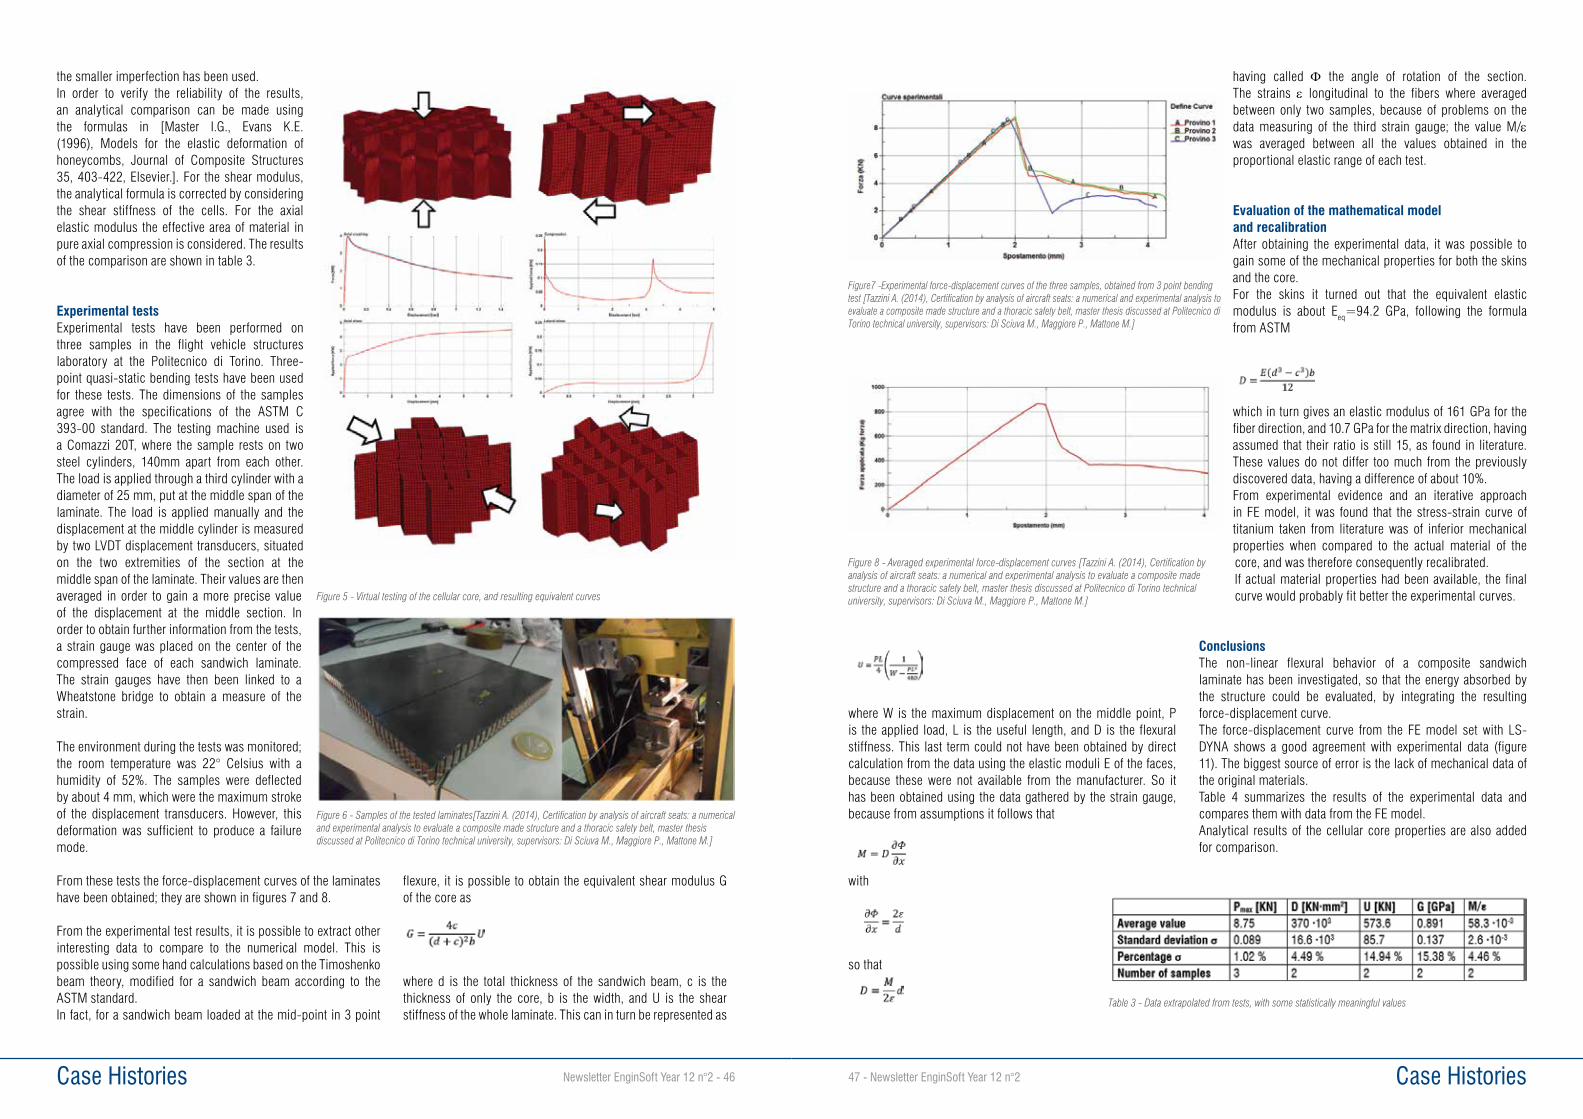
Case Histories47 - Newsletter EnginSoft Year 12 n°2 Case Histories Newsletter EnginSoft Year 12 n°2 - 46
where W is the maximum displacement on the middle point, P is the applied load, L is the useful length, and D is the flexural stiffness. This last term could not have been obtained by direct calculation from the data using the elastic moduli E of the faces, because these were not available from the manufacturer. So it has been obtained using the data gathered by the strain gauge, because from assumptions it follows that
with
so that
having called Φ the angle of rotation of the section. The strains ε longitudinal to the fibers where averaged between only two samples, because of problems on the data measuring of the third strain gauge; the value M/ε was averaged between all the values obtained in the proportional elastic range of each test.
Evaluation of the mathematical model and recalibrationAfter obtaining the experimental data, it was possible to gain some of the mechanical properties for both the skins and the core.For the skins it turned out that the equivalent elastic modulus is about Eeq=94.2 GPa, following the formula from ASTM
which in turn gives an elastic modulus of 161 GPa for the fiber direction, and 10.7 GPa for the matrix direction, having assumed that their ratio is still 15, as found in literature. These values do not differ too much from the previously discovered data, having a difference of about 10%.From experimental evidence and an iterative approach in FE model, it was found that the stress-strain curve of titanium taken from literature was of inferior mechanical properties when compared to the actual material of the core, and was therefore consequently recalibrated.If actual material properties had been available, the final curve would probably fit better the experimental curves.
ConclusionsThe non-linear flexural behavior of a composite sandwich laminate has been investigated, so that the energy absorbed by the structure could be evaluated, by integrating the resulting force-displacement curve.The force-displacement curve from the FE model set with LS-DYNA shows a good agreement with experimental data (figure 11). The biggest source of error is the lack of mechanical data of the original materials.Table 4 summarizes the results of the experimental data and compares them with data from the FE model.Analytical results of the cellular core properties are also added for comparison.
Figure7 -Experimental force-displacement curves of the three samples, obtained from 3 point bending test [Tazzini A. (2014), Certification by analysis of aircraft seats: a numerical and experimental analysis to evaluate a composite made structure and a thoracic safety belt, master thesis discussed at Politecnico di Torino technical university, supervisors: Di Sciuva M., Maggiore P., Mattone M.]
Figure 8 - Averaged experimental force-displacement curves [Tazzini A. (2014), Certification by analysis of aircraft seats: a numerical and experimental analysis to evaluate a composite made structure and a thoracic safety belt, master thesis discussed at Politecnico di Torino technical university, supervisors: Di Sciuva M., Maggiore P., Mattone M.]
Table 3 - Data extrapolated from tests, with some statistically meaningful values
the smaller imperfection has been used.In order to verify the reliability of the results, an analytical comparison can be made using the formulas in [Master I.G., Evans K.E. (1996), Models for the elastic deformation of honeycombs, Journal of Composite Structures 35, 403-422, Elsevier.]. For the shear modulus, the analytical formula is corrected by considering the shear stiffness of the cells. For the axial elastic modulus the effective area of material in pure axial compression is considered. The results of the comparison are shown in table 3.
Experimental testsExperimental tests have been performed on three samples in the flight vehicle structures laboratory at the Politecnico di Torino. Three-point quasi-static bending tests have been used for these tests. The dimensions of the samples agree with the specifications of the ASTM C 393-00 standard. The testing machine used is a Comazzi 20T, where the sample rests on two steel cylinders, 140mm apart from each other. The load is applied through a third cylinder with a diameter of 25 mm, put at the middle span of the laminate. The load is applied manually and the displacement at the middle cylinder is measured by two LVDT displacement transducers, situated on the two extremities of the section at the middle span of the laminate. Their values are then averaged in order to gain a more precise value of the displacement at the middle section. In order to obtain further information from the tests, a strain gauge was placed on the center of the compressed face of each sandwich laminate. The strain gauges have then been linked to a Wheatstone bridge to obtain a measure of the strain.
The environment during the tests was monitored; the room temperature was 22° Celsius with a humidity of 52%. The samples were deflected by about 4 mm, which were the maximum stroke of the displacement transducers. However, this deformation was sufficient to produce a failure mode.
From these tests the force-displacement curves of the laminates have been obtained; they are shown in figures 7 and 8.
From the experimental test results, it is possible to extract other interesting data to compare to the numerical model. This is possible using some hand calculations based on the Timoshenko beam theory, modified for a sandwich beam according to the ASTM standard.In fact, for a sandwich beam loaded at the mid-point in 3 point
flexure, it is possible to obtain the equivalent shear modulus G of the core as
where d is the total thickness of the sandwich beam, c is the thickness of only the core, b is the width, and U is the shear stiffness of the whole laminate. This can in turn be represented as
Figure 5 - Virtual testing of the cellular core, and resulting equivalent curves
Figure 6 - Samples of the tested laminates[Tazzini A. (2014), Certification by analysis of aircraft seats: a numerical and experimental analysis to evaluate a composite made structure and a thoracic safety belt, master thesis discussed at Politecnico di Torino technical university, supervisors: Di Sciuva M., Maggiore P., Mattone M.]
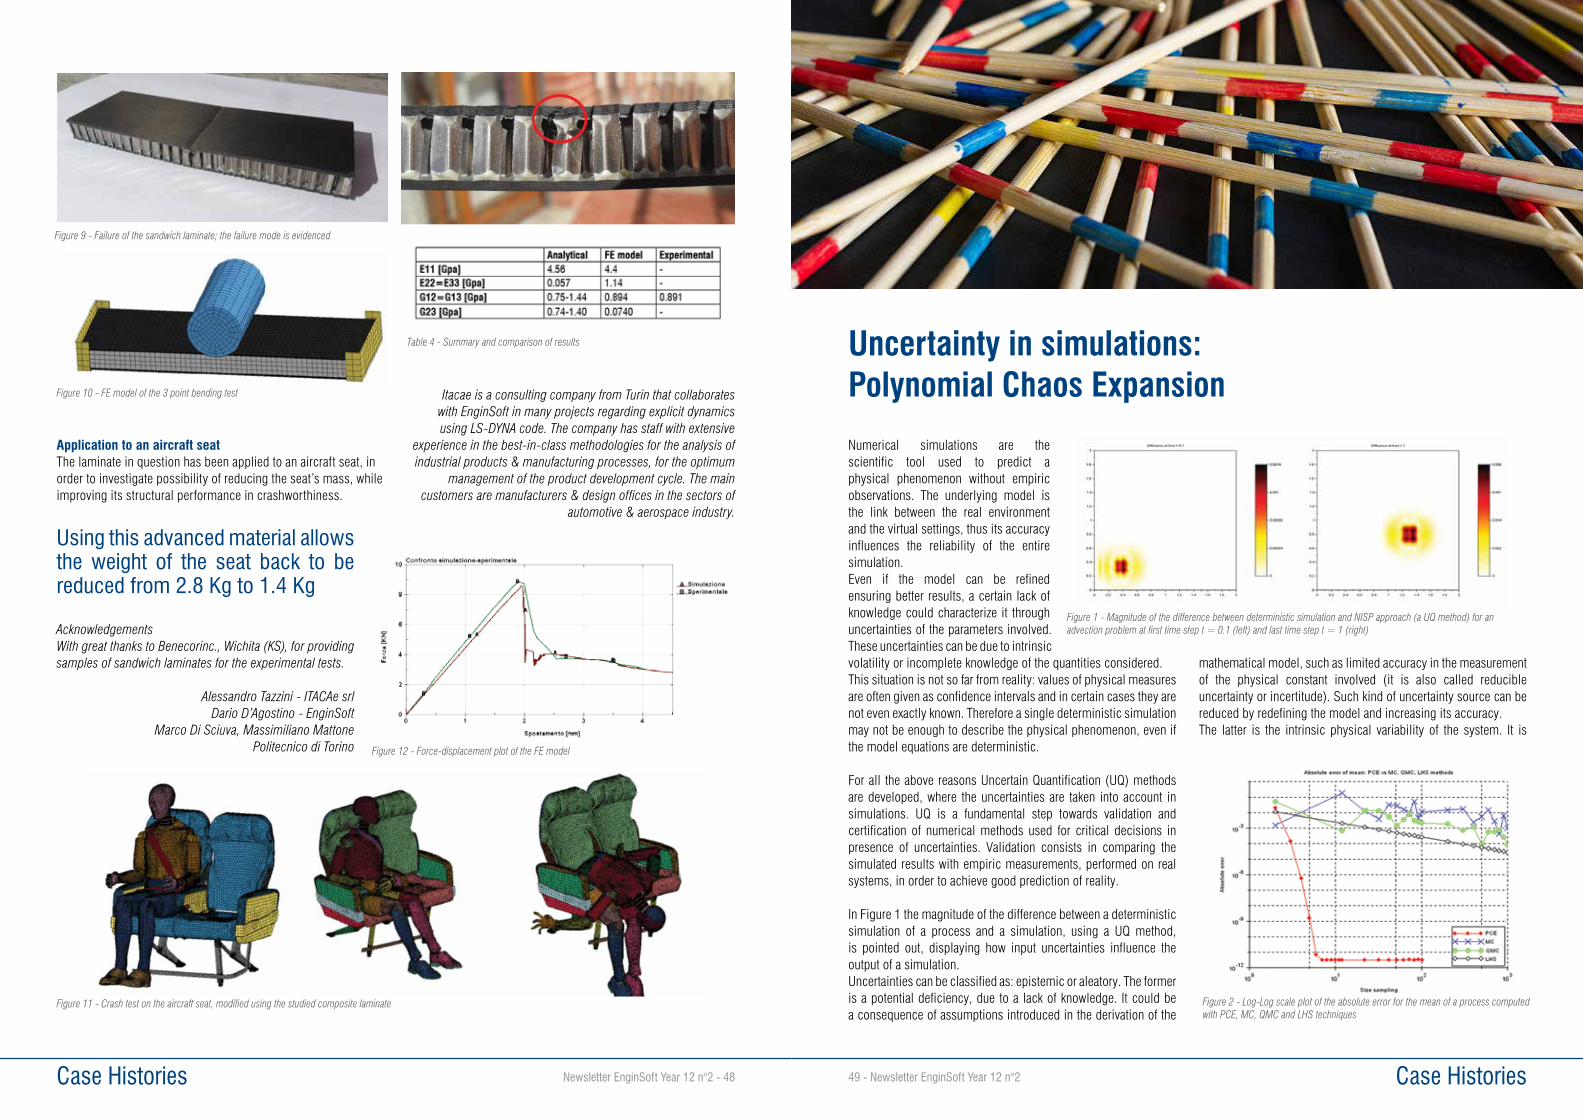
Case Histories49 - Newsletter EnginSoft Year 12 n°2 Case Histories Newsletter EnginSoft Year 12 n°2 - 48
Numerical simulations are the scientific tool used to predict a physical phenomenon without empiric observations. The underlying model is the link between the real environment and the virtual settings, thus its accuracy influences the reliability of the entire simulation.Even if the model can be refined ensuring better results, a certain lack of knowledge could characterize it through uncertainties of the parameters involved. These uncertainties can be due to intrinsic volatility or incomplete knowledge of the quantities considered.This situation is not so far from reality: values of physical measures are often given as confidence intervals and in certain cases they are not even exactly known. Therefore a single deterministic simulation may not be enough to describe the physical phenomenon, even if the model equations are deterministic.
For all the above reasons Uncertain Quantification (UQ) methods are developed, where the uncertainties are taken into account in simulations. UQ is a fundamental step towards validation and certification of numerical methods used for critical decisions in presence of uncertainties. Validation consists in comparing the simulated results with empiric measurements, performed on real systems, in order to achieve good prediction of reality.
In Figure 1 the magnitude of the difference between a deterministic simulation of a process and a simulation, using a UQ method, is pointed out, displaying how input uncertainties influence the output of a simulation.Uncertainties can be classified as: epistemic or aleatory. The former is a potential deficiency, due to a lack of knowledge. It could be a consequence of assumptions introduced in the derivation of the
mathematical model, such as limited accuracy in the measurement of the physical constant involved (it is also called reducible uncertainty or incertitude). Such kind of uncertainty source can be reduced by redefining the model and increasing its accuracy.The latter is the intrinsic physical variability of the system. It is
Uncertainty in simulations: Polynomial Chaos Expansion
Figure 1 - Magnitude of the difference between deterministic simulation and NISP approach (a UQ method) for an advection problem at first time step t = 0.1 (left) and last time step t = 1 (right)
Figure 2 - Log-Log scale plot of the absolute error for the mean of a process computed with PCE, MC, QMC and LHS techniques
Application to an aircraft seatThe laminate in question has been applied to an aircraft seat, in order to investigate possibility of reducing the seat’s mass, while improving its structural performance in crashworthiness.
Using this advanced material allows the weight of the seat back to be reduced from 2.8 Kg to 1.4 Kg
AcknowledgementsWith great thanks to Benecorinc., Wichita (KS), for providing samples of sandwich laminates for the experimental tests.
Alessandro Tazzini - ITACAe srlDario D’Agostino - EnginSoft
Marco Di Sciuva, Massimiliano Mattone Politecnico di Torino
Itacae is a consulting company from Turin that collaborates with EnginSoft in many projects regarding explicit dynamics using LS-DYNA code. The company has staff with extensive
experience in the best-in-class methodologies for the analysis of industrial products & manufacturing processes, for the optimum
management of the product development cycle. The main customers are manufacturers & design offices in the sectors of
automotive & aerospace industry.
Figure 9 - Failure of the sandwich laminate; the failure mode is evidenced
Figure 10 - FE model of the 3 point bending test
Figure 12 - Force-displacement plot of the FE model
Table 4 - Summary and comparison of results
Figure 11 - Crash test on the aircraft seat, modified using the studied composite laminate
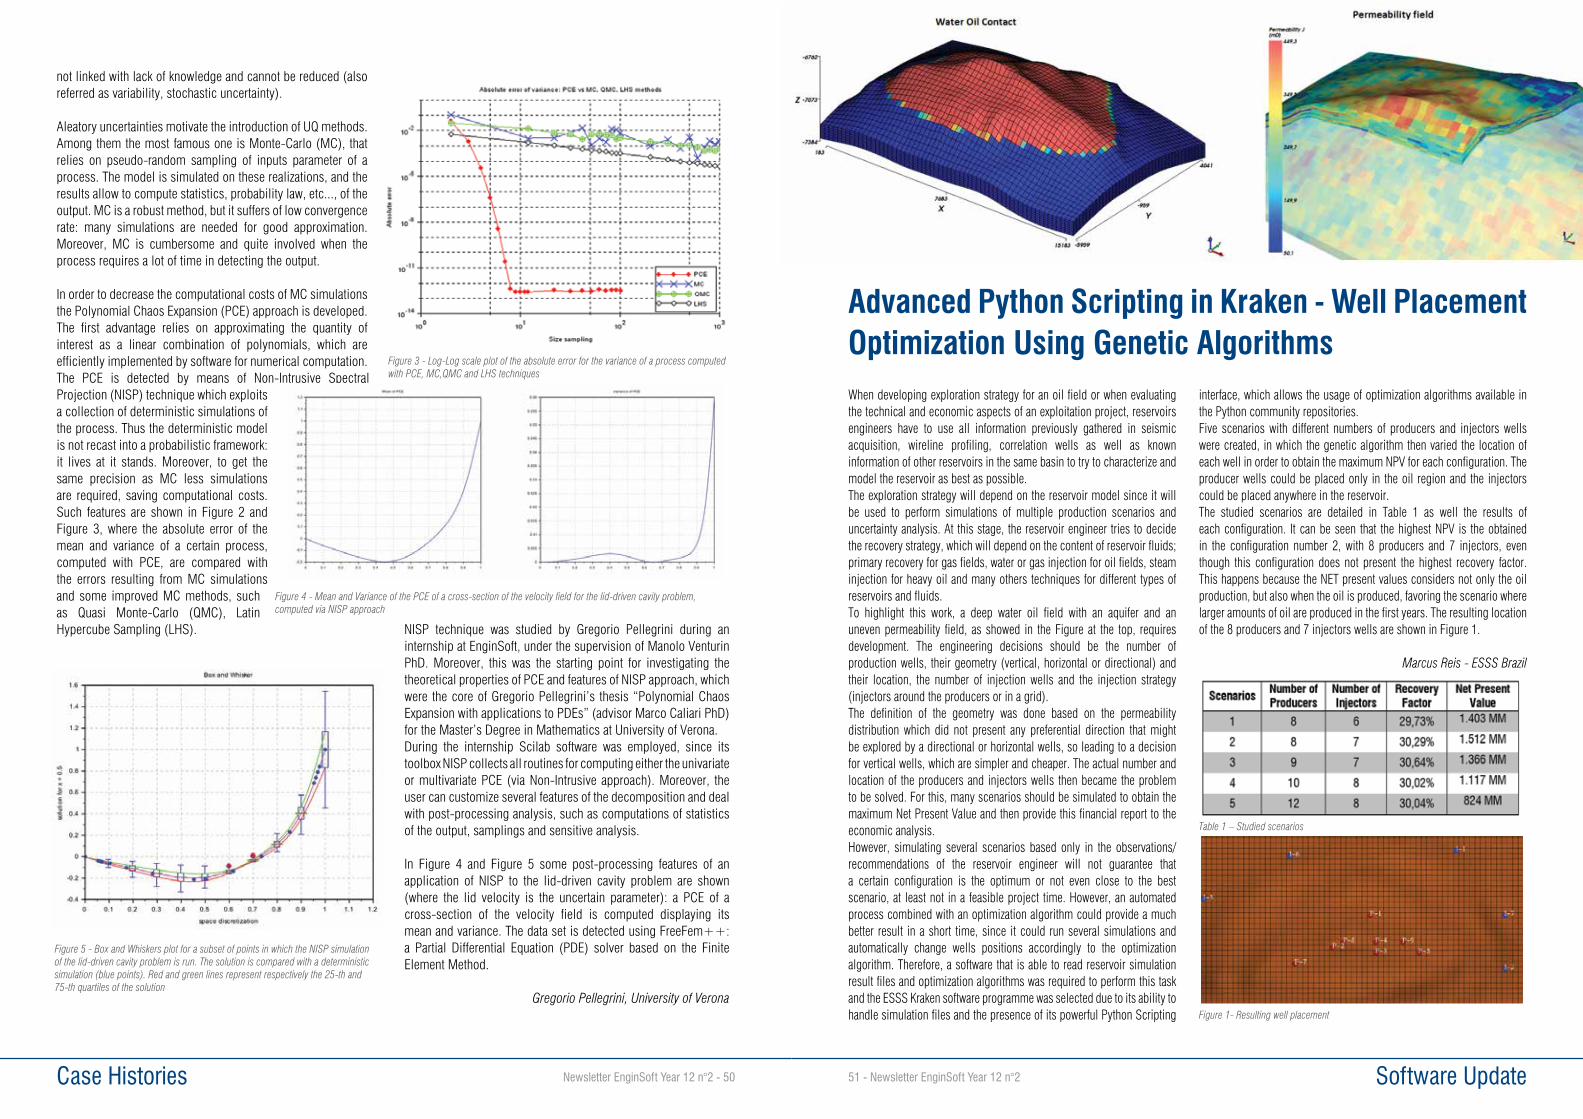
Software Update51 - Newsletter EnginSoft Year 12 n°2 Case Histories Newsletter EnginSoft Year 12 n°2 - 50
not linked with lack of knowledge and cannot be reduced (also referred as variability, stochastic uncertainty).
Aleatory uncertainties motivate the introduction of UQ methods. Among them the most famous one is Monte-Carlo (MC), that relies on pseudo-random sampling of inputs parameter of a process. The model is simulated on these realizations, and the results allow to compute statistics, probability law, etc..., of the output. MC is a robust method, but it suffers of low convergence rate: many simulations are needed for good approximation. Moreover, MC is cumbersome and quite involved when the process requires a lot of time in detecting the output. In order to decrease the computational costs of MC simulations the Polynomial Chaos Expansion (PCE) approach is developed. The first advantage relies on approximating the quantity of interest as a linear combination of polynomials, which are efficiently implemented by software for numerical computation.The PCE is detected by means of Non-Intrusive Spectral Projection (NISP) technique which exploits a collection of deterministic simulations of the process. Thus the deterministic model is not recast into a probabilistic framework: it lives at it stands. Moreover, to get the same precision as MC less simulations are required, saving computational costs. Such features are shown in Figure 2 and Figure 3, where the absolute error of the mean and variance of a certain process, computed with PCE, are compared with the errors resulting from MC simulations and some improved MC methods, such as Quasi Monte-Carlo (QMC), Latin Hypercube Sampling (LHS).
NISP technique was studied by Gregorio Pellegrini during an internship at EnginSoft, under the supervision of Manolo Venturin PhD. Moreover, this was the starting point for investigating the theoretical properties of PCE and features of NISP approach, which were the core of Gregorio Pellegrini’s thesis “Polynomial Chaos Expansion with applications to PDEs” (advisor Marco Caliari PhD) for the Master’s Degree in Mathematics at University of Verona.During the internship Scilab software was employed, since its toolbox NISP collects all routines for computing either the univariate or multivariate PCE (via Non-Intrusive approach). Moreover, the user can customize several features of the decomposition and deal with post-processing analysis, such as computations of statistics of the output, samplings and sensitive analysis.
In Figure 4 and Figure 5 some post-processing features of an application of NISP to the lid-driven cavity problem are shown (where the lid velocity is the uncertain parameter): a PCE of a cross-section of the velocity field is computed displaying its mean and variance. The data set is detected using FreeFem++: a Partial Differential Equation (PDE) solver based on the Finite Element Method.
Gregorio Pellegrini, University of Verona
Figure 3 - Log-Log scale plot of the absolute error for the variance of a process computed with PCE, MC,QMC and LHS techniques
When developing exploration strategy for an oil field or when evaluating the technical and economic aspects of an exploitation project, reservoirs engineers have to use all information previously gathered in seismic acquisition, wireline profiling, correlation wells as well as known information of other reservoirs in the same basin to try to characterize and model the reservoir as best as possible. The exploration strategy will depend on the reservoir model since it will be used to perform simulations of multiple production scenarios and uncertainty analysis. At this stage, the reservoir engineer tries to decide the recovery strategy, which will depend on the content of reservoir fluids; primary recovery for gas fields, water or gas injection for oil fields, steam injection for heavy oil and many others techniques for different types of reservoirs and fluids.To highlight this work, a deep water oil field with an aquifer and an uneven permeability field, as showed in the Figure at the top, requires development. The engineering decisions should be the number of production wells, their geometry (vertical, horizontal or directional) and their location, the number of injection wells and the injection strategy (injectors around the producers or in a grid).The definition of the geometry was done based on the permeability distribution which did not present any preferential direction that might be explored by a directional or horizontal wells, so leading to a decision for vertical wells, which are simpler and cheaper. The actual number and location of the producers and injectors wells then became the problem to be solved. For this, many scenarios should be simulated to obtain the maximum Net Present Value and then provide this financial report to the economic analysis.However, simulating several scenarios based only in the observations/recommendations of the reservoir engineer will not guarantee that a certain configuration is the optimum or not even close to the best scenario, at least not in a feasible project time. However, an automated process combined with an optimization algorithm could provide a much better result in a short time, since it could run several simulations and automatically change wells positions accordingly to the optimization algorithm. Therefore, a software that is able to read reservoir simulation result files and optimization algorithms was required to perform this task and the ESSS Kraken software programme was selected due to its ability to handle simulation files and the presence of its powerful Python Scripting
interface, which allows the usage of optimization algorithms available in the Python community repositories.Five scenarios with different numbers of producers and injectors wells were created, in which the genetic algorithm then varied the location of each well in order to obtain the maximum NPV for each configuration. The producer wells could be placed only in the oil region and the injectors could be placed anywhere in the reservoir. The studied scenarios are detailed in Table 1 as well the results of each configuration. It can be seen that the highest NPV is the obtained in the configuration number 2, with 8 producers and 7 injectors, even though this configuration does not present the highest recovery factor. This happens because the NET present values considers not only the oil production, but also when the oil is produced, favoring the scenario where larger amounts of oil are produced in the first years. The resulting location of the 8 producers and 7 injectors wells are shown in Figure 1.
Marcus Reis - ESSS Brazil
Advanced Python Scripting in Kraken - Well Placement Optimization Using Genetic Algorithms
Figure 1- Resulting well placement
Table 1 – Studied scenarios
Figure 4 - Mean and Variance of the PCE of a cross-section of the velocity field for the lid-driven cavity problem, computed via NISP approach
Figure 5 - Box and Whiskers plot for a subset of points in which the NISP simulation of the lid-driven cavity problem is run. The solution is compared with a deterministic simulation (blue points). Red and green lines represent respectively the 25-th and 75-th quartiles of the solution
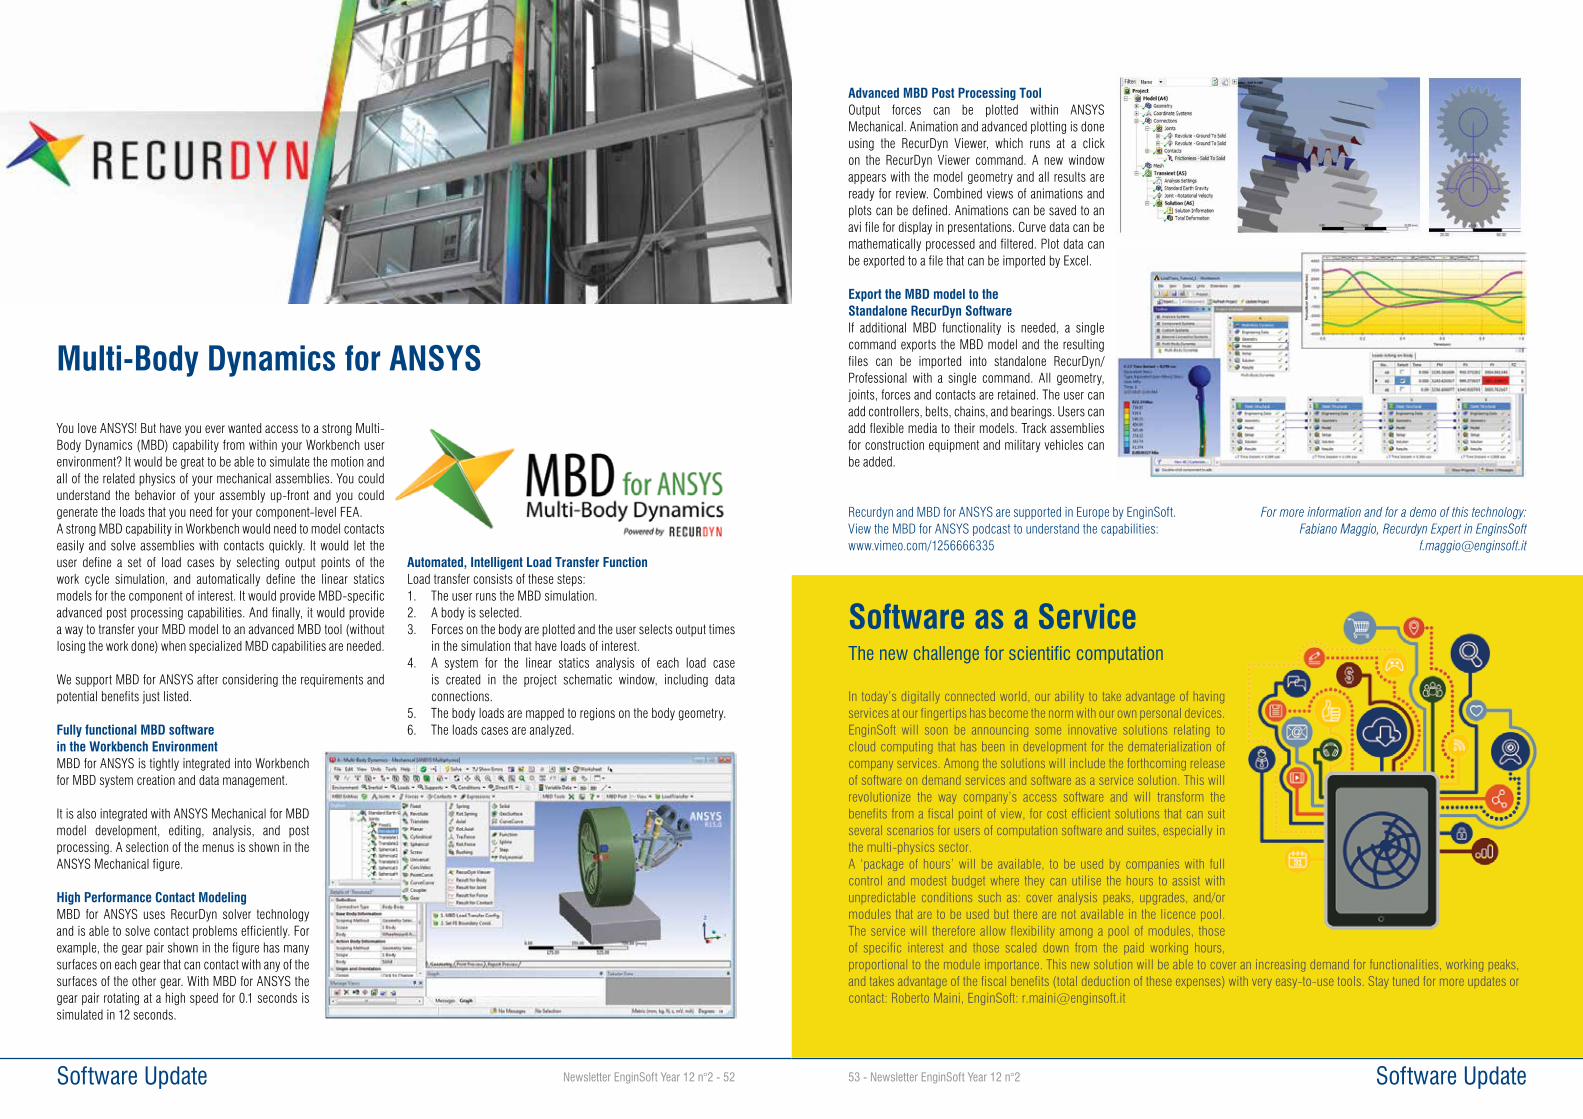
Software Update53 - Newsletter EnginSoft Year 12 n°2
Advanced MBD Post Processing ToolOutput forces can be plotted within ANSYS Mechanical. Animation and advanced plotting is done using the RecurDyn Viewer, which runs at a click on the RecurDyn Viewer command. A new window appears with the model geometry and all results are ready for review. Combined views of animations and plots can be defined. Animations can be saved to an avi file for display in presentations. Curve data can be mathematically processed and filtered. Plot data can be exported to a file that can be imported by Excel.
Export the MBD model to the Standalone RecurDyn SoftwareIf additional MBD functionality is needed, a single command exports the MBD model and the resulting files can be imported into standalone RecurDyn/Professional with a single command. All geometry, joints, forces and contacts are retained. The user can add controllers, belts, chains, and bearings. Users can add flexible media to their models. Track assemblies for construction equipment and military vehicles can be added.
Recurdyn and MBD for ANSYS are supported in Europe by EnginSoft.View the MBD for ANSYS podcast to understand the capabilities:www.vimeo.com/1256666335
For more information and for a demo of this technology:Fabiano Maggio, Recurdyn Expert in EnginsSoft
Software as a Service
In today’s digitally connected world, our ability to take advantage of having services at our fingertips has become the norm with our own personal devices.EnginSoft will soon be announcing some innovative solutions relating to cloud computing that has been in development for the dematerialization of company services. Among the solutions will include the forthcoming release of software on demand services and software as a service solution. This will revolutionize the way company’s access software and will transform the benefits from a fiscal point of view, for cost efficient solutions that can suit several scenarios for users of computation software and suites, especially in the multi-physics sector.A ‘package of hours’ will be available, to be used by companies with full control and modest budget where they can utilise the hours to assist with unpredictable conditions such as: cover analysis peaks, upgrades, and/or modules that are to be used but there are not available in the licence pool. The service will therefore allow flexibility among a pool of modules, those of specific interest and those scaled down from the paid working hours, proportional to the module importance. This new solution will be able to cover an increasing demand for functionalities, working peaks, and takes advantage of the fiscal benefits (total deduction of these expenses) with very easy-to-use tools. Stay tuned for more updates or contact: Roberto Maini, EnginSoft: [email protected]
The new challenge for scientific computation
Software Update Newsletter EnginSoft Year 12 n°2 - 52
You love ANSYS! But have you ever wanted access to a strong Multi-Body Dynamics (MBD) capability from within your Workbench user environment? It would be great to be able to simulate the motion and all of the related physics of your mechanical assemblies. You could understand the behavior of your assembly up-front and you could generate the loads that you need for your component-level FEA.A strong MBD capability in Workbench would need to model contacts easily and solve assemblies with contacts quickly. It would let the user define a set of load cases by selecting output points of the work cycle simulation, and automatically define the linear statics models for the component of interest. It would provide MBD-specific advanced post processing capabilities. And finally, it would provide a way to transfer your MBD model to an advanced MBD tool (without losing the work done) when specialized MBD capabilities are needed.
We support MBD for ANSYS after considering the requirements and potential benefits just listed.
Fully functional MBD software in the Workbench EnvironmentMBD for ANSYS is tightly integrated into Workbench for MBD system creation and data management.
It is also integrated with ANSYS Mechanical for MBD model development, editing, analysis, and post processing. A selection of the menus is shown in the ANSYS Mechanical figure.
High Performance Contact ModelingMBD for ANSYS uses RecurDyn solver technology and is able to solve contact problems efficiently. For example, the gear pair shown in the figure has many surfaces on each gear that can contact with any of the surfaces of the other gear. With MBD for ANSYS the gear pair rotating at a high speed for 0.1 seconds is simulated in 12 seconds.
Automated, Intelligent Load Transfer FunctionLoad transfer consists of these steps:1. The user runs the MBD simulation.2. A body is selected.3. Forces on the body are plotted and the user selects output times
in the simulation that have loads of interest. 4. A system for the linear statics analysis of each load case
is created in the project schematic window, including data connections.
5. The body loads are mapped to regions on the body geometry.6. The loads cases are analyzed.
Multi-Body Dynamics for ANSYS
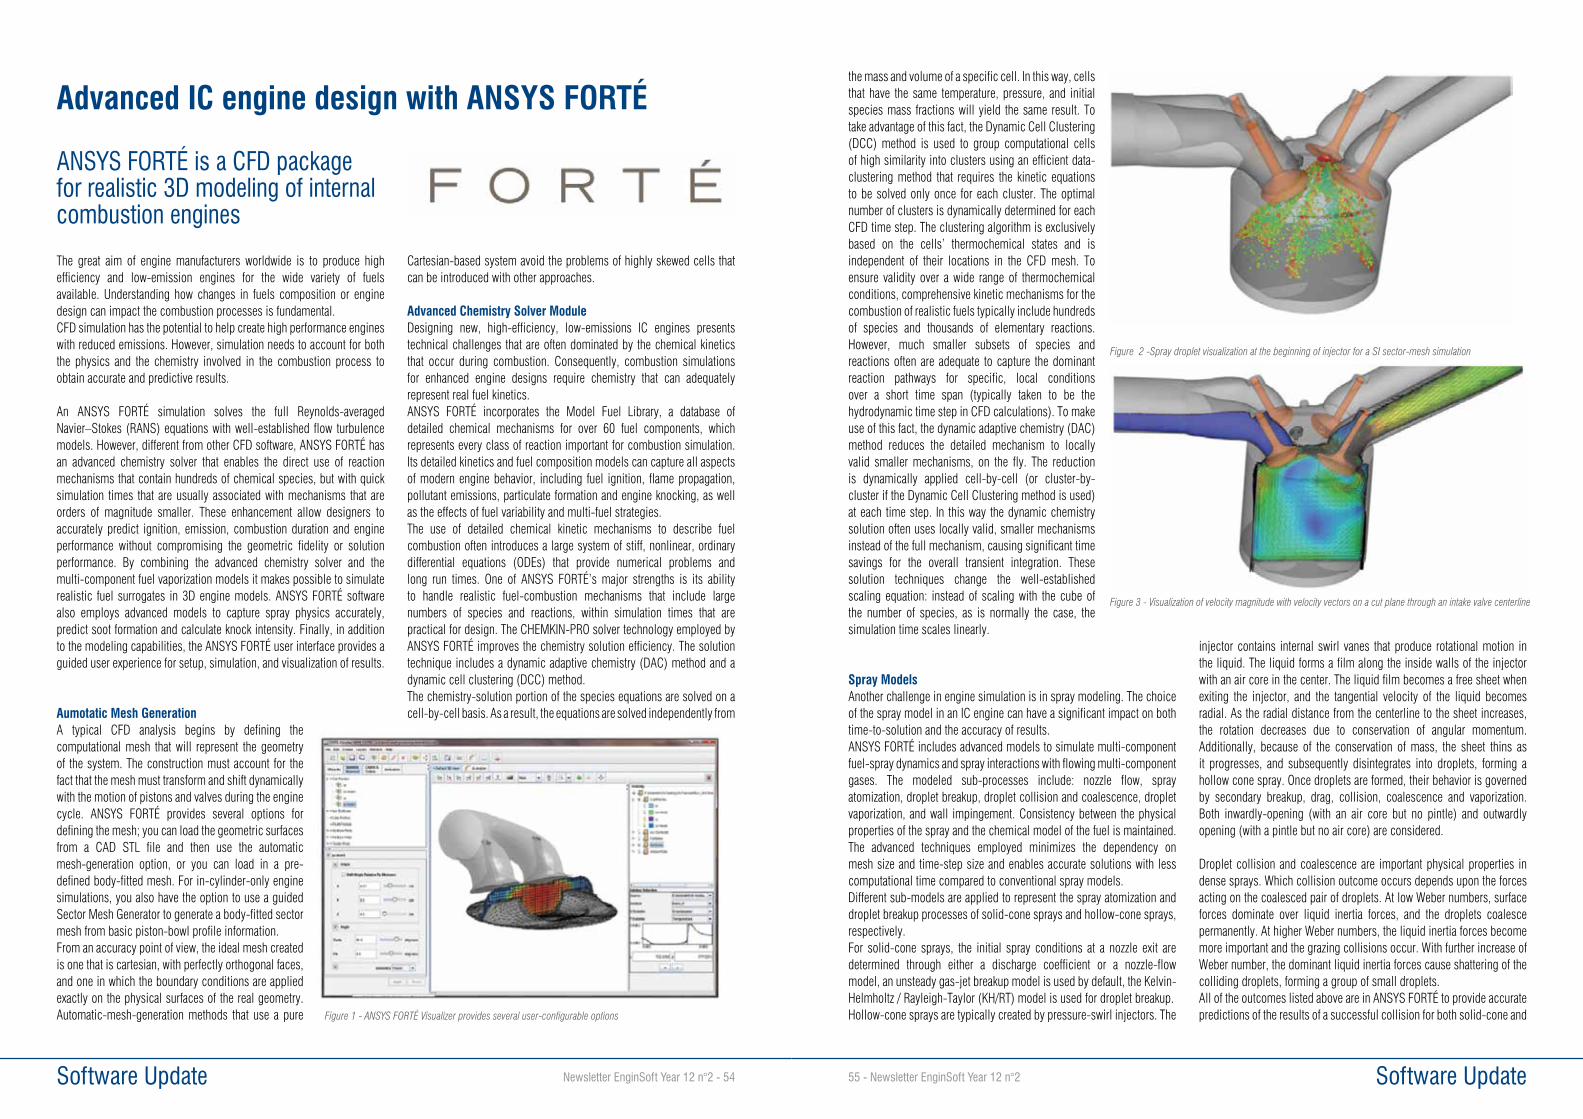
Software Update55 - Newsletter EnginSoft Year 12 n°2 Software Update Newsletter EnginSoft Year 12 n°2 - 54
the mass and volume of a specific cell. In this way, cells that have the same temperature, pressure, and initial species mass fractions will yield the same result. To take advantage of this fact, the Dynamic Cell Clustering (DCC) method is used to group computational cells of high similarity into clusters using an efficient data-clustering method that requires the kinetic equations to be solved only once for each cluster. The optimal number of clusters is dynamically determined for each CFD time step. The clustering algorithm is exclusively based on the cells’ thermochemical states and is independent of their locations in the CFD mesh. To ensure validity over a wide range of thermochemical conditions, comprehensive kinetic mechanisms for the combustion of realistic fuels typically include hundreds of species and thousands of elementary reactions. However, much smaller subsets of species and reactions often are adequate to capture the dominant reaction pathways for specific, local conditions over a short time span (typically taken to be the hydrodynamic time step in CFD calculations). To make use of this fact, the dynamic adaptive chemistry (DAC) method reduces the detailed mechanism to locally valid smaller mechanisms, on the fly. The reduction is dynamically applied cell-by-cell (or cluster-by-cluster if the Dynamic Cell Clustering method is used) at each time step. In this way the dynamic chemistry solution often uses locally valid, smaller mechanisms instead of the full mechanism, causing significant time savings for the overall transient integration. These solution techniques change the well-established scaling equation: instead of scaling with the cube of the number of species, as is normally the case, the simulation time scales linearly.
Spray ModelsAnother challenge in engine simulation is in spray modeling. The choice of the spray model in an IC engine can have a significant impact on both time-to-solution and the accuracy of results. ANSYS FORTÉ includes advanced models to simulate multi-component fuel-spray dynamics and spray interactions with flowing multi-component gases. The modeled sub-processes include: nozzle flow, spray atomization, droplet breakup, droplet collision and coalescence, droplet vaporization, and wall impingement. Consistency between the physical properties of the spray and the chemical model of the fuel is maintained. The advanced techniques employed minimizes the dependency on mesh size and time-step size and enables accurate solutions with less computational time compared to conventional spray models.Different sub-models are applied to represent the spray atomization and droplet breakup processes of solid-cone sprays and hollow-cone sprays, respectively. For solid-cone sprays, the initial spray conditions at a nozzle exit are determined through either a discharge coefficient or a nozzle-flow model, an unsteady gas-jet breakup model is used by default, the Kelvin-Helmholtz / Rayleigh-Taylor (KH/RT) model is used for droplet breakup. Hollow-cone sprays are typically created by pressure-swirl injectors. The
injector contains internal swirl vanes that produce rotational motion in the liquid. The liquid forms a film along the inside walls of the injector with an air core in the center. The liquid film becomes a free sheet when exiting the injector, and the tangential velocity of the liquid becomes radial. As the radial distance from the centerline to the sheet increases, the rotation decreases due to conservation of angular momentum. Additionally, because of the conservation of mass, the sheet thins as it progresses, and subsequently disintegrates into droplets, forming a hollow cone spray. Once droplets are formed, their behavior is governed by secondary breakup, drag, collision, coalescence and vaporization. Both inwardly-opening (with an air core but no pintle) and outwardly opening (with a pintle but no air core) are considered.
Droplet collision and coalescence are important physical properties in dense sprays. Which collision outcome occurs depends upon the forces acting on the coalesced pair of droplets. At low Weber numbers, surface forces dominate over liquid inertia forces, and the droplets coalesce permanently. At higher Weber numbers, the liquid inertia forces become more important and the grazing collisions occur. With further increase of Weber number, the dominant liquid inertia forces cause shattering of the colliding droplets, forming a group of small droplets.All of the outcomes listed above are in ANSYS FORTÉ to provide accurate predictions of the results of a successful collision for both solid-cone and
Figure 2 -Spray droplet visualization at the beginning of injector for a SI sector-mesh simulation
Figure 3 - Visualization of velocity magnitude with velocity vectors on a cut plane through an intake valve centerline
ANSYS FORTÉ is a CFD package for realistic 3D modeling of internal combustion engines
The great aim of engine manufacturers worldwide is to produce high efficiency and low-emission engines for the wide variety of fuels available. Understanding how changes in fuels composition or engine design can impact the combustion processes is fundamental. CFD simulation has the potential to help create high performance engines with reduced emissions. However, simulation needs to account for both the physics and the chemistry involved in the combustion process to obtain accurate and predictive results.
An ANSYS FORTÉ simulation solves the full Reynolds-averaged Navier–Stokes (RANS) equations with well-established flow turbulence models. However, different from other CFD software, ANSYS FORTÉ has an advanced chemistry solver that enables the direct use of reaction mechanisms that contain hundreds of chemical species, but with quick simulation times that are usually associated with mechanisms that are orders of magnitude smaller. These enhancement allow designers to accurately predict ignition, emission, combustion duration and engine performance without compromising the geometric fidelity or solution performance. By combining the advanced chemistry solver and the multi-component fuel vaporization models it makes possible to simulate realistic fuel surrogates in 3D engine models. ANSYS FORTÉ software also employs advanced models to capture spray physics accurately, predict soot formation and calculate knock intensity. Finally, in addition to the modeling capabilities, the ANSYS FORTÉ user interface provides a guided user experience for setup, simulation, and visualization of results.
Aumotatic Mesh GenerationA typical CFD analysis begins by defining the computational mesh that will represent the geometry of the system. The construction must account for the fact that the mesh must transform and shift dynamically with the motion of pistons and valves during the engine cycle. ANSYS FORTÉ provides several options for defining the mesh; you can load the geometric surfaces from a CAD STL file and then use the automatic mesh-generation option, or you can load in a pre-defined body-fitted mesh. For in-cylinder-only engine simulations, you also have the option to use a guided Sector Mesh Generator to generate a body-fitted sector mesh from basic piston-bowl profile information.From an accuracy point of view, the ideal mesh created is one that is cartesian, with perfectly orthogonal faces, and one in which the boundary conditions are applied exactly on the physical surfaces of the real geometry. Automatic-mesh-generation methods that use a pure
Cartesian-based system avoid the problems of highly skewed cells that can be introduced with other approaches.
Advanced Chemistry Solver ModuleDesigning new, high-efficiency, low-emissions IC engines presents technical challenges that are often dominated by the chemical kinetics that occur during combustion. Consequently, combustion simulations for enhanced engine designs require chemistry that can adequately represent real fuel kinetics.ANSYS FORTÉ incorporates the Model Fuel Library, a database of detailed chemical mechanisms for over 60 fuel components, which represents every class of reaction important for combustion simulation. Its detailed kinetics and fuel composition models can capture all aspects of modern engine behavior, including fuel ignition, flame propagation, pollutant emissions, particulate formation and engine knocking, as well as the effects of fuel variability and multi-fuel strategies.The use of detailed chemical kinetic mechanisms to describe fuel combustion often introduces a large system of stiff, nonlinear, ordinary differential equations (ODEs) that provide numerical problems and long run times. One of ANSYS FORTÉ’s major strengths is its ability to handle realistic fuel-combustion mechanisms that include large numbers of species and reactions, within simulation times that are practical for design. The CHEMKIN-PRO solver technology employed by ANSYS FORTÉ improves the chemistry solution efficiency. The solution technique includes a dynamic adaptive chemistry (DAC) method and a dynamic cell clustering (DCC) method.The chemistry-solution portion of the species equations are solved on a cell-by-cell basis. As a result, the equations are solved independently from
Advanced IC engine design with ANSYS FORTÉ
Figure 1 - ANSYS FORTÉ Visualizer provides several user-configurable options
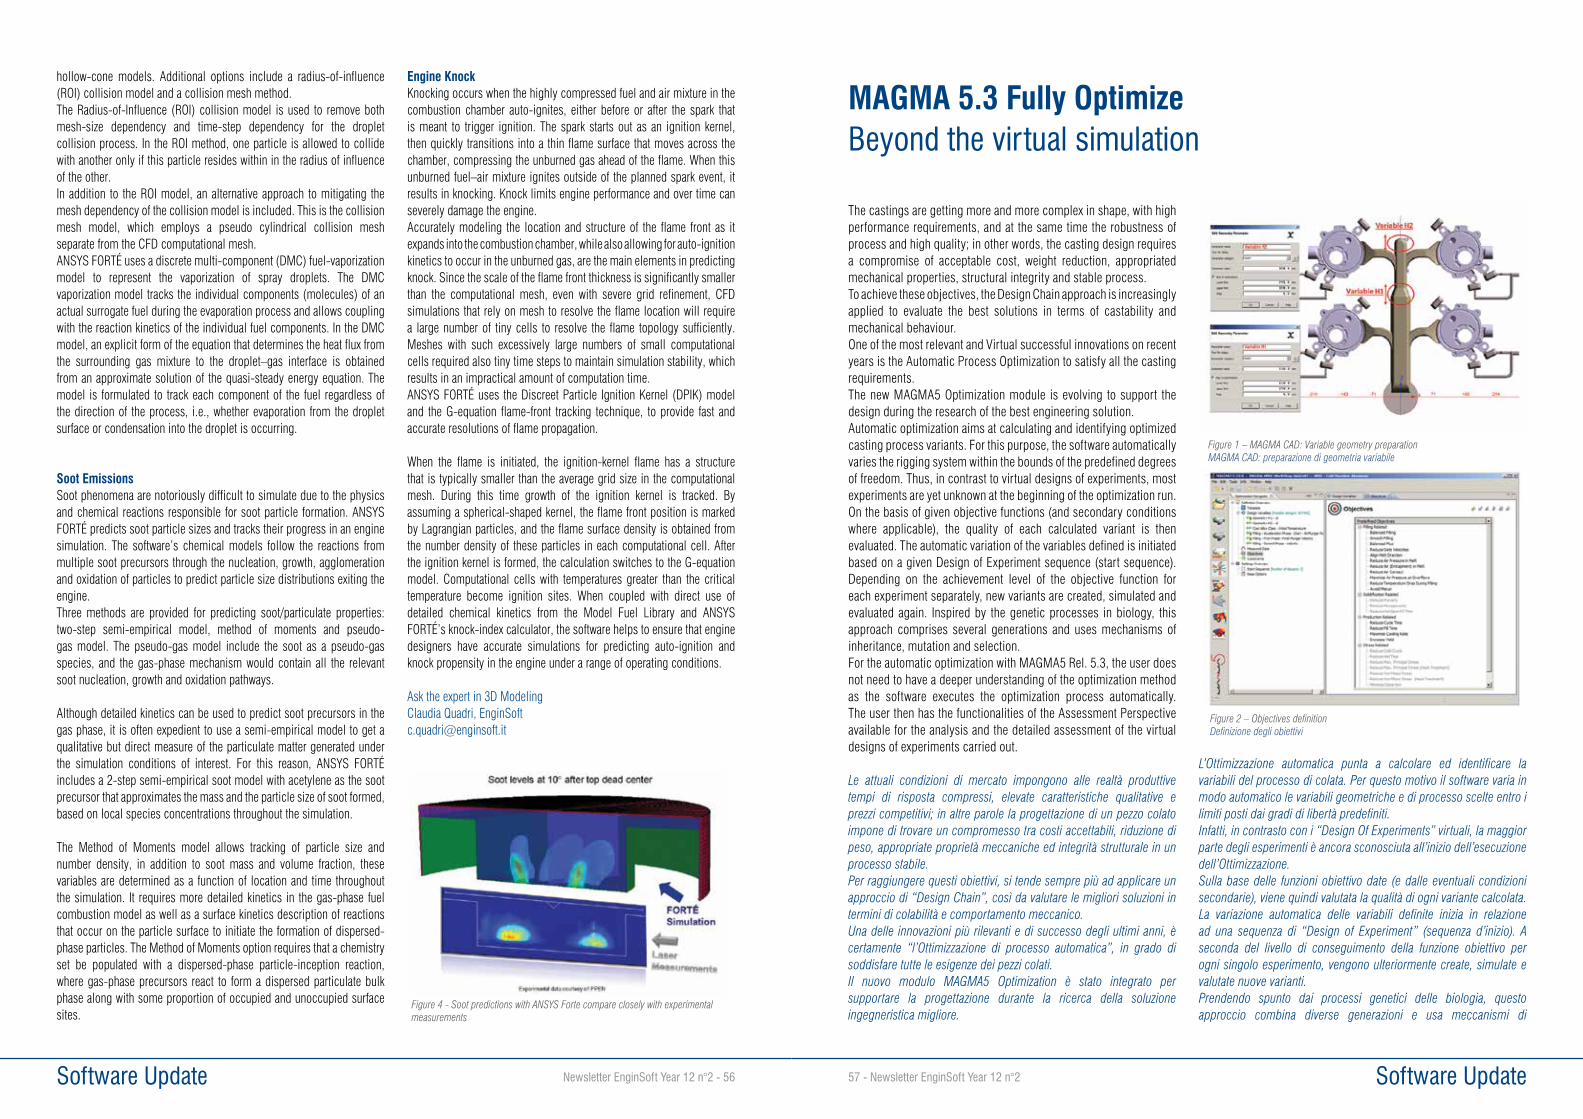
Software Update57 - Newsletter EnginSoft Year 12 n°2 Software Update Newsletter EnginSoft Year 12 n°2 - 56
The castings are getting more and more complex in shape, with high performance requirements, and at the same time the robustness of process and high quality; in other words, the casting design requires a compromise of acceptable cost, weight reduction, appropriated mechanical properties, structural integrity and stable process. To achieve these objectives, the Design Chain approach is increasingly applied to evaluate the best solutions in terms of castability and mechanical behaviour.One of the most relevant and Virtual successful innovations on recent years is the Automatic Process Optimization to satisfy all the casting requirements.The new MAGMA5 Optimization module is evolving to support the design during the research of the best engineering solution. Automatic optimization aims at calculating and identifying optimized casting process variants. For this purpose, the software automatically varies the rigging system within the bounds of the predefined degrees of freedom. Thus, in contrast to virtual designs of experiments, most experiments are yet unknown at the beginning of the optimization run.On the basis of given objective functions (and secondary conditions where applicable), the quality of each calculated variant is then evaluated. The automatic variation of the variables defined is initiated based on a given Design of Experiment sequence (start sequence). Depending on the achievement level of the objective function for each experiment separately, new variants are created, simulated and evaluated again. Inspired by the genetic processes in biology, this approach comprises several generations and uses mechanisms of inheritance, mutation and selection.For the automatic optimization with MAGMA5 Rel. 5.3, the user does not need to have a deeper understanding of the optimization method as the software executes the optimization process automatically. The user then has the functionalities of the Assessment Perspective available for the analysis and the detailed assessment of the virtual designs of experiments carried out.
Le attuali condizioni di mercato impongono alle realtà produttive tempi di risposta compressi, elevate caratteristiche qualitative e prezzi competitivi; in altre parole la progettazione di un pezzo colato impone di trovare un compromesso tra costi accettabili, riduzione di peso, appropriate proprietà meccaniche ed integrità strutturale in un processo stabile.Per raggiungere questi obiettivi, si tende sempre più ad applicare un approccio di “Design Chain”, così da valutare le migliori soluzioni in termini di colabilità e comportamento meccanico.Una delle innovazioni più rilevanti e di successo degli ultimi anni, è certamente “l’Ottimizzazione di processo automatica”, in grado di soddisfare tutte le esigenze dei pezzi colati.Il nuovo modulo MAGMA5 Optimization è stato integrato per supportare la progettazione durante la ricerca della soluzione ingegneristica migliore.
L’Ottimizzazione automatica punta a calcolare ed identificare la variabili del processo di colata. Per questo motivo il software varia in modo automatico le variabili geometriche e di processo scelte entro i limiti posti dai gradi di libertà predefiniti.Infatti, in contrasto con i “Design Of Experiments” virtuali, la maggior parte degli esperimenti è ancora sconosciuta all’inizio dell’esecuzione dell’Ottimizzazione.Sulla base delle funzioni obiettivo date (e dalle eventuali condizioni secondarie), viene quindi valutata la qualità di ogni variante calcolata. La variazione automatica delle variabili definite inizia in relazione ad una sequenza di “Design of Experiment” (sequenza d’inizio). A seconda del livello di conseguimento della funzione obiettivo per ogni singolo esperimento, vengono ulteriormente create, simulate e valutate nuove varianti.Prendendo spunto dai processi genetici delle biologia, questo approccio combina diverse generazioni e usa meccanismi di
MAGMA 5.3 Fully Optimize Beyond the virtual simulation
Figure 1 – MAGMA CAD: Variable geometry preparationMAGMA CAD: preparazione di geometria variabile
Figure 2 – Objectives definitionDefinizione degli obiettivi
hollow-cone models. Additional options include a radius-of-influence (ROI) collision model and a collision mesh method. The Radius-of-Influence (ROI) collision model is used to remove both mesh-size dependency and time-step dependency for the droplet collision process. In the ROI method, one particle is allowed to collide with another only if this particle resides within in the radius of influence of the other. In addition to the ROI model, an alternative approach to mitigating the mesh dependency of the collision model is included. This is the collision mesh model, which employs a pseudo cylindrical collision mesh separate from the CFD computational mesh. ANSYS FORTÉ uses a discrete multi-component (DMC) fuel-vaporization model to represent the vaporization of spray droplets. The DMC vaporization model tracks the individual components (molecules) of an actual surrogate fuel during the evaporation process and allows coupling with the reaction kinetics of the individual fuel components. In the DMC model, an explicit form of the equation that determines the heat flux from the surrounding gas mixture to the droplet–gas interface is obtained from an approximate solution of the quasi-steady energy equation. The model is formulated to track each component of the fuel regardless of the direction of the process, i.e., whether evaporation from the droplet surface or condensation into the droplet is occurring.
Soot Emissions Soot phenomena are notoriously difficult to simulate due to the physics and chemical reactions responsible for soot particle formation. ANSYS FORTÉ predicts soot particle sizes and tracks their progress in an engine simulation. The software’s chemical models follow the reactions from multiple soot precursors through the nucleation, growth, agglomeration and oxidation of particles to predict particle size distributions exiting the engine. Three methods are provided for predicting soot/particulate properties: two-step semi-empirical model, method of moments and pseudo-gas model. The pseudo-gas model include the soot as a pseudo-gas species, and the gas-phase mechanism would contain all the relevant soot nucleation, growth and oxidation pathways.
Although detailed kinetics can be used to predict soot precursors in the gas phase, it is often expedient to use a semi-empirical model to get a qualitative but direct measure of the particulate matter generated under the simulation conditions of interest. For this reason, ANSYS FORTÉ includes a 2-step semi-empirical soot model with acetylene as the soot precursor that approximates the mass and the particle size of soot formed, based on local species concentrations throughout the simulation.
The Method of Moments model allows tracking of particle size and number density, in addition to soot mass and volume fraction, these variables are determined as a function of location and time throughout the simulation. It requires more detailed kinetics in the gas-phase fuel combustion model as well as a surface kinetics description of reactions that occur on the particle surface to initiate the formation of dispersed-phase particles. The Method of Moments option requires that a chemistry set be populated with a dispersed-phase particle-inception reaction, where gas-phase precursors react to form a dispersed particulate bulk phase along with some proportion of occupied and unoccupied surface sites.
Engine KnockKnocking occurs when the highly compressed fuel and air mixture in the combustion chamber auto-ignites, either before or after the spark that is meant to trigger ignition. The spark starts out as an ignition kernel, then quickly transitions into a thin flame surface that moves across the chamber, compressing the unburned gas ahead of the flame. When this unburned fuel–air mixture ignites outside of the planned spark event, it results in knocking. Knock limits engine performance and over time can severely damage the engine. Accurately modeling the location and structure of the flame front as it expands into the combustion chamber, while also allowing for auto-ignition kinetics to occur in the unburned gas, are the main elements in predicting knock. Since the scale of the flame front thickness is significantly smaller than the computational mesh, even with severe grid refinement, CFD simulations that rely on mesh to resolve the flame location will require a large number of tiny cells to resolve the flame topology sufficiently. Meshes with such excessively large numbers of small computational cells required also tiny time steps to maintain simulation stability, which results in an impractical amount of computation time. ANSYS FORTÉ uses the Discreet Particle Ignition Kernel (DPIK) model and the G-equation flame-front tracking technique, to provide fast and accurate resolutions of flame propagation.
When the flame is initiated, the ignition-kernel flame has a structure that is typically smaller than the average grid size in the computational mesh. During this time growth of the ignition kernel is tracked. By assuming a spherical-shaped kernel, the flame front position is marked by Lagrangian particles, and the flame surface density is obtained from the number density of these particles in each computational cell. After the ignition kernel is formed, the calculation switches to the G-equation model. Computational cells with temperatures greater than the critical temperature become ignition sites. When coupled with direct use of detailed chemical kinetics from the Model Fuel Library and ANSYS FORTÉ’s knock-index calculator, the software helps to ensure that engine designers have accurate simulations for predicting auto-ignition and knock propensity in the engine under a range of operating conditions.
Ask the expert in 3D ModelingClaudia Quadri, [email protected]
Figure 4 - Soot predictions with ANSYS Forte compare closely with experimental measurements
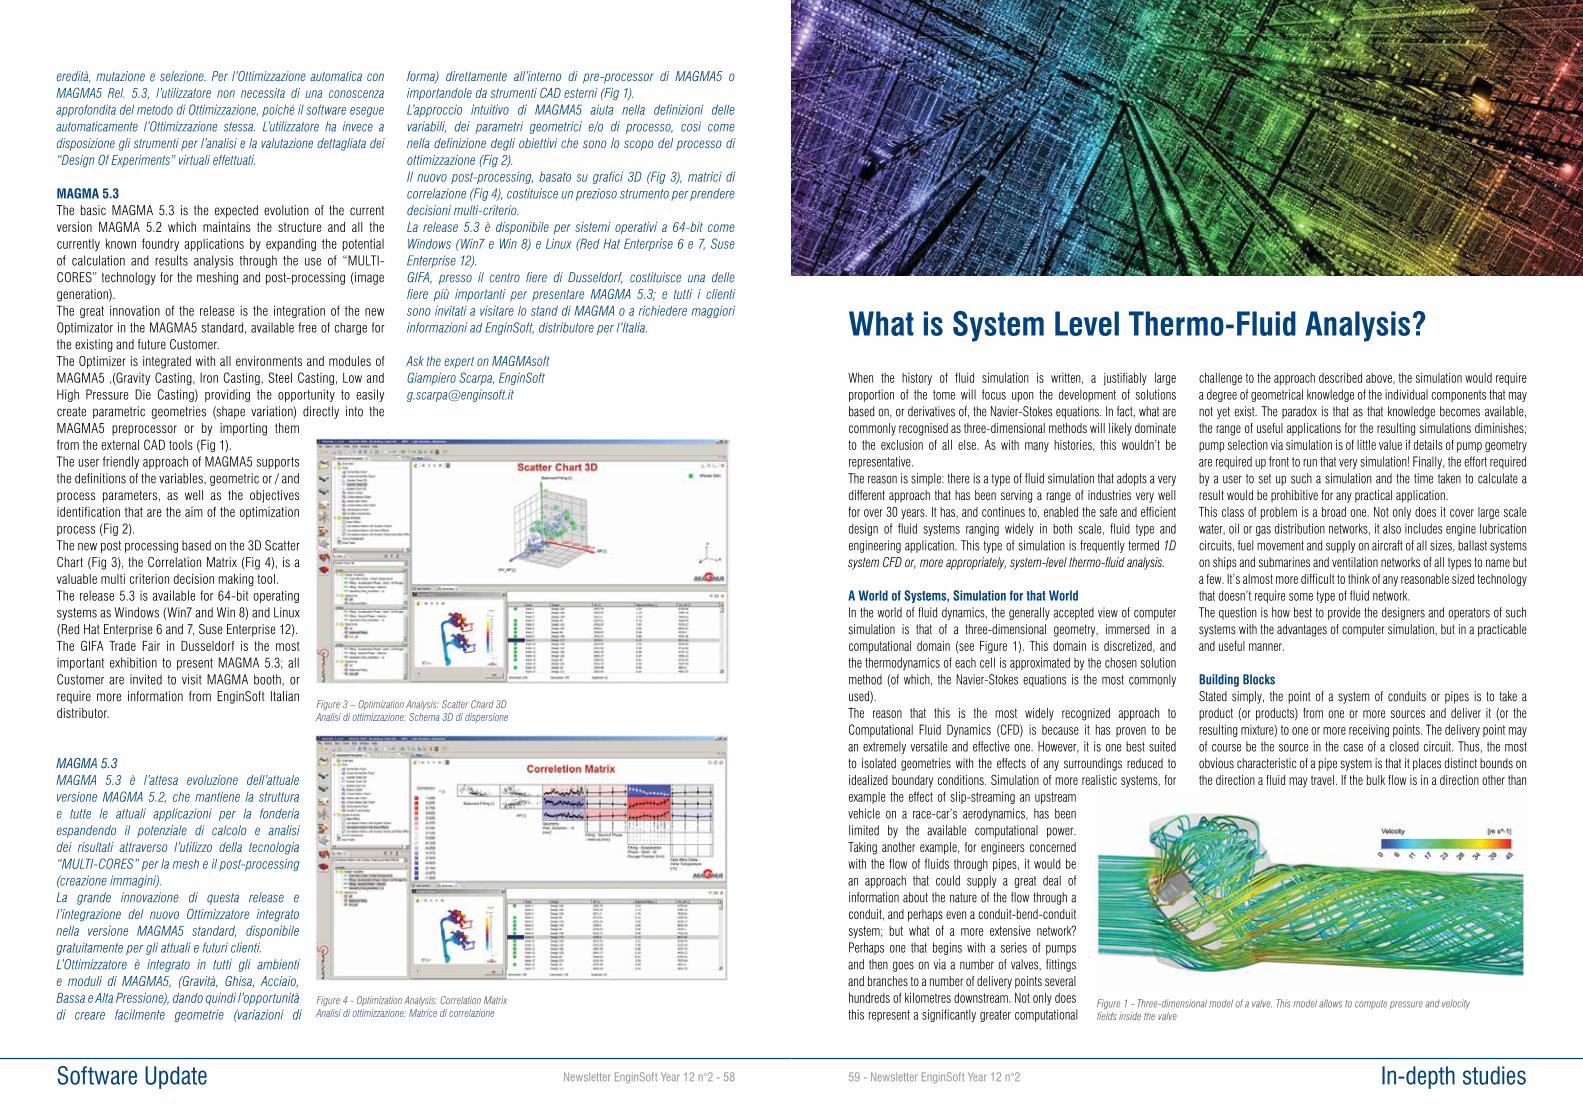
In-depth studies59 - Newsletter EnginSoft Year 12 n°2 Software Update Newsletter EnginSoft Year 12 n°2 - 58
When the history of fluid simulation is written, a justifiably large proportion of the tome will focus upon the development of solutions based on, or derivatives of, the Navier-Stokes equations. In fact, what are commonly recognised as three-dimensional methods will likely dominate to the exclusion of all else. As with many histories, this wouldn’t be representative.The reason is simple: there is a type of fluid simulation that adopts a very different approach that has been serving a range of industries very well for over 30 years. It has, and continues to, enabled the safe and efficient design of fluid systems ranging widely in both scale, fluid type and engineering application. This type of simulation is frequently termed 1D system CFD or, more appropriately, system-level thermo-fluid analysis.
A World of Systems, Simulation for that WorldIn the world of fluid dynamics, the generally accepted view of computer simulation is that of a three-dimensional geometry, immersed in a computational domain (see Figure 1). This domain is discretized, and the thermodynamics of each cell is approximated by the chosen solution method (of which, the Navier-Stokes equations is the most commonly used).The reason that this is the most widely recognized approach to Computational Fluid Dynamics (CFD) is because it has proven to be an extremely versatile and effective one. However, it is one best suited to isolated geometries with the effects of any surroundings reduced to idealized boundary conditions. Simulation of more realistic systems, for example the effect of slip-streaming an upstream vehicle on a race-car’s aerodynamics, has been limited by the available computational power. Taking another example, for engineers concerned with the flow of fluids through pipes, it would be an approach that could supply a great deal of information about the nature of the flow through a conduit, and perhaps even a conduit-bend-conduit system; but what of a more extensive network? Perhaps one that begins with a series of pumps and then goes on via a number of valves, fittings and branches to a number of delivery points several hundreds of kilometres downstream. Not only does this represent a significantly greater computational
challenge to the approach described above, the simulation would require a degree of geometrical knowledge of the individual components that may not yet exist. The paradox is that as that knowledge becomes available, the range of useful applications for the resulting simulations diminishes; pump selection via simulation is of little value if details of pump geometry are required up front to run that very simulation! Finally, the effort required by a user to set up such a simulation and the time taken to calculate a result would be prohibitive for any practical application.This class of problem is a broad one. Not only does it cover large scale water, oil or gas distribution networks, it also includes engine lubrication circuits, fuel movement and supply on aircraft of all sizes, ballast systems on ships and submarines and ventilation networks of all types to name but a few. It’s almost more difficult to think of any reasonable sized technology that doesn’t require some type of fluid network.The question is how best to provide the designers and operators of such systems with the advantages of computer simulation, but in a practicable and useful manner.
Building BlocksStated simply, the point of a system of conduits or pipes is to take a product (or products) from one or more sources and deliver it (or the resulting mixture) to one or more receiving points. The delivery point may of course be the source in the case of a closed circuit. Thus, the most obvious characteristic of a pipe system is that it places distinct bounds on the direction a fluid may travel. If the bulk flow is in a direction other than
What is System Level Thermo-Fluid Analysis?
Figure 1 - Three-dimensional model of a valve. This model allows to compute pressure and velocity fields inside the valve
eredità, mutazione e selezione. Per l’Ottimizzazione automatica con MAGMA5 Rel. 5.3, l’utilizzatore non necessita di una conoscenza approfondita del metodo di Ottimizzazione, poiché il software esegue automaticamente l’Ottimizzazione stessa. L’utilizzatore ha invece a disposizione gli strumenti per l’analisi e la valutazione dettagliata dei “Design Of Experiments” virtuali effettuati.
MAGMA 5.3The basic MAGMA 5.3 is the expected evolution of the current version MAGMA 5.2 which maintains the structure and all the currently known foundry applications by expanding the potential of calculation and results analysis through the use of “MULTI-CORES” technology for the meshing and post-processing (image generation).The great innovation of the release is the integration of the new Optimizator in the MAGMA5 standard, available free of charge for the existing and future Customer.The Optimizer is integrated with all environments and modules of MAGMA5 ,(Gravity Casting, Iron Casting, Steel Casting, Low and High Pressure Die Casting) providing the opportunity to easily create parametric geometries (shape variation) directly into the MAGMA5 preprocessor or by importing them from the external CAD tools (Fig 1).The user friendly approach of MAGMA5 supports the definitions of the variables, geometric or / and process parameters, as well as the objectives identification that are the aim of the optimization process (Fig 2).The new post processing based on the 3D Scatter Chart (Fig 3), the Correlation Matrix (Fig 4), is a valuable multi criterion decision making tool.The release 5.3 is available for 64-bit operating systems as Windows (Win7 and Win 8) and Linux (Red Hat Enterprise 6 and 7, Suse Enterprise 12).The GIFA Trade Fair in Dusseldorf is the most important exhibition to present MAGMA 5.3; all Customer are invited to visit MAGMA booth, or require more information from EnginSoft Italian distributor.
MAGMA 5.3MAGMA 5.3 è l’attesa evoluzione dell’attuale versione MAGMA 5.2, che mantiene la struttura e tutte le attuali applicazioni per la fonderia espandendo il potenziale di calcolo e analisi dei risultati attraverso l’utilizzo della tecnologia “MULTI-CORES” per la mesh e il post-processing (creazione immagini).La grande innovazione di questa release e l’integrazione del nuovo Ottimizzatore integrato nella versione MAGMA5 standard, disponibile gratuitamente per gli attuali e futuri clienti. L’Ottimizzatore è integrato in tutti gli ambienti e moduli di MAGMA5, (Gravità, Ghisa, Acciaio, Bassa e Alta Pressione), dando quindi l’opportunità di creare facilmente geometrie (variazioni di
forma) direttamente all’interno di pre-processor di MAGMA5 o importandole da strumenti CAD esterni (Fig 1).L’approccio intuitivo di MAGMA5 aiuta nella definizioni delle variabili, dei parametri geometrici e/o di processo, così come nella definizione degli obiettivi che sono lo scopo del processo di ottimizzazione (Fig 2).Il nuovo post-processing, basato su grafici 3D (Fig 3), matrici di correlazione (Fig 4), costituisce un prezioso strumento per prendere decisioni multi-criterio. La release 5.3 è disponibile per sistemi operativi a 64-bit come Windows (Win7 e Win 8) e Linux (Red Hat Enterprise 6 e 7, Suse Enterprise 12).GIFA, presso il centro fiere di Dusseldorf, costituisce una delle fiere più importanti per presentare MAGMA 5.3; e tutti i clienti sono invitati a visitare lo stand di MAGMA o a richiedere maggiori informazioni ad EnginSoft, distributore per l’Italia.
Ask the expert on MAGMAsoftGiampiero Scarpa, [email protected]
Figure 4 - Optimization Analysis: Correlation MatrixAnalisi di ottimizzazione: Matrice di correlazione
Figure 3 – Optimization Analysis: Scatter Chard 3DAnalisi di ottimizzazione: Schema 3D di dispersione
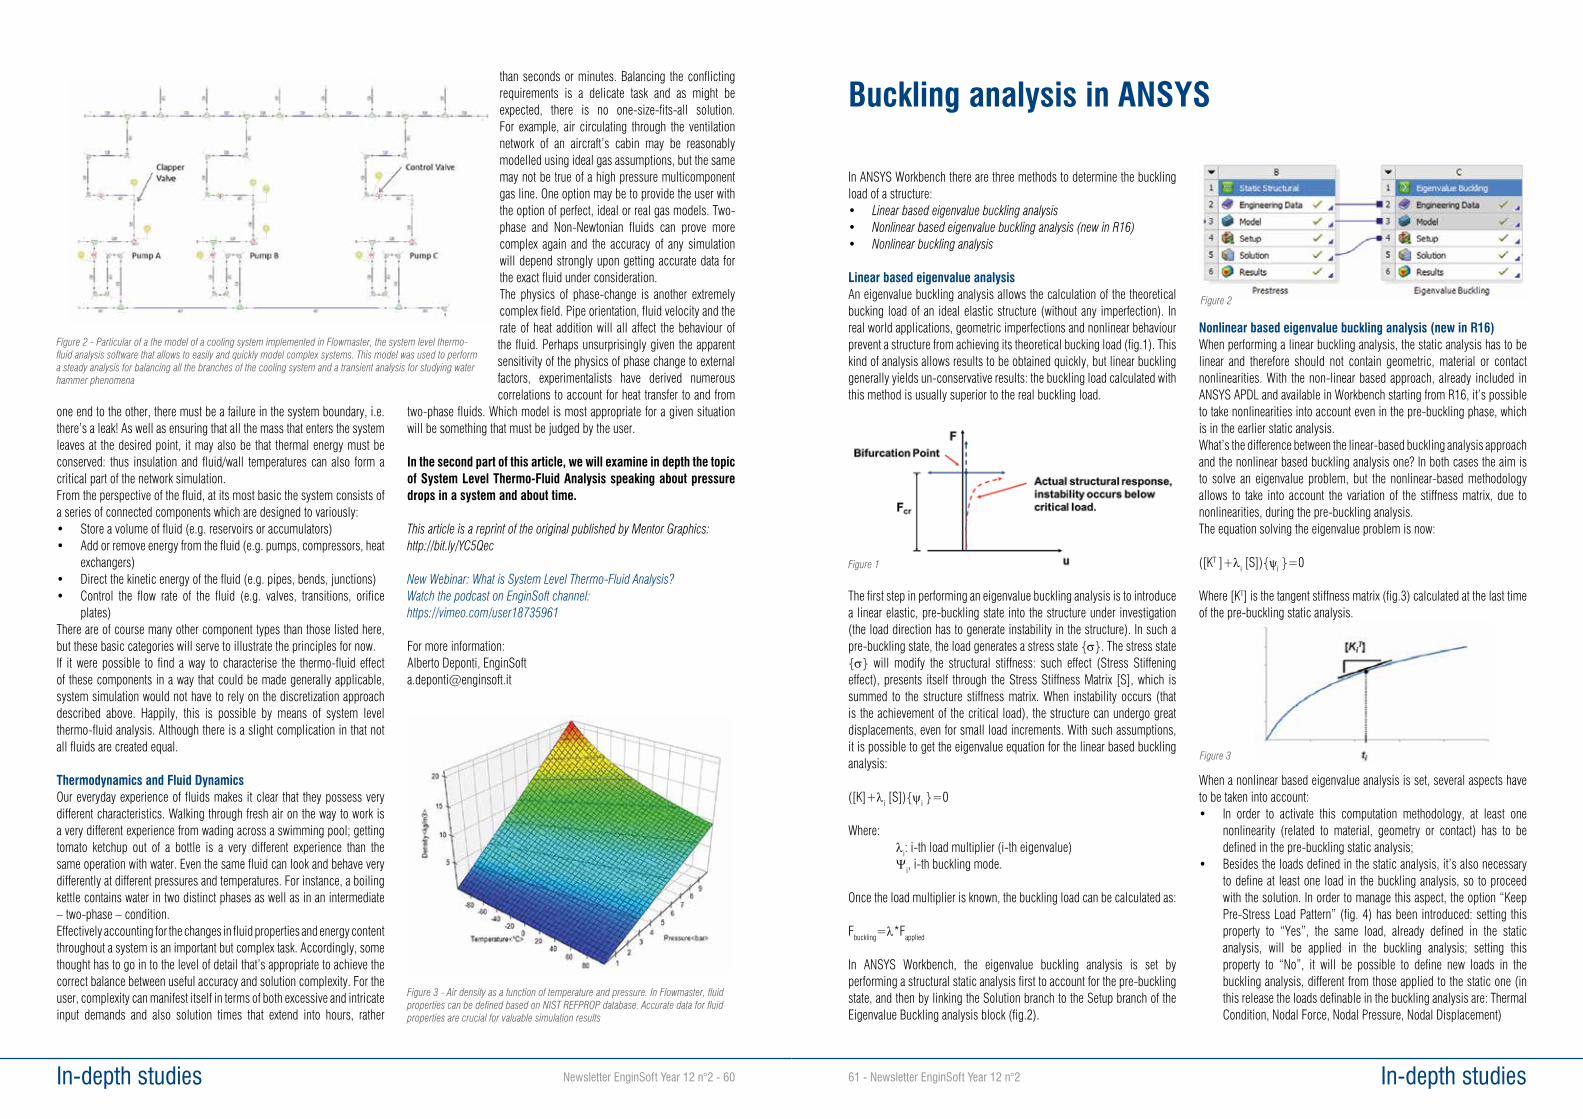
In-depth studies61 - Newsletter EnginSoft Year 12 n°2 In-depth studies Newsletter EnginSoft Year 12 n°2 - 60
one end to the other, there must be a failure in the system boundary, i.e. there’s a leak! As well as ensuring that all the mass that enters the system leaves at the desired point, it may also be that thermal energy must be conserved: thus insulation and fluid/wall temperatures can also form a critical part of the network simulation.From the perspective of the fluid, at its most basic the system consists of a series of connected components which are designed to variously:• Store a volume of fluid (e.g. reservoirs or accumulators)• Add or remove energy from the fluid (e.g. pumps, compressors, heat
exchangers)• Direct the kinetic energy of the fluid (e.g. pipes, bends, junctions)• Control the flow rate of the fluid (e.g. valves, transitions, orifice
plates)There are of course many other component types than those listed here, but these basic categories will serve to illustrate the principles for now.If it were possible to find a way to characterise the thermo-fluid effect of these components in a way that could be made generally applicable, system simulation would not have to rely on the discretization approach described above. Happily, this is possible by means of system level thermo-fluid analysis. Although there is a slight complication in that not all fluids are created equal.
Thermodynamics and Fluid DynamicsOur everyday experience of fluids makes it clear that they possess very different characteristics. Walking through fresh air on the way to work is a very different experience from wading across a swimming pool; getting tomato ketchup out of a bottle is a very different experience than the same operation with water. Even the same fluid can look and behave very differently at different pressures and temperatures. For instance, a boiling kettle contains water in two distinct phases as well as in an intermediate – two-phase – condition.Effectively accounting for the changes in fluid properties and energy content throughout a system is an important but complex task. Accordingly, some thought has to go in to the level of detail that’s appropriate to achieve the correct balance between useful accuracy and solution complexity. For the user, complexity can manifest itself in terms of both excessive and intricate input demands and also solution times that extend into hours, rather
than seconds or minutes. Balancing the conflicting requirements is a delicate task and as might be expected, there is no one-size-fits-all solution. For example, air circulating through the ventilation network of an aircraft’s cabin may be reasonably modelled using ideal gas assumptions, but the same may not be true of a high pressure multicomponent gas line. One option may be to provide the user with the option of perfect, ideal or real gas models. Two-phase and Non-Newtonian fluids can prove more complex again and the accuracy of any simulation will depend strongly upon getting accurate data for the exact fluid under consideration.The physics of phase-change is another extremely complex field. Pipe orientation, fluid velocity and the rate of heat addition will all affect the behaviour of the fluid. Perhaps unsurprisingly given the apparent sensitivity of the physics of phase change to external factors, experimentalists have derived numerous correlations to account for heat transfer to and from
two-phase fluids. Which model is most appropriate for a given situation will be something that must be judged by the user.
In the second part of this article, we will examine in depth the topic of System Level Thermo-Fluid Analysis speaking about pressure drops in a system and about time.
This article is a reprint of the original published by Mentor Graphics: http://bit.ly/YC5Qec
New Webinar: What is System Level Thermo-Fluid Analysis?Watch the podcast on EnginSoft channel: https://vimeo.com/user18735961
For more information:Alberto Deponti, [email protected]
Figure 3 - Air density as a function of temperature and pressure. In Flowmaster, fluid properties can be defined based on NIST REFPROP database. Accurate data for fluid properties are crucial for valuable simulation results
In ANSYS Workbench there are three methods to determine the buckling load of a structure:• Linear based eigenvalue buckling analysis• Nonlinear based eigenvalue buckling analysis (new in R16)• Nonlinear buckling analysis
Linear based eigenvalue analysisAn eigenvalue buckling analysis allows the calculation of the theoretical bucking load of an ideal elastic structure (without any imperfection). In real world applications, geometric imperfections and nonlinear behaviour prevent a structure from achieving its theoretical bucking load (fig.1). This kind of analysis allows results to be obtained quickly, but linear buckling generally yields un-conservative results: the buckling load calculated with this method is usually superior to the real buckling load.
The first step in performing an eigenvalue buckling analysis is to introduce a linear elastic, pre-buckling state into the structure under investigation (the load direction has to generate instability in the structure). In such a pre-buckling state, the load generates a stress state {s}. The stress state {s} will modify the structural stiffness: such effect (Stress Stiffening effect), presents itself through the Stress Stiffness Matrix [S], which is summed to the structure stiffness matrix. When instability occurs (that is the achievement of the critical load), the structure can undergo great displacements, even for small load increments. With such assumptions, it is possible to get the eigenvalue equation for the linear based buckling analysis:
([K]+λi [S]){ψi }=0
Where: λi: i-th load multiplier (i-th eigenvalue) Ψi, i-th buckling mode.
Once the load multiplier is known, the buckling load can be calculated as:
Fbuckling=λ*Fapplied
In ANSYS Workbench, the eigenvalue buckling analysis is set by performing a structural static analysis first to account for the pre-buckling state, and then by linking the Solution branch to the Setup branch of the Eigenvalue Buckling analysis block (fig.2).
Nonlinear based eigenvalue buckling analysis (new in R16)When performing a linear buckling analysis, the static analysis has to be linear and therefore should not contain geometric, material or contact nonlinearities. With the non-linear based approach, already included in ANSYS APDL and available in Workbench starting from R16, it’s possible to take nonlinearities into account even in the pre-buckling phase, which is in the earlier static analysis.What’s the difference between the linear-based buckling analysis approach and the nonlinear based buckling analysis one? In both cases the aim is to solve an eigenvalue problem, but the nonlinear-based methodology allows to take into account the variation of the stiffness matrix, due to nonlinearities, during the pre-buckling analysis. The equation solving the eigenvalue problem is now:
([KT ]+λi [S]){ψi }=0
Where [KT] is the tangent stiffness matrix (fig.3) calculated at the last time of the pre-buckling static analysis.
When a nonlinear based eigenvalue analysis is set, several aspects have to be taken into account:• In order to activate this computation methodology, at least one
nonlinearity (related to material, geometry or contact) has to be defined in the pre-buckling static analysis;
• Besides the loads defined in the static analysis, it’s also necessary to define at least one load in the buckling analysis, so to proceed with the solution. In order to manage this aspect, the option “Keep Pre-Stress Load Pattern” (fig. 4) has been introduced: setting this property to “Yes”, the same load, already defined in the static analysis, will be applied in the buckling analysis; setting this property to “No”, it will be possible to define new loads in the buckling analysis, different from those applied to the static one (in this release the loads definable in the buckling analysis are: Thermal Condition, Nodal Force, Nodal Pressure, Nodal Displacement)
Buckling analysis in ANSYS
Figure 1
Figure 2
Figure 3
Figure 2 - Particular of a the model of a cooling system implemented in Flowmaster, the system level thermo-fluid analysis software that allows to easily and quickly model complex systems. This model was used to perform a steady analysis for balancing all the branches of the cooling system and a transient analysis for studying water hammer phenomena
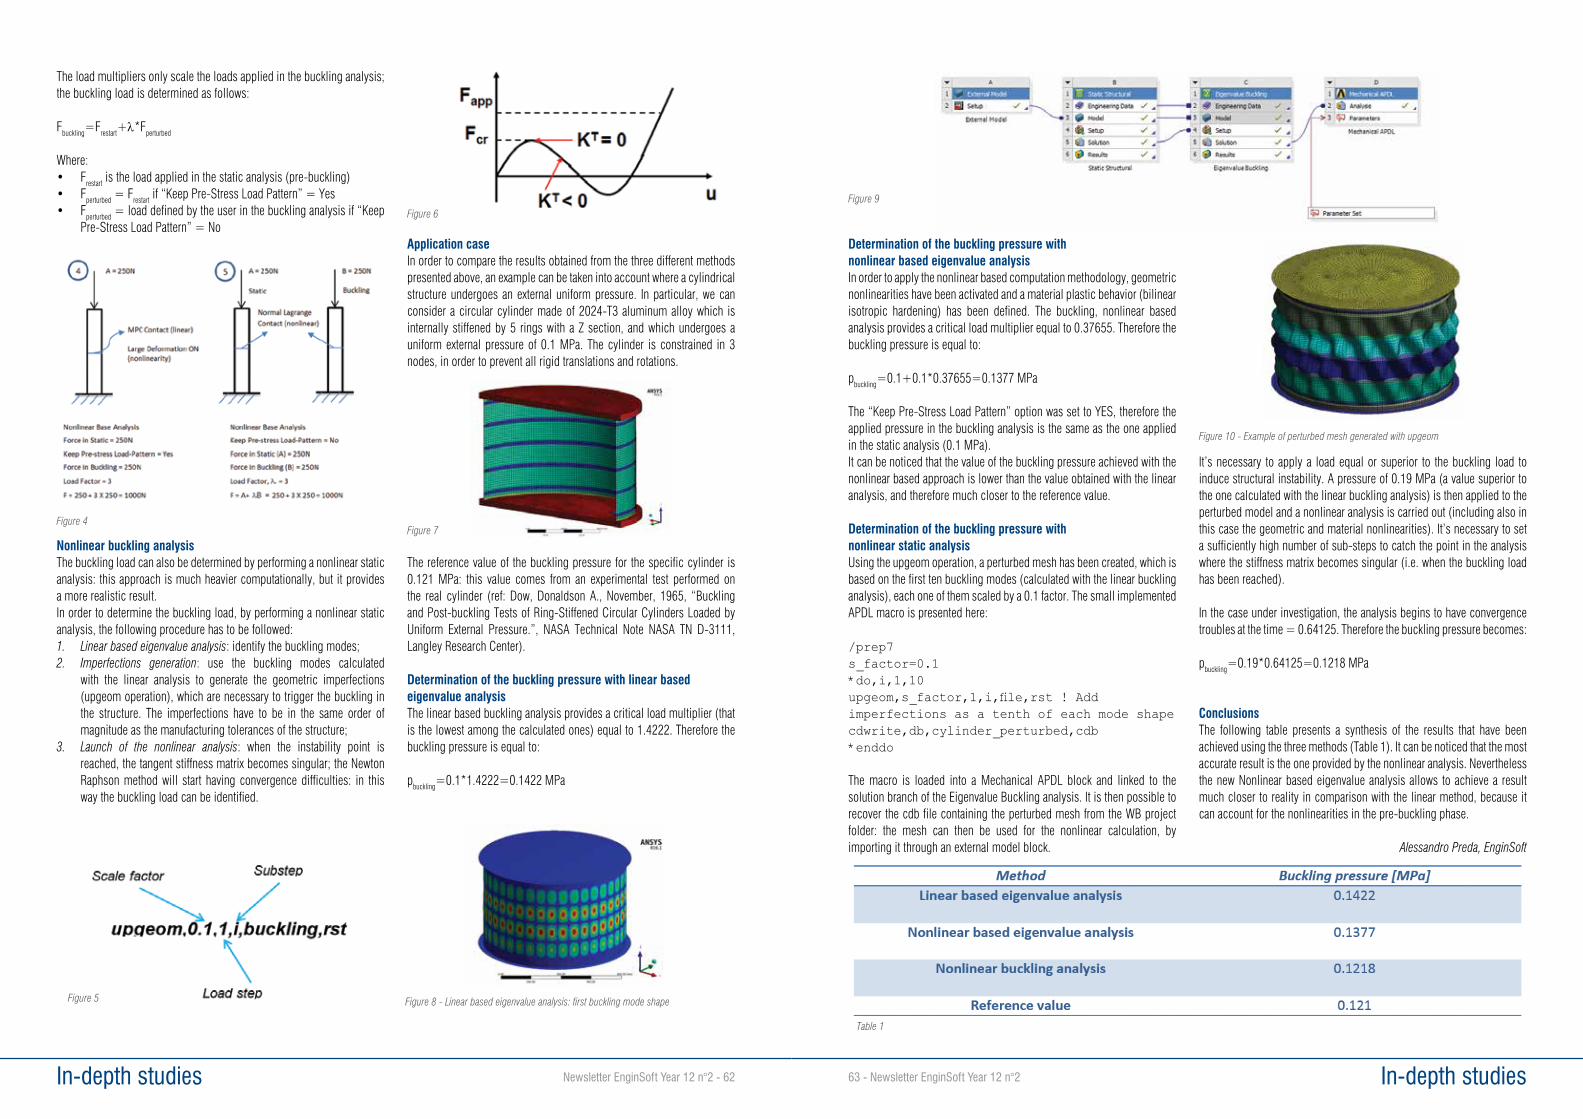
In-depth studies63 - Newsletter EnginSoft Year 12 n°2 In-depth studies Newsletter EnginSoft Year 12 n°2 - 62
Determination of the buckling pressure with nonlinear based eigenvalue analysisIn order to apply the nonlinear based computation methodology, geometric nonlinearities have been activated and a material plastic behavior (bilinear isotropic hardening) has been defined. The buckling, nonlinear based analysis provides a critical load multiplier equal to 0.37655. Therefore the buckling pressure is equal to:
pbuckling=0.1+0.1*0.37655=0.1377 MPa
The “Keep Pre-Stress Load Pattern” option was set to YES, therefore the applied pressure in the buckling analysis is the same as the one applied in the static analysis (0.1 MPa).It can be noticed that the value of the buckling pressure achieved with the nonlinear based approach is lower than the value obtained with the linear analysis, and therefore much closer to the reference value.
Determination of the buckling pressure with nonlinear static analysis Using the upgeom operation, a perturbed mesh has been created, which is based on the first ten buckling modes (calculated with the linear buckling analysis), each one of them scaled by a 0.1 factor. The small implemented APDL macro is presented here:
/prep7s_factor=0.1*do,i,1,10upgeom,s_factor,1,i,file,rst ! Add imperfections as a tenth of each mode shapecdwrite,db,cylinder_perturbed,cdb*enddo
The macro is loaded into a Mechanical APDL block and linked to the solution branch of the Eigenvalue Buckling analysis. It is then possible to recover the cdb file containing the perturbed mesh from the WB project folder: the mesh can then be used for the nonlinear calculation, by importing it through an external model block.
It’s necessary to apply a load equal or superior to the buckling load to induce structural instability. A pressure of 0.19 MPa (a value superior to the one calculated with the linear buckling analysis) is then applied to the perturbed model and a nonlinear analysis is carried out (including also in this case the geometric and material nonlinearities). It’s necessary to set a sufficiently high number of sub-steps to catch the point in the analysis where the stiffness matrix becomes singular (i.e. when the buckling load has been reached).
In the case under investigation, the analysis begins to have convergence troubles at the time = 0.64125. Therefore the buckling pressure becomes:
pbuckling=0.19*0.64125=0.1218 MPa
ConclusionsThe following table presents a synthesis of the results that have been achieved using the three methods (Table 1). It can be noticed that the most accurate result is the one provided by the nonlinear analysis. Nevertheless the new Nonlinear based eigenvalue analysis allows to achieve a result much closer to reality in comparison with the linear method, because it can account for the nonlinearities in the pre-buckling phase.
Alessandro Preda, EnginSoft
The load multipliers only scale the loads applied in the buckling analysis; the buckling load is determined as follows:
Fbuckling=Frestart+λ*Fperturbed
Where:• Frestart is the load applied in the static analysis (pre-buckling)• Fperturbed = Frestart if “Keep Pre-Stress Load Pattern” = Yes• Fperturbed = load defined by the user in the buckling analysis if “Keep
Pre-Stress Load Pattern” = No
Nonlinear buckling analysisThe buckling load can also be determined by performing a nonlinear static analysis: this approach is much heavier computationally, but it provides a more realistic result.In order to determine the buckling load, by performing a nonlinear static analysis, the following procedure has to be followed:1. Linear based eigenvalue analysis: identify the buckling modes;2. Imperfections generation: use the buckling modes calculated
with the linear analysis to generate the geometric imperfections (upgeom operation), which are necessary to trigger the buckling in the structure. The imperfections have to be in the same order of magnitude as the manufacturing tolerances of the structure;
3. Launch of the nonlinear analysis: when the instability point is reached, the tangent stiffness matrix becomes singular; the Newton Raphson method will start having convergence difficulties: in this way the buckling load can be identified.
Application caseIn order to compare the results obtained from the three different methods presented above, an example can be taken into account where a cylindrical structure undergoes an external uniform pressure. In particular, we can consider a circular cylinder made of 2024-T3 aluminum alloy which is internally stiffened by 5 rings with a Z section, and which undergoes a uniform external pressure of 0.1 MPa. The cylinder is constrained in 3 nodes, in order to prevent all rigid translations and rotations.
The reference value of the buckling pressure for the specific cylinder is 0.121 MPa: this value comes from an experimental test performed on the real cylinder (ref: Dow, Donaldson A., November, 1965, “Buckling and Post-buckling Tests of Ring-Stiffened Circular Cylinders Loaded by Uniform External Pressure.”, NASA Technical Note NASA TN D-3111, Langley Research Center).
Determination of the buckling pressure with linear based eigenvalue analysisThe linear based buckling analysis provides a critical load multiplier (that is the lowest among the calculated ones) equal to 1.4222. Therefore the buckling pressure is equal to:
pbuckling=0.1*1.4222=0.1422 MPa
Figure 4
Figure 5
Figure 6
Figure 7
Figure 8 - Linear based eigenvalue analysis: first buckling mode shape
Figure 9
Figure 10 - Example of perturbed mesh generated with upgeom
Table 1
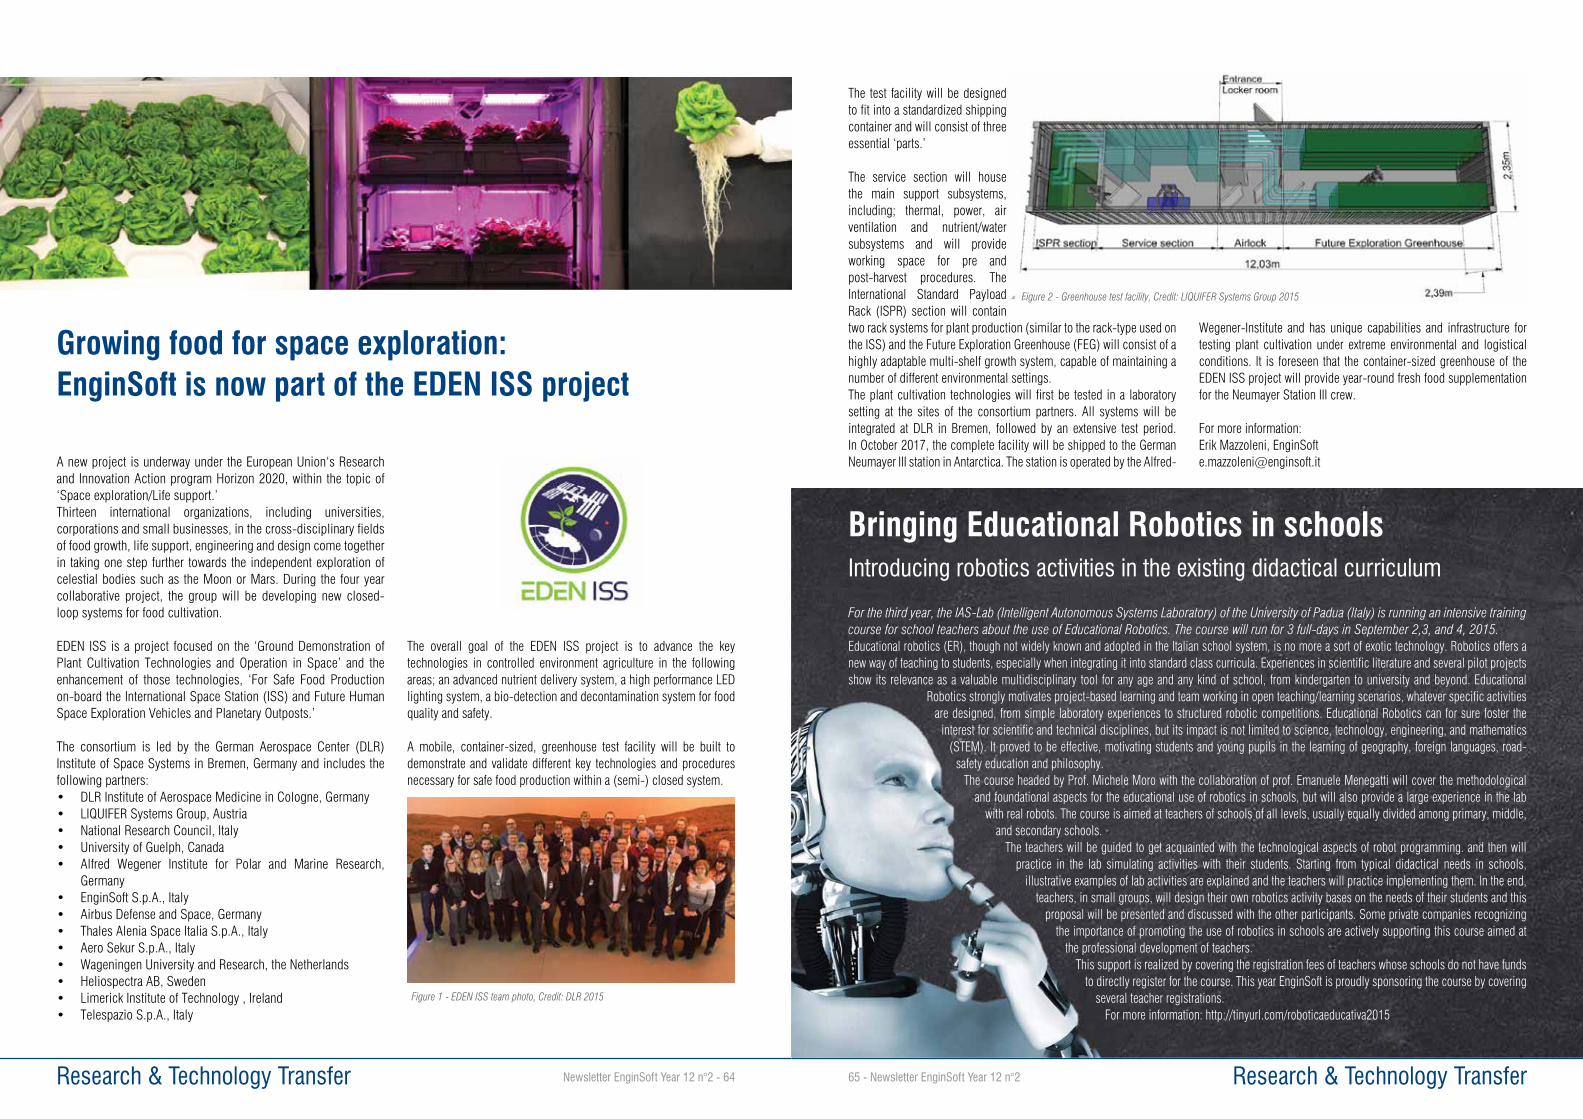
The test facility will be designed to fit into a standardized shipping container and will consist of three essential ‘parts.’
The service section will house the main support subsystems, including; thermal, power, air ventilation and nutrient/water subsystems and will provide working space for pre and post-harvest procedures. The International Standard Payload Rack (ISPR) section will contain two rack systems for plant production (similar to the rack-type used on the ISS) and the Future Exploration Greenhouse (FEG) will consist of a highly adaptable multi-shelf growth system, capable of maintaining a number of different environmental settings. The plant cultivation technologies will first be tested in a laboratory setting at the sites of the consortium partners. All systems will be integrated at DLR in Bremen, followed by an extensive test period. In October 2017, the complete facility will be shipped to the German Neumayer III station in Antarctica. The station is operated by the Alfred-
Wegener-Institute and has unique capabilities and infrastructure for testing plant cultivation under extreme environmental and logistical conditions. It is foreseen that the container-sized greenhouse of the EDEN ISS project will provide year-round fresh food supplementation for the Neumayer Station III crew.
For more information:Erik Mazzoleni, [email protected]
Research & Technology Transfer65 - Newsletter EnginSoft Year 12 n°2 Research & Technology Transfer Newsletter EnginSoft Year 12 n°2 - 64
A new project is underway under the European Union‘s Research and Innovation Action program Horizon 2020, within the topic of ‘Space exploration/Life support.’ Thirteen international organizations, including universities, corporations and small businesses, in the cross-disciplinary fields of food growth, life support, engineering and design come together in taking one step further towards the independent exploration of celestial bodies such as the Moon or Mars. During the four year collaborative project, the group will be developing new closed-loop systems for food cultivation.
EDEN ISS is a project focused on the ‘Ground Demonstration of Plant Cultivation Technologies and Operation in Space’ and the enhancement of those technologies, ‘For Safe Food Production on-board the International Space Station (ISS) and Future Human Space Exploration Vehicles and Planetary Outposts.’
The consortium is led by the German Aerospace Center (DLR) Institute of Space Systems in Bremen, Germany and includes the following partners:• DLR Institute of Aerospace Medicine in Cologne, Germany • LIQUIFER Systems Group, Austria • National Research Council, Italy • University of Guelph, Canada • Alfred Wegener Institute for Polar and Marine Research,
Germany• EnginSoft S.p.A., Italy • Airbus Defense and Space, Germany• Thales Alenia Space Italia S.p.A., Italy• Aero Sekur S.p.A., Italy • Wageningen University and Research, the Netherlands• Heliospectra AB, Sweden • Limerick Institute of Technology , Ireland• Telespazio S.p.A., Italy
The overall goal of the EDEN ISS project is to advance the key technologies in controlled environment agriculture in the following areas; an advanced nutrient delivery system, a high performance LED lighting system, a bio-detection and decontamination system for food quality and safety.
A mobile, container-sized, greenhouse test facility will be built to demonstrate and validate different key technologies and procedures necessary for safe food production within a (semi-) closed system.
Growing food for space exploration:EnginSoft is now part of the EDEN ISS project
Figure 1 - EDEN ISS team photo, Credit: DLR 2015
For the third year, the IAS-Lab (Intelligent Autonomous Systems Laboratory) of the University of Padua (Italy) is running an intensive training course for school teachers about the use of Educational Robotics. The course will run for 3 full-days in September 2,3, and 4, 2015.Educational robotics (ER), though not widely known and adopted in the Italian school system, is no more a sort of exotic technology. Robotics offers a new way of teaching to students, especially when integrating it into standard class curricula. Experiences in scientific literature and several pilot projects show its relevance as a valuable multidisciplinary tool for any age and any kind of school, from kindergarten to university and beyond. Educational
Robotics strongly motivates project-based learning and team working in open teaching/learning scenarios, whatever specific activities are designed, from simple laboratory experiences to structured robotic competitions. Educational Robotics can for sure foster the
interest for scientific and technical disciplines, but its impact is not limited to science, technology, engineering, and mathematics (STEM). It proved to be effective, motivating students and young pupils in the learning of geography, foreign languages, road-
safety education and philosophy.The course headed by Prof. Michele Moro with the collaboration of prof. Emanuele Menegatti will cover the methodological
and foundational aspects for the educational use of robotics in schools, but will also provide a large experience in the lab with real robots. The course is aimed at teachers of schools of all levels, usually equally divided among primary, middle,
and secondary schools. The teachers will be guided to get acquainted with the technological aspects of robot programming. and then will
practice in the lab simulating activities with their students. Starting from typical didactical needs in schools, illustrative examples of lab activities are explained and the teachers will practice implementing them. In the end,
teachers, in small groups, will design their own robotics activity bases on the needs of their students and this proposal will be presented and discussed with the other participants. Some private companies recognizing
the importance of promoting the use of robotics in schools are actively supporting this course aimed at the professional development of teachers.
This support is realized by covering the registration fees of teachers whose schools do not have funds to directly register for the course. This year EnginSoft is proudly sponsoring the course by covering
several teacher registrations.For more information: http://tinyurl.com/roboticaeducativa2015
Bringing Educational Robotics in schoolsIntroducing robotics activities in the existing didactical curriculum
Figure 2 - Greenhouse test facility, Credit: LIQUIFER Systems Group 2015
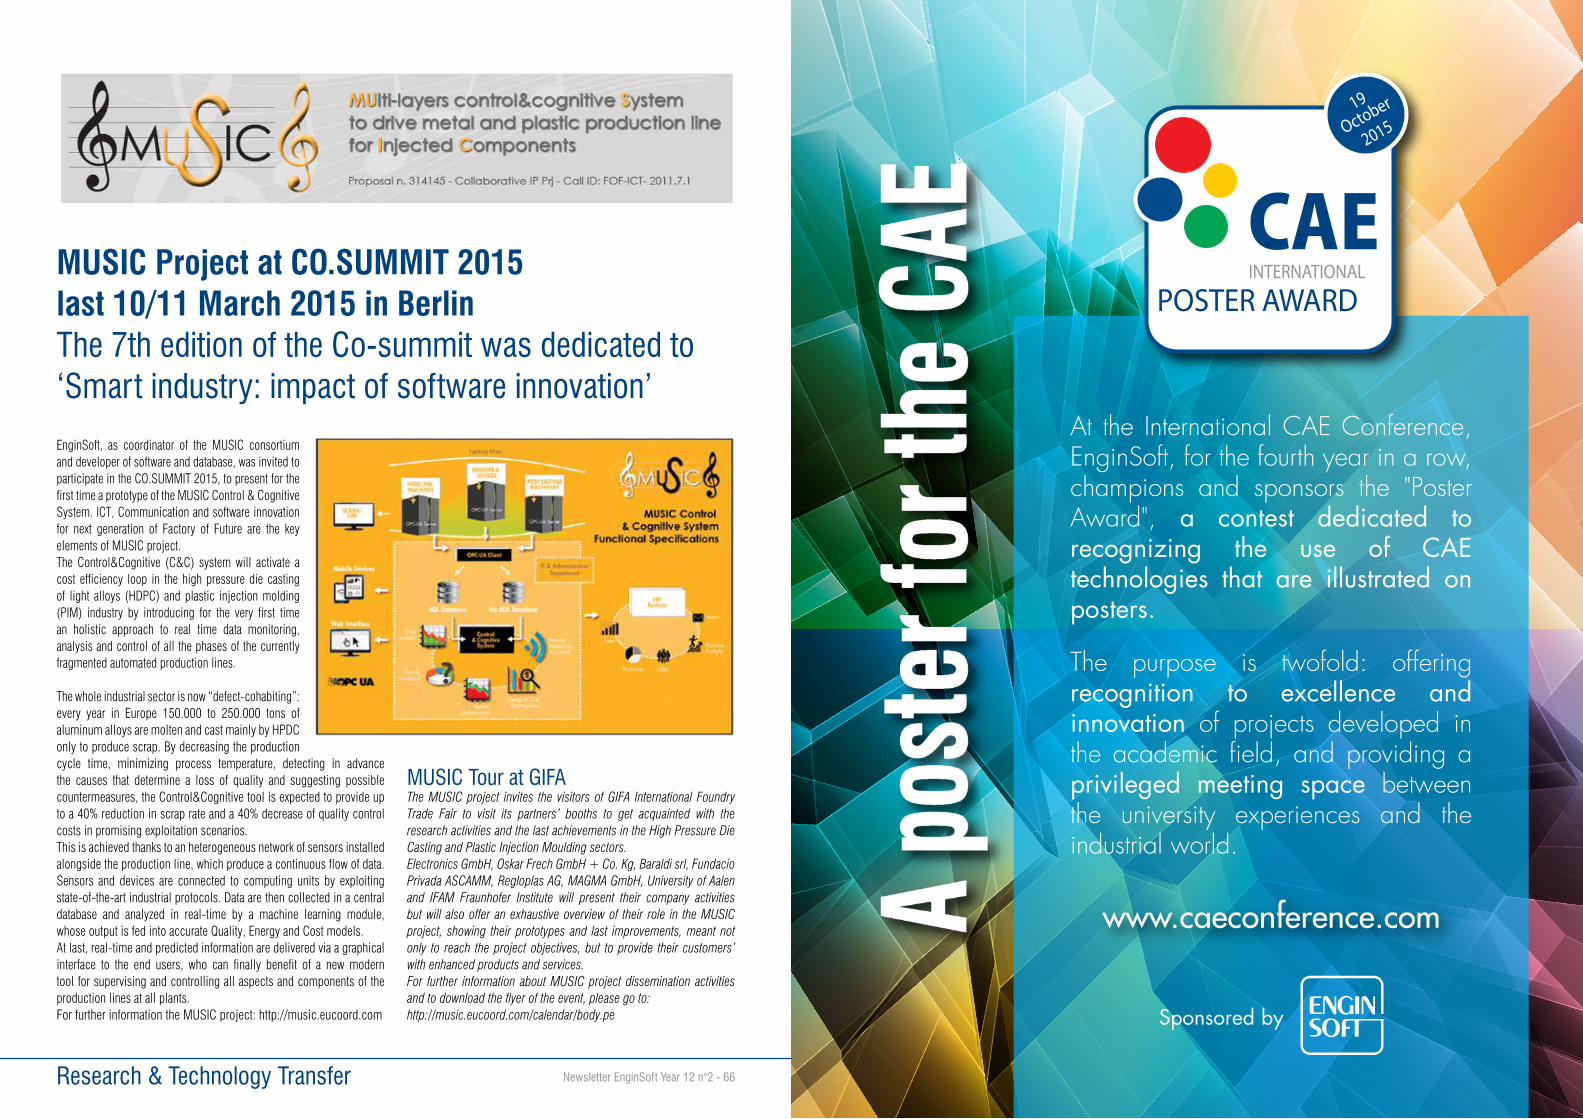
Research & Technology Transfer Newsletter EnginSoft Year 12 n°2 - 66
At the International CAE Conference, EnginSoft, for the fourth year in a row, champions and sponsors the "Poster Award", a contest dedicated to recognizing the use of CAE technologies that are illustrated on posters.
The purpose is twofold: offering recognition to excellence and innovation of projects developed in the academic �eld, and providing a privileged meeting space between the university experiences and the industrial world.
www.caeconference.com
Sponsored by
CAEPOSTER AWARD
19
October
2015
INTERNATIONAL
EnginSoft, as coordinator of the MUSIC consortium and developer of software and database, was invited to participate in the CO.SUMMIT 2015, to present for the first time a prototype of the MUSIC Control & Cognitive System. ICT, Communication and software innovation for next generation of Factory of Future are the key elements of MUSIC project.The Control&Cognitive (C&C) system will activate a cost efficiency loop in the high pressure die casting of light alloys (HDPC) and plastic injection molding (PIM) industry by introducing for the very first time an holistic approach to real time data monitoring, analysis and control of all the phases of the currently fragmented automated production lines.
The whole industrial sector is now “defect-cohabiting”: every year in Europe 150.000 to 250.000 tons of aluminum alloys are molten and cast mainly by HPDC only to produce scrap. By decreasing the production cycle time, minimizing process temperature, detecting in advance the causes that determine a loss of quality and suggesting possible countermeasures, the Control&Cognitive tool is expected to provide up to a 40% reduction in scrap rate and a 40% decrease of quality control costs in promising exploitation scenarios.This is achieved thanks to an heterogeneous network of sensors installed alongside the production line, which produce a continuous flow of data. Sensors and devices are connected to computing units by exploiting state-of-the-art industrial protocols. Data are then collected in a central database and analyzed in real-time by a machine learning module, whose output is fed into accurate Quality, Energy and Cost models.At last, real-time and predicted information are delivered via a graphical interface to the end users, who can finally benefit of a new modern tool for supervising and controlling all aspects and components of the production lines at all plants.For further information the MUSIC project: http://music.eucoord.com
MUSIC Tour at GIFAThe MUSIC project invites the visitors of GIFA International Foundry Trade Fair to visit its partners’ booths to get acquainted with the research activities and the last achievements in the High Pressure Die Casting and Plastic Injection Moulding sectors.Electronics GmbH, Oskar Frech GmbH + Co. Kg, Baraldi srl, Fundacio Privada ASCAMM, Regloplas AG, MAGMA GmbH, University of Aalen and IFAM Fraunhofer Institute will present their company activities but will also offer an exhaustive overview of their role in the MUSIC project, showing their prototypes and last improvements, meant not only to reach the project objectives, but to provide their customers’ with enhanced products and services.For further information about MUSIC project dissemination activities and to download the flyer of the event, please go to: http://music.eucoord.com/calendar/body.pe
MUSIC Project at CO.SUMMIT 2015 last 10/11 March 2015 in BerlinThe 7th edition of the Co-summit was dedicated to ‘Smart industry: impact of software innovation’

Save the date
Your opportunity to be part of the future!
19 - 20October 2015Pacengo del Garda,
Verona - Italy
www.caeconference.com
The annual Simulation Based technology event, will once again present technically rich content to the satisfaction of our esteemed guests.
This year’s plenary session will honour EXPO Milano, with stimulating speeches relating to the food chain industry, such as international projects referring to astronaut food product.
Plenary sessions will feature the futuristic building designed for the EXPO, which was veri�ed using sophisticated FEM calculations. These sessions will be followed by fascinating topics delivered by international key note speakers on: numerical analysis applied to artwork maintenance, exciting innovative project related to the exploitation of renewable energy.
The plenary will be followed by several transversal sessions, focusing on the wide range of simulation sectors such as: Transportation, Energy and Oil & Gas, Aerospace & Defence, Construction, Manufacturing, Foundry and Metal Forming, Explicit Dynamics, Healthcare, ITC & HPC.
Among this year’s edition, attendees will have access to software experts in the Technology Gallery, where there are opportunities to book onsite technical demonstrations and to meet major hardware and software developers in the exhibition area.
For all updates, stay tuned!