Embed Size (px)
Citation preview

news release eurostat
EN
ASIA- EUROPE MEETING
Bangkok, 1-2 March 1996
Relations between the European Union
and Asian countries
Key figures
Source of the data:
EUROSTAT, if no other indication ---
f
Asian and EU countries
Areakm2 Population (1000) GNP (current GNP per Mio US$) Capita*
(US$) 1994 1993 1993 .
:;:
Brunei 5770 282 3640 14144 Indonesia 1 904570 192 217 136991 730 Malaysia 329750 19684 60061 3160 The Philippines 300000 67038 54609 830 Singapore 620 2826 55372 19310 Thailand 513120 57586 120235 2040 VietNam 331 690 72342 11997 170 Asean Total 3 385 520 411 975 442 905
China 9 596960 **1178 402 581109 490 Ja~an 377 800 **124 469 31450 South Korea 99020 44456 338020 7670 . Atlas method •• 1993
Area km2 Population GNP (current GNP per (1000) Mio US$) Capita (US $)
1994 1993 1993
Belgium 30500 10130.6 211 748 20996 Denmark 43100 5 215.7 130664 25181 Gerrnany1 356900 81 552.5 1 909517 23522 Greece 132 000 10 442.4 90103 8695 Spain 504800 39169.6 473151 12088 France 544000 58027.3 1 241 855 21663 Ireland 70300 3 576.6 41812 11735 Italy 301300 *57247.5 975904
~~ Luxembourg 2600 406.6 14621 Nethet1ands 41200 15422.8 308920 20204 Austria 83900 8039.9 181 249 22682 Portugal 92400 9 912.1 84591 8565 An land 337100 5098.8 78702 15505 Sweden 450000 8816.4 177825 20395 United Kingdom 244100 **58276.0 941265 16209 EU15 3234200 ***371 484.8 6861928 18528
United Gennany residential populalioo .. 1993 Ell'ostat estimation
~-
•
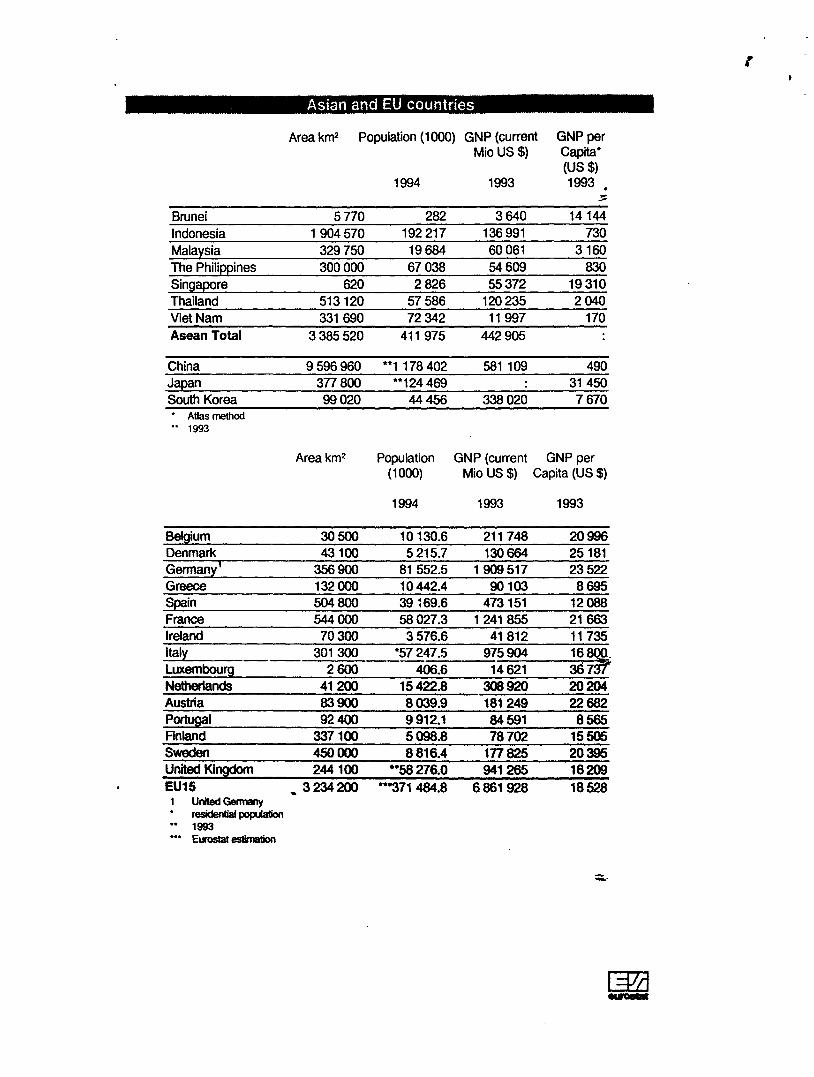
EU aid to Asian countries*
(Mio US$) 1991 1992 1993
Brunei· 0.00 0.09 0.06 Indonesia 12.02 12.95 13.46 •
Mala~sia 5.05 2.93 0.97.;:
The Philipeines 15.97 17.71 20.14 Singapore 0.35 0.17 0.49 Thailand 13.62 21.72 17.46 VietNam 19.07 20.82 14.25 Asean Total 66.08 76.39 66.83
China 26.77 31.29 19.51 South Korea 0.02 0.00 0.00 • Excluding bilateral aid from Member States
Public develo ment aid
(1993, Mio US $) Total EU bilateral o/o Other bilateral o/o Multilateral o/o
Brunei 5.1 0.2 3.94 4.8 94.03 0.1 2.03 Indonesia 2732 730 26.71 1869 68.39 134 4.90 Malaysia 276 57 20.67 208 75.13 12 4.20 The Philippines 1 819 252 13.84 1407 77.36 160 ;8.80 Singapore 31 7 23.22 23 72.55 1 423 Thailand 817 119 14.63 641 78.48 56 6.89 VietNam 341 122 35.82 117 34.40 102 29.78 Asean Total 6021 1287 21.38 4269 70.90 465 7.72
China 3474 753 21.67 1689 48.63 1032 29.71 South Korea 278 33 11.73 242 87.03 3 1.24
-~
Forei n Debt
(1993 Mio US $) Total Debt Foreign Debt/ servicing GNP(%)
Brunei Indonesia 89539 13297 65.90 Malaysia 23335 4229 37.80 The Philippines 35269 4 785 63.70 Singapore Thailand 45819 9112 ~- 37.60
VietNam 24224
AseanTotat 498 188.70 ~
China 83780 10105 21.40 Japan South Korea 47203 9173 14.40
[3?lJ ~

•
Trade relations between Asian countries and EU ~ 1994
EU's imports from EU's exports EU trade balance to
source: (1000 ECU) (1000 ECU) (1000 ECU) Eurostat -Comext
Brunei 313 914 785 838 471 92a Indonesia 5 890 018 4 311 424 -1 578 594
Mala~sia 7 493298 5 765 607 -1 727 691 The Philippines 2 131 491 1 957 588 -173 903 Singapore 7 801 206 8842 594 1 041 388 Thailand 6334858 6100968 -233 890 VietNam 876394 616522 -259872 Asean Total 30 841179 28 380541 -2 460638
China 23 012 385 12 508908 -10 503 477 Japan 48 821 167 26 582 891 -22 238276 South Korea 8688412 10 024 841 1 336429
Trade flows of Asian countries in 1994*
as % of total trade Exports to EU Imports from EU
Brunei 20.09 30.80 Indonesia 16.35 18.39 Malaxsia 13.92 13.53 The Phi!ippin:;:s 17.11 10.29 ,;; Singapore 12.96 12.07 Thailand 15.00 13.73 VietNam 20.56 9.53 AseanTotal 14.44 13.38
China 12.09 14.65 Japan 14.53 12.94 Sduth Korea 10.61 ... 12.68 • souce: IMF-DOTS
---

'
•
Independence Capital
: 1984 : Bandar Seri Begawan
Area : 5 770 km2 Population (1994) : 282 000
Demographic Data 197()..75 1975-80 198()..85 1985-90
Average rate of pop. growth(%) 4.3 3.6 3.2 2..6 Av. rate of urbanisation pop.(%) 4.4 2.9 2.4 2.6
Labour force(% of tot. pop.)
Males (% of tot. labour force) Females (% of tot. labour force)
1990-95 2.2
~--~~--~~~~--~~-------------------------------------------In agriculture (% of tot. labour force) In industry (% of tot. labour force) In services (% of tot. labour force)
198()..85 1985-90 1990-91 1991-92 1992-93 GNP growth rate {%) 2.01 -1.75 12.68
Structure of GDP {%) 1980 1990 1991 1992 1993 Agriculture 0.64 2.36 2.60 lndust!Y 84.82 54.79 52.22 Services 14.54 42.85 45.18
1 709.84 10 210.11 10801
Current account balance (Mio US $) General Government Deficit (Mio US $) Direct investment from abroad (Mio US $)
~ 'J
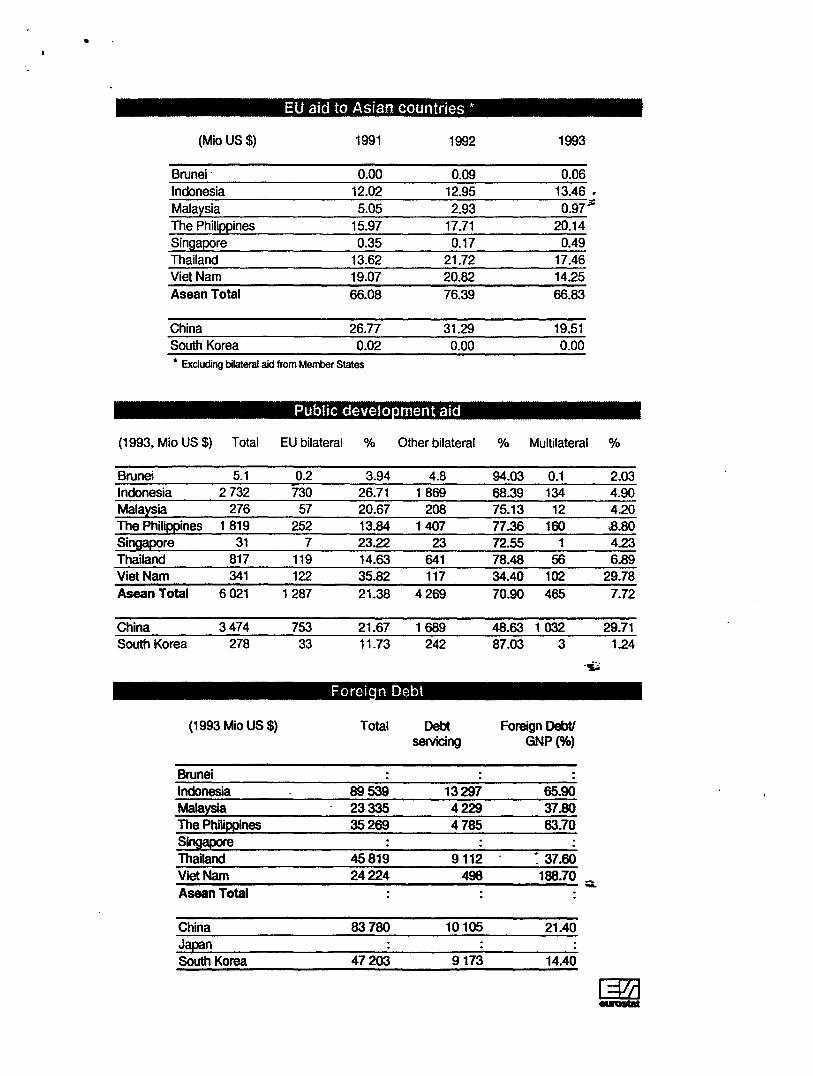
Independence Capital
: 1949 : Beijing (Pekin)
Area : 9 596 960 km2 Population (1993): 1 178 402 000
Demographic Data 1970-~7:..;:5:.___;1;_;:;9~75-80::.=:~-1=-=9.::.;80-85=-:=-:::---1:..::985--=-:90:=-:--1:.::.990--=-,;::..:.95::-
Average rate of pop. growth (%) 2.3 --~1 ~-4 1.4 1.5 1.4 -'Ac..:.v::..:..·~ra::.:.;te:;...o::.;f...::u;.;.;;rba=:..:;ni:.=;sa:;;;:t::..:..io::..:..n..<:.po.:;lp::..:...('-'-o/o::L) ______ .;;;.2.::..:..2'----3 .. 9 . ___ 4..:.;.·.;...1 ----;,4..:.;..6 ___ ___:,_
1970 1975 1980 1985 1990 Labour force {% of tot pop.} 51.56 51.96 54.92 58.32 60.50
Males {% of tot. labour force} 58.31 57.59 56.82 Females {%of tot. labour force} 41.69 42.41 43.18
In agriculture{% of tot. labour force} 78.34 76.29 74.24 In indust!}: {% of tot. labour force} 10.12 12.05 13.99 In services{% of tot. labour force} 11.54 11.66 11.77
1980-85 1985-90 1990-91 1991-92 1992-93 GNP growth rate{%} 6.19 4.88 8.79 8.14 5.46
Structure of GDP {o/o} 1980 1990 1991 1992 1993 Agriculture 30.40 27.03 24.41 21.76 19.48 lndust!1 49.04 41.57 42.01 43.89 47.59 Services 20.56 31.40 33.58 34.35 32.93
Apparent energy consumption per capita 421.03 577.77 591.68 609.10 632.25 of oil
Inflation rate (o/o) • 7.46 3.06 6.35 14.59 24.25
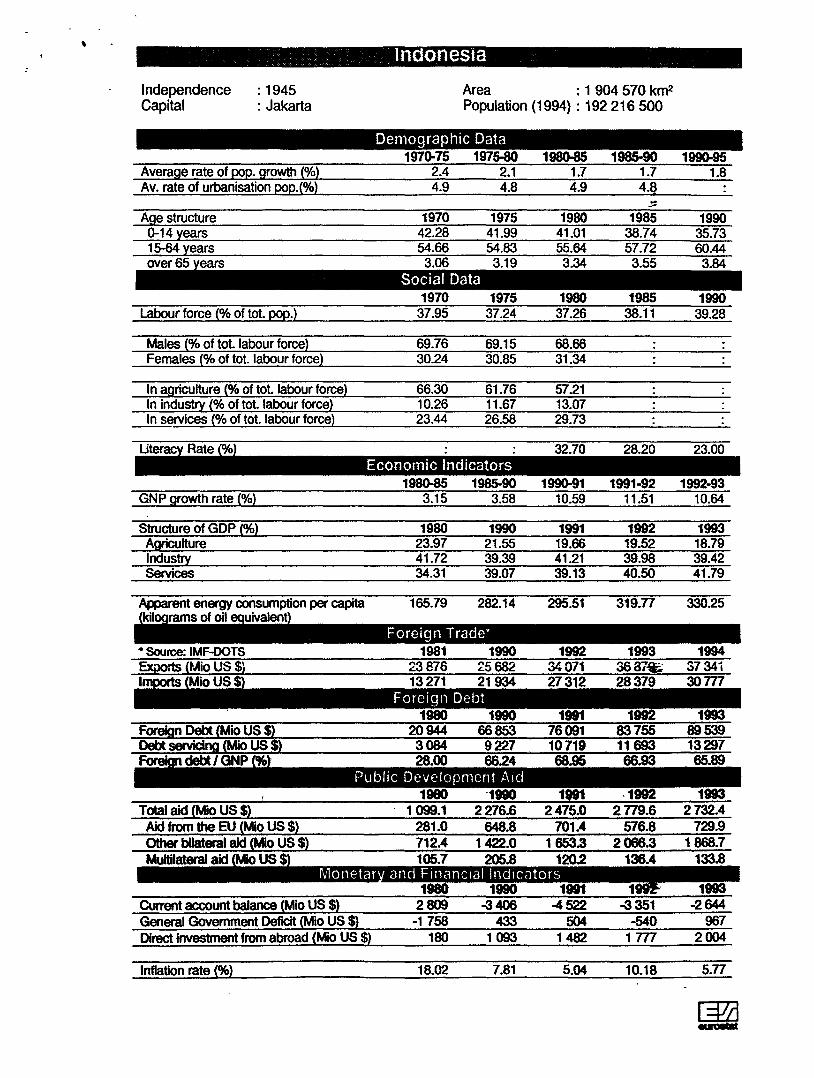
' Indonesia
Independence : 1945 Area : 1 904 570 km2 Capital : Jakarta Population (1994) : 192 216 500
Demographic Data 197().75 1975-80 1980-85 1985-90 1990-95
Average rate of PQQ. growth {o/o) 2.4 2.1 1.7 1.7 1.8 Av. rate of urbanisation PQQ.{o/o) 4.9 4.8 4.9 4.8 .
:;:
Age structure G-14 ~ears 15-64 ~ears over65
Labour force {o/o of tot. pop.)
Males {o/o of tot. labour force} 69.76 69.15 68.66 Females {o/o of tot. labour force) 30.24 30.85 31.34
In agriculture {o/o of tot. labour force) 66.30 61.76 57.21 In industry {o/o of tot. labour force} 10.26 11.67 13.07 In services {o/o of tot. labour force) 23.44 26.58 29.73
1980-85 1985-90 1990-91 1991-92 1992-93 GNP growth rate {o/o} 3.15 3.58 10.59 11.51 10.64
Structure of GDP {o/o} 1980 1990 1991 1992 1993 Agriculture 23.97 21.55 19.66 19.52 18.79 Industry 41.72 39.39 41.21 39.98 39.42 Services 34.31 39.07 39.13 40.50 41.79
Apparent energy consumption per capita 165.79 282.14 295.51 319.77 330.25 oil
Inflation rate (o/o} 18.02 7.81 5.04 10.18 5.77

Independence Capital
: 1957 : Kuala Lumpur
Average rate of pop. growth (o/o) Av. rate of urbanisation pop.(o/o)
Labour force(% of tot. pop.~
Males {o/o of tot. labour force} Females (% of tot. labour force}
In agriculture (% of tot. labour force} In indust!Y {o/o of tot. labour force} In services (% of tot. labour force}
GNP growth rate (%}
Structure of GOP (o/o) Agriculture Industry Services
Apparent energy consumption per capita of oil
Inflation rate (%)
Malaysia , Area : 329 750 km2
Population (1994) : 19 684 000
Demographic Data 197~75 1975-80 1980-85 1985-90 199().95
2.4 2.3 2.5 2.5 2.4 4.8 4.5 4.3 4.1
1970 1975 1980 1985 1990 34.01 36.17 38.78 39.67 40.88
68.75 67.00 65.37 31.25 33.00 34.63
53.78 47.75 41.59 14.27 16.65 19.11 31.95 35.60 39.31
1980-85 1985-90 199().91 1991·92 1992-93 3.90 7.38 8.51 14.24 13.76
1980 1990 1991 1992 1993 21.91 37.83 40.26
688.15 1236.6 1433.69 1508.44 1 544.76
6.67 2.62 4.77 3.54 3.72

The PhiHppJnes
Independence : 1946 Area : 300 000 km2 Capital : Manila Population (1994) : 67 038 341
Demographic Data 1970..75 1975-80 1980-85 1985-90 199o-95
Average rate of po~. growth (o/ol 2.7 2.3 2.5 2.1 2.1 Av. rate of urbanisation po~.(o/ol 4.2 3.4 5.2 4.7
.!:= Age structure Q-14 ~ears 15-64 ~ears over65
1970 1975 1980 1985 1990 Labour force (% of tot. ~o~.l 36.61 37.15 36.29 36.47 36.86
Males (% of tot labour force} 66.76 67.16 67.11 Females (%of tot. labour force} 33.24 32.84 32.89
In agriculture {o/o of tot labour forcel 54.75 53.31 51.76 In indust!Y (o/g of tot. labour forcel 16.53 16.09 15.66
_In services (%of tot. labour forcel 28.72 30.60 32.57
GNP growth rate {%}
Structure of GDP {%} 1980 1990 1991 1992 1993 Agriculture 25.12 21.90 20.98 21.82 21.68 Industry 38.79 34.47 34.01 32.84 32.92 Services 36.10 43.62 45.00 45.34 45.40
Inflation rate (%) 18.2 14.14 8.92 7.59 9.06

Independence Capital
: 1963 :Singapore
Average rate of pop. growth(%) Av. rate of urbanisation pop.(%)
Labour force {% of tot. pop.}
Males (% of tot. labour force} Females {% of tot. labour force}
In agriculture (% of tot. labour force} In indust!Y {% of tot. labour force} In services (%of tot. labour force}
GNP growth rate {%}
Structure of GOP (%} Agriculture lndust!Y Serllices
Apparent energy consumption per capita of oil
General Government Deficit (Mio US $) Direct investment from abroad (Mio US $)
Inflation rate (%)
Singapore
Area : 620 km2
PoRulation (1994) : 2 826 000
Demographic Data 1970..75 1975-80 198()..85 1990-95
1.7 1.3 1.2 1.1 1.0 1.7 1.3 1.2
1970 1975 1980 1985 1990 35.02 40.20 46.24 47.90 48.04
74.15 69.33 65.51 25.85 30.67 34.49
3.43 2.52 1.59 30.25 33.96 37.71 66.31 63.52 60.70
1980-85 1985-90 1990-91 1991-92 1992-93 10.05 13.01 16.82 18.80 15.79
1980 1990 1991 1992 1993 1.28 0.27 0.23 0.22 0.19
38.11 37.05 37.58 37.37 36.76 60.60 62.69 62.19 62.42 63.06
2504.76 4450.65 4680.91 5252.93 5562.90
6062
8.53 3.44 2.29 2.24 3.14

ThaHana Independence Area : 513120 km2 Capital : Bangkok Population (1994) :57 586 000
Demographic Data 1970..75 1975-80 1990-95
Average rate of pop. growth (%) 2.9 2.4 1.3 Av. rate of urbanisation pop.(%) 5.5 4.8
Labour force (% of tot pop.)
Males (% of tot labour force) 52.67 52.90 52.93 Females (% of tot. labour force) 47.33 47.10 47.07
,. ' In agriculture {o/o of tot labour force) 79.75 75.31 70.89 : l In industry (% of tot. labour force) 6.03 8.15 10.26 . -·
In services (% of tot. labour force) 14.22 16.54 18.84
1980-85 1985-90 199()..91 1991-92 1992-93 GNP growth rate (%} 4.15 15.61 12.99 14.25 12.33
Structure of GDP {%} 1980 1990 1991 1992 1993 Agriculture 2324 12.74 12.74 12.01 9.96 Industry 28.68 37.03 38.n 38.49 39.24 Services 48.08 50.23 48.50 49.50 50.80
Inflation rate{%) 19.7 5.93 4.14 3.57 5.34

V let Nam ,
Independence : 1954 Capital : Hanoi
Area : 331 690 km2 Population ( 1994) : 72 342 000
Demographic Data 1970..75 1975-80 1980-85 1985-90 199o-95
Average rate of pop. growth (%) 2.3 2.2 2.2 2.2 2.0 Av. rate of urbanisation pop.(%) 2.9 2.7 2.6 2.5.
1970 1975 1980 1985 1990 Labour force (% of tot. po~.l 47.44 46.46 46.02 48.16 49.76
Males (% of tot. labour force} 52.27 52.25 52.39 Females (% of tot. labour force} 47.73 47.75 47.61
In agriculture (o/o of tot. labour force} 76.60 72.04 67.48 In indust!Y (% of tot. labour force} 6.49 9.16 11.83 In services (% of tot. labour force} ~6.91 18.80 20.69
1980-85 1985-90 199o-91 1991-92 1992-93 GNP growth rate (%}
Structure of GOP (%} 1980 1990 1991 1992 1.993 Agriculture 38.56 39.52 32.99 29.29 Industry 22.32 23.79 27.26 28.41 Services 39.12 36.69 39.74 42.31
Apparent energy consumption per capita 74.92 87.09 76.48 n.49 76.51 of oil
Inflation rate(%) 30.0 90.0 67.2 17.5 5.2


![endudbafizierung.files.wordpress.com · 2012-09-25 · sop qo 'uass1M 112 Juvssa.lann sq 'suassgmao sap pun uaquppsuatu Jap 'IJunu -lap aSms -lap -tap sang.npsuot] 210.11 -lap uauas](https://img.dokumen.tips/doc/110x75/5e5850af353f6878480c27e6/2012-09-25-sop-qo-uass1m-112-juvssalann-sq-suassgmao-sap-pun-uaquppsuatu-jap.jpg)