Embed Size (px)
Citation preview

1
NEWS RELEASE
Shaw Announces First Quarter Results
Broadband advantage helps drive solid Q1 performance
Calgary, Alberta (January 12, 2017) – Shaw Communications Inc. announces consolidated financial
and operating results for the quarter ended November 30, 2016. Consolidated revenue from continuing
operations for the quarter of $1.3 billion increased by 14.9% over the comparable period. Operating
income before restructuring costs and amortization1 for the quarter of $539 million improved 6.1% over
the comparable period. Excluding the results of the Wireless division, acquired on March 1, 2016,
revenue for the quarter from the combined Consumer, Business Network Services and Business
Infrastructure Services divisions was up 2.8% and operating income before restructuring costs and
amortization for the quarter remained flat over the comparable period.
Chief Executive Officer, Brad Shaw said, “We’ve entered fiscal 2017 with momentum and on track to
deliver on our strategic initiatives. Shaw recently announced the completion of key milestones
demonstrating our commitment to execute on our video and network technology roadmaps, most notably,
the introduction of our next generation video product BlueSky TV and the launch of Freedom Mobile’s
LTE-Advanced network. Our solid first quarter results reflect the broadband advantage we’ve created
and our disciplined approach to long-term and sustainable growth.”
Selected Financial Highlights
Three months ended November 30, Change %
(millions of Canadian dollars except per share amounts)
2016
2015
Revenue 1,313 1,143 14.9
Operating income before restructuring costs and amortization 1 539 508 6.1 Operating margin 1 41.1% 44.4% (3.3pts)
Free cash flow 1 158 173 (8.7)
Net income 89 218 (59.2) Basic and diluted earnings per share 0.18 0.43
Net income for the current quarter in the amount of $89 million decreased by $129 million relative to the
first quarter of fiscal 2016 mainly due to a non-recurring provision in the amount of $107 million related
to the wind down of our investment in shomi. Net income in the quarter also reflects a decrease in
income from discontinued operations, net of tax, in the amount of $80 million due to the sale of the
former Media division in the third quarter of the prior year which is offset partially by the equity income
of $27 million in the quarter from our investment in Corus.
Consolidated free cash flow1 for the quarter of $158 million compared to $173 million in the prior year.
The decrease for the quarter was largely due to the loss of free cash flow generated by the former Media
division and higher planned capital expenditures from continuing operations driven by the addition of the
Wireless division.
In the quarter, we continued our momentum of improving subscriber trends. Consumer revenue
generating units (“RGUs”) in the first quarter declined by 29,696, a meaningful improvement over the
43,750 loss in the first quarter of fiscal 2016. This year-over-year improvement was driven by a
reduction in cable video and phone RGU losses in addition to strong Internet RGU net gains of 16,669
reflecting a full quarter impact of our WideOpen Internet 150 offering launched in August 2016. The

2
decline in Consumer RGUs was also largely impacted by the anticipated seasonal disconnections of
satellite Video subscribers in the amount of 15,704 RGUs.
“We are using our wireline broadband advantage to support WideOpen Internet 150 with the majority of
new Internet customers opting for our two-year value plan, underlining the value we are providing with
much faster speeds at affordable prices across 95% of our footprint,” said Mr. Shaw. “We continue to
enhance our wireline network and are on track to complete our DOCSIS 3.1 upgrade by the end of fiscal
2017.”
In Wireless, we added approximately 9,500 RGUs, a shortfall from the net gains achieved in the fourth
quarter of fiscal 2016. The wireless subscriber results reflect our focus on the launch of Freedom Mobile,
the rollout of our LTE-Advanced network and significantly heightened competitive activity in the period.
“We achieved three important milestones in our Wireless division this quarter. First, we launched the new
Freedom Mobile brand, anchored by a commitment of trust and transparency for our customers. Second,
the rollout of our LTE-Advanced network in the key markets of central Toronto and central Vancouver.
Third, the introduction of the Freedom Wi-Fi trial, allowing customers to connect to over 65,000 Shaw
Go WiFi hotspots across Alberta and British Columbia,” said Mr. Shaw.
Mr. Shaw added, “Today, we are excited to be the first in Canada to offer a best-in-class TV experience
powered by our strategic partnership with Comcast. This next chapter in our video technology roadmap
marks an important and exciting milestone in Shaw’s history. Our new X1 TV experience, named
BlueSky TV, provides ease-of-use and customization that is unprecedented in Canada. Its innovative
voice remote technology provides a whole new way for our customers to quickly and easily discover what
they want to watch. We are pleased to offer this leading technology experience to customers in Calgary,
with subsequent launches in major cities within our footprint planned throughout fiscal 2017.”
Shaw continues to be disciplined in driving efficiencies throughout the business. In the quarter, we shifted
our In-Home Technician team to a hybrid unit-based installation and service technician model, combining
a foundation of customer experience with technical skill that will deliver annualized operating cost
savings of approximately $16 million. This initiative resulted in a non-recurring restructuring charge of
$10 million in the quarter.
Brad Shaw concluded, “In fiscal 2017 we are focused on delivering exceptional customer experiences
through the launch of BlueSky TV, Freedom Mobile and continuously building our converged network.
We thank our 14,000 employees for their dedication to delivering on Shaw’s key strategic initiatives. This
is an exciting time for Shaw as we leverage our broadband advantage and strengthen our wireless network
delivering significant value to both our customers and our shareholders.”
Shaw Communications Inc. is an enhanced connectivity provider. Our Consumer division serves
consumers with broadband Internet, Shaw Go WiFi, video and digital phone. Our Wireless division
provides wireless voice and data services through an expanding and improving mobile wireless network
infrastructure. The Business Network Services division provides business customers with Internet, data,
WiFi, telephony, video and fleet tracking services. The Business Infrastructure Services division, through
ViaWest, provides hybrid IT solutions including colocation, cloud computing and security and
compliance for North American enterprises.
Shaw is traded on the Toronto and New York stock exchanges and is included in the S&P/TSX 60 Index
(Symbol: TSX - SJR.B, SJR.PR.A, SJR.PR.B, NYSE – SJR, and TSXV – SJR.A). For more information,
please visit www.shaw.ca

3
The accompanying Management’s Discussion and Analysis (“MD&A”) forms part of this news release
and the “Caution concerning forward-looking statements” applies to all the forward-looking statements
made in this news release.
For more information, please contact:
Shaw Investor Relations
[email protected] 1 See definitions and discussion under “Non-IFRS and additional GAAP measures” in the accompanying MD&A.

Shaw Communications Inc.
4
MANAGEMENT’S DISCUSSION AND ANALYSIS
For the three months ended November 30, 2016
January 12, 2017
Contents
Introduction 7
Selected financial and operational highlights 8
Overview 9
Outlook 12
Non-IFRS and additional GAAP measures 12
Discussion of operations 15
Supplementary quarterly financial information 19
Other income and expense items 21
Financial position 22
Liquidity and capital resources 23
Accounting standards 24
Related party transactions 25
Financial instruments and other instruments 25
Risk and uncertainties 25
Advisories
The following Management’s Discussion and Analysis (“MD&A”), dated January 12, 2017, should be
read in conjunction with the unaudited interim Consolidated Financial Statements and Notes thereto for
the quarter ended November 30, 2016 and the 2016 Annual Consolidated Financial Statements, the Notes
thereto and related MD&A included in the Company’s 2016 Annual Report. The financial information
presented herein has been prepared on the basis of International Financial Reporting Standards (“IFRS”)
for interim financial statements and is expressed in Canadian dollars unless otherwise indicated.
References to “Shaw”, the “Company”, “we”, “us” or “our” mean Shaw Communications Inc. and its
subsidiaries and consolidated entities, unless the context otherwise requires.
Caution concerning forward-looking statements
Statements included in this MD&A that are not historic constitute “forward-looking statements” within
the meaning of applicable securities laws. Such statements include, but are not limited to:
• statements about future capital expenditures;
• asset acquisitions and dispositions;
• cost efficiencies;
• financial guidance for future performance;
• business and technology strategies and measures to implement strategies;
• statements about the Company’s equity investments, joint ventures and partnership arrangements
including any statements about write-downs, losses and liabilities;
• competitive strengths; and
• expansion and growth of the Company’s business and operations and other goals and plans.

Shaw Communications Inc.
5
They can generally be identified by words such as “anticipate”, “believe”, “expect”, “plan”, “intend”,
“target”, “goal” and similar expressions (although not all forward-looking statements contain such
words). All of the forward-looking statements made in this report are qualified by these cautionary
statements.
Forward-looking statements are based on assumptions and analyses made by the Company in light of its
experience and its perception of historical trends, current conditions and expected future developments as
well as other factors it believes are appropriate in the circumstances as of the current date. The
Company’s management believes that its assumptions and analysis in this MD&A are reasonable and
that the expectations reflected in the forward looking statements contained herein are also reasonable
based on the information available on the date such statements are made and the process used to prepare
the information. These assumptions, many of which are confidential, include, but are not limited to:
• general economic conditions;
• interest;
• income tax and exchange rates;
• technology deployment;
• content and equipment costs;
• industry structure;
• conditions and stability;
• government regulation; and
• the integration of recent acquisitions.
You should not place undue reliance on any forward-looking statements. Many factors, including those
not within the Company's control, may cause the Company's actual results to be materially different from
the views expressed or implied by such forward-looking statements, including, but not limited to:
• general economic, market and business conditions;
• changes in the competitive environment in the markets in which the Company operates and from
the development of new markets for emerging technologies;
• industry trends, technological developments, and other changing conditions in the entertainment,
information and communications industries;
• the Company’s ability to execute its strategic plans and capital projects;
• the Company’s ability to achieve cost efficiencies;
• technology, cyber security and reputational risks;
• opportunities that may be presented to and pursued by the Company;
• changes in laws, regulations and decisions by regulators that affect the Company or the markets
in which it operates;
• the Company’s status as a holding company with separate operating subsidiaries; and
• other factors described in this report under the heading “Known events, trends, risks and
uncertainties”.
The foregoing is not an exhaustive list of all possible factors.
Should one or more of these risks materialize, or should assumptions underlying the forward-looking
statements prove incorrect, actual results may vary materially from those described herein.
The Company provides certain financial guidance for future performance as the Company believes that
certain investors, analysts and others utilize this and other forward-looking information in order to assess
the Company's expected operational and financial performance and as an indicator of its ability to service
debt and pay dividends to shareholders. The Company's financial guidance may not be appropriate for
this or other purposes.

Shaw Communications Inc.
6
Any forward-looking statement speaks only as of the date on which it was originally made and, except as
required by law, the Company expressly disclaims any obligation or undertaking to disseminate any
updates or revisions to any forward-looking statement to reflect any change in related assumptions,
events, conditions or circumstances. All forward looking statements contained in this MD&A are
expressly qualified by this statement.
Non-IFRS and additional GAAP measures
Certain measures in this MD&A do not have standard meanings prescribed by IFRS and are therefore
considered non-IFRS measures. These measures are provided to enhance the reader’s overall
understanding of our financial performance or current financial condition. They are included to provide
investors and management with an alternative method for assessing our operating results in a manner that
is focused on the performance of our ongoing operations and to provide a more consistent basis for
comparison between periods. These measures are not in accordance with, or an alternative to, IFRS and
do not have standardized meanings. Therefore, they are unlikely to be comparable to similar measures
presented by other entities.
Please refer to “Non-IFRS and additional GAAP measures” in this MD&A for a discussion and
reconciliation of non-IFRS measures, including operating income before restructuring costs and
amortization and free cash flow.

Shaw Communications Inc.
7
Introduction
With the completion of two transformative transactions in 2016 and other significant strategic initiatives
and acquisitions in recent years, we have strengthened Shaw’s growth profile. The addition of the
Wireless division enables Shaw to combine the power of fibre, coax, Wi-Fi and wireless networks to
deliver a seamless experience of anytime and anywhere enhanced connectivity within our operating
footprint. We are focused on operational efficiency to ensure we execute on our strategic priorities and
build on delivering an exceptional customer experience that is centered on our world-class converged
network and strategic partnerships with best in-class providers.
We enter fiscal 2017 with a solid foundation in place to execute on the strategic initiatives we set out to
achieve. Our broadband advantage is supporting the continued momentum in the WideOpen Internet 150
offering with most new Internet customers opting for our two-year value plan, underlining the value we
are providing with much faster speeds at affordable prices across 95% of our footprint. We continue to
enhance our wireline network and are on track to complete our DOCSIS 3.1 upgrade by the end of fiscal
2017.
We are also excited to be the first in Canada to offer a best-in-class TV experience powered by our
strategic partnership with Comcast. This next chapter in our video technology roadmap marks an
important and exciting milestone in Shaw’s history. Our new X1 TV experience, named BlueSky TV,
provides ease-of-use and customization that is unprecedented in Canada. Its innovative voice remote
technology provides a whole new way for our customers to quickly and easily discover what they want
to watch. We are pleased to offer this leading technology experience to customers in Calgary, with
subsequent launches in the remaining major cities in our footprint planned throughout fiscal 2017.
In Wireless, we continued taking the necessary steps to becoming an enhanced connectivity provider and
in the quarter reached three important milestones. First, the launch of the new Freedom Mobile brand,
anchored by a commitment of trust and transparency for our customers. Second, the rollout of our LTE-
Advanced network in the key markets of central Toronto and central Vancouver. Third, the introduction
of the Freedom Wi-Fi trial, allowing customers to connect to over 65,000 Shaw Go WiFi hotspots across
Alberta and British Columbia.
Shaw continues to be disciplined in driving efficiencies throughout the business. In the quarter, we
shifted our In-Home Technician team to a hybrid unit-based installation and service technician model,
combining a foundation of customer experience with technical skill that will deliver annualized operating
cost savings of approximately $16 million. This initiative resulted in a non-recurring restructuring charge
of $10 million in the quarter.
In 2017, we are focused on delivering exceptional customer experiences through the launch of BlueSky
TV, Freedom Mobile and continuously building our converged network. In our Wireless division, we
will continue with the rollout of our LTE-Advanced upgrade which is expected to be complete in our
existing major markets by the end of fiscal 2017. The Business Network Services division continues to
strengthen our position as trusted advisors to small and medium sized businesses, applying a managed
services strategy developed in partnership with Broadsoft, Cisco and Meraki. We have made it easy for
businesses to harness seamless technology advances such as SmartVoice, SmartWiFi, and SmartSecurity
for all of their connectivity needs. Our Business Infrastructure Services division continues its industry
leadership in providing hybrid IT solutions, including colocation, cloud and managed services, by
leveraging ViaWest’s established track record.
This is an exciting time for Shaw as we capitalize on our broadband advantage and strengthen our
wireless network delivering significant value to both our customers and our shareholders.

Shaw Communications Inc.
8
Selected financial and operational highlights
Basis of presentation
On April 1, 2016, Shaw sold 100% of its wholly owned subsidiary Shaw Media Inc. to Corus
Entertainment Inc. (“Corus”), a related party subject to common voting control for $2.65 billion,
comprised of $1.85 billion in cash and 71,364,853 Corus Class B non-voting participating shares.
Accordingly, the operating results and operating cash flows for the previously reported Media division
are presented as discontinued operations separate from the Company’s continuing operations. Prior
period financial information has been reclassified to present the Media division as a discontinued
operation, and has therefore been excluded from both continuing operations and segmented results for all
periods presented in this MD&A and the accompanying interim financial statements. This MD&A
reflects the results of continuing operations, unless otherwise noted.
Financial Highlights Three months ended November 30,
(millions of Canadian dollars except per share amounts)
2016
2015 Change %
Operations: Revenue 1,313 1,143 14.9
Operating income before restructuring costs and
amortization (1) 539 508
6.1 Operating margin (1) 41.1% 44.4% (3.3pts)
Net income from continuing operations 89 138 (35.5)
Income from discontinued operations, net of tax - 80 (100.0) Net income 89 218 (59.2)
Per share data: Basic and diluted earnings per share
Continuing operations 0.18 0.28
Discontinued operations - 0.15
0.18 0.43
Weighted average participating shares outstanding during period (millions) 487 480
Funds flow from continuing operations (2) 414 347 19.3 Free cash flow(1) 158 173 (8.7)
(1) See definitions and discussion under “Non-IFRS and additional GAAP measures”. (2) Funds flow from operations is before changes in non-cash balances related to operations as presented in the unaudited
interim Consolidated Statements of Cash Flows.

Shaw Communications Inc.
9
Subscriber highlights Change
Three months ended November 30,
November 30, 2016 August 31, 2016 2016 2015
Consumer
Video – Cable 1,657,913 1,671,059 (13,146) (18,029)
Video – Satellite 774,905 790,574 (15,669) (12,927)
Internet 1,804,606 1,787,642 16,964 9,433
Phone 938,918 956,763 (17,845) (22,227)
Total Consumer 5,176,342 5,206,038 (29,696) (43,750)
Business Network
Services
Video – Cable 57,955 61,153 (3,198) (2,871)
Video – Satellite 30,959 30,994 (35) 299
Internet 177,000 179,867 (2,867) (1,015)
Phone 306,692 301,328 5,364 2,497
Total Business
Network Services 572,606 573,342 (736) (1,090)
Wireless
Postpaid 681,335 667,028 14,307 -
Prepaid 371,423 376,260 (4,837) -
Total Wireless 1,052,758 1,043,288 9,470 -
Total Subscribers 6,801,706 6,822,668 (20,962) (44,840)
Overview
Our fiscal 2017 first quarter financial results represent improvements in consolidated revenue and
operating income before restructuring costs and amortization over the first quarter of fiscal 2016.
Highlights of the first quarter financial results are as follows:
Revenue for the quarter of $1.31 billion, an increase of 14.9% from $1.14 billion for the first
quarter of 2016
First quarter operating income before restructuring costs and amortization of $539 million, an
increase of 6.1% from $508 million for the first quarter of 2016
Operating margin for the first quarter of 41.1%, down from 44.4% for the first quarter of 2016
Net income for the first quarter of $89 million, a decrease of 59.2% from $218 million for the
first quarter of 2016
Free cash flow for the first quarter of $158 million, a $15 million decrease from $173 million for
the first quarter of 2016
The period ended with 6,801,706 RGUs, inclusive of 1,052,758 Wireless subscribers. Wireless
subscribers increased by 9,470 in the first quarter. Consumer and Business Network Services had
a combined 30,432 RGU decline in the first quarter compared to a decline of 44,840 for the first
quarter of 2016.
Revenue increased 14.9% for the quarter, primarily due to the acquisition of Freedom Mobile (formerly,
WIND) on March 1, 2016, contributing Wireless revenues of $138 million. The Consumer, Business
Network Services and Business Infrastructure Services divisions also contributed to the consolidated

Shaw Communications Inc.
10
revenue increases for the quarter. In Consumer, the improvement was driven primarily by the August
2016 rate increases, growth in Internet RGUs and a year-over-year decrease in promotional costs.
Revenue increases in the Business Network Services and Business Infrastructure Services divisions were
driven by customer growth in the quarter and the year-over-year impact of the December 2015
acquisition of INetU.
Operating income before restructuring costs and amortization of $539 million for the quarter improved
6.1% compared to $508 million for fiscal 2016. The improvement in the first quarter reflects the added
contribution of $30 million from the Wireless division and increases in the Business Infrastructure
Services and Business Network Services divisions attributable to profitable customer growth and the
acquisition of INetU. These improvements were partially offset by lower operating income before
restructuring costs and amortization in the Consumer division where higher revenue was more than fully
offset by increased costs, primarily programming related.
As compared to the fourth quarter of fiscal 2016, consolidated revenue for the quarter increased 0.5% or
by $7 million to $1.31 billion and operating income before restructuring costs and amortization
decreased 1.8% or by $10 million to $539 million. The improvement in revenue was primarily due to the
August 2016 rate increases in the Consumer division and customer growth in each the Business Network
Services and Business Infrastructure Services divisions offset partially by decreased revenue in the
Wireless division due mostly to lower handset sales. The decrease in operating income before
restructuring costs and amortization was driven primarily by higher costs in the Consumer division
related to an increase in programming costs and the timing of sponsorship related marketing costs.
In the quarter, the Company continued its momentum of improving subscriber trends. Consumer
revenue generating units (“RGUs”) in the first quarter declined by 29,696, a meaningful improvement
over the declines of 37,104 RGUs in the fourth quarter of 2016 and 43,750 RGUs in the first quarter of
2016. The year-over-year improvement was driven by a reduction in cable video and phone RGU losses
in addition to strong Internet RGU net gains of 16,669 reflecting a full quarter impact of our WideOpen
Internet 150 offering launched in August 2016. The decline in Consumer RGUs was also impacted by
the anticipated seasonal disconnections of satellite Video subscribers in the amount of 15,704 RGUs.
The Wireless division added a net 9,470 RGUs, a shortfall from the net gains achieved in the fourth
quarter of fiscal 2016, finishing the period with a total 1,052,758 RGUs. The wireless subscriber results
reflect our focus on the launch of Freedom Mobile, the rollout of our LTE-Advanced network and
significantly heightened competitive activity

Shaw Communications Inc.
11
Net income for the current fiscal quarter of $89 million compared to $154 million in the prior quarter
(August 31, 2016) and $218 million in the comparable quarter of the prior year (November 30, 2015).
The changes in net income are outlined in the following table.
November 30, 2016 net income compared to:
Three months ended Three months ended
(millions of Canadian dollars) August 31, 2016 November 30, 2015
Increased (decreased) operating income before restructuring costs
and amortization (1) (10) 31
Increased restructuring costs (11) (12)
Increased amortization (2) (32)
Change in net other costs and revenue (2) (62) (60)
Decreased (increased) income taxes 30 24
Decreased income from discontinued operations, net of tax (10) (80)
(65) (129)
(1) See definitions and discussion under “Non-IFRS and additional GAAP measures”. (2) Net other costs and revenue includes business acquisition costs, accretion of long-term liabilities and provisions, debt
retirement costs, equity income and losses of an associate or joint venture and other losses as detailed in the unaudited
Consolidated Statements of Income.
First quarter net income decreased $65 million compared to the fourth quarter of fiscal 2016 primarily
due to a non-recurring provision in the amount of $107 million related to the wind down of shomi
operations included in net other costs and revenue for the current quarter offset partially by $27 million
in equity income from our investment in Corus. Also contributing to the decrease in net income was
lower operating income before restructuring costs, higher restructuring costs and lower income from
discontinued operations, partially offset by lower income taxes.
Net income for the current quarter in the amount of $89 million decreased by $129 million relative to the
first quarter of fiscal 2016 mainly due to the non-recurring provision in the amount of $107 million
related to the wind down of our investment in shomi. Net income in the quarter also reflects a decrease
in income from discontinued operations, net of tax, in the amount of $80 million due to the sale of the
former Media division in the third quarter of the prior year which is offset partially by the equity income
of $27 million in the quarter from our investment in Corus.
Free cash flow of $158 million for the quarter compared to $173 million for first quarter of fiscal 2016.
The free cash flow decrease was primarily the result of a reduction in free cash flow from discontinued
operations in the amount of $74 million following the sale of the Media division in 2016 and the addition
of the Wireless division, where capital expenditures of $64 million exceeded $30 million of operating
income before restructuring and amortization for the quarter. These decreases were partially offset by
lower capital investment by Consumer and Business Network Services and Business Infrastructure
Services, a reduction in cash taxes, increased dividends from equity accounted associates and lower
pension funding during the quarter.

Shaw Communications Inc.
12
Outlook
Shaw confirms at this time that there are no changes to our previously issued fiscal 2017 guidance.
Operating income before restructuring costs and amortization is expected to range between $2.125 and
$2.175 billion and free cash flow is expected to exceed $400 million. Consolidated capital investment
targets also remain unchanged from previously provided guidance at $1.3 billion for the year.
See “Caution concerning forward-looking statements”.
Non-IFRS and additional GAAP measures
The Company’s continuous disclosure documents may provide discussion and analysis of non-IFRS
financial measures. These financial measures do not have standard definitions prescribed by IFRS and
therefore may not be comparable to similar measures disclosed by other companies. The Company’s
continuous disclosure documents may also provide discussion and analysis of additional GAAP
measures. Additional GAAP measures include line items, headings, and sub-totals included in the
financial statements.
The Company utilizes these measures in making operating decisions and assessing its performance.
Certain investors, analysts and others utilize these measures in assessing the Company’s operational and
financial performance and as an indicator of its ability to service debt and return cash to shareholders.
The non-IFRS financial measures and additional GAAP measures have not been presented as an
alternative to net income or any other measure of performance required by IFRS.
Below is a discussion of the non-IFRS financial measures and additional GAAP measures used by the
Company and provides a reconciliation to the nearest IFRS measure or provides a reference to such
reconciliation.
Operating income before restructuring costs and amortization
Operating income before restructuring costs and amortization is calculated as revenue less operating,
general and administrative expenses. It is intended to indicate the Company’s ongoing ability to service
and/or incur debt, and is therefore calculated before one-time items such as restructuring costs,
amortization (a non-cash expense) and interest. Operating income before restructuring costs and
amortization is also one of the measures used by the investing community to value the business. Three months ended November 30,
(millions of Canadian dollars)
2016
2015
Operating income from continuing operations 272 285
Add back (deduct): Restructuring costs 12 -
Amortization:
Deferred equipment revenue (14) (19) Deferred equipment costs 34 40
Property, plant and equipment, intangibles and other 235 202
Operating income before restructuring costs and amortization 539 508

Shaw Communications Inc.
13
Operating margin
Operating margin is calculated by dividing operating income before restructuring costs and amortization
by revenue.
Three months ended November 30,
2016 2015 Change
Consumer 42.8% 44.4% (1.6pts)
Business Network Services 50.0% 47.1% 2.9pts Business Infrastructure Services 35.6% 34.2% 1.4pts
Wireless 21.7% - n/a
41.1% 44.4% (3.3pts)
Income from discontinued operations before restructuring costs, amortization, taxes and other
non-operating items
Income from discontinued operations before restructuring costs, amortization, taxes and other non-
operating items is calculated as revenue less operating, general and administrative expenses from
discontinued operations. This measure is used in the determination of free cash flow.
Three months ended November 30,
(millions of Canadian dollars) 2016 2015
Income from discontinued operations, net of tax - 80 Add back (deduct): -
Gain on divestiture, net of tax - -
Income taxes - 29 Restructuring costs - -
Amortization: -
Property, plant and equipment, intangibles and other - 7 Other non-operating items - 2
Income from discontinued operations before restructuring costs, amortization, taxes
and other non-operating items
-
118
Free cash flow
The Company utilizes this measure to assess the Company’s ability to repay debt and pay dividends to
shareholders. Free cash flow is calculated as free cash flow from continuing operations and free cash
flow from discontinued operations.
Free cash flow from continuing operations is comprised of operating income before restructuring costs
and amortization adding dividends from equity accounted associates, changes in receivable related
balances with respect to customer equipment financing transactions as a cash item and deducting capital
expenditures (on an accrual basis and net of proceeds on capital dispositions) and equipment costs (net),
interest, cash taxes paid or payable, dividends paid on the preferred shares, recurring cash funding of
pension amounts net of pension expense and adjusted to exclude share-based compensation expense.
Free cash flow from continuing operations has not been reported on a segmented basis. Certain
components of free cash flow from continuing operations, including operating income before
restructuring costs and amortization continue to be reported on a segmented basis. Capital expenditures
and equipment costs (net) are reported on a combined basis for Consumer and Business Network
Services due to the common infrastructure and separately for Business Infrastructure Services and
Wireless. Other items, including interest and cash taxes, are not generally directly attributable to a
segment, and are reported on a consolidated basis.
Free cash flow from discontinued operations is comprised of income from discontinued operations
before restructuring costs, amortization, taxes and other non-operating items after deducting capital
expenditures (on an accrual basis and net of proceeds on capital dispositions), cash taxes paid or payable,

Shaw Communications Inc.
14
program rights amortization on assets held for sale, cash amounts associated with funding CRTC benefit
obligations related to media acquisitions, recurring cash funding of pension amounts net of pension
expense and excludes non-controlling interest amounts that are included in the income from discontinued
operations before restructuring costs, amortization, taxes and other non-operating items.
Free cash flow is calculated as follows:
Three months ended November 30,
(millions of Canadian dollars)
2016
2015
Change
%
Revenue Consumer 947 943 0.4
Business Network Services 144 136 5.9
Business Infrastructure Services 90 73 23.3 Wireless 138 - n/a
1,319 1,152 14.5
Intersegment eliminations (6) (9) 33.3
1,313 1,143 14.9
Operating income before restructuring
costs and amortization (1)
Consumer 405 419 (3.3) Business Network Services 72 64 12.5
Business Infrastructure Services 32 25 28.0
Wireless 30 - n/a
539 508 6.1
Capital expenditures and equipment costs (net):(2)
Consumer and Business Network Services 205 215 (4.7) Business Infrastructure Services 21 30 (30.0)
Wireless 64 - n/a
290 245 18.4
Free cash flow before the following 249 263 (5.3) Less:
Interest (73) (73) -
Cash taxes (44) (68) (35.3)
Other adjustments:
Dividends from equity accounted
associates
21
-
n/a Non-cash share-based compensation 1 1 -
Pension adjustment 4 (23) (>100.0) Customer equipment financing 2 2 -
Preferred share dividends (2) (3) (33.3)
Free cash flow from continuing
operations
158 99
59.6
Income from discontinued operations
before restructuring costs, amortization,
taxes and other non-operating items
- 118
n/a Less:
Capital expenditures - (1) n/a
Cash taxes - (29) n/a CRTC benefit obligation funding - (4) n/a
Non-controlling interests - (9) n/a
Pension adjustment - (1) n/a
Free cash flow from discontinued
operations
- 74
n/a
Free cash flow 158 173 (8.7)
(1) See definitions and discussion under “Non-IFRS and additional GAAP measures”. (2) Per Note 4 to the unaudited interim Consolidated Financial Statements.

Shaw Communications Inc.
15
Discussion of operations
Consumer Three months ended November 30,
(millions of Canadian dollars)
2016
2015
Change %
Revenue 947 943 0.4
Operating income before restructuring costs and amortization (1) 405 419 (3.3)
Operating margin (1) 42.8% 44.4% (1.6pts)
(1) See definitions and discussion under “Non-IFRS and additional GAAP measures”.
In the quarter, net gains achieved in Internet RGUs of 16,964 were more than fully offset by phone and
Video RGU declines, including the anticipated seasonal disconnections of satellite Video subscribers in
the fall months. In aggregate, Consumer RGUs in the first quarter declined by 29,696 RGUs, a
meaningful improvement over the first quarter of fiscal 2016 where RGUs declined 43,750. The
improvement over the prior year was due primarily to the market launch of WideOpen Internet 150,
together with a reduction in phone unbundling activity from a year ago and lower cable video RGU
losses. Despite the continued improvements in RGU trends, the economic slowdown in parts of western
Canada, competitive pressures and wireline substitution continue to put downward pressure on
Consumer RGUs.
Consumer revenue for the current quarter of $947 million marginally improved by 0.4% or $4 million
compared to the prior year period. Improvements in revenue were driven by August 2016 rate increases,
growth in Internet RGUs and a year-over-year decrease in promotional costs.
Operating income before restructuring costs and amortization for the quarter of $405 million was lower
by 3.3% relative to the comparable quarter. The reduction in operating margin results in the quarter
primarily reflect higher expenses, most notably the impact of higher programming costs which more than
fully offset the revenue growth achieved in the period.
As compared to the fourth quarter of fiscal 2016, the current quarter revenue improved 1.0% or $9
million. Improvements were driven primarily by a full quarter of the August 2016 rate increase, lower
promotional costs and a full quarter of revenue from our reconnected customers in Fort McMurray.
These gains were partially offset by RGU declines and lower On Demand revenues. Operating income
before restructuring costs and amortization decreased 3.1% or by $13 million reflecting higher expenses
most notably programming costs and timing of various other administrative costs including sponsorship
related marketing costs.
On January 11, 2017, we announced a significant milestone in our video technology roadmap with the
market launch of BlueSky TV. BlueSky’s TV experience, powered by Comcast’s X1 technology,
provides ease-of-use and customization that is unprecedented in Canada. This leading technology
experience is now available to customers in Calgary, with subsequent launches in the remaining major
cities in our footprint planned throughout fiscal 2017. Also in the quarter, we shifted our In-Home
Technician team to a hybrid unit-based installation and service technician model, combining a
foundation of customer experience with technical skill that will deliver annualized operating cost savings
of approximately $16 million. This initiative resulted in a non-recurring restructuring charge of $10
million in the quarter.

Shaw Communications Inc.
16
Business Network Services
Three months ended November 30,
(millions of Canadian dollars)
2016
2015
Change
%
Revenue 144 136 5.9
Operating income before restructuring costs and amortization (1) 72 64 12.5
Operating margin (1) 50.0% 47.1% 2.9pts
(1) See definitions and discussion under “Non-IFRS and additional GAAP measures”.
Revenue of $144 million for the quarter was up 5.9% over the comparable period. The business,
excluding satellite services, increased revenues 7.7% in the current quarter primarily due to our
continued growth across the entire customer base as well as an August 2016 rate increase for video,
Internet and phone products.
Operating income before restructuring costs and amortization of $72 million for the quarter improved
12.5% over the comparable period. Consistent with the growth trends achieved in fiscal 2016, current
quarter improvements were due mainly to profitable customer growth partially offset by the incremental
costs associated with pursuing new customer opportunities including additional employee and marketing
related costs.
Revenue improved 2.9% or by $4 million over the fourth quarter of fiscal 2016, primarily due to
customer growth across our entire customer base as well as a full quarter of revenue after the August
2016 rate increases in our video, Internet and phone products. Operating income before restructuring
costs and amortization also improved by 2.9% or by $2 million over the fourth quarter due mainly to the
profitable customer growth.
Business Infrastructure Services
Three months ended November 30,
(millions of Canadian dollars)
2016
2015
Change %
Revenue 90 73 23.3 Operating income before restructuring costs and amortization (1) 32 25 28.0
Operating margin (1) 35.6% 34.2% 1.4pts
(1) See definitions and discussion under “Non-IFRS and additional GAAP measures”.
Revenue of $90 million for the current quarter increased 23.3% over the comparable period primarily
due to the December 2015 acquisition of INetU and continued customer growth. Excluding the effect of
foreign exchange, revenue for the U.S. based operations increased by 21.3% to US$67 million for the
three month period. Excluding the effect of INetU, revenue for the U.S. based operations increased by
5.6% to US$59 million for the three month period.
Operating income before restructuring costs and amortization improved over the comparable period by
28.0% for the current quarter. Excluding the effect of foreign exchange, operating income before
restructuring costs and amortization for the U.S. based operations increased by 22.9% to US$25 million
for the three month period. Year-over-year improvements were primarily due to the acquisition of INetU
and profitable customer growth.
Compared to the fourth quarter of 2016, revenue increased 4.7% or by $4 million and operating income
before restructuring costs and amortization was comparable as the incremental margin earned on
customer growth was offset by the timing of certain annual administrative costs and planned IT-related
enhancement costs incurred in the quarter. Excluding the impact of foreign exchange, revenue and
Shaw Communications Inc.
17
operating income before restructuring costs and amortization for U.S. based operations increased 1.5%
and flat respectively, compared to the fourth quarter of fiscal 2016.
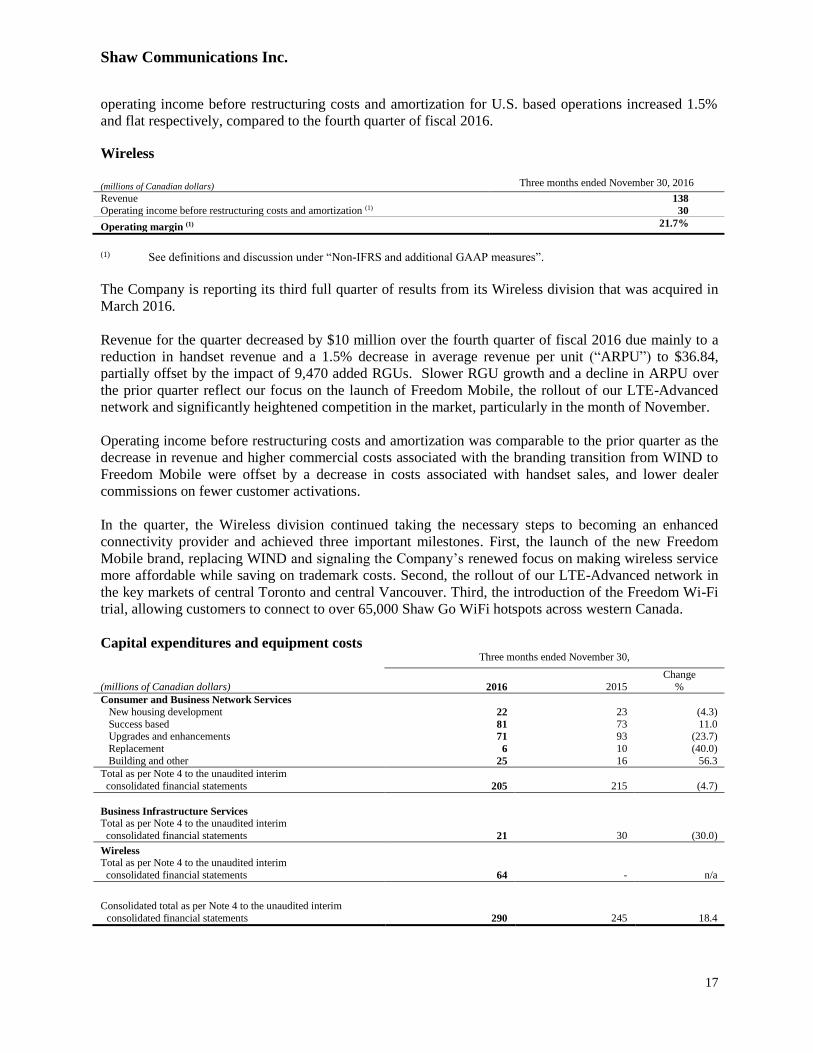
Wireless
(millions of Canadian dollars) Three months ended November 30, 2016
Revenue 138
Operating income before restructuring costs and amortization (1) 30
Operating margin (1) 21.7%
(1) See definitions and discussion under “Non-IFRS and additional GAAP measures”.
The Company is reporting its third full quarter of results from its Wireless division that was acquired in
March 2016.
Revenue for the quarter decreased by $10 million over the fourth quarter of fiscal 2016 due mainly to a
reduction in handset revenue and a 1.5% decrease in average revenue per unit (“ARPU”) to $36.84,
partially offset by the impact of 9,470 added RGUs. Slower RGU growth and a decline in ARPU over
the prior quarter reflect our focus on the launch of Freedom Mobile, the rollout of our LTE-Advanced
network and significantly heightened competition in the market, particularly in the month of November.
Operating income before restructuring costs and amortization was comparable to the prior quarter as the
decrease in revenue and higher commercial costs associated with the branding transition from WIND to
Freedom Mobile were offset by a decrease in costs associated with handset sales, and lower dealer
commissions on fewer customer activations.
In the quarter, the Wireless division continued taking the necessary steps to becoming an enhanced
connectivity provider and achieved three important milestones. First, the launch of the new Freedom
Mobile brand, replacing WIND and signaling the Company’s renewed focus on making wireless service
more affordable while saving on trademark costs. Second, the rollout of our LTE-Advanced network in
the key markets of central Toronto and central Vancouver. Third, the introduction of the Freedom Wi-Fi
trial, allowing customers to connect to over 65,000 Shaw Go WiFi hotspots across western Canada.
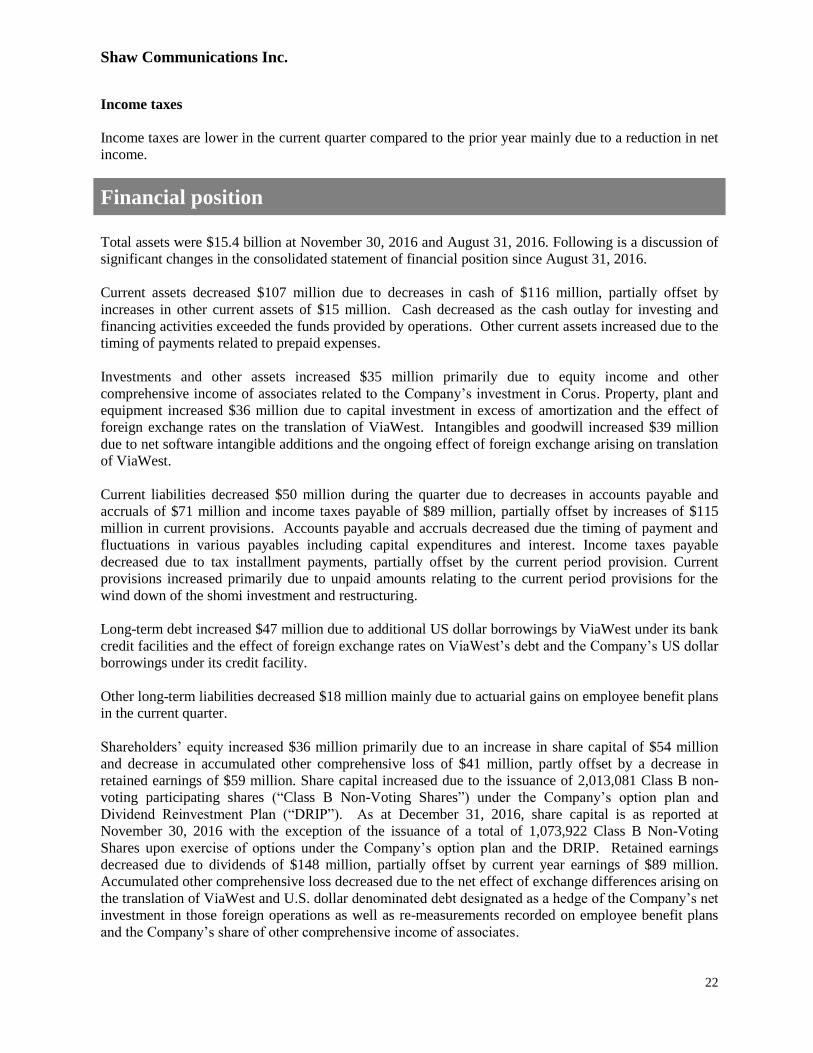
Capital expenditures and equipment costs
Three months ended November 30,
(millions of Canadian dollars)
2016
2015
Change
%
Consumer and Business Network Services
New housing development 22 23 (4.3)
Success based 81 73 11.0 Upgrades and enhancements 71 93 (23.7)
Replacement 6 10 (40.0)
Building and other 25 16 56.3
Total as per Note 4 to the unaudited interim
consolidated financial statements 205 215 (4.7)
Business Infrastructure Services Total as per Note 4 to the unaudited interim
consolidated financial statements 21 30 (30.0)
Wireless Total as per Note 4 to the unaudited interim
consolidated financial statements 64 - n/a
Consolidated total as per Note 4 to the unaudited interim
consolidated financial statements 290 245 18.4

Shaw Communications Inc.
18
Capital investment was $290 million in the current quarter, an 18.4% increase over the comparable
period investment of $245 million driven primarily by the $64 million of added capital expenditures
from the Wireless division.
Consumer and Business Network Services
The combined Consumer and Business Network Services divisions investment in capital reduced 4.7%
or $10 million compared to the first quarter of fiscal 2016 primarily due to lower planned capital spend
on plant upgrades and enhancements offset partially by an increase in success based capital.
Success based capital for the quarter of $81 million was 11% higher than in the prior year. The higher
capital spend was driven primarily by advanced Internet WiFi modem purchases and installs offset
partially by lower phone installations.
For the quarter, investment in the combined upgrades and enhancement and replacement categories was
$77 million, a 25% decrease over the prior year due mostly to the timing of spend in network capacity
upgrades in support of enhanced broadband capacity and DOCSIS 3.1.
Investment in buildings and other of $25 million for the quarter was up $9 million over the comparable
period. The increase relates mostly to refurbishment expenditures in owned corporate facilities.
Business Infrastructure Services
Capital investment of $21 million for the quarter, decreased 30% or by $9 million primarily due to higher
spend in the prior year related to the investment in the Calgary, Alberta data centre. The current quarter
spend relates primarily to capital invested in core infrastructure and equipment to deploy customer
solutions.
Wireless
Capital investment of $64 million for the quarter represented investment for the continued improvement
in the network infrastructure primarily in the LTE-Advanced core and the radio network rollout readiness
project across the network as well as capital investments made on the upgrade of back office systems.

Shaw Communications Inc.
19
Discontinued operations – Shaw Media
On April 1, 2016, Shaw sold 100% of its wholly owned subsidiary Shaw Media Inc. to Corus, a related
party subject to common voting control for $2.65 billion, comprised of $1.85 billion in cash and
71,364,853 Corus Class B non-voting participating shares. Accordingly, the operating results and
operating cash flows for the previously reported Media division are presented as discontinued operations
separate from the Company’s continuing operations. Prior period financial information has been
reclassified to present the Media division as a discontinued operation. Three months ended November 30,
2016 2015
Revenue - 294 Eliminations(1) - (19)
- 275
Operating, general and administrative expenses
Employee salaries and benefits - 45 Purchases of goods and services - 131
- 176
Eliminations(1) - (19)
- 157
Amortization - 7
Accretion of long-term liabilities and provisions - 1 Other losses - 1
Income from discontinued operations before tax and gain on divestiture - 109
Income taxes - 29
Income (loss) from discontinued operations, net of tax - 80
(1) Eliminations relate to intercompany transactions between continuing and discontinued operations. The costs are
included in continuing operations as they are expected to continue to be incurred subsequent to the disposition.
Supplementary quarterly financial information
Quarter
Revenue
Operating
income before
restructuring
costs and
amortization (1)
Net income from
continuing
operations
attributable to
equity shareholders
Net income
attributable
to equity
shareholders
Net income (2)
Basic and
Diluted earnings
per share from
continuing
operations
Basic and
Diluted
earnings per
share
(millions of Canadian dollars except per share amounts)
2017
First 1,313 539 89 89 89 0.18 0.18
2016
Fourth 1,306 549 144 154 154 0.29 0.31
Third 1,283 555 58 700 704 0.11 1.44
Second 1,151 502 116 156 164 0.24 0.32
First 1,144 508 138 209 218 0.28 0.43
2015
Fourth 1,131 525 247 272 276 0.51 0.57
Third 1,135 527 136 202 209 0.28 0.42
Second 1,118 498 135 163 168 0.28 0.34
(1) See definition and discussion under “Non-IFRS and additional GAAP measures”. (2) Net income attributable to both equity shareholders and non-controlling interests
In the first quarter of fiscal 2017, net income decreased $65 million compared to the fourth quarter of
fiscal 2016 mainly due to a non-recurring provision related to the wind down of shomi operations
included in net other costs and revenue for the current quarter. Also contributing to the decreased net
income was lower operating income before restructuring costs and amortization, higher restructuring
charges and lower income from discontinued operations, partially offset by $27 equity income from our

Shaw Communications Inc.
20
investment in Corus and lower income taxes. See “Other income and expense items” for further detail
on non-operating items.
In the fourth quarter of fiscal 2016 net income decreased $550 million compared to the third quarter of
fiscal 2016 mainly due to lower income from discontinued operations relating primarily to the gain on
the divestiture of the former Media division recorded in the third quarter, decreased operating income
before restructuring costs and amortization, and higher income taxes. Partly offsetting the decrease in
net income were decreases in net other costs and revenues and restructuring costs. Net other costs and
revenue decreased primarily due to non-recurring charges recorded in the third quarter, including a $17
million impairment of goodwill relating to the Tracking business, a $51 million impairment of the
Company’s joint venture investment in shomi, a $20 million write-down of a private portfolio
investment, $12 million acquisition related costs and a $10 million loss from an equity accounted
associate.
Net income for the third quarter of fiscal 2016 increased $540 million compared to the second quarter of
fiscal 2016 mainly due to higher income from discontinued operations relating primarily to the gain on
the divestiture of the former Media division, increased operating income before restructuring costs and
amortization and lower income taxes. Partly offsetting the net income improvement in the quarter were:
i) decreased net other costs and revenue; ii) increased restructuring charges; and iii) increased
amortization. Net other costs and revenue decreased primarily due to $17 million impairment of
goodwill relating to the Tracking operations in the Business Networks Services division, a $51 million
impairment of the Company’s shomi joint venture investment, a $20 million write-down of a private
portfolio investment and a $10 loss from an equity accounted associate.
In the second quarter of fiscal 2016, net income decreased $54 million compared to the first quarter of
fiscal 2016 mainly due to decreased income from discontinued operations of $32 million, primarily due
to the seasonality of the Media business reflected in income from discontinued operations, net of tax, and
net other costs and revenue of $13 million. Net other costs and revenues decreased primarily due to $8
million of costs recorded in the quarter related to the acquisition of WIND and INetU.
In the first quarter of fiscal 2016, net income decreased $58 million compared to the fourth quarter of
2015 mainly due to a change in net other costs and revenues of $140 million and decrease in operating
income before restructuring costs and amortization of $17 million offset by an increase in income from
discontinued operations, net of tax, of $51 million and a decrease in income taxes of $50 million. Net
other costs and revenue decreased primarily due to a fourth quarter fiscal 2015 gain on the sale of
wireless spectrum of $158 million less the impact of a $27 million write-down of a private portfolio
investment in the same period offset by an increase in the equity loss of a joint venture interest in shomi
of $5 million in the first quarter of fiscal 2016.
In the fourth quarter of fiscal 2015, net income increased $67 million primarily due to improved net other
costs and revenue items of $191 million partially offset by lower income from discontinued operations,
net of tax, of $44 million and higher income tax expense of $70 million. The improvement in net other
costs and revenue items was due to the combined effect of the aforementioned sale of spectrum licenses
and write-down of a private portfolio investment during the fourth quarter and the $59 million net charge
arising in the third quarter related to an impairment of goodwill, write-down of IPTV assets and proceeds
received from the Shaw Court insurance claim.
In the third quarter of fiscal 2015, net income increased $41 million due to higher operating income
before restructuring costs and amortization of $29 million, an increase in income from discontinued
operations, net of tax, of $40 million, lower restructuring costs of $35 million and $11 million of
proceeds related to the Shaw Court insurance claim, partially offset by a charge for impairment of
goodwill of $15 million and write-down of IPTV assets of $55 million as well as the distributions

Shaw Communications Inc.
21
received from a venture capital fund in the second quarter. The impairment of goodwill was in respect of
the Tracking operations in the Business Network Services division and was a result of the Company’s
annual impairment test of goodwill and indefinite-life intangibles in the third quarter. The write-down of
IPTV assets was a result of the Company’s decision to work with Comcast to begin technical trials of
their cloud-based X1 platform.
In the second quarter of fiscal 2015, net income decreased $59 million due to lower income from
discontinued operations, net of tax, of $46 million and restructuring expenses of $36 million partially
offset by higher operating income before restructuring costs and amortization of $10 million, net other
costs and revenue items of $24 million due to the aforementioned venture capital fund distributions.
Other income and expense items
Amortization Three months ended November 30,
(millions of Canadian dollars)
2016
2015
Change %
Amortization revenue (expense)
Deferred equipment revenue 14 19 (26.3) Deferred equipment costs (34) (40) 15.0
Property, plant and equipment,
intangibles and other
(235)
(202)
16.3
Amortization of property, plant and equipment, intangibles and other increased 16.3% over the
comparable quarter due to amortization related to the new Wireless division and the amortization of new
expenditures exceeding the amortization of assets that became fully amortized during the periods.
Amortization of financing costs and Interest expense
Three months ended November 30,
(millions of Canadian dollars)
2016
2015
Change
%
Amortization of financing costs –
long-term debt
1
1
-
Interest expense 73 73 -
Interest expense for the quarter was comparable to the same period in the prior year.
Equity income (loss) of an associate or joint venture
For the quarter the Company recorded equity income of $27 million related to its interest in Corus. In
the comparable period, the Company recorded equity losses of $18 million related to its interest in
shomi.
Other losses
In the current quarter, the category is comprised primarily of a $107 million provision in respect of the
Company’s investment in shomi which announced a wind down of operations during the quarter. This
category also includes realized and unrealized foreign exchange gains and losses on U.S. dollar
denominated current assets and liabilities, gains and losses on disposal of property, plant and equipment
and minor investments, and the Company’s share of the operations of Burrard Landing Lot 2 Holdings
Partnership.
Shaw Communications Inc.
22
Income taxes
Income taxes are lower in the current quarter compared to the prior year mainly due to a reduction in net
income.
Financial position
Total assets were $15.4 billion at November 30, 2016 and August 31, 2016. Following is a discussion of
significant changes in the consolidated statement of financial position since August 31, 2016.
Current assets decreased $107 million due to decreases in cash of $116 million, partially offset by
increases in other current assets of $15 million. Cash decreased as the cash outlay for investing and
financing activities exceeded the funds provided by operations. Other current assets increased due to the
timing of payments related to prepaid expenses.
Investments and other assets increased $35 million primarily due to equity income and other
comprehensive income of associates related to the Company’s investment in Corus. Property, plant and
equipment increased $36 million due to capital investment in excess of amortization and the effect of
foreign exchange rates on the translation of ViaWest. Intangibles and goodwill increased $39 million
due to net software intangible additions and the ongoing effect of foreign exchange arising on translation
of ViaWest.
Current liabilities decreased $50 million during the quarter due to decreases in accounts payable and
accruals of $71 million and income taxes payable of $89 million, partially offset by increases of $115
million in current provisions. Accounts payable and accruals decreased due the timing of payment and
fluctuations in various payables including capital expenditures and interest. Income taxes payable
decreased due to tax installment payments, partially offset by the current period provision. Current
provisions increased primarily due to unpaid amounts relating to the current period provisions for the
wind down of the shomi investment and restructuring.
Long-term debt increased $47 million due to additional US dollar borrowings by ViaWest under its bank
credit facilities and the effect of foreign exchange rates on ViaWest’s debt and the Company’s US dollar
borrowings under its credit facility.
Other long-term liabilities decreased $18 million mainly due to actuarial gains on employee benefit plans
in the current quarter.
Shareholders’ equity increased $36 million primarily due to an increase in share capital of $54 million
and decrease in accumulated other comprehensive loss of $41 million, partly offset by a decrease in
retained earnings of $59 million. Share capital increased due to the issuance of 2,013,081 Class B non-
voting participating shares (“Class B Non-Voting Shares”) under the Company’s option plan and
Dividend Reinvestment Plan (“DRIP”). As at December 31, 2016, share capital is as reported at
November 30, 2016 with the exception of the issuance of a total of 1,073,922 Class B Non-Voting
Shares upon exercise of options under the Company’s option plan and the DRIP. Retained earnings
decreased due to dividends of $148 million, partially offset by current year earnings of $89 million.
Accumulated other comprehensive loss decreased due to the net effect of exchange differences arising on
the translation of ViaWest and U.S. dollar denominated debt designated as a hedge of the Company’s net
investment in those foreign operations as well as re-measurements recorded on employee benefit plans
and the Company’s share of other comprehensive income of associates.

Shaw Communications Inc.
23
Liquidity and capital resources
In the current quarter, the Company generated $158 million of free cash flow. Shaw used its free cash
flow along with cash of $116 million, borrowings of $20 million under ViaWest’s credit facility and
proceeds on issuance of Class B Non-Voting Shares of $3 million to fund the net working capital change
of $160 million, pay common share dividends of $96 million, make $31 million in financial investments,
pay $3 million in restructuring costs and pay $7 million in other net items.
The Company issues Class B Non-Voting Shares from treasury under its DRIP which resulted in cash
savings and incremental Class B Non-Voting Shares of $49 million during the three months ending
November 30, 2016. On December 16, 2016, the Company amended its DRIP to permit eligible
shareholders who are residents of the United States to enroll their Class A Participating Shares and Class
B Non-voting Participating Shares in the DRIP. Prior to this amendment, the DRIP was only available to
eligible shareholders who were residents of Canada.
As at November 30, 2016, the Company had $289 million of cash on hand, as well as approximately
$970 million of available credit under its $1.5 billion bank credit facility. On December 15, 2016, the
Company amended the terms of this bank credit facility to extend the maturity date from December 2019
to December 2021. The facility is used for working capital and general corporate purposes.
Shaw’s and ViaWest’s credit facilities are subject to customary covenants which include maintaining
minimum or maximum financial ratios.
Covenant Limit
Shaw Credit Facilities
Total Debt to Operating Cash Flow(1) Ratio < 5.00:1 Operating Cash Flow(1) to Fixed Charges(2) Ratio > 2.00:1
ViaWest Credit Facilities
Total Net Leverage Ratio(3) ≤ 6.50:1 (1) Operating Cash Flow, for the purposes of the covenants, is calculated as net earnings before interest expense, depreciation,
amortization and current and deferred income taxes, excluding profit or loss from investments accounted for on an equity basis, for
the most recently completed fiscal quarter multiplied by four, plus cash dividends and other cash distributions received in the most recently completed four fiscal quarters from investments accounted for on an equity basis.
(2) Fixed Charges are defined as the aggregate of interest expense for the most recently completed fiscal quarter multiplied by four and
dividends paid or accrued on shares (other than participating shares) during the most recently completed four fiscal quarters. (3) Total Net Leverage Ratio is calculated as the ratio of consolidated total debt under the facility as of the last day of the most recent
completed four fiscal quarters to Consolidated Adjusted EBITDA of ViaWest for the same period. Consolidated Adjusted EBITDA,
for the purposes of the covenants, is calculated similar to Operating income before restructuring and amortization with adjustments for certain items such as one-time expenses and extraordinary items.
At November 30, 2016 Shaw is in compliance with these covenants and based on current business plans,
the Company is not aware of any condition or event that would give rise to non-compliance with the
covenants over the life of the borrowings.
Based on the aforementioned financing activities, available credit facilities and forecasted free cash flow,
the Company expects to have sufficient liquidity to fund operations and obligations, including maturing
debt, during the upcoming fiscal year. On a longer-term basis, Shaw expects to generate free cash flow
and have borrowing capacity sufficient to finance foreseeable future business plans and refinance
maturing debt.

Shaw Communications Inc.
24
Cash Flow from Operations
Operating Activities Three months ended November 30,
(millions of Canadian dollars)
2016
2015
Change
%
Funds flow from operations 414 347 19.3
Net change in non-cash balances related to
operations
(151)
(89)
(69.7)
Operating activities of discontinued operations
-
46
(100.0)
263 304 (13.5)
For the three month period ended November 30, 2016, funds flow from operations increased over the
comparable period primarily due to higher operating income before restructuring costs and amortization,
lower income tax expense and lower pension funding, partially offset by higher restructuring costs
recorded during the quarter. The net change in non-cash working capital balances related to operations
fluctuated over the comparative periods due to changes in accounts receivable balances and the timing of
payment of current income taxes payable and accounts payable and accrued liabilities.
Investing Activities Three months ended November 30,
(millions of Canadian dollars) 2016 2015 Decrease
Cash flow used in investing activities (301) (324) 23
The cash used in investing activities decreased over the comparable quarter due primarily to reduced
cash outlays for capital expenditures in the current year.
Financing Activities
The changes in financing activities during the comparative periods were as follows:
Three months ended November 30,
(millions of Canadian dollars) 2016 2015
Bank loans – net borrowings - - ViaWest’s credit facility and finance lease obligations 18 (2)
WIND finance lease obligations (1) -
Bank facility arrangement costs - (1) Dividends (98) (98)
Issuance of Class B Non-Voting Shares 3 6
Financing activities of discontinued operations - -
(78) (95)
Accounting standards
The MD&A included in the Company’s August 31, 2016 Annual Report outlined critical accounting
policies, including key estimates and assumptions that management has made under these policies, and
how they affect the amounts reported in the Consolidated Financial Statements. The MD&A also
describes significant accounting policies where alternatives exist. The condensed interim consolidated
financial statements follow the same accounting policies and methods of application as the most recent
annual consolidated financial statements except as described below.

Shaw Communications Inc.
25
Change in accounting policy
In November 2016, the IFRS Interpretations Committee (“the Committee”) published a summary of its
meeting discussion regarding a request to clarify how an entity determines the expected manner of
recovery of an intangible asset with an indefinite useful life for the purposes of measuring deferred tax in
accordance with IAS 12 Income Taxes. Although the Committee decided not to add this issue to its
agenda, the Committee noted that an intangible asset with an indefinite useful life is not a non-
depreciable asset because a non-depreciable asset has an unlimited (or infinite) life, and that indefinite
does not mean infinite. Consequently, the fact that an entity does not amortize an intangible asset with an
indefinite useful life does not necessarily mean that the entity will recover the carrying amount of that
asset only through sale and not through use. As such, the Company changed retrospectively its
accounting policy for the accounting of deferred tax on intangible assets with indefinite useful lives to be
in line with the Committee discussions.
The following table summarizes the impact of this change of accounting policy on previously reported
consolidated statements of financial position. The change of accounting policy did not have an impact
on the previously reported consolidated statements of income or consolidated statements of cash flows.
Increase (decrease) to previously reported amounts: As at August 31,
(millions of Canadian dollars) 2016 2015
Goodwill 143 182
Deferred income tax liabilities 740 779
Retained earnings (1) (597) (597) (1) Included in Shareholders’ equity - Common and preferred shareholders
Related Party Transactions
The Company’s transactions with related parties are discussed in its Management’s Discussion and
Analysis for the year ended August 31, 2016 under “Related Party Transactions” and under Note 27 of
the Consolidated Financial Statements of the Company for the year ended August 31, 2016. There has
been no material change in the Company’s transactions with related parties between August 31, 2016 and
November 30, 2016.
Financial Instruments
There has been no material change in the Company’s risk management practices with respect to financial
instruments between August 31, 2016 and November 30, 2016. See “Known Events, Trends and
Uncertainties – Interest Rates, Foreign Exchange Rates and Capital Markets” in the Company’s
Management’s Discussion and Analysis for the year ended August 31, 2016 and the section entitled
“Risk Management” under Note 28 of the Consolidated Financial Statements of the Company for the
year ended August 31, 2016.
Risks and Uncertainties
The significant risks and uncertainties affecting the Company and its business are discussed in the
Company’s August 31, 2016 Annual Report under “Known events, trends, risks and uncertainties” in
Management’s Discussion and Analysis.

Shaw Communications Inc.
26
CONSOLIDATED STATEMENTS OF FINANCIAL POSITION (unaudited)
[millions of Canadian dollars] November 30, 2016
August 31, 2016
August 31, 2015
(restated, note 2) (restated, note 2)
ASSETS
Current
Cash 289 405 398
Accounts receivable 259 268 468
Inventories 68 65 60
Other current assets 153 138 78
Asset held for sale - - 5
769 876 1,009
Investments and other assets [notes 12 and 13] 888 853 97
Property, plant and equipment 4,643 4,607 4,220
Other long-term assets 281 275 259
Deferred income tax assets 6 6 14
Intangibles 7,466 7,450 7,459
Goodwill 1,338 1,315 1,688
15,391 15,382 14,746
LIABILITIES AND SHAREHOLDERS’ EQUITY
Current
Accounts payable and accrued liabilities 873 944 887
Provisions 148 33 52
Income taxes payable 126 215 195
Unearned revenue 210 215 196
Current portion of long-term debt [notes 7 and 12] 412 412 608
1,769 1,819 1,938
Long-term debt [notes 7 and 12] 5,247 5,200 5,061
Other long-term liabilities 117 135 186
Provisions 54 53 10
Deferred credits 557 563 588
Deferred income tax liabilities 1,913 1,914 1,914
9,657 9,684 9,697
Shareholders’ equity [notes 8 and 10]
Common and preferred shareholders 5,733 5,697 4,812
Non-controlling interests in subsidiaries 1 1 237
5,734 5,698 5,049
15,391 15,382 14,746
See accompanying notes.

Shaw Communications Inc.
27
CONSOLIDATED STATEMENTS OF INCOME (unaudited)
Three months ended November 30,
(millions of Canadian dollars) 2016 2015
Revenue [note 4] 1,313 1,143
Operating, general and administrative expenses [note 6] (774) (635)
Restructuring costs [notes 6 and 14] (12) - Amortization:
Deferred equipment revenue 14 19
Deferred equipment costs (34) (40) Property, plant and equipment, intangibles and other (235) (202)
Operating income from continuing operations 272 285
Amortization of financing costs – long-term debt (1) (1) Interest expense (73) (73)
Business acquisition costs - (1)
Equity income (loss) of an associate or joint venture 27 (18) Other losses [note 15] (108) (2)
Income from continuing operations before income taxes 117 190
Current income tax expense [note 4] 39 63 Deferred income tax recovery (11) (11)
Net income from continuing operations 89 138
Income from discontinued operations, net of tax [note 3] - 80
Net income 89 218
Net income from continuing operations attributable to:
Equity shareholders 89 138
Income from discontinued operations attributable to:
Equity shareholders - 72 Non-controlling interests in subsidiaries held for sale - 8
- 80
Basic earnings per share [note 9]
Continuing operations 0.18 0.28 Discontinued operations - 0.15
0.18 0.43
Diluted earnings per share [note 9] Continuing operations 0.18 0.28
Discontinued operations - 0.15
0.18 0.43
See accompanying notes.

Shaw Communications Inc.
28
CONSOLIDATED STATEMENTS OF COMPREHENSIVE INCOME (unaudited)
Three months ended November 30,
(millions of Canadian dollars) 2016 2015
Net income 89 218
Other comprehensive income (loss) [note 10]
Items that may subsequently be reclassified to income:
Change in unrealized fair value of derivatives designated as cash flow hedges 2 -
Adjustment for hedged items recognized in the period (1) - Share of other comprehensive income of associates 8 -
Exchange differences on translation of a foreign operation 27 15
Exchange differences on US denominated debt hedging a foreign operation
(12) (6)
24 9
Items that will not subsequently be reclassified to income:
Remeasurements on employee benefit plans:
Continuing operations 17 5
Discontinued operations - 4
41 18
Comprehensive income 130 236
Comprehensive income attributable to:
Equity shareholders 130 227 Non-controlling interests in subsidiaries - 9
130 236
See accompanying notes.

Shaw Communications Inc.
29
CONSOLIDATED STATEMENTS OF CHANGES IN SHAREHOLDERS’ EQUITY (unaudited)
Three months ended November 30, 2016
Attributable to equity shareholders
[millions of Canadian dollars]
Share
capital
Contributed
surplus
Retained earnings
(restated,
note 2)
Accumulated other
comprehensive
loss
Total
Equity attributable to
non-controlling
interests
Total
equity
Balance as at September 1, 2016 3,799 42 1,908 (52) 5,697 1 5,698
Net income - - 89 - 89 - 89
Other comprehensive income - - - 41 41 - 41
Comprehensive income - - 89 41 130 - 130
Dividends - - (99) - (99) - (99)
Dividend reinvestment plan 49 - (49) - - - -
Shares issued under stock option plan 5 (1) - - 4 - 4
Share-based compensation - 1 - - 1 - 1
Distributions declared by subsidiaries
to non-controlling interests
-
-
-
-
-
-
-
Balance as at November 30, 2016 3,853 42 1,849 (11) 5,733 1 5,734
Three months ended November 30, 2015
Attributable to equity shareholders
[millions of Canadian dollars]
Share capital
Contributed surplus
Retained
earnings
(restated, note 2)
Accumulated
other
comprehensive loss
Total
Equity
attributable to
non-controlling interests
Total equity
Balance as at September 1, 2015 3,500 45 1,286 (19) 4,812 237 5,049
Net income - - 209 - 209 9 218
Other comprehensive income - - - 18 18 - 18
Comprehensive income - - 209 18 227 9 236
Dividends - - (99) - (99) - (99)
Dividend reinvestment plan 46 - (46) - - - -
Shares issued under stock option plan 7 (1) - - 6 - 6
Share-based compensation - 1 - - 1 - 1
Distributions declared by subsidiaries to non-controlling interests - - - - - - -
Balance as at November 30, 2015 3,553 45 1,350 (1) 4,947 246 5,193

Shaw Communications Inc.
30
CONSOLIDATED STATEMENTS OF CASH FLOWS (unaudited)
Three months ended November 30,
(millions of Canadian dollars) 2016 2015
OPERATING ACTIVITIES
Funds flow from continuing operations [note 11] 414 347
Net change in non-cash balances related to continuing operations (151) (89)
Operating activities of discontinued operations - 46
263 304
INVESTING ACTIVITIES
Additions to property, plant and equipment [note 4] (240) (267)
Additions to equipment costs (net) [note 4] (23) (24)
Additions to other intangibles [note 4] (27) (22)
Net additions to inventories (2) -
Business acquisitions, net of cash acquired - (2)
Additions to investments and other assets (9) (11)
Distributions received and proceeds from sale of investments - 2
Proceeds on disposal of property, plant and equipment - 6
Investing activities of discontinued operations - (6)
(301) (324)
FINANCING ACTIVITIES
Increase in long-term debt 20 -
Debt repayments (3) (2)
Bank facility arrangement costs - (1)
Issue of Class B Non-Voting Shares [note 8] 3 6
Dividends paid on Class A Shares and Class B Non-Voting
Shares
(96) (95)
Dividends paid on Preferred Shares (2) (3)
Financing activities of discontinued operations - -
(78) (95)
Effect of currency translation on cash balances -
Decrease in cash (116) (115)
Cash, beginning of the period 405 398
Cash of continuing operations, end of the period 289 283

Shaw Communications Inc.
NOTES TO CONDENSED CONSOLIDATED FINANCIAL STATEMENTS
(unaudited)
November 30, 2016 and 2015
[all amounts in millions of Canadian dollars, except share and per share amounts]
31
1. CORPORATE INFORMATION
Shaw Communications Inc. (the “Company”) is a diversified Canadian communications company whose core
operating business is providing: Cable telecommunications and Satellite video services to residential customers
("Consumer"); data networking, Cable telecommunications, Satellite video and fleet tracking services to businesses
and public sector entities ("Business Network Services"); data centre colocation, cloud technology and managed IT
solutions to businesses (“Business Infrastructure Services”); and wireless services for voice and data
communications (“Wireless”). The Company’s shares are listed on the Toronto Stock Exchange (“TSX”), TSX
Venture Exchange and New York Stock Exchange.
2. BASIS OF PRESENTATION AND ACCOUNTING POLICIES
Statement of compliance
These condensed interim consolidated financial statements of the Company have been prepared in accordance with
International Financial Reporting Standards (“IFRS”) and in compliance with International Accounting Standard
(“IAS”) 34 Interim Financial Reporting as issued by the International Accounting Standards Board (“IASB”).
The condensed interim consolidated financial statements of the Company for the months ended November 30, 2016
were authorized for issue by the Audit Committee of the Board of Directors on January 11, 2017.
Basis of presentation
These condensed interim consolidated financial statements have been prepared primarily under the historical cost
convention except as detailed in the significant accounting policies disclosed in the Company’s consolidated
financial statements for the year ended August 31, 2016 and are expressed in millions of Canadian dollars unless
otherwise indicated. The condensed interim consolidated statements of income are presented using the nature
classification for expenses.
The notes presented in these condensed interim consolidated financial statements include only significant events and
transactions occurring since the Company’s last fiscal year end and are not fully inclusive of all matters required to
be disclosed by IFRS in the Company’s annual consolidated financial statements. As a result, these condensed
interim consolidated financial statements should be read in conjunction with the Company’s consolidated financial
statements for the year ended August 31, 2016.
The condensed interim consolidated financial statements follow the same accounting policies and methods of
application as the most recent annual consolidated financial statements except as noted below.
Discontinued operations
The Company reports financial results for discontinued operations separately from continuing operations to
distinguish the financial impact of disposal transactions from ongoing operations. Discontinued operations reporting
occurs when the disposal of a component or a group of components of the Company represents a strategic shift that
will have a major impact on the Company’s operations and financial results, and where the operations and cash
flows can be clearly distinguished, operationally and for financial reporting purposes, from the rest of the Company.
The results of discontinued operations are excluded from both continuing operations and business segment
information in the interim consolidated financial statements and the notes to the interim consolidated financial
statements, unless otherwise noted, and are presented net of tax in the statement of income for the current and
comparative periods. Refer to Note 3 Discontinued Operations for further information regarding the Company’s
discontinued operations.

Shaw Communications Inc.
NOTES TO CONDENSED CONSOLIDATED FINANCIAL STATEMENTS (unaudited)
November 30, 2016 and 2015
[all amounts in millions of Canadian dollars, except share and per share amounts]
32
Change in accounting policy
In November 2016, the IFRS Interpretations Committee (“the Committee”) published a summary of its meeting
discussion regarding a request to clarify how an entity determines the expected manner of recovery of an intangible
asset with an indefinite useful life for the purposes of measuring deferred tax in accordance with IAS 12 Income
Taxes. Although the Committee decided not to add this issue to its agenda, the Committee noted that an intangible
asset with an indefinite useful life is not a non-depreciable asset because a non-depreciable asset has an unlimited
(or infinite) life, and that indefinite does not mean infinite. Consequently, the fact that an entity does not amortize an
intangible asset with an indefinite useful life does not necessarily mean that the entity will recover the carrying
amount of that asset only through sale and not through use. As such, the Company changed retrospectively its
accounting policy for the accounting of deferred tax on intangible assets with indefinite useful lives to be in line
with the Committee discussions.
The following table summarizes the impact of this change of accounting policy on previously reported consolidated
statements of financial position. The change of accounting policy did not have an impact on the previously reported
consolidated statements of income or consolidated statements of cash flows.
Increase (decrease) to previously reported amounts As at August 31,
2016 2015
Goodwill 143 182 Deferred income tax liabilities 740 779
Retained earnings (1) (597) (597)
(1) Included in Shareholders’ equity - Common and preferred shareholders
3. DISCONTINUED OPERATIONS
In the second quarter of fiscal 2016, the Company announced it entered into an agreement with Corus Entertainment
Inc. (“Corus”), a related party subject to common voting control, to sell 100% of its wholly owned subsidiary Shaw
Media Inc. (“Shaw Media”) for a purchase price of approximately $2.65 billion comprised of $1.85 billion of cash
and 71,364,853 Corus Class B non-voting participating shares. The transaction closed on April 1, 2016, but remains
subject to customary closing adjustments.
Although, through holding of the shares in Corus, the Company effectively retains an indirect, non-controlling
interest in the former Media division subsequent to the sale, the Company no longer has control over the division.
Accordingly, the operating results and operating cash flows for the previously reported Media segment are presented
as discontinued operations separate from the Company’s continuing operations. Prior period financial information
has been reclassified to present the former Media division as a discontinued operation.

Shaw Communications Inc.
NOTES TO CONDENSED CONSOLIDATED FINANCIAL STATEMENTS (unaudited)
November 30, 2016 and 2015
[all amounts in millions of Canadian dollars, except share and per share amounts]
33
A reconciliation of the major classes of line items constituting income from discontinued operations, net of tax, as
presented in the consolidated statements of income is as follows:
Three months ended November 30,
2016 2015
Revenue - 294
Eliminations(1) - (19)
- 275
Operating, general and administrative expenses Employee salaries and benefits - 45
Purchases of goods and services - 131
- 176 Eliminations(1) - (19)
- 157
Restructuring costs - - Amortization - 7
Accretion of long-term liabilities and provisions - 1
Other losses - 1
Income from discontinued operations before tax and gain on
divestiture
- 109
Income taxes - 29
Income from discontinued operations before gain on
divestiture
- 80
Gain on divestiture, net of tax - -
Income from discontinued operations, net of tax - 80
(1) Eliminations relate to intercompany transactions between continuing and discontinued operations. The costs are
included in continuing operations as they continue to be incurred subsequent to the disposition.
4. BUSINESS SEGMENT INFORMATION
The Company’s chief operating decision makers are the CEO, President and CFO and they review the operating
performance of the Company by segments which comprise Consumer, Business Network Services, Business
Infrastructure Services and Wireless. The chief operating decision makers utilize operating income before
restructuring costs and amortization for each segment as a key measure in making operating decisions and assessing
performance. The Consumer segment provides Cable telecommunications services including Video, Internet, WiFi
and Phone, and Satellite Video, to Canadian consumers. The Business Network Services segment provides data
networking, video, voice and Internet services through a national fibre-optic backbone network and also provides
satellite Video services, and fleet tracking services to North American businesses and public sector entities. The
Business Infrastructure Services segment provides data centre colocation, cloud and managed services to North
American and European businesses. The Wireless segment, formed by the acquisition of Freedom Mobile
(formerly, WIND Mobile) on March 1, 2016, provides wireless services for voice and data communications serving
customers in Ontario, British Columbia and Alberta. All of the Company’s reportable segments are substantially
located in Canada with the exception of Business Infrastructure Services, consisting primarily of ViaWest which has
operations located in the United States and Europe. Information on operations by segment is as follows:

Shaw Communications Inc.
NOTES TO CONDENSED CONSOLIDATED FINANCIAL STATEMENTS (unaudited)
November 30, 2016 and 2015
[all amounts in millions of Canadian dollars, except share and per share amounts]
34
Operating information Three months ended November 30,
2016 2015
Revenue Consumer 947 943
Business Network Services 144 136
Business Infrastructure Services 90 73 Wireless 138 -
1,319 1,152
Intersegment eliminations (6) (9)
1,313 1,143
Operating income before restructuring costs and amortization
Consumer 405 419
Business Network Services 72 64 Business Infrastructure Services 32 25
Wireless 30 -
539 508 Restructuring costs (12) -
Amortization (255) (223)
Operating income 272 285
Current taxes Operating 44 68
Other/non-operating (5) (5)
39 63
Capital expenditures Three months ended November 30,
2016 2015
Capital expenditures accrual basis
Consumer and Business Network Services (1) 180 189 Business Infrastructure Services 21 30
Wireless 64 -
265 219
Equipment costs (net of revenue) Consumer and Business Network Services 25 26
Capital expenditures and equipment costs (net)
Consumer and Business Network Services 205 215 Business Infrastructure Services 21 30
Wireless 64 -
290 245

Shaw Communications Inc.
NOTES TO CONDENSED CONSOLIDATED FINANCIAL STATEMENTS (unaudited)
November 30, 2016 and 2015
[all amounts in millions of Canadian dollars, except share and per share amounts]
35
Three months ended November 30,
2016 2015
Reconciliation to Consolidated Statements of Cash Flows
Additions to property, plant and equipment 240 267 Additions to equipment costs (net) 23 24
Additions to other intangibles 27 22
Total of capital expenditures and equipment costs (net) per Consolidated Statements of Cash Flows
290
313
Increase/decrease in working capital and other liabilities
related to capital expenditures
-
(63) Decrease in customer equipment financing receivables 1 2
Less: Proceeds on disposal of property, plant and
equipment
-
(6) Less: Satellite equipment profit (1) (1) (1)
Total capital expenditures and equipment costs (net)
reported by segments
290
245
(1) The profit from the sale of satellite equipment is subtracted from the calculation of segmented capital expenditures
and equipment costs (net) as the Company views the profit on sale as a recovery of expenditures on customer premise
equipment.
5. PROVISIONS
During the quarter, shomi, a joint venture of the Company and Rogers Communications Inc., announced the
decision to wind down its operations with service ending on November 30, 2016. The Company has recorded a
provision of $107 in the quarter relating to the wind down of the investment.
6. OPERATING, GENERAL AND ADMINISTRATIVE EXPENSES AND RESTRUCTURING
COSTS
Three months ended November 30
2016 2015
Employee salaries and benefits 232 202 Purchase of goods and services 554 433
786 635

Shaw Communications Inc.
NOTES TO CONDENSED CONSOLIDATED FINANCIAL STATEMENTS (unaudited)
November 30, 2016 and 2015
[all amounts in millions of Canadian dollars, except share and per share amounts]
36
7. LONG-TERM DEBT
November 30, 2016 August 31, 2016
Long-term
debt at
amortized
cost
Adjustment
for finance
costs
Long-term
debt repayable
at maturity
Long-term debt at
amortized
cost
Adjustment
for finance
costs
Long-term debt
repayable at
maturity
$ $ $ $ $ $
Corporate
Bank loans (1) 510 - 510 498 - 498
Cdn fixed rate senior notes- 5.70% due March 2, 2017 400 - 400 400 - 400
5.65% due October 1, 2019 1,247 3 1,250 1,246 4 1,250
5.50% due December 7, 2020 498 2 500 498 2 500 3.15% due February 19, 2021 298 2 300 298 2 300
4.35% due January 31, 2024 497 3 500 497 3 500 6.75% due November 9, 2039 1,418 32 1,450 1,418 32 1,450
4,868 42 4,910 4,855 43 4,898
Other
ViaWest – credit facility 718 13 731 682 13 695 ViaWest – other 30 - 30 31 - 31
Freedom Mobile - other 3 - 3 4 - 4
Burrard Landing Lot 2 Holdings Partnership 40 - 40 40 - 40
Total consolidated debt 5,659 55 5,714 5,612 56 5,668
Less current portion (2) 412 - 412 412 - 412
5,247 55 5,302 5,200 56 5,256
(1) Bank loans include borrowings of USD $380 at November 30, 2016 (August 31, 2016 – USD $380). Subsequent to the period end, the
Company amended the terms of its bank credit facility to extend the maturity date to December 2021. (2) Current portion of long-term debt includes the 5.70% senior notes due March 2017, amounts due within one year in respect of ViaWest’s
term loan, and ViaWest’s and Freedom Mobile’s finance lease obligations and landlord debt.
8. SHARE CAPITAL
Changes in share capital during the three months ended November 30, 2016 are as follows:
Class A Shares
Class B Non-Voting
Shares
Series A
Preferred Shares
Series B
Preferred Shares
Number $ Number $ Number $ Number $
August 31, 2016 22,420,064 2 463,827,512 3,504 10,012,393 245 1,987,607 48
Issued upon stock option plan
exercises - - 150,619 5
- - - - Issued pursuant to dividend
reinvestment plan - - 1,862,462 49
- - - -
November 30, 2016 22,420,064 2 465,840,593 3,558 10,012,393 245 1,987,607 48

Shaw Communications Inc.
NOTES TO CONDENSED CONSOLIDATED FINANCIAL STATEMENTS (unaudited)
November 30, 2016 and 2015
[all amounts in millions of Canadian dollars, except share and per share amounts]
37
9. EARNINGS PER SHARE
Earnings per share calculations are as follows:
Three months ended November 30,
2016 2015
Numerator for basic and diluted earnings per share ($)
Net income from continuing operations 89 138
Deduct: dividends on Preferred Shares (2) (3)
Net income attributable to common shareholders from continuing operations 87 135
Net income from discontinued operations - 80
Deduct: net income from discontinued operations attributable to non-controlling interests - (8)
Net income from discontinued operations attributable to common shareholders - 72
Net income attributable to common shareholders 87 207
Denominator (millions of shares) Weighted average number of Class A Shares and Class B Non-Voting Shares for basic earnings
per share
487 480
Effect of dilutive securities (1) 1 1
Weighted average number of Class A Shares and Class B Non-Voting Shares for diluted
earnings per share
488
481
Basic earnings per share ($) Continuing operations 0.18 0.28
Discontinued operations - 0.15
Attributable to common shareholders 0.18 0.43
Diluted earnings per share ($)
Continuing operations 0.18 0.28 Discontinued operations - 0.15
Attributable to common shareholders 0.18 0.43
(1) The earnings per share calculation does not take into consideration the potential dilutive effect of certain stock options since
their impact is anti-dilutive. For the three months ended November 30, 2016, 1,808,474 (2015 – 2,957,853) options were
excluded from the diluted earnings per share calculation.
10. OTHER COMPREHENSIVE INCOME AND ACCUMULATED OTHER COMPREHENSIVE
LOSS
Components of other comprehensive income and the related income tax effects for the three months ended November
30, 2016 are as follows: Amount
$
Income
taxes
$
Net
$
Items that may subsequently be reclassified to income
Change in unrealized fair value of derivatives designated as cash flow hedges 3 (1) 2
Adjustment for hedged items recognized in the period (1) - (1)
Share of other comprehensive income of associates 8 - 8
Exchange differences on translation of a foreign operation 27 - 27
Exchange differences on translation of US denominated debt hedging a foreign operation (12) - (12)
25 (1) 24
Items that will not be subsequently be reclassified to income
Remeasurements on employee benefit plans:
Continuing operations 23 (6) 17
Discontinued operations - - -
48 (7) 41

Shaw Communications Inc.
NOTES TO CONDENSED CONSOLIDATED FINANCIAL STATEMENTS (unaudited)
November 30, 2016 and 2015
[all amounts in millions of Canadian dollars, except share and per share amounts]
38
Components of other comprehensive income and the related income tax effects for the three months ended
November 30, 2015 are as follows: Amount
$
Income
taxes
$
Net
$
Items that may subsequently be reclassified to income
Exchange differences on translation of a foreign operation 15 - 15
Exchange differences on translation of US denominated debt hedging a foreign operation (6) - (6)
9 - 9
Items that will not be subsequently be reclassified to income
Remeasurements on employee benefit plans:
Continuing operations 7 (2) 5
Discontinued operations 5 (1) 4
21 (3) 18
Accumulated other comprehensive loss is comprised of the following: November 30, 2016
$
August 31, 2016
$
Items that may subsequently be reclassified to income
Change in unrealized fair value of derivatives designated as cash flow hedges 3 1
Share of other comprehensive income of associates 3 (5)
Foreign currency translation adjustments 122 108
Items that will not be subsequently reclassified to income
Remeasurements on employee benefit plans:
Continuing operations (139) (156)
Discontinued operations - -
(11) (52)
11. STATEMENTS OF CASH FLOWS
Disclosures with respect to the Consolidated Statements of Cash Flows are as follows:
(i) Funds flow from continuing operations
Three months ended November 30,
2016 2015
Net income from continuing operations 89 138
Adjustments to reconcile net income to funds flow from operations: Amortization 256 224
Deferred income tax recovery (11) (11)
Share-based compensation 1 1 Defined benefit pension plans 4 (23)
Equity loss (income) of an associate or joint venture (27) 18
Provision for investment loss 107 - Other (5) -
Funds flow from continuing operations 414 347

Shaw Communications Inc.
NOTES TO CONDENSED CONSOLIDATED FINANCIAL STATEMENTS (unaudited)
November 30, 2016 and 2015
[all amounts in millions of Canadian dollars, except share and per share amounts]
39
(ii) Interest and income taxes paid and interest received and classified as operating activities are as follows:
Three months ended November 30,
2016 2015
Interest paid 109 113 Income taxes paid (net of refunds) 128 123
Interest received 1 1
(iii) Non-cash transactions:
The Consolidated Statements of Cash Flows exclude the following non-cash transactions:
Three months ended November 30,
2016 2015
Issuance of Class B Non-Voting Shares: Dividend reinvestment plan 49 46
12. FAIR VALUE
Fair value estimates are made at a specific point in time, based on relevant market information and information
about the financial instrument. These estimates are subjective in nature and involve uncertainties and matters of
significant judgement and, therefore, cannot be determined with precision. Changes in assumptions could
significantly affect the estimates.
Financial instruments
The fair value of financial instruments has been determined as follows:
(i) Current assets and current liabilities
The fair value of financial instruments included in current assets and current liabilities approximates their
carrying value due to their short-term nature.
(ii) Investments and other assets and other long-term assets
The fair value of publicly traded investments is determined by quoted market prices. Investments in private
entities which do not have quoted market prices in an active market and whose fair value cannot be readily
measured are carried at cost. No published market exists for such investments. These equity investments have
been made as they are considered to have the potential to provide future benefit to the Company and
accordingly, the Company has no current intention to dispose of these investments in the near term. The fair
value of long-term receivables approximates their carrying value as they are recorded at the net present values
of their future cash flows, using an appropriate discount rate.
(iii) Long-term debt
The carrying value of long-term debt is at amortized cost based on the initial fair value as determined at the time
of issuance or at the time of a business acquisition. The fair value of publicly traded notes is based upon current
trading values. The fair value of finance lease obligations is determined by discounting future cash flows using
a rate for loans with similar terms, conditions and maturity dates. The carrying value of bank credit facilities
approximates fair value as the debt bears interest at rates that fluctuate with market values. Other notes and
debentures are valued based upon current trading values for similar instruments.

Shaw Communications Inc.
NOTES TO CONDENSED CONSOLIDATED FINANCIAL STATEMENTS (unaudited)
November 30, 2016 and 2015
[all amounts in millions of Canadian dollars, except share and per share amounts]
40
(iv) Other long-term liabilities
The fair value of contingent consideration arising from a business acquisition is determined by calculating the
present value of the probability weighted assessment of the likelihood that revenue targets will be met and the
estimated timing of such payments.
(v) Derivative financial instruments
The fair value of US currency forward purchase contracts is determined by an estimated credit-adjusted mark-
to-market valuation using observable forward exchange rates at the end of reporting periods and contract
forward rates.
The carrying values and estimated fair values of long-term debt and a contingent liability are as follows:
November 30, 2016 August 31, 2016
Carrying
value
Estimated
fair value
Carrying
value
Estimated
fair value
$ $ $ $
Liabilities
Long-term debt (including current portion) (1) 5,659 6,211 5,612 6,252
Contingent liability(2) 1 1 2 2
(1) Level 2 fair value – determined by valuation techniques using inputs based on observable market data, either directly or indirectly, other than quoted prices.
(2) Level 3 fair value – determined by valuation techniques using inputs that are not based on observable market data.
13. INVESTMENTS AND OTHER ASSETS
Corus Entertainment Inc.
In connection with the sale of the Media division to Corus in 2016, the Company received 71,364,853 Corus Class B
non-voting participating shares representing approximately 37% of Corus’ total issued equity of Class A and Class
B shares. The Company participates in Corus’ dividend reinvestment program for this initial investment in Corus
Class B Shares. For the three month period ended November 30, 2016, the Company received dividends of $21
from Corus, of which $20 were reinvested in additional Corus Class B shares. At November 30, 2016, the Company
owned 75,922,254 Corus Class B shares having a fair value of $919 and representing 38% of the total issued equity
of Corus. The Company’s weighted average ownership of Corus for the period from September 1 to November 30,
2016 was 38%.
Summary financial information for Corus as at November 30, 2016 and for the three months then ended is as
follows:
November 30, 2016
$
Current assets 531
Non-current assets 5,643
Current liabilities (614)
Non-current liabilities (3,022)
Net assets 2,538
Less: non-controlling interests (155)
2,383
Carrying amount of the investment 851

Shaw Communications Inc.
NOTES TO CONDENSED CONSOLIDATED FINANCIAL STATEMENTS (unaudited)
November 30, 2016 and 2015
[all amounts in millions of Canadian dollars, except share and per share amounts]
41
Three months ended
November 30, 2016
$
Revenue 468
Net income (loss) attributable to:
Shareholders 71
Non-controlling interest 10
81
Other comprehensive income, attributable to shareholders 20
Comprehensive income 101
Equity income from associates(1) 27
Other comprehensive income from equity accounted associates(1) 8
35
(1) The Company’s share of income and other comprehensive income reflect the weighted average proportion of Corus net
income and other comprehensive income attributable to shareholders for the period.
14. RESTRUCTURING COSTS
During 2016, the Company underwent a restructuring following a set of significant asset realignment initiatives,
including the acquisition of Freedom Mobile and the divestiture of Shaw Media.
During the current quarter, the Company restructured certain operations within the Consumer segment. In
connection with the restructuring, the Company recorded $12 primarily related to severance and employee related
costs in respect of the approximate 250 affected employees. The majority of the remaining costs are expected to be
paid in the current year. The continuity of the restructuring provisions follows.
$
Balance as at September 1, 2016 4
Additions 12
Payments (4)
Balance as at November 30, 2016 12
15. OTHER LOSSES
In the current quarter, other losses include a provision of $107 in respect of the Company’s investment in shomi
which announced a wind down of operations during the quarter. Other gains/losses generally includes realized and
unrealized foreign exchange gains and losses on US dollar denominated current assets and liabilities, gains and
losses on disposal of property, plant and equipment and minor investments, and the Company’s share of the
operations of Burrard Landing Lot 2 Holdings Partnership.