Embed Size (px)
Citation preview

The key financial metrics under IFRS compared to CGAAP for the 2011 financial year are as follows:
• Return on equity of 20.3%, compared to 18.8% under CGAAP
• Diluted earnings per share of $4.57, compared to $4.62 under CGAAP
• Net income of $5,330 million, compared to $5,268 million under CGAAP
• Productivity ratio(1) of 53.9%, compared to 54.4% under CGAAP
(1) Refer to page 3 for a discussion of non-IFRS measures.
Scotiabank Provides 2011 Results and Financial Position under International
Financial Reporting Standards
ToRonTo, January 24, 2012 – Scotiabank has adopted the International Financial Reporting Standards (IFRS) issued by the International Accounting Standards Board effective November 1, 2011, which replaced Canadian generally accepted accounting principles (CGAAP). Scotiabank will prepare its financial statements in accordance with IFRS beginning in the first quarter of 2012 which will include comparative financial information for 2011.
This report summarizes the impact of IFRS on the 2011 comparative net income, business segment results, financial position, shareholders’ equity, October 31, 2011 balance sheet and key performance metrics. This information is provided to assist users of the financial statements to better understand the impact of the adoption of IFRS on Scotiabank’s 2011 comparative financial information. This information reflects the first-time adoption elections and accounting policy choices made by the Bank and should be read in conjunction with the MD&A (pages 83-89) found in the Bank’s 2011 Annual Report. Adjusted supplementary financial information for the 2011 comparative results under IFRS is also available today at www.scotiabank.com.
overview and key financial measuresScotiabank’s net income under IFRS for the year ended October 31, 2011 was $5,330 million. This was $62 million higher than net income under CGAAP for the same period. Net income attributable to common shareholders under IFRS was $4,965 million versus $4,959 million under CGAAP. Basic earnings per share and diluted earnings per share under IFRS were $4.63 and $4.57, respectively, compared to $4.62 for both basic and diluted earnings per share for the same period under CGAAP.
News Release – Impact of IFRS
Contents
4 Effect of IFRS on net income for 2011 – Reconciliation of CGAAP net income to IFRS net income (4)
– Presentation changes in consolidated statement of income (5)
– Business segment results (7)
– Quarterly results (8) •EffectofIFRSonquarterlynet income for 2011 (8) • Quarterlybusinesssegmentresults(8)
9 EffectofIFRSonquarterlyconsolidated financial position
– Reconciliationofshareholders’equity(9)
– ReconciliationofCGAAPbalancesheet to IFRS (10)
12 Effect of IFRS on consolidated statement of cash flows
12 Key performance metrics
® Registered Trademark of The Bank of Nova Scotia.

2
Forward-looking statements Our public communications often include oral or written forward-looking statements. Statements
of this type are included in this document, and may be included in other filings with Canadian securities regulators or the
U.S. Securities and Exchange Commission, or in other communications. All such statements are made pursuant to the
“safe harbour” provisions of the United States Private Securities Litigation Reform Act of 1995 and any applicable Canadian
securities legislation. Forward-looking statements may include comments with respect to the Bank’s objectives, strategies
to achieve those objectives, expected financial results (including those in the area of risk management), and the outlook for
the Bank’s businesses and for the Canadian, United States and global economies. Such statements are typically identified by
words or phrases such as “believe”, “expect”, “anticipate”, “intent”, “estimate”, “plan”, “may increase”, “may fluctuate”, and
similar expressions of future or conditional verbs, such as “will”, “should”, “would” and “could”.
By their very nature, forward-looking statements involve numerous assumptions, inherent risks and uncertainties, both
general and specific, and the risk that predictions and other forward-looking statements will not prove to be accurate.
Do not unduly rely on forward-looking statements, as a number of important factors, many of which are beyond our
control, could cause actual results to differ materially from the estimates and intentions expressed in such forward-looking
statements. These factors include, but are not limited to: the economic and financial conditions in Canada and globally;
fluctuations in interest rates and currency values; liquidity; significant market volatility and interruptions; the failure of third
parties to comply with their obligations to us and our affiliates; the effect of changes in monetary policy; legislative and
regulatory developments in Canada and elsewhere, including changes in tax laws; the effect of changes to our credit ratings;
amendments to, and interpretations of, risk-based capital guidelines and reporting instructions and liquidity regulatory
guidance; operational and reputational risks; the risk that the Bank’s risk management models may not take into account
all relevant factors; the accuracy and completeness of information the Bank receives on customers and counterparties; the
timely development and introduction of new products and services in receptive markets; the Bank’s ability to expand existing
distribution channels and to develop and realize revenues from new distribution channels; the Bank’s ability to complete
and integrate acquisitions and its other growth strategies; changes in accounting policies and methods the Bank uses to
report its financial condition and the results of its operations, including uncertainties associated with critical accounting
assumptions and estimates; the effect of applying future accounting changes; global capital markets activity; the Bank’s ability
to attract and retain key executives; reliance on third parties to provide components of the Bank’s business infrastructure;
unexpected changes in consumer spending and saving habits; technological developments; fraud by internal or external
parties, including the use of new technologies in unprecedented ways to defraud the Bank or its customers; consolidation
in the Canadian financial services sector; competition, both from new entrants and established competitors; judicial and
regulatory proceedings; acts of God, such as earthquakes and hurricanes; the possible impact of international conflicts
and other developments, including terrorist acts and war on terrorism; the effects of disease or illness on local, national or
international economies; disruptions to public infrastructure, including transportation, communication, power and water; and
the Bank’s anticipation of and success in managing the risks implied by the foregoing. A substantial amount of the Bank’s
business involves making loans or otherwise committing resources to specific companies, industries or countries. Unforeseen
events affecting such borrowers, industries or countries could have a material adverse effect on the Bank’s financial results,
businesses, financial condition or liquidity. These and other factors may cause the Bank’s actual performance to differ
materially from that contemplated by forward-looking statements. For more information, see the discussion starting on page
63 of the Bank’s 2011 Annual Report.
The preceding list of important factors is not exhaustive. When relying on forward-looking statements to make decisions
with respect to the Bank and its securities, investors and others should carefully consider the preceding factors, other
uncertainties and potential events. The Bank does not undertake to update any forward-looking statements, whether written
or oral, that may be made from time to time by or on its behalf.
Additional information relating to the Bank, including the Bank’s Annual Information Form, can be located on the SEDAR
website at www.sedar.com and on the EDGAR section of the SEC’s website at www.sec.gov.

3
The Bank uses a number of financial measures to assess its
performance. Some of these measures are not calculated in
accordance with IFRS, are not defined by IFRS and do not
have standardized meaning that would ensure consistency
and comparability among companies using these measures.
Taxable equivalent basis
The Bank analyzes net interest income, other operating
income and total revenues on a taxable equivalent basis
(TEB). This methodology grosses up tax-exempt income
earned on certain securities reported in either net interest
income or other operating income to an equivalent before
tax basis. A corresponding increase is made to the provision
for income taxes; hence, there is no impact on net income.
Management believes that this basis for measurement
provides a uniform comparability of net interest income,
other operating income and total revenues arising from
both taxable and non-taxable sources and facilitates a
consistent basis of measurement. While other banks also
use TEB, their methodology may not be comparable to the
Bank’s methodology. For purposes of segmented reporting, a
segment’s revenue and provision for income taxes are grossed
up by the taxable equivalent amount. The elimination of the
TEB gross up is recorded in the Other segment.
Productivity ratio (TEB)
Management uses the productivity ratio as a measure of the
Bank’s efficiency. This ratio represents non-interest expenses
as a percentage of total revenue on a taxable equivalent basis.
Impairment losses on financial investments were reported
as other income under CGAAP and are now separately
disclosed under IFRS and not included in total revenue.
The impairment on financial investments is included in the
calculation of the productivity ratio.
Net interest margin on total average assets (TEB)
This ratio represents net interest income on a taxable
equivalent basis as a percentage of total average assets.
Return on equity
Return on equity is a profitability measure that presents
the net income attributable to common shareholders as
a percentage of common shareholders’ equity. The Bank
calculates its return on equity using average common
shareholders’ equity.
Economic equity and return on economic equity
For internal reporting purposes, the Bank attributes capital
to its business segments based on their risk profile and uses
a methodology that considers credit, market, operational and
other risks inherent in each business segment. The amount
of risk capital attributed is commonly referred to as economic
equity. Return on economic equity for the business segment
is calculated as a ratio of Adjusted Net Income of the business
segment and the economic equity attributed. Adjusted Net
Income is net income attributable to common shareholders
grossed up for the incremental cost of non-common equity
capital instruments.
Use of non-IFRS financial measures

4
Effect of IFRS on net income for 2011
Reconciliation of CGAAP net income to IFRS net income For the year ended(Unaudited) ($ millions) October 31, 2011Net income under CGAAP $5,268Adjustments under IFRS: Consolidation Consolidation of SPEs (a-i) 15 Capital instruments (a-ii) 58 (a) 73 Securitization (b) (97) Employee benefits (c) 25 Changes in functional currency (d) 51 Foreign exchange translation of available-for-sale equity securities (e) 13 Other (f) (3) Subtotal - adjustments under IFRS 62 Net income under IFRS $5,330
The following discussion provides a summary of the impact the
adoption of IFRS had on the comparative year consolidated
statement of income for the year ended October 31, 2011.
The information provided should be read in conjunction with
2011 audited consolidated financial statements and the Future
Accounting Changes disclosed in the MD&A on pages 83 to 89
of the Bank’s 2011 Annual Report.
a-i) Consolidation of SPEs
The Bank consolidated certain special purpose entities (SPEs)
under IFRS that were previously not consolidated under
CGAAP. The adjustment to net income captures the impact of
consolidation of these SPEs along with any related impact on
hedges that were in place under CGAAP.
In 2012, the consolidated SPEs will continue to have a
modest impact on net income under IFRS.
a-ii) Capital instruments
Certain capital instruments issued by the trusts, that were
consolidated under IFRS, were either wholly or in part
assessed to be non-common equity. As a result, income under
IFRS is higher, as a portion of the previously recorded interest
expense is reflected as a distribution to equity holders.
However, there is no impact on net income attributable to
common shareholders or basic earnings per share.
In 2012, the impact is expected to remain consistent
with 2011.
b) Securitization
As a result of differences in derecognition criteria between
IFRS and CGAAP, the Bank’s transfers of insured residential
mortgages to Canada Housing Trusts (CHT) through the
Canadian Government Canada Mortgage Bond (CMB) program
do not meet the derecognition criteria and, hence, have been
accounted for as secured borrowing transactions under IFRS.
Under CGAAP, these mortgages were considered to be
sold and a gain on sale was recorded. Seller swaps between
the Bank and CHT were recorded and marked to market.
Under IFRS, the mortgages remain on balance sheet, a related
funding liability is recorded and the seller swaps are no
longer recorded on the balance sheet. The difference in net
income under IFRS is due to recognition of the income on the
mortgages, interest expense on the related funding, reversal of
the gain on sale and reversal of the MTM on the seller swaps.
In 2012, the securitization program will reflect the secured
borrowing nature of the transaction capturing only the net spread
on the mortgages, which will be recognized over the life of the
mortgages. In addition, there will be no volatility due to gains on
sale of mortgages and/or MTM fluctuations on the seller swaps.
c) Employee benefits
The recognition of previously unrecognized cumulative
actuarial losses in retained earnings, upon transition to IFRS,
results in a lower pension expense in future periods.
In the second quarter of 2011, there was a cost of living
adjustment made to the pension plan. This was recognized
immediately in the consolidated statement of income under
IFRS, but was amortized under CGAAP.
In 2012, the pension expense should remain substantially
consistent, however no pension adjustments are expected.
d) Changes in functional currency
IFRS requires that the functional currency for each foreign
operation be determined based on the primary economic
environment and primary factors in which the entity
operates, with less emphasis on secondary factors. The
changes in functional currency impacts the foreign currency
translation of foreign investments, as well as any related
hedges in place over the net investments.
Under IFRS, the Bank assessed and determined changes
in functional currency for a small number of foreign
operations. The foreign exchange translation gains/losses of
Summary of key differences

5
Diluted earnings per share
these operations are taken to net income instead of other
comprehensive income. Net investment hedges that were
in place for these operations under CGAAP did not qualify
under IFRS, causing the foreign exchange impact of these
hedges to flow to net income instead of other comprehensive
income. During 2011, certain new hedging strategies were
implemented which offset any impact from functional
currency changes for the remainder of the year.
In 2012, there should be little impact on earnings from this
change as appropriate accounting hedges are in place.
e) Foreign exchange translation of available-for-sale (AFS) equity securities
All AFS equity securities denominated in foreign currency were
hedged with related funding liabilities in the same currency. As a
result, under CGAAP the foreign exchange impact on translation
of AFS securities was completely offset by translation of related
funding liabilities. Under IFRS, the foreign exchange translation
on AFS equity securities is recorded in other comprehensive
income, while the foreign exchange translation on the funding
liabilities is recorded in the income statement. The impact on net
income in 2011 reflects changes to exchange rates.
In 2012, accounting hedges are in place to offset the
foreign exchange volatility on AFS equity securities
denominated in foreign currency.
f) Other
This section reflects the impact on net income of individually
immaterial items resulting from the adoption of IFRS. These
include the following:
• Businesscombinations–impactfromrecognitionof
contingent consideration at fair value.
• Hyperinflationaryeconomies–impactofthegeneral
price index adjustment on the equity pick up from
associates.
• Share-basedpayments–impactoffairvalueofliability-
based awards compared to intrinsic value.
Under IFRS, financial instruments which can be converted
into common shares are considered dilutive, irrespective of
the likelihood of conversion. Under CGAAP, the inclusion or
exclusion of such instruments in diluted earnings per share
was based on past experience and expectations of whether the
instrument would be converted into shares or settled for cash.
Certain capital instruments (Scotiabank Trust Securities
– Series 2000-1, Series 2002-1 and Series 2003–1) allow the
holders of the instruments the ability to convert to common
shares under the terms of the instruments and are therefore
considered dilutive under IFRS. These instruments resulted
in a reduction in diluted earnings per share of 4 cents per
share in 2011. This impact reflects the change in accounting
requirements and not a change in management’s expectations
of the likelihood of conversion. In December 2010, Scotiabank
Trust Securities – Series 2000-1 were redeemed at par for cash
by BNS Capital Trust. With regulatory approval, Series 2002-1
and Series 2003-1 may be redeemed in whole or in part by the
payment of cash at the option of Scotiabank Capital Trust. These
securities are eligible to be called at par in June 2012 and June
2013, respectively.
In addition, stock options granted between November 1, 2002
and October 31, 2009 that have Tandem Stock Appreciation
Rights (Tandem SARs) were not considered dilutive under
CGAAP but are included in the dilution factor under IFRS. This
resulted in a reduction of 1 cent per share.
The form and presentation of the consolidated statement
of income has been changed to reflect IFRS best practices,
and to conform to the changes made to the consolidated
statement of financial position.
IFRS requires revenue to be presented by major category
of income:
• UnderCGAAP,thereweretworevenuecategories
presented: net interest income and other income.
• UnderIFRS,theBanknowpresentsthreerevenue
categories: net interest income, net fee and commission
revenues and other operating income. Other
operating income includes income from trading
operations and net income from investments in
associated corporations.
Categories which have been reclassified under IFRS include:
• netincomefrominvestmentinassociatedcorporations,
which is now presented as a separate category of other
operating income. Previously, this was presented as either
interest income on securities or mutual fund income
depending on the nature of the underlying investment;
• changesinthefairvalueoffinancialinstrumentsusedfor
asset/liability management purposes are now presented
in other operating income. Previously, this was presented
as interest income/expense;
• impairmentlossesonfinancialinstrumentsarenowpresented
separately on the income statement after total revenue.
Previously, this was presented in the net gain (loss) on
securities, other than trading which was in other income; and
• netinterestincomefromtradingoperationshasbeen
reclassified to income from trading operations.
Presentation changes in consolidated statement of income

6
For the year ended October 31, 2011 (Unaudited) ($ millions) Step 1 Step 2 Change in presentation
CGAAP IFRS balances reclassification/ Canadian GAAP under IFRS remeasurement presentation CGAAP From To presentation IFRS presentation adjustments IFRS Revenue Interest income $18,712 $(449) (a) $18,263 Interest income $765 $19,028 Interest expense 9,442 114 (b) 9,556 Interest expense 458 10,014 Net interest income 9,270 8,707 Net interest income 307 9,014 Provision for credit losses 1,046 (1,046) (c) Total other income 8,018 (8,018) (d) 6,602 (d) 6,602 Fee and commission revenues (61) 6,541 341 (d) 341 Fee and commission expenses 341 6,261 Net fees and commission revenues (61) 6,200 Other operating income 110 (a) 697 (d) 807 807 Income from trading operations 23 830 11 (b) Income from financial instruments 7 (d) designated at fair value 18 18 through profit or loss (31) (13) Net gain/(loss) on sale of financial 342 (d) 342 investments 42 384 299 (a) 163 (d) Net income/(loss) from investments 462 462 in associated corporations (29) 433
40 (a) 103 (b) 651 (d) 794 794 Other (233) 561 2,423 Total other operating income (228) 2,195 17,391 Total revenues 18 17,409 1,046 (c) 1,046 Provision for credit losses 30 1,076 Impairment losses on 103 (d) 103 financial investments (4) 99 Non-interest expenses 9,564 9,564 Operating expenses (83) 9,481 Provision for income taxes 1,410 1,410 Provision for income taxes 13 1,423 Net income $5,268 $(7,535) $7,535 $5,268 Net income $62 $5,330
(a) Split out from interest income ($449) to income from trading operations ($110), net income/(loss) from investments in associated corporations ($299) and other – other operating income ($40).
(b) Split out from interest expense ($114) to income from financial instruments designated at fair value through profit or loss ($11) and other - other operating income ($103).
(c) Moved to a different line order. (d) Split out other income ($8,018) to fee and commission revenues ($6,602), fee and commission expenses ($341), income from trading operations
($697), income from financial instruments designated at fair value through profit or loss ($7), net gain/(loss) on sale of financial investments ($342), net income/(loss) from investments in associated corporations ($163), other - other operating income ($651) and impairment losses on financial investments ($103).
The following presents a reconciliation of the changes in
presentation made to the CGAAP income statement to arrive
at the IFRS income statement.
The reconciliation is presented in two steps on the
following table. Step 1 changes the presentation from CGAAP
to IFRS using the CGAAP amounts.
Step 2 reflects the reclassification and remeasurement
adjustments to the CGAAP amounts to arrive at the IFRS
income statement.

7
Business segment results
CGAAP For the year ended October 31, 2011 Canadian International Global Wealth Scotia(Unaudited) ($ millions) (TEB(1)) Banking Banking Management Capital Other Total Net interest income $ 4,889 $ 3,988 $ 345 $ 1,066 $ (1,018) $ 9,270 Other income 1,351 1,420 2,973 1,894 380 8,018 Provision for credit losses 590 485 2 29 (60) 1,046 Operating expenses 3,069 3,056 1,890 1,409 140 9,564 Provision for income taxes 719 382 208 338 (237) 1,410 Net income $ 1,862 $ 1,485 $ 1,218 $ 1,184 $ (481) $ 5,268 Return on economic equity (%)(1) 37.9 14.4 18.2 21.2 n/a 18.8
IFRS For the year ended October 31, 2011 Canadian International Global Wealth Scotia(Unaudited) ($ millions) (TEB(1)) Banking Banking Management Capital Other Total Net interest income $ 4,831 $ 3,615 $ 355 $ 723 $ (510) $ 9,014 Net fee and commission revenues 1,332 1,222 2,497 1,159 (10) 6,200 Other operating income 20 602 470 1,147 (44) 2,195Provision for credit losses 592 509 2 33 (60) 1,076 Impairment losses on financial investments 7 13 – 11 68 99 Operating expenses 3,038 3,049 1,884 1,396 114 9,481 Provision for income taxes 710 383 210 357 (237) 1,423 Net income $ 1,836 $ 1,485 $ 1,226 $ 1,232 $ (449) $ 5,330 Return on economic equity (%)(1) 37.3 14.3 18.2 21.9 n/a 20.3
ChangesFor the year ended October 31, 2011 Canadian International Global Wealth Scotia(Unaudited) ($ millions) (TEB(1)) Banking Banking Management Capital Other Total Net interest income $ (58) $ (373) $ 10 $ (343) $ 508 $ (256) Operating income(2) 1 404 (6) 412 (434) 377Provision for credit losses 2 24 – 4 – 30 Impairment losses on financial investments 7 13 – 11 68 99 Operating expenses (31) (7) (6) (13) (26) (83)Provision for income taxes (9) 1 2 19 – 13 Net income $ (26) $ – $ 8 $ 48 $ 32 $ 62
(1) Refer to page 3 for a discussion of non-IFRS measures.(2) Operating income reflects net fee and commission revenues and other operating income under IFRS compared to other income under CGAAP.
Net income for the year in Canadian Banking was lower
as a result of allocation of higher funding interest costs
associated with the mortgage securitization program,
partially offset by adjustments relating to lower employee
pension expenses.
Overall net income in International Banking has not
changed. There was a reclassification of net income from
investments in associated corporations from net interest
income to other operating income.
Net income in Global Wealth Management increased
primarily due to lower pension and benefits expense.
Net income in Scotia Capital increased primarily due to
the consolidation of certain SPEs under IFRS. There was
also a reclassification of net interest income from trading
operations to income from trading operations.
Net income in the Other segment increased, driven
mainly by foreign exchange gains resulting from functional
currency changes. These gains were partially offset by the
reversal of gains from securitized mortgages being recorded
on balance sheet.
Analysis of key changes

8
Quarterly results
Effect of IFRS on quarterly net income for 2011
Quarterly business segment results
CGAAP For the three months ended For the year ended January 31 April 30 July 31 October 31 October 31 (Unaudited) ($ millions) 2011 2011 2011 2011 2011Canadian Banking $ 497 $ 444 $ 461 $ 460 $ 1,862 International Banking 360 402 350 373 1,485 Global Wealth Management 223 489 256 250 1,218 Scotia Capital 308 357 289 230 1,184 Other (188) (149) (71) (73) (481)Total $ 1,200 $ 1,543 $ 1,285 $ 1,240 $ 5,268
IFRS For the three months ended For the year ended January 31 April 30 July 31 October 31 October 31 (Unaudited) ($ millions) 2011 2011 2011 2011 2011Canadian Banking $ 499 $ 422 $ 461 $ 454 $ 1,836 International Banking 364 401 345 375 1,485 Global Wealth Management 227 490 258 251 1,226 Scotia Capital 328 368 299 237 1,232 Other (169) (60) (60) (160) (449)Total $ 1,249 $ 1,621 $ 1,303 $ 1,157 $ 5,330
Difference For the three months ended For the year ended January 31 April 30 July 31 October 31 October 31 (Unaudited) ($ millions) 2011 2011 2011 2011 2011Canadian Banking $ 2 $ (22) $ – $ (6) $ (26)International Banking 4 (1) (5) 2 – Global Wealth Management 4 1 2 1 8 Scotia Capital 20 11 10 7 48Other 19 89 11 (87) 32 Total $ 49 $ 78 $ 18 $ (83) $ 62
Refer to page 7 for discussion of key changes.
For the three months ended January 31 April 30 July 31 October 31(Unaudited) ($ millions) 2011 2011 2011 2011Net income under CGAAP $1,200 $1,543 $1,285 $1,240Adjustments under IFRS: Consolidation Consolidation of SPEs – 16 13 (14) Capital instruments 15 14 15 14 15 30 28 – Securitization (23) (16) (2) (56) Employee benefits 16 (12) 13 8 Changes in functional currency 14 37 – – Foreign exchange translation of available-for-sale equity securities 14 40 (7) (34) Other 13 (1) (14) (1) Subtotal - adjustments under IFRS 49 78 18 (83) Net income under IFRS $1,249 $1,621 $1,303 $1,157

9
Effect of IFRS on quarterly consolidated financial position
CGAAP
As at November 1 January 31 April 30 July 31 October 31
(Unaudited) ($ millions) 2010 2011 2011 2011 2011
Assets $ 526,657 $ 541,268 $ 571,541 $ 567,689 $ 575,256
Liabilities 498,447 512,554 540,183 535,340 541,856
Equity 28,210 28,714 31,358 32,349 33,400
Total liabilities and equity $ 526,657 $ 541,268 $ 571,541 $ 567,689 $ 575,256
IFRS
As at November 1 January 31 April 30 July 31 October 31
(Unaudited) ($ millions) 2010 2011 2011 2011 2011
Assets $ 543,970 $ 559,415 $ 590,695 $ 587,597 $ 594,423
Liabilities 516,752 531,639 560,196 556,161 562,183
Equity 27,218 27,776 30,499 31,436 32,240
Total liabilities and equity $ 543,970 $ 559,415 $ 590,695 $ 587,597 $ 594,423
The most significant adjustment to the total assets was the
balance sheet treatment of the Bank’s insured residential
mortgages securitized under the Canada Mortgage Bond
Program. Previously under CGAAP, these securitized
residential mortgages met the derecognition criteria and were
removed from the balance sheet. There were also increases due
to the consolidation of certain SPEs.
The decrease in equity as at October 31, 2011 of $1,160
million (January 31, 2011 – $938 million decrease; April 30,
2011 – $859 million decrease; July 31, 2011 – $913 million
decrease) was primarily due to the Bank’s transition elections
available to the Bank as a first-time adopter of IFRS made as
at November 1, 2010. The significant adjustments on transition
were for employee benefits, the impact of the on-balance
sheet treatment of insured residential mortgages previously
derecognized, the fair value of private equity securities, the
consolidation of certain special purpose entities and the
reclassification of certain capital instruments to equity.
Refer to the Bank’s 2011 Annual Report (pages 83-89) for
detailed explanation of the changes.
As at November 1 January 31 April 30 July 31 October 31 (Unaudited) ($ millions) 2010 2011 2011 2011 2011Shareholders’ equity under CGAAP $28,210 $28,714 $31,358 $32,349 $33,400 IFRS 1 – First-time adoption of IFRS (1) (1,640) (1,640) (1,640) (1,640) (1,640) Consolidation (2) 721 678 730 693 683 Financial instruments (3) 186 255 302 275 34 Employee benefits (4) (190) (172) (177) (164) (157) Other (5) (69) (59) (74) (77) (80)Adjustments under IFRS (992) (938) (859) (913) (1,160)Shareholders’ equity under IFRS $27,218 $27,776 $30,499 $31,436 $32,240
(1) – (5) discussed on page 10, Summary of key differences.
Reconciliation of shareholders’ equity

10
Summary of key differences
The consolidated statement of financial position presented on
page 11 has been prepared in accordance with IFRS as issued
by the International Accounting Standards Board (IASB).
Previously, the consolidated financial statements were
prepared in accordance with CGAAP.
The reconciliation is presented in two steps on the
following table. Step 1 changes the presentation from CGAAP
to IFRS using the CGAAP amounts.
The change in presentation for the consolidated statement
of financial position is to reflect the assets and liabilities in
order of liquidity, versus the product-based categorization
used for CGAAP. There are no changes in values.
Step 2 reflects the reclassification and remeasurement
adjustments to the CGAAP amounts to arrive at the IFRS
consolidated statement of financial position.
The following discussion provides a summary of the
impact the adoption of IFRS had on the comparative
year consolidated statement of equity for the year ended
October 31, 2011.
1) IFRS 1 – First-time adoption of IFRS
Reflects the impact of optional exemptions elected by the
Bank and mandatory exceptions required under IFRS. The
IFRS 1 first-time adoption impact on November 1, 2010 has
been held constant and any changes period over period has
been reflected in the relevant standards. The largest impacts
from first-time adoption are in relation to employee benefits
and derecognition of financial assets.
2) Consolidation
Reflects the result of the consolidation of SPEs that were not
consolidated under CGAAP (primarily U.S. based multi-seller
conduit and capital funding trusts). The variance in equity
is due to net income of the consolidated SPEs, changes in
unrealized gains on AFS securities in the consolidated SPEs
which are recorded through other comprehensive income
and the impact of semi-annual distributions on the capital
instruments now classified as equity.
3) Financial instruments
Includes the impact of private equity securities and
securitizations as follows:
• ThedifferenceinthemeasurementbasisontheBank’s
investment in private equity securities from cost under
CGAAP to fair value under IFRS.
• Theon-balancesheettreatmentofthesecuritized
insured residential mortgages under the CMB program
and the related net income impact. Interest income on
the mortgages is recognized in income, offset by the
interest expense on the related funding liability.
The gain on the sale of mortgages is reversed, as well as
the MTM adjustments on the CMHC seller swaps and the
related hedges.
4) Employee benefits
Reflects the impact of different measurement basis under
IFRS for pension related items to reflect changes to the
measurement date for the actuarial valuation of employee
benefit plans and the use of fair values for determining the
expected return on pension assets.
5) Other
Includes the impact of individually immaterial items resulting
from the adoption of IFRS as follows:
• Adjustingfinancialstatementsofentitiesinhyperinfla-
tionary economies to an inflation adjusted basis prior
to equity pick up by the Bank. Also includes foreign
exchange differences on translation recorded in other
comprehensive income under IFRS.
• Changesinfunctionalcurrenciesincertainsubsidiaries
and changes to the related net investment hedges. Also
includes foreign exchange impact on certain AFS equity
securities and related funding liabilities denominated in
foreign currencies.
• Adjustmentsrelatedtothefairvalueofcontingent
consideration on acquisitions prior to November 1, 2010.
Changes in equity are primarily due to foreign currency
movements impacting contingent consideration recorded
through comprehensive income as well as changes in
fair value.
• Remeasurementofcashsettledawards(i.e.,liability-
based) at the end of each reporting period based on the
fair value of the liability under IFRS compared to intrinsic
value under CGAAP.
Reconciliation of CGAAP balance sheet to IFRS
Impact on regulatory capital
The impact of the IFRS adjustments to the Bank’s regulatory
capital ratios is a decline of approximately 71 basis points on
the Bank’s Tier 1 capital ratio and an increase of 0.9 to the
assets-to-capital multiple as at October 31, 2011. The Office
of the Superintendent of Financial Institutions (OSFI) has
allowed financial institutions to elect to take the impact over
five quarters. The Bank has elected to phase in the impact
over five quarters.

11
Reco
ncili
atio
n of
CG
AAP
bala
nce
shee
t to
IFRS
As
at O
ctob
er 3
1, 2
011
(un
au
dit
ed)
($ m
illi
ons)
St
ep 1
St
ep 2
Cha
nge
in p
rese
ntat
ion
IF
RS
CG
AA
P
re
clas
sifi
cati
on/
C
GA
AP
ba
lanc
es u
nder
IF
RS
re
mea
sure
men
t
C
anad
ian
GA
AP
pre
sent
atio
n ba
lanc
e F
rom
T
o IF
RS
pres
enta
tion
ad
just
men
ts
IFR
SA
sset
s
Ass
ets
Cas
h re
sour
ces
$ 45
,222
$
45,2
22
Cas
h an
d de
posi
ts w
ith
bank
s
$
45,
222
Pre
ciou
s m
etal
s
9,24
9
9,24
9 P
reci
ous
met
als
9,24
9S
ecu
riti
es
T
rad
ing
asse
ts
T
radi
ng
63
,327
$
(1,1
35)
(a)
62
,192
Sec
urit
ies
6
2,19
2
Ava
ilabl
e-fo
r-sa
le
52
,055
(52,
055)
(b)
E
quit
y ac
coun
ted
inve
stm
ents
4,49
1
(4,4
91)
(c)
$ 12
,570
(d)
12,5
70
L
oans
$
1,
037
13
,607
1,
135
(a)
1,
037
(d)
Fin
anci
al in
stru
men
ts d
esig
nate
d at
fair
val
ue th
roug
h
2,17
2
2,
172
p
rofit
or
loss
(1,7
97)
375
Secu
riti
es p
urch
ased
und
er r
esal
e ag
reem
ents
34,5
82
34,5
82
Secu
riti
es p
urch
ased
und
er r
esal
e ag
reem
ents
34,5
82
37,2
08 (
e)
37
,208
D
eriv
ativ
e fi
nanc
ial i
nstr
umen
ts
114
37
,322
52,0
55 (
b)
52
,055
F
inan
cial
inve
stm
ents
(2
1,87
9)
30,1
76L
oan
s
Lo
ans
to c
ust
om
ers
Res
iden
tial
mor
tgag
es
12
3,08
2
12
3,08
2
Res
iden
tial
mor
tgag
es
38,6
03
16
1,68
5P
erso
nal a
nd c
redi
t ca
rds
62
,764
62,7
64
P
erso
nal a
nd c
redi
t ca
rds
553
63
,317
Bus
ines
s an
d go
vern
men
t lo
ans
11
5,67
3
(13,
607)
(d)
102,
066
B
usin
ess
and
gove
rnm
ent
loan
s
3,
194
10
5,26
0A
llow
ance
for
cre
dit
loss
es
2,
817
2,81
7
Allo
wan
ce f
or c
redi
t lo
sses
(1
28)
2,
689
Der
ivat
ive
inst
rum
ents
37,2
08
(3
7,20
8) (
e)
4,49
1 (c
)
4,49
1 In
vest
men
ts in
ass
ocia
tes
and
join
t ve
ntur
es
(57)
4,
434
1,
496
(f)
1,
496
Def
erre
d ta
x as
sets
71
8
2,21
4O
ther
ass
ets
30
,420
(1,4
96)
(f)
28
,924
O
ther
ass
ets
(1,4
47)
27
,477
To
tal
asse
ts
$ 57
5,25
6 $
(109
,992
)
$ 10
9,99
2
$ 57
5,25
6 T
ota
l as
sets
$ 19
,167
$
594,
423
Lia
bil
itie
s an
d s
har
eho
lder
s’ e
qu
ity
L
iab
ilit
ies
Dep
osi
ts
D
epo
sits
Per
sona
l, bu
sine
ss a
nd g
over
nmen
t $
375,
031
$
375,
031
Dep
osit
s fr
om c
usto
mer
s
$ 24
,959
$
399,
990
Ban
ks
21
,345
21
,345
D
epos
its
from
ban
ks
21,3
45D
eriv
ativ
e in
stru
men
ts
40
,889
40
,889
D
eriv
ativ
e fi
nanc
ial i
nstr
umen
ts
(653
)
40,2
36
O
blig
atio
ns r
elat
ed t
o se
curi
ties
sol
d un
der
O
blig
atio
ns r
elat
ed t
o se
curi
ties
sol
d un
der
rep
urch
ase
agre
emen
ts
46
,062
46
,062
rep
urch
ase
agre
emen
ts
(7,8
46)
38
,216
504
(g)
50
4 D
efer
red
tax
liabi
litie
s
(2
6)
47
8O
ther
liab
iliti
es
58
,529
(504
) (g
)
58,0
25
Oth
er li
abili
ties
3,
893
61
,918
Sh
areh
old
ers’
eq
uit
y
Eq
uit
yC
omm
on s
hare
s
8,33
6
8,
336
C
omm
on s
hare
s
8,3
36
Ret
aine
d ea
rnin
gs
24
,662
24
,662
Ret
aine
d ea
rnin
gs
(6,2
41)
18
,421
Acc
umul
ated
oth
er c
ompr
ehen
sive
A
ccum
ulat
ed o
ther
com
preh
ensi
ve
inc
ome
(los
s)
(4
,718
)
(4
,718
)
inco
me
(los
s)
4,22
1
(497
)O
ther
equ
ity
4,
480
4,48
0
Oth
er e
quit
y
87
4
5,35
4N
on-c
ontr
ollin
g in
tere
sts
in s
ubsi
diar
ies
64
0
64
0
Non
-con
trol
ling
inte
rest
s
(1
4)
62
6
To
tal
liab
ilit
ies
and
sh
areh
old
ers’
eq
uit
y $
575,
256
$ (5
04)
$
504
$
575,
256
To
tal
liab
ilit
ies
and
eq
uit
y
$ 19
,167
$
594,
423
(a)
Sec
uri
ties
des
ign
ate
d u
nd
er t
he
fair
va
lue
opti
on (
$1,1
35)
are
now
pre
sen
ted
un
der
a s
epa
rate
lin
e –
fin
an
cia
l in
stru
men
ts d
esig
na
ted
at
fair
va
lue
thro
ugh
pro
fit
or l
oss
(FV
TP
L).
(b
), (
c) a
nd
(e)
– m
oved
to
a d
iffe
ren
t or
der
or
lin
e it
em.
(d)
Sp
lit
out
from
bu
sin
ess
an
d g
over
nm
ent
loa
ns
($13
,607
) to
FV
TP
L (
$1,0
37)
an
d t
rad
ing
ass
ets
- lo
an
s ($
12,5
70).
(f)
Sp
lit
out
from
oth
er a
sset
s ($
1,49
6) t
o d
efer
red
ta
x a
sset
s.(g
) S
pli
t ou
t fr
om o
ther
lia
bili
ties
($5
04)
to d
efer
red
ta
x l
iabi
liti
es.
12
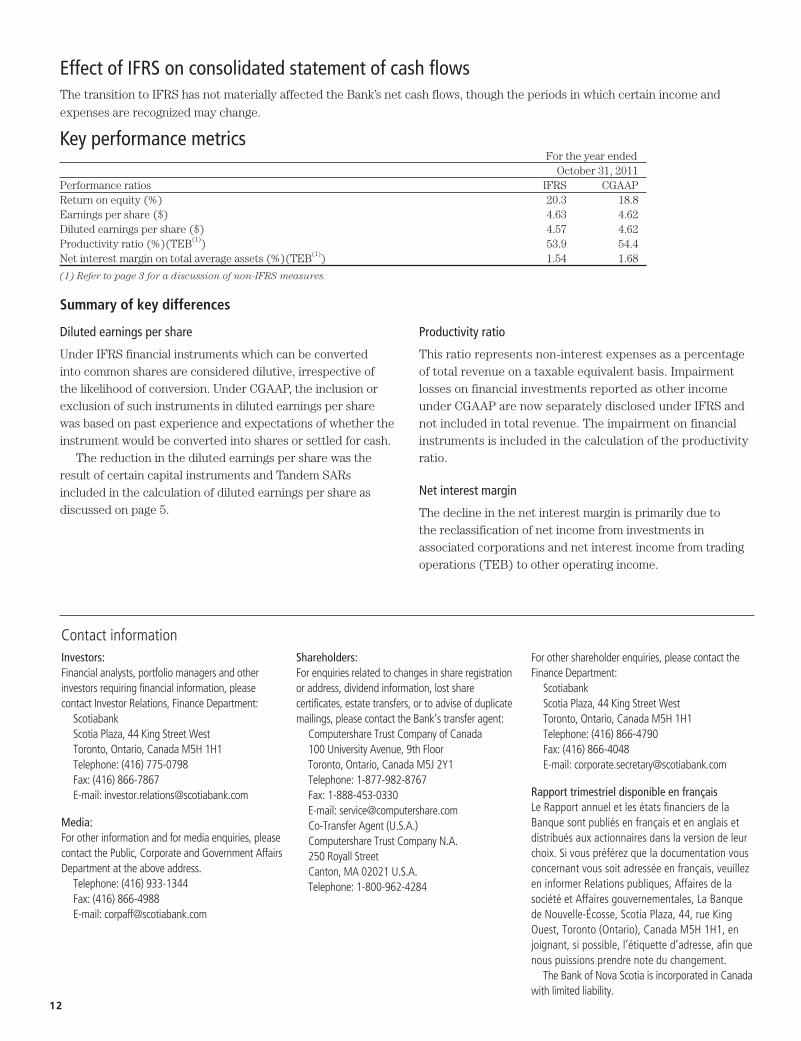
Effect of IFRS on consolidated statement of cash flows The transition to IFRS has not materially affected the Bank’s net cash flows, though the periods in which certain income and
expenses are recognized may change.
Key performance metrics For the year ended October 31, 2011Performance ratios IFRS CGAAPReturn on equity (%) 20.3 18.8 Earnings per share ($) 4.63 4.62 Diluted earnings per share ($) 4.57 4.62 Productivity ratio (%)(TEB(1)) 53.9 54.4 Net interest margin on total average assets (%)(TEB(1)) 1.54 1.68
(1) Refer to page 3 for a discussion of non-IFRS measures.
Diluted earnings per share
Under IFRS financial instruments which can be converted into common shares are considered dilutive, irrespective of the likelihood of conversion. Under CGAAP, the inclusion or exclusion of such instruments in diluted earnings per share was based on past experience and expectations of whether the instrument would be converted into shares or settled for cash.
The reduction in the diluted earnings per share was the result of certain capital instruments and Tandem SARs included in the calculation of diluted earnings per share as discussed on page 5.
Productivity ratio
This ratio represents non-interest expenses as a percentage of total revenue on a taxable equivalent basis. Impairment losses on financial investments reported as other income under CGAAP are now separately disclosed under IFRS and not included in total revenue. The impairment on financial instruments is included in the calculation of the productivity ratio.
Net interest margin
The decline in the net interest margin is primarily due to the reclassification of net income from investments in associated corporations and net interest income from trading operations (TEB) to other operating income.
Summary of key differences
Investors:Financial analysts, portfolio managers and other investorsrequiringfinancialinformation,pleasecontact Investor Relations, Finance Department:ScotiabankScotia Plaza, 44 King Street West Toronto, Ontario, Canada M5H 1H1Telephone: (416) 775-0798Fax: (416) 866-7867E-mail:[email protected]
Media:Forotherinformationandformediaenquiries,pleasecontactthePublic,CorporateandGovernmentAffairsDepartmentattheaboveaddress.
Telephone: (416) 933-1344 Fax: (416) 866-4988E-mail:[email protected]
Shareholders:Forenquiriesrelatedtochangesinshareregistrationor address, dividend information, lost share certificates, estate transfers, or to advise of duplicate mailings, please contact the Bank’s transfer agent:
Computershare Trust Company of Canada100 University Avenue, 9th FloorToronto, Ontario, Canada M5J 2Y1Telephone: 1-877-982-8767Fax: 1-888-453-0330E-mail: [email protected] Agent (U.S.A.)Computershare Trust Company N.A.250 Royall StreetCanton, MA 02021 U.S.A.Telephone: 1-800-962-4284
Forothershareholderenquiries,pleasecontacttheFinance Department:ScotiabankScotia Plaza, 44 King Street WestToronto, Ontario, Canada M5H 1H1Telephone: (416) 866-4790Fax: (416) 866-4048E-mail:[email protected]
Rapport trimestriel disponible en françaisLe Rapport annuel et les états financiers de la Banquesontpubliésenfrançaisetenanglaisetdistribuésauxactionnairesdanslaversiondeleurchoix.Sivouspréférezqueladocumentationvousconcernantvoussoitadresséeenfrançais,veuillezeninformerRelationspubliques,AffairesdelasociétéetAffairesgouvernementales,LaBanquede Nouvelle-Écosse, Scotia Plaza, 44, rue King Ouest, Toronto (Ontario), Canada M5H 1H1, en joignant,sipossible,l’étiquetted’adresse,afinquenous puissions prendre note du changement.
The Bank of Nova Scotia is incorporated in Canada withlimitedliability.
Contact information