Embed Size (px)
Citation preview
www.angelbroking.com
Market Outlook August 21, 2017
www.angelbroking.com
Market Cues
Indian markets are likely to open flat tracking global cues and SGX Nifty.
U.S. stock benchmarks closed firmly lower on Friday with low volumes. Stocks shifted between gains and losses Friday as President Donald Trump’s strategist Stephen Bannon departed the White House, following the prior day’s selloff fuelled by a terrorist attack in Barcelona and rumours that Trump’s economic adviser Gary Cohn might resign. The Dow closed down 0.35 percent to 21,674, The S&P 500 declined 0.18 percent to close at 2,425, and The Nasdaq declined 0.09 percent at 6,216.
Blue-chip stocks in the U.K. dropped Friday, wrapping up the week with a fall in travel-related stocks after terrorists launched attacks in Spain. The FTSE 100 UKX, fell 0.9 percent to close at 7,324, trimming its weekly advance to 0.2 percent.
On the domestic front, Indian shares fell on Friday, with weak global cues and steep losses in Infosys shares in the wake of CEO Vishal Sikka's resignation weighing on markets, heading into the weekend. The 30-share BSE Sensex fell 0.85 percent to finish at 31,524.68 while the broader 50-share NSE Nifty index ended down by 0.67 percent at 9,837.40.
News Analysis CEO & MD of Infosys Resigns
Infosys Buyback
Detailed analysis is on Pg2
Investor’s Ready Reckoner
Key Domestic & Global Indicators
Stock Watch: Latest investment recommendations on 150+ stocks
Refer Pg7 onwards
Top Picks Company Sector Rating
CMP (`)
Target (`)
Upside (%)
Blue Star Capital Goods Accumulate 714 760 6.4
Dewan Housing Finance Financials Buy 450 520 15.5
Mahindra Lifespace Real Estate Buy 405 522 28.9
Navkar Corporation Others Buy 189 265 40.3 KEI Industries Capital Goods Buy 216 258 19.6 More Top Picks on Pg5
Key Upcoming Events Date Region Event Description
Previous Reading
Consensus Expectations
Aug 23, 2017 Germany PMI Services 53.10 53.30
Aug 23, 2017 Germany PMI Manufacturing 58.10 57.70
Aug 23, 2017 US New home sales 610.00 610.00
Aug 23, 2017 Euro Zone Euro-Zone Consumer Confidence (1.70) (1.90)
Aug 24, 2017 US Initial Jobless claims 232.00 More Events on Pg7
Domestic Indices Chg (%) (Pts) (Close)
BSE Sensex 0.3 86 29,422
Nifty 0.4 33 9,136
Mid Cap 0.7 95 14,485
Small Cap 1.1 171 15,128
Bankex (0.5) (131) 24,444
Global Indices Chg (%) (Pts) (Close)
Dow Jones 0.9 174 20,579
Nasdaq 0.9 54 5,917
FTSE 0.1 4 7,119
Nikkei (0.0) (2) 18,430
Hang Seng 1.0 231 24,057
Shanghai Com 0.0 1 3,172
Advances / Declines BSE NSE
Advances 1,849 1,130
Declines 1,039 543
Unchanged 164 74
Volumes (` Cr)
BSE 4,029
NSE 25,391
#Net Inflows (` Cr) Net Mtd Ytd
FII (565) (2,249) 41,972
MFs 804 4,895 14,333
Top Gainers Price (`) Chg (%)
Indiacem 190 8.8
Jktyre 154 8.4
Gsfc 124 7.5
Sobha 392 7.3
Jetairways 511 6.5
Top Losers Price (`) Chg (%)
Irb 240 (5.0)
Yesbank 1,545 (3.8)
Icicibank 273 (2.9)
Polaris 214 (2.5)
Concor 1,186 (2.5) #As on April 20, 2017
Domestic Indices Chg (%) (Pts) (Close)
BSE Sensex (0.9) (271) 31,525
Nifty (0.7) (67) 9,837
Mid Cap (0.1) (20) 15,208
Small Cap (0.5) (77) 15,618
Bankex (0.7) (194) 27,184
Global Indices Chg (%) (Pts) (Close)
Dow Jones (0.4) (76) 21,675
Nasdaq (0.1) (5) 6,217
FTSE (0.9) (64) 7,324
Nikkei (1.2) (232) 19,470
Hang Seng (1.1) (297) 27,048
Shanghai Com 0.0 0 3,269
Advances / Declines BSE NSE
Advances 944 589
Declines 1,621 1,102
Unchanged 116 61
Volumes (` Cr)
BSE 3,864
NSE 28,953
#Net Inflows (` Cr) Net Mtd Ytd
FII (1,927) (6,127) 52,270
MFs (38) 4,434 55,380
Top Gainers Price (`) Chg (%)
Dishtv 78 5.7
Sparc 399 5.1
Pcjeweller 372 4.5
Rcom 24 4.3
Infratel 394 4.1
Top Losers Price (`) Chg (%)
Infy 923 (9.6)
Aban 177 (4.3)
Fortis 145 (4.1)
Sunpharma 470 (3.8)
Sintex 33 (3.8) #as on 18th Aug, 2017

www.angelbroking.com
Market Outlook August 21, 2017
www.angelbroking.com
News Analysis
CEO & MD of Infosys Resigns
Mr. Vishal Sikka has resigned as the Chief Executive Officer & Managing Director of Infosys with immediate effect. Sikka cited among his reasons for leaving "a continuous stream of distractions and disruptions over the recent months and quarters, increasingly personal and negative as of late, as preventing management's ability to accelerate the company's transformation. Sikka has been appointed as Executive Vice-Chairman while Chief Operating Officer UB Pravin Rao will now take over as the interim MD & CEO of the software major. Infosys said that the succession plan for appointment of a new Managing Director and Chief Executive Officer has been operationalised by the Board & a search for the same has been commenced. While in near term it’s a setback for the company; but given the strength of the board of the company, we believe that the company, will be overcome the setback. Given the valuations we maintain our buy with a price target of `1179.
Infosys Buyback
Infosys Ltd.’s board approved to buy back shares worth up to `13,000cr at ` 1,150/-. That represents 4.92 percent of its total outstanding equity. The buyback price implies a premium of 24.5 percent to Friday’s closing price.
Economic and Political News PSBs need to take haircuts on stressed assets: RBI Governor
Bank unions threaten to strike work on Tuesday; services may be hit
Govt. may soon allow 100% FDI in defence
Corporate News
Laurus Labs’ Vizag unit gets two U.S. FDA observations
Central Bank of India issues preference shares to government
Bajaj Electricals Bags order worth `391.45cr from Transmission Corporation of Telangana
Nestle India partners with Amazon for new range of Maggi noodles
www.angelbroking.com
Market Outlook August 21, 2017
www.angelbroking.com
Top Picks Company Market Cap
(` Cr) CMP
(`) Target
(`) Upside
(%) Rationale
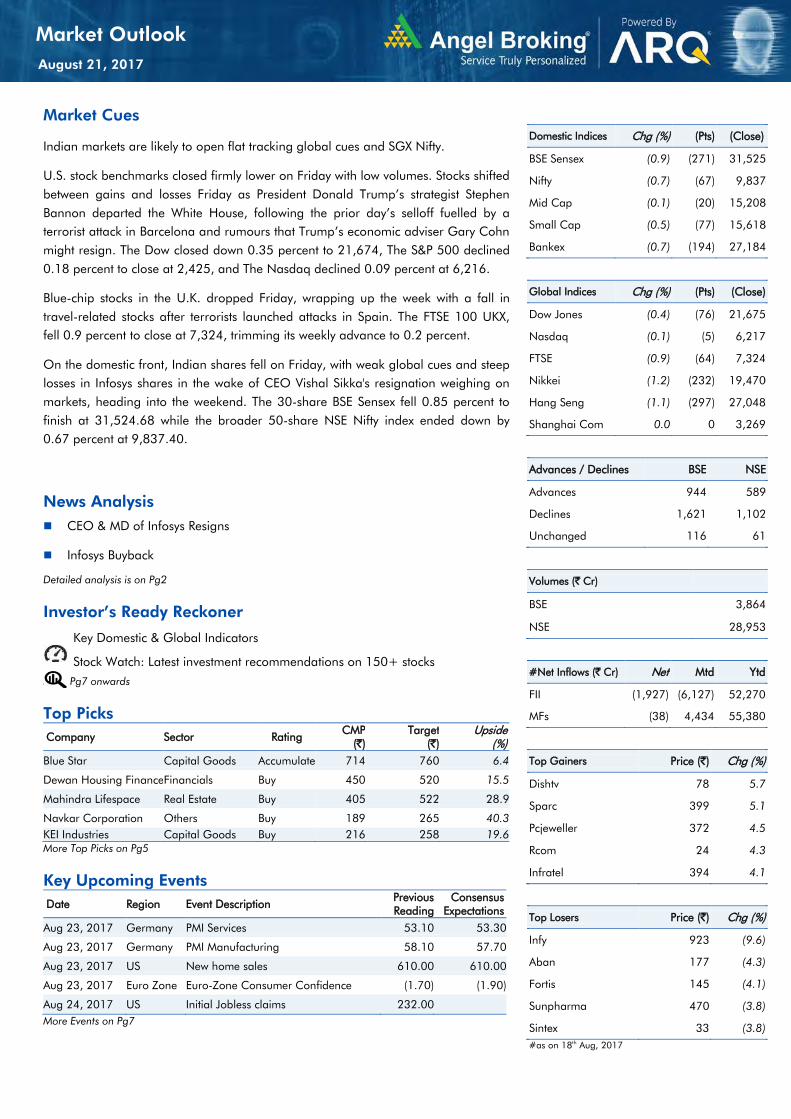
Alkem Laboratories 21,520 1,800 2,161 20.1
Strong growth in domestic business due to its leadership in acute therapeutic segment. Alkem expects to launch more products in USA, which bodes for its international business.
Asian Granito 1,231 409 480 17.3 We expect the company would report strong profitability owing to better product mix, higher B2C sales and amalgamation synergy.
Blue Star 6,841 714 760 6.4
Favorable outlook for the AC industry to augur well for Cooling products business which is out pacing the market growth. EMPPAC division's profitability to improve once operating environment turns around.
Dewan Housing Finance 14,121 450 520 15.5
With a focus on the low and medium income (LMI) consumer segment, the company has increased its presence in tier-II & III cities where the growth opportunity is immense.
Karur Vysya Bank 8,614 143 160 12.2 Loan growth is likely to pick up after a sluggish FY17. Lower credit cost will help in strong bottom-line growth. Increasing share of CASA will help in NIM improvement.
KEI Industries 1,678 216 258 19.6 High order book execution in EPC segment, rising B2C sales and higher exports to boost the revenues and profitability
Mahindra Lifespace 2,078 405 522 28.9 Speedier execution and speedier sales, strong revenue visibility in short-to-long run, attractive valuations
Music Broadcast 2,146 376 434 15.4 Expected to benefit from the lower capex requirement and 15 year long radio broadcast licensing.
Navkar Corporation 2,694 189 265 40.3 Massive capacity expansion along with rail advantage at ICD as well CFS augurs well for the company
Siyaram Silk Mills 1,892 2,018 2,500 23.9 Strong brands and distribution network would boost growth going ahead. Stock currently trades at an inexpensive valuation.
TV Today Network 1,432 240 344 43.3
Market leadership in Hindi news genre and no. 2 viewership ranking in English news genre, exit from the radio business, and anticipated growth in ad spends by corporates to benefit the stock.
Maruti Suzuki 2,30,187 7,620 8,544 12.1
After GST, the company is expected to see higher volumes along with improving product mix. The Gujarat plant will also enable higher operating leverage which will be margin accretive.
Source: Company, Angel Research

1
www.angelbroking.com
Market Outlook
August 21, 2017
www.angelbr oki ng.com
Key Upcoming Events
Global economic events release calendar
Date Time Country Event Description Unit Period
Bloomberg Data
Last Reported Estimated
Aug 23, 2017 1:00 PM Germany PMI Services Value Aug P 53.10 53.30
1:00 PM Germany PMI Manufacturing Value Aug P 58.10 57.70
7:30 PM US New home sales Thousands Jul 610.00 610.00
7:30 PM Euro Zone Euro-Zone Consumer Confidence Value Aug A (1.70) (1.90)
Aug 24, 2017 6:00 PM US Initial Jobless claims Thousands Aug 19 232.00
11:30 AM Germany GDP nsa (YoY) % Change 2Q F 0.80 0.80
2:00 PM UK GDP (YoY) % Change 2Q P 1.70 1.70
Aug 25, 2017 7:30 PM US Existing home sales Million Jul 5.52 5.56
Aug 29, 2017 7:30 PM US Consumer Confidence S.A./ 1985=100 Aug 121.10 119.00
Aug 30, 2017 6:00 PM US GDP Qoq (Annualised) % Change 2Q S 2.60 2.40
Aug 31, 2017 1:25 PM Germany Unemployment change (000's) Thousands Aug (8.00)
6:30 AM China PMI Manufacturing Value Aug 51.40
Sep 01, 2017 6:00 PM US Change in Nonfarm payrolls Thousands Aug 209.00 180.00
6:00 PM US Unnemployment rate % Aug 4.30 4.30
2:00 PM UK PMI Manufacturing Value Aug 55.10
Sep 05, 2017 2:30 PM Euro Zone Euro-Zone GDP s.a. (QoQ) % Change 2Q F 0.60
Sep 07, 2017 5:15 PM Euro Zone ECB announces interest rates % Sep 7 -
Sep 08, 2017
India Exports YoY% % Change Aug 3.94
India Imports YoY% % Change Aug 15.40
2:00 PM UK Industrial Production (YoY) % Change Jul 0.30
China Exports YoY% % Change Aug 7.20
Sep 09, 2017 7:00 AM China Consumer Price Index (YoY) % Change Aug 1.40
Sep 12, 2017 2:00 PM UK CPI (YoY) % Change Aug 2.60
Source: Bloomberg, Angel Research

3
www.angelbroking.com
Market Outlook
August 21, 2017
www.angelbr oki ng.com
Macro watch
Exhibit 1: Quarterly GDP trends
Source: CSO, Angel Research
Exhibit 2: IIP trends
Source: MOSPI, Angel Research
Exhibit 3: Monthly CPI inflation trends
Source: MOSPI, Angel Research
Exhibit 4: Manufacturing and services PMI
Source: Market, Angel Research; Note: Level above 50 indicates expansion
Exhibit 5: Exports and imports growth trends
Source: Bloomberg, Angel Research
Exhibit 6: Key policy rates
Source: RBI, Angel Research
7.9
8.8
6.1
7.3 7.6
8.0
7.2
9.1
7.9
7.5
7.0
6.1
3.0
4.0
5.0
6.0
7.0
8.0
9.0
10.0
1Q
FY15
2Q
FY15
3Q
FY15
4Q
FY15
1Q
FY16
2Q
FY16
3Q
FY16
4Q
FY16
1Q
FY17
2Q
FY17
3Q
FY17
4Q
FY17
(%)
4.9
5.7
4.9
5.7
2.6
3.0
1.9
3.8
2.8 2.8
(0.1) (1.0)
-
1.0
2.0
3.0
4.0
5.0
6.0
Aug-16
Sep-1
6
Oct-1
6
No
v-1
6
Dec-1
6
Jan-17
Feb-1
7
Mar-17
Apr-17
May-17
Jun-1
7
(%)
5.1
4.3 4.2
3.6 3.4
3.2
3.7 3.9
3.0
2.2
1.5
2.4
-
1.0
2.0
3.0
4.0
5.0
6.0
Aug-16
Sep-16
Oct-16
Nov-16
Dec-16
Jan-17
Feb-17
Mar-17
Apr-17
May-17
Jun-17
Jul-17
(%)
40.0
42.0
44.0
46.0
48.0
50.0
52.0
54.0
56.0Jun-1
6
Jul-1
6
Aug-16
Sep-1
6
Oct-1
6
No
v-1
6
Dec-1
6
Jan-17
Feb-1
7
Mar-17
Apr-17
May-17
Jun-1
7
Jul-1
7
Mfg. PMI Services PMI
(30.0)
(20.0)
(10.0)
0.0
10.0
20.0
30.0
40.0
50.0
60.0
Jul-1
6
Aug-16
Sep-1
6
Oct-1
6
No
v-1
6
Dec-1
6
Jan-17
Feb-1
7
Mar-17
Apr-17
May-17
Jun-1
7
Exports yoy growth Imports yoy growth(%)
3.00
3.50
4.00
4.50
5.00
5.50
6.00
6.50
Oct-16
Oct-16
Nov-16
Dec-16
Dec-16
Jan-17
Feb-17
Mar-17
Mar-17
Apr-17
May-17
May-17
Jun-17
Jul-17
Jul-17
Repo rate Reverse Repo rate CRR (%)
4
www.angelbroking.com
Market Outlook
August 21, 2017
www.angelbr oki ng.com
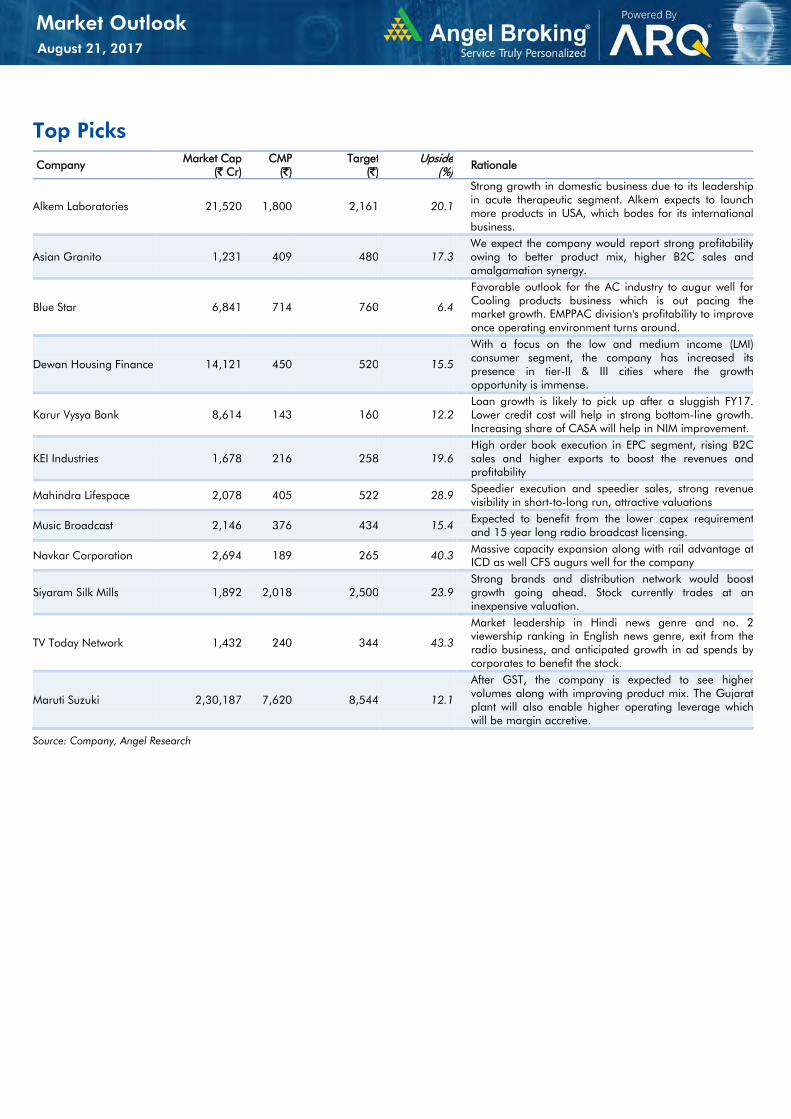
Global watch
Exhibit 1: Latest quarterly GDP Growth (%, yoy) across select developing and developed countries
Source: Bloomberg, Angel Research
Exhibit 2: 2016 GDP Growth projection by IMF (%, yoy) across select developing and developed countries
Source: IMF, Angel Research
Exhibit 3: One year forward P-E ratio across select developing and developed countries
Source: IMF, Angel Research
(0.4)
0.5
5.3
6.9
1.0 5.0
5.6
3.3
1.7
2.1
2.9
1.8
1.3
(1.0)
-
1.0
2.0
3.0
4.0
5.0
6.0
7.0
8.0
Bra
zil
Russia
Ind
ia
Ch
ina
South
A
frica
Ind
onesia
Ma
laysia
Tha
ilan
d
UK
USA
Germ
any
France
Ja
pa
n
(%)
0.2
1.4
7.2
6.6
0.8
5.1
4.5
3.0
2.0 2.3
1.6 1.4
1.2
-
1.0
2.0
3.0
4.0
5.0
6.0
7.0
8.0
Brazil
Russia
India
Chin
a
So
uth A
fric
a
Indonesia
Malaysia
Thailand
UK
USA
Germ
any
France
Japan
(%)
13
.6
5.6
19
.8
13
.1
15
.8
17
.4
17
.3
15
.1
14
.6
17
.0
13
.1
14
.5
13
.8
-
5.0
10.0
15.0
20.0
25.0
Brazil
Russia
India
China
South
Africa
Indonesia
Malaysia
Thailand
UK
USA
Germ
any
France
Japan
(x)

5
www.angelbroking.com
Market Outlook
August 21, 2017
www.angelbr oki ng.com
Exhibit 4: Relative performance of indices across globe
Returns (%)
Country Name of index Closing price 1M 3M 1YR
Brazil Bovespa 68,715 5.4 9.7 16.8
Russia Micex 1,931 (1.1) (1.6) (2.4)
India Nifty 9,837 0.1 4.3 13.4
China Shanghai Composite 3,269 1.2 5.8 8.8
South Africa Top 40 48,930 4.3 2.4 7.8
Mexico Mexbol 51,075 (0.0) 4.4 5.8
Indonesia LQ45 982 0.7 3.5 6.7
Malaysia KLCI 1,776 1.1 0.0 5.8
Thailand SET 50 997 (0.0) 1.3 0.6
USA Dow Jones 21,675 0.2 4.9 16.8
UK FTSE 7,324 (1.4) (2.0) 7.3
Japan Nikkei 19,470 (2.6) (0.4) 16.3
Germany DAX 12,165 (2.3) (3.7) 14.5
France CAC 5,114 (2.0) (3.9) 15.1
Source: Bloomberg, Angel Research
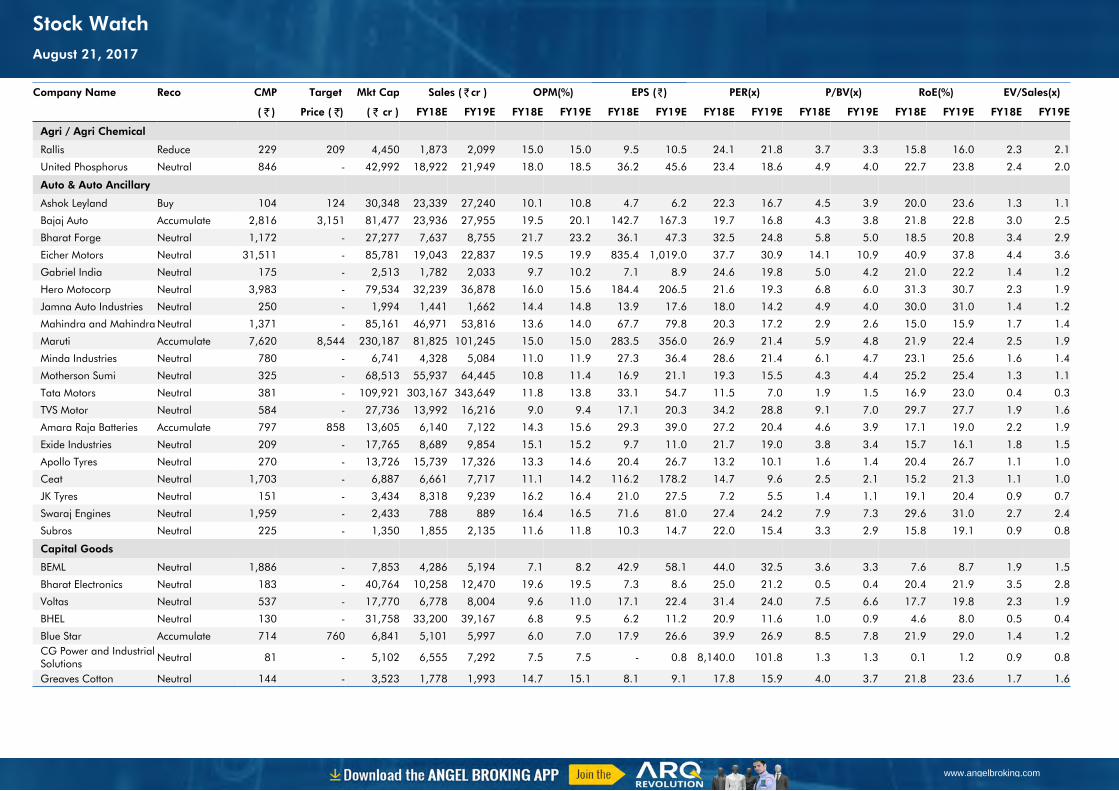
Company Name Reco CMP Target Mkt Cap Sales ( ₹cr ) OPM(%) EPS (₹) PER(x) P/BV(x) RoE(%) EV/Sales(x)
( ₹ ) Price ( ₹) ( ₹ cr ) FY18E FY19E FY18E FY19E FY18E FY19E FY18E FY19E FY18E FY19E FY18E FY19E FY18E FY19E
Agri / Agri Chemical
Rallis Reduce 229 209 4,450 1,873 2,099 15.0 15.0 9.5 10.5 24.1 21.8 3.7 3.3 15.8 16.0 2.3 2.1
United Phosphorus Neutral 846 - 42,992 18,922 21,949 18.0 18.5 36.2 45.6 23.4 18.6 4.9 4.0 22.7 23.8 2.4 2.0
Auto & Auto Ancillary
Ashok Leyland Buy 104 124 30,348 23,339 27,240 10.1 10.8 4.7 6.2 22.3 16.7 4.5 3.9 20.0 23.6 1.3 1.1
Bajaj Auto Accumulate 2,816 3,151 81,477 23,936 27,955 19.5 20.1 142.7 167.3 19.7 16.8 4.3 3.8 21.8 22.8 3.0 2.5
Bharat Forge Neutral 1,172 - 27,277 7,637 8,755 21.7 23.2 36.1 47.3 32.5 24.8 5.8 5.0 18.5 20.8 3.4 2.9
Eicher Motors Neutral 31,511 - 85,781 19,043 22,837 19.5 19.9 835.4 1,019.0 37.7 30.9 14.1 10.9 40.9 37.8 4.4 3.6
Gabriel India Neutral 175 - 2,513 1,782 2,033 9.7 10.2 7.1 8.9 24.6 19.8 5.0 4.2 21.0 22.2 1.4 1.2
Hero Motocorp Neutral 3,983 - 79,534 32,239 36,878 16.0 15.6 184.4 206.5 21.6 19.3 6.8 6.0 31.3 30.7 2.3 1.9
Jamna Auto Industries Neutral 250 - 1,994 1,441 1,662 14.4 14.8 13.9 17.6 18.0 14.2 4.9 4.0 30.0 31.0 1.4 1.2
Mahindra and Mahindra Neutral 1,371 - 85,161 46,971 53,816 13.6 14.0 67.7 79.8 20.3 17.2 2.9 2.6 15.0 15.9 1.7 1.4
Maruti Accumulate 7,620 8,544 230,187 81,825 101,245 15.0 15.0 283.5 356.0 26.9 21.4 5.9 4.8 21.9 22.4 2.5 1.9
Minda Industries Neutral 780 - 6,741 4,328 5,084 11.0 11.9 27.3 36.4 28.6 21.4 6.1 4.7 23.1 25.6 1.6 1.4
Motherson Sumi Neutral 325 - 68,513 55,937 64,445 10.8 11.4 16.9 21.1 19.3 15.5 4.3 4.4 25.2 25.4 1.3 1.1
Tata Motors Neutral 381 - 109,921 303,167 343,649 11.8 13.8 33.1 54.7 11.5 7.0 1.9 1.5 16.9 23.0 0.4 0.3
TVS Motor Neutral 584 - 27,736 13,992 16,216 9.0 9.4 17.1 20.3 34.2 28.8 9.1 7.0 29.7 27.7 1.9 1.6
Amara Raja Batteries Accumulate 797 858 13,605 6,140 7,122 14.3 15.6 29.3 39.0 27.2 20.4 4.6 3.9 17.1 19.0 2.2 1.9
Exide Industries Neutral 209 - 17,765 8,689 9,854 15.1 15.2 9.7 11.0 21.7 19.0 3.8 3.4 15.7 16.1 1.8 1.5
Apollo Tyres Neutral 270 - 13,726 15,739 17,326 13.3 14.6 20.4 26.7 13.2 10.1 1.6 1.4 20.4 26.7 1.1 1.0
Ceat Neutral 1,703 - 6,887 6,661 7,717 11.1 14.2 116.2 178.2 14.7 9.6 2.5 2.1 15.2 21.3 1.1 1.0
JK Tyres Neutral 151 - 3,434 8,318 9,239 16.2 16.4 21.0 27.5 7.2 5.5 1.4 1.1 19.1 20.4 0.9 0.7
Swaraj Engines Neutral 1,959 - 2,433 788 889 16.4 16.5 71.6 81.0 27.4 24.2 7.9 7.3 29.6 31.0 2.7 2.4
Subros Neutral 225 - 1,350 1,855 2,135 11.6 11.8 10.3 14.7 22.0 15.4 3.3 2.9 15.8 19.1 0.9 0.8
Capital Goods
BEML Neutral 1,886 - 7,853 4,286 5,194 7.1 8.2 42.9 58.1 44.0 32.5 3.6 3.3 7.6 8.7 1.9 1.5
Bharat Electronics Neutral 183 - 40,764 10,258 12,470 19.6 19.5 7.3 8.6 25.0 21.2 0.5 0.4 20.4 21.9 3.5 2.8
Voltas Neutral 537 - 17,770 6,778 8,004 9.6 11.0 17.1 22.4 31.4 24.0 7.5 6.6 17.7 19.8 2.3 1.9
BHEL Neutral 130 - 31,758 33,200 39,167 6.8 9.5 6.2 11.2 20.9 11.6 1.0 0.9 4.6 8.0 0.5 0.4
Blue Star Accumulate 714 760 6,841 5,101 5,997 6.0 7.0 17.9 26.6 39.9 26.9 8.5 7.8 21.9 29.0 1.4 1.2CG Power and Industrial Solutions Neutral 81 - 5,102 6,555 7,292 7.5 7.5 - 0.8 8,140.0 101.8 1.3 1.3 0.1 1.2 0.9 0.8
Greaves Cotton Neutral 144 - 3,523 1,778 1,993 14.7 15.1 8.1 9.1 17.8 15.9 4.0 3.7 21.8 23.6 1.7 1.6
www.angelbroking.com
Stock WatchAugust 21, 2017
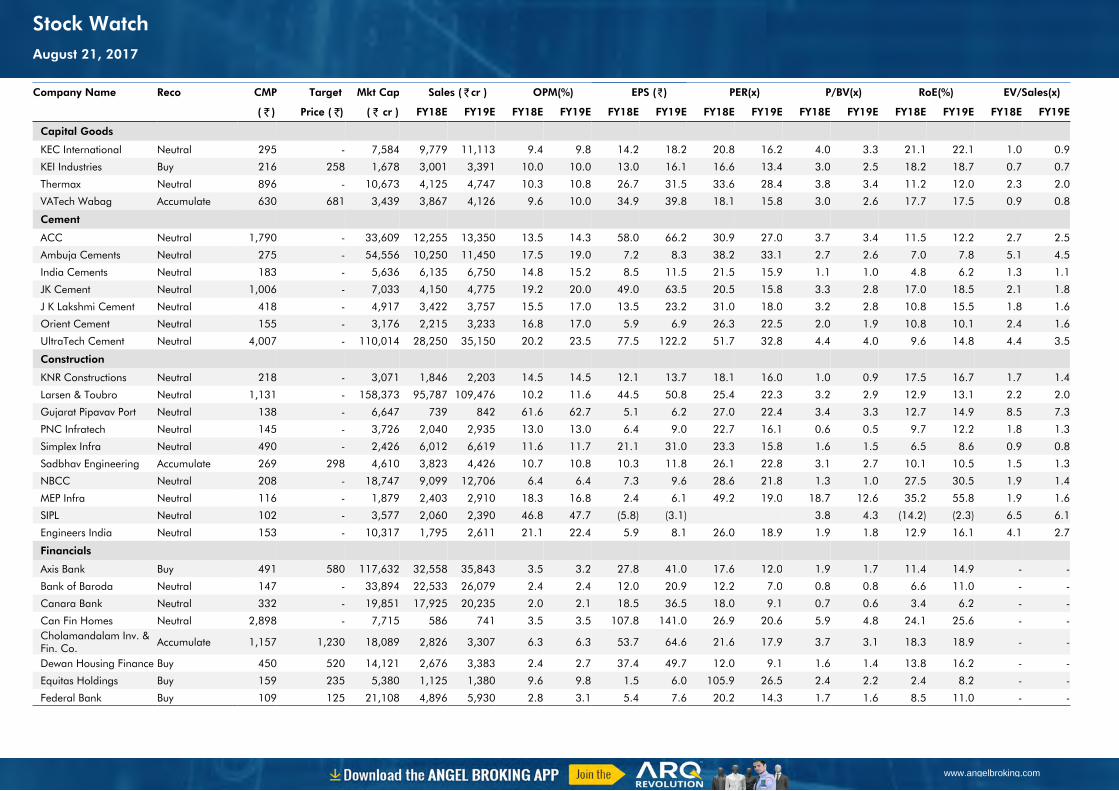
Company Name Reco CMP Target Mkt Cap Sales ( ₹cr ) OPM(%) EPS (₹) PER(x) P/BV(x) RoE(%) EV/Sales(x)
( ₹ ) Price ( ₹) ( ₹ cr ) FY18E FY19E FY18E FY19E FY18E FY19E FY18E FY19E FY18E FY19E FY18E FY19E FY18E FY19E
Capital Goods
KEC International Neutral 295 - 7,584 9,779 11,113 9.4 9.8 14.2 18.2 20.8 16.2 4.0 3.3 21.1 22.1 1.0 0.9
KEI Industries Buy 216 258 1,678 3,001 3,391 10.0 10.0 13.0 16.1 16.6 13.4 3.0 2.5 18.2 18.7 0.7 0.7
Thermax Neutral 896 - 10,673 4,125 4,747 10.3 10.8 26.7 31.5 33.6 28.4 3.8 3.4 11.2 12.0 2.3 2.0
VATech Wabag Accumulate 630 681 3,439 3,867 4,126 9.6 10.0 34.9 39.8 18.1 15.8 3.0 2.6 17.7 17.5 0.9 0.8
Cement
ACC Neutral 1,790 - 33,609 12,255 13,350 13.5 14.3 58.0 66.2 30.9 27.0 3.7 3.4 11.5 12.2 2.7 2.5
Ambuja Cements Neutral 275 - 54,556 10,250 11,450 17.5 19.0 7.2 8.3 38.2 33.1 2.7 2.6 7.0 7.8 5.1 4.5
India Cements Neutral 183 - 5,636 6,135 6,750 14.8 15.2 8.5 11.5 21.5 15.9 1.1 1.0 4.8 6.2 1.3 1.1
JK Cement Neutral 1,006 - 7,033 4,150 4,775 19.2 20.0 49.0 63.5 20.5 15.8 3.3 2.8 17.0 18.5 2.1 1.8
J K Lakshmi Cement Neutral 418 - 4,917 3,422 3,757 15.5 17.0 13.5 23.2 31.0 18.0 3.2 2.8 10.8 15.5 1.8 1.6
Orient Cement Neutral 155 - 3,176 2,215 3,233 16.8 17.0 5.9 6.9 26.3 22.5 2.0 1.9 10.8 10.1 2.4 1.6
UltraTech Cement Neutral 4,007 - 110,014 28,250 35,150 20.2 23.5 77.5 122.2 51.7 32.8 4.4 4.0 9.6 14.8 4.4 3.5
Construction
KNR Constructions Neutral 218 - 3,071 1,846 2,203 14.5 14.5 12.1 13.7 18.1 16.0 1.0 0.9 17.5 16.7 1.7 1.4
Larsen & Toubro Neutral 1,131 - 158,373 95,787 109,476 10.2 11.6 44.5 50.8 25.4 22.3 3.2 2.9 12.9 13.1 2.2 2.0
Gujarat Pipavav Port Neutral 138 - 6,647 739 842 61.6 62.7 5.1 6.2 27.0 22.4 3.4 3.3 12.7 14.9 8.5 7.3
PNC Infratech Neutral 145 - 3,726 2,040 2,935 13.0 13.0 6.4 9.0 22.7 16.1 0.6 0.5 9.7 12.2 1.8 1.3
Simplex Infra Neutral 490 - 2,426 6,012 6,619 11.6 11.7 21.1 31.0 23.3 15.8 1.6 1.5 6.5 8.6 0.9 0.8
Sadbhav Engineering Accumulate 269 298 4,610 3,823 4,426 10.7 10.8 10.3 11.8 26.1 22.8 3.1 2.7 10.1 10.5 1.5 1.3
NBCC Neutral 208 - 18,747 9,099 12,706 6.4 6.4 7.3 9.6 28.6 21.8 1.3 1.0 27.5 30.5 1.9 1.4
MEP Infra Neutral 116 - 1,879 2,403 2,910 18.3 16.8 2.4 6.1 49.2 19.0 18.7 12.6 35.2 55.8 1.9 1.6
SIPL Neutral 102 - 3,577 2,060 2,390 46.8 47.7 (5.8) (3.1) 3.8 4.3 (14.2) (2.3) 6.5 6.1
Engineers India Neutral 153 - 10,317 1,795 2,611 21.1 22.4 5.9 8.1 26.0 18.9 1.9 1.8 12.9 16.1 4.1 2.7
Financials
Axis Bank Buy 491 580 117,632 32,558 35,843 3.5 3.2 27.8 41.0 17.6 12.0 1.9 1.7 11.4 14.9 - -
Bank of Baroda Neutral 147 - 33,894 22,533 26,079 2.4 2.4 12.0 20.9 12.2 7.0 0.8 0.8 6.6 11.0 - -
Canara Bank Neutral 332 - 19,851 17,925 20,235 2.0 2.1 18.5 36.5 18.0 9.1 0.7 0.6 3.4 6.2 - -
Can Fin Homes Neutral 2,898 - 7,715 586 741 3.5 3.5 107.8 141.0 26.9 20.6 5.9 4.8 24.1 25.6 - -Cholamandalam Inv. & Fin. Co. Accumulate 1,157 1,230 18,089 2,826 3,307 6.3 6.3 53.7 64.6 21.6 17.9 3.7 3.1 18.3 18.9 - -
Dewan Housing Finance Buy 450 520 14,121 2,676 3,383 2.4 2.7 37.4 49.7 12.0 9.1 1.6 1.4 13.8 16.2 - -
Equitas Holdings Buy 159 235 5,380 1,125 1,380 9.6 9.8 1.5 6.0 105.9 26.5 2.4 2.2 2.4 8.2 - -
Federal Bank Buy 109 125 21,108 4,896 5,930 2.8 3.1 5.4 7.6 20.2 14.3 1.7 1.6 8.5 11.0 - -
www.angelbroking.com
Stock WatchAugust 21, 2017
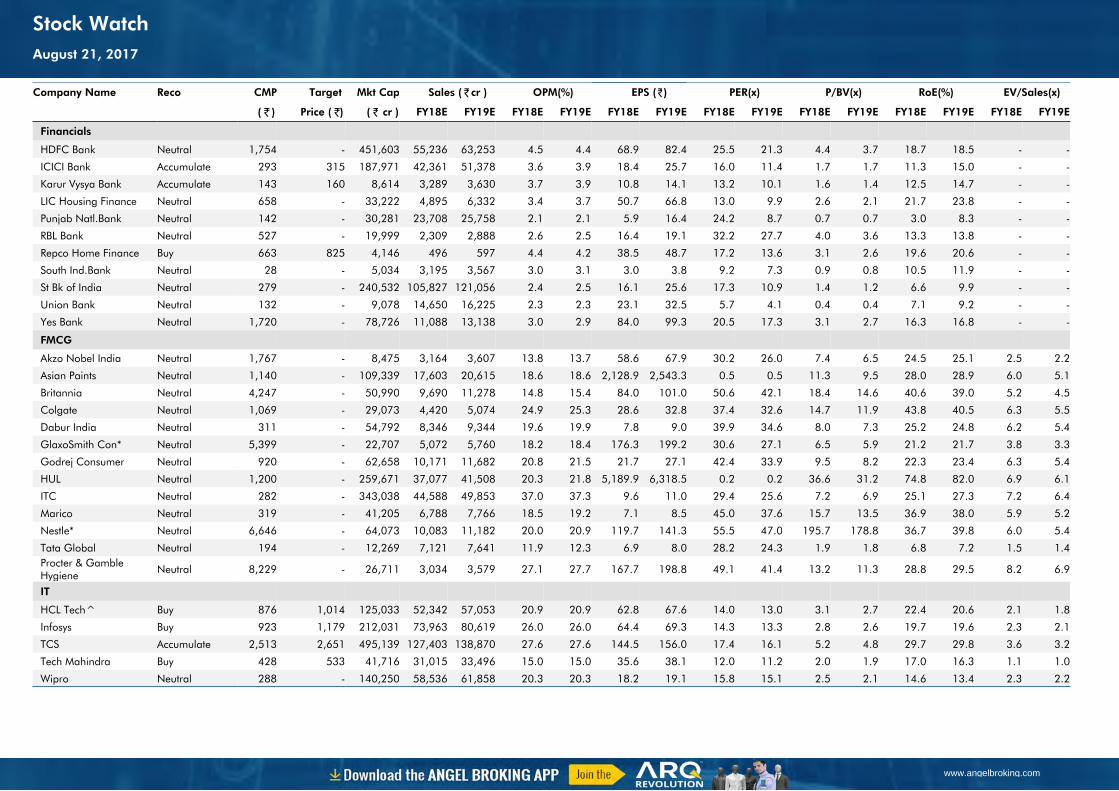
Company Name Reco CMP Target Mkt Cap Sales ( ₹cr ) OPM(%) EPS (₹) PER(x) P/BV(x) RoE(%) EV/Sales(x)
( ₹ ) Price ( ₹) ( ₹ cr ) FY18E FY19E FY18E FY19E FY18E FY19E FY18E FY19E FY18E FY19E FY18E FY19E FY18E FY19E
Financials
HDFC Bank Neutral 1,754 - 451,603 55,236 63,253 4.5 4.4 68.9 82.4 25.5 21.3 4.4 3.7 18.7 18.5 - -
ICICI Bank Accumulate 293 315 187,971 42,361 51,378 3.6 3.9 18.4 25.7 16.0 11.4 1.7 1.7 11.3 15.0 - -
Karur Vysya Bank Accumulate 143 160 8,614 3,289 3,630 3.7 3.9 10.8 14.1 13.2 10.1 1.6 1.4 12.5 14.7 - -
LIC Housing Finance Neutral 658 - 33,222 4,895 6,332 3.4 3.7 50.7 66.8 13.0 9.9 2.6 2.1 21.7 23.8 - -
Punjab Natl.Bank Neutral 142 - 30,281 23,708 25,758 2.1 2.1 5.9 16.4 24.2 8.7 0.7 0.7 3.0 8.3 - -
RBL Bank Neutral 527 - 19,999 2,309 2,888 2.6 2.5 16.4 19.1 32.2 27.7 4.0 3.6 13.3 13.8 - -
Repco Home Finance Buy 663 825 4,146 496 597 4.4 4.2 38.5 48.7 17.2 13.6 3.1 2.6 19.6 20.6 - -
South Ind.Bank Neutral 28 - 5,034 3,195 3,567 3.0 3.1 3.0 3.8 9.2 7.3 0.9 0.8 10.5 11.9 - -
St Bk of India Neutral 279 - 240,532 105,827 121,056 2.4 2.5 16.1 25.6 17.3 10.9 1.4 1.2 6.6 9.9 - -
Union Bank Neutral 132 - 9,078 14,650 16,225 2.3 2.3 23.1 32.5 5.7 4.1 0.4 0.4 7.1 9.2 - -
Yes Bank Neutral 1,720 - 78,726 11,088 13,138 3.0 2.9 84.0 99.3 20.5 17.3 3.1 2.7 16.3 16.8 - -
FMCG
Akzo Nobel India Neutral 1,767 - 8,475 3,164 3,607 13.8 13.7 58.6 67.9 30.2 26.0 7.4 6.5 24.5 25.1 2.5 2.2
Asian Paints Neutral 1,140 - 109,339 17,603 20,615 18.6 18.6 2,128.9 2,543.3 0.5 0.5 11.3 9.5 28.0 28.9 6.0 5.1
Britannia Neutral 4,247 - 50,990 9,690 11,278 14.8 15.4 84.0 101.0 50.6 42.1 18.4 14.6 40.6 39.0 5.2 4.5
Colgate Neutral 1,069 - 29,073 4,420 5,074 24.9 25.3 28.6 32.8 37.4 32.6 14.7 11.9 43.8 40.5 6.3 5.5
Dabur India Neutral 311 - 54,792 8,346 9,344 19.6 19.9 7.8 9.0 39.9 34.6 8.0 7.3 25.2 24.8 6.2 5.4
GlaxoSmith Con* Neutral 5,399 - 22,707 5,072 5,760 18.2 18.4 176.3 199.2 30.6 27.1 6.5 5.9 21.2 21.7 3.8 3.3
Godrej Consumer Neutral 920 - 62,658 10,171 11,682 20.8 21.5 21.7 27.1 42.4 33.9 9.5 8.2 22.3 23.4 6.3 5.4
HUL Neutral 1,200 - 259,671 37,077 41,508 20.3 21.8 5,189.9 6,318.5 0.2 0.2 36.6 31.2 74.8 82.0 6.9 6.1
ITC Neutral 282 - 343,038 44,588 49,853 37.0 37.3 9.6 11.0 29.4 25.6 7.2 6.9 25.1 27.3 7.2 6.4
Marico Neutral 319 - 41,205 6,788 7,766 18.5 19.2 7.1 8.5 45.0 37.6 15.7 13.5 36.9 38.0 5.9 5.2
Nestle* Neutral 6,646 - 64,073 10,083 11,182 20.0 20.9 119.7 141.3 55.5 47.0 195.7 178.8 36.7 39.8 6.0 5.4
Tata Global Neutral 194 - 12,269 7,121 7,641 11.9 12.3 6.9 8.0 28.2 24.3 1.9 1.8 6.8 7.2 1.5 1.4Procter & Gamble Hygiene Neutral 8,229 - 26,711 3,034 3,579 27.1 27.7 167.7 198.8 49.1 41.4 13.2 11.3 28.8 29.5 8.2 6.9
IT
HCL Tech^ Buy 876 1,014 125,033 52,342 57,053 20.9 20.9 62.8 67.6 14.0 13.0 3.1 2.7 22.4 20.6 2.1 1.8
Infosys Buy 923 1,179 212,031 73,963 80,619 26.0 26.0 64.4 69.3 14.3 13.3 2.8 2.6 19.7 19.6 2.3 2.1
TCS Accumulate 2,513 2,651 495,139 127,403 138,870 27.6 27.6 144.5 156.0 17.4 16.1 5.2 4.8 29.7 29.8 3.6 3.2
Tech Mahindra Buy 428 533 41,716 31,015 33,496 15.0 15.0 35.6 38.1 12.0 11.2 2.0 1.9 17.0 16.3 1.1 1.0
Wipro Neutral 288 - 140,250 58,536 61,858 20.3 20.3 18.2 19.1 15.8 15.1 2.5 2.1 14.6 13.4 2.3 2.2
www.angelbroking.com
Stock WatchAugust 21, 2017
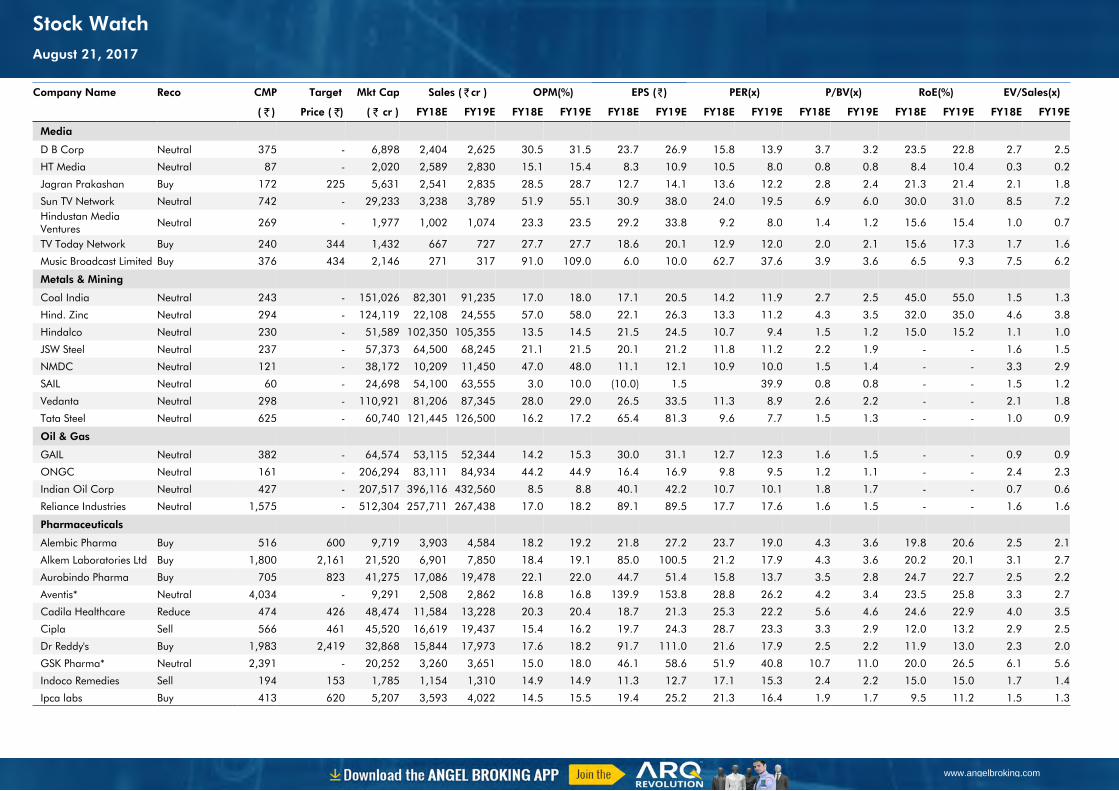
Company Name Reco CMP Target Mkt Cap Sales ( ₹cr ) OPM(%) EPS (₹) PER(x) P/BV(x) RoE(%) EV/Sales(x)
( ₹ ) Price ( ₹) ( ₹ cr ) FY18E FY19E FY18E FY19E FY18E FY19E FY18E FY19E FY18E FY19E FY18E FY19E FY18E FY19E
Media
D B Corp Neutral 375 - 6,898 2,404 2,625 30.5 31.5 23.7 26.9 15.8 13.9 3.7 3.2 23.5 22.8 2.7 2.5
HT Media Neutral 87 - 2,020 2,589 2,830 15.1 15.4 8.3 10.9 10.5 8.0 0.8 0.8 8.4 10.4 0.3 0.2
Jagran Prakashan Buy 172 225 5,631 2,541 2,835 28.5 28.7 12.7 14.1 13.6 12.2 2.8 2.4 21.3 21.4 2.1 1.8
Sun TV Network Neutral 742 - 29,233 3,238 3,789 51.9 55.1 30.9 38.0 24.0 19.5 6.9 6.0 30.0 31.0 8.5 7.2Hindustan Media Ventures Neutral 269 - 1,977 1,002 1,074 23.3 23.5 29.2 33.8 9.2 8.0 1.4 1.2 15.6 15.4 1.0 0.7
TV Today Network Buy 240 344 1,432 667 727 27.7 27.7 18.6 20.1 12.9 12.0 2.0 2.1 15.6 17.3 1.7 1.6
Music Broadcast Limited Buy 376 434 2,146 271 317 91.0 109.0 6.0 10.0 62.7 37.6 3.9 3.6 6.5 9.3 7.5 6.2
Metals & Mining
Coal India Neutral 243 - 151,026 82,301 91,235 17.0 18.0 17.1 20.5 14.2 11.9 2.7 2.5 45.0 55.0 1.5 1.3
Hind. Zinc Neutral 294 - 124,119 22,108 24,555 57.0 58.0 22.1 26.3 13.3 11.2 4.3 3.5 32.0 35.0 4.6 3.8
Hindalco Neutral 230 - 51,589 102,350 105,355 13.5 14.5 21.5 24.5 10.7 9.4 1.5 1.2 15.0 15.2 1.1 1.0
JSW Steel Neutral 237 - 57,373 64,500 68,245 21.1 21.5 20.1 21.2 11.8 11.2 2.2 1.9 - - 1.6 1.5
NMDC Neutral 121 - 38,172 10,209 11,450 47.0 48.0 11.1 12.1 10.9 10.0 1.5 1.4 - - 3.3 2.9
SAIL Neutral 60 - 24,698 54,100 63,555 3.0 10.0 (10.0) 1.5 39.9 0.8 0.8 - - 1.5 1.2
Vedanta Neutral 298 - 110,921 81,206 87,345 28.0 29.0 26.5 33.5 11.3 8.9 2.6 2.2 - - 2.1 1.8
Tata Steel Neutral 625 - 60,740 121,445 126,500 16.2 17.2 65.4 81.3 9.6 7.7 1.5 1.3 - - 1.0 0.9
Oil & Gas
GAIL Neutral 382 - 64,574 53,115 52,344 14.2 15.3 30.0 31.1 12.7 12.3 1.6 1.5 - - 0.9 0.9
ONGC Neutral 161 - 206,294 83,111 84,934 44.2 44.9 16.4 16.9 9.8 9.5 1.2 1.1 - - 2.4 2.3
Indian Oil Corp Neutral 427 - 207,517 396,116 432,560 8.5 8.8 40.1 42.2 10.7 10.1 1.8 1.7 - - 0.7 0.6
Reliance Industries Neutral 1,575 - 512,304 257,711 267,438 17.0 18.2 89.1 89.5 17.7 17.6 1.6 1.5 - - 1.6 1.6
Pharmaceuticals
Alembic Pharma Buy 516 600 9,719 3,903 4,584 18.2 19.2 21.8 27.2 23.7 19.0 4.3 3.6 19.8 20.6 2.5 2.1
Alkem Laboratories Ltd Buy 1,800 2,161 21,520 6,901 7,850 18.4 19.1 85.0 100.5 21.2 17.9 4.3 3.6 20.2 20.1 3.1 2.7
Aurobindo Pharma Buy 705 823 41,275 17,086 19,478 22.1 22.0 44.7 51.4 15.8 13.7 3.5 2.8 24.7 22.7 2.5 2.2
Aventis* Neutral 4,034 - 9,291 2,508 2,862 16.8 16.8 139.9 153.8 28.8 26.2 4.2 3.4 23.5 25.8 3.3 2.7
Cadila Healthcare Reduce 474 426 48,474 11,584 13,228 20.3 20.4 18.7 21.3 25.3 22.2 5.6 4.6 24.6 22.9 4.0 3.5
Cipla Sell 566 461 45,520 16,619 19,437 15.4 16.2 19.7 24.3 28.7 23.3 3.3 2.9 12.0 13.2 2.9 2.5
Dr Reddy's Buy 1,983 2,419 32,868 15,844 17,973 17.6 18.2 91.7 111.0 21.6 17.9 2.5 2.2 11.9 13.0 2.3 2.0
GSK Pharma* Neutral 2,391 - 20,252 3,260 3,651 15.0 18.0 46.1 58.6 51.9 40.8 10.7 11.0 20.0 26.5 6.1 5.6
Indoco Remedies Sell 194 153 1,785 1,154 1,310 14.9 14.9 11.3 12.7 17.1 15.3 2.4 2.2 15.0 15.0 1.7 1.4
Ipca labs Buy 413 620 5,207 3,593 4,022 14.5 15.5 19.4 25.2 21.3 16.4 1.9 1.7 9.5 11.2 1.5 1.3
www.angelbroking.com
Stock WatchAugust 21, 2017
Company Name Reco CMP Target Mkt Cap Sales ( ₹cr ) OPM(%) EPS (₹) PER(x) P/BV(x) RoE(%) EV/Sales(x)
( ₹ ) Price ( ₹) ( ₹ cr ) FY18E FY19E FY18E FY19E FY18E FY19E FY18E FY19E FY18E FY19E FY18E FY19E FY18E FY19E
Pharmaceuticals
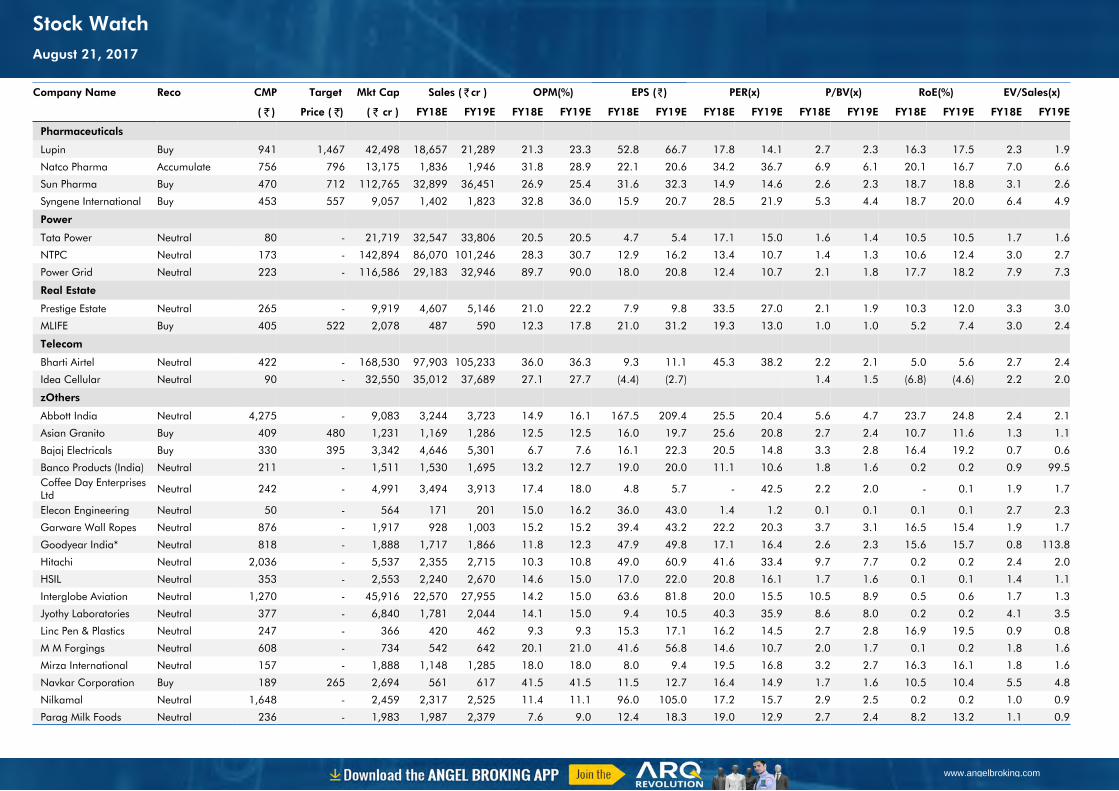
Lupin Buy 941 1,467 42,498 18,657 21,289 21.3 23.3 52.8 66.7 17.8 14.1 2.7 2.3 16.3 17.5 2.3 1.9
Natco Pharma Accumulate 756 796 13,175 1,836 1,946 31.8 28.9 22.1 20.6 34.2 36.7 6.9 6.1 20.1 16.7 7.0 6.6
Sun Pharma Buy 470 712 112,765 32,899 36,451 26.9 25.4 31.6 32.3 14.9 14.6 2.6 2.3 18.7 18.8 3.1 2.6
Syngene International Buy 453 557 9,057 1,402 1,823 32.8 36.0 15.9 20.7 28.5 21.9 5.3 4.4 18.7 20.0 6.4 4.9
Power
Tata Power Neutral 80 - 21,719 32,547 33,806 20.5 20.5 4.7 5.4 17.1 15.0 1.6 1.4 10.5 10.5 1.7 1.6
NTPC Neutral 173 - 142,894 86,070 101,246 28.3 30.7 12.9 16.2 13.4 10.7 1.4 1.3 10.6 12.4 3.0 2.7
Power Grid Neutral 223 - 116,586 29,183 32,946 89.7 90.0 18.0 20.8 12.4 10.7 2.1 1.8 17.7 18.2 7.9 7.3
Real Estate
Prestige Estate Neutral 265 - 9,919 4,607 5,146 21.0 22.2 7.9 9.8 33.5 27.0 2.1 1.9 10.3 12.0 3.3 3.0
MLIFE Buy 405 522 2,078 487 590 12.3 17.8 21.0 31.2 19.3 13.0 1.0 1.0 5.2 7.4 3.0 2.4
Telecom
Bharti Airtel Neutral 422 - 168,530 97,903 105,233 36.0 36.3 9.3 11.1 45.3 38.2 2.2 2.1 5.0 5.6 2.7 2.4
Idea Cellular Neutral 90 - 32,550 35,012 37,689 27.1 27.7 (4.4) (2.7) 1.4 1.5 (6.8) (4.6) 2.2 2.0
zOthers
Abbott India Neutral 4,275 - 9,083 3,244 3,723 14.9 16.1 167.5 209.4 25.5 20.4 5.6 4.7 23.7 24.8 2.4 2.1
Asian Granito Buy 409 480 1,231 1,169 1,286 12.5 12.5 16.0 19.7 25.6 20.8 2.7 2.4 10.7 11.6 1.3 1.1
Bajaj Electricals Buy 330 395 3,342 4,646 5,301 6.7 7.6 16.1 22.3 20.5 14.8 3.3 2.8 16.4 19.2 0.7 0.6
Banco Products (India) Neutral 211 - 1,511 1,530 1,695 13.2 12.7 19.0 20.0 11.1 10.6 1.8 1.6 0.2 0.2 0.9 99.5Coffee Day Enterprises Ltd Neutral 242 - 4,991 3,494 3,913 17.4 18.0 4.8 5.7 - 42.5 2.2 2.0 - 0.1 1.9 1.7
Elecon Engineering Neutral 50 - 564 171 201 15.0 16.2 36.0 43.0 1.4 1.2 0.1 0.1 0.1 0.1 2.7 2.3
Garware Wall Ropes Neutral 876 - 1,917 928 1,003 15.2 15.2 39.4 43.2 22.2 20.3 3.7 3.1 16.5 15.4 1.9 1.7
Goodyear India* Neutral 818 - 1,888 1,717 1,866 11.8 12.3 47.9 49.8 17.1 16.4 2.6 2.3 15.6 15.7 0.8 113.8
Hitachi Neutral 2,036 - 5,537 2,355 2,715 10.3 10.8 49.0 60.9 41.6 33.4 9.7 7.7 0.2 0.2 2.4 2.0
HSIL Neutral 353 - 2,553 2,240 2,670 14.6 15.0 17.0 22.0 20.8 16.1 1.7 1.6 0.1 0.1 1.4 1.1
Interglobe Aviation Neutral 1,270 - 45,916 22,570 27,955 14.2 15.0 63.6 81.8 20.0 15.5 10.5 8.9 0.5 0.6 1.7 1.3
Jyothy Laboratories Neutral 377 - 6,840 1,781 2,044 14.1 15.0 9.4 10.5 40.3 35.9 8.6 8.0 0.2 0.2 4.1 3.5
Linc Pen & Plastics Neutral 247 - 366 420 462 9.3 9.3 15.3 17.1 16.2 14.5 2.7 2.8 16.9 19.5 0.9 0.8
M M Forgings Neutral 608 - 734 542 642 20.1 21.0 41.6 56.8 14.6 10.7 2.0 1.7 0.1 0.2 1.8 1.6
Mirza International Neutral 157 - 1,888 1,148 1,285 18.0 18.0 8.0 9.4 19.5 16.8 3.2 2.7 16.3 16.1 1.8 1.6
Navkar Corporation Buy 189 265 2,694 561 617 41.5 41.5 11.5 12.7 16.4 14.9 1.7 1.6 10.5 10.4 5.5 4.8
Nilkamal Neutral 1,648 - 2,459 2,317 2,525 11.4 11.1 96.0 105.0 17.2 15.7 2.9 2.5 0.2 0.2 1.0 0.9
Parag Milk Foods Neutral 236 - 1,983 1,987 2,379 7.6 9.0 12.4 18.3 19.0 12.9 2.7 2.4 8.2 13.2 1.1 0.9
www.angelbroking.com
Stock WatchAugust 21, 2017
Company Name Reco CMP Target Mkt Cap Sales ( ₹cr ) OPM(%) EPS (₹) PER(x) P/BV(x) RoE(%) EV/Sales(x)
( ₹ ) Price ( ₹) ( ₹ cr ) FY18E FY19E FY18E FY19E FY18E FY19E FY18E FY19E FY18E FY19E FY18E FY19E FY18E FY19E
zOthers
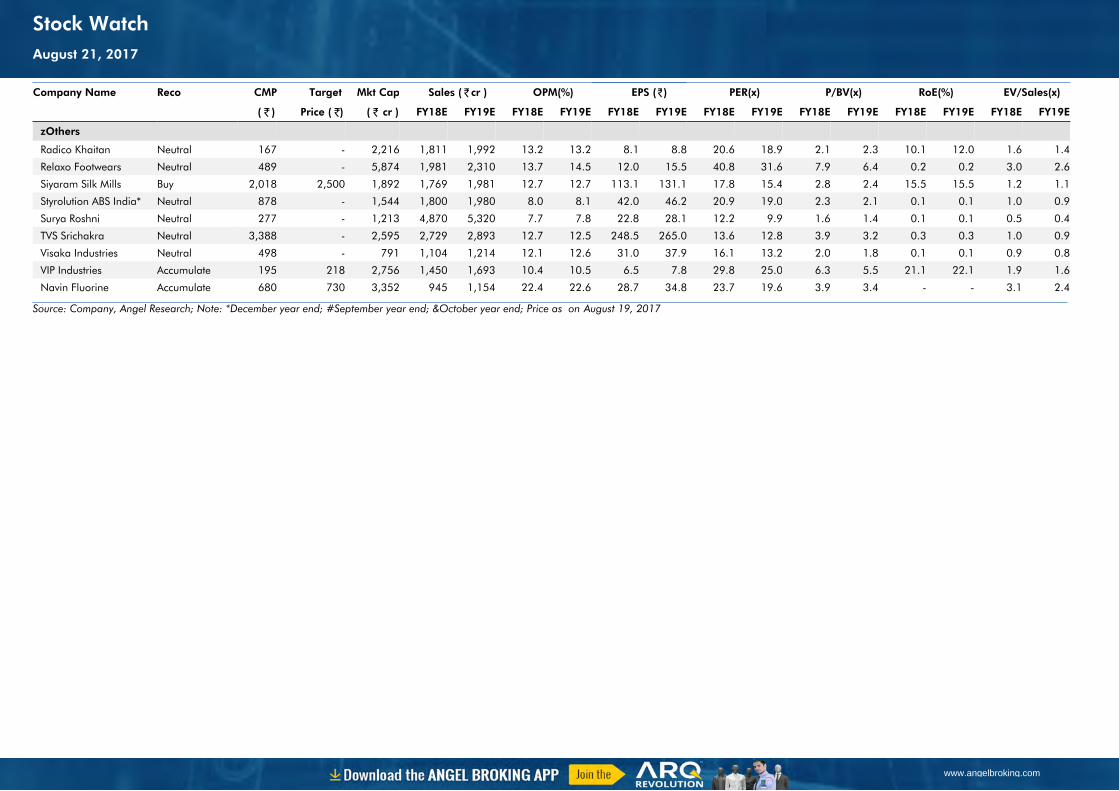
Radico Khaitan Neutral 167 - 2,216 1,811 1,992 13.2 13.2 8.1 8.8 20.6 18.9 2.1 2.3 10.1 12.0 1.6 1.4
Relaxo Footwears Neutral 489 - 5,874 1,981 2,310 13.7 14.5 12.0 15.5 40.8 31.6 7.9 6.4 0.2 0.2 3.0 2.6
Siyaram Silk Mills Buy 2,018 2,500 1,892 1,769 1,981 12.7 12.7 113.1 131.1 17.8 15.4 2.8 2.4 15.5 15.5 1.2 1.1
Styrolution ABS India* Neutral 878 - 1,544 1,800 1,980 8.0 8.1 42.0 46.2 20.9 19.0 2.3 2.1 0.1 0.1 1.0 0.9
Surya Roshni Neutral 277 - 1,213 4,870 5,320 7.7 7.8 22.8 28.1 12.2 9.9 1.6 1.4 0.1 0.1 0.5 0.4
TVS Srichakra Neutral 3,388 - 2,595 2,729 2,893 12.7 12.5 248.5 265.0 13.6 12.8 3.9 3.2 0.3 0.3 1.0 0.9
Visaka Industries Neutral 498 - 791 1,104 1,214 12.1 12.6 31.0 37.9 16.1 13.2 2.0 1.8 0.1 0.1 0.9 0.8
VIP Industries Accumulate 195 218 2,756 1,450 1,693 10.4 10.5 6.5 7.8 29.8 25.0 6.3 5.5 21.1 22.1 1.9 1.6
Navin Fluorine Accumulate 680 730 3,352 945 1,154 22.4 22.6 28.7 34.8 23.7 19.6 3.9 3.4 - - 3.1 2.4
Source: Company, Angel Research; Note: *December year end; #September year end; &October year end; Price as on August 19, 2017
www.angelbroking.com
Stock WatchAugust 21, 2017
Research Team Tel: 022 - 39357800 E-mail: [email protected] Website: www.angelbroking.com
DISCLAIMER
Angel Broking Private Limited (hereinafter referred to as “Angel”) is a registered Member of National Stock Exchange of India Limited,Bombay Stock Exchange Limited and Metropolitan Stock Exchange Limited. It is also registered as a Depository Participant with CDSL and Portfolio Manager with SEBI. It also has registration with AMFI as a Mutual Fund Distributor. Angel Broking Private Limited is a registered entity with SEBI for Research Analyst in terms of SEBI (Research Analyst) Regulations, 2014 vide registration number INH000000164. Angel or its associates has not been debarred/ suspended by SEBI or any other regulatory authority for accessing /dealing in securities Market. Angel or its associates/analyst has not received any compensation / managed or co-managed public offering of securities of the company covered by Analyst during the past twelve months.
This document is solely for the personal information of the recipient, and must not be singularly used as the basis of any investmentdecision. Nothing in this document should be construed as investment or financial advice. Each recipient of this document should make such investigations as they deem necessary to arrive at an independent evaluation of an investment in the securities of the companies referred to in this document (including the merits and risks involved), and should consult their own advisors to determine the merits and risks of such an investment.
Reports based on technical and derivative analysis center on studying charts of a stock's price movement, outstanding positions andtrading volume, as opposed to focusing on a company's fundamentals and, as such, may not match with a report on a company'sfundamentals. Investors are advised to refer the Fundamental and Technical Research Reports available on our website to evaluate the contrary view, if any.
The information in this document has been printed on the basis of publicly available information, internal data and other reliablesources believed to be true, but we do not represent that it is accurate or complete and it should not be relied on as such, as thisdocument is for general guidance only. Angel Broking Pvt. Limited or any of its affiliates/ group companies shall not be in any wayresponsible for any loss or damage that may arise to any person from any inadvertent error in the information contained in this report.Angel Broking Pvt. Limited has not independently verified all the information contained within this document. Accordingly, we cannottestify, nor make any representation or warranty, express or implied, to the accuracy, contents or data contained within this document.While Angel Broking Pvt. Limited endeavors to update on a reasonable basis the information discussed in this material, there may beregulatory, compliance, or other reasons that prevent us from doing so.
This document is being supplied to you solely for your information, and its contents, information or data may not be reproduced,redistributed or passed on, directly or indirectly.
Neither Angel Broking Pvt. Limited, nor its directors, employees or affiliates shall be liable for any loss or damage that may arise fromor in connection with the use of this information.
www.angelbroking.com
Market OutlookAugust 21, 2017