Embed Size (px)
Citation preview

NewMarket CorporatioN aNNUaL report 2013

FINANCIAL HIGHLIGHTS
2013 2012
in thousands, except shareand per-share amounts
OPERATIONS:Earnings excluding special items . . . . . . . . . . . . . . . . . . . . . . . . . . . . . . . . . . . . . . . . . $238,259 $239,942Special items income (loss) (a) . . . . . . . . . . . . . . . . . . . . . . . . . . . . . . . . . . . . . . . . . . . 26,483 (349)
Net income . . . . . . . . . . . . . . . . . . . . . . . . . . . . . . . . . . . . . . . . . . . . . . . . . . . . . . . . . . $264,742 $239,593
BASIC AND DILUTED EARNINGS PER SHARE:Earnings excluding special items . . . . . . . . . . . . . . . . . . . . . . . . . . . . . . . . . . . . . $ 17.90 $ 17.87Special items income (loss) (a) . . . . . . . . . . . . . . . . . . . . . . . . . . . . . . . . . . . . . . . 2.00 (0.02)
Net income . . . . . . . . . . . . . . . . . . . . . . . . . . . . . . . . . . . . . . . . . . . . . . . . . . . . . . . . . . $ 19.90 $ 17.85
FINANCIAL POSITION AND OTHER DATA:Cash and cash equivalents . . . . . . . . . . . . . . . . . . . . . . . . . . . . . . . . . . . . . . . . . . . . . . . $238,703 $ 89,129Long-term debt . . . . . . . . . . . . . . . . . . . . . . . . . . . . . . . . . . . . . . . . . . . . . . . . . . . . . . . $349,467 $424,407Shareholders’ equity . . . . . . . . . . . . . . . . . . . . . . . . . . . . . . . . . . . . . . . . . . . . . . . . . . . $572,448 $402,205Shares repurchased during year . . . . . . . . . . . . . . . . . . . . . . . . . . . . . . . . . . . . . . . . . . . 327,600 0
(a) The earnings for both 2013 and 2012 include certain special items. We have reported net income includingspecial items, as well as earnings excluding special items, and the related per-share amounts. Earnings andearnings per share, excluding special items, are not financial measures required by, or calculated inaccordance with, accounting principles generally accepted in the United States (GAAP). We have presentedthese non-GAAP financial measures with the most directly comparable GAAP financial measures and havereconciled them to such GAAP financial measures above. Our management believes this providesinformation about our operations and, in doing so, provides transparency to investors and enhances period-to-period comparability of performance. Our management further believes that this information enables thereader to have a clear understanding of the results of operations included in the GAAP financial statements.
Special items income (loss) after income tax expense:
Gain on sale of discontinued business . . . . . . . . . . . . . . . . . . . . . . . . . . . . . . . . . . . . . $ 21,855 $ 0Income from operations of discontinued business . . . . . . . . . . . . . . . . . . . . . . . . . . . . 540 2,321Gain (loss) on interest rate swap agreement . . . . . . . . . . . . . . . . . . . . . . . . . . . . . . . . . 4,088 (3,266)Tax benefit of special dividend . . . . . . . . . . . . . . . . . . . . . . . . . . . . . . . . . . . . . . . . . . . 0 6,151Loss on early extinguishment of debt . . . . . . . . . . . . . . . . . . . . . . . . . . . . . . . . . . . . . . 0 (5,555)
$ 26,483 $ (349)

To Our Shareholders:
It is again my privilege to address you, our shareholders, on the condition of our company. I am proud to reportthat 2013 was another very successful year for the company, continuing the trend of the last several years. Ourpetroleum additives business posted its 10th consecutive improvement in operating profit — quite a remarkableaccomplishment.
Many of my core messages this year are similar to those I have made in the past. That is mainly due to the factthat we continue to run our business over the years with the same strategy and intensity. We manage the businessfor the long-run and make our everyday decisions through that lens. We have often spoken of our approach to themarket, which we call our “customer intimacy model.” We are confident that model is right for us, as well as ourcustomers, and plays a significant role in the success we have seen for the past several years. The insights wehave gained through this model have guided our increasing investment in research and development, as we workto continue to earn the confidence and business our customers have entrusted in us.
We work very hard to make safety a way of doing business here at NewMarket. We have a good safety record,but we are not satisfied with “good.” We want “great.” To that end, we started a program to positively influencesafety behavior which we call “Actively Caring.” This new behavior encourages each employee to look out forthe safety and welfare of others with courage and compassion, with the goal of achieving an injury-freeenvironment. We are extremely proud of our safety performance today and know we will be successful inmaking significant improvements going forward.
During the year, Afton made a smooth and successful change in leadership as Rob Shama became the Presidentof Afton. Rob has continued the tradition of providing the leadership to ensure that Afton remains an integralcontributor to the success of our customers.
During 2013, we sold the real estate assets of Foundry Park I, which, for now, has ended our active involvementin managing real estate for other companies. We were pleased with both the positive change this real estatedevelopment has made on the City of Richmond, as well as the results of the sale.
As we have grown, we recognized the need to add manufacturing capacity to meet our customers’ demands. Tothat end, during 2013 we continued with our planning to build a petroleum additives manufacturing facility inSingapore. The first phase of this effort will cost approximately $100 million and is scheduled to be operationalat the end of 2015. This facility is tangible evidence of our commitment to this very important geographic portionof our business. It is our intention to continue to strengthen our capabilities to meet the unique needs of ourcustomers in Asia, India and other emerging markets in this region. The combination of a talented work force inthe region, facilities, and R&D capability is an unmistakable sign of our commitment to grow our successfulparticipation in the region.
During 2013, our balance sheet continued to strengthen. We ended the year with very low leverage and havevirtually the entire capacity of $650 million available on our revolving line of credit.
Our business is performing well, and our balance sheet is in an excellent position. Our significant cash flow hasallowed us to continue to benefit our shareholders by: 1) funding the internal growth needs of Afton, 2) pursuingacquisitions in the petroleum additives market, and 3) returning cash to our shareholders by paying a healthydividend and in the form of stock repurchases.
In all, the year was a very busy and successful one for us. Once again, this could not have been accomplishedwithout the hard work and dedication of each and every one of our 1,789 employees around the globe. Their hardwork, dedication, and focus on delivering value to our customers are the keys to our continued success.
Sincerely,
Thomas E. GottwaldPresident and CEO

UNITED STATESSECURITIES AND EXCHANGE COMMISSION
Washington, D.C. 20549
FORM 10-K
È ANNUAL REPORT PURSUANT TO SECTION 13 OR 15(d) OF THE SECURITIES EXCHANGEACT OF 1934
For the fiscal year ended December 31, 2013
or
‘ TRANSITION REPORT PURSUANT TO SECTION 13 OR 15(d) OF THE SECURITIESEXCHANGE ACT OF 1934
For the transition period from to
Commission file number 1-32190
NEWMARKET CORPORATIONIncorporated pursuant to the Laws of the Commonwealth of Virginia
Internal Revenue Service Employer Identification No. 20-0812170330 South Fourth Street
Richmond, Virginia 23219-4350804-788-5000
Securities registered pursuant to Section 12(b) of the Act:Title of each class Name of each exchange on which registered
COMMON STOCK, without par value NEW YORK STOCK EXCHANGESecurities registered pursuant to Section 12(g) of the Act: None
Indicate by check mark if the registrant is a well-known seasoned issuer, as defined in Rule 405 of the SecuritiesAct Yes È No ‘
Indicate by check mark if the registrant is not required to file reports pursuant to Section 13 or Section 15(d) of theAct Yes ‘ No È
Indicate by check mark whether the registrant (1) has filed all reports required to be filed by Section 13 or 15(d) of theSecurities Exchange Act of 1934 during the preceding 12 months (or for such shorter period that the registrant was required tofile such reports), and (2) has been subject to such filing requirements for the past 90 days. Yes È No ‘
Indicate by check mark whether the registrant has submitted electronically and posted on its corporate website, if any, everyInteractive Data File required to be submitted and posted pursuant to Rule 405 of Regulation S-T (§ 232.405 of this chapter)during the preceding 12 months (or for such shorter period that the registrant was required to submit and post suchfiles). Yes È No ‘
Indicate by check mark if disclosure of delinquent filers pursuant to Item 405 of Regulation S-K (§ 229.405 of this chapter) isnot contained herein, and will not be contained, to the best of registrant’s knowledge, in definitive proxy or informationstatements incorporated by reference in Part III of this Form 10-K or any amendment to this Form 10-K. È
Indicate by check mark whether the registrant is a large accelerated filer, an accelerated filer, a non-accelerated filer, or asmaller reporting company. See the definitions of “large accelerated filer,” “accelerated filer” and “smaller reportingcompany” in Rule 12b-2 of the Exchange Act.
Large accelerated filer È Accelerated filer ‘
Non-accelerated filer ‘ Smaller reporting company ‘
Indicate by check mark whether the registrant is a shell company (as defined in Rule 12b-2 of the Act). Yes ‘ No È
Aggregate market value of voting stock held by non-affiliates of the registrant as of June 28, 2013 (the last business day of theregistrant’s most recently completed second fiscal quarter): $2,626,274,517*Number of shares of Common Stock outstanding as of January 31, 2014: 13,004,241
DOCUMENTS INCORPORATED BY REFERENCEPortions of NewMarket Corporation’s definitive Proxy Statement for its 2014 Annual Meeting of Shareholders to be filedwith the Securities and Exchange Commission pursuant to Regulation 14A under the Securities Exchange Act of 1934 areincorporated by reference into Part III of this Annual Report on Form 10-K.
* In determining this figure, an aggregate of 3,309,553 shares of Common Stock as beneficially owned by Bruce C. Gottwaldand members of his immediate family have been excluded and treated as shares held by affiliates. See Item 12. The aggregatemarket value has been computed on the basis of the closing price on the New York Stock Exchange on June 28, 2013.
Form 10-KTable of Contents
PART IItem 1. Business . . . . . . . . . . . . . . . . . . . . . . . . . . . . . . . . . . . . . . . . . . . . . . . . . . . . . . . . . . . . . . . . . . . 3Item 1A. Risk Factors . . . . . . . . . . . . . . . . . . . . . . . . . . . . . . . . . . . . . . . . . . . . . . . . . . . . . . . . . . . . . . . . . 12Item 1B. Unresolved Staff Comments . . . . . . . . . . . . . . . . . . . . . . . . . . . . . . . . . . . . . . . . . . . . . . . . . . . . 19Item 2. Properties . . . . . . . . . . . . . . . . . . . . . . . . . . . . . . . . . . . . . . . . . . . . . . . . . . . . . . . . . . . . . . . . . . 20Item 3. Legal Proceedings . . . . . . . . . . . . . . . . . . . . . . . . . . . . . . . . . . . . . . . . . . . . . . . . . . . . . . . . . . . . 21Item 4. Mine Safety Disclosures . . . . . . . . . . . . . . . . . . . . . . . . . . . . . . . . . . . . . . . . . . . . . . . . . . . . . . . 21
PART IIItem 5. Market for Registrant’s Common Equity, Related Stockholder Matters and Issuer Purchases
of Equity Securities . . . . . . . . . . . . . . . . . . . . . . . . . . . . . . . . . . . . . . . . . . . . . . . . . . . . . . . . . 22Item 6. Selected Financial Data . . . . . . . . . . . . . . . . . . . . . . . . . . . . . . . . . . . . . . . . . . . . . . . . . . . . . . . . 24Item 7. Management’s Discussion and Analysis of Financial Condition and Results of Operations . . . 26Item 7A. Quantitative and Qualitative Disclosures about Market Risk . . . . . . . . . . . . . . . . . . . . . . . . . . . 39Item 8. Financial Statements and Supplementary Data . . . . . . . . . . . . . . . . . . . . . . . . . . . . . . . . . . . . . . 41Item 9. Changes in and Disagreements with Accountants on Accounting and Financial Disclosure . . . 90Item 9A. Controls and Procedures . . . . . . . . . . . . . . . . . . . . . . . . . . . . . . . . . . . . . . . . . . . . . . . . . . . . . . . 90Item 9B. Other Information . . . . . . . . . . . . . . . . . . . . . . . . . . . . . . . . . . . . . . . . . . . . . . . . . . . . . . . . . . . . 91
PART IIIItem 10. Directors, Executive Officers and Corporate Governance . . . . . . . . . . . . . . . . . . . . . . . . . . . . . 92Item 11. Executive Compensation . . . . . . . . . . . . . . . . . . . . . . . . . . . . . . . . . . . . . . . . . . . . . . . . . . . . . . . 92Item 12. Security Ownership of Certain Beneficial Owners and Management and Related Stockholder
Matters . . . . . . . . . . . . . . . . . . . . . . . . . . . . . . . . . . . . . . . . . . . . . . . . . . . . . . . . . . . . . . . . . . 92Item 13. Certain Relationships and Related Transactions, and Director Independence . . . . . . . . . . . . . . 93Item 14. Principal Accounting Fees and Services . . . . . . . . . . . . . . . . . . . . . . . . . . . . . . . . . . . . . . . . . . . 93
PART IVItem 15. Exhibits, Financial Statement Schedules . . . . . . . . . . . . . . . . . . . . . . . . . . . . . . . . . . . . . . . . . . 94Signatures . . . . . . . . . . . . . . . . . . . . . . . . . . . . . . . . . . . . . . . . . . . . . . . . . . . . . . . . . . . . . . . . . . . . . . . . . . . . . . 97
2

PART I
ITEM 1. BUSINESS
NewMarket Corporation (NewMarket) (NYSE: NEU) is a holding company and is the parent company of AftonChemical Corporation (Afton), Ethyl Corporation (Ethyl), NewMarket Services Corporation (NewMarketServices), and NewMarket Development Corporation (NewMarket Development).
Each of our subsidiaries manages its own assets and liabilities. Afton encompasses the petroleum additivesbusiness, while Ethyl represents the sale of tetraethyl lead (TEL) in North America and certain petroleumadditives manufacturing operations. NewMarket Development manages the property that we own in Richmond,Virginia. NewMarket Services provides various administrative services to NewMarket, Afton, Ethyl, andNewMarket Development. NewMarket Services departmental expenses and other expenses are billed toNewMarket and each subsidiary pursuant to services agreements between the companies.
References in this Annual Report on Form 10-K to “we,” “us,” “our,” and “NewMarket” are to NewMarketCorporation and its consolidated subsidiaries, unless the context indicates otherwise.
As a specialty chemicals company, Afton develops and manufactures highly formulated lubricant and fueladditive packages and markets and sells these products worldwide. Afton is one of the largest lubricant and fueladditives companies worldwide. Lubricant and fuel additives are necessary products for efficient maintenanceand reliable operation of all vehicles and machinery. From custom-formulated additive packages to market-general additives, we believe Afton provides customers with products and solutions that make engines runsmoother, machines last longer, and fuels burn cleaner.
Through an open, flexible, and collaborative style, Afton works closely with its customers to understand theirbusiness and help them meet their goals. This style has allowed Afton to develop long-term relationships with itscustomers in every major region of the world, which Afton serves through ten manufacturing facilities across theglobe.
With almost 500 employees in research and development, Afton is dedicated to developing additive formulationsthat are tailored to our customers’ and the end-users’ specific needs. Afton’s portfolio of technologically-advanced, value-added products allows it to provide a full range of products, services, and solutions to itscustomers.
Ethyl provides contract manufacturing services to Afton and to third parties and is a marketer of TEL in NorthAmerica.
NewMarket Development manages the property that we own on a site in Richmond, Virginia consisting ofapproximately 57 acres. We have our corporate offices on this site, as well as a research and testing facility, andseveral acres dedicated to other uses. We are currently exploring various development opportunities for portionsof the property as the demand warrants. This effort is ongoing in nature, as we have no specific timeline for anyfuture developments.
In July 2013, Foundry Park I, LLC (Foundry Park I), a wholly-owned subsidiary of NewMarket Development,completed the sale of its real estate assets, which comprised our entire real estate development segment. Priorperiods have been reclassified to reflect the discontinued operations.
We were incorporated in the Commonwealth of Virginia in 2004. Our principal executive offices are located at330 South Fourth Street, Richmond, Virginia, and our telephone number is (804) 788-5000. We employed 1,789people at the end of 2013.
Business Segments
Our business is composed of one segment, petroleum additives, which is primarily represented by Afton. TheTEL business of Ethyl is reflected in the “All other” category. Each of these is discussed below.
3

Petroleum Additives—Petroleum additives are used in lubricating oils and fuels to enhance their performance inmachinery, vehicles, and other equipment. We manufacture chemical components that are selected to performone or more specific functions and combine those chemicals with other components to form additive packagesfor use in specified end-user applications. The petroleum additives market is a global marketplace, withcustomers ranging from oil companies and refineries to original equipment manufacturers (OEMs) and otherspecialty chemical companies.
We believe our success in the petroleum additives market is largely due to our ability to deliver value to ourcustomers through our products and our open, flexible, and collaborative working style. We accomplish this byunderstanding what our customers value and by applying our technical capabilities, formulation expertise,broadly differentiated product offerings, and global distribution capabilities to deliver those solutions. We investsignificantly in research and development in order to meet our customers’ needs and to adapt to the rapidlychanging environment for new and improved products and services.
We view the petroleum additives marketplace as being comprised of two broad product groupings: lubricantadditives and fuel additives. Lubricant additives are highly formulated chemical packages that, when blendedwith base fluids, improve the efficiency, durability, performance, and functionality of mineral oils, synthetic oils,and biodegradable fluids, thereby enhancing the performance of machinery and engines. Fuel additives arechemical components and formulations that improve the refining process and performance of gasoline, diesel,biofuels, and other fuels, resulting in lower operating costs, improved vehicle performance, and reduced tailpipeor smokestack emissions.
Lubricant Additives
Lubricant additives are essential ingredients for lubricating oils. Lubricant additives are used in a wide variety ofvehicle and industrial applications, including engine oils, transmission fluids, off-road equipment, gear oils,hydraulic oils, turbine oils, industrial oils, metalworking fluids and in virtually any other application wheremetal-to-metal moving parts are utilized. Lubricant additives are organic and synthetic chemical components thatenhance wear protection, prevent deposits, and protect against the hostile operating environment of an engine,transmission, axle, hydraulic pump, or industrial machine.
Lubricants are widely used in operating machinery from heavy industrial equipment to vehicles. Lubricantsprovide a layer of protection between moving mechanical parts. Without this layer of protection, the normalfunctioning of machinery would not occur. Effective lubricants reduce downtime, prevent accidents, and increaseefficiency. Specifically, lubricants serve the following main functions:
• friction reduction—Friction is reduced by maintaining a thin film of lubricant between movingsurfaces, preventing them from coming into direct contact with one another and reducing wear onmoving machinery, thereby providing longer life and operational efficiency.
• heat removal—Lubricants act as coolants by removing heat resulting either from friction or throughcontact with other, higher temperature materials.
• containment of contaminants—Lubricants are required to function by carrying contaminants away fromthe machinery and neutralizing the harmful impact of the by-products created by combustion.
The functionality of lubricants is created through an exact balance between a base fluid and performanceenhancing additives. This balance is the goal of effective formulations achieved by experienced research anddevelopment professionals. We offer a full line of lubricant additive packages, each of which is composed ofcomponent chemicals specially selected to perform desired functions. We manufacture most of the chemicalcomponents and blend these components to create formulated additives packages designed to meet industry andcustomer specifications. Lubricant additive components are generally classified based upon their intendedfunctionality, including:
• detergents, which clean moving parts of engines and machines, suspend oil contaminants andcombustion by-products, and absorb acidic combustion products;
4

• dispersants, which serve to inhibit the formation of sludge and particulates;
• extreme pressure/antiwear agents, which reduce wear on moving engine and machinery parts;
• viscosity index modifiers, which improve the viscosity and temperature characteristics of lubricantsand help the lubricant flow evenly to all parts of an engine or machine; and
• antioxidants, which prevent oil from degrading over time.
We are one of the leading global suppliers of specially formulated lubricant additives that combine some or all ofthe components described above to develop our products. Our products are highly formulated, complex chemicalcompositions derived from extensive research and testing to ensure all additive components work together toprovide the intended results. Our products are engineered to meet specifications prescribed by either the industryor a specific customer. Purchasers of lubricant additives tend to be oil companies, distributors, refineries, andcompounders/blenders. We make no sales directly to end-users.
Key drivers of demand for lubricant additives include total vehicle miles driven, fuel economy, drain/refillintervals, the average age of vehicles on the road, vehicle production, equipment production, and new vehicle andequipment hardware technologies.
We view our participation in the lubricant marketplace in three primary areas: engine oil additives, drivelineadditives, and industrial additives. Our view is not necessarily the same way others view the market.
Engine Oil Additives—The largest submarket within the lubricant additives marketplace is engine oil additives,which we estimate represents approximately 70% of the overall lubricant additives market volume. The engineoil market’s primary customers include consumers, fleet owners, service dealers, and OEMs. The extension ofdrain intervals has generally offset increased demand due to higher vehicle population, new hardware, and moremiles driven. The primary functions of engine oil additives are to reduce friction, prevent wear, control formationof sludge and oxidation, and prevent rust. Engine oil additives are typically sold to lubricant manufacturers whocombine them with a base oil fluid to meet internal, industry, and OEM specifications.
Key drivers of the engine oils market are the total vehicle miles driven, fuel economy, number of vehicles on theroad, drain intervals, engine and crankcase size, changes in engine design, and temperature and specificationchanges driven by the OEMs. Afton offers products that enhance the performance of mineral, part-synthetic, andfully-synthetic engine oils.
Driveline Additives—The driveline additives submarket is comprised of additives designed for products such astransmission fluids and gear oils, as well as axle and off-road fluids. This submarket shares in the 30% of themarket not covered by engine oil additives. Transmission fluids primarily serve as the power transmission andheat transfer medium in the area of the transmission where the torque of the drive shaft is transferred to the gearsof the vehicle. Gear oil additives lubricate gears, bearings, clutches, and bands in the gear-box and are used invehicles, as well as in off-highway, hydraulic, and marine equipment. Other products in this area includehydraulic transmission fluids, universal tractor fluids, power steering fluids, shock absorber fluids, gear oils, andlubricants for heavy machinery. These products must conform to highly prescribed specifications developed byvehicle OEMs for specific models or designs. These additives are generally sold to oil companies for ultimatesale to vehicle OEMs for new vehicles (factory-fill), service dealers for aftermarket servicing (service-fill),retailers, and distributors.
Key drivers of the driveline additives marketplace are the number of vehicles manufactured, total number ofvehicles in operation, drain intervals for transmission fluids and gear applications, changes in engine andtransmission design and temperatures, and specification changes driven by the OEMs.
Industrial Additives—The industrial additives submarket is comprised of additives designed for products forindustrial applications such as hydraulic fluids, grease, industrial gear fluids, industrial specialty applications,and metalworking additives. This submarket also shares in the 30% of the market not covered by engine oil
5

additives. These products must conform to industry specifications, OEM requirements, and/or application andoperating environment demands. Industrial additives are generally sold to oil companies, service dealers forafter-market servicing, and distributors.
Key drivers of the industrial additives marketplace are gross domestic product levels and industrial production.
Fuel Additives
Fuel additives are chemical compounds that are used to improve both the oil refining process and theperformance of gasoline, diesel, biofuels, and other fuels. Benefits of fuel additives in the oil refining processinclude reduced use of crude oil, lower processing costs, and improved fuel storage properties. Fuel performancebenefits include ignition improvements, combustion efficiency, reduced emission particulates, fuel economyimprovements, and engine cleanliness, as well as protection against deposits in fuel injectors, intake valves, andthe combustion chamber. Our fuel additives are extensively tested and designed to meet stringent industry,government, OEM, and individual customer requirements.
Many different types of additives are used in fuels. Their use is generally determined by customer, industry,OEM, and government specifications, and often differs from country to country. The types of fuel additives weoffer include:
• gasoline performance additives, which clean and maintain key elements of the fuel delivery systems,including fuel injectors and intake valves, in gasoline engines;
• diesel fuel performance additives, which perform similar cleaning functions in diesel engines;
• cetane improvers, which increase the cetane number (ignition quality) in diesel fuel by reducing thedelay between injection and ignition;
• stabilizers, which reduce or eliminate oxidation in fuel;
• corrosion inhibitors, which minimize the corrosive effects of combustion by-products and prevent rust;
• lubricity additives, which restore lubricating properties lost in the refining process;
• cold flow improvers, which improve the pumping and flow of diesel in cold temperatures; and
• octane enhancers, which increase octane ratings and decrease emissions.
We offer a broad line of fuel additives worldwide and sell our products to major fuel marketers and refiners, aswell as independent terminals and other fuel blenders.
Key drivers in the fuel additive marketplace include total vehicle miles driven, fuel economy, the introduction ofnew engine design, regulations on emissions (both gasoline and diesel), quality of the crude oil slate andperformance standards, and marketing programs of major oil companies.
Competition
We believe we are one of the four largest manufacturers and suppliers in the petroleum additives marketplace.
In the lubricant additives submarket of petroleum additives, our major competitors are The Lubrizol Corporation(a wholly-owned subsidiary of Berkshire Hathaway Inc.), Infineum (a joint venture between ExxonMobilChemical and Royal Dutch Shell plc), and Chevron Oronite Company LLC. There are several other suppliers inthe worldwide market who are competitors in their particular product areas.
The fuel additives submarket is fragmented and characterized by many competitors. While we participate inmany facets of the fuel additives market, our competitors tend to be more narrowly focused. In the gasolinedetergent market, we compete mainly against BASF AG, Chevron Oronite Company LLC, and The Lubrizol
6

Corporation. In the diesel and refinery markets, we compete mainly against The Lubrizol Corporation, Infineum,BASF AG, Clariant Ltd., and Innospec Inc. (Innospec). We also compete against other regional competitors inthe fuel additives marketplace.
The competition among the participants in these industries is characterized by the need to provide customers withcost effective, technologically-capable products that meet or exceed industry specifications. The need tocontinually increase technology performance and lower cost through formulation technology and costimprovement programs is vital for success in this environment.
All Other—The “All other” category includes the operations of the TEL business (primarily sales of TEL inNorth America), as well as certain contract manufacturing performed by Ethyl. The Ethyl manufacturing facilityis located in Houston, Texas. This plant is substantially dedicated to petroleum additives manufacturing andproduces both lubricant additives and fuel additives. The financial results of the petroleum additives productionby Ethyl are reflected in the petroleum additives segment results. The “All other” category financial resultsinclude a service fee charged by Ethyl for its production services to Afton. Our remaining manufacturingfacilities are part of Afton and produce lubricant additives and/or fuel additives.
Raw Materials and Product Supply
We use a variety of raw materials and chemicals in our manufacturing and blending processes and believe thesources of these are adequate for our current operations. The primary raw materials for Afton are base oil,polyisobutylene, antioxidants, alcohols, solvents, sulfonates, friction modifiers, olefins, and copolymers.
As the performance requirements of our products become more complex, we often work with highly specializedsuppliers. In some cases, we source from a single supplier. In cases where we decide to source from a singlesupplier, we manage our risk by maintaining safety stock of the raw material, qualifying alternate supply, oridentifying a backup position. The backup position could take additional time to implement, but we are confidentwe can ensure continued supply for our customers. We continue to monitor the raw material supply situation andcontinually adjust our procurement strategies as conditions require.
Research, Development, and Testing
Research, development, and testing (R&D) provides Afton with the core technologies and performance-basedsolutions for our customers in the petroleum additives market. We develop products through a combination ofchemical synthesis, formulation development, engineering design, and performance testing. In addition toproducts, R&D provides our customers with product differentiation and technical support to assure totalcustomer satisfaction.
We are committed to providing the most advanced products, comprehensive testing programs, and superiortechnical solutions to our customers and to OEMs worldwide. R&D expenditures, which totaled $137 million in2013, $118 million in 2012, and $105 million in 2011, are expected to increase again in 2014. Afton continues toexpand our internal testing, research, and customer support capabilities around the world in support of our goalsof providing market-driven technical leadership and performance-based differentiation. In 2013, we expandedour laboratory and mechanical testing capabilities in five of our principal technical centers around the world:Richmond, Virginia; Ashland, Virginia; Bracknell, England; Suzhou, China; and Tsukuba, Japan. This increasesour capacity for providing differentiated solutions to our customers and provides additional process developmentcapability to enhance our speed-to-market for new products and technologies.
Afton continues to develop new technology and products to meet the changing requirements of OEMs and tokeep our customers well positioned for the future. A significant portion of our R&D investment is dedicated tothe development of products that are differentiated by their ability to deliver improved fuel efficiency in additionto robust performance in a wide range of new hardware designs.
7

In 2013, we successfully launched new technologies across all of our lubricant additive and fuel additive productareas. We developed new engine oil products for passenger cars and commercial trucks in support of ourcustomers in all regions of the world. Research in the engine oil area continues to increase as we prepare for thenew engine oil specifications in North America: ILSAC GF-6 for passenger car motor oils and PC-11 forcommercial trucks.
Our industrial additives product slate continued to expand with the development of new products in multipleareas including hydraulic fluids, grease, industrial gear oils, turbine oils, grease additives, and metalworking fluidadditives. Research is focused on the development of technologies that will provide differentiation to ourcustomers in multiple performance areas including equipment life and energy efficiency.
We continue to provide leading technology in the fuel additives area. In 2013, new products were developed andlaunched in all product lines including gasoline performance additives and diesel performance additives, as wellas specification and distribution fuel additives. Research is focused on the development of new technologies thatexceed the changing needs of modern engine fueling systems and changing fuel properties, as well as addressingthe growing need for increased fuel economy and emissions reduction. In addition, we continue to maintain closeinteractions with regulatory, industry, and OEM leaders to guide our development of future fuel additivetechnologies based on well-defined market needs.
Technology development continued at a rapid pace in our transmission fluid, axle oil, and tractor fluid productlines. This included the development of new factory fill products for OEMs in the United States, Germany,Japan, India, and China, and for expansion of our service fill product portfolio. Afton’s state-of-the art testingcapabilities are enabling customized research in all areas of performance needed by both OEMs and tier onesuppliers. Our leading-edge capabilities and fundamental understanding in the areas of friction control, energyefficiency, and wear/pitting prevention were used to set the stage for next generation products in all drivelineareas.
Intellectual Property
Our intellectual property, including our patents, licenses, and trademarks, is an important component of ourbusiness. We actively protect our inventions, new technologies, and product developments by filing patentapplications and maintaining trade secrets. We currently own approximately 1,200 issued or pending UnitedStates and foreign patents. In addition, we have acquired the rights under patents and inventions of others throughlicenses or otherwise. We take care to respect the intellectual property rights of others and we believe ourproducts do not infringe upon those rights. We vigorously participate in patent opposition proceedings around theworld, where necessary, to secure a technology base free of infringement. We believe our patent position isstrong, aggressively managed, and sufficient for the conduct of our business.
We also have several hundred trademark registrations throughout the world for our marks, includingNewMarket®, Afton Chemical®, Ethyl®, mmt®, HiTEC®, TecGARD®, GREENBURN®, Passion for Solutions®,CleanStart®, Polartech®, BioTEC®, and Axcel®, as well as a pending trademark application for MicrobotzTM andthe service mark QuickResponse 24/7SM.
Commitment to Environmental and Safety Excellence
Our commitment to the environment and safety excellence applies to every employee, every day, at every site.Safety and environmental responsibility are a way of life at NewMarket - enhancing operations, the way wework, and the relationships we maintain with our employees, customers, supply chain partners, and thecommunities in which we operate. Our objective is to establish a culture where our employees understand thatgood environmental and safety performance is good business and understand that environmental compliance andsafety is their personal responsibility. Every employee at NewMarket is responsible for ensuring that our highstandards in the area of health, safety (including process safety), environmental protection, and security (HSES)are upheld at all times.
8

Our Global Responsible Care Policy Statement includes a commitment to conduct operations in a manner thatprotects our employees, communities, and the environment, to comply with all applicable laws and regulationsconcerning HSES and to reduce our environmental footprint. Additionally, in pursuit of our vision of zeroincidents, we work with our employees and other key stakeholders to establish appropriate goals, objectives andtargets.
Both Afton and Ethyl have implemented Responsible Care Management Systems (RCMS® or RC14001®) atU.S. facilities. Our implementation of RCMS® is certified by an independent third-party auditing process.Additionally, Afton’s Feluy, Belgium, Suzhou, China, and Manchester, England plants are certified to theenvironmental standard ISO 14001. Suzhou is also certified to OHSAS 18001, a global occupational health andsafety standard. Afton’s Sauget, Illinois plant continues to be an OSHA VPP (Voluntary Protection Program)“Star” worksite.
In 2013 we launched our “Actively Caring” safety program where people look out for the safety and welfare ofothers with courage and compassion, enabling the achievement of an injury-free environment. Our worldwideinjury/illness recordable rate (which is the number of injuries per 200,000 hours worked) in 2013 was .81. Ourperformance is a demonstration of our safety-first culture and represents a focused effort by all of ouremployees. We are extremely proud of our accomplishments in this area. Both Afton and Ethyl continue to beone of the top performers among their industry peers. While our safety performance is very strong, we strive forcontinual improvement with a vision of having zero accidents.
As members of the American Chemistry Council (ACC), Afton and Ethyl provide data on twelve metrics used totrack environmental impact, safety, energy use, community outreach and emergency preparedness, greenhousegas intensity, and product stewardship performance of the ACC member companies. These can be viewed athttp://responsiblecare.americanchemistry.com/Performance-Results. The information on this website is not, andshall not be deemed to be, a part of this Annual Report on Form 10-K or incorporated by reference in this AnnualReport on Form 10-K or any other filings we make with the Securities and Exchange Commission (SEC).
Environmental
We operate under policies that we believe comply with federal, state, local, and foreign requirements regardingthe handling, manufacture, and use of materials. One or more regulatory agencies may classify some of thesematerials as hazardous or toxic. We also believe that we comply in all material respects with laws, regulations,statutes, and ordinances protecting the environment, including those related to the discharge of materials. Weexpect to continue to comply in all material respects. We regularly review the status of significant existing orpotential environmental issues.
Our total accruals for environmental remediation, dismantling, and decontamination were approximately $18million at December 31, 2013 and $20 million at December 31, 2012.
As new technology becomes available, it may be possible to reduce accrued amounts. While we believe that weare currently fully accrued for known environmental issues, it is possible that unexpected future costs could havea significant financial impact on our financial position, results of operations, and cash flows.
We spent approximately $19 million in 2013, $18 million in 2012, and $19 million in 2011 for ongoingenvironmental operating and clean-up costs, excluding depreciation of previously capitalized expenditures. Theseenvironmental operating and clean-up expenses are included in cost of goods sold.
For capital expenditures on pollution prevention and safety projects, we spent $11 million in 2013, $10 million in2012, and $9 million in 2011. We expect expenditures in 2014 to be at a level similar to the previous three years.
9

Our estimate of the effects of complying with governmental pollution prevention and safety regulations is subjectto:
• potential changes in applicable statutes and regulations (or their enforcement and interpretation);
• uncertainty as to the success of anticipated solutions to pollution problems;
• uncertainty as to whether additional expense may prove necessary; and
• potential for emerging technology to affect remediation methods and reduce associated costs.
We are subject to liabilities associated with the investigation and cleanup of hazardous substances, as well aspersonal injury, property damage, or natural resource damage arising from the release of, or exposure to, suchhazardous substances. Further, we may have environmental liabilities imposed in many situations without regardto violations of laws or regulations. These liabilities may also be imposed jointly and severally (so that aresponsible party may be held liable for more than its share of the losses involved, or even the entire loss) andmay be imposed on many different entities with a relationship to the hazardous substances at issue, including, forexample, entities that formerly owned or operated the property and entities that arranged for the disposal of thehazardous substances at an affected property. We are subject to many environmental laws, including the federalComprehensive Environmental Response, Compensation and Liability Act, commonly known as CERCLA orSuperfund, in the United States, and similar foreign and state laws.
Under CERCLA, we are currently considered a potentially responsible party (PRP), at several sites, ranging froma de minimis PRP or a minor PRP, to an involvement considered greater than the minor PRP involvement. Atsome of these sites, the remediation methodology, as well as the proportionate shares of each PRP, has been wellestablished. Other sites are not as mature, which makes it more difficult to reasonably estimate our share of thefuture clean-up or remediation costs.
In 2000, the Environmental Protection Agency (EPA) named us as a PRP under Superfund law for the clean-upof soil and groundwater contamination at the five grouped disposal sites known as “Sauget Area 2 Sites” inSauget, Illinois. Without admitting any fact, responsibility, fault, or liability in connection with this site, we areparticipating with other PRPs in site investigations and feasibility studies. The Sauget Area 2 Sites PRPs receivednotice of approval from the EPA of the Remedial Investigation report on February 27, 2009, notice of approvalof the October 2009 Human Health Risk Assessment on December 17, 2009, and approval of the FeasibilityStudy report on April 3, 2013. Finally, in December 2013, the EPA issued its Record of Decision confirming itsremedies for the selected Sauget Area 2 sites. We have accrued our estimated proportional share of the remedialcosts and expenses addressed in the Record of Decision. We do not believe there is any additional informationavailable as a basis for revision of the liability that we have established at December 31, 2013. The amountaccrued for this site is not material. We also have several other sites where we are in the process ofenvironmental remediation and monitoring. See Note 17 for further information.
Geographic Areas
We have operations in the United States, Europe, Asia, Latin America, Australia, the Middle East, and Canada.The economies are generally stable in the countries where we do most of our business, although many of thosecountries have experienced economic downturns in the past few years. In countries with more political oreconomic uncertainty, we generally minimize our risk of loss by utilizing U.S. Dollar-denominated transactions,letters of credit, and prepaid transactions. Our foreign customers consist of global, national, and independent oilcompanies, as well as financially viable state-owned organizations.
The table below reports revenues and long-lived assets by geographic area. Except for the United States, nosingle country exceeded 10% of consolidated revenue or long-lived assets in any year. However, because ourforeign operations are significant to our overall business, we are presenting revenue in the table below by themajor regions in which we operate. We assign revenues to geographic areas based on the location to which theproduct was shipped to a third-party. The change in revenues during the three-year period is discussed more fullyin Item 7, “Management’s Discussion and Analysis of Financial Condition and Results of Operations.”
10

Net sales to one customer of our petroleum additives segment exceeded 10% of consolidated revenue in 2013,2012, and 2011. Sales to Royal Dutch Shell plc and its affiliates (Shell) amounted to $253 million (11% ofconsolidated revenue) in 2013, $252 million (11% of consolidated revenue) in 2012, and $246 million (11% ofconsolidated revenue) in 2011. These sales represent a wide range of products sold to this customer in multipleregions of the world.
Geographic Areas
Years Ended December 31,
(in millions) 2013 2012 2011
Consolidated revenueUnited States . . . . . . . . . . . . . . . . . . . . . . . . . . . . . . . . . . $ 806 $ 800 $ 756Europe, Middle East, Africa, India . . . . . . . . . . . . . . . . . 760 692 728Asia Pacific . . . . . . . . . . . . . . . . . . . . . . . . . . . . . . . . . . . 462 441 405Other foreign . . . . . . . . . . . . . . . . . . . . . . . . . . . . . . . . . . 252 279 249
Consolidated revenue . . . . . . . . . . . . . . . . . . . . . . . . $2,280 $2,212 $2,138
Long-lived assets (a)United States . . . . . . . . . . . . . . . . . . . . . . . . . . . . . . . . . . $ 166 $ 255 $ 257Foreign . . . . . . . . . . . . . . . . . . . . . . . . . . . . . . . . . . . . . . . 119 103 96
Total long-lived assets . . . . . . . . . . . . . . . . . . . . . . . $ 285 $ 358 $ 353
(a) Long-lived assets include property, plant, and equipment, net of depreciation.
Availability of Reports Filed with the Securities and Exchange Commission and Corporate GovernanceDocuments
Our internet website address is www.newmarket.com. We make available, free of charge through our website,our Annual Report on Form 10-K, Quarterly Reports on Form 10-Q, Current Reports on Form 8-K, andamendments to those reports filed or furnished pursuant to Section 13(a) or 15(d) of the Securities Exchange Actof 1934, as amended (Exchange Act), as soon as reasonably practicable after such documents are electronicallyfiled with, or furnished to, the SEC. In addition, our Corporate Governance Guidelines, Code of Conduct, and thecharters of our Audit; Compensation; and Nominating and Corporate Governance Committees, are available onour website and are available in print, without charge, to any shareholder upon request by contacting ourCorporate Secretary at NewMarket Corporation, 330 South Fourth Street, Richmond, Virginia 23219. Theinformation on our website is not, and shall not be deemed to be, a part of this Annual Report on Form 10-K orincorporated by reference in this Annual Report on Form 10-K or any other filings we make with the SEC.
11

Executive Officers of the Registrant
The names and ages of all executive officers as of February 19, 2014 follow.
Name Age Positions
Thomas E. Gottwald . . . . . . 53 President and Chief Executive Officer (Principal Executive Officer)David A. Fiorenza . . . . . . . . 64 Vice President and Chief Financial Officer (Principal Financial Officer)Steven M. Edmonds . . . . . . 61 Vice President—General CounselBruce R. Hazelgrove, III . . . 53 Vice President and Chief Administrative OfficerWilliam J. Skrobacz . . . . . . 54 Controller (Principal Accounting Officer)Cameron D. Warner, Jr. . . . 55 TreasurerM. Rudolph West . . . . . . . . 60 SecretaryRobert A. Shama . . . . . . . . . 53 President, Afton Chemical Corporation
Our officers, at the discretion of the Board of Directors, hold office until the meeting of the Board of Directorsfollowing the next annual shareholders’ meeting. With the exception of Mr. Warner, Mr. Shama, andMr. Skrobacz, all of the officers have served in these capacities with NewMarket for at least the last five years.Mr. Warner has been employed by NewMarket for at least five years in various senior management capacities.Prior to being named Treasurer in 2011, Mr. Warner was Director—Treasury and Corporate Development since2007. Mr. Shama has been employed by Afton for at least five years in various senior management capacities.Prior to being named President of Afton in 2013, he was Executive Vice President of Afton beginning in 2012and Senior Vice President North America and Chief Marketing Officer in 2011. From 2008 to 2010, Mr. Shamawas Vice President Sales and Marketing North America. Mr. Skrobacz joined NewMarket in May 2011 as SeniorManager, Business Assurance, and was appointed Controller Designate in September 2012. In May 2013, he wasappointed Controller. Prior to joining NewMarket, Mr. Skrobacz served as Controller of UPS Freight, a wholly-owned subsidiary of United Parcel Service, Inc., since 2008.
ITEM 1A. RISK FACTORS
Our business is subject to many factors that could materially adversely affect our future performance and causeour actual results to differ materially from those expressed or implied by forward-looking statements made in thisAnnual Report on Form 10-K. Those risk factors are outlined below.
• Availability of raw materials and transportation systems, including sourcing from some singlesuppliers, could have a material adverse effect on our operations.
The chemical industry can experience some tightness of supply of certain materials or availability oftransportation systems. In addition, in some cases, we choose to source from a single supplier. Anysignificant disruption in supply could affect our ability to obtain raw materials or to utilizetransportation systems. This could have a material adverse effect on our operations.
• Several of our products are produced solely at one location, and a significant disruption ordisaster at such a location could have a material adverse effect on our results of operations.
Several of the products we sell are produced only in one location. We are dependent upon thecontinued safe operation of these production facilities. These production facilities are subject to varioushazards associated with the manufacturing, handling, storage, and transportation of chemical materialsand products, including leaks and ruptures, explosions, fires, unscheduled downtime, andenvironmental hazards. Additionally, these sites may experience significant disruptions in operationsdue to inclement weather, natural disasters, flooding, and levee breaches. Some of our products involvethe manufacturing and handling of a variety of reactive, explosive, and flammable materials. Many ofthese hazards could cause a disruption in the production of our products. We cannot assure that thesefacilities will not experience these types of hazards and disruptions in the future or that these incidentswill not result in production delays or otherwise have an adverse effect on our results of operations,financial condition, or cash flows in any given period.
12

• We may be unable to respond effectively to technological changes in our industry.
Our future business success will depend upon our ability to maintain and enhance our technologicalcapabilities, develop and market products and applications that meet changing customer needs, andsuccessfully anticipate or respond to technological changes in a cost-effective and timely manner. Ourindustry is characterized by frequent changes in industry performance standards, which affect theamount and timing of our research and development costs and other technology-related costs. As aresult, the life cycle of our products is often hard to predict. Further, technological changes in some orall of our customers’ products or processes may make our products obsolete. Our inability to maintaina highly qualified technical workforce or their inability to anticipate, respond to, or utilize changingtechnologies could have a material adverse effect on our results of operations, financial condition, orcash flows in any given period.
• Our research and development efforts are costly and may not succeed.
The petroleum additives industry is subject to periodic technological change and ongoing productimprovements. In order to maintain our profits and remain competitive, we must successfully develop,manufacture, and market new or improved products. As a result, we must commit substantial resourceseach year to research and development. Ongoing investments in research and development for futureproducts could result in higher costs without a proportional increase in profits. Additionally, for anynew product program, there is a risk of technical or market failure in which case we may not be able todevelop the new commercial product needed to maintain our competitive position, or we may need tocommit additional resources to new product development programs. Moreover, new products may havelower margins than the products they replace. Finally, our research and development efforts are basedon the contribution of highly skilled personnel who may be difficult to recruit and retain.
• Our failure to protect our intellectual property rights could adversely affect our futureperformance and growth.
Protection of our proprietary processes, methods, compounds, and other technologies is important toour business. We depend upon our ability to develop and protect our intellectual property rights todistinguish our products from those of our competitors. Failure to protect our existing intellectualproperty rights may result in the loss of valuable technologies or having to pay other companies forinfringing on their intellectual property rights. We rely on a combination of patent, trade secret,trademark, and copyright law, as well as judicial enforcement, to protect such technologies. Wecurrently own approximately 1,200 issued and pending U.S. and foreign patents. Some of these patentsare licensed to others. In addition, we have acquired the rights under patents and inventions of othersthrough licenses or otherwise. We have developed, and may in the future develop, technologies withuniversities or other academic institutions, or with the use of government funding. In such cases, theacademic institution or the government may retain certain rights to the developed intellectual property.We also own several hundred trademark and service mark registrations throughout the world for ourmarks, including NewMarket®, Afton Chemical®, Ethyl®, HiTEC®, TecGARD®, GREENBURN®,BioTEC®, Passion for Solutions®, CleanStart®, Polartech®, Axcel®, and mmt®, as well as a pendingtrademark application for MicrobotzTM and the service mark QuickResponse 24/7SM. In the event thatwe are unable to continue using certain of our marks, we may be forced to rebrand our products, whichcould result in the loss of brand recognition, and could require us to devote resources to advertise andmarket brands. In particular, the loss of our HiTEC® mark could have a material adverse effect on ourbusiness.
We cannot assure that the measures taken by us to protect these assets and rights will provide meaningfulprotection for our trade secrets or proprietary manufacturing expertise or that adequate remedies will beavailable in the event of an unauthorized use or disclosure of our trade secrets or manufacturing expertise.We cannot assure that any of our intellectual property rights will not be challenged, invalidated,circumvented, or rendered unenforceable. Furthermore, we cannot assure that any pending patent applicationfiled by us will result in an issued patent, or if patents are issued to us, that those patents will provide
13

meaningful protection against competitors or against competitive technologies. The failure of our patents orother measures to protect our processes, apparatuses, technology, trade secrets and proprietarymanufacturing expertise, methods, and compounds could have an adverse effect on our results of operations,financial condition, or cash flows. We could face patent infringement claims from our competitors or othersalleging that our processes or products infringe on their proprietary technologies. If we were found to beinfringing on the proprietary technology of others, we may be liable for damages, and we may be required tochange our processes, to redesign our products partially or completely, to pay to use the technology of othersor to stop using certain technologies or producing the infringing product entirely. Even if we ultimatelyprevail in an infringement suit, the existence of the suit could prompt customers to switch to products thatare not the subject of infringement suits. We may not prevail in any intellectual property litigation and suchlitigation may result in significant legal costs or otherwise impede our ability to produce and distribute keyproducts.
We also rely upon unpatented proprietary manufacturing expertise, continuing technological innovationand other trade secrets to develop and maintain our competitive position. While we generally enter intoconfidentiality agreements with our employees and third parties to protect our intellectual property, wecannot assure you that our confidentiality agreements will not be breached, that they will providemeaningful protection for our trade secrets and proprietary manufacturing expertise or that adequateremedies will be available in the event of an unauthorized use or disclosure of our trade secrets ormanufacturing expertise.
• Our business is subject to hazards common to chemical businesses, any of which could interruptour production or our transportation systems and adversely affect our results of operations.
Our business is subject to hazards common to chemical manufacturing, storage, handling, andtransportation, including explosions, fires, inclement weather, natural disasters, mechanical failure,unscheduled downtime, transportation interruptions, remediation, chemical spills, discharges orreleases of toxic or hazardous substances or gases, and other risks. These hazards can cause personalinjury and loss of life, severe damage to, or destruction of, property and equipment, and environmentalcontamination. In addition, the occurrence of material operating problems at our facilities due to any ofthese hazards may diminish our ability to meet our output goals. Accordingly, these hazards and theirconsequences could have a material adverse effect on our operations as a whole, including our resultsof operations or cash flows, both during and after the period of operational difficulties.
• The occurrence or threat of extraordinary events, including domestic and international terroristattacks may disrupt our operations, decrease demand for our products, and increase ourexpenses.
Chemical-related assets may be at greater risk of future terrorist attacks than other possible targets inthe United States and throughout the world. Federal legislation has imposed significant new sitesecurity requirements, specifically on chemical manufacturing facilities, that have increased our annualoverhead expenses. Federal regulations have also been enacted to increase the security of thetransportation of hazardous chemicals in the United States. Further regulations could be enacted in thefuture, which could result in additional costs.
The occurrence of extraordinary events, including future terrorist attacks and the outbreak or escalationof hostilities, cannot be predicted, but their occurrence can be expected to negatively affect theeconomy in general, and specifically the markets for our products. The resulting damage from a directattack on our assets or assets used by us could include loss of life and property damage. In addition,available insurance coverage may not be sufficient to cover all of the damage incurred or, if available,may be prohibitively expensive.
• Competition could adversely affect our operating results.
We face intense competition in many of the product lines and markets in which we compete. Weexpect that our competitors will develop and introduce new and enhanced products, which could cause
14

a decline in the market acceptance of certain products we manufacture. In addition, as a result of pricecompetition, we may be compelled to reduce the prices for some of our products, which couldadversely affect our margins and profitability. Competitive pressures can also result in the loss of majorcustomers. Our inability to compete successfully could have a material adverse effect on our results ofoperations, financial condition, or cash flows in any given period. In addition, some of our competitorsmay have greater financial, technological, and other resources than we have. Some of our competitorsmay also be able to maintain greater operating and financial flexibility than we are able to maintain. Asa result, these competitors may be able to better withstand changes in conditions within our industry,changes in the prices for raw materials, and changes in general economic conditions.
• Sudden or sharp raw materials price increases may adversely affect our profit margins.
We utilize a variety of raw materials in the manufacture of our products, including base oil,polyisobutylene, antioxidants, alcohols, solvents, sulfonates, friction modifiers, olefins, andcopolymers. Our profitability is sensitive to changes in the costs of these materials caused by changesin supply, demand or other market conditions, over which we have little or no control. Political andeconomic conditions in the Middle East and Latin America have caused, and may continue to cause,the cost of our raw materials to fluctuate. War, armed hostilities, terrorist acts, civil unrest, or otherincidents may also cause a sudden or sharp increase in the cost of our raw materials. We cannot assurethat we will be able to pass on to our customers any future increases in raw material costs in the formof price increases for our products.
• Our reliance on a small number of significant customers may have a material adverse effect onour results of operations.
Our principal customers are major multinational oil companies. The oil industry is characterized by theconcentration of a few large participants. The loss of a significant customer or a material reduction inpurchases by a significant customer could have a material adverse effect on our results of operations,financial condition, or cash flows.
• Our customers are concentrated in the lubricant and fuel industries and, as a result, our relianceon that industry is significant.
Most of our customers are primarily engaged in the fuel and lubricant industries. This concentration ofcustomers affects our overall risk profile, since our customers will be similarly affected by changes ineconomic, geopolitical, and industry conditions. Many factors affect the level of our customers’spending on our products, including, among others, general business conditions, changes in technology,interest rates, gasoline prices, and consumer confidence in future economic conditions. A sudden orprotracted downturn in these industries could adversely affect the buying power and purchases by ourcustomers.
• We face risks related to our foreign operations that may negatively affect our business.
In 2013, sales to customers outside of the United States accounted for over 60% of consolidatedrevenue. We do business in all major regions of the world, some of which do not have stableeconomies or governments. In particular, we sell and market products in countries experiencingpolitical and/or economic instability in the Middle East, Asia Pacific, Latin America, and Europe. Ourinternational operations are subject to international business risks, including unsettled politicalconditions, expropriation, import and export restrictions, increases in royalties, exchange controls,national and regional labor strikes, taxes, government royalties, inflationary or unstable economies andcurrency exchange rate fluctuations, and changes in laws and policies governing operations of foreign-based companies (such as restrictions on repatriation of earnings or proceeds from liquidated assets offoreign subsidiaries). The occurrence of any one or a combination of these factors may increase ourcosts or have other adverse effects on our business.
15

• We have a substantial amount of indebtedness and our ability to repay or service ourindebtedness will require a significant amount of cash. Our ability to generate cash depends onmany factors beyond our control.
Our ability to make payments on and to refinance our indebtedness and to fund planned capitalexpenditures and research and development efforts will depend on our ability to generate cash fromoperations in the future. This, to a certain extent, is subject to general economic, financial, competitive,legislative, regulatory, and other factors that are beyond our control.
We cannot guarantee that our business will generate sufficient cash flow from operations or that futureborrowings will be available to us under the revolving credit facility in an amount sufficient to enableus to repay our debt, service our indebtedness, or to fund other liquidity needs. Furthermore, althoughsubstantially all of our business is conducted through our subsidiaries, we cannot guarantee that oursubsidiaries will be able to distribute funds to us for that purpose.
We may need to refinance all or a portion of our indebtedness on or before maturity. We cannotguarantee that we will be able to refinance any of our indebtedness on commercially reasonable termsor at all.
• We are exposed to fluctuations in foreign exchange rates, which may adversely affect our resultsof operations.
We conduct our business in the local currency of many of the countries in which we operate. Thefinancial condition and results of operations of our foreign operating subsidiaries are reported in therelevant local currency and then translated to U.S. Dollars at the applicable currency exchange rate forinclusion in our consolidated financial statements. Changes in exchange rates between these foreigncurrencies and the U.S. Dollar will affect the recorded levels of our assets and liabilities, as well as ourrevenues, costs, and operating margins. The primary foreign currencies in which we have exchange ratefluctuation exposure are the European Union Euro, British Pound Sterling, Japanese Yen, ChineseRenminbi, and Canadian Dollar. Exchange rates between these currencies and the U.S. Dollar havefluctuated significantly in recent years and may do so in the future.
• An information technology system failure may adversely affect our business.
We rely on information technology systems to transact our business. An information technologysystem failure due to computer viruses, internal or external security breaches, power interruptions,hardware failures, fire, natural disasters, human error, or other causes could disrupt our operations andprevent us from being able to process transactions with our customers, operate our manufacturingfacilities, and properly report those transactions in a timely manner. A significant, protractedinformation technology system failure may result in a material adverse effect on our results ofoperations, financial condition, or cash flows.
• Our business is subject to government regulation and could be adversely affected by futuregovernmental regulation.
We are subject to regulation by local, state, federal, and foreign governmental authorities. In somecircumstances, before we may sell certain products, these authorities must approve these products, ourmanufacturing processes, and our facilities. We are also subject to ongoing reviews of our products,manufacturing processes, and facilities by governmental authorities.
In order to obtain regulatory approval of certain new products, we must, among other things,demonstrate to the relevant authority that the product is safe and effective for its intended uses and thatwe are capable of manufacturing the product in accordance with current regulations. The process ofseeking approvals can be costly, time consuming, and subject to unanticipated and significant delays.There can be no assurance that approvals will be granted to us on a timely basis, or at all. Any delay inobtaining, or any failure to obtain or maintain, these approvals would adversely affect our ability tointroduce new products and to generate sales from those products.
16

New laws and regulations, including climate change regulations, may be introduced in the future thatcould result in additional compliance costs, seizures, confiscation, recall, or monetary fines, any ofwhich could prevent or inhibit the development, distribution, and sale of our products. If we fail tocomply with applicable laws and regulations, we may be subject to civil remedies, including fines,injunctions, and recalls or seizures, any of which could have an adverse effect on our results ofoperations, financial condition, or cash flows.
Our business and our customers are subject to significant regulations under the EuropeanCommission’s Registration, Evaluation and Authorization of Chemicals (REACH) regulation. Itimposes obligations on European Union manufacturers and importers of chemicals and other productsinto the European Union to compile and file comprehensive reports, including testing data, on eachchemical substance, perform chemical safety assessments, and obtain pre-market authorization withrespect to certain substances of particularly high concern. The regulation imposes additional burdenson chemical producers and importers, and, to a lesser extent, downstream users of chemical substancesand preparations. Our manufacturing presence and sales activities in the European Union will requireus to incur additional compliance costs.
We are subject to the U.S. Foreign Corrupt Practices Act, the U.K. Bribery Act and anti-bribery laws inother jurisdictions which generally prohibit companies and their intermediaries from making improperpayments to foreign officials for the purposes of obtaining or retaining business. We are also subject toexport and import laws and regulations which restrict trading with embargoed or sanctioned countriesand certain individuals. Although we have policies and procedures designed to facilitate compliancewith these laws and regulations, our employees, contractors and agents may take actions in violation ofour policies. Any such violation, even if prohibited by our policies, could have a material adverse effecton our business and reputation.
• Legal proceedings and other claims could impose substantial costs on us.
We are involved in numerous administrative and legal proceedings that result from, and are incidentalto, the conduct of our business. From time to time, these proceedings involve environmental, productliability, TEL, premises asbestos liability, and other matters. See Item 3, “Legal Proceedings.” We haveinsurance coverage that we believe would be available to mitigate potential damages in many of theseproceedings. However, there is no assurance that our available insurance will cover these claims, thatour insurers will not challenge coverage for certain claims, or that final damage awards will not exceedour available insurance coverage. Any of the foregoing could have a material adverse effect on ourresults of operations, financial condition, or cash flows.
• Environmental matters could have a substantial negative impact on our results of operations.
As a manufacturer and distributor of chemical products, we are generally subject to extensive local,state, federal, and foreign environmental, safety, and health laws and regulations concerning, amongother things, emissions to the air, discharges to land and water, the generation, handling, treatment, anddisposal of hazardous waste and other materials, and remediation of contaminated soil, as well assurface and ground water. Our operations entail the risk of violations of those laws and regulations,many of which provide for substantial fines and criminal sanctions for violations. We believe that wecomply in all material respects with laws, regulations, statutes, and ordinances protecting theenvironment, including those related to the discharge of materials. However, we cannot assure that wehave been or will be at all times in compliance with all of these requirements.
In addition, these requirements, and the enforcement or interpretation of these requirements, maybecome more stringent in the future. Although we cannot predict the ultimate cost of compliance withany such requirements, the costs could be material. Noncompliance could subject us to materialliabilities, such as government fines, damages arising from third-party lawsuits, or the suspension andpotential cessation of noncompliant operations. We may also be required to make significant site oroperational modifications at substantial cost. Future developments could also restrict or eliminate the
17
use of or require us to make modifications to our products, which could have an adverse effect on ourresults of operations, financial condition, or cash flows.
At any given time, we are involved in claims, litigation, administrative proceedings, and investigationsof various types in a number of jurisdictions involving potential environmental liabilities, includingclean-up costs associated with waste disposal sites, natural resource damages, property damage, andpersonal injury. We cannot assure that the resolution of these environmental matters will not have anadverse effect on our results of operations, financial condition, or cash flows.
There may be environmental problems associated with our properties of which we are unaware. Someof our properties contain, or may have contained in the past, on-site facilities or underground tanks forthe storage of chemicals, hazardous materials, and waste products that could create a potential forrelease of hazardous substances or contamination of the environment. The discovery of environmentalliabilities attached to our properties could have a material adverse effect on our results of operations,financial condition, or cash flows even if we did not create or cause the problem.
We may also face liability arising from current or future claims alleging personal injury, productliability, or property damage due to exposure to chemicals or other hazardous substances, such aspremises asbestos, at or from our facilities. We may also face liability for personal injury, productliability, property damage, natural resource damage, or clean-up costs for the alleged migration ofcontaminants or hazardous substances from our facilities or for future accidents or spills. A significantincrease in the number or success of these claims could adversely affect our results of operations,financial condition, or cash flows. For further discussion of some related claims, see Item 1,“Business—Environmental.”
The ultimate costs and timing of environmental liabilities are difficult to predict. Liability underenvironmental laws relating to contaminated sites can be imposed retroactively and on a joint andseveral basis. A liable party could be held responsible for all costs at a site, whether currently orformerly owned or operated, regardless of fault, knowledge, timing of the contamination, cause of thecontamination, percentage of contribution to the contamination, or the legality of the original disposal.We could incur significant costs, including clean-up costs, natural resource damages, civil or criminalfines and sanctions, and third-party claims, as a result of past or future violations of, or liabilities under,environmental laws.
• We have been identified, and in the future may be identified, as a PRP in connection with stateand federal laws regarding environmental clean-up projects.
Within the United States, we are subject to the federal, state, and local environmental laws under whichwe may be designated as a PRP. As a PRP, we may be liable for a share of the costs associated withcleaning up hazardous waste sites, such as a landfill to which we may have sent waste.
In de minimis PRP matters and in some minor PRP matters, we generally negotiate a consent decree topay an apportioned settlement. This relieves us of any further liability as a PRP, except for remotecontingencies. We are also a PRP at sites where our liability may be in excess of the de minimis orminor PRP levels. Most sites where we are a PRP represent environmental issues that are quite mature.The sites have been investigated, and in many cases, the remediation methodology, as well as theproportionate shares of each PRP, has been established. Other sites are not as mature, which makes itmore difficult to reasonably estimate our share of future clean-up or remediation costs. Generally,environmental remediation and monitoring will go on for an extended period. As a result, we may incursubstantial expenses for all these sites over a number of years.
Liability for investigation and remediation of hazardous substance contamination at currently orformerly owned or operated facilities or at third-party waste disposal sites is joint and several.Currently, we are involved in active remediation efforts at several sites where we have been named aPRP. If other PRPs at these sites are unable to contribute to the remediation costs, we could be held
18

responsible for some, or all, of their portion of the remediation costs, in addition to the portion of thesecosts for which we are already responsible.
• Restrictive covenants in our debt instruments may adversely affect our business.
Our revolving credit facility and 4.10% senior notes contain restrictive covenants. These covenantsmay constrain our activities and limit our operational and financial flexibility. The failure to complywith these covenants could result in an event of default, which, if not cured or waived, could have amaterial adverse effect on our business, results of operations, financial condition, or cash flows.
• The insurance that we maintain may not fully cover all potential exposures.
We maintain property, business interruption, and casualty insurance, but such insurance may not coverall risks associated with the hazards of our business and is subject to limitations, including deductiblesand maximum liabilities covered. We may incur losses beyond the limits, or outside the coverage, ofour insurance policies, including liabilities for environmental remediation. In the future, we may not beable to obtain coverage at current levels, and our premiums may increase significantly on coverage thatwe maintain.
• Financing risks associated with Foundry Park I could adversely affect our financial results.
We may incur losses, which could be material, under the Goldman Sachs interest rate swap agreement.See Note 15 for further information on the interest rate swap.
• We may not be able to complete future acquisitions or successfully integrate future acquisitionsinto our business, which could result in unanticipated expenses and losses.
As part of our business growth strategy, we intend to pursue acquisitions. Our ability to implement thiscomponent of our growth strategy will be limited by our ability to identify appropriate acquisition orjoint venture candidates and our financial resources, including available cash and borrowing capacity.The expense incurred in completing acquisitions or entering into joint ventures, the time it takes tointegrate an acquisition, or our failure to integrate businesses successfully, could result in unanticipatedexpenses and losses. Furthermore, we may not be able to realize any of the anticipated benefits fromacquisitions or joint ventures.
The process of integrating acquired operations into our existing operations may result in unforeseenoperating difficulties and may require significant financial resources that would otherwise be availablefor the ongoing development or expansion of existing operations.
• We could be required to make additional contributions to our pension plans, which may beunderfunded due to any underperformance of the equities markets.
Our pension plan asset allocation in the United States is predominantly weighted towards equities.Cash contribution requirements to our pension plans are sensitive to changes in our plans’ actual returnon assets. Reductions in our plans’ return on assets due to poor performance of the equities marketscould cause our pension plans to be underfunded and require us to make additional cash contributions.
ITEM 1B. UNRESOLVED STAFF COMMENTS
None.
19

ITEM 2. PROPERTIES
Our principal operating properties are shown below. Unless indicated, we own the research, development, andtesting facilities, as well as the manufacturing and distribution properties, which primarily support the petroleumadditives business segment.
Research, Development, and Testing Richmond, VirginiaBracknell, EnglandManchester, EnglandTsukuba, JapanAshland, Virginia (leased)Suzhou, China
Manufacturing and Distribution Bedford Park, Illinois (lubricant additives)Feluy, Belgium (lubricant additives)Houston, Texas (lubricant and fuel additives; also TEL storage anddistribution)Hyderabad, India (lubricant additives)Manchester, England (lubricant additives)Orangeburg, South Carolina (fuel additives)Port Arthur, Texas (lubricant additives)Rio de Janeiro, Brazil (petroleum additives storage and distribution;leased)Sauget, Illinois (lubricant and fuel additives)Suzhou, China (lubricant additives)
We own our corporate headquarters located in Richmond, Virginia, and generally lease our regional and salesoffices located in a number of areas worldwide.
NewMarket Development manages the property that we own on a site in Richmond, Virginia consisting ofapproximately 57 acres. We have our corporate offices on this site, as well as a research and testing facility, andseveral acres dedicated to other uses. We are currently exploring various development opportunities for portionsof the property as the demand warrants. This effort is ongoing in nature, and we have no specific timeline for anyfuture developments.
Production Capacity
We believe our plants and supply agreements are sufficient to meet expected sales levels. Operating rates of theplants vary with product mix and normal sales swings. We believe that our facilities are well maintained and ingood operating condition.
20

ITEM 3. LEGAL PROCEEDINGS
We are involved in legal proceedings that are incidental to our business and include administrative or judicialactions seeking remediation under environmental laws, such as Superfund. Some of these legal proceedingsrelate to environmental matters and involve governmental authorities. For further information, see“Environmental” in Part I, Item 1.
While it is not possible to predict or determine with certainty the outcome of any legal proceeding, we believe theoutcome of any of these proceedings, or all of them combined, will not result in a material adverse effect on ourconsolidated results of operations, financial condition, or cash flows.
As we previously disclosed, the United States Department of Justice has advised us that it is conducting a reviewof certain of our foreign business activities in relation to compliance with relevant U.S. economic sanctionsprograms and anti-corruption laws, as well as certain historical conduct in the domestic U.S. market, and hasrequested certain information in connection with such review. We are cooperating with the investigation. Inconnection with such cooperation, we have voluntarily agreed to provide certain information and are conductingan internal review for that purpose.
ITEM 4. MINE SAFETY DISCLOSURES
Not applicable.
21

PART II
ITEM 5. MARKET FOR REGISTRANT’S COMMON EQUITY, RELATED STOCKHOLDERMATTERS AND ISSUER PURCHASES OF EQUITY SECURITIES
Our common stock, with no par value, has traded on the New York Stock Exchange (NYSE) under the symbol“NEU” since June 21, 2004 when we became the parent holding company of Ethyl, Afton, NewMarket Services,NewMarket Development, and their subsidiaries. We had 2,554 shareholders of record at January 31, 2014.
On July 17, 2012, our Board of Directors approved a share repurchase program authorizing management torepurchase up to $250 million of NewMarket’s outstanding common stock until December 31, 2014, as marketconditions warrant and covenants under our existing agreements permit. We may conduct the share repurchasesin the open market and in privately negotiated transactions. The repurchase program does not require NewMarketto acquire any specific number of shares and may be terminated or suspended at any time. Approximately $154million remained available under the 2012 authorization at December 31, 2013. The following table outlines thepurchases during the fourth quarter of 2013 under this authorization.
Issuer Purchases of Equity Securities
PeriodTotal Number ofShares Purchased
Average Price Paidper Share
Total Number ofShares Purchased as
Part of PubliclyAnnounced Plans or
Programs
Approximate DollarValue of Shares that
May Yet Be PurchasedUnder the Plans or
Programs
October 1 to October 31 . . . . . . . . 0 $ 0.00 0 $208,844,260November 1 to November 30 . . . . 92,500 318.14 92,500 179,416,085December 1 to December 31 . . . . . 77,300 329.28 77,300 153,962,996
Total . . . . . . . . . . . . . . . . . . . . . . . 169,800 $323.21 169,800 153,962,996
As shown in the table below, cash dividends declared and paid totaled $3.80 per share for the twelve monthsended December 31, 2013 and $28.00 per share for the twelve months ended December 31, 2012. The dividendof $25.00 declared on October 25, 2012 was a special dividend.
Year Date Declared Date Paid Per Share Amount
2013 . . . . . . . . . . . . . . . . . . February 28, 2013 April 1, 2013 $ 0.90April 25, 2013 July 1, 2013 0.90July 18, 2013 October 1, 2013 0.90
October 24, 2013 January 1, 2014 1.10
2012 . . . . . . . . . . . . . . . . . . February 23, 2012 April 2, 2012 0.75April 26, 2012 July 2, 2012 0.75July 17, 2012 October 1, 2012 0.75
October 25, 2012 November 27, 2012 25.00October 25, 2012 December 21, 2012 0.75
The declaration and payment of dividends is subject to the discretion of our Board of Directors. Future dividendswill depend on various factors, including our financial condition, earnings, cash requirements, legalrequirements, restrictions in agreements governing our outstanding indebtedness, and other factors deemedrelevant by our Board of Directors.
22

The following table shows the high and low prices of our common stock on the NYSE for each of the last eightquarters.
2013
FirstQuarter
SecondQuarter
ThirdQuarter
FourthQuarter
High . . . . . . . . . . . . . . . . . . . . . . . . . . . . . . . . . . . . . . . . . $291.10 $281.01 $295.29 $341.69Low . . . . . . . . . . . . . . . . . . . . . . . . . . . . . . . . . . . . . . . . . 238.00 255.45 260.24 280.51
2012
FirstQuarter
SecondQuarter
ThirdQuarter
FourthQuarter
High . . . . . . . . . . . . . . . . . . . . . . . . . . . . . . . . . . . . . . . . . $220.85 $234.62 $260.66 $283.48Low . . . . . . . . . . . . . . . . . . . . . . . . . . . . . . . . . . . . . . . . . 172.50 181.28 215.63 232.41
The performance graph showing the five-year cumulative total return on our common stock as compared tochemical companies in the S&P 1500 Specialty Chemicals Index and the S&P 500 is shown below. The graphassumes $100 invested on the last day of December 2008, and the reinvestment of all dividends.
Performance GraphComparison of Five-Year Cumulative Total Return
Performance Through December 31, 2013
2012201120102009 20132008
$0
$200
$400
$600
$800
$1,000
$1,200
NewMarketCorporation Specialty Chemicals S&P 500
23

ITEM 6. SELECTED FINANCIAL DATA
NewMarket Corporation and SubsidiariesFive Year Summary
Years Ended December 31,
(in thousands, except per-share amounts) 2013 2012 2011 2010 2009
Results of operationsNet sales . . . . . . . . . . . . . . . . . . . . . . . . . . . . $2,280,355 $2,211,878 $2,138,127 $1,786,076 $1,530,122Costs and expenses . . . . . . . . . . . . . . . . . . . . 1,928,510 1,853,445 1,843,240 1,505,772 1,267,443Gain on legal settlement, net (1) . . . . . . . . . . 0 0 38,656 0 0
Operating profit . . . . . . . . . . . . . . . . . . . . . . . 351,845 358,433 333,543 280,304 262,679Interest and financing expenses, net . . . . . . . 17,796 8,435 14,151 12,668 11,716Loss on early extinguishment of debt (2) . . . 0 9,092 0 0 0Other income (expense), net (3) . . . . . . . . . . 7,262 (3,338) (18,048) (10,047) (11,196)
Income from continuing operations beforeincome tax expense . . . . . . . . . . . . . . . . . . 341,311 337,568 301,344 257,589 239,767
Income tax expense . . . . . . . . . . . . . . . . . . . . 98,964 100,296 95,887 81,957 77,300
Income from continuing operations . . . . . . . 242,347 237,272 205,457 175,632 162,467Income (loss) from discontinued operations,
net of tax (4) . . . . . . . . . . . . . . . . . . . . . . . 22,395 2,321 1,450 1,493 (184)
Net income . . . . . . . . . . . . . . . . . . . . . . . . . . $ 264,742 $ 239,593 $ 206,907 $ 177,125 $ 162,283
Financial position and other data (4)Total assets . . . . . . . . . . . . . . . . . . . . . . . . . . $1,327,274 $1,264,248 $1,191,662 $1,062,741 $1,025,192Operations:
Working capital . . . . . . . . . . . . . . . . . . . $ 649,705 $ 518,824 $ 463,707 $ 396,388 $ 405,087Current ratio . . . . . . . . . . . . . . . . . . . . . 3.62 to 1 3.39 to 1 3.15 to 1 2.92 to 1 3.05 to 1Depreciation and amortization . . . . . . . $ 46,144 $ 43,389 $ 43,352 $ 39,134 $ 32,820Capital expenditures . . . . . . . . . . . . . . . $ 58,476 $ 38,753 $ 53,515 $ 36,406 $ 89,133Gross profit as a % of revenue . . . . . . . 28.6 28.5 25.8 28.5 30.3Research, development, and testing
expenses (5) . . . . . . . . . . . . . . . . . . . . $ 136,573 $ 117,845 $ 105,496 $ 91,188 $ 86,072Total long-term debt . . . . . . . . . . . . . . . . . . . $ 349,467 $ 424,407 $ 232,601 $ 217,544 $ 216,200Common stock and other shareholders’
equity . . . . . . . . . . . . . . . . . . . . . . . . . . . . . $ 572,448 $ 402,205 $ 549,593 $ 491,640 $ 458,185Total long-term debt as a % of total
capitalization (debt plus equity) . . . . . . . . 37.9 51.3 29.7 30.7 32.1Common stockBasic earnings per share:
Income from continuing operations . . . $ 18.21 $ 17.68 $ 14.99 $ 12.01 $ 10.68Income (loss) from discontinued
operations (4) . . . . . . . . . . . . . . . . . . . 1.69 0.17 0.11 0.11 (0.01)
Net income . . . . . . . . . . . . . . . . . . . . . . . . . . $ 19.90 $ 17.85 $ 15.10 $ 12.12 $ 10.67
Diluted earnings per share:Income from continuing operations . . . $ 18.21 $ 17.68 $ 14.98 $ 11.99 $ 10.66Income (loss) from discontinued
operations (4) . . . . . . . . . . . . . . . . . . . 1.69 0.17 0.11 0.10 (0.01)
Net income . . . . . . . . . . . . . . . . . . . . . . . . . . $ 19.90 $ 17.85 $ 15.09 $ 12.09 $ 10.65
Equity per share . . . . . . . . . . . . . . . . . . . . . . . $ 43.70 $ 29.98 $ 41.00 $ 35.03 $ 30.12Cash dividends declared per share (6) . . . . . $ 3.80 $ 28.00 $ 2.39 $ 1.565 $ 1.075
24

Notes to the Five Year Summary
(1) The 2011 amount represents a gain on a legal settlement with Innospec, net of legal fees.
(2) In March 2012, we entered into a $650 million five-year unsecured revolving credit facility. During 2012,we used a portion of the $650 million revolving credit facility to fund the early redemption of all of our thenoutstanding 7.125% senior notes (7.125% senior notes), as well as to repay the outstanding principal amounton the Foundry Park I, LLC mortgage loan agreement (mortgage loan). As a result, we recognized a loss onearly extinguishment of debt of $9.9 million in 2012 from accelerated amortization of financing feesassociated with the prior revolving credit facility, the 7.125% senior notes, and the mortgage loan, as well ascosts associated with redeeming the 7.125% senior notes prior to maturity. Of the loss on earlyextinguishment of debt, $0.8 million is included as a component of Income from discontinued operations,net of tax.
(3) Other income (expense), net in each year included the gain or loss on the Goldman Sachs interest rate swap.The gain on the interest rate swap was $7 million for the year ended December 31, 2013. The loss on theinterest rate swap was $5 million for the year ended December 31, 2012; $18 million for the year endedDecember 31, 2011; $10 million for the year ended December 31, 2010; and $11 million for the year endedDecember 31, 2009. We are not using hedge accounting to record the interest rate swap, and accordingly,any change in the fair value is immediately recognized in earnings.
(4) On July 2, 2013, Foundry Park I completed the sale of its real estate assets which comprised the entire realestate development segment. The operations of the real estate development segment are reported asdiscontinued operations. The 2013 amount includes the gain on sale of discontinued business, net of tax, of$22 million. Financial position and other data reflect discontinued operations and continuing operationstogether.
(5) Of the total research, development, and testing expenses, the portion related to new products and processeswas $59 million in 2013, $55 million in 2012, $51 million in 2011, $45 million in 2010, and $46 million in2009.
(6) Cash dividends declared per share for 2012 included a special dividend of $25 per share.
25

ITEM 7. MANAGEMENT’S DISCUSSION AND ANALYSIS OF FINANCIAL CONDITION ANDRESULTS OF OPERATIONS
Forward-Looking Statements
The following discussion, as well as other discussions in this Annual Report on Form 10-K, contains forward-looking statements about future events and expectations within the meaning of the Private Securities LitigationReform Act of 1995. We have based these forward-looking statements on our current expectations andprojections about future results. When we use words in this document such as “anticipates,” “intends,” “plans,”“believes,” “estimates,” “projects,” “expects,” “should,” “could,” “may,” “will,” and similar expressions, we doso to identify forward-looking statements. Examples of forward-looking statements include, but are not limitedto, statements we make regarding future prospects of growth in the petroleum additives market, other trends inthe petroleum additives market, our ability to maintain or increase our market share, and our future capitalexpenditure levels.
We believe our forward-looking statements are based on reasonable expectations and assumptions, within thebounds of what we know about our business and operations. However, we offer no assurance that actual resultswill not differ materially from our expectations due to uncertainties and factors that are difficult to predict andbeyond our control.
Factors that could cause actual results to differ materially from expectations include, but are not limited to,availability of raw materials and transportation systems; supply disruptions at single-sourced facilities; ability torespond effectively to technological changes in our industry; failure to protect our intellectual property rights;hazards common to chemical businesses; occurrence or threat of extraordinary events, including natural disastersand terrorist attacks; competition from other manufacturers; sudden or sharp raw material price increases; gain orloss of significant customers; risks related to operating outside of the United States; the impact of fluctuations inforeign exchange rates; political, economic, and regulatory factors concerning our products; future governmentalregulation; resolution of environmental liabilities or legal proceedings; and inability to complete futureacquisitions or successfully integrate future acquisitions into our business. In addition, certain risk factors arealso discussed in Item 1A, “Risk Factors.”
You should keep in mind that any forward-looking statement made by us in this discussion or elsewhere speaksonly as of the date on which we make it. New risks and uncertainties arise from time to time, and it is impossiblefor us to predict these events or how they may affect us. We have no duty to, and do not intend to, update orrevise the forward-looking statements in this discussion after the date hereof, except as may be required by law.In light of these risks and uncertainties, any forward-looking statement made in this discussion or elsewhere,might not occur.
OVERVIEW
Operations of our petroleum additives business for 2013 resulted in a record setting year for operating profit. Inaddition, net sales and product shipments improved over 2012 levels. Our research, development, and testingexpenses, as well as selling, general, and administrative expenses, have increased reflecting our continuinginvestments in people, technology, processes, technical centers, and production capacity, in support of ourbusiness. Our cash flows from operations were a strong $278 million, and our working capital position improved25% from December 31, 2012. We continue to manage our business for the long-run with the goal of helping ourcustomers succeed in their marketplace.
On July 2, 2013, Foundry Park I completed the sale of its real estate assets for $144 million in cash, whichcomprised our entire real estate development segment. The operations of the real estate development segment arereported as discontinued operations for all periods presented in the Consolidated Statements of Income.
Also of note, during 2013, we repurchased 327,600 shares of our common stock at a total cost of $96 million andreduced outstanding long-term debt by $75 million.
26

RESULTS OF OPERATIONS
Revenue
Our consolidated revenue for 2013 amounted to $2.3 billion, an increase of 3.1% from $2.2 billion in 2012. Theincrease of $74 million between 2012 and 2011 was 3.4%.
Net sales to one customer of our petroleum additives segment exceeded 10% of consolidated revenue in 2013,2012, and 2011. Sales to Shell amounted to $253 million (11% of consolidated revenue) in 2013, $252 million(11% of consolidated revenue) in 2012, and $246 million (11% of consolidated revenue) in 2011. These salesrepresent a wide range of products sold to this customer in multiple regions of the world.
No other single customer accounted for 10% or more of our total revenue in 2013, 2012, or 2011.
The following table shows revenue by segment and product line for each of the last three years.
Years Ended December 31,
(in millions) 2013 2012 2011
Petroleum additivesLubricant additives . . . . . . . . . . . . . . . . . . . . . . . . . . . . . . $1,830 $1,750 $1,684Fuel additives . . . . . . . . . . . . . . . . . . . . . . . . . . . . . . . . . . 441 451 442
Total . . . . . . . . . . . . . . . . . . . . . . . . . . . . . . . . . . . . . 2,271 2,201 2,126All other . . . . . . . . . . . . . . . . . . . . . . . . . . . . . . . . . . . . . . . . . . 9 11 12
Consolidated revenue . . . . . . . . . . . . . . . . . . . . . . . . . . . . . . . . $2,280 $2,212 $2,138
Petroleum Additives—The primary regions in which we operate include North America (the United States andCanada), Latin America (Mexico and South America), Asia Pacific, and the Europe/Middle East/Africa/India(EMEAI) region. The percentage of revenue being generated in the regions has remained fairly consistent overthe past three years, with some limited fluctuation due to various factors, including economic downturns. NorthAmerica represents almost 40% of our petroleum additives revenues, while EMEAI represents a little over 30%.Asia Pacific contributes approximately 20% and Latin America represents almost 10%. The EMEAI percentagehas increased over 2012 levels, which was down slightly due partially to economic conditions in the countriescomprising the EMEAI region. As shown in the table above, the percentage of lubricant additives sales and fueladditives sales to total petroleum additives sales has remained substantially consistent over the past three years.The discussion below provides further detail on revenue in our petroleum additives segment for 2013, 2012, and2011.
Petroleum additives net sales for 2013 of $2.3 billion were approximately 3.2% higher than 2012 levels.Regionally, EMEAI and Asia Pacific experienced increased revenue and shipments when comparing 2013 and2012, while revenues and shipments in North America and Latin America were lower. The increase between thetwo years reflects higher shipments of lubricant additives products overall, mainly in EMEAI and Asia Pacific.This was partially offset by a decrease in fuel additives product shipments, mainly in EMEAI. The remainingchange in net sales between the two years resulted from the impact of lower selling prices and an unfavorableforeign currency impact. Overall, product shipments for 2013 increased 3.7% from 2012 levels. When comparingthe two years, the U.S. Dollar strengthened against the British Pound Sterling and Japanese Yen, resulting in anunfavorable foreign currency impact on revenue, mostly from the Japanese Yen. The European Union Eurostrengthened against the U.S. Dollar when comparing the two years, resulting in a favorable foreign currencyimpact.
Net sales in 2012 of $2.2 billion were approximately 3.5% higher than 2011 levels, with increases in all regionsexcept the EMEAI region, which was approximately 5% lower in 2012 than 2011. The increase between the twoyears primarily resulted from higher selling prices, offset by an unfavorable foreign exchange impact. Whileproduct shipments decreased 1.5% in 2012 from 2011 levels, the volume impact on net sales was slightly
27

favorable when comparing the two years due to changes in the mix of products sold during 2012, as we soldmore higher priced lubricant additive products. The lower product shipments were across both the lubricant andfuel additive product lines. We experienced some impact from economic downturns in different countries,including those in the EMEAI region, but those impacts were essentially offset by the other favorable factorsdiscussed above. When comparing the two years, the U.S. Dollar strengthened against the major currencies inwhich we conduct business, including the European Union Euro and British Pound Sterling, resulting in anunfavorable foreign currency impact on revenue.
The approximate components of the petroleum additives increase in net sales of $70 million when comparing2013 to 2012 and $75 million when comparing 2012 to 2011 are shown below in millions.
Net sales for year ended December 31, 2011 . . . . . . . . . . . . . . . $2,126Lubricant additives shipments . . . . . . . . . . . . . . . . . . . . . . . . . . 11Fuel additives shipments . . . . . . . . . . . . . . . . . . . . . . . . . . . . . . (9)Selling prices, including changes in customer mix . . . . . . . . . . 106Foreign currency impact, net . . . . . . . . . . . . . . . . . . . . . . . . . . . (33)
Net sales for year ended December 31, 2012 . . . . . . . . . . . . . . . 2,201Lubricant additives shipments . . . . . . . . . . . . . . . . . . . . . . . . . . 105Fuel additives shipments . . . . . . . . . . . . . . . . . . . . . . . . . . . . . . (8)Selling prices, including changes in customer mix . . . . . . . . . . (22)Foreign currency impact, net . . . . . . . . . . . . . . . . . . . . . . . . . . . (5)
Net sales for year ended December 31, 2013 . . . . . . . . . . . . . . . $2,271
All Other—The “All other” category includes the operations of the TEL business, and certain contractmanufacturing performed by Ethyl.
Segment Operating Profit
NewMarket evaluates the performance of the petroleum additives business based on segment operating profit.NewMarket Services expenses are charged to NewMarket and each subsidiary pursuant to services agreementsbetween the companies. Depreciation on segment property, plant, and equipment, as well as amortization ofsegment intangible assets, is included in the segment operating profit.
The table below reports segment operating profit for the last three years.
Years Ended December 31,
(in millions) 2013 2012 2011
Petroleum additives . . . . . . . . . . . . . . . . . . . . . . . . . . . . . . . . . . . . . . $375 $372 $348
All other . . . . . . . . . . . . . . . . . . . . . . . . . . . . . . . . . . . . . . . . . . . . . . . $ (1) $ 6 $ 3
Petroleum Additives—The 2011 operating profit in the petroleum additives segment includes a net gain of $39million related to the Innospec settlement, which is discussed further in Note 22.
Petroleum additives operating profit increased $3 million when comparing 2013 to 2012 and $24 million whencomparing 2012 to 2011. The increase from 2012 to 2013 resulted from improved results in the lubricantadditives product line, which was partially offset by a decrease in the fuel additives product line. The increasebetween 2012 and 2011 was across both of our major product lines, lubricant additives and fuel additives. Theoperating profit margin was 16.5% in 2013, 16.9% in 2012, and 16.4% in 2011. These margins are consistentwith our current expectations of the performance of our business over the long-term. While operating profitmargins will fluctuate from quarter to quarter due to multiple factors, we do not operate our business differentlyfrom quarter to quarter. We believe the fundamentals of our business and industry are unchanged. We continue tofocus on developing and delivering innovative, technology-driven solutions to our customers.
28

Gross profit results, which do not include the gain from the Innospec settlement, were favorable $30 millionwhen comparing 2013 and 2012 and $75 million when comparing 2012 and 2011. Cost of sales as a percentageof revenue has remained fairly consistent over the last three years at 71% in 2013, 72% in 2012, and 74% in2011.
When comparing 2013 and 2012, total product shipments increased 3.7% as discussed above in the Revenuesection, with higher shipments of lubricant additives products, partially offset by lower shipments of fueladditives products. Increased sales volumes of higher-valued products, along with small variances in conversioncosts, contributed over 100% of the improvement in petroleum additive gross profit between 2013 and 2012.Unfavorable selling price variances, as discussed in the revenue section above, were substantially offset byfavorable raw material variances reflecting a near balance between selling prices and raw material costs duringthe year.
When comparing 2012 and 2011, total product shipments decreased 1.5% as discussed above in the Revenuesection. Nonetheless, selling increased volumes of higher-valued products contributed approximately 36% of theimprovement in gross profit between 2012 and 2011. The remaining improvement in gross profit between 2012and 2011 was due to favorable comparisons on selling prices which contributed approximately 50%. Rawmaterial costs were also favorable, while manufacturing conversion costs were unfavorable.
Selling, general, and administrative expenses (SG&A) in 2013 were $8 million, or 6%, higher than 2012 levels,while 2012 was 0.3%, higher as compared to 2011. The increase from 2011 to 2012 would have beensignificantly higher except for favorable foreign currency impacts. SG&A as a percentage of revenue was 6% ineach of 2013, 2012, and 2011. Our SG&A costs are mainly personnel-related and include salaries, benefits andother costs associated with our workforce. As our workforce has increased in number to support our worldwideoperations, these costs have also risen, which occurred when comparing 2013 to 2012.
When comparing 2013 with 2012, R&D increased approximately $19 million, while when comparing 2012 with2011, R&D increased approximately $12 million. As a percentage of revenue, R&D was 6% in 2013 and 5% ineach of 2012 and 2011. Approximately 80% of the increase in R&D spending in 2013 was in the lubricantadditives product line, with the remaining 20% spent on fuel additives products. The increase from 2011 to 2012was substantially for the lubricant additives product line. The increases in R&D spending for both periods reflectefforts to support the development of additives that meet our customers’ needs, as well as new standards, and toexpand into new product solution areas.
Our approach to R&D investment, as it is with SG&A, is one of purposeful spending on programs to support ourcurrent product base and to ensure that we develop products to support our customers’ programs in the future.R&D includes personnel-related costs, as well as the costs of performing both internal and external testing of ourproducts. Most R&D is incurred in the United States and in the United Kingdom, with over 70% of total R&Dbeing attributable to the North America and EMEAI regions. All expenses for new product development areincurred in the United States and the United Kingdom. The remaining 30% of R&D is attributable to the AsiaPacific and Latin America regions and represents customer technology support services in those regions. All ofour R&D is related to the petroleum additives segment. R&D related to new products and processes was $59million in 2013, $55 million in 2012, and $51 million in 2011.
All Other—Operating profit for 2013 compared to 2012 includes an unfavorable comparison resulting primarilyfrom accruals related to the historical operations of the TEL business.
The following discussion references certain captions on the Consolidated Statements of Income.
Interest and Financing Expenses
Interest and financing expenses were $18 million in 2013, $8 million in 2012, and $14 million in 2011. Theincrease in interest and financing expenses between 2013 and 2012 primarily resulted from higher averageoutstanding debt. The higher outstanding debt was caused by the issuance of $350 million of 4.10% senior notes
29

in December 2012. The previously outstanding $150 million of 7.125% senior notes were redeemed in April2012. Fees and amortization increased $1 million in 2013 over 2012. The decrease in interest and financingexpenses between 2012 and 2011 resulted from a lower average interest rate.
Loss on Early Extinguishment of Debt
We recorded a loss on the early extinguishment of debt of $10 million in 2012. The loss resulted from therecognition of $5 million from the early redemption premium on the 7.125% senior notes, $3 million ofunamortized deferred financing costs on the 7.125% senior notes, with the remainder attributable to unamortizeddeferred financing costs on both the mortgage loan and on our previous revolving credit facility. Of the total lossof $10 million on early extinguishment of debt, approximately $5 million was a cash payment. The remainingamounts were a noncash charge. Of the total loss on early extinguishment of debt, $1 million of unamortizeddeferred financing costs on the mortgage loan was reclassified and included as a component of income fromoperations of discontinued business.
Other Income (Expense), Net
Other income (expense), net was income of $7 million in 2013, expense of $3 million in 2012, and expense of$18 million in 2011. The 2012 amount includes a gain of $2 million related to the sale of common stock that wasreceived in September 2011 as part of the legal settlement with Innospec, which is discussed further in Note 22.The 2011 amount includes $1 million of expense related to the consents we obtained in January 2011 from theholders of the 7.125% senior notes to modify the formula for calculating the capacity under the 7.125% seniornotes to make certain restricted payments. The remaining amounts for 2013, 2012, and 2011 primarily representthe gain in 2013 or loss in 2012 and 2011 on a derivative instrument representing an interest rate swap recordedat fair value through earnings. See Note 15 for additional information on the interest rate swap.
Income Tax Expense
Income tax expense was $99 million in 2013, $100 million in 2012, and $96 million in 2011. The effective taxrate was 29.0% in 2013, 29.7% in 2012, and 31.8% in 2011. The effective income tax rates for each year includethe benefit of higher income in foreign jurisdictions with lower tax rates, as well as a substantial benefit from thedomestic manufacturing tax deduction. The 2013 effective rate includes the effect of the R&D tax credit for 2013as well as 2012, as the legislation to extend such tax credits was retroactively signed into law in January 2013. Abenefit from the R&D tax credit is also included in 2011. Currently, the R&D tax credit has not been extended to2014 by the United States Congress. The tax rate for 2012 includes a substantial tax benefit related to the specialdividend of $25 per share, which was paid in November 2012. See Note 20 for further details on income taxes.
The increase in income before income tax expense between 2013 and 2012 resulted in an increase of $1 millionin income tax expense. This was offset by a reduction in income tax expense of $2 million due to the lowereffective tax rate in 2013 compared to 2012.
The increase in income before income tax expense between 2012 and 2011 resulted in an increase of $11 millionin income tax expense. This was partially offset by a reduction in income tax expense of $7 million due to thelower effective tax rate in 2012 compared to 2011.
Our deferred taxes are in a net asset position. Based on current forecasted operating plans and historicalprofitability, we believe that we will recover nearly the full benefit of our deferred tax assets and have, therefore,only recorded an immaterial valuation allowance at certain foreign subsidiaries.
Discontinued Operations
On July 2, 2013, Foundry Park I completed the sale of its real estate assets for $144 million in cash, whichcomprised our entire real estate development segment. The operations of the real estate development segment for
30

all periods presented are now reported in Income from operations of discontinued business, net of tax in theConsolidated Statements of Income. We recognized a gain of $36 million ($22 million after tax) in 2013 relatedto this transaction.
CASH FLOWS DISCUSSION
We generated cash from operating activities of $278 million in 2013, $273 million in 2012, and $185 million in2011.
During 2013, we used the $278 million cash generated from operations, along with $140 million in net proceedsfrom the sale of real estate assets and a net return of deposits related to the Goldman Sachs swap of $12 millionto repay $75 million on our revolving credit facility, repurchase $92 million of our common stock, fund $50million in dividend payments, and fund $58 million of capital expenditures. These items, including favorablefluctuations in foreign currency rates of $3 million, resulted in an increase of $150 million in cash and cashequivalents. Cash flows from operating activities included payments of $32 million for our pension andpostretirement plans. Further information on the Goldman Sachs interest rate swap is in Note 15.
During 2012, we used the $273 million of cash provided from operations, as well as $349 million from theissuance of the 4.10% senior notes and $53 million of borrowings under our revolving credit facility, to fund$376 million in dividend payments (including a special dividend payment of $335 million), redeem $150 millionof the 7.125% senior notes, pay in full $64 million on the mortgage loan, and fund $39 million of capitalexpenditures. In addition, we made a net deposit of $2 million related to the Goldman Sachs interest rate swapand funded $6 million for debt issuance costs. These items, including favorable fluctuations in foreign currencyrates of $2 million, resulted in an increase of $39 million in cash and cash equivalents. Cash flows fromoperating activities included a decrease of $14 million resulting from higher working capital requirements, aswell as payments of $32 million for our pension and postretirement plans.
During 2011, we used the cash provided by operating activities of $185 million, along with $18 million ofborrowings under our revolving credit facility and an additional $7 million of borrowings under foreign lines ofcredit to fund $54 million in capital expenditures, $98 million in repurchases of our common stock, and $33million in dividend payments. In addition, we made a net deposit of $13 million related to the Goldman Sachsinterest rate swap, and funded $3 million for debt issuance costs. These cash flows included an unfavorableforeign exchange impact of $1 million and resulted in an increase in cash and cash equivalents of $1 million.Cash flows from operating activities included a decrease of $62 million resulting from higher working capitalrequirements and payments of $31 million for our pension and postretirement plans, as well as $25 millionproceeds from a legal settlement.
We expect that cash from operations, together with borrowing available under our revolving credit facility, willcontinue to be sufficient to cover our operating needs and planned capital expenditures for at least the nexttwelve months.
FINANCIAL POSITION AND LIQUIDITY
Cash
At December 31, 2013, we had cash and cash equivalents of $239 million as compared to $89 million at the endof 2012.
Our cash and cash equivalents held by our foreign subsidiaries amounted to approximately $135 million atDecember 31, 2013 and $80 million at December 31, 2012. A significant amount, but not all, of these foreigncash balances are associated with earnings that we have asserted are indefinitely reinvested. We plan to use theseindefinitely reinvested earnings to support growth outside of the United States through funding of operatingexpenses, research and development expenses, capital expenditures, and other cash needs of our foreign
31

subsidiaries. Periodically, we repatriate cash from our foreign subsidiaries to the United States throughintercompany dividends. These intercompany dividends are paid only by subsidiaries whose earnings we havenot asserted are indefinitely reinvested or whose earnings qualify as previously taxed income, as defined by theInternal Revenue Code. If circumstances were to change that would cause these indefinitely reinvested earningsto be repatriated, an incremental U.S. tax liability would be incurred. As part of our foreign subsidiaryrepatriation activities, we received cash dividends from our foreign subsidiaries of $10 million for 2013, $8million for 2012, and $30 million for 2011.
Debt
4.10% Senior Notes—At both December 31, 2013 and December 31, 2012, we had $349 million of 4.10%senior notes which are senior unsecured obligations. The notes are jointly and severally guaranteed on a seniorunsecured basis by all existing and future domestic subsidiaries that also guarantee our obligations under therevolving credit facility or any of our other indebtedness. We incurred financing costs in 2012 and 2013 totalingapproximately $5 million related to the 4.10% senior notes, which are being amortized over the term of theagreement.
The 4.10% senior notes and the subsidiary guarantees rank:
• equal in right of payment with all of our and the guarantors’ existing and future senior unsecuredindebtedness; and
• senior in right of payment to any of our and the guarantors’ future subordinated indebtedness.
The indenture governing the 4.10% senior notes contains covenants that, among other things, limit our abilityand the ability of our subsidiaries to:
• create or permit to exist liens;
• enter into sale-leaseback transactions;
• incur additional guarantees; and
• sell all or substantially all of our assets or consolidate or merge with or into other companies.
We were in compliance with all covenants under the indenture governing the 4.10% senior notes as ofDecember 31, 2013 and December 31, 2012.
During March 2013, we registered these 4.10% senior notes under the Securities Act of 1933. All previouslyunregistered 4.10% senior notes that were outstanding at December 31, 2012 have been exchanged for an equalaggregate principal amount of registered 4.10% senior notes.
Revolving Credit Facility—In 2012, we entered into a Credit Agreement (Credit Agreement) with a term of fiveyears. The Credit Agreement provides for a $650 million, multicurrency revolving credit facility, with a $100million sublimit for multicurrency borrowings, a $100 million sublimit for letters of credit, and a $20 millionsublimit for swingline loans. The Credit Agreement includes an expansion feature which allows us, subject tocertain conditions, to request an increase in the aggregate amount of the revolving credit facility or obtainincremental term loans in an amount up to $150 million. There were no outstanding borrowings under therevolving credit facility at December 31, 2013.
We paid financing costs in 2012 of approximately $2 million related to this revolving credit facility and carriedover deferred financing costs from our previous revolving credit facility of approximately $2 million, resulting intotal deferred financing costs of $4 million, which we are amortizing over the term of the Credit Agreement.
The obligations under the Credit Agreement are unsecured and are fully guaranteed by NewMarket and thesubsidiary guarantors. The revolving credit facility matures on March 14, 2017.
32

Borrowings made under the revolving credit facility bear interest at an annual rate equal to, at our election, either(1) the Alternate Base Rate (ABR) plus the Applicable Rate (solely in the case of loans denominated in U.S. dollarsto NewMarket) or (2) the Adjusted LIBO Rate plus the Applicable Rate. ABR is the greatest of (i) the rate ofinterest publicly announced by the Administrative Agent as its prime rate, (ii) the federal funds effective rate plus0.5%, or (iii) the Adjusted LIBO Rate for a one month interest period plus 1%. The Adjusted LIBO Rate means therate at which Agreed Currencies in the London interbank market for certain periods (as selected by NewMarket) arequoted, as adjusted for statutory reserve requirements. Depending on our consolidated Leverage Ratio, theApplicable Rate ranges from 0.50% to 1.00% for loans bearing interest based on the ABR and from 1.50% to 2.00%for loans bearing interest based on the Adjusted LIBO Rate. At December 31, 2013, the Applicable Rate was 0.50%for loans bearing interest based on the ABR and 1.50% for loans bearing interest based on the Adjusted LIBO Rate.
The Credit Agreement contains financial covenants that require NewMarket to maintain a consolidated LeverageRatio (as defined in the Credit Agreement) of no more than 3.00 to 1.00 and a consolidated Interest CoverageRatio (as defined in the Credit Agreement) of no less than 3.00 to 1.00, calculated on a rolling four quarter basis,as of the end of each fiscal quarter ending on and after March 31, 2012. At December 31, 2013, the LeverageRatio was 0.94 and the Interest Coverage Ratio was 19.54.
We were in compliance with all covenants under our revolving credit facility at December 31, 2013 andDecember 31, 2012.
The following table provides information related to the unused portion of our revolving credit facility in effect atDecember 31, 2013 and December 31, 2012.
December 31,
(in millions) 2013 2012
Maximum borrowing capacity under the revolving credit facility . . . . . . . . . $650 $650Outstanding borrowings under the revolving credit facility . . . . . . . . . . . . . . 0 75Outstanding letters of credit . . . . . . . . . . . . . . . . . . . . . . . . . . . . . . . . . . . . . . 3 3
Unused portion of revolving credit facility . . . . . . . . . . . . . . . . . . . . . . . . . . . $647 $572
For further information on the outstanding letters of credit, see Note 17. The average interest rate for borrowingsunder our revolving credit facilities was 2.2% during 2013 and 1.8% during 2012.
Other Borrowings—One of our subsidiaries in China has a short-term line of credit of $15 million with anoutstanding balance of $3 million at December 31, 2013. The average interest rate was approximately 2.2%during 2013 and 2.9% during 2012. At December 31, 2013 the interest rate was 2.2%. The outstanding balanceon the China line of credit is due during 2014.
***
We had long-term debt of $349 million at December 31, 2013 and $424 million at December 31, 2012. Thedecrease in debt resulted from repayment of $75 million on the revolving credit facility.
As a percentage of total capitalization (total long-term debt and shareholders’ equity), our total long-term debtdecreased from 51.3% at the end of 2012 to 37.9% at the end of 2013. The change in the percentage wasprimarily the result of the decrease in debt, as well as an increase in shareholders’ equity. The increase inshareholders’ equity reflects the impact of earnings and the improvement in the funded position of our definedbenefit pension plans, which was partially offset by dividend payments and share repurchases. Normally, werepay long-term debt with cash from operations or refinancing activities.
Working Capital
At December 31, 2013, we had working capital of $650 million, resulting in a current ratio of 3.62 to 1. Ourworking capital at December 31, 2012 was $519 million resulting in a current ratio of 3.39 to 1.
33

The change in the working capital ratio primarily reflects increased cash and cash equivalents, as well as higheraccounts receivable and prepaid expenses and other current assets. These were partially offset by lowerinventory, as well as higher accounts payable and dividends payable at December 31, 2013. The increase inaccounts receivable was primarily due to higher sales levels when comparing the fourth quarter of 2013 with thefourth quarter of 2012, which was partially offset during 2013 from the reduction of a 2012 income tax refundreceivable. The fluctuation in inventories primarily resulted from changes in foreign currency rates, but was alsoimpacted by fluctuations in sales patterns, as well as the transfer of two high-volume raw materials to a purchase-as-used basis with our suppliers. The increase in prepaid expenses and other current assets includes the increasein dividends payable resulting from the funding of dividends in December 2013 that were not paid by the transferagent until January 2014, whereas the payment of the fourth quarter 2012 dividends occurred in December 2012,instead of in January 2013. The increase in accounts payable is from normal differences in timing of payments.
Capital Expenditures
Capital expenditures were $58 million for 2013, $39 million for 2012, and $54 million for 2011. We expectcapital expenditures to be approximately $120 million in 2014. We expect to continue to finance this capitalspending through cash on hand and cash provided from operations, together with borrowing available under our$650 million revolving credit facility.
The estimated capital expenditure amount includes anticipated spending in 2014 on the start of a newmanufacturing facility in Singapore, as well as several improvements to our manufacturing and R&Dinfrastructure around the world. We expect capital expenditures in 2015 and 2016 to be $70 million to $90million in support of our worldwide business.
The Singapore facility is expected to be operational in late-2015 with a total investment in excess of $100million. Groundbreaking will occur in mid-2014 and the significant capital spending for this project will begin atthat time. The initial capacity will represent a modest increase in our overall global production, but will enable usto more effectively service our Asia Pacific customers, as well as those in India and the Middle East. The facilitywill be scalable to allow for growth, as demand warrants.
Environmental Expenses
We spent approximately $19 million in 2013, $18 million in 2012, and $19 million in 2011 for ongoingenvironmental operating and clean-up costs, excluding depreciation of previously capitalized expenditures. Theseenvironmental operating and clean-up expenses are included in cost of goods sold. We expect to continue to fundthese costs through cash provided by operations.
Contractual Obligations
The table below shows our year-end contractual obligations by year due.
Payments Due by Period
(in millions) TotalLess than
1 Year1 - 3
Years3 - 5
YearsMore than
5 Years
Debt obligations (a) . . . . . . . . . . . . . . . . . . . . . . . . . . . . . . . . . . . . . . . $353 $ 3 $ 0 $ 0 $350Interest payable on long-term debt, interest rate swaps, and capital
lease obligations . . . . . . . . . . . . . . . . . . . . . . . . . . . . . . . . . . . . . . . . 169 19 39 39 72Letters of credit (b) . . . . . . . . . . . . . . . . . . . . . . . . . . . . . . . . . . . . . . . 3 0 0 0 3Operating lease obligations . . . . . . . . . . . . . . . . . . . . . . . . . . . . . . . . . 43 12 16 6 9Property, plant, and equipment purchase obligations . . . . . . . . . . . . . 7 7 0 0 0Raw material purchase obligations (c) . . . . . . . . . . . . . . . . . . . . . . . . 271 49 89 89 44Other long-term liabilities (d) . . . . . . . . . . . . . . . . . . . . . . . . . . . . . . . 42 22 3 3 14Reserves for uncertain tax positions . . . . . . . . . . . . . . . . . . . . . . . . . . 3 1 2 0 0
Total . . . . . . . . . . . . . . . . . . . . . . . . . . . . . . . . . . . . . . . . . . . . . . . $891 $113 $149 $137 $492
34

(a) Amounts represent contractual payments due on the 4.10% senior notes, revolving credit facility, and short-term lines of credit as of December 31, 2013. See Note 12 for more information on long-term debtobligations.
(b) We intend to renew letters of credit when necessary as they mature; therefore, the obligations do not have adefinitive maturity date.
(c) Raw material purchase obligations include agreements to purchase goods or services that are enforceableand legally binding and that specify all significant terms, including: fixed or minimum quantities to bepurchased; fixed, minimum, or variable price provisions; and the approximate timing of the transaction.Purchase obligations exclude agreements that are cancelable without penalty. Purchase orders made in theordinary course of business are excluded from the above table. Any amounts for which we are liable underpurchase orders are reflected in our Consolidated Balance Sheets as accounts payable or accrued expenses.
(d) These represent other long-term liability amounts reflected in our Consolidated Balance Sheets that haveknown payment streams. Amounts include environmental liabilities, including asset retirement obligations,as well as contributions associated with pension and postretirement benefit plans. Amounts accrued for thepotential exposure with respect to litigation, claims, and assessments are not included in the table above.
Pension and Postretirement Benefit Plans
Our U.S. and foreign benefit plans are discussed separately below. The information discussed below applies to allof our U.S. benefit plans. Our foreign plans are quite diverse, and the actuarial assumptions used by the variousforeign plans are based upon the circumstances of each particular country and retirement plan. The discussionbelow surrounding our foreign retirement benefits focuses only on our pension plan in the United Kingdom(U.K.) which represents the majority of the impact on our financial statements from foreign pension plans. Weuse a December 31 measurement date to determine our pension and postretirement expenses and related financialdisclosure information. Additional information on our pension and postretirement plans is in Note 18.
U.S. Pension and Postretirement Benefit Plans—The average remaining service period of active participantsfor our U.S. plans is 13 years, while the average remaining life expectancy of inactive participants is 23 years.We utilize the Optional Combined Mortality Tables for males and females based on the RP-2000 MortalityTables projected to 2014 with Scale AA in determining the impact of the U.S. benefit plans on our financialstatements.
Investment Return Assumptions and Asset Allocation—We periodically review our assumptions for the long-termexpected return on pension plan assets. As part of the review and to develop expected rates of return, weconsidered an analysis of expected returns based on the U.S. plans’ asset allocation as of both January 1, 2013and January 1, 2014. This analysis reflects our expected long-term rates of return for each significant asset classor economic indicator. As of January 1, 2014, the expected rates were 8.8% for U.S. large cap stocks, 5.2% forfixed income, and 3.2% for inflation. The range of returns developed relies both on forecasts and on broad-market historical benchmarks for expected return, correlation, and volatility for each asset class.
The asset allocation for our U.S. pension plans is predominantly weighted toward equities. Through the ongoingmonitoring of our investments and review of market data, we have determined that we should maintain theexpected long-term rate of return for our U.S. pension plans at 8.5% at December 31, 2013.
An actuarial gain occurred during both 2013 and 2012, as the actual investment return was higher than theexpected return for all of our U.S. pension plans by approximately $33 million in 2013 and $6 million in 2012.During 2011, the actual return was lower than the expected return, resulting in an actuarial loss for all of our U.S.pension plans of approximately $11 million. Investment gains and losses are recognized in earnings on anamortized basis over a period of years, resulting in decreased expense of approximately $1 million in 2014. Weexpect that there will be continued volatility in pension expense as actual investment returns vary from theexpected return, but we continue to believe the potential long-term benefits justify the risk premium for equityinvestments.
35

At December 31, 2013, our expected long-term rate of return on our postretirement plans was 5.5%. This ratevaries from the pension rate of 8.5% primarily because of the difference in investment of assets. The assets of thepostretirement plan are held in an insurance contract, which results in a lower assumed rate of investment return.
Pension expense and the life insurance portion of postretirement expense are sensitive to changes in the expectedreturn on assets. For example, decreasing the expected rate of return by 25 basis points to 8.25% for pensionassets and 5.25% for postretirement benefit assets (while holding other assumptions constant) would increase theforecasted 2014 expense for our U.S. pension and postretirement plans by approximately $575 thousand.Similarly, a 25 basis point increase in the expected rate of return to 8.75% for pension assets and 5.75% forpostretirement benefit assets (while holding other assumptions constant) would reduce forecasted 2014 pensionand postretirement expense by the same amount.
Discount Rate Assumption—We develop the discount rate assumption by determining the single effectivediscount rate for a unique hypothetical portfolio constructed from investment-grade bonds that, in aggregate,match the projected cash flows of each of our retirement plans. The discount rate is developed based on thehypothetical portfolio on the last day of December. The discount rate at December 31, 2013 was 5.0% for allplans.
Pension and postretirement benefit expense is also sensitive to changes in the discount rate. For example,decreasing the discount rate by 25 basis points to 4.75% (while holding other assumptions constant) wouldincrease the forecasted 2014 expense for our U.S. pension and postretirement benefit plans by approximately $1million. A 25 basis point increase in the discount rate to 5.25% would reduce forecasted 2014 pension andpostretirement benefit expense by a similar amount.
Rate of Projected Compensation Increase—We have maintained our rate of projected compensation increase atDecember 31, 2013 at 3.50%. The rate assumption was based on an analysis of our projected compensationincreases for the foreseeable future.
Liquidity—Cash contribution requirements to the pension plan are sensitive to changes in assumed interest ratesand investment gains or losses in the same manner as pension expense. We expect our aggregate cashcontributions, before income taxes, to the U.S. pension plans will be approximately $12 million in 2014. Weexpect our contributions to the postretirement benefit plans will be approximately $2 million in 2014.
Other Assumptions—We periodically review our assumption for the health care cost trend rate based on actualcost experience, typically assuming a higher current-year trend scaling down to a lower permanent rate over afive to ten year period. We refreshed this health care trend assumption in 2012 resulting in an assumed rate of8.0% for 2012 and 7.5% for 2013, scaling down to 5.0% by 2018.
Foreign Pension Benefit Plans—Our foreign pension plans are quite diverse. The following information appliesonly to our U.K. pension plan, which represents the majority of the impact on our financial statements from ourforeign pension plans. The average remaining service period for our U.K. plan is 11 years, while the averageremaining life expectancy is 36 years. We utilize the S1 SAPS Normal Health (Light) mortality tables and allowfor future projected improvements in life expectancy in line with the CMI 2013 model, with a long-term rate ofimprovement of 1% per year based on the membership of the plan, in determining the impact of the U.K. pensionplans on our financial statements.
Investment Return Assumptions and Asset Allocation—We periodically review our assumptions for the long-termexpected return on the U.K. pension plan assets. The expected long-term rate of return is based on both the assetallocation, as well as yields available in the U.K. markets.
The target asset allocation in the U.K. is to be invested 55% in equities, 40% in a mixture of government andcorporate bonds, and 5% in a pooled investment property fund, while the actual allocation at the end of 2013 was
36

57% in equities, 38% in government and corporate bonds, 4% in a pooled investment property fund, and 1% incash. Based on the actual asset allocation and the expected yields available in the U.K. markets, the expectedlong-term rate of return for the U.K. pension plan was 5.8% at December 31, 2013.
An actuarial gain occurred during both 2013 and 2012, as the actual investment return exceeded the expected returnby approximately $4 million. In 2011, the expected investment return exceeded the actual investment return byapproximately $2 million resulting in an actuarial loss for our U.K. pension plan. Investment gains and losses arerecognized in earnings on an amortized basis, resulting in decreased expense of less than $1 million in 2014. Weexpect that there will be continued volatility in pension expense as actual investment returns vary from the expectedreturn, but we continue to believe the potential benefits justify the risk premium for the target asset allocation.
Pension expense is sensitive to changes in the expected return on assets. For example, decreasing the expectedrate of return by 25 basis points to 5.55% (while holding other assumptions constant) would increase theforecasted 2014 expense for our U.K. pension plan by approximately $300 thousand. Similarly, a 25 basis pointincrease in the expected rate of return to 6.05% (while holding other assumptions constant) would reduceforecasted 2014 pension expense by approximately $300 thousand.
Discount Rate Assumption—We utilize a yield curve based on AA-rated corporate bond yields constructed fromiBoxx indices in developing a discount rate assumption (extrapolated at longer terms based on the correspondingswap yield curve). The yield appropriate to the duration of the U.K. plan liabilities is then used. The discount rateat December 31, 2013 was 4.4%.
Pension expense is also sensitive to changes in the discount rate. For example, decreasing the discount rate by 25basis points to 4.15% (while holding other assumptions constant) would increase the forecasted 2014 expense forour U.K. pension plans by approximately $500 thousand. A 25 basis point increase in the discount rate to 4.65%would reduce forecasted 2014 pension expense by approximately $400 thousand.
Rate of Projected Compensation Increase—We have maintained our rate of projected compensation increase atDecember 31, 2013 at 4.50%. The rate assumption was based on an analysis of our projected compensationincreases for the foreseeable future.
Liquidity—Cash contribution requirements to the U.K. pension plan are sensitive to changes in assumed interestrates in the same manner as pension expense. We expect our aggregate U.K. cash contributions, before incometaxes, will be approximately $5 million in 2014.
Other Matters
During April 2013, we made the decision to discontinue the production of a fuel additive at our Ethyl Canadafacility. This decision required that we write down the related property, plant, and equipment and reduce theworkforce at the facility. By the end of the second quarter of 2013, we had recorded a charge to recognize theimpairment of the assets and severance costs associated with the termination of the employees. The amount of thecharge was not material to our financial statements. By June 30, 2013, the majority of the employees affected bythis decision had left the company.
In October 2013, we decided to sell the facility and completed the sale in November 2013. The remaining workforcewas terminated by the end of 2013. During the fourth quarter, we recognized a loss related to the sale of the facility anda charge related to the severance of the employees. This charge was not material to our financial statements.
OUTLOOK
As we begin 2014, we remain confident that our customer-focused approach to the market is the path on which tocontinue. We believe the fundamentals of how we run our business—a safety-first culture, customer-focusedsolutions, technology-driven product offerings, world-class supply chain capability, and a regional organizationalstructure to better understand our customers’ needs—will continue to pay dividends to all of our stakeholders.
37

After having posted record operating profit results for each of the past 10 years, we have expectations that ourpetroleum additives segment will continue to deliver solid results in 2014. We expect that petroleum additivesindustry shipment demand will continue to grow at an average annual rate of 1% to 2% over the next five years,as there has been no significant change in the positive fundamentals of the business. Over the long-term, we planto exceed the industry growth rate. Over the past several years, we have made significant investments to expandour capabilities around the world. These investments have been in people, technology, processes, technicalcenters, and production capacity. We intend to use these new capabilities to improve our ability to deliver thegoods and services that our customers value and to expand our business and improve profits.
Our business continues to generate significant amounts of cash beyond what is necessary for the expansion andgrowth of our current offerings. We regularly review the many internal opportunities which we have to utilizethis cash, both from a geographic and product line perspective. We continue our efforts in investigating potentialacquisitions as both a use for this cash and to generate shareholder value. Our primary focus in the acquisitionarea remains on the petroleum additives industry. It is our view that this industry will provide the greatestopportunity for a good return on our investment while minimizing risk. We remain focused on this strategy andwill evaluate any future opportunities. Nonetheless, we are patient in this pursuit and intend to make the rightacquisition when the opportunity arises. We will continue to evaluate all alternative uses of cash to enhanceshareholder value, including stock repurchases and dividends.
CRITICAL ACCOUNTING POLICIES AND ESTIMATES
The following discussion highlights some of the more critical areas where a significant change in facts andcircumstances in our operating and financial environment could cause a change in future reported financialresults.
Intangibles (net of amortization)
We have certain identifiable intangibles amounting to $18 million at December 31, 2013 that are discussed inNote 9. These intangibles relate to our petroleum additives business and are being amortized over periods with upto approximately sixteen years of remaining life. We continue to assess the market related to these intangibles, aswell as their specific values, and have concluded the values and amortization periods are appropriate. We alsoevaluate these intangibles for any potential impairment when significant events or circumstances occur that mightimpair the value of these assets. These evaluations continue to support the values at which these identifiableintangibles are carried on our financial statements. However, if conditions were to substantially deteriorate in thepetroleum additives market, it could possibly cause a decrease in the estimated useful lives of the intangibleassets or result in a noncash write-off of all or a portion of the intangibles’ carrying amount. A reduction in theamortization period would have no effect on cash flows. We do not anticipate such a change in the marketconditions in the near term.
Environmental and Legal Proceedings
We have made disclosure of our environmental matters in Item 1 of this Annual Report on Form 10-K, as well asin the Notes to Consolidated Financial Statements. We believe our environmental accruals are appropriate for theexposures and regulatory guidelines under which we currently operate. While we currently do not anticipatesignificant changes to the many factors that could impact our environmental requirements, we continue to keepour accruals consistent with these requirements as they change.
Also, as noted in the discussion of “Legal Proceedings” in Item 3 of this Annual Report on Form 10-K, while it isnot possible to predict or determine with certainty the outcome of any legal proceeding, it is our opinion, basedon our current knowledge, that we will not experience any material adverse effects on our results of operations,cash flows, or financial condition as a result of any pending or threatened proceeding.
38

Pension Plans and Other Postretirement Benefits
We use assumptions to record the impact of the pension and postretirement benefit plans in the financialstatements. These assumptions include the discount rate, expected long-term rate of return on plan assets, rate ofcompensation increase, and health-care cost trend rate. A change in any one of these assumptions could causedifferent results for the plans and therefore, impact our results of operations, cash flows, and financial condition.We develop these assumptions after considering available information that we deem relevant. Information isprovided on the pension and postretirement plans in Note 18. In addition, further disclosure of the effect ofchanges in these assumptions is provided in the “Financial Position and Liquidity” section of Item 7.
Income Taxes
We file United States, foreign, and local income tax returns, under which assumptions may be made to determinethe deductibility of certain costs. We make estimates related to the impact of tax positions taken on our financialstatements when we believe the tax position is more likely than not to be upheld on audit. We do not provide forincome taxes on earnings considered to be indefinitely reinvested abroad.
ITEM 7A. QUANTITATIVE AND QUALITATIVE DISCLOSURES ABOUT MARKET RISK
We are exposed to many market risk factors, including fluctuations in interest and foreign currency rates, as wellas changes in the cost of raw materials. These risk factors may affect our results of operations, cash flows, andfinancial position.
We manage these risks through regular operating and financing methods, including the use of derivative financialinstruments. When we have derivative instruments, they are with major financial institutions and are not forspeculative or trading purposes. Also, as part of our financial risk management, we regularly review significantcontracts for embedded derivatives and record them in accordance with accounting principles generally acceptedin the United States of America.
The following analysis presents the effect on our results of operations, cash flows, and financial position as if thehypothetical changes in market risk factors occurred at December 31, 2013. We analyzed only the potentialimpacts of our hypothetical assumptions. This analysis does not consider other possible effects that could impactour business.
Interest Rate Risk
At December 31, 2013, we had total long-term debt of $349 million, all of which is at fixed rates. We had nooutstanding variable rate debt under our revolving credit facility at December 31, 2013.
We recorded the Goldman Sachs interest rate swap at fair value, which amounted to a liability of $21 million atDecember 31, 2013. Any change in fair value is recognized immediately in earnings. With other variables heldconstant, a hypothetical 50 basis point adverse parallel shift in the LIBOR yield curve would have resulted in anincrease of approximately $4 million in the liability fair value of the interest rate swap with Goldman Sachs. SeeNote 15 for further information.
A hypothetical 100 basis point decrease in interest rates, holding all other variables constant, would have resultedin a change of $27 million in fair value of our debt at December 31, 2013.
Foreign Currency Risk
We sell to customers in foreign markets through our foreign subsidiaries, as well as through export sales from theUnited States. These transactions are often denominated in currencies other than the U.S. Dollar. Our primary
39

currency exposures are the European Union Euro, British Pound Sterling, Japanese Yen, Chinese Renminbi, andCanadian Dollar. We sometimes enter into forward contracts as hedges to minimize the fluctuation ofintercompany accounts receivable denominated in foreign currencies. At December 31, 2013, we had nooutstanding forward contracts.
Raw Material Price Risk
We utilize a variety of raw materials in the manufacture of our products, including base oil, polyisobutylene,antioxidants, alcohols, solvents, sulfonates, friction modifiers, olefins and copolymers. Our profitability issensitive to changes in the costs of these materials caused by changes in supply, demand, or other marketconditions, over which we have little or no control. In addition, political and economic conditions in certainregions of the world in which we operate have caused and may continue to cause the cost of our raw materials tofluctuate. War, armed hostilities, terrorist acts, civil unrest or other incidents may also cause a sudden or sharpincrease in the cost of our raw materials. If we experience such increases in the cost of our raw materials, we maynot be able to pass them along to our customers in the form of price increases for our products. The inability todo so would have a negative impact on our operating profit.
40

ITEM 8. FINANCIAL STATEMENTS AND SUPPLEMENTARY DATA
Report of Independent Registered Public Accounting Firm
To the Board of Directors and Shareholders of NewMarket Corporation:
In our opinion, the accompanying consolidated balance sheets and the related consolidated statements of income,comprehensive income, shareholders’ equity and cash flows present fairly, in all material respects, the financialposition of NewMarket Corporation and its subsidiaries (the “Company”) at December 31, 2013 andDecember 31, 2012, and the results of their operations and their cash flows for each of the three years in theperiod ended December 31, 2013 in conformity with accounting principles generally accepted in the UnitedStates of America. Also in our opinion, the Company maintained, in all material respects, effective internalcontrol over financial reporting as of December 31, 2013, based on criteria established in Internal Control -Integrated Framework (1992) issued by the Committee of Sponsoring Organizations of the TreadwayCommission (COSO). The Company’s management is responsible for these financial statements, for maintainingeffective internal control over financial reporting and for its assessment of the effectiveness of internal controlover financial reporting, included in Management’s Report in Internal Control over Financial Reportingappearing under Item 9A. Our responsibility is to express opinions on these financial statements and on theCompany’s internal control over financial reporting based on our integrated audits. We conducted our audits inaccordance with the standards of the Public Company Accounting Oversight Board (United States). Thosestandards require that we plan and perform the audits to obtain reasonable assurance about whether the financialstatements are free of material misstatement and whether effective internal control over financial reporting wasmaintained in all material respects. Our audits of the financial statements included examining, on a test basis,evidence supporting the amounts and disclosures in the financial statements, assessing the accounting principlesused and significant estimates made by management, and evaluating the overall financial statement presentation.Our audit of internal control over financial reporting included obtaining an understanding of internal control overfinancial reporting, assessing the risk that a material weakness exists, and testing and evaluating the design andoperating effectiveness of internal control based on the assessed risk. Our audits also included performing suchother procedures as we considered necessary in the circumstances. We believe that our audits provide areasonable basis for our opinions.
A company’s internal control over financial reporting is a process designed to provide reasonable assuranceregarding the reliability of financial reporting and the preparation of financial statements for external purposes inaccordance with generally accepted accounting principles. A company’s internal control over financial reportingincludes those policies and procedures that (i) pertain to the maintenance of records that, in reasonable detail,accurately and fairly reflect the transactions and dispositions of the assets of the company; (ii) provide reasonableassurance that transactions are recorded as necessary to permit preparation of financial statements in accordancewith generally accepted accounting principles, and that receipts and expenditures of the company are being madeonly in accordance with authorizations of management and directors of the company; and (iii) provide reasonableassurance regarding prevention or timely detection of unauthorized acquisition, use, or disposition of thecompany’s assets that could have a material effect on the financial statements.
Because of its inherent limitations, internal control over financial reporting may not prevent or detectmisstatements. Also, projections of any evaluation of effectiveness to future periods are subject to the risk thatcontrols may become inadequate because of changes in conditions, or that the degree of compliance with thepolicies or procedures may deteriorate.
/s/ PricewaterhouseCoopers LLP
Richmond, VirginiaFebruary 19, 2014
41

NewMarket Corporation and Subsidiaries
Consolidated Statements of Income
Years Ended December 31,
(in thousands, except per-share amounts) 2013 2012 2011
Net sales . . . . . . . . . . . . . . . . . . . . . . . . . . . . . . . . . . . . . . . . . . . . . . . . . . $2,280,355 $2,211,878 $2,138,127Cost of goods sold . . . . . . . . . . . . . . . . . . . . . . . . . . . . . . . . . . . . . . . . . . . 1,627,059 1,581,393 1,586,145
Gross profit . . . . . . . . . . . . . . . . . . . . . . . . . . . . . . . . . . . . . . . . . . . . . . . . 653,296 630,485 551,982Selling, general, and administrative expenses . . . . . . . . . . . . . . . . . . . . . . 164,878 154,207 151,599Research, development, and testing expenses . . . . . . . . . . . . . . . . . . . . . . 136,573 117,845 105,496Gain on legal settlement, net . . . . . . . . . . . . . . . . . . . . . . . . . . . . . . . . . . . 0 0 38,656
Operating profit . . . . . . . . . . . . . . . . . . . . . . . . . . . . . . . . . . . . . . . . . . . . . 351,845 358,433 333,543Interest and financing expenses, net . . . . . . . . . . . . . . . . . . . . . . . . . . . . . 17,796 8,435 14,151Loss on early extinguishment of debt . . . . . . . . . . . . . . . . . . . . . . . . . . . . 0 9,092 0Other income (expense), net . . . . . . . . . . . . . . . . . . . . . . . . . . . . . . . . . . . 7,262 (3,338) (18,048)
Income from continuing operations before income tax expense . . . . . . . 341,311 337,568 301,344Income tax expense . . . . . . . . . . . . . . . . . . . . . . . . . . . . . . . . . . . . . . . . . . 98,964 100,296 95,887
Income from continuing operations . . . . . . . . . . . . . . . . . . . . . . . . . . . . . 242,347 237,272 205,457Discontinued operations:
Gain on sale of discontinued business, net of tax . . . . . . . . . . . . . . . 21,855 0 0Income from operations of discontinued business, net of tax . . . . . . 540 2,321 1,450
Net income . . . . . . . . . . . . . . . . . . . . . . . . . . . . . . . . . . . . . . . . $ 264,742 $ 239,593 $ 206,907
Basic earnings per share:Income from continuing operations . . . . . . . . . . . . . . . . . . . . . . . . . $ 18.21 $ 17.68 $ 14.99Income from discontinued operations . . . . . . . . . . . . . . . . . . . . . . . . 1.69 0.17 0.11
Net income . . . . . . . . . . . . . . . . . . . . . . . . . . . . . . . . . . . . . . . . . . . . . . . . $ 19.90 $ 17.85 $ 15.10
Diluted earnings per share:Income from continuing operations . . . . . . . . . . . . . . . . . . . . . . . . . $ 18.21 $ 17.68 $ 14.98Income from discontinued operations . . . . . . . . . . . . . . . . . . . . . . . . 1.69 0.17 0.11
Net income . . . . . . . . . . . . . . . . . . . . . . . . . . . . . . . . . . . . . . . . . . . . . . . . $ 19.90 $ 17.85 $ 15.09
See accompanying Notes to Consolidated Financial Statements
42

NewMarket Corporation and Subsidiaries
Consolidated Statements of Comprehensive Income
Years Ended December 31,
(in thousands) 2013 2012 2011
Net income . . . . . . . . . . . . . . . . . . . . . . . . . . . . . . . . . . . . . . . . . . . . . . . . . . . . . $264,742 $239,593 $206,907
Other comprehensive income (loss):Pension plans and other postretirement benefits:
Prior service (cost) credit arising during the period, net of incometax (benefit) expense of $(367) in 2013 and $(471) in 2012 . . . . . (605) (1,570) 0
Amortization of prior service cost (credit) included in net periodicbenefit cost, net of income tax expense (benefit) of $65 in 2013,$48 in 2012, and $138 in 2011 . . . . . . . . . . . . . . . . . . . . . . . . . . . . 97 27 260
Actuarial net gain (loss) arising during the period, net of income taxexpense (benefit) of $29,083 in 2013, $(13,290) in 2012, and$(17,052) in 2011 . . . . . . . . . . . . . . . . . . . . . . . . . . . . . . . . . . . . . . 45,932 (22,721) (27,577)
Amortization of actuarial net (gain) loss included in net periodicbenefit cost, net of income tax (benefit) expense of $3,127 in2013, $2,331 in 2012, and $1,322 in 2011 . . . . . . . . . . . . . . . . . . . 5,404 4,066 2,423
Settlements and curtailments, net of income tax (benefit) expense of$272 in 2013 and $145 in 2012 . . . . . . . . . . . . . . . . . . . . . . . . . . . 785 436 0
Amortization of transition obligation (asset) included in netperiodic benefit cost, net of income tax expense (benefit) of $11in 2013, $14 in 2012, and $13 in 2011 . . . . . . . . . . . . . . . . . . . . . . 33 39 40
Total pension plans and other postretirement benefits . . . . . . . . 51,646 (19,723) (24,854)
Derivative instruments:Unrealized gain (loss) on derivative instruments, net of income tax
expense (benefit) of $(210) in 2012, and $(1,022) in 2011 . . . . . . 0 (330) (1,605)Reclassification adjustments for (gains) losses on derivative
instruments included in net income, net of income tax (benefit)expense of $2,622 in 2013, $569 in 2012, and $649 in 2011 . . . . . 4,173 893 1,020
Total derivative instruments . . . . . . . . . . . . . . . . . . . . . . . . . . . . 4,173 563 (585)
Foreign currency translation adjustments, net of income tax (benefit)expense of $(2,919) in 2013, $(1,007) in 2012, and $(558) in 2011 . . . (5,216) 7,567 163
Marketable securities:Unrealized gain (loss) on marketable securities, net of income tax
expense (benefit) of $419 in 2012 and $226 in 2011 . . . . . . . . . . . 0 676 364Reclassification adjustment for (gain) loss on marketable securities
included in net income, net of income tax (benefit) expense of$(645) in 2012 . . . . . . . . . . . . . . . . . . . . . . . . . . . . . . . . . . . . . . . . 0 (1,040) 0
Total marketable securities . . . . . . . . . . . . . . . . . . . . . . . . . . . . 0 (364) 364
Other comprehensive income (loss) . . . . . . . . . . . . . . . . . . . . . . . . . . . . . . . . . . 50,603 (11,957) (24,912)
Comprehensive income . . . . . . . . . . . . . . . . . . . . . . . . . . . . . . . . . . . . . . . . . . . $315,345 $227,636 $181,995
See accompanying Notes to Consolidated Financial Statements
43

NewMarket Corporation and Subsidiaries
Consolidated Balance Sheets
December 31,
(in thousands, except share amounts) 2013 2012
ASSETSCurrent assets:
Cash and cash equivalents . . . . . . . . . . . . . . . . . . . . . . . . . . . . . . . . . . . . . . . . . . . . $ 238,703 $ 89,129Trade and other accounts receivable, net . . . . . . . . . . . . . . . . . . . . . . . . . . . . . . . . 309,847 297,055Inventories . . . . . . . . . . . . . . . . . . . . . . . . . . . . . . . . . . . . . . . . . . . . . . . . . . . . . . . . 307,518 322,674Deferred income taxes . . . . . . . . . . . . . . . . . . . . . . . . . . . . . . . . . . . . . . . . . . . . . . . 8,267 8,452Prepaid expenses and other current assets . . . . . . . . . . . . . . . . . . . . . . . . . . . . . . . 32,984 18,185
Total current assets . . . . . . . . . . . . . . . . . . . . . . . . . . . . . . . . . . . . . . . . . . . . . 897,319 735,495
Property, plant, and equipment, at cost . . . . . . . . . . . . . . . . . . . . . . . . . . . . . . . . . . . . . . 985,196 1,070,967Less accumulated depreciation and amortization . . . . . . . . . . . . . . . . . . . . . . . . . . 700,160 712,596
Net property, plant, and equipment . . . . . . . . . . . . . . . . . . . . . . . . . . . . . . . . . 285,036 358,371
Prepaid pension cost . . . . . . . . . . . . . . . . . . . . . . . . . . . . . . . . . . . . . . . . . . . . . . . . . . . . 55,087 12,710Deferred income taxes . . . . . . . . . . . . . . . . . . . . . . . . . . . . . . . . . . . . . . . . . . . . . . . . . . . 22,961 55,123Intangibles (net of amortization) and goodwill . . . . . . . . . . . . . . . . . . . . . . . . . . . . . . . . 23,319 30,542Deferred charges and other assets . . . . . . . . . . . . . . . . . . . . . . . . . . . . . . . . . . . . . . . . . . 43,552 72,007
Total assets . . . . . . . . . . . . . . . . . . . . . . . . . . . . . . . . . . . . . . . . . . . . . . . . . . . . . . . . . . . $1,327,274 $1,264,248
LIABILITIES AND SHAREHOLDERS’ EQUITYCurrent liabilities:
Accounts payable . . . . . . . . . . . . . . . . . . . . . . . . . . . . . . . . . . . . . . . . . . . . . . . . . . $ 134,132 $ 119,298Accrued expenses . . . . . . . . . . . . . . . . . . . . . . . . . . . . . . . . . . . . . . . . . . . . . . . . . . 77,992 79,061Dividends payable . . . . . . . . . . . . . . . . . . . . . . . . . . . . . . . . . . . . . . . . . . . . . . . . . . 12,996 0Income taxes payable . . . . . . . . . . . . . . . . . . . . . . . . . . . . . . . . . . . . . . . . . . . . . . . 11,419 10,024Other current liabilities . . . . . . . . . . . . . . . . . . . . . . . . . . . . . . . . . . . . . . . . . . . . . . 11,075 8,288
Total current liabilities . . . . . . . . . . . . . . . . . . . . . . . . . . . . . . . . . . . . . . . . . . 247,614 216,671
Long-term debt . . . . . . . . . . . . . . . . . . . . . . . . . . . . . . . . . . . . . . . . . . . . . . . . . . . . . . . . 349,467 424,407Other noncurrent liabilities . . . . . . . . . . . . . . . . . . . . . . . . . . . . . . . . . . . . . . . . . . . . . . . 157,745 220,965
Total liabilities . . . . . . . . . . . . . . . . . . . . . . . . . . . . . . . . . . . . . . . . . . . . . . . . . . . . . . . . 754,826 862,043
Commitments and contingencies (Note 17)Shareholders’ equity:
Common stock and paid-in capital (without par value; authorized shares—80,000,000; issued and outstanding—13,099,356 at December 31, 2013 and13,417,877 at December 31, 2012) . . . . . . . . . . . . . . . . . . . . . . . . . . . . . . . . . . . 0 721
Accumulated other comprehensive loss . . . . . . . . . . . . . . . . . . . . . . . . . . . . . . . . . (60,086) (110,689)Retained earnings . . . . . . . . . . . . . . . . . . . . . . . . . . . . . . . . . . . . . . . . . . . . . . . . . . 632,534 512,173
Total shareholders’ equity . . . . . . . . . . . . . . . . . . . . . . . . . . . . . . . . . . . . . . . . . . . . . . 572,448 402,205
Total liabilities and shareholders’ equity . . . . . . . . . . . . . . . . . . . . . . . . . . . . . . . . . . $1,327,274 $1,264,248
See accompanying Notes to Consolidated Financial Statements
44

NewMarket Corporation and Subsidiaries
Consolidated Statements of Shareholders’ Equity
Common Stock andPaid-in Capital
AccumulatedOther
ComprehensiveLoss
RetainedEarnings
TotalShareholders’
Equity(in thousands, except share and per-share amounts) Shares Amount
Balance at December 31, 2010 . . . . . . . . . . . . 14,034,884 $ 0 $ (73,820) $ 565,460 $ 491,640Net income . . . . . . . . . . . . . . . . . . . . . . . . 206,907 206,907Other comprehensive income (loss) . . . . . (24,912) (24,912)Ordinary cash dividends ($2.39 per
share) . . . . . . . . . . . . . . . . . . . . . . . . . . (32,588) (32,588)Repurchases of common stock . . . . . . . . . (659,373) (3,237) (91,518) (94,755)Stock options exercised . . . . . . . . . . . . . . 16,000 70 70Stock option tax benefit . . . . . . . . . . . . . . 1,102 1,102Stock-based compensation . . . . . . . . . . . . 13,320 2,129 2,129
Balance at December 31, 2011 . . . . . . . . . . . . 13,404,831 64 (98,732) 648,261 549,593Net income . . . . . . . . . . . . . . . . . . . . . . . . 239,593 239,593Other comprehensive income (loss) . . . . . (11,957) (11,957)Ordinary cash dividends ($3.00 per
share) . . . . . . . . . . . . . . . . . . . . . . . . . . (40,234) (40,234)Special cash dividend ($25.00 per
share) . . . . . . . . . . . . . . . . . . . . . . . . . . (335,447) (335,447)Stock-based compensation . . . . . . . . . . . . 13,046 657 657
Balance at December 31, 2012 . . . . . . . . . . . . 13,417,877 721 (110,689) 512,173 402,205Net income . . . . . . . . . . . . . . . . . . . . . . . . 264,742 264,742Other comprehensive income (loss) . . . . . 50,603 50,603Ordinary cash dividends ($3.80 per
share) . . . . . . . . . . . . . . . . . . . . . . . . . . (50,357) (50,357)Repurchases of common stock . . . . . . . . . (327,600) (2,013) (94,024) (96,037)Stock-based compensation . . . . . . . . . . . . 9,079 1,292 1,292
Balance at December 31, 2013 . . . . . . . . . . . . 13,099,356 $ 0 $ (60,086) $ 632,534 $ 572,448
See accompanying Notes to Consolidated Financial Statements
45

NewMarket Corporation and Subsidiaries
Consolidated Statements of Cash Flows
Years Ended December 31,
(in thousands) 2013 2012 2011
Cash and cash equivalents at beginning of year . . . . . . . . . . . . . . . . . . . . $ 89,129 $ 50,370 $ 49,192
Cash flows from operating activities:Net income . . . . . . . . . . . . . . . . . . . . . . . . . . . . . . . . . . . . . . . . . . . . . . . 264,742 239,593 206,907Adjustments to reconcile net income to cash flows from operating
activities:Depreciation and amortization . . . . . . . . . . . . . . . . . . . . . . . . . . . . 46,144 43,389 43,352Noncash pension benefits expense . . . . . . . . . . . . . . . . . . . . . . . . . 19,407 15,244 13,719Noncash postretirement benefits expense . . . . . . . . . . . . . . . . . . . 3,676 3,611 2,780Deferred income tax expense (benefit) . . . . . . . . . . . . . . . . . . . . . 1,026 (1,976) 2,375Gain on sale of discontinued business . . . . . . . . . . . . . . . . . . . . . . (35,770) 0 0Loss on early extinguishment of debt . . . . . . . . . . . . . . . . . . . . . . 0 9,932 0Gain on legal settlement, net . . . . . . . . . . . . . . . . . . . . . . . . . . . . . 0 0 (38,656)Unrealized (gain) loss on derivative instruments, net . . . . . . . . . . (11,550) 663 12,642
Change in assets and liabilities:Trade and other accounts receivable, net . . . . . . . . . . . . . . . . . . . . (8,606) (15,027) (16,225)Inventories . . . . . . . . . . . . . . . . . . . . . . . . . . . . . . . . . . . . . . . . . . . 3,133 (12,945) (33,154)Prepaid expenses . . . . . . . . . . . . . . . . . . . . . . . . . . . . . . . . . . . . . . (1,897) 5,641 (13,721)Accounts payable and accrued expenses . . . . . . . . . . . . . . . . . . . . 5,834 11,369 1,976Income taxes payable . . . . . . . . . . . . . . . . . . . . . . . . . . . . . . . . . . . 1,347 (3,281) (887)
Cash pension benefits contributions . . . . . . . . . . . . . . . . . . . . . . . . . . . . (30,743) (30,586) (29,447)Cash postretirement benefits contributions . . . . . . . . . . . . . . . . . . . . . . (1,740) (1,845) (1,929)Proceeds from legal settlements . . . . . . . . . . . . . . . . . . . . . . . . . . . . . . . 5,100 5,050 25,000Other, net . . . . . . . . . . . . . . . . . . . . . . . . . . . . . . . . . . . . . . . . . . . . . . . . 17,831 3,979 9,866
Cash provided from (used in) operating activities . . . . . . . . . 277,934 272,811 184,598
Cash flows from investing activities:Capital expenditures . . . . . . . . . . . . . . . . . . . . . . . . . . . . . . . . . . . . . . . . (58,476) (38,753) (53,515)Proceeds from sale of discontinued business . . . . . . . . . . . . . . . . . . . . . 140,011 0 0Deposits for interest rate swap . . . . . . . . . . . . . . . . . . . . . . . . . . . . . . . . (12,514) (22,913) (46,467)Return of deposits for interest rate swap . . . . . . . . . . . . . . . . . . . . . . . . 24,370 21,260 33,600Other, net . . . . . . . . . . . . . . . . . . . . . . . . . . . . . . . . . . . . . . . . . . . . . . . . (4,927) 1,620 (4,574)
Cash provided from (used in) investing activities . . . . . . . . . 88,464 (38,786) (70,956)
Cash flows from financing activities:Net (repayments) borrowings under revolving credit facility . . . . . . . . (75,000) 53,000 18,000Issuance of 4.10% senior notes . . . . . . . . . . . . . . . . . . . . . . . . . . . . . . . 0 349,405 0Repayment of 7.125% senior notes . . . . . . . . . . . . . . . . . . . . . . . . . . . . 0 (150,000) 0Repayment of Foundry Park I mortgage loan . . . . . . . . . . . . . . . . . . . . 0 (63,544) (2,731)Net (repayments) borrowings under lines of credit . . . . . . . . . . . . . . . . (1,135) (3,641) 6,529Dividends paid . . . . . . . . . . . . . . . . . . . . . . . . . . . . . . . . . . . . . . . . . . . . (50,368) (375,681) (32,588)Debt issuance costs . . . . . . . . . . . . . . . . . . . . . . . . . . . . . . . . . . . . . . . . . (1,145) (6,485) (3,233)Repurchases of common stock . . . . . . . . . . . . . . . . . . . . . . . . . . . . . . . . (92,195) 0 (98,093)Other, net . . . . . . . . . . . . . . . . . . . . . . . . . . . . . . . . . . . . . . . . . . . . . . . . 0 0 1,028
Cash provided from (used in) financing activities . . . . . . . . . (219,843) (196,946) (111,088)
Effect of foreign exchange on cash and cash equivalents . . . . . . . . . . . . . . . 3,019 1,680 (1,376)
Increase in cash and cash equivalents . . . . . . . . . . . . . . . . . . . . . . . . . . . . 149,574 38,759 1,178
Cash and cash equivalents at end of year . . . . . . . . . . . . . . . . . . . . . . . . . $ 238,703 $ 89,129 $ 50,370
See accompanying Notes to Consolidated Financial Statements
46

Notes to Consolidated Financial Statements
1. Summary of Significant Accounting Policies
Consolidation—Our consolidated financial statements include the accounts of NewMarket Corporation and itssubsidiaries. All intercompany transactions are eliminated upon consolidation. References to “we,” “us,” “our,”and “NewMarket” are to NewMarket Corporation and its consolidated subsidiaries, unless the context indicatesotherwise.
NewMarket is the parent company of three operating companies, each managing its own assets and liabilities.Those companies are Afton, which focuses on petroleum additive products; Ethyl, representing certainmanufacturing operations and the TEL business; and NewMarket Development, which manages the property andimprovements that we own in Richmond, Virginia. NewMarket is also the parent company of NewMarketServices, which provides various administrative services to NewMarket, Afton, Ethyl, and NewMarketDevelopment.
Certain reclassifications have been made to the accompanying consolidated financial statements and the relatednotes to conform to the current presentation.
Foreign Currency Translation—We translate the balance sheets of our foreign subsidiaries into U.S. Dollarsbased on the current exchange rate at the end of each period. We translate the statements of income using theweighted-average exchange rates for the period. NewMarket includes translation adjustments in the ConsolidatedBalance Sheets as part of accumulated other comprehensive loss and transaction adjustments in the ConsolidatedStatements of Income as part of cost of goods sold.
Revenue Recognition—Our policy is to recognize revenue from the sale of products when title and risk of losshave transferred to the buyer, the price is fixed and determinable, and collectability is reasonably assured.Revenues are reported at the gross amount billed, including amounts related to shipping that are charged to thecustomer. Provisions for rebates to customers are recorded in the same period that the related sales are recorded.Freight costs incurred on the delivery of product are included in the Consolidated Statements of Income in cost ofgoods sold. Our standard terms of delivery are included in our contracts, sales order confirmation documents, andinvoices. Taxes assessed by a governmental authority and concurrent with sales to our customers, including sales,use, value-added, and revenue-related excises taxes, are not included as revenue, but are reflected in accruedexpenses until remitted to the appropriate governmental authority.
We recognized rental revenue on a straight-line basis over the lease term. The cumulative difference betweenlease revenue recognized under this method and the contractual lease payment terms was recorded in deferredcharges and other assets on our Consolidated Balance Sheets. Rental revenue is reflected as a component ofincome from operations of discontinued business, net of tax.
Cash and Cash Equivalents—Our cash equivalents consist of government obligations and commercial paperwith original maturities of 90 days or less. Throughout the year, we have cash balances in excess of federallyinsured amounts on deposit with various financial institutions. We state cash and cash equivalents at cost, whichapproximates fair value.
Accounts Receivable—We record our accounts receivable at net realizable value. We maintain an allowance fordoubtful accounts for estimated losses resulting from our customers not making required payments. Wedetermine the adequacy of the allowance by periodically evaluating each customer’s receivable balance,considering our customers’ financial condition and credit history, and considering current economic conditions.The allowance for doubtful accounts was not material at December 31, 2013 or December 31, 2012.
Inventories—NewMarket values its U.S. petroleum additives and TEL inventories at the lower of cost ormarket, with cost determined on the last-in, first-out (LIFO) basis. In all other countries, we use the weighted-average method. Inventory cost includes raw materials, direct labor, and manufacturing overhead.
47

Notes to Consolidated Financial Statements
Property, Plant, and Equipment—We state property, plant, and equipment at cost and compute depreciation bythe straight-line method based on the estimated useful lives of the assets. We capitalize expenditures forsignificant improvements that extend the useful life of the related property. We expense repairs and maintenance,including plant turnaround costs, as incurred. When property is sold or retired, we remove the cost andaccumulated depreciation from the accounts and any related gain or loss is included in earnings.
Our policy on capital leases is to record the asset at the lower of fair value at lease inception or the present valueof the total minimum lease payments. We compute amortization by the straight-line method over the lesser of theestimated economic life of the asset or the term of the lease.
Real Estate Development and Construction Costs—We capitalize in property, plant, and equipment the costsassociated with real estate development projects, including the cost of land, as well as development andconstruction costs. We also capitalize interest costs associated with the project. Upon completion of the project,the accumulated depreciable costs are recognized in the Consolidated Statements of Income over the estimateduseful life of the asset.
Intangibles (Net of Amortization) and Goodwill—Identifiable intangibles include the cost of acquiredcontracts, formulas and technology, trademarks and trade names, and customer bases. We assign a value toidentifiable intangibles based on independent third-party appraisals and management’s assessment at the time ofacquisition. NewMarket amortizes the cost of the customer bases by an accelerated method and the cost of theremaining identifiable intangibles by the straight-line method over the estimated economic life of the intangible.
Goodwill arises from the excess of cost over net assets of businesses acquired. Goodwill represents the residualpurchase price after allocation to all identifiable net assets. We test goodwill for impairment each year andwhenever a significant event or circumstance occurs which could reduce the fair value of the reporting unit towhich the goodwill applies below the carrying amount of the reporting unit.
Impairment of Long-Lived Assets—When significant events or circumstances occur that might impair thevalue of long-lived assets, we evaluate recoverability of the recorded cost of these assets. Assets are consideredto be impaired if their carrying amount is not recoverable from the estimated undiscounted future cash flowsassociated with the assets. If we determine an asset is impaired and its recorded cost is higher than estimated fairmarket value based on the estimated present value of future cash flows, we adjust the asset to estimated fairmarket value.
Asset Retirement Obligations—Asset retirement obligations, including costs associated with the retirement oftangible long-lived assets, are recorded at the fair value of the liability for an asset retirement obligation whenincurred instead of ratably over the life of the asset. The asset retirement costs must be capitalized as part of thecarrying amount of the long-lived asset. If the liability is settled for an amount other than the recorded balance,we recognize either a gain or loss at settlement. Asset retirement obligations are not material to our financialposition, results of operations, or cash flows for the periods presented in these financial statements.
Environmental Costs—NewMarket capitalizes environmental compliance costs if they extend the useful life ofthe related property or prevent future contamination. Environmental compliance costs also include maintenanceand operation of pollution prevention and control facilities. We expense these compliance costs in cost of goodssold as incurred.
Accrued environmental remediation and monitoring costs relate to an existing condition caused by pastoperations. NewMarket accrues these costs in current operations within cost of goods sold in the ConsolidatedStatements of Income when it is probable that we have incurred a liability and the amount can be reasonablyestimated. These estimates are based on an assessment of the site, available clean-up methods, and priorexperience in handling remediation.
48

Notes to Consolidated Financial Statements
When we can reliably determine the amount and timing of future cash flows, we discount these liabilities,incorporating an inflation factor.
Legal Costs—We expense legal costs in the period incurred.
Employee Savings Plan—Most of our full-time salaried and hourly employees may participate in definedcontribution savings plans. Employees who are covered by collective bargaining agreements may also participatein a savings plan according to the terms of their bargaining agreements. Employees, as well as NewMarket,contribute to the plans. We made contributions of $5 million in 2013, $5 million in 2012, and $4 million in 2011related to these plans.
Research, Development, and Testing Expenses—NewMarket expenses all research, development, and testingcosts as incurred. Of the total research, development, and testing expenses, those related to new products andprocesses were $59 million in 2013, $55 million in 2012, and $51 million in 2011.
Income Taxes—We recognize deferred income taxes for temporary differences between the financial reportingbasis and the income tax basis of assets and liabilities. We also adjust for changes in tax rates and laws at thetime the changes are enacted. A valuation allowance is recorded when it is more likely than not that a deferredtax asset will not be realized. We recognize accrued interest and penalties associated with uncertain tax positionsas part of income tax expense on our Consolidated Statements of Income.
We generally provide for additional U.S. taxes that would be incurred if a foreign subsidiary returns its earningsin cash to the United States. Undistributed earnings of certain foreign subsidiaries for which U.S. taxes have notbeen provided totaled approximately $301 million at December 31, 2013, $239 million at December 31, 2012,and $177 million at December 31, 2011. Deferred income taxes have not been provided on these earnings sincewe expect them to be indefinitely reinvested abroad. Accordingly, no provision has been made for taxes that maybe payable on the remittance of these earnings. The determination of the amount of such unrecognized deferredtax liability is not practicable.
Derivative Financial Instruments and Hedging Activities—We record all derivatives on the balance sheet atfair value. The accounting for changes in the fair value of derivatives depends on the intended use of thederivative, whether we have elected to designate a derivative in a hedging relationship and apply hedgeaccounting, and whether the hedging relationship has satisfied the criteria necessary to apply hedge accounting.We may enter into derivative contracts that are intended to economically hedge certain of our risks, even thoughhedge accounting does not apply or we elect not to apply hedge accounting. We do not enter into derivativeinstruments for speculative purposes.
Derivatives designated and qualifying as a hedge of the exposure to changes in the fair value of an asset, liability,or firm commitment attributable to a particular risk are considered fair value hedges. Derivatives designated andqualifying as a hedge of the exposure to variability in expected future cash flows, or other types of forecastedtransactions, are considered cash flow hedges. Derivatives may also be designated as hedges of the foreigncurrency exposure of a net investment in a foreign operation.
Stock-based Compensation—The value of stock awards is measured based on the closing price of our commonstock on the date of grant, adjusted for provisions specific to a particular award. We recognize stock-basedcompensation expense on a straight-line basis over the requisite service period.
Investments—We classify current marketable securities as “available for sale” and record them at fair valuewith the unrealized gains or losses, net of tax, included as a component of shareholders’ equity in accumulatedother comprehensive loss. The fair value is determined based on quoted market prices.
49

Notes to Consolidated Financial Statements
When a decline in the fair value of a marketable security is considered other than temporary, we write down theinvestment to estimated fair market value with a corresponding charge to earnings.
Estimates and Risks Due to Concentration of Business—The preparation of financial statements in conformitywith accounting principles generally accepted in the United States of America requires management to makeestimates and assumptions that affect the amounts reported in the financial statements and accompanying notes.Actual results could differ from those estimates.
In addition, our financial results can be influenced by certain risk factors. Some of our significant concentrationsof risk include the following:
• reliance on a small number of significant customers;
• customers concentrated in the fuel and lubricant industries; and
• production of several of our products solely at one facility.
2. Discontinued Operations
On July 2, 2013, Foundry Park I completed the sale of its real estate assets for $144 million in cash, whichcomprised our entire real estate development segment. The operations of the real estate development segment forall periods presented are reported in income from operations of discontinued business, net of tax in theConsolidated Statements of Income. We recognized a gain of $36 million ($22 million after tax) in 2013 relatedto this transaction.
The components of income from operations of discontinued business, net of tax were as follows:
Years Ended December 31,
(in thousands) 2013 2012 2011
Rental revenue . . . . . . . . . . . . . . . . . . . . . . . . . . . . . . . . . . . . . . . . . . . $5,747 $11,431 $11,431Cost of rental . . . . . . . . . . . . . . . . . . . . . . . . . . . . . . . . . . . . . . . . . . . . 2,136 4,386 4,386Interest, financing, and other expenses, net . . . . . . . . . . . . . . . . . . . . . 2,728 2,382 4,672Loss on early extinguishment of debt . . . . . . . . . . . . . . . . . . . . . . . . . 0 840 0
Income before income tax expense . . . . . . . . . . . . . . . . . . . . . . . . . . . 883 3,823 2,373Income tax expense . . . . . . . . . . . . . . . . . . . . . . . . . . . . . . . . . . . . . . . 343 1,502 923
Income from operations of discontinued business, net of tax . . . . . . . $ 540 $ 2,321 $ 1,450
Interest, financing, and other expenses, net include only amounts directly related to the Foundry Park I mortgageloan and related interest rate swap. See Note 15 for further information. Other interest and financing expenseshave not been allocated to discontinued operations. The Consolidated Statements of Cash Flows summarize theactivity of discontinued operations and continuing operations together.
3. Earnings Per Share
For the years ended December 31, 2013 and December 31, 2012, we had 20,270 shares and 11,940 shares,respectively, of nonvested restricted stock that were excluded from the calculation of diluted earnings per shareas their effect on earnings per share would be anti-dilutive. We had no anti-dilutive options or stock-basedcompensation awards that were excluded from the calculation of diluted earnings per share for 2011.
50

Notes to Consolidated Financial Statements
The nonvested restricted stock is considered a participating security since the stock contains nonforfeitable rightsto dividends. As such, we use the two-class method to compute basic and diluted earnings per share. Thefollowing table illustrates the earnings allocation method utilized in the calculation of basic and diluted earningsper share from continuing operations.
Years Ended December 31,
(in thousands, except per-share amounts) 2013 2012 2011
Earnings per share from continuing operations numerator:Income from continuing operations attributable to common shareholders
before allocation of earnings to participating securities . . . . . . . . . . . . $242,347 $237,272 $205,457Income from continuing operations allocated to participating
securities . . . . . . . . . . . . . . . . . . . . . . . . . . . . . . . . . . . . . . . . . . . . . . . . . 339 316 0
Income from continuing operations attributable to common shareholdersafter allocation of earnings to participating securities . . . . . . . . . . . . . . $242,008 $236,956 $205,457
Earnings per share from continuing operations denominator:Weighted-average number of shares of common stock outstanding . . . . . 13,286 13,405 13,707Dilutive effect of unexercised stock options . . . . . . . . . . . . . . . . . . . . . . . 0 0 5
Total shares . . . . . . . . . . . . . . . . . . . . . . . . . . . . . . . . . . . . . . . . . . . . 13,286 13,405 13,712
Basic earnings per share from continuing operations . . . . . . . . . . . . . . . . . . . . $ 18.21 $ 17.68 $ 14.99
Diluted earnings per share from continuing operations . . . . . . . . . . . . . . . . . . . $ 18.21 $ 17.68 $ 14.98
4. Supplemental Cash Flow Information
Years Ended December 31,
(in thousands) 2013 2012 2011
Cash paid during the year forInterest and financing expenses (net of capitalization) . . . . . . . $17,172 $ 9,612 $17,329Income taxes . . . . . . . . . . . . . . . . . . . . . . . . . . . . . . . . . . . . . . . . 96,273 99,956 96,919
5. Trade and Other Accounts Receivable, Net
December 31,
(in thousands) 2013 2012
Trade receivables . . . . . . . . . . . . . . . . . . . . . . . . . . . . . . . . $286,737 $261,492Income tax receivables . . . . . . . . . . . . . . . . . . . . . . . . . . . 2,466 18,824Other . . . . . . . . . . . . . . . . . . . . . . . . . . . . . . . . . . . . . . . . . 20,644 16,739
$309,847 $297,055
51

Notes to Consolidated Financial Statements
6. Inventories
December 31,
(in thousands) 2013 2012
Finished goods and work-in-process . . . . . . . . . . . . . . . . . $257,446 $265,017Raw materials . . . . . . . . . . . . . . . . . . . . . . . . . . . . . . . . . . 41,799 48,881Stores, supplies, and other . . . . . . . . . . . . . . . . . . . . . . . . . 8,273 8,776
$307,518 $322,674
Our U.S. inventories, which are stated on the LIFO basis, amounted to $109 million at December 31, 2013,which was below replacement cost by approximately $56 million. At December 31, 2012, LIFO basis inventorieswere $111 million, which was approximately $58 million below replacement cost.
Our foreign inventories amounted to $192 million at December 31, 2013 and $205 million at December 31, 2012.
The reserves for obsolete and slow-moving inventory included in the table above were not material atDecember 31, 2013 and December 31, 2012.
7. Prepaid Expenses and Other Current Assets
December 31,
(in thousands) 2013 2012
Income taxes on intercompany profit . . . . . . . . . . . . . . . . . . $13,812 $12,507Dividend funding . . . . . . . . . . . . . . . . . . . . . . . . . . . . . . . . . . 12,996 0Other . . . . . . . . . . . . . . . . . . . . . . . . . . . . . . . . . . . . . . . . . . . 6,176 5,678
$32,984 $18,185
8. Property, Plant, and Equipment, at Cost
December 31,
(in thousands) 2013 2012
Land . . . . . . . . . . . . . . . . . . . . . . . . . . . . . . . . . . . . . . . . $ 41,891 $ 42,713Land improvements . . . . . . . . . . . . . . . . . . . . . . . . . . . . 31,980 31,452Leasehold improvements . . . . . . . . . . . . . . . . . . . . . . . . 1,134 1,148Buildings . . . . . . . . . . . . . . . . . . . . . . . . . . . . . . . . . . . . 138,823 191,866Machinery and equipment . . . . . . . . . . . . . . . . . . . . . . . 740,003 772,256Construction in progress . . . . . . . . . . . . . . . . . . . . . . . . . 31,365 31,532
$985,196 $1,070,967
We depreciate the cost of property, plant, and equipment by the straight-line method and primarily over thefollowing useful lives:
Land improvements . . . . . . . . . . . . . . . . . . . . . . . . . . . . . 5 - 30 yearsBuildings . . . . . . . . . . . . . . . . . . . . . . . . . . . . . . . . . . . . . . 10 - 50 yearsMachinery and equipment . . . . . . . . . . . . . . . . . . . . . . . . 3 - 15 years
52

Notes to Consolidated Financial Statements
At December 31, 2012, assets held for lease and reflected in the table above included $3 million of land, $2million of land improvements, $66 million of buildings, and $38 million of machinery and equipment.Accumulated depreciation on these assets was $11 million at December 31, 2012. All of these assets representedthe assets of Foundry Park I, which were sold in 2013. Refer to Note 2 for further information. Depreciationexpense was $35 million in 2013, $34 million in 2012, and $33 million in 2011.
9. Intangibles (Net of Amortization) and Goodwill
December 31,
2013 2012
(in thousands)
GrossCarryingAmount
AccumulatedAmortization
GrossCarryingAmount
AccumulatedAmortization
Amortizing intangible assetsFormulas and technology . . . . . . . . . . . . . $ 88,917 $77,217 $ 91,662 $74,762Contracts . . . . . . . . . . . . . . . . . . . . . . . . . . 7,127 5,528 9,593 6,734Customer bases . . . . . . . . . . . . . . . . . . . . . 7,012 2,918 7,021 2,400Trademarks and trade names . . . . . . . . . . 1,591 610 1,586 426
Goodwill . . . . . . . . . . . . . . . . . . . . . . . . . . . . . . 4,945 5,002
$109,592 $86,273 $114,864 $84,322
Aggregate amortization expense . . . . . . . . . . . $ 7,194 $ 7,433
Aggregate amortization expense was $9 million in 2011. The change in the goodwill amount between 2012 and2013 is due to foreign currency fluctuations. All of the intangibles relate to the petroleum additives segment.There is no accumulated goodwill impairment.
Estimated annual amortization expense related to our intangible assets for the next five years is expected to be (inthousands):
2014 . . . . . . . . . . . . . . . . . . . . . . . . . . . . . . . . . . . . . . . . . . . . . . $6,1632015 . . . . . . . . . . . . . . . . . . . . . . . . . . . . . . . . . . . . . . . . . . . . . . 5,7902016 . . . . . . . . . . . . . . . . . . . . . . . . . . . . . . . . . . . . . . . . . . . . . . 1,9102017 . . . . . . . . . . . . . . . . . . . . . . . . . . . . . . . . . . . . . . . . . . . . . . 7462018 . . . . . . . . . . . . . . . . . . . . . . . . . . . . . . . . . . . . . . . . . . . . . . 715
We amortize contracts over 1.5 to 10 years; customer bases over 20 years; formulas and technology over 5 to 20years; and trademarks and trade names over 10 years.
10. Deferred Charges and Other Assets
December 31,
(in thousands) 2013 2012
Interest rate swap deposits . . . . . . . . . . . . . . . . . . . . . . . . . . $25,839 $37,694Deferred financing costs, net of amortization . . . . . . . . . . . . 7,390 8,560Asbestos insurance receivables . . . . . . . . . . . . . . . . . . . . . . . 5,596 6,498Other . . . . . . . . . . . . . . . . . . . . . . . . . . . . . . . . . . . . . . . . . . . 4,727 19,255
$43,552 $72,007
See Note 12 for further information on our long-term debt and Note 15 for further information on interest rateswaps.
53

Notes to Consolidated Financial Statements
11. Accrued Expenses
December 31,
(in thousands) 2013 2012
Employee benefits, payroll, and related taxes . . . . . . . . . . . . . . . . . . . . $28,779 $28,659Customer rebates . . . . . . . . . . . . . . . . . . . . . . . . . . . . . . . . . . . . . . . . . . 20,517 21,881Taxes other than income and payroll . . . . . . . . . . . . . . . . . . . . . . . . . . 3,929 4,517Repurchase of NewMarket Corporation common stock . . . . . . . . . . . . 3,842 0Other . . . . . . . . . . . . . . . . . . . . . . . . . . . . . . . . . . . . . . . . . . . . . . . . . . . 20,925 24,004
$77,992 $79,061
12. Long-term Debt
December 31,
(in thousands) 2013 2012
Senior notes - 4.10% due 2022 . . . . . . . . . . . . . . . . . . . . . $349,467 $349,407Revolving credit facility . . . . . . . . . . . . . . . . . . . . . . . . . . 0 75,000
$349,467 $424,407
4.10% Senior Notes - In 2012, we issued $350 million aggregate principal amount of 4.10% senior notes due2022 at an issue price of 99.83%. The 4.10% senior notes are our senior unsecured obligations and are jointly andseverally guaranteed on a senior unsecured basis by all existing and future domestic subsidiaries that alsoguarantee our obligations under the revolving credit facility or any of our other indebtedness. We incurredfinancing costs in 2012 and 2013 totaling approximately $5 million related to the 4.10% senior notes, which arebeing amortized over the term of the agreement.
The 4.10% senior notes and the subsidiary guarantees rank:
• equal in right of payment with all of our and the guarantors’ existing and future senior unsecuredindebtedness; and
• senior in right of payment to any of our and the guarantors’ future subordinated indebtedness.
The indenture governing the 4.10% senior notes contains covenants that, among other things, limit our abilityand the ability of our subsidiaries to:
• create or permit to exist liens;
• enter into sale-leaseback transactions;
• incur additional guarantees; and
• sell all or substantially all of our assets or consolidate or merge with or into other companies.
We were in compliance with all covenants under the indenture governing the 4.10% senior notes as ofDecember 31, 2013 and December 31, 2012.
During March 2013, we registered these 4.10% senior notes under the Securities Act of 1933. All previouslyunregistered 4.10% senior notes that were outstanding at December 31, 2012 have been exchanged for an equalaggregate principal amount of registered 4.10% senior notes.
54

Notes to Consolidated Financial Statements
Revolving Credit Facility – In 2012, we entered into a Credit Agreement with a term of five years. The CreditAgreement provides for a $650 million, multicurrency revolving credit facility, with a $100 million sublimit formulticurrency borrowings, a $100 million sublimit for letters of credit, and a $20 million sublimit for swinglineloans. The Credit Agreement includes an expansion feature which allows us, subject to certain conditions, torequest an increase to the aggregate amount of the revolving credit facility or obtain incremental term loans in anamount up to $150 million.
The obligations under the Credit Agreement are unsecured and are fully guaranteed by NewMarket and thesubsidiary guarantors. The revolving credit facility matures on March 14, 2017.
Borrowings made under the revolving credit facility bear interest at an annual rate equal to, at our election, either(1) the ABR plus the Applicable Rate (solely in the case of loans denominated in U.S. dollars to NewMarket) or(2) the Adjusted LIBO Rate plus the Applicable Rate. ABR is the greatest of (i) the rate of interest publiclyannounced by the Administrative Agent as its prime rate, (ii) the federal funds effective rate plus 0.5%, or(iii) the Adjusted LIBO Rate for a one month interest period plus 1%. The Adjusted LIBO Rate means the rate atwhich Agreed Currencies in the London interbank market for certain periods (as selected by NewMarket) arequoted, as adjusted for statutory reserve requirements. Depending on our consolidated Leverage Ratio, theApplicable Rate ranges from 0.50% to 1.00% for loans bearing interest based on the ABR and from 1.50% to2.00% for loans bearing interest based on the Adjusted LIBO Rate. At December 31, 2013, the Applicable Ratewas 0.50% for loans bearing interest based on the ABR and 1.50% for loans bearing interest based on theAdjusted LIBO Rate.
The Credit Agreement contains financial covenants that require NewMarket to maintain a consolidated LeverageRatio (as defined in the Credit Agreement) of no more than 3.00 to 1.00 and a consolidated Interest CoverageRatio (as defined in the Credit Agreement) of no less than 3.00 to 1.00, calculated on a rolling four quarter basis,as of the end of each fiscal quarter ending on and after March 31, 2012. We were in compliance with allcovenants under the revolving credit facility at December 31, 2013 and December 31, 2012.
The following table provides information related to the unused portion of our revolving credit facility in effect atDecember 31, 2013 and December 31, 2012:
December 31,
(in millions) 2013 2012
Maximum borrowing capacity under the revolving credit facility . . . . . . . . . $650 $650Outstanding borrowings under the revolving credit facility . . . . . . . . . . . . . . 0 75Outstanding letters of credit . . . . . . . . . . . . . . . . . . . . . . . . . . . . . . . . . . . . . . 3 3
Unused portion of revolving credit facility . . . . . . . . . . . . . . . . . . . . . . . . . . . $647 $572
The average interest rate for borrowings under our revolving credit facilities was 2.2% during 2013 and 1.8%during 2012.
None of our outstanding borrowings at December 31, 2013 are due in the next five years.
55

Notes to Consolidated Financial Statements
13. Other Noncurrent Liabilities
December 31,
(in thousands) 2013 2012
Employee benefits . . . . . . . . . . . . . . . . . . . . . . . . . . . . . . . $ 90,088 $140,501Interest rate swaps . . . . . . . . . . . . . . . . . . . . . . . . . . . . . . . 18,941 30,508Environmental remediation . . . . . . . . . . . . . . . . . . . . . . . . 15,337 16,869Asbestos litigation reserve . . . . . . . . . . . . . . . . . . . . . . . . 10,106 9,453Other . . . . . . . . . . . . . . . . . . . . . . . . . . . . . . . . . . . . . . . . . 23,273 23,634
$157,745 $220,965
The decrease in employee benefits primarily reflects the improvement in the funded status of our pension andpostretirement plans resulting from higher discount rates, as well as favorable market performance. See Note 18for further information on these employee benefit plans. Environmental remediation includes our asset retirementobligations. Further information on the interest rate swaps is in Note 15.
14. Stock-based Compensation
The 2004 Incentive Compensation and Stock Plan (the Plan) was approved on May 24, 2004. Any employee ofour company or an affiliate or a person who is a member of our Board of Directors or the board of directors of anaffiliate is eligible to participate in the Plan if the Compensation Committee of the Board of Directors (theAdministrator), in its sole discretion, determines that such person has contributed significantly or can be expectedto contribute significantly to the profits or growth of our company or its affiliates (each, a participant). Under theterms of the Plan, we may grant participants stock awards, incentive awards, or options (which may be eitherincentive stock options or nonqualified stock options), or stock appreciation rights (SARs), which may be grantedwith a related option. Stock options entitle the participant to purchase a specified number of shares of ourcommon stock at a price that is fixed by the Administrator at the time the option is granted; provided, however,that the price cannot be less than the shares’ fair market value on the date of grant. The maximum period inwhich an option may be exercised is fixed by the Administrator at the time the option is granted but, in the caseof an incentive stock option, cannot exceed ten years. No participant may be granted or awarded, in any calendaryear, shares, options, or SARs covering more than 200,000 shares of our common stock in the aggregate. Forpurposes of this limitation and the individual limitation on the grant of options, an option and corresponding SARare treated as a single award.
The maximum aggregate number of shares of our common stock that may be issued under the Plan is 1,500,000.At December 31, 2013, 1,429,078 shares were available for grant.
During 2013, 9,534 shares of our common stock were issued under the Plan. Of those shares, 8,850 were issuedto employees as restricted stock subject to a three-year vesting period and 684 shares were issued to six of ournon-employee directors and vested immediately.
We calculate fair value based on the closing price of our common stock on the date of grant. As award recipientsare entitled to receive dividends during the vesting period, we made no adjustment to the fair value of the awardfor dividends.
56

Notes to Consolidated Financial Statements
A summary of activity during 2013 related to NewMarket’s restricted stock awards is presented below in wholeshares:
Number of Shares
Weighted AverageGrant-Date Fair
Value
Nonvested restricted stock awards at January 1, 2013 . . . . . . . . . 11,940 $246.93Granted in 2013 . . . . . . . . . . . . . . . . . . . . . . . . . . . . . . . . . . . . . . . 8,850 314.19Vested in 2013 . . . . . . . . . . . . . . . . . . . . . . . . . . . . . . . . . . . . . . . 65 246.93Forfeited in 2013 . . . . . . . . . . . . . . . . . . . . . . . . . . . . . . . . . . . . . . 455 252.10
Nonvested restricted stock awards at December 31, 2013 . . . . . . 20,270 276.18
We recognized compensation expense of $1 million in 2013, $400 thousand in 2012, and $3 million in 2011related to restricted stock awards. At December 31, 2013, total unrecognized compensation expense related tononvested restricted stock awards was $4 million, which is expected to be recognized over a period of 2.2 years.
15. Derivatives and Hedging Activities
We are exposed to certain risks arising from both our business operations and economic conditions. We primarilymanage our exposures to a wide variety of business and operational risks through management of our corebusiness activities.
We manage certain economic risks, including interest rate, liquidity, and credit risk primarily by managing theamount, sources, and duration of our debt funding, as well as through the use of derivative financial instruments.Specifically, we have entered into interest rate swaps to manage our exposure to interest rate movements.
Our foreign operations expose us to fluctuations of foreign exchange rates. These fluctuations may impact thevalue of our cash receipts and payments as compared to our reporting currency, the U.S. Dollar. To manage thisexposure, we sometimes enter into foreign currency forward contracts to minimize currency exposure due to cashflows from foreign operations. There were no such contracts outstanding at December 31, 2013 or December 31,2012.
Cash Flow Hedge of Interest Rate Risk
In January 2010, we entered into an interest rate swap to manage our exposure to interest rate movements on theFoundry Park I mortgage loan and to reduce variability in interest expense. This mortgage loan interest rate swapterminated with the payoff of the mortgage loan on May 1, 2012. We also had an interest rate swap to manageour exposure to interest rate movements on the Foundry Park I construction loan and to add stability tocapitalized interest expense. The Foundry Park I construction loan interest rate swap matured on January 1, 2010.Both interest rate swaps were designated and qualified as cash flow hedges. As such, the effective portion ofchanges in the fair value of the swaps was recorded in accumulated other comprehensive loss and wassubsequently reclassified into earnings in the period that the hedged forecasted transaction affected earnings. Anyineffective portion of changes in the fair value of the swap was recognized immediately in earnings. Due to thesale of the real estate assets of Foundry Park I in July 2013, the amounts in accumulated other comprehensiveloss for both interest rate swaps were completely recognized in the Consolidated Statements of Income in 2013.
Non-designated Hedges
On June 25, 2009, we entered into an interest rate swap with Goldman Sachs in the notional amount of $97million and with a maturity date of January 19, 2022 (Goldman Sachs interest rate swap). NewMarket enteredinto the Goldman Sachs interest rate swap in connection with the termination of a loan application and related
57

Notes to Consolidated Financial Statements
rate lock agreement between Foundry Park I and Principal Commercial Funding II, LLC (Principal). When therate lock agreement was originally executed in 2007, Principal simultaneously entered into an interest rate swapwith a third party to hedge Principal’s exposure to fluctuation in the ten-year United States Treasury Bond rate.Upon the termination of the rate lock agreement on June 25, 2009, Goldman Sachs both assumed Principal’sposition with the third party and entered into an offsetting interest rate swap with NewMarket. Under the terms ofthis interest rate swap, NewMarket is making fixed rate payments at 5.3075% and Goldman Sachs makesvariable rate payments based on three-month LIBOR. We have collateralized this exposure through cash depositsposted with Goldman Sachs amounting to $26 million at December 31, 2013 and $38 million at December 31,2012.
We have made an accounting policy election to not offset derivative fair value amounts with the fair valueamounts for the right to reclaim cash collateral under our master netting arrangement. We do not use hedgeaccounting for the Goldman Sachs interest rate swap, and therefore, immediately recognize any change in the fairvalue of this derivative financial instrument directly in earnings.
*****
The table below presents the fair value of our derivative financial instruments, as well as their classification onthe Consolidated Balance Sheets as of December 31, 2013 and December 31, 2012.
Liability Derivatives
December 31, 2013 December 31, 2012
(in thousands)Balance Sheet
LocationFair
ValueBalance Sheet
LocationFair
Value
Derivatives Not Designated as Hedging Instruments
Goldman Sachs interest rate swap . . . . . . . . . . . . . . . . . . . . . . .
Accruedexpensesand Othernoncurrentliabilities $21,211
Accruedexpensesand Othernoncurrentliabilities $32,761
The tables below present the effect of our derivative financial instruments on the Consolidated Statements ofIncome.
Effect of Derivative Instruments on the Consolidated Statements of IncomeDesignated Cash Flow Hedges
(in thousands)
Derivatives in Cash Flow HedgingRelationship
Amount of Gain (Loss)Recognized in OCI on
Derivative (Effective Portion)
Location ofGain (Loss)Reclassified
fromAccumulated
OCI intoIncome
(EffectivePortion)
Amount of Gain (Loss)Reclassified from
Accumulated OCI intoIncome (Effective Portion)
Years Ended December 31, Years Ended December 31,
2013 2012 2011 2013 2012 2011
Mortgage loan interest rate swap . . . . . $0 $(540) $(2,627)Discontinued
operations $(2,727) $(1,376) $(1,584)
Construction loan interest rate swap . . $0 $ 0 $ 0Discontinued
operations $(4,068) $ (86) $ (85)
58

Notes to Consolidated Financial Statements
Of the amounts in discontinued operations reflected in the table above, $4 million from the construction loan wasrecorded as a component of the gain on sale of discontinued business. The remaining amounts are recorded as acomponent of income from operations of discontinued business. There was no gain or loss recognized in theConsolidated Statements of Income in 2013, 2012, or 2011 due to ineffectiveness.
Effect of Derivative Instruments on the Consolidated Statements of IncomeNot Designated Derivatives
(in thousands)
Derivatives Not Designated as Hedging Instruments
Location of Gain (Loss)Recognized in Income on
DerivativesAmount of Gain (Loss) Recognized in
Income on Derivatives
Years Ended December 31,
2013 2012 2011
Goldman Sachs interest rate swap . . . . . . . . . . Other income (expense), net $6,690 $(5,346) $(17,516)
Credit-risk Related Contingent Features
The agreement we have with our current derivative counterparty contains a provision where we could be declaredin default on our derivative obligation if repayment of indebtedness is accelerated by our lender(s) due to ourdefault on the indebtedness.
As of December 31, 2013, the fair value of the derivative in a net liability position related to this agreement,which includes accrued interest but excludes any adjustment for nonperformance risk, was $21 million. We haveminimum collateral posting thresholds with the counterparty and have posted cash collateral of $26 million as ofDecember 31, 2013. If required, we could have settled our obligations under the agreement at the terminationvalue of $21 million at December 31, 2013.
16. Fair Value Measurements
The following table provides information on assets and liabilities measured at fair value on a recurring basis. Nomaterial events occurred during 2013 requiring adjustment to the recognized balances of assets or liabilitieswhich are recorded at fair value on a nonrecurring basis.
CarryingAmount in
ConsolidatedBalance Sheets Fair Value
Fair Value Measurements Using
Level 1 Level 2 Level 3
(in thousands) December 31, 2013
Cash and cash equivalents . . . . . . . . . . . . . . . . . . . . . . . $238,703 $238,703 $238,703 $ 0 $0Cash deposit for collateralized interest rate swap . . . . . 25,839 25,839 25,839 0 0Interest rate swap liability . . . . . . . . . . . . . . . . . . . . . . . 21,211 21,211 0 21,211 0
December 31, 2012
Cash and cash equivalents . . . . . . . . . . . . . . . . . . . . . . . $ 89,129 $ 89,129 $ 89,129 $ 0 $0Cash deposit for collateralized interest rate swap . . . . . 37,694 37,694 37,694 0 0Interest rate swap liability . . . . . . . . . . . . . . . . . . . . . . . 32,761 32,761 0 32,761 0
We determine the fair value of the derivative instrument shown in the table above by using widely-acceptedvaluation techniques, including discounted cash flow analysis on the expected cash flows of each instrument. Theanalysis reflects the contractual terms of the derivatives, including the period to maturity, and uses observablemarket-based inputs.
59

Notes to Consolidated Financial Statements
The fair value of the interest rate swap is determined using the market standard methodology of netting thediscounted future fixed cash receipts and the discounted expected variable cash payments. The variable cashpayments are based on an expectation of future interest rates derived from observable market interest rate curves.In determining the fair value measurements, we incorporate credit valuation adjustments to appropriately reflectboth our nonperformance risk and the counterparties’ nonperformance risk.
Although we have determined that the majority of the inputs used to value our derivative falls within Level 2 ofthe fair value hierarchy, the credit valuation adjustment associated with the derivative utilizes Level 3 inputs.These Level 3 inputs include estimates of current credit spreads to evaluate the likelihood of default by both usand the counterparties to the derivative. As of December 31, 2013 and December 31, 2012, we have assessed thesignificance of the impact of the credit valuation adjustment on the overall valuation of our derivative and havedetermined that the credit valuation adjustment is not significant to the overall valuation of the derivative.Accordingly, we have determined that our derivative valuation should be classified in Level 2 of the fair valuehierarchy.
We have made an accounting policy election to measure credit risk of any derivative financial instrumentssubject to master netting agreements on a net basis by counterparty portfolio.
Long-term debt—We record the value of our long-term debt at historical cost. The estimated fair value of ourlong-term debt is shown in the table below and is based primarily on estimated current rates available to us fordebt of the same remaining duration and adjusted for nonperformance risk and credit risk. The estimated fairvalue is determined by the market standard practice of modeling the contractual cash flows required under thedebt instrument and discounting the cash flows back to present value at the appropriate credit-risk adjustedmarket interest rates. For floating rate debt obligations, we use forward rates, derived from observable marketyield curves, to project the expected cash flows we will be required to make under the debt instrument. We thendiscount those cash flows back to present value at the appropriate credit-risk adjusted market interest rates. Thefair value is categorized as Level 2.
December 31, 2013 December 31, 2012
(in thousands)CarryingAmount
FairValue
CarryingAmount
FairValue
Long-term debt . . . . . . . . . . . . . . . . . . . . . . . . . . . . $349,467 $345,283 $424,407 $432,395
17. Contractual Commitments and Contingencies
Contractual Commitments—NewMarket has operating lease agreements primarily for office space,transportation equipment, and storage facilities. Rental expense was $27 million in 2013, $25 million in 2012,and $24 million in 2011.
Future lease payments for all noncancelable operating leases as of December 31, 2013 are (in millions):
2014 . . . . . . . . . . . . . . . . . . . . . . . . . . . . . . . . . . . . . . . . . . . . . . . . . $122015 . . . . . . . . . . . . . . . . . . . . . . . . . . . . . . . . . . . . . . . . . . . . . . . . . 92016 . . . . . . . . . . . . . . . . . . . . . . . . . . . . . . . . . . . . . . . . . . . . . . . . . 72017 . . . . . . . . . . . . . . . . . . . . . . . . . . . . . . . . . . . . . . . . . . . . . . . . . 42018 . . . . . . . . . . . . . . . . . . . . . . . . . . . . . . . . . . . . . . . . . . . . . . . . . 2After 2018 . . . . . . . . . . . . . . . . . . . . . . . . . . . . . . . . . . . . . . . . . . . . 9
We have contractual obligations for the construction of assets, as well as purchases of property and equipment ofapproximately $7 million at December 31, 2013.
60

Notes to Consolidated Financial Statements
Raw Material Purchase Obligations—We have raw material purchase obligations over the next five yearsamounting to approximately $271 million at December 31, 2013 for agreements to purchase goods or servicesthat are enforceable, legally binding, and specify all significant terms, including: fixed or minimum quantities tobe purchased; fixed, minimum, or variable price provisions; and the approximate timing of the transaction. Rawmaterial purchase obligations exclude agreements that are cancelable without penalty. Purchase orders made inthe ordinary course of business are excluded from this amount. Any amounts for which we are liable underpurchase orders are reflected in our Consolidated Balance Sheets as accounts payable or accrued expenses.
Litigation—We are involved in legal proceedings that are incidental to our business and include administrativeor judicial actions seeking remediation under environmental laws, such as Superfund. Some of these legalproceedings relate to environmental matters and involve governmental authorities. For further information see“Environmental” below and Item 1 of this Form 10-K.
While it is not possible to predict or determine with certainty the outcome of any legal proceeding, we believe theoutcome of any of these proceedings, or all of them combined, will not result in a material adverse effect on ourconsolidated results of operations, financial condition, or cash flows.
As we previously disclosed, the United States Department of Justice has advised us that it is conducting a reviewof certain of our foreign business activities in relation to compliance with relevant U.S. economic sanctionsprograms and anti-corruption laws, as well as certain historical conduct in the domestic U.S. market, and hasrequested certain information in connection with such review. We are cooperating with the investigation. Inconnection with such cooperation, we have voluntarily agreed to provide certain information and are conductingan internal review for that purpose.
Asbestos
We are a defendant in personal injury lawsuits involving exposure to asbestos. These cases involve exposure toasbestos in premises owned or operated, or formerly owned or operated, by subsidiaries of NewMarket. We havenever manufactured, sold, or distributed products that contain asbestos. Nearly all of these cases are pending inTexas, Louisiana, or Illinois and involve multiple defendants. We maintain an accrual for these proceedings, aswell as a receivable for expected insurance recoveries.
The accrual for our premises asbestos liability related to currently asserted claims is based on the followingassumptions and factors:
• We are often one of many defendants. This factor influences both the number of claims settled againstus and the indemnity cost associated with such resolutions.
• The estimated percent of claimants in each case that will actually, after discovery, make a claim againstus, out of the total number of claimants in a case, is based on a level consistent with past experienceand current trends.
• We utilize average comparable plaintiff cost history as the basis for estimating pending premisesasbestos related claims. These claims are filed by both former contractors’ employees and formeremployees who worked at past and present company locations. We also include an estimated inflationfactor in the calculation.
• No estimate is made for unasserted claims.
• The estimated recoveries from insurance and Albemarle Corporation (a former operation of ourcompany) for these cases are based on, and are consistent with, the 2005 settlement agreements withTravelers Indemnity Company.
61

Notes to Consolidated Financial Statements
Based on the above assumptions, we have provided an undiscounted liability related to premises asbestos claimsof $12 million at December 31, 2013 and $11 million December 31, 2012. The liabilities related to asbestosclaims are included in accrued expenses (current portion) and other noncurrent liabilities on the ConsolidatedBalance Sheets. Certain of these costs are recoverable through our insurance coverage and an agreement withAlbemarle Corporation. The receivable for these recoveries related to premises asbestos liabilities was $6 millionat December 31, 2013 and $8 million at December 31, 2012. These receivables are included in trade and otheraccounts receivable, net on the Consolidated Balance Sheets for the current portion. The noncurrent portion isincluded in deferred charges and other assets.
Environmental—We are involved in environmental proceedings and potential proceedings relating to soil andgroundwater contamination, disposal of hazardous waste, and other environmental matters at several of ourcurrent or former facilities, or at third-party sites where we have been designated as a potentially responsibleparty (PRP). We accrue for environmental remediation and monitoring activities for which costs can bereasonably estimated and are probable. These estimates are based on an assessment of the site, available clean-upmethods, and prior experience in handling remediation. Recorded liabilities are discounted to present value(including an inflation factor in the estimate) only if we can reliably determine the amount and timing of futurecash payments. While we believe we are currently adequately accrued for known environmental issues, it ispossible that unexpected future costs could have a significant impact on our financial position, results ofoperations, and cash flows. Our total accruals for environmental remediation, dismantling, and decontaminationwere approximately $18 million at December 31, 2013 and $20 million at December 31, 2012.
Our more significant environmental sites include a former TEL plant site in Louisiana (the Louisiana site) and aformer Houston, Texas plant site (the Texas site). Together, the amounts accrued on a discounted basis related tothese sites represent approximately $11 million at December 31, 2013 and $12 million at December 31, 2012 ofthe total accrual above, using discount rates ranging from 3% to 9%. Of the total accrued for these two sites, theamount related to remediation of groundwater and soil was $5 million for the Louisiana site and $6 million forthe Texas site at December 31, 2013. The accrual for remediation of groundwater and soil at these two sites atDecember 31, 2012 was $6 million for the Louisiana site and $6 million for the Texas site. The aggregateundiscounted amount for these sites was $16 million at both December 31, 2013 and December 31, 2012.
We spent $19 million in 2013, $18 million in 2012, and $19 million in 2011 for ongoing environmental operatingand clean-up costs, excluding depreciation of previously capitalized expenditures.
In 2000, the EPA named us as a PRP under Superfund law for the clean-up of soil and groundwatercontamination at the five grouped disposal sites known as “Sauget Area 2 Sites” in Sauget, Illinois. Withoutadmitting any fact, responsibility, fault, or liability in connection with this site, we are participating with otherPRPs in site investigations and feasibility studies. The Sauget Area 2 Sites PRPs received notice of approvalfrom the EPA of the Remedial Investigation report on February 27, 2009, notice of approval of the October 2009Human Health Risk Assessment on December 17, 2009, and approval of the Feasibility Study report on April 3,2013. Finally, in December 2013, the EPA issued its Record of Decision confirming its remedies for the selectedSauget Area 2 sites. We have accrued our estimated proportional share of the remedial costs and expensesaddressed in the Record of Decision. We do not believe there is any additional information available as a basisfor revision of the liability that we have established at December 31, 2013. The amount accrued for this site is notmaterial.
Guarantees—We have agreements with several financial institutions that provide guarantees for certain businessactivities of our subsidiaries, including performance, insurance, credit, lease, and customs and excise guarantees.The parent company provides guarantees of the subsidiaries’ performance under these agreements and alsoprovides a guarantee for repayment of a line of credit for a subsidiary in China. Guarantees outstanding under allof these agreements at December 31, 2013 are $11 million. Certain of these guarantees are secured by letters of
62

Notes to Consolidated Financial Statements
credit, all of which were issued under the $100 million letter of credit sub-facility of our revolving credit facility.The maximum potential amount of future payments under all other guarantees not secured by letters of credit atDecember 31, 2013 is $24 million. Expiration dates of the letters of credit and certain guarantees range from2013 to 2024. Some of the guarantees have no expiration date. We renew letters of credit as necessary.
18. Pension Plans and Other Postretirement Benefits
NewMarket uses a December 31 measurement date for all of our plans.
U.S. Retirement Plans
NewMarket sponsors four pension plans for all full-time U.S. employees that offer a benefit based primarily onyears of service and compensation. Employees do not contribute to these pension plans. The plans are as follows:
• Salaried employees pension plan;
• Afton pension plan for union employees (the Sauget plan);
• Ethyl retirement income plan for union employees in Houston, Texas (the Houston plan); and
• Afton Chemical Additives pension plan for union employees in Port Arthur, Texas (the Port Arthurplan).
In addition, we offer an unfunded, nonqualified supplemental pension plan. This plan restores the pensionbenefits from our regular pension plans that would have been payable to designated participants if it were not forlimitations imposed by U.S. federal income tax regulations.
We also provide postretirement health care benefits and life insurance to eligible retired employees. NewMarketpays the premium for the insurance contract that holds plan assets for retiree life insurance benefits.
The components of net periodic pension and postretirement benefit costs, as well as other amounts recognized inother comprehensive income (loss), are shown below.
Years Ended December 31,
Pension Benefits Postretirement Benefits
(in thousands) 2013 2012 2011 2013 2012 2011
Net periodic benefit costService cost . . . . . . . . . . . . . . . . . . . . . . . . . . . . $ 11,087 $ 8,801 $ 7,055 $ 2,130 $ 1,885 $ 1,514Interest cost . . . . . . . . . . . . . . . . . . . . . . . . . . . . 9,571 9,583 9,079 2,598 3,052 3,158Expected return on plan assets . . . . . . . . . . . . . . (14,519) (13,264) (11,445) (1,452) (1,492) (1,595)Amortization of prior service cost . . . . . . . . . . . 176 210 306 9 9 8Amortization of actuarial net loss (gain) . . . . . . 7,080 5,329 3,203 (8) (66) (602)
Net periodic benefit cost . . . . . . . . . . . . . . . . . . 13,395 10,659 8,198 3,277 3,388 2,483
Other changes in plan assets and benefitobligations recognized in other comprehensiveincome (loss)
Actuarial net (gain) loss . . . . . . . . . . . . . . . . . . . (61,710) 25,509 37,484 (12,902) 2,442 5,072Prior service cost . . . . . . . . . . . . . . . . . . . . . . . . 972 0 0 0 0 0Amortization of actuarial net (loss) gain . . . . . . (7,080) (5,329) (3,203) 8 66 602Amortization of prior service cost . . . . . . . . . . . (176) (210) (306) (9) (9) (8)
Total recognized in other comprehensiveincome (loss) . . . . . . . . . . . . . . . . . . . . . . . . . (67,994) 19,970 33,975 (12,903) 2,499 5,666
Total recognized in net periodic benefit costand other comprehensive income (loss) . . . . $(54,599) $ 30,629 $ 42,173 $ (9,626) $ 5,887 $ 8,149
63

Notes to Consolidated Financial Statements
The estimated actuarial net loss to be amortized from accumulated other comprehensive loss into net periodicbenefit cost during 2014 is expected to be $4 million for pension plans. The estimated prior service cost to beamortized from accumulated other comprehensive loss into net periodic benefit cost during 2014 is expected tobe $100 thousand for pension plans. The amounts to be amortized from accumulated other comprehensive lossinto net periodic benefit cost during 2014 related to postretirement benefits are not material.
Changes in the plans’ benefit obligations and assets follow.
Years Ended December 31,
Pension Benefits Postretirement Benefits
(in thousands) 2013 2012 2013 2012
Change in benefit obligationBenefit obligation at beginning of year . . . . . . . . . . . . . . . . . . . . . . $234,752 $191,061 $ 68,097 $ 64,483Service cost . . . . . . . . . . . . . . . . . . . . . . . . . . . . . . . . . . . . . . . . . . . . 11,087 8,801 2,130 1,885Interest cost . . . . . . . . . . . . . . . . . . . . . . . . . . . . . . . . . . . . . . . . . . . . 9,571 9,583 2,598 3,052Actuarial net (gain) loss . . . . . . . . . . . . . . . . . . . . . . . . . . . . . . . . . . (28,433) 31,760 (12,964) 2,224Plan amendment . . . . . . . . . . . . . . . . . . . . . . . . . . . . . . . . . . . . . . . . 973 0 0 0Benefits paid . . . . . . . . . . . . . . . . . . . . . . . . . . . . . . . . . . . . . . . . . . . (7,180) (6,453) (3,335) (3,547)
Benefit obligation at end of year . . . . . . . . . . . . . . . . . . . . . . . . . . . 220,770 234,752 56,526 68,097
Change in plan assetsFair value of plan assets at beginning of year . . . . . . . . . . . . . . . . . 164,732 129,086 25,272 25,903Actual return on plan assets . . . . . . . . . . . . . . . . . . . . . . . . . . . . . . . 47,796 19,515 1,390 1,274Employer contributions . . . . . . . . . . . . . . . . . . . . . . . . . . . . . . . . . . 22,825 22,584 1,524 1,642Benefits paid . . . . . . . . . . . . . . . . . . . . . . . . . . . . . . . . . . . . . . . . . . . (7,180) (6,453) (3,335) (3,547)
Fair value of plan assets at end of year . . . . . . . . . . . . . . . . . . . . . . . 228,173 164,732 24,851 25,272
Funded status . . . . . . . . . . . . . . . . . . . . . . . . . . . . . . . . . . . . . . . . . . $ 7,403 $ (70,020) $(31,675) $(42,825)
Amounts recognized in the Consolidated Balance SheetsCurrent liabilities . . . . . . . . . . . . . . . . . . . . . . . . . . . . . . . . . . . . . . . $ (2,422) $ (2,442) $ (1,535) $ (1,900)Noncurrent assets . . . . . . . . . . . . . . . . . . . . . . . . . . . . . . . . . . . . . . . 39,368 0 0 0Noncurrent liabilities . . . . . . . . . . . . . . . . . . . . . . . . . . . . . . . . . . . . (29,543) (67,578) (30,140) (40,925)
$ 7,403 $ (70,020) $(31,675) $(42,825)
Amounts recognized in accumulated other comprehensive lossActuarial net loss (gain) . . . . . . . . . . . . . . . . . . . . . . . . . . . . . . . . . . $ 46,421 $115,211 $(16,232) $ (3,338)Prior service (credit) cost . . . . . . . . . . . . . . . . . . . . . . . . . . . . . . . . . (306) (1,102) 9 18
$ 46,115 $114,109 $(16,223) $ (3,320)
The accumulated benefit obligation for all domestic defined benefit pension plans was $188 million atDecember 31, 2013 and $195 million at December 31, 2012.
The fair market value of plan assets exceeded both the projected benefit obligation and the accumulated benefitobligation for all domestic plans, except the nonqualified plan, at December 31, 2013. The net asset position ofthese plans is included in prepaid pension cost on the Consolidated Balance Sheets at December 31, 2013
The projected benefit obligation exceeded the fair market value of plan assets for all domestic plans atDecember 31, 2012. The accumulated benefit obligation exceeded the fair market value of plan assets for alldomestic plans, except for the Salaried plan and the Houston plan, at December 31, 2012.
64

Notes to Consolidated Financial Statements
The net liability position of plans in which the projected benefit obligation exceeded assets is included in othernoncurrent liabilities on the Consolidated Balance Sheets.
A portion of the accrued benefit cost for the nonqualified plan is included in current liabilities at bothDecember 31, 2013 and December 31, 2012. As the nonqualified plan is unfunded, the amount reflected incurrent liabilities represents the expected benefit payments related to the nonqualified plan during 2014.
The first table below shows information on domestic pension plans with the accumulated benefit obligation inexcess of plan assets. The second table presents information on domestic pension plans with the projected benefitobligation in excess of plan assets.
December 31,
(in thousands) 2013 2012
Plans with the accumulated benefit obligation in excess of the fair market value ofplan assets
Projected benefit obligation . . . . . . . . . . . . . . . . . . . . . . . . . . . . . . . . . . . . . . . . . . . . . . $31,966 $ 67,123Accumulated benefit obligation . . . . . . . . . . . . . . . . . . . . . . . . . . . . . . . . . . . . . . . . . . . 29,805 63,831Fair market value of plan assets . . . . . . . . . . . . . . . . . . . . . . . . . . . . . . . . . . . . . . . . . . . 0 31,501
December 31,
(in thousands) 2013 2012
Plans with the projected benefit obligation in excess of the fair market value of planassets
Projected benefit obligation . . . . . . . . . . . . . . . . . . . . . . . . . . . . . . . . . . . . . . . . . . . . . . $31,966 $234,752Fair market value of plan assets . . . . . . . . . . . . . . . . . . . . . . . . . . . . . . . . . . . . . . . . . . . 0 164,732
There are no assets held in the nonqualified plan by the trustee for the retired beneficiaries of the nonqualifiedplan. Payments to retired beneficiaries of the nonqualified plan are made with cash from operations.
Assumptions—We used the following assumptions to calculate the results of our retirement plans:
Pension Benefits Postretirement Benefits
2013 2012 2011 2013 2012 2011
Weighted-average assumptions used to determine netperiodic benefit cost for years ended December 31,
Discount rate . . . . . . . . . . . . . . . . . . . . . . . . . . . . . . . . . . . . . 4.125% 5.000% 5.875% 4.125% 5.000% 5.875%Expected long-term rate of return on plan assets . . . . . . . . . 8.50% 9.00% 9.00% 6.00% 6.25% 6.25%Rate of projected compensation increase . . . . . . . . . . . . . . . 3.50% 3.50% 3.50%
Weighted-average assumptions used to determine benefitobligations at December 31,
Discount rate . . . . . . . . . . . . . . . . . . . . . . . . . . . . . . . . . . . . . 5.000% 4.125% 5.000% 5.000% 4.125% 5.000%Rate of projected compensation increase . . . . . . . . . . . . . . . 3.50% 3.50% 3.50%
For pension plans, we base the assumed expected long-term rate of return for plan assets on an analysis of ouractual investments, including our asset allocation, as well as an analysis of expected returns. This analysisreflects the expected long-term rates of return for each significant asset class and economic indicator. As ofJanuary 1, 2014, the expected rates were 8.8% for U.S. large cap stocks, 5.2% for fixed income, and 3.2% forinflation. The range of returns relies both on forecasts and on broad-market historical benchmarks for expectedreturn, correlation, and volatility for each asset class. Our asset allocation is predominantly weighted towardequities. Through our ongoing monitoring of our investments and review of market data, we have determined
65

Notes to Consolidated Financial Statements
that we should maintain the expected long-term rate of return for our U.S. plans at 8.5% at December 31, 2013.For the post-retirement plan, we based the assumed expected long-term rate of return for plan assets on anevaluation of projected interest rates, as well as the guaranteed interest rate for our insurance contract.
Assumed health care cost trend rates are shown in the table below. The expected health care cost trend rate for2013 was 7.5%.
December 31,
2013 2012
Health care cost trend rate assumed for next year . . . . . . . . . . . . . . . . . . . . . . . . . . . . . . 7.0% 7.5%Rate to which the cost trend rate is assumed to decline (the ultimate trend rate) . . . . . . 5.0% 5.0%Year that the rate reaches the ultimate trend rate . . . . . . . . . . . . . . . . . . . . . . . . . . . . . . 2018 2018
A one-percentage point change in the assumed health care cost trend rate would have the following effects:
(in thousands)1%
Increase1%
Decrease
Effect on accumulated postretirement benefit obligation as of December 31, 2013 . . . . . . . . . $7,429 $(5,854)Effect on net periodic postretirement benefit cost in 2013 . . . . . . . . . . . . . . . . . . . . . . . . . . . . . 860 (647)
The Patient Protection and Affordable Care Act (PPACA), as amended by the Health Care and EducationReconciliation Act of 2010, was signed into law in March 2010. The PPACA mandates health care reforms witheffective dates from 2010 to 2018, including an excise tax on high cost health care plans effective in 2018. Theadditional accumulated postretirement liability resulting from the PPACA is not material and has been includedin the benefit obligation for our postretirement plan at December 31, 2013 and December 31, 2012. Given thecomplexity of the PPACA and the extended time period during which implementation is currently expected tooccur, additional adjustments to the benefit obligation may be necessary.
Plan Assets—Pension plan assets are held and distributed by trusts and consist principally of common stock andinvestment-grade fixed income securities. We invest directly in common stocks, as well as in funds whichprimarily hold stock and debt securities. Our target allocation is 90% to 97% in equities and 3% to 10% in debtsecurities or cash.
The pension obligation is long-term in nature and the investment philosophy followed by the Pension InvestmentCommittee is likewise long-term in its approach. The majority of the pension funds are invested in equitysecurities as historically, equity securities have outperformed debt securities and cash investments, resulting in ahigher investment return over the long-term. While in the short-term, equity securities may underperform otherinvestment classes, we are less concerned with short-term results and more concerned with long-termimprovement. The pension funds are managed by six different investment companies who predominantly investin U.S. and international equities. Each investment company’s performance is reviewed quarterly. A smallportion of the funds is in investments, such as cash or short-term bonds, which historically has been lessvulnerable to short-term market swings. These funds are used to provide the cash needed to meet our monthlyobligations.
There are no significant concentrations of risk within plan assets, nor do the equity securities include anyNewMarket common stock for any year presented.
The assets of the postretirement benefit plan are invested completely in an insurance contract held byMetropolitan Life. No NewMarket common stock is included in these assets.
66
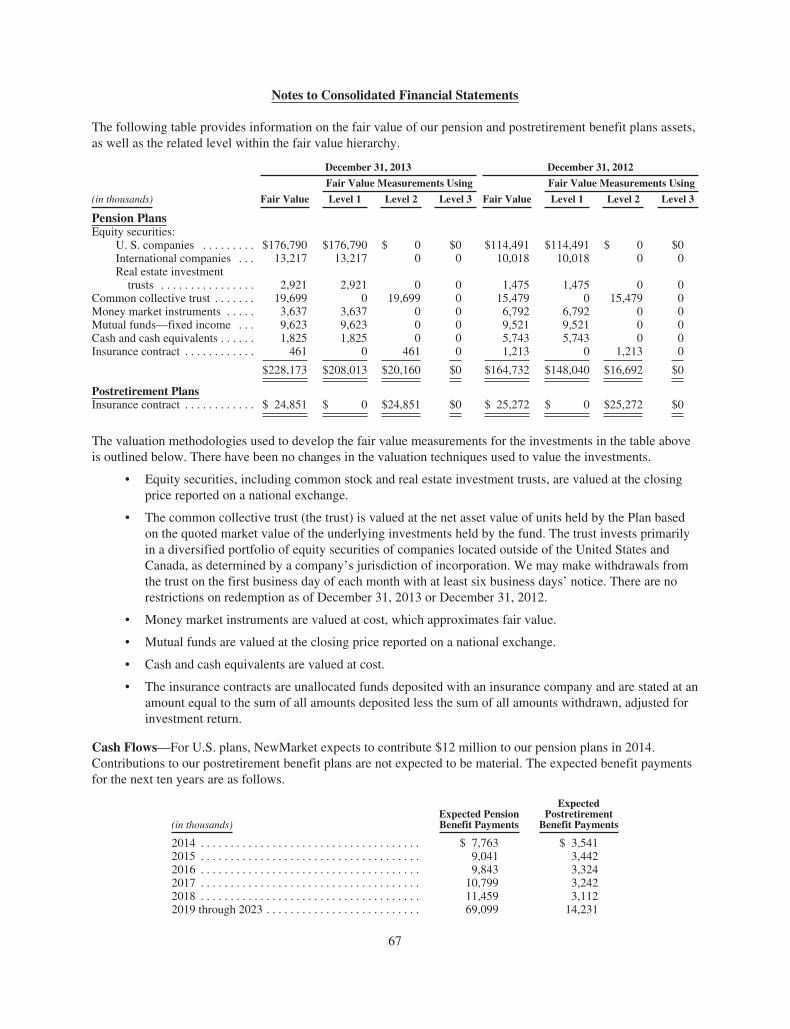
Notes to Consolidated Financial Statements
The following table provides information on the fair value of our pension and postretirement benefit plans assets,as well as the related level within the fair value hierarchy.
December 31, 2013 December 31, 2012
Fair Value Measurements Using Fair Value Measurements Using
(in thousands) Fair Value Level 1 Level 2 Level 3 Fair Value Level 1 Level 2 Level 3
Pension PlansEquity securities:
U. S. companies . . . . . . . . . $176,790 $176,790 $ 0 $0 $114,491 $114,491 $ 0 $0International companies . . . 13,217 13,217 0 0 10,018 10,018 0 0Real estate investment
trusts . . . . . . . . . . . . . . . . 2,921 2,921 0 0 1,475 1,475 0 0Common collective trust . . . . . . . 19,699 0 19,699 0 15,479 0 15,479 0Money market instruments . . . . . 3,637 3,637 0 0 6,792 6,792 0 0Mutual funds—fixed income . . . 9,623 9,623 0 0 9,521 9,521 0 0Cash and cash equivalents . . . . . . 1,825 1,825 0 0 5,743 5,743 0 0Insurance contract . . . . . . . . . . . . 461 0 461 0 1,213 0 1,213 0
$228,173 $208,013 $20,160 $0 $164,732 $148,040 $16,692 $0
Postretirement PlansInsurance contract . . . . . . . . . . . . $ 24,851 $ 0 $24,851 $0 $ 25,272 $ 0 $25,272 $0
The valuation methodologies used to develop the fair value measurements for the investments in the table aboveis outlined below. There have been no changes in the valuation techniques used to value the investments.
• Equity securities, including common stock and real estate investment trusts, are valued at the closingprice reported on a national exchange.
• The common collective trust (the trust) is valued at the net asset value of units held by the Plan basedon the quoted market value of the underlying investments held by the fund. The trust invests primarilyin a diversified portfolio of equity securities of companies located outside of the United States andCanada, as determined by a company’s jurisdiction of incorporation. We may make withdrawals fromthe trust on the first business day of each month with at least six business days’ notice. There are norestrictions on redemption as of December 31, 2013 or December 31, 2012.
• Money market instruments are valued at cost, which approximates fair value.
• Mutual funds are valued at the closing price reported on a national exchange.
• Cash and cash equivalents are valued at cost.
• The insurance contracts are unallocated funds deposited with an insurance company and are stated at anamount equal to the sum of all amounts deposited less the sum of all amounts withdrawn, adjusted forinvestment return.
Cash Flows—For U.S. plans, NewMarket expects to contribute $12 million to our pension plans in 2014.Contributions to our postretirement benefit plans are not expected to be material. The expected benefit paymentsfor the next ten years are as follows.
(in thousands)Expected PensionBenefit Payments
ExpectedPostretirement
Benefit Payments
2014 . . . . . . . . . . . . . . . . . . . . . . . . . . . . . . . . . . . . . $ 7,763 $ 3,5412015 . . . . . . . . . . . . . . . . . . . . . . . . . . . . . . . . . . . . . 9,041 3,4422016 . . . . . . . . . . . . . . . . . . . . . . . . . . . . . . . . . . . . . 9,843 3,3242017 . . . . . . . . . . . . . . . . . . . . . . . . . . . . . . . . . . . . . 10,799 3,2422018 . . . . . . . . . . . . . . . . . . . . . . . . . . . . . . . . . . . . . 11,459 3,1122019 through 2023 . . . . . . . . . . . . . . . . . . . . . . . . . . 69,099 14,231
67
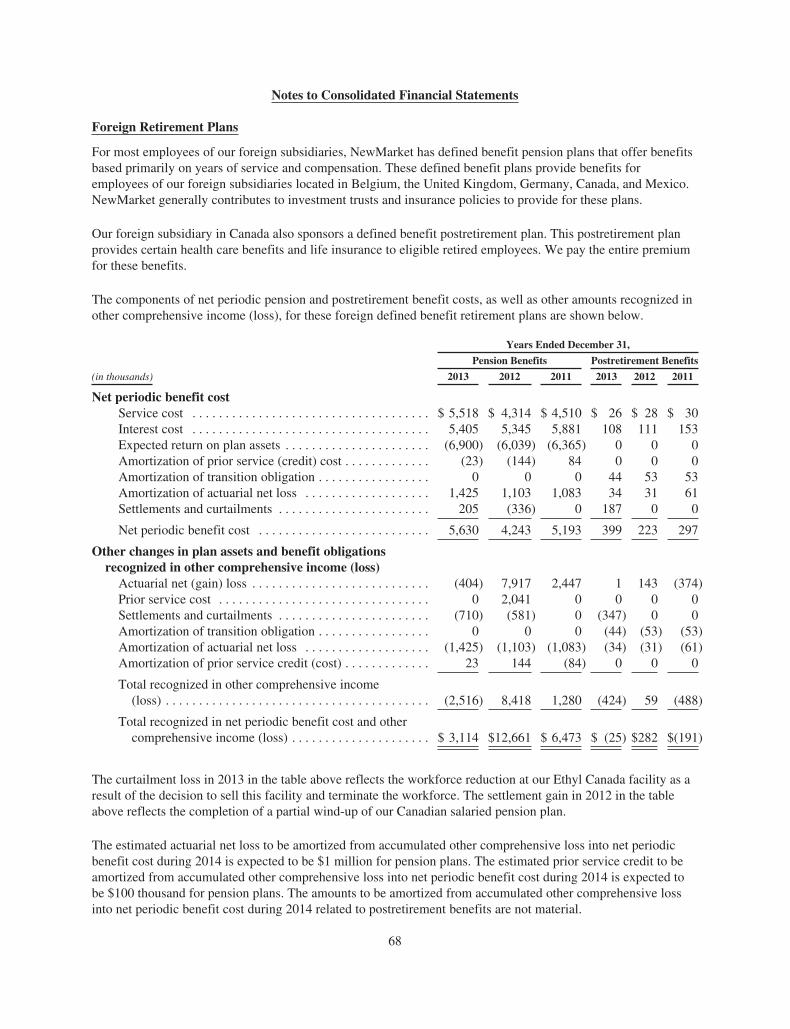
Notes to Consolidated Financial Statements
Foreign Retirement Plans
For most employees of our foreign subsidiaries, NewMarket has defined benefit pension plans that offer benefitsbased primarily on years of service and compensation. These defined benefit plans provide benefits foremployees of our foreign subsidiaries located in Belgium, the United Kingdom, Germany, Canada, and Mexico.NewMarket generally contributes to investment trusts and insurance policies to provide for these plans.
Our foreign subsidiary in Canada also sponsors a defined benefit postretirement plan. This postretirement planprovides certain health care benefits and life insurance to eligible retired employees. We pay the entire premiumfor these benefits.
The components of net periodic pension and postretirement benefit costs, as well as other amounts recognized inother comprehensive income (loss), for these foreign defined benefit retirement plans are shown below.
Years Ended December 31,
Pension Benefits Postretirement Benefits
(in thousands) 2013 2012 2011 2013 2012 2011
Net periodic benefit costService cost . . . . . . . . . . . . . . . . . . . . . . . . . . . . . . . . . . . . $ 5,518 $ 4,314 $ 4,510 $ 26 $ 28 $ 30Interest cost . . . . . . . . . . . . . . . . . . . . . . . . . . . . . . . . . . . . 5,405 5,345 5,881 108 111 153Expected return on plan assets . . . . . . . . . . . . . . . . . . . . . . (6,900) (6,039) (6,365) 0 0 0Amortization of prior service (credit) cost . . . . . . . . . . . . . (23) (144) 84 0 0 0Amortization of transition obligation . . . . . . . . . . . . . . . . . 0 0 0 44 53 53Amortization of actuarial net loss . . . . . . . . . . . . . . . . . . . 1,425 1,103 1,083 34 31 61Settlements and curtailments . . . . . . . . . . . . . . . . . . . . . . . 205 (336) 0 187 0 0
Net periodic benefit cost . . . . . . . . . . . . . . . . . . . . . . . . . . 5,630 4,243 5,193 399 223 297
Other changes in plan assets and benefit obligationsrecognized in other comprehensive income (loss)
Actuarial net (gain) loss . . . . . . . . . . . . . . . . . . . . . . . . . . . (404) 7,917 2,447 1 143 (374)Prior service cost . . . . . . . . . . . . . . . . . . . . . . . . . . . . . . . . 0 2,041 0 0 0 0Settlements and curtailments . . . . . . . . . . . . . . . . . . . . . . . (710) (581) 0 (347) 0 0Amortization of transition obligation . . . . . . . . . . . . . . . . . 0 0 0 (44) (53) (53)Amortization of actuarial net loss . . . . . . . . . . . . . . . . . . . (1,425) (1,103) (1,083) (34) (31) (61)Amortization of prior service credit (cost) . . . . . . . . . . . . . 23 144 (84) 0 0 0
Total recognized in other comprehensive income(loss) . . . . . . . . . . . . . . . . . . . . . . . . . . . . . . . . . . . . . . . . (2,516) 8,418 1,280 (424) 59 (488)
Total recognized in net periodic benefit cost and othercomprehensive income (loss) . . . . . . . . . . . . . . . . . . . . . $ 3,114 $12,661 $ 6,473 $ (25) $282 $(191)
The curtailment loss in 2013 in the table above reflects the workforce reduction at our Ethyl Canada facility as aresult of the decision to sell this facility and terminate the workforce. The settlement gain in 2012 in the tableabove reflects the completion of a partial wind-up of our Canadian salaried pension plan.
The estimated actuarial net loss to be amortized from accumulated other comprehensive loss into net periodicbenefit cost during 2014 is expected to be $1 million for pension plans. The estimated prior service credit to beamortized from accumulated other comprehensive loss into net periodic benefit cost during 2014 is expected tobe $100 thousand for pension plans. The amounts to be amortized from accumulated other comprehensive lossinto net periodic benefit cost during 2014 related to postretirement benefits are not material.
68

Notes to Consolidated Financial Statements
Changes in the benefit obligations and assets of the foreign defined benefit plans follow.
Years Ended December 31,
Pension Benefits Postretirement Benefits
(in thousands) 2013 2012 2013 2012
Change in benefit obligationBenefit obligation at beginning of year . . . . . . . . . . . . . . . . . . . $135,498 $112,656 $ 2,743 $ 2,596Service cost . . . . . . . . . . . . . . . . . . . . . . . . . . . . . . . . . . . . . . . . . 5,518 4,314 26 28Interest cost . . . . . . . . . . . . . . . . . . . . . . . . . . . . . . . . . . . . . . . . . 5,405 5,345 108 111Plan amendments . . . . . . . . . . . . . . . . . . . . . . . . . . . . . . . . . . . . 0 2,014 0 0Employee contributions . . . . . . . . . . . . . . . . . . . . . . . . . . . . . . . 780 687 0 0Actuarial net loss . . . . . . . . . . . . . . . . . . . . . . . . . . . . . . . . . . . . . 5,256 11,572 1 142Benefits paid . . . . . . . . . . . . . . . . . . . . . . . . . . . . . . . . . . . . . . . . (5,512) (5,225) (216) (203)Settlement and curtailment gains . . . . . . . . . . . . . . . . . . . . . . . . (509) (910) (164) 0Foreign currency translation . . . . . . . . . . . . . . . . . . . . . . . . . . . . 3,247 5,045 (177) 69
Benefit obligation at end of year . . . . . . . . . . . . . . . . . . . . . . . . . 149,683 135,498 2,321 2,743
Change in plan assetsFair value of plan assets at beginning of year . . . . . . . . . . . . . . . 126,392 108,177 0 0Actual return on plan assets . . . . . . . . . . . . . . . . . . . . . . . . . . . . 12,680 9,714 0 0Employer contributions . . . . . . . . . . . . . . . . . . . . . . . . . . . . . . . . 7,871 7,957 216 203Employee contributions . . . . . . . . . . . . . . . . . . . . . . . . . . . . . . . 780 687 0 0Benefits paid . . . . . . . . . . . . . . . . . . . . . . . . . . . . . . . . . . . . . . . . (5,512) (5,225) (216) (203)Foreign currency translation . . . . . . . . . . . . . . . . . . . . . . . . . . . . 2,572 5,082 0 0
Fair value of plan assets at end of year . . . . . . . . . . . . . . . . . . . . 144,783 126,392 0 0
Funded status . . . . . . . . . . . . . . . . . . . . . . . . . . . . . . . . . . . . . . . $ (4,900) $ (9,106) $(2,321) $(2,743)
Amounts recognized in the Consolidated Balance SheetsNoncurrent assets . . . . . . . . . . . . . . . . . . . . . . . . . . . . . . . . . . . . $ 15,719 $ 12,710 $ 0 $ 0Current liabilities . . . . . . . . . . . . . . . . . . . . . . . . . . . . . . . . . . . . (418) (394) (150) (149)Noncurrent liabilities . . . . . . . . . . . . . . . . . . . . . . . . . . . . . . . . . (20,201) (21,422) (2,171) (2,594)
$ (4,900) $ (9,106) $(2,321) $(2,743)
Amounts recognized in accumulated other comprehensiveloss
Actuarial net loss . . . . . . . . . . . . . . . . . . . . . . . . . . . . . . . . . . . . . $ 36,820 $ 39,156 $ 433 $ 627Prior service credit . . . . . . . . . . . . . . . . . . . . . . . . . . . . . . . . . . . (241) (61) 0 0Transition obligation . . . . . . . . . . . . . . . . . . . . . . . . . . . . . . . . . . 10 10 2 232
$ 36,589 $ 39,105 $ 435 $ 859
The accumulated benefit obligation for all foreign defined benefit pension plans was $134 million atDecember 31, 2013 and $118 million at December 31, 2012.
The fair market value of plan assets exceeded both the accumulated benefit obligation and projected benefitobligation for the United Kingdom, Canadian Hourly, and the Canadian Salary plans at year-end 2013. The netasset position of the United Kingdom, Canadian Hourly, and Canadian Salary plans are included in prepaidpension cost on the Consolidated Balance Sheets at December 31, 2013. The accumulated benefit obligation andprojected benefit obligation exceeded the fair market value of plan assets for the German, Belgian, and Mexicanplans at December 31, 2013. The accrued benefit cost of these plans is included in other noncurrent liabilities onthe Consolidated Balance Sheets. As the German plan is unfunded, a portion of the accrued benefit cost for theGerman plan is included in current liabilities at year-end 2013 reflecting the expected benefit payments related tothe plan for the following year.
69

Notes to Consolidated Financial Statements
The fair market value of plan assets exceeded both the accumulated benefit obligation and projected benefitobligation for the United Kingdom and the Canadian Salary plans at year-end 2012. The net asset position of theUnited Kingdom plan and Canadian Salary plans are included in prepaid pension cost on the ConsolidatedBalance Sheets at December 31, 2012. The accumulated benefit obligation and projected benefit obligationexceeded the fair market value of plan assets for the German, Belgian, Canadian Hourly, and Mexican plans atDecember 31, 2012. The accrued benefit cost of these plans is included in other noncurrent liabilities on theConsolidated Balance Sheets. As the German plan is unfunded, a portion of the accrued benefit cost for theGerman plan is included in current liabilities at year-end 2012 reflecting the expected benefit payments related tothe plan for the following year.
The first table below shows information on foreign plans with the accumulated benefit obligation in excess ofplan assets. The second table shows information on plans with the projected benefit obligation in excess of planassets.
December 31,
(in thousands) 2013 2012
Plans with the accumulated benefit obligation in excess of the fair market value of planassets
Projected benefit obligation . . . . . . . . . . . . . . . . . . . . . . . . . . . . . . . . . . . . . . . . . . . . . . . . . . . $31,827 $35,983Accumulated benefit obligation . . . . . . . . . . . . . . . . . . . . . . . . . . . . . . . . . . . . . . . . . . . . . . . . 22,031 25,322Fair market value of plan assets . . . . . . . . . . . . . . . . . . . . . . . . . . . . . . . . . . . . . . . . . . . . . . . . 11,208 14,167
December 31,
(in thousands) 2013 2012
Plans with the projected benefit obligation in excess of the fair market value of plan assetsProjected benefit obligation . . . . . . . . . . . . . . . . . . . . . . . . . . . . . . . . . . . . . . . . . . . . . . . . . . . $31,827 $35,983Fair market value of plan assets . . . . . . . . . . . . . . . . . . . . . . . . . . . . . . . . . . . . . . . . . . . . . . . . 11,208 14,167
Assumptions—The information in the table below provides the weighted-average assumptions used to calculatethe results of our foreign defined benefit plans.
Pension Benefits Postretirement Benefits
2013 2012 2011 2013 2012 2011
Weighted-average assumptions used to determine net periodicbenefit cost for the years ended December 31,
Discount rate . . . . . . . . . . . . . . . . . . . . . . . . . . . . . . . . . . . . . . 4.03% 4.65% 5.16% 4.00% 4.25% 5.00%Expected long-term rate of return on plan assets . . . . . . . . . . . 5.56% 5.46% 5.92%Rate of projected compensation increase . . . . . . . . . . . . . . . . . 4.26% 4.24% 4.63%
Weighted-average assumptions used to determine benefitobligations at December 31,
Discount rate . . . . . . . . . . . . . . . . . . . . . . . . . . . . . . . . . . . . . . 4.01% 4.03% 4.65% 4.50% 4.00% 4.25%Rate of projected compensation increase . . . . . . . . . . . . . . . . . 4.25% 4.26% 4.24%
The actuarial assumptions used by the various foreign locations are based upon the circumstances of eachparticular country and pension plan. The factors impacting the determination of the long-term rate of return for aparticular foreign pension plan include the market conditions within a particular country, as well as theinvestment strategy and asset allocation of the specific plan.
70

Notes to Consolidated Financial Statements
Assumed health care cost trend rates are shown in the table below.
December 31,
2013 2012
Health care cost trend rate assumed for next year . . . . . . . . . . . . . . . . . . . . . . . . . . . . . . 5.0% 5.0%Rate to which the cost trend rate is assumed to decline (the ultimate trend rate) . . . . . . 5.0% 5.0%Year that the rate reached the ultimate trend rate . . . . . . . . . . . . . . . . . . . . . . . . . . . . . . 2012 2012
A one-percentage point change in the assumed health care cost trend rate would have the following effects:
(in thousands)1%
Increase1%
Decrease
Effect on accumulated postretirement benefit obligation as of December 31, 2013 . . . . . . . . . $171 $(138)Effect on net periodic postretirement benefit cost in 2013 . . . . . . . . . . . . . . . . . . . . . . . . . . . . . 17 (13)
Plan Assets—Pension plan assets vary by foreign location and plan. Assets are held and distributed by trusts and,depending upon the foreign location and plan, consist primarily of equity securities, corporate and governmentdebt securities, cash, and insurance contracts. The combined weighted-average target allocation of our foreignpension plans is 54% in equities, 34% in debt securities, 8% in insurance contracts, and 4% in a pooledinvestment property fund.
While the pension obligation is long-term in nature for each of our foreign plans, the investment strategiesfollowed by each plan vary to some degree based upon the laws of a particular country, as well as the provisionsof the specific pension trust. The United Kingdom and Canadian plans are invested predominantly in equitysecurities and debt securities. The funds of these plans are managed by various trustees and investmentcompanies whose performance is reviewed throughout the year. The Belgian plan is invested in an insurancecontract. The Mexican plan is invested in various mutual funds. The German plan has no assets.
There are no significant concentrations of risk within plan assets, nor do the equity securities include anyNewMarket common stock for any year presented. The benefits of the Canadian postretirement benefit plan arepaid through an insurance contract.
71

Notes to Consolidated Financial Statements
The following table provides information on the fair value of our foreign pension plans assets, as well as therelated level within the fair value hierarchy.
December 31, 2013 December 31, 2012
Fair Value Measurements Using Fair Value Measurements Using
(in thousands) Fair Value Level 1 Level 2 Level 3 Fair Value Level 1 Level 2 Level 3
Pension PlansEquity securities:
U.S. companies . . . . . . . $ 9,068 $ 9,068 $ 0 $0 $ 6,927 $ 6,927 $ 0 $0International
companies . . . . . . . . . 58,571 58,571 0 0 48,244 48,244 0 0Debt securities—corporate . . 40,525 40,525 0 0 37,266 37,266 0 0Debt
securities—government . . . 4,498 4,498 0 0 4,338 4,338 0 0Mutual funds . . . . . . . . . . . . . 95 95 0 0 52 52 0 0Cash and cash equivalents . . . 445 445 0 0 559 559 0 0Pooled investment funds:
Equity securities—U.S.companies . . . . . . . . . 1,243 0 1,243 0 888 0 888 0
Equity securities—internationalcompanies . . . . . . . . . 11,692 0 11,692 0 10,908 0 10,908 0
Debt securities—corporate . . . . . . . . . . 932 0 932 0 693 0 693 0
Debt securities—government . . . . . . . . 1,057 0 1,057 0 901 0 901 0
Cash and cashequivalents . . . . . . . . . 619 0 619 0 482 0 482 0
Property . . . . . . . . . . . . . 4,925 0 4,925 0 4,409 0 4,409 0Insurance contract . . . . . . . . . 11,113 0 11,113 0 10,725 0 10,725 0
$144,783 $113,202 $31,581 $0 $126,392 $97,386 $29,006 $0
The valuation methodologies used to develop the fair value measurements for the investments in the table aboveare outlined below. There have been no changes in the valuation techniques used to value the investments.
• Equity securities are valued at the closing price reported on a national exchange.
• Corporate and government debt securities are composed of bond funds that are priced daily.
• Mutual funds are valued at the closing price reported on a national exchange.
• Cash and cash equivalents are valued at cost.
• The pooled investment funds are priced daily. The underlying assets that are invested in equitysecurities, as well as corporate and government debt securities, are listed on a recognized exchange.The underlying assets that are invested in property are valued monthly by an independent propertymanagement firm.
• The insurance contracts are funds deposited with an insurance company and are stated at an amountequal to the sum of all amounts deposited less the sum of all amounts withdrawn, adjusted forinvestment return.
72

Notes to Consolidated Financial Statements
Cash Flows—For foreign pension plans, NewMarket expects to contribute $7 million to the plans in 2014.Contributions to our postretirement benefit plans are not expected to be material. The expected benefit paymentsfor the next ten years for our foreign pension plans are shown in the table below. The expected benefit paymentsfor the next ten years for our foreign postretirement benefit plans are not expected to be material.
(in thousands)Expected PensionBenefit Payments
2014 . . . . . . . . . . . . . . . . . . . . . . . . . . . . . . . . . . . . . . . . $ 4,6142015 . . . . . . . . . . . . . . . . . . . . . . . . . . . . . . . . . . . . . . . . 4,9992016 . . . . . . . . . . . . . . . . . . . . . . . . . . . . . . . . . . . . . . . . 4,1382017 . . . . . . . . . . . . . . . . . . . . . . . . . . . . . . . . . . . . . . . . 5,2212018 . . . . . . . . . . . . . . . . . . . . . . . . . . . . . . . . . . . . . . . . 4,8742019 through 2023 . . . . . . . . . . . . . . . . . . . . . . . . . . . . 27,761
19. Other Income (Expense), Net
Other income (expense), net was income of $7 million in 2013, expense of $3 million in 2012, and expense of$18 million in 2011, primarily representing a gain in 2013 and a loss in 2012 and 2011 on the Goldman Sachsinterest rate swap derivative instrument recorded at fair value. See Note 15 for additional information on theinterest rate swap. In 2012, the loss was partially offset by a gain related to the sale of common stock that wasreceived in 2011 as part of a legal settlement with Innospec, which is discussed further in Note 22.
20. Income Tax Expense
Our income from continuing operations before income tax expense is shown in the table below.
Years Ended December 31,
(in thousands) 2013 2012 2011
Income from continuing operations before income tax expenseDomestic . . . . . . . . . . . . . . . . . . . . . . . . . . . . . . . . . . . . . . . . . . . . . . . . . . . $236,114 $227,172 $195,780Foreign . . . . . . . . . . . . . . . . . . . . . . . . . . . . . . . . . . . . . . . . . . . . . . . . . . . . 105,197 110,396 105,564
$341,311 $337,568 $301,344
Our provision for income tax expense from continuing operations is shown in the table below.
Years Ended December 31,
(in thousands) 2013 2012 2011
Income tax expense from continuing operationsCurrent income taxes
Federal . . . . . . . . . . . . . . . . . . . . . . . . . . . . . . . . . . . . . . . $62,547 $ 69,152 $55,397State . . . . . . . . . . . . . . . . . . . . . . . . . . . . . . . . . . . . . . . . . 8,782 8,301 9,903Foreign . . . . . . . . . . . . . . . . . . . . . . . . . . . . . . . . . . . . . . . 22,016 26,300 28,530
93,345 103,753 93,830
Deferred income taxesFederal . . . . . . . . . . . . . . . . . . . . . . . . . . . . . . . . . . . . . . . 3,374 (3,339) 1,111State . . . . . . . . . . . . . . . . . . . . . . . . . . . . . . . . . . . . . . . . . 771 (428) 181Foreign . . . . . . . . . . . . . . . . . . . . . . . . . . . . . . . . . . . . . . . 1,474 310 765
5,619 (3,457) 2,057
Total income tax expense from continuing operations . . . . . . . . $98,964 $100,296 $95,887
73

Notes to Consolidated Financial Statements
The reconciliation of the U.S. federal statutory rate to the effective income tax rate follows:
% of IncomeBefore Income Tax Expense
2013 2012 2011
Federal statutory rate . . . . . . . . . . . . . . . . . . . . . . . . . . . . . . . . . . . . 35.0% 35.0% 35.0%State taxes, net of federal tax . . . . . . . . . . . . . . . . . . . . . . . . . . . . . . 1.8 1.5 1.8Foreign operations . . . . . . . . . . . . . . . . . . . . . . . . . . . . . . . . . . . . . . (3.6) (2.4) (2.0)Employee savings plan . . . . . . . . . . . . . . . . . . . . . . . . . . . . . . . . . . . (0.2) (1.9) (0.2)Research tax credit . . . . . . . . . . . . . . . . . . . . . . . . . . . . . . . . . . . . . . (2.1) 0.0 (0.7)Domestic manufacturing tax benefit . . . . . . . . . . . . . . . . . . . . . . . . . (2.5) (2.1) (2.4)Other items and adjustments . . . . . . . . . . . . . . . . . . . . . . . . . . . . . . . 0.6 (0.4) 0.3
Effective income tax rate . . . . . . . . . . . . . . . . . . . . . . . . . . . . . . . . . 29.0% 29.7% 31.8%
The 2013 effective rate includes the effect of the R&D tax credit for 2013 as well as all of 2012, as the legislationto extend such tax credits was retroactively signed into law in January 2013. A benefit from the R&D tax credit isalso included in 2011. Certain foreign operations have a U.S. tax impact due to our election to include theirearnings in our federal income tax return.
Our deferred income tax assets and liabilities follow.
December 31,
(in thousands) 2013 2012
Deferred income tax assetsFuture employee benefits . . . . . . . . . . . . . . . . . . . . . . . . . . . . . . . $20,618 $56,643Environmental and future shutdown reserves . . . . . . . . . . . . . . . . 6,412 6,981Loss on derivatives . . . . . . . . . . . . . . . . . . . . . . . . . . . . . . . . . . . . 8,251 14,305Trademark expenses . . . . . . . . . . . . . . . . . . . . . . . . . . . . . . . . . . . 5,404 5,152Foreign currency translation adjustments . . . . . . . . . . . . . . . . . . . 4,883 4,383Other . . . . . . . . . . . . . . . . . . . . . . . . . . . . . . . . . . . . . . . . . . . . . . . 5,672 7,589
51,240 95,053
Deferred income tax liabilitiesDepreciation and amortization . . . . . . . . . . . . . . . . . . . . . . . . . . . 19,135 25,623Intangibles . . . . . . . . . . . . . . . . . . . . . . . . . . . . . . . . . . . . . . . . . . . 1,085 3,029Undistributed earnings of foreign subsidiaries . . . . . . . . . . . . . . . 1,875 3,851Other . . . . . . . . . . . . . . . . . . . . . . . . . . . . . . . . . . . . . . . . . . . . . . . 4,400 5,713
26,495 38,216
Net deferred income tax assets . . . . . . . . . . . . . . . . . . . . . . . . . . . . . . . $24,745 $56,837
Reconciliation to financial statementsDeferred income tax assets—current . . . . . . . . . . . . . . . . . . . . . . $ 8,267 $ 8,452Deferred income tax assets—noncurrent . . . . . . . . . . . . . . . . . . . 22,961 55,123Deferred income tax liabilities—noncurrent . . . . . . . . . . . . . . . . . 6,483 6,738
Net deferred income tax assets . . . . . . . . . . . . . . . . . . . . . . . . . . . . . . . $24,745 $56,837
Deferred income tax liabilities—noncurrent is included in other noncurrent liabilities on our ConsolidatedBalance Sheets. Our deferred taxes are in a net asset position at December 31, 2013. Based on current forecastoperating plans and historical profitability, we believe that we will recover nearly the full benefit of our deferredtax assets. We have recorded an immaterial valuation allowance at certain foreign subsidiaries.
74

Notes to Consolidated Financial Statements
The balance of unrecognized tax benefits totaled approximately $3 million at December 31, 2013 and $2 millionat December 31, 2012. The balance at December 31, 2011, and the additions and decreases in all periodspresented, were not material. At December 31, 2013, $3 million of this amount if recognized, would affect oureffective tax rate.
We recognize accrued interest and penalties associated with uncertain tax positions as part of income tax expenseon our Consolidated Statements of Income. We expect the amount of unrecognized tax benefits to change in thenext twelve months; however, we do not expect the change to have a material impact on our financial statements.
Our U.S. subsidiaries file a U.S. federal consolidated income tax return. We are currently under examination bythe Internal Revenue Service for 2011 and by various U.S. state and foreign jurisdictions. We are no longersubject to U.S. federal income tax examinations for years before 2010. Foreign and U.S. state jurisdictions havestatutes of limitations generally ranging from three to five years. Years still open to examination by foreign taxauthorities in major jurisdictions include: the United Kingdom (2010 and forward); Singapore (2006 andforward); Japan (2009 and forward); Belgium (2011 and forward); Canada (2006 and forward); and Brazil (2009and forward).
21. Other Comprehensive Income (Loss) and Accumulated Other Comprehensive Loss
The balances of, and changes in, the components of accumulated other comprehensive loss, net of tax, consist ofthe following:
(in thousands)
Pension Plansand Other
PostretirementBenefits
DerivativeInstruments
ForeignCurrency
TranslationAdjustments
MarketableSecurities
AccumulatedOther
ComprehensiveIncome (Loss)
Balance at December 31, 2010 . . . . . . . . . . $(51,562) $(4,151) $(18,107) $ 0 $ (73,820)Other comprehensive income (loss) before
reclassifications . . . . . . . . . . . . . . . . . . . . (27,577) (1,605) 163 364 (28,655)Amounts reclassified from accumulated
other comprehensive loss . . . . . . . . . . . . 2,723 1,020 0 0 3,743
Other comprehensive income (loss) . . . . . . (24,854) (585) 163 364 (24,912)
Balance at December 31, 2011 . . . . . . . . . . (76,416) (4,736) (17,944) 364 (98,732)Other comprehensive income (loss) before
reclassifications . . . . . . . . . . . . . . . . . . . . (24,291) (330) 7,567 676 (16,378)Amounts reclassified from accumulated
other comprehensive loss . . . . . . . . . . . . 4,568 893 0 (1,040) 4,421
Other comprehensive income (loss) . . . . . . (19,723) 563 7,567 (364) (11,957)
Balance at December 31, 2012 . . . . . . . . . . (96,139) (4,173) (10,377) 0 (110,689)Other comprehensive income (loss) before
reclassifications . . . . . . . . . . . . . . . . . . . . 45,327 0 (5,216) 0 40,111Amounts reclassified from accumulated
other comprehensive loss . . . . . . . . . . . . 6,319 4,173 0 0 10,492
Other comprehensive income (loss) . . . . . . 51,646 4,173 (5,216) 0 50,603
Balance at December 31, 2013 . . . . . . . . . . $(44,493) $ 0 $(15,593) $ 0 $ (60,086)
75

Notes to Consolidated Financial Statements
The following table illustrates the amounts, net of tax, reclassified out of each component of accumulated othercomprehensive loss and their location within the respective line items on the Consolidated Statements of Income.
(in thousands)
Amount Reclassified fromAccumulated OtherComprehensive Loss
Accumulated Other Comprehensive Loss Component
Years Ended December 31, Affected Line Item on theConsolidated Statements of
Income2013 2012 2011
Pension plans and other postretirement benefits:Amortization of prior service cost . . . . . . . . . . . $ 97 $ 27 $ 260(a)Amortization of actuarial net loss . . . . . . . . . . . 5,404 4,066 2,423(a)Settlements and curtailments . . . . . . . . . . . . . . . 785 436 0(a)Amortization of transition obligation . . . . . . . . 33 39 40(a)
Total pension plans and otherpostretirement benefits . . . . . . . . . . . . . 6,319 4,568 2,723
Derivative instruments:
Amortization of mortgage loan interest rateswap . . . . . . . . . . . . . . . . . . . . . . . . . . . . . . . . 1,666 841 968
Income from operations ofdiscontinued business, netof tax
Amortization of construction loan interest rateswap . . . . . . . . . . . . . . . . . . . . . . . . . . . . . . . . 2,507 52 52 Discontinued operations
Total derivative instruments . . . . . . . . . . . 4,173 893 1,020
Marketable securities . . . . . . . . . . . . . . . . . . . . . . . . . 0 (1,040) 0 Other income (expense), net
Total reclassifications for the period . . . . . . . . . . . $10,492 $ 4,421 $3,743
(a) These components of accumulated other comprehensive loss are included in the computation of net periodicbenefit cost. See Note 18 for further information.
In 2013, $2.5 million of the amount reported in the table above for the amortization of construction loan interestrate swap is a component of gain on sale of discontinued business, net of tax. The remaining amounts related toderivative instruments for all periods are components of income from operations of discontinued business, net oftax.
22. Segment and Geographic Area Information
Segment Information—The tables below show our consolidated segment results. The “All other” categoryincludes the operations of the TEL business, as well as certain contract manufacturing performed by Ethyl.
The accounting policies of the segments are the same as those described in Note 1. We evaluate the performanceof the petroleum additives business based on segment operating profit. NewMarket Services departments andother expenses are billed to Afton and Ethyl based on the services provided under the holding company structure.Depreciation on segment property, plant, and equipment, as well as amortization of segment intangible assets, areincluded in segment operating profit. No transfers occurred between the petroleum additives segment and the“All other” category during the periods presented. The table below reports revenue and operating profit bysegment, as well as a reconciliation to income from continuing operations before income tax expense, for the lastthree years.
76

Notes to Consolidated Financial Statements
Years Ended December 31,
(in thousands) 2013 2012 2011
Consolidated revenuePetroleum additives
Lubricant additives . . . . . . . . . . . . . . . . . . . . . . . . . . . . . . . . . . . . . . . . $1,829,681 $1,750,107 $1,684,561Fuel additives . . . . . . . . . . . . . . . . . . . . . . . . . . . . . . . . . . . . . . . . . . . . 441,578 450,673 441,883
Total . . . . . . . . . . . . . . . . . . . . . . . . . . . . . . . . . . . . . . . . . . . . . . . 2,271,259 2,200,780 2,126,444All other . . . . . . . . . . . . . . . . . . . . . . . . . . . . . . . . . . . . . . . . . . . . . . . . . . . . 9,096 11,098 11,683
Consolidated revenue (a) . . . . . . . . . . . . . . . . . . . . . . . . . . . . . . . $2,280,355 $2,211,878 $2,138,127
Segment operating profitPetroleum additives:
Petroleum additives before gain on legal settlement, net . . . . . . . . . . . $ 375,291 $ 371,964 $ 309,626Gain on legal settlement, net (b) . . . . . . . . . . . . . . . . . . . . . . . . . . . . . . 0 0 38,656
Total petroleum additives . . . . . . . . . . . . . . . . . . . . . . . . . . . . . . . 375,291 371,964 348,282All other . . . . . . . . . . . . . . . . . . . . . . . . . . . . . . . . . . . . . . . . . . . . . . . . . . . . (1,150) 6,272 2,861
Segment operating profit . . . . . . . . . . . . . . . . . . . . . . . . . . . . . . . 374,141 378,236 351,143Corporate, general, and administrative expenses . . . . . . . . . . . . . . . . . . . . . (22,508) (20,192) (16,709)Interest and financing expenses, net . . . . . . . . . . . . . . . . . . . . . . . . . . . . . . . (17,796) (8,435) (14,151)Gain (loss) on interest rate swap agreement (c) . . . . . . . . . . . . . . . . . . . . . . 6,690 (5,346) (17,516)Loss on early extinguishment of debt (d) . . . . . . . . . . . . . . . . . . . . . . . . . . . 0 (9,092) 0Other income (expense), net . . . . . . . . . . . . . . . . . . . . . . . . . . . . . . . . . . . . . 784 2,397 (1,423)
Income from continuing operations before income taxexpense . . . . . . . . . . . . . . . . . . . . . . . . . . . . . . . . . . . . . . . . . . . $ 341,311 $ 337,568 $ 301,344
(a) Net sales to one customer of our petroleum additives segment exceeded 10% of consolidated revenue in2013, 2012, and 2011. Sales to Shell amounted to $253 million (11% of consolidated revenue) in 2013, $252million (11% of consolidated revenue) in 2012, and $246 million (11% of consolidated revenue) in 2011.These sales represent a wide range of products sold to this customer in multiple regions of the world.
(b) For 2011, the petroleum additives segment included a net gain of $39 million related to a legal settlement.On September 13, 2011, we signed a settlement agreement with Innospec Inc. and its subsidiaries, AlcorChemie Vertriebs GmbH and Innospec Ltd. (collectively, Innospec) which provided for mutual releases ofthe parties and dismissal of the actions with prejudice. Under the settlement agreement, Innospec agreed topay NewMarket an aggregate amount of approximately $45 million in a combination of cash, a promissorynote, and stock, of which $25 million was paid in cash on September 20, 2011 and $5 million was paid inthe form of 195,313 shares of unregistered Innospec Inc. common stock. Fifteen million dollars is payable inthree equal annual installments of $5 million under the promissory note, which bears simple interest at1% per year. The first two installments were paid in September 2012 and September 2013. The gain is net ofexpenses related to the settlement of the lawsuit.
(c) The gain (loss) on interest rate swap agreement represents the change, since the beginning of the reportingperiod, in the fair value of an interest rate swap which we entered into on June 25, 2009. We are not usinghedge accounting to record the interest rate swap, and accordingly, any change in the fair value isimmediately recognized in earnings.
77

Notes to Consolidated Financial Statements
(d) In March 2012, we entered into a $650 million five-year unsecured revolving credit facility. During 2012,we used a portion of the $650 million revolving credit facility to fund the early redemption of all of our thenoutstanding 7.125% senior notes, as well as to repay the outstanding principal amount on the mortgageloan. As a result, we recognized a loss on early extinguishment of debt of $10 million during 2012 fromaccelerated amortization of financing fees associated with the prior revolving credit facility, the 7.125%senior notes, and the mortgage loan, as well as costs associated with redeeming the 7.125% senior notesprior to maturity. Of the loss on early extinguishment of debt, $1 million is included as a component ofincome from operations of discontinued business, net of tax.
The following table shows asset information by segment and the reconciliation to consolidated assets. Segmentassets consist of accounts receivable, inventory, and long-lived assets. Long-lived assets in the table belowinclude property, plant, and equipment, net of depreciation.
December 31,
(in thousands) 2013 2012 2011
Segment assetsPetroleum additives . . . . . . . . . . . . . . . . . . . . . . . $ 889,944 $ 873,277 $ 854,134All other . . . . . . . . . . . . . . . . . . . . . . . . . . . . . . . . 12,170 14,018 14,125
902,114 887,295 868,259Cash and cash equivalents . . . . . . . . . . . . . . . . . . 238,703 89,129 50,370Other accounts receivable (a) . . . . . . . . . . . . . . . 1,960 11,806 173Deferred income taxes . . . . . . . . . . . . . . . . . . . . . 31,228 63,575 43,066Prepaid expenses and other current assets . . . . . 32,979 18,173 36,943Non-segment property, plant, and equipment,
net (a) . . . . . . . . . . . . . . . . . . . . . . . . . . . . . . . . 28,242 122,350 125,678Prepaid pension cost . . . . . . . . . . . . . . . . . . . . . . 55,087 12,710 11,494Deferred charges and other assets (a) . . . . . . . . . 36,961 59,210 55,679
Total assets . . . . . . . . . . . . . . . . . . . . . . . . . $1,327,274 $1,264,248 $1,191,662
Additions to long-lived assetsPetroleum additives . . . . . . . . . . . . . . . . . . . . . . . $ 54,187 $ 36,873 $ 50,760All other . . . . . . . . . . . . . . . . . . . . . . . . . . . . . . . . 7 0 30Corporate . . . . . . . . . . . . . . . . . . . . . . . . . . . . . . . 4,282 1,880 2,725
Total additions to long-lived assets . . . . . . . $ 58,476 $ 38,753 $ 53,515
Depreciation and amortizationPetroleum additives . . . . . . . . . . . . . . . . . . . . . . . $ 38,750 $ 36,197 $ 36,604All other (b) . . . . . . . . . . . . . . . . . . . . . . . . . . . . . 4,683 4,959 4,203Corporate . . . . . . . . . . . . . . . . . . . . . . . . . . . . . . . 2,711 2,233 2,545
Total depreciation and amortization . . . . . . $ 46,144 $ 43,389 $ 43,352
(a) Amounts previously reported for 2012 and 2011 have been reclassified to include the assets of thediscontinued operation resulting from the July 2013 sale of the assets of Foundry Park I.
(b) This amount includes depreciation and amortization expense of Foundry Park I, which was $5 million for2013, $5 million for 2012, and $4 million for 2011. These amounts are included in income from operationsof discontinued business, net of tax in the Consolidated Statements of Income.
78

Notes to Consolidated Financial Statements
Geographic Area Information—The table below reports revenue, total assets, and long-lived assets bygeographic area. Long-lived assets in the table below include property, plant, and equipment, net of depreciation.No country, except for the United States, exceeded 10% of consolidated revenue or long-lived assets in any year.However, because our foreign operations are significant to our overall business, we are presenting revenue in thetable below by the major regions in which we operate. NewMarket assigns revenues to geographic areas based onthe location to which the product was shipped to a third party.
December 31,
(in thousands) 2013 2012 2011
Consolidated revenueUnited States . . . . . . . . . . . . . . . . . . . . . . . . . . . . $ 806,462 $ 799,754 $ 756,284Europe, Middle East, Africa, India . . . . . . . . . . . 759,918 692,132 727,632Asia Pacific . . . . . . . . . . . . . . . . . . . . . . . . . . . . . 462,080 440,589 405,534Other foreign . . . . . . . . . . . . . . . . . . . . . . . . . . . . 251,895 279,403 248,677
Consolidated revenue . . . . . . . . . . . . . . . . . $2,280,355 $2,211,878 $2,138,127
Total assetsUnited States . . . . . . . . . . . . . . . . . . . . . . . . . . . . $ 637,386 $ 653,069 $ 642,976Foreign . . . . . . . . . . . . . . . . . . . . . . . . . . . . . . . . 689,888 611,179 548,686
Total assets . . . . . . . . . . . . . . . . . . . . . . . . . $1,327,274 $1,264,248 $1,191,662
Long-lived assetsUnited States . . . . . . . . . . . . . . . . . . . . . . . . . . . . $ 165,944 $ 255,150 $ 256,998Foreign . . . . . . . . . . . . . . . . . . . . . . . . . . . . . . . . 119,092 103,221 95,968
Total long-lived assets . . . . . . . . . . . . . . . . . $ 285,036 $ 358,371 $ 352,966
79

Notes to Consolidated Financial Statements
23. Selected Quarterly Consolidated Financial Data (unaudited)
(in thousands, except per-share amounts)First
QuarterSecondQuarter
ThirdQuarter
FourthQuarter
2013Net sales . . . . . . . . . . . . . . . . . . . . . . . . . . . . . . . . . . . $559,750 $583,779 $580,455 $556,371Gross profit . . . . . . . . . . . . . . . . . . . . . . . . . . . . . . . . 168,407 169,428 163,823 151,638Income from continuing operations . . . . . . . . . . . . . . 66,941 64,384 57,021 54,001Discontinued operations . . . . . . . . . . . . . . . . . . . . . . . 894 (374) 21,875 0
Net income . . . . . . . . . . . . . . . . . . . . . . . . . . . . . . . . . $ 67,835 $ 64,010 $ 78,896 $ 54,001
Earnings per share—basic and diluted:Income from continuing operations . . . . . . . . . . $ 5.00 $ 4.84 $ 4.29 $ 4.08Income from discontinued operations . . . . . . . . 0.07 (0.03) 1.65 0.00
Net income . . . . . . . . . . . . . . . . . . . . . . . . . . . . . . . . . $ 5.07 $ 4.81 $ 5.94 $ 4.08
FirstQuarter
SecondQuarter
ThirdQuarter
FourthQuarter
2012Net sales . . . . . . . . . . . . . . . . . . . . . . . . . . . . . . . . . . . $559,821 $587,548 $551,187 $513,322Gross profit . . . . . . . . . . . . . . . . . . . . . . . . . . . . . . . . 167,746 163,609 160,269 138,861Income from continuing operations . . . . . . . . . . . . . . 66,147 55,063 63,823 52,239Discontinued operations . . . . . . . . . . . . . . . . . . . . . . . 400 205 892 824
Net income . . . . . . . . . . . . . . . . . . . . . . . . . . . . . . . . . $ 66,547 $ 55,268 $ 64,715 $ 53,063
Earnings per share—basic and dilutedIncome from continuing operations . . . . . . . . . . $ 4.93 $ 4.11 $ 4.76 $ 3.88Income from discontinued operations . . . . . . . . 0.03 0.01 0.07 0.06
Net income . . . . . . . . . . . . . . . . . . . . . . . . . . . . . . . . . $ 4.96 $ 4.12 $ 4.83 $ 3.94
24. Consolidating Financial Information
The 4.10% senior notes are guaranteed on a senior unsecured basis by certain of our domestic subsidiaries thatguarantee our obligations under the revolving credit facility and any of our other indebtedness (GuarantorSubsidiaries). The subsidiary guarantees are joint and several obligations of the Guarantor Subsidiaries. Theindenture governing the 4.10% senior notes includes a provision which allows for a Guarantor Subsidiary to bereleased of its obligations under the subsidiary guarantee under certain conditions. Those conditions include thesale or other disposition of all or substantially all of the Guarantor Subsidiary’s assets in compliance with theindenture and the release or discharge of a Guarantor Subsidiary from its obligations as a guarantor under ourrevolving credit facility and all of our other indebtedness. During 2013, certain subsidiaries that had beenGuarantor Subsidiaries were released from their obligations under the revolving credit facility, and thereforewere released as a Subsidiary Guarantor under the 4.10% senior notes. The Guarantor Subsidiaries and thesubsidiaries that do not guarantee the 4.10% senior notes (the Non-Guarantor Subsidiaries) are 100% owned byNewMarket Corporation (the Parent Company). The current Guarantor Subsidiaries consist of the following:
Ethyl Corporation Afton Chemical CorporationNewMarket Services Corporation Afton Chemical Additives Corporation
80

Notes to Consolidated Financial Statements
We conduct all of our business through and derive essentially all of our income from our subsidiaries. Therefore,our ability to make payments on the 4.10% senior notes or other obligations is dependent on the earnings and thedistribution of funds from our subsidiaries.
The following sets forth the Consolidating Statements of Income and Comprehensive Income for the years endedDecember 31, 2013, December 31, 2012, and December 31, 2011; Consolidating Balance Sheets as ofDecember 31, 2013 and December 31, 2012; and Condensed Consolidating Statements of Cash Flows for theyears ended December 31, 2013, December 31, 2012, and December 31, 2011 for the Parent Company, theGuarantor Subsidiaries, and the Non-Guarantor Subsidiaries. The financial information is based on ourunderstanding of the SEC’s interpretation and application of Rule 3-10 of the SEC Regulation S-X. Prior periodshave been revised to reflect the change in Guarantor Subsidiaries and Non-Guarantor subsidiaries.
The financial information may not necessarily be indicative of results of operations or financial position had theGuarantor Subsidiaries or Non-Guarantor Subsidiaries operated as independent entities. The Parent Companyaccounts for investments in these subsidiaries using the equity method.
81

Notes to Consolidated Financial Statements
NewMarket Corporation and SubsidiariesConsolidating Statements of Income and Comprehensive Income
Year Ended December 31, 2013
(in thousands)Parent
CompanyGuarantor
SubsidiariesNon-Guarantor
Subsidiaries
TotalConsolidatingAdjustments Consolidated
Net sales . . . . . . . . . . . . . . . . . . . . . . . . . . . . . . . $ 0 $896,593 $1,383,762 $ 0 $2,280,355Cost of goods sold . . . . . . . . . . . . . . . . . . . . . . . . 0 457,698 1,169,361 0 1,627,059
Gross profit . . . . . . . . . . . . . . . . . . . . . . . . . 0 438,895 214,401 0 653,296Selling, general, and administrative expenses . . 6,869 91,230 66,779 0 164,878Research, development, and testing expenses . . 0 95,114 41,459 0 136,573
Operating (loss) profit . . . . . . . . . . . . . . . . . (6,869) 252,551 106,163 0 351,845Interest and financing expenses, net . . . . . . . . . . 18,303 (3,631) 3,124 0 17,796Other income (expense), net . . . . . . . . . . . . . . . . 6,754 38 470 0 7,262
(Loss) income from continuing operationsbefore income taxes and equity income ofsubsidiaries . . . . . . . . . . . . . . . . . . . . . . . . . . . (18,418) 256,220 103,509 0 341,311
Income tax (benefit) expense . . . . . . . . . . . . . . . (5,476) 80,958 23,482 0 98,964Equity income of subsidiaries . . . . . . . . . . . . . . . 277,684 0 0 (277,684) 0
Income from continuing operations . . . . . . . . . . 264,742 175,262 80,027 (277,684) 242,347Discontinued operations:
Gain on sale of discontinued business, netof tax . . . . . . . . . . . . . . . . . . . . . . . . . . . . 0 0 21,855 0 21,855
Income from operations of discontinuedbusiness, net of tax . . . . . . . . . . . . . . . . . 0 0 540 0 540
Net income . . . . . . . . . . . . . . . . . . . . . . . . . . . . . 264,742 175,262 102,422 (277,684) 264,742
Other comprehensive income (loss) . . . . . . . . . . 50,603 11,791 (745) (11,046) 50,603
Comprehensive income . . . . . . . . . . . . . . . . . . . . $315,345 $187,053 $ 101,677 $(288,730) $ 315,345
82

Notes to Consolidated Financial Statements
NewMarket Corporation and SubsidiariesConsolidating Statements of Income and Comprehensive Income
Year Ended December 31, 2012
(in thousands)Parent
CompanyGuarantor
SubsidiariesNon-Guarantor
Subsidiaries
TotalConsolidatingAdjustments Consolidated
Net sales . . . . . . . . . . . . . . . . . . . . . . . . . . . . . . . $ 0 $905,043 $1,306,835 $ 0 $2,211,878Cost of goods sold . . . . . . . . . . . . . . . . . . . . . . . . 0 443,896 1,137,497 0 1,581,393
Gross profit . . . . . . . . . . . . . . . . . . . . . . . . . 0 461,147 169,338 0 630,485Selling, general, and administrative expenses . . 6,089 115,450 32,668 0 154,207Research, development, and testing expenses . . 0 86,494 31,351 0 117,845
Operating (loss) profit . . . . . . . . . . . . . . . . . (6,089) 259,203 105,319 0 358,433Interest and financing expenses, net . . . . . . . . . . 8,432 (3,842) 3,845 0 8,435Loss on early extinguishment of debt . . . . . . . . . 9,092 0 0 0 9,092Other income (expense), net . . . . . . . . . . . . . . . . (5,301) 1,690 273 0 (3,338)
(Loss) income from continuing operationsbefore income taxes and equity income ofsubsidiaries . . . . . . . . . . . . . . . . . . . . . . . . . . . (28,914) 264,735 101,747 0 337,568
Income tax (benefit) expense . . . . . . . . . . . . . . . (17,984) 93,205 25,075 0 100,296Equity income of subsidiaries . . . . . . . . . . . . . . . 250,523 0 0 (250,523) 0
Income from continuing operations . . . . . . . . . . 239,593 171,530 76,672 (250,523) 237,272Income from operations of discontinued
business, net of tax . . . . . . . . . . . . . . . . . . . . . 0 0 2,321 0 2,321
Net income . . . . . . . . . . . . . . . . . . . . . . . . . . . . . 239,593 171,530 78,993 (250,523) 239,593
Other comprehensive income (loss) . . . . . . . . . . (11,957) 860 (771) (89) (11,957)
Comprehensive income . . . . . . . . . . . . . . . . . . . . $227,636 $172,390 $ 78,222 $(250,612) $ 227,636
83

Notes to Consolidated Financial Statements
NewMarket Corporation and SubsidiariesConsolidating Statements of Income and Comprehensive Income
Year Ended December 31, 2011
(in thousands)Parent
CompanyGuarantor
SubsidiariesNon-Guarantor
Subsidiaries
TotalConsolidatingAdjustments Consolidated
Net sales . . . . . . . . . . . . . . . . . . . . . . . . . . . . . . . $ 0 $836,917 $1,301,210 $ 0 $2,138,127Cost of goods sold . . . . . . . . . . . . . . . . . . . . . . . . 0 457,866 1,128,279 0 1,586,145
Gross profit . . . . . . . . . . . . . . . . . . . . . . . . . 0 379,051 172,931 0 551,982Selling, general, and administrative expenses . . 6,158 106,163 39,278 0 151,599Research, development, and testing expenses . . 0 77,569 27,927 0 105,496Gain on legal settlement, net . . . . . . . . . . . . . . . . 0 38,656 0 0 38,656
Operating (loss) profit . . . . . . . . . . . . . . . . . (6,158) 233,975 105,726 0 333,543Interest and financing expenses, net . . . . . . . . . . 14,397 (3,402) 3,156 0 14,151Other income (expense), net . . . . . . . . . . . . . . . . (18,558) 1,794 (1,284) 0 (18,048)
(Loss) income from continuing operationsbefore income taxes and equity income ofsubsidiaries . . . . . . . . . . . . . . . . . . . . . . . . . . . (39,113) 239,171 101,286 0 301,344
Income tax (benefit) expense . . . . . . . . . . . . . . . (15,399) 82,049 29,237 0 95,887Equity income of subsidiaries . . . . . . . . . . . . . . . 230,621 0 0 (230,621) 0
Income from continuing operations . . . . . . . . . . 206,907 157,122 72,049 (230,621) 205,457Income from operations of discontinued
business, net of tax . . . . . . . . . . . . . . . . . . . . . 0 0 1,450 0 1,450
Net income . . . . . . . . . . . . . . . . . . . . . . . . . . . . . 206,907 157,122 73,499 (230,621) 206,907
Other comprehensive income (loss) . . . . . . . . . . (24,912) (5,521) 670 4,851 (24,912)
Comprehensive income . . . . . . . . . . . . . . . . . . . . $181,995 $151,601 $ 74,169 $(225,770) $ 181,995
84

Notes to Consolidated Financial Statements
NewMarket Corporation and SubsidiariesConsolidating Balance Sheets
December 31, 2013
(in thousands)Parent
CompanyGuarantor
SubsidiariesNon-Guarantor
Subsidiaries
TotalConsolidatingAdjustments Consolidated
ASSETSCash and cash equivalents . . . . . . . . . . . . . . . . . $ 1,038 $102,205 $135,460 $ 0 $ 238,703Trade and other accounts receivable, net . . . . . . 1,512 108,908 199,431 (4) 309,847Amounts due from affiliated companies . . . . . . 0 139,710 77,098 (216,808) 0Inventories . . . . . . . . . . . . . . . . . . . . . . . . . . . . . 0 115,442 192,076 0 307,518Deferred income taxes . . . . . . . . . . . . . . . . . . . . 2,600 4,919 748 0 8,267Prepaid expenses and other current assets . . . . . 13,055 17,886 2,043 0 32,984
Total current assets . . . . . . . . . . . . . . 18,205 489,070 606,856 (216,812) 897,319
Amounts due from affiliated companies . . . . . . 0 113,076 8,025 (121,101) 0Property, plant, and equipment, at cost . . . . . . . 0 692,024 293,172 0 985,196
Less accumulated depreciation andamortization . . . . . . . . . . . . . . . . . . . . . . 0 555,805 144,355 0 700,160
Net property, plant, andequipment . . . . . . . . . . . . . . . . . . . 0 136,219 148,817 0 285,036
Investment in consolidated subsidiaries . . . . . . 955,560 0 0 (955,560) 0Prepaid pension cost . . . . . . . . . . . . . . . . . . . . . 23,276 16,092 15,719 0 55,087Deferred income taxes . . . . . . . . . . . . . . . . . . . . 20,999 0 7,984 (6,022) 22,961Intangibles (net of amortization) and
goodwill . . . . . . . . . . . . . . . . . . . . . . . . . . . . . 0 17,036 6,283 0 23,319Deferred charges and other assets . . . . . . . . . . . 33,257 9,014 1,281 0 43,552
Total assets . . . . . . . . . . . . . . . . . . . . . . . . . . . . $1,051,297 $780,507 $794,965 $(1,299,495) $1,327,274
LIABILITIES AND SHAREHOLDERS’EQUITY
Accounts payable . . . . . . . . . . . . . . . . . . . . . . . . $ 6 $ 86,649 $ 47,477 $ 0 $ 134,132Accrued expenses . . . . . . . . . . . . . . . . . . . . . . . 10,788 46,401 20,803 0 77,992Dividends payable . . . . . . . . . . . . . . . . . . . . . . . 12,996 0 0 0 12,996Amounts due to affiliated companies . . . . . . . . 23,183 77,098 116,527 (216,808) 0Income taxes payable . . . . . . . . . . . . . . . . . . . . . 0 0 11,423 (4) 11,419Other current liabilities . . . . . . . . . . . . . . . . . . . 0 7,828 3,247 0 11,075
Total current liabilities . . . . . . . . . . . . 46,973 217,976 199,477 (216,812) 247,614
Long-term debt . . . . . . . . . . . . . . . . . . . . . . . . . 349,467 0 0 0 349,467Amounts due to affiliated companies . . . . . . . . 0 8,025 113,076 (121,101) 0Other noncurrent liabilities . . . . . . . . . . . . . . . . 82,409 41,014 40,344 (6,022) 157,745
Total liabilities . . . . . . . . . . . . . . . . . . 478,849 267,015 352,897 (343,935) 754,826
Shareholders’ equity:Common stock and paid-in capital . . . . . . 0 260,776 126,661 (387,437) 0Accumulated other comprehensive loss . . (60,086) (5,786) (40,360) 46,146 (60,086)Retained earnings . . . . . . . . . . . . . . . . . . . . 632,534 258,502 355,767 (614,269) 632,534
Total shareholders’ equity . . . . . . . . . 572,448 513,492 442,068 (955,560) 572,448
Total liabilities and shareholders’ equity . . . $1,051,297 $780,507 $794,965 $(1,299,495) $1,327,274
85

Notes to Consolidated Financial Statements
NewMarket Corporation and SubsidiariesConsolidating Balance Sheets
December 31, 2012
(in thousands)Parent
CompanyGuarantor
SubsidiariesNon-Guarantor
Subsidiaries
TotalConsolidatingAdjustments Consolidated
ASSETSCash and cash equivalents . . . . . . . . . . . . . . . . . $ 5,001 $ 3,956 $ 80,172 $ 0 $ 89,129Trade and other accounts receivable, net . . . . . . 4,347 113,131 179,577 0 297,055Amounts due from affiliated companies . . . . . . 0 142,125 97,784 (239,909) 0Inventories . . . . . . . . . . . . . . . . . . . . . . . . . . . . . 0 117,638 205,036 0 322,674Deferred income taxes . . . . . . . . . . . . . . . . . . . . 2,555 5,062 835 0 8,452Prepaid expenses and other current assets . . . . . 65 16,248 1,872 0 18,185
Total current assets . . . . . . . . . . . . . . 11,968 398,160 565,276 (239,909) 735,495
Amounts due from affiliated companies . . . . . . 58,935 107,236 0 (166,171) 0Property, plant, and equipment, at cost . . . . . . . 0 664,912 406,055 0 1,070,967
Less accumulated depreciation andamortization . . . . . . . . . . . . . . . . . . . . . . 0 536,700 175,896 0 712,596
Net property, plant, andequipment . . . . . . . . . . . . . . . . . . . 0 128,212 230,159 0 358,371
Investment in consolidated subsidiaries . . . . . . 866,676 0 0 (866,676) 0Prepaid pension cost . . . . . . . . . . . . . . . . . . . . . 0 0 12,710 0 12,710Deferred income taxes . . . . . . . . . . . . . . . . . . . . 53,057 0 6,477 (4,411) 55,123Intangibles (net of amortization) and
goodwill . . . . . . . . . . . . . . . . . . . . . . . . . . . . . 0 23,785 6,757 0 30,542Deferred charges and other assets . . . . . . . . . . . 46,286 15,670 10,051 0 72,007
Total assets . . . . . . . . . . . . . . . . . . . . . . . . . . . . $1,036,922 $673,063 $831,430 $(1,277,167) $1,264,248
LIABILITIES AND SHAREHOLDERS’EQUITY
Accounts payable . . . . . . . . . . . . . . . . . . . . . . . . $ 206 $ 75,239 $ 43,853 $ 0 $ 119,298Accrued expenses . . . . . . . . . . . . . . . . . . . . . . . 8,366 50,763 19,932 0 79,061Amounts due to affiliated companies . . . . . . . . 63,021 93,330 83,558 (239,909) 0Income taxes payable . . . . . . . . . . . . . . . . . . . . . 0 1,214 8,810 0 10,024Other current liabilities . . . . . . . . . . . . . . . . . . . 0 3,906 4,382 0 8,288
Total current liabilities . . . . . . . . . . . . 71,593 224,452 160,535 (239,909) 216,671
Long-term debt . . . . . . . . . . . . . . . . . . . . . . . . . 424,407 0 0 0 424,407Amounts due to affiliated companies . . . . . . . . 0 0 166,171 (166,171) 0Other noncurrent liabilities . . . . . . . . . . . . . . . . 138,717 44,755 41,904 (4,411) 220,965
Total liabilities . . . . . . . . . . . . . . . . . . 634,717 269,207 368,610 (410,491) 862,043
Shareholders’ equity:Common stock and paid-in capital . . . . . . 721 260,840 217,407 (478,247) 721Accumulated other comprehensive loss . . (110,689) (17,578) (39,612) 57,190 (110,689)Retained earnings . . . . . . . . . . . . . . . . . . . . 512,173 160,594 285,025 (445,619) 512,173
Total shareholders’ equity . . . . . . . . . 402,205 403,856 462,820 (866,676) 402,205
Total liabilities and shareholders’ equity . . . $1,036,922 $673,063 $831,430 $(1,277,167) $1,264,248
86

Notes to Consolidated Financial Statements
NewMarket Corporation and SubsidiariesCondensed Consolidating Statements of Cash Flows
Year Ended December 31, 2013
(in thousands)Parent
CompanyGuarantor
SubsidiariesNon-Guarantor
Subsidiaries
TotalConsolidatingAdjustments Consolidated
Cash provided from (used in) operatingactivities . . . . . . . . . . . . . . . . . . . . . . . . . . . . . $ 149,278 $ (8,448) $ 83,832 $ 53,272 $ 277,934
Cash flows from investing activities:Capital expenditures . . . . . . . . . . . . . . . . . . 0 (29,583) (28,893) 0 (58,476)Proceeds from sale of discontinued
business . . . . . . . . . . . . . . . . . . . . . . . . . . 0 0 140,011 0 140,011Deposits for interest rate swap . . . . . . . . . . . (12,514) 0 0 0 (12,514)Return of deposits for interest rate swap . . . 24,370 0 0 0 24,370Return of investment in subsidiary . . . . . . . 45,174 0 0 (45,174) 0Other, net . . . . . . . . . . . . . . . . . . . . . . . . . . . (4,927) 0 0 0 (4,927)
Cash provided from (used in)investing activities . . . . . . . . . . . . . 52,103 (29,583) 111,118 (45,174) 88,464
Cash flows from financing activities:Net (repayments) borrowings under
revolving credit facility . . . . . . . . . . . . . . (75,000) 0 0 0 (75,000)Net (repayments) borrowings under lines of
credit . . . . . . . . . . . . . . . . . . . . . . . . . . . . 0 0 (1,135) 0 (1,135)Dividends paid . . . . . . . . . . . . . . . . . . . . . . . (50,368) (86,585) (77,978) 164,563 (50,368)Debt issuance costs . . . . . . . . . . . . . . . . . . . (1,145) 0 0 0 (1,145)Repurchases of common stock . . . . . . . . . . (92,195) 0 0 0 (92,195)Issuance of intercompany note payable,
net . . . . . . . . . . . . . . . . . . . . . . . . . . . . . . . 0 (14,328) 14,328 0 0Repayment of intercompany note payable,
net . . . . . . . . . . . . . . . . . . . . . . . . . . . . . . . 58,935 18,961 (77,896) 0 0Financing from affiliated companies . . . . . . (45,571) 218,232 0 (172,661) 0
Cash provided from (used in)financing activities . . . . . . . . . . . . . (205,344) 136,280 (142,681) (8,098) (219,843)
Effect of foreign exchange on cash and cashequivalents . . . . . . . . . . . . . . . . . . . . . . . . . . . . 0 0 3,019 0 3,019
(Decrease) increase in cash and cashequivalents . . . . . . . . . . . . . . . . . . . . . . . . . . . (3,963) 98,249 55,288 0 149,574
Cash and cash equivalents at beginning ofyear . . . . . . . . . . . . . . . . . . . . . . . . . . . . . . . . . 5,001 3,956 80,172 0 89,129
Cash and cash equivalents at end of year . . . . $ 1,038 $102,205 $ 135,460 $ 0 $ 238,703
87

Notes to Consolidated Financial Statements
NewMarket Corporation and SubsidiariesCondensed Consolidating Statements of Cash Flows
Year Ended December 31, 2012
(in thousands)Parent
CompanyGuarantor
SubsidiariesNon-Guarantor
Subsidiaries
TotalConsolidatingAdjustments Consolidated
Cash provided from (used in) operatingactivities . . . . . . . . . . . . . . . . . . . . . . . . . . . . . $ 320,504 $ 140,082 $ 64,015 $(251,790) $ 272,811
Cash flows from investing activities:Capital expenditures . . . . . . . . . . . . . . . . . . 0 (22,308) (16,445) 0 (38,753)Deposits for interest rate swap . . . . . . . . . . . (22,913) 0 0 0 (22,913)Return of deposits for interest rate swap . . . 21,260 0 0 0 21,260Other, net . . . . . . . . . . . . . . . . . . . . . . . . . . . (4,683) 6,303 0 0 1,620
Cash provided from (used in)investing activities . . . . . . . . . . . . . (6,336) (16,005) (16,445) 0 (38,786)
Cash flows from financing activities:Net (repayments) borrowings under
revolving credit facility . . . . . . . . . . . . . . 53,000 0 0 0 53,000Issuance of 4.10% senior notes . . . . . . . . . . 349,405 0 0 0 349,405Repayment of 7.125% senior notes . . . . . . . (150,000) 0 0 0 (150,000)Repayment of Foundry Park I mortgage
loan . . . . . . . . . . . . . . . . . . . . . . . . . . . . . . 0 0 (63,544) 0 (63,544)Net (repayments) borrowings under lines of
credit . . . . . . . . . . . . . . . . . . . . . . . . . . . . 0 0 (3,641) 0 (3,641)Dividends paid . . . . . . . . . . . . . . . . . . . . . . . (375,681) (344,584) (7,722) 352,306 (375,681)Debt issuance costs . . . . . . . . . . . . . . . . . . . (6,485) 0 0 0 (6,485)Issuance of intercompany note payable,
net . . . . . . . . . . . . . . . . . . . . . . . . . . . . . . . (65,500) 0 65,500 0 0Repayment of intercompany note payable,
net . . . . . . . . . . . . . . . . . . . . . . . . . . . . . . . 6,565 0 (6,565) 0 0Financing from affiliated companies . . . . . . (120,488) 221,004 0 (100,516) 0
Cash provided from (used in)financing activities . . . . . . . . . . . . . (309,184) (123,580) (15,972) 251,790 (196,946)
Effect of foreign exchange on cash and cashequivalents . . . . . . . . . . . . . . . . . . . . . . . . . . . . 0 0 1,680 0 1,680
Increase in cash and cash equivalents . . . . . . . 4,984 497 33,278 0 38,759Cash and cash equivalents at beginning of
year . . . . . . . . . . . . . . . . . . . . . . . . . . . . . . . . . 17 3,459 46,894 0 50,370
Cash and cash equivalents at end of year . . . . $ 5,001 $ 3,956 $ 80,172 $ 0 $ 89,129
88

Notes to Consolidated Financial Statements
NewMarket Corporation and SubsidiariesCondensed Consolidating Statements of Cash Flows
Year Ended December 31, 2011
(in thousands)Parent
CompanyGuarantor
SubsidiariesNon-Guarantor
Subsidiaries
TotalConsolidatingAdjustments Consolidated
Cash provided from (used in) operatingactivities . . . . . . . . . . . . . . . . . . . . . . . . . . . . . . $ 15,179 $ (1,763) $ 60,612 $ 110,570 $ 184,598
Cash flows from investing activities:Capital expenditures . . . . . . . . . . . . . . . . . . . 0 (24,147) (29,368) 0 (53,515)Deposits for interest rate swap . . . . . . . . . . . (46,467) 0 0 0 (46,467)Return of deposits for interest rate swap . . . . 33,600 0 0 0 33,600Other, net . . . . . . . . . . . . . . . . . . . . . . . . . . . . (4,574) 0 0 0 (4,574)
Cash provided from (used in)investing activities . . . . . . . . . . . . . . (17,441) (24,147) (29,368) 0 (70,956)
Cash flows from financing activities:Net (repayments) borrowings under
revolving credit facility . . . . . . . . . . . . . . . 18,000 0 0 0 18,000Repayment of Foundry Park I mortgage
loan . . . . . . . . . . . . . . . . . . . . . . . . . . . . . . 0 0 (2,731) 0 (2,731)Net (repayments) borrowings under lines of
credit . . . . . . . . . . . . . . . . . . . . . . . . . . . . . 0 0 6,529 0 6,529Dividends paid . . . . . . . . . . . . . . . . . . . . . . . (32,588) 0 (32,748) 32,748 (32,588)Debt issuance costs . . . . . . . . . . . . . . . . . . . . (3,233) 0 0 0 (3,233)Repurchases of common stock . . . . . . . . . . . (98,093) 0 0 0 (98,093)Issuance of intercompany note payable,
net . . . . . . . . . . . . . . . . . . . . . . . . . . . . . . . 0 (23,298) 23,298 0 0Repayment of intercompany note payable,
net . . . . . . . . . . . . . . . . . . . . . . . . . . . . . . . 0 24,000 (24,000) 0 0Financing from affiliated companies . . . . . . 118,106 25,212 0 (143,318) 0Other, net . . . . . . . . . . . . . . . . . . . . . . . . . . . . 70 958 0 0 1,028
Cash provided from (used in)financing activities . . . . . . . . . . . . . . 2,262 26,872 (29,652) (110,570) (111,088)
Effect of foreign exchange on cash and cashequivalents . . . . . . . . . . . . . . . . . . . . . . . . . . . . . 0 0 (1,376) 0 (1,376)
Increase in cash and cash equivalents . . . . . . . . 0 962 216 0 1,178Cash and cash equivalents at beginning of
year . . . . . . . . . . . . . . . . . . . . . . . . . . . . . . . . . . 17 2,497 46,678 0 49,192
Cash and cash equivalents at end of year . . . . . $ 17 $ 3,459 $ 46,894 $ 0 $ 50,370
89

ITEM 9. CHANGES IN AND DISAGREEMENTS WITH ACCOUNTANTS ON ACCOUNTING ANDFINANCIAL DISCLOSURE
None.
ITEM 9A. CONTROLS AND PROCEDURES
Evaluation of Disclosure Controls and Procedures
We maintain a system of internal control over financial reporting to provide reasonable, but not absolute,assurance of the reliability of the financial records and the protection of assets. Our controls and proceduresinclude written policies and procedures, careful selection and training of qualified personnel, and an internalaudit program. We use third-party firms, separate from our independent registered public accounting firm, toassist with internal audit services.
We work closely with the business groups, operations personnel, and information technology to ensuretransactions are recorded properly. Environmental and legal staff are consulted to determine the appropriatenessof our environmental and legal liabilities for each reporting period. We regularly review the regulations and rulechanges that affect our financial disclosures.
Our disclosure controls and procedures include signed representation letters from our regional officers, as well assenior management.
We have a Financial Disclosure Committee (the committee), which is made up of the president of Afton, thegeneral counsel of NewMarket, and the controller of NewMarket. The committee makes representations withregard to the financial statements that, to the best of their knowledge, the statements do not contain anymisstatement of a material fact or omit a material fact that is necessary to make the statements not misleadingwith respect to the periods covered by the report. They also represent that, to the best of their knowledge, thefinancial statements fairly present, in all material respects, our financial condition, results of operations, and cashflows as of and for the periods presented in the report.
Management personnel from our geographic regions also represent that, to the best of their knowledge, thefinancial statements and other financial information from their respective regions, which are included in ourconsolidated financial statements, fairly present, in all material respects, the financial condition and results ofoperations of their respective regions as of and for the periods presented in the report.
Pursuant to Rule 13a-15(b) under the Securities Exchange Act of 1934 (the Exchange Act), we carried out anevaluation, with the participation of our management, including our principal executive officer and our principalfinancial officer, of the effectiveness of our disclosure controls and procedures (as defined under Rule 13a-15(e))under the Exchange Act as of the end of the period covered by this report. Based upon that evaluation, ourprincipal executive officer and our principal financial officer concluded that our disclosure controls andprocedures are effective.
There has been no change in our internal control over financial reporting, as such term is defined in Rule 13a-15(f) under the Exchange Act, during the quarter ended December 31, 2013 that has materially affected, or isreasonably likely to materially affect, our internal control over financial reporting.
Management’s Report on Internal Control Over Financial Reporting
Our management is responsible for establishing and maintaining adequate internal control over financialreporting, as such term is defined in Rule 13a-15(f), under the Securities Exchange Act of 1934.
90
Our internal control over financial reporting is a process designed to provide reasonable assurance regarding thereliability of financial reporting and the preparation of financial statements for external purposes in accordancewith accounting principles generally accepted in the United States of America. Internal control over financialreporting includes those policies and procedures that:
• pertain to the maintenance of records that, in reasonable detail, accurately and fairly reflect thetransactions and dispositions of our assets;
• provide reasonable assurance that transactions are recorded as necessary to permit preparation offinancial statements in accordance with accounting principles generally accepted in the United Statesof America and that our receipts and expenditures are being made only in accordance withauthorization of our management and directors; and
• provide reasonable assurance regarding prevention or timely detection of unauthorized acquisition, useor disposition of assets that could have a material effect on the consolidated financial statements.
Because of its inherent limitations, internal control over financial reporting may not prevent or detectmisstatements. Also, projections of any evaluation of effectiveness to future periods are subject to the risk thatcontrols may become inadequate because of changes in conditions, or that the degree of compliance with thepolicies or procedures may deteriorate.
Under the supervision and with the participation of our management, including our principal executive officerand principal financial officer, we conducted an evaluation of the effectiveness of our internal control overfinancial reporting based on the framework in “Internal Control—Integrated Framework (1992)” issued by theCommittee of Sponsoring Organizations of the Treadway Commission. Based on our evaluation under theframework in “Internal Control—Integrated Framework (1992),” our management concluded that our internalcontrol over financial reporting was effective at the reasonable assurance level as of December 31, 2013. Theeffectiveness of our internal control over financial reporting as of December 31, 2013, has been audited byPricewaterhouseCoopers LLP, an independent registered public accounting firm, as stated in their report, whichis included in Item 8 of this Annual Report on Form 10-K.
ITEM 9B. OTHER INFORMATION
None.
91

PART III
ITEM 10. DIRECTORS, EXECUTIVE OFFICERS AND CORPORATE GOVERNANCE
The information required by this item is incorporated by reference to our definitive Proxy Statement for our 2014annual meeting of shareholders (Proxy Statement) under the headings entitled “Election of Directors,”“Committees of Our Board,” “Certain Relationships and Related Transactions,” and “Section 16(a) BeneficialOwnership Reporting Compliance” and is included in Part I of this Form 10-K under the heading entitled“Executive Officers of the Registrant.”
We have adopted a Code of Conduct that applies to our directors, officers, and employees (including ourprincipal executive officer, principal financial officer, and principal accounting officer) and have posted the Codeof Conduct on our internet website. We intend to satisfy the disclosure requirement under Item 5.05 of Form 8-Krelating to amendments to or waivers from any provision of our Code of Conduct applicable to the principalexecutive officer, principal financial officer, and principal accounting officer by posting this information on ourinternet website. Our internet website address is www.newmarket.com.
We have filed, as exhibits to this Annual Report on Form 10-K, the certifications of our principal executiveofficer and principal financial officer required under Sections 906 and 302 of the Sarbanes Oxley Act of 2002 tobe filed with the SEC regarding the quality of our public disclosure.
ITEM 11. EXECUTIVE COMPENSATION
The information required by this item is incorporated by reference to our Proxy Statement under the headings(including the narrative disclosures following a referenced table) entitled “Compensation Discussion andAnalysis,” “The Compensation Committee Report,” “Compensation of Executive Officers,” and “Compensationof Directors.”
ITEM 12. SECURITY OWNERSHIP OF CERTAIN BENEFICIAL OWNERS AND MANAGEMENTAND RELATED STOCKHOLDER MATTERS
Except as noted below, the information required by this item is incorporated by reference to our Proxy Statementunder the heading “Stock Ownership.”
The following table presents information as of December 31, 2013 with respect to equity compensation plansunder which shares of our common stock are authorized for issuance.
Plan Category
Number ofSecurities to be
Issued uponExercise of
OutstandingOptions, Warrants
and Rights (a)
Weighted-AverageExercise Price of
OutstandingOptions, Warrants
and Rights
Number ofSecurities
RemainingAvailable for
Future IssuanceUnder EquityCompensation
Plans (b)
Equity compensation plans approved by shareholders:2004 Incentive Compensation and Stock Plan . . . . . . . . . . 0 $0 1,429,078
Equity compensation plans not approved byshareholders (c): . . . . . . . . . . . . . . . . . . . . . . . . . . . . . . . . . . . . 0 0 0
Total . . . . . . . . . . . . . . . . . . . . . . . . . . . . . . . . . . . . . . . . . . . . . . . 0 $0 1,429,078
(a) There are no outstanding options, rights, or warrants.(b) Amounts exclude any securities to be issued upon exercise of outstanding options.(c) We do not have any equity compensation plans that have not been approved by shareholders.
92

ITEM 13. CERTAIN RELATIONSHIPS AND RELATED TRANSACTIONS, AND DIRECTORINDEPENDENCE
The information required by this item is incorporated by reference to our Proxy Statement under the headingsentitled “Board of Directors” and “Certain Relationships and Related Transactions.”
ITEM 14. PRINCIPAL ACCOUNTING FEES AND SERVICES
The information required by this item is incorporated by reference to our Proxy Statement under the heading“Ratification of Appointment of Independent Registered Public Accounting Firm.”
93

PART IV
ITEM 15. EXHIBITS, FINANCIAL STATEMENT SCHEDULES
(A)(1) Management’s Report on Internal Control Over Financial Reporting
Report of Independent Registered Public Accounting Firm
Consolidated Statements of Income for each of the three years in the periods ended December 31, 2013,2012, and 2011
Consolidated Statements of Comprehensive Income for each of the three years in the periods endedDecember 31, 2013, 2012, and 2011
Consolidated Balance Sheets as of December 31, 2013 and 2012
Consolidated Statements of Shareholders’ Equity for each of the three years in the periods endedDecember 31, 2013, 2012, and 2011
Consolidated Statements of Cash Flows for each of the three years in the periods ended December 31,2013, 2012, and 2011
Notes to Consolidated Financial Statements
(A)(2) Financial Statement Schedules—none required
(A)(3) Exhibits
3.1 Articles of Incorporation Amended and Restated effective April 27, 2012 (incorporated by reference toExhibit 3.1 to Form 8-K (File No. 1-32190) filed April 30, 2012)
3.2 NewMarket Corporation Bylaws Amended and Restated effective April 27, 2012 (incorporated byreference to Exhibit 3.2 to Form 8-K (File No. 1- 32190) filed April 30, 2012)
4.1 Indenture, dated as of December 20, 2012, among NewMarket Corporation, the guarantors listed on thesignature pages thereto and U.S. Bank National Association, as trustee, (incorporated by reference toExhibit 4.1 to Form 8-K (File No. 1-32190) filed December 21, 2012)
4.2 Form of 4.10% Senior Notes due 2022 (Included in Exhibit 4.1) (incorporated by reference to Exhibit4.1 to Form 8-K (File No. 1-32190) filed December 21, 2012)
4.3 Registration Rights Agreement, dated as of December 20, 2012, among NewMarket Corporation, theguarantors listed on the signature pages thereto and J.P. Morgan Securities LLC and the other severalinitial purchasers of the Notes (incorporated by reference to Exhibit 4.3 to Form 8-K (File No. 1-32190)filed December 21, 2012)
10.1 Credit Agreement dated as of March 14, 2012, by and among the Company and the Foreign SubsidiaryBorrowers party thereto; the Lenders party thereto; JPMorgan Chase Bank, N.A. as AdministrativeAgent; Citizens Bank of Pennsylvania as Syndication Agent; and Bank of America, N.A. and PNCBank, National Association as Co-Documentation Agents (incorporated by reference to Exhibit 10.1 toForm 8-K (File No. 1-32190) filed March 15, 2012)
10.2 Amendment No. 1 to the Credit Agreement, dated as of September 30, 2013, by and among NewMarketCorporation, the Guarantors listed on the signature page thereto, JPMorgan Chase Bank, N.A., and theLenders listed on the signature pages thereto (incorporated by reference to Exhibit 4.1 to Form 10-Q(File No. 1-32190) filed October 31, 2013)
10.3 International Swap Dealers Association, Inc. Master Agreement dated June 25, 2009, betweenNewMarket Corporation and Goldman Sachs Bank USA (ISDA Master Agreement) (incorporated byreference to Exhibit 10.1 to Form 8-K (File No. 1-32190) filed June 30, 2009)
94

10.4 Schedule to the ISDA Master Agreement dated June 25, 2009 (incorporated by reference to Exhibit10.2 to Form 8-K (File No. 1-32190) filed June 30, 2009)
10.5 Credit Support Annex to the Schedule to the ISDA Master Agreement dated June 25, 2009, betweenNewMarket Corporation and Goldman Sachs Bank USA (incorporated by reference to Exhibit 10.3 toForm 8-K (File No. 1-32190) filed June 30, 2009)
10.6 2004 Incentive Compensation and Stock Plan (incorporated by reference to Exhibit 10.4 to Form 10-K(File No. 1-32190) filed March 14, 2005)*
10.7 Excess Benefit Plan (incorporated by reference to Exhibit 10.4 to Ethyl Corporation’s Form 10-K (FileNo. 1-5112) filed February 25, 1993)*
10.8 Trust Agreement between Ethyl Corporation and Merrill Lynch Trust Company of America(incorporated by reference to Exhibit 4.5 to Ethyl Corporation’s Registration Statement on Form S-8(Registration No. 333-60889) filed August 7, 1998)
10.9 NewMarket Corporation and Affiliates Bonus Plan (incorporated by reference to Exhibit 10.9 to EthylCorporation’s Form 10-K (File No. 1-5112) filed March 14, 2003)*
10.10 Indemnification Agreement, dated as of July 1, 2004 by and among NewMarket Corporation, EthylCorporation and Afton Chemical Corporation (incorporated by reference to Exhibit 10.5 to Form 10-Q(File No. 1-32190) filed August 5, 2004)
10.11 Services Agreement, dated as of July 1, 2004, by and between NewMarket Services Corporation andAfton Chemical Corporation (incorporated by reference to Exhibit 10.2 to Form 10-Q (File No. 1-32190) filed November 5, 2004)
10.12 Services Agreement, dated as of July 1, 2004, by and between NewMarket Services Corporation andEthyl Corporation (incorporated by reference to Exhibit 10.3 to Form 10-Q (File No. 1-32190) filedNovember 5, 2004)
10.13 Services Agreement, dated as of July 1, 2004, by and between NewMarket Services Corporation andNewMarket Corporation (incorporated by reference to Exhibit 10.4 to Form 10-Q (File No. 1-32190)filed November 5, 2004)
10.14 Summary of Compensation of Named Executive Officers*
10.15 Summary of Directors’ Compensation*
10.16 Consulting Agreement, dated March 28, 2013, between NewMarket Corporation and C.S. WarrenHuang (incorporated by reference to Exhibit 10.1 to Form 8-K (File No. 1-32190) filed April 9,2013)*
10.17 Form of Restricted Stock Award Agreement (incorporated by reference to Exhibit 10.1 to Form 8-K(File No. 1-32190) filed August 21, 2012)*
10.18 Purchase and Sale Agreement, dated June 21, 2013, by and between Foundry Park I, LLC, a Virginialimited liability company, and Select Income REIT, a Maryland real estate investment trust(incorporated by reference to Exhibit 10.2 to Form 10-Q (File No. 1-32190) filed July 31, 2013)
12 Computation of Ratio of Earnings to Fixed Charges
21 Subsidiaries of the Registrant
23 Consent of Independent Registered Public Accounting Firm
31(a) Certification pursuant to Rule 13a-14(a) under the Securities Exchange Act of 1934, as adoptedpursuant to Section 302 of the Sarbanes-Oxley Act of 2002, by Thomas E. Gottwald
31(b) Certification pursuant to Rule 13a-14(a) under the Securities Exchange Act of 1934, as adoptedpursuant to Section 302 of the Sarbanes-Oxley Act of 2002, by David A. Fiorenza
95

32(a) Certification pursuant to 18 U.S.C. Section 1350, as adopted pursuant to Section 906 of the Sarbanes-Oxley Act of 2002, by Thomas E. Gottwald
32(b) Certification pursuant to 18 U.S.C. Section 1350, as adopted pursuant to Section 906 of the Sarbanes-Oxley Act of 2002, by David A. Fiorenza
101 XBRL Instance Document and Related Items
* Indicates management contracts, compensatory plans or arrangements of the company required to be filed asan exhibit
(B) Exhibits—The response to this portion of Item 15 is submitted as a separate section of this Annual Reporton Form 10-K.
96

SIGNATURES
Pursuant to the requirements of Section 13 or 15(d) of the Securities Exchange Act of 1934, the registrant hasduly caused this report to be signed on its behalf by the undersigned, thereunto duly authorized.
NEWMARKET CORPORATION
By: /s/ Thomas E. Gottwald(Thomas E. Gottwald, President and
Chief Executive Officer)
Date: February 19, 2014
Pursuant to the requirements of the Securities Exchange Act of 1934, this report has been signed below by thefollowing persons on behalf of the registrant and in the capacities indicated as of February 19, 2014.
SIGNATURE TITLE
/S/ BRUCE C. GOTTWALD
(Bruce C. Gottwald)
Chairman of the Board, Chairman of the Executive Committee, and Director
/S/ THOMAS E. GOTTWALD
(Thomas E. Gottwald)
President, Chief Executive Officer, and Director (Principal ExecutiveOfficer)
/S/ D. A. FIORENZA
(David A. Fiorenza)
Vice President and Chief Financial Officer (Principal Financial Officer)
/S/ WILLIAM J. SKROBACZ
(William J. Skrobacz)
Controller (Principal Accounting Officer)
/S/ PHYLLIS L. COTHRAN
(Phyllis L. Cothran)
Director
/S/ MARK M. GAMBILL
(Mark M. Gambill)
Director
/S/ PATRICK D. HANLEY
(Patrick D. Hanley)
Director
/S/ J. E. ROGERS
(James E. Rogers)
Director
/S/ C. B. WALKER
(Charles B. Walker)
Director
97

Exhibit 31(a)
CERTIFICATION
I, Thomas E. Gottwald, certify that:
1. I have reviewed this Annual Report on Form 10-K for the year ended December 31, 2013 ofNewMarket Corporation;
2. Based on my knowledge, this report does not contain any untrue statement of a material fact or omit tostate a material fact necessary to make the statements made, in light of the circumstances under whichsuch statements were made, not misleading with respect to the period covered by this report;
3. Based on my knowledge, the financial statements, and other financial information included in thisreport, fairly present in all material respects the financial condition, results of operations and cashflows of the registrant as of, and for, the periods presented in this report;
4. The registrant’s other certifying officer(s) and I are responsible for establishing and maintainingdisclosure controls and procedures (as defined in Exchange Act Rules 13a-15(e) and 15d-15(e)) andinternal control over financial reporting (as defined in Exchange Act Rules 13a-15(f) and 15d-15(f)) forthe registrant and have:
a. Designed such disclosure controls and procedures, or caused such disclosure controls andprocedures to be designed under our supervision, to ensure that material information relating tothe registrant, including its consolidated subsidiaries, is made known to us by others within thoseentities, particularly during the period in which this report is being prepared;
b. Designed such internal control over financial reporting, or caused such internal control overfinancial reporting to be designed under our supervision, to provide reasonable assuranceregarding the reliability of financial reporting and the preparation of financial statements forexternal purposes in accordance with generally accepted accounting principles;
c. Evaluated the effectiveness of the registrant’s disclosure controls and procedures and presented inthis report our conclusions about the effectiveness of the disclosure controls and procedures, as ofthe end of the period covered by this report based on such evaluation; and
d. Disclosed in this report any change in the registrant’s internal control over financial reporting thatoccurred during the registrant’s most recent fiscal quarter (the registrant’s fourth fiscal quarter inthe case of an annual report) that has materially affected, or is reasonably likely to materiallyaffect, the registrant’s internal control over financial reporting; and
5. The registrant’s other certifying officer(s) and I have disclosed, based on our most recent evaluation ofinternal control over financial reporting, to the registrant’s auditors and the audit committee of theregistrant’s board of directors (or persons performing the equivalent functions):
a. All significant deficiencies and material weaknesses in the design or operation of internal controlover financial reporting which are reasonably likely to adversely affect the registrant’s ability torecord, process, summarize and report financial information; and
b. Any fraud, whether or not material, that involves management or other employees who have asignificant role in the registrant’s internal control over financial reporting.
Date: February 19, 2014
By: /s/ Thomas E. Gottwald
Thomas E. GottwaldPresident and Chief Executive Officer

Exhibit 31(b)
CERTIFICATION
I, David A. Fiorenza, certify that:
1. I have reviewed this Annual Report on Form 10-K for the year ended December 31, 2013 ofNewMarket Corporation;
2. Based on my knowledge, this report does not contain any untrue statement of a material fact or omit tostate a material fact necessary to make the statements made, in light of the circumstances under whichsuch statements were made, not misleading with respect to the period covered by this report;
3. Based on my knowledge, the financial statements, and other financial information included in thisreport, fairly present in all material respects the financial condition, results of operations and cashflows of the registrant as of, and for, the periods presented in this report;
4. The registrant’s other certifying officer(s) and I are responsible for establishing and maintainingdisclosure controls and procedures (as defined in Exchange Act Rules 13a-15(e) and 15d-15(e)) andinternal control over financial reporting (as defined in Exchange Act Rules 13a-15(f) and 15d-15(f)) forthe registrant and have:
a. Designed such disclosure controls and procedures, or caused such disclosure controls andprocedures to be designed under our supervision, to ensure that material information relating tothe registrant, including its consolidated subsidiaries, is made known to us by others within thoseentities, particularly during the period in which this report is being prepared;
b. Designed such internal control over financial reporting, or caused such internal control overfinancial reporting to be designed under our supervision, to provide reasonable assuranceregarding the reliability of financial reporting and the preparation of financial statements forexternal purposes in accordance with generally accepted accounting principles;
c. Evaluated the effectiveness of the registrant’s disclosure controls and procedures and presented inthis report our conclusions about the effectiveness of the disclosure controls and procedures, as ofthe end of the period covered by this report based on such evaluation; and
d. Disclosed in this report any change in the registrant’s internal control over financial reporting thatoccurred during the registrant’s most recent fiscal quarter (the registrant’s fourth fiscal quarter inthe case of an annual report) that has materially affected, or is reasonably likely to materiallyaffect, the registrant’s internal control over financial reporting; and
5. The registrant’s other certifying officer(s) and I have disclosed, based on our most recent evaluation ofinternal control over financial reporting, to the registrant’s auditors and the audit committee of theregistrant’s board of directors (or persons performing the equivalent functions):
a. All significant deficiencies and material weaknesses in the design or operation of internal controlover financial reporting which are reasonably likely to adversely affect the registrant’s ability torecord, process, summarize and report financial information; and
b. Any fraud, whether or not material, that involves management or other employees who have asignificant role in the registrant’s internal control over financial reporting.
Date: February 19, 2014
By: /s/ D.A. Fiorenza
David A. FiorenzaVice President and Chief Financial Officer

SHAREHOLDER INFORMATION
TICKER SYMBOL: NEU
TRANSFER AGENT:
Computershare
P.O. Box 30170
College Station, Texas 77842-3170
Website: www-us.computershare.com/investor
Other inquiries should be directed to
NewMarket’s toll-free Shareholder Information Line
at 1-800-625-5191
or outside the United States at 1-312-360-5144