Embed Size (px)
Citation preview

1 2015 NEW ZEALAND NEPHROLOGY ANNUAL DATA REPORT
New Zealand Nephrology
ANNUAL DATA REPORT 2015
About care for end-stage kidney disease treated with dialysis or kidney transplantation
Mā te mōhio ka mārama, mā te mārama ka mātau
By discussion comes understanding, through understanding comes wisdom.

2 2015 NEW ZEALAND NEPHROLOGY ANNUAL DATA REPORT
CONTENTS Summary ................................................................................................................................................. 7
Incidence (patients starting dialysis or transplant treatment) ........................................................... 7
Kidney transplantation ........................................................................................................................ 8
Dialysis ................................................................................................................................................ 9
Children ............................................................................................................................................. 10
Annual data report development ..................................................................................................... 10
Future reports ................................................................................................................................... 10
1 Introduction ....................................................................................................................................... 11
Funding and support ......................................................................................................................... 11
2 Data sources and collection ............................................................................................................... 12
3 Starting renal replacement therapy (incidence) ................................................................................ 13
Starting treatment: Modality ............................................................................................................ 16
Starting treatment: Age .................................................................................................................... 17
Starting treatment: Ethnicity ............................................................................................................ 18
4 Prevalence of renal replacement therapy ......................................................................................... 19
Modality ............................................................................................................................................ 20
Diabetes ............................................................................................................................................ 22
5 Late specialist assessment ................................................................................................................. 23
6 Transplantation .................................................................................................................................. 24
Multi-organ transplantation ............................................................................................................. 24
Kidney transplant exchange program ............................................................................................... 24
ABO incompatible transplantation ................................................................................................... 24
Transplantation rates by District Health Board ................................................................................ 25
7 Peritoneal dialysis .............................................................................................................................. 27
Delay in starting peritoneal dialysis .................................................................................................. 27
Peritoneal dialysis peritonitis rates ................................................................................................... 28
8 Vascular access for haemodialysis ..................................................................................................... 29
Prevalent haemodialysis vascular access .......................................................................................... 29
Incident vascular access (all patients starting dialysis) ..................................................................... 30
Incident vascular access for haemodialysis (late referrals excluded) ............................................... 31
Catheter-associated blood stream infections (CABSI) ...................................................................... 32
Current dialysis vascular access practices......................................................................................... 33
9 Haemodialysis adequacy, frequency, and treatment duration ......................................................... 34

3 2015 NEW ZEALAND NEPHROLOGY ANNUAL DATA REPORT
Duration of haemodialysis ................................................................................................................ 34
Frequency of haemodialysis ............................................................................................................. 35
Haemodialysis adequacy ................................................................................................................... 36
10 Anaemia treatment .......................................................................................................................... 37
11 Pre-dialysis care ............................................................................................................................... 39
12 Supportive care ................................................................................................................................ 40
13 Potential action points ..................................................................................................................... 41
14 Notable New Zealand publications & reports arising from ANZDATA (2015-2017) ........................ 42
Journal papers (in reverse date order) ............................................................................................. 42
15 New Zealand activities ..................................................................................................................... 44
Starship ............................................................................................................................................. 44
Capital & Coast .................................................................................................................................. 44
Canterbury ........................................................................................................................................ 44
Southern............................................................................................................................................ 44

4 2015 NEW ZEALAND NEPHROLOGY ANNUAL DATA REPORT
Starting treatment for kidney failurein New Zealand
A summary of 2015
527New Zealanders started
treatment for
end-stage kidney disease in 2015
55% started with haemodialysis
40% with peritoneal dialysis
5% started treatment with a kidney transplant
Patients aged between 65 and 74 years were
the most likely to start treatment
The number of people starting dialysis each year is staying the same for New Zealand European patients, and continuing to increase among Māori and Pacificpatients 1 in 6 patients started
dialysis less than 3 months after their firstassessment. This number is
decreasing.
We wish to acknowledge that this summary is based on information provided by New Zealand patients and kidney units each year to ANZDATA.
50%
25%
Half of patients starting dialysishave diabetes.One-quarter of patients having a transplant have diabetes.
5 2015 NEW ZEALAND NEPHROLOGY ANNUAL DATA REPORT
KidneyTransplants in New Zealand
A summary of 2015
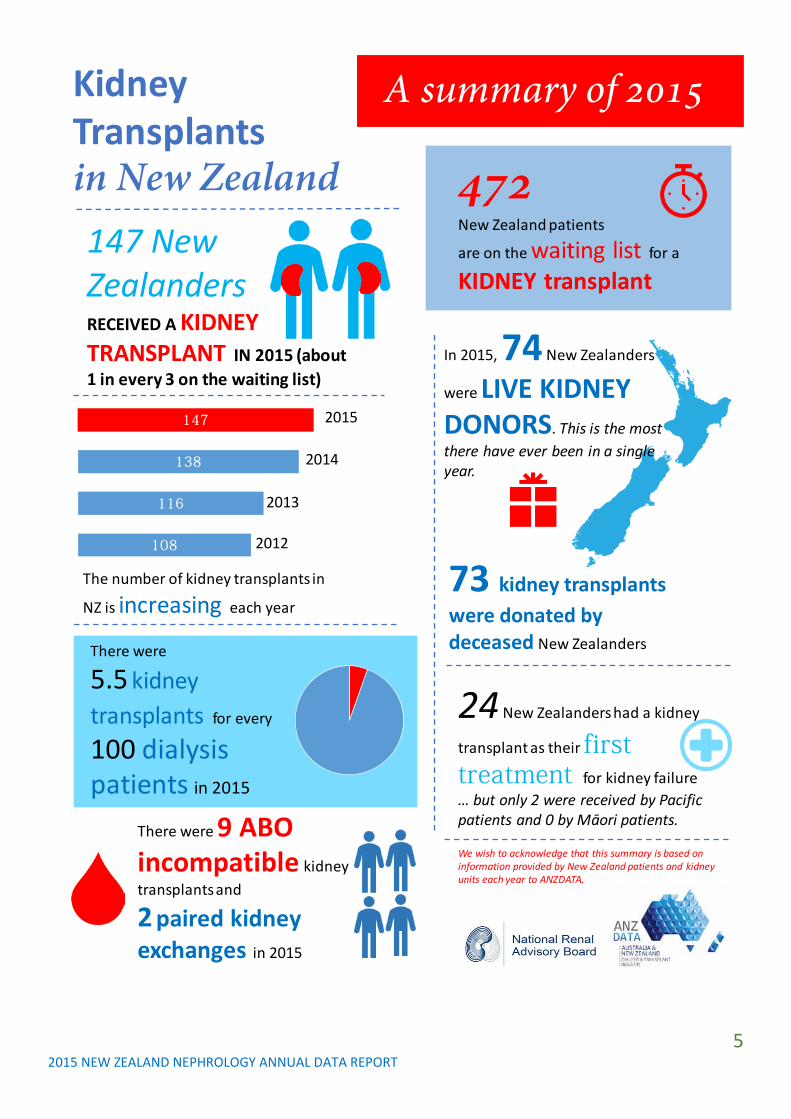
147 New ZealandersRECEIVED A KIDNEY TRANSPLANT IN 2015 (about 1 in every 3 on the waiting list)
472New Zealand patients
are on the waiting list for a
KIDNEY transplant
In 2015, 74 New Zealanders
were LIVE KIDNEY DONORS. This is the most there have ever been in a single year.
108
116
138
147
The number of kidney transplants in
NZ is increasing each year
2015
2014
2013
2012
73 kidney transplants were donated by deceased New Zealanders There were
5.5 kidney transplants for every
100 dialysispatients in 2015
24 New Zealanders had a kidney
transplant as their first treatment for kidney failure… but only 2 were received by Pacific patients and 0 by Māori patients.
There were 9 ABO incompatible kidney transplants and
2 paired kidney exchanges in 2015
We wish to acknowledge that this summary is based on information provided by New Zealand patients and kidney units each year to ANZDATA.

6 2015 NEW ZEALAND NEPHROLOGY ANNUAL DATA REPORT
Dialysisin New Zealand
A summary of 2015
In 2015, 503New Zealanders
started long-
term dialysis treatment
48%
Treated with
homedialysis
2674adults and
children were treated with dialysis during 2015
(an increase of 12% in the last 5 years).
30% treated with peritoneal dialysis
70% treated with haemodialysis
61% started
haemodialysis with
temporary dialysis catheter
We wish to acknowledge that this summary is based on information provided by New Zealand patients and kidney units each year to ANZDATA.
18children and young adults started dialysis in 2015
1 in 3 of patients
starting dialysis were older than
65
7 2015 NEW ZEALAND NEPHROLOGY ANNUAL DATA REPORT
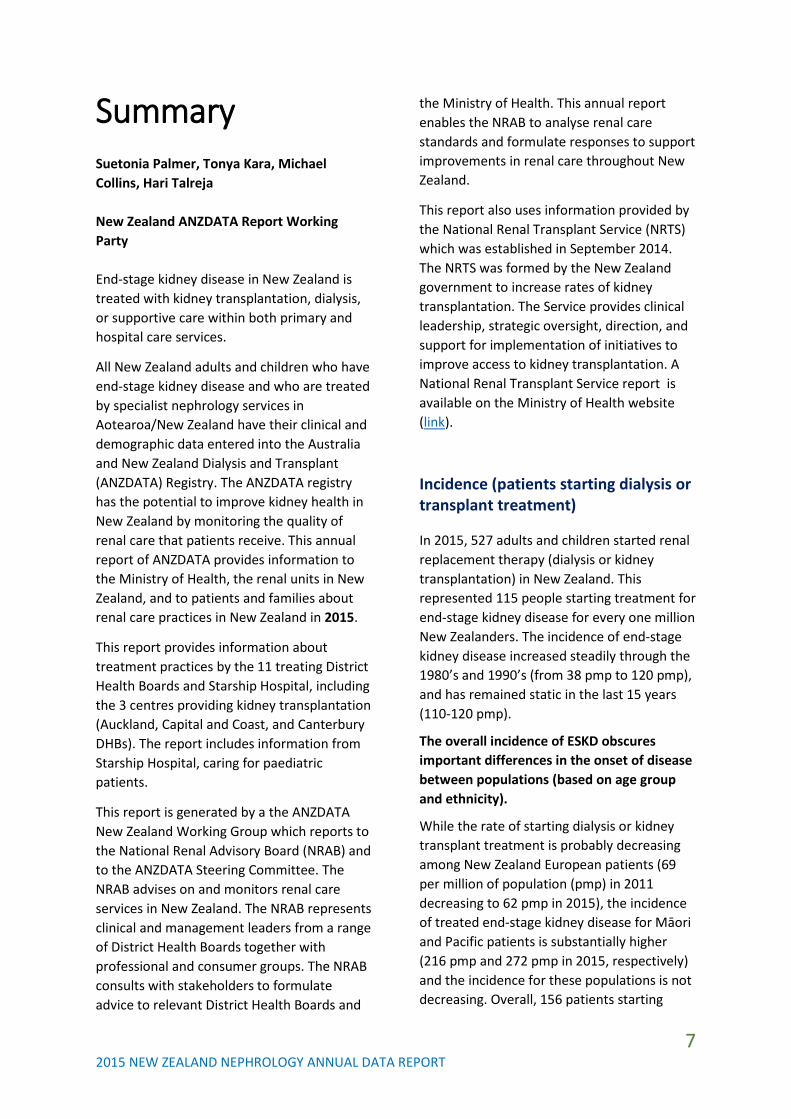
Summary Suetonia Palmer, Tonya Kara, Michael Collins, Hari Talreja New Zealand ANZDATA Report Working Party End-stage kidney disease in New Zealand is treated with kidney transplantation, dialysis, or supportive care within both primary and hospital care services.
All New Zealand adults and children who have end-stage kidney disease and who are treated by specialist nephrology services in Aotearoa/New Zealand have their clinical and demographic data entered into the Australia and New Zealand Dialysis and Transplant (ANZDATA) Registry. The ANZDATA registry has the potential to improve kidney health in New Zealand by monitoring the quality of renal care that patients receive. This annual report of ANZDATA provides information to the Ministry of Health, the renal units in New Zealand, and to patients and families about renal care practices in New Zealand in 2015.
This report provides information about treatment practices by the 11 treating District Health Boards and Starship Hospital, including the 3 centres providing kidney transplantation (Auckland, Capital and Coast, and Canterbury DHBs). The report includes information from Starship Hospital, caring for paediatric patients.
This report is generated by a the ANZDATA New Zealand Working Group which reports to the National Renal Advisory Board (NRAB) and to the ANZDATA Steering Committee. The NRAB advises on and monitors renal care services in New Zealand. The NRAB represents clinical and management leaders from a range of District Health Boards together with professional and consumer groups. The NRAB consults with stakeholders to formulate advice to relevant District Health Boards and
the Ministry of Health. This annual report enables the NRAB to analyse renal care standards and formulate responses to support improvements in renal care throughout New Zealand.
This report also uses information provided by the National Renal Transplant Service (NRTS) which was established in September 2014. The NRTS was formed by the New Zealand government to increase rates of kidney transplantation. The Service provides clinical leadership, strategic oversight, direction, and support for implementation of initiatives to improve access to kidney transplantation. A National Renal Transplant Service report is available on the Ministry of Health website (link).
Incidence (patients starting dialysis or transplant treatment)
In 2015, 527 adults and children started renal replacement therapy (dialysis or kidney transplantation) in New Zealand. This represented 115 people starting treatment for end-stage kidney disease for every one million New Zealanders. The incidence of end-stage kidney disease increased steadily through the 1980’s and 1990’s (from 38 pmp to 120 pmp), and has remained static in the last 15 years (110-120 pmp).
The overall incidence of ESKD obscures important differences in the onset of disease between populations (based on age group and ethnicity).
While the rate of starting dialysis or kidney transplant treatment is probably decreasing among New Zealand European patients (69 per million of population (pmp) in 2011 decreasing to 62 pmp in 2015), the incidence of treated end-stage kidney disease for Māori and Pacific patients is substantially higher (216 pmp and 272 pmp in 2015, respectively) and the incidence for these populations is not decreasing. Overall, 156 patients starting

8 2015 NEW ZEALAND NEPHROLOGY ANNUAL DATA REPORT
dialysis treatment in 2015 were Māori (30% of all patients) and 104 (20%) were of Pacific ethnicity. Inequities in the incidence of end-stage kidney disease based on ethnicity have persisted over time.
Older adults have the highest rate of starting dialysis of any age group. The highest incidence of renal replacement therapy was in the 65-74-year age group (311 pmp), followed by the 75-84-year age group (260 pmp). No patients commenced dialysis at 85 years or older in New Zealand in 2015. The incidence of renal replacement therapy in young adults or children aged 24 years or younger was 13 pmp.
Nearly half (47%) of all patients starting renal replacement therapy had kidney disease caused by diabetes. This rate was substantially higher than the comparable rate in Australia (37%) and is indicative of the complexity of end-stage kidney disease care in New Zealand and the consequences of diabetes on the health of New Zealanders. Over half of all patients (54%) treated with dialysis have diabetes, and this rate has increased from 45% in 2006.
Overall, 8.5% of patients starting dialysis in 2015 were referred to nephrology services within 90 days of starting dialysis treatment. (so called “late referrals”). Late referral reduces the opportunities for patients to start dialysis care with permanent vascular access, with their preferred dialysis modality, or a kidney transplant as first treatment for kidney failure. This late referral rate has steadily decreased from 17.1% in 2011. The decrease is largely due to decreased late referral rates among Pacific patients. Children and young adults have the highest rate of starting dialysis care after late referral, and has remained static at 25-30% of children starting dialysis.
Kidney transplantation
For patients who might benefit, kidney transplantation is the best available treatment for end stage kidney disease. Government funding in 2014 facilitated the development of the National Renal Transplant Service (NRTS), with the goal of increasing kidney transplantation in New Zealand.
Since the establishment of the NRTS, kidney transplantation rates in New Zealand have been increasing. In 2015, 147 patients received a kidney transplant in New Zealand. This is the highest number of kidney transplants in any single year in New Zealand.
Overall, 74 patients received a kidney from a living donor and 73 patients received a kidney from a deceased donor. The number of kidney transplant operations has increased sharply since 2012 (from 108 (25 pmp) in 2012 to 147 (31 pmp) in 2015). In 2015, 31 patients received a kidney transplant for every 100 patients who were active on the transplant waiting list – this has increased from 26 in 2012. On average, 5.5 patients received a kidney transplant for every 100 dialysis patients (increased from 4.4 in 2012).
Overall, 1694 patients were living with a functioning kidney transplant at the end of 2015 – 369 patients for every million-people living in New Zealand. This has increased over the last 5 years from 1483 people (338 per million) in 2011.
New Zealand patients rarely receive a kidney transplant as their first treatment for end-stage kidney disease (called pre-emptive transplantation). In 2015, 24 patients were treated with pre-emptive transplantation compared with 503 who started treatment with dialysis. Overall, about 4% of patients started treatment for end-stage kidney disease with a pre-emptive transplant.
There is persistent inequity in access to transplantation based on ethnicity. In 2015,
9 2015 NEW ZEALAND NEPHROLOGY ANNUAL DATA REPORT
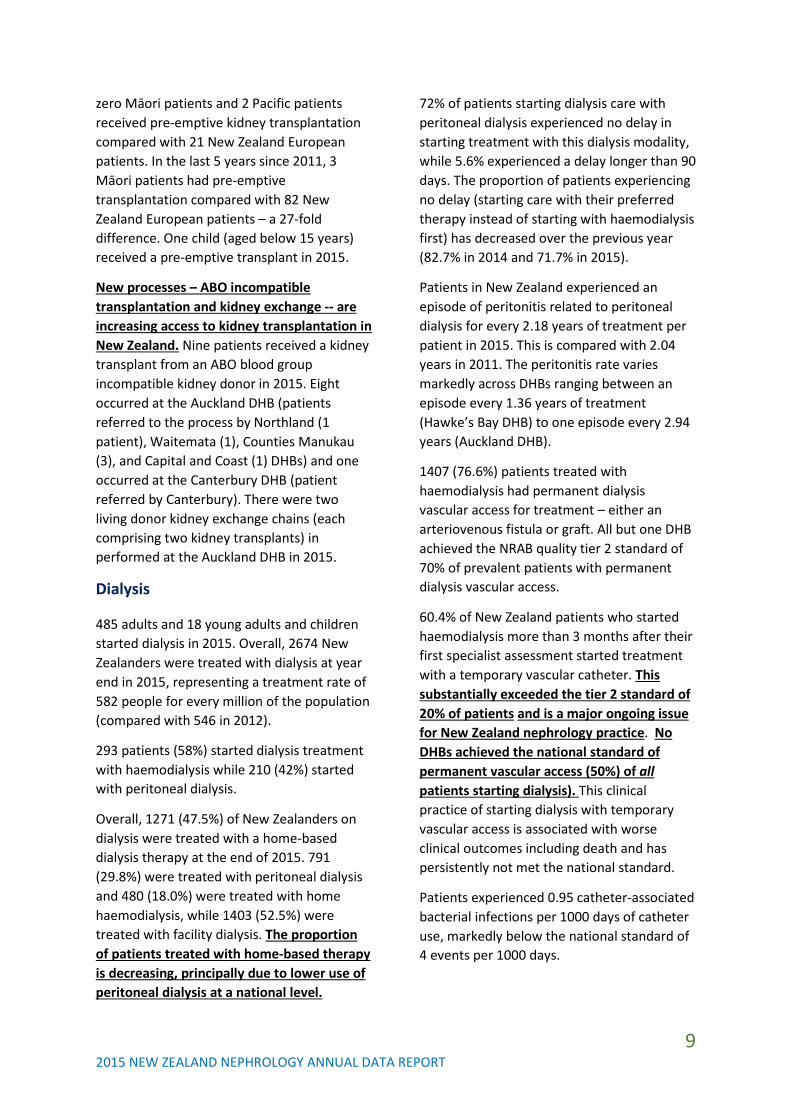
zero Māori patients and 2 Pacific patients received pre-emptive kidney transplantation compared with 21 New Zealand European patients. In the last 5 years since 2011, 3 Māori patients had pre-emptive transplantation compared with 82 New Zealand European patients – a 27-fold difference. One child (aged below 15 years) received a pre-emptive transplant in 2015.
New processes – ABO incompatible transplantation and kidney exchange -- are increasing access to kidney transplantation in New Zealand. Nine patients received a kidney transplant from an ABO blood group incompatible kidney donor in 2015. Eight occurred at the Auckland DHB (patients referred to the process by Northland (1 patient), Waitemata (1), Counties Manukau (3), and Capital and Coast (1) DHBs) and one occurred at the Canterbury DHB (patient referred by Canterbury). There were two living donor kidney exchange chains (each comprising two kidney transplants) in performed at the Auckland DHB in 2015.
Dialysis
485 adults and 18 young adults and children started dialysis in 2015. Overall, 2674 New Zealanders were treated with dialysis at year end in 2015, representing a treatment rate of 582 people for every million of the population (compared with 546 in 2012).
293 patients (58%) started dialysis treatment with haemodialysis while 210 (42%) started with peritoneal dialysis.
Overall, 1271 (47.5%) of New Zealanders on dialysis were treated with a home-based dialysis therapy at the end of 2015. 791 (29.8%) were treated with peritoneal dialysis and 480 (18.0%) were treated with home haemodialysis, while 1403 (52.5%) were treated with facility dialysis. The proportion of patients treated with home-based therapy is decreasing, principally due to lower use of peritoneal dialysis at a national level.
72% of patients starting dialysis care with peritoneal dialysis experienced no delay in starting treatment with this dialysis modality, while 5.6% experienced a delay longer than 90 days. The proportion of patients experiencing no delay (starting care with their preferred therapy instead of starting with haemodialysis first) has decreased over the previous year (82.7% in 2014 and 71.7% in 2015).
Patients in New Zealand experienced an episode of peritonitis related to peritoneal dialysis for every 2.18 years of treatment per patient in 2015. This is compared with 2.04 years in 2011. The peritonitis rate varies markedly across DHBs ranging between an episode every 1.36 years of treatment (Hawke’s Bay DHB) to one episode every 2.94 years (Auckland DHB).
1407 (76.6%) patients treated with haemodialysis had permanent dialysis vascular access for treatment – either an arteriovenous fistula or graft. All but one DHB achieved the NRAB quality tier 2 standard of 70% of prevalent patients with permanent dialysis vascular access.
60.4% of New Zealand patients who started haemodialysis more than 3 months after their first specialist assessment started treatment with a temporary vascular catheter. This substantially exceeded the tier 2 standard of 20% of patients and is a major ongoing issue for New Zealand nephrology practice. No DHBs achieved the national standard of permanent vascular access (50%) of all patients starting dialysis). This clinical practice of starting dialysis with temporary vascular access is associated with worse clinical outcomes including death and has persistently not met the national standard.
Patients experienced 0.95 catheter-associated bacterial infections per 1000 days of catheter use, markedly below the national standard of 4 events per 1000 days.

10 2015 NEW ZEALAND NEPHROLOGY ANNUAL DATA REPORT
Children
Nineteen young adults and children started treatment for end-stage kidney disease in 2015 (10 haemodialysis; 8 peritoneal dialysis; 1 transplant). Five patients (26%) aged 24 years or below commenced dialysis within 3 months of their first specialist assessment. Late referrals have the highest rate in paediatric patients compared with all other age groups.
At year end, 48 children were treated for end-stage kidney disease overall in New Zealand (6 with dialysis and 42 had a kidney transplant). There were 4 episodes of peritoneal dialysis peritonitis among children. There were 2.5 catheter-associated blood stream infection for every 1000 catheter-days in children, compared with an average 1.1 per 1000 catheter days in adult patients.
Annual data report development
In 2014, for the first time, editable data displays in this report were made available to users within a PowerPoint format for local use and adaptation. In 2014, patient summaries of the report has been generated for the first time (a report about transplantation and a report about dialysis). New Zealand publications arising from ANZDATA are now collated annually.
The main ANZDATA report now has a New Zealand chapter for the first time providing a summary for 2015. This will be developed over time to include standardised mortality ratios and patient and kidney transplant life expectancies.
ANZDATA developed a New Zealand Working Group in 2016 which holds responsibility for considering data requests to ANZDATA and for advocating for New Zealand issues and priorities.
There has been some exciting progress with research in ANZDATA. Traditional clinical trials are often very expensive and require
additional follow up for patients at hospitals in addition to usual clinical care. A registry trial – where all follow up is carried out remotely with linkage to the routine ANZDATA database -- is being developed in Australia and New Zealand in collaboration with the Australasian Kidney Trials Network (AKTN). The BEST-FLUIDs trial will ask whether different fluids given to patients at the time of kidney transplant surgery and in the first 48 hours afterwards will help kidney transplant function.
ANZDATA is exploring the potential for patient outcomes to be reported in ANZDATA. These patient-reported outcome measures (PROMS) and patient-reported experience measures (PREMS) are being considered by a new Working Group set up in late 2016.
Future reports
Additional plans for future reports include consideration of:
• Consider reporting measures of patient experiences of nephrology services will be in the annual report, after piloting and consultation with stakeholders including consumers.
• Plain language summaries of NZ publications arising from ANZDATA.
• Mortality and transplant survival outcomes.
• Analyses to detect the impact of gender, age, and ethnicity on rates of transplantation and home dialysis.
11 2015 NEW ZEALAND NEPHROLOGY ANNUAL DATA REPORT
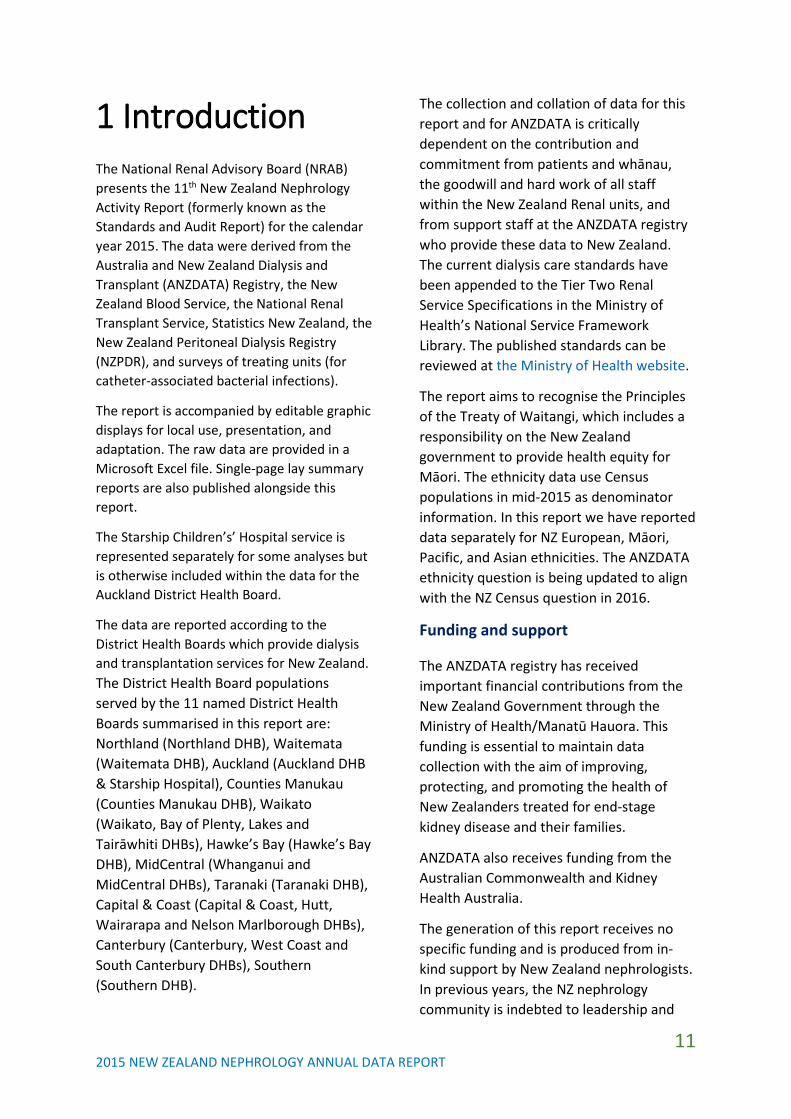
1 Introduction The National Renal Advisory Board (NRAB) presents the 11th New Zealand Nephrology Activity Report (formerly known as the Standards and Audit Report) for the calendar year 2015. The data were derived from the Australia and New Zealand Dialysis and Transplant (ANZDATA) Registry, the New Zealand Blood Service, the National Renal Transplant Service, Statistics New Zealand, the New Zealand Peritoneal Dialysis Registry (NZPDR), and surveys of treating units (for catheter-associated bacterial infections).
The report is accompanied by editable graphic displays for local use, presentation, and adaptation. The raw data are provided in a Microsoft Excel file. Single-page lay summary reports are also published alongside this report.
The Starship Children’s’ Hospital service is represented separately for some analyses but is otherwise included within the data for the Auckland District Health Board.
The data are reported according to the District Health Boards which provide dialysis and transplantation services for New Zealand. The District Health Board populations served by the 11 named District Health Boards summarised in this report are: Northland (Northland DHB), Waitemata (Waitemata DHB), Auckland (Auckland DHB & Starship Hospital), Counties Manukau (Counties Manukau DHB), Waikato (Waikato, Bay of Plenty, Lakes and Tairāwhiti DHBs), Hawke’s Bay (Hawke’s Bay DHB), MidCentral (Whanganui and MidCentral DHBs), Taranaki (Taranaki DHB), Capital & Coast (Capital & Coast, Hutt, Wairarapa and Nelson Marlborough DHBs), Canterbury (Canterbury, West Coast and South Canterbury DHBs), Southern (Southern DHB).
The collection and collation of data for this report and for ANZDATA is critically dependent on the contribution and commitment from patients and whānau, the goodwill and hard work of all staff within the New Zealand Renal units, and from support staff at the ANZDATA registry who provide these data to New Zealand. The current dialysis care standards have been appended to the Tier Two Renal Service Specifications in the Ministry of Health’s National Service Framework Library. The published standards can be reviewed at the Ministry of Health website.
The report aims to recognise the Principles of the Treaty of Waitangi, which includes a responsibility on the New Zealand government to provide health equity for Māori. The ethnicity data use Census populations in mid-2015 as denominator information. In this report we have reported data separately for NZ European, Māori, Pacific, and Asian ethnicities. The ANZDATA ethnicity question is being updated to align with the NZ Census question in 2016.
Funding and support
The ANZDATA registry has received important financial contributions from the New Zealand Government through the Ministry of Health/Manatū Hauora. This funding is essential to maintain data collection with the aim of improving, protecting, and promoting the health of New Zealanders treated for end-stage kidney disease and their families.
ANZDATA also receives funding from the Australian Commonwealth and Kidney Health Australia.
The generation of this report receives no specific funding and is produced from in-kind support by New Zealand nephrologists. In previous years, the NZ nephrology community is indebted to leadership and
12 2015 NEW ZEALAND NEPHROLOGY ANNUAL DATA REPORT
contributions of Drs Kelvin Lynn, Grant Pidgeon, and Mark Marshall. The work of Dr Stephen McDonald and Phil Clayton at ANZDATA is also acknowledged.
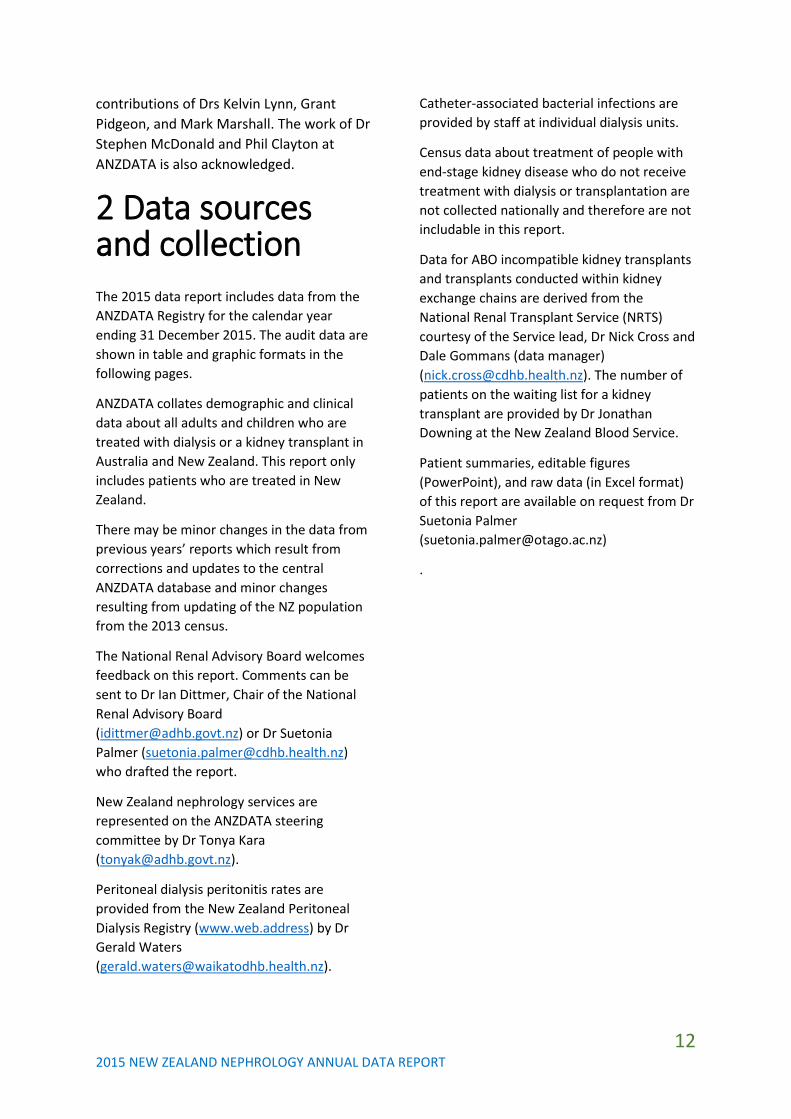
2 Data sources and collection The 2015 data report includes data from the ANZDATA Registry for the calendar year ending 31 December 2015. The audit data are shown in table and graphic formats in the following pages.
ANZDATA collates demographic and clinical data about all adults and children who are treated with dialysis or a kidney transplant in Australia and New Zealand. This report only includes patients who are treated in New Zealand.
There may be minor changes in the data from previous years’ reports which result from corrections and updates to the central ANZDATA database and minor changes resulting from updating of the NZ population from the 2013 census.
The National Renal Advisory Board welcomes feedback on this report. Comments can be sent to Dr Ian Dittmer, Chair of the National Renal Advisory Board ([email protected]) or Dr Suetonia Palmer ([email protected]) who drafted the report.
New Zealand nephrology services are represented on the ANZDATA steering committee by Dr Tonya Kara ([email protected]).
Peritoneal dialysis peritonitis rates are provided from the New Zealand Peritoneal Dialysis Registry (www.web.address) by Dr Gerald Waters ([email protected]).
Catheter-associated bacterial infections are provided by staff at individual dialysis units.
Census data about treatment of people with end-stage kidney disease who do not receive treatment with dialysis or transplantation are not collected nationally and therefore are not includable in this report.
Data for ABO incompatible kidney transplants and transplants conducted within kidney exchange chains are derived from the National Renal Transplant Service (NRTS) courtesy of the Service lead, Dr Nick Cross and Dale Gommans (data manager) ([email protected]). The number of patients on the waiting list for a kidney transplant are provided by Dr Jonathan Downing at the New Zealand Blood Service.
Patient summaries, editable figures (PowerPoint), and raw data (in Excel format) of this report are available on request from Dr Suetonia Palmer ([email protected])
.

13 2015 NEW ZEALAND NEPHROLOGY ANNUAL DATA REPORT
3 Starting renal replacement therapy (incidence)
• Renal replacement therapy is treatment to replace kidney function when a patient reaches end-stage kidney disease and includes either dialysis or a kidney transplant
• 527 people started treatment for end-stage kidney disease (either dialysis or a kidney transplant) in New Zealand in 2015.
• 503 adults commenced dialysis and 24 adults had a kidney transplant as first treatment (pre-emptive transplant). Eighteen children and young adults started dialysis. One paediatric patient received a pre-emptive kidney transplant in 2015.
• The overall incidence of renal replacement therapy in New Zealand was 115 per million population (pmp) (Table 3.1)
• The overall incidence of RRT has been relatively stable over time, although this summary rate masks substantial variation in treatment incidence among the various DHBs (Figure 3.1) and among people based on ethnicity and age group (see sections below).
• The incidence of renal replacement therapy varied more than 10-fold across New Zealand DHBs. The highest incidences were at Counties Manukau [211 pmp] and Northland [184 pmp] while the lowest incidences were at Canterbury [78 pmp] and Southern [45 pmp] DHBs. The Hawke’s Bay data showing an incidence of 19 pmp appear to be anomalous in 2015.
• The differences in population rates of starting renal replacement therapy are likely to be driven in part by distributions of age, ethnicity, and clinical comorbidity, including diabetes, within the corresponding DHB populations.
• The vast majority of patients started treatment with dialysis. 24 patients received a kidney transplant as their first treatment (pre-emptive kidney transplant) representing 4.4% of all incident patients.
• Among New Zealand European patients, 10.6% of incident patients had a pre-emptive transplant. The proportion of NZ European patients starting RRT with a transplant is steadily increasing (6.7% in 2011). By contrast, the pre-emptive transplantation rate for Māori (0.0%), Pacific (1.9%), and Asian (2.2%) patients remained low and is not increasing.
Figure 3.1 Patients starting renal replacement therapy (dialysis or kidney transplant) per million of the corresponding DHB population *Incidence data incomplete for Hawke’s Bay DHB.
18489
122211
139
112Not available
111
103
78
45

14 2015 NEW ZEALAND NEPHROLOGY ANNUAL DATA REPORT
Figure 3.2 Incidence of renal replacement therapy in New Zealand 1986-2015 (30 years) per million of national population.
• The incidence of renal replacement therapy (dialysis or kidney transplantation) increased steadily between 1986 to 2000 from 38 per million of population to 120 per million population. The incidence has remained fairly stable (with some variation) since 2000, ranging between 110-136 pmp. The overall incidence shown as a national summary obscures the differences in incidence in different age groups and based on ethnicity (see later in report).
3846 46
53 5462
6965 69
78 7784
96 97
110120117114112111
119111
116
136
118111
118125122
115
0
20
40
60
80
100
120
140
160
1986
1987
1988
1989
1990
1991
1992
1993
1994
1995
1996
1997
1998
1999
2000
2001
2002
2003
2004
2005
2006
2007
2008
2009
2010
2011
2012
2013
2014
2015
New
pat
ient
s, p
mp
Incidence of RRT in New Zealand 1986-2015 (per million population)

15 2015 NEW ZEALAND NEPHROLOGY ANNUAL DATA REPORT
Table 3.1 Nephrology service demographics
Incidence end-stage kidney
disease Dialysis
prevalence Transplant prevalence
Total end-stage kidney disease
prevalence
District Health Board region Pop* Number
Rate (PMP) Number
Rate (PMP) Number
Rate (PMP) Number
Rate (PMP)
Number of transplant patients per 100 dialysis patients
Northland 168,300 31 184 171 1016 77 458 248 1474 45
Waitemata 575,600 51 89 279 485 171 297 450 782 61
Auckland 490,000 60 122 340 694 249 508 589 1202 73
Counties Manukau 521,700 110 211 611 1171 172 330 783 1501 28
Waikato 764,300 106 139 496 649 182 238 678 887 37
Hawke’s Bay 159,900 Not
available -- Not available -- Not
available -- Not available --
MidCentral 234,700 26 111 139 592 76 324 215 916 55
Taranaki 115,900 13 112 53 457 41 354 94 811 77
Capital & Coast 633,100 65 103 262 414 279 441 541 855 106
Canterbury 618,000 48 78 144 233 264 427 408 660 183
Southern 314,000 14 45 95 303 105 334 200 637 111
Overall 4,595,700 527 115 2674 582 1694 369 4368 950 63
*The source population is derived from Statistics New Zealand population projections. ** This shows the number of patients living with a kidney transplant per every 100 dialysis patients. Incidence – the number of patients commencing dialysis treatment or pre-emptive transplantation at first treatment for end-stage kidney disease during the 2015 calendar year. Prevalence – the number of patients receiving dialysis or transplantation treatment for end-stage kidney disease at the end of the calendar year (i.e. 31/12/2015). PMP – Per million of the population. Unit coverage – The named District Health Boards provide dialysis and transplant services to their own population and other District Health Boards. The DHB populations being served by the central DHBs are: Northland (Northland DHB), Waitemata (Waitemata DHB), Auckland (Auckland DHB & Starship Hospital), Counties Manukau (Counties Manukau DHB), Waikato (Waikato, Bay of Plenty, Lakes and Tairāwhiti DHBs), Hawke’s Bay (Hawke’s Bay DHB), MidCentral (Whanganui and MidCentral DHBs), Taranaki (Taranaki DHB), Capital & Coast (Capital & Coast, Hutt, Wairarapa and Nelson Marlborough DHBs), Canterbury (Canterbury, West Coast and South Canterbury DHBs), Southern (Southern DHB) . Data for children are not shown separately. Data for incident patients were not routinely collected at Hawke’s Bay DHB in the 2015 calendar year.

16 2015 NEW ZEALAND NEPHROLOGY ANNUAL DATA REPORT
Starting treatment: Modality
• Most incident patients in NZ started treatment with haemodialysis in 2015 (55.6%), with 39.8% starting with peritoneal dialysis and 4.6% with a kidney transplant (Figure 3.3).
• Treatment modality rates have been relatively static over the past decade (Figure 3.2), although a trend for decreasing use of haemodialysis and increasing use of peritoneal dialysis has started to emerge in 2014-2015.
• In 2015, only 24 patients (4.6%) received a kidney transplant as their first treatment for end-stage kidney disease. This compared with 16 in 2010, 15 in 2011, 18 in 2012, 19 in 2013 and 24 in 2014.
• There is wide regional variation in rates of pre-emptive transplantation, ranging from 0% of patients at Northland, Waikato, and MidCentral DHBs to 18.8% at Canterbury DHB (Figure 3.4).
• The proportion of patients starting with peritoneal dialysis varied from 26.9% at MidCentral DHB to 57.1% at Southern DHB.
Figure 3.3 Trends in incident treatment modality in NZ, 2006-2015
Figure 3.4 Treatment modality on starting renal replacement therapy, 2011-2015, by treating DHB
65.5 66.564.3
61.665.2 65.4 64 64.2 62.5
55.6
31.928
30.834.2
31.7 31.6 32.5 32.4 33.7
39.8
2.65.6 4.8 4.1 3.1 3.1 3.5 3.4 3.8 4.6
0
10
20
30
40
50
60
70
2006 2007 208 2009 2010 2011 2012 2013 2014 2015
Perc
ent o
f new
pat
ient
s
Trends in incident modality, 2006-2015
Haemodialysis
Peritoneal dialysis
Transplant
0% 20% 40% 60% 80% 100%
20112012201320142015
20112012201320142015
20112012201320142015
20112012201320142015
20112012201320142015
20112012201320142015
20112012201320142015
20112012201320142015
20112012201320142015
20112012201320142015
20112012201320142015
20112012201320142015
Nort
hlan
dW
aite
mat
aAu
ckla
ndSt
arsh
ipCo
untie
sM
anuk
auW
aika
toHa
wke
's Ba
yTa
rana
kiM
idCe
ntra
lCa
pita
l and
Coa
stCa
nter
bury
Sout
hern
Peritoneal dialysis Haemodialysis Transplant

17 2015 NEW ZEALAND NEPHROLOGY ANNUAL DATA REPORT
Starting treatment: Age
• The older age groups had the highest incidence of RRT in 2015 (Figure 3.4). The incidence was highest in the 65-74-year-old age group with an incidence of 311 pmp.
• The incidence of RRT among patients 85+ years remains low. There were no patients starting dialysis in this age group in NZ in 2015.
• Younger patients aged between 0 and 25 years experienced a dialysis incidence of 13 pmp.
• 52 patients commenced dialysis at 75 years or older and 3 started treatment at 85 years or older in 2014.
• The proportion of older patients in the 75-84-year-old age group starting treatment appears to be increasing (Figure 3.4).
Figure 3.4 Starting renal replacement therapy, by age group, 2011-2015 12 20
10 1613
65 6385
74 77
219
254 253
222
227
380
324
364
406
311
224 216 224
274260
73
1455
390
0
50
100
150
200
250
300
350
400
450
2011 2012 2013 2014 2015
Inci
denc
e, p
er m
illio
n po
pula
tion
Incidence of end-stage kidney disease by age in New Zealand 2011-2015
0-24
25-44
45-64
65-74
75-84
85+
18 2015 NEW ZEALAND NEPHROLOGY ANNUAL DATA REPORT
Starting treatment: Ethnicity
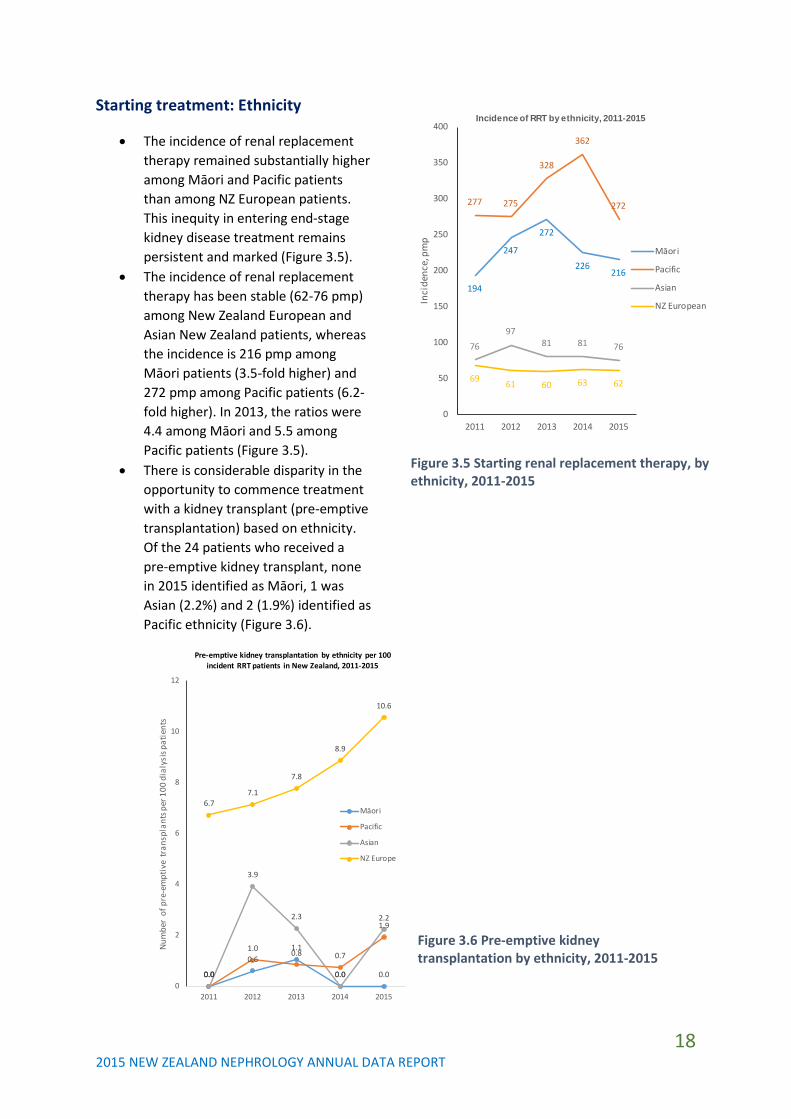
• The incidence of renal replacement therapy remained substantially higher among Māori and Pacific patients than among NZ European patients. This inequity in entering end-stage kidney disease treatment remains persistent and marked (Figure 3.5).
• The incidence of renal replacement therapy has been stable (62-76 pmp) among New Zealand European and Asian New Zealand patients, whereas the incidence is 216 pmp among Māori patients (3.5-fold higher) and 272 pmp among Pacific patients (6.2-fold higher). In 2013, the ratios were 4.4 among Māori and 5.5 among Pacific patients (Figure 3.5).
• There is considerable disparity in the opportunity to commence treatment with a kidney transplant (pre-emptive transplantation) based on ethnicity. Of the 24 patients who received a pre-emptive kidney transplant, none in 2015 identified as Māori, 1 was Asian (2.2%) and 2 (1.9%) identified as Pacific ethnicity (Figure 3.6).
0.0
0.61.1
0.0 0.00.0
1.0 0.8 0.7
1.9
0.0
3.9
2.3
0.0
2.2
6.77.1
7.8
8.9
10.6
0
2
4
6
8
10
12
2011 2012 2013 2014 2015
Num
ber
of p
re-e
mpt
ive
tran
spla
nts p
er 1
00 d
ialy
sis p
atie
nts
Pre-emptive kidney transplantation by ethnicity per 100 incident RRT patients in New Zealand, 2011-2015
Māori
Pacific
Asian
NZ Europe
Figure 3.5 Starting renal replacement therapy, by ethnicity, 2011-2015
Figure 3.6 Pre-emptive kidney transplantation by ethnicity, 2011-2015
194
247
272
226216
277 275
328
362
272
7697
81 81 76
69 61 60 63 62
0
50
100
150
200
250
300
350
400
2011 2012 2013 2014 2015In
cide
nce,
pm
p
Incidence of RRT by ethnicity, 2011-2015
Māori
Pacific
Asian
NZ European

19 2015 NEW ZEALAND NEPHROLOGY ANNUAL DATA REPORT
4 Prevalence of renal replacement therapy
• In 2015, 4368 patients were treated with dialysis or a kidney transplant, which was an increase of 1.4% from 2014 (Figure 4.1).
• The prevalence of dialysis has increased from 546 pmp in 2011 to 582 pmp in 2015, but has been stable in the last 3 years.
• The prevalence of kidney transplantation has increased from 338 pmp in 2011 to 369 pmp in 2015. The proportion of patients treated with a kidney transplant has increased year-on-year.
• The prevalence of renal replacement therapy was highly variable across DHBs ranging from 637 pmp at Canterbury (lowest) to 1501 at Counties Manukau (highest) (Figure 4.2).
Figure 4.2 Prevalence of renal replacement therapy per million of DHB population, 2011-2015
Figure 4.1 Prevalence of renal replacement therapy, 2011-2015
0
500
1000
1500
2000
2500
3000
3500
4000
4500
5000
2011 2012 2013 2014 2015
Num
ber
of p
atie
nts
Prevalence of RRT, New Zealand 2011-2015
Transplantation
Dialysis
0 200 400 600 800 1000 1200 1400 1600
20112012201320142015
20112012201320142015
20112012201320142015
20112012201320142015
20112012201320142015
20112012201320142015
20112012201320142015
20112012201320142015
20112012201320142015
20112012201320142015
20112012201320142015
20112012201320142015
Nor
thla
ndW
aite
mat
aAu
ckla
ndSt
arsh
ipCo
untie
s Man
ukau
Wai
kato
Haw
ke's
Bay
Tara
naki
Mid
Cent
ral
Capi
tal C
oast
Cant
erbu
rySo
uthe
rn
Number per million of population
Prevalent ESKD patients pmp 2011-2015
Dialysis Transplant

20 2015 NEW ZEALAND NEPHROLOGY ANNUAL DATA REPORT
Modality
• 4320 adult patients were treated with dialysis (582 pmp) and 1589 (369 pmp) were treated with transplantation at end of calendar year 2015.
• 6 children and adolescents were treated with dialysis and 42 were treated with kidney transplantation at end of calendar year 2015.
• Most DHBs treat proportionally more patients with dialysis than transplantation, with the exception of Starship, Capital and Coast, Canterbury, and Southern DHBs.
• Most patients treated with dialysis in NZ received facility-based haemodialysis within a hospital centre or satellite unit (Figure 4.3).
• The proportion of dialysis patients receiving facility haemodialysis treatment continued to increase year on year from 27.9% in 2006 to 32.1% in 2015 (Figure 4.4). PD treatment rates appeared to fall in proportion with increasing facility haemodialysis.
• The number and proportion of dialysis patients treated with peritoneal dialysis (either automated or continuous ambulatory) has fallen from 23.5% of RRT patients in 2006 to 18.1% in 2015.
• The proportion of patients on peritoneal dialysis is falling mainly due to falling rates of CAPD (from 11.4% of all RRT in 2011 to 8.6% in 2015). The rates of APD have remained at approximately 10% of all RRT.
• The proportion of dialysis patients treated with home haemodialysis has remained largely unchanged (16.1% of dialysis in 2006 to 18.0%) in 2015.
• The number of home haemodialysis patients as a proportion of all haemodialysis has remained
unchanged at between 25-28% over the previous decade.
• The overall proportion of dialysis patients treated with any home-based dialysis is decreasing (from 54.0% in 2005 to 48.6% in 2014) due to decreasing use of CAPD and increasing facility dialysis.
Figure 4.3 Prevalent modality of treatment for end-stage kidney disease, 2006-2015
23.522.1 22.1 21.7 21.7 20.5 19.5 20 19 18.1
27.929.6 29.3 29.9 29.5 30 30.6 30.8 31.9 32.1
9.9 9.7 9.6 10.3 11.1 11.2 11.9 11.5 11.4 11
38.6 38.6 39.1 38.1 37.7 38.3 38.1 37.7 37.7 38.8
0
5
10
15
20
25
30
35
40
45
2006 2007 2008 2009 2010 2011 2012 2013 2014 2015
Perc
enta
ge
Prevalence of RRT, 2006-2015
PD
Facility HD
Home HD
Transplantation
38.336.0 36.3 35.1 34.8 33.2 31.5 32.1 30.5 29.6
45.448.2 48.1 48.3 47.4 48.6 49.4 49.4
51.2 52.5
16.1 15.8 15.8 16.6 17.8 18.2 19.2 18.5 18.3 18.0
0
10
20
30
40
50
60
2006 2007 2008 2009 2010 2011 2012 2013 2014 2015
Perc
enta
ge
Prevalence of dialysis modalities, 2006-2015
PD
Facility HD
Home HD
Figure 4.4 Prevalent dialysis modality, 2006-2015 (expressed as percentage of dialysis patients)

21 2015 NEW ZEALAND NEPHROLOGY ANNUAL DATA REPORT
• Patterns of the modality for dialysis treatment remains highly variable across treating DHBs (Figure 4.5).
• The prevalence of peritoneal dialysis ranged from 9.3% of all ESKD patients at Waitemata to 30.1% at Waikato.
• The proportion treated with automated PD ranged from 16.8% at Waikato and 22.3% at Taranaki to 5.6% at MidCentral and 5.8% at Auckland.
• The proportion of patients who did home haemodialysis was highest at Southern (27.5% of all patients) and lowest at Capital & Coast (5.7%) and Northland (6.9%) DHBs.
• The modalities of treatment at Starship show variation due to the relatively smaller numbers of children treated at this centre.
• Satellite dialysis was provided to a substantial number of patients at Northland, Waitemata, Auckland, Counties Manukau, and Waikato. The proportion on satellite dialysis at Counties Manukau continues to decrease, while the numbers treated with satellite dialysis at Capital Coast, Waitemata, and Northland appear to be increasing. Regional (Taranaki, MidCentral) and South Island (Canterbury and Southern) DHBs report no satellite facility dialysis treatment.
• As a proportion of the overall NZ population, Māori and Pacific patients are over-represented in the number of patients treated with dialysis each year, and under-represented in the number of patients who are treated with a kidney transplant.
0 20 40 60 80 100
20112012201320142015
20112012201320142015
20112012201320142015
20112012201320142015
20112012201320142015
20112012201320142015
20112012201320142015
20112012201320142015
20112012201320142015
20112012201320142015
20112012201320142015
20112012201320142015
Nor
thla
ndW
aite
mat
aAu
ckla
ndSt
arsh
ipCo
untie
s Man
ukau
Wai
kato
Haw
ke's
Bay
Tara
naki
Mid
Cent
ral
Capi
tal &
Coa
stCa
nter
bury
Sout
hern
Per centPrevalent modality (2011-2015)
APD CAPD Hosp HD
Sat HD Home HD Transplant
Figure 4.5 Prevalent treatment modality for end-stage kidney disease, by treating DHB.

22 2015 NEW ZEALAND NEPHROLOGY ANNUAL DATA REPORT
Diabetes
• 54% of patients treated with dialysis in 2015 had a recorded diagnosis of diabetes (Figure 4.6). 22% of kidney transplant recipients had a diagnosis of diabetes.
• This proportion is increasing year on year (increased from 45% in 2006 in dialysis patients and 17% for transplant patients).
• The proportion of dialysis patients with a documented diagnosis of diabetes is markedly higher than among kidney transplant patients.
Figure 4.6 Proportion of patients with a documented diagnosis of diabetes, 2006-2014
45 46 4749 50 50
52 53 54 54
17 17 17 17 1820 20 20 21 22
0
10
20
30
40
50
60
2006 2007 208 2009 2010 2011 2012 2013 2014 2015
Diab
etes
, %
Prevalence of diabetes by modality, %
Dialysis
Transplant

23 2015 NEW ZEALAND NEPHROLOGY ANNUAL DATA REPORT
5 Late specialist assessment
• In this report, a late specialist assessment is defined as a first nephrology specialist assessment occurring within 90 days of commencing renal replacement therapy (usually dialysis). Late specialist assessment may necessitate starting dialysis rather than receiving a kidney transplant as first treatment.
• Overall, 13.1% of patients started dialysis within 90 days of their first specialist assessment (compared with 14.1% in 2014). The rate is falling overall in NZ and appears to be decreasing markedly for Pacific patients (Figure 5.1).
• The late assessment rate was generally <20% at all DHBs (except at Taranaki and MidCentral), ranging from 6.5% at Canterbury to 30.8% at Taranaki. The rate at Counties Manukau has halved in 5 years (Figure 5.2). Taranaki and MidCentral DHBs showed a marked increase in late referrals in 2015.
Figure 5.1 Late referral by ethnicity, 2011-2015
Figure 5.2 Late specialist assessment rates 2011-2015, by treating DHB
0
5
10
15
20
25
30
2011 2012 2013 2014 2015
Late
ref
erra
l, %
Late referral to nephrology services, by ethnicityNew Zealand 2011-2015
NZ European
Māori
Pacific
Overall
0 20 40 60 80 100
20112012201320142015
20112012201320142015
20112012201320142015
20112012201320142015
20112012201320142015
20112012201320142015
20112012201320142015
20112012201320142015
20112012201320142015
20112012201320142015
20112012201320142015
Nor
thla
ndW
aite
mat
aAu
ckla
ndCo
untie
s Man
ukau
Wai
kato
Haw
ke's
Bay
Tara
naki
Mid
Cent
ral
Capi
tal &
Coa
stCa
nter
bury
Sout
hern
Per cent
Late assessment, %
2015 national average, 13.1%

24 2015 NEW ZEALAND NEPHROLOGY ANNUAL DATA REPORT
6 Transplantation • Transplantation rates include kidney
transplants from living donors and deceased donors. A small number of New Zealanders receive a kidney transplant together with another transplanted organ.
• There were 74 living donor kidney transplants and 73 deceased donor kidney transplants in 2015 (Figure 6.1)
• Overall, kidney transplantation rates (PMP) remain relatively unchanged or fell between 2007 and 2013, but have increased steadily in the years 2014 and 2015 coincident with the new National Renal Transplant Service (Figure 6.1).
• The total of 147 transplants is the highest number of transplants ever performed in one year in New Zealand and represents a 1.3-fold increase on the 2007-2013 average of 117 per year.
• In 2015, 472 patients were on the waiting list for a kidney transplant.
Multi-organ transplantation
• In 2015, two patients received a combined kidney and liver transplant (referring DHBs Northland and Counties Manukau) and two patients received a combined kidney and pancreas transplant (referring DHBs Canterbury and MidCentral). All multi-organ transplants were done in Auckland
Kidney transplant exchange program
• In 2015, there were two kidney exchange chains completed, providing 4 kidney transplants. All exchange transplants were undertaken in Auckland.
ABO incompatible transplantation
• In 2015, there were 9 ABO incompatible kidney transplants performed (8 Auckland and 1 Canterbury). This compares with 7 in 2014 (Table 6.1).
Table 6.1 Summary of ABO blood group incompatible kidney transplantation
Transplant DHB Referring DHB Number Auckland Northland 1 Auckland Waitemata 1 Auckland Auckland 2 Auckland Counties
Manukau 3
Auckland Capital & Coast 1 Canterbury Canterbury 1
Figure 6.1 Living and decreased donor kidney transplantation 2006-2015
0
20
40
60
80
100
120
140
160
2006 2007 2008 2009 2010 2011 2012 2013 2014 2015
Num
ber
of tr
ansp
lant
s
Living and deceased donor kidney transplantation, 2006-2015
Living donor transplantsDeceased donor transplantsTotal

25 2015 NEW ZEALAND NEPHROLOGY ANNUAL DATA REPORT
Transplantation rates by District Health Board
• Transplantation rates are highly variable across DHBs by including the proportion of living to deceased donor transplantation (Figure 6.2).
• Among the five largest DHBs (those serving populations of >500,000), increases in transplantation per million population (PMP) occurred in Waitemata, Capital & Coast, and Canterbury.
• The highest rate of transplantation overall (particularly in living donation) was seen at Counties Manukau in 2014 and 2015. Conversely, there has been little change at Waikato, the largest DHB serving pop. 764,000.
Figure 6.2 Kidney transplantation per million of population, 2011-2015.
0 20 40 60 80 100
20112012201320142015
20112012201320142015
20112012201320142015
20112012201320142015
20112012201320142015
20112012201320142015
20112012201320142015
20112012201320142015
20112012201320142015
20112012201320142015
20112012201320142015
Nor
thla
ndW
aite
mat
aAu
ckla
ndCo
untie
sM
anuk
auW
aika
toHa
wke
's B
ayTa
rana
kiM
idCe
ntra
lCa
pita
l & C
oast
Cant
erbu
rySo
uthe
rn
Kidney transplants per mill ion population
Living donor Deceased donor

26 2015 NEW ZEALAND NEPHROLOGY ANNUAL DATA REPORT
• Transplantation rates relative to the number of treated dialysis patients, are also highly variable across DHBs (Figure 6.3).
• In 2015, the transplantation rate per 100 dialysis patients ranged from 1.9 at Taranaki to 13.9 at Canterbury. The national average was just 5 per 100 dialysis patients, and has increased slowly but steadily since 2012.
• Among the five largest DHBs (by population), the highest transplantation rates per 100 dialysis patients are seen in Capital & Coast and Canterbury, driven by high rates of living donation. However, both of these DHBs have a lower prevalence of dialysis patients (<500 PMP) compared with national averages.
• Among the DHBs with the highest prevalence of patients on dialysis PMP (Counties Manukau, Northland (>1000 PMP), Auckland and Waikato (>600 PMP), transplantation rates remain less than the national average of 5 per 100 dialysis patients.
• The wide variation in transplantation rates between referring DHBs is observed year on year and likely to be related to complex practice and patient-related characteristics. Further investigation of these characteristics (e.g. with adjustment for patient demographics, comorbidities) could aid the understanding these differences and identify whether quality and service improvements at local level are possible that might improve access to transplantation.
0 5 10 15 20
20112012201320142015
20112012201320142015
20112012201320142015
20112012201320142015
20112012201320142015
20112012201320142015
20112012201320142015
20112012201320142015
20112012201320142015
20112012201320142015
20112012201320142015
20112012201320142015
Nor
thla
ndW
aite
mat
aAu
ckla
ndCo
untie
s Man
ukau
Wai
kato
Haw
ke's
Bay
Tara
naki
Mid
Cent
ral
Capi
tal &
Coa
stCa
nter
bury
Sout
hern
Ove
rall
Kidney transplants per 100 dialysis patients
Living donor % Deceased donor %
Figure 6.3 Kidney transplantation per 100 dialysis patients, 2011-2015 by referring DHB.

27 2015 NEW ZEALAND NEPHROLOGY ANNUAL DATA REPORT
7 Peritoneal dialysis Delay in starting peritoneal dialysis
• The percentage of patients who experienced delay in starting peritoneal dialysis (PD) defined as longer than 90 days after first needing treatment for end-stage kidney disease was 6.2% in 2015.
• However, a national average for NZ obscures the very wide variation in PD commencement practices across different DHBs and within DHBs from year to year (Figure 7.1).
• The rate of delay has markedly fallen since 2013 at Counties Manukau, despite being one of the largest NZ dialysis units. The marked improvement at Waikato DHB observed since 2012 has somewhat stalled.
• A marked increase in PD delay in 2015 was seen at Taranaki, mainly driven by increases in delays < 90 days.
Figure 7.1 Delay starting peritoneal dialysis, 2011-2015 by treating DHBs
0 20 40 60 80 100
20112012201320142015
20112012201320142015
20112012201320142015
20112012201320142015
20112012201320142015
20112012201320142015
20112012201320142015
20112012201320142015
20112012201320142015
20112012201320142015
20112012201320142015
20112012201320142015
Nor
thla
ndW
aite
mat
aAu
ckla
ndSt
arsh
ipCo
untie
s Man
ukau
Wai
kato
Haw
ke's
Bay
Tara
naki
Mid
Cent
ral
Capi
tal &
Coa
stCa
nter
bury
Sout
hern
Per cent
Delay commencing PD 2011-2015
<90 days >=90 days

28 2015 NEW ZEALAND NEPHROLOGY ANNUAL DATA REPORT
Peritoneal dialysis peritonitis rates
• The number of PD peritonitis episodes for every year of PD treatment per patient ranged from 0.26 at the Southern DHB to 0.74 at the Hawke’s Bay DHB (Figure 7.2). The current International Society for Peritoneal Dialysis guideline recommends a target of below 0.5 episodes per patient-year of treatment.
• The number of episodes per patient year of treatment in 2015 (by DHB) were (DHBs not reaching ISPD target in bold):
o Northland: 0.36 o Waitemata: 0.36 o Auckland: 0.34 o Starship: 1.50 o Counties Manukau: 0.55 o Waikato: 0.55 o Hawke’s Bay: 0.74 o Taranaki: 0.50 o MidCentral: -- o Capital & Coast: 0.40 o Canterbury: 0.45 o Southern: 0.26
• The PD peritonitis rate appears to be
increasing at Northland, Waitemata, and Hawke’s Bay DHBs. The rate appears to be decreasing at Auckland, Counties Manukau, and Southern DHBs.
• Wide variation in PD peritonitis rates at some treating DHBs make interpretation of trends difficult. There does not appear to be a relationship between DHB unit size and trend in PD peritonitis rate.
Figure 7.2 Peritoneal dialysis-related peritonitis rates (episodes per year of PD treatment) 2011-2015 by treating DHB (ISPD target shown by red line)
0 0.2 0.4 0.6 0.8
20112012201320142015
20112012201320142015
20112012201320142015
20112012201320142015
20112012201320142015
20112012201320142015
20112012201320142015
20112012201320142015
20112012201320142015
20112012201320142015
20112012201320142015
Nor
thla
ndW
aite
mat
aAu
ckla
ndCo
untie
s M
anuk
auW
aika
toHa
wke
's Ba
yTa
rana
kiM
idCe
ntra
lCa
pita
l & C
oast
Cant
erbu
rySo
uthe
rn
PD peritonitis rate NZ 2011-2015Number of episodes per patient year

29 2015 NEW ZEALAND NEPHROLOGY ANNUAL DATA REPORT
8 Vascular access for haemodialysis Prevalent haemodialysis vascular access
• In 2015, 77% of prevalent haemodialysis patients were dialysing with permanent vascular access (either an arteriovenous fistula or graft) (Figure 8.1). This is above the national recommended standard of 70%.
• Most DHBs reached the national standard of 70%. Rates of permanent access improved at Counties Manukau and Hawke’s Bay in 2015, now meeting the national standard.
• The prevalence of permanent dialysis access at the Taranaki DHB continues to be well below the national standard (46%) with a very high rate of tunnelled central venous catheters as the primary access for dialysis
(54%). The Taranaki DHB currently relies on services from Waikato DHB for vascular access surgery.
• The marked variation in use of arteriovenous grafts persists with the highest prevalence of AV grafts as 15% of all dialysis vascular access at the Waikato DHB.
• Central venous catheter use was predominantly with tunnelled central venous catheters at all DHBs. The central venous catheter rate ranged from 11% at Southern to 31% at MidCentral DHB and 54% at Taranaki DHB.
0 50 100
Northland
Waitemata
Auckland
Counties Manukau
Waikato
Hawke's Bay
Taranaki
MidCentral
Capital & Coast
Canterbury
Southern
Per cent
AVF
AV graft
Tunnelled CVC
Non-tunnelled CVC
Missing
NZ standard 70%
Figure 8.1 Prevalent haemodialysis vascular access, 2015, by treating DHB.

30 2015 NEW ZEALAND NEPHROLOGY ANNUAL DATA REPORT
Incident vascular access (all patients starting dialysis)
• The proportion of patients who commenced haemodialysis with permanent vascular access remained highly variable across treating DHBs (Figure 8.2).
• No DHBs achieved the national standard of permanent vascular access (50% of all patients starting dialysis).
• There is year on year increases in permanent access at Counties Manukau DHB. Many DHBs have seen marked reductions in permanent vascular access in 2015 including Hawke’s Bay, Taranaki, MidCentral, Canterbury, and Southern DHBs.
• The proportion of all patients starting haemodialysis with permanent access in 2015 were:
o Northland: 45.5% o Waitemata 32.4% o Auckland: 25% o Counties Manukau: 32.1% o Waikato: 34.5% o Hawke’s Bay: 17.7% o Taranaki: 11.1% o MidCentral: 15.8% o Capital & Coast: 41% o Canterbury 11.8% o Southern: 20.0%
Figure 8.2 Dialysis vascular access in all patients starting haemodialysis as first treatment (including patients who had first specialist assessment within 3 months of starting dialysis), 2011-2015, by treating DHB.
0 20 40 60 80 100
20112012201320142015
20112012201320142015
20112012201320142015
20112012201320142015
20112012201320142015
20112012201320142015
20112012201320142015
20112012201320142015
20112012201320142015
20112012201320142015
20112012201320142015
20112012201320142015
Nor
thla
ndW
aite
mat
aAu
ckla
ndSt
arsh
ipCo
untie
sM
anuk
auW
aika
toHa
wke
's B
ayTa
rana
kiM
idCe
ntra
lCa
pita
l & C
oast
Cant
erbu
rySo
uthe
rn
Per cent
Incident HD access 2011-2015
AVF AVG Tunnelled CVC Non-tunnelled CVC
NZ standard: 50% AV acces

31 2015 NEW ZEALAND NEPHROLOGY ANNUAL DATA REPORT
Incident vascular access for haemodialysis (late referrals excluded)
• National practice patterns for vascular access among patients who started haemodialysis >3 months of their first specialist assessment) is shown in Figure 8.3. The national standard is >80% patients starting dialysis with an arteriovenous fistula or graft.
• In 2015, many DHBs reached the national standard through increases in permanent access including Northland, Auckland, Counties Manukau, Capital and Coast and Canterbury DHBs.
• The rate of permanent haemodialysis access has fallen in Waitemata, Taranaki, and Southern DHBs.
• Information about vascular access was missing for Hawke’s Bay DHB.
Figure 8.3 Dialysis vascular access in patients who started haemodialysis >3 months after first specialist appointment 2011-2015, by treating DHB.
0 20 40 60 80 100
20112012201320142015
20112012201320142015
20112012201320142015
20112012201320142015
20112012201320142015
20112012201320142015
20112012201320142015
20112012201320142015
20112012201320142015
20112012201320142015
20112012201320142015
Nor
thla
ndW
aite
mat
aAu
ckla
ndCo
untie
s Man
ukau
Wai
kato
Haw
ke's
Bay
Tara
naki
Mid
Cent
ral
Capi
tal &
Coa
stCa
nter
bury
Sout
hern
Per cent
Incident HD access 2011-2015 (late referrals excluded)
AVF AVG Tunnelled CVC Non-tunnelled CVC
NZ standard: 80% AV acce

32 2015 NEW ZEALAND NEPHROLOGY ANNUAL DATA REPORT
Catheter-associated blood stream infections (CABSI)
• The rate of central venous catheter-associated blood stream infections (CABSI) varies considerably among DHBs and from year to year within DHBs (Figure 8.4).
• The average nationwide infection rate in 2015 was 1.08 infection events for every 1000 catheter-days.
• All DHBs achieved CABSI rates well below the national standard of 4 events per 1000 catheter days, suggesting the standard may need to be reviewed.
• CABSI rates are decreasing at Hawke’s Bay, MidCentral, and Counties Manukau DHB. Rates appear to be increasing at Capital & Coast DHB.
As the current NRAB standard of 4 infections per 1000 catheter days is being achieved by all units, the standard appears to require re-assessment. Based on a possible new standard <1 good, 1-2 acceptable, and >2 not acceptable, 8 DHBs would meet the good standard (Waitemata, Auckland, Counties Manukau, Hawke’s Bay, Taranaki, MidCentral, and Southern), 3 DHBs would meet the acceptable standard (Northland, Capital & Coast, Canterbury), and one treating unit (Starship) would meet the not acceptable standard.
Figure 8.4 Catheter-associated blood stream infections (CABSI) of central venous dialysis catheters, 2011-2015, by treating DHB
0 1 2 3 4
20112012201320142015
20112012201320142015
20112012201320142015
20112012201320142015
20112012201320142015
20112012201320142015
20112012201320142015
20112012201320142015
20112012201320142015
20112012201320142015
20112012201320142015
20112012201320142015
Nor
thla
ndW
aite
mat
aAu
ckla
ndSt
arsh
ipCo
untie
s Man
ukau
Wai
kato
Haw
ke's
Bay
Tara
naki
Mid
Cent
ral
Capi
tal &
Coa
stCa
nter
bury
Sout
hern
Per 1000 catheter days
Dialysis vascular catheter-associated blood stream infections
NZ average 20150.95 event per 1000 catheter days
National standard4 events per 1000 catheter days

33 2015 NEW ZEALAND NEPHROLOGY ANNUAL DATA REPORT
Current dialysis vascular access practices
Treating DHB Vascular access lock Northland Gentamicin/heparin Waitemata Gentamicin/heparin (changed to heparin only in 2015) Auckland Gentamicin/citrate Counties Manukau Gentamicin/heparin (changed to gentamicin/heparin in 2015) Waikato Gentamicin/citrate Hawke’s Bay Gentamicin/heparin Taranaki -- MidCentral Heparin Capital & Coast Heparin Canterbury Gentamicin/heparin Southern Heparin
34 2015 NEW ZEALAND NEPHROLOGY ANNUAL DATA REPORT
9 Haemodialysis adequacy, frequency, and treatment duration Duration of haemodialysis
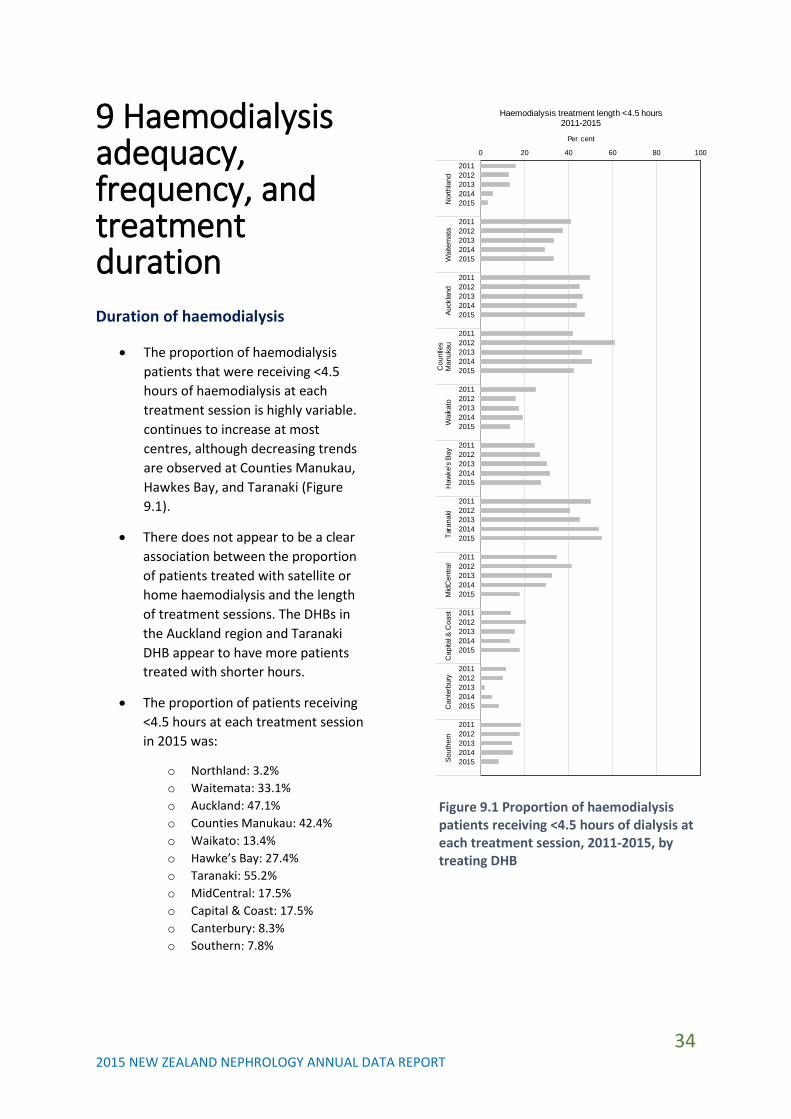
• The proportion of haemodialysis patients that were receiving <4.5 hours of haemodialysis at each treatment session is highly variable. continues to increase at most centres, although decreasing trends are observed at Counties Manukau, Hawkes Bay, and Taranaki (Figure 9.1).
• There does not appear to be a clear association between the proportion of patients treated with satellite or home haemodialysis and the length of treatment sessions. The DHBs in the Auckland region and Taranaki DHB appear to have more patients treated with shorter hours.
• The proportion of patients receiving <4.5 hours at each treatment session in 2015 was:
o Northland: 3.2% o Waitemata: 33.1% o Auckland: 47.1% o Counties Manukau: 42.4% o Waikato: 13.4% o Hawke’s Bay: 27.4% o Taranaki: 55.2% o MidCentral: 17.5% o Capital & Coast: 17.5% o Canterbury: 8.3% o Southern: 7.8%
Figure 9.1 Proportion of haemodialysis patients receiving <4.5 hours of dialysis at each treatment session, 2011-2015, by treating DHB
0 20 40 60 80 100
20112012201320142015
20112012201320142015
20112012201320142015
20112012201320142015
20112012201320142015
20112012201320142015
20112012201320142015
20112012201320142015
20112012201320142015
20112012201320142015
20112012201320142015
Nor
thla
ndW
aite
mat
aAu
ckla
ndC
ount
ies
Man
ukau
Wai
kato
Haw
ke's
Bay
Tara
naki
Mid
Cen
tral
Cap
ital &
Coa
stC
ante
rbur
ySo
uthe
rn
Per cent
Haemodialysis treatment length <4.5 hours2011-2015

35 2015 NEW ZEALAND NEPHROLOGY ANNUAL DATA REPORT
Frequency of haemodialysis
• Patients rarely received haemodialysis fewer than 3 times per week during 2011-2015 (Figure 9.2). There are small proportion of patients at Northland (0.8%), Counties Manukau (0.9%), Capital & Coast (2.3%), and Southern (3.1%) DHBs who received dialysis <3 days per week.
• The use of quotidian or frequent haemodialysis is highest at Waikato, Canterbury, and Southern DHBs, associated with higher use of home haemodialysis.
• Frequent haemodialysis is very infrequent at Northland, Counties Manukau, and Capital & Coast DHBs.
• The proportion of patients who received frequent haemodialysis at each DHB in 2015 was:
o Northland: 4.0% o Waitemata: 16.1% o Auckland: 16.2% o Counties Manukau: 6.8% o Waikato: 21.7% o Hawke’s Bay: 9.7% o Taranaki: 17.2% o MidCentral: 12.5% o Capital & Coast: 3.5% o Canterbury: 45.0% o Southern: 45.3%
Figure 9.2 Frequency of haemodialysis treatment sessions, 2011-2015, at treating DHBs
0 20 40 60 80 100
2011
2013
2015
2011
2013
2015
2011
2013
2015
2011
2013
2011
2013
2015
2011
2013
2015
2011
2013
2015
2011
2013
2015
2011
2013
2015
2011
2013
2015
2011
2013
2015
2011
2013
2015
Nor
thla
ndW
aite
mat
aAu
ckla
ndSt
arsh
ipCo
untie
sM
anuk
auW
aika
toHa
wke
's B
ayTa
rana
kiM
idCe
ntra
lCa
pita
l &Co
ast
Cant
erbu
rySo
uthe
rn
Per cent
HD frequency/week 2011-2015
<3/week 3/week Alt/days >3/week

36 2015 NEW ZEALAND NEPHROLOGY ANNUAL DATA REPORT
Haemodialysis adequacy
• Various measures of the adequacy of the haemodialysis dose are used by dialysis services. These are commonly the amount of urea removed by dialysis at each dialysis session (measured using the urea reduction ratio (URR) or Kt/V).
• Many treating DHBs do not measure or report dialysis adequacy. Missing data represent differing practice patterns and the difficulty in measuring dialysis adequacy for home-based haemodialysis.
• It is unclear whether dialysis clearances are associated with patient outcomes. More recently, haemodiafiltration has been reported to be associated with improved. Future reports will include the use of haemodiafiltration and high-flux dialysis.
• The proportion of patients at each DHB who received a URR ≥65% was:
o Northland: 81.7% o Waitemata: 60.8% o Auckland: 53.3% o Counties Manukau: 58.6% o Waikato: 65.8% o Hawke’s Bay: 74.6% o Taranaki: 65.5% o MidCentral: 80% o Capital & Coast: 63.0% o Canterbury: Not estimable o Southern: Not estimable.
Figure 9.3 Proportion of haemodialysis patients with urea reduction ratio (URR), 2011-2015, by treating DHB.
0 20 40 60 80 100
20112012201320142015
20112012201320142015
20112012201320142015
20112012201320142015
20112012201320142015
20112012201320142015
20112012201320142015
20112012201320142015
20112012201320142015
20112012201320142015
20112012201320142015
Nor
thla
ndW
aite
mat
aAu
ckla
ndCo
untie
s Man
ukau
Wai
kato
Haw
ke's
Bay
Tara
naki
Mid
Cent
ral
Capi
tal &
Coa
stCa
nter
bury
Sout
hern
Per cent
Urea reduction ratio 2011-2015
<65 65-99 >=100 Not reported

37 2015 NEW ZEALAND NEPHROLOGY ANNUAL DATA REPORT
10 Anaemia treatment
• Higher haemoglobin levels are associated with worse patient outcomes during treatment with epoetin. Therefore, international guidelines suggest haemoglobin levels should be kept within the range of 100-120 g/L. This includes treatment with iron and epoetin therapy.
• The overall percentage of NZ patients that have a haemoglobin level between 100-129 g/L is between 65-70% (Figure 10.1).
• The proportion of patients receiving erythropoiesis treatment appears to have increased slightly in 2015. PD patients are less likely to receive epoetin (ESA) treatment than HD patients.
Figure 10.1 Erythropoiesis-stimulating agent (ESA) prescribing patterns and haemoglobin levels, 2009-2014
70
75
80
85
90
95
100
50
55
60
65
70
75
80
2011 2012 2013 2014 2015
ESA
trea
tmen
t, %
Hae
mog
lobi
n le
vel 1
00 t
o 12
9 g/
l, %
ESA prescribing and haemoglobin levels, 2011-2015
HD, Haemoglobin target PD, Haemoglobin target
HD, ESA treatment PD, ESA treatment

38 2015 NEW ZEALAND NEPHROLOGY ANNUAL DATA REPORT
• The percentage of patients with a haemoglobin >130 g/L who continued to be prescribed an ESA, ranged from 12.5% at Canterbury to 75.3% at Counties Manukau (Figure 10.2).
• Anaemia management and any relationship with use of epoetin at DHBs warrants further analysis.
Figure 10.2 Prevalence of epoetin therapy among patients who have a haemoglobin above 130 g/l.
0 20 40 60 80 100
20112012201320142015
20112012201320142015
20112012201320142015
20112012201320142015
20112012201320142015
20112012201320142015
20112012201320142015
20112012201320142015
20112012201320142015
20112012201320142015
20112012201320142015
Nor
thla
ndW
aite
mat
aAu
ckla
ndCo
untie
s Man
kau
Wai
kato
Haw
ke's
Bay
Tara
naki
Mid
Cent
ral
Capi
tal &
Coa
stCa
nter
bury
Sout
hern
Per cent
Prevalence of epoetin therapy among patients with haemoglobin >130 g/l, 2011-2015

39 2015 NEW ZEALAND NEPHROLOGY ANNUAL DATA REPORT
11 Pre-dialysis care A summary of patients currently receiving pre-dialysis care preparing for dialysis or transplant therapy is shown in Table 11.1.
Treating DHB Pre-dialysis patients, number
Northland 203 Waitemata 292 Auckland -- Starship 8 Counties Manukau -- Waikato -- Hawke’s Bay 95 Taranaki -- MidCentral 109 Capital & Coast 55 Canterbury 85 Southern 108
Variation in the number of patients referred for pre-dialysis care may be explained by variation in referral practices and clinical care pathways. Data were not available for some DHBs.

40 2015 NEW ZEALAND NEPHROLOGY ANNUAL DATA REPORT
12 Supportive care A summary of unique patients referred to and receiving supportive care is shown in Table 12.1
Treating DHB Supportive care patients, number
Northland 27 Waitemata 67 Auckland -- Counties Manukau -- Waikato -- Hawke’s Bay 25 Taranaki -- MidCentral 20 Capital & Coast -- Canterbury 19 Southern 13
Data were not available for some DHBs.

41 2015 NEW ZEALAND NEPHROLOGY ANNUAL DATA REPORT
13 Potential action points While the determinants of practice patterns and patient outcomes at each treating DHB are complex and include contributions from patient demography, clinical comorbidity, and local practices, there are persistent areas of nephrology practice highlighted in this annual report that warrant further consideration and possible action.
Documenting local and national activities underway to address practice disparities and activities below current national standards is beyond the scope of this review.
Areas of potential further investigation and possible action include:
• Centre-specific reports of activity • Outcome data including standardized
mortality ratios and patient and graft survival (caution will be needed for comparisons between DHBs)
• Low permanent vascular access for incident and prevalent haemodialysis patients
• Disparities in rates of ESKD treatment among Māori and Pacific patients
• Pre-emptive kidney transplantation among Māori and Pacific patients and for children/adolescents
• Late referral rates among children and young adults
• Low kidney transplantation rates at some treating DHBs
• Access to home dialysis and transplantation based on gender and ethnicity
• Decreasing rates of peritoneal dialysis • Persistent ESA prescribing among
patients with haemoglobin >130 g/L • Annual surveys of practice patterns not
routinely collected within ANZDATA – e.g., transition-to-adult care, viral screening, immunisation practices.

42 2015 NEW ZEALAND NEPHROLOGY ANNUAL DATA REPORT
14 Notable New Zealand publications & reports arising from ANZDATA (2015-2017) Journal papers (in reverse date order)
1. Page M, Wyeth EH, Samaranayaka A, McNoe B, Walker R, Schollum J, Marshall M, Walker R, Derret S. Accuracy of ethnicity data recorded in hospital-based clinical records and the Australia and New Zealand Dialysis and Transplant Registry. N Z Med J. 2017;130(1454):65-71. Link
Summary: This study looked at whether self-reported ethnicity in ANZDATA agreed with ethnicity based on patient interview among patients older than 65 years. The study found that there was agreement on the ethnicity information for patients in different databases, suggesting ethnicity information in ANZDATA is accurate at least among older patients.
2. Fernando MR, Dent H, McDonal SP, Rangan GK. Incidence and survival of end-stage kidney disease due to polycystic kidney disease in Australia and New Zealand (1963-2014). Popul Health metr 2017;15(1):7. Link
Summary: The number of people affected by adult polycystic kidney disease and who develop severe kidney failure has not improved, although life expectancy and brain complications have decreased. This suggests better treatments directed at kidney protection and specifically to reduce
the formation of kidney cysts is still urgently needed.
3. Lim WH, Russ GR, Wong G, Pilmore H, Kanellis J, Chadban SJ. The risk of cancer in kidney transplant recipients may be reduced in those maintained on everolimus and reduced cyclosporine. Kidney Int 2017;91(4):954-963. Link
Summary: This study looked at whether treatment with everolimus plus reduced-exposure cyclosporin was associated with lower risks of cancer after kidney transplantation than mycophenolate mofetil and standard-exposure cyclosporin. There was possibly lower cancer rates among patients treated with everolimus and low-dose cyclosporin without apparent increased risks of rejection or transplant kidney failure.
4. Walker R, Marshall R, Howard K, Morton RL, Marshall MR. “Who matters most?”: clinician perspectives of influence and recommendations on home dialysis. Nephrology 2016: doi: 10.1111/nep.12920. Link
Summary: This study explored the influence of individuals within dialysis teams on home dialysis recommendations and uptake. The study showed that the decisional power around home dialysis in New Zealand sits with nephrologists. The study suggested nephrologists need to exercise their decisional power to advocate home dialysis and address reasons why they may not recommend home dialysis to appropriate patients.
5. Kasza J, Wolfe R, McDonald SP, Marshall MR, Polkinghorne KR. Dialysis modality, vascular access and mortality in end-stage kidney disease: a bi-national registry-based cohort study. Nephrology (Carlton). 2015 Dec 2. doi:10.1111/nep.12688. Link

43 2015 NEW ZEALAND NEPHROLOGY ANNUAL DATA REPORT
Summary: This study asked whether different dialysis modalities offered better life-expectancy for patients. Survival with home haemodialysis, facility haemodialysis (with permanent or temporary vascular access) or peritoneal dialysis was compared in over 20,000 patients. The authors found that in the first year of dialysis treatment, home haemodialysis offered the best survival, followed by facility dialysis with permanent access. Facility dialysis with a temporary catheter and peritoneal dialysis were linked with the highest risk of death in the first 12 months.
6. Marshall MR, Polkinghorne KR, Kerr PG, Hawley CM, Agar JW, McDonald SP. Intensive hemodialysis and mortality risk in Australian and New Zealand populations. Am J Kidney Dis. 2016 Apr,67(4):617-28. Link
Summary: This study looked at whether more intensive haemodialysis (more frequent or longer dialysis session) was associated with better survival. In over 40,000 patients treated between 1996 and 2012, more intensive haemodialysis (either at a facility or and home) was generally linked to improved life expectancy although was still inferior to kidney transplantation.
7. Zhang L, Liu X, Pascoe EM, Badve SV, Boudville NC, Clayton PA, De Zoysa J, Hawley CM, Kanellis J, McDonald SP, Peh CA, Polkinghorne KR, Johnson DW. Long-term outcomes of end-stage kidney disease for patients with IgA nephropathy: A multi-centre registry study. Nephrology. 2016:21(5):387-96. Link
Summary: Patients with IgA nephropathy tend to experience better dialysis and transplantation outcomes compared with patients who have other forms of kidney disease.
8. Marshall MR, Polkinghorne KR, Kerr PG, Agar JW, Hawley CM, McDonald SP. Temporal changes in mortality risk by dialysis modality in the Australian and New Zealand dialysis population. Am J Kidney Dis. 2015 Sep;66(3):489-98. Link
Summary: This study asked whether survival of patients treated with dialysis had changed over time. The investigators compared outcomes for patients starting dialysis between 1998 and 2002 with those starting dialysis during 2003-2007 and 2008-2012. Despite patients having greater medical comorbidity over time, there has been a 21% reduction in mortality for patients on facility haemodialysis, 27% reduction for peritoneal dialysis patients and 49% reduction for patients on home haemodialysis. Outcomes for dialysis are improving and are most evident for home dialysis therapies.

44 2015 NEW ZEALAND NEPHROLOGY ANNUAL DATA REPORT
15 New Zealand activities We have included here a summary of nephrology activities of interest reported by some centres for the 2015-2016 calendar year.
Starship
Starship continues to provide outreach services to most provincial centres in New Zealand. A paediatric nephrologist (Dr Robin Erikson) from Canada on a fixed-term contract. Closer collaboration with Australian paediatric centres is occurring for nephrotic syndrome protocols and research into genetic diseases. A collaboration with the renal genetics group based in Sydney is being developed to explore genetic kidney diseases including nephrotic syndrome.
Capital & Coast
The Wellington renal service has seen continual growth in dialysis patients with 250 treated across the dialysis units and home dialysis. Whilst the Kenepuru Dialysis Unit has increased to run at 20 stations, there is continued focus on growing the home-based dialysis service. A second dialysis Associate Charge Nurse Manager has been appointed to manage the workload. With the support of the Ministry funded live donor liaison coordinator saw CCDHB perform an equal record number of renal transplants in 2016.
2016 also saw the departure of Dr Nicky Hay after 23 years in the service. Dr Carolyn Clark will start in her place in February 2017.
Canterbury
Canterbury welcomed a Clinical Psychologist to join our team as well as increased FTE for Transplant Coordination. We have signed a contract for a new home dialysis training facility to replace the existing unit which has been
damaged beyond repair in the 2011 earthquakes. Dr Penny Hill, nephrologist, has joined our team.
Southern
The quality of life study in patients older than 65 years is nearing completion.