Embed Size (px)
Citation preview
FACT
SH
EET
01 J
ULY
201
3
NEW ZEALAND FAMILIES TODAY A brief demographic profile
www.nzfamilies.org.nz

ISSN 2253-5810 (Print)
ISSN 2253-5829 (Online)
ISBN 978-0-478-36936-6 (Print)
ISBN 978-0-478-36937-3 (Online)

1
STATEMENT OF INTENT
ContentsIntroduction 2
New Zealand’s population 2
Who do people live with? 3
Households 3
Families with dependent children 4
Partnerships 6
Divorce 8
Having children 9
Age of parents 10
Ex-nuptial births 11
Trends in educational attainment 13
Employment 14
Child care 15
Conclusion 16

2 | NEW ZEALAND FAMILIES TODAY FACT SHEET
Families Commission Kömihana ä Whänau
IntroductionThis brief demographic profi le presents a broad overview of the make-up of the New Zealand family in 2012 and identifi es trends over the past few decades.
The aim is to make available to the general public the
latest information on New Zealand families, and in doing
so, make them better informed of the diversity of family
life. There are dangers in simplifying demographic
trends that often vary for different groups (eg ethnic,
geographical or socio-economic), but more detailed studies
of New Zealand family and whänau are available for those
interested.1 These studies offer a more complete picture of
family trends and the factors contributing to family change.
Historical studies of the family2 show that there has never
been a period that might serve as the ‘norm’, as the nature
of family relationships has changed throughout history.
Until recently we tended to compare current family forms
with the ‘nuclear family’ model of the 1950s and 1960s
(eg mum, dad and the kids). This brief shows that this
model no longer serves to describe the variety of family
forms in New Zealand today, if indeed it ever did.
1 Pool, I., Dharmalingam, A., & Sceats, J. (2007). The New Zealand family from 1840:
A demographic history. Auckland University Press, Auckland; Families Commission (2008)
The Kiwi Nest; 60 years of change in New Zealand families. Families Commission, Wellington;
Families Commission (2011) Whänau Yesterday, Today, Tomorrow. Families Commission,
Wellington; Te Puni Kökiri (2011) Mäori: Demographic dividend for economic return. Te Puni
Kökiri, Wellington; Te Puni Kökori and FC report on Mäori demographics.
2 Coontz, S. (2005). Marriage, a History. Penguin; New York.
New Zealand’s populationNew Zealand’s population has grown steadily over the last 30 years and was estimated as 4.44 million as at 30 June 2012.3
While the rate of natural growth has been steady the
contribution of migration to population growth has
varied. In some years there has been a net fl ow out of
New Zealand (eg the mid 1980’s) and some years an
inward fl ow (eg since 2002). Immigration and the higher
birth rates, and younger age profi le, of Asian, Mäori and
Pacifi c peoples is resulting in an increasingly diverse
cultural mix for New Zealand.4
Like many ‘developed’ countries, New Zealand’s population
is aging. For example, the median age of the population
has increased from 26.4 years in 1976 to 35.8 years in
2006, and is estimated as being 37 years in 2012.
The proportion of the population who are children has
fallen, while the proportion in the 65 years plus age group
has risen. This aging of the population is likely to result
in fewer working-age New Zealanders supporting an
increasing number who have retired.5
Where New Zealanders live within New Zealand has also
undergone signifi cant change. There has been greater
growth in urban areas and the North, with the Auckland,
Hamilton and Tauranga experiencing greater than average
population growth. In 2006 86 percent of the population
was living in urban areas, with almost a third
of New Zealanders living in Auckland.
3 Demographic Trends 2011, New Zealand resident population.
4 Ministry of Social Development (2010). The Social Report. Ministry of Social Development,
Wellington. See also the recent Growing Up in New Zealand study, Morton, S. et al. (2010).
Growing up in New Zealand: A longitudinal study of New Zealand children and their families.
Report 1: Before we are born. Auckland: Growing up in New Zealand.
5 Jackson, N. (2001). The policy-maker’s guide to population ageing: key concepts and issues.
Policy Research Paper No. 13. Department of Family and Community Services, Canberra.
6 Statistics New Zealand (2012). Demographic Trends 2011. Census
7 Ministry of Social Development (2010). The Social Report. Ministry of Social Development,
Wellington.
8 For example, the Household Labour Force Survey or occasional specifi c topic surveys.
This report mainly uses data collected and
published by Statistics New Zealand6 with
additional information from the Ministry of Social
Development’s ‘Social Report’.7 With the delay
of the 2011 Census until 2013, the most recent
Census data is from the 2006 Census, unless
fi gures are based on other data sources.8 To
avoid excessive referencing, data comes from
these primary sources, unless stated otherwise
in the text.
NEW ZEALAND FAMILIES TODAY FACT SHEET | 3
Families Commission Kömihana ä Whänau
Who do people live with?Most New Zealanders live in households with other people, to whom they may or may not be biologically related.
When statistics are collected in the Census, people are
categorised as living in households and, where relevant,
in families. A household can contain one or more families,
or a person living alone, or a group of unrelated adults
(eg students fl atting together). Families are categorised in
terms of the relationships between household members
(eg a couple with or without children). Over time there may
be changes in both the composition of households and in
the main types of family.
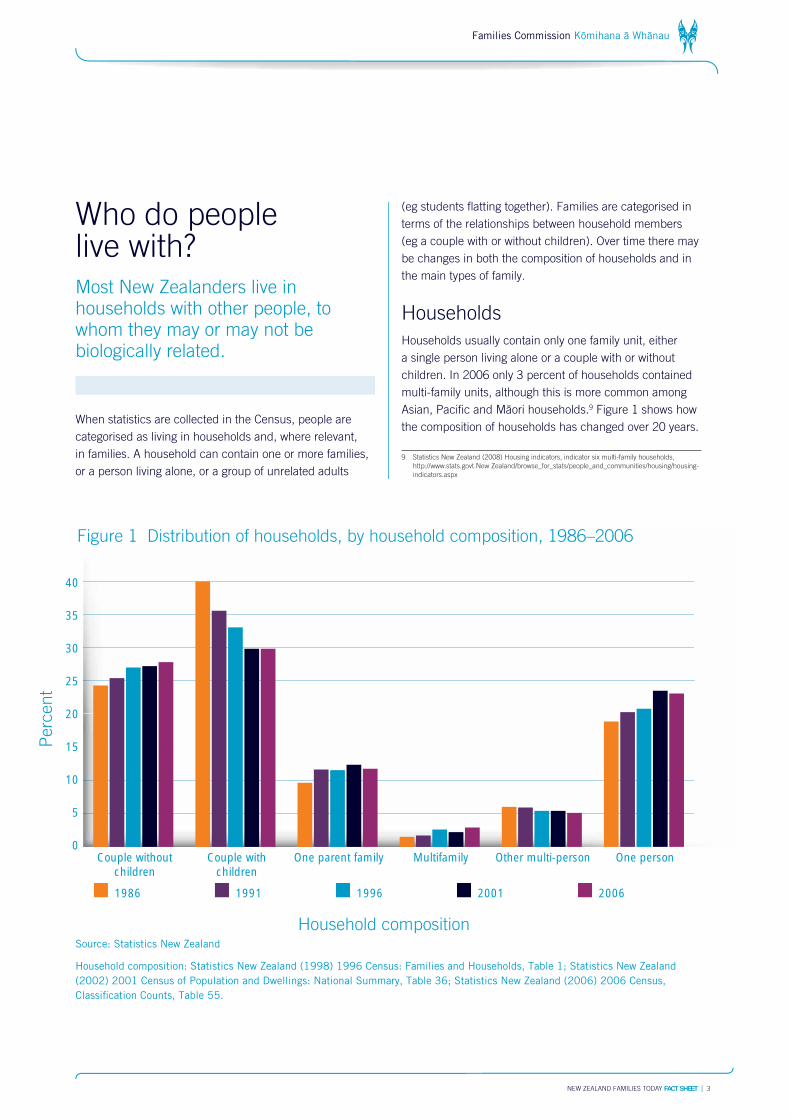
Households
Households usually contain only one family unit, either
a single person living alone or a couple with or without
children. In 2006 only 3 percent of households contained
multi-family units, although this is more common among
Asian, Pacifi c and Mäori households.9 Figure 1 shows how
the composition of households has changed over 20 years.
9 Statistics New Zealand (2008) Housing indicators, indicator six multi-family households,
http://www.stats.govt.New Zealand/browse_for_stats/people_and_communities/housing/housing-
indicators.aspx
40
35
30
25
20
15
10
5
0Couple without
childrenCouple with
childrenOne parent family Multifamily Other multi-person One person
1986 1991 1996 2001 2006
Household composition
Perc
ent
Figure 1 Distribution of households, by household composition, 1986–2006g , y p ,
Source: Statistics New Zealand
Household composition: Statistics New Zealand (1998) 1996 Census: Families and Households, Table 1; Statistics New Zealand
(2002) 2001 Census of Population and Dwellings: National Summary, Table 36; Statistics New Zealand (2006) 2006 Census,
Classifi cation Counts, Table 55.
4 | NEW ZEALAND FAMILIES TODAY FACT SHEET
Families Commission Kömihana ä Whänau
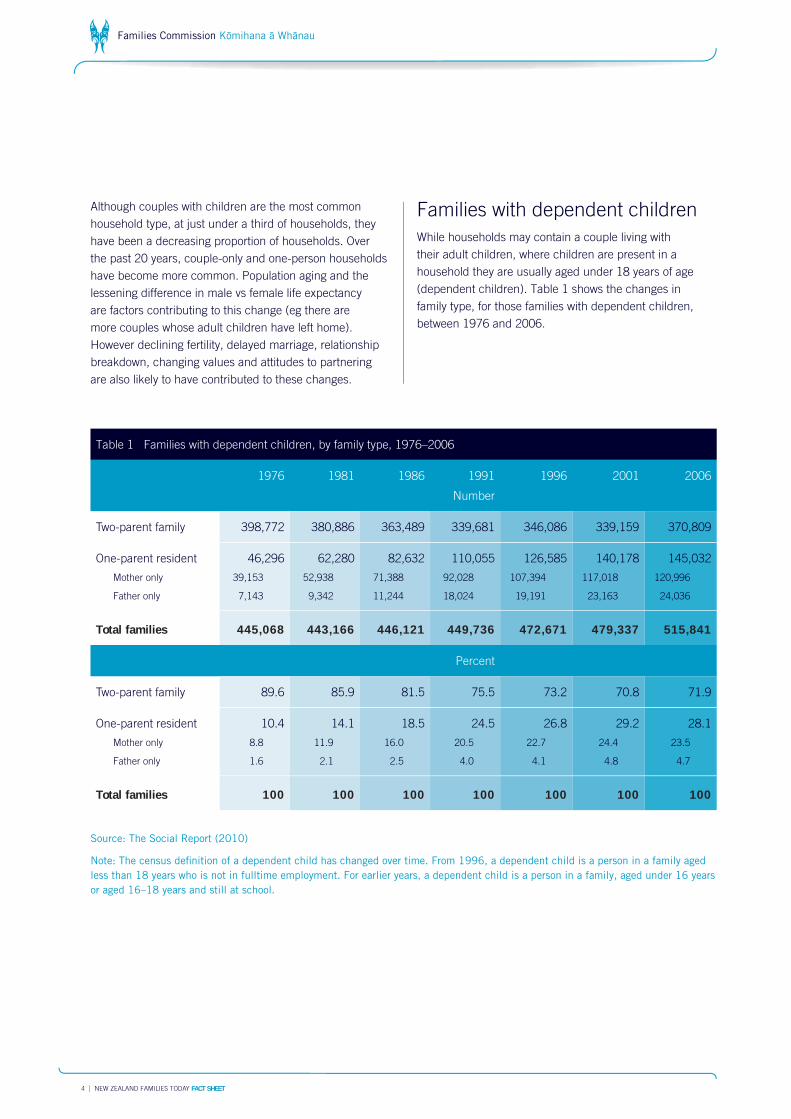
Although couples with children are the most common
household type, at just under a third of households, they
have been a decreasing proportion of households. Over
the past 20 years, couple-only and one-person households
have become more common. Population aging and the
lessening difference in male vs female life expectancy
are factors contributing to this change (eg there are
more couples whose adult children have left home).
However declining fertility, delayed marriage, relationship
breakdown, changing values and attitudes to partnering
are also likely to have contributed to these changes.
Families with dependent children
While households may contain a couple living with
their adult children, where children are present in a
household they are usually aged under 18 years of age
(dependent children). Table 1 shows the changes in
family type, for those families with dependent children,
between 1976 and 2006.
Table 1 Families with dependent children, by family type, 1976–2006
1976 1981 1986 1991 1996 2001 2006
Number
Two-parent family 398,772 380,886 363,489 339,681 346,086 339,159 370,809
One-parent resident 46,296 62,280 82,632 110,055 126,585 140,178 145,032
Mother only 39,153 52,938 71,388 92,028 107,394 117,018 120,996
Father only 7,143 9,342 11,244 18,024 19,191 23,163 24,036
Total families 445,068 443,166 446,121 449,736 472,671 479,337 515,841
Percent
Two-parent family 89.6 85.9 81.5 75.5 73.2 70.8 71.9
One-parent resident 10.4 14.1 18.5 24.5 26.8 29.2 28.1
Mother only 8.8 11.9 16.0 20.5 22.7 24.4 23.5
Father only 1.6 2.1 2.5 4.0 4.1 4.8 4.7
Total families 100 100 100 100 100 100 100
Source: The Social Report (2010)
Note: The census defi nition of a dependent child has changed over time. From 1996, a dependent child is a person in a family aged
less than 18 years who is not in fulltime employment. For earlier years, a dependent child is a person in a family, aged under 16 years
or aged 16–18 years and still at school.

NEW ZEALAND FAMILIES TODAY FACT SHEET | 5
Families Commission Kömihana ä Whänau
Since 1976 there has been a decrease in the share of
families with dependant children who are in two-parent
families, from 89.6 percent in 1976 to 71.9 percent in
2006, and an increase in sole parent families,10 from
10.4 percent in 1976 to 28.1 percent in 2006. Recent
analysis indicates that the rate of growth in the proportion
of families headed by a sole parent is levelling off.11 It
is relevant to note that in 1981 the Family Proceedings
10 It should be noted that the term ‘sole parent family/household’ is used to refer to the situation
where only one parent is living in a child’s usual residence. In most cases the other parent is still
fulfi lling a parenting role and children often spend time living in this other parents household
(for a discussion of this issue see Callister, P. & Birks, S. (2006). Two Parents, Two Households:
New Zealand Data Collections, Language and Complex Parenting, Blue Skies Fund research,
Families Commission).
11 Centre for Social Research and Evaluation (2010). Sole parenting in New Zealand: An update on
key trends and what helps reduce disadvantage. Ministry of Social Development, Wellington.
Act (1980) came into force, doing away with fault-based
divorce and seeing a signifi cant increase in divorce
(see p. 8). The increase in the proportion of sole parent
families mirrors overseas trends, although New Zealand’s
rate is relatively high by international standards (Figure 2).
It is important to note that while at any one time just over
one-in-four families with dependent children contain only
one resident parent, the chances of ever living in a sole
parent family are higher, with an estimated third of children
having lived in a sole mother family by age 17.12
12 Dharmalingam, A., Pool, I., Sceats, J. & Mackay, R. (2004). Raising Children in New Zealand,
Patterns of Family Formation and Change in New Zealand. Ministry of Social Development:
Wellington.
25
20
15
10
5
0
Figure 2 Proportion of children aged 0–14 years in sole parent households for OECD countries, around 2007
Uni
ted
Stat
es
Uni
ted
Kin
gdom
Can
ada
New
Zea
land
Swed
en
Cze
ch R
epub
lic
Den
mar
k
Aus
tral
ia
Aus
tria
OEC
D -
22
Pol
and
Slov
enia
Finl
and
Switz
erla
nd
Spai
n
Hun
gary
Slov
ak R
epub
lic
Ger
man
y
Fran
ce
Japa
n
Net
herla
nds
Por
tuga
l
Italy
Gre
ece
Source: OECD Family Database (www.oecd.org/els/social/family/database).
Perc
ent

6 | NEW ZEALAND FAMILIES TODAY FACT SHEET
Families Commission Kömihana ä Whänau
Partnerships
In 2006 57 percent of all adults aged 16 and over were
living with a partner. The majority of those who were
partnered were married (76 percent) with the remainder
in de-facto, or cohabiting, partnerships.13 There are also
an unknown number of couples who would consider
themselves to be in a committed partnership, but who
through circumstances (eg work and study) do not live
together (often referred to as LAT or Living Apart but
Together couples). The proportion of adults who are
partnered has declined over the past 20 years with
23 percent living alone in 2006, up from 19 percent
in 1986. This may partly be a result of the aging of
the population, but could also be due to people
delaying cohabitation.
13 Families Commission (2008). The Kiwi Nest; 60 years of change in New Zealand families.
Families Commission, Wellington.
Figure 3 shows the marriage rate for the last 50 years.
Since the early 1970s there has been an almost
uninterrupted decline in the general marriage rate
(number of marriages per 1,000 not-married population
aged 16 years and over). At 13.2 in 2009, the rate is
currently less than one-third of the peak of 45.5 marriages
per 1,000 non-married, recorded in 1971. Many
factors have contributed to the fall in the marriage rate,
including the growth in de-facto unions, a general trend
towards delayed marriage, and increasing numbers of
New Zealanders remaining single.
Evidence that some people are delaying marriage is
seen in the increasing median age of those who marry.
For example, the median age of men who married for
the fi rst time in 2012 was 30 years, about seven years
older than the median age of those who married for the
fi rst time in 1971. The median age of women who married
for the fi rst time has risen by a similar margin, from
50
45
40
35
30
25
20
15
10
5
0
Figure 3 Marriage rates, 1961–2012
1961
1963
1965
1967
1969
1971
1973
1975
1977
1979
1981
1983
1985
1987
1989
1991
1993
1995
1997
1999
2001
2003
2005
2007
2009
2011
2012
Rate
per
1,0
00
not
marr
ied
Year
Source: Statistics New Zealand. Demographic Trends (2011)
Rate per 1,000 mean not-married estimated population aged 16 years and over.

NEW ZEALAND FAMILIES TODAY FACT SHEET | 7
Families Commission Kömihana ä Whänau
20.8 years in 1971 to 28.5 years in 2012. Amongst all
marriages (fi rst and remarriages) the median age for
men in 1971 was 23.5 rising to 32.3 years in 2012 and
21.2 years for women, rising to 30.2 years. Women still
tend to marry men older than themselves, but the gap
between their median ages at fi rst marriage has narrowed.
In 1971, the gap was 2.1 years, but by 2012 it had
narrowed to 1.5 years.
However the increasing age at marriage does not mean
individuals have been foregoing either relationships or
partnering. As indicated above, a growing proportion
of New Zealanders now live together without legally
formalising their relationship, similar to trends in Australia,
North America, and Europe. The fi ve-yearly Census is
the primary source of information on de facto unions,
since, unlike marriage or civil unions individuals don’t
have to register a de-facto relationship. In 1996, about
one-in-four men and women aged 15–44 years who were
in partnerships were in de-facto relationships. By 2006,
this fi gure had increased to almost two-in-fi ve. Other
New Zealand research14 indicates that each generation
has seen a greater proportion cohabit with a partner, rather
than marry, as their fi rst relationship. It is now the norm for
de-facto cohabitation to be the fi rst form of relationship and
for those who marry to have time in a de-facto relationship
before marrying.
14 Dharmalingam, A., Pool, I., Sceats, J. & Mackay, R. (2004). Raising Children in New Zealand,
Patterns of Family Formation and Change in New Zealand. Ministry of Social Development:
Wellington.
Divorce rates have increased until recently (see p. 8) and
the proportion of people who marry for a second time has
been increasing. In 1971 just 16 percent of marriages
involved the remarriage of one or both partners, but by
2011 it was 31 percent. These remarriages do not always
involve dependent children, as the previous marriage may
have been childless or the children may now be adults.
Remarriage fi gures do not capture individuals who may
have had children with a previous de-facto partner (ie was
not previously married). For this reason remarriage rates
do not provide an indication of the numbers of stepfamilies
(often also referred to as blended families).
Stepfamilies form when a couple enter a partnership and
one or both adults have a child from a previous relationship
(either marriage or de facto). We do not have national
estimates of the proportion of children living in stepfamilies
in New Zealand. However the rates are likely to be at
least as great as in Australia (7 percent)15 and England
(9.5 percent).16 One estimate is that as many as
20 percent of children in New Zealand will have the
experience of living with a step-parent before they
turn 17 years.17
The Civil Unions Act 2004 came into force on 26 April
2005, and the fi rst ceremonies were celebrated on
29 April 2005. By 31 March 2012, there had been a total
of 2,745 civil unions registered to New Zealand residents.
Of these, 2,195 (80 percent) were same-sex civil unions.18
15 Family Characteristics survey 2009-2010, Australian Bureau of Statistics: Canberra.
16 Focus on Families (2007). Offi ce National Statistics, London.
17 Dharmalingam, A. et al. (2004). Ibid.
18 Statistics New Zealand (2012). Provisional civil unions and marriages.
8 | NEW ZEALAND FAMILIES TODAY FACT SHEET
Families Commission Kömihana ä Whänau
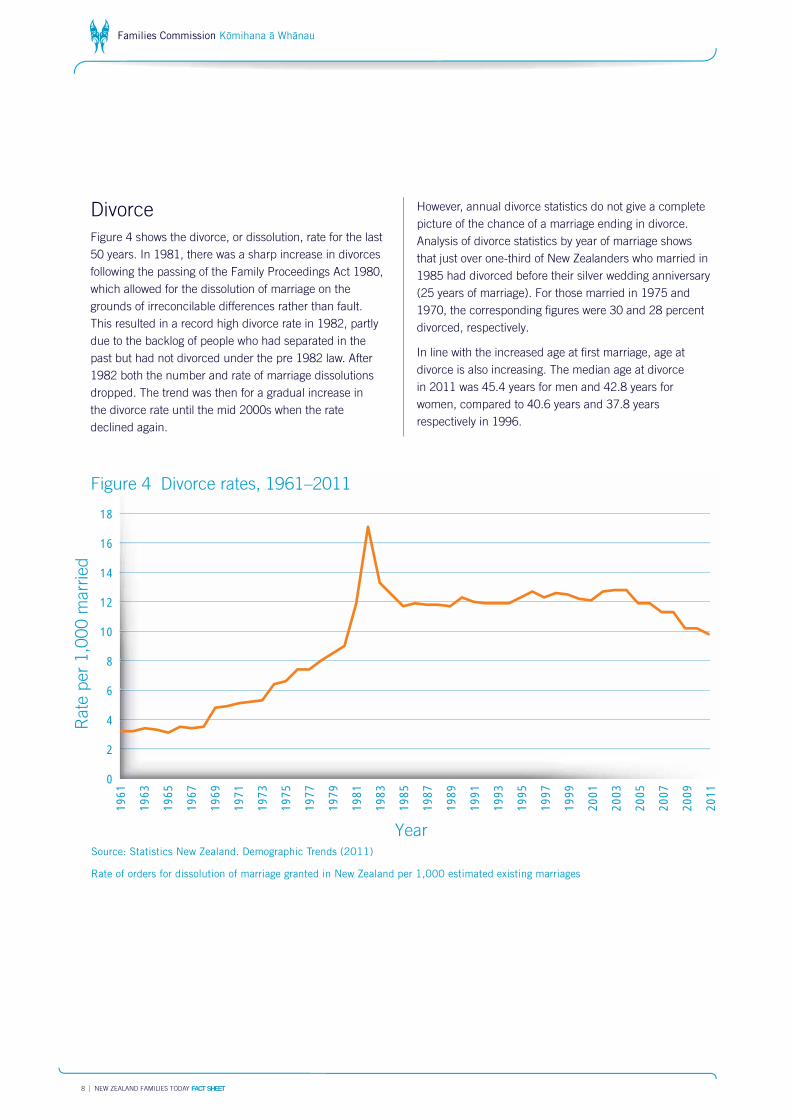
Divorce
Figure 4 shows the divorce, or dissolution, rate for the last
50 years. In 1981, there was a sharp increase in divorces
following the passing of the Family Proceedings Act 1980,
which allowed for the dissolution of marriage on the
grounds of irreconcilable differences rather than fault.
This resulted in a record high divorce rate in 1982, partly
due to the backlog of people who had separated in the
past but had not divorced under the pre 1982 law. After
1982 both the number and rate of marriage dissolutions
dropped. The trend was then for a gradual increase in
the divorce rate until the mid 2000s when the rate
declined again.
However, annual divorce statistics do not give a complete
picture of the chance of a marriage ending in divorce.
Analysis of divorce statistics by year of marriage shows
that just over one-third of New Zealanders who married in
1985 had divorced before their silver wedding anniversary
(25 years of marriage). For those married in 1975 and
1970, the corresponding fi gures were 30 and 28 percent
divorced, respectively.
In line with the increased age at fi rst marriage, age at
divorce is also increasing. The median age at divorce
in 2011 was 45.4 years for men and 42.8 years for
women, compared to 40.6 years and 37.8 years
respectively in 1996.
18
16
14
12
10
8
6
4
2
0
Figure 4 Divorce rates, 1961–2011
Rate
per
1,0
00 m
arr
ied
Year
1961
1963
1965
1967
1969
1971
1973
1975
1977
1979
1981
1983
1985
1987
1989
1991
1993
1995
1997
1999
2001
2003
2005
2007
2009
2011
Source: Statistics New Zealand. Demographic Trends (2011)
Rate of orders for dissolution of marriage granted in New Zealand per 1,000 estimated existing marriages
NEW ZEALAND FAMILIES TODAY FACT SHEET | 9
Families Commission Kömihana ä Whänau
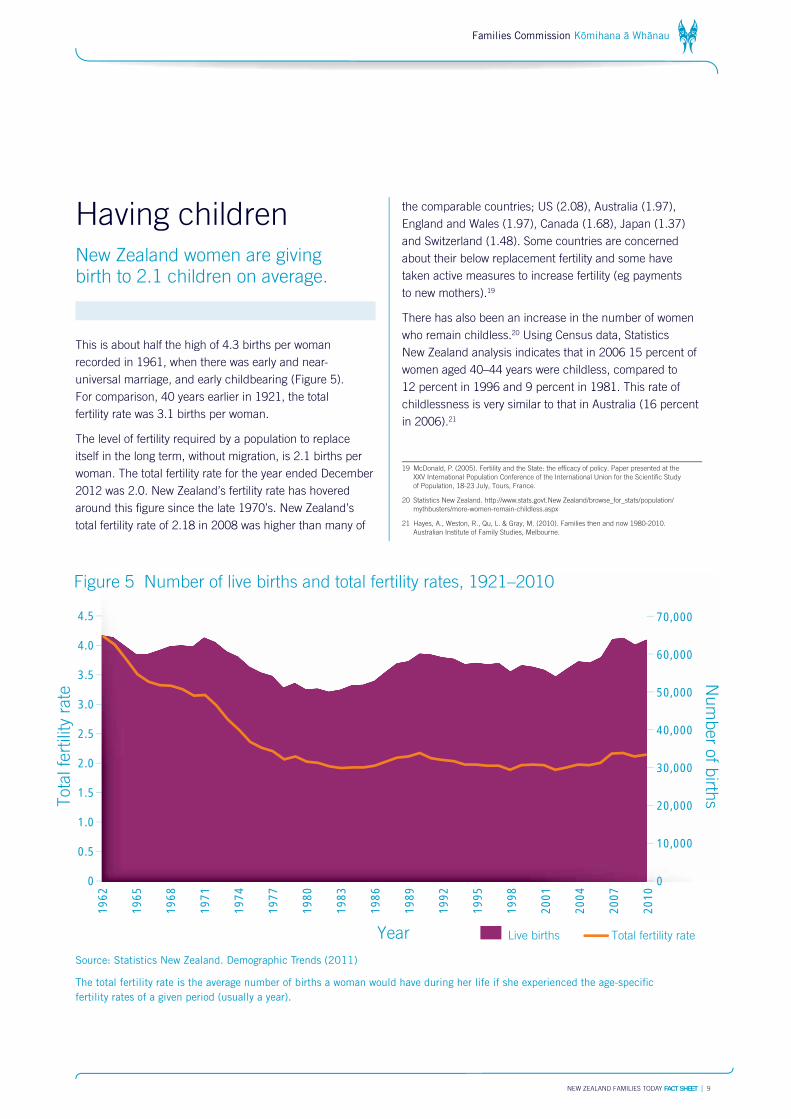
Having childrenNew Zealand women are giving birth to 2.1 children on average.
This is about half the high of 4.3 births per woman
recorded in 1961, when there was early and near-
universal marriage, and early childbearing (Figure 5).
For comparison, 40 years earlier in 1921, the total
fertility rate was 3.1 births per woman.
The level of fertility required by a population to replace
itself in the long term, without migration, is 2.1 births per
woman. The total fertility rate for the year ended December
2012 was 2.0. New Zealand’s fertility rate has hovered
around this fi gure since the late 1970’s. New Zealand’s
total fertility rate of 2.18 in 2008 was higher than many of
the comparable countries; US (2.08), Australia (1.97),
England and Wales (1.97), Canada (1.68), Japan (1.37)
and Switzerland (1.48). Some countries are concerned
about their below replacement fertility and some have
taken active measures to increase fertility (eg payments
to new mothers).19
There has also been an increase in the number of women
who remain childless.20 Using Census data, Statistics
New Zealand analysis indicates that in 2006 15 percent of
women aged 40–44 years were childless, compared to
12 percent in 1996 and 9 percent in 1981. This rate of
childlessness is very similar to that in Australia (16 percent
in 2006).21
19 McDonald, P. (2005). Fertility and the State: the effi cacy of policy. Paper presented at the
XXV International Population Conference of the International Union for the Scientifi c Study
of Population, 18-23 July, Tours, France.
20 Statistics New Zealand. http://www.stats.govt.New Zealand/browse_for_stats/population/
mythbusters/more-women-remain-childless.aspx
21 Hayes, A., Weston, R., Qu, L. & Gray, M. (2010). Families then and now 1980-2010.
Australian Institute of Family Studies, Melbourne.
Source: Statistics New Zealand. Demographic Trends (2011)
The total fertility rate is the average number of births a woman would have during her life if she experienced the age-specifi c
fertility rates of a given period (usually a year).
4.5
4.0
3.5
3.0
2.5
2.0
1.5
1.0
0.5
0
70,000
60,000
50,000
40,000
30,000
20,000
10,000
0
Live births Total fertility rate
Figure 5 Number of live births and total fertility rates, 1921–2010
Tota
l fe
rtili
ty r
ate
Nu
mb
er o
f birth
s
Year
1962
1965
1968
1971
1974
1977
1980
1983
1986
1989
1992
1995
1998
2001
2004
2007
2010
10 | NEW ZEALAND FAMILIES TODAY FACT SHEET
Families Commission Kömihana ä Whänau
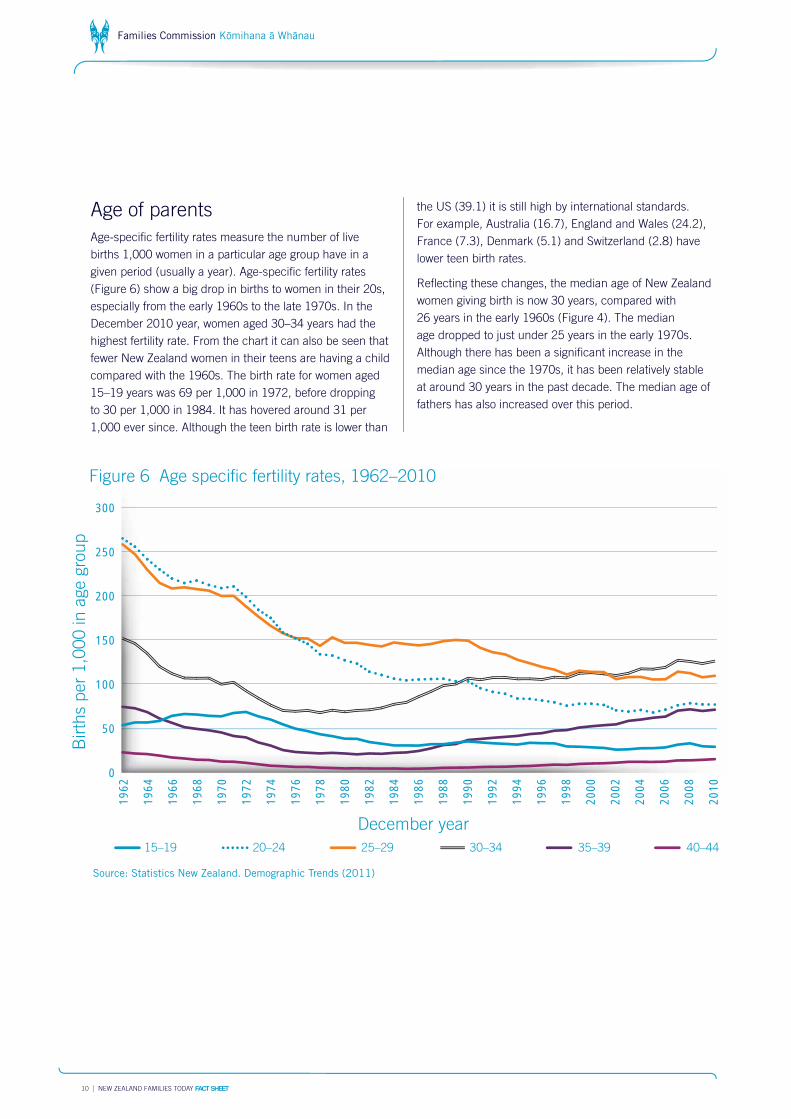
Age of parents
Age-specifi c fertility rates measure the number of live
births 1,000 women in a particular age group have in a
given period (usually a year). Age-specifi c fertility rates
(Figure 6) show a big drop in births to women in their 20s,
especially from the early 1960s to the late 1970s. In the
December 2010 year, women aged 30–34 years had the
highest fertility rate. From the chart it can also be seen that
fewer New Zealand women in their teens are having a child
compared with the 1960s. The birth rate for women aged
15–19 years was 69 per 1,000 in 1972, before dropping
to 30 per 1,000 in 1984. It has hovered around 31 per
1,000 ever since. Although the teen birth rate is lower than
the US (39.1) it is still high by international standards.
For example, Australia (16.7), England and Wales (24.2),
France (7.3), Denmark (5.1) and Switzerland (2.8) have
lower teen birth rates.
Refl ecting these changes, the median age of New Zealand
women giving birth is now 30 years, compared with
26 years in the early 1960s (Figure 4). The median
age dropped to just under 25 years in the early 1970s.
Although there has been a signifi cant increase in the
median age since the 1970s, it has been relatively stable
at around 30 years in the past decade. The median age of
fathers has also increased over this period.
300
250
200
150
100
50
0
15–19 20–24 25–29 30–34 35–39 40–44
Figure 6 Age specifi c fertility rates, 1962–2010
Birth
s per
1,0
00 in a
ge g
roup
December year
1962
1964
1966
1968
1970
1972
1974
1976
1978
1980
1982
1984
1986
1988
1990
1992
1994
1996
1998
2000
2002
2004
2006
2008
2010
Source: Statistics New Zealand. Demographic Trends (2011)

NEW ZEALAND FAMILIES TODAY FACT SHEET | 11
Families Commission Kömihana ä Whänau
Ex-nuptial births
As the rate of cohabitation has risen, so has the proportion
of births to women who are not married to the child’s
father (referred to as ex-nuptial births). While just under
10 percent of births were to unmarried women in 1964,
nearly a quarter of all births were by the early 1980s
and nearly 50 percent of all live births in 2010
(Figure 7). However it is estimated22 that in the 1960s
22 Pool et al (2007) ibid.
almost a quarter of births were conceived before the
marriage date. Most of these conceptions led to marriage
before the birth. Most of the increase in ex-nuptial births
has been due to the growth in the number of children
born to cohabiting couples. These cohabiting couples may
go on to marry, although US and UK data suggests that
increasingly many do not.23
23 Beaujouan, E. & Ni Bhrolchain, M. (2011). Cohabitation and marriage in Britain since the 1970s.
Population Trends, 145, Offi ce of national Statistics, London.
50
40
30
20
10
0
Figure 7 Ex-nuptial births as percentage of live births, 1964–2010
Perc
ent
Year
1964
1966
1968
1970
1972
1974
1976
1978
1980
1982
1984
1986
1988
1990
1992
1994
1996
1998
2000
2002
2004
2006
2008
2010
Source: Statistics New Zealand. http://www.teara.govt.New Zealand/en/families-a-history/7/2
12 | NEW ZEALAND FAMILIES TODAY FACT SHEET
Families Commission Kömihana ä Whänau
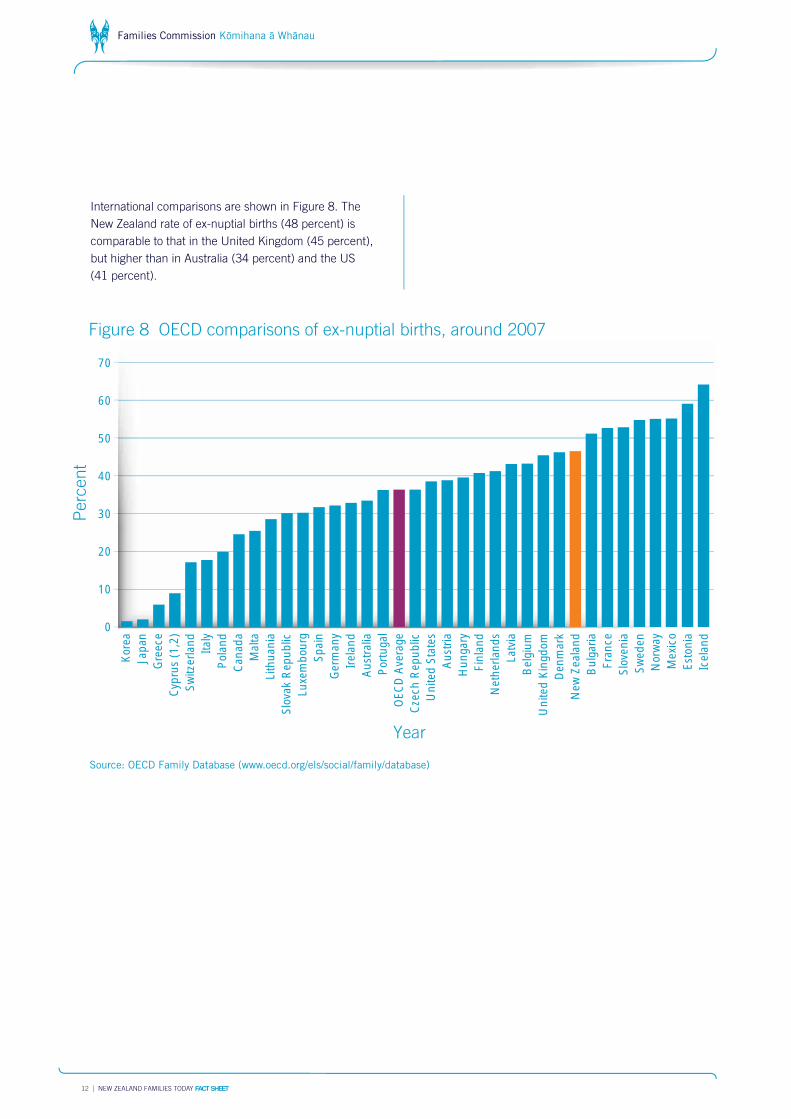
International comparisons are shown in Figure 8. The
New Zealand rate of ex-nuptial births (48 percent) is
comparable to that in the United Kingdom (45 percent),
but higher than in Australia (34 percent) and the US
(41 percent).
70
60
50
40
30
20
10
0
Figure 8 OECD comparisons of ex-nuptial births, around 2007
Year
Kor
eaJa
pan
Gre
ece
Cyp
rus
(1,2
)Sw
itzer
land
Italy
Pol
and
Can
ada
Mal
taLi
thua
nia
Slov
ak R
epub
licLu
xem
bour
gSp
ain
Ger
man
yIr
elan
dA
ustr
alia
Por
tuga
lO
ECD
Ave
rage
Cze
ch R
epub
licU
nite
d St
ates
Aus
tria
Hun
gary
Finl
and
Net
herla
nds
Latv
iaB
elgi
umU
nite
d K
ingd
omD
enm
ark
New
Zea
land
Bul
garia
Fran
ceSl
oven
iaSw
eden
Nor
way
Mex
ico
Esto
nia
Icel
and
Source: OECD Family Database (www.oecd.org/els/social/family/database)
Perc
ent
NEW ZEALAND FAMILIES TODAY FACT SHEET | 13
Families Commission Kömihana ä Whänau
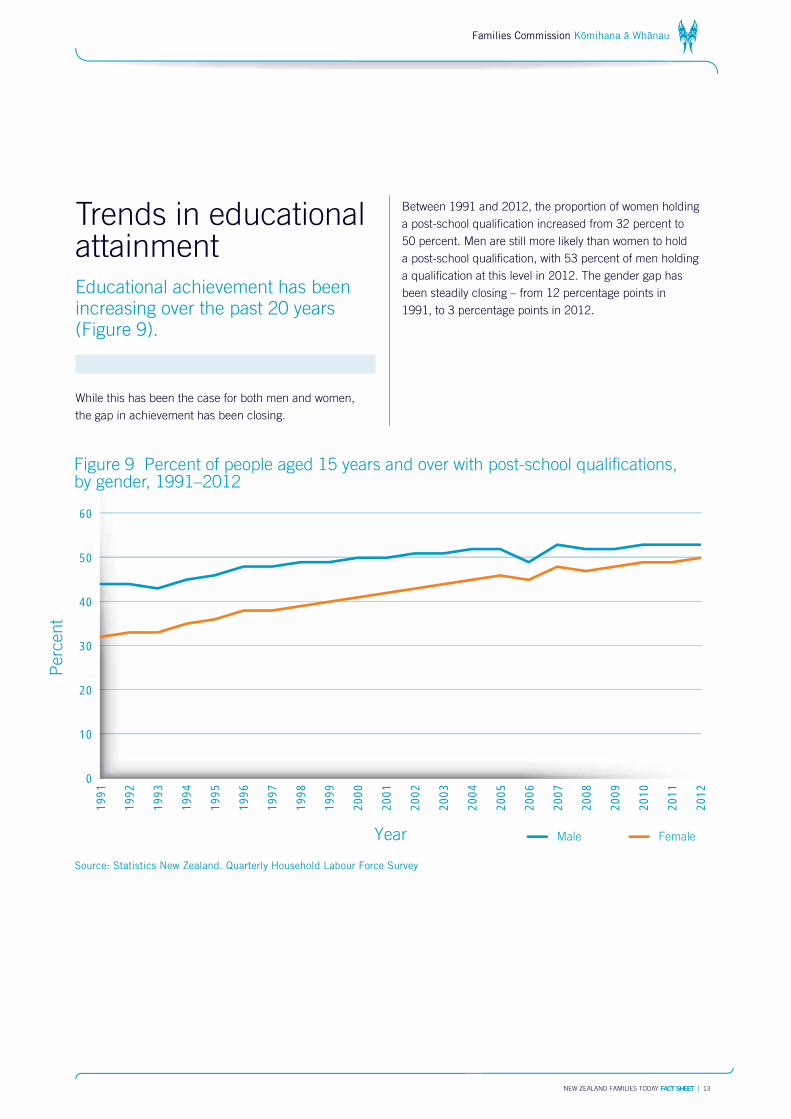
Trends in educational attainmentEducational achievement has been increasing over the past 20 years (Figure 9).
While this has been the case for both men and women,
the gap in achievement has been closing.
Between 1991 and 2012, the proportion of women holding
a post-school qualifi cation increased from 32 percent to
50 percent. Men are still more likely than women to hold
a post-school qualifi cation, with 53 percent of men holding
a qualifi cation at this level in 2012. The gender gap has
been steadily closing – from 12 percentage points in
1991, to 3 percentage points in 2012.
60
50
40
30
20
10
0
Figure 9 Percent of people aged 15 years and over with post-school qualifi cations, by gender, 1991–2012
Year
1991
1992
1993
1994
1995
1996
1997
1998
1999
2000
2001
2002
2003
2004
2005
2006
2007
2008
2009
2010
2011
2012
Perc
ent
Male Female
Source: Statistics New Zealand. Quarterly Household Labour Force Survey
14 | NEW ZEALAND FAMILIES TODAY FACT SHEET
Families Commission Kömihana ä Whänau
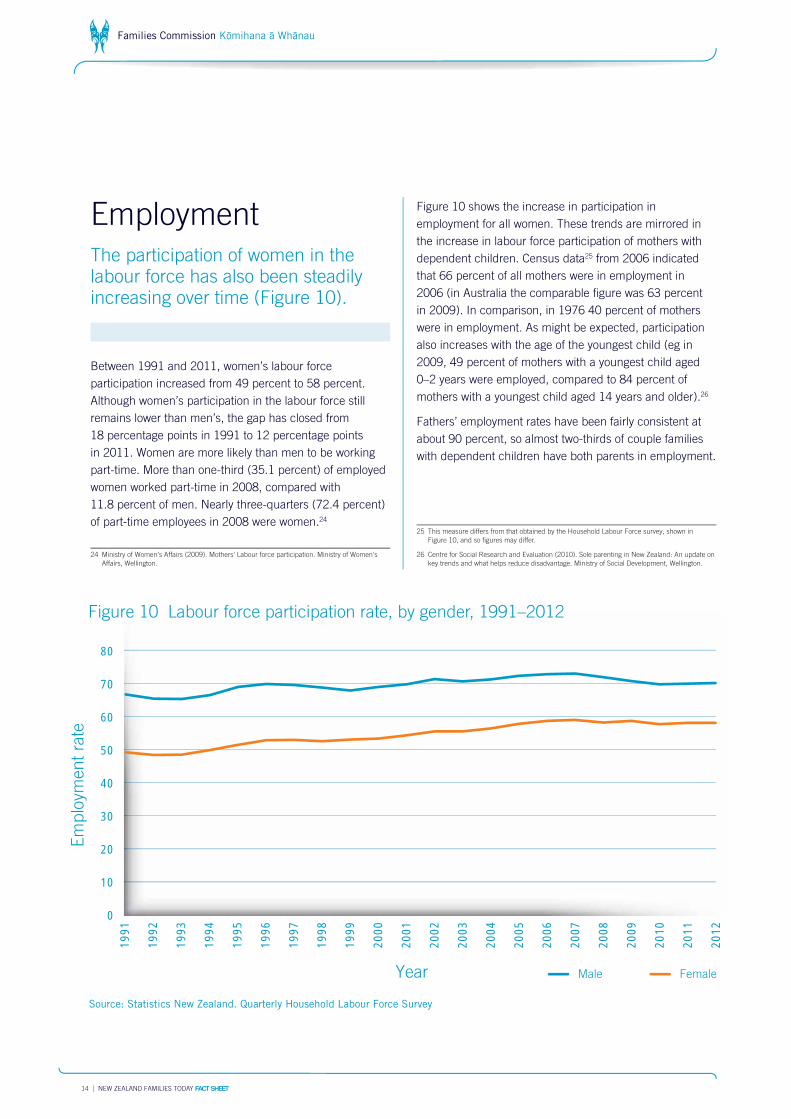
EmploymentThe participation of women in the labour force has also been steadily increasing over time (Figure 10).
Between 1991 and 2011, women’s labour force
participation increased from 49 percent to 58 percent.
Although women’s participation in the labour force still
remains lower than men’s, the gap has closed from
18 percentage points in 1991 to 12 percentage points
in 2011. Women are more likely than men to be working
part-time. More than one-third (35.1 percent) of employed
women worked part-time in 2008, compared with
11.8 percent of men. Nearly three-quarters (72.4 percent)
of part-time employees in 2008 were women.24
24 Ministry of Women’s Affairs (2009). Mothers’ Labour force participation. Ministry of Women’s
Affairs, Wellington.
Figure 10 shows the increase in participation in
employment for all women. These trends are mirrored in
the increase in labour force participation of mothers with
dependent children. Census data25 from 2006 indicated
that 66 percent of all mothers were in employment in
2006 (in Australia the comparable fi gure was 63 percent
in 2009). In comparison, in 1976 40 percent of mothers
were in employment. As might be expected, participation
also increases with the age of the youngest child (eg in
2009, 49 percent of mothers with a youngest child aged
0–2 years were employed, compared to 84 percent of
mothers with a youngest child aged 14 years and older).26
Fathers’ employment rates have been fairly consistent at
about 90 percent, so almost two-thirds of couple families
with dependent children have both parents in employment.
25 This measure differs from that obtained by the Household Labour Force survey, shown in
Figure 10, and so fi gures may differ.
26 Centre for Social Research and Evaluation (2010). Sole parenting in New Zealand: An update on
key trends and what helps reduce disadvantage. Ministry of Social Development, Wellington.
80
70
60
50
40
30
20
10
0
Figure 10 Labour force participation rate, by gender, 1991–2012
1991
1992
1993
1994
1995
1996
1997
1998
1999
2000
2001
2002
2003
2004
2005
2006
2007
2008
2009
2010
2011
2012
Year Male Female
Em
plo
yment
rate
Source: Statistics New Zealand. Quarterly Household Labour Force Survey

NEW ZEALAND FAMILIES TODAY FACT SHEET | 15
Families Commission Kömihana ä Whänau
Child careWith the falling cost of ECE for three and four year olds, increasing employment of mothers of dependent children and increased joint work hours for couples there is potentially an increased need for childcare.
It is likely that both informal (eg grandparents, friends
and neighbours) and formal care (eg childcare centres,
in home care services)27 is being used to meet these
childcare needs, and that fl exibility in work arrangements
is important to couples.28
27 Families Commission (2011). Caring for Kids: Parents’ views on out-of-school services and care.
Families Commission, Wellington.
28 Families Commission (2009). Finding Time: Parents’ long working hours and the impact on
family life. Families Commission, Wellington.
Figure 11 shows the increased use of formal early
childhood education (ECE) services over the past 10 years,
with a particular increase in the use of education and
care centres and home-based care services. In 2010
53.9 percent of preschool children attended formal ECE,
and 44.1 percent attended informal care, and 80.9 percent
of children aged 3 to 5 years who attended formal ECE,
used 20 hours ECE.
For school-aged children, most parents provide before-
and after-school care themselves during school terms
(56 percent) or during school holidays (57 percent).29
Less than one in 10 report currently using formal before-
or after-school services or holiday programmes. The
remainder of the gap in childcare for school-aged children
is usually met by grandparents or other family members.
29 Families Commission (2011). Caring for Kids: Parents’ views on out-of-school services and care.
Families Commission, Wellington.
220,000
200,000
180,000
160,000
140,000
120,000
100,000
80,000
60,000
40,000
20,000
0
Figure 11 Number of enrolments in licensed ECE services by service type 2000–2011
Year
2000
2001
2002
2003
2004
2005
2006
2007
2008
2009
2010
2011
Num
ber
of enro
lments
Total Education & Care Kindergarten Home-based Other
Source: Ministry of Education Annual Summary
16 | NEW ZEALAND FAMILIES TODAY FACT SHEET
Families Commission Kömihana ä Whänau
ConclusionAs indicated in the introduction to this brief demographic profi le of New Zealand families, its purpose is to map the broad demographic changes over the past 20 to 30 years.
Inevitably such an approach raises many questions:
What impact do these changes have on family wellbeing?
What is ‘driving’ these changes? How are these changes
in family life related to one another? Where is the family
heading in the future?
It is clear that there have been major changes in the
sequencing and timing of signifi cant ‘life’ events –
education, employment, partnering, child-bearing,
marriage, child rearing, divorce, remarriage etc. There
has been much academic30 and popular debate about
what is driving family structural changes. It is clear,
however, that family and whänau still remain a basic unit
of society. Marriage is still popular and, whether married or
cohabiting, couples perform perhaps the most important
role in society – the care and nurturance of children. What
is missing from the above picture, and from our statistical
data collections, is the place of the parents within the wider
context of extended family and whänau relationships.31
As to the future, there are some trends that are clearly
emerging and predictable, such as population aging. Other
trends, such as decreasing rates of marriage, may reverse.
For example, after many years of increase the divorce rate
has in recent years begun to fall. However it is unlikely
that we will return to the situation of 1960’s, particularly as
attitudes towards cohabitation and marriage have changed
so much since then.32 As the above data show, there is a
diversity of family forms in New Zealand.
30 For example Pool, I., Dharmalingam, A., & Sceats, J. (2007). The New Zealand family from
1840: A demographic history. Auckland University Press, Auckland; Coontz, S. (2005).
Marriage, a History. Penguin; New York; Cherlin, A. (2009). The marriage-go-round: the state
of marriage and the family in America today. Alfred A Knopf, New York.
31 For example see the following for a discussion of the lack of information on whänau
relationships. Families Commission (2011). Whänau Yesterday, Today, Tomorrow.
Families Commission, Wellington.
32 Thornton, A, & Young-DeMarco, L. (2001). Four decades of trends in attitudes toward family
issues in the United States. Journal of Marriage and Family; Nov 2001; 63(4); pp 1009-1037.

Wellington offi ce
Public Trust Building, Level 5
117–125 Lambton Quay
PO Box 2839, Wellington 6140
Phone 04 917 7040
Fax 04 917 7059
Auckland offi ce
AMI House, Level 5
63 Albert Street, Auckland 1010
Phone 09 985 4106
Fax 09 985 4109
Commission website
www.nzfamilies.org.nz
Follow us on Facebook
Follow us on Twitter
If you would like any information about the work of the Families Commission, contact