Embed Size (px)
Citation preview


New York StateSalt Marsh Restoration and Monitoring Guidelines
prepared by:Nancy L. Niedowski
for the
New York State Department of StateDivision of Coastal Resources
41 State StreetAlbany, NY 12231
- and -
New York State Department of Environmental ConservationDivision of Fish, Wildlife and Marine Resources
Bureau of Marine Resources205 N. Belle Meade RoadEast Setauket, NY 11733
December 1, 2000

The Salt Marsh Restoration and Monitoring Guidelines were prepared under the NationalOceanic and Atmospheric Administration Coastal Services Center Coastal ManagementFellowship Program, which places recent graduates in coastal management and related fieldswith state coastal programs to conduct special two-year projects. The Coastal ManagementFellowship Program is administered by NOAA Coastal Services Center, 2234 South HobsonAvenue, Charleston, South Carolina 29405.
Additional financial assistance was provided through a federal grant from the U.S.De partment of Commerce, National Oceanic and Atmospheric Administration, Office ofOcean and Coastal Resource Management, under the Coastal Zone Management Act of 1972,as amended.
The New York State Coastal Management Program is administered by the New York StateDepartment of State, Division of Coastal Resources, 41 State Street, Albany, New York 12231.
December 2000

PREFACE
All salt marsh restoration activities are regulated, and require permits and approvals. Using this guidancedocument does not relieve the reader of regulatory requirements, nor does it guarantee receipt of a permit.This document does not waive existing regulatory standards. Using this document should not be substitutedfor communication with permit staff regarding a proposed salt marsh restoration project. Regional permitstaff should always be contacted by a project proponent early in the planning process and prior tosubmission of permit applications.
This document is primarily intended to guide voluntary restoration projects, not mitigation projects.Mitigation projects are constrained by specific regulatory standards. This document does not modify orwaive any program standards for mitigation. In addition, while voluntary projects are more flexible in goal-setting and design, such projects will nevertheless be subject to regulatory requirements, including permitsand approvals from the State and federal government.
The Salt Marsh Restoration and Monitoring Guidelines are primarily intended for use with projectssponsored by municipalities. Individuals with ideas for restoration projects are strongly encouraged tocollaborate with their municipality, and to contact regional Department of Environmental Conservation staffprior to project planning. Activities in identified tidal wetlands, including salt marshes on private property,are regulated by the State of New York, and require permits and approvals.

i
TABLE OF CONTENTS
LIST OF FIGURES . . . . . . . . . . . . . . . . . . . . . . . . . . . . . . . . . . . . . . . . . . . . . . . . . . . . . . . . . . . v
LIST OF TABLES . . . . . . . . . . . . . . . . . . . . . . . . . . . . . . . . . . . . . . . . . . . . . . . . . . . . . . . . . . . vi
1. INTRODUCTION . . . . . . . . . . . . . . . . . . . . . . . . . . . . . . . . . . . . . . . . . . . . . . . . . . . . . . . . . . 11.a. Purpose of the Salt Marsh Restoration and Monitoring Guidelines . . . . . . . . . . . . . . . 21.b. Intended Audience and Format of the Guidelines . . . . . . . . . . . . . . . . . . . . . . . . . . . . 21.c. Overall Goal Setting for Habitat Restoration in New York State . . . . . . . . . . . . . . . . 41.d. Definitions of Terms . . . . . . . . . . . . . . . . . . . . . . . . . . . . . . . . . . . . . . . . . . . . . . . . . 61.e. Principal Planning Considerations in Salt Marsh Restoration . . . . . . . . . . . . . . . . . . . 7
2. TEMPERATE SALT MARSH HABITAT CHARACTERIZATION . . . . . . . . . . . . . . . . 112.a. Salt Marsh Development . . . . . . . . . . . . . . . . . . . . . . . . . . . . . . . . . . . . . . . . . . . . 112.b. Salt Marshes in New York State . . . . . . . . . . . . . . . . . . . . . . . . . . . . . . . . . . . . . . 122.c. Salt Marsh Vegetation . . . . . . . . . . . . . . . . . . . . . . . . . . . . . . . . . . . . . . . . . . . . . . 122.d. Salt Marsh Fish and Wildlife . . . . . . . . . . . . . . . . . . . . . . . . . . . . . . . . . . . . . . . . . . 132.e. Salt Marsh Functions . . . . . . . . . . . . . . . . . . . . . . . . . . . . . . . . . . . . . . . . . . . . . . . 142.f. Conceptual Model for Salt Marsh System Restoration . . . . . . . . . . . . . . . . . . . . . . 16
2.f.1. Introduction to Conceptual Models . . . . . . . . . . . . . . . . . . . . . . . . . . . . . . . 162.f.2. Controlling Factors . . . . . . . . . . . . . . . . . . . . . . . . . . . . . . . . . . . . . . . . . . . 162.f.3. Attributes of the Controlling Factors . . . . . . . . . . . . . . . . . . . . . . . . . . . . . . 172.f.4. Structural Elements . . . . . . . . . . . . . . . . . . . . . . . . . . . . . . . . . . . . . . . . . . . 182.f.5. Attributes of the Structural Elements . . . . . . . . . . . . . . . . . . . . . . . . . . . . . . 192.f.6. Functions . . . . . . . . . . . . . . . . . . . . . . . . . . . . . . . . . . . . . . . . . . . . . . . . . . 202.f.7. Specific Functional Parameters . . . . . . . . . . . . . . . . . . . . . . . . . . . . . . . . . . 21
2.g. Generic Activities Affecting Salt Marshes and Adjacent Habitats . . . . . . . . . . . . . . . 22
3. HUMAN DISTURBANCES . . . . . . . . . . . . . . . . . . . . . . . . . . . . . . . . . . . . . . . . . . . . . . . . 223.a. Ditching . . . . . . . . . . . . . . . . . . . . . . . . . . . . . . . . . . . . . . . . . . . . . . . . . . . . . . . . . 233.b. Filling . . . . . . . . . . . . . . . . . . . . . . . . . . . . . . . . . . . . . . . . . . . . . . . . . . . . . . . . . . . 233.c. Restricted Tidal Connection . . . . . . . . . . . . . . . . . . . . . . . . . . . . . . . . . . . . . . . . . . 243.d. Diking & Impoundment . . . . . . . . . . . . . . . . . . . . . . . . . . . . . . . . . . . . . . . . . . . . . 253.e. Pollution . . . . . . . . . . . . . . . . . . . . . . . . . . . . . . . . . . . . . . . . . . . . . . . . . . . . . . . . . 253.f. Shoreline Hardening & Structures . . . . . . . . . . . . . . . . . . . . . . . . . . . . . . . . . . . . . . 273.g. Sea Level Rise . . . . . . . . . . . . . . . . . . . . . . . . . . . . . . . . . . . . . . . . . . . . . . . . . . . . 28
4. NATURAL DISTURBANCES . . . . . . . . . . . . . . . . . . . . . . . . . . . . . . . . . . . . . . . . . . . . . . 294.a. Seasonal Disturbances . . . . . . . . . . . . . . . . . . . . . . . . . . . . . . . . . . . . . . . . . . . . . . 29

ii
4.b. Natural Disasters . . . . . . . . . . . . . . . . . . . . . . . . . . . . . . . . . . . . . . . . . . . . . . . . . . 30
5. POST-DISTURBANCE CONDITIONS IN SALT MARSHES . . . . . . . . . . . . . . . . . . . . . 305.a. Changes in Tidal Regime . . . . . . . . . . . . . . . . . . . . . . . . . . . . . . . . . . . . . . . . . . . . 315.b. Subsidence . . . . . . . . . . . . . . . . . . . . . . . . . . . . . . . . . . . . . . . . . . . . . . . . . . . . . . 315.c. Flooding . . . . . . . . . . . . . . . . . . . . . . . . . . . . . . . . . . . . . . . . . . . . . . . . . . . . . . . . 325.d. Changes in Salinity . . . . . . . . . . . . . . . . . . . . . . . . . . . . . . . . . . . . . . . . . . . . . . . . . 325.e. Changes in Salt Marsh Vegetation . . . . . . . . . . . . . . . . . . . . . . . . . . . . . . . . . . . . . 33
6. OVERVIEW OF RESTORATION METHODS . . . . . . . . . . . . . . . . . . . . . . . . . . . . . . . . . 346.a. Manipulating Tidal Regime . . . . . . . . . . . . . . . . . . . . . . . . . . . . . . . . . . . . . . . . . . . 34
6.a.1. General Considerations . . . . . . . . . . . . . . . . . . . . . . . . . . . . . . . . . . . . . . . 346.a.2. Measuring Tidal Elevations . . . . . . . . . . . . . . . . . . . . . . . . . . . . . . . . . . . . . 346.a.3. Duration of Inundation . . . . . . . . . . . . . . . . . . . . . . . . . . . . . . . . . . . . . . . . 356.a.4. Sizing of Culverts . . . . . . . . . . . . . . . . . . . . . . . . . . . . . . . . . . . . . . . . . . . . 366.a.5. Open Marsh Water Management . . . . . . . . . . . . . . . . . . . . . . . . . . . . . . . . 366.a.6. Low-lying Structures . . . . . . . . . . . . . . . . . . . . . . . . . . . . . . . . . . . . . . . . . 38
6.b. Manipulating Elevation, Slope, and Substrate . . . . . . . . . . . . . . . . . . . . . . . . . . . . . 386.b.1. General Considerations . . . . . . . . . . . . . . . . . . . . . . . . . . . . . . . . . . . . . . . 386.b.2. Slope . . . . . . . . . . . . . . . . . . . . . . . . . . . . . . . . . . . . . . . . . . . . . . . . . . . . . 396.b.3. Substrate Properties . . . . . . . . . . . . . . . . . . . . . . . . . . . . . . . . . . . . . . . . . . 396.b.4. Tidal Channels . . . . . . . . . . . . . . . . . . . . . . . . . . . . . . . . . . . . . . . . . . . . . . 406.b.5. Heavy Equipment . . . . . . . . . . . . . . . . . . . . . . . . . . . . . . . . . . . . . . . . . . . . 40
6.c. Manipulating Vegetation . . . . . . . . . . . . . . . . . . . . . . . . . . . . . . . . . . . . . . . . . . . . . 406.c.1. Planting vs. Natural Colonization . . . . . . . . . . . . . . . . . . . . . . . . . . . . . . . . 406.c.2. Spartina alterniflora—Seeding . . . . . . . . . . . . . . . . . . . . . . . . . . . . . . . . . 416.c.3. Spartina alterniflora—Stems, Plugs, and Potted Seedlings . . . . . . . . . . . . 416.c.4. Spartina alterniflora—Planting Methods . . . . . . . . . . . . . . . . . . . . . . . . . . 426.c.5. Spartina alterniflora—Fertilization . . . . . . . . . . . . . . . . . . . . . . . . . . . . . . 426.c.6. Spartina alterniflora—Spacing of Plants . . . . . . . . . . . . . . . . . . . . . . . . . . 436.c.7. Other Plant Species . . . . . . . . . . . . . . . . . . . . . . . . . . . . . . . . . . . . . . . . . . 436.c.8. Estimated Costs for Plants . . . . . . . . . . . . . . . . . . . . . . . . . . . . . . . . . . . . . 43
6.d. Invasive Species Control: Common Reed . . . . . . . . . . . . . . . . . . . . . . . . . . . . . . . . 456.d.1. General Considerations . . . . . . . . . . . . . . . . . . . . . . . . . . . . . . . . . . . . . . . 456.d.2. Common Reed Habitat . . . . . . . . . . . . . . . . . . . . . . . . . . . . . . . . . . . . . . . . 456.d.3. Disturbances Favoring Common Reed . . . . . . . . . . . . . . . . . . . . . . . . . . . . 466.d.4. Natural History of Common Reed . . . . . . . . . . . . . . . . . . . . . . . . . . . . . . . 466.d.5. Impacts caused by Common Reed . . . . . . . . . . . . . . . . . . . . . . . . . . . . . . . 466.d.6. Ecological Value of Common Reed . . . . . . . . . . . . . . . . . . . . . . . . . . . . . . 476.d.7. Determining the Need for Control . . . . . . . . . . . . . . . . . . . . . . . . . . . . . . . . 476.d.8. Control Methods for Common Reed . . . . . . . . . . . . . . . . . . . . . . . . . . . . . 48
iii
6.d.9. Tidal Inundation . . . . . . . . . . . . . . . . . . . . . . . . . . . . . . . . . . . . . . . . . . . . . 486.d.10. Cutting and Mowing . . . . . . . . . . . . . . . . . . . . . . . . . . . . . . . . . . . . . . . . . 496.d.11. Cutting and Mowing Combined with Other Techniques . . . . . . . . . . . . . . . 496.d.12. Controlled Burning . . . . . . . . . . . . . . . . . . . . . . . . . . . . . . . . . . . . . . . . . . 496.d.13. Controlled Burning Combined with Other Techniques . . . . . . . . . . . . . . . . 506.d.14. Chemical Control . . . . . . . . . . . . . . . . . . . . . . . . . . . . . . . . . . . . . . . . . . . 50
7. SALT MARSH RESTORATION—RECOMMENDED MONITORING PROTOCOL . . . . . . . . . . . . . . . . . . . . . . . . . . . . . . . . . . . . . . . . . . . . . . . . . . . . . . . . . . 53
8. COMMON REED CONTROL—RECOMMENDED MONITORINGPROTOCOL . . . . . . . . . . . . . . . . . . . . . . . . . . . . . . . . . . . . . . . . . . . . . . . . . . . . . . . . . . 67
9. SALT MARSH BIBLIOGRAPHY . . . . . . . . . . . . . . . . . . . . . . . . . . . . . . . . . . . . . . . . . . . . 77
10. COMMON REED CONTROL BIBLIOGRAPHY . . . . . . . . . . . . . . . . . . . . . . . . . . . . . . 95
APPENDIX AFIELD AND REPORTING FORMS FOR RECOMMENDED SALT MARSH RESTORATION MONITORING PROTOCOL . . . . . . . . . . . . . . . . . . . 99
APPENDIX BWORLD WIDE WEB RESOURCES RELEVANT FOR SALT MARSH RESTORATION . . . . . . . . . . . . . . . . . . . . . . . . . . . . . . . . . . . . . . . . . . 107
APPENDIX CRESTORATION PROJECT TIMELINE . . . . . . . . . . . . . . . . . . . . . . . . . . . . . . . . . . . . 113
APPENDIX DFEDERAL AND STATE LAWS AND REGULATIONS RELATED TO WETLAND RESTORATION AND MANAGEMENT . . . . . . . . . . . . . 117
APPENDIX EKNOWLEDGEABLE CONTACTS . . . . . . . . . . . . . . . . . . . . . . . . . . . . . . . . . . . . . . . . 125
APPENDIX FACKNOWLEDGMENTS . . . . . . . . . . . . . . . . . . . . . . . . . . . . . . . . . . . . . . . . . . . . . . . 135


v
LIST OF FIGURES PAGE
Figure 1. Process and Considerations for Restoration Projects . . . . . . . . . . . . . . . . . . . . . . . . . 8
Figure 2. Recreational Shellfishing . . . . . . . . . . . . . . . . . . . . . . . . . . . . . . . . . . . . . . . . . . . . . . 9
Figure 3. Salt Marsh Development Over Time . . . . . . . . . . . . . . . . . . . . . . . . . . . . . . . . . . . . 11
Figure 4. Low Marsh Zone . . . . . . . . . . . . . . . . . . . . . . . . . . . . . . . . . . . . . . . . . . . . . . . . . . 13
Figure 5. Grid Ditching in Long Island Wetlands . . . . . . . . . . . . . . . . . . . . . . . . . . . . . . . . . . 23
Figure 6. Wetland Filling . . . . . . . . . . . . . . . . . . . . . . . . . . . . . . . . . . . . . . . . . . . . . . . . . . . . 24
Figure 7. Tidal Restriction . . . . . . . . . . . . . . . . . . . . . . . . . . . . . . . . . . . . . . . . . . . . . . . . . . . 24
Figure 8. Petroleum Pollution . . . . . . . . . . . . . . . . . . . . . . . . . . . . . . . . . . . . . . . . . . . . . . . . 26
Figure 9. Bulkheading . . . . . . . . . . . . . . . . . . . . . . . . . . . . . . . . . . . . . . . . . . . . . . . . . . . . . . 27
Figure 10. Walkway Over a Marsh . . . . . . . . . . . . . . . . . . . . . . . . . . . . . . . . . . . . . . . . . . . . . 28
Figure 11. OMWM Ditch Plug . . . . . . . . . . . . . . . . . . . . . . . . . . . . . . . . . . . . . . . . . . . . . . . . 37
Figure 12. Common Reed . . . . . . . . . . . . . . . . . . . . . . . . . . . . . . . . . . . . . . . . . . . . . . . . . . . . 45
Figure 13. Transect and Quadrat Placement for Salt Marsh Restoration . . . . . . . . . . . . . . . . . . 63
Figure 14. Location of Appropriate Reference Site . . . . . . . . . . . . . . . . . . . . . . . . . . . . . . . . . 65
Figure 15. Recommended Quadrat for Salt Marsh Restoration . . . . . . . . . . . . . . . . . . . . . . . . 65
Figure 16. Transect and Quadrat Placement for Phragmites Control Project . . . . . . . . . . . . . . 75
Figure 17. Recommended Quadrat for Phragmites Control Project . . . . . . . . . . . . . . . . . . . . 76
Figure 18. Reporting Vegetation Zones Along a Transect . . . . . . . . . . . . . . . . . . . . . . . . . . . . . 76

vi
LIST OF TABLES PAGE
Table 1. Gross Primary Productivity of Various Ecosystems . . . . . . . . . . . . . . . . . . . . . . . . . 14
Table 2. Cost of Nursery-Grown Salt Marsh Plant Species . . . . . . . . . . . . . . . . . . . . . . . . . 44

1
1. INTRODUCTION
Planning, design, and implementation of publicly and privately sponsored salt marsh restoration projectsin the northeast United States is rapidly increasing. Both governmental and non-governmental entities arelooking beyond habitat protection alone, and are turning their attention to the possibilities of habitatrestoration. Increased implementation of salt marsh restoration projects is partially attributable to theavailability of funding (e.g., Natural Resources Damage Assessment Program, Partners for Fish andWildlife Program), and the incorporation of restoration considerations into ongoing resource managementprograms (e.g., National Estuary Programs, National Estuarine Research Reserves). The increase inimplementation is also a result of improving science and information on practical salt marsh restoration.
The guidelines have been developed as part of the State’s overall policy “to conserve, improve, and protectits natural resources and environment...”, as stated in Title 1, section 0101 of the New York StateEnvironmental Conservation Law (ECL). This policy is echoed and expanded upon in several othersections of the ECL and in the State’s Coastal Management Program with several specific charges torestore degraded habitat for the purposes of maintaining the health and viability of fish and wildlifepopulations (ECL Title 3, §0301.1(n); Title 11, §0303.2(b)(1), Title 13, §0105.1, Executive Law Article42, §913). Salt marshes are a vital part of healthy coastal ecosystems and the fish and wildlife populationsthat depend on them.
With the increase in state funding opportunities for aquatic habitat restoration through the 1996 CleanWater/Clean Air Bond Act and several years of full funding of the Environmental Protection Fund, localplanning and implementation of aquatic habitat restoration projects has substantially increased. Notablylacking, however, is state guidance on restoration planning, project design, and implementation.
The guidelines also seek to address common shortcomings noted by scientists and natural resourcemanagers in past restoration projects. Some consistently highlighted issues (Kusler and Kentula, 1990)include:
C poorly planned and designed projects,C lack of baseline site information (no pre-project monitoring),C lack of workplan compliance (no compliance monitoring),C lack of post-project monitoring,C inadequate monitoring (too short, wrong parameters),C project information and data lost or inaccessible,C data lack comparability among different projects or over time, andC no determination, or a faulty determination, of success or failure is made.
The guidelines in this report attempt to provide a framework for salt marsh restoration activities, includingplanning, design, implementation and monitoring.

2
Tidal wetlands, including salt marsh habitats, are protected in the State of New York under Article 25 ofEnvironmental Conservation Law, the Tidal Wetlands Act. All tidal wetland restoration projects areregulated activities in New York State and require both state and federal permits. Use of these guidelinesdoes not waive regulatory requirements, nor does is guarantee receipt of required permits and approvals.Use of these guidelines also should not be substituted for consultation with Department of EnvironmentalConservation permit staff prior to submission of permit applications. You must research your project’sregulatory requirements, consult with appropriate permit staff, and file all required permit applications.Appendix D contains a listing of state and federal statutes that regulate activities in tidal wetlands. TheAppendix also lists statutes that support federal involvement in ecosystem restoration.
1.a. Purpose of the Salt Marsh Restoration and Monitoring Guidelines
This guidance document should assist in improving standards of practice for the burgeoning array of saltmarsh restoration activities in the State of New York. The increase in funded habitat restoration projectshighlights the need for accepted reference standards to guide project planning, techniques, and monitoringto measure success. Holding all projects to more consistent standards increases the likelihood of achievingsuccess and ensures that public dollars are wisely spent.
To this end, the guidance document has been designed to provide a comprehensive, accessible, andunderstandable source for current technical information on salt marsh restoration and ecology, to increasethe quality of restoration project planning. The guidelines include restoration monitoring protocols that wereresearched and developed to provide essential and standardized pre-project, compliance, and post-projectinformation for the evaluation of project success. The protocols are designed to be understandable anduseable by a wide variety of user groups, including trained volunteers. Finally, the protocols are presentedin workplan format, to facilitate their incorporation into contracts, memoranda of understanding, andrequests for proposals associated with restoration projects.
1.b. Intended Audience and Format of the Guidelines
This document is designed to serve several audiences. First, it is intended to assist individuals with little orno restoration experience by providing basic information regarding salt marsh restoration. For theseindividuals, there are brief characterizations of the salt marsh ecosystem and common disturbances to NewYork salt marshes. The effects of these disturbances on salt marshes are also discussed. Despite someoverlap, these sections are kept separate to facilitate the user’s access to needed information. TheRestoration Methods section briefly presents the main topics in this area, while providing documentationof alternatives, additional considerations, and references to more detailed information. While the idea ofa salt marsh restoration “cookbook” is appealing, the topic is too complex for such an approach. Thisdocument familiarizes the reader with the extent of detail associated with the main topics while remainingmanageable and intelligible to the non-specialist. Ideally, readers with little experience should exit thedocument informed about the fundamentals of salt marsh restoration planning and the ability to seek outadditional information and the appropriate expertise required for a restoration project.

3
Second, this document is expected to serve experienced natural resources managers by providing explicitdocumentation of the topics and a compilation of references. While the formulation of a restoration“cookbook” is not feasible, some aspects of the habitat restoration process can greatly benefit from adegree of standardization, especially methods for post-project monitoring and the goals for habitatrestoration programs and projects from the perspective of the State of New York. Experienced naturalresources managers benefit from this standardization because their individual projects become morecomparable, communication is facilitated, and the potential for conflicts in strategy and/or goals is removed.Also, while an experienced restoration practitioner may have expertise in one particular area of salt marshor restoration ecology, he or she may lack strength in other important areas and therefore may also benefit.
This guidance document contains the following sections:
CCOverall goal setting for habitat restoration in New York State, intended to serve as generalguidance for developing project-specific restoration goals, objectives, and tasks;
CCDefinitions of terms related to restoration;
CCPrincipal planning considerations , discussing identification of site-specific goals, objectives andlimitations, and the difficulties encountered in the restoration planning process;
CCSalt marsh habitat characterizations outline the habitat zones associated with tidal wetlands,their vegetation, common fish and wildlife species, habitat functions, and generic impacts to thesehabitats;
CCHuman disturbance characterizations discuss common human activities in New York Statethat adversely affect salt marshes;
CCNatural disturbance characterizations discuss natural events and processes influencing, oftensubstantially, salt marsh structure and function;
CCPost-disturbance conditions in the marsh describes a number of common, undesirablesituations that occur in salt marshes as a result of the anthropogenic and natural disturbancesdescribed previously;
CCRestoration methods discusses the most important considerations and techniques for therestoration of salt marshes;
CCSalt marsh restoration monitoring protocol recommends an approach that should be used inNew York State funded or authorized salt marsh restoration projects and, when appropriate, usedfor non-state funded or authorized projects;
4
CCSalt marsh restoration bibliography, drawn from peer reviewed literature, government-sponsored studies and reports, conference proceedings, books, magazines, and the internet;
CCCommon reed control monitoring protocol;
CCCommon reed control bibliography, derived from the same sources listed above;
CCSalt marsh conceptual model discusses and lists measurable parameters to help construct site-specific monitoring programs and assist in general restoration planning;
CAppendices, with tables and other graphics summarizing and expanding on important informationcontained within the document.
1.c. Overall Goal Setting for Habitat Restoration in New York State
One component of adequate habitat restoration planning is identification and articulation of goals.Therefore, the following goal statements were developed to serve as the basis for an overall State of NewYork habitat restoration program:
1. To the greatest extent practical, achieve functional, community, and/or ecosystemequivalence with reference sites when undertaking restoration.
Many restoration efforts to date have evaluated success based only on measures such as post-project percent coverage of vegetation. Percent cover of vegetation at a restoration site alone doesnot indicate the presence of a fully functional habitat. Important characteristic functions such asprovision of habitat for key species, support of a diverse food web, primary productivity andexport of organic material, nutrient cycling, and other factors are essential to a successfulrestoration project.
2. Restore critical habitats for priority fish, wildlife, and plant species, includingthose listed as threatened, endangered, and of special concern by Federal andState governments, and species of historical or current commercial and/orrecreational importance in New York State.
There are many New York State listed animal species dependent on salt marshes for food, shelter,breeding, rearing of young, or other critical life stage needs. Attention should be focused on thosespecies listed as endangered, threatened and of special concern in the State of New York. Suchspecies currently include: black rail (Endangered, Laterallus jamaicensis), least tern (Threatened,Sterna antillarum), northern harrier (Threatened, Circus cyaneus), common tern (Threatened,Sterna hirundo), least bittern (Threatened, Ixobrychus exilis), and osprey (Special Concern,

5
Pandion haliaetus). Current New York State protected plants of salt or brackish marshesinclude: saltmarsh loosestrife (Endangered, Lythrum lineare), Slender marsh-pink (Endangered,Sabatia campanulata), clustered bluets (Threatened, Hedyotis uniflora), swamp sunflower(Threatened, Helianthus angustifolius), marsh fimbry (Threatened, Fimbristylis castanaea),marsh straw sedge (Rare, Carex hormathodes), cyperus (Rare, Cyperus polystachyos var.texensis), and others.
3. Plan and implement restoration initiatives using a regional perspective to integrateand prioritize individual restoration projects and programs.
While it is important to support the implementation of individual, well-planned restoration projects,a long-term restoration program including objectives for the state is needed. This program shouldinclude planning restoration on a landscape ecology or regional scale. Such planning involves theidentification of those habitats most in need of restoration in a given region and the areas in thatregion where this type of habitat restoration is feasible. Individual projects from a given region canthen be evaluated against the landscape-oriented restoration goals for that region.
4. To the extent practical, use historical acreages, proportions, and/or spatialdistributions to prioritize habitats from a state or regional perspective.
State and regional planning initiatives help frame goals and give important context to restorationstrategies and programs. Regional planning can identify status and trends and examine thefeasibility of restoring certain habitats locally while addressing regional needs. Historical acreageis not always attainable at an individual site, but may be cumulatively achieved at several sites withina region through thoughtful planning and evaluation. Determination of the target historical acreageor proportion of salt marsh habitat is beyond the scope of this document, but is recommended aspart of future expansion of state habitat restoration planning.
5. To the extent practical, ensure where appropriate that historical acreages,proportions, and/or spatial distributions of priority habitats are restored andpreserved in New York State.
In many cases, restoring sufficient historical acreage may not be feasible. Some types of habitatrestoration are less likely to succeed. These habitats should be given higher priority for protectionthan for restoration. In all cases, where restoration is associated with a higher degree ofuncertainty, special consideration should be given to long-term protection and preservationopportunities for those habitats.
These overall goals for habitat restoration in New York State can serve as a basis for framing goals andobjectives for individual habitat restoration projects. The overall goals are intended as a planning guideline,and should not be substituted for project-specific articulation of goals and objectives.

6
1.d. Definitions of Terms
Restoration ecology is a scientific discipline requiring consistent use of terms. Unfortunately, the lack ofstandardization for key terms associated with restoration complicates its practice and clouds generalunderstanding of what restoration can and cannot accomplish.
The terms defined below represent the key terms commonly used by the practitioners of the discipline.There are other terms that are often misused interchangeably with some of those listed below. Forexample, the terms “rehabilitation” and “reclamation” have been, by some, equated with “restoration”.However, “rehabilitation” has also been applied to the conversion of a former wetland (now upland) of onetype into some other type of wetland not previously present. “Reclamation” is used in many places toindicate the filling of wetlands for the purpose of reclaiming the land (Lewis, 1990). Perhaps the mostproblematic misuse of terminology equates “restoration” and “mitigation”. While these terms are notinterchangeable, habitat restoration can be part of mitigation requirements.
To respond to these problems and decrease the general uncertainty surrounding the complex field ofrestoration, key terms are defined below. Use of these definitions by entities involved in restoration andrelated activities throughout the State of New York would greatly benefit the long term practice andunderstanding of wetland restoration as a discipline.
1. Restoration
Re-establishment of previously existing wetland or other aquatic resource character and function(s)at a site where they have ceased to exist, or exist only in a substantially degraded state. In practicethis may be achieved by re-establishing the functions of a wetland or other aquatic resource thathave been degraded or lost by such actions as filling, draining, altering hydrology or introductionof contaminants.
2. Enhancement
Activities conducted in existing wetlands or other aquatic resources to achieve specific managementobjectives or provide conditions which previously did not exist, and which increase one or moreaquatic function. Enhancement may involve trade-offs between aquatic resource structure,functions, and values. A positive change in one function may result in negative effects to otherfunctions.
3. Creation
The establishment of a wetland or other aquatic resource where one did not formerly exist.

7
4. Function
A physical, chemical, or biological process which takes place in wetland areas. Commonlyrecognized functions are food chain production, provision of fish and wildlife habitat, barrier towaves and erosion, storm and flood water storage, and nutrient and chemical uptake.
1.e. Principal Planning Considerations in Salt Marsh Restoration
The methods selected for a given project greatly influence cost, expertise needed, labor, time to complete,level of maintenance required, and the potential for success. Lessons learned from past successes andfailures with similar restoration projects should help guide the development of current projects. It isessential to research past experience and to contribute new scientific knowledge to an information base onrestoration that is generally accessible to the public. Salt marsh restorations are currently supported by anextensive knowledge base and success record, relative to other types of habitat restoration. Therefore,a failure to research and fully understand previously employed methods, past experience, stumbling blocks,and both project successes and failures will perpetuate the past mistakes.
Figure 1 outlines the basic steps involved in conducting restoration projects, including planning and design,construction, monitoring, and information dissemination. Important considerations associated with eachof these phases are also listed.
Planning for individual projects should not be conducted in a vacuum. It will be helpful to research theregional context for habitat restoration in a proposed project area. Restoration plans may already be indevelopment in the area. Not only does context research avoid duplication of effort or potential projectconflicts, but additional information, data and other resources and expertise become available. There area variety of knowledgable contacts to assist in planning individual restoration projects in New York State,including regional National Estuary Program staff, Department of Environmental Conservation staff,Department of State Division of Coastal Resources staff, and others (see Appendix E, KnowledgableContacts).
Goals and objectives for each restoration project must be articulated early in the planning process. Clearly-stated goals and objectives will assist during planning when trade-offs are required. Articulating goals willprovide insight, for example, into whether planting salt marsh vegetation should be conducted, at greaterexpense, rather than depending on natural recolonization. If erosion of low marsh and creek banks is aconcern, planting may be warranted. However, if common reed control in the high marsh is a higherpriority, the resources that would be required for low marsh planting should be allocated to common reedcontrol. Without knowledge of project goals, selection of options in situations requiring trade-offs becomesarbitrary. Once goals and objectives have been determined, performance criteria and monitoringparameters may be selected and an assessment program developed.

8
1. Planning and Design Phase
a. Define Goals and Objectivesi. Ecologicalii. Economiciii. Public Benefit (recreational, educational, cultural value)iv. Aesthetic
b. Develop Specific and Quantifiable Performance Criteriav. Define Time Scale for Assessmentvi. Define Spatial Scale for Assessmentvii. Determine Target Plant and Animal Communityviii. Determine Target Ecosystem Functionsix. Should Be Self-sustainingx. Should Be Resilient
c. Research Restoration Sitexi. Historical Conditions (aerial and historical photos, local records)xii. Degree of Alteration (physical, chemical, biological)xiii. Landscape Setting (adjacent land uses, ownership, watershed)xiv. Allometryxv. Hydrologyvi. Contaminationvii. Seed Sources
d. Refine Objectives Based on Site Researche. Plan Restoration Project
xvi. Level of Physical Effort
ii. Technology Requirementsiii. Costiv. Schedulev. Site Constraints (access, flooding, nuisance species)vi. Legal Restrictions
f. Obtain Required Permitsg. Develop a Contingency Plan for Unexpected Outcomesh. Do Engineering Designs
2. Construction Phase
a. Consider Effect on Resources (at site and adjacent sites)b. Consider Best Times to Plant, Lay Fallow, Develop Channels, etc.c. Monitor Construction Activities and Workplan Compliance
3. Assessment Phase
a. Collect Minimum Standard Baseline Datab. Tailor Monitoring Program to Project Goals and Objectivesc. Make Needed Adjustments to Correct Course of Development
Figure 1. Process and Considerations for Restoration Projects (based on R. Thom, 1998).

9
Figure 2. Recrational shellfishing in an intertidal mudflat.
It should be noted that trade-offs involving habitat exchange are often unacceptable. In such cases, fullyfunctional habitats are altered to create a different type of habitat. For example, an intertidal mudflat mightbe graded and planted to create low salt marsh, i.e., salt marsh is added to this area at the expense of themudflat community. It is important to consult with existing planning efforts to discuss regional priorities withregard to habitat type, and to verify that a proposed project is not a habitat exchange. Because habitatmanipulations involve some degree of risk in terms of outcome, habitat exchanges should be avoided.
In addition to the ecological value,societal value of restoring salt marshesshould also be considered in restorationplanning. Potential values derived fromsalt marsh restoration activities mayinclude educational, recreational, andcommercial benefits. The recreationaland aesthetic values of the restored saltmarsh often will be more important ingarnering public and political support fora project than the degree of ecologicalfunction achieved.
Generally, the likelihood for success increases and costs of a project decrease if pre-project site researchis appropriately conducted. Historical information on a site, from government and other records, shouldbe collected. Historical aerial photographs and false-color infrared photography should be obtained andused in planning the extent and type of restoration. Often local and regional natural resource managementagencies and organizations will have valuable information on a potential restoration site, and should becontacted.
Site-specific characteristics of each restoration locale also influence restoration planning. Although theimpacts to and the generic characteristics of salt marshes are often similar, restoration of these resourcesmust be planned and evaluated on a case-by-case basis. Site-specific characteristics (e.g., long windfetch), coastal processes (e.g., 2 foot tidal range), disturbances (e.g., filling), the surrounding environment(e.g., adjacent golf course), and other micro- and macrocharacteristics will affect project success, and mustbe examined and understood prior to undertaking restoration activities. Site surveys to assess these andother site-specific characteristics should occur for every restoration project early during planning. Theguidelines presented here should be used keeping the limitations associated with site-specificity in mind.
The degree of salt marsh restoration possible may be limited by a number of factors. Salt marshes in thenortheast United States have been affected by human activities since before colonial settlement. It is notpractical or even possible to restore salt marshes to pre-disturbance conditions. Unaffected referencemarshes are not available for comparison in planning and evaluation processes.

10
The degree of restoration possible is also limited by human encroachment. Even recently disturbed saltmarshes may not be restored to pre-disturbance conditions because critical salt marsh processes like tidalinundation conflict with human development in the area. In such cases only partial restoration is feasible,targeting a smaller total acreage of salt marsh for restoration, or particular functions of the marsh may beimproved. Monitoring must become a regular part of restoration projects, and standard, accepted methodologies mustbe followed. Failure to adequately monitor may mean that problems are not identified in time forcorrection; project comparisons are difficult; and expenditure of time, labor, and funds are hard to justify.Information on appropriate salt marsh restoration monitoring parameters is available. Salt marsh monitoringprotocols that are implemented now may be modified in the future as the knowledge base of restorationscience grows.
Increased use of standardized monitoring should also be accompanied by selection of and comparison toreference sites. These sites are generally high quality examples of a habitat that are used to assist designand evaluation of restoration projects in a nearby area. This type of reference site provides an exampleof ecological structure and function of a habitat in its current context. Without comparison to a referencesite, it is impossible to establish realistic restoration goals during planning, or track restoration progress afterproject implementation.
Finally, to decrease the number of trial-and-error restoration projects implemented, information availabilitymust be improved. First and foremost, good records for all projects must be kept, including budgets,workplans, site plans, survey data, monitoring programs, photographs, and post-project monitoring dataand analysis. Project information and data should be disseminated to restoration practitioners and otherinterested parties through conferences, workshops, public outreach, and the use of internet technology.Central repositories for restoration data and information should be designated, and specific contact peopleidentified. Regional restoration planning, through National Estuary Programs for example, should assist inincreasing information availability and accessibility.
Although there are many complicated planning considerations and limitations associated with habitatrestoration, this does not mean that undertaking such projects cannot succeed and provide benefit to acommunity, municipality, or region. Restoration projects do not have to be vast in size or scope to be ofvalue. Those without experience planning and conducting restoration are encouraged to start small, andtake advantage of knowledgable contacts and information resources available. With adequate research,planning, site investigation, and monitoring, a salt marsh restoration project has an extremely high likelihoodof success.

11
Figure 3. Salt marsh development over time (based on Warren, 1995).
2. TEMPERATE SALT MARSH HABITAT CHARACTERIZATION
2.a. Salt Marsh Development
Present day salt marshes in the northeastern United States appear to have been established only during thelast 3,000 to 4,000 years, subsequent to a rapid fall in sea level followed by a rapid rise (~16 mm per year)in sea level 7,000 to 8,000 years ago. After this period sea level rise slowed to approximately onemillimeter per year, and salt marshes were established (Nixon, 1982).
Over time, the gradual accumulation of sediments in shallow coastal waters leads to the formation ofmudflats. Spartina alterniflora (smooth cordgrass) colonizes these intertidal mudflats, and the presenceof Spartina alterniflora accelerates sediment deposition at the seaward edge of the vegetated area. Thebelowground roots and rhizomes begin to form salt marsh peat. As the marsh peat accumulates, high marshSpartina patens (salt-meadow cordgrass) replaces low marsh Spartina alterniflora in areas nearing thehigh tide limit. The high marsh continues to accumulate peat, and also accumulates sediment in responseto sea level rise. In this manner, salt marshes grow upward and outward over time (Nixon, 1982; Teal,1986).

12
2.b. Salt Marshes in New York State
In New York, salt marshes can be found across Long Island in north and south shore embayments and inthe Peconic estuary at the eastern end of the island, as well as around New York City, in WestchesterCounty on Long Island Sound, and in the Hudson River north to approximately the Tappan Zee Bridge.The Hudson River is tidal north to the Federal Dam at Troy, New York, but is in general not greatlyinfluenced by salinity north of Poughkeepsie, New York (NYS DOS, 1990).
Tidal ranges differ greatly among these areas, ranging from 0.2 meters in the South Shore Estuary atBayshore, Long Island, to 0.7 meters at Montauk Point and Plum Gut in eastern Long Island, to 1.3 metersat The Battery in New York City, and approximately 2.0 meters at both Willets Point in the East River inNew York City and at Port Jefferson on Long Island’s north shore. Because of these variations in tidalregime, salt marsh communities within New York State differ, particularly in terms of vegetation. Saltmarshes with large tidal ranges are often dominated by tall form Spartina alterniflora, while those foundin areas with more restricted tidal ranges will maintain a short form Spartina alterniflora zone, and moreexpansive high salt marsh areas.
2.c. Salt Marsh Vegetation
Salt marshes constitute some of the most diverse and biologically productive habitats of the coastal region.Typical zonation in a salt marsh includes low marsh, high marsh, and mudflats. This zonation can extendto include brackish and freshwater tidal habitats as well. However, restoration of brackish and freshwatertidal marsh habitats are not within the scope of this document.
Salt marsh zonation is generally defined by salinity gradients and duration of inundation. Salt marshes are,however, a dynamic ecosystem. The extent of zonation can be influenced by a number of naturalprocesses. For example, as peat accumulates under marsh grasses, higher marsh elevations are subjectto less frequent flooding by tides, which may lead to conversion from low to high marsh.Low marsh, which is submerged at high tide but exposed at low tide, is dominated by smooth cordgrass(Spartina alterniflora). Smooth cordgrass can grow to three meters (ten feet). Few other higher plantspecies are present in the low marsh; species of algae like rockweed (Fucus vesiculosus), green algae(Enteromorpha spp.), and sea lettuce (Ulva lactuca) may be present between cordgrass stems.Glasswort (Salicornia europaea) can sometimes be found, in low densities, in the low marsh zone.
High marsh, which is only periodically flooded by spring and flood tides, is dominated by a mix of salt-meadow cordgrass (Spartina patens) and short-form smooth cordgrass, with lesser amounts of spikegrass(Distichlis spicata), and black grass (Juncus gerardii). High marsh may also support switchgrass(Panicum virgatum), sea-lavender (Limonium carolinianum), saltmarsh plantain (Plantago maritima),seaside gerardia (Agalinis maritima), and glassworts (Salicornia spp.). This zone also supports a saltpanne community in the depressions and pools of the high marsh surface. Inundation of these areas

13
Figure 4. Tall form Spartina alterniflora in the low marsh zone.
fluctuates greatly, often causing substantial increases in salinity in soil water. The salt panne communitygenerally exhibits glassworts, short-form smooth cordgrass, and arrowgrass (Triglochin maritimum);widgeon grass (Ruppia maritima) grows in permanent pools.
Tidal creeks frequently occur in conjunction with coastal salt marsh. These creeks flow sinuously throughmarsh vegetation, and have vertical banks that may erode and slump into the water, which is fresh to saline.Salt marsh tidal creeks also distribute seawater throughout the marsh, and transport wrack, detritus andaquatic species into and out of the vegetated marsh.
Intertidal mudflats are comprised ofsandy or muddy substrates lyingbetween low and high tide. Intertidalmudflats are entirely exposed duringlow tide. The chemical properties ofintertidal mudflats are primarilydetermined by substrate grain size, i.e.,fine or coarse. Mudflats do notsupport any rooted vegetation but arecharacterized by communities ofmicro- and macroalgae. These algalcommunities often form extensive matson the surface. Intertidal mudflats alsosupport important bacterialcommunities.
2.d. Salt Marsh Fish and Wildlife
There are a number of bird species that nest in tidal marshes, including marsh wren (Cistothorus palustris),sharp-tailed sparrow (Ammodramus caudacutus), red-winged blackbird (Agelaius phoeniceus), black-crowned night heron (Nycticorax nycticorax), Canada goose (Branta canadensis), American black duck(Anas rubripes), and sometimes clapper rail (Rallus longirostris) and willet (Catoptrophorussemipalmatus).
Many more birds depend on tidal marshes for food, feeding on small fish, invertebrates, insects, andvegetation. This group includes Canada goose, which breeds and winters in salt marshes near ice-free,shallow water, and American black duck, a permanent resident requiring nearby open water and thickmarsh vegetation. Green heron (Butorides striatus), great egret (Casmerodius albus), snowy egret(Egretta thula), glossy ibis (Plegadis falcinellus), tree swallow (Tachycineta bicolor), and terns (Sternaspp.) also feed in tidal wetlands. Northern harrier and short-eared owl (Asio flammeus) hunt in marshesfor small mammals like meadow vole (Microtus pennsylvanicus).
14
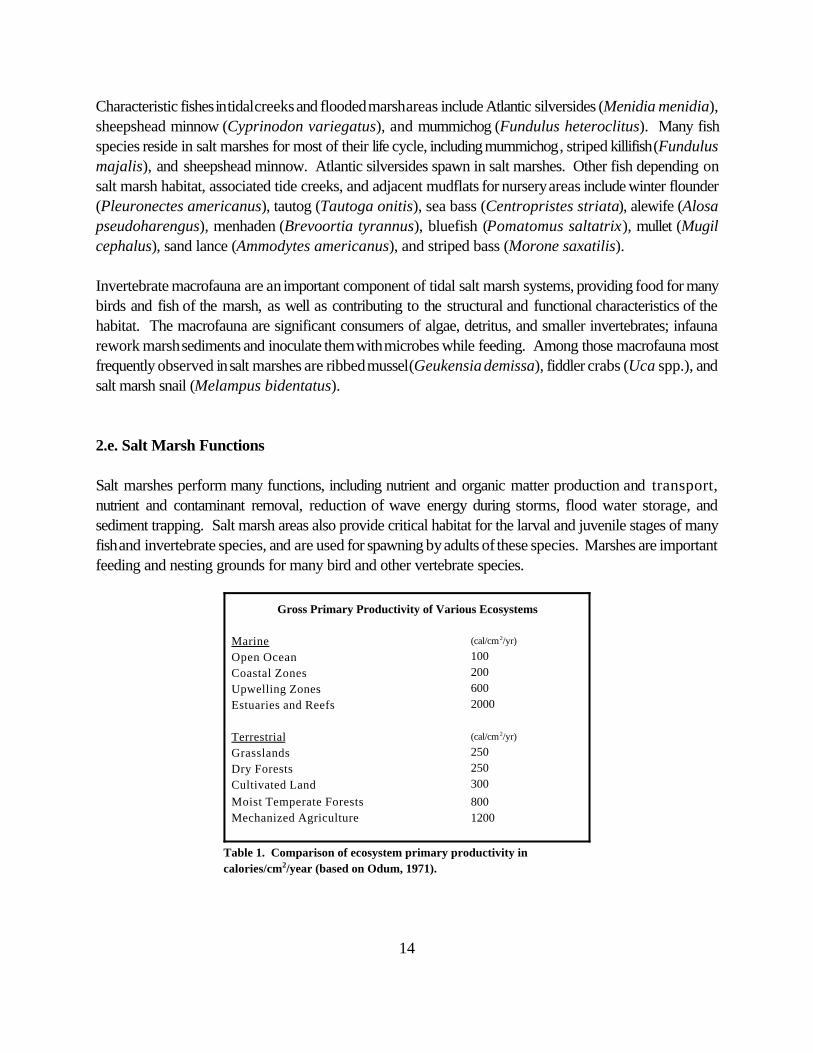
Gross Primary Productivity of Various Ecosystems
Marine (cal/cm2/yr)
Open Ocean 100Coastal Zones 200Upwelling Zones 600Estuaries and Reefs 2000
Terrestrial (cal/cm2/yr)
Grasslands 250Dry Forests 250Cultivated Land 300
Moist Temperate Forests 800Mechanized Agriculture 1200
Table 1. Comparison of ecosystem primary productivity incalories/cm2/year (based on Odum, 1971).
Characteristic fishes in tidal creeks and flooded marsh areas include Atlantic silversides (Menidia menidia),sheepshead minnow (Cyprinodon variegatus), and mummichog (Fundulus heteroclitus). Many fishspecies reside in salt marshes for most of their life cycle, including mummichog , striped killifish (Fundulusmajalis), and sheepshead minnow. Atlantic silversides spawn in salt marshes. Other fish depending onsalt marsh habitat, associated tide creeks, and adjacent mudflats for nursery areas include winter flounder(Pleuronectes americanus), tautog (Tautoga onitis), sea bass (Centropristes striata), alewife (Alosapseudoharengus), menhaden (Brevoortia tyrannus), bluefish (Pomatomus saltatrix), mullet (Mugilcephalus), sand lance (Ammodytes americanus), and striped bass (Morone saxatilis).
Invertebrate macrofauna are an important component of tidal salt marsh systems, providing food for manybirds and fish of the marsh, as well as contributing to the structural and functional characteristics of thehabitat. The macrofauna are significant consumers of algae, detritus, and smaller invertebrates; infaunarework marsh sediments and inoculate them with microbes while feeding. Among those macrofauna mostfrequently observed in salt marshes are ribbed mussel (Geukensia demissa), fiddler crabs (Uca spp.), andsalt marsh snail (Melampus bidentatus).
2.e. Salt Marsh Functions
Salt marshes perform many functions, including nutrient and organic matter production and transport,nutrient and contaminant removal, reduction of wave energy during storms, flood water storage, andsediment trapping. Salt marsh areas also provide critical habitat for the larval and juvenile stages of manyfish and invertebrate species, and are used for spawning by adults of these species. Marshes are importantfeeding and nesting grounds for many bird and other vertebrate species.

15
The primary productivity of Spartina species on Long Island and in Rhode Island ranges from 430 to 510g dry weight/m2/yr (Nixon, 1982). Dry weight value may be roughly converted to an organic carbon value(g C/m2/yr) by dividing the dry weight value by two, as approximately one-half the dry weight of marshgrasses is carbon (Peterson & Peterson, 1979). The resultant carbon productivity ranges can be expressedas 215 to 255 g C/m2/yr for Long Island and Rhode Island marshes.
Salt marshes are the primary source of much of the organic matter and nutrients forming the basis of thecoastal and estuarine food web. As salt marsh vegetation decays, a steady supply of detritus is releasedinto surrounding waters, promoting the secondary production of finfish, shellfish, crustaceans, and birds.Salt marshes export an estimated 40% of the aboveground Spartina alterniflora biomass, rangingbetween 200-400 g dry weight/m2/yr (100-200 g C/m2/yr; Teal, 1986). For comparison, the world’saverage agricultural production from corn fields is 412 g C/m2/yr. Salt marshes, therefore, provide theresources for some of the most productive ecosystems on Earth (see Table 1).
Mudflats are also important contributors to primary production and breakdown of organic materials. Algalcommunities on mudflats are primary producers and provide a food source for snails and other benthicorganisms. Bacterial communities contribute to the breakdown of organic materials.
The presence of salt marsh grasses such as Spartina alterniflora reduces the energy of waves movingshoreward. At the seaward edge of salt marshes, a wave energy reduction of 26% m-1 vegetation has beenreported (Fonseca & Cahalan, 1992). Wave energy reduction decreases with distance into the marsh.The ability of salt marsh vegetation to reduce wave energy in this manner helps prevent shoreline erosion.
Reduction of wave and current energies in salt marshes causes them to trap sediment. As flow velocitydecreases, water loses its capacity to carry sediment particles (Nixon, 1982). Sediment then settles to thebottom. The large initial reduction in flow velocity at the seaward edge of salt marshes concentratessediment accumulation at this location, contributing to long-term maintenance and development of the saltmarsh (Teal, 1986). Salt marsh grasses also reduce the velocity of terrestrial runoff. Water leaving themarsh, therefore, carries less particulate material and is less turbid (Desbonnet et al., 1994).
Reduction of flow velocities by salt marsh grasses contributes to flood control. Decreased flow velocitiesallow water to be transferred into soils and underground watercourses (Desbonnet et al., 1994),decreasing the impact of flood waters on adjacent upland.
Salt marshes remove nutrients, especially nitrogen, from coastal waters, contributing to water quality.Experimental addition of nutrients during the growing season showed retention of between 80% and 94%of added nitrogen and phosphorus; in spring and fall retention dropped to between 60% and 75% of addednutrients (Teal, 1986). Salt marsh productivity is stimulated by the addition of nitrogen (Nixon, 1982), andconsequent increases in productivity by herbivores and detritivores are also reported (Teal, 1986). Highlyproductive areas of salt marshes are characterized by tall form Spartina alterniflora plants with thick,widely spaced stems. These characteristics make the marsh surface more accessible to predatory fish,increasing species diversity (Teal, 1986).

16
Salt marsh sediments filter and accumulate heavy metals (Teal, 1986). Most heavy metals form insolublesulfides that adsorb onto clays, organics, and precipitates in the sediments. Salt marsh vegetation stabilizesthe sediments, allowing formation of the anoxic environment required for deposition of heavy metal-sulfidecomplexes. Salt marsh grasses also take up metals to varying extents, sequestering them in plant tissuesuntil death. At this time, the metals are exported into surrounding coastal waters with plant detritus.Although salt marshes are generally thought to be a heavy metal sink, chronic contamination can damagethe marsh. Salt marshes carrying high heavy metal loads may also become a long-term source ofcontamination in coastal waters (Teal, 1986).
2.f. Conceptual Model for Salt Marsh System Restoration
2.f.1. Introduction to Conceptual Models
The conceptual model is a tool to assist the restoration practitioner in understanding important connectionsamong ecosystem attributes (physical, chemical, and biological). The model should also assist in selectingthe best monitoring parameters to assess the system with respect to project goals (Thom & Wellman,1996). Tailored conceptual models can be constructed for individual restoration projects, defining thespecific parameters controlling development and maintenance of the restoration site structure, its importantcharacteristics, and the functions for which it is being restored (Thom & Wellman, 1996).
In such models, a small number of critical, site-specific controlling factors, structural elements, and functionsare defined and the relationships between them outlined (often graphically). Below is a generic listing ofconceptual model components for salt marsh ecosystems, and specific parameters associated with thesecomponents that may be selected for use in a more tailored monitoring program. The best conceptualmodels and restoration monitoring programs will be based on site-specific information, data, and goals, i.e.,the listing below may not be comprehensive for every project’s purposes. However, basic planning maybe conducted using this listing, and the use of a conceptual model is recommended for all restorationprojects (Thom & Wellman, 1996).
2.f.2. Controlling Factors
The controlling factors of the salt marsh include 4 main categories. These are:
C Hydrology,C Morphology,C Water Chemistry and Physical Properties, andC Substrate Properties.
The controlling factors of a habitat are those that determine the structural and functional parameters at agiven site. These factors determine whether establishment of a salt marsh habitat is indeed possible at agiven site. In planning salt marsh restoration projects, the controlling factors should be carefully considered.

17
The hydrology of a potential restoration site involves the presence/absence and cycling of water at the site.Sources of water may include groundwater, rivers and streams, tides, tidal creeks, rainfall, snowmelt,terrestrial runoff, Combined Sewer Overflows (CSOs), and others. How these water sources enter andexit the site, in terms of quantity, form, frequency and duration, constitute site hydrology.
The morphology, or physical form, of a site is particularly important to salt marsh habitat because certainphysical forms interact with site hydrology to produce favorable conditions for salt marsh plant growth.Salt marsh morphology is determined by a variety of attributes, including elevation, slope, micro- andmacrotopography, and the presence/absence of channels, among others.
All salt marsh restoration projects will require detailed elevation maps and information on tidal range. Tomaximize the potential for success, knowledge of local tidal elevations is critical. These elements areassociated with the hydrological and morphological controlling factors of a restoration site.
Chemical and physical properties of the water entering and exiting a potential restoration site will be anadditional controlling factor governing establishment of salt marsh habitat. Important properties of waterinclude salinity and temperature. Individual species of both flora and fauna have different tolerancethresholds for these water properties. Specific chemical properties can therefore influence the communitystructure of the habitat.
Finally, substrate properties of a potential restoration site influence the interaction between the hydrologyand morphology of the site. The size and type of sediment particles influences water drainage and thelocation of the water table. Other properties, such as organic matter content, pH, salinity, and othersdetermine the presence/absence and growth rate of salt marsh flora and fauna.
2.f.3. Attributes of the Controlling Factors
The controlling factors described above are characterized by more specific attributes. These attributes canoften be measured and tracked, and therefore can be used to construct a monitoring program for a saltmarsh restoration project. Often, controlling factor attributes offer the most insight when used in pre-project planning and post-construction assessment. This is particularly true of hydrological andmorphological attributes. In other words, data on the hydrological and morphological attributes of apotential restoration site can guide planners in determining whether and how to restore a site into salt marshhabitat. After the site has been manipulated, measuring these attributes can help planners determinewhether the planned morphology and hydrology of the site have been achieved.
However, water chemistry and substrate attributes may provide the most insight over time as part of anongoing, post-project monitoring program. These attributes can be examined in relation to data on floraand fauna to assess cause and effect relationships between controlling factors and structural factors. Forexample, the presence of an undesired plant species may be explained by data on water chemistry and/orsubstrate properties. Further, resolving the cause of an undesired result then allows the practitioner to moreeffectively and efficiently make plans to correct the situation.

18
Hydrologic attributes include the following: Tidal elevations, duration of inundation, wave energy, height of water table, terrestrial water inputs,frequency of storm/rain/snow events, and timing of storm/rain/snow events.
Morphologic attributes include the following: Number of tidal inlets, tidal inlet width/depth/shape, slopes, elevation of site features, number of tidalchannels/creeks, sinuosity of channels/creeks, channel/creek width/depth/shape, and nearshore bottomtopography.
Water property attributes include the following: Salinity, temperature, pH, biochemical oxygen demand (BOD), contaminant concentrations.
Substrate properties include the following: Grain size/drainage, organic matter content, pH/oxygenation,and soil/porewater salinity.
2.f.4. Structural Elements
The structural elements of the salt marsh include 7 main categories. These are the following:
CIntertidal Flats/Primary producers,CIntertidal Flats/Fauna,CLow Marsh/Vegetation,CLow Marsh/Fauna,CHigh Marsh/Vegetation,CHigh Marsh/Fauna, andCUpland Fringe/Vegetation.
The structural elements of a site are not to be confused with the morphology, or physical shape, of the site.In a habitat, the structure is considered to be the plants and animals that occur there. In other words, a saltmarsh habitat is not a salt marsh habitat until the appropriate community of plants and animals inhabit a sitewith favorable morphological, hydrological, water, and substrate properties. The true structure of thehabitat, then, is indeed the flora and fauna present at the site.
Often, achieving a certain community structure, i.e., the occurrence of several specific attributessimultaneously, will be the primary goal of a restoration project. Alternatively, influencing a single structuralattribute may be the project goal, e.g., increasing the numbers of low marsh nesting birds inhabiting the site.Therefore, those structural attributes most closely associated with the restoration project’s goals should beincluded in the project’s monitoring program. In general, the structural attributes chosen will be trackedboth before and after site manipulation for purposes of comparison. Often, the same structural attributeswill also be tracked at a similar site nearby the restoration site (the “reference site”) that is not undergoingany manipulation. This allows the practitioner to resolve project-caused results from environment-causedresults during the ongoing, post-project monitoring program.

19
2.f.5. Attributes of the Structural Elements
The community structure of salt marsh habitat encompasses several distinct zones, where characteristic floraand fauna appear. These zones most generally include the intertidal mudflats, where topography is fairlylevel, with vast expanses of substrate exposed at low tide; the low salt marsh, usually dominated by a singletall grass species tolerant of daily, prolonged inundation; the high salt marsh, which is more irregularlyflooded and supports a more diverse array of plant and animal species; and the upland fringe, or salt shrubarea, where conditions are sufficiently dry that some woody vegetation may grow, and the influence offreshwater inputs can substantially increase plant diversity, supporting both salt-tolerant and brackishspecies.
To construct an appropriate monitoring program for structural attributes of a restoration project, it willgenerally be necessary to first define the zone or zones (as described above) that will be manipulated orcreated. Only specific attributes associated with those zones need to be monitored. Again, the goals ofthe restoration project generally provide the most insight into the structural attributes of highest priority.It is not necessary to track all the specific attributes of a particular zone to adequately assess the status ofthat zone; however, an adequate understanding of the relationships among structural attributes, and betweenstructural and controlling attributes, is essential in order to construct a monitoring program that effectivelyand efficiently assesses restoration success. Below is a listing of some key species found in the differentsalt marsh structural elements.
The Intertidal Flats/Primary Producers category includes:Sea lettuce (Ulva lactuca), green fleece (Codium fragile), green algae (Enteromorpha spp.), epibenthicmicroalgae/bacteria, epiphytic algae, and phytoplankton (in pools and during inundation).
The Intertidal Flats/Fauna category includes:Macro- & microinvertebrate infauna, salt marsh snail (Melampus bidentatus), mud snail (Ilyanassaobsoletus), oyster (Argopecten irradians), softshell clam (Mya arenaria), hard clam (Mercenariamercenaria), ribbed mussel (Geukensia demissa), marsh fiddler crab (Uca pugnax), sand fiddler crab(Uca pugilator), green crab (Carcinus maenas), mud crabs (Panopeus spp.), great egret (Casmerodiusalbus), snowy egret (Egretta thula), cattle egret (Bubulcus ibis), tricolor heron (Egretta tricolor), littleblue heron (Egretta caerulea), green heron (Butorides striatus), willet (Catoptrophorus semipalmatus),greater yellowlegs (Tringa melanoleuca).
The Low Marsh/Vegetation category includes:Tall form smooth cordgrass (Spartina alterniflora), rockweed (Fucus vesiculosus), and glassworts(Salicornia spp.).

20
The Low Marsh/Fauna category includes:Ribbed mussel, marsh fiddler crab, mummichog (Fundulus heteroclitus), sheepshead minnow(Cyprinodon variegatus), Atlantic silverside (Menidia menidia), juvenile fish and fish larvae includingwinter flounder (Pleuronectes americanus), alewife (Alosa pseudoharengus), bluefish (Pomatomussaltatrix); clapper rail (Rallus longirostris), willet, marsh wren (Cistothorus palustris).
The High Marsh/Vegetation category includes:Salt meadow cordgrass (Spartina patens), short form smooth cordgrass, spike grass (Distichlis spicata),black grass (Juncus gerardii), switchgrass (Panicum virgatum), sea-lavender (Limoniumcarolinianum), glassworts, and widgeon grass (in pannes).
The High Marsh/Fauna category includes:Mummichog (in pannes/high tide), sheepshead minnow (in pannes/high tide), Atlantic silverside (inpannes/high tide), salt marsh snail, periwinkle (Littorina littorea), hydrobia (Hydrobia totteni), northernharrier (Circus cyaneus), wading birds (in pannes), American black duck (Anas rubripes), sharp-tailedsparrows (Ammodramus caudacutus), marsh wren, meadow vole (Microtus pennsylvanicus), muskrat(Ondatra zibethicus), raccoon (Procyon lotor), mosquitoes (Aedes spp.), grasshoppers, and spiders.
The Upland Fringe/Vegetation category includes:Marsh elder (Iva frutescens), groundsel bush (Baccharis halimifolia), switchgrass, three-square rush(Scirpus pungens), seaside goldenrod (Solidago sempervirens), and prairie grass (Spartina pectinata).
2.f.6. Functions
The functional elements of the salt marsh include 9 main categories. These are:
CProvision of habitat,CPrimary production,CSupport of food web dynamics,CCycling of nutrients,CExport of organic matter,CRemoval of contaminants,CAttenuation of wave energy,CStorage of flood water, andCEnhancement of sedimentation/accretion.
Salt marsh ecosystems can support an array of functions that provide ecological services to native flora andfauna, other habitats, and also economic services to human beings. Functions can be thought of as the“activities” of the salt marsh, regardless of whether they are caused actively or passively by the flora andfauna. These functions are the products of the interaction of controlling factors and structural attributes.

21
Attaining one or more of these functions is often the goal of a restoration project, i.e., to reach a statewhere the ecological and/or economic salt marsh services are available. For example, a project goal mightbe to increase primary production and support higher trophic levels in the food web, such as commercialand recreational fish species. An obvious functional goal of many salt marsh restoration projects isprovision of habitat, either for a single priority species or a suite of native species. Many functions areclosely associated with specific structural attributes: Provision of habitat is again an obvious example, asthe particular structure of the animal community is largely influenced by the structure of the plant community,and also vice versa. Also, attenuation of wave energy and storage of flood waters are directly determinedby plant community structure; food web dynamics are determined by both plant and animal communitystructure.
Tracking functional attributes of the ecosystem during a restoration monitoring program is important;however, some functions may be inferred by monitoring the structural attributes with which they are closelyassociated. In general, at least one important function of salt marshes should be monitored as part of theongoing restoration monitoring program to assess the development of the natural processes underlying thestructure. Monitoring these processes can provide an early warning of problems with the restoration; thatis to say, an appropriate structure may exist at the site, but sub-optimal or abnormal functioning mayindicate degradation of this structure, or an inability to provide other related functions.
2.f.7. Specific Functional Parameters
The salt marsh functions discussed above can be tracked by measuring or observing specific parameters.Some of these specific functional parameters may be auxiliary project goals, e.g., community resistance andresilience, low water column turbidity, or a low frequency of flooding in adjacent terrestrial areas. Choiceof one or more of these specific measurement parameters should be dictated by the restoration project’sgoals, and more specifically by an adequate understanding of the relationship among functions and betweenfunctions, ecosystem structure, and controls.
Provision of habitat parameters include:Landscape patchiness, species richness (number of species), species dominance (relative abundance),community resilience (after disturbance), and community resistance (to disturbance).
Primary production parameters include:Aboveground biomass, belowground biomass, and gross/net production.
Support of food web dynamics parameters include:Number of trophic levels, trophic organization, and ecological efficiency (trophic transfer).
Cycling of nutrients parameters include:Nitrogen fixation (N2 to NO3/NO2/NH3), denitrification (NO3 to N2), nitrification (NH3 to NO3), organicnitrogen (urea, amino acids, peptides), and detrital N/C ratios.
22
Export of organic matter parameters include:Primary production gradients, dissolved organic matter (DOM), and particulate organic matter (POM).
Removal of contaminants parameters include:Heavy metal concentrations (in H2O), plant tissue heavy metal concentrations, pesticide concentrations (inH2O), benthic macroinvertebrate tissue contaminant concentrations, and pollution gradients(sediments/water column).
Attenuation of Wave Energy parameters include:Flow velocities, erosion rates/patterns, and sedimentation/accretion rates.
Storage of Flood Water parameters include:Frequency/duration of flood events (of adjacent terrestrial areas).
Enhancement of Sedimentation/AccretionWater column turbidity, sediment cores, and sedimentation rate (using sediment traps).
2.g. Generic Activities Affecting Salt Marshes and Adjacent Habitats
Activities that cause disruptions in the hydrologic regime, or cause minor elevational or gradient changes,can have profound adverse effects on vegetated tidal wetlands. Degradation and loss of upland buffers maycause increased sediment flow, altered ground water elevations and flow, loss of nutrient filtering vegetation,and loss of wildlife habitat for wetland edge species. Changes in ambient soil and water salinities will affectspecies compositions in tidal wetlands and creek communities, e.g., invasion by common reed. Otheractivities that have an adverse effect on tidal wetlands include ditching, diking, fill, excavation, channeldredging, application of pesticides, and stormwater discharge. Finally, tidal creeks are affected byalterations to their bank structure, e.g., bulkheading, and by changes in the size or shape of their inlet.Mudflat areas adjacent to salt marshes are an extremely dynamic and somewhat resilient habitat. However,activities such as dredging and filling alter the area’s morphology, water circulation patterns, substrate type,and oxygenation, and can expose or bury organisms. Sediment resuspension can clog filter- andsuspension-feeding mechanisms in species like bivalve molluscs and substantially decrease primaryproduction as a result of light attenuation. This could lead to hypoxic substrates and a decline in benthichabitat quality.
3. HUMAN DISTURBANCES
Understanding human disturbances that cause negative impacts in the salt marsh habitat is important whenplanning and designing restoration projects. Ditching and filling account for the largest salt marsh losses inNew York State. There may be more than one type of human disturbance in a salt marsh. It would not

23
Figure 5. Aerial photo of grid ditching in Long Island tidal wetlands.
be unusual to see a salt marsh that has been ditched for mosquito control, partially bulkheaded to protecta shoreline development, and partially filled for adjacent development. Addressing these various humandisturbances will involve trade-offs that may only be effectively chosen if these disturbances, their impacts,and the available restoration methods are understood. Therefore, the generic human activities that maydisturb the salt marsh ecosystem, listed above, are discussed separately and in greater detail in this sectionof the document.
3.a. Ditching
Extensive grid ditching of saltmarshes has been conducted in thenortheast during this century, toeliminate or manage mosquito(Aedes spp.) populations (Taylor,1998; Hruby, 1990; Clarke et al.,1985; Niering & Warren, 1980).Grid ditching typically involvedconstruction of parallel ditches at100-150 foot intervals, and crossditches to drain standing water areas(Taylor, 1998). Some of the naturalstanding pools and pannes on themarsh surface do provide a breedingground for mosquito populations.However, ditching is non-specific in that it drains all pools, not only those standing pools serving asmosquito breeding areas. Impacts resulting from ditching include changes in original tidal regime and marshvegetation. The functions and habitat value of a salt marsh are decreased as a result of ditching. Clarkeet al. (1985) showed that foraging by shorebirds, waterfowl, and insectivores was greatly decreased in gridditched marshes in Massachusetts. Other researchers have observed decreases in the numbers of birdsusing ditched salt marshes over time (Howe et al., 1978; Nixon, 1982; Taylor, 1998). Draining also resultsin the loss of important submerged aquatic vegetation habitat in natural pools on the high marsh (Taylor,1998).
3.b. Filling
Many marshes have been filled, either as a result of the need to dispose of dredged material fromnavigational channels and basins (Rozsa, 1995), or to “reclaim” the land for development, industry, andagriculture (NYS Office of Planning Services, 1972; Freese & Kulhawy, 1983). Coastal salt marshes havealso been used extensively as a location for municipal landfills such as Pelham Bay, Pennsylvania Avenue,
24
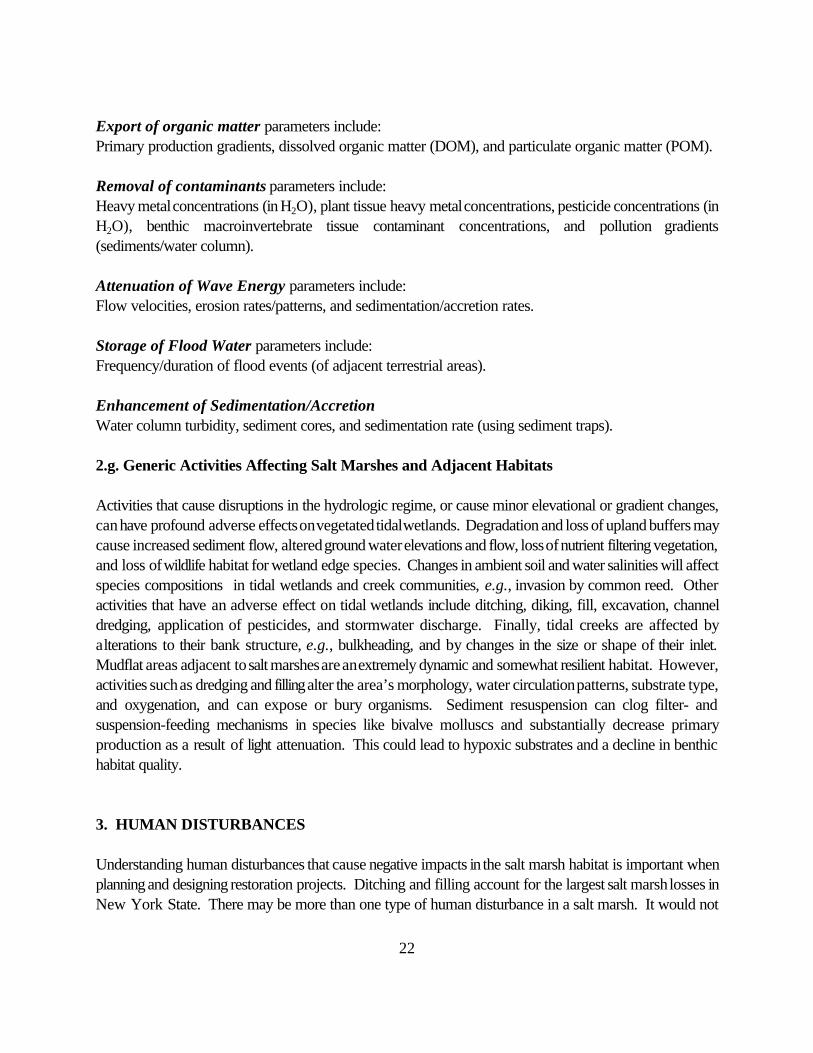
Figure 6. Wetland filling caused by golf course construction.
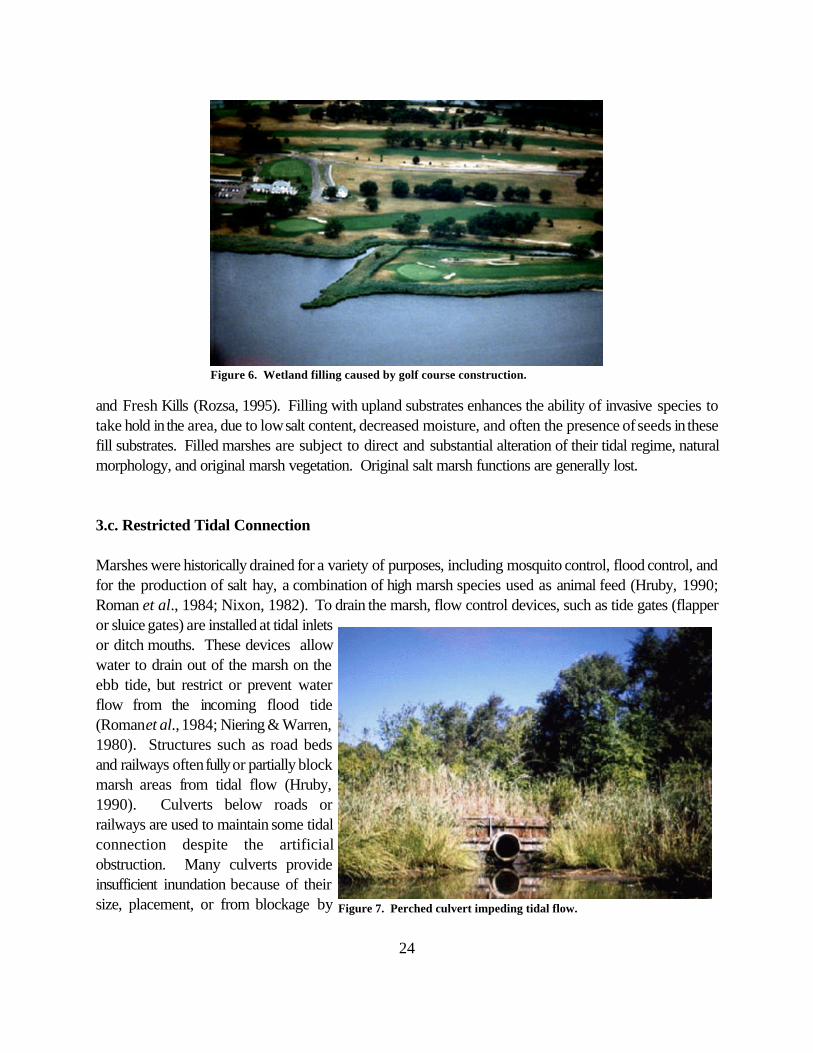
Figure 7. Perched culvert impeding tidal flow.
and Fresh Kills (Rozsa, 1995). Filling with upland substrates enhances the ability of invasive species totake hold in the area, due to low salt content, decreased moisture, and often the presence of seeds in thesefill substrates. Filled marshes are subject to direct and substantial alteration of their tidal regime, naturalmorphology, and original marsh vegetation. Original salt marsh functions are generally lost.
3.c. Restricted Tidal Connection
Marshes were historically drained for a variety of purposes, including mosquito control, flood control, andfor the production of salt hay, a combination of high marsh species used as animal feed (Hruby, 1990;Roman et al., 1984; Nixon, 1982). To drain the marsh, flow control devices, such as tide gates (flapperor sluice gates) are installed at tidal inletsor ditch mouths. These devices allowwater to drain out of the marsh on theebb tide, but restrict or prevent waterflow from the incoming flood tide(Roman et al., 1984; Niering & Warren,1980). Structures such as road bedsand railways often fully or partially blockmarsh areas from tidal flow (Hruby,1990). Culverts below roads orrailways are used to maintain some tidalconnection despite the artificialobstruction. Many culverts provideinsufficient inundation because of theirsize, placement, or from blockage by

25
debris. These types of disturbances result in salt marshes mapped as “formerly connected wetlands” bythe New York State Department of Environmental Conservation under Article 25, EnvironmentalConservation Law Implementing Regulations 6NYCRR Part 661. In these marshes, flow control devicesand/or inadequate culverts decrease or eliminate the connection between the marsh and its inundating bodyof water. Impacts resulting from restricting tidal connection may include changes in the frequency, volume,and duration of tidal flooding. Tidal restrictions can also change marsh vegetation, morphology, subsidence,water quality, and salinity and soil oxidation. Some restrictions also provide a physical barrier to certainfish and wildlife species that normally migrate in and out of the marsh. The effects of these tidal restrictionshave significantly degraded salt marsh functions and habitat value throughout the marine coast of NewYork.
3.d. Diking & Impoundment
Impoundments are flooded areas created by building dikes or placing weirs in the mouth of a creek or tidalinlet (Herke et al., 1992). Diking and impoundment of salt marshes has sometimes occurred under theguise of habitat creation: recreationally important colonial waterfowl species prefer expanses of open waterto emergent marsh areas (Peck et al., 1994; Sinicrope et al., 1990; Shisler, 1990). Unfortunately, afteran initial increase in waterfowl use in such impoundments, a subsequent decline occurs as the open waterhabitat is invaded by new plant communities, like cattail (Typha spp.) and common reed (Phragmitesaustralis; Rozsa, 1995). Impoundments were also created on some tidal creeks and embayments topower mills. Mill pond impoundments, which caused prolonged inundation of vegetated salt marshes ,resulted in the elimination of this vegetation from all but a narrow fringe around the impoundments as waterelevations increased (Rozsa, 1995). Impacts from diking and impoundment include changes in tidal regime,flooding, salinity, original vegetation communities, and possibly altered morphology. Many salt marshfunctions are substantially altered by impoundment. Shisler (1990) notes that impoundments were oftenthe cause of the worst mosquito problems associated with salt marsh habitats. In addition, Herke et al.(1992) showed that semi-impounded marshes result in a dramatic decrease in estuarine-dependent fish andcrustacean use and export.
3.e. Pollution
Salt marshes can be damaged or destroyed by acute pollution events such as oil spills, and chronicexposure to petroleum hydrocarbons from marinas, boat traffic, and terrestrial runoff. Petroleumcontamination kills marsh vegetation as well as fauna, and remains in the substrates, vegetation, and certainorganisms for a long time subsequent to the initial pollution event (up to 12 years; Teal, 1986). Chronicinput of small quantities of petroleum and other contaminants such as heavy metals, can also substantiallydamage marsh flora and fauna (Teal, 1986; Nixon, 1982).

26
Figure 8. Removing petroleum pollution from a marsh.
Other types of pollution affecting salt marshes include traditional mosquito management techniquesemploying broad-spectrum chemical pesticides, applied directly to the salt marsh (Lent et al., 1990). Forexample, DDT was used extensively to control mosquito populations in marshes throughout New YorkState until it was banned in eastern Long Island in 1966 and nationally in 1972 (Howe et al., 1978).Marine and coastal birds were significantly impacted by environmental contaminants such as chlorinatedhydrocarbons, including DDT. This category of compounds, mostly pesticides and herbicides,bioaccumulates in bird prey species and subsequently affects the reproductive processes of marine andcoastal birds (Howe et al., 1978). Contaminated sediments enter nearshore waters when they areresuspended in the water column by dredging (SCPD, 1985). Effects from chemical pollution include bothacute and chronic toxicity to marsh vegetation and wildlife, and may cause indirect impacts across thecoastal food chain.
Stormwater discharges are a major source of pollution, including petroleum hydrocarbons and polycyclicaromatic hydrocarbons (PAHs). These chemical compounds are often derived from road and paved arearunoff. The New York City Parks Department Natural Resources Group has conducted both field andlaboratory research on heterotrophic bacteria capable of degrading petroleum hydrocarbons found in theroot zone of smooth cordgrass. Petroleum-contaminated restoration sites are planted with Spartinaalterniflora and fertilized. The Spartina plants aerate the root zone, promoting growth of these beneficialbacteria. Reductions in total petroleum hydrocarbons in field studies to date show that this process isworking (Matsil & Feller, 1996).
Stormwater discharges also cause sedimentation in the marsh at rates far greater than those associated withnatural marsh building processes. Stormwater sediment loads are primarily derived from sand and dirtrunning off roads and paved surfaces. While deposition of sediment over the long term from regular tidalflooding and periodic large storm events is integral to maintaining the natural configuration of the marsh andits vegetative communities (Stumpf, 1983), excessive sediment loads delivered by large pulses of

27
Figure 9. Bulkheaded shoreline of a tidal creek.
stormwater runoff disrupt this process. These sediment loads can result in significant changes to salt marshelevations. Stormwater discharges are also characterized by large pulses of fresh water into the system,which can disrupt the salinity regime in the marsh. Chronic fresh water influxes will alter soil salinities andthe nutrient cycling regime, and influence the vegetative community found at the site. Both stormwaterdischarge impacts—excess loading of sediment and fresh water—may result in competitive exclusion ofnative salt marsh vegetation by invasive species. Functions and habitat can be severely impacted, if noteliminated, as a result of all types of anthropogenic pollution (chemical contaminants, excess sedimentation,freshwater pulses) in the salt marsh.
3.f. Shoreline Hardening & Structures
Increased residential and recreational use ofthe coastal area has led to a greater numberof man-made structures intruding in andaffecting natural habitat. In salt marsh areas,such structures are primarily bulkheads,revetments, groins, jetties, breakwaters, anddocks. Bulkheads, generally constructed ofwooden planks, steel sheeting, or concrete,are structures designed to minimize the lossof substrates from the shoreline by erosion(Freese & Kulhawy, 1983). Bulkheads andother structures such as revetments deflectwaves from the shore face, but causescouring at the toe of the structure and theadjacent shorelines. This process undermines the integrity of the structure itself, and alters the slope of theadjacent bottom areas. Single sections of bulkhead can actually increase erosion rates in adjacentunprotected areas; this “flanking” of the bulkhead results in erosion of the shore behind the bulkhead fromeither side (Freese & Kulhawy, 1983).
The presence of bulkheads initiates a cycle where toe scour causes a deepening of the water directly infront of the bulkhead; wave heights and flooding are thereby increased; and wetland areas that wouldnaturally attenuate wave energy and store flood waters are eroded away.
New marsh formation, especially on the back side of barrier beaches on the south shore of Long Island,is dependent on overwash from storms. These processes are impeded by shoreline hardening structures.Marsh accretion and landward retreat are also prevented by bulkheads.
The construction of small, “light duty” docks, pedestrian catwalks or walkways, and observation platformsis common in marshes. Researchers examined the effects of docks on salt marsh vegetation, and found that

28
Figure 10. Walkway to a dock constructed over salt marsh.
dock height (measured from the marsh surface to the bottom of the longitudinal supporting beam) was asignificant limiting factor for vegetation growth under those structures (Kearney et al., 1983). The presenceof docks and other pile-supported structures create a shaded environment that may result in the loss ofvegetation adapted to higher light intensity. In their study, Kearney et al. (1983) found that both height anddensity of all plant species examined were severely depressed at dock heights of < 30 cm. Normal heightswere attained in different species of vegetation at different dock heights: spikegrass was largely unaffectedby a dock of ~70 cm in height; salt meadow cordgrass required a dock height of ~85 cm to remainunaffected; smooth cordgrass required a dock height of ~200 cm to reach no effect status.
Effects from shoreline hardening and the placement of other structures (such as docks) in or near saltmarshes may alter marsh vegetation, structure, and hydrology. The New York State Department ofEnvironmental Conservation, under 6NYCRR Part 661, has requirements for dock width and placementin intertidal marshes, flats, and adjacent areas. Cumulative impacts from a large number of individual, smallscale projects negatively affect, if not eliminate, the function and habitat value of salt marshes.
3.g. Sea Level Rise
Sea level rise is thought to be induced largely by increasing concentrations of greenhouse gases fromautomobiles and industrial emissions (e.g., carbon dioxide, methane) in the atmosphere and their concurrentimpact on global temperature (Titus, 1991; Titus et al., 1991). Current estimates of sea level rise rangefrom 50-200 cm (2-7 ft) over the next 150-200 years (Titus et al., 1991); a 30 cm (1 ft) rise is likely bythe year 2050 (Titus, 1991; EPA Global Warming Site, 1998). Coastal marshes are particularly vulnerableto global sea level rise, as they occur primarily within a few feet of mean sea level (EPA Global Warming
29
Site, 1998; Titus et al., 1991). Although marshes successfully developed despite sea level rise (and fall)over time (Teal & Teal, 1969; Orson et al., 1987), the current situation poses a serious threat to theseareas for several reasons.
Sea level rise now occurs at a more rapid rate than in the past. Many coastal wetlands, which rise as aresult of sediment accumulation and peat building, may not succeed in keeping pace (Titus et al., 1991).Concurrent with a rise through peat accumulation comes a landward migration of the marsh. However,many marshes are adjacent to bulkheaded and developed uplands, and inland migration of the marsh assea level rises is precluded (see Shoreline Hardening & Coastal Structures above; Titus et al., 1991; Titus,1991; Rozsa, 1995; Teal, 1986). Most adjacent upland areas are steeper than current wetland areas.Even if salt marsh development keeps pace with sea level rise a net loss of coastal wetland acreage wouldstill occur (Titus, 1991). Researchers predict a one meter rise in sea level will inundate 36,000 km2
(14,000 mi2), divided equally between wet and dry land (Titus et al., 1991). This underscores theimportance of identifying and protecting low lying areas to allow future landward migration of salt marshes.
Other anthropogenic factors not associated with global warming are also blamed for sea level rise over thepast century. Groundwater withdrawal, surface water diversion, changes in land use, and deforestationare thought by some to be responsible for ~30% of this century’s rise in sea level (Sahagian & Schwartz,1994; Sullivant, 1994; Monastersky, 1994). Subsidence of coastal areas from groundwater withdrawaland landform modification will compound the effects of sea level rise on salt marshes (Fee, 1993; C. Rilling,personal communication).
4. NATURAL DISTURBANCES
Natural disturbances in the salt marsh may compound the effects of anthropogenic disturbances, and mayinfluence the timing and methodology selected, as well as the likelihood of success, for restoration projects.Natural disturbances are not “bad” in themselves, but may be “bad” for a restoration project, especiallyif they are not considered during planning. The natural processes discussed below—seasonal disturbancesassociated with ice sheets, and acute natural disasters such as storms and hurricanes—are destructiveforces at work in the marsh, and may substantially alter morphology and vegetative succession. They arenonetheless part of the natural ecology of the salt marsh, necessary for development and maintenance ofthe habitat over time. Existing anthropogenic stresses in the salt marsh, however, may adversely affectmarshes’ resilience to natural events.
4.a. Seasonal Disturbances
Salt marshes in the northeastern United States can be covered with ice during the winter. Ice sheets uprootvegetation in the marsh when chunks of ice are dislodged by storms. Tidal action also causes ice sheetsto shear the stems of cordgrass and other marsh plants (Bertness, 1992; Niering & Warren, 1980). Icemay cause changes in the elevation of a salt marsh through sediment erosion, transport, and deposition.

30
Large debris (e.g., boulders, lumber or concrete from coastal structures) may be transported by ice anddeposited on the marsh surface, changing morphology and directly affecting vegetation (Shisler, 1990;Freese & Kulhawy, 1983).
Ice scouring can also cause indirect impacts to salt marsh environments. Uprooted plants and shorn stemsare transported in extensive rafts onto upper high marsh areas by extreme high tides or storm waves. Raftsof material remain trapped on the surface of the marsh when high waters recede, where they may shadeout existing vegetation. Patchy loss of marsh vegetation from both the ice scouring and subsequentdeposition of debris rafts on the high marsh is important in maintenance and development of vegetativecommunity structure in the salt marsh. Bare areas produced by this loss of vegetation are colonized bymore opportunistic salt marsh vegetation, or form shallow pannes which can increase species diversity andhabitat heterogeneity of the marsh (Bertness, 1992; Niering & Warren, 1980).
4.b. Natural Disasters
Weather events have disastrous effects on coastal environments. Wave energy during tropical(hurricanes) and extratropical (nor’easters) storms may cause severe shoreline erosion, changing themorphology of salt marshes, and of the nearby submerged landforms and protective features that influencethem, such as sandbars and barrier beaches. Storm surge, a rise in overall water levels beyond that ofnormal tides, may cause severe impacts on coastal areas, largely due to flooding. Storm surge is influencedby direct wind action, atmospheric low pressure, heavy rainfall, and wave and swell transport of water.The timing of peak surge with respect to the tidal cycle will determine the degree of severity of surge-related flooding (Freese & Kulhawy, 1983). Sediment and debris may be deposited in excess on thesurface of the marsh during hurricane and heavy storm events, resulting in morphological changes to themarsh and direct impacts on vegetation (Niering & Warren, 1980). However, it should be noted thatstorm-related sediment deposition also appears to be a crucial element in maintaining some marshes overthe long term as they contend with sea level rise (Stumpf, 1983).
5. POST-DISTURBANCE CONDITIONS IN SALT MARSHES
Developing a successful restoration plan ultimately depends on an understanding of the on-the-groundeffect(s) caused by a disturbance. A single type of disturbance may have several effects; for example, atidal restriction placed within a salt marsh habitat will alter the tidal regime, possibly cause subsidence andaeration of the substrate, change the substrate salinity, and potentially promote the invasion of nuisancespecies. The details of a restoration plan must respond to site-specific issues, avoiding a generic responseto disturbance type. Projects that do not respond to impacts in the habitat are more likely to be subjectto unforseen problems and failure. The most prevalent on-the-ground impacts stemming from theanthropogenic disturbances discussed above and observed in salt marsh habitats of the northeastern UnitedStates are discussed in this section.

31
5.a. Changes in Tidal Regime
Tidal inundation is the primary physical characteristic of a salt marsh. Alterations in the tidal regime willhave a profound effect on the vegetative communities present (Lefor et al., 1987). Salt-tolerant vegetationwill be replaced by other species in areas that are no longer inundated. Phragmites australis (commonreed) will often invade these disturbed environments, outcompeting other species and often forming amonoculture (Roman et al., 1984; Niering & Warren, 1980). Impounded or other areas with decreasedsalinities may become dominated by brackish species, such as cattail (Typha angustifolia; Beare & Zedler,1987; Peck et al., 1994; Sinicrope et al., 1990). In addition, lack of inundation will cause marshsubstrates to dry out, changing the chemical properties of these substrates and increasing erosion by wind,rain, and terrestrial runoff. Finally, tidal restrictions that prevent inundation reduce or eliminate the extentof fish use of the marsh (Burdick et al., 1997).
Changes in tidal regime may also lead to increased inundation. Inlet dredging, for example, causesincreased tidal flow into an embayment, raising the mean high tide elevation and changing the zonation ofsalt marsh vegetation. Low marsh Spartina alterniflora replaces former high marsh vegetation in the newintertidal zone. The overall area of the salt marsh is decreased as the former low marsh is lost underwater.
Reduction of tidal range in a salt marsh lowers the water table, and surface substrates become dry. Inaddition to drying, the oxygen content of these substrates increases. Associated with aeration of marshsubstrates is a host of other chemical processes, including an increased rate of organic matterdecomposition (oxidation), conversion of iron sulfide (pyrite) in marsh substrates to sulfuric acid, decreasein substrate pH to highly acidic conditions, and mobilization of potentially bioavailable heavy metals.
5.b. Subsidence
Subsidence is a drop in the surface elevation of the marsh below its former elevation. Tidal restrictions,in addition to reducing saltwater flooding, reduce the amount of sediment entering the marsh. Decreasedsedimentation, compaction of dry marsh peat, and increased microbial decomposition of the peat can causesubsidence over time (Roman et al., 1984; Rozsa, 1995). Subsided areas that are subjected once againto full tidal flow may be inundated for periods too long for the survival of salt marsh vegetation (Seneca etal., 1985); i.e., too much water remains on the marsh during low tides (Rozsa, 1995).
Restoration of tidal flow can result in the conversion of the area to a habitat other than salt marsh, such asshallow water habitat or unvegetated flats. Restoration of salt marsh in subsided areas can occur, butlonger time frames are required. Rozsa (1995) observed that the Great Harbor Marsh (CT), which hadsubsided 60 cm (2 ft.) below its original elevation as a result of a tide gate, once again supported wetlandvegetation 40 years after a hurricane destroyed the gate in the 1950s. However, despite nearly a half-century of self-restoration, the plant communities in Great Harbor Marsh did not replace those lost whenthe tide gate was installed—the area had supported a high marsh plant community, but now supports aSpartina alterniflora-dominated low marsh community (Rozsa, 1995).

32
Restoration of original plant communities in a subsided marsh may require more highly engineered solutions;Rozsa (1995) cites work conducted by the U.S. ACOE at Leetes Island Marsh (CT) modeling controlledflow restoration, which uses a series of structures that allow more water to leave the salt marsh on low tidethan enters on high tide. Another solution may be the addition of fill to subsided intertidal or subtidal areas,creating suitable elevations for the establishment of salt marsh vegetation (C. Pickerell, personalcommunication).
5.c. Flooding
Drained salt marshes that have subsided due to oxidation and decomposition may increase the potentialfor freshwater flooding. When marsh elevations are lower, freshwater inputs from rainfall, snowmelt,creeks or rivers may remain trapped on the marsh surface. Standing water such as this may increasemosquito populations (C. Rilling, personal communication).
Flooding frequently occurs as a result of diking creeks and rivers. Salt marshes become flooded with freshor brackish water, decreasing the ambient water and soil salinities and changing other chemical parameters(Shisler, 1990). The new ambient conditions influence the vegetative communities present, and invasive orbrackish species generally dominate (Sinicrope et al., 1990; Beare & Zedler, 1987). Impounded wetlandsthat have existed as standing water areas for some period of time may accumulate a great deal of sediment.In such instances, elevation of the former wetland surface, if drained, may no longer be appropriate forestablishment of the original salt marsh community. Salt marsh vegetation can be lost due to prolongedinundation .
5.d. Changes in Salinity
Salt marshes that have been modified to decrease or eliminate tidal inundation will experience alterationsin the salinity of both the “standing” water present, and their substrates. During dry periods, salinities in themarsh will increase as evaporation occurs and there is no tidal flushing or rainfall to dilute salt build-up(Nordby & Zedler, 1991). High concentrations of salt may burn plant roots, community composition maychange, and barren zones may appear (Bertness, 1992).
Conversely, during wet periods (e.g., rainfall, flooding, spring melt events, pulses of fresh water from seweroverflows), salinities will decrease as salt content is diluted and not replenished by tidal inundation. Asimilar situation may result from the impoundment of marshes at the mouth of a river or creek. Theincoming brackish or fresh water will remain in the impoundment basin and no tidal flushing occurs toreplenish salt content (Nordby & Zedler, 1991).
A decrease in salinity in the marsh to less than ~18 parts per thousand (ppt) will promote the invasion ofcommon reed which is less tolerant of salt than naturally dominant species like smooth cordgrass and salt

33
meadow cordgrass. In reduced-salinity marsh areas where Phragmites invasion does not occur, plantspecies diversity is often substantially increased, encompassing both salt marsh and brackish species.Cattail, for example, will germinate and grow in marshes whose salinities have decreased below 20 ppt(Beare & Zedler, 1987). However, Nordby & Zedler (1991) found that among fish and macrobenthicspecies, reduced salinities resulted in reduced species richness and abundances, population structuresskewed toward young animals, and dominance by species with early reproductive development and longspawning periods.
5.e. Changes in Salt Marsh Vegetation
Salt marsh vegetation (primarily Spartina alterniflora and S. patens) may be lost as a result of chemicaland physical changes in the ecosystem and through competitive exclusion by invasive species. Even minorchanges in the elevation or salinity of salt marsh habitats will enhance competitive exclusion, especially bycommon reed. Phragmites australis is indigenous to the northeast (Orson et al., 1987); however, aninvasive form from Europe that spreads rapidly through brackish and freshwater marsh habitats is nowbelieved to be present in North America (Besitka, 1996; Casagrande, 1997; R. Rozsa, personalcommunication). Recent research indicates that the invasive European form is phenotypically distinct fromthe native version (Besitka, 1996); current studies are underway at Yale University (Principal InvestigatorProfessor K. Vogt/Research Assistant K. Sullivan) to establish genotypic differences between live, invasiveexamples of Phragmites and historical examples of native Phragmites (C. Rilling, personalcommunication).
Once established, Phragmites shades existing vegetation and hinders the germination and growth of otherspecies. Phragmites stands are also thought to provide inferior nesting habitat for many marsh birds(Howe et al., 1978), including seaside sparrow, sharp-tailed sparrow, and willet. These marsh specialistsare adapted to nesting in short grasses like Spartina patens and Distichlis spicata (Benoit, 1997).Conversion of salt marsh to Phragmites monocultures alters detrital cycling patterns due to the slowerdegradation rate of Phragmites’ woody stalks, and increases the likelihood of fire as dead, woody stemsaccumulate (Niering & Warren, 1980). The slower degradation rate of Phragmites stalks can also raisethe elevation of the marsh, thereby decreasing the area that can be flooded with salt water by tidal flow andfurther promoting Phragmites australis invasion (T. Diers, personal communication). Stands ofPhragmites, growing up to 14 feet in height, are often considered to negatively impact the “viewshed” inan area (Tiner, 1987; Eastman, 1995).
Total loss of vegetation in the marsh, and the subsequent exposure of the substrate, will impact otherimportant marsh functions. For instance, the presence of vegetation (any species) will decrease waveenergy and retard erosion of the shore; store flood waters and decrease flooding of adjacent upland areas;remove nutrients and contaminants from terrestrial runoff; and foster sedimentation, which improves waterquality in nearshore waters.

34
6. OVERVIEW OF RESTORATION METHODS
This overview of restoration methods is organized by types of impact (not disturbance) to assist with thedevelopment of restoration plans which respond to the specific conditions observed in a given salt marshhabitat. The impacts described in the previous section can generally be categorized as being associatedwith the tidal regime, the morphology, and/or the vegetation of the salt marsh habitat. For sites with impactsto tidal regime, for example, restoration planning will involve consideration of the factors discussed belowunder “Manipulating Tidal Regime”. Most projects will be required to respond to more than one impactcategory.
6.a. Manipulating Tidal Regime
6.a.1. General Considerations
The most basic means of restoring salt marshes is reintroduction of a tidal regime. Ditches may be pluggedto raise the elevation of tidal inundation in the marsh and reestablish natural pools and pannes in the marshsurface (Taylor, 1998). Tide gates and other flow restriction devices at tidal inlets may be removed orreplaced with self-regulating devices that are calibrated for appropriate tidal hydrology in the marsh(Niering & Warren, 1980; ASCE, 1998). Culverts may be removed, replaced with wider culverts, or haveclogging debris cleared from them (New Hampshire NRCS, 1998; Hruby, 1990). Dikes and otherimpoundments may be removed to drain flooded areas and restore a natural tidal range (Sinicrope et al.,1990).
Reintroduction of tidal flushing to drained marshes that have subsided will result in flooding duration thatis too long over most of the restoration area to achieve the original ratios of target plant communities (e.g.,low marsh, high marsh, salt shrub). Areas that were originally Spartina patens-dominated high marsh maybe converted to S. alterniflora low marsh (Hruby, 1990; Rozsa, 1995). In extreme cases, the subsidedarea may be converted to unvegetated intertidal flat or standing water (Rozsa, 1995). Restoration mayrequire some filling and regrading of the area to achieve the original, appropriate elevations before tidalinundation is reestablished. Conversely, for impoundments that have acted as settling basins, someexcavation and regrading may be required to appropriate elevations before tidal inundation is reestablished.Otherwise, a significant area of the restoration site will remain above mean high water elevation.
6.a.2. Measuring Tidal Elevations
The first measurements required when planning the restoration of tidal regime at a site are tidal elevations.Mean High Water (MHW) at a specific site is a function of tidal prism, and is affected by adjacent bottomcontours, prevailing winds, and currents (Lefor et al., 1987; PERL, 1990; Lagna, 1975). NormandeauAssociates (1992) note that salt marshes are associated with coastal features such as barrier spits andislands, embayments, and river mouths, all of which will modify tidal heights and ranges. Therefore,

35
published tidal data are not likely to be sufficiently accurate for an individual salt marsh restoration site.McKee & Patrick (1988) found that growth range of Spartina alterniflora is positively correlated withmean tidal range (the elevation difference between low and high water), which explained ~70% of thestatistical variation in upper and lower limits of growth. These researchers also found that Spartinaalterniflora growth range differs by latitude among marshes with similar tidal ranges. Therefore, it isessential that tidal elevations be determined specifically for individual restoration sites.
There are a variety of simple methods available for measuring tidal elevations. The New HampshireCoastal Program recommends a water-level maxima/minima gauge employing sliding magnets on ameasuring rod developed by Richter (1997). In addition, they describe a “glue stick method”, employingsix foot tomato stakes marked at five centimeter intervals, covered with dried Elmer’s glue colored withfood coloring. A number of such stakes are placed throughout the restoration site; when the tide rises theglue will be washed off up to the elevation of high tide, and this elevation can be reconciled with knownelevations at the site (NHCP, 1998). For example, a leveled string may be run from the stake (tied at thepoint indicating the highest elevation of the tide) to the point of intersection with the marsh surface. If thestring is level between these points, the point of intersection should closely approximate the level of hightide in the marsh.
Another simple tide staff is described by Roman et al. (1984). Graduated poles housed within circularpipes are placed near tide gates or tidal creek inlets at the restoration sites. The graduated poles have acup filled with cork dust attached. When the tide rises the cork dust floats up to the level of high tideadhering to the graduated pole at this level when the water falls. For any of these methods, a minimummeasurement duration of two complete Spring tidal cycles is required (Burdick, unpublished).
6.a.3. Duration of Inundation
Tidal elevation data should be combined with information on topographic elevation and morphology of thesite to determine duration of inundation. The duration of inundation at a particular elevation influences thevegetation found there. Seneca et al. (1985) studied the influence of duration of inundation on developmentof a planted Spartina alterniflora marsh. They found that through the first several growing seasons, S.alterniflora exhibited maximum well-being in the 7- and 4-hour inundation zones, but for the remainingperiod through 12 growing seasons S. alterniflora demonstrated a shift in maximum well-being to the 11-and 9-hour inundation zones, and dominated these zones for the duration of the study. The upper zones(7- and 4-hour inundation) became a mixed species marsh over the 12-year period, and by the twelfth yearPhragmites australis came to dominate the uppermost, 4-hour inundation zone (Seneca et al., 1985).These results compliment work from other researchers (Bertness & Ellison, 1987; Bertness, 1992) showingthat S. alterniflora is limited to the lowest elevations of the marsh because of competition with other marshspecies.

36
6.a.4. Sizing of Culverts
Where feasible, restoration tidal regime can be accomplished by removal of restrictions to the level of thenatural marsh surface. If removal of some or all of the restrictions is not feasible, culverts can be placedor enlarged to improve tidal flow into the marsh. Site specific calculations must be made to determine thevolume of tidal water required to flood the desired area.
Hruby (1990) provides a simplified method for estimating this volume. To calculate the volume of waterrequired to flood the wetland, the surface area of the wetland and a topographic map of the area areneeded. The amount of water needed to flood a given area of wetland can be calculated with thisinformation by assuming an even grade between the two intervals.
In order to determine how many culverts, and of what size, are necessary to deliver the required amountof water the volume of water that will flow through a culvert of a given size must be determined. Suchcalculations are complex for round or oval pipes; Hruby (1990) suggests that the following estimates (basedon data from Seatuck National Wildlife Refuge, Islip, NY) may be used: 1) A 12" round corrugated culvertwill pass ~1200 m3 in one tidal cycle. 2) A 35" oval pipe will pass ~4000 m3 in one tidal cycle. Thenumber of pipes needed to flood the area of the marsh can then be roughly estimated using these figures(Hruby, 1990). These calculations should be employed to obtain estimates only; an engineering studyshould be conducted during the formal planning process to determine the actual area of inundation that willresult.
6.a.5. Open Marsh Water Management
A series of techniques collectively termed “Open Marsh Water Management” (OMWM), designed toprovide alternatives to grid ditching and chemical applications for control of mosquito populations, can becategorized as tidal regime restoration methods. OMWM centers on the creation of permanent, deepwater areas in the high marsh that are connected by shallow channels to known mosquito breeding areas.Larvivorous fish, such as mummichog, thus have a habitat in the marsh (deep water pools), and access tomosquito breeding areas (shallow channels). When high water flooding of the marsh triggers larval hatches,the shallow channels are simultaneously flooded, bringing larvae-eating fish to the hatching mosquitopopulation (Lent et al., 1990).
Two desirable OMWM techniques are available: closed systems and semi-tidal systems. Taylor (1998)described optimum characteristics for the development of closed OMWM systems: Closed systems haveshallow ponds and pannes (2"-18"), sump ponds (30"-36"), and pond radial ditches (~30"). Ponds arecreated at small depressions of mosquito breeding, by enlarging the area of the depression and excavatingto a depth of 30"-36" in the deepest area of the pond. Peat depth is a limitation on any excavation forpannes, sumps, and ditches. Unconsolidated sands and gravels below the peat layer will not retain water(Hruby, 1990). Slopes should be gentle, ranging from 4:1 to 10:1. More shallow areas (such as theoptimum migratory bird depth of 12"-18", 2"-3" shorebird foraging depth, or 7"-25" preferred Ruppia

37
Figure 11. Ditch plug in an OMWM system.
maritima depth range) may be created in the pond, as long as there is a 30"-36" sump area providedsomewhere in the pond. Curvilinear ponds between 1/10 and 1/4 acre in size provide the greatest wildlifehabitat benefit. Radial connector ditches that allow larvivorous fish access to and from sump ponds andmosquito breeding habitat should be at least 18" deep and 24" wide. Existing ditches greater than 36" indepth may be filled with marsh spoil to achieve a more appropriate ~30" depth. To create shallow ponds,pannes, and sump ponds, some parallel grid ditches must be plugged to hold permanent water on the highmarsh. These ditches may be blocked with marsh spoil at or near their connection with the tidal channel.Plugs must be filled to slightly above marsh level, and extend laterally onto the marsh to prevent erosionaround the edge of the plug. Plugs will settle and be impacted by water flow before revegetation andstabilization occurs. Lumber may be used to reinforce plugs, and wire may be used to discourage muskratburrowing, during this stabilization period (Taylor, 1998). Another approach to ditch plugging involves useof 4' X 8' pressure-treated or marine plywood alone, driven into the peat with an excavator. The top maythen be notched to the depth desired for the ditch water level (C. Rilling, personal communication).
Some drawbacks to OMWM systems,especially the closed system, arereported. These systems may have highmaintenance costs (T. Diers, personalcommunication). However, NewHampshire mosquito control divisionshave found that properly-constructedclosed systems do not require ongoingmaintenance (J. Taylor, personalcommunication). OMWM systems havenot been demonstrated as a commonreed control method in salt marshes.Finally, the problem of spoil disposalresulting from pool and ditch excavationmust be confronted (T. Diers, personalcommunication). In general, however,
spoil from pool and ditch excavation may be used to bring up ditch depths and plug man-made ditches.Rotary ditching equipment may also be used to minimize spoil disposal impacts. This equipment, widelyused in Massachusetts, New Jersey, and Delaware, shoots out a slurry that does not raise salt marshelevation; vegetation is unchanged and the site fully recovered within one year (J. Taylor, personalcommunication).
The characteristics of semi-tidal systems are also described by Taylor (1998): This technique involves deepditches (30") with sills, or shallow tidal outlets (4"-8"), that are only partially tidal. In this manner a silldrains very shallow standing water from the surface of the marsh, but does not excessively lower the watertable. The depth of the sill controls the height of the water table. The sump pond and connector ditch

38
system described for the closed system is also used for semi-tidal systems. However, some natural pondand panne formation will be precluded by the lower water table, impacting shorter-legged bird foragingarea and vegetative community structure (Taylor, 1998).
Other biological methods of mosquito control have been suggested for use in salt marshes. The mostcommonly employed species, mosquito fish (Gambusia affinis), however, is native to the midwesternUnited States south to Mexico. This species has nonetheless been used for mosquito control in fresh andbrackish water habitats from coast to coast. Mosquito fish are used by Suffolk County Vector Control(Yaphank, NY) only in contained freshwater areas, such as ornamental ponds, and measures to preventescape into the natural environment are employed (T. Iwanejko, personal communication). Theintroduction of non-native species into the environment is not recommended. In addition, introduction ofmosquito fish into New York salt marshes is unnecessary due to the presence of native species of larvae-eating fish such as killifish.
6.a.6. Low-lying Structures
Before tidal inundation can be reestablished at a site, the elevations of the lowest structures in the area(private property, homes, roads) must be determined. Restoration of the full tidal range may not bepossible due to the potential for flooding nearby structures and property. Self-regulating tide gates areopened by a float that rises and falls with the tides. These devices can be set at the time of installation torestrict natural tidal inundation only to the extent required for the protection of low-lying structures. Self-regulating gates face the tidal side of an inlet and are hinged at the top; therefore, they float on the water’ssurface until counterfloats extending above the hinge point close them. The gates will be closed during hightides or storms, keeping excess water away from nearby homes and property. During ebb tide, a hydraulichead in the inlet reverses, and the gate reopens (ASCE, 1998). These devices require long-termmaintenance to ensure continued proper operation, but are effective in balancing habitat restoration andprotection of adjacent properties.
6.b. Manipulating Elevation, Slope, and Substrate
6.b.1. General Considerations
Salt marsh habitat is created by an interaction of the tidal regime and the morphology of the inundatedlandform. Specifically, proper elevations and slope are crucial for the establishment of native vegetation,which are specialized for different frequencies and duration of tidal inundation (Seneca et al., 1985;Broome et al.. 1988). For example, the difference in elevation between the marsh edge and the borderingupland may be only 10-15 cm, or 4-6 in. (Lefor et al., 1987). Therefore, reintroduction of tidal flushingalone may not meet your restoration goals.

39
Subsided or compacted areas which have lost elevation and lie below tidal elevations may require theaddition of fill. Conversely, filled marshes, which have gained elevation and lie above tidal elevations needto be excavated to an elevation allowing tidal inundation. Similarly, impounded areas that have acted assettling basins (increasing marsh elevation) may require some excavation (after draining the impoundment)to achieve elevations that will result in an appropriate tidal cycle for marsh vegetation. In any of thesescenarios, some grading and contouring will be necessary to achieve the necessary duration of inundation.
6.b.2. Slope
The slope of the site is an important factor to consider in restoration planning (Broome, 1990; Shisler,1990; Normandeau Associates, 1992). The more gentle the slope at a restoration site, the greater the areaon which intertidal marsh vegetation may become established. Broome et al. (1988) recommend slopesof 1-3% for marsh establishment. Gentle slopes dissipate wave energy over a greater area, therebydecreasing erosion and disruption to plantings. However, slopes that are too flat will decrease drainage,potentially leading to waterlogging and hypersaline conditions (Broome, 1990; Normandeau Associates,1992). Mature marshes exhibit a variety of slope conditions (<1% to 10%), ranging from flat, high marshsurface to the nearly vertical low marsh creek banks (Broome et al., 1988; Normandeau Associates,1992). Some authors cite an observed range of marsh slopes of 6-20% (Reimold & Cobler, 1986, citedin Shisler, 1990 & Normandeau Associates, 1992). The type of restoration and the site conditions will helpdetermine whether changes in the slope are required. Where excavation or fill are planned, target slopesshould be carefully considered. Projects involving simple removal of tidal restrictions, by contrast, oftenwill not require any change in slope.
6.b.3. Substrate Properties
Restoration of areas requiring the addition of fill, such as subsided or compacted marsh areas, may beaccomplished using uncontaminated dredged material of proper grain size (Coastal America, 1996). Thegrain size of added fill influences both vegetative success and the level of difficulty encountered in handlingthe material at the restoration site (Normandeau Associates, 1992; Broome, 1990). Substrate propertiesaffect colonization by important macrofauna, like Geukensia demissa and Uca pugnax (Kraus & Crow,1985; Bertness & Miller, 1984). Coarse substrates, such as sand, are well drained, preventing chemicalalterations associated with waterlogging from occurring (Normandeau Associates, 1992; Broome, 1990).These substrates are also more likely to resist excessive accumulation of salt (Broome et al., 1988). Sandis more easily handled, contoured, and planted than finer-textured substrates (Normandeau Associates,1992; Broome, 1990; Broome et al., 1988). However, sand is low in nutrients and fertilization of plantingsis required (Broome et al., 1988; Normandeau Associates, 1992). Also, Geukensia demissa prefersubstrates with a low sand content (0-20%) and high organic matter content (10-20%), and are found indecreasing concentrations on soils with increasing percentage of sand (Kraus & Crow, 1985).

40
Several authors cite specifications from Garbisch (1986) for wetland restoration substrates: a minimum ofone foot in depth of clean inorganic/organic material of which 80-90% by weight will pass through a No.10 sieve (Shisler, 1990; Normandeau Associates, 1992). Shisler & Charette (1984) recommend thefollowing order of preference for substrates: 1) natural marsh peat; 2) clay and silty clay; 3) estuarinesediments (dredged material); and 4) sand (cited in Shisler, 1990). These authors caution that sand placedon marsh peat is unstable and will compact over time, resulting in pools of standing water on the marshsurface (Shisler, 1990). Broome et al. (1988) comment, however, that although most marshes naturallyexist on peats high in organic matter, these marshes were initiated prior to organic matter accumulation, aprocess occurring over time through the development of the marsh itself. This organic matter accumulationwill occur over time in a marsh established on sand or dredged material as well.
6.b.4. Tidal Channels
The creation of tidal channels is often necessary to facilitate the transport of seawater into back marshareas. Filled marshes are more likely to require tidal channel creation than formerly connected or slightlydisturbed areas. Tidal channels will often develop their own “fingers” (dendritic channels) and morphologythrough exposure to the natural tidal regime over time (Simenstad & Thom, 1996). Therefore, planningand engineering these dendritic channels at a restoration site may not be cost-effective (R. Thom, personalcommunication). Planning for tidal channel creation should be based on restoration goals as well as thesize of the restoration site, its existing configuration, and the tidal regime to which it will be exposed.
6.b.5. Heavy Equipment
The use of heavy equipment in restoration activities (backhoes, bulldozers, trucks) may compact substratesthat have been graded to an appropriate elevation, possibly resulting in restoration failure. In addition,compacted substrates greatly affect the survival, development, and rate of plant propagation at the site.Herbaceous species planted for restoration require unconsolidated substrates of four to six inches in depthfor optimal development. There is special, low ground pressure equipment (less than 2 pounds per squareinch) available to help prevent compaction problems during restorations (Hruby, 1990; for example, CTDEP).
6.c. Manipulating Vegetation
6.c.1. Planting vs. Natural Colonization
Often, restoration of tidal flushing, combined with the existence or creation of an appropriate marshmorphology (i.e., elevation, slope, grade, substrate, etc.) will be enough to rapidly revegetate the area withnative salt marsh communities (see Sinicrope et al., 1990). However, if there is no peat layer, or the siteis isolated from sources of recolonizing vegetation, planting may be required in order to decrease the length

41
of time before natural revegetation occurs. Planting, though potentially costly, is beneficial in the restorationof sites damaged by pollution, e.g., an oil spill (Matsil & Feller, 1996), and can hasten re-establishment oftarget salt marsh vegetative communities.
The following factors should assist in making this decision: surrounding land uses and their potential tocontribute disturbances or invasive species; isolation of the site from similar, natural sites that could act asseed sources; the time of year the restoration will be accomplished; hydrologic considerations such astiming and duration of inundation, water level fluctuations, and flushing; and the characteristics of sitesubstrates and any substrate augmentations planned (Kentula et al., 1993).
6.c.2. Spartina alterniflora—Seeding
Seeding has been used to restore Spartina alterniflora marsh. However, seeding is not effective on sitessubject to even moderate wave energies (Broome, 1990) and is not recommended in most cases. Seedsmay be collected locally and propagated for planting as stems or plugs. Spartina alterniflora seed shouldbe harvested near maturity but prior to shattering (usually in August-early September in the northeast).Seed heads may be clipped with knives or shears. Harvested seed should be transferred to burlap sacksfor temporary storage and kept moist under refrigeration, for 3-4 weeks before threshing. After threshing,S. alterniflora seed should be stored in saline water (18-35 ppt) in covered containers at 2-4 degreesCelsius (36-39 degrees Fahrenheit). Seed life, when stored in this manner, is up to 1 year. For additionaldetail on harvesting seed heads, threshing, storage, and planting see Broome (1990) and Broome et al.(1988). The cost of Spartina alterniflora seed from a nursery runs from $15 to $35 per thousand purelive seed; the cost of pure live Spartina alterniflora seed needed to plant one acre (10 pure live seed persq. ft., requiring a total of 440,000 pure live seed) is approximately $6,600 (Environmental Concern,1998).
6.c.3. Spartina alterniflora—Stems, Plugs, and Potted Seedlings
Planting growing or dormant plants, or plant propagules, is the most reliable planting method for salt marshrestoration projects (Broome et al., 1988; Garbisch et al., 1975). Spartina alterniflora may be plantedusing single stems (no soil around roots) or plugs (intact root and soil mat included). Transplants of S.alterniflora may be dug from the field or grown from seed in pots or flats, either in a greenhouse oroutdoors when temperatures permit (Broome, 1990; Broome et al., 1988). Seedlings of S. alternifloraand other salt marsh plants may be greenhouse-grown in a medium of equal parts sand, top soil, and peatmoss or vermiculite (Broome et al., 1988).
Potted seedlings are desirable because they avoid disturbing natural vegetation, and can be held whendelays are encountered. However, potted seedlings often result in much higher costs (especially if they arepurchased from a nursery); require advance planning if not readily available from a commercial source orif propagated from harvested seed; are inconvenient to transport; and do not contain native soil compositionand microorganisms that will jump-start functional restoration (Broome, 1990).
42
6.c.4. Spartina alterniflora—Planting Methods
Mechanized planting has been accomplished at some sites--see Broome (1990) and Broome et al. (1988).However, hand-planting is generally required for intertidal vegetation. Planting should occur in spring orearly summer (e.g., May-June; Broome, 1990). Planting holes should be ~15 cm in depth, 5-7 cm indiameter; a soil auger of appropriate diameter may be used for this purpose (Broome et al., 1988). Stemsor plugs of Spartina alterniflora are then inserted into the planting hole. Soil should be firmly pressedaround the plant to prevent dislodging by waves (Broome, 1990).
6.c.5. Spartina alterniflora—Fertilization
Better results are often achieved when a slug of fertilizer, containing both nitrogen and phosphorus, is addedto each plant during planting (Garbisch et al., 1975; Broome, 1990; Broome et al., 1983). Slow releasefertilizers (such as Mag Amp or Osmocote), are the most effective and widely used (Broome et al., 1983;Broome, 1990; Broome et al., 1988). Use of slow release fertilizers avoids pulsed nutrient additions, whichmay cause increased insect herbivory and defoliation (Langis et al., 1991). Mag Amp, however, has thedisadvantage of producing low growth early in the season as a result of extremely low solubility and aninappropriate ratio of nitrogen to phosphorus. A possible alternative nitrogen source to slow-releasefertilizers is ammonium sulfate. This is more economical, but is soluble and therefore less persistent. Analternative source of phosphorus to the slow-release fertilizers is concentrated superphosphate (Broomeet al., 1983).
Osmocote or Mag Amp fertilizers should be placed directly in the planting hole beneath the Spartinaalterniflora sprig or plug, about 15-30 grams (0.5-1 oz.) per plant. Conventional, soluble fertilizers mayalso be placed directly in the planting hole when applied at low rates of fertilization (Broome et al., 1983).These should be placed in a separate hole near each plant (~5 cm distant), at a higher rate of fertilizationthan for conventional fertilizers (Broome, 1990; Broome et al., 1988). This avoids direct contact with plantroots and the potential for root burn. Surface fertilization is ineffective for low salt marsh restoration(Broome et al., 1983). Broome (1990, p. 57) provides a table of appropriate quantities for variousfertilization rate formulations, for both slow-release and soluble fertilizers.
Less standard fertilizers composed of kelp meal, seaweed extracts, and fish meal may be appropriate forsalt marsh restoration. Pelletized versions of these products exist and some are designed for long-termnutrient release. However, no research appears to have been conducted on the use of such fertilizers inintertidal environments. Some non-standard fertilizer formulations also contain growth hormones, whichmay not be appropriate for applications in the natural environment. Additional information on non-standardfertilizer formulations is necessary before their use in salt marsh restoration projects could berecommended.

43
6.c.6. Spartina alterniflora—Spacing of Plants
The spacing of plants is important to the success of vegetation re-establishment. Broome et al. (1986)found that plans for marsh plant spacing should be based on the harshness of the restoration environment.Restoration success in the first growing season, in high energy and exposed areas will depend on a higherplanting density. In this type of environment, 45- and 60-cm spacings (~1.5-2.0 feet) resulted in the mostsuccessful aboveground standing crops of Spartina alterniflora populations near the lower elevation limitsof this species. In more favorable environments, 90-cm to 1 m spacing (~3.0 feet) is adequate forestablishment of similar aboveground crops (Broome et al., 1986; Broome, 1990). One foot plant spacingis commonly used in New York for Spartina alterniflora. The advantage of closer spacing towardpopulation establishment is provided by the greater density of plants emerging from rhizomes at thebeginning of the second growing season, and possibly from the stabilizing effect of the more closely-spacedroots and rhizomes during the first winter. In addition to planting success, Broome et al. (1986) found thatin the early post-restoration, belowground biomass is also affected by spacing. Belowground biomass after3 growing seasons was greatest for areas planted at 45-cm intervals, with no significant difference in thisparameter observed between areas planted at 60- and 90-cm spacings. After 4 growing seasons,however, no significant differences were observed in belowground biomass among spacing treatments(Broome et al., 1986).
6.c.7. Other Plant Species
Spartina patens may be planted as described above for S. alterniflora. Direct seeding is not consideredeffective for restoration of S. patens, but seeds may be harvested and propagated for planting as pottedseedlings. In general, however, S. patens seeds are not considered to be very viable (C. Pickerell,personal communication). Slow release fertilization is generally unnecessary in the high marsh, thereforeconventional forms of fertilizer may be used when planting S. patens in these areas. Fertilization shouldideally occur 3-4 weeks after planting to allow the root system to develop. Nitrogen fertilization providesthe most vigorous response (Broome, 1990).
Distichlis spicata is another high marsh plant species. It may be restored by transplant, rhizomes, seeds,or plugs. Distichlis spicata should be transplanted in late winter-early spring (February-March). Seedsmay also be propagated for use as potted seedlings as described above; seeds should be harvested in thefall and must be stored under refrigeration (Broome, 1990).
6.c.8. Estimated Costs for Plants
Planting a one acre restoration site with S. alterniflora peat pots, therefore, could cost between $24,200-$33,000 (assuming one 2" peat pot per square foot). Collection and propagation of native plant seed foruse in the restoration project should be considered to insure use of the most appropriate plant variety atthe site. For example, short form S. alterniflora may not be appropriate for some sites, e.g., where tidalrange is large and tall form S. alterniflora naturally dominates. The converse—tall form S. alterniflora
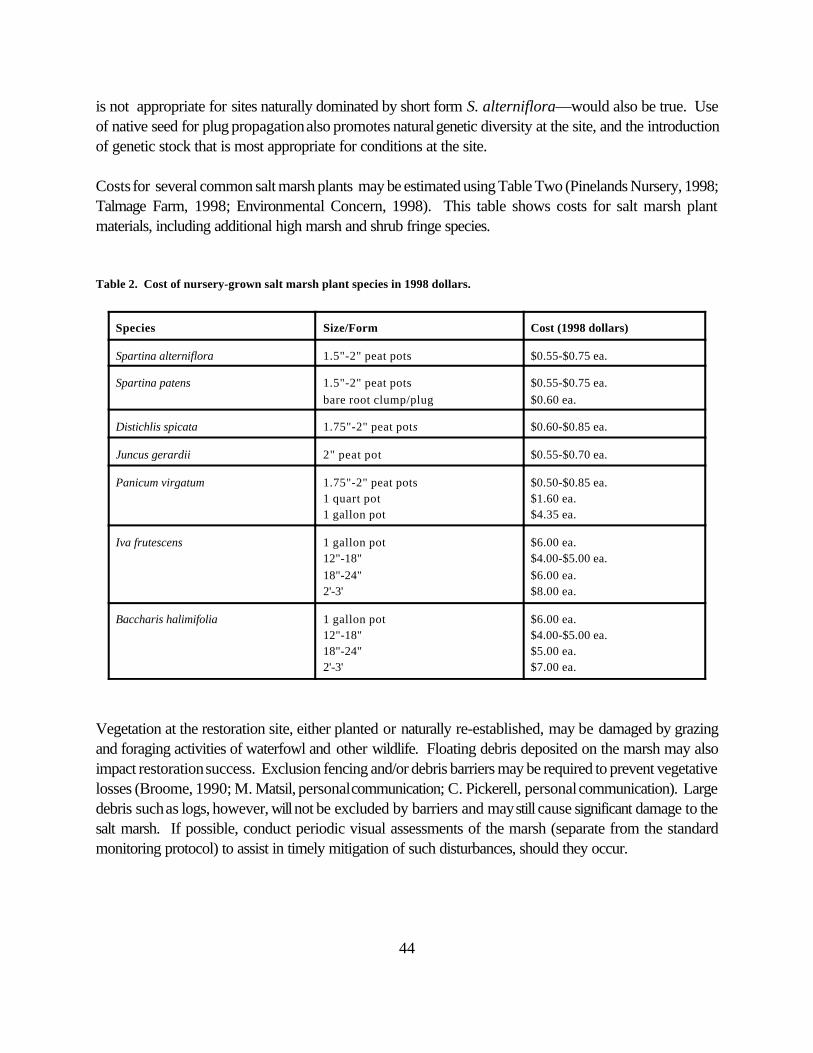
44
is not appropriate for sites naturally dominated by short form S. alterniflora—would also be true. Useof native seed for plug propagation also promotes natural genetic diversity at the site, and the introductionof genetic stock that is most appropriate for conditions at the site.
Costs for several common salt marsh plants may be estimated using Table Two (Pinelands Nursery, 1998;Talmage Farm, 1998; Environmental Concern, 1998). This table shows costs for salt marsh plantmaterials, including additional high marsh and shrub fringe species.
Table 2. Cost of nursery-grown salt marsh plant species in 1998 dollars.
Species Size/Form Cost (1998 dollars)
Spartina alterniflora 1.5"-2" peat pots $0.55-$0.75 ea.
Spartina patens 1.5"-2" peat potsbare root clump/plug
$0.55-$0.75 ea.$0.60 ea.
Distichlis spicata 1.75"-2" peat pots $0.60-$0.85 ea.
Juncus gerardii 2" peat pot $0.55-$0.70 ea.
Panicum virgatum 1.75"-2" peat pots1 quart pot1 gallon pot
$0.50-$0.85 ea.$1.60 ea.$4.35 ea.
Iva frutescens 1 gallon pot12"-18"18"-24"2'-3'
$6.00 ea.$4.00-$5.00 ea.$6.00 ea.$8.00 ea.
Baccharis halimifolia 1 gallon pot12"-18"18"-24"2'-3'
$6.00 ea.$4.00-$5.00 ea.$5.00 ea.$7.00 ea.
Vegetation at the restoration site, either planted or naturally re-established, may be damaged by grazingand foraging activities of waterfowl and other wildlife. Floating debris deposited on the marsh may alsoimpact restoration success. Exclusion fencing and/or debris barriers may be required to prevent vegetativelosses (Broome, 1990; M. Matsil, personal communication; C. Pickerell, personal communication). Largedebris such as logs, however, will not be excluded by barriers and may still cause significant damage to thesalt marsh. If possible, conduct periodic visual assessments of the marsh (separate from the standardmonitoring protocol) to assist in timely mitigation of such disturbances, should they occur.

45
Figure 12. Stand of invasive common reed.
6.d. Invasive Species Control: Common Reed
6.d.1. General Considerations
Salt marsh vegetation may be absent as a result of competitive exclusion by invasive species, oftenPhragmites australis. In many cases, restoration of tidal inundation coupled with an appropriatemorphology will gradually eliminate Phragmites without further intervention. However, in cases wherePhragmites remains or site specifics dictate (the presence of freshwater seepage or springs), removal ofthis species may be more effectively accomplished by mowing or cutting, or by application of glyphosateherbicide, produced commercially by Monsanto under the name Rodeo. A variety of Phragmites removaltechniques are discussed below.
6.d.2. Common Reed Habitat
Common reed is common in brackish environments associated with Spartina, Carex, Typha, and Juncusspecies. Common reed can be found almost anywhere wet but not inundated. Its more frequentoccurrence in brackish areas is not preferential but a result of its competitive edge over freshwater specieswhen waters are slightly saline. Observed maximum salinity tolerances from 10 to 30 parts per thousand(ppt) have been reported, with 10 to 18 ppt a more commonly observed range. Common reed willoutcompete other vegetation in shallow, stagnant waters with poorly aerated sediments.
Reproduction by this species is primarily vegetative, although seed is produced. Phragmites australisflowers and sets seed between July and September, and seeds are dispersed between November andJanuary. Investigations indicate that most seed produced by common reed plants is not viable. Once seedsare set, nutrients are translocated to rhizomes and the aboveground portions of plants die back for thewinter.

46
6.d.3. Disturbances Favoring Common Reed
Anthropogenic disturbance has increased the quantity of favorable common reed habitat in the UnitedStates. Filling and construction activities that alter an area’s hydrology promote the growth of Phragmitesaustralis where elevations are increased or inundation is decreased. Common reed is adept at invadingbare, sandy patches caused by excessive sedimentation. The proliferation of paved surfaces alsocontributes to the creation of bare areas because it promotes flashy passage of water through theenvironment, destabilizing substrates. Runoff containing deicing salts increases soil salinity, favoringcommon reed. High concentrations of nutrients, especially nitrates, also appear to favor this species,although European declines of Phragmites australis have been partially blamed on eutrophication.
6.d.4. Natural History of Common Reed
Common reed is an indigenous species of the northeastern United States. Evidence of its presence has beenfound in cores 3000 years old (Niering and Warren, 1977). In the twentieth century many populations ofcommon reed exhibited extremely aggressive growth, forming vast monocultures and replacing indigenous,often rare plant communities. Currently, there remains some uncertainty regarding the natural history of thisspecies and the cause of its sudden expansion. Similarly, there remains high uncertainty regarding when andhow to manage common reed in coastal environments.
The aggressive form of Phragmites australis is believed to be a genetically different stock native to Europetransported to North America in ship ballast (Besitka, 1996; Casagrande, 1997; R. Rozsa, personalcommunication). Recent research indicates that the invasive, European form is phenotypically distinct fromthe native version (Besitka, 1996); current studies are underway at Yale University (Principal InvestigatorProfessor K. Vogt/Research Assistant K. Sullivan) to establish genotypic differences between live, invasiveexamples of Phragmites and historical examples of native Phragmites (C. Rilling, personalcommunication).
6.d.5. Impacts caused by Common Reed
Common reed shades other indigenous vegetation, and hinders germination and growth by other speciesthrough shading and dense accumulation of litter. Phragmites monocultures alter detrital cycling patternsbecause Phragmites’ woody stalks exhibit a slower rate of decomposition. Phragmites monoculturesare also more susceptible to wildfires when the dead, woody litter from stalks accumulates (Niering &Warren, 1980). Slow degradation of Phragmites litter raises the elevation of an invaded marsh,decreasing tidal flooding and further enhancing habitat suitability for this species (T. Diers, personalcommunication).
Mammalian and avian diversity are low in Phragmites stands. This is partly caused because this speciesprovides inferior nesting habitat for many marsh birds (Howe et al., 1978), including seaside sparrow,sharp-tailed sparrow, and willet. These birds are marsh specialists adapted to nesting in short grasses likeSpartina patens and Distichlis spicata (Benoit, 1997; Benoit, 1999).

47
Phragmites australis monocultures can produce large broods of mosquitos. Common mosquito controltechniques are ineffective in Phragmites-dominated marshes because dense stands of this species preventaccess to mosquito breeding areas.
Phragmites may also detract from an area’s scenic quality. This species can reach 14 feet in height (Tiner,1987; Eastman, 1995), shielding panoramas from view. Common reed invasion has caused this type ofproblem in Boston’s Back Bay Fens, designed by Frederick Law Olmstead.
6.d.6. Ecological Value of Common Reed
In some cases, Phragmites control is not necessary. Since this species is indigenous to marsh habitats,eradication is not warranted. Stable stands, i.e., those that are not increasing in size and invading adjacenthabitat, should be considered a natural and appropriate part of the plant community.
A variety of recent research on the effects of Phragmites australis on habitat value indicate that thisspecies may provide more beneficial functions than previously thought. Phragmites has a high capacityfor nutrient assimilation. Rates of denitrification and concentrations of ammonium in porewaters are lowerin areas where Phragmites is the dominant species, than in areas dominated by other indigenous marshvegetation.
While some declining bird species are negatively affected by Phragmites invasion, stands of this speciesare not entirely devoid of habitat value. For example, marsh wren and swamp sparrow are marshspecialists that prefer tall, reedy vegetation. For certain bird species the presence of Phragmites has beenobserved to make little difference in use of an area.
Invertebrate populations also appear not to differ in their use of Phragmites stands and Phragmites-freeareas. Studies using the common estuarine species marsh fiddler crab, grass shrimp (Palaemonetespugio), and larval mummichog found no preference by these species for Phragmites or Spartina stems,preference given only to stems over bare substrates.
6.d.7. Determining the Need for Control
Stands of common reed should be assessed for stability before control methods are planned andimplemented. If available, historical aerial photography may be used to determine trends in Phragmitescoverage at a given location. To assess stability, the following parameters should be monitored overseveral growing seasons: percent aerial cover by Phragmites; stem density; culm height, especially atperiphery of stand; and trends in species diversity among other plants in the community. In a single growingseason, stability may be roughly assessed by monitoring growth beyond a set of markers delineating thefront edge of a stand at the beginning of the season. A disputed indicator of expanding stands is thepresence of long rhizomes spreading over new areas of the marsh surface; further information on thisindicator is needed.

48
Clear goals and specific management objectives must be developed for Phragmites australis standswarranting control. Articulating these goals and objectives will assist in the selection of the mostappropriate control method. The degree of control desired, time frame for results, species targeted forrevegetation or for use of the restored salt marsh, and other factors should be determined for each controlproject. Each project can then be tailored to fit its particular goals and limitations.
6.d.8. Control Methods for Common Reed
Regardless of technique used, effective control of Phragmites australis requires knowledge of the plant’slife cycle and its local growing season in order to most appropriately select and schedule control treatments(Cross & Fleming, 1989). Also, the likelihood for return of Phragmites after control strategies have beenimplemented, due to site characteristics or ongoing disturbances, should be carefully considered during theplanning phase. Disturbances contributing to the presence of common reed should be identified andminimized prior to the implementation of any control strategy in order to maximize the likelihood forsuccess.
Considerable care should be exercised in selecting a control method for Phragmites australis populations.Unfortunately, it is not appropriate to advocate a single method for all cases. Site specifics and projectgoals must be examined to determine which method or methods will be most effective and least disruptive.For example, the time windows for sensitive species in the area and control method implementation shouldnot coincide. Adjacent land uses at a site may preclude certain control strategies, like prescribed burningor flooding. Also, the size of the Phragmites australis stand may also influence selection of controlmethods, e.g., cutting or mowing may not be feasible for extremely large sites. These and other factorsmust be carefully examined prior to project planning once it has been determined that a Phragmites standwarrants control. Details and planning considerations associated with common Phragmites australiscontrol methods are presented in the following sections.
6.d.9. Tidal Inundation
Where control is warranted, the most basic method involves reintroducing regular tidal flooding of the site(Rozsa, 1995). Phragmites seeds cannot sprout in salinities >10 parts per thousand (ppt) and mostPhragmites plants cannot tolerate salinities >18 ppt. It is important to take flood considerations intoaccount when planning for removal of tidal restrictions; self-regulating tide gates and other technologies,often expensive, may be required to balance ecosystem restoration with adjacent land use. Other methodsfor increasing tidal flow to a formerly flooded area involve simple measures such as removing blockagesin culverts. After tidal inundation has been reintroduced, it may take many years to completely eliminatePhragmites, but stand height can be reduced by one to three feet per year during this period. Salt marshvegetation often will naturally recolonize the site.
At some sites, such as areas near freshwater seeps, removal of tidal restrictions alone will not be effective.In these situations, an effective common reed control technique involves creation of 24" wide by 36" deep

49
perimeter ditches dug at the upland edge of unrestricted tidal marshes. These perimeter ditches are thenconnected to grid ditches subject to tidal flooding. This drains fresh water and increases salt water flowinto the back marsh, raising soil salinity (T. Diers, personal communication). In brackish marshes wheresaving specialized indigenous vegetation is a priority other control techniques are required.
6.d.10. Cutting and Mowing
Cutting and mowing are techniques frequently employed to control common reed. Conflicting reports aregiven for the best season to conduct mowing and cutting. Some researchers report that mowing may beconducted in either the winter or spring. Winter mowing has produced stunted growth in the following year,possibly as a result of interference with oxygen uptake mechanisms. Spring mowing immediately followingthe first appearance of shoots (around April) has resulted in stunted and low density of new shoots (OLISP,1998). However, some reports cite increased growth of Phragmites australis following winter and springmowing. Summer mowing or cutting may be the most consistently effective strategy. Cutting Phragmitesplants after tasseling, i.e., late July, may produce the most stress. This method should be conducted forseveral consecutive years for maximum effect.
All cut materials must be removed from the restoration site to prevent establishment of new Phragmitesplants from cut pieces of rhizome. Cuttings may, however, be mulched or disked on site, although thisgenerally increases the expense of the project. Mulching or disking still may not prevent the problem ofplant reappearance from rhizome fragments. Low ground pressure equipment should be used when manualcutting or mowing is not feasible.
6.d.11. Cutting and Mowing Combined with Other Techniques
Research from Connecticut College has shown that mowing used in combination with herbicide applicationor flow restoration may elicit better results (C. Rilling, personal communication). Mowing or cutting andremoval of litter subsequent to herbicide application removes combustible plant debris, minimizing a firehazard and allowing reestablishment of other vegetation. Mowed or cut stands of Phragmites may beflooded for a prolonged period (~ 4 months), generally during the growing season. This latter strategyrequires spring mowing, and such prolonged flooding may not be feasible in many areas. Mowing or cuttingmay also be followed by the use of a temporary clear or black plastic cover (Marks, Lapin & Randall,1993; Tiner, 1998). It is thought that high temperatures under the plastic are the primary cause ofPhragmites mortality resulting from this strategy. More information on long-term effectiveness of plasticcovers used on mowed or cut Phragmites is needed.
6.d.12. Controlled Burning
Controlled burning may be employed in cases where a supply of dry, combustible litter is accumulated(OLISP, 1998). This strategy, therefore, may only be employed periodically (in alternate years at its mostfrequent). Controlled burning in Phragmites stands can be dangerous because there is a potential forremote spot burns to break out in the area.

50
Conflicting reports are also given regarding the optimal season to conduct controlled burns. The Office ofLong Island Sound Programs (1998) recommends burning simultaneous with new shoot emergence in thespring (around April). Research from Europe supports this recommendation. However, others havereported enhanced Phragmites growth from spring and winter burns. It is hypothesized that enhancedgrowth after burns during these seasons is caused by elimination of shade, exposure of burned soil, nutrientenhancement from ash deposits, and generation of viable plant fragments (Weinstein, 1996). Mid to late-summer burning may be the most consistently effective alternative. For burning to be effective in reducingcommon reed growth, root burn must occur; burns penetrate the roots most easily during this period.Phragmites may also be vulnerable to late summer (July/August) burns because translocation of nutrientsto roots may have begun. Burn timing must be planned with potential effects on wildlife, e.g., nesting birds,in mind.
It should be noted that controlled burning is a regulated activity in the State of New York requiring a varietyof approvals and permits. It is necessary to contact Department of Environmental Conservation permitstaff, the local fire department and fire marshall, and the State Emergency Management Office prior toplanning and undertaking a controlled burn for Phragmites australis control.
6.d.13. Controlled Burning Combined with Other Techniques
Controlled burning may be used most effectively in combination with other control strategies. Burningsubsequent to herbicide application removes dead stems and litter, assisting revegetation by other plantspecies (Marks, Lapin & Randall, 1993). Burns may also be followed by prolonged manual flooding ofthe area (~ 4 months), generally during the growing season. Prolonged flooding of this nature would followemergence (spring) burns, and may not be feasible in many areas.
6.d.14. Chemical Control
Chemical control of Phragmites is possible. It is important to note that chemical control should becarefully considered before implementation; particular attention should be paid to the likelihood of a returnof the Phragmites after the control project is terminated, e.g., in freshwater or brackish systems and indisturbed areas without mitigation.
Herbicides that have been used to control common reed include amitrole, dalapon, and glyphosate (Cross& Fleming, 1989). All three of these chemicals listed above are absorbed through plant leaves and aretranslocated to rhizomes (CCE, 1998a,b,c). Amitrole (Rhone Poulenc Agricultural Company, ResearchTriangle Park, NC; CCE, 1998b) is effective on both flooded or dry sites; Amitrole is, however, aRestricted Use Pesticide (RUP), and may be purchased and used only be certified applicators. Amitroleis considered a probable human carcinogen (CCE, 1998b). Dalapon (BASF Corporation, AgriculturalProduct Group, Research Triangle Park, NC; CCE, 1998c) and glyphosate, both general use pesticides,are not as effective on flooded sites but do work on moist or dry sites. Rates of application for Amitrolerange from 2-12 lb. per acre, generally occurring during the summer. Dalapon has been used at rates

51
ranging from 15-30 lb. per acre, applied throughout the growing season (Cross & Fleming, 1989). Thethird herbicide, glyphosate, will be further discussed below under one of its trade names, Rodeo (MonsantoAgricultural Company, St. Louis, MO; CCE, 1998a).
The herbicide Rodeo is the most common herbicide employed for Phragmites control, and can be effectivein controlling monocultures of this plant. Rodeo is a moderately toxic herbicide containing glyphosate, thesame active ingredient as Roundup, the common lawn and garden herbicide. The glyphosate in Rodeo isnot, however, pre-mixed with a surfactant. As described above, this nonselective herbicide is absorbedthrough plant leaves and translocated to plant roots, where it disrupts an enzyme essential to proteinproduction. Cell disruption, decreased growth, and death of the plant root and rhizome eventually follow(Rilling, 1998a).
Rodeo should be applied to actively growing plants following pollination and tasseling (between July andSeptember; Magee, 1981; Marks, Lapin & Randall, 1993). All plants do not tassel simultaneously, andseveral treatments during the flowering period may be necessary (OLISP, 1998; Rilling, 1998a). Rodeois generally applied at a rate of 4-6 pints per acre (Cross & Fleming, 1989; Rilling, 1998a). Cross &Fleming (1989) report that some researchers found an increased effectiveness when Rodeo applicationswere split, i.e., administering two doses at ½ the dosage rather than a single full dosage. The secondapplication should occur 15-30 days after the first (Cross & Fleming, 1989).
Rodeo should be applied during warm, sunny weather with no rain forecast for a minimum of 12 hours.Low wind conditions are also necessary to prevent spray drift onto non-target vegetation (OLISP, 1998;Rilling, 1998a). Late summer (around August) is a good target period for satisfying many of the aboveconditions. Rodeo has been applied using techniques ranging from manual spray equipment transportedby backpack, to aerial application from a helicopter. Size of stand, accessibility, and proximity to rare plantspecies or other priority vegetation must be considered when planning herbicide application (Cross &Fleming, 1989). Wilting and yellowing generally begins within a week following application, and browningand deterioration of roots should be complete within 6-8 weeks (Rilling, 1998a). Removal of plants aftershoots turn brown will assist recolonization by other plant species.
Rodeo is highly adsorbent on substrates with high organic content, where it becomes inert, and non-volatile.Rodeo is degraded into natural products, e.g., carbon dioxide, nitrogen gas, phosphate, and water, by soilmicroorganisms between 1 and 174 days (CCE, 1998a; Weinstein, 1996; Rilling, 1998a). Becauseglyphosate is strongly adsorbed to suspended organic materials, it has half life of 12 days to 10 weeks innatural waters (CCE, 1998a; Rilling, 1998a). For this reason it is recommended that Rodeo be mixed withdistilled water prior to application to minimize adsorbance onto particulate organic materials in tap or otherwater, decreasing the effectiveness of application.
Rodeo has been approved by the U.S. EPA for use in aquatic systems (Cross & Fleming, 1989). Theprotein production enzyme disrupted by glyphosate is found only in plants (Rilling, 1998a). Rodeo istherefore considered of low toxicity for humans, birds, mammals, fishes, and aquatic invertebrates (Rilling,

52
1998a; CCE, 1998a). There is low potential for accumulation of glyphosate in the environment or in animaltissues. No reproductive, teratogenic, mutagenic, carcinogenic, or organ toxicity effects have been foundin field and laboratory evidence. Acute toxic effects are limited to eye irritation. Oral LD50 values forglyphosate range from 1,500 mg/kg to over 10,000 mg/kg for mice, rabbits and goats (CCE, 1998a).
Rodeo must be mixed with a surfactant prior to application. The surfactant acts as a wetting agent,softening the waxy layer on plant surfaces and allowing glyphosate to be absorbed. Without a surfactant,the herbicide “balls up” on the leaf surface (CCE, 1998a; C. Rilling, personal communication). Somesurfactants used with glyphosate (e.g., Induce or Chemsurf 90) may have toxic effects for humans and theenvironment. For example, the surfactant additive found in Roundup is a modified tallow amine toxic tofish (CCE, 1998a). Roundup should therefore not be used for the control of Phragmites australis inaquatic environments. Limited test data appears to indicate that other surfactants are relatively non-toxic,e.g., X-77, LI-700, and Kinetic (Weinstein, 1996). Selection of an appropriate surfactant for Rodeoshould be carefully researched; see Weinstein (1996) for additional information on surfactants.
It should be noted that pesticide application is a regulated activity in the State of New York. Departmentof Environmental Conservation permit staff must be consulted prior to planning and undertaking anypesticide applications for Phragmites australis control.

53
7. SALT MARSH RESTORATION—RECOMMENDED MONITORING PROTOCOL
Monitoring is a critical element of adaptive management, an interactive process that regularly reexaminesprior choices in the light of current outcomes (Wilber & Titre, 1996). This incremental managementprocess employs a flexible design, where management actions may continually change to respond to newinformation on progress generated by monitoring. This type of structure maximizes the success ofmanagement activities. Additional information on adaptive management may be obtained from Yozzo, Titre& Sexton (1996) and Thom & Wellman (1996).
This section includes the recommended components of a monitoring program for salt marsh restorationprojects conducted in the estuarine waters of New York State. These components are not presented ina “discussion” format; several fine discussions of restoration monitoring are available elsewhere and arerecommended as background (see Thom and Wellman, 1996; PERL, 1990; Kentula et al., 1993, pp. 43-72; Erwin, 1990, pp. 429-458; Broome, 1990, pp. 60-61). They are presented as a protocol and incontract work plan format to assist municipalities and other entities with the incorporation of a monitoringprogram into the restoration project planning process. The New York City Parks Department NaturalResources Group is the first to participate in a pilot initiative using this monitoring protocol for their state-funded habitat restoration projects.
The monitoring protocols which follow can and should be tailored for individual projects. The parametersand methods suggested represent the baseline information generally required to adequately monitor thegeneric salt marsh restoration project. However, depending on restoration goals and the details of theproject, a modification of the suggested protocol may be warranted. For example, the numbers andplacement of transects and quadrats may be altered, different biotic elements may be tracked, or additionalchemical parameters may be included. Also, although these elements are not included in the protocolswhich follow, pre-project monitoring must include site assessment of important characteristics (hydrologicalproperties, elevations, tidal regime) needed to develop a feasible restoration project. In general, planningof the monitoring program should occur during the general project planning process. Alterations to thesuggested protocol should be reviewed with the regulators in charge, the appropriate natural resourcesmanagers, and qualified ecologists.
A sample timeline for monitoring salt marsh restoration projects is included in Appendix C.


55
SALT MARSH RESTORATION MONITORING WORK PLAN
Modifications to the monitoring guidelines described below must be discussed with and approved by theRegulator(s) and representatives of the funding entity prior to all restoration activities. All approvedmodifications need to be clearly articulated in the work plan in a manner similar to that below.
1) Principle parties:
The party responsible for carrying out all restoration requirements will be referred to as the ResponsibleParty (RP). These restoration activities include the development and implementation of a monitoringprotocol to assess the progress of the restoration during, and to evaluate the success or failure of therestoration at the conclusion of, the monitoring period (a period > 5 years is recommended).
The RP for the (project name) is (agency/name) .
Other parties that may be involved in restoration and restoration monitoring activities are:
CThe Designer of the restoration, who is responsible for including monitoring specifications in the design andsite plan, including specific locations of transects, quadrats, permanent fixed-point photo stations, and otherfeatures.
The designer for this project is (agency/name) .
CAn Ecologist to assist in planning and implementing a site-specific monitoring protocol.
The ecologist for this project is (agency/name) .
CThe Contractor(s) is(are) in charge of construction and of maintenance of the site and its features, includingall transects, quadrats, and fixed-point photo stations. When a contractor is not required , all sitemanipulation and maintenance activities are generally the responsibility of the RP.
The contractor(s) for this project is/are (name/names) .
CThe Regulator(s) is(are) responsible for approving the restoration designs and monitoring protocols, andfor any required permitting for restoration activities.
The Regulator(s) for this project is/are (NYS DEC, NYS DOS, ACOE, other) .
CVolunteers may be involved in conducting monitoring activities. They may require training, and usually willbe supervised by and/or report to the RP.

56
Note: The RP will be responsible for ensuring fulfillment of all monitoring requirements, including those ofthe Designer, Ecologist, Contractor(s), and Volunteers as specified in the work plan, and is responsible forreporting as specified to the Regulator(s), when applicable. The Designer and the Ecologist may be thesame person or from the same agency, and this person/agency may also be the RP.
2) Purpose:
This monitoring protocol is designed to assess the progress towards, and the success or failure of, arestoration of salt marsh habitat and the achievement of acceptable standards of salt marsh character andfunction. At a minimum, this should include regular assessment, for a period > 5 years, of vegetationdevelopment, soil properties, colonization by benthic invertebrates, and habitat usage by macrofauna, asdescribed below.
3) Monitoring Protocol Design:
Plan and locate all salt marsh restoration project transects, 1.0 m2 quadrats, and fixed-point photo stationsaccording to the guidelines described below. Any modifications to these guidelines shall be discussed withthe Regulator(s) prior to conducting any restoration activities, and, if approved, the modified monitoringprotocol shall be clearly articulated prior to all restoration activities in a work plan.
A work plan should always be written by the responsible party for any restoration project undertaken,including any site-specific modifications to the recommended monitoring protocol, where necessary andappropriate. Monitoring parameters and activities, whether the recommended protocol below or someother approved protocol, should be clearly articulated and documented in the work plan in a manner anda level of detail similar to the guidelines below. All transects, 1.0 m2 quadrats, and fixed-point photostations should be assigned location codes, and this information should be documented on an official sitemap and in the project work plan.
Monitoring, except where noted below, shall be conducted at the restoration project site and at anappropriate reference site. This reference site will consist of, at a minimum, three control transects(including 3 quadrats each), and must be located contiguous with or nearby the restoration project site, andbe similar in morphology and vegetation zonation (i.e., compare restored high marsh with nearbyunrestored, “natural” high marsh; restored low marsh creek bank with nearby unrestored, “natural” lowmarsh creek bank). An additional requirement of the reference site is that all major vegetation zones of therestoration site must be matched at the reference site; therefore, additional transects at the reference sitemay be needed to provide control data for all applicable vegetation zones or morphological features.
The purpose of the reference site is to help discern background environmental effects from the effectsattributable to the restoration project. For example, vegetation parameters at a restoration site must be

57
compared with the same parameters at a nearby reference site to determine whether an observed loss ofvegetation is a restoration failure, or is caused by a natural event, such as a hurricane or winter storm, thathas similarly affected all the marshes in the area.
C Transects: Place a minimum of 3 transects evenly spaced across the site. For large sites, transectsshould be evenly spaced, and although an absolute minimum of 3 transects is required, a larger number oftransects is recommended based on the acreage to be covered and the number and type of vegetationzones present. Transects should run perpendicular to the main channel and/or parallel with the elevationgradient, across the restoration site approximately from the seaward edge of the Spartina alterniflora zone(i.e., encompassing traditional areas of occurrence for Geukensia demissa and/or Fucus spp.) to at leastthe landward extent of the project. Transect locations should be permanently marked at the landward andseaward ends using two stakes that are sturdy and will be easily located.
During monitoring visits, a tape measure should be used to mark the transect line, starting at the upland end.Hook the tape measure onto the permanent landward stake and walk toward the seaward transect end,also marked by a permanent stake. To minimize trampling of the site, do not walk directly to the seawardtransect end but walk diagonally from the upland marker toward some point a short distance away fromthe actual seaward marker, but in line with the marker to either the right or left. When you are in line withthe seaward marker, walk to the seaward marker and wrap the measuring tape around the stake, makingsure it is taut. This forms a transect line between the landward and seaward stakes. This procedure shouldbe repeated for all pairs of upland/seaward transect ends at the restoration site.
Noteworthy features occurring along each transect should be recorded relative to the distance marked onthe tape measure at the point of occurrence. It is imperative that a notation is made regarding whichtransect end is being used as zero distance (using the placement method above it should be the landwardmarker), and that the same transect end (the landward marker) be consistently used as zero distance forall transect monitoring at the restoration site.
C Quadrats: Place quadrats (1.0 m2) along the transects at a minimum of three different elevations (i.e.,a minimum of three quadrats per transect) between the seaward edge of the Spartina alterniflora zoneand the landward extent of the project, including, as applicable, all vegetation zones present. Within asingle vegetation zone (e.g., low marsh Spartina alterniflora zone), quadrats must be located at least 3.0m apart along the length of the transect. Quadrats will be placed semi-randomly within an area 2.0 metersto either side of the measuring tape transect line. A stake, bar, length of PVC pipe, or other item 4.0meters in length, carried or placed on the ground with 2.0 meters length extending on either side of thecenterline, can be used to demarcate this area during monitoring visits. Placement of quadrats can beaccomplished, e.g., by walking in a zig-zag pattern back and forth across the demarcated area along theentire length of the transect line, dropping quadrats at random (with the exception of deliberate inclusionof all vegetation zones present and/or deliberate placement of quadrats > 3.0 meters apart within a singlevegetation zone). After placement, orient the quadrats so one side is parallel to the transect line and record

58
the location of upper and lower quadrat boundaries with respect to the tape measure , e.g., upperboundary at 3 meters, lower boundary at 4 meters. This should be done for all quadrats along all transectsat the restoration site.
C Permanent fixed-point photo stations: The transect marker stakes (seaward end and landward end)should be used as permanent photo stations for photographic monitoring. Photographs each transectshould be taken facing the seaward transect marker from the landward transect marker, and facing thelandward transect marker from the seaward transect marker. This should be done for all pairs of transectends at the restoration site.
Provide an overview photograph or photographs of the entire restoration site and consistently use thislocation for the duration of photomonitoring. Photographs should be taken at low tide (avoiding spring tideand full moon periods) and should be labeled with the location code, the direction of view, the date, thetime, and the tide. Photographs must be in the form of prints no smaller than 4" x 6", and must be in color.
C Video monitoring (optional): Video monitoring is encouraged to supplement photomonitoring andprovide additional qualitative information that cannot be provided by standard photographs. This includesclose-up images of vegetation, benthic epifauna, and substrates; a panorama of the site is also easily filmed.The restoration site should be walked by the video monitor, using the transect lines as guides. Cards maybe filmed, or voice may be used, to give the required information, such as location code, date, time of day,direction of view, and tide. At each transect end the location code and direction of view should beidentified. Close up views should be filmed of all vegetation zones occurring along the transects.
CAerial infrared photography (optional): Aerial IR photography, if available, is useful for assessingvegetation, both pre- and post-project, for large project areas.
4) Pre-Restoration Monitoring Activities:
On sites where planting is planned, take a complete set of color photographs including all permanent, fixed-point stations (transect ends and elevated overview) upon completion of the design phase and prior to anyconstruction activities. Photographs should also be taken at the reference site.
On sites where some marsh habitat already exists (e.g., formerly connected marshes, grid ditched marshes)and no planting is planned, all parameters described below under “Post-Construction Monitoring (Annualfor 5 Years)” should be monitored at least once prior to the restoration at both the restoration site and thereference site. At a minimum, all parameters should be monitored once during the last August prior to therestoration. May, August and/or December parameters specified below can be included in pre-restorationmonitoring during the year prior to the restoration, at the discretion of the RP or other overseeing entity.

59
5) Post-Construction Monitoring (Four-Five Weeks Post-Construction):
C The restoration site should be walked by the RP, the Ecologist, and/or the Regulator(s) 4-5 weeks post-construction to assess compliance with submitted work plans. Elevations should be double-checked priorto planting.
C Permanent fixed-point photo stations: Take color photographs at permanent, fixed-point photo stationsarticulated above, for the restoration site and the reference site. Photographs should be taken at low tide(avoiding spring tide and full moon periods) in the manner articulated above. Label photographs with thelocation code, direction of view, date, time, and the tide. Photographs must be in the form of prints nosmaller than 4" x 6", and must be in color.
C The RP will determine, based on the 4-5 week post-construction assessment, whether any additionalwork is required to achieve work plan compliance, and above and beyond any standard regulatory reviewassociated with the project.
6) Post-Construction Monitoring (Annual for 5 Years):
a) Vegetation
The following parameters should be monitored once annually for 5 years, during the last week in Augustor the first three weeks in September, at the restoration site and the reference site.
< Plant species occurring: All plant species occurring in each quadrat along the transect shouldbe recorded.
< Stem Density: All live stems of any plant species found within a 0.25 m2 section of the quadratare counted. Divide each 1.0 m2 quadrat into four 0.25 m2 sections and randomly select one 0.25m2 section for the stem density count. Use the same 0.25 m2 section for plant heightmeasurements; see below.
< Plant Height: All live stems of any plant species within a 0.25 m2 section of the quadrat aremeasured from the base of the plant to the top of the stem in meters. Use the same 0.25 m2 sectionof the quadrat for height measurements as was used for stem density count; see above.
< Signs of disease, predation, or other disturbance should be monitored in each quadrat andalong the length of the transect, recording observations as necessary.
< Vegetation Zones: Walk along the measuring tape that demarcates the transect line starting atthe seaward transect end. Note the distance marked on tape measure at the transition betweendifferent vegetation zones, and the dominant species composition of these zones.

60
b) Fixed-point photo stations
Take color photographs from all designated locations once annually for 5 years at the time of vegetationmonitoring (during the last week in August or first three weeks in September), for the restoration site andthe reference site. The permanent transect marker stakes (seaward end and landward end) should be usedas photo stations for the photographic monitoring. An overview photograph or photographs of the entirerestoration site should be consistently used in all photomonitoring. Take photographs at low tide (avoidingspring tide and full moon periods) in the manner articulated above. Label with the location code, directionof view, date, time, and tide. Photographs should be in the form of prints no smaller than 4" x 6", and mustbe in color.
Video monitoring, if used, should also occur at the time of vegetation monitoring, annually for 5 years.
c) Soil Properties
The following parameters should be monitored once annually for 5 years, at the time of vegetationmonitoring (during the last week in August or the first three weeks in September, at low tide avoiding springtide and full moon periods). Measure each soil property parameter at least twice in each quadrat placedalong the transect line.
< Soil organic matter: Sediment cores (2 cores per quadrat) should be sampled to 10 cm depthusing, e.g., a cylindrical push corer ~5 cm in diameter. Soil organic matter (includes organic carbonand other organic compounds) from marsh substrates may be measured by loss on combustion.Samples for this procedure are dried, weighed, combusted at 500 degrees Celsius for ~8 hours,and weighed again. During the 8-hour combustion period, organic material burns and is lost fromthe sample as a result of the high temperature. Inorganic and refractory materials, which have evenhigher temperatures of combustion, remain in the sample after this period. Therefore, the differencein weight between the dried and combusted samples, which may be expressed as a percentage ofthe dried weight, represents the organic matter content of the marsh soil sample.
< Soil salinity: The salinity of the soil may be determined in the field using a refractometer orconductivity meter. With a refractometer, pore water from a small soil sample is squeezed ontothe lens and the resulting salinity reading is recorded as soil salinity. Pore waters with highconcentrations of suspended solids may require rudimentary filtration in the field. In these cases,squeeze pore water through filter paper onto the lens of the refractometer.
d) Benthic Invertebrates in m2 quadrats
The following parameters should be monitored annually for 5 years at the time of vegetation monitoring,during the last week in August or the first three weeks in September. Monitoring should be conducted atthe restoration site and the reference site.

61
< Ribbed mussels: Ribbed mussels in each quadrat should be counted and recorded. Two to sixmussels per quadrat, as appropriate, should be measured lengthwise.
< Fiddler crab burrows: Fiddler crab burrows in each quadrat should be counted and recorded.The presence of live fiddler crabs should also be recorded, where applicable.
< Other benthic invertebrates: The presence of any additional species observed (e.g., Melampusbidentata), and the number of individuals (when practical), should be recorded both withinquadrats and along the length of the transect line, as applicable.
e) Macrofauna
The following parameters (except “Other macrofauna”, see below) should be monitored at the restorationsite once monthly in June and August for 5 years. Observe birds from an obscured location on thelandward side of the restoration site, unless site-specific characteristics require otherwise. In this case,identify a location will minimize disturbance to bird species at the site when the monitor approaches.Document the location and assign a location code. The location should be easily locatable by monitors insubsequent years. The monitor should record observations as described below for a 3 to 4 hour periodsurrounding mid-tide (1.5 to 2 hours before and 1.5 to 2 hours after mid-tide). Record time of day, tide,weather conditions (temperature, wind strength, precipitation), location code, direction of view from thechosen viewing station on all observation sheets. Bird monitoring should not be conducted on days whenthere is high wind, rain, or low barometric pressure.
< Saltwater-fish-feeding birds: Record presence, duration of stay, general location, and activityfor wading birds, e.g., great egret, snowy egret, tricolor heron, black-crowned night heron, andother species, if observed.
< Benthic-invertebrate-feeding birds: Record presence, general location, duration of stay, andactivity for wading birds, e.g., little blue heron, yellow-crowned night heron (Nyctanassaviolacea), and other species, if observed.
< Other salt marsh associated bird species: Record numbers of species and individuals, generallocation, activities, and duration of stay.
< Other macrofauna: Record presence, or reasonable evidence of presence, for any othermacrofauna (small mammals, horseshoe crabs, terrapin) at the site, observed during any site visit.
< Wintering waterfowl: If resources are available and the goals of the restoration are compatible,waterfowl species can be monitored once annually in December. Record species, abundance,general location, activities, and duration of stay.

62
f) Contingency Inspections
The restoration site (and its reference site) should be inspected for damage in the event of winter stormsor other destructive events. These visits should be conducted subsequent to such events, and at a minimumonce annually in late March/early April to ensure that damage is documented and plans for repair anddebris removal are made at the earliest possible opportunity. If repair, debris removal, or other action isindicated, photomonitoring as described previously should be conducted during the contingency inspection.
7) Monitoring Reporting Requirements:
Annual monitoring reports should be written and submitted (by a mutually agreed upon date) to theapplicable Regulator(s) and/or some other pre-designated, central repository. Reporting will begin afterthe first post-construction growing season. Include data and photographs, labeled as described above, aswell as a brief summary of the collected data. Length measurements should be reported using the metricsystem.
The monitoring reporting deadline for this project is
8) Recommended Monitoring after 5 Years (optional):
It is recommended that photomonitoring for all restoration sites continue for an additional 3-5 yearsfollowing the conclusion of the initial 5-year monitoring period. Photomonitoring during years 5-10 shouldoccur at a minimum once annually during the last week of August or first three weeks of September, andconsist of the same site overview and photographs as described above at all of the same permanent transectphotostations used during the initial monitoring period. The additional 3-5 years of photomonitoring recordsshould also be labeled, stored, and distributed in the same manner as occurred during the initial 5-yearmonitoring period.

Figure 13. Diagram of hypothetical placement of transects and quadrats for monitoring a salt marsh restoration.


Figure 14. Hypothetical selection of an appropriate reference site for monitoring a restoration project.
Figure 15. Diagram of the recommended quadrat and associated monitoring variables for a saltmarsh restoration.


67
8. COMMON REED CONTROL—RECOMMENDED MONITORING PROTOCOL
Below is an outline of the recommended components of a monitoring program for common reed controlprojects, frequently associated with salt marsh restorations, in brackish and estuarine waters of New YorkState.
1) Principle parties:
The party responsible for carrying out all restoration requirements will be referred to as the ResponsibleParty (RP). These restoration activities include the development and implementation of a monitoringprotocol to assess the progress of the restoration during, and to evaluate the success or failure of therestoration at the conclusion of, the monitoring period (a period > 5 years is recommended).
The RP for the (project name) is (agency/name) .
Other parties that may be involved in restoration and restoration monitoring activities are:
CThe Designer of the restoration, who is responsible for including monitoring specifications in the design andsite plan, including specific locations of transects, quadrats, permanent fixed-point photo stations, and otherfeatures.
The designer for this project is (agency/name) .
CAn Ecologist to assist in planning and implementing a site-specific monitoring protocol.
The ecologist for this project is (agency/name) .
CThe Contractor(s) is(are) in charge of construction and of maintenance of the site and its features, includingall transects, quadrats, and fixed-point photo stations. When a contractor is not required, all sitemanipulation and maintenance activities are generally the responsibility of the RP.
The contractor(s) for this project is/are (name/names) .
CThe Regulator(s) is(are) responsible for approving the restoration designs and monitoring protocols, andfor any required permitting for restoration activities.
The Regulator(s) for this project is/are (NYS DEC, NYS DOS, ACOE, others) .
CVolunteers may be involved in conducting monitoring activities. They may require training, and usually willbe supervised by and/or report to the RP.

68
Note: The RP will be responsible for ensuring fulfillment of all monitoring requirements, including those ofthe Designer, Ecologist, Contractor(s), and Volunteers as specified in the work plan, and is responsible forreporting as specified to the Regulator(s), when applicable. The RP will ensure that any herbicideapplicator is New York State certified. The Designer and the Ecologist may be the same person or fromthe same agency, and this person/agency may also be the RP.
2) Purpose of the protocol:
This monitoring protocol is designed to assess the progress towards, and the success or failure of, arestoration of salt or brackish marsh habitat by control or eradication of common reed, through cutting,mowing, burning, flooding with salt water, use of plastic, and/or application of herbicide, such as Rodeo.At a minimum, this should include regular assessment, for a period of > 5 years, of the parametersdescribed below. This monitoring protocol would not be applicable for restoration projects involvingexcavation of Phragmites stands, followed by backfilling, grading, and re-planting with salt marsh species.For an excavation-type Phragmites removal project, use of the recommended salt marsh monitoringprotocol is encouraged.
Note: Most Phragmites australis control strategies require multiple treatments (multiple cuttings,mowings, herbicide applications) to achieve success. Therefore, it is recommended that all monitoringactivities commence following the first post-treatment growing season, and should continue for 5 yearsfollowing the final treatment. During years 4-5 after the final treatment it is possible that a monitoringprotocol tailored to development of salt marsh or other habitat (i.e., the salt marsh restorationrecommended monitoring protocol) will provide the best information if used in conjunction with thisPhragmites australis monitoring protocol.
3) Monitoring Protocol Design:
All monitoring, except where noted below, should be conducted at the restoration project site and at anappropriate reference site. This reference site should consist of, at a minimum, three control transects, andmust be located contiguous with or nearby the restoration project site. The control transects mustrepresent stands of unmanaged common reed in similar habitat to the reed management site. For example,a high marsh area invaded by Phragmites and subject to eradication/management should be comparedwith control transects in a high marsh area dominated by Phragmites that will remain untouched byrestoration activities.
The purpose of the reference site is to help discern background environmental effects from the effectsattributable to the restoration project. For example, vegetation parameters at a restoration site must becompared with the same parameters at a nearby reference site to determine whether an observed loss ofvegetation is a restoration failure, or is caused by a natural event, such as disease, a hurricane, or a winterstorm that has similarly affected all the marshes in the area.

69
C Transects: A minimum of 3 transects, evenly spaced across the site, should be used for all restorationprojects. For large sites, transects should be evenly spaced, and although an absolute minimum of 3transects is required, a larger number of transects is recommended based on the acreage to be coveredand the heterogeneity of the site. Transects should run perpendicular to the main channel and/or parallelwith the elevation gradient, across the restoration site approximately from the mean low water (MLW) toat least the landward edge of the project. Transect locations should be permanently marked at thelandward end only using stakes that are sturdy and will be easily located during future monitoring visits.
During monitoring visits, a tape measure should be used to mark the transect line, starting at the upland end.Hook the tape measure onto the permanent landward stake, and walk toward the MLW mark remainingroughly parallel with the elevation gradient. At the seaward end of the transect, wrap the measuring tapearound a second, temporary stake, making sure it is taut. This forms a transect line between the landwardand seaward stakes. This procedure should be repeated for all transect locations at the restoration site.
Noteworthy features occurring along each transect should be recorded relative to the distance marked onthe tape measure at the point of occurrence. Note which transect end is being used as zero distance (usingthe placement method above it should be the landward marker), and that the same transect end (thelandward marker) be consistently used as zero distance for all transect monitoring at the restoration site.
C Permanent fixed-point photo stations: The permanent and temporary transect end markers (landwardend and seaward end, respectively) should also be used as the photostations for photographic monitoring.Photographs should be taken facing the seaward transect marker from the landward transect marker, andfacing the landward transect marker from the seaward transect marker. It is particularly important thatsome standard height reference marker be included in all photographs taken for the purpose of monitoringa common reed eradication or control project, during every monitoring visit to the site for the duration ofthe monitoring period (~ 5 years). For example, a tall stake with regular height interval markings that willbe visible in a photograph should be placed in the substrate or held by an assistant monitor at the head ofeach transect line and photographed. This should be done for all pairs of transect ends at the restorationsite. Also, a location that provides an overview photograph or photographs of the entire restoration siteshould be identified and consistently used for the duration of photomonitoring. All photographs should betaken at low tide (avoiding spring tide and full moon periods) and should be labeled with the location code,the direction of view, the date, the time, and the tide if ambiguous. All photographs should be in the formof prints no smaller than 4" x 6", and must be in color.
C Quadrats (optional): A 25 (twenty-five) m2 quadrat (a square 5 meters on a side) may be placed alongeach transect if the density of the Phragmites stand permits. This may be accomplished using a tapemeasure and 4 temporary stakes. The tape measure can be wrapped around the first stake, from wherethe monitor walks in a straight line for 5 meters, places a second stake wrapping the tape measure aroundthis stake, walks again for 5 meters in a straight line perpendicular to the original 5 meter line, places a thirdstake wrapping the tape measure around this stake, turns and walks another 5 meters in a straight lineperpendicular to the second 5 meters and parallel with the original 5 meters, etc., until a square 5 meters

70
on a side (25 m2) is formed. The quadrat should be intersected by the transect line (placed within 5 metersof the transect line on either side) and the location along the transect from distance zero noted (e.g., upperboundary at 8 meters, lower boundary at 13 meters). This should be done for all quadrats placed along alltransects at the restoration site.
C Video monitoring (optional): Use of video monitoring is encouraged to supplement photomonitoringand provide additional qualitative information that cannot be provided by standard photographs. Thisincludes close-up images of vegetation, benthic epifauna, and substrates; a panorama of the site is alsoeasily filmed. The restoration site should be walked by the video monitor, using the transect lines as guides.Cards may be filmed, or voice may be used, to give the required information, such as location code, date,time of day, direction of view, and tide. At each transect end the location code and direction of viewshould be identified. Close up views should be filmed of all vegetation zones occurring along the transects.
CAerial infrared photography (optional): Aerial IR photography, if available, is useful for assessingvegetation, both pre- and post-project, for large project areas.
4) Pre-Restoration Monitoring Activities:
All required parameters described below under “Post-Treatment Monitoring--Annual for > 5 Years”should be monitored once prior to the first eradication/control treatment, at both the restoration site andthe reference sites. This should occur during the last week in August or first three weeks of September,or immediately prior to the first treatment.
5) Post-Treatment Monitoring (Four to Five Weeks Post-Treatment):
C The restoration site should be walked by the RP, the Ecologist, and/or the Regulator(s) 4-5 weeks post-treatment to assess compliance with submitted work plans and initial effects of the treatment.
C Permanent fixed-point photo stations—A set of color photographs should be taken at this time at allpermanent, fixed-point photo stations articulated above, for the restoration site and the reference site. Allphotographs should be taken at low tide (avoiding spring tide and full moon periods) and should be labeledwith the location code, the direction of view, the date, the time, and the tide if ambiguous. It is particularlyimportant that some standard height reference marker be included in all photographs taken for the purposeof monitoring a common reed eradication or control project, during every monitoring visit to the site for theduration of the monitoring period. All photographs should be in the form of prints no smaller than 4" x 6",and must be in color.
C The RP will determine, based on the 4-5 week post-construction assessment, whether any additionalwork is required to achieve work plan compliance, and above and beyond any standard regulatory reviewassociated with the project.

71
6) Post-Treatment Monitoring (Annual for > 5 Years):
a) Vegetation along transects
The following parameters should be monitored once annually for > 5 years, during the last week in Augustor the first three weeks in September, at the restoration site and the reference sites.
< Vegetation Zones: Walk along the measuring tape that demarcates the transect line starting atthe upland transect end. Note the distance marked on tape measure at the transition betweendifferent vegetation zones, and the dominant species composition of these zones. The location ofthe seaward front of the Phragmites stand should be recorded as precisely as possible in orderto track dieback over time and with continued treatments. In areas where plant species diversityis low, the presence of all plant species other than Phragmites encountered along the transectshould be recorded.
< Signs of disease, predation, or other disturbance should be monitored along the length of thetransect, recording observations as necessary.
b) Fixed-point photo stations
All photomonitoring should be done for all transects at the restoration site. Color photographs should betaken from all designated locations once annually for > 5 years at the time of vegetation monitoring (duringthe last week in August or first three weeks in September), for the restoration site and the reference sites.The permanent and temporary transect marker stakes (upland end and seaward end, respectively) shouldbe used as photo stations for the photographic monitoring. Photographs should be taken facing theseaward transect marker from the upland transect marker, and facing the upland transect marker from theseaward transect marker. It is particularly important that some standard height reference marker beincluded in all photographs taken for the purpose of monitoring a common reed eradication/control project,during every monitoring visit to the site for the duration of the monitoring period (~ 5 years; see detailabove). Also, an overview photograph or photographs of the entire restoration site should be consistentlyused in all photomonitoring. Photographs should be taken at low tide (avoiding spring tide and full moonperiods) and should be labeled with the location code, the direction of view, the date, the time, and the tideif ambiguous. All photographs should be in the form of prints no smaller than 4" x 6", and must be in color.
Video monitoring, if used, should also occur at the time of vegetation monitoring, annually for > 5 years.
c) Vegetation in 25 (twenty-five) m2 quadrats
The following parameters are optional. If they are included, these parameters should be monitored onceannually for > 5 years, during the last week in August or first three weeks in September. In general,quadrat monitoring will be most informative in those sites where there is some diversity of plant species (i.e.,

72
the site is not a Phragmites australis monoculture). Alternatively, the parameters below will provide amore quantitative Phragmites australis data set that can assist in evaluating the effectiveness of differentcontrol strategies or other hypotheses associated with the eradication/control project.
< Percent cover: The percent coverage by all plant species present in the entire 25 (twenty-five)m2 quadrat should be estimated visually according to the basal area occupied by the plants (andnot the overall aboveground area).
< Stem density: All live stems of Phragmites australis in a 1.5625 m2 section of each 25 (twenty-five) m2 quadrat should counted. Divide each 25 m2 quadrat into four 6.25 m2 sections (1/4 of thetotal quadrat area). Then divide one of these 6.25 m2 sections into four subsections (1.5625 m2
sections). The 1.5625 m2 subsections represent 1/16 of the total quadrat area. Randomly selectone 1.5625 m2 subsection for the stem density count. Use the same 1.5625 m2 subsection forplant height measurements; see below.
< Plant Height: All live stems of Phragmites australis in a 1.5625 m2 section of each 25 (twenty-five) m2 quadrat are measured from the base of the plant to the top of the stem in meters. Use thesame 1.5625 m2 section of the quadrat for height measurements as was used for stem densitycount; see above.
7) Monitoring Reporting Requirements:
Annual monitoring reports should be submitted (by a mutually agreed upon date) to the applicableRegulator(s) and/or some other pre-designated, central repository beginning after the first post-treatmentgrowing season. Include data and all photographs, labeled as described above, should be included, as wellas a brief summary of the collected data. Length measurements should be reported using the metric system.
The monitoring reporting deadline for this project is _______________________________.
8) Recommended Monitoring after 5 Years:
It is recommended that photomonitoring for all restoration sites continue for an additional 3-5 yearsfollowing the conclusion of the initial required 5-year monitoring period. Photomonitoring during years 5-10should occur at a minimum once annually during the last week of August or first three weeks of September,and consist of photographs of the same overview site and from the same permanent transect photostationsused during the initial monitoring period. The additional 3-5 years of photomonitoring records should alsobe labeled, stored, and distributed in the same manner as occurred during the initial 5-year monitoringperiod.

73


Figure 16. Diagram of hypothetical placement of transects and quadrats for monitoring a Phragmites control project.

Figure 17. Diagram of the recommended quadrat and associated monitoring variablesfor a Phragmites australis control project.
Figure 18. Reporting vegetation and other features along a transect.
77
9. SALT MARSH BIBLIOGRAPHY
The reference list that follows is comprehensive for salt marsh restoration and ecology in the northeastUnited States. Other bibliographies of salt marsh restoration literature have been compiled and may be ofuse for additional research (Matthews and Minello, 1994; and see their references). These bibliographiesare comprised of a great deal of hard-to-retrieve conference proceedings and grey literature. An effort wasmade with the references below to rely more heavily on peer-reviewed literature drawn from scientificjournals that can be found in a good science library (e.g., the State University of New York-Albany libraryand the New York State Library were the primary sources for articles listed below. Most grey and otherliterature included below were available through the New York State Library). Most of these referencesare now housed in the New York State Coastal Management Program habitat library.
An “additional bibliographic materials” section follows the reference list below. This second sectiondocuments literature not cited in the Salt Marsh Restoration and Monitoring Guidelines, that maynonetheless be useful for those readers with more targeted needs or interested in conducting additionalresearch.
References
American Society of Civil Engineers (ASCE). 1998. Tide gates help restore salt marsh. Civil Engineering68(7): 87.
Beare, P.A. & J.B. Zedler. 1987. Cattail invasion and persistence in a coastal salt marsh: the role ofsalinity reduction. Estuaries 10(2): 165-170.
Benoit, L. 1997. Impacts of Phragmites on tidal marsh birds. Abstract, Phragmites workshop, Instituteof Ecosystem Studies, Millbrook, NY. April 29, 1997.
Benoit, L.K. 1999. Impact of the spread of Phragmites on the distribution of birds in Connecticut tidalmarshes. In: Yale School of Forestry and Environmental Studies, Greater New England symposium onthe ecology of invasive species: Presentations, posters, and discussion of current scientific research oninvasive animals and plants of the New England region, February 27, 1999.
Bertness, M.D. 1992. The ecology of a New England salt marsh. American Scientist 80: 260-268.
Bertness, M.D. 1984. Ribbed mussels and Spartina alterniflora production in a New England saltmarsh. Ecology 65: 1794-1807.
Bertness, M.D. & A.M. Ellison. 1987. Determinants of pattern in a New England salt marsh plantcommunity. Ecol. Monogr. 57: 129-147.

78
Besitka, M.A.R. 1996. An ecological and historical study of Phragmites australis along the Atlanticcoast. Master of Science Thesis, Department of Bioscience and Biotechnology, Drexel University,Philadelphia, PA.
Broome, S.W. 1990. Creation and restoration of tidal wetlands of the southeastern United States. Pp.37-72 in Kusler, J.A. & M.E. Kentula, eds., Wetland Creation and Restoration: The Status of the Science.Island Press, Washington, D.C.
Broome, S.W., E.D. Seneca & W.W. Woodhouse, Jr. 1983. The effects of source, rate and placementof nitrogen and phosphorous fertilizers on growth of Spartina alterniflora transplants in North Carolina.Estuaries 6: 212-226.
Broome, S.W., E.D. Seneca & W.W. Woodhouse, Jr. 1986. Long-term growth and development oftransplants of the salt marsh grass Spartina alterniflora. Estuaries 9: 63-74.
Broome, S.W., E.D. Seneca & W.W. Woodhouse, Jr. 1988. Tidal marsh restoration. Aquat. Bot. 32:1-22.
Burdick, D.M. 1996. Assessing salt marsh restoration projects. Jackson Estuarine Laboratory, Durham,NH. Unpublished.
Burdick, D.M., M. Dionne, R.M. Boumans & F.T. Short. 1997. Ecological responses to tidal restorationsof two northern New England salt marshes. Wetlands Ecology and Management 4(2): 129-144.
Casagrande, R.A. 1997. Potential of European insects to control North American Phragmites. Abstract,Phragmites workshop, Institute of Ecosystem Studies, Millbrook, NY. April 29, 1997.
Clarke, J., B.A. Harrington, T. Hruby, & F.E. Wasserman. 1985. The effect of ditching for mosquitocontrol on salt marsh use by birds in Rowley, Massachusetts. Journal of Field Ornithology 55: 160-180.
Coastal America. 1996. Coastal Restoration and Protection: Lessons Learned. Coastal AmericaTechnology Transfer Report. January, 1996.
Cornell Cooperative Extension (CCE). 1998a. Glyphosate. Extoxnet (Extension Toxicology Network)Pesticide Information Profile. http://pmep.cce.cornell.edu/profiles/extoxnet/. Cornell Cooperative ExtensionOffices of Cornell University, Ithaca, NY. September 30, 1998.
Cornell Cooperative Extension (CCE). 1998b. Amitrole. Extoxnet (Extension Toxicology Network)Pesticide Information Profile. http://pmep.cce.cornell.edu/profiles/extoxnet/. Cornell Cooperative ExtensionOffices of Cornell University, Ithaca, NY. September 30, 1998.

79
Cornell Cooperative Extension (CCE). 1998c. Dalapon. Extoxnet (Extension Toxicology Network)Pesticide Information Profile. http://pmep.cce.cornell.edu/profiles/extoxnet/. Cornell Cooperative ExtensionOffices of Cornell University, Ithaca, NY. September 30, 1998.
Cross, D.H. & K.L. Fleming. 1989. Control of Phragmites or common reed. U.S. Fish and WildlifeService, Waterfowl Management Handbook, Fish and Wildlife Leaflet 13.4.12.
Eastman, J. 1995. The Book of Swamp and Bog: Trees, Shrubs, and Wildflowers of Eastern FreshwaterWetlands. Stackpole Books, Mechanicsburg, PA. 237 pp.
EPA Global Warming Site. September 21, 1998. Impacts: Coastal. Web page address:http://www.epa.gov/ globalwarming/impacts/coastal/index.html
Environmental Concern, Inc. 1998. Nursery Catalog. 210 West Chew Avenue, P.O. Box P, St.Michaels, MD, 21663.
Erwin, K.L. 1990. Wetland evaluation for restoration and creation. Pp. 429-458 in Kusler, J.A. & M.E.Kentula, eds., Wetland Creation and Restoration: The Status of the Science. Island Press, Washington,D.C.
Fee, R. 1993. Shrimpers can expect a decline as Louisiana marshland recedes. National Fisherman73(11): 18-19.
Freese, J.H. & F.H. Kulhawy. 1983. General planning considerations for small-scale coastal structures.Report to New York Sea Grant Institute, Albany, New York, by School of Civil and EnvironmentalEngineering, Cornell University, Ithaca, NY. December, 1983.
Garbisch, E.W., Jr., P.B. Woller & R.J. McCallum. 1975. Salt marsh establishment and development.Technical Memorandum 52(114). U.S. Army Corps of Engineers, Coastal Engineering Research Center,Fort Belvoir, VA.
Herke, W., E. Knudsen, P. Knudsen, & B. Rogers. 1992. Effect of semi-impoundment on fish andcrustacean nursery use and export. N. Amer. J. Fish. Mgmt. 12: 151-160.
Howe, M.A., R.B. Clapp & J.S. Weske. 1978. Marine and coastal birds. Marine EcoSystems Analysis(MESA) Program, MESA New York Bight Atlas Monograph 31, New York Sea Grant Institute, Albany,NY. 87 pp.
Hruby, T. 1990. Long Island region tidal wetlands management manual. Part III: Management plandevelopment. Seatuck Research Program, Islip, NY. 42 pp.

80
Kearney, V., Y. Segal & M.W. Lefor. 1983. The effects of docks on salt marsh vegetation. ConnecticutDepartment of Environmental Protection, Water Resources Unit, Hartford, CT. 22 pp.
Kentula, M.E., R.P. Brooks, S.E. Gwin, C.C. Holland, A.D. Sherman & J.C. Sifneos. 1993. Anapproach to improving decision making in wetland restoration and creation. Edited by A.J. Hairston. U.S.Environmental Protection Agency, Environmental Research Laboratory, Corvallis, OR.
Kraus, M.L. & J.H. Crow. 1985. Substrate characteristics associated with the distribution of the ribbedmussel, Geukensia demissa (Modiolus demissus), on a tidal creek bank in southern New Jersey.Estuaries 8: 237-243.
Kruczynski, W.L. 1990. Mitigation and the Section 404 program: a perspective. In: Kusler, J.A. andM.E. Kentula, eds. Wetland creation and restoration: the status of the science. Island Press, Washington,D.C.
Kusler, J.A. & M.E. Kentula. 1990. Executive summary. Pp. xvii-xxv in Kusler, J.A. & M.E. Kentula,eds., Wetland Creation and Restoration: The Status of the Science. Island Press, Washington, D.C.
Lagna, L. 1975. The relationship of Spartina alterniflora to mean high water. Prepared for New YorkSea Grant Institute, State University of New York and Cornell University, NYSSGP-RS-75-002, January1975.
Langis, R., M. Zalejko, and J.B. Zedler. 1991. Nitrogen assessment in a constructed and a natural saltmarsh of San Diego Bay. Ecological Applications 1: 40-51.
Lefor, M.W., W.C. Kennard & D.L. Civco. 1987. Relationships of saltmarsh plant distribution to tidallevels in Connecticut, USA. Environmental Management 11(1): 61-68.
Lent, R.A., T. Hruby, D.P. Cowan & T.S. Litwin. 1990. Open Marsh Water Management on GreatSouth Bay, Islip, NY: Final report. Seatuck Research Program, Islip, NY. 101 pp.
Lewis, R.L. 1990. Wetland restoration/creation/enhancement terminology: Suggestions forstandardization. Pp. 417-422 in Kusler, J.A. & M.E. Kentula, eds., Wetland Creation and Restoration:The Status of the Science. Island Press, Washington, D.C.
Magee, D.W. 1981. Freshwater wetlands: A guide to common indicator plants of the northeast. TheUniversity of Massachusetts Press, Amherst, MA. 245 pp.
Matsil, M.A. & M.J. Feller. 1996. Natural areas restoration in New York City: A bite of the apple.Restoration and Management Notes 14(1) 5-14.

81
Matthews, G.A. & T.J. Minello. 1994. Technology and Success in Restoration, Creation, andEnhancement of Spartina alterniflora marshes in the United States. Vol. 1--Executive Summary andAnnotated Bibliography. NOAA Coastal Ocean Program Decision Analysis Series No. 2. NOAACoastal Ocean Office, Silver Spring, MD.
McKee, K.L. & W.H. Patrick, Jr. 1988. The relationship of smooth cordgrass (Spartina alterniflora)to tidal datums: a review. Estuaries 11(3): 143-151.
Monastersky, R. 1994. Water habits on land cause oceans to swell. Science News 145(2): 21.
New Hampshire Natural Resources Conservation Service (NRCS). 1998. Salt Marsh Restoration inNew Hampshire. http://nh.nrcs.usda.gov/saltrest.html, July 24, 1998.
New Hampshire Coastal Program (NHCP). 1998. Draft monitoring requirements for salt marshrestoration projects. State of New Hampshire Office of State Planning, September 1998.
New York Sea Grant Institute (NYSGI). 1993. Estuarine resources of the Fire Island National Seashoreand vicinity. New York Sea Grant Institute. Stony Brook, NY.
New York State Department of Environmental Conservation (NYSDEC). 1992. The SEQR Handbook.New York State Department of Environmental Conservation, Albany, NY.
New York State Department of Environmental Conservation (NYSDEC). 1995. Draft wetlandsconservation in New York State: a strategy for the future. New York State Department of EnvironmentalConservation, Albany, NY.
New York State Department of State. 1990. Hudson River Significant Tidal Habitats: A Guide to theFunctions, Values, and Protection of the River’s Natural Resources. Prepared by the New York StateDepartment of State Division of Coastal Resources and Waterfront Revitalization and The NatureConservancy, March 1990.
New York State Office of Planning Services. 1972. Long Island Marine Wetlands: Status, Value, andPreservation Potentials. Prepared by the Metropolitan New York District Office, Office of PlanningServices. Published by the State of New York, Office of Planning Services, Albany, NY. 60 pp.
Nicholls, R.J. & S.P. Leatherman. 1996. Adapting to sea-level rise: Relative sea-level trends to 2100 forthe United States. Coastal Management 24: 301-324.
Niering, W.A. & R.S. Warren. 1980. Vegetation patterns and processes in New England salt marshes.BioScience 30: 301-307.

82
Nixon, S.W. 1982. The ecology of New England high salt marshes: A community profile. Prepared fornational Coastal Ecosystems Team, Office of Biological Services, U.S. Fish and Wildlife Service, U.S.DOI, Washington, D.C., Report FWS/OBS-81/55, March, 1982.
Nordby, C.S. & J.B. Zedler. 1991. Responses of fish and macrobenthic assemblages to hydrologicdisturbances in Tijuana Estuary and Los Penasquitos Lagoon, California. Estuaries 14(1): 80-93.
Normandeau Associates, Inc. 1992. A manual for monitoring mitigation and restoration projects on NewHampshire’s salt marshes. Prepared for Office of State Planning, New Hampshire Coastal Program,Concord, NH, June 1992.
Odum, E.P. 1971. Fundamentals of Ecology. 3rd Edition. W.B. Saunders Company, Philadelphia, PA.
Office of Long Island Sound Programs (OLISP). 1998. Tidal Wetlands. Draft characterization documentfor the Long Island Sound Study Habitat Restoration Plan. Connecticut Department of EnvironmentalProtection, Hartford, CT.
Orson, R.A., R.S. Warren & W.A. Niering. 1987. Development of a tidal marsh in a New England rivervalley. Estuaries 10(1): 20-27.
Oviatt, C.A., S.W. Nixon & J. Garber. 1977. Variation and evaluation of coastal salt marshes.Environmental Management 1: 201-211.
Pacific Estuarine Research Laboratory (PERL). 1990. A manual for assessing restored and natural coastalwetlands, with examples from Southern California. California Sea Grant Report No. T-CSGCP-021, LaJolla, California.
Peck, M.A., P.E. Fell, E.A. Allen, J.A. Gieg, C.R. Guthke & M.D. Newkirk. 1994. Evaluation of tidalmarsh restoration: Comparisons of selected macroinvertebrate populations on a restored impounded valleymarsh and an unimpounded valley marsh within the same salt marsh system in Connecticut, USA.Environmental Management 18: 283-293.
Peterson, C.H. & N.M. Peterson. 1979. The ecology of intertidal flats of North Carolina: A communityprofile. Prepared for national Coastal Ecosystems Team, Biological Services Program, U.S. Fish andWildlife Service, U.S. DOI, NASA-Slidell Computer Complex, Slidell LA, November 1979.
Pinelands Nursery. 1998. Wholesale Catalog. Pinelands Nursery, Inc., 323 Island Road, Columbus, NJ,08022.
Portnoy, J.W. 1991. Summer oxygen depletion in a diked New England estuary. Estuaries 14: 122-129.

83
Reimold, R.J. & S.A. Cobler. 1986. Wetlands mitigation effectiveness. U.S. Environmental ProtectionAgency Contract No. 68-04-0015. Boston, MA.
Richter, K.O. 1997. A simple gauge for water-level maxima and minima. Restoration and ManagementNotes 15(1): 60-63.
Rilling, C. 1998a. Tidal wetland restoration--Use of the herbicide Rodeo to control common reed.Technical report of the Connecticut Department of Environmental Protection, Office of Long Island SoundPrograms, April 17, 1998.
Rilling, C. 1998b. Tidal wetland restoration--Use of a surfactant with herbicide Rodeo to control commonreed. Technical report of the Connecticut Department of Environmental Protection, Office of Long IslandSound Programs, June 15, 1998.
Roman, C.T., W.A. Niering & R.S. Warren. 1984. Salt marsh vegetation change in response to tidalrestriction. Environmental Management 8: 141-150.
Rozsa, R. 1995. Human impacts on tidal wetlands: history and regulations. In: Tidal Marshes of LongIsland Sound: Ecology, History, and Restoration. Dreyer, G.D. & W.A. Niering, eds. The ConnecticutCollege Arboretum, Bulletin No. 34, New London, CT. December, 1995.
Sahagian, D. & F.W. Schwartz. 1994. Direct anthropogenic contributions to sea level rise in the twentiethcentury. Nature 367(6468): 54-57.
Seneca, E.D., S.W. Broome & W.W. Woodhouse. 1985. The influence of duration-of-inundation ondevelopment of a man-initiated Spartina alterniflora Loisel. marsh in North Carolina. J. Exp. Mar. Biol.Ecol. 94: 259-268.
Shisler, J.K. 1990. Creation and restoration of the coastal wetlands of the northeastern United States.Pp. 143-170 in Kusler, J.A. & M.E. Kentula, eds., Wetland Creation and Restoration: The Status of theScience. Island Press, Washington, D.C.
Shisler, J.K. & D.J. Charette. 1984. Evaluation of Artificial Salt Marshes in New Jersey. New JerseyAgricultural Experiment Station Publication Number P-40502-01-84.
Silverberg, S.M. & M.S. Dennison. 1993. Wetlands and coastal zone regulation and compliance. JohnWiley and Sons, New York, NY.
Simenstad, C.A. & R.M. Thom. 1996. Functional equivalency trajectories of the restored Gog-Le-Hi-Teestuarine wetland. Ecological Applications 6(1): 38-56.

84
Sinicrope, T.L., P.G. Hine, R.S. Warren & W.A. Niering. 1990. Restoration of an impounded salt marshin New England. Estuaries 13: 25-30.
Stumpf, R.P. 1983. The process of sedimentation on the surface of a salt marsh. Estuar. Coast. Shelf Sci.17: 495-508.
Suffolk County Planning Department (SCPD). 1985. Analysis of dredging and spoil disposal activityconducted by Suffolk County: Historical perspective and a look to the future. Prepared by Suffolk CountyPlanning Department, Hauppauge, NY, October, 1985.
Sullivant, R. 1994. Draining the earth to fill the ocean. Sea Frontiers 40(2): 11-12.
Swanson, R.L. 1976. Tides. Marine EcoSystems Analysis (MESA) Program, MESA New York BightAtlas Monograph 4, New York Sea Grant Institute, Albany, NY. 34 pp.
Talmage Farm. 1998. Spring ’98 Catalog. H.R. Talmage & Son, 2975 Sound Avenue, Riverhead, NY,11901.
Taylor, J. 1998. Guidance for Meeting U.S. Fish and Wildlife Service Trust Resource Needs WhenConducting Coastal Marsh Management for Mosquito Control On Region 5 National Wildlife Refuges.U.S. Fish and Wildlife Service Region 5, Great Bay National Wildlife Refuge, Newington, NH. 20 pp.
Teal, J.M. 1986. The ecology of regularly flooded salt marshes of New England: A community profile.Prepared for the National Coastal Ecosystems Team, Division of Biological Services, U.S. Fish andWildlife Service, U.S. Department of the Interior, Washington, DC, June 1986.
Teal, J. & M. Teal. 1969. Life and Death of the Salt Marsh. Ballantine Books, New York, NY.
Thom, Ronald M. 1998. From Advanced Habitat Restoration Training materials, presented at NorriePoint Environmental Center, Staatsburg, NY, June 1998.
Thom, R. M. & K.F. Wellman. 1996. Planning aquatic ecosystem restoration monitoring programs.Prepared for the U.S. Army Corps of Engineers, Institute for Water Resources, Alexandria, Virginia andWaterways Experiment Station, Vicksburg, Mississippi. IWR Report 96-R-23, December, 1996.
Tiner, R.W., Jr. 1987. A Field Guide to Coastal Wetland Plants of the Northeastern United States. TheUniversity of Massachusetts Press, Amherst, MA.
Tiner, R. 1998. Managing common reed (Phragmites australis) in Massachusetts: An introduction tothe species and control techniques. Prepared by the U.S. Fish and Wildlife Services for MassachusettsWetlands Restoration and Banking Program, Executive Office of Environmental Affairs, Boston, MA,December 1998.

85
Titus, J.G. 1991. Greenhouse effect and coastal wetland policy: How Americans could abandon an areathe size of Massachusetts at minimum cost. Environmental Management 15: 39-58.
Titus, J.G., R.A. Park, S.P. Leatherman, J.R. Weggel, M.S. Greene, P.W. Mausel, S. Brown, C. Gaunt,M. Trehan, & G. Yohe. 1991. Greenhouse effect and sea level rise: The cost of holding back the sea.Coastal Management 19: 171-210.
United States Department of the Interior (USDOI). 1989. National wetlands priority conservation plan.U.S. Fish and Wildlife Service, Washington, D.C.
Warren, R.S. 1995. Evolution and development of tidal marshes. In: Tidal marshes of Long Island Sound:ecology, history and restoration. Dreyer, G.D. & W.A. Niering, eds. The Connecticut CollegeArboretum, Bulletin No. 34, New London, CT. December, 1995.
Weinstein, M.P. 1996. Restoration of degraded salt marshes: The use of Rodeo for initial Phragmitescontrol. Prepared for the Public Service Electric and Gas Company Estuary Enhancement Program, NewJersey, July 10, 1996.
Weis, J.S., J.Tan, C. Cherilus, L. Dounacvskaia, & C. Peterman. 1999. Phragmites or Spartina ashabitat: do the estuarine species care? In: Yale School of Forestry and Environmental Studies, GreaterNew England symposium on the ecology of invasive species: Presentations, posters, and discussion ofcurrent scientific research on invasive animals and plants of the New England region, February 27, 1999.
Wilber, P. & J. Titre. 1996. Introduction. Pp. 1.1-1.5 in: Planning and Evaluating Restoration of AquaticHabitats from an Ecological Perspective. Prepared for U.S. Army Corps of Engineers WaterwaysExperiment Station, Vicksburg, MS and Institute for Water Resources, Alexandria, VA. Evaluation ofEnvironmental Investments Program IWR Report 96-EL-4, September 1996.
World Wildlife Fund (WWF). 1995. Statewide wetland strategies: a guide to protecting and managingthe resource. Island Press, Washington, D.C.
Yozzo, D., J. Titre, & J. Sexton. 1996. Planning and Evaluating Restoration of Aquatic Habitats from anEcological Perspective. Prepared for U.S. Army Corps of Engineers Waterways Experiment Station,Vicksburg, MS and Institute for Water Resources, Alexandria, VA. Evaluation of EnvironmentalInvestments Program IWR Report 96-EL-4, September 1996.

86
Additional bibliographic material
Anderson, F. 1986. Influence of Spartina detritus enrichment on exchange of nutrients between sedimentand water in an intertidal area of Bay of Fundy. Marine Ecology Progress Series 29: 7-14.
Barrett, N.E. & W.A. Niering. 1993. Tidal marsh restoration: Trends in vegetation change using ageographical information system (GIS). Restoration Ecology 1(1): 18-28.
Bertness, M.D. 1985. Fiddler crab regulation of Spartina alterniflora production on a New England saltmarsh. Ecology 66: 1042-1055.
Bertness, M.D. & T. Miller. 1984. The distribution and dynamics of Uca pugnax burrows in a NewEngland salt marsh. J. Exp. Mar. Biol. Ecol. 83: 211-237.
Bliven, S. & A.L. Hankin (eds.). 1985. Salt Ponds and Tidal Inlets: Maintenance and ManagementConsiderations. Proceedings of a Conference. Lloyd Center for Environmental Studies, South Dartmouth,MA, Publication No. 2-85. 130 pp.
Bowen, M. & M. Small. 1992. Identification and evaluation of coastal habitat evaluation methodologies.Technical Report EL-92-21. Prepared by Normandeau Associates for the U.S. Army Corps of Engineers,Waterways Experiment Station, Vicksburg, MS.
Boesch, D.F. & R. E. Turner. 1984. Dependence of fishery species on salt marshes: The role of food andrefuge. Estuaries 7(4A): 460-468.
Brinson, M.M. 1993. A hydrogeomorphic classification of wetlands. U.S. Army Corps of EngineersWaterways Experiment Station, Wetlands Research Program Technical Report WRP-DE-4, April 1993.
Brinson, M.M. & R. Rheinhardt. 1996. The role of reference wetlands in functional assessment andmitigation. Ecological Applications 6(1): 69-76.
Brown, M.T. 1991. Evaluating constructed wetlands through comparisons with natural wetlands. EPA-600-3-91-058. U.S. Environmental Protection Agency, Corvallis, OR.
Bryan, R.R., M. Dionne, R.A. Cook, J. Jones, & A. Goodspeed. 1997. Maine citizens guide toevaluating, restoring, and managing tidal marshes. Published by the Maine Audubon Society, April 1997.
Burdick, D.M. & I.A. Mendelssohn. 1987. Waterlogging responses in dune, swale and marsh populationsof Spartina patens under field conditions. Oecologia 74: 321-329.
Burdick, D.M. & M. Dionne. 1994. Comparison of salt marsh restoration and creation techniques inpromoting native vegetation and functional values. Office of State Planning. Concord, NH. 65 pp.
87
Buschbaum, R. & M. Hall. 1991. Draft: An inventory of the biota of a Belle Isle marsh in a tidallyrestricted area. Massachusetts Audubon Society, Lincoln, MA. 46 pp.
Crabtree, A., E. Day, A. Garlo & G. Stevens. 1990. Evaluation of wetland mitigation measures. Finalreport: Volume 1. U.S. Department of Transportation, Federal Highway Administration, Report No.FHWA-RD-90-083. Washington, D.C.
Craft, C.B., S.W. Broome & E.D. Seneca. 1988. Nitrogen, phosphorus, and organic carbon pools innatural and transplanted marsh soils. Estuaries 11: 272-280.
Craft, C.B., E.D. Seneca & S.W. Broome. 1991. Porewater chemistry of natural and created marsh soils.J. Exp. Mar. Biol. Ecol. 152: 187-200.
Craft, C.B., E.D. Seneca & S.W. Broome. 1991. Loss on ignition and Kjeldahl digestion for estimatingorganic carbon and total nitrogen in estuarine marsh soils: Calibration with dry combustion. Estuaries 14(2):175-179.
Cranford, P.J., D.C. Gordon, & C.M. Jarvis. 1989. Measurements of cordgrass, Spartina alterniflora,in a macrotidal estuary, Bay of Fundy. Estuaries 12: 27-34.
Crawford, H. & P. Van Patten. 1991. Coastal habitat restoration: Can the damage be undone?Nor’Easter, Spring 1991: 38-42.
Cundy, A.B., I.W. Croudace, J. Thomson, & J.T. Lewis. 1997. Reliability of salt marshes as“geochemical recorders” of pollution input: A case study from contrasting estuaries in southern England.Environmental Science and Technology 31: 1093-1101.
Earhart, H.G. & E.W. Garbisch, Jr. 1983. Habitat development utilizing dredged material at BarrenIsland, Dorchester County, Maryland. Wetlands 3: 108-119.
Eleuterius, L.N. & J.I. Gill. 1981. Long-term observations on seagrass beds and salt marsh establishedfrom transplants. Pp. 74-86 in Stovall, R.H., ed., Proceedings of the eighth annual conference on wetlandsrestoration and creation. Hillsborough Community College, Tampa, FL.
Faber, P.M. 1991. The Muzzi marsh, Corte Madera, California: Long-term observations of a restoredmarsh in San Francisco Bay. Pp. 424-438 in Bolton, H.S., ed., Coastal Wetlands. American Society ofCivil Engineers, New York.
Fleisher, S., L. Steibe & L. Leonardson. 1991. Restoration of wetlands as a means of reducing nitrogentransport to coastal waters. Ambio: A journal of the human environment 20(6): 271-272.

88
Gallagher, J.L., G.F. Somers, D.M. Grant & D.M. Seliskar. 1988. Persistent differences in two formsof Spartina alterniflora: A common garden experiment. Ecology 69(4): 1005-1008.
Gallagher, J.L., H.V. Kibby & K.W. Skirvin. 1984. Detritus processing and mineral cycling in seagrass(Zostera) litter in an Oregon salt marsh. Aquatic Botany 20: 97-108.
Garcia, R. 1983. Mosquito management: Ecological approaches. Environmental Management 7(1): 73-78.
Gleason, M.L. & J.C. Zieman. 1981. Influence of tidal inundation on internal oxygen supply of Spartinaalterniflora and Spartina patens. Estuarine, Coastal and Shelf Science 13:47-57.
Graneli, W. 1989. Influence of standing litter on shoot production in reed, Phragmites australis (Cav.)Trin. Ex. Steudel. Aquatic Botany 35: 99-109.
Gross, M.F., M.A. Hardisky, P.L. Wolf & V. Klemas. 1991. Relationship between aboveground andbelowground biomass of Spartina alterniflora (smooth cordgrass). Estuaries 14(2): 180-191.
Gwin, S.E. & M.E. Kentula. 1990. Evaluating design and verifying compliance of wetlands created underSection 404 of the Clean Water Act in Oregon. EPA-600-3-90-061. U.S. Environmental ProtectionAgency, Environmental Research Laboratory, Corvallis, OR.
Haltiner, J., J.B. Zedler, K.E. Boyer, G.D. Williams & J.C. Callaway. 1997. Influence of physicalprocesses on the design, functioning, and evolution of restored tidal wetlands in California (USA).Wetlands Ecology and Management 4: 73-91.
Havens, K.J., L.M. Varnell & J.G. Bradshaw. 1995. An assessment of ecological conditions in aconstructed tidal marsh and two natural reference tidal marshes in coastal Virginia. Ecological Engineering4: 117-141.
Holloway, M. 1994. Nurturing nature. Scientific American (April 1994): 98-108.
Holt, E.R. & R. Buchsbaum. 1999. Bird use of Phragmites australis in coastal marshes of northernMassachusetts. In: Yale School of Forestry and Environmental Studies, Greater New England symposiumon the ecology of invasive species: Presentations, posters, and discussion of current scientific research oninvasive animals and plants of the New England region, February 27, 1999.
Horner, R.R. & K.J. Raedeke. 1989. Guide for wetland mitigation project monitoring. Res. Proj.GC8286, Task 6, Washington State Transportation Commission, Seattle, WA.
Hruby, T. & W.G. Montgomery. 1988. Open marsh water management for open tidal marshes in thenortheast: A manual of methods. Massachusetts Audubon Society, Gloucester, MA.

89
Institute for Ecosystem Studies. 1997. Compendium of Phragmites abstracts. Phragmites workshop,Millbrook, NY, April 29, 1997.
Jackson, A. & J.H. Pardue. 1997. Seasonal variability of crude oil respiration potential in salt and freshmarshes. Journal of Environmental Quality 26: 1140-1146.
Joyce, A.A. & S. B. Weisberg. 1986. The effects of predation by the mummichog, Fundulusheteroclitus (L.), on the abundance and distribution of the salt marsh snail, Melampus bidentatus (Say).J. Exp. Mar. Biol. Ecol. 100: 295-306.
Josselyn, M. (Ed.) 1982. Wetland restoration and enhancement in California. Proceedings of a workshopheld February 1982, California State University, Hayward. A California sea Grant College ProgramPublication, Report Nol T-CSGCP-007, December 1982.
Josselyn, M. & S. Chamberlain. 1994. Wetland restoration by the Coastal Conservancy: A status report.California Coast and Ocean, Winter/Spring 1994: 26-31.
Kennedy, V.S. (Ed.) 1980. Estuarine Perspectives. Academic Press, New York.
King, D.M. Economics: Costing out restoration. Restoration & Management Notes 9(1): 15-20.
Kneib, R.T. 1984. Patterns of invertebrate distribution and abundance in the intertidal salt marsh: Causesand questions. Estuaries 7(4A): 392-412.
Knutson, P.L. & W.W. Woodhouse, Jr. 1983. Shore stabilization with salt marsh vegetation. U.S. ArmyCorps of Engineers, Coastal Engineering Research Center, Fort Belvoir, Virginia, Special Report No. 9,January 1983.
Levin, L.A., D. Talley & G. Thayer. 1996. Succession of macrobenthos in a created salt marsh. Mar.Ecol. Prog. Ser. 141: 67-82.
Lewis, R. R. 1990. Wetlands restoration/creation/enhancement terminology: Suggestions forstandardization. Pp. 417-422 in Kusler, J.A. & M.E. Kentula, eds., Wetland Creation and Restoration:The Status of the Science. Island Press, Washington, D.C.
Linthurst, R.A. & E.D. Seneca. 1980. The effects of standing water and drainage potential on theSpartina alterniflora substrate complex in a North Carolina salt marsh. Estuarine and Coastal MarineScience 11: 41-52.
Louis Berger & Associates, Inc. 1997. Costs for wetland creation and restoration projects in the glaciatednortheast. Prepared for the U.S. Environmental Protection Agency, Region I. EPA Contract No. 68-D5-0171. 56 pp.

90
Luckenbach, M.W., R.J. Diaz, E.C. Zobrist & C.H. Hutton. 1990. Evaluation of the benthic resourcevalue of impounded and nonimpounded tidal creeks in Virginia, USA. Ocean & Shoreline Management14: 35-50.
Malchoff, M. 1996. Methods to evaluate constructed and restored wetlands as finfish nursery habitats.South Shore Estuary Reserve Early Action Proposal Report, New York Sea Grant, Riverhead, New York,March 1996.
McIvor, C.C. & W.E. Odum. 1988. Food, predation risk, and microhabitat selection in a marsh fishassemblage. Ecology 69(5): 1341-1351.
Mendelssohn, I.A. & E.D. Seneca. 1980. The influence of soil drainage on the growth of salt marshcordgrass Spartina alterniflora in North Carolina. Estuarine and Coastal Marine Science 11: 27-40.
Minello, T.J. & J.W. Webb, Jr. 1997. Use of natural and created Spartina alterniflora salt marshes byfishery species and other aquatic fauna in Galveston Bay, Texas, USA. Mar. Ecol. Prog. Ser. 151: 165-179.
Mitsch, W.J. 1992. Landscape design and the role of created, restored, and natural riparian wetlands incontrolling nonpoint source pollution. Ecological Engineering 1: 27-47.
Mitsch, W.J. & J. G.Gosselink. 1993. Wetlands (second edition). Van Nostrand Reinhold, New York.
Mitsch, W.J. & R.F. Wilson. 1996. Improving the success of wetland creation and restoration with know-how, time, and self-design. Ecological Applications 6(1): 77-83.
Montague, C.L., A.V. Zale & H.F. Percival. 1987. Ecological effects of coastal marsh impoundments:A review. Environmental Management 11: 743-756.
Moy, L.D. & L.A. Levin. 1991. Are Spartina alterniflora marshes a replaceable resource? A functionalapproach to the evaluation of marsh creation efforts. Estuaries 14: 1-16.
Munro, J.W. Undated. Wetland restoration in the mitigation context. Restoration and Management Notes9(2): 80-86.
Ninivaggi, D. 1989. Managing New York’s mosquito coast. The Conservationist July-August 1989.
O’Brien, A.L. 1988. Evaluating the cumulative effects of alternation on New England wetlands.Environmental Management 12(5).
Odum, E.P. 1969. The strategy of ecosystem development. Science 164: 262-269.
91
Race, M.S. & M.S. Fonseca. 1996. Fixing compensatory mitigation: What will it take? EcologicalApplications 6(1): 94-101.
Rader, D.N. 1984. Salt-marsh benthic invertebrates: Small-scale patterns of distribution and abundance.Estuaries 7(4A): 413-420.
Reed, D.J. & D.R. Cahoon. 1992. The relationship between marsh surface topography, hydroperiod, andgrowth of Spartina alterniflora in a deteriorating Louisiana salt marsh. J. Coast. Res. 8: 77-87.
Rozsa, R. 1988. An overview of wetland restoration projects in Connecticut. Pages 1-12 in M.W. Lefor& W.C. Kennard, eds., Proceedings of the Fourth Wetlands Conference: Wetlands Creation andRestoration. Connecticut Institute of Water Resources, University of Connecticut, Storrs, CT.
Rozsa, R. Undated. Common reed (Phragmites australis)--Invasive species profile. Office of LongIsland Sound Programs, Connecticut Department of Environmental Protection. Unpublished.
Rulifson, R.A. 1991. Finfish utilization of man-initiated and adjacent natural creeks of South CreekEstuary, North Carolina using multiple gear types. Estuaries 14(4): 447-464.
Steinke, T.J. 1986. Hydrologic manipulation and restoring wetland values: Pine Creek, Fairfield,Connecticut. Pp. 377-383 in Kusler, J.A., M.L. Quammen & G. Brooks, eds., National wetlandsymposium: Mitigation of impacts and losses. Association of State Wetland Managers, New Orleans, LA.
Talbot, C.W. & K.W. Able. 1984. Composition and distribution of larval fishes in New Jersey highmarshes. Estuaries 7(4A): 434-443.
Thayer, G.W. (ed.) 1992. Restoring the Nation’s Marine Environment. Maryland Sea Grant, CollegePark, MD.
Thompson, D.J. & J.M. Shay. 1985. The effects of fire on Phragmites australis in the Delta Marsh,Manitoba. Can. J. Bot. 63: 1864-1869.
Thompson, D.J. & J.M. Shay. 1989. First-year response of a Phragmites marsh community to seasonalburning. Can. J. Bot. 67: 1448-1455.
Tiner, R. 1998. Managing common reed (Phragmites australis) in Massachusetts: An introduction tothe species and control techniques. Prepared by the U.S. Fish and Wildlife Service for the MassachusettsWetlands Restoration and Banking Program, Executive Office of Environmental Affairs, Boston,Massachusetts, December 1998.
U.S. Army Corps of Engineers. 1995. Massachusetts wetlands restoration study: Site identification andevaluation report. USACE, New England Division, Waltham, MA.

92
U.S. Army Corps of Engineers. 1996. Cape Cod wetlands investigation. USACE, New EnglandDivision, Waltham, MA.
U.S. Department of Agriculture. 1994. Evaluation of restorable salt marshes in New Hampshire. USDANatural Resources Conservation Service, Durham, NH. 32 pp.
U.S. Environmental Protection Agency. 1997. Climate change and New York. Office of Policy, Planningand Evaluation, EPA 230-F-97-008ff, September 1997.
Valiela, I. & J.M. Teal. 1979. The nitrogen budget of a salt marsh ecosystem. Nature 280: 652-656.
Varnell, L.M. & K.J. Havens. 1995. A comparison of dimension-adjusted catch data methods forassessment of fish and crab abundance in intertidal salt marshes. Estuaries 18(2): 319-325.
Varnell, L.M., K.J. Havens & C.Hershner. 1995. Daily variability in abundance and populationcharacteristics of tidal salt-marsh fauna. Estuaries 18(2): 326-334.
Vittor, B. & D. Yozzo. 1996. Estuarine and coastal wetlands. Pp. 5C-1—5C-51 in Yozzo, D., J. Titre& J. Sexton, eds., Planning and Evaluating Restoration of Aquatic Habitats from an Ecological Perspective.Prepared for U.S. Army Corps of Engineers-Waterways Experiment Station, Vicksburg, MS and U.S.Army Corps of Engineers-Institute for Water Resources, Alexandria, VA, IWR Report 96-EL-4,September, 1996.
Webb, J.W., Jr. & J.D. Dodd. 1983. Wave-protected versus unprotected transplantings on a Texas bayshoreline. Journal of Soil and Water Conservation 38: 363-366.
Weisner, S.E.B. & W. Graneli. 1989. Influence of substrate conditions on the growth of Phragmitesaustralis after a reduction in oxygen transport to below-ground parts. Aquatic Botany 35: 71-80.
Wheelwright, M.C. 1996. Post Island marsh restoration: A rubric of reclamation. City of Quincy,Department of Public Works, Quincy, MA. 11 pp.
Whitlatch, R.B. 1982. The ecology of New England tidal flats: a community profile. U.S. Fish andWildlife Service, Washington, D.C. 125 pp.
Wilsey, McKee, & Mendelssohn. Effects of increased elevation and macro- and micronutrient additionson S. alterniflora transplant success in salt marsh dieback areas in Louisiana. Environmental Management16: 505-511.
Wolaver, T.G., J. Zieman, & B. Kjerfve. 1986. Factors affecting short-term variability in sediment pHas a function of marsh elevation in a Virginia mesohaline marsh. J. Exp. Mar. Biol. Ecol. 101: 227-237.

93
Yale School of Forestry and Environmental Studies. 1999. Greater New England symposium on theecology of invasive species: Presentations, posters, and discussion of current scientific research on invasiveanimals and plants of the New England region, February 27, 1999.
Zedler, J.B. 1993. Canopy architecture of natural and planted cordgrass marshes: Selecting habitatevaluation criteria. Ecological Applications 3(1) 123-138.
Zedler, J.B. & B. Nyden. 1995. Innovative management of California wetlands. Forum for AppliedResearch and Public Policy 10 (Summer 1995): 93-97.
Zedler, J.B. 1996. Coastal mitigation in southern California: The need for a regional restoration strategy.Ecological Applications 6: 84-93.


95
10. COMMON REED CONTROL BIBLIOGRAPHY
Besitka, M.A.R. 1996. An ecological and historical study of Phragmites australis along the Atlanticcoast. Master of Science Thesis, Department of Bioscience and Biotechnology, Drexel University,Philadelphia, PA.
Benoit, L. 1997. Impacts of Phragmites on tidal marsh birds. Abstract, Phragmites workshop, Instituteof Ecosystem Studies, Millbrook, NY. April 29, 1997.
Benoit, L.K. 1999. Impact of the spread of Phragmites on the distribution of birds in Connecticut tidalmarshes. In: Yale School of Forestry and Environmental Studies, Greater New England symposium onthe ecology of invasive species: Presentations, posters, and discussion of current scientific research oninvasive animals and plants of the New England region, February 27, 1999.
Bontje, M.P. 1988. The application of science and engineering to restore a salt marsh, 1987. In: F.J.Webb (ed.), Proceedings of the 15th Annual Conference on Wetlands Restoration and Creation,Hillsborough Community College, Tampa, FL.
Boone, J., E. Furbish, and K. Turner. 1987. Control of Phragmites communis: Results of burning,cutting, and covering with plastic in a North Carolina marsh. National Park Service, U.S. Department ofthe Interior. CPSU Technical Report No. 41.
Casagrande, R.A. 1997. Potential of European insects to control North American Phragmites. Abstract,Phragmites workshop, Institute of Ecosystem Studies, Millbrook, NY. April 29, 1997.
Cornell Cooperative Extension (CCE). 1998a. Glyphosate. Extoxnet (Extension Toxicology Network)Pesticide Information Profile. http://pmep.cce.cornell.edu/profiles/extoxnet/. Cornell Cooperative ExtensionOffices of Cornell University, Ithaca, NY. September 30, 1998.
Cornell Cooperative Extension (CCE). 1998b. Amitrole. Extoxnet (Extension Toxicology Network)Pesticide Information Profile. http://pmep.cce.cornell.edu/profiles/extoxnet/. Cornell Cooperative ExtensionOffices of Cornell University, Ithaca, NY. September 30, 1998.
Cornell Cooperative Extension (CCE). 1998c. Dalapon. Extoxnet (Extension Toxicology Network)Pesticide Information Profile. http://pmep.cce.cornell.edu/profiles/extoxnet/. Cornell Cooperative ExtensionOffices of Cornell University, Ithaca, NY. September 30, 1998.
Cross, D.H. & K.L. Fleming. 1989. Control of Phragmites or common reed. U.S. Fish and WildlifeService, Waterfowl Management Handbook, Fish and Wildlife Leaflet 13.4.12.
Eastman, J. 1995. The Book of Swamp and Bog: Trees, Shrubs, and Wildflowers of Eastern FreshwaterWetlands. Stackpole Books, Mechanicsburg, PA. 237 pp.

96
Graneli, W. 1989. Influence of standing litter on shoot production in reed, Phragmites australis (Cav.)Trin. Ex. Steudel. Aquatic Botany 35: 99-109.
Hellings, S.E. & J.L. Gallagher. 1992. The effects of salinity and flooding on Phragmites australis. J.Applied Ecol. 29: 41-49.
Holt, E.R. & R. Buchsbaum. 1999. Bird use of Phragmites australis in coastal marshes of northernMassachusetts. In: Yale School of Forestry and Environmental Studies, Greater New England symposiumon the ecology of invasive species: Presentations, posters, and discussion of current scientific research oninvasive animals and plants of the New England region, February 27, 1999.
Institute for Ecosystem Studies. 1997. Compendium of Phragmites abstracts. Phragmites workshop,Millbrook, NY, April 29, 1997.
Jontos, R., Jr. & C.P. Allan. 1984. Test salt to control Phragmites in salt marsh restoration(Connecticut). Restoration and Management Notes 2: 32.
Magee, D.W. 1981. Freshwater Wetlands: A Guide to Common Indicator Plants of the Northeast. TheUniversity of Massachusetts Press, Amherst, MA. 245 pp.
Marks, M., B. Lapin, and J. Randall. 1994. Phragmites australis (P. communis). Threats,management, and monitoring. Natural Areas Journal 14: 285-294.
Rilling, C. 1998a. Tidal wetland restoration--Use of the herbicide Rodeo to control common reed.Technical report of the Connecticut Department of Environmental Protection, Office of Long Island SoundPrograms, April 17, 1998.
Rilling, C. 1998b. Tidal wetland restoration--Use of a surfactant with herbicide Rodeo to control commonreed. Technical report of the Connecticut Department of Environmental Protection, Office of Long IslandSound Programs, June 15, 1998.
Rozsa, R. 1995. Tidal Marshes of Long Island Sound: Ecology, History, and Restoration. Dreyer, G.D.& W.A. Niering, eds. Bulletin No. 34 of the Connecticut College Arboretum. December, 1995.
Rozsa, R. Undated. Common reed (Phragmites australis)--Invasive species profile. Office of LongIsland Sound Programs, Connecticut Department of Environmental Protection. Unpublished.
Thompson, D.J. & J.M. Shay. 1989. First-year response of a Phragmites marsh community to seasonalburning. Can. J. Bot. 67: 1448-1455.
Thompson, D.J. & J.M. Shay. 1985. The effects of fire on Phragmites australis in the Delta Marsh,Manitoba. Can. J. Bot. 63: 1964-1969.

97
Tiner, R.W., Jr. 1987. A Field Guide to Coastal Wetland Plants of the Northeastern United States. TheUniversity of Massachusetts Press, Amherst, MA.
Tiner, R. 1998. Managing common reed (Phragmites australis) in Massachusetts: An introduction tothe species and control techniques. Prepared by the U.S. Fish and Wildlife Services for MassachusettsWetlands Restoration and Banking Program, Executive Office of Environmental Affairs, Boston, MA,December 1998.
Van der Toorn, J. & J.H. Mook. 1982. The influence of environmental factors and management of standsof Phragmites australis. I. Effects of burning, frost, and insect damage on shoot density and shoot size.J. Applied Ecol. 19: 477-499.
Weinstein, M.P. 1996. Restoration of degraded salt marshes: The use of Rodeo for initial Phragmitescontrol. Prepared for the Public Service Electric and Gas Company Estuary Enhancement Program, NewJersey, July 10, 1996.
Weis, J.S., J.Tan, C. Cherilus, L. Dounacvskaia, & C. Peterman. 1999. Phragmites or Spartina ashabitat: do the estuarine species care? In: Yale School of Forestry and Environmental Studies, GreaterNew England symposium on the ecology of invasive species: Presentations, posters, and discussion ofcurrent scientific research on invasive animals and plants of the New England region, February 27, 1999.
Weisner, S.E.B. & W. Graneli. 1989. Influence of substrate conditions on the growth of Phragmitesaustralis after a reduction in oxygen transport to below-ground parts. Aquatic Botany 35: 71-80.
Yale School of Forestry and Environmental Studies. 1999. Greater New England symposium on theecology of invasive species: Presentations, posters, and discussion of current scientific research on invasiveanimals and plants of the New England region, February 27, 1999.


99
APPENDIX AFIELD AND REPORTING FORMS FOR RECOMMENDED SALT MARSH
RESTORATION MONITORING PROTOCOL


PROJECT INFORMATION
Project Name
Project Code
Project Location
Project Description(project rationale, work planned)
Responsible Party
Affiliation
Contact Information Address:
Telephone # :
Fax # :
Other Involved Parties(name, affiliation, telephone)
Please attach a site map showing photo stations, transects, quadrats, and bird observationlocation(s) labeled with their assigned codes.

MONITORING INFORMATION
Date of Monitoring
Time of Monitoring Began:_______________Concluded:_______________
Tide (please circle one)
High Tide / Ebbing / Low Tide / Flooding
Predicted low and high tides:
Time of tidal measurements:
Nearest tidal station:
Weather(temperature, wind, precipitation)
Monitor(s)(name, affiliation)
Type of Monitoring (please circle one)
Pre-Construction
As-built (4-5 weeks)
Annual Post-Construction: Year 1 / 2 / 3 / 4 / 5
Parameters Measured(please circle all that apply)
Vegetation
Sediment
Benthic Invertebrates
Birds
Other (please describe):
Photo Monitoring Conducted?(please indicate station codes)
Yes / No
Video Monitoring Conducted?(please provide brief description)
Yes / No

MONITORING PARAMETERS: QUADRATS
Quadrat 1a(______)
Quadrat 1b(______)
Quadrat 1c(______)
Stem Density
Mean Plant Height
Sediment Core Codes
Ribbed Mussel Count
Fiddler Crab Burrows
Other (please describe):
Quadrat 2a(______)
Quadrat 2b(______)
Quadrat 2c(______)
Stem Density
Mean Plant Height
Sediment Core Codes
Ribbed Mussel Count
Fiddler Crab Burrows
Other (please describe):
Quadrat 3a(______)
Quadrat 3b(______)
Quadrat 3c(______)
Stem Density
Mean Plant Height
Sediment Core Codes
Ribbed Mussel Count
Fiddler Crab Burrows
Other (please describe):
Please attach sediment core analyses when lab work has been completed.

MONITORING PARAMETERS: TRANSECTS
Transect 1 (_______)
seaward landward
distance ____ distance 0
Notes:
Transect 2 (_______)
seaward landward
distance ____ distance 0
Notes:
Transect 3 (_______)
seaward landward
distance _____ distance 0
Notes:

MONITORING PARAMETERS: BIRD OBSERVATION
Species Abundance Location Activity Duration of Stay
Notes:

FIELD NOTES

107
APPENDIX BWORLD WIDE WEB RESOURCES RELEVANT FOR SALT MARSH RESTORATION


109
1. New York State Department of Environmental Conservation (NYS DEC) Regulatory Information
http://www.dec.state.ny.us/website/dcs/permits_level2.html
Information and application materials for NYS DEC permits can be found at this address. Tidalwetlands permit information is found in the Uniform Procedures Act (UPA) Permits section.
2. New York State Assembly Consolidated Laws: Environmental Conservation
http://assembly.state.ny.us/cgi-bin/claws?law=37
Links to text of Articles 1-72 and associated Titles of New York State Consolidated Law. Article25 is the Tidal Wetlands Act.
3. New York State Department of State Division of Coastal Resources
http://www.dos.state.ny.us/cstl/cstlwww.html
Information on New York’s Coastal Management Program Policies, Local WaterfrontRevitalization Programs (LWRPs), and the Environmental Protection Fund (EPF) is available atthis address.
4. Environmental Protection Agency (EPA) Office of Water Office of Wetlands, Oceans andWatersheds (OWOW)
http://www.epa.gov/owow/
This site contains information on wetland restoration, volunteer monitoring, water quality,watersheds, marine pollution and debris, and a variety of other topics.
5. United States Fish and Wildlife Service (USFWS) Division of Habitat Conservation NationalWetlands Inventory
http://www.nwi.fws.gov/
The NWI site provides downloadable data, map coverage and availability, and other information.
6. National Oceanic and Atmospheric Administration (NOAA) National Ocean Service (NOS)Center for Operational Oceanographic Products and Services (CO-OPS)
http://www.opsd.nos.noaa.gov/
This site provides tables of tide predictions, water level observations, and other data.

110
7. NOAA National Marine Fisheries Service (NMFS) Office of Habitat Conservation
http://www.nmfs.gov/habitat/index.html
This page links to the Habitat Restoration Center and to information on Essential Fish Habitat(EFH), wetlands, and other topics.
8. Coastal America Partnership National Web Site
http://www.csc.noaa.gov/coastalamerica/
This site provides habitat restoration project summaries and contact information for regionalCoastal America partners.
9. United States Department of Agriculture (USDA) Natural Resources Conservation Service(NRCS) Wetland Science Institute
http://www.pwrc.usgs.gov/wli/
The WLI site has national practice standards and technical notes for wetland restoration, andinformation on wetland assessment, delineation, and training.
10. United States Army Corps of Engineers (USACE) Waterways Experiment Station (WES)Environmental Laboratory
http://www.wes.army.mil/el/homepage.html
Under “Research Areas and Programs” there are links to USACE pages on environmentalrestoration, wetlands, dredged materials management, and other topics.
11. USDA NRCS New Hampshire
http://www.nh.nrcs.usda.gov/what_rest.htm
Under “Ecosystem Restoration”, there is good background information, with pictures, on salt marshimpacts, as well as project profiles, a report on evaluating restorable salt marshes, and otherinformation.
12. Parker River Clean Water Association (Byfield, MA) Tidal Crossing Handbook
http://www.parker-river.org/tides/Handbook/

111
This is a manual guiding volunteer-based tidal restriction assessment programs, containing goodbackground information and pictures.
13. National Estuarine Research Reserve Estuary-Net Project
http://inlet.geol.sc.edu/estnet.html
This site is mainly about volunteer-based nonpoint pollution monitoring, but contains goodbackground information on estuarine ecology, lists of monitoring equipment, and field datacollection forms.
14. The Nature Conservancy Wildland Weeds Management and Research Program
http://tncweeds.ucdavis.edu/esadocs/phraaust.html
This site provides pictures and HTML, Adobe, and Word versions of the Phragmites australisElement Stewardship Abstract.
15. Environment Canada Ecological Monitoring and Assessment Network
http://www.cciw.ca/eman-temp/research/protocols/marine/
This site documents marine and estuarine biodiversity monitoring protocols used by EnvironmentCanada to assess fishes, phytoplankton, benthic organisms, seabirds, and other parameters.
16. Massachusetts Coastal Zone Management Wetland Ecology and Assessment Website
http://www.state.ma.us/czm/wastart.htm
The MCZM site provides information on wetland ecology and function, habitat assessment, andecological indicators.


113
APPENDIX CRESTORATION PROJECT TIMELINE


115
Hypothetical Timeline for a Restoration Project
Project Planning (Months 1-6)
< Define goals and objectives of the restoration project, and articulate site constraints. < Contact knowledgable groups (e.g., National Estuary Programs) and State agencies for information
about restoration planning in the project area. < Research the history of the proposed restoration site through aerial photography, historical
photography, tax map records, and other resources.< Develop a draft restoration plan and appropriate monitoring protocol.
Permit Applications (Months 3-7)
< Contact permit staff in the proposed project area for pre-application assistance, includingrepresentatives of:C New York State Department of Environmental ConservationC United States Army Corps of EngineersC New York State Department of State Coastal Resources.
< Apply for required permits and approvals, including but not necessarily limited to: C Article 25 Tidal WetlandsC Clean Water Act Section 404C Federal Consistency Certification.
Project Design (Months 5-9)
< Conduct site surveys, including elevations, hydrology, soil sampling, vegetation, wildlife and otherparameters as appropriate.
< Draw site maps showing vegetation zones and locations and codes for transects, quadrats, wildlifeobservation points, and photostations.
< Develop final restoration plan and construction documents.
Funding applications (Months 1-9)
< Apply for project planning or implementation funding if applicable.
Project Implementation (Months 9-12)
< Conduct pre-project monitoring prior to site manipulation or construction (see Monitoringtimeline).
< Conduct implementation tasks as specified in the restoration plan.

116
Monitoring
Pre-Project Monitoring (within one year prior to project implementation)
Jan Feb Mar Apr Ma Jun Jul Aug* Sep Oct Nov De
Vegetation
Soil
Benthos
Waders
Waterfowl
Photo
Conting.
* August/September parameters need to be monitored once during this period, i.e., in either late Augustor early September
As-Built Monitoring (four to five weeks after site manipulation or construction)
Photos should be taken at all photomonitoring stations. Additional parameters may be assessed at thediscretion of the Responsible Party or Regulator. Corrective measures may be developed.
Post-Project Monitoring (annually for five years after site manipulation or construction)
Jan Feb Mar Apr Ma Jun Jul Aug* Sep Oct Nov De
Vegetation
Soil
Benthos
Waders
Waterfowl
Photo
Conting. **
* August/September parameters need to be monitored once during this period, i.e., in either late Augustor early September
** Contingency monitoring should be conducted once during March/April, and as often as necessarythroughout the year, e.g., after winter storms, hurricanes, or other natural disasters
117
APPENDIX DFEDERAL AND STATE LAWS AND REGULATIONS
RELATED TO WETLAND RESTORATION AND MANAGEMENT


119
FEDERAL
National Environmental Policy Act (NEPA) of 1969. The Act established a program for reviewing theenvironmental impacts of activities that fall within the jurisdiction of any federal agency. Under NEPA, thereview of agency actions can require the drafting of an Environmental Assessment (EA) or anEnvironmental Impact Statement (EIS). These documents are the tools by which potential environmentaleffects of actions are identified and alternatives to the proposed actions evaluated (Silverberg andDennison, 1993).
U.S. Environmental Protection Agency (USEPA). The USEPA administers and enforces federalenvironmental laws including NEPA, and the Federal Water Pollution Control Act (FWPCA) of 1972,more commonly known as the Clean Water Act (CWA). § 404 of the FWPCA was enacted to controlpollution from discharges of dredged or fill materials into waters of the United States (Kruczynski, 1990).Wetlands are protected because they are defined as waters of the U.S.
U.S. Army Corps of Engineers (USACE). Most New York State salt marshes are within USACE NewYork District jurisdiction. The USACE implements § 10 of the Rivers and Harbor Act of 1899 (RHA).Generally, the RHA requires that a landowner secure a § 10 permit from the USACE before building awharf, pier or other structure in any water of the United States outside established harbor lines.
Under the § 404 program, the USEPA and the USACE have concurrent authority over the dredging andfilling of waters of the U.S., including wetlands (Silverberg and Dennison, 1993). The USACE is the permitauthority for the program while the USEPA is responsible for developing the environmental guidelines usedby the USACE in its permit decisions.
To implement objectives of the CWA, a Memorandum of Agreement (MOA) between the USEPA andthe Department of the Army describes the sequence of impact avoidance, minimization, and compensationnecessary to demonstrate compliance with § 404 guidelines. The MOA is a directive for USACE andUSEPA staff and must be adhered to when considering mitigation requirements for permitted activities thatwill adversely affect wetlands.
National Park Service (NPS). The NPS manages a number of federal facilities that are within the marineand estuarine districts of New York State, including the Gateway National Recreation Area and Fire IslandNational Seashore. The NPS is formulating a technically-sound, habitat-specific monitoring andmanagement plan for the Fire Island National Seashore (NYSGI, 1993).
U.S. Fish and Wildlife Service (USFWS). The USFWS has the regulatory authority, derived from Title50 of the Code of Federal Regulations, to control most activities within the boundaries of National WildlifeRefuges. The Emergency Wetlands Resources Act of 1986 charged the USFWS to develop a NationalWetlands Priority Conservation Plan to identify wetlands that should be acquisition priorities. It alsodirects the USFWS to continue the NWI mapping project (USDOI, 1989).

120
The Cortland, New York, field office of the USFWS reviews projects within the marine and estuarinedistricts of New York State requiring USACE permits. If it is determined that a proposed action willimpact wildlife, endangered species, or habitat, the USFWS can recommend mitigation measures to ensurethe continued existence and protection of the resource.
National Marine Fisheries Service (NMFS). This research and applied science agency is charged withthe protection and enhancement of fishery resources and their habitats. Responsibilities for wetlandsinclude review and analysis of proposed activities seaward of the high tide line and special projectsinvolving headwaters.
In 1986, the U.S. Department of the Interior, through the USFWS, and the U.S. Department ofCommerce, through the NMFS, established procedures to ensure that federal actions do not jeopardizeendangered or threatened species, or modify or destroy their habitat.
Federal Emergency Management Agency (FEMA). FEMA administers the National Flood InsuranceProgram. The program benefits wetlands by designating "floodways", by that means restrictingdevelopment within these areas, and by encouraging the preservation of open space by offering favorableflood insurance rates (WWF, 1995).
Coastal Zone Management Act of 1972 (CZMA). The U.S. Congress enacted the CZMA, and itssubsequent amendments, to address coastal environmental problems, including the degradation of wetlandvalues and functions. While recognizing a need for development, the CZMA encourages state regulationof activities in the coastal zone, and uses financial aid and federal consistency as incentives to merge nationalgoals into state programs (Silverberg and Dennison, 1993). The main focus of the CZMA is for each stateto resolve for its own area the basic choices among competing uses for finite resources; in other words, todraft its own coastal zone management (CZM) plan. A draft CZM must be approved by the secretary ofcommerce. New York State has an approved CZM plan. CZMA Reauthorization Amendments requireeach state with a federally approved coastal zone management (CZM) program to develop a CoastalNonpoint Pollution Control Program to implement coastal land use management measures for controllingnonpoint source pollution (Silverberg and Dennison, 1993).
Coastal Barrier Resources Act of 1982 (CBRA). This program uses the denial of federal assistanceessentially as a scheme to discourage new development in ecologically significant coastal areas. Wetlandsbenefit because protected barrier beaches buffer them from destructive storms.
NEW YORK STATE
State Environmental Quality Review Act (SEQR). Through SEQR, New York State has establisheda process that requires the consideration of environmental factors early in the planning stages of proposedactions involving local, regional and state agencies (NYSDEC, 1992). Like many other states, the lawclosely follows the provisions of NEPA (Silverberg and Dennison, 1993), and it is possible to jointlycoordinate SEQR and NEPA reviews.

121
Just about all agencies of government are independently responsible to ensure that their discretionarydecisions are consistent with the Act. Actions involving wetlands alteration, regulation, or adjacent landuse may be subject to SEQR. The regulations have been amended to require agency actions to beconsistent with coastal policies. Specific actions in the coastal area must comply with standards of NewYork State's Waterfront Revitalization and Coastal Resources Act.
New York State Department of Environmental Conservation (NYSDEC). This agency protectsfreshwater and tidal wetlands in New York State through its regulatory, management, and acquisitionprograms. It is important to recognize that the freshwater wetland (FW) program and the tidal wetlands(TW) program are separate and distinct. Each is empowered by unique legislation and regulation, andprogram goals do differ. The FW program seeks no net loss of wetlands, while the TW program desiresto achieve a net increase of tidal wetlands.
The TW program has inventoried and mapped all tidal wetlands within New York State's Marine Districtand instituted a regulatory scheme to protect and conserve them. The NYSDEC governs activitiesconducted within or adjacent to tidal wetlands according to the provision of the Tidal Wetlands Land UseRegulations. Jurisdiction can extend as much as 300 feet landward of the tidal wetland boundary.
The FW program has inventoried and mapped Long Island's freshwater wetland resource. And like theTW program, the NYSDEC protects the resource through a permit program. Unlike the TW program,a procedure exists that allows local government to assume responsibility for the protection of its freshwaterwetlands.
In 1990, the New York State Legislature amended Articles 24 and 25 of the Environmental ConservationLaw, enabling the NYSDEC Freshwater and Tidal Wetlands programs to create the Adopt-A-Wetlandstewardship program. Interested parties can adopt a state owned wetland and perform management,stewardship, or education activities. Only two adoptions have taken place to date (NYSDEC, 1995).
Coastal Erosion Hazard Areas Program (CEHA). New York State regulations have been adoptedto control certain activities and development in mapped coastal erosion hazard areas. Implemented byNYSDEC, their regulatory authority may be delegated to municipalities that develop comparable programs.Within coastal erosion hazard areas, construction or placement of a structure, or any action or use of theland which would materially alter its condition, requires a permit from the NYSDEC, or in the case ofprogram delegation, county or local government. CEHA's include natural protective features such asbeaches and dunes, sandbars and spits, barrier bays and islands, and wetlands, including associated naturalvegetation.
Use and Protection of Waters Program. Also known as the Stream Protection Program. Article 15of New York State's Environmental Conservation Law (ECL) provides is the legislative basis for regulatingthe construction or repair of water impoundment structures, and any disturbance of a stream bed, its banks,or any excavation or fill of navigable waters. Regulated activities include the construction and placement

122
of docks and moorings, the maintenance of dams, and the placing of piles and piers. Jurisdiction includesnavigable waters and extends to waters that have been classified according to their best use. Theexcavation or filling of areas within jurisdiction requires a permit. Wetlands and areas adjacent areprotected.
State Pollutant Discharge Elimination System (SPDES). NYSDEC regulates discharges into surfaceand ground waters from industrial, commercial, and municipal users, and those of certain residentialsubdivisions as well. Discharges are reviewed in light of the existence of wetlands. NYSDEC's technicaloperational guidance states that it is generally unacceptable to discharge untreated stormwater to naturallyoccurring wetlands.
Water Quality Certification Program. § 401 of the CWA gave the states the prerogative and authorityto regulate water quality within their borders. The NYSDEC is normally the approving authority in NewYork State. § 401 requires that any applicant for a federal license or permit to conduct any activity thatmay result in any discharge into navigable waters must obtain a water quality certification from the state inwhich the discharge will originate. So, actions requiring a § 404 permit will first need § 401 certification.Water Quality Certifications are usually tied to Protection of Water permits, Tidal Wetlands permits, andFreshwater Wetland permits.
NYSDEC has received an Environmental Protection Agency grant to develop water quality standardswhich would provide greater protection to wetlands. NYSDEC began drafting these standards in late1995. They will be incorporated into New York State's water quality certification program when finalized. Flood Control Program. The Flood Control Program is designed to achieve the reduction of flooddamages to public and natural resources. The program preserves areas which benefit water quality ormaintain biota, protects natural integrity of water bodies and drainage systems, and limits destruction ofnatural conveyance systems, if such areas coincide with flood control projects designed primarily for floodprotection. Restrictions placed on development in flood plains offer a degree of protection to wetlands.The program is administered by the NYSDEC.
Endangered Species Program. The program is administered by the NYSDEC, and pursuant to the StateEndangered Species Act, is responsible for protection of federal and state listed endangered and threatenedspecies. A large number of these species are associated with wetlands.
Natural Heritage Program. Established by The Nature Conservancy (TNC) and now jointly funded bythem and the NYSDEC, the program's major purpose is to inventory the rare plants, animals, and naturalcommunities of New York State. A database of occurrences is maintained and the information is used byNYSDEC and other agencies in permit application review.
Wild, Scenic and Recreational Rivers System. The program applies to land use, development, orsubdivision of private lands, within designated wild, scenic and recreational river areas. A river area

123
includes the river and the land area in the river's immediate environs, not exceeding the width of one-halfmile from each bank of the river. Rivers and their immediate river area possessing outstanding natural,ecological, recreational, aesthetic, cultural, archeological and scientific values, are eligible for specialprotection under this program.
New York State Department of State (NYSDOS). New York State's Coastal Management Program(CMP) is administered by the NYSDOS Division of Coastal Resources. The CMP was developedpursuant to the Coastal Zone Management Act of 1972 and approved in 1982. State Executive LawArticle 42 declares that it is the public policy of the State within its coastal area to "...conserve and protectfish and wildlife and their habitats...preventing permanent adverse changes to ecological systems...." TheCMP ties together the numerous programs of State agencies including the protection and use of coastalresources to ensure, in part, that all State and federal actions in the coastal area comply with enforceablepolicies and purposes of the CMP.
Whenever an activity is subject to State or federal consistency with the CMP, the effects of the activity mustbe evaluated against the preservation and protection of tidal and freshwater wetlands and their benefits, andSignificant Coastal Fish and Wildlife Habitats.
Significant Coastal Fish and Wildlife Habitats (SCFWH). Based on a quantitative evaluation ofecological factors, significant coastal fish and wildlife habitats are designated and mapped by NYSDOS.Activities within and outside a SCFWH are held to strict standards to prevent impairments to theirimportant habitat functions or values. Approximately 120 SCFWH's have been designated in the marineand estuarine districts of New York State. The CMP SCFWH policy states that significant coastal fishand wildlife habitats will be protected, preserved, and where practical, restored so as to maintain theirviability as habitats.
New York State Office of General Services (OGS). OGS manages all state-owned underwater landsand formerly underwater lands to the last known location of mean high water. Under the Public LandsLaw, most private uses of State land requires a grant, easement, or lease from OGS. Most underwaterlands, and lands formerly underwater to the last known location of mean high water, along the AtlanticOcean, in New York City, in Long Island Sound, and in the Peconic Bays are owned by the State, whileon Long Island most underwater lands within harbors and inshore bays are owned by towns. Many of theunderwater lands managed by OGS are seaward of tidal wetlands. OGS can play an important role inwetland protection by limiting coveyances of underwater lands for uses that will maintain their biologicalproductivity.


125
APPENDIX EKNOWLEDGEABLE CONTACTS


127
New York State Agencies
Department of State
Division of Coastal ResourcesNew York State Department of State41 State Street, 8th FloorAlbany, NY 12231telephone: 518-474-6000internet: http://dos.state.ny.us/cstl/cstlwww.html
Department of Environmental Conservation
Bureau of Marine Resources Headquarters New York State Department of State205 North Belle Mead Road, Suite 1East Setauket, New York 11733telephone: 631-444-0430 internet: http://www.dec.state.ny.us/website/dfwmr/marine/index.htm
Division of Fish, Wildlife and Marine Resources-HeadquartersNew York State Department of Environmental Conservation50 Wolf Road Albany, NY 12233 telephone: 518-457-5690internet: http://www.dec.state.ny.us/website/dfwmr/xoa1e.htm#central
Division of Environmental Permits-HeadquartersNew York State Department of Environmental Conservation 50 Wolf Road, Room 423 Albany, NY 12233telephone: 518-457-6180
Region One-Nassau and Suffolk CountiesNew York State Department of Environmental ConservationSUNY-Building 40Stony Brook, NY 11790telephone: 631-444-0354internet: http://www.dec.state.ny.us/website/reg1/index.html
128
Regional Permit Administrator, Region OneDivision of Environmental Permits New York State Department of Environmental Conservation SUNY at Stony Brook Campus Loop Road Building 40, Room 121 Stony Brook NY 11790telephone: 516-444-0365internet: http://www.dec.state.ny.us/website/dcs/EP_REGIONS/region1.html
Region Two-Bronx, Kings, New York, Queens, and Richmond CountiesNew York State Department of Environmental ConservationOne Hunter’s Point Plaza47-40 21st StreetLong Island City, NY 11101telephone: 718-482-4900internet: http://www.dec.state.ny.us/website/reg2/index.html
Regional Permit Administrator, Region TwoDivision of Environmental PermitsNYS Department of Environmental ConservationOne Hunter’s Point Plaza47-40 21st StreetLong Island City, NY 11101telephone: 718-482-4997 internet: http://www.dec.state.ny.us/website/dcs/EP_REGIONS/region2.html
Region Three-Sullivan, Ulster, Orange, Dutchess, Putnam, Rockland and Westchester CountiesNew York State Department of Environmental Conservation21 South Putt Corners RoadNew Paltz, NY 12561telephone: 914-256-3000internet: http://www.dec.state.ny.us/website/reg3/index.html
Regional Permit Administrator, Region ThreeDivision of Environmental PermitsNYS Department of Environmental Conservation21 South Putt Corners RoadNew Paltz, NY 12561telephone: 914-256-3054 internet: http://www.dec.state.ny.us/website/dcs/EP_REGIONS/region3.html

129
Federal Agencies
United States Fish and Wildlife Service
Southern New England-New York BightCoastal Ecosystems Program U.S. Fish and Wildlife Service Shoreline Plaza, Route 1A P.O. Box 307 Charlestown, RI 02813 telephone: 401-364-9124 internet: http://www.fws.gov/r5snep/snep1.htm
Long Island National Wildlife Refuge ComplexU.S. Fish and Wildlife ServiceP.O. Box 2121 Smith Road (Express Mail Only)Shirley, NY 11967telephone: 516-286-0485internet: http://northeast.fws.gov/
Long Island Field OfficeU.S. Fish & Wildlife ServiceP.O. Box 608Islip, NY 11751telephone: 516-581-2941internet: http://northeast.fws.gov/
National Wetlands Inventory-Region 5U. S. Fish and Wildlife Service300 Westgate Center DriveHadley, MA 01035telephone: 413-253-8620internet: http://www.nwi.fws.gov/
National Oceanic and Atmospheric Administration
NOAA Restoration CenterNational Marine Fisheries ServiceF/HC3 1315 East-West HighwaySilver Spring, MD 20910telephone: 301-713-0174 internet: http://www.nmfs.gov/habitat/restoration/nspage.html
130
Habitat Conservation DivisionNortheast Regional OfficeNOAA Restoration CenterNational Marine Fisheries ServiceOne Blackburn DriveGloucester, MA 01930telephone: 978-281-9251internet: http://www.wh.whoi.edu/ro/doc/nero.html
Environmental Protection Agency
Region 2-New York, New Jersey, Puerto Rico, U.S. Virgin IslandsUnited States Environmental Protection Agency290 BroadwayNew York, NY 10007telephone: 212-637-3000internet: http://www.epa.gov/Region2/index.html
United States Department of Agriculture
Riverhead Service CenterNatural Resources Conservation ServiceUnited States Department of AgricultureRiverhead County CenterRoom N-210Riverhead, NY 11901telephone: 631-727-2315internet: http://www.nrcs.usda.gov/
Highland Service CenterNatural Resources Conservation ServiceUnited States Department of Agriculture652 Route 299Highland, NY 12528telephone: 914-883-7162internet: http://www.nrcs.usda.gov/
Millbrook Service CenterNatural Resources Conservation ServiceUnited States Department of AgricultureFarm & Home Center Route 44Millbrook, NY 12545telephone: 914-677-3952internet: http://www.nrcs.usda.gov/

131
National Estuary Programs
Long Island Sound Study
EPA LIS Office-New YorkMarine Science Research CenterSUNY Stony BrookStony Brook, NY 11794telephone: 631-632-9216internet: http://www.epa.gov/region01/eco/lis/
EPA LIS Office-ConnecticutStamford Government Center888 Washington BoulevardStamford, CT 06904(203) 977-1541internet: http://www.epa.gov/region01/eco/lis/
New York/New Jersey Harbor Estuary Program
US EPA Region 2 290 Broadway 24th Floor New York, NY 10007telephone: 212-637-3809internet: http://www.hudsonriver.org/hep/
New Jersey Department of Environmental ProtectionDivision of Watershed ManagementP.O. Box 418Trenton, NJ 08625-0418telephone: 609-633-7242internet: http://www.hudsonriver.org/hep/
Peconic Estuary Program
Office of EcologySuffolk County Department of Health ServicesRiverhead County CenterRiverhead, NY 11901telephone: 631-852-2077internet: http://www.co.suffolk.ny.us/health/pep/

132
New York State Estuary Programs
Hudson River Estuary Program
Region 3-Dutchess, Orange, Putnam, Rockland, Sullivan, Ulster and Westchester CountiesNew York State Department of Environmental Conservation21 South Putt Corners RoadNew Paltz, New York 12561 telephone: 914-256-3016internet: http://www.dec.state.ny.us/website/hudson/hrep.html
South Shore Estuary Reserve
Division of Coastal ResourcesNew York State Department of State41 State Street Albany, NY 12231telephone: 518-474-6000internet: http://dos.state.ny.us/cstl/cstlwww.html
South Shore Estuary Reserve Council225 Main Street, Suite 2Farmingdale, NY 11735telephone: 631-470-BAYS (2297)
National Estuarine Research Reserves
Hudson River National Estuarine Research Reserve
NYS Department of Environmental Conservation c/o Bard College Field Station Annandale, NY 12504telephone: 914-758-5193internet: http://www.ocrm.nos.noaa.gov/nerr/reserves/nerrhudsonriver.html
Miscellaneous Contacts
New York City Parks and Recreation Department
Natural Resources GroupNew York City Parks and RecreationArsenal North, 1234 Fifth AvenueNew York, NY 10029telephone: 212-360-1417internet: http://www.ci.nyc.ny.us/html/dpr/html/boomer.html

133
Cornell Cooperative Extension
Cornell Cooperative Extension Marine Program3690 Cedar Beach RoadSouthold, NY 11971telephone: 631-852-8660internet: http://www.cce.cornell.edu/suffolk/index.html
New York Sea Grant
New York Sea Grant Extension ProgramCornell University348 Roberts HallIthaca, NY 14853telephone: 607-255-2832internet: http://www.seagrant.sunysb.edu/
New York Sea GrantSUNY at Stony Brook146 Suffolk HallStony Brook, NY 11794-5002telephone: 631-632-8730internet: http://www.seagrant.sunysb.edu/
New York Sea GrantCornell University Laboratory3029 Sound AvenueRiverhead, NY 11901telephone: 631-727-3910internet: http://www.seagrant.sunysb.edu/
New York Sea Grant10 Westbrook LaneKingston, NY 12401telephone: 845-340-3983internet: http://www.seagrant.sunysb.edu/


135
APPENDIX FACKNOWLEDGMENTS


Many individuals contributed to the development of the Salt Marsh Restoration and Monitoring Guidelinesand their assistance has been greatly appreciated. I offer a profound thank you to everyone listed on thispage.
Lisa Holst, New York State Department of Environmental Conservation, Division of Fish, Wildlife andMarine Resources, contributed to and carefully reviewed several versions of this document and coordinatedall DEC staff comments. Her efforts and input were critical to the successful completion of the Salt MarshRestoration and Monitoring Guidelines. A number of other DEC staff were helpful in the development ofthese guidelines: Karen Chytalo, Central Office, East Setauket; Steve Zahn, Region Two; and KarenGraulich, Region One.
Andrew Bergen and Carl Alderson, New York City Department of Parks and Recreation NaturalResources Group, developed and provided the original monitoring protocol, upon which the current versionis based.
Substantial input was provided by several individuals, including: Chris Pickerell, Cornell CooperativeExtension Marine Program; Chris Rilling, Connecticut Department of Environmental Protection; Ted Diers,New Hampshire Coastal Program; Dr. Christopher Deacutis, Narragansett Bay Estuary Program; andGregory Capobianco, New York State Department of State Division of Coastal Resources. Several otherDivision of Coastal Resources staff provided a thorough review of early drafts of this document, including:William Barton, Walter Meyer, Vance Barr, Michael Corey, Jeffrey Zappieri, Sally Ball, Steven Resler,and Thomas Hart.
A number of others offered extremely useful suggestions and editorial commentary on the Review Draft,including: Dr. William Wise, Marine Sciences Research Center, SUNY Stony Brook; Stephen Seymour,Lawler, Matusky and Skelly Engineers; Michael Donnelly, Ecology and Environment, Inc.; Robert Alpern,New York City Department of Environmental Protection; Bernard Blum, Friends of Rockaway; JanithTaylor, U.S. Fish and Wildlife Service, Great Bay National Wildlife Refuge, Newington, NH; MarilynJordan, The Nature Conservancy, Long Island Chapter; and Richard Groh, Town of Babylon, NY.
Expressions of support regarding the Review Draft from Marc Matsil, New York City Department ofParks and Recreation Natural Resources Group; Omie Medford-Ryan, New York City Department ofCity Planning; Kevin Burns, New York State Office of Parks, Recreation and Historic Preservation; DavidStilwell, U.S. Fish and Wildlife Service, Cortland, NY; and James Byrne and Karl Leupold, Departmentof Public Works, Town of Oyster Bay, NY were also appreciated.
General thanks to all New York State Department of State Division of Coastal Resources staff for theirassistance and support during the 1997-1999 Coastal Management Fellowship; to Jan Kucklick and PaulScholz at NOAA Coastal Services Center, Charleston, SC for ongoing participation in Fellowshipactivities; and to Stefanie Massucci and other staff at New York Sea Grant, SUNY Stony Brook foradministration of the Fellowship.