Embed Size (px)
Citation preview

1 2012 IECC AS COMPARED TO THE 2009 IECC
New York Energy and Cost Savings for New Single– and Multifamily Homes: 2012 IECC as Compared to the 2009 IECC
BUILDING TECHNOLOGIES PROGRAM
2 2012 IECC AS COMPARED TO THE 2009 IECC
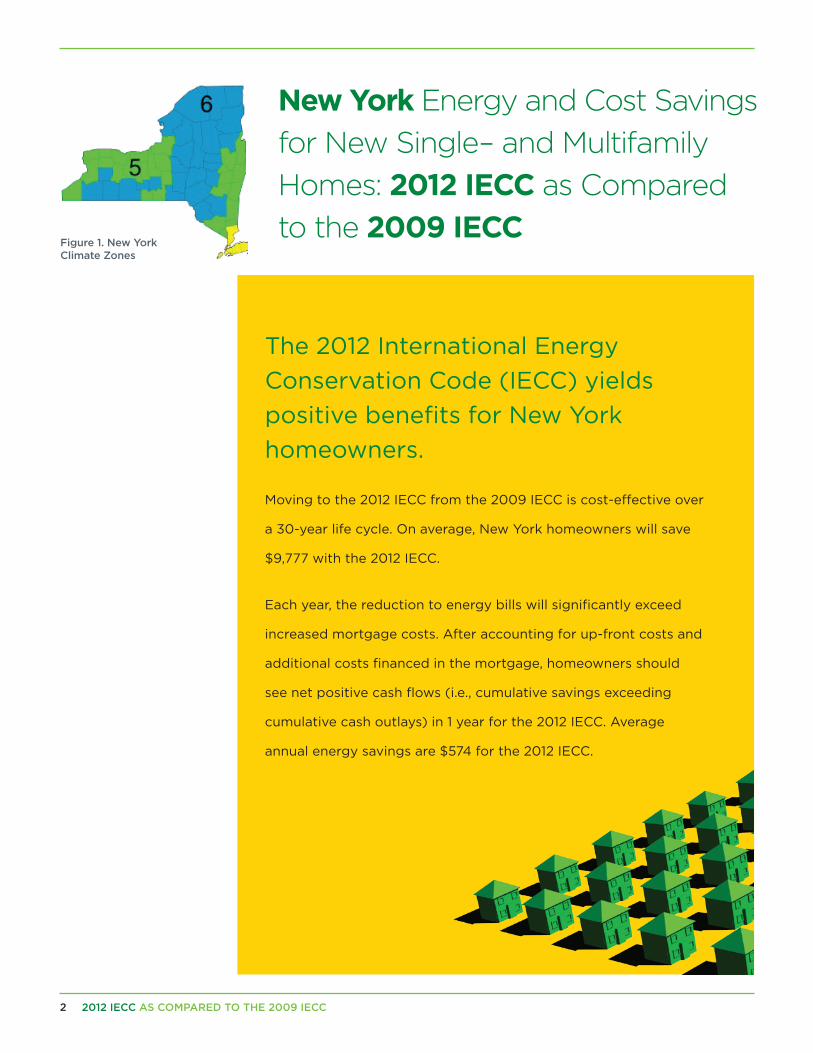
New York Energy and Cost Savings for New Single– and Multifamily Homes: 2012 IECC as Compared to the 2009 IECC
The 2012 International Energy Conservation Code (IECC) yields positive benefits for New York homeowners.
Moving to the 2012 IECC from the 2009 IECC is cost-effective over
a 30-year life cycle. On average, New York homeowners will save
$9,777 with the 2012 IECC.
Each year, the reduction to energy bills will significantly exceed
increased mortgage costs. After accounting for up-front costs and
additional costs financed in the mortgage, homeowners should
see net positive cash flows (i.e., cumulative savings exceeding
cumulative cash outlays) in 1 year for the 2012 IECC. Average
annual energy savings are $574 for the 2012 IECC.
Figure 1. New York Climate Zones

32012 IECC AS COMPARED TO THE 2009 IECC
HighlightsCost-effectiveness against a 2009 IECC baseline:
• Life-cycle cost savings, averaged across climate zones and building types, are $9,777 for the 2012 IECC
• Simple payback period is 3.2 years for the 2012 IECC
Consumer savings compared to a 2009 IECC baseline:
• Households save an average of $574 per year on energy costs with the 2012 IECC
• Net annual consumer savings, including energy savings, mortgage cost increases, and other associated costs in the first year of ownership average $467 for the 2012 IECC
• Energy costs, on average, are 26.9% lower for the 2012 IECC
Cost-EffectivenessThe U.S. Department of Energy (DOE) evaluates the energy codes based on three measures of cost-effectiveness:
• Life-Cycle Cost: Full accounting over a 30-year period of the cost savings, considering energy savings, the initial investment financed through increased mortgage costs, tax impacts, and residual values of energy efficiency measures
• Cash Flow: Net annual cost outlay (i.e., difference between annual energy cost savings and increased annual costs for mortgage payments, etc.)
• Simple Payback: Number of years required for energy cost savings to exceed the incremental first costs of a new code
Life-cycle cost is the primary measure by which DOE assesses the cost-effectiveness of the IECC. These savings assume that initial costs are mortgaged, that homeowners take advantage of the mortgage interest deductions, and that long-lived efficiency measures retain a residual value after the 30-year analysis period. As shown in Table 1, life-cycle cost savings averaged across climate zones are $9,777 for the 2012 IECC.
Life-Cycle Cost Savings ($)
Net Positive Cash Flow (Years)
Simple Payback (Years)
2012 IECC $9,777 1 3.2
Table 1. Average Life-Cycle Cost Savings from Compliance with the 2012 IECC, Relative to the 2009 IECC

4 2012 IECC AS COMPARED TO THE 2009 IECC
BUILDING TECHNOLOGIES PROGRAMFor information on Building Energy Codes, visit www.energycodes.gov
For more information on how these estimates were developed, visit the DOE Building Energy Codes website: www.energycodes.gov/development/residential
The U.S. Department of Energy (DOE) provides estimates of energy and cost savings from code adoption:
• National: Energy cost savings (only)
• Climate Zone: Energy cost savings, life-cycle cost savings, and consumer cash flows
• State: Energy cost savings, life-cycle cost savings, consumer cash flows, and simple paybacks
EERE Information Center1-877-EERE-INFO (1-877-337-3463)www.eere.energy.gov/informationcenter
September 2012 PNNL-21775
Consumer SavingsAnnual consumer cash flows impact the affordability of energy-efficient homes. Based on this analysis, New York homeowners, on average, should see annual energy cost savings of $574 and achieve a net cumulative savings
Consumers’ Cash Flow (Average) 2012 IECC
A Down payment and other up-front costs
$198
B Annual energy savings (year one) $574
C Annual mortgage increase $107
D Net annual cost of mortgage interest deductions, mortgage insurance, and property taxes (year one)
$0
E = [B-(C+D)] Net annual cash flow savings (year one)
$467
F = [A/E] Years to positive savings, including up-front cost impacts
1
that accounts for an increased down payment in addition to energy costs, mortgage costs, and tax-related costs and benefits in 1 year when comparing the 2012 IECC to the 2009 IECC. Table 2 summarizes these results.
Table 2. Impacts to Consumers’ Cash Flow from Compliance with the 2012 IECC Compared to the 2009 IECC

A.1 September 2012
Technical Appendix A Methodology
An overview of the methodology used to calculate these impacts is provided below. Further information as to how these estimates were developed is available at the U.S. Department of Energy’s (DOE) Building Energy Codes website.1 Cost-Effectiveness Pacific Northwest National Laboratory (PNNL) calculated three cost-effectiveness metrics in comparing the 2012 International Energy Conservation Code (IECC) and the 2009 IECC. These are:
· Life-Cycle Cost (LCC): Full accounting over a 30-year period of the cost savings, considering energy savings, the initial investment financed through increased mortgage costs, tax impacts, and residual values of energy efficiency measures
· Cash Flow: Net annual cost outlay (i.e., difference between annual energy cost savings and increased annual costs for mortgage payments, etc.)
· Simple Payback: Number of years required for energy cost savings to exceed the incremental first costs of a new code
LCC is a robust cost-benefit metric that sums the costs and benefits of a code change over a specified time period. LCC is a well-known approach to assessing cost-effectiveness. DOE uses LCC for determining the cost-effectiveness of code change proposals, and for the code as a whole, because it is the most straightforward approach to achieving the desired balance of short- and long-term perspectives. The financial and economic parameters used for these calculations are as follows:
· New home mortgage parameters: o 5.0% mortgage interest rate (fixed rate) o Loan fees equal to 0.7% of the mortgage amount o 30-year loan term o 10% down payment
· Other rates and economic parameters: o 5% nominal discount rate (equal to mortgage rate) o 1.6% inflation rate o 25% marginal federal income tax and 6.85% marginal state income tax o 0.9% property tax o Insulation has 60-year life with linear depreciation resulting in a 50% residual value at the end of
the 30-year period o Windows, duct sealing, and envelope sealing have a 30-year life and hence no residual value at
the end of the analysis period o Light bulbs have a 6-year life and are replaced four times during the 30-year analysis period
1 www.energycodes.gov/development/residential

A.2 September 2012
Energy and Economic Analysis This analysis determined the energy savings and economic impacts of the 2012 IECC compared to the 2009 IECC. Energy usage was modeled using DOE’s EnergyPlus™ software for two building types:
1. Single-Family: A two-story home with a 30-ft by 40-ft rectangular shape, 2,400 ft2 of floor area excluding the basement, and windows that cover 15% of the wall area, equally distributed on all sides of the house
2. Multifamily: A three-story building with 18 units (6 units per floor), each unit having conditioned floor area of 1,200 ft2 and window area equal to approximately 10% of the conditioned floor area, equally distributed on all sides of the building
Each of these building types, single-family and apartment/condo in a multifamily building, has four unique foundation types:
1. Slab on grade 2. Heated basement 3. Unheated basement 4. Crawlspace
Each building type has three unique heating system types:
1. Natural gas 2. Heat pump 3. Electric resistance 4. Oil
This results in 32 unique scenarios (2 × 4 × 4) for each of the climate zones. PNNL incorporated the prescriptive requirements of the 2009 and 2012 IECC when modeling the impacts of changes to the code. Whenever possible, PNNL uses DOE’s EnergyPlus model software to simulate changes to code requirements. However, in some cases, alternative methods are employed to estimate the effects of a given change. As an example, in order to give full consideration of the impacts of the 2012 IECC requirement for insulating hot water pipes (or shortening the pipe lengths), a separate estimate was developed for hot water pipe insulation requirements in the 2012 IECC, which results in a 10% savings in water heating energy use (Klein 2012). Energy and economic impacts were determined separately for each unique scenario, including the single-family and multifamily buildings, the four unique foundation types, and the four unique heating system types. However, the cost-effectiveness results are reported as a single overall state average. To determine this average, first the results were combined across foundation types and heating system types for single-family and multifamily prototypes as shown in Table A.1 and Table A.2 (single-family and multifamily have the same shares for foundation types). For example, the primary heating system type in new residential units in New York is a natural gas furnace. Therefore, the combined average energy usage calculations were proportionally weighted to account for the predominance of natural gas heating. Then single-family and multifamily results were combined for each climate zone in the state and the climate zone results were combined to determine a state average weighted by housing starts from 2010 U.S. Census data as shown in Table A.3.

A.3 September 2012
Table A.1. Heating Equipment Shares
Heating System Percent Share Single-Family Multifamily
Natural gas 69.2 49.6 Heat pump 24.5 39.5
Electric resistance 1.7 4.9 Oil 4.6 6.1
Table A.2. Foundation Type Shares
Foundation Type Slab on Grade Heated Basement Unheated Basement Crawlspace
Percent share 20.4 25.9 41.7 12.0 Table A.3. Construction by Building Type and Climate Zone
Climate Zone Housing Starts Single-Family Multifamily
4 1,810 2,964 5 5,702 987 6 2,447 257
Differences Between the 2009 IECC and the 2012 IECC The IECC have requirements that apply uniformly to all climate zones, and other requirements that vary by climate zone. Highlights of the mandatory requirements across all buildings include:
· Building envelope must be caulked and sealed. The 2012 IECC adds a requirement that the building must be tested and a level of leakage that is no more than a maximum limit must be achieved.
· Ducts and air handlers must be sealed. Testing against specified maximum leakage rates is required in the 2009 and 2012 IECC if any ducts pass outside the conditioned space (e.g., in attics, unheated basements). The 2012 IECC leakage requirements are more energy efficient.
· Supply and return ducts in attics, and all ducts in crawlspaces, unheated basements, garages, or otherwise outside the building envelope must be insulated.
· For both the 2009 and 2012 IECC, a minimum percentage of the lighting bulbs or fixtures in the dwelling must be high-efficacy lighting.
· A certificate listing insulation levels and other energy efficiency measures must be posted on or near the electric service panel.
A comparison of significant IECC requirements that do not vary by climate zone is contained in Table A.4. Of these, the most significant changes in the 2012 IECC compared to the 2009 IECC are the requirements for pressure testing of the building envelope and ducts/air handlers, and for insulating service hot water pipes. The requirement for high-efficacy lamps, while significant, is somewhat abated by a superseding federal regulation banning the manufacture or import of less efficient lamps at common watt levels that takes effect in 2012 to 2014.

A.4 September 2012
Table A.4. Comparison of Major Requirements That Do Not Vary by Climate Zone
Requirement 2009 IECC 2012 IECC
Building envelope sealing Caulked and sealed, verified by visual inspection against a
more detailed checklist
Caulked and sealed, verified by visual inspection and a pressure test against a
leakage requirement
Ducts and air handlers
Sealed, verified by visual inspection, and pressure
tested, or all ducts must be inside building envelope
Sealed, verified by visual inspection, and pressure tested against a leakage requirement,
or all ducts must be inside building envelope
Supply ducts in attics R-8 R-8
Return ducts in attics and all ducts in crawlspaces, unheated basements, garages, or otherwise outside the building envelope
R-6 R-6
Insulation on hot water pipes for service water heating systems None R-3 except where pipe run length is below a
diameter-dependent threshold Insulation on hot water pipes for hydronic
(boiler) space heating systems R-3 R-3
High-efficacy lamps (percent of lighting in the home) 50% of lamps 75% of lamps or 75% of fixtures
Certificate of insulation levels and other energy efficiency measures Yes Yes
Requirements such as insulation levels and fenestration (window, door, and skylights) U-factors can vary by the eight zones in the United States. Table A.5 shows these requirements. New York has three climate zones (Zones 4, 5 and 6) as defined in the IECC.

A.5 September 2012
Table A.5. Comparison of Major Requirements That Vary by Climate Zone
Components
Climate Zone IECC Ceiling
(R-value) Skylight
(U-factor)
Fenestration (windows and doors) Wood
Frame Wall
(R-value)
Mass Wall*
(R-value)
Floor (R-value)
Basement Wall**
(R-value)
Tested Max Air Leakage
Rate (air changes
per hour)
Slab*** (R-value
and depth)
Crawl Space** (R-value) U-factor SHGC
1 2009 30 0.75 NR 0.3 13 3/4 13 NR NR NR NR 2012 0.25 5
2 2009 30 0.75 0.65 0.3 13 4/6 13 NR NR NR NR 2012 38 0.65 0.4 0.25 5
3 2009 30 0.65 0.5 0.3 13 5/8 19 5/13**** NR NR 5/13 2012 38 0.55 0.35 0.25 20 8/13 3
4 2009 38 0.6 0.35 NR 13 5/10 19 10/13 NR 10, 2 ft 10/13 2012 49 0.55 0.40 20 8/13 3
5 2009 38 0.6 0.35
NR 20 13/17
30 10/13 NR
10, 2 ft 10/13
2012 49 0.55 0.32 15/19 15/19 3 15/19
6 2009
49 0.6 0.35
NR 20
15/19 30 15/19 NR
10, 4 ft 10/13
2012 0.55 0.32 20+5 3 15/19
7 and 8 2009 49 0.6 0.35 NR 21 19/21 38 15/19 NR 10, 4 ft 10/13 2012 0.55 0.32 20+5 3 15/19
* The second number applies when more than half the insulation is on the interior side of the high mass material in the wall. ** The first number is for continuous insulation (e.g., a board or blanket directly on the foundation wall) and the second number is for cavity insulation (i.e., if there is a furred-out
wall built against the foundation wall). Only one of these two has to be met. *** The first number is R-value. The second value refers to the vertical depth of the insulation around the perimeter. **** Basement wall insulation is not required in the warm-humid region of Zone 3 in the southeastern United States. NR = not required SHGC = solar heat gain coefficient

A.6 September 2012
While exemptions or allowances in the code are not included in this analysis, the 2012 IECC does allow for some of these depending on the compliance path. Examples include the following:
· One door and 15 ft2 of window area are exempt · Skylight U-factors are allowed to be higher than window U-factors · Five hundred square feet or 20% of ceiling area of a cathedral ceiling, whichever is less, is allowed to
have R-30 insulation in climate zones where more than R-30 is required for other ceilings Incremental First Costs Table A.6 shows the costs of implementing the prescriptive measures of the 2012 IECC. Costs are provided for both the reference home and apartment/condo moving from the 2009 IECC to the 2012 IECC. The costs derive from estimates assembled by Faithful + Gould (2012) and a number of other sources.2 The original cost data were based on a national average. The costs are adjusted upwards by 9.3% (multiplied by 1.093) to reflect local construction costs based on location factors provided by Faithful + Gould (2011). Table A.6. Total Construction Cost Increase for the 2012 IECC Compared to the 2009 IECC
2,400 ft2 House 1,200 ft2 Apartment/Condo Slab, Unheated Basement, or Crawlspace
Heated Basement Slab, Unheated Basement, or Crawlspace
Heated Basement
Zone 4 $2,225 $2,225 $1,101 $1,101 Zone 5 $1,712 $1,991 $915 $955 Zone 6 $3,057 $3,057 $1,407 $1,407
Results Life-Cycle Cost Table A.7 shows the LCC savings (discounted present value) of the 2012 IECC over the 30-year analysis period. These savings assume that initial costs are mortgaged, that homeowners take advantage of the mortgage interest tax deductions, and that efficiency measures retain a residual value at the end of the 30 years. As shown in Table A.7, LCC savings are $9,777 for the 2012 IECC. Table A.7. Life-Cycle Cost Savings Compared to the 2009 IECC
Code Zone 4 Zone 5 Zone 6 State Average
2012 IECC $6,175 $11,593 $11,543 $9,777 Cash Flow Because most houses are financed, consumers will be very interested in the financial impacts of buying a home that complies with the 2012 IECC requirements compared to the 2009 IECC. Mortgages spread the payment for the cost of a house over a long period of time (the simple payback fails to account for the impacts of mortgages).
2 The Faithful + Gould cost data and other cost data for energy efficiency measures are available on the “BC3” website at http://bc3.pnnl.gov/.

A.7 September 2012
In this analysis, a 30-year fixed-rate mortgage was assumed. It was also assumed that homebuyers will deduct the interest portion of the payments from their income taxes. Table A.8 shows the impacts to consumers’ cash flow resulting from the improvements in the 2012 IECC. Up-front costs include the down payment and loan fees. The annual values shown in the table are for the first year. The savings from income tax deductions for the mortgage interest will slowly decrease over time while energy savings are expected to increase over time because of escalating energy prices. These tables also include increases in annual property taxes because of the higher assessed house values. The net annual cash flow includes energy costs, mortgage payments, mortgage tax deductions, and property taxes but not the up-front costs. The time to positive cash flow includes all costs and benefits, including the down payment and other up-front costs. As shown in Table A.8, on average, there is a net positive cash flow to the consumer of $467 per year beginning in year one for the 2012 IECC. Positive cumulative savings, including payment of up-front costs, are achieved in 1 year. Table A.8. Impacts to Consumers’ Cash Flow from Compliance with the 2012 IECC Compared to the 2009 IECC
Cost/Benefit Zone 4 Zone 5 Zone 6 State Average
A Down payment and other up-front costs $163 $177 $310 $198
B Annual energy savings (year one) $382 $656 $708 $574 C Annual mortgage increase $89 $96 $168 $107
D Net annual cost of mortgage interest deductions, mortgage insurance, and
property taxes (year one) -$1 -$1 $0 $0
E =
[B-(C+D)]
Net annual cash flow savings (year one) $294 $561 $540 $467
F =
[A/E]
Years to positive savings, including up-front cost impacts 1 1 1 1
Note: Item D includes mortgage interest deductions, mortgage insurance, and property taxes for the first year. Deductions can partially or completely offset insurance and tax costs. As such, the "net" result appears relatively small or is sometimes even negative.
Simple Payback Table A.9 shows the simple payback period, which consists of the construction cost increase divided by first-year energy cost savings. This calculation yields the number of years required for the energy cost savings to pay back the initial investment. Simple payback does not consider financing of the initial costs through a mortgage or favored tax treatment of mortgages. As Table A.9 shows, the simple payback period from moving to the 2012 IECC from the 2009 IECC averages 3.2 years.

A.8 September 2012
Table A.9. Simple Payback Period, Relative to the 2009 IECC (Years)
Code Zone 4 Zone 5 Zone 6 State Average
2012 IECC 4 2.5 4.1 3.2 Energy Cost Savings All fuel prices were obtained from the DOE Energy Information Administration and are recent residential prices specific to New York (DOE 2012a, 2012b, 2012c). For this analysis, natural gas fuel prices were set to $1.177/therm. Electricity prices were set to $0.175/kWh for space heating and $0.192/kWh for air conditioning. Oil prices were set to $23.87/MBtu. Energy prices are assumed to escalate at the rates published in DOE’s Annual Energy Outlook (DOE 2012d). Table A.10 shows the estimated annual energy costs, including heating, cooling, water heating, and lighting per home that result from meeting the requirements in the 2009 IECC and 2012 IECC. Table A.11 shows the total energy cost savings as both a net dollar savings and as a percentage of the total energy use.3 Results are averaged across home type (single- and multifamily), foundation type, and heating system type. Table A.10. Annual Energy Costs for 2009 IECC and 2012 IECC
Climate Zone
2009 IECC 2012 IECC
Heating Cooling Water Heating Lighting Total Heating Cooling Water
Heating Lighting Total
4 $705 $343 $345 $185 $1,578 $413 $315 $311 $157 $1,196 5 $1,427 $297 $408 $280 $2,412 $857 $292 $367 $240 $1,756 6 $1,480 $235 $419 $293 $2,427 $856 $237 $377 $249 $1,719
State Average $1,194 $301 $389 $250 $2,134 $707 $289 $350 $214 $1,560
As can be seen from Table A.11, energy cost savings per year for the 2012 IECC compared to the 2009 IECC range from $382 in Zone 4 to $708 in Zone 6 per year. On a percentage basis, energy cost savings average 26.9% with the 2012 IECC.
3 The percent savings is the annual energy cost savings for heating, cooling, water heating, and lighting divided by the total baseline annual energy cost for heating, cooling, water heating, and lighting.

A.9 September 2012
Table A.11. Total Energy Cost Savings Compared to the 2009 IECC
Climate Zone 2012 IECC
Savings ($/yr) Percent Savings
4 $382 24.2 5 $656 27.2 6 $708 29.2
State Average $574 26.9 References
Faithful + Gould. 2012. Residential Energy Efficiency Measures – Prototype Estimate and Cost Data. Portland, Oregon. http://bc3.pnnl.gov/wiki/index.php/Downloads
Faithful + Gould. 2011. Residential Energy Efficiency Measures – Locations Factors. Portland, Oregon. http://bc3.pnnl.gov/wiki/index.php/Downloads
Klein, G. 2012. Cost Estimation for Materials and Installation of Hot Water Piping Insulation. Affiliated International Management, LLC, Newport Beach, California.
U.S. Department of Energy (DOE). 2012a. Electric Power Monthly. DOE/EIA-0226. Washington, D.C. http://www.eia.doe.gov/cneaf/electricity/epm/table5_6_a.html
U.S. Department of Energy (DOE). 2012b. Natural Gas Monthly. DOE/EIA-0130. Washington, D.C. http://www.eia.gov/oil_gas/natural_gas/data_publications/natural_gas_monthly/ngm.html
U.S. Department of Energy (DOE). 2012c. Petroleum Marketing Monthly. DOE/EIA-0380. Washington, D.C. http://www.eia.gov/petroleum/marketing/monthly/
U.S. Department of Energy (DOE). 2012d. Annual Energy Outlook. DOE/EIA-0383. Washington, D.C.