Embed Size (px)
Citation preview
NEW YORK CITY WATER AND WASTEWATER RATE REPORT – FY 2019MAY 2018
Steel liners for the Delaware Aqueduct Bypass Tunnel(each liner is 16’ in diameter and 40’ long)
1
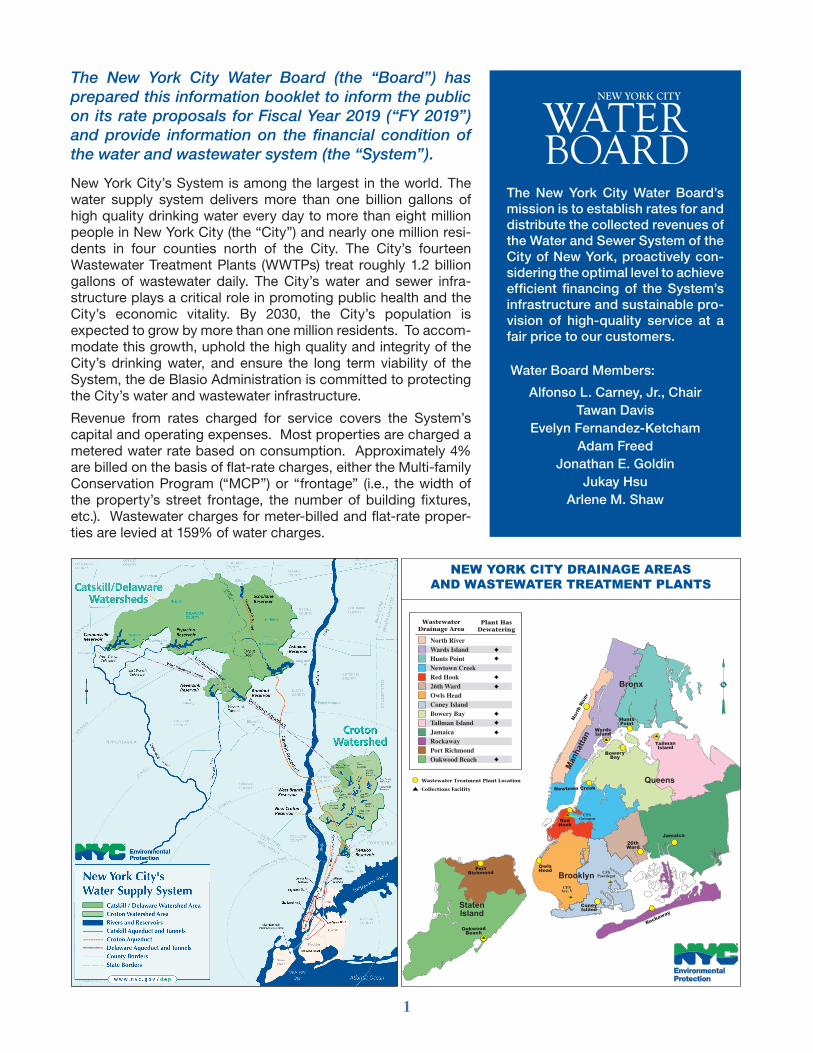
The New York City Water Board (the “Board”) has prepared this information booklet to inform the public on its rate proposals for Fiscal Year 2019 (“FY 2019”) and provide information on the financial condition of the water and wastewater system (the “System”).
New York City’s System is among the largest in the world. The water supply system delivers more than one billion gallons of high quality drinking water every day to more than eight million people in New York City (the “City”) and nearly one million resi-dents in four counties north of the City. The City’s fourteen Wastewater Treatment Plants (WWTPs) treat roughly 1.2 billion gallons of wastewater daily. The City’s water and sewer infra-structure plays a critical role in promoting public health and the City’s economic vitality. By 2030, the City’s population is expected to grow by more than one million residents. To accom-modate this growth, uphold the high quality and integrity of the City’s drinking water, and ensure the long term viability of the System, the de Blasio Administration is committed to protecting the City’s water and wastewater infrastructure.
Revenue from rates charged for service covers the System’s capital and operating expenses. Most properties are charged a metered water rate based on consumption. Approximately 4% are billed on the basis of flat-rate charges, either the Multi-family Conservation Program (“MCP”) or “frontage” (i.e., the width of the property’s street frontage, the number of building fixtures, etc.). Wastewater charges for meter-billed and flat-rate proper-ties are levied at 159% of water charges.
Wastewater Treatment Plant Location
Collections Facility
NEW YORK CITY DRAINAGE AREASAND WASTEWATER TREATMENT PLANTS
WastewaterDrainage Area
CFSGowanus
CFSAve. V
CFSPaerdegat
Nort
h R
iver
WardsIsland
HuntsPoint
Newtown Creek
BoweryBay
TallmanIsland
Jamaica
26thWard
ConeyIsland
OwlsHeadPort
Richmond
OakwoodBeach
Rockaway
RedHook
Bronx
Man
hatta
n
Queens
Brooklyn
StatenIsland
Plant HasDewatering
NYCDEP/BCIA/AJ 3/10
The New York City Water Board’s mission is to establish rates for and distribute the collected revenues of the Water and Sewer System of the City of New York, proactively con-sidering the optimal level to achieve efficient financing of the System’s infrastructure and sustainable pro-vision of high-quality service at a fair price to our customers.
Water Board Members:
Alfonso L. Carney, Jr., ChairTawan Davis
Evelyn Fernandez-KetchamAdam Freed
Jonathan E. GoldinJukay Hsu
Arlene M. Shaw
2
WATER BOARD RATE ADOPTION PROCESS
• Rates that will satisfy the revenue requirements of the System and policies that will advance the Board’s mission are presented to the Board.
• The New York City Municipal Water Finance Authority projects debt service on bonds issued to finance water and wastewater capital projects and certifies the annual debt service to the Board.
• The City Office of Management and Budget proj-ects the System’s operating and maintenance expenses and certifies the annual amount to the Board based on the Mayor’s Executive Budget.
• The System’s consulting engineer certifies that the annual expenses and capital investment are rea-sonable and appropriate to maintain the viability of the System.
• The Board holds a public hearing in each borough of the City. (See schedule below.)
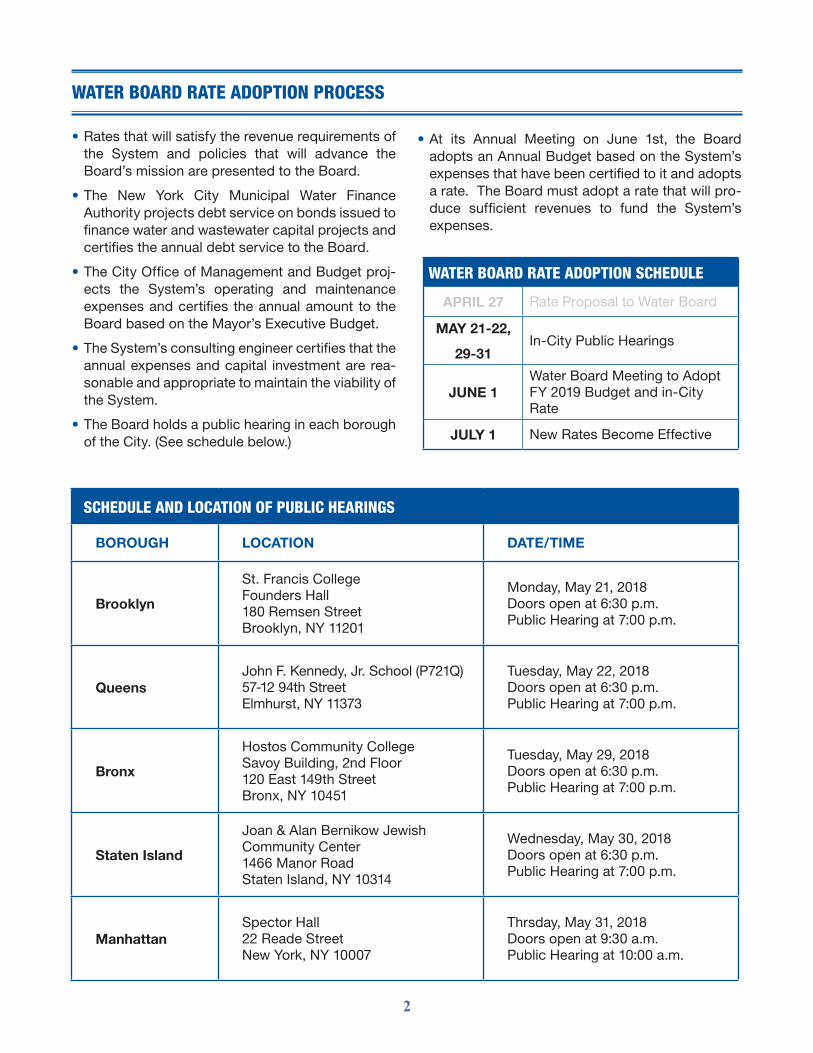
WATER BOARD RATE ADOPTION SCHEDULE
APRIL 27 Rate Proposal to Water Board
MAY 21-22,
29-31In-City Public Hearings
JUNE 1Water Board Meeting to Adopt FY 2019 Budget and in-City Rate
JULY 1 New Rates Become Effective
• At its Annual Meeting on June 1st, the Board adopts an Annual Budget based on the System’s expenses that have been certified to it and adopts a rate. The Board must adopt a rate that will pro-duce sufficient revenues to fund the System’s expenses.
SCHEDULE AND LOCATION OF PUBLIC HEARINGS
BOROUGH LOCATION DATE/TIME
Brooklyn
St. Francis CollegeFounders Hall180 Remsen StreetBrooklyn, NY 11201
Monday, May 21, 2018Doors open at 6:30 p.m.Public Hearing at 7:00 p.m.
QueensJohn F. Kennedy, Jr. School (P721Q) 57-12 94th StreetElmhurst, NY 11373
Tuesday, May 22, 2018Doors open at 6:30 p.m.Public Hearing at 7:00 p.m.
Bronx
Hostos Community CollegeSavoy Building, 2nd Floor120 East 149th StreetBronx, NY 10451
Tuesday, May 29, 2018Doors open at 6:30 p.m.Public Hearing at 7:00 p.m.
Staten Island
Joan & Alan Bernikow Jewish Community Center1466 Manor RoadStaten Island, NY 10314
Wednesday, May 30, 2018Doors open at 6:30 p.m.Public Hearing at 7:00 p.m.
ManhattanSpector Hall22 Reade StreetNew York, NY 10007
Thrsday, May 31, 2018Doors open at 9:30 a.m.Public Hearing at 10:00 a.m.
3
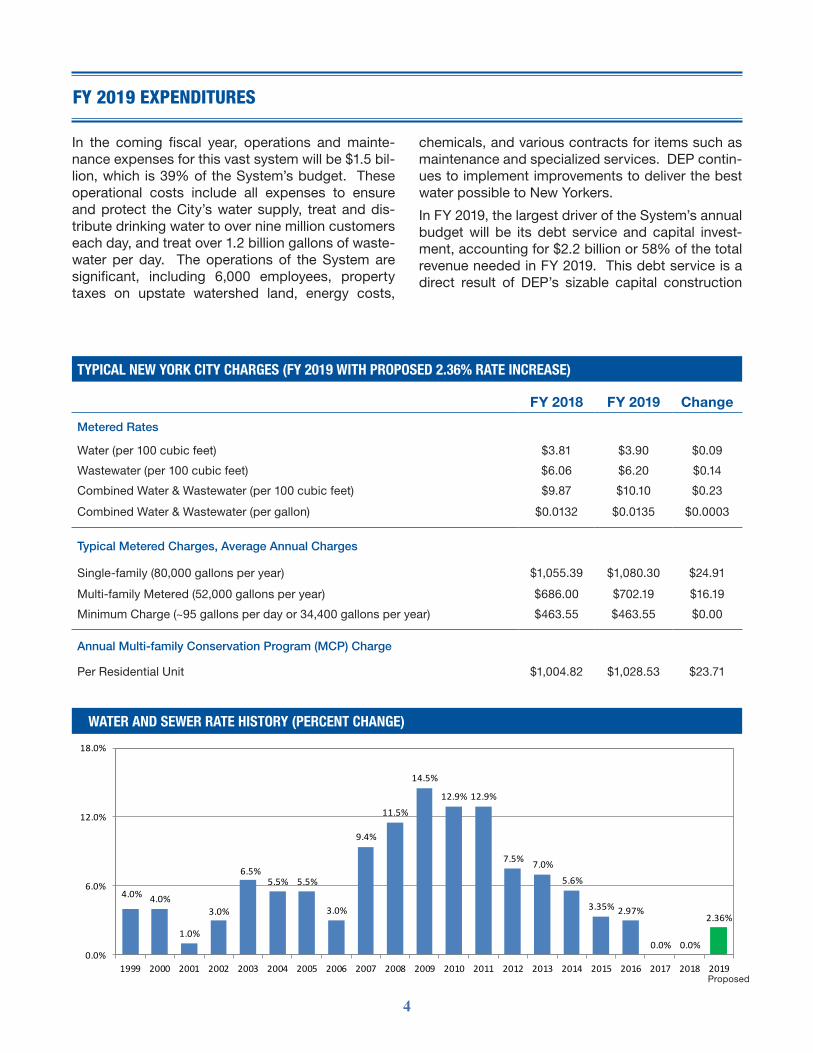
k Increase in-City water rates by 2.36%.
k Minimum Charge: Freeze the minimum charge for meter-billed customers for the fifth consecu-tive year at the FY 2014 rate of $0.49 per day for water service, plus the wastewater charge of 159% of water charges.
k Multi-family Water Assistance Program: Modify the ranking formula for determining program participation to rank eligible applicants from lowest-to-highest median income, with priority given to the lowest.
k Letter of Authorization: Letters of Authorization will be valid for two years unless otherwise specified by the customer, which will reduce the paperwork burden on customers and their advisors.
k Title Read Policy: Clarify existing Title Read Policy and procedure and extend the time in which a customer may request a title read from 30 days prior to a property transfer to 60 days.
FY 2019 RATE PROPOSAL
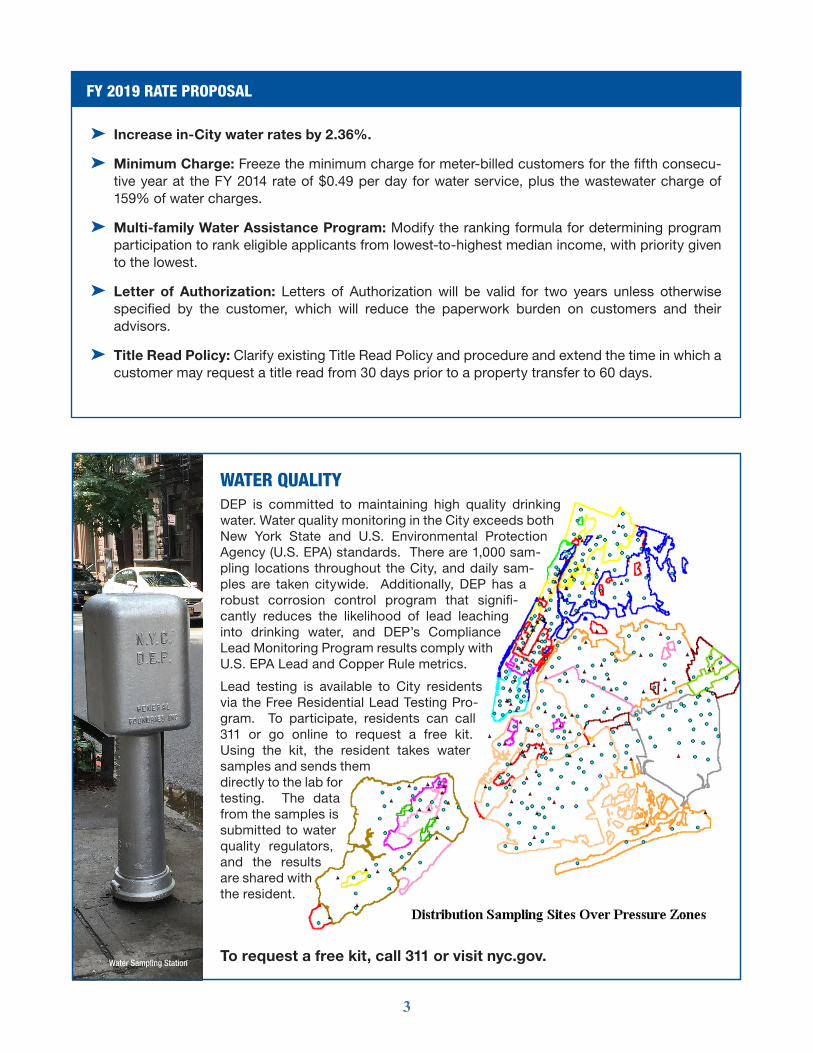
WATER QUALITYDEP is committed to maintaining high quality drinking water. Water quality monitoring in the City exceeds both New York State and U.S. Environmental Protection Agency (U.S. EPA) standards. There are 1,000 sam-pling locations throughout the City, and daily sam-ples are taken citywide. Additionally, DEP has a robust corrosion control program that signifi-cantly reduces the likelihood of lead leaching into drinking water, and DEP’s Compliance Lead Monitoring Program results comply with U.S. EPA Lead and Copper Rule metrics.
Lead testing is available to City residents via the Free Residential Lead Testing Pro-gram. To participate, residents can call 311 or go online to request a free kit. Using the kit, the resident takes water samples and sends them directly to the lab for testing. The data from the samples is submitted to water quality regulators, and the results are shared with the resident.
Water Sampling Station To request a free kit, call 311 or visit nyc.gov.
4
In the coming fiscal year, operations and mainte-nance expenses for this vast system will be $1.5 bil-lion, which is 39% of the System’s budget. These operational costs include all expenses to ensure and protect the City’s water supply, treat and dis-tribute drinking water to over nine million customers each day, and treat over 1.2 billion gallons of waste-water per day. The operations of the System are significant, including 6,000 employees, property taxes on upstate watershed land, energy costs,
TYPICAL NEW YORK CITY CHARGES (FY 2019 WITH PROPOSED 2.36% RATE INCREASE)
FY 2018 FY 2019 Change
Metered Rates
Water (per 100 cubic feet) $3.81 $3.90 $0.09
Wastewater (per 100 cubic feet) $6.06 $6.20 $0.14
Combined Water & Wastewater (per 100 cubic feet) $9.87 $10.10 $0.23
Combined Water & Wastewater (per gallon) $0.0132 $0.0135 $0.0003
Typical Metered Charges, Average Annual Charges
Single-family (80,000 gallons per year) $1,055.39 $1,080.30 $24.91
Multi-family Metered (52,000 gallons per year) $686.00 $702.19 $16.19
Minimum Charge (~95 gallons per day or 34,400 gallons per year) $463.55 $463.55 $0.00
Annual Multi-family Conservation Program (MCP) Charge
Per Residential Unit $1,004.82 $1,028.53 $23.71
ANNUAL WATER/WASTEWATER CHARGES (COMMERCIAL)WATER AND SEWER RATE HISTORY (PERCENT CHANGE)
4.0% 4.0%
1.0%
3.0%
6.5%5.5% 5.5%
3.0%
9.4%
11.5%
14.5%
12.9% 12.9%
7.5% 7.0%
5.6%
3.35% 2.97%
0.0% 0.0%
2.36%
0.0%
6.0%
12.0%
18.0%
1999 2000 2001 2002 2003 2004 2005 2006 2007 2008 2009 2010 2011 2012 2013 2014 2015 2016 2017 2018 2019
chemicals, and various contracts for items such as maintenance and specialized services. DEP contin-ues to implement improvements to deliver the best water possible to New Yorkers.
In FY 2019, the largest driver of the System’s annual budget will be its debt service and capital invest-ment, accounting for $2.2 billion or 58% of the total revenue needed in FY 2019. This debt service is a direct result of DEP’s sizable capital construction
FY 2019 EXPENDITURES
Proposed
5
Water Authority Funds for Debt
Service and Capital Investment
$2.258%
Operations & Maintenance
$1.539%
Water Finance Authority & Water Board Expenses
$0.13%
FY 2019 EXPENDITURES
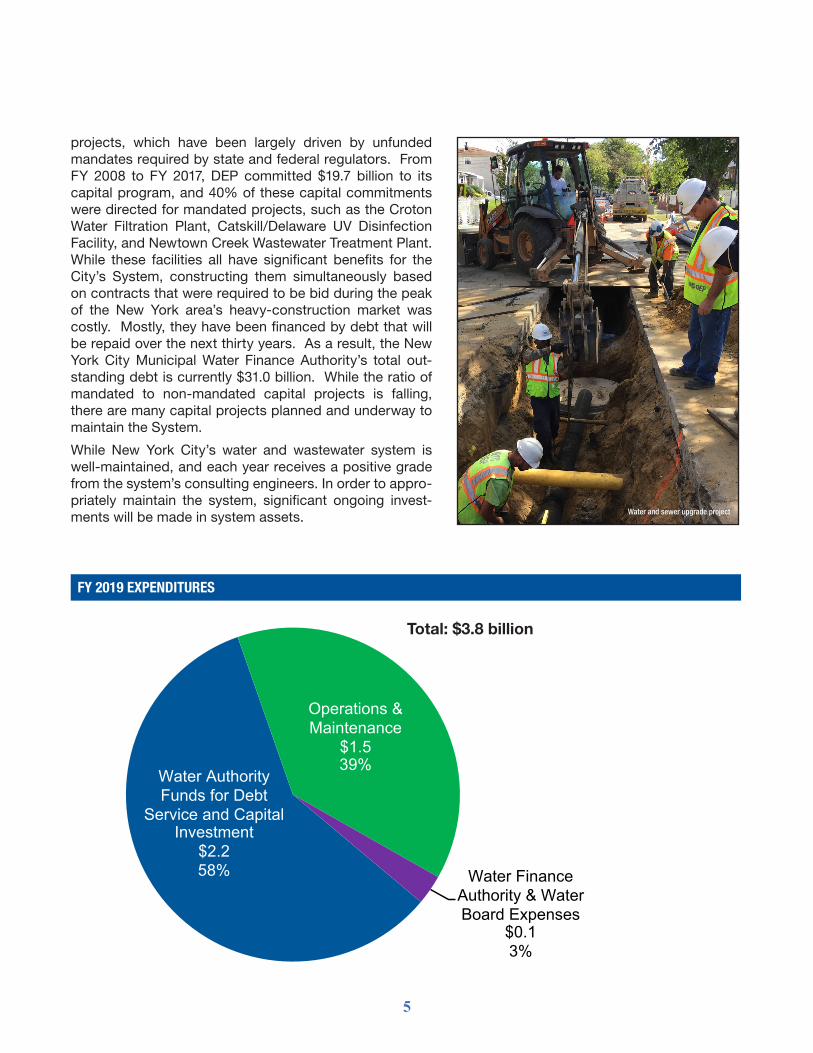
projects, which have been largely driven by unfunded mandates required by state and federal regulators. From FY 2008 to FY 2017, DEP committed $19.7 billion to its capital program, and 40% of these capital commitments were directed for mandated projects, such as the Croton Water Filtration Plant, Catskill/Delaware UV Disinfection Facility, and Newtown Creek Wastewater Treatment Plant. While these facilities all have significant benefits for the City’s System, constructing them simultaneously based on contracts that were required to be bid during the peak of the New York area’s heavy-construction market was costly. Mostly, they have been financed by debt that will be repaid over the next thirty years. As a result, the New York City Municipal Water Finance Authority’s total out-standing debt is currently $31.0 billion. While the ratio of mandated to non-mandated capital projects is falling, there are many capital projects planned and underway to maintain the System.
While New York City’s water and wastewater system is well-maintained, and each year receives a positive grade from the system’s consulting engineers. In order to appro-priately maintain the system, significant ongoing invest-ments will be made in system assets. Water and sewer upgrade project
Total: $3.8 billion
6
From FY 2008 to FY 2017, DEP committed $19.7 bil-lion to its capital program, and the current Capital Improvement Plan for FY 2018 to FY 2027 is $19.1 billion with $2.1 billion for FY 2018. These invest-ments have secured the City’s System today and will benefit additional New Yorkers for generations to come.
DEP will continue to invest in the City’s water and wastewater infrastructure, with additional multi-phase, long-term projects, such as the Green Infra-structure program, rehabilitation of the City’s WWTPs, and the planning, design, and construction of permanent repairs to the Delaware Aqueduct. Ongoing projects, such as upstate land acquisition, energy and energy efficiency projects systemwide, and maintaining infrastructure throughout the water-shed to support the FAD will continue to enhance the City’s System.
The following paragraphs summarize some of the programmatic areas for capital investment as noted in the approved FY 2019 Executive Capital Improve-ment Plan.
WATER SUPPLY
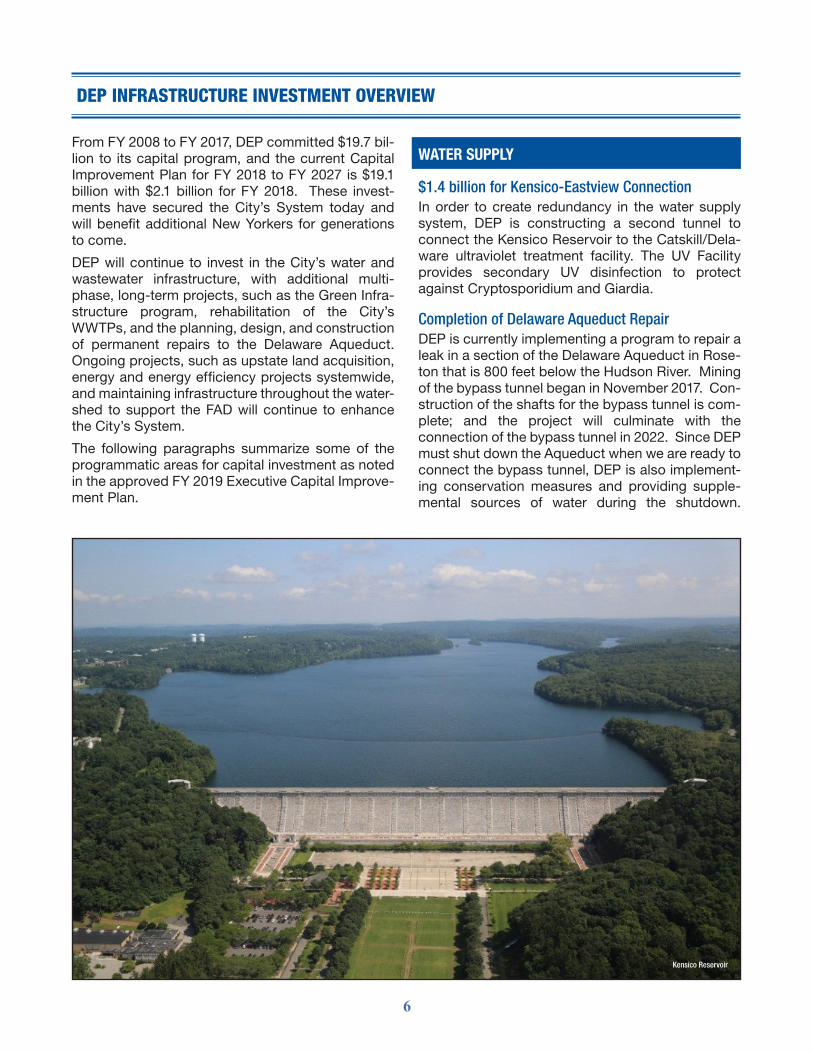
$1.4 billion for Kensico-Eastview ConnectionIn order to create redundancy in the water supply system, DEP is constructing a second tunnel to connect the Kensico Reservoir to the Catskill/Dela-ware ultraviolet treatment facility. The UV Facility provides secondary UV disinfection to protect against Cryptosporidium and Giardia.
Completion of Delaware Aqueduct RepairDEP is currently implementing a program to repair a leak in a section of the Delaware Aqueduct in Rose-ton that is 800 feet below the Hudson River. Mining of the bypass tunnel began in November 2017. Con-struction of the shafts for the bypass tunnel is com-plete; and the project will culminate with the connection of the bypass tunnel in 2022. Since DEP must shut down the Aqueduct when we are ready to connect the bypass tunnel, DEP is also implement-ing conservation measures and providing supple-mental sources of water during the shutdown.
DEP INFRASTRUCTURE INVESTMENT OVERVIEW
Kensico Reservoir
7
The most significant of these projects will increase the capacity of the Catskill Aqueduct by an addi-tional 50 million gallons per day.
$660 million for City Water Tunnel No. 3The Manhattan Section of City Water Tunnel No. 3 was activated in October 2013 to provide redun-dancy for the older Water Tunnels No. 1 and 2 in Manhattan. The Brooklyn/Queens section is cur-rently activation ready in the unlikely event it is needed as an emergency backup in the event of a major disruption in water delivery from Tunnels 1 or 2. The remaining work on the project includes the construction of two new shafts in Queens and is expected to be completed in the mid-2020s.
WASTEWATER MANAGEMENT AND TREATMENT
$1.9 billion for Combined Sewer Overflow (CSO) Long-term Control Plans (LTCPs)These funds in the current 10-year capital program will continue the City’s successes in protecting local waterways towards a goal of opening 90% of the City’s waterways for recreation by 2030. CSOs occur during especially wet weather when the City’s 14 WWTPs are unable to treat all the waste-water and stormwater in the System. Therefore, in response to an administrative consent order with the NYSDEC, DEP is required to submit LTCPs for CSOs in ten waterbodies, the East River, and open citywide waters. Currently, seven LTCPs have been approved by NYSDEC. Programs such as CSO retention tanks, wastewater treatment plant upgrades, and sustainable stormwater manage-ment practices will help keep floatable trash, debris, oils, grease, and bacteria from entering our water-ways. By updating our stormwater management system with both traditional mechanical upgrades (such as sewer construction and pumping stations), as well as Green Infrastructure (such as rain gar-dens and green roofs), the City’s waterways will continue to improve.
$1.7 billion for Southeast Queens Water and Sewer InfrastructureFlooding has long been a concern in Southeast Queens and increasing rainfall, loss of permeable surfaces, and reduced groundwater use have only worsened the problem. DEP has developed a four-pronged program to improve flooding conditions: construct quick fixes to bring near-term flooding relief, build neighborhood sewer projects, invest in
large trunk sewers to create future capacity, and evaluate opportunities to reduce groundwater flood-ing. Over the next 10 years, DEP plans to begin full sewer buildout, which will require approximately 450 miles of new storm sewers and upgrades to 260 miles of sanitary sewers and 30 miles of combined sewers. In order to relieve local flooding, DEP will build Green Infrastructure to capture stormwater before it gets to the storm sewer system. DEP will also accelerate the planning and design of large trunk sewers, which transport stormwater to Jamaica Bay; build collection storm sewers in the hardest hit areas; and partner with community groups to edu-cate residents about steps they can take to protect their properties during rain events.
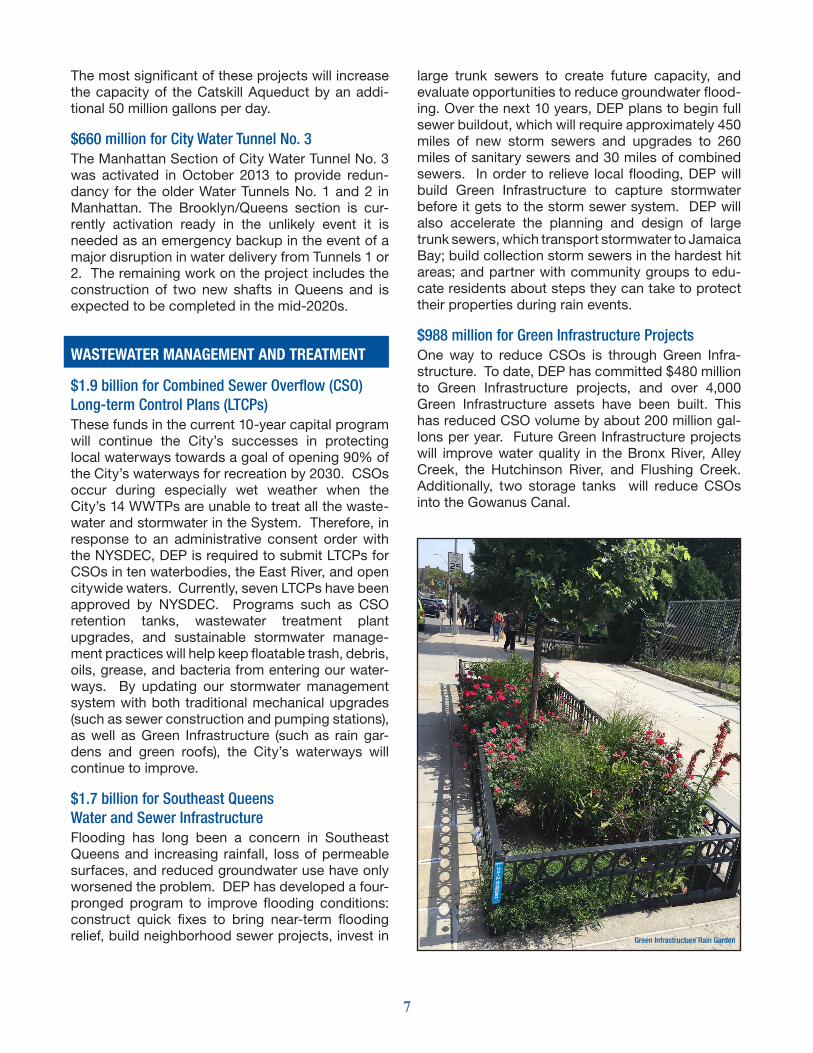
$988 million for Green Infrastructure ProjectsOne way to reduce CSOs is through Green Infra-structure. To date, DEP has committed $480 million to Green Infrastructure projects, and over 4,000 Green Infrastructure assets have been built. This has reduced CSO volume by about 200 million gal-lons per year. Future Green Infrastructure projects will improve water quality in the Bronx River, Alley Creek, the Hutchinson River, and Flushing Creek. Additionally, two storage tanks will reduce CSOs into the Gowanus Canal.
Green Infrastructure Rain Garden
8
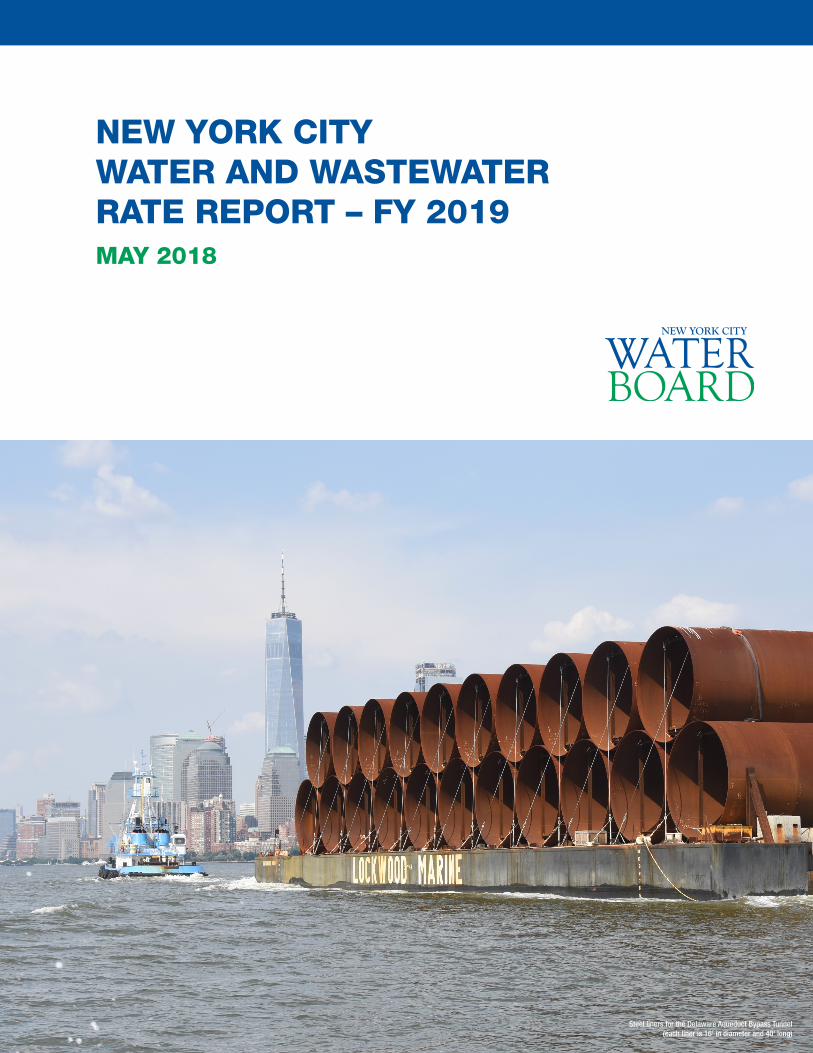
0
500
1000
1500
2000
2500
3000
Memphis
Phoen
ix
Chicago
Milwauk
ee
Denver
Miami-D
adeDalla
s
San Anton
io
Fort Worth
St. Lou
is
Columbus
Jack
sonvill
e
Charlott
e
Houston
New York
Detroit
Louisv
ille
Los A
ngele
s
Philad
elphia
San Jo
se
Indiana
polis
Boston
Baltim
ore
San D
iegoAus
tin
Washing
ton, D
.C.
Clevelan
d
Atlanta
San Franc
isco
Seattle
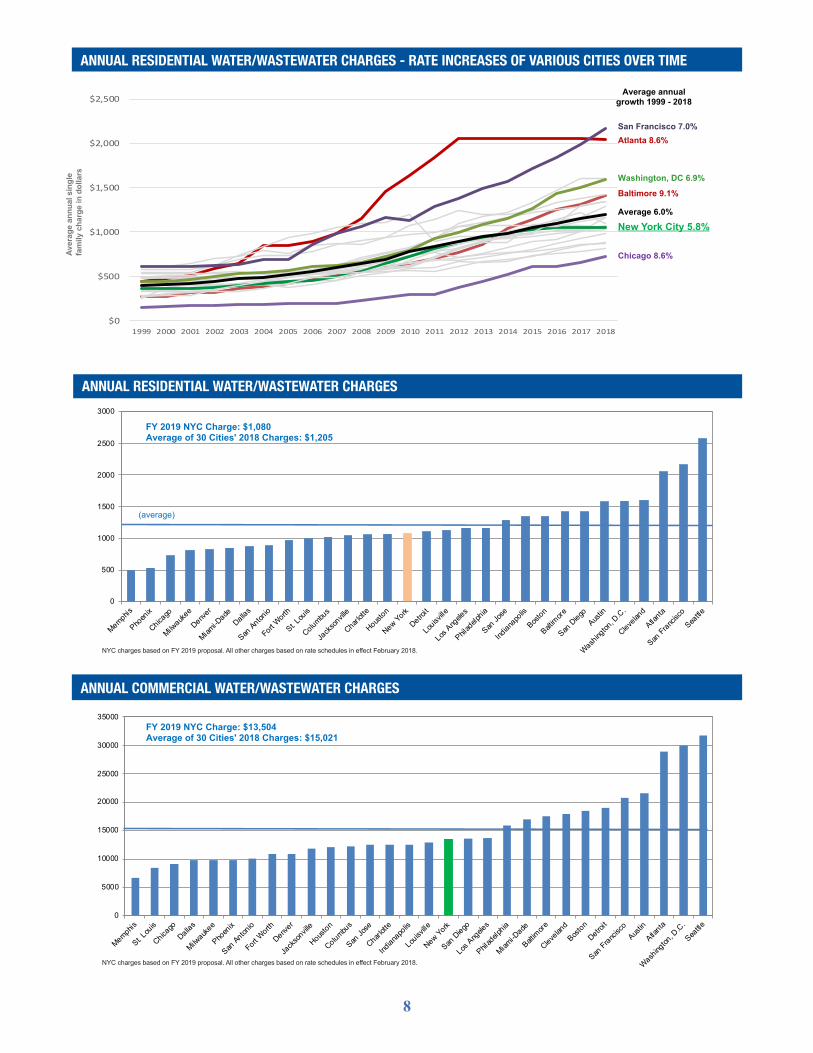
FY 2019 NYC Charge: $1,080Average of 30 Cities' 2018 Charges: $1,205
(average)
ANNUAL RESIDENTIAL WATER/WASTEWATER CHARGES
ANNUAL COMMERCIAL WATER/WASTEWATER CHARGES
0
5000
10000
15000
20000
25000
30000
35000
Memphis
St. Lou
is
Chicago
Dallas
Milwauk
ee
Phoen
ix
San Anton
io
Fort Worth
Denver
Jack
sonvill
e
Houston
Columbus
San Jo
se
Charlott
e
Indiana
polis
Louisv
ille
New York
San D
iego
Los A
ngele
s
Philad
elphia
Miami-D
ade
Baltim
ore
Clevelan
d
Boston
Detroit
San Franc
isco
Austin
Atlanta
Washing
ton, D
.C.
Seattle
FY 2019 NYC Charge: $13,504Average of 30 Cities' 2018 Charges: $15,021
ANNUAL WATER/WASTEWATER CHARGES (COMMERCIAL)ANNUAL RESIDENTIAL WATER/WASTEWATER CHARGES - RATE INCREASES OF VARIOUS CITIES OVER TIME
$0
$500
$1,000
$1,500
$2,000
$2,500
1999 2000 2001 2002 2003 2004 2005 2006 2007 2008 2009 2010 2011 2012 2013 2014 2015 2016 2017 2018
Atlanta 8.6%San Francisco 7.0%
Washington, DC 6.9%
Baltimore 9.1%
Average 6.0%
New York City 5.8%
Chicago 8.6%
Average annual growth 1999 - 2018
Aver
age
annu
al s
ingl
e fa
mily
cha
rge
in d
olla
rs
NYC charges based on FY 2019 proposal. All other charges based on rate schedules in effect February 2018.
NYC charges based on FY 2019 proposal. All other charges based on rate schedules in effect February 2018.

9
ANTICIPATED SYSTEM FINANCIALS FOR DEBT COVERAGE ($ MILLIONS)FY 2018 FY 2019 Change
REVENUES
Operating Revenues
Water and Sewer User Payments 3,550 3,673 124Upstate Revenue 82 86 4Miscellaneous Revenue 17 18 1
Other Revenues
Interest on Funds 20 23 3Federal Subsidy on Outstanding Build America Bonds 70 70 0
Current Revenues Available for Debt Service 3,738 3,870 131
EXPENSES
First Resolution Authority Debt Service
Outstanding Bonds 71 133 61Anticipated Future Bonds 7 7
Total First Resolution Debt Service 71 139 68
Debt Service on Subordinated Indebtedness
Outstanding Second Resolution Bonds 1,062 1,132 70Anticipated Future Second Resolution Bonds 13 82 69Interest Payments on Commercial Paper Notes 0 17 17Outstanding Second Resolution Bonds to EFC 547 552 6Anticipated Future Second Resolution EFC Bonds 0 9 9Less: EFC Subsidy and Capitalized Interest -100 -106 -6
Debt Service on Subordinated Indebtedness 1,521 1,685 165
Less: Carryforward Revenues -1,212 -1,025 187
Net Debt Service on Subordinated Indebtedness 309 660 352
Total Debt Service Payable from Current Revenues 380 800 420
Operating Expenses
Water Authority 53 56 3Water Board 50 51 1DEP Operating and Maintenance 1,403 1,467 64Other Expenses 18 18 0
Total Operating Expenses 1,524 1,592 68
Deposits to O&M Reserve Fund 0 2 2Defeasance/Cash Financed Capital Construction 825 525 -300
Total Expenses 2,349 2,120 -230
Cash Released from Escrow -17 -17 0
Net Year-end Balance 1,025 967 -59
First Resolution Debt Service Coverage 52.3x 27.8xFirst and Second Resolution Debt Service Coverage 9.7x 4.8x
Note: This listing is for information only and does not follow the Flow of Funds priority established under the Financing Agreement.

10
CAPITAL COMMITMENTS - DEP CONTINUES TO INVEST IN INFRASTRUCTURE
CAPITAL IMPROVEMENT PLAN: FY 2018-FY 2027 INVESTMENT ALLOCATION (IN BILLIONS)
Mandates$4.1 21%
Dependability$2.2 11%
State of Good Repair
$5.6 29%
Other$0.5 3% SE Queens
$1.7 9%
Sewer Construction
$3.0 16%
Water Main Construction
$2.0 11%
Total: $19.1 billion
You can sign up to receive monthly water and sewer bills. Not only will monthly bills help you notice leaks sooner and make budgeting easier, if you switch to monthly billing and register to receive the monthly bills as eBills, you’ll get a $10 credit on your DEP account after receiving your third consecutive monthly eBill! By signing up to receive your bills online, you’ll save time and help improve our environment by reducing paper consumption. Instead of a paper bill, you’ll receive an email notification when your next bill is due. You can then log in to My DEP Account to see an electronic copy of your bill.
Get alerts when your water use spikes unexpectedly
The Leak Notification Program enables you to be alerted to potential water leaks on your property. Sign up online to receive email notifications when your water use increases significantly over a period of several days, enabling you to quickly respond to potential leaks and fix them before they become a serious billing problem. Since 2011, 288,800 customers have enrolled in the Leak Notification Program and been able to save more than $138 million in leak-related charges.
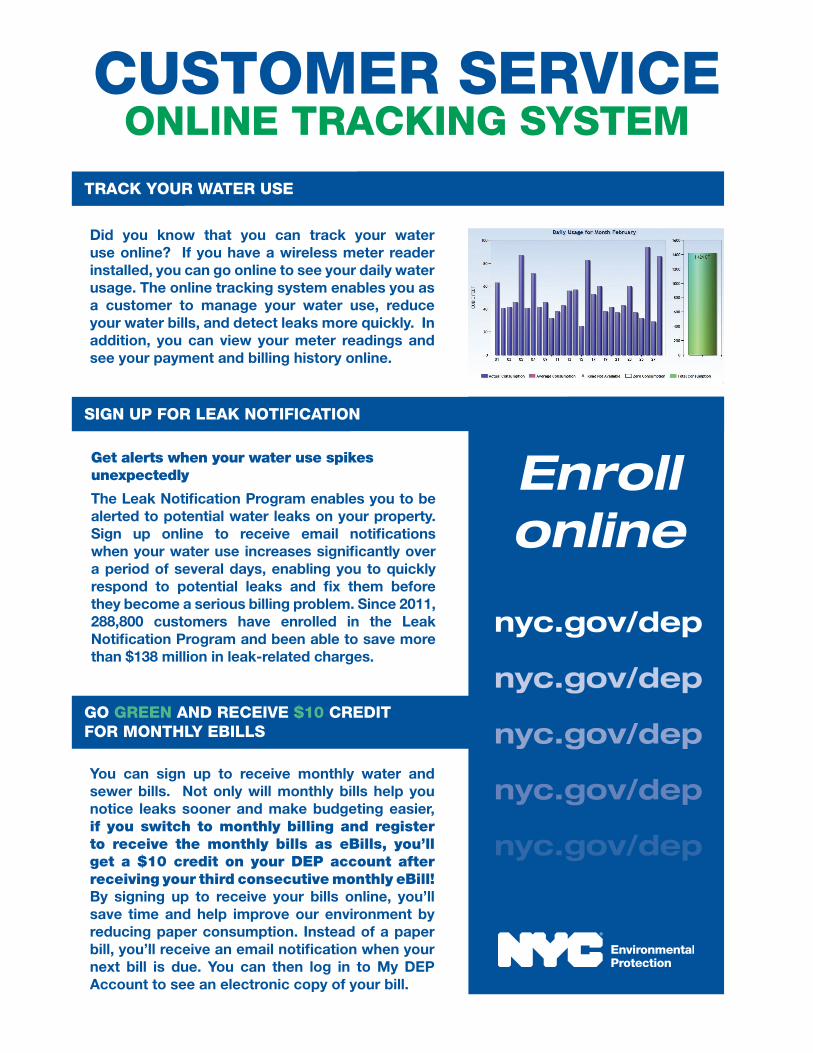
Did you know that you can track your water use online? If you have a wireless meter reader installed, you can go online to see your daily water usage. The online tracking system enables you as a customer to manage your water use, reduce your water bills, and detect leaks more quickly. In addition, you can view your meter readings and see your payment and billing history online.
SIGN UP FOR LEAK NOTIFICATION
TRACK YOUR WATER USE
GO GREEN AND RECEIVE $10 CREDIT FOR MONTHLY EBILLS
Enroll online
nyc.gov/dep
nyc.gov/dep
nyc.gov/dep
nyc.gov/dep
nyc.gov/dep
CUSTOMER SERVICEONLINE TRACKING SYSTEM