Embed Size (px)
Citation preview

Lawrence Schloss
Deputy Comptroller / Chief Investment Officer
THE CITY OF NEW YORK
OFFICE OF THE COMPTROLLER BUREAU OF ASSET MANAGEMENT
1 CENTRE STREET ROOM 736 NEW YORK, N.Y. 10007-2341
───────────── JOHN C. LIU COMPTROLLER
TELEPHONE: (212) 669-8318 FAX NUMBER: (212) 669-3445
WWW.COMPTROLLER.NYC.GOV
EMAIL: [email protected]
MEMORANDUM
TO: Trustees
Teachers’ Retirement System of the City of New York FROM: Larry Schloss DATE: May 6, 2011 RE: Teachers’ Retirement System of the City of New York Investment Meeting – May 12, 2011
Enclosed is a copy of the public agenda for the Thursday, May 12, 2011 Investment Meeting. The meeting will be held at 55 Water Street, 16th Floor Conference Room beginning at (9:30am). If you have questions about any agenda item, please give me a call at 212-669-8318.
I:\Investment Strategy\Agendas\Teachers\05 - May 12, 2011\PUBLIC AGENDA MATERIALS\5-12-2011 Memo Public).doc

THE CITY OF NEW YORK
OFFICE OF THE COMPTROLLER 1 CENTRE STREET
NEW YORK, N.Y. 10007-2341 ─────────────
John C. Liu COMPTROLLER
TEACHERS’ RETIREMENT SYSTEM OF THE CITY OF NEW YORK
INVESTMENT MEETING
MAY 12, 2011
1

TEACHERS’ RETIREMENT SYSTEM OF THE CITY OF NEW YORK
INVESTMENT MEETING
MAY 12, 2011
PUBLIC AGENDA
Page
I. Monthly Performance Review: (30 Minutes) 4
II. Emerging Manager Review & Recommendation: (30 Minutes) 51
III. Asset Allocation: (1 Hour) 58 APPENDICES: • TUCS Performance Rankings 4Q10 88 • Basket Clause 91
2

PUBLIC AGENDA
3

I. Monthly Performance Review:
4
Prepared for the New York City Teachers’ Retirement System
5/12/2011
5
TABLE OF CONTENTS
Economic Indicators –From BAM .................................................................................................................... 1
Market Indicators –From BAM ........................................................................................................................ 15
Teachers’ Market Values 2003-2011 ............................................................................................................... 27
Teachers’ Market Values 2010-2011 ............................................................................................................... 28
Asset Allocation and Policy Weight Mixes ...................................................................................................... 29
Classification of Investments, including policy weights and rebalancing ranges ........................................... 30
Contribution to Returns .................................................................................................................................... 31
Market Indicators for March ........................................................................................................................... 32
Manager / Benchmark Comparison Report ..................................................................................................... 33
Private Equity Fund Supplemental Details ...................................................................................................... 42
Real Estate Fund Supplemental Details ........................................................................................................... 44
6

NYC OFFICE OF THE COMPTROLLERBUREAU OF ASSET MANAGEMENT
BUREAU OF ASSET MANAGEMENT
7

BUREAU OF ASSET MANAGEMENT SOURCE: BLOOMBERG
2
•LAST PRICE 2.3•HIGH ON 03/30 /01 4.1•AVERAGE 1.7•LOW ON 06/30 /09 -4 .1
8
BUREAU OF ASSET MANAGEMENT
3
SOURCE: BLOOMBERG
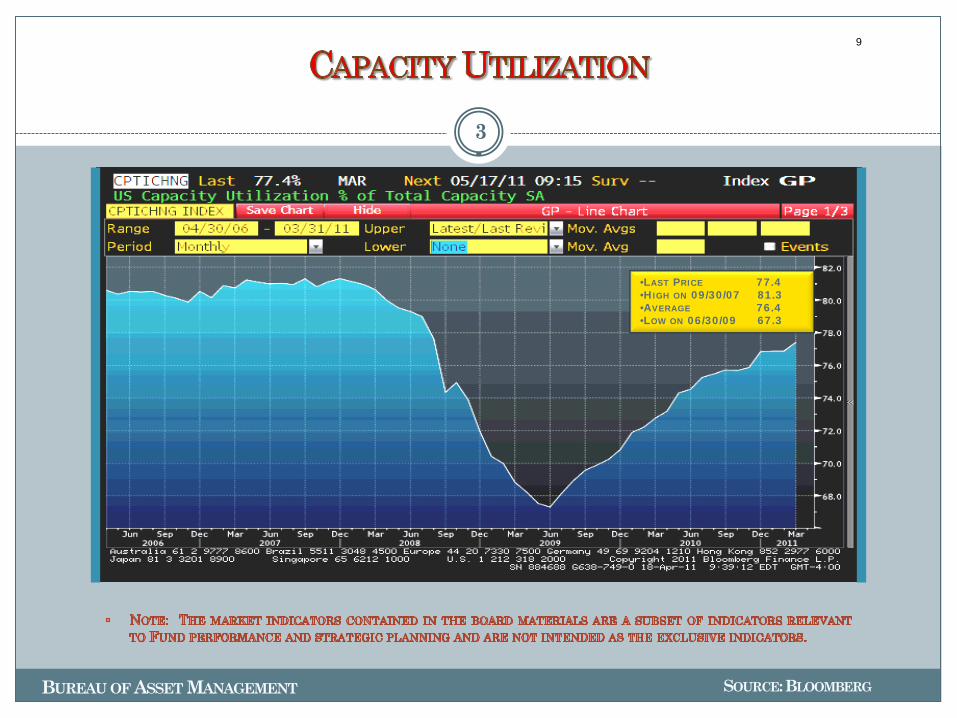
•LAST PRICE 77.4•HIGH ON 09/30/07 81.3•AVERAGE 76.4•LOW ON 06/30/09 67.3
9

BUREAU OF ASSET MANAGEMENT
4
SOURCE: BLOOMBERG
•LAST PRICE 60.4•HIGH ON 02/28/11 61.4•AVERAGE 51.1•LOW ON 12/31/08 33.3
10

BUREAU OF ASSET MANAGEMENT
5
SOURCE: BLOOMBERG
•LAST PRICE 429.0•HIGH ON 03/27/09 659.0•AVERAGE 424.2•LOW ON 01/12/07 296.0
11
BUREAU OF ASSET MANAGEMENT
6
SOURCE: BLOOMBERG
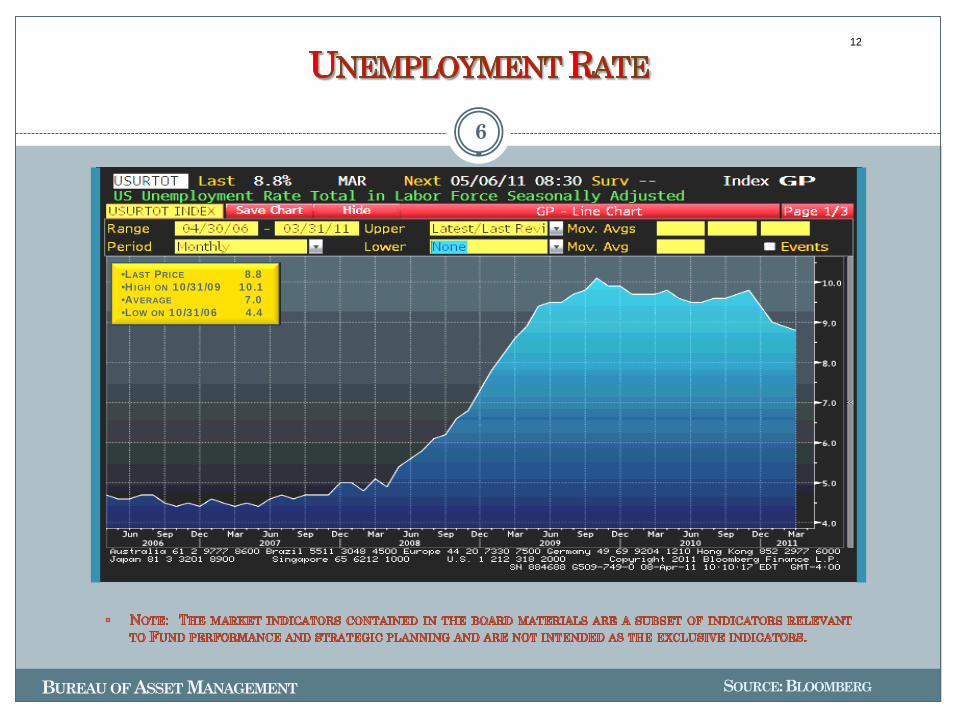
•LAST PRICE 8.8•HIGH ON 10/31/09 10.1•AVERAGE 7.0•LOW ON 10/31/06 4.4
12
BUREAU OF ASSET MANAGEMENT
7
SOURCE: BLOOMBERG
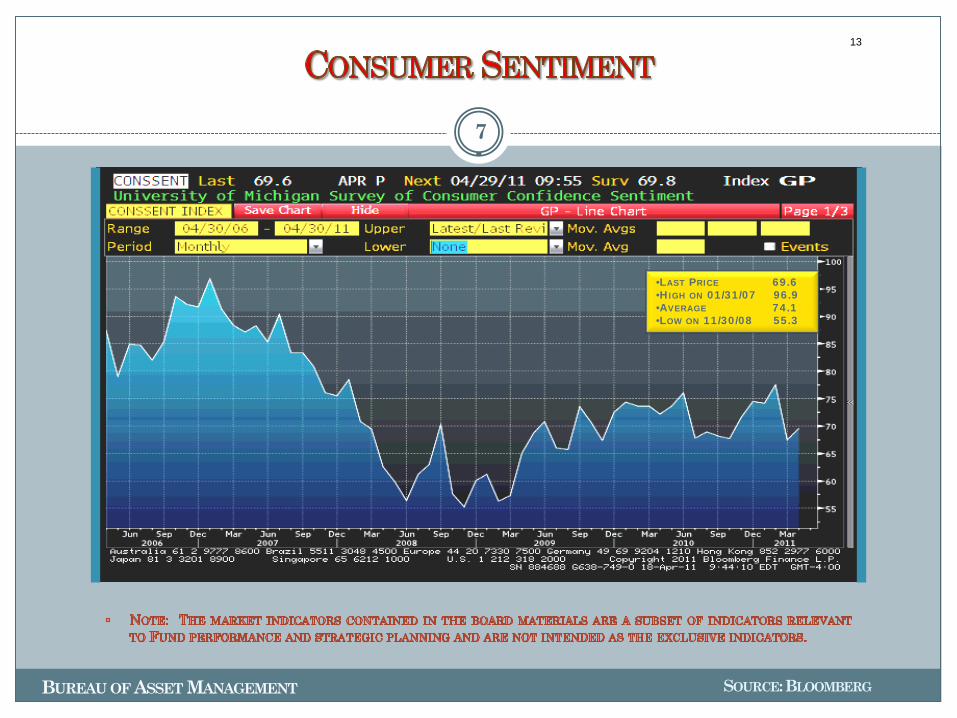
•LAST PRICE 69.6•HIGH ON 01/31/07 96.9•AVERAGE 74.1•LOW ON 11/30/08 55.3
13
BUREAU OF ASSET MANAGEMENT
8
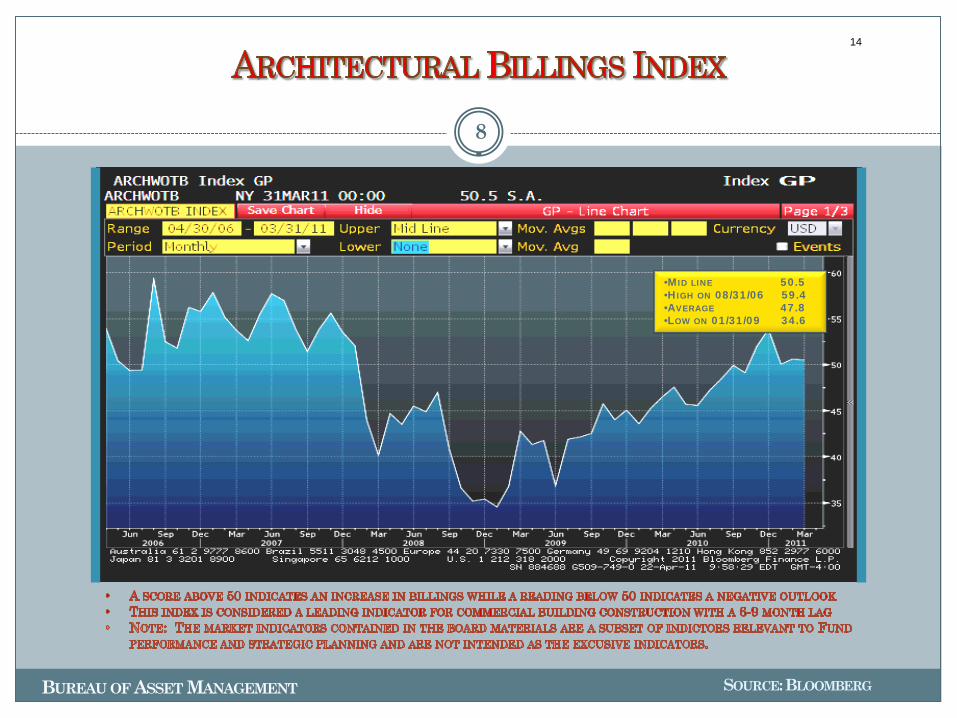
•MID LINE 50.5•HIGH ON 08/31/06 59.4•AVERAGE 47.8•LOW ON 01/31/09 34.6
SOURCE: BLOOMBERG
14
BUREAU OF ASSET MANAGEMENT
9
SOURCE: BLOOMBERG
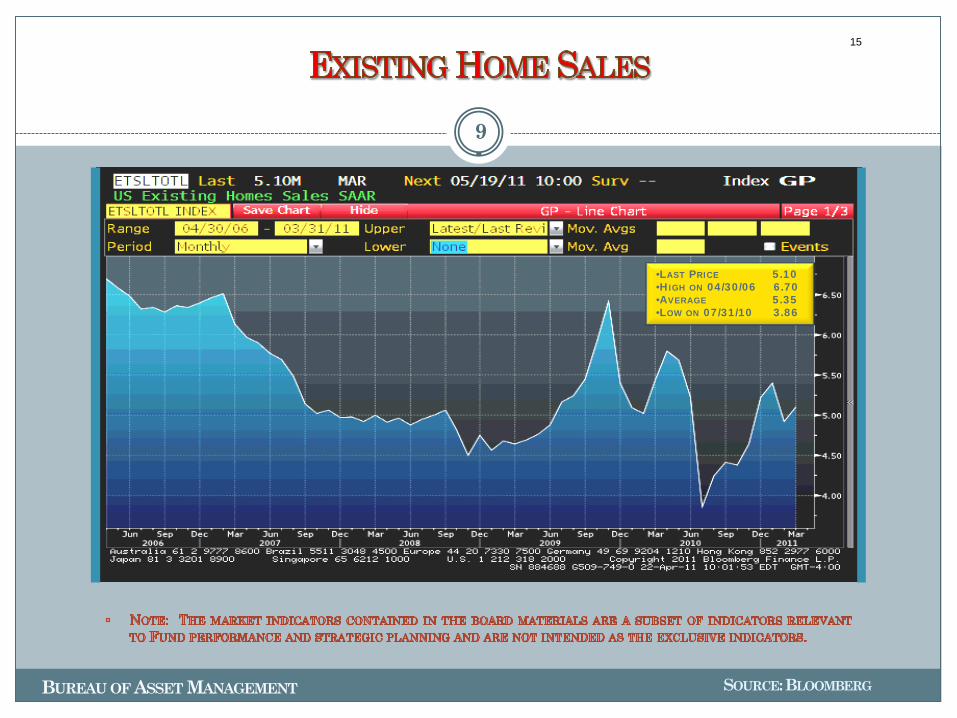
•LAST PRICE 5.10•HIGH ON 04/30/06 6.70•AVERAGE 5.35•LOW ON 07/31/10 3.86
15
BUREAU OF ASSET MANAGEMENT
10
SOURCE: BLOOMBERG
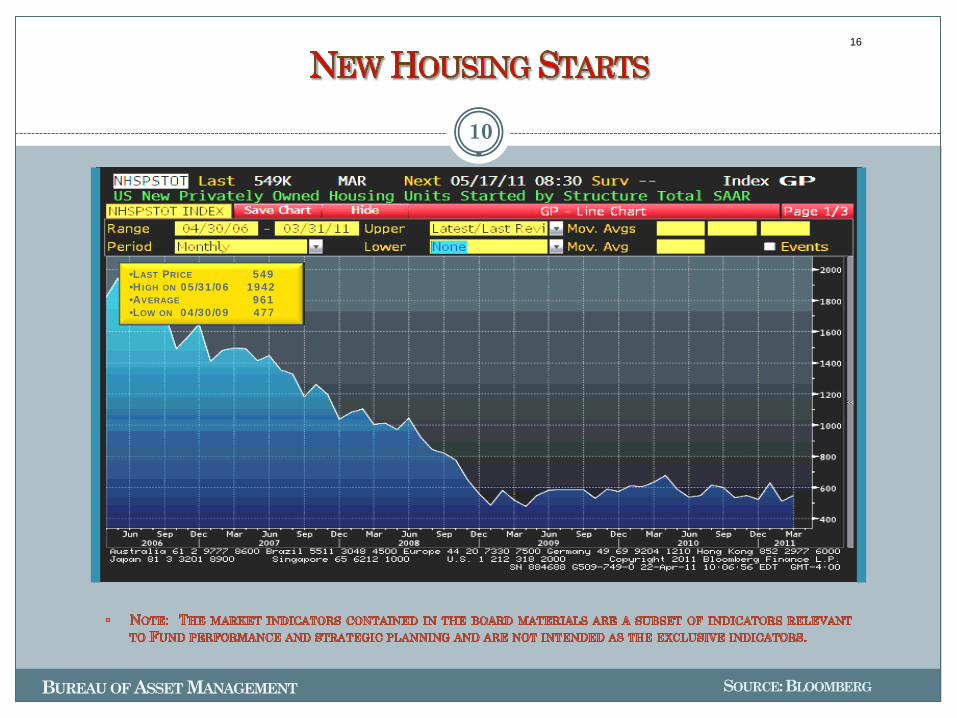
•LAST PRICE 549•HIGH ON 05/31/06 1942•AVERAGE 961•LOW ON 04/30/09 477
16

BUREAU OF ASSET MANAGEMENT
11
SOURCE: BLOOMBERG
•LAST PRICE 5.10•HIGH ON 05/03/11 5.10•AVERAGE 1.57•LOW ON 07/14/09 - 5.70
17

BUREAU OF ASSET MANAGEMENT
12
SOURCE: BLOOMBERG
•LAST PRICE 13.147•HIGH ON 07/31/06 17.17•AVERAGE 13.33•LOW ON 02/28/09 9.34
18
BUREAU OF ASSET MANAGEMENT
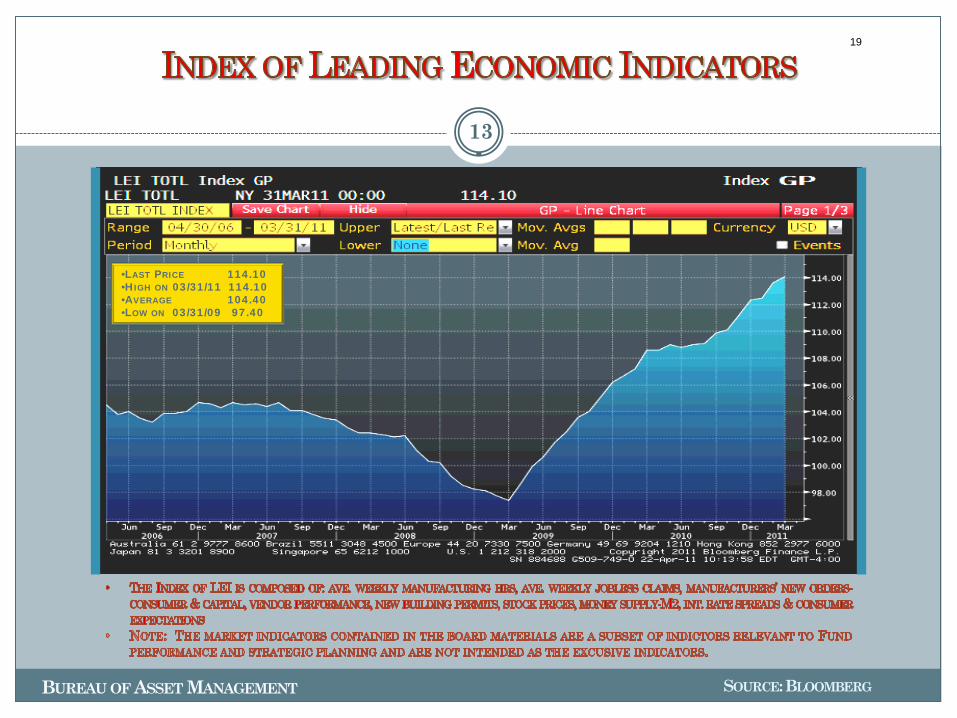
13
SOURCE: BLOOMBERG
•LAST PRICE 114.10•HIGH ON 03/31/11 114.10•AVERAGE 104.40•LOW ON 03/31/09 97.40
19
BUREAU OF ASSET MANAGEMENT
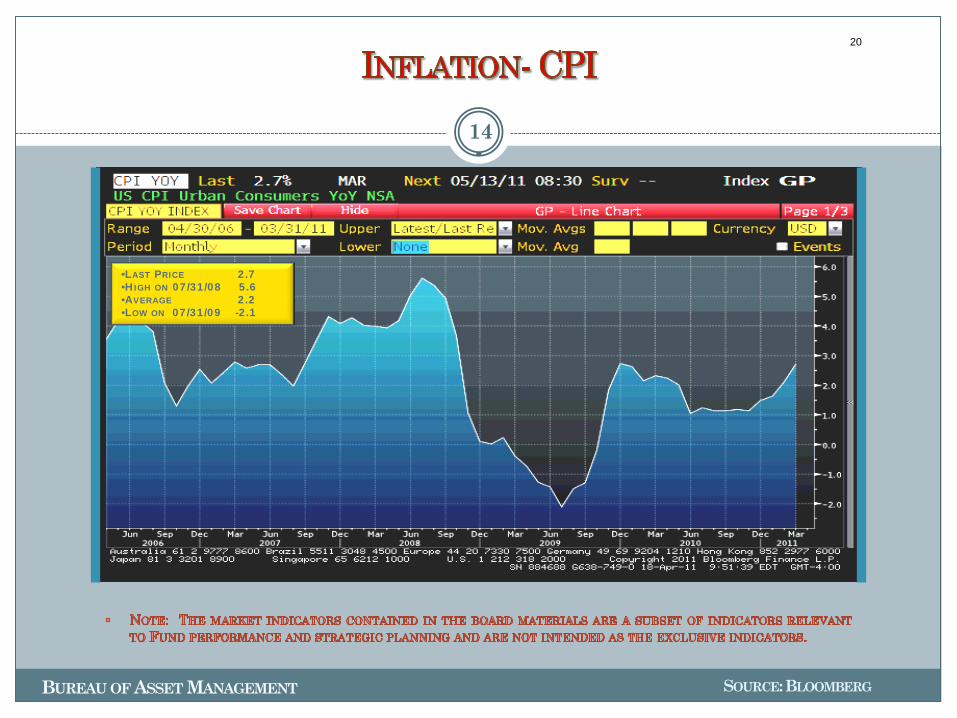
14
SOURCE: BLOOMBERG
•LAST PRICE 2.7•HIGH ON 07/31/08 5.6•AVERAGE 2.2•LOW ON 07/31/09 -2.1
20

15
NYC OFFICE OF THE COMPTROLLERBUREAU OF ASSET MANAGEMENT
BUREAU OF ASSET MANAGEMENT
21
BUREAU OF ASSET MANAGEMENT
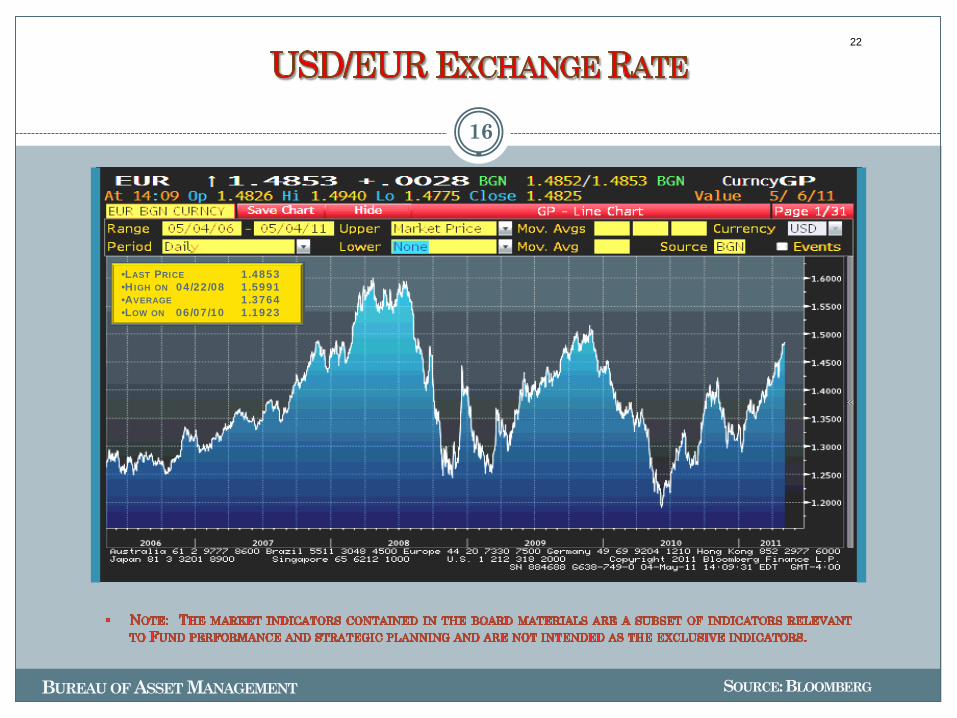
16
SOURCE: BLOOMBERG
•LAST PRICE 1.4853•HIGH ON 04/22/08 1.5991•AVERAGE 1.3764•LOW ON 06/07/10 1.1923
22
BUREAU OF ASSET MANAGEMENT
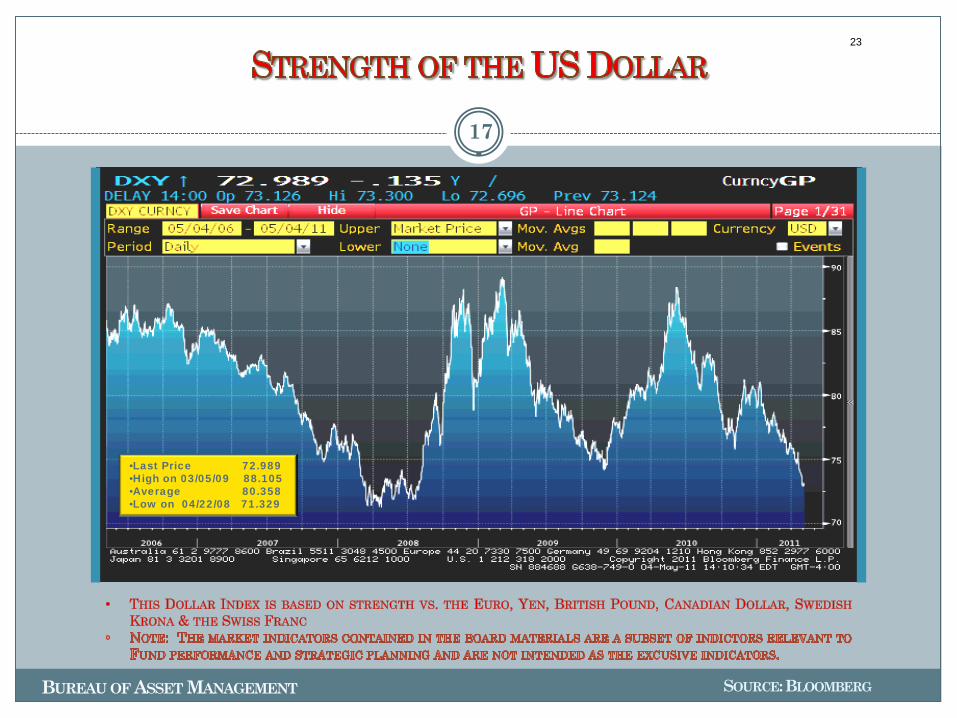
17
SOURCE: BLOOMBERG
•Last Price 72.989•High on 03/05/09 88.105•Average 80.358•Low on 04/22/08 71.329
23

BUREAU OF ASSET MANAGEMENT
18
SOURCE: BLOOMBERG
•ASK PRICE 0.27025•HIGH ON 09/07/07 5.72500•AVERAGE 2.58881•LOW ON 12/21/09 0.24875
24

BUREAU OF ASSET MANAGEMENT
19
SOURCE: BLOOMBERG
•LAST PRICE 17.09 •HIGH ON 11/20/08 80.86•AVERAGE 22.83•LOW ON 01/24/07 9.89
25
BUREAU OF ASSET MANAGEMENT
20
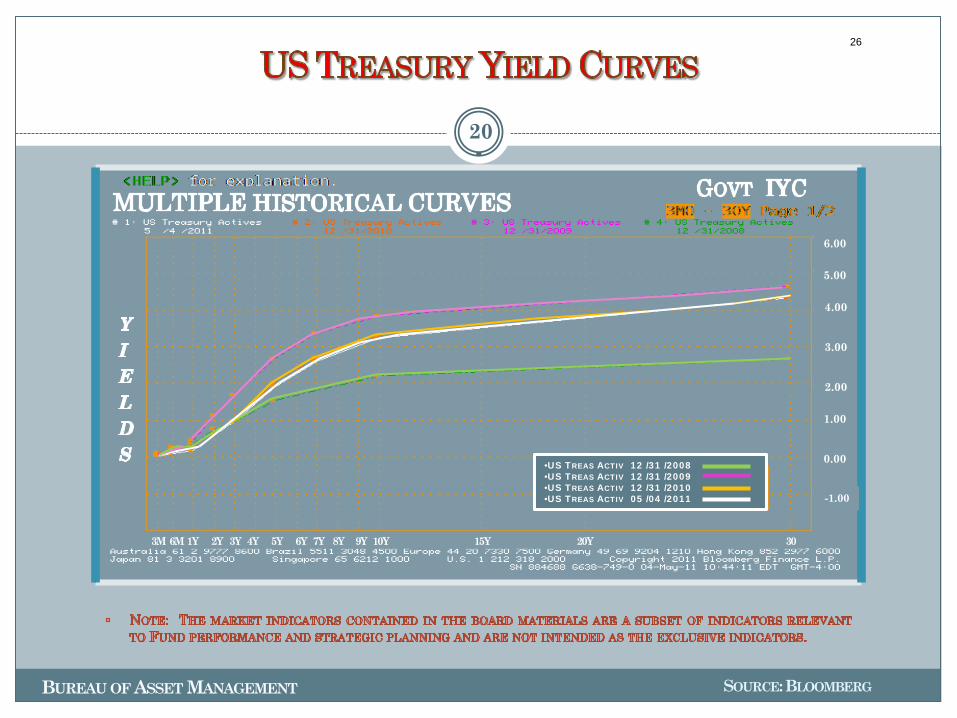
SOURCE: BLOOMBERG
•US TREAS ACTIV 12 /31 /2008•US TREAS ACTIV 12 /31 /2009•US TREAS ACTIV 12 /31 /2010•US TREAS ACTIV 05 /04 /2011
3M 6M 1Y 2Y 3Y 4Y 5Y 6Y 7Y 8Y 9Y 10Y 15Y 20Y 30
6.00
5.00
4.00
3.00
2.00
1.00
0.00
-1.00
26

BUREAU OF ASSET MANAGEMENT
21
SOURCE: BLOOMBERG
•MID LINE 3.220•HIGH ON 06/12/07 5.295•AVERAGE 3.813•LOW ON 12/30/08 2.055
27
BUREAU OF ASSET MANAGEMENT
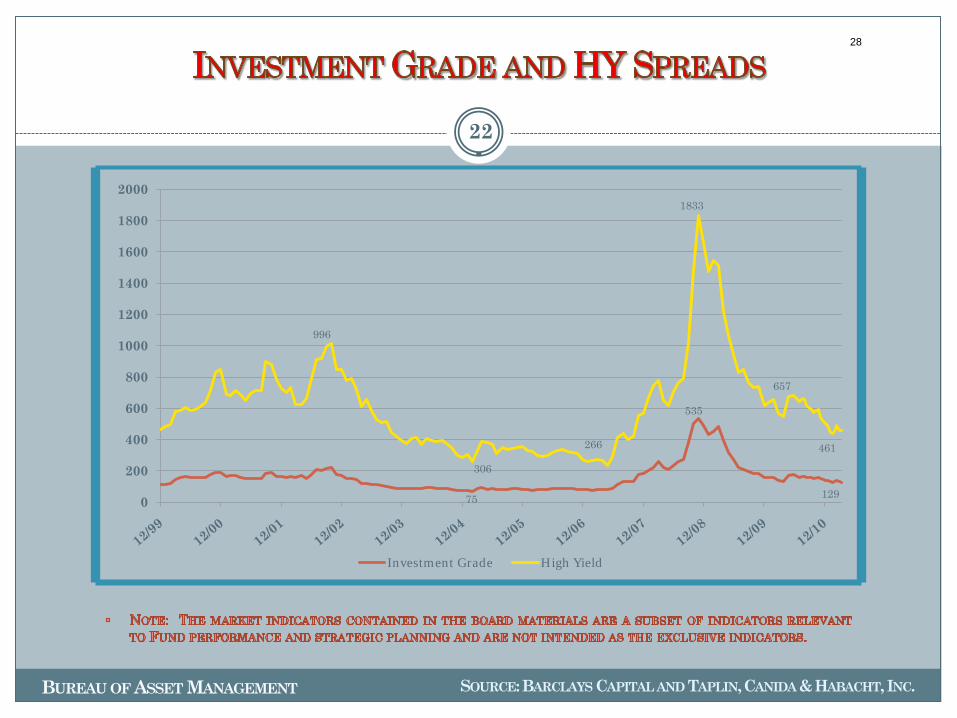
22
SOURCE: BARCLAYS CAPITAL AND TAPLIN, CANIDA & HABACHT, INC.
75
535
129
996
306
266
1833
657
461
0
200
400
600
800
1000
1200
1400
1600
1800
2000
Investment Grade High Yield
28
BUREAU OF ASSET MANAGEMENT
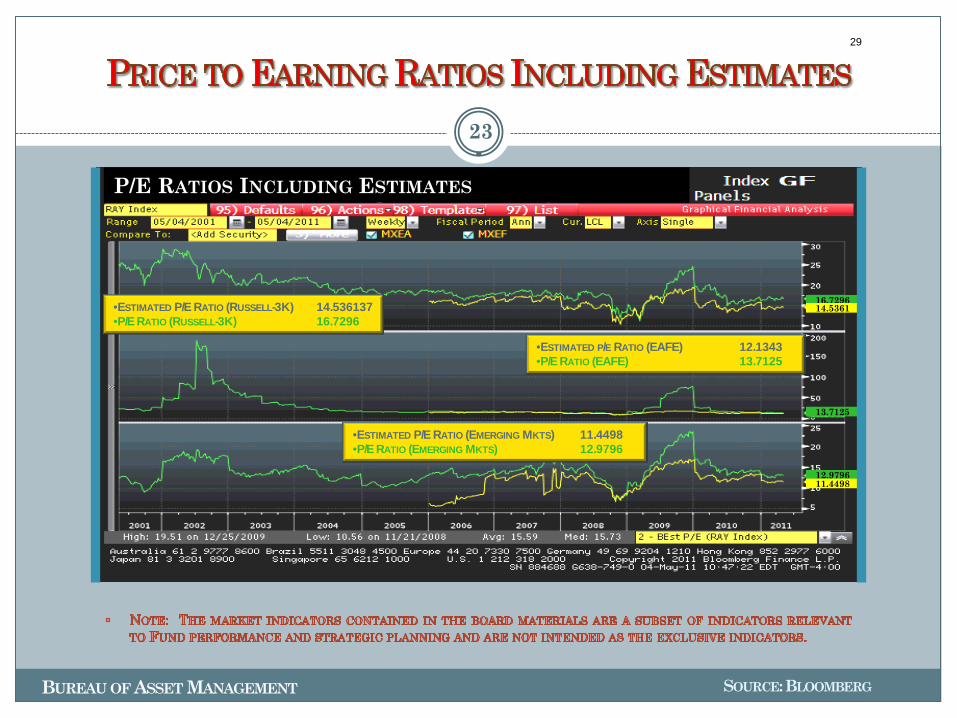
23
SOURCE: BLOOMBERG
•ESTIMATED P/E RATIO (EMERGING MKTS) 11.4498•P/E RATIO (EMERGING MKTS) 12.9796
•ESTIMATED P/E RATIO (RUSSELL-3K) 14.536137•P/E RATIO (RUSSELL-3K) 16.7296
•ESTIMATED P/ERATIO (EAFE) 12.1343•P/E RATIO (EAFE) 13.7125
16.7296
13.7125
12.9796
14.5361
11.4498
P/E RATIOS INCLUDING ESTIMATES
29
BUREAU OF ASSET MANAGEMENT
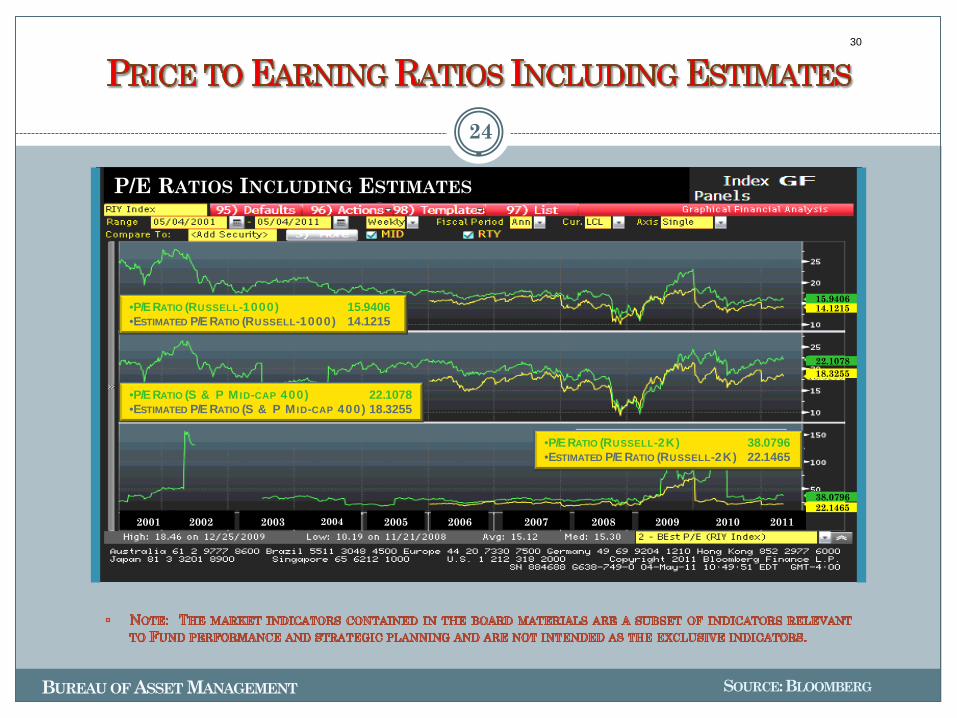
24
SOURCE: BLOOMBERG
•P/E RATIO (RUSSELL-1000) 15.9406•ESTIMATED P/E RATIO (RUSSELL-1000) 14.1215
•P/E RATIO (S & P MID-CAP 400) 22.1078•ESTIMATED P/E RATIO (S & P MID-CAP 400) 18.3255
•P/E RATIO (RUSSELL-2K) 38.0796•ESTIMATED P/E RATIO (RUSSELL-2K) 22.1465
14.1215
18.3255
22.1465
15.9406
22.1078
38.0796
2001 2002 2003 2004 2005 2006 2007 2008 2009 2010 2011
P/E RATIOS INCLUDING ESTIMATES
30

BUREAU OF ASSET MANAGEMENT
25
SOURCE: BLOOMBERG
• RUSSELL 3000 INDEX = RAY INDEX USD• MSCI EAFE = MXEA INDEX USD• MSCI EMERGING MKTS = MXEF INDEX USD
COMPARATIVE RETURNS
31

BUREAU OF ASSET MANAGEMENT
26
SOURCE: BLOOMBERG
Mergers & Acquisitions
32

$23,009.3
$29,079.6
$38,828.0
$34,690.0
$42,251.3
$15,000.0
$20,000.0
$25,000.0
$30,000.0
$35,000.0
$40,000.0
$45,000.0
TRS Market Value2003 ‐ 2011
$23,009.3
$29,079.6
$38,828.0
$34,690.0
$42,251.3
$10,000.0
$15,000.0
$20,000.0
$25,000.0
$30,000.0
$35,000.0
$40,000.0
$45,000.0
TRS Market Value2003 ‐ 2011
The March 2011 market value of $42.251 billion marks a new high for the fund. The previous high was $38.828 billion in September 2007.
33

$37,393.3
$39,089.0 $40,977.2
$42,251.3
$38,000.0
$40,000.0
$42,000.0
$44,000.0
TRS ‐Market ValuesApril 2010 ‐March 2011
$37,393.3
$35,711.4
$39,089.0 $40,977.2
$42,251.3
$32,000.0
$34,000.0
$36,000.0
$38,000.0
$40,000.0
$42,000.0
$44,000.0
TRS ‐Market ValuesApril 2010 ‐March 2011
34
Teachers’ Retirement System of the City of New YorkPerformance Overview as of March 31, 2011
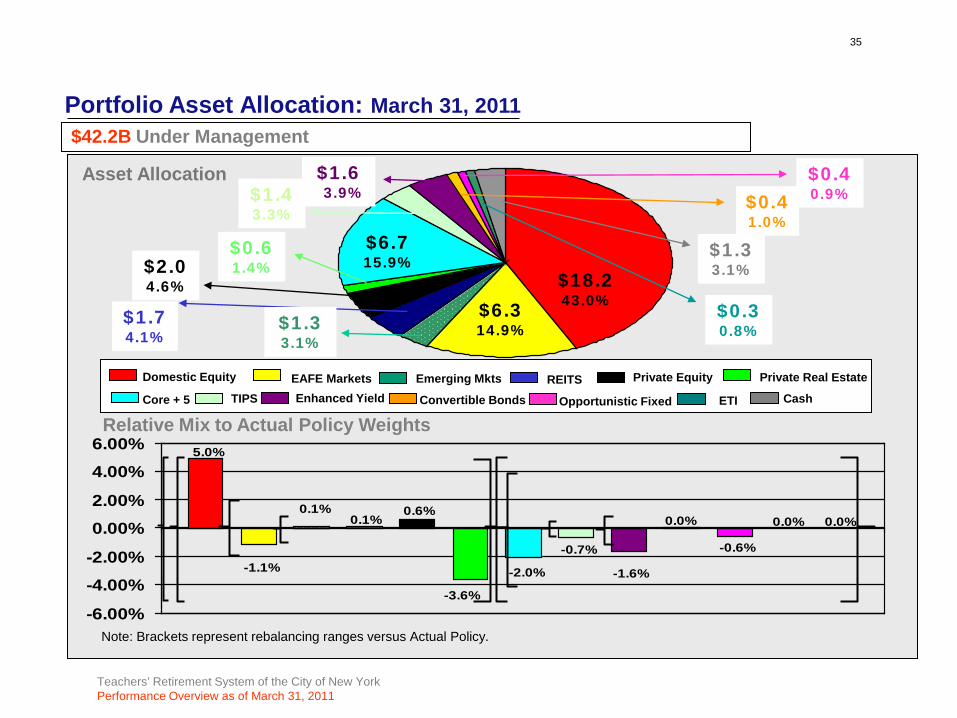
$42.2B Under ManagementPortfolio Asset Allocation: March 31, 2011
Asset Allocation
Relative Mix to Actual Policy Weights5.0%
-1.1%
0.1%0.1%
0.6%
-3.6%
-2.0%
-0.7%
-1.6%
0.0%
-0.6%
0.0% 0.0%
-6.00%
-4.00%
-2.00%
0.00%
2.00%
4.00%
6.00%
Domestic Equity REITSEAFE Markets
Core + 5 Enhanced Yield
Private Equity
$6.3 14.9%
Note: Brackets represent rebalancing ranges versus Actual Policy.
$6.715.9%
$18.243.0%
Private Real Estate
$2.0 4.6%
TIPS Convertible Bonds CashOpportunistic Fixed
$1.63.9%
$1.7 4.1%
$0.6 1.4%
$1.4 3.3%
$0.4 1.0%
$0.4 0.9%
$0.3 0.8%
$1.3 3.1%
ETI
$1.3 3.1%
Emerging Mkts
35

NYC TEACHERS' RETIREMENT SYSTEMCLASSIFICATION OF INVESTMENTS
(as of March 31st 2011)
In $MM Policy % *Adjusted Policy %
Rebalancing Range %
US Equities $18,158.8 38.0% 41.6% 36.6%-46.6%
Non-US Equities/EAFE $6,283.0 16.0% 16.0% 14.0%-18.0%
Emerging Markets $1,301.4 3.0% 3.0% 3.0%
Total Public Equities $25,743.2 57.0% 60.6%
In $MM Policy % *Adjusted Policy %
Rebalancing Range %
US - Government $1,080.9 21.2% 21.2%
US - Mortgage $3,291.1 43.8% 43.8%
US - Investment Grade Credit $2,356.4 35.0% 35.0%
Fixed Income Core + 5 $6,728.5 18.0% 18.1% 14.1%-22.1%
TIPS $1,408.1 4.0% 4.0% 3.5%-4.5%
Enhanced Yield $1,636.8 5.5% 6.0% 5.0%-7.0%
Convertible Bonds $440.0 1.0% 1.0% 1.0%
ETI $338.1 **2.0% **0.8% 0.8%
Cash $1,304.6 0.0% 0.0% 0.0%
Sub-total Fixed Income $11,856.1 28.5% 29.1%
In $MM Policy % Adjusted Policy %
Rebalancing Range %
Real Estate Investment Trusts $1,734.1 4.0% 4.0% 3.0%-5.0%
Private Real Estate $578.3 5.0% 1.4% 1.4%
Total Real Estate $2,312.4 9.0% 5.4%
In $MM Policy % Adjusted Policy %
Rebalancing Range %
Private Equity $1,944.0 4.0% 4.0% 4.0%
In $MM Policy % Adjusted Policy %
Rebalancing Range %
Opportunistic Fixed Income $395.6 1.5% 0.9% 0.9%
In $MM Policy % Adjusted Policy %
Rebalancing Range %
Total Equities $29,999.6 70.0% 70.0% 65.0%-75.0%
Total Fixed Income $12,251.7 30.0% 30.0% 25.0%-35.0%
Neutral to the Core + 5
Index Weights
Actual %
Actual %
Actual %
15.9%
16.1%
48.9%
35.0%
4.1%
1.4%
14.9%
43.0%
Actual %
0.9%1.5%
0.9%
60.9%
0.9%
3.1%
100.0%
3.3%
3.9%
1.0%
3.1%
Actual %
100.0% 100.0%
28.1%
5.5%
4.6%
Absolute Return
$42,251.3
71.0%
29.0%
0.8%
Actual %
TOTAL
$395.6
EMERGINGMARKETS
23%
CONVERTIBLEBONDS
3%
ETI2%
CASH11%
*IF PE, RE, OR OPPORTUNISTIC FI ACTUAL WEIGHTS ARE BELOW THE POLICY WEIGHTS, THE SHORTFALL WILL BEINVESTED IN US EQUITY, CORE + 5, OR HIGH YIELD AS APPROPRIATE.
**ETI'S HAVE A POLICY OF 2% OF THE TOTAL FUND. THE ETI ADJUSTED POLICY % IS SHOWN FOR ILLUSTRATIVEPURPOSES ONLY AND IS NOT INCLUDED IN THE SUB-TOTALS. THE ETI POLICY % IS INCLUDED WITHIN THE POLICY % OFTHE OTHER ASSET CLASSES.
36
NYC Teachers' Retirement System Contribution to Return - March 2011NYC Teachers' Retirement System Contribution to Return - March 2011
0.28
2.86 13.817.88
1.65
NYC Teachers' Retirement System Contribution to Return - March 2011
DOMESTIC EQUITY
INTERNATIONAL EQUITY
CORE +5
TIPS
1.26(0.04)
(0.16)
0.28
2.86 13.817.88
1.65
NYC Teachers' Retirement System Contribution to Return - March 2011
DOMESTIC EQUITY
INTERNATIONAL EQUITY
CORE +5
TIPS
ENHANCED YIELD
CONVERTIBLE BONDS
OPPORTUNISTIC FIXED
(0.05)
0.02
0.58
0.03
0.18
0.02
0 121.25
1.26(0.04)
0.57
4.17
2.03
(0.16)
0.28
2.86 13.817.88
1.65
NYC Teachers' Retirement System Contribution to Return - March 2011
DOMESTIC EQUITY
INTERNATIONAL EQUITY
CORE +5
TIPS
ENHANCED YIELD
CONVERTIBLE BONDS
OPPORTUNISTIC FIXED
TARGETED
OTHER FIXED
(0.01)-RES 0.06-RES (0.35)-RES (0.13)-RES
0.650.08 0.10-PRE 0.22-PRE 0.24-PRE
(0.23)0.28
0.380.68 0.82
(0.02)-PE
(0.05)
0.26
1.170.88
0.06
0.00-Other FI0.00-Other FI
0.00-Other FI 0.01-Other FI 0.02-Other FI
0.00-ETI0.01-ETI
0.04-ETI0.04-ETI
0.03-ETI0.01-Opp FI
0.05-Opp FI0.14-Opp FI
0.20-Opp FI
0.00 -Opp FI
0.00-Conv0.05-Conv
0.21-Conv0.15-Conv
0.00-Conv
0.02
0.19
0.840.84
0.58
0.03
0.06-TIPS0.14-Tips
0.29-TIPS
0.18
0.02
0.12
0.51
1.25
1.26(0.04)
0.57
4.17
2.03
(0.16)
0.28
2.86 13.817.88
1.65
NYC Teachers' Retirement System Contribution to Return - March 2011
DOMESTIC EQUITY
INTERNATIONAL EQUITY
CORE +5
TIPS
ENHANCED YIELD
CONVERTIBLE BONDS
OPPORTUNISTIC FIXED
TARGETED
OTHER FIXED
REITS
PRIVATE EQUITY
PRIVATE REAL ESTATE
RESIDUAL(0.01)-RES 0.06-RES (0.35)-RES (0.13)-RES
0.650.08 0.10-PRE 0.22-PRE 0.24-PRE
(0.23)0.28
0.380.68 0.82
(0.02)-PE
(0.05)
0.26
1.170.88
0.06
0.00-Other FI0.00-Other FI
0.00-Other FI 0.01-Other FI 0.02-Other FI
0.00-ETI0.01-ETI
0.04-ETI0.04-ETI
0.03-ETI0.01-Opp FI
0.05-Opp FI0.14-Opp FI
0.20-Opp FI
0.00 -Opp FI
0.00-Conv0.05-Conv
0.21-Conv0.15-Conv
0.00-Conv
0.02
0.19
0.840.84
0.58
0.03
0.06-TIPS0.14-Tips
0.29-TIPS
0.18
0.02
0.12
0.51
1.25
1.26(0.04)
0.57
4.17
2.03
(0.16)
0.28
2.86 13.817.88
1.65
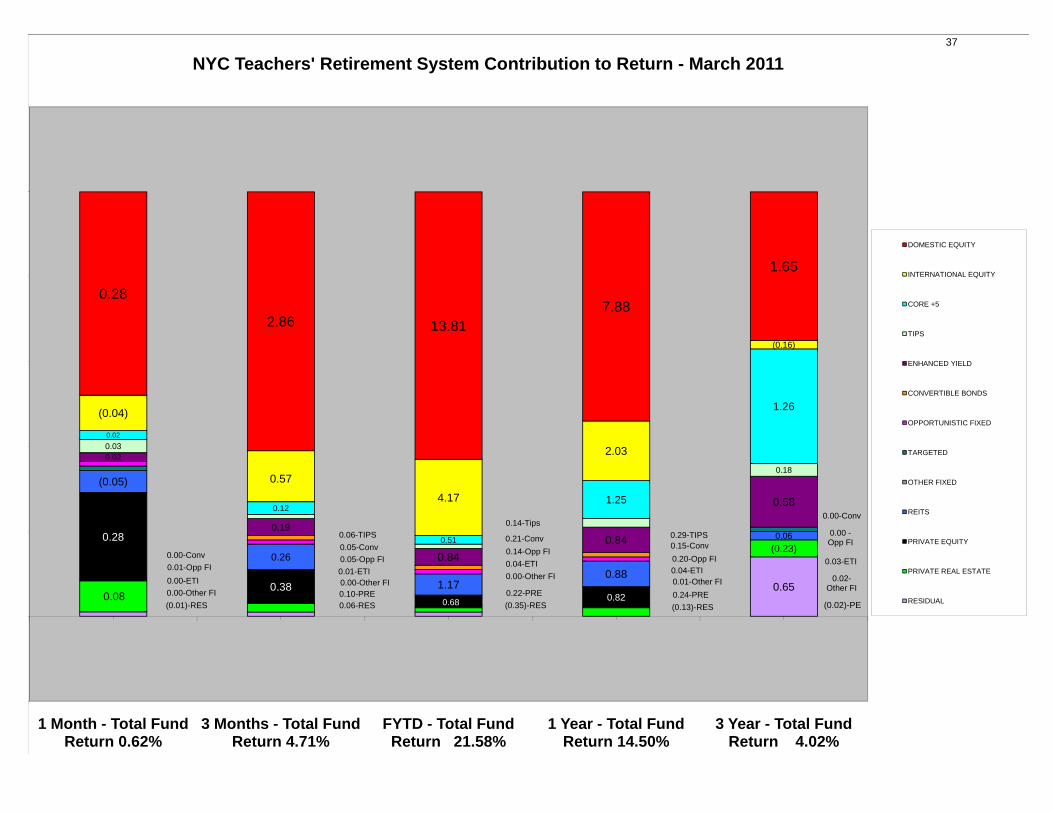
1 Month - Total Fund Return 0.62%
3 Months - Total Fund Return 4.71%
FYTD - Total Fund Return 21.58%
1 Year - Total Fund Return 14.50%
3 Year - Total Fund Return 4.02%
NYC Teachers' Retirement System Contribution to Return - March 2011
DOMESTIC EQUITY
INTERNATIONAL EQUITY
CORE +5
TIPS
ENHANCED YIELD
CONVERTIBLE BONDS
OPPORTUNISTIC FIXED
TARGETED
OTHER FIXED
REITS
PRIVATE EQUITY
PRIVATE REAL ESTATE
RESIDUAL
37

Trailing Trailing 06/30/10 Trailing Trailing* Trailing* Trailing* Trailing*1 Month 3 Months 03/31/11 1 Year 2 Years 3 Years 5 Years 10 Years
MARKET INDICATORS
STANDARD & POORS 500 0.04 5.92 30.56 15.65 31.63 2.36 2.62 3.29S&P MIDCAP INDEX 400 2.45 9.36 40.41 26.95 44.36 10.01 6.07 9.37RUSSELL 1000 0.26 6.24 31.77 16.69 33.03 2.98 2.93 3.83RUSSELL 2000 2.59 7.94 39.65 25.79 43.12 8.57 3.35 7.87RUSSELL 3000 0.45 6.38 32.40 17.41 33.81 3.42 2.95 4.13RUSSELL 3000 GROWTH 0.42 6.30 34.82 19.24 34.00 5.58 4.32 3.25RUSSELL 3000 VALUE 0.48 6.47 30.02 15.60 33.65 1.09 1.42 4.86
MSCI EAFE (NET DIVIDEND) -2.24 3.36 28.36 10.42 30.61 -3.02 1.30 5.39MSCI EMERGING MARKETS FREE 5.90 2.10 29.52 18.78 46.89 4.63 11.02 17.13FTSE CUSTOM BENCHMARK 6.14 0.64 31.26 20.30 51.28 5.85 11.95 ****MSCI WORLD INDEX -0.94 4.91 30.31 14.03 32.21 0.34 2.65 4.74MSCI EUROPE SMID CAP INDEX 0.85 6.54 40.37 21.10 44.60 -1.23 **** ****
NYC - TREASURY AGENCY PLUS FIVE 0.00 -0.36 -0.92 7.34 1.83 4.53 6.73 6.33CITIGROUP MORTGAGE 0.18 0.61 1.36 4.53 4.78 5.93 6.53 5.71NYC - INVESTMENT GRADE CREDIT INDEX 0.01 0.81 3.51 6.89 13.45 6.73 6.14 6.09NYC - CORE PLUS FIVE 0.08 0.47 1.54 5.80 6.82 6.01 6.59 6.05CITIGROUP BROAD INVESTMENT GRADE 0.05 0.36 1.34 5.06 5.75 5.34 6.20 5.67BARCLAYS CAPITAL AGGREGATE 0.06 0.42 1.57 5.12 6.40 5.30 6.02 5.57
CITIGROUP BB & B 0.41 3.80 13.41 13.72 25.04 8.19 6.46 6.96BofA MERRILL LYNCH HY MASTER II 0.42 3.90 14.27 14.18 34.01 12.70 9.03 8.41
BARCLAYS CAPITAL GLOBAL US TIPS (INFLATION NOTES) 1.02 2.08 3.94 7.97 7.08 3.95 6.26 6.75
BofA ML ALL CONVERTIBLES EX MANDATORY 0.69 5.66 23.53 16.92 32.94 8.53 **** ****
DJ WILSHIRE REAL ESTATE SECURITIES INDEX -1.42 6.66 30.01 24.40 63.53 1.37 0.56 11.10NCREIF NFI-ODCE NET 3.89 3.89 14.45 19.13 -1.62 -9.73 -1.01 ****
91 DAY TREASURY BILL 0.03 0.05 0.13 0.16 0.17 0.52 2.23 2.24
THE BANK OF NEW YORK MELLONCITY OF NEW YORK
Market Indicator Page *NYC Teachers' Retirement SystemMarch 31, 2011
38

Assets % Trailing Trailing Fiscal Calendar Calendar Calendar Calendar Calendar Trailing Trailing* Trailing* Trailing* Since ($MM) of Total 1 Month 3 Months YTD YTD YTD 2010 YTD 2009 YTD 2008 YTD 2007 1 Year 3 Years 5 Years 10 Years Inception
ASSET CLASS SUMMARY
DOMESTIC EQUITY 18,158.8$ 42.98% 0.63% 6.47% 32.76% 6.47% 17.33% 28.33% -37.09% 4.86% 17.87% 3.68% 3.01% **** 9.84%
INTERNATIONAL EAFE 6,283.0 14.87% -1.29 3.17 28.18 3.17 11.42 32.77 -42.36 11.49 12.77 -1.20 2.60 **** 7.49
TOTAL EMERGING MARKETS 1,301.4 3.08% **** **** **** **** **** **** **** **** **** **** **** **** ****
TOTAL REAL ESTATE EQUITY SECURITIES 1,734.1 4.10% -1.35 6.48 30.51 6.48 32.10 30.86 -41.06 -16.75 26.88 1.62 1.65 **** 13.39
CORE + 5 6,728.5 15.92% 0.10 0.74 2.71 0.74 8.58 8.54 2.98 6.64 6.95 6.43 6.54 6.12 8.37
CONVERTIBLE BONDS 440.0 1.04% 0.10 4.56 19.74 4.56 13.18 34.16 **** **** 14.07 **** **** **** 8.34
TIPS MANAGERS 1,408.1 3.33% 0.99 1.87 3.62 1.87 6.47 10.14 -0.74 11.71 7.85 4.04 6.37 **** 5.24
ENHANCED YIELD 1,636.8 3.87% 0.42 3.83 13.48 3.83 13.43 38.75 -18.14 3.95 13.73 10.92 8.30 7.50 6.15
OPPORTUNISTIC FIXED INCOME 395.6 0.94% 1.32 4.74 13.70 4.74 23.88 18.09 -9.68 **** 22.12 11.45 **** **** 6.89
ECONOMICALLY TARGETED INVESTMENTS 338.1 0.80% 0.14 0.83 2.43 0.83 6.61 7.62 6.43 6.20 5.19 6.19 6.51 6.34 9.80
PRIVATE EQUITY 1,944.0 4.60% 6.45 8.46 13.39 8.46 14.04 -4.44 -1.50 15.33 19.21 4.98 8.25 **** 12.33
PRIVATE REAL ESTATE 578.3 1.37% 6.42 8.30 19.77 8.30 9.99 -44.20 -7.61 68.62 23.28 -15.13 3.08 **** 6.55
CASH 1,262.6 2.99% 0.04 0.04 0.19 0.04 0.48 1.25 3.80 5.67 0.33 1.41 3.03 2.84 5.70
TOTAL TEACHERS 42,251.3$ 0.62% 4.71% 21.58% 4.71% 13.92% 21.15% -26.35% 6.24% 14.50% 4.02% 4.45% 5.74% 8.70%
TOTAL EQUITY 27,477.3 65.03% 0.27 5.77 31.62 5.77 16.64 29.37 -38.60 4.94 17.25 2.37 2.84 **** 5.94
TOTAL FIXED INCOME 10,947.0 25.91% 0.31 1.70 5.69 1.70 9.77 14.75 -2.25 6.80 8.92 7.30 7.09 **** 5.95
TOTAL PRIVATE EQUITY 1,944.0 4.60% 6.45 8.46 13.39 8.46 14.04 -4.44 -1.50 15.33 19.21 4.98 8.25 **** 12.33
TOTAL PRIVATE REAL ESTATE 578.3 1.37% 6.42 8.30 19.77 8.30 9.99 -44.20 -7.61 68.62 23.28 -15.13 3.08 **** 6.55
TOTAL CASH 1,304.6 3.09% 0.04 0.05 0.20 0.05 0.45 1.23 3.70 5.66 0.39 1.38 3.00 **** 3.05
THE BANK OF NEW YORK MELLONCITY OF NEW YORK
Manager / Benchmark Comparison Report *NYC Teachers' Retirement SystemMarch 31, 2011
Page 1
39

Assets % Trailing Trailing Fiscal Calendar Calendar Calendar Calendar Calendar Trailing Trailing* Trailing* Trailing* Since ($MM) of Total 1 Month 3 Months YTD YTD YTD 2010 YTD 2009 YTD 2008 YTD 2007 1 Year 3 Years 5 Years 10 Years Inception
THE BANK OF NEW YORK MELLONCITY OF NEW YORK
Manager / Benchmark Comparison Report *NYC Teachers' Retirement SystemMarch 31, 2011
EQUITY ASSET CLASS SUMMARY
DOMESTIC EQUITY 18,158.8$ 44.12% 0.63% 6.47% 32.76% 6.47% 17.33% 28.33% -37.09% 4.86% 17.87% 3.68% 3.01% 4.22% 9.84%
ACTIVE DOMESTIC EQUITY 837.1 2.03% 1.19 6.38 33.00 6.38 18.47 31.54 -39.33 6.32 18.34 4.07 2.44 3.91 1.64RUSSELL 3000 0.45 6.38 32.40 6.38 16.93 28.34 -37.31 5.13 17.41 3.42 2.95 4.13
+/- 0.74 0.00 0.60 0.00 1.54 3.20 (2.02) 1.19 0.93 0.65 (0.51) (0.22)
PASSIVE DOMESTIC EQUITY 17,262.4 41.94% 0.59 6.34 32.62 6.34 17.23 28.40 -37.16 5.16 17.65 3.54 3.04 4.23 8.90RUSSELL 3000 0.45 6.38 32.40 6.38 16.93 28.34 -37.31 5.13 17.41 3.42 2.95 4.13
+/- 0.14 (0.04) 0.22 (0.04) 0.30 0.06 0.15 0.03 0.24 0.12 0.09 0.10
DEVELOPED MARKETS 6,283.0 15.26% -1.29 3.17 28.18 3.17 11.42 32.77 -42.36 11.49 12.77 -1.20 2.60 **** 7.49
ACTIVE DEVELOPED MARKETS 6,085.5 14.78% -1.39 3.12 27.84 3.12 11.14 32.60 -42.05 11.49 12.44 -1.16 2.62 6.35 6.93MSCI EAFE (NET DIVIDEND) -2.24 3.36 28.36 3.36 7.75 31.78 -43.39 11.17 10.42 -3.02 1.30 5.39
+/- 0.85 (0.24) (0.52) (0.24) 3.39 0.82 1.34 0.32 2.02 1.86 1.32 0.96
EMERGING MARKETS 1,301.4 3.16% **** **** **** **** **** **** **** **** **** **** **** **** ****
PASSIVE EMERGING MARKETS 1,301.4 3.16% **** **** **** **** **** **** **** **** **** **** **** **** ****MSCI EMERGING MARKETS FREE 5.90 2.10 29.52 2.10 19.20 79.02 -53.17 39.78 18.78 4.63 11.02 17.13
+/- **** **** **** **** **** **** **** **** **** **** **** ****
Page 2
40
Assets % Trailing Trailing Fiscal Calendar Calendar Calendar Calendar Calendar Trailing Trailing* Trailing* Trailing* Since ($MM) of Total 1 Month 3 Months YTD YTD YTD 2010 YTD 2009 YTD 2008 YTD 2007 1 Year 3 Years 5 Years 10 Years Inception
THE BANK OF NEW YORK MELLONCITY OF NEW YORK
Manager / Benchmark Comparison Report *NYC Teachers' Retirement SystemMarch 31, 2011
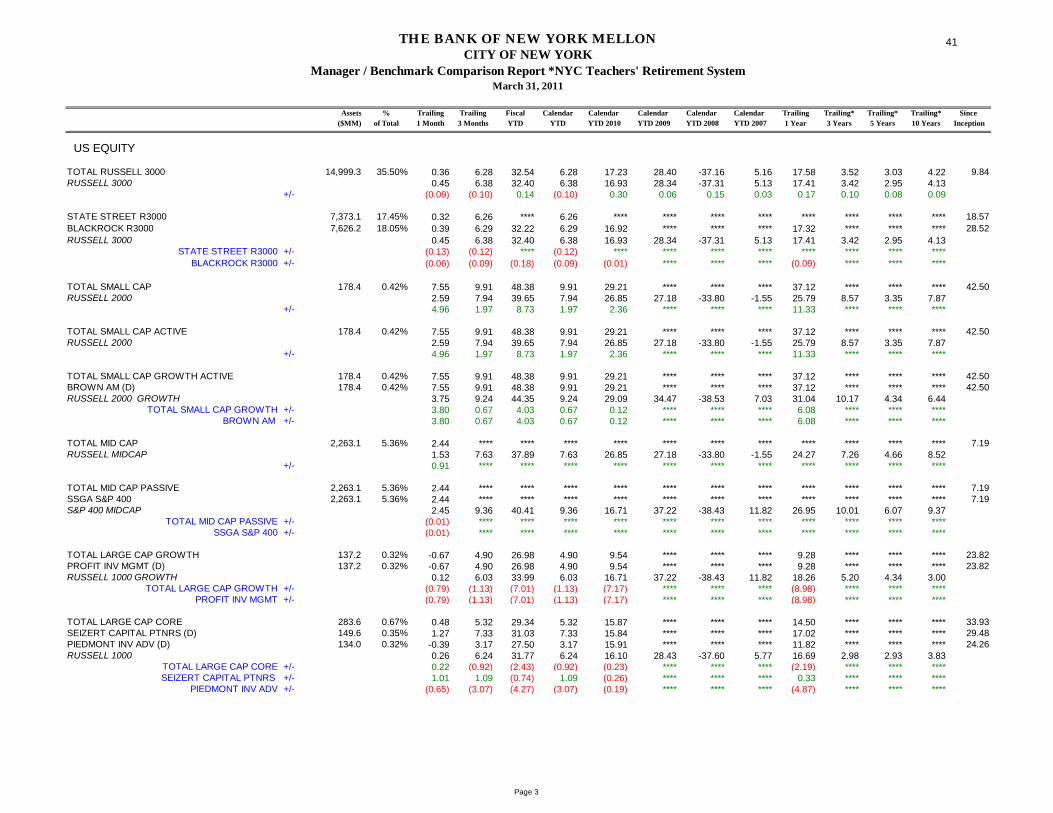
US EQUITY
TOTAL RUSSELL 3000 14,999.3 35.50% 0.36 6.28 32.54 6.28 17.23 28.40 -37.16 5.16 17.58 3.52 3.03 4.22 9.84RUSSELL 3000 0.45 6.38 32.40 6.38 16.93 28.34 -37.31 5.13 17.41 3.42 2.95 4.13
+/- (0.09) (0.10) 0.14 (0.10) 0.30 0.06 0.15 0.03 0.17 0.10 0.08 0.09
STATE STREET R3000 7,373.1 17.45% 0.32 6.26 **** 6.26 **** **** **** **** **** **** **** **** 18.57BLACKROCK R3000 7,626.2 18.05% 0.39 6.29 32.22 6.29 16.92 **** **** **** 17.32 **** **** **** 28.52RUSSELL 3000 0.45 6.38 32.40 6.38 16.93 28.34 -37.31 5.13 17.41 3.42 2.95 4.13
STATE STREET R3000 +/- (0.13) (0.12) **** (0.12) **** **** **** **** **** **** **** ****BLACKROCK R3000 +/- (0.06) (0.09) (0.18) (0.09) (0.01) **** **** **** (0.09) **** **** ****
TOTAL SMALL CAP 178.4 0.42% 7.55 9.91 48.38 9.91 29.21 **** **** **** 37.12 **** **** **** 42.50RUSSELL 2000 2.59 7.94 39.65 7.94 26.85 27.18 -33.80 -1.55 25.79 8.57 3.35 7.87
+/- 4.96 1.97 8.73 1.97 2.36 **** **** **** 11.33 **** **** ****
TOTAL SMALL CAP ACTIVE 178.4 0.42% 7.55 9.91 48.38 9.91 29.21 **** **** **** 37.12 **** **** **** 42.50RUSSELL 2000 2.59 7.94 39.65 7.94 26.85 27.18 -33.80 -1.55 25.79 8.57 3.35 7.87
+/- 4.96 1.97 8.73 1.97 2.36 **** **** **** 11.33 **** **** ****
TOTAL SMALL CAP GROWTH ACTIVE 178.4 0.42% 7.55 9.91 48.38 9.91 29.21 **** **** **** 37.12 **** **** **** 42.50BROWN AM (D) 178.4 0.42% 7.55 9.91 48.38 9.91 29.21 **** **** **** 37.12 **** **** **** 42.50RUSSELL 2000 GROWTH 3.75 9.24 44.35 9.24 29.09 34.47 -38.53 7.03 31.04 10.17 4.34 6.44
TOTAL SMALL CAP GROWTH +/- 3.80 0.67 4.03 0.67 0.12 **** **** **** 6.08 **** **** ****BROWN AM +/- 3.80 0.67 4.03 0.67 0.12 **** **** **** 6.08 **** **** ****
TOTAL MID CAP 2,263.1 5.36% 2.44 **** **** **** **** **** **** **** **** **** **** **** 7.19RUSSELL MIDCAP 1.53 7.63 37.89 7.63 26.85 27.18 -33.80 -1.55 24.27 7.26 4.66 8.52
+/- 0.91 **** **** **** **** **** **** **** **** **** **** ****
TOTAL MID CAP PASSIVE 2,263.1 5.36% 2.44 **** **** **** **** **** **** **** **** **** **** **** 7.19SSGA S&P 400 2,263.1 5.36% 2.44 **** **** **** **** **** **** **** **** **** **** **** 7.19S&P 400 MIDCAP 2.45 9.36 40.41 9.36 16.71 37.22 -38.43 11.82 26.95 10.01 6.07 9.37
TOTAL MID CAP PASSIVE +/- (0.01) **** **** **** **** **** **** **** **** **** **** ****SSGA S&P 400 +/- (0.01) **** **** **** **** **** **** **** **** **** **** ****
TOTAL LARGE CAP GROWTH 137.2 0.32% -0.67 4.90 26.98 4.90 9.54 **** **** **** 9.28 **** **** **** 23.82PROFIT INV MGMT (D) 137.2 0.32% -0.67 4.90 26.98 4.90 9.54 **** **** **** 9.28 **** **** **** 23.82RUSSELL 1000 GROWTH 0.12 6.03 33.99 6.03 16.71 37.22 -38.43 11.82 18.26 5.20 4.34 3.00
TOTAL LARGE CAP GROWTH +/- (0.79) (1.13) (7.01) (1.13) (7.17) **** **** **** (8.98) **** **** ****PROFIT INV MGMT +/- (0.79) (1.13) (7.01) (1.13) (7.17) **** **** **** (8.98) **** **** ****
TOTAL LARGE CAP CORE 283.6 0.67% 0.48 5.32 29.34 5.32 15.87 **** **** **** 14.50 **** **** **** 33.93SEIZERT CAPITAL PTNRS (D) 149.6 0.35% 1.27 7.33 31.03 7.33 15.84 **** **** **** 17.02 **** **** **** 29.48PIEDMONT INV ADV (D) 134.0 0.32% -0.39 3.17 27.50 3.17 15.91 **** **** **** 11.82 **** **** **** 24.26RUSSELL 1000 0.26 6.24 31.77 6.24 16.10 28.43 -37.60 5.77 16.69 2.98 2.93 3.83
TOTAL LARGE CAP CORE +/- 0.22 (0.92) (2.43) (0.92) (0.23) **** **** **** (2.19) **** **** ****SEIZERT CAPITAL PTNRS +/- 1.01 1.09 (0.74) 1.09 (0.26) **** **** **** 0.33 **** **** ****
PIEDMONT INV ADV +/- (0.65) (3.07) (4.27) (3.07) (0.19) **** **** **** (4.87) **** **** ****
Page 3
41

Assets % Trailing Trailing Fiscal Calendar Calendar Calendar Calendar Calendar Trailing Trailing* Trailing* Trailing* Since ($MM) of Total 1 Month 3 Months YTD YTD YTD 2010 YTD 2009 YTD 2008 YTD 2007 1 Year 3 Years 5 Years 10 Years Inception
THE BANK OF NEW YORK MELLONCITY OF NEW YORK
Manager / Benchmark Comparison Report *NYC Teachers' Retirement SystemMarch 31, 2011
TOTAL LARGE CAP 421.0 1.00% -0.79 4.71 27.38 4.71 12.82 **** **** **** 11.72 **** **** **** 29.51RUSSELL 1000 0.26 6.24 31.77 6.24 16.10 28.43 -37.60 5.77 16.69 2.98 2.93 3.83
+/- (1.05) (1.53) (4.39) (1.53) (3.28) **** **** **** (4.97) **** **** ****
EMERGING MANAGERS
F.I.S FUND MGMT 81.0 0.19% 0.54 6.70 32.85 6.70 16.51 27.00 -35.46 **** 17.62 3.93 **** **** 0.58CAPITAL PROSPECTS 34.9 0.08% 1.32 7.86 34.52 7.86 18.58 27.10 -37.68 **** 20.65 4.43 **** **** 0.22RUSSELL 3000 0.45 6.38 32.40 6.38 16.93 28.34 -37.31 5.13 17.41 3.42 2.95 4.13
F.I.S FUND MGMT +/- 0.09 0.32 0.45 0.32 (0.42) (1.34) 1.85 **** 0.21 0.51 **** ****CAPITAL PROSPECTS +/- 0.87 1.48 2.12 1.48 1.65 (1.24) (0.37) **** 3.24 1.01 **** ****
ATTUCKS 39.4 0.09% 2.40 9.13 41.92 9.13 28.59 26.84 -36.42 **** 29.66 8.23 **** **** 3.88RUSSELL 2000 2.59 7.94 39.65 7.94 26.85 27.18 -33.80 -1.55 25.79 8.57 3.35 7.87
+/- (0.19) 1.19 2.27 1.19 1.74 (0.34) (2.62) **** 3.87 (0.34) **** ****
PROGRESS EQUITY 82.3 0.19% 2.44 8.83 38.47 8.83 22.53 34.20 -40.56 **** 24.70 6.42 **** **** 1.92RUSSELL MIDCAP 1.53 7.63 37.89 7.63 25.47 40.46 -41.46 5.59 24.27 7.26 4.66 8.52
+/- 0.91 1.20 0.58 1.20 (2.94) (6.26) 0.90 **** 0.43 (0.84) **** ****
TOTAL EMERGING MGRS 237.7 0.56% 1.61 8.00 36.61 8.00 21.13 29.70 -37.28 **** 22.62 6.01 **** **** 2.03RUSSELL 3000 0.45 6.38 32.40 6.38 16.93 28.34 -37.31 5.13 17.41 3.42 2.95 4.13
+/- 1.16 1.62 4.21 1.62 4.20 1.36 0.03 **** 5.21 2.59 **** ****
U.S. ENVIRONMENTAL
WALDEN ASSET MGMT 54.6 0.13% 3.68 7.75 34.34 7.75 25.69 29.88 **** **** 27.19 **** **** **** 8.92RUSSELL 2000 2.59 7.94 39.65 7.94 26.85 27.18 -33.80 -1.55 25.79 8.57 3.35 7.87
+/- 1.09 (0.19) (5.31) (0.19) (1.16) 2.70 **** **** 1.40 **** **** ****
TOTAL U.S. ENVIRONMENTAL 54.6 0.13% 3.68 7.75 34.34 7.75 27.39 31.28 **** **** 27.19 **** **** **** 6.92RUSSELL 2000 2.59 7.94 39.65 7.94 26.85 27.18 -33.80 -1.55 25.79 8.57 3.35 7.87
+/- 1.09 (0.19) (5.31) (0.19) 0.54 4.10 **** **** 1.40 **** **** ****
NON - US EQUITY
TOTAL INTL GROWTH 2,524.9 5.98% -0.33 3.15 28.07 3.15 12.52 34.40 -40.92 **** 13.13 0.49 **** **** -1.50BAILLIE 933.9 2.21% 0.46 2.49 31.03 2.49 18.23 41.76 -44.08 **** 15.96 1.16 **** **** -1.23WALTER -SCOTT 820.3 1.94% -1.38 2.07 23.06 2.07 14.30 34.26 -32.07 **** 13.09 4.52 **** **** 2.72MARTIN CURRIE 770.7 1.82% -0.17 5.16 30.15 5.16 4.47 26.80 -46.34 **** 9.91 -4.73 **** **** -8.57MSCI EAFE GROWTH -1.18 2.30 28.68 2.30 12.60 29.91 -42.46 16.85 12.88 -2.16 2.50 ****
TOTAL INTL GROWTH +/- 0.85 0.85 (0.61) 0.85 (0.08) 4.49 1.54 **** 0.25 2.65 **** ****BAILLIE +/- 1.64 0.19 2.35 0.19 5.63 11.85 (1.62) **** 3.08 3.32 **** ****
WALTER -SCOTT +/- (0.20) (0.23) (5.62) (0.23) 1.70 4.35 10.39 **** 0.21 6.68 **** ****MARTIN CURRIE +/- 1.01 2.86 1.47 2.86 (8.13) (3.11) (3.88) **** (2.97) (2.57) **** ****
Page 4
42

Assets % Trailing Trailing Fiscal Calendar Calendar Calendar Calendar Calendar Trailing Trailing* Trailing* Trailing* Since ($MM) of Total 1 Month 3 Months YTD YTD YTD 2010 YTD 2009 YTD 2008 YTD 2007 1 Year 3 Years 5 Years 10 Years Inception
THE BANK OF NEW YORK MELLONCITY OF NEW YORK
Manager / Benchmark Comparison Report *NYC Teachers' Retirement SystemMarch 31, 2011
TOTAL INTL VALUE 2,311.3 5.47% -2.42 2.71 26.65 2.71 9.44 31.02 -42.34 9.93 10.71 -2.66 2.51 **** 7.67SPRUCEGROVE (NEW) 916.3 2.17% -1.05 1.42 27.45 1.42 19.93 35.62 -41.62 **** 15.33 0.82 **** **** -1.87MONDRIAN INVESTMENT PARTNERS LTD II 812.1 1.92% -2.16 4.35 25.11 4.35 3.16 24.13 **** **** 9.39 **** **** **** -4.09ALLIANCE 582.9 1.38% -4.84 2.50 27.56 2.50 3.65 34.15 -48.24 **** 5.79 -6.57 **** **** -8.20MSCI EAFE VALUE -3.21 4.64 28.38 4.64 3.81 35.06 -43.68 6.47 8.82 -2.96 0.97 ****
TOTAL INTL VALUE +/- 0.79 (1.93) (1.73) (1.93) 5.63 (4.04) 1.34 3.46 1.89 0.30 1.54 ****SPRUCEGROVE (NEW) +/- 2.16 (3.22) (0.93) (3.22) 16.12 0.56 2.06 **** 6.51 3.78 **** ****
MONDRIAN INVESTMENT PARTNERS LTD II +/- 1.05 (0.29) (3.27) (0.29) (0.65) (10.93) **** **** 0.57 **** **** ****ALLIANCE +/- (1.63) (2.14) (0.82) (2.14) (0.16) (0.91) (4.56) **** (3.03) (3.61) **** ****
TOTAL INTL CORE 1,246.3 2.95% -1.60 3.83 29.54 3.83 11.45 32.36 -42.17 **** 14.26 -1.81 **** **** -3.67THORNBURG 590.5 1.40% -1.11 3.79 30.13 3.79 15.10 30.12 -42.86 **** 16.45 -0.28 **** **** -3.59BLACKROCK 393.6 0.93% -2.00 3.35 28.94 3.35 9.01 30.70 **** **** 11.42 -3.18 **** **** -2.54PHILADELPHIA 262.2 0.62% -2.07 4.64 29.14 4.64 7.36 40.88 -48.33 **** 13.80 -3.62 **** **** -6.01MSCI EAFE (NET DIVIDEND) -2.24 3.36 28.36 3.36 7.75 31.78 -43.39 11.17 10.42 -3.02 1.30 5.39
TOTAL INTL CORE +/- 0.64 0.47 1.18 0.47 3.70 0.58 1.22 **** 3.84 1.21 **** ****THORNBURG +/- 1.13 0.43 1.77 0.43 7.35 (1.66) 0.53 **** 6.03 2.74 **** ****BLACKROCK +/- 0.24 (0.01) 0.58 (0.01) 1.26 (1.08) **** **** 1.00 **** **** ****
PHILADELPHIA +/- 0.17 1.28 0.78 1.28 (0.39) 9.10 (4.94) **** 3.38 (0.60) **** ****
TOTAL NON-U.S. ENVIRONMENTAL 80.5 0.19% 0.03 2.68 28.04 2.68 8.67 33.34 **** **** 11.83 **** **** **** -4.72F&C SGE 80.5 0.19% 0.03 2.68 25.64 2.68 12.37 38.14 **** **** 12.35 **** **** **** 2.08MSCI WORLD INDEX -0.94 4.91 30.31 4.91 12.34 30.80 -40.33 9.57 14.03 0.34 2.65 4.74
TOTAL NON-U.S. ENVIRONMENTAL +/- 0.97 (2.23) (2.27) (2.23) (3.67) 2.54 **** **** (2.20) **** **** ****F&C SGE +/- 0.97 (2.23) (4.67) (2.23) 0.03 7.34 **** **** (1.68) **** **** ****
TOTAL NON-U.S. ACTIVIST 117.1 0.28% 3.48 5.93 48.51 5.93 36.48 42.60 **** **** 34.92 **** **** **** 39.75GOVERNANCE FOR OWNERS 117.1 0.28% 3.48 5.93 48.51 5.93 36.48 42.60 **** **** 34.92 **** **** **** 39.75MSCI EUROPE SMID CAP INDEX 0.85 6.54 40.37 6.54 16.03 53.23 -52.13 **** 21.10 -1.23 **** ****
TOTAL NON-U.S. ACTIVIST +/- 2.63 (0.61) 8.14 (0.61) 20.45 (10.63) **** **** 13.82 **** **** ****GOVERNANCE FOR OWNERS +/- 2.63 (0.61) 8.14 (0.61) 20.45 (10.63) **** **** 13.82 **** **** ****
EMERGING MARKETS 1,301.4 3.08% **** **** **** **** **** **** **** **** **** **** **** **** ****BLACKROCK - EM 1,301.4 3.08% **** **** **** **** **** **** **** **** **** **** **** **** ****MSCI EMERGING MARKETS FREE 5.90 2.10 29.52 2.10 16.03 53.23 -52.13 **** 18.78 4.63 11.02 17.13
EMERGING MARKETS +/- **** **** **** **** **** **** **** **** **** **** **** ****BLACKROCK EM +/- **** **** **** **** **** **** **** **** **** **** **** ****
TOTAL ACTIVE-INTL EQUITY 6,085.5 14.40% -1.39 3.12 27.84 3.12 11.14 32.60 -42.05 11.49 12.44 -1.16 2.62 6.35 6.93MSCI EAFE (NET DIVIDEND) -2.24 3.36 28.36 3.36 7.75 31.78 -43.39 11.17 10.42 -3.02 1.30 5.39
+/- 0.85 (0.24) (0.52) (0.24) 3.39 0.82 1.34 0.32 2.02 1.86 1.32 0.96
TOTAL INTERNATIONAL EQUITY 7,584.4 17.95% -0.23 3.79 28.95 3.79 11.43 32.77 -42.36 11.49 13.45 -1.00 2.72 6.39 6.85MSCI EAFE (NET DIVIDEND) -2.24 3.36 28.36 3.36 7.75 31.78 -43.39 11.17 10.42 -3.02 1.30 5.39
+/- 2.01 0.43 0.59 0.43 3.68 0.99 1.03 0.32 3.03 2.02 1.42 1.00
Page 5
43
Assets % Trailing Trailing Fiscal Calendar Calendar Calendar Calendar Calendar Trailing Trailing* Trailing* Trailing* Since ($MM) of Total 1 Month 3 Months YTD YTD YTD 2010 YTD 2009 YTD 2008 YTD 2007 1 Year 3 Years 5 Years 10 Years Inception
THE BANK OF NEW YORK MELLONCITY OF NEW YORK
Manager / Benchmark Comparison Report *NYC Teachers' Retirement SystemMarch 31, 2011
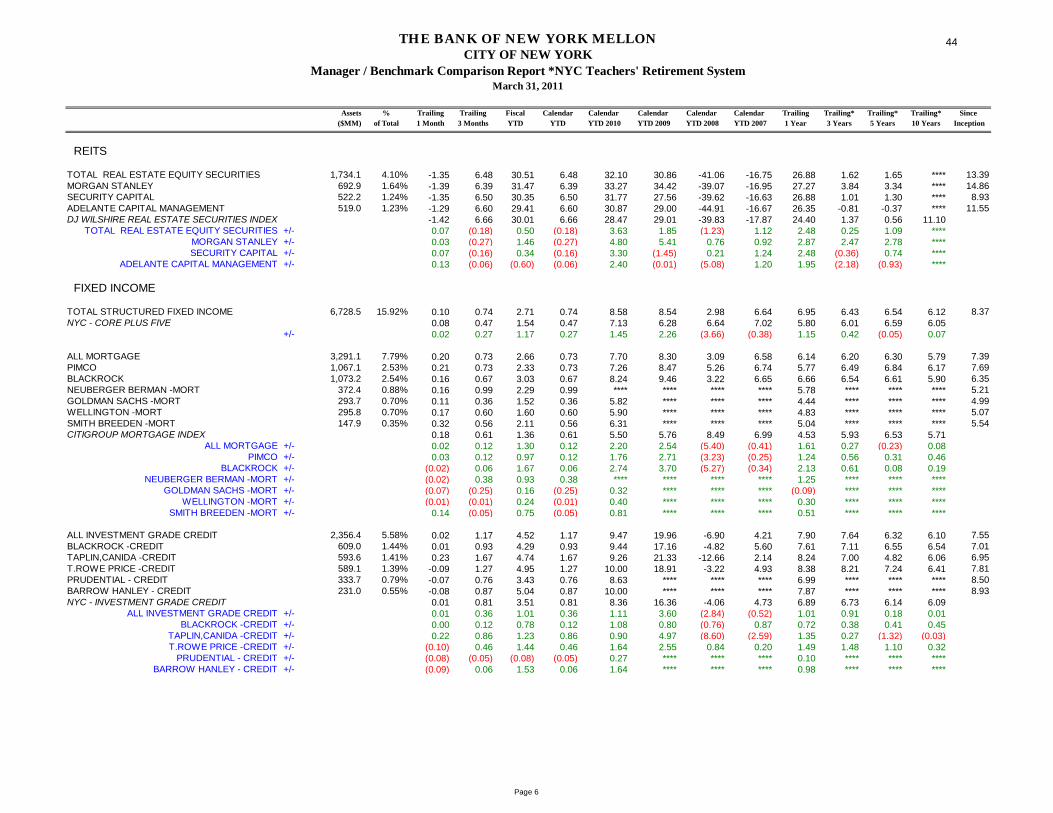
REITS
TOTAL REAL ESTATE EQUITY SECURITIES 1,734.1 4.10% -1.35 6.48 30.51 6.48 32.10 30.86 -41.06 -16.75 26.88 1.62 1.65 **** 13.39MORGAN STANLEY 692.9 1.64% -1.39 6.39 31.47 6.39 33.27 34.42 -39.07 -16.95 27.27 3.84 3.34 **** 14.86SECURITY CAPITAL 522.2 1.24% -1.35 6.50 30.35 6.50 31.77 27.56 -39.62 -16.63 26.88 1.01 1.30 **** 8.93ADELANTE CAPITAL MANAGEMENT 519.0 1.23% -1.29 6.60 29.41 6.60 30.87 29.00 -44.91 -16.67 26.35 -0.81 -0.37 **** 11.55DJ WILSHIRE REAL ESTATE SECURITIES INDEX -1.42 6.66 30.01 6.66 28.47 29.01 -39.83 -17.87 24.40 1.37 0.56 11.10
TOTAL REAL ESTATE EQUITY SECURITIES +/- 0.07 (0.18) 0.50 (0.18) 3.63 1.85 (1.23) 1.12 2.48 0.25 1.09 ****MORGAN STANLEY +/- 0.03 (0.27) 1.46 (0.27) 4.80 5.41 0.76 0.92 2.87 2.47 2.78 ****SECURITY CAPITAL +/- 0.07 (0.16) 0.34 (0.16) 3.30 (1.45) 0.21 1.24 2.48 (0.36) 0.74 ****
ADELANTE CAPITAL MANAGEMENT +/- 0.13 (0.06) (0.60) (0.06) 2.40 (0.01) (5.08) 1.20 1.95 (2.18) (0.93) ****
FIXED INCOME
TOTAL STRUCTURED FIXED INCOME 6,728.5 15.92% 0.10 0.74 2.71 0.74 8.58 8.54 2.98 6.64 6.95 6.43 6.54 6.12 8.37NYC - CORE PLUS FIVE 0.08 0.47 1.54 0.47 7.13 6.28 6.64 7.02 5.80 6.01 6.59 6.05
+/- 0.02 0.27 1.17 0.27 1.45 2.26 (3.66) (0.38) 1.15 0.42 (0.05) 0.07
ALL MORTGAGE 3,291.1 7.79% 0.20 0.73 2.66 0.73 7.70 8.30 3.09 6.58 6.14 6.20 6.30 5.79 7.39PIMCO 1,067.1 2.53% 0.21 0.73 2.33 0.73 7.26 8.47 5.26 6.74 5.77 6.49 6.84 6.17 7.69BLACKROCK 1,073.2 2.54% 0.16 0.67 3.03 0.67 8.24 9.46 3.22 6.65 6.66 6.54 6.61 5.90 6.35NEUBERGER BERMAN -MORT 372.4 0.88% 0.16 0.99 2.29 0.99 **** **** **** **** 5.78 **** **** **** 5.21GOLDMAN SACHS -MORT 293.7 0.70% 0.11 0.36 1.52 0.36 5.82 **** **** **** 4.44 **** **** **** 4.99WELLINGTON -MORT 295.8 0.70% 0.17 0.60 1.60 0.60 5.90 **** **** **** 4.83 **** **** **** 5.07SMITH BREEDEN -MORT 147.9 0.35% 0.32 0.56 2.11 0.56 6.31 **** **** **** 5.04 **** **** **** 5.54CITIGROUP MORTGAGE INDEX 0.18 0.61 1.36 0.61 5.50 5.76 8.49 6.99 4.53 5.93 6.53 5.71
ALL MORTGAGE +/- 0.02 0.12 1.30 0.12 2.20 2.54 (5.40) (0.41) 1.61 0.27 (0.23) 0.08 PIMCO +/- 0.03 0.12 0.97 0.12 1.76 2.71 (3.23) (0.25) 1.24 0.56 0.31 0.46
BLACKROCK +/- (0.02) 0.06 1.67 0.06 2.74 3.70 (5.27) (0.34) 2.13 0.61 0.08 0.19 NEUBERGER BERMAN -MORT +/- (0.02) 0.38 0.93 0.38 **** **** **** **** 1.25 **** **** ****
GOLDMAN SACHS -MORT +/- (0.07) (0.25) 0.16 (0.25) 0.32 **** **** **** (0.09) **** **** ****WELLINGTON -MORT +/- (0.01) (0.01) 0.24 (0.01) 0.40 **** **** **** 0.30 **** **** ****
SMITH BREEDEN -MORT +/- 0.14 (0.05) 0.75 (0.05) 0.81 **** **** **** 0.51 **** **** ****
ALL INVESTMENT GRADE CREDIT 2,356.4 5.58% 0.02 1.17 4.52 1.17 9.47 19.96 -6.90 4.21 7.90 7.64 6.32 6.10 7.55BLACKROCK -CREDIT 609.0 1.44% 0.01 0.93 4.29 0.93 9.44 17.16 -4.82 5.60 7.61 7.11 6.55 6.54 7.01TAPLIN,CANIDA -CREDIT 593.6 1.41% 0.23 1.67 4.74 1.67 9.26 21.33 -12.66 2.14 8.24 7.00 4.82 6.06 6.95T.ROWE PRICE -CREDIT 589.1 1.39% -0.09 1.27 4.95 1.27 10.00 18.91 -3.22 4.93 8.38 8.21 7.24 6.41 7.81PRUDENTIAL - CREDIT 333.7 0.79% -0.07 0.76 3.43 0.76 8.63 **** **** **** 6.99 **** **** **** 8.50BARROW HANLEY - CREDIT 231.0 0.55% -0.08 0.87 5.04 0.87 10.00 **** **** **** 7.87 **** **** **** 8.93NYC - INVESTMENT GRADE CREDIT 0.01 0.81 3.51 0.81 8.36 16.36 -4.06 4.73 6.89 6.73 6.14 6.09
ALL INVESTMENT GRADE CREDIT +/- 0.01 0.36 1.01 0.36 1.11 3.60 (2.84) (0.52) 1.01 0.91 0.18 0.01 BLACKROCK -CREDIT +/- 0.00 0.12 0.78 0.12 1.08 0.80 (0.76) 0.87 0.72 0.38 0.41 0.45
TAPLIN,CANIDA -CREDIT +/- 0.22 0.86 1.23 0.86 0.90 4.97 (8.60) (2.59) 1.35 0.27 (1.32) (0.03)T.ROWE PRICE -CREDIT +/- (0.10) 0.46 1.44 0.46 1.64 2.55 0.84 0.20 1.49 1.48 1.10 0.32
PRUDENTIAL - CREDIT +/- (0.08) (0.05) (0.08) (0.05) 0.27 **** **** **** 0.10 **** **** ****BARROW HANLEY - CREDIT +/- (0.09) 0.06 1.53 0.06 1.64 **** **** **** 0.98 **** **** ****
Page 6
44

Assets % Trailing Trailing Fiscal Calendar Calendar Calendar Calendar Calendar Trailing Trailing* Trailing* Trailing* Since ($MM) of Total 1 Month 3 Months YTD YTD YTD 2010 YTD 2009 YTD 2008 YTD 2007 1 Year 3 Years 5 Years 10 Years Inception
THE BANK OF NEW YORK MELLONCITY OF NEW YORK
Manager / Benchmark Comparison Report *NYC Teachers' Retirement SystemMarch 31, 2011
ALL TREASURY / AGENCY 1,080.9 2.56% -0.02 -0.19 -0.86 -0.19 9.39 -5.89 17.50 10.00 7.42 4.88 6.93 6.51 7.97PIMCO 419.2 0.99% -0.04 -0.11 -0.69 -0.11 9.90 -4.47 16.19 10.20 7.72 5.17 7.16 6.71 7.35STATE STREET -GOVT 350.2 0.83% -0.02 -0.27 -0.99 -0.27 8.96 **** **** **** 7.11 **** **** **** 5.27BLACKROCK -GOVT 311.6 0.74% -0.01 -0.22 -0.93 -0.22 9.20 **** **** **** 7.37 **** **** **** 5.18NYC - TREASURY AGENCY PLUS FIVE 0.00 -0.36 -0.92 -0.36 9.24 -7.44 18.91 9.85 7.34 4.53 6.73 6.33
ALL TREASURY / AGENCY +/- (0.02) 0.17 0.06 0.17 0.15 1.55 (1.41) 0.15 0.08 0.35 0.20 0.18 PIMCO +/- (0.04) 0.25 0.23 0.25 0.66 2.97 (2.72) 0.35 0.38 0.64 0.43 0.38
STATE STREET -GOVT +/- (0.02) 0.09 (0.07) 0.09 (0.28) **** **** **** (0.23) **** **** ****BLACKROCK -GOVT +/- (0.01) 0.14 (0.01) 0.14 (0.04) **** **** **** 0.03 **** **** ****
HIGH YIELD
TOTAL ENHANCED YIELD 1,636.8 3.87% 0.42 3.83 13.48 3.83 13.43 38.75 -18.14 3.95 13.73 10.92 8.30 7.50 6.15CITIGROUP BB & B 0.41 3.80 13.41 3.80 13.35 40.37 -25.10 2.25 13.72 8.19 6.46 6.96
+/- 0.01 0.03 0.07 0.03 0.08 (1.62) 6.96 1.70 0.01 2.73 1.84 0.54
MACKAY SHIELDS 375.7 0.89% 0.47 3.48 12.13 3.48 13.48 44.70 -20.41 4.35 13.33 11.18 8.66 **** 8.27BofA MERRILL LYNCH HY MASTER II 0.42 3.90 14.27 3.90 15.19 57.51 -26.39 2.19 14.18 12.70 9.03 8.41
+/- 0.05 (0.42) (2.14) (0.42) (1.71) (12.81) 5.98 2.16 (0.85) (1.52) (0.37) ****
SEIX 415.7 0.98% 0.38 4.31 15.13 4.31 14.44 36.16 -18.19 3.44 14.84 10.53 7.97 **** 7.28SHENKMAN 334.1 0.79% 0.41 3.32 12.16 3.32 11.77 29.79 -12.75 4.11 11.97 10.08 7.73 **** 7.81T.ROWE PRICE ENHANCED 337.4 0.80% 0.37 3.92 14.06 3.92 14.00 43.45 -19.90 4.34 14.12 11.81 8.77 **** 8.69STONE HARBOR INVESTMENT PARTNERS 173.8 0.41% 0.49 4.21 13.88 4.21 12.84 40.64 -19.83 3.10 14.37 10.89 8.19 **** 8.43CITIGROUP BB & B 0.41 3.80 13.41 3.80 13.35 40.37 -25.10 2.25 13.72 8.19 6.46 6.96
SEIX +/- (0.03) 0.51 1.72 0.51 1.09 (4.21) 6.91 1.19 1.12 2.34 1.51 ****SHENKMAN +/- 0.00 (0.48) (1.25) (0.48) (1.58) (10.58) 12.35 1.86 (1.75) 1.89 1.27 ****
T.ROWE PRICE ENHANCED +/- (0.04) 0.12 0.65 0.12 0.65 3.08 5.20 2.09 0.40 3.62 2.31 ****STONE HARBOR INVESTMENT PARTNERS +/- 0.08 0.41 0.47 0.41 (0.51) 0.27 5.27 0.85 0.65 2.70 1.73 ****
TIPS
TOTAL TIPS MANAGERS 1,408.1 3.33% 0.99 1.87 3.62 1.87 6.47 10.14 -0.74 11.71 7.85 4.04 6.37 **** 5.24PIMCO-TIPS-MTA 795.6 1.88% 0.95 1.72 3.43 1.72 6.57 10.24 -0.88 11.77 7.72 4.00 6.35 **** 5.12STATE STREET-TIPS-MTA 349.3 0.83% 1.02 2.05 3.90 2.05 6.34 10.00 -0.96 11.51 8.06 3.89 6.26 **** 5.50BLACKROCK-TIPS-MTA 263.1 0.62% 1.06 2.09 3.81 2.09 6.34 10.02 -0.03 11.79 7.97 4.34 6.56 **** 5.92BARCLAYS CAPITAL US TIPS INDEX 1.02 2.08 3.94 2.08 6.37 11.41 -2.35 11.64 7.97 3.95 6.26 6.75
TOTAL TIPS MANAGERS +/- (0.03) (0.21) (0.32) (0.21) 0.10 (1.27) 1.61 0.07 (0.12) 0.09 0.11 ****PIMCO-TIPS-MTA +/- (0.07) (0.36) (0.51) (0.36) 0.20 (1.17) 1.47 0.13 (0.25) 0.05 0.09 ****
STATE STREET-TIPS-MTA +/- 0.00 (0.03) (0.04) (0.03) (0.03) (1.41) 1.39 (0.13) 0.09 (0.06) 0.00 ****BLACKROCK-TIPS-MTA +/- 0.04 0.01 (0.13) 0.01 (0.03) (1.39) 2.32 0.15 0.00 0.39 0.30 ****
Page 7
45
Assets % Trailing Trailing Fiscal Calendar Calendar Calendar Calendar Calendar Trailing Trailing* Trailing* Trailing* Since ($MM) of Total 1 Month 3 Months YTD YTD YTD 2010 YTD 2009 YTD 2008 YTD 2007 1 Year 3 Years 5 Years 10 Years Inception
THE BANK OF NEW YORK MELLONCITY OF NEW YORK
Manager / Benchmark Comparison Report *NYC Teachers' Retirement SystemMarch 31, 2011
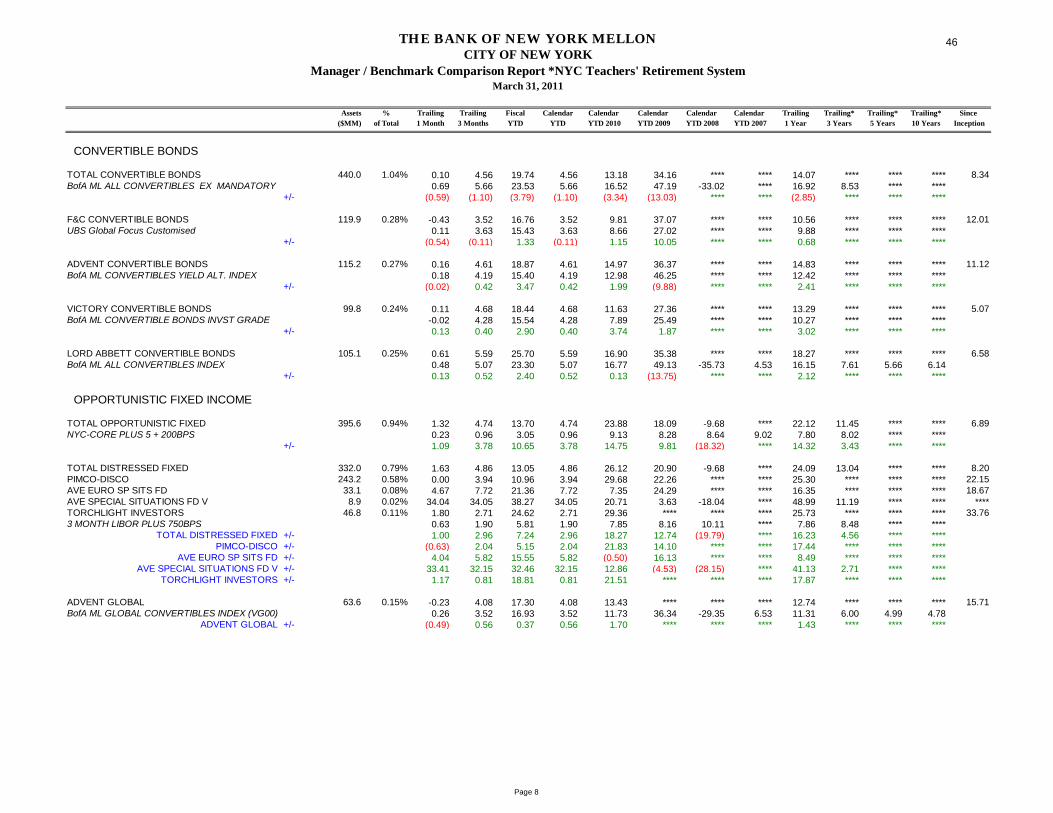
CONVERTIBLE BONDS
TOTAL CONVERTIBLE BONDS 440.0 1.04% 0.10 4.56 19.74 4.56 13.18 34.16 **** **** 14.07 **** **** **** 8.34BofA ML ALL CONVERTIBLES EX MANDATORY 0.69 5.66 23.53 5.66 16.52 47.19 -33.02 **** 16.92 8.53 **** ****
+/- (0.59) (1.10) (3.79) (1.10) (3.34) (13.03) **** **** (2.85) **** **** ****
F&C CONVERTIBLE BONDS 119.9 0.28% -0.43 3.52 16.76 3.52 9.81 37.07 **** **** 10.56 **** **** **** 12.01UBS Global Focus Customised 0.11 3.63 15.43 3.63 8.66 27.02 **** **** 9.88 **** **** ****
+/- (0.54) (0.11) 1.33 (0.11) 1.15 10.05 **** **** 0.68 **** **** ****
ADVENT CONVERTIBLE BONDS 115.2 0.27% 0.16 4.61 18.87 4.61 14.97 36.37 **** **** 14.83 **** **** **** 11.12BofA ML CONVERTIBLES YIELD ALT. INDEX 0.18 4.19 15.40 4.19 12.98 46.25 **** **** 12.42 **** **** ****
+/- (0.02) 0.42 3.47 0.42 1.99 (9.88) **** **** 2.41 **** **** ****
VICTORY CONVERTIBLE BONDS 99.8 0.24% 0.11 4.68 18.44 4.68 11.63 27.36 **** **** 13.29 **** **** **** 5.07BofA ML CONVERTIBLE BONDS INVST GRADE -0.02 4.28 15.54 4.28 7.89 25.49 **** **** 10.27 **** **** ****
+/- 0.13 0.40 2.90 0.40 3.74 1.87 **** **** 3.02 **** **** ****
LORD ABBETT CONVERTIBLE BONDS 105.1 0.25% 0.61 5.59 25.70 5.59 16.90 35.38 **** **** 18.27 **** **** **** 6.58BofA ML ALL CONVERTIBLES INDEX 0.48 5.07 23.30 5.07 16.77 49.13 -35.73 4.53 16.15 7.61 5.66 6.14
+/- 0.13 0.52 2.40 0.52 0.13 (13.75) **** **** 2.12 **** **** ****
OPPORTUNISTIC FIXED INCOME
TOTAL OPPORTUNISTIC FIXED 395.6 0.94% 1.32 4.74 13.70 4.74 23.88 18.09 -9.68 **** 22.12 11.45 **** **** 6.89NYC-CORE PLUS 5 + 200BPS 0.23 0.96 3.05 0.96 9.13 8.28 8.64 9.02 7.80 8.02 **** ****
+/- 1.09 3.78 10.65 3.78 14.75 9.81 (18.32) **** 14.32 3.43 **** ****
TOTAL DISTRESSED FIXED 332.0 0.79% 1.63 4.86 13.05 4.86 26.12 20.90 -9.68 **** 24.09 13.04 **** **** 8.20PIMCO-DISCO 243.2 0.58% 0.00 3.94 10.96 3.94 29.68 22.26 **** **** 25.30 **** **** **** 22.15AVE EURO SP SITS FD 33.1 0.08% 4.67 7.72 21.36 7.72 7.35 24.29 **** **** 16.35 **** **** **** 18.67AVE SPECIAL SITUATIONS FD V 8.9 0.02% 34.04 34.05 38.27 34.05 20.71 3.63 -18.04 **** 48.99 11.19 **** **** ****TORCHLIGHT INVESTORS 46.8 0.11% 1.80 2.71 24.62 2.71 29.36 **** **** **** 25.73 **** **** **** 33.763 MONTH LIBOR PLUS 750BPS 0.63 1.90 5.81 1.90 7.85 8.16 10.11 **** 7.86 8.48 **** ****
TOTAL DISTRESSED FIXED +/- 1.00 2.96 7.24 2.96 18.27 12.74 (19.79) **** 16.23 4.56 **** ****PIMCO-DISCO +/- (0.63) 2.04 5.15 2.04 21.83 14.10 **** **** 17.44 **** **** ****
AVE EURO SP SITS FD +/- 4.04 5.82 15.55 5.82 (0.50) 16.13 **** **** 8.49 **** **** ****AVE SPECIAL SITUATIONS FD V +/- 33.41 32.15 32.46 32.15 12.86 (4.53) (28.15) **** 41.13 2.71 **** ****
TORCHLIGHT INVESTORS +/- 1.17 0.81 18.81 0.81 21.51 **** **** **** 17.87 **** **** ****
ADVENT GLOBAL 63.6 0.15% -0.23 4.08 17.30 4.08 13.43 **** **** **** 12.74 **** **** **** 15.71BofA ML GLOBAL CONVERTIBLES INDEX (VG00) 0.26 3.52 16.93 3.52 11.73 36.34 -29.35 6.53 11.31 6.00 4.99 4.78
ADVENT GLOBAL +/- (0.49) 0.56 0.37 0.56 1.70 **** **** **** 1.43 **** **** ****
Page 8
46

Assets % Trailing Trailing Fiscal Calendar Calendar Calendar Calendar Calendar Trailing Trailing* Trailing* Trailing* Since ($MM) of Total 1 Month 3 Months YTD YTD YTD 2010 YTD 2009 YTD 2008 YTD 2007 1 Year 3 Years 5 Years 10 Years Inception
THE BANK OF NEW YORK MELLONCITY OF NEW YORK
Manager / Benchmark Comparison Report *NYC Teachers' Retirement SystemMarch 31, 2011
OTHER FIXED INCOME
TOTAL ETI 338.1 0.80% 0.14 0.83 2.43 0.83 6.61 7.62 6.43 6.20 5.19 6.19 6.51 6.34 9.80TEACHERS CUSTOM BENCHMARK (NO CASH) 0.12 0.51 1.73 0.51 6.31 5.12 6.62 6.89 5.08 5.42 6.10 5.71
+/- 0.02 0.32 0.70 0.32 0.30 2.50 (0.19) (0.69) 0.11 0.77 0.41 0.63
AFL-CIO HOUSING INV TRUST 187.2 0.44% 0.10 0.79 2.12 0.79 6.16 6.28 5.26 6.69 4.81 5.56 6.06 **** 4.96BARCLAYS CAPITAL AGGREGATE 0.06 0.42 1.57 0.42 6.54 5.93 5.24 6.97 5.12 5.30 6.02 5.57
+/- 0.04 0.37 0.55 0.37 (0.38) 0.35 0.02 (0.28) (0.31) 0.26 0.04 ****
ACCESS RBC 41.3 0.10% -0.31 0.21 1.09 0.21 5.36 10.99 6.67 **** 3.50 6.82 **** **** 6.73ACCESS CUSTOM BENCHMARK 0.10 0.27 1.07 0.27 5.52 **** **** **** 4.28 4.95 6.17 ****
+/- (0.41) (0.06) 0.02 (0.06) (0.16) **** **** **** (0.78) 1.87 **** ****
STATE STREET SHORT TERM 1,262.6 2.99% 0.04 0.04 0.19 0.04 0.48 1.25 3.80 5.67 0.33 1.41 3.03 2.84 5.70ML 91 DAY TREASURY BILL INDEX 0.03 0.05 0.13 0.05 0.13 0.21 2.06 5.00 0.16 0.52 2.23 2.24
+/- 0.01 (0.01) 0.06 (0.01) 0.35 1.04 1.74 0.67 0.17 0.89 0.80 0.60
PRIVATE EQUITY
TOTAL PRIVATE EQUITY 1,944.0 4.60% 6.45 8.46 13.39 8.46 14.04 -4.44 -1.50 15.33 19.21 4.98 8.25 **** 12.33RUSSELL 3000 PLUS 5% 0.71 7.99 37.29 7.99 21.93 33.34 -32.30 10.13 22.42 8.79 8.18 9.30
+/- 5.74 0.47 (23.90) 0.47 (7.89) (37.78) 30.80 5.20 (3.21) (3.81) 0.07 **** PRIVATE REAL ESTATE
TOTAL PRIVATE REAL ESTATE 578.3 1.37% 6.42 8.30 19.77 8.30 9.99 -44.20 -7.61 68.62 23.28 -15.13 3.08 **** 6.55NCREIF NFI-ODCE NET 3.89 3.89 14.45 3.89 15.26 -30.40 -10.70 14.84 19.13 -9.73 -1.01 ****
+/- 2.53 4.41 5.32 4.41 (5.27) (13.80) 3.09 53.78 4.15 (5.40) 4.09 ****
TOTAL TEACHERS 42,251.3 0.62 4.71 21.58 4.71 13.92 21.15 -26.35 6.24 14.50 4.02 4.45 5.74 8.70TEACHERS POLICY BENCHMARK 0.12 4.51 23.05 4.51 14.01 25.01 -28.50 5.86 14.35 4.03 4.38 5.66
+/- 0.50 0.20 (1.47) 0.20 (0.09) (3.86) 2.15 0.38 0.15 (0.01) 0.07 0.08
Page 9
47

Vintage Year Deal Name
First Drawdown
Capital Committed Cash In Cash Out Market Value Multiple IRR
Cypress Merchant Banking Partners II, LP 7/8/1999 50,000,000$ 53,780,137$ 40,275,908$ 5,407,402$ 0.85x (3.8%)FdG Capital Partners, L.P. 6/2/1999 30,000,000 34,397,448 50,173,456 8,372,420 1.70x 15.8%Lincolnshire Equity Fund II, L.P. 2/26/2001 15,000,000 14,446,100 25,257,218 4,411,407 2.05x 25.9%Allegra Capital Partners IV, L.P. 7/25/2000 18,000,000 16,000,000 7,650,035 (3,863,738) 0.24x (20.1%)Carlyle Partners III, L.P. 12/22/2000 30,000,000 33,962,619 65,731,095 4,321,351 2.06x 23.2%SCP Private Equity Partners II, L.P. 1/19/2001 20,000,000 22,250,557 6,607,483 11,568,528 0.82x (3.4%)Solera Partners, L.P. 7/8/2002 15,000,000 17,301,905 4,375,785 17,150,459 1.24x 4.2%Apollo Investment Fund V, L.P. 8/23/2001 30,000,000 46,658,872 81,088,574 10,985,675 1.97x 39.7%New Mountain Partners, L.P. 7/20/2001 15,000,000 12,901,792 14,406,689 4,020,187 1.43x 13.0%Ripplewood Partners II, L.P. 6/30/2002 15,000,000 16,055,090 9,545,118 7,889,706 1.09x 2.9%RRE Ventures III, L.P. 6/13/2002 20,000,000 25,238,403 12,473,335 21,635,007 1.35x 7.1%BDCM Opportunity Fund, L.P. 11/10/2003 25,000,000 54,181,232 70,265,246 14,932,179 1.57x 23.4%Coller International Partnership IV, L.P. 11/6/2002 35,000,000 30,903,548 27,665,056 15,769,891 1.41x 15.2%Landmark Equity Partners XI, L.P. 9/15/2004 20,000,000 20,967,163 24,516,551 4,843,086 1.40x 24.7%Thomas McNerney & Partners, L.P. 11/26/2002 15,000,000 13,612,500 5,252,354 8,935,026 1.04x 1.1%Yucaipa American Alliance Fund I, L.P. 10/1/2004 55,000,000 80,131,360 59,003,465 36,741,953 1.19x 8.5%Ares Corporate Opportunities Fund, L.P. 5/4/2004 15,000,000 17,894,667 18,727,205 7,496,633 1.47x 14.5%Blackstone Capital Partners IV L.P. 1/10/2003 30,000,000 30,535,872 51,375,876 18,976,022 2.30x 40.2%FS Equity Partners V, L.P. 5/30/2003 25,000,000 21,249,797 16,210,189 18,755,647 1.65x 14.3%Leeds Weld Equity Partners IV, L.P. 12/13/2004 15,000,000 15,078,104 5,634,979 18,967,886 1.63x 12.5%Aurora Equity Partners III, L.P. 5/19/2005 20,000,000 21,648,122 9,279,730 18,277,906 1.27x 11.8%Celtic Pharmaceutical Holdings, L.P. 7/10/2006 15,000,000 15,241,256 241,256 24,703,375 1.64x 13.8%FdG Capital Partners II, L.P. 8/30/2004 35,000,000 36,170,684 13,543,914 11,005,458 0.68x (11.6%)Lincolnshire Equity Fund III, L.P. 12/23/2004 25,000,000 20,493,851 27,280,724 14,290,719 2.03x 42.7%Markstone Capital Partners, L.P. 7/21/2004 35,000,000 32,746,485 11,728,225 20,951,338 1.00x (0.1%)New York/Fairview Emerging Managers (Tranche A), L.P. 10/21/2004 24,000,000 17,940,000 1,483,103 13,910,089 0.86x (5.1%)Paladin Homeland Security Fund (NY), L.P 10/1/2004 15,000,000 15,674,740 1,925,490 6,950,897 0.57x (13.2%)Palladium Equity Partners III, L.P. 8/10/2005 35,000,000 27,854,293 11,676,736 19,463,706 1.12x 5.2%Silver Lake Partners II, L.P. 7/28/2004 32,400,000 32,475,033 24,206,162 22,852,593 1.45x 10.6%Trilantic Capital Partners III (fka LBMB III), L.P. 9/22/2005 30,000,000 23,384,282 21,411,446 9,908,681 1.34x 10.4%Blackstone Mezzanine Partners II, L.P. 5/26/2006 20,000,000 18,813,996 8,595,302 14,483,630 1.23x 8.1%Bridgepoint Europe III, L.P. 12/6/2005 31,736,165 26,978,225 713,284 27,822,194 1.06x 1.6%Clayton, Dubilier & Rice Fund VII, L.P. 4/28/2006 30,000,000 31,065,395 4,050,636 30,184,213 1.10x 3.0%Erasmus New York City Growth Fund, L.P. 8/16/2005 30,000,000 26,117,536 6,448,809 16,405,603 0.88x (4.0%)Ethos Private Equity Fund V, L.P. 6/28/2006 15,000,000 13,027,038 4,018,864 9,121,000 1.01x 0.4%GI Partners Fund II, L.P. 6/19/2006 25,000,000 24,374,582 703,577 27,564,710 1.16x 4.0%JP Morgan Fleming (Tranche A), L.P. 12/21/2005 31,000,000 20,644,621 3,237,854 17,386,642 1.00x (0.0%)New Mountain Partners II, L.P. 1/12/2005 23,225,800 21,041,604 10,245,617 18,158,272 1.35x 8.6%Prism Venture Partners V-A, L.P. 7/14/2005 20,000,000 18,023,087 4,753,452 9,153,790 0.77x (9.7%)Psilos Group Partners III, L.P. 10/17/2007 25,000,000 19,874,059 141,315 16,617,175 0.84x (6.5%)Quadrangle Capital Partners II, L.P. 2/28/2006 35,000,000 27,708,667 9,251,989 21,586,569 1.11x 3.7%Snow Phipps Group, L.P. 8/2/2007 15,000,000 13,842,135 4,226,207 14,016,176 1.32x 16.9%USPF II Institutional Fund, L.P. 11/23/2005 35,000,000 42,777,922 18,336,294 32,806,311 1.20x 6.9%VSS Communications Partners IV, L.P. 6/2/2006 10,000,000 9,890,895 1,119,822 6,146,711 0.73x (9.5%)AEA Investors 2006 Fund, L.P. 6/30/2008 20,000,000 12,586,929 2,317,461 9,815,836 0.96x (2.1%)Aisling Capital II, L.P. 1/12/2006 4,500,000 3,663,571 619,714 2,492,571 0.85x (5.7%)Ampersand 2006, L.P. 7/6/2007 15,000,000 11,850,000 3,540,241 9,300,322 1.08x 3.0%Apollo Investment Fund VI, L.P. 5/10/2006 35,000,000 41,351,129 14,363,782 33,316,972 1.15x 5.8%Ares Corporate Opportunities Fund II, L.P. 5/23/2006 30,000,000 31,297,583 14,819,626 23,258,467 1.22x 7.2%Arsenal Capital Partners II, L.P. 12/19/2006 13,500,000 11,384,909 237,476 11,186,664 1.00x 0.2%Avista Capital Partners, L.P. 8/11/2006 30,000,000 35,913,660 13,884,279 28,662,717 1.18x 6.3%BDCM Opportunity Fund II, L.P. 12/28/2006 25,000,000 23,813,208 7,977,133 18,128,498 1.10x 5.3%Blackstone Capital Partners V, L.P. 4/13/2006 75,600,000 71,656,970 8,008,049 62,076,988 0.98x (0.8%)Catterton Partners VI, L.P. 12/14/2006 30,000,000 23,229,904 2,255,499 25,471,977 1.19x 6.1%CCMP Capital Investors II, L.P. 5/22/2007 20,000,000 12,496,682 907,941 10,686,211 0.93x (3.5%)Fairview Ventures Fund III, L.P. 7/13/2007 20,000,000 9,449,472 302,714 8,025,852 0.88x (7.8%)First Reserve Fund XI, L.P. 12/22/2006 30,000,000 25,674,847 7,668,092 17,497,469 0.98x (0.8%)GF Private Equity Capital Fund, L.P. 3/20/2008 15,000,000 11,582,698 - 11,513,066 0.99x (0.4%)GSC Recovery III, L.P. 5/4/2006 10,000,000 10,243,206 4,920,445 4,495,454 0.92x (3.4%)InterMedia Partners VII, L.P. 6/8/2006 25,000,000 24,257,740 331,937 25,127,851 1.05x 1.5%Landmark Equity Partners Fund XIII, L.P. 5/15/2006 25,000,000 20,941,973 7,092,449 13,243,817 0.97x (1.1%)MidOcean Partners III, L.P. 6/19/2007 40,000,000 24,164,787 1,013,996 14,246,717 0.63x (18.0%)NewSpring Ventures II, L.P. 2/26/2008 15,000,000 8,671,315 - 8,936,475 1.03x 1.5%Perseus Partners VII, L.P. 8/6/2007 20,000,000 17,934,296 1,932,271 18,255,667 1.13x 6.0%RRE Ventures IV, L.P. 10/25/2006 25,000,000 20,492,225 1,360,686 20,467,513 1.07x 3.0%Terra Firma Capital Partners III, L.P. 2/26/2007 31,648,649 22,656,548 602,140 7,676,806 0.37x (36.6%)The Fourth Cinven Fund 1/22/2007 45,707,918 31,746,633 - 32,218,057 1.01x 0.5%Thomas H. Lee Equity Fund VI, L.P. 6/22/2007 25,000,000 18,462,165 1,322,029 15,678,036 0.92x (3.1%)Thomas, McNerney & Partners II, L.P. 11/30/2006 15,000,000 9,000,000 1,307,286 6,718,601 0.89x (5.0%)Carlyle Partners V, L.P. 9/28/2007 50,000,000 31,846,455 3,102,502 30,754,358 1.06x 3.6%Co-Investment Partners Europe, L.P. 12/5/2008 26,988,600 16,415,014 108,178 13,840,111 0.85x (8.9%)Constellation Ventures III, L.P. 11/20/2008 15,000,000 8,336,022 - 7,185,791 0.86x (8.5%)Craton Equity Investors I, L.P. 3/11/2008 10,000,000 6,276,701 6,094 5,363,706 0.86x (9.4%)FTVentures III, L.P. 3/1/2007 14,244,080 9,543,534 266,011 10,462,897 1.12x 4.8%GSO Capital Opportunties Fund, L.P. 8/15/2008 30,000,000 26,218,424 14,653,701 15,560,165 1.15x 10.5%Halyard Capital Fund II, L.P. 11/2/2007 15,000,000 7,178,073 425,409 6,752,066 1.00x (0.0%)HM 2006 Sector Performance Fund, L.P. 4/15/2008 20,000,000 17,044,753 2,035,509 10,081,935 0.71x (14.2%)Montreux Equity Partners IV, L.P. 3/27/2007 15,000,000 9,540,000 434,810 8,929,561 0.98x (0.9%)Nautic Partners VI, L.P. 6/30/2008 20,000,000 13,196,580 21,479 11,889,120 0.90x (6.6%)New Mountain Partners III, L.P. 9/25/2007 35,000,000 18,158,911 3,260,522 13,949,295 0.95x (3.6%)
2002
2006
Teachers' Retirement System of the City of New York(as of September 30, 2010)
2001
2000
1999
2005
2004
2003
48

Vintage Year Deal Name
First Drawdown
Capital Committed Cash In Cash Out Market Value Multiple IRR
Teachers' Retirement System of the City of New York(as of September 30, 2010)
PCG Clean Energy & Technology Fund East, L.P. 4/25/2008 60,000,000 31,353,829 1,972,863 27,409,920 0.94x (3.6%)Pegasus Partners IV, L.P. 10/9/2007 20,000,000 20,103,730 5,543,944 27,907,949 1.66x 25.3%Quaker BioVentures II, L.P. 4/18/2008 15,000,000 7,655,832 497,995 5,868,848 0.83x (12.0%)RLJ Equity Partners Fund I, L.P. 4/14/2009 15,000,000 6,061,016 49,709 5,526,995 0.92x (7.0%)SCP Vitalife Partners II, L.P. 1/10/2008 15,000,000 7,124,774 1,184 5,142,616 0.72x (16.5%)Silver Lake Partners III, L.P. 8/13/2007 35,000,000 20,949,155 4,268,622 20,448,553 1.18x 10.3%StarVest Partners II, L.P. 12/8/2008 20,000,000 6,839,928 5,245 5,093,873 0.75x (18.8%)Tailwind Capital Partners, L.P. 4/28/2008 20,000,000 16,794,921 3,075,767 14,974,438 1.07x 4.6%Trilantic Capital Partners IV L.P. 10/22/2007 53,311,339 31,807,412 2,163,434 32,214,149 1.08x 4.4%USPF III Institutional Fund, L.P. 7/10/2007 30,000,000 22,939,882 3,073,986 19,172,678 0.97x (1.5%)Vista Equity Partners Fund III, L.P. 11/30/2007 25,000,000 19,657,573 11,861,232 17,813,665 1.51x 19.4%Vitruvian Investment Partnership I (Side Car), L.P. 1/31/2008 4,193,867 1,914,655 56 1,437,756 0.75x (24.2%)Vitruvian Investment Partnership I, L.P. 1/31/2008 37,744,699 17,231,796 506 12,940,834 0.75x (24.2%)Aisling Capital III, L.P. 11/20/2008 10,500,000 1,325,700 - 803,750 0.61x -36.4%Apollo Investment Fund VII, L.P. 4/16/2008 50,000,000 33,417,786 13,029,377 25,953,239 1.17x 14.1%Ares Corporate Opportunities Fund III, L.P. 7/30/2008 60,000,000 32,999,235 8,774,287 31,676,049 1.23x 14.7%Avista Capital Partners II, L.P. 12/31/2008 50,000,000 36,831,119 10,043,059 29,854,941 1.08x 7.0%Blue Wolf Capital Fund II, L.P. 11/14/2008 20,000,000 7,346,593 4,844,293 3,227,679 1.10x 6.5%Bridgepoint Europe IV, L.P. 9/30/2008 27,770,147 7,158,067 - 6,271,929 0.88x -12.5%Carpenter Community BancFund-A, L.P. 6/5/2008 15,000,000 11,584,539 148,735 10,868,899 0.95x -3.6%CS TRSCNY Emerging Manager Co-Investment Fund, L.P. 8/22/2008 12,626,263 6,776,808 53,198 6,612,915 0.98x -1.2%CS TRSCNY Emerging Manager Fund, L.P. 8/22/2008 59,373,737 15,262,649 5,080,566 8,552,080 0.89x -10.4%Emerald Infrastructure Development Fund, L.P. 12/2/2008 20,000,000 797,444 4,486 - 0.01x -99.4%First Reserve Fund XII, L.P. 11/14/2008 30,000,000 15,614,083 1,267,898 11,801,379 0.84x -10.9%GI Partners III, L.P. 7/29/2008 30,000,000 19,082,358 2,126,030 17,287,885 1.02x 2.1%Landmark Equity Partners XIV, L.P. 9/19/2008 50,000,000 5,650,086 761,416 4,547,570 0.94x -4.1%Lee Equity Partners, L.P. 4/23/2008 30,000,000 12,185,770 747,131 8,682,640 0.77x -12.8%Leeds Equity Partners V, L.P. 7/28/2008 40,000,000 4,207,198 - 5,395,517 1.28x 10.4%Levine Leichtman Capital Partners IV, L.P. 9/22/2008 25,000,000 12,430,099 1,479,663 10,977,173 1.00x 0.2%New York/Fairview Emerging Managers (Tranche B), L.P. 5/28/2008 35,000,000 8,239,000 121,389 7,377,287 0.91x -7.8%NGN BioMed Opportunity II, L.P. 10/31/2008 15,000,000 7,988,866 17,765 7,440,152 0.93x -4.3%Onex Partners III, L.P. 3/31/2009 40,000,000 14,953,915 3,492,895 9,247,709 0.85x -22.4%Paladin III (HR), L.P. 1/8/2008 20,000,000 10,301,062 1,192,519 8,118,727 0.90x -5.2%Pine Brook Capital Partners, L.P. 4/7/2008 22,500,000 8,913,927 2,657,436 7,209,667 1.11x 5.8%Relativity Fund, L.P. 1/17/2008 15,000,000 4,721,370 161,968 2,468,344 0.56x -24.3%Riverstone/Carlyle Global Energy & Power Fund IV 9/29/2008 32,500,000 22,262,414 4,454,200 20,025,882 1.10x 7.4%Yucaipa American Alliance Fund II, L.P. 3/28/2008 75,000,000 59,235,330 18,305,689 57,428,954 1.28x 17.5%Yucaipa Corporate Initiatives Fund II, L.P. 6/23/2008 35,000,000 11,924,413 106,309 7,125,916 0.61x -27.6%Clayton, Dubilier & Rice Fund VIII, L.P. 9/30/2008 35,000,000 16,278,437 6,007 19,212,785 1.18x 19.8%Lincolnshire Equity Fund IV, L.P. 8/7/2009 12,500,000 1,984,633 - 1,508,587 0.76x -41.3%Welsh, Carson, Anderson & Stowe XI, L.P. 9/30/2008 30,000,000 11,043,215 - 9,896,648 0.90x -14.0%Ampersand 2011, L.P. 3/11/2011 17,500,000 875,000 - 875,000 1.00x 0.0%Blackstone Capital Partners VI, L.P. 9/30/2008 60,000,000 180,350 - 0 0.00x NMJP Morgan Fleming (Tranche B), L.P. 3/31/2008 10,000,000 1,772,992 - 1,826,887 1.03x 5.5%Trident V, L.P. 12/30/2010 35,000,000 3,404,522 - 2,887,021 0.85x -19.8%
Grand Total(s): 3,368,071,264$ 2,450,816,073$ 1,027,345,746$ 1,775,467,578$ 1.2x 6.8%
2008
2007
2009
* Where available, December 31, 2010 reported valuations were used. In the absense of December 31, 2010 reported values, market values reflect September 30, 2010 reported market values. In both scenarios, market values have been adjusted forward using interim cashflows through March 22, 2011. The IRR calculated in the early years of a fund is not meaningful given the j-curve effect. The
aggregate portfolio performance figures for IRR and multiple are as of September 30, 2010.
2010
49
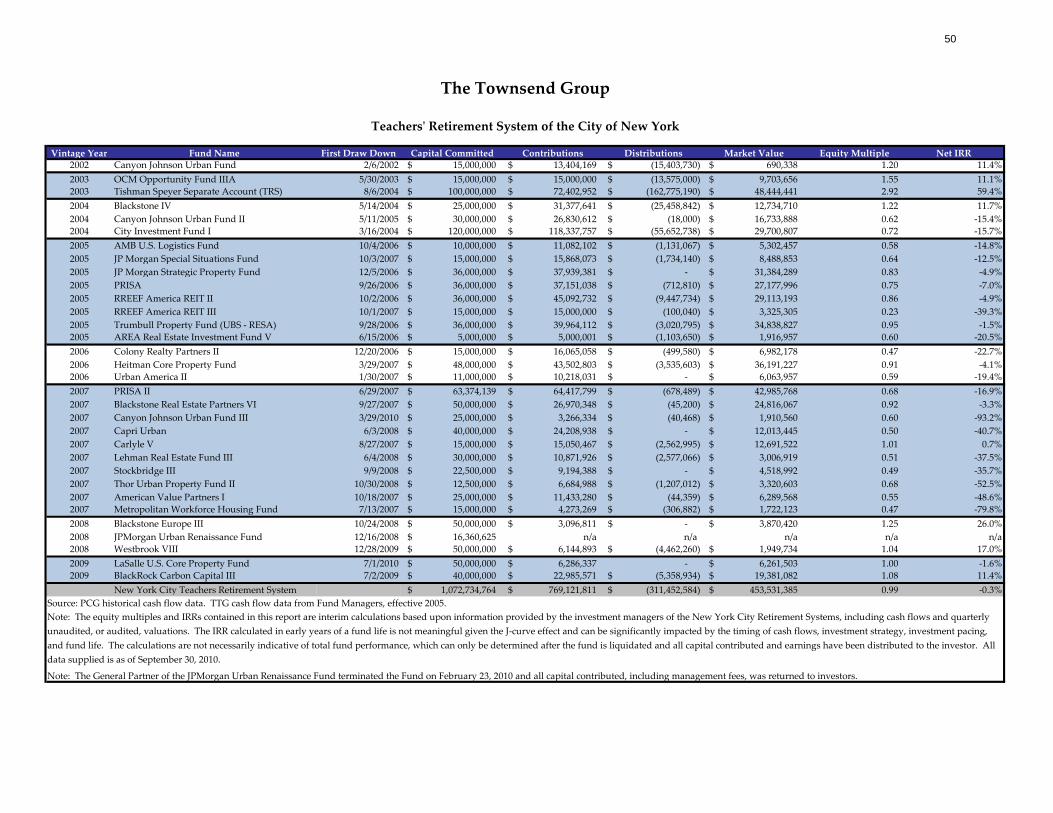
Vintage Year Fund Name First Draw Down Capital Committed Contributions Distributions Market Value Equity Multiple Net IRR2002 Canyon Johnson Urban Fund 2/6/2002 15,000,000$ 13,404,169$ (15,403,730)$ 690,338$ 1.20 11.4%2003 OCM Opportunity Fund IIIA 5/30/2003 15,000,000$ 15,000,000$ (13,575,000)$ 9,703,656$ 1.55 11.1%2003 Tishman Speyer Separate Account (TRS) 8/6/2004 100,000,000$ 72,402,952$ (162,775,190)$ 48,444,441$ 2.92 59.4%2004 Blackstone IV 5/14/2004 25,000,000$ 31,377,641$ (25,458,842)$ 12,734,710$ 1.22 11.7%2004 Canyon Johnson Urban Fund II 5/11/2005 30,000,000$ 26,830,612$ (18,000)$ 16,733,888$ 0.62 -15.4%2004 City Investment Fund I 3/16/2004 120,000,000$ 118,337,757$ (55,652,738)$ 29,700,807$ 0.72 -15.7%2005 AMB U.S. Logistics Fund 10/4/2006 10,000,000$ 11,082,102$ (1,131,067)$ 5,302,457$ 0.58 -14.8%2005 JP Morgan Special Situations Fund 10/3/2007 15,000,000$ 15,868,073$ (1,734,140)$ 8,488,853$ 0.64 -12.5%2005 JP Morgan Strategic Property Fund 12/5/2006 36,000,000$ 37,939,381$ -$ 31,384,289$ 0.83 -4.9%2005 PRISA 9/26/2006 36,000,000$ 37,151,038$ (712,810)$ 27,177,996$ 0.75 -7.0%2005 RREEF America REIT II 10/2/2006 36,000,000$ 45,092,732$ (9,447,734)$ 29,113,193$ 0.86 -4.9%2005 RREEF America REIT III 10/1/2007 15,000,000$ 15,000,000$ (100,040)$ 3,325,305$ 0.23 -39.3%2005 Trumbull Property Fund (UBS - RESA) 9/28/2006 36,000,000$ 39,964,112$ (3,020,795)$ 34,838,827$ 0.95 -1.5%2005 AREA Real Estate Investment Fund V 6/15/2006 5,000,000$ 5,000,001$ (1,103,650)$ 1,916,957$ 0.60 -20.5%2006 Colony Realty Partners II 12/20/2006 15,000,000$ 16,065,058$ (499,580)$ 6,982,178$ 0.47 -22.7%2006 Heitman Core Property Fund 3/29/2007 48,000,000$ 43,502,803$ (3,535,603)$ 36,191,227$ 0.91 -4.1%2006 Urban America II 1/30/2007 11,000,000$ 10,218,031$ -$ 6,063,957$ 0.59 -19.4%2007 PRISA II 6/29/2007 63,374,139$ 64,417,799$ (678,489)$ 42,985,768$ 0.68 -16.9%2007 Blackstone Real Estate Partners VI 9/27/2007 50,000,000$ 26,970,348$ (45,200)$ 24,816,067$ 0.92 -3.3%2007 Canyon Johnson Urban Fund III 3/29/2010 25,000,000$ 3,266,334$ (40,468)$ 1,910,560$ 0.60 -93.2%2007 Capri Urban 6/3/2008 40,000,000$ 24,208,938$ -$ 12,013,445$ 0.50 -40.7%2007 Carlyle V 8/27/2007 15,000,000$ 15,050,467$ (2,562,995)$ 12,691,522$ 1.01 0.7%2007 Lehman Real Estate Fund III 6/4/2008 30,000,000$ 10,871,926$ (2,577,066)$ 3,006,919$ 0.51 -37.5%2007 Stockbridge III 9/9/2008 22,500,000$ 9,194,388$ -$ 4,518,992$ 0.49 -35.7%2007 Thor Urban Property Fund II 10/30/2008 12,500,000$ 6,684,988$ (1,207,012)$ 3,320,603$ 0.68 -52.5%2007 American Value Partners I 10/18/2007 25,000,000$ 11,433,280$ (44,359)$ 6,289,568$ 0.55 -48.6%2007 Metropolitan Workforce Housing Fund 7/13/2007 15,000,000$ 4,273,269$ (306,882)$ 1,722,123$ 0.47 -79.8%2008 Blackstone Europe III 10/24/2008 50,000,000$ 3,096,811$ -$ 3,870,420$ 1.25 26.0%2008 JPMorgan Urban Renaissance Fund 12/16/2008 16,360,625$ n/a n/a n/a n/a n/a2008 Westbrook VIII 12/28/2009 50,000,000$ 6,144,893$ (4,462,260)$ 1,949,734$ 1.04 17.0%2009 LaSalle U.S. Core Property Fund 7/1/2010 50,000,000$ 6,286,337$ - 6,261,503$ 1.00 -1.6%2009 BlackRock Carbon Capital III 7/2/2009 40,000,000$ 22,985,571$ (5,358,934)$ 19,381,082$ 1.08 11.4%
New York City Teachers Retirement System 1,072,734,764$ 769,121,811$ (311,452,584)$ 453,531,385$ 0.99 -0.3%Source: PCG historical cash flow data. TTG cash flow data from Fund Managers, effective 2005.Note: The equity multiples and IRRs contained in this report are interim calculations based upon information provided by the investment managers of the New York City Retirement Systems, including cash flows and quarterly unaudited, or audited, valuations. The IRR calculated in early years of a fund life is not meaningful given the J-curve effect and can be significantly impacted by the timing of cash flows, investment strategy, investment pacing, and fund life. The calculations are not necessarily indicative of total fund performance, which can only be determined after the fund is liquidated and all capital contributed and earnings have been distributed to the investor. All data supplied is as of September 30, 2010.
Note: The General Partner of the JPMorgan Urban Renaissance Fund terminated the Fund on February 23, 2010 and all capital contributed, including management fees, was returned to investors.
The Townsend Group
Teachers' Retirement System of the City of New York
50

II. Emerging Manager Review & Recommendation
51

THE CITY OF NEW YORKOFFICE OF THE COMPTROLLER
Emerging Managers Program Review and Recommendation
5-12-11
52

What is an Emerging Manager?
• The goal of the Emerging Managers Program is to gain exposure to smaller investment managers that generally do not have enough assets for “stand alone” mandates from the NYC Retirement Systems.
• Currently, TRS invests in emerging managers through Emerging Manager of Managers or Fund of Funds, who are charged with monitoring the underlying emerging managers (“sub-managers”) on a regular basis and providing performance measurement and analysis on at least a quarterly basis.
• Sub-managers will generally remain in the NYC Emerging Manager Program until they reach $1 billion of firm-wide assets under management.
2Bureau of Asset Management NYC Comptroller’s Office
53

TRS History with U.S. Equities Emerging Managers
• November 2007- NYC Teachers invested $270 million with 5 Emerging Manager of Managers. At the time of investment this represented 12% of Active U.S. Equities and 0.7% of total assets:
$81 million with Progress Investment Management $81 million with The FIS Group $36 million with Attucks Asset Management $36 million with Capital Prospects $36 million with Bivium Capital.*
* Bivium Capital was terminated in 2010.
3Bureau of Asset Management NYC Comptroller’s Office
54

TRS U.S. Equities Emerging Manager of Managers– Current Market Value
Manager of Managers TRS Investment ($ in Millions)As of 3/31/11
Total Progress (Mid Cap) $82M
F.I.S. Group (All Cap) 81
Attucks (Small Cap) 39
Capital Prospects (All Cap) 35
Total Emerging Manager of Managers $238M
Percent of Active U.S. Equity 28%
Percent of Total Assets 0.6%
4Bureau of Asset Management NYC Comptroller’s Office
55
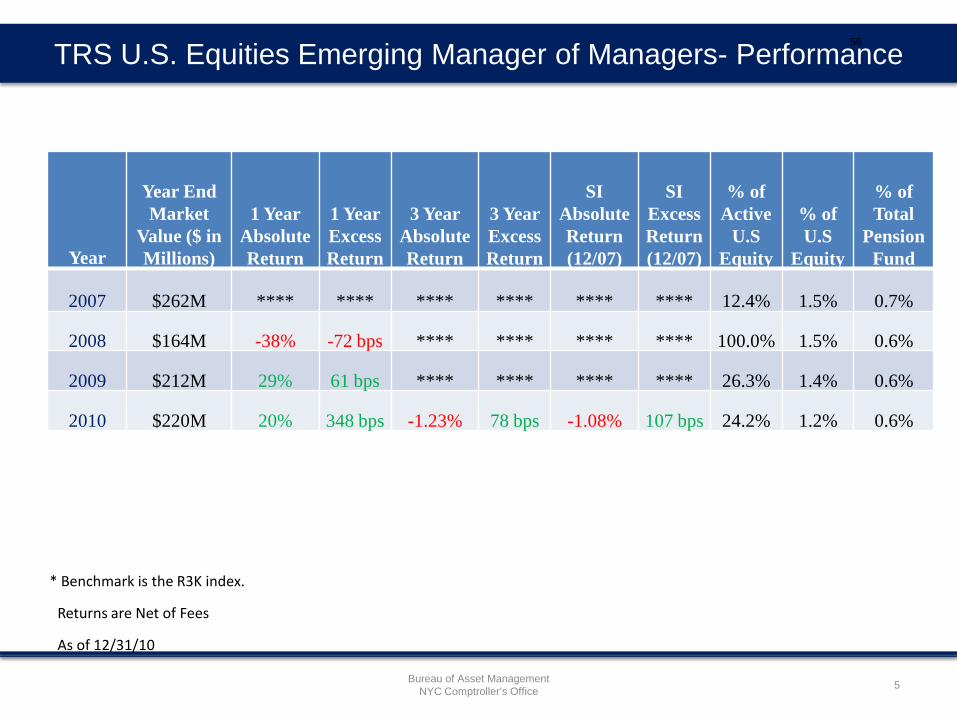
Year
Year End Market
Value ($ in Millions)
1 Year Absolute Return
1 Year Excess Return
3 Year AbsoluteReturn
3 Year Excess Return
SI Absolute Return (12/07)
SI Excess Return (12/07)
% of Active
U.S Equity
% of U.S
Equity
% of Total
Pension Fund
2007 $262M **** **** **** **** **** **** 12.4% 1.5% 0.7%
2008 $164M -38% -72 bps **** **** **** **** 100.0% 1.5% 0.6%
2009 $212M 29% 61 bps **** **** **** **** 26.3% 1.4% 0.6%
2010 $220M 20% 348 bps -1.23% 78 bps -1.08% 107 bps 24.2% 1.2% 0.6%
TRS U.S. Equities Emerging Manager of Managers- Performance
As of 12/31/10
Returns are Net of Fees
* Benchmark is the R3K index.
5Bureau of Asset Management NYC Comptroller’s Office
56

Recommended Investment Policy for the Emerging & Developing Managers
• The Emerging Manager of Manager’s Sub-Managers would be generally limited to under $2 billion of firm-wide assets under management (currently limited to under $1BN).
• A Sub-Manager can graduate out of the Emerging Managers Program when it reaches $2 billion in firm-wide AUM. In general, graduation can only occur if and when the Comptroller’s Office issues a new RFP in the Sub-Manager’s respective investment strategy and is selected by the Boards. Otherwise, the Sub-Manager will remain in the Emerging Managers Program.
• There should be no overlap between NYC’s Sub-Managers and Developing Managers.
6Bureau of Asset Management NYC Comptroller’s Office
57

III. Asset Allocation:
58

1
Asset Allocation Discussion
Teachers’ Retirement System of the City of New York
May 12, 2011
Robin Pellish 203-621-1723Chris Lyon 203-621-1718Mike Fulvio 203-621-1716Matt Maleri 203-621-1710
59

2
Introduction
The Board of the New York City Teachers’ Pension Fund has had a long term practice of periodically reviewing asset allocation policy and considering modifications to the Fund’s policy as capital markets and the Fund’s objectives evolve.
• Over time asset allocations to existing asset classes have been changed and new asset classes added to provide opportunities for incremental return or to manage various risks including equity risk, inflation, duration and volatility.
• Although the Fund’s asset allocation has changed significantly since its inception when it was fully invested in US fixed income, the policy tends to evolve incrementally over time. The addition of TIPS (2005), private real estate (2006), convertible bonds (2008) and opportunistic fixed income (2008) to the Fund is illustrative of the Board’s approach to asset allocation.
The following slides are consistent with this approach to asset allocation. This presentation suggests that several asset classes not currently utilized in the Fund be considered including emerging market equities and debt, commodities, and absolute return. The analysis suggests that the addition of some or all of these asset classes in combination with modifications to existing allocations serves to lower the expected risk of the Fund without reducing expected return.
Although the following slides contain a significant amount of information and quantitative metrics, several points worth noting include:
• Expected returns for most asset classes are fairly modest, with only private equity and emerging market equity having expected compound returns of 8% or greater.
• Despite these lower return expectations, expected volatility has not diminished.• Given the various constraints which apply to the Pension Fund such as the basket clause and specific return
objectives, the range of potential asset allocation mixes is fairly narrow. Nonetheless, the analysis does indicate that there is a potential benefit available from increasing the level of diversification within the Fund and reducing the equity risk which currently dominates the portfolio
60

3
Capital Market Assumptions Methodology
61

4
Rocaton Capital Market Forecasts-Methodology
Establish long-run equilibrium
expectations based on fundamental
building blocks
Step 1
Identify key economic factors
which influence market returns
Step 2
Regularly assess market conditions
versus equilibrium expectations
Step 3
Develop 10-year forecasts based on
equilibrium expectations adjusted
for current market conditions
Step 4
62
5
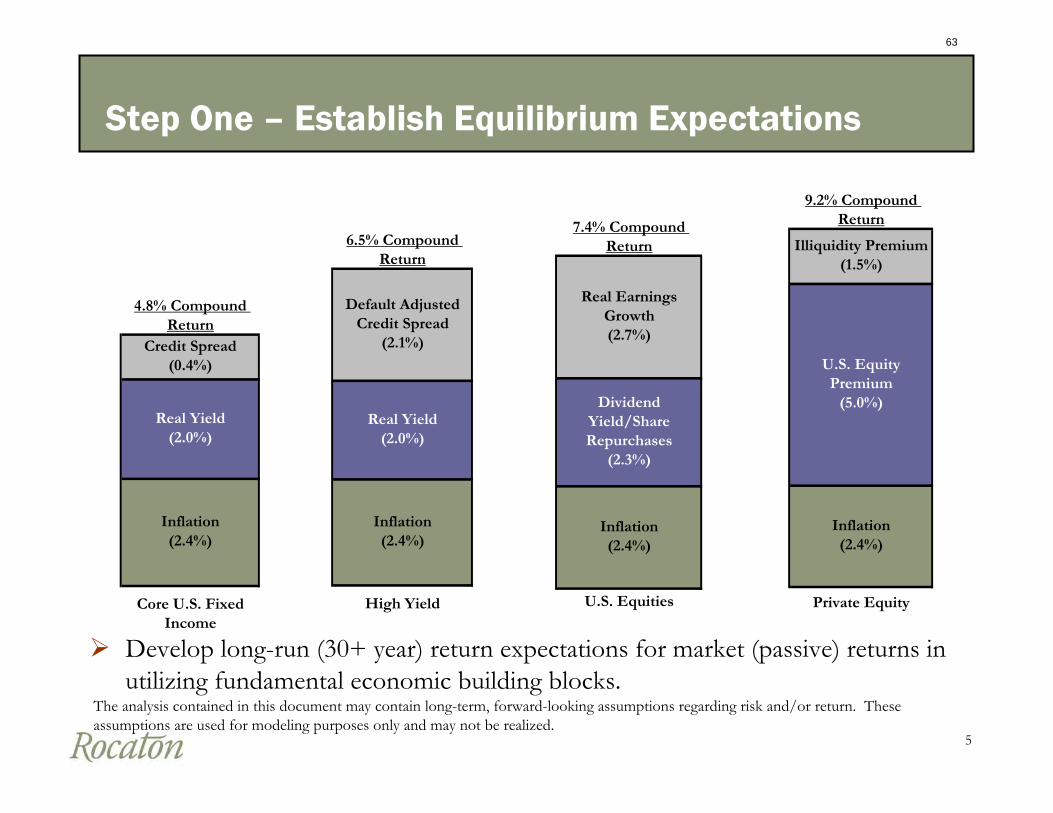
Step One – Establish Equilibrium Expectations
Develop long-run (30+ year) return expectations for market (passive) returns in utilizing fundamental economic building blocks.
Default Adjusted Credit Spread
(2.1%)
Inflation (2.4%)
6.5% Compound Return
High Yield
Real Yield (2.0%)
7.4% Compound Return
U.S. Equities
Dividend Yield/Share Repurchases
(2.3%)
Real Earnings Growth (2.7%)
Inflation (2.4%)
The analysis contained in this document may contain long-term, forward-looking assumptions regarding risk and/or return. These assumptions are used for modeling purposes only and may not be realized.
4.8% Compound Return
Core U.S. Fixed Income
Real Yield (2.0%)
Credit Spread (0.4%)
Inflation (2.4%)
9.2% Compound Return
Illiquidity Premium (1.5%)
Private Equity
Inflation (2.4%)
U.S. Equity Premium
(5.0%)
63

6
Step 2 – Identify Key Economic Factors
Capital market theory and empirical evidence indicates that the prices of financial assets are determined in part by the level of interest rates and the implied discounting of future cash flows.
Risk premiums investors are compensated by the market vary over time; Rocaton’s forecast utilize the level of investment-grade corporate bond spreads as a proxy for the “global risk premium.”
Rocaton’s forecast adjust returns of asset classes based on the expectation that breakeven inflation priced by the market will converge towards long-term expectations.
Treasury Yields
Corporate Spreads
Breakeven Inflation
64

7
Actual Forecasted
*30 Year Treasury Yields unavailable from February 2002 - January 2006.Sources: Barclays Capital, Rocaton
0
1
2
3
4
5
6
7
8
9
Jan-96
Jan-97
Jan-98
Jan-99
Jan-00
Jan-01
Jan-02
Jan-03
Jan-04
Jan-05
Jan-06
Jan-07
Jan-08
Jan-09
Jan-10
Jan-11
Jan-12
Jan-13
Jan-14
Jan-15
Jan-16
Yie
ld (
%)
1 Year
1 Year Long-Term Expected
30 Year*
30 Year Long-Term Expected
Actual Forecasted
Sources: Bloomberg, Rocaton
0.0
0.5
1.0
1.5
2.0
2.5
3.0
Jan-00
Jan-01
Jan-02
Jan-03
Jan-04
Jan-05
Jan-06
Jan-07
Jan-08
Jan-09
Jan-10
Jan-11
Jan-12
Jan-13
Jan-14
Jan-15
Jan-16
Bre
akev
en I
nfl
atio
n (
%)
10 Year BreakevenLong-Term Expected
Step 3 – Assess Current Market Conditions
10-Year Breakeven Inflation
Treasury Yields Corporate Bond Spreads
Start with current market conditions and construct forecasts for each key economic variable reflecting mean-reverting properties.
Forecasted
Actual
Sources: Barclays Capital, Rocaton
0
1
2
3
4
5
6
7
Jan-96
Jan-97
Jan-98
Jan-99
Jan-00
Jan-01
Jan-02
Jan-03
Jan-04
Jan-05
Jan-06
Jan-07
Jan-08
Jan-09
Jan-10
Jan-11
Jan-12
Jan-13
Jan-14
Jan-15
Jan-16
Cor
por
ate
Spre
ads
(%)
Corporate SpreadsLong-Term Expected
65
8
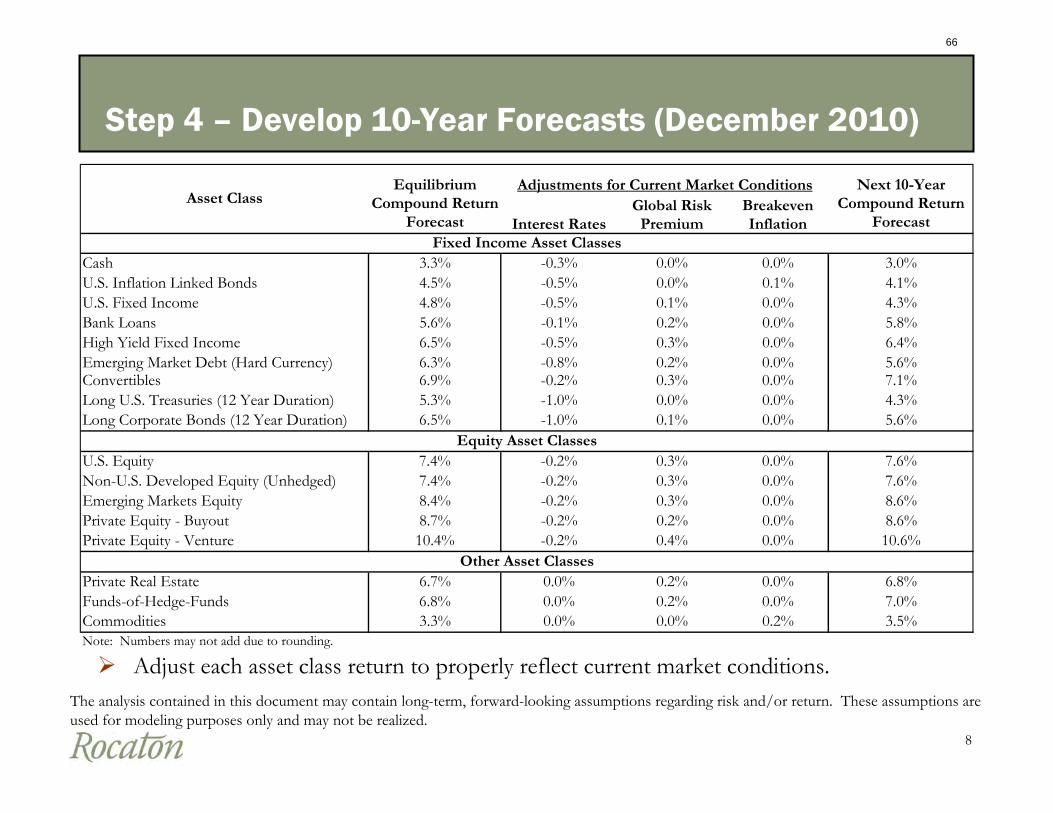
Cash 3.3% -0.3% 0.0% 0.0% 3.0%U.S. Inflation Linked Bonds 4.5% -0.5% 0.0% 0.1% 4.1%U.S. Fixed Income 4.8% -0.5% 0.1% 0.0% 4.3%Bank Loans 5.6% -0.1% 0.2% 0.0% 5.8%High Yield Fixed Income 6.5% -0.5% 0.3% 0.0% 6.4%Emerging Market Debt (Hard Currency) 6.3% -0.8% 0.2% 0.0% 5.6%Convertibles 6.9% -0.2% 0.3% 0.0% 7.1%Long U.S. Treasuries (12 Year Duration) 5.3% -1.0% 0.0% 0.0% 4.3%Long Corporate Bonds (12 Year Duration) 6.5% -1.0% 0.1% 0.0% 5.6%
U.S. Equity 7.4% -0.2% 0.3% 0.0% 7.6%Non-U.S. Developed Equity (Unhedged) 7.4% -0.2% 0.3% 0.0% 7.6%Emerging Markets Equity 8.4% -0.2% 0.3% 0.0% 8.6%Private Equity - Buyout 8.7% -0.2% 0.2% 0.0% 8.6%Private Equity - Venture 10.4% -0.2% 0.4% 0.0% 10.6%
Private Real Estate 6.7% 0.0% 0.2% 0.0% 6.8%Funds-of-Hedge-Funds 6.8% 0.0% 0.2% 0.0% 7.0%Commodities 3.3% 0.0% 0.0% 0.2% 3.5%Note: Numbers may not add due to rounding.
Equilibrium Compound Return
Forecast
Next 10-Year Compound Return
Forecast
Asset Class
Fixed Income Asset Classes
Equity Asset Classes
Other Asset Classes
Adjustments for Current Market Conditions
Interest RatesGlobal Risk
PremiumBreakeven Inflation
Step 4 – Develop 10-Year Forecasts (December 2010)
Adjust each asset class return to properly reflect current market conditions. The analysis contained in this document may contain long-term, forward-looking assumptions regarding risk and/or return. These assumptions are used for modeling purposes only and may not be realized.
66
9
Efficient Frontier and Candidate Portfolio Analysis
67

10
Capital Market Assumptions
The analysis contained in this document may contain long-term, forward-looking assumptions regarding risk and/or return. These assumptions are used for modeling purposes only and may not be realized.
Asset ClassCompound
Annual ReturnAverage
Annual Return
Standard Deviation of
Annual Return
5th Percentile Return
Outcome
95th Return Percentile Outcome
Sharpe Ratio
Cash 3.0% 3.0% 1.5% 0.5% 5.6% N/ABank Loans 5.8% 6.1% 8.0% -6.9% 19.2% 0.39TIPS 4.1% 4.5% 8.7% -9.8% 18.8% 0.17Non-U.S. Fixed Income (100% H) 4.2% 4.3% 5.2% -4.3% 12.9% 0.25Core + 5 4.6% 4.7% 6.0% -5.1% 14.6% 0.29High Yield 6.4% 7.1% 11.8% -12.3% 26.4% 0.34EMD 5.6% 6.1% 10.1% -10.5% 22.8% 0.31Long Treasury Bonds (12 Year Duration) 4.3% 5.0% 11.6% -14.1% 24.1% 0.17Long Corporate Bonds (12 Year Duration) 5.6% 6.5% 12.9% -14.7% 27.6% 0.27Convertibles 7.1% 8.0% 13.7% -14.5% 30.5% 0.36U.S. Equities 7.6% 9.4% 19.1% -22.0% 40.8% 0.33Non-U.S. Equities 7.6% 9.6% 19.7% -22.9% 42.0% 0.33Emerging Equities 8.6% 12.1% 26.6% -31.7% 55.9% 0.34REITS 7.6% 9.5% 19.4% -22.4% 41.3% 0.33Private Equity (90% Buyout/10% Venture) 9.2% 13.0% 27.7% -32.6% 58.6% 0.36Private Real Estate (Core) 6.2% 6.7% 9.9% -9.5% 22.9% 0.37Private Real Estate (Non-Core) 7.2% 8.1% 13.8% -14.6% 30.8% 0.37Commodities (DJ-UBS) 3.5% 4.2% 12.3% -16.1% 24.5% 0.10Absolute Return 7.0% 7.3% 8.0% -5.9% 20.5% 0.53Opportunistic Fixed Income1 6.7% 7.2% 10.2% -9.6% 23.9% 0.411Represents a blend of 40% High Yield/40% EMD/20% U.S. Equity
Rocaton Capital Market Assumptions: 10 Year Forecast as of December 31, 2010
68
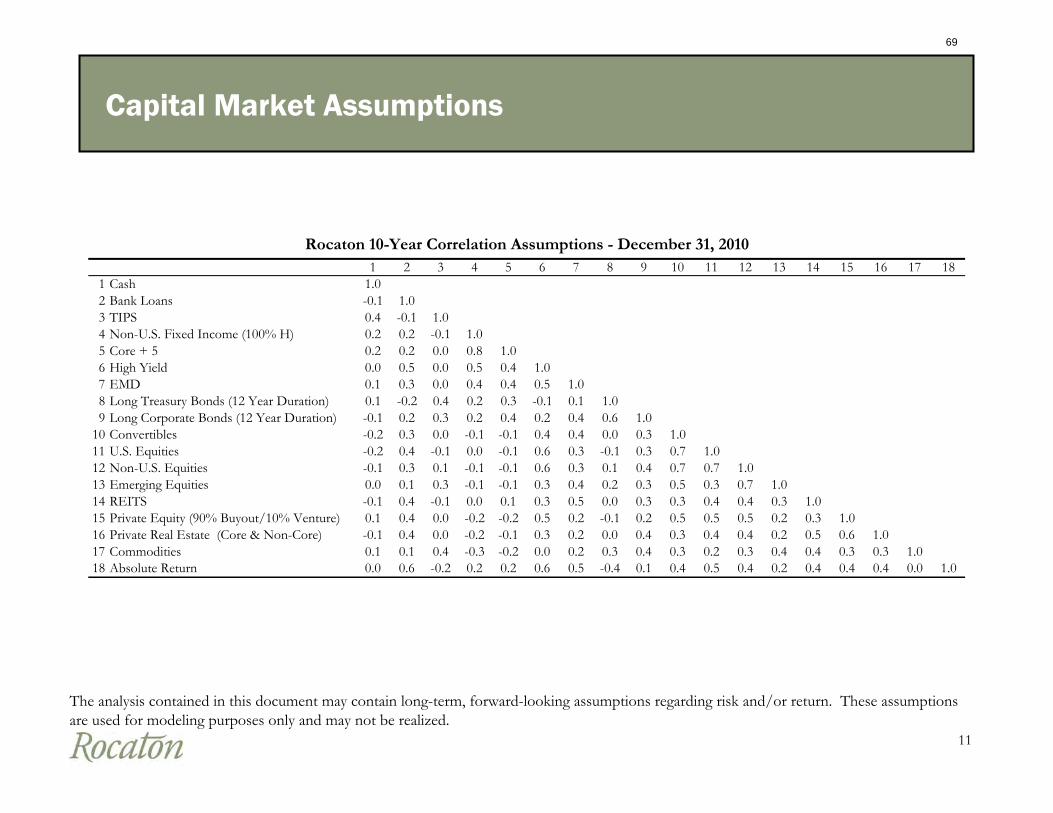
11
Capital Market Assumptions
The analysis contained in this document may contain long-term, forward-looking assumptions regarding risk and/or return. These assumptions are used for modeling purposes only and may not be realized.
Rocaton 10-Year Correlation Assumptions - December 31, 20101 2 3 4 5 6 7 8 9 10 11 12 13 14 15 16 17 18
1 Cash 1.02 Bank Loans -0.1 1.03 TIPS 0.4 -0.1 1.04 Non-U.S. Fixed Income (100% H) 0.2 0.2 -0.1 1.05 Core + 5 0.2 0.2 0.0 0.8 1.06 High Yield 0.0 0.5 0.0 0.5 0.4 1.07 EMD 0.1 0.3 0.0 0.4 0.4 0.5 1.08 Long Treasury Bonds (12 Year Duration) 0.1 -0.2 0.4 0.2 0.3 -0.1 0.1 1.09 Long Corporate Bonds (12 Year Duration) -0.1 0.2 0.3 0.2 0.4 0.2 0.4 0.6 1.0
10 Convertibles -0.2 0.3 0.0 -0.1 -0.1 0.4 0.4 0.0 0.3 1.011 U.S. Equities -0.2 0.4 -0.1 0.0 -0.1 0.6 0.3 -0.1 0.3 0.7 1.012 Non-U.S. Equities -0.1 0.3 0.1 -0.1 -0.1 0.6 0.3 0.1 0.4 0.7 0.7 1.013 Emerging Equities 0.0 0.1 0.3 -0.1 -0.1 0.3 0.4 0.2 0.3 0.5 0.3 0.7 1.014 REITS -0.1 0.4 -0.1 0.0 0.1 0.3 0.5 0.0 0.3 0.3 0.4 0.4 0.3 1.015 Private Equity (90% Buyout/10% Venture) 0.1 0.4 0.0 -0.2 -0.2 0.5 0.2 -0.1 0.2 0.5 0.5 0.5 0.2 0.3 1.016 Private Real Estate (Core & Non-Core) -0.1 0.4 0.0 -0.2 -0.1 0.3 0.2 0.0 0.4 0.3 0.4 0.4 0.2 0.5 0.6 1.017 Commodities 0.1 0.1 0.4 -0.3 -0.2 0.0 0.2 0.3 0.4 0.3 0.2 0.3 0.4 0.4 0.3 0.3 1.018 Absolute Return 0.0 0.6 -0.2 0.2 0.2 0.6 0.5 -0.4 0.1 0.4 0.5 0.4 0.2 0.4 0.4 0.4 0.0 1.0
69

12
Asset Class Min Max
Core Fixed Income + 5 3.0% n/aU.S. Equities 3.0% n/aNon-U.S. Equities 3.0% n/aEmerging Equities 3.0% 7.5%Commodities* 3.0% 10.0%Convertibles 3.0% 3.0%Emerging Market Debt 3.0% 10.0%High Yield Fixed Income 3.0% 10.0%REITS 3.0% 10.0%TIPS 3.0% 10.0%Private Real Estate (60% Non-Core) 3.0% 10.0%Private Equity 3.0% 7.5%Opportunistic Fixed Income 1.0% 5.0%Absolute Return 3.0% 10.0%
Group Constraints
Basket Clause = Non-U.S. Equities + Emerging Equities - 10% + 60% Real Estate + Private Equity + 50% EMD + Commodities + Absolute Return
0.0% 23.0%
Total Equities (U.S., Non-U.S., Emerging, Commodities, REITS, Private Real Estate, Private Equity, Absolute Return) > 60%Total Fixed Income (Core + 5, High Yield, EMD, TIPS, Convertibles) < 40%
Real Estate + REITS < 10%
Asset Class Constraints Summary
Constraint Summary – Max 23% to Basket Clause
*The addition of commodities to the plan would require significant time to implement.
70

13
Constraint Summary – Max 33% to Basket Clause
*The addition of commodities to the plan would require significant time to implement.
Asset Class Min Max
Core Fixed Income + 5 3.0% n/aU.S. Equities 3.0% n/aNon-U.S. Equities 3.0% n/aEmerging Equities 3.0% 10.0%Commodities* 3.0% 15.0%Convertibles 3.0% 3.0%Emerging Market Debt 3.0% 10.0%High Yield Fixed Income 3.0% 10.0%REITS 3.0% 15.0%TIPS 3.0% 15.0%Private Real Estate (60% Non-Core) 3.0% 15.0%Private Equity 3.0% 12.5%Opportunistic Fixed Income 1.0% 5.0%Absolute Return 3.0% 10.0%
Group Constraints
Basket Clause = Non-U.S. Equities + Emerging Equities - 10% + 60% Real Estate + Private Equity + 50% EMD + Commodities + Absolute Return
0.0% 33.0%
Total Equities (U.S., Non-U.S., Emerging, Commodities, REITS, Private Real Estate, Private Equity, Absolute Return) > 60%Total Fixed Income (Core + 5, High Yield, EMD, TIPS, Convertibles) < 40%
Real Estate + REITS < 10%
Asset Class Constraints Summary
71
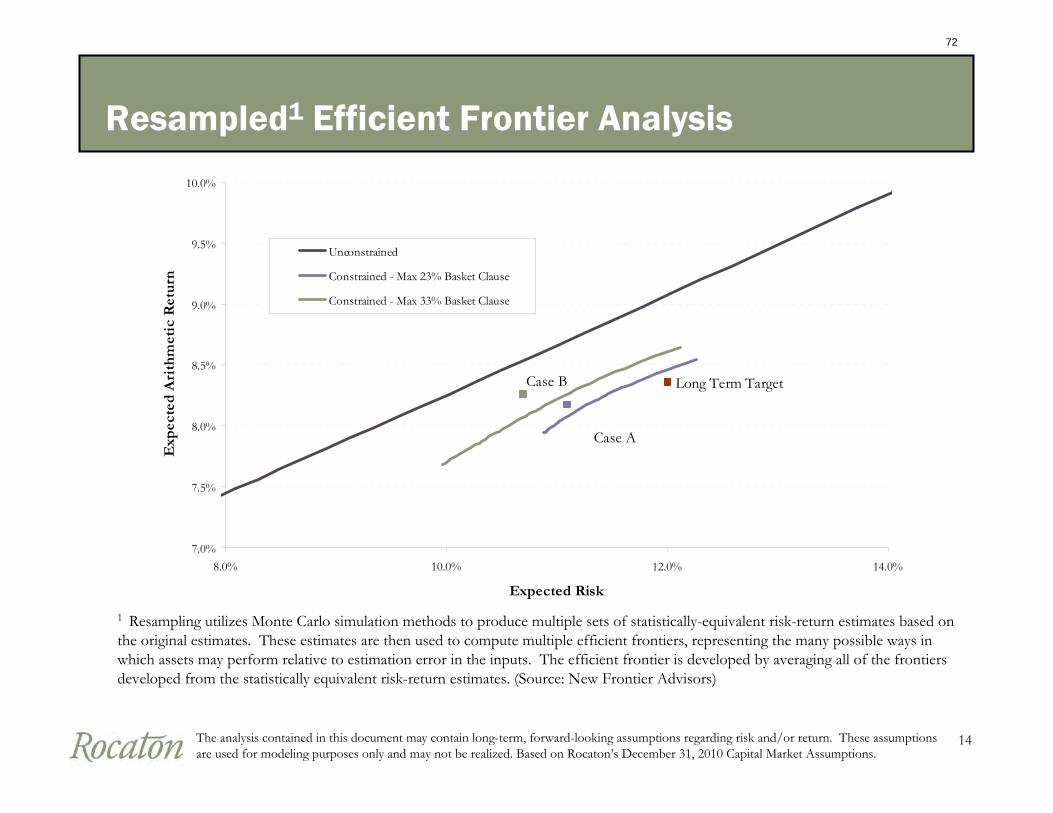
14
Resampled1 Efficient Frontier Analysis
1 Resampling utilizes Monte Carlo simulation methods to produce multiple sets of statistically-equivalent risk-return estimates based on the original estimates. These estimates are then used to compute multiple efficient frontiers, representing the many possible ways in which assets may perform relative to estimation error in the inputs. The efficient frontier is developed by averaging all of the frontiers developed from the statistically equivalent risk-return estimates. (Source: New Frontier Advisors)
The analysis contained in this document may contain long-term, forward-looking assumptions regarding risk and/or return. These assumptions are used for modeling purposes only and may not be realized. Based on Rocaton’s December 31, 2010 Capital Market Assumptions.
Case B
Case A
Long Term Target
7.0%
7.5%
8.0%
8.5%
9.0%
9.5%
10.0%
8.0% 10.0% 12.0% 14.0%
Expected Risk
Exp
ecte
d A
rith
met
ic R
etu
rn
Unconstrained
Constrained - Max 23% Basket Clause
Constrained - Max 33% Basket Clause
72

15
Alternative Portfolios
The analysis contained in this document may contain long-term, forward-looking assumptions regarding risk and/or return. These assumptions are used for modeling purposes only and may not be realized. Based on Rocaton’s December 31, 2010 Capital Market Assumptions.
U.S. Equity 38.0% 30.0% 25.0%International Developed Markets 16.0% 10.0% 9.0%Emerging Market Equities 3.0% 7.0% 8.0%REITs 4.0% 4.0% 4.0%Commodities 0.0% 0.0% 4.0%Private Equity1 4.0% 6.0% 7.0%Private Real Estate (Core) 2.0% 3.0% 3.0%Private Real Estate (Non-Core) 3.0% 2.0% 2.0%Absolute Return 0.0% 3.0% 5.0%
Total Equity - Public & Private 70.0% 65.0% 67.0%
Core+5 18.0% 17.0% 14.0%Convertibles 1.0% 3.0% 3.0%TIPS 4.0% 5.0% 5.0%Opportunistic Fixed2 1.5% 4.0% 5.0%High Yield 5.5% 3.0% 3.0%Emerging Market Debt 0.0% 3.0% 3.0%
Total Domestic Fixed Income 30.0% 35.0% 33.0%
Total Basket Clause (Approximate) 18% 24% 32%Total 100.0% 100.0% 100.0%
Risk/Return SummaryExpected Compound Return 7.6% 7.7% 7.7%Expected Arithmetic Return 8.4% 8.3% 8.3%Expected Risk 12.0% 11.0% 10.7%Sharpe Ratio 0.45 0.48 0.49
VAR Analysis1% Probability Downside (%) -19.6% -17.3% -16.6%1% Probability Downside ($ billions)3 ($7.9) ($7.0) ($6.7)1 90% Buyout, 10% Venture Capital2 Modeled as 40% High Yield/40% EMD/20% U.S. Equity3 Estimated based on total assets of $40.3 billion as of December 31, 2010.
Teachers’ Retirement System of the City of New York
Long Term Target Case BCase A
73
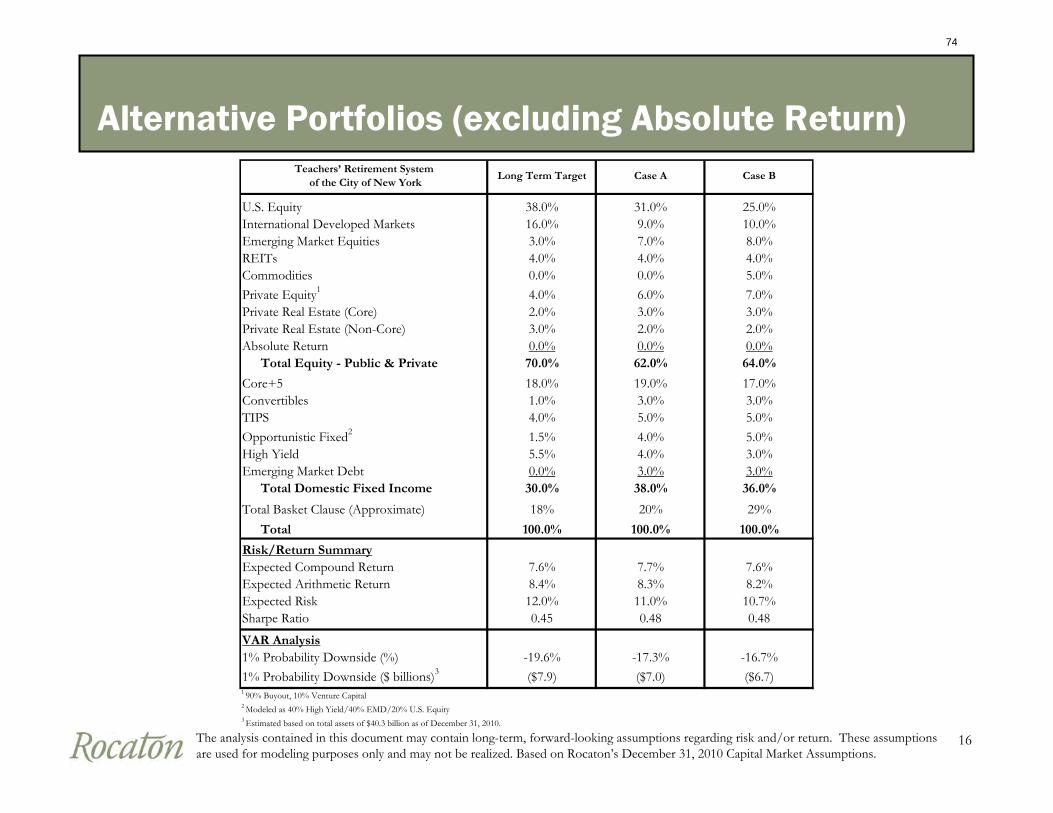
16
Alternative Portfolios (excluding Absolute Return)
The analysis contained in this document may contain long-term, forward-looking assumptions regarding risk and/or return. These assumptions are used for modeling purposes only and may not be realized. Based on Rocaton’s December 31, 2010 Capital Market Assumptions.
U.S. Equity 38.0% 31.0% 25.0%International Developed Markets 16.0% 9.0% 10.0%Emerging Market Equities 3.0% 7.0% 8.0%REITs 4.0% 4.0% 4.0%Commodities 0.0% 0.0% 5.0%Private Equity1 4.0% 6.0% 7.0%Private Real Estate (Core) 2.0% 3.0% 3.0%Private Real Estate (Non-Core) 3.0% 2.0% 2.0%Absolute Return 0.0% 0.0% 0.0%
Total Equity - Public & Private 70.0% 62.0% 64.0%
Core+5 18.0% 19.0% 17.0%Convertibles 1.0% 3.0% 3.0%TIPS 4.0% 5.0% 5.0%Opportunistic Fixed2 1.5% 4.0% 5.0%High Yield 5.5% 4.0% 3.0%Emerging Market Debt 0.0% 3.0% 3.0%
Total Domestic Fixed Income 30.0% 38.0% 36.0%
Total Basket Clause (Approximate) 18% 20% 29%Total 100.0% 100.0% 100.0%
Risk/Return SummaryExpected Compound Return 7.6% 7.7% 7.6%Expected Arithmetic Return 8.4% 8.3% 8.2%Expected Risk 12.0% 11.0% 10.7%Sharpe Ratio 0.45 0.48 0.48
VAR Analysis1% Probability Downside (%) -19.6% -17.3% -16.7%1% Probability Downside ($ billions)3 ($7.9) ($7.0) ($6.7)1 90% Buyout, 10% Venture Capital2 Modeled as 40% High Yield/40% EMD/20% U.S. Equity3 Estimated based on total assets of $40.3 billion as of December 31, 2010.
Teachers’ Retirement System of the City of New York
Long Term Target Case BCase A
74
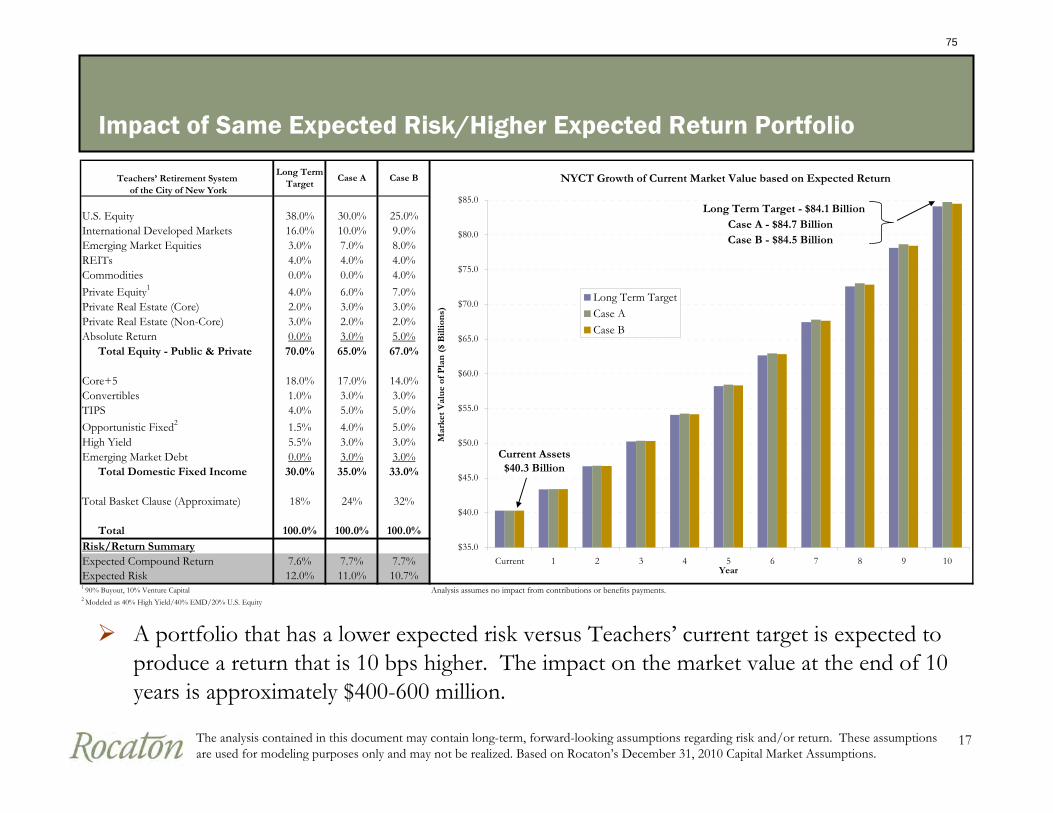
17
Impact of Same Expected Risk/Higher Expected Return Portfolio
A portfolio that has a lower expected risk versus Teachers’ current target is expected to produce a return that is 10 bps higher. The impact on the market value at the end of 10 years is approximately $400-600 million.
The analysis contained in this document may contain long-term, forward-looking assumptions regarding risk and/or return. These assumptions are used for modeling purposes only and may not be realized. Based on Rocaton’s December 31, 2010 Capital Market Assumptions.
Teachers’ Retirement System of the City of New York
Long Term Target
Case A Case B
U.S. Equity 38.0% 30.0% 25.0%International Developed Markets 16.0% 10.0% 9.0%Emerging Market Equities 3.0% 7.0% 8.0%REITs 4.0% 4.0% 4.0%Commodities 0.0% 0.0% 4.0%Private Equity1 4.0% 6.0% 7.0%Private Real Estate (Core) 2.0% 3.0% 3.0%Private Real Estate (Non-Core) 3.0% 2.0% 2.0%Absolute Return 0.0% 3.0% 5.0%
Total Equity - Public & Private 70.0% 65.0% 67.0%
Core+5 18.0% 17.0% 14.0%Convertibles 1.0% 3.0% 3.0%TIPS 4.0% 5.0% 5.0%Opportunistic Fixed2 1.5% 4.0% 5.0%High Yield 5.5% 3.0% 3.0%Emerging Market Debt 0.0% 3.0% 3.0%
Total Domestic Fixed Income 30.0% 35.0% 33.0%
Total Basket Clause (Approximate) 18% 24% 32%
Total 100.0% 100.0% 100.0%Risk/Return SummaryExpected Compound Return 7.6% 7.7% 7.7%Expected Risk 12.0% 11.0% 10.7%1 90% Buyout, 10% Venture Capital Analysis assumes no impact from contributions or benefits payments.2 Modeled as 40% High Yield/40% EMD/20% U.S. Equity
NYCT Growth of Current Market Value based on Expected Return
$35.0
$40.0
$45.0
$50.0
$55.0
$60.0
$65.0
$70.0
$75.0
$80.0
$85.0
Current 1 2 3 4 5 6 7 8 9 10Year
Mar
ket
Val
ue
of P
lan
($
Bill
ion
s)
Long Term TargetCase ACase B
Case A - $84.7 BillionLong Term Target - $84.1 Billion
Current Assets $40.3 Billion
Case B - $84.5 Billion
75

18
Historical Analysis
76

19
Recent Stress Periods – Historical Results
Analysis assumes monthly rebalancing. Benchmarks utilized: Russell 3000, MSCI EAFE Net, MSCI EM, DJ Wilshire REIT, DJ UBS Commodity Index, 67% Cambridge PE/33% Cambridge Venture, NCREIF Prop Index (1Q lagged), Citigroup Core+5 Index, Barclays US TIPS, BofA ML High Yield Master II Constrained, JPM EMBI Global Diversified, BofA ML Investment Grade Convertibles
$0.72$0.72$0.68
$0.92
$0.90
$0.85
Growth of $1 - Credit Crisis (July 2007 - March 2009)
$0.60
$0.70
$0.80
$0.90
$1.00
$1.10
Jun-07
Sep-07
Dec-07
Mar-08
Jun-08
Sep-08
Dec-08
Long Term Target Case A Case B
Growth of $1 Tech Bubble (March 2000 - March 2003)
$0.80
$0.85
$0.90
$0.95
$1.00
$1.05
$1.10
$1.15
Mar-00
Jun-00
Sep-00
Dec-00
Mar-01
Jun-01
Sep-01
Dec-01
Mar-02
Jun-02
Sep-02
Dec-02
Mar-03
Long Term Target Case A Case B
77
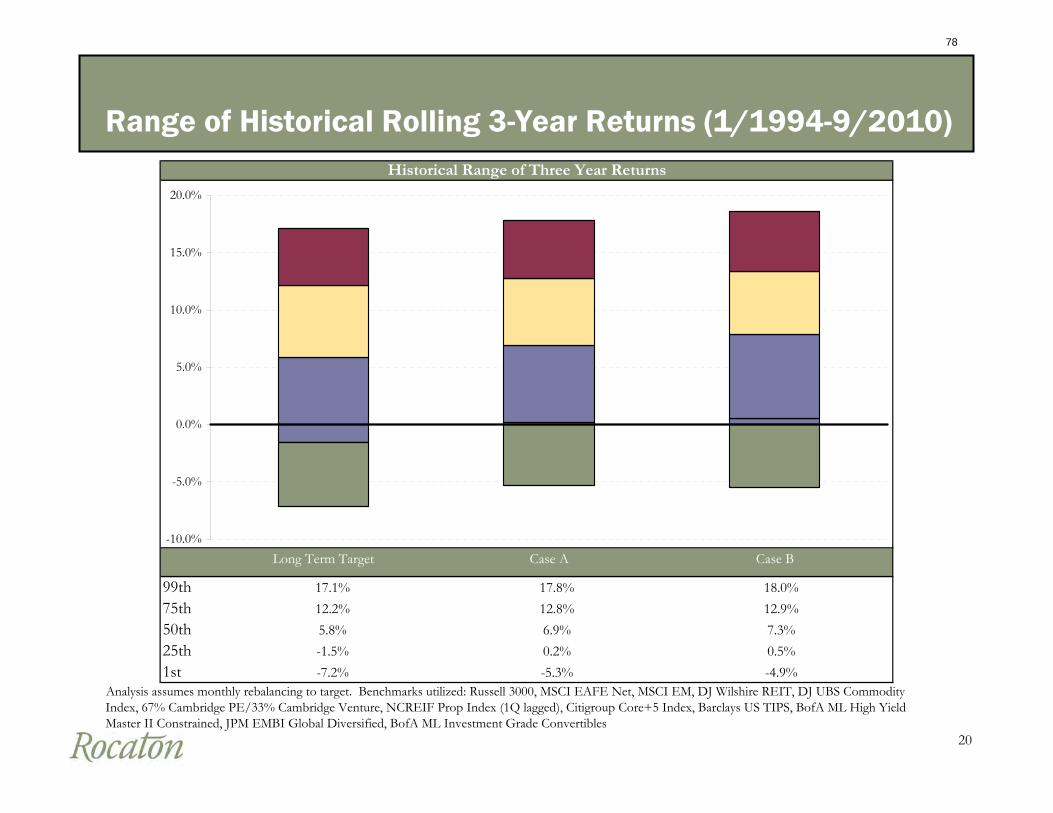
20
Range of Historical Rolling 3-Year Returns (1/1994-9/2010)
Analysis assumes monthly rebalancing to target. Benchmarks utilized: Russell 3000, MSCI EAFE Net, MSCI EM, DJ Wilshire REIT, DJ UBS Commodity Index, 67% Cambridge PE/33% Cambridge Venture, NCREIF Prop Index (1Q lagged), Citigroup Core+5 Index, Barclays US TIPS, BofA ML High Yield Master II Constrained, JPM EMBI Global Diversified, BofA ML Investment Grade Convertibles
99th 17.1% 17.8% 18.0%75th 12.2% 12.8% 12.9%50th 5.8% 6.9% 7.3%25th -1.5% 0.2% 0.5%1st -7.2% -5.3% -4.9%
Historical Range of Three Year Returns
-10.0%
-5.0%
0.0%
5.0%
10.0%
15.0%
20.0%
Long Term Target Case A Case B
78
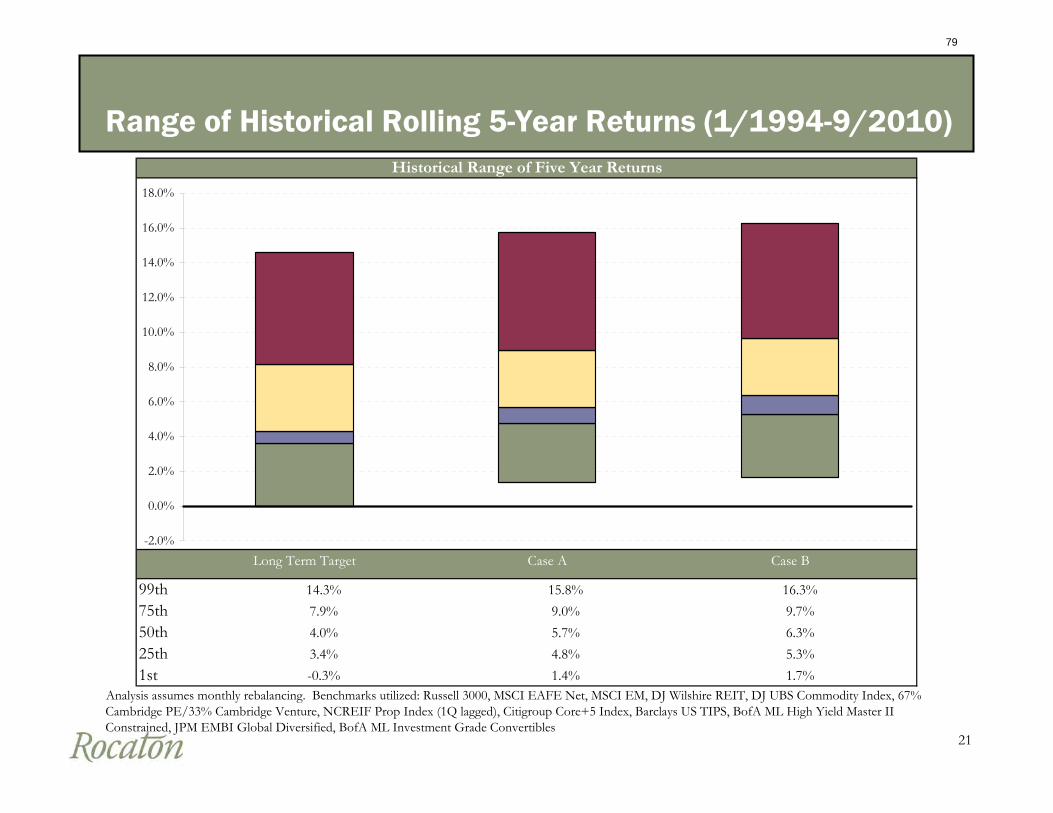
21
Range of Historical Rolling 5-Year Returns (1/1994-9/2010)
Analysis assumes monthly rebalancing. Benchmarks utilized: Russell 3000, MSCI EAFE Net, MSCI EM, DJ Wilshire REIT, DJ UBS Commodity Index, 67% Cambridge PE/33% Cambridge Venture, NCREIF Prop Index (1Q lagged), Citigroup Core+5 Index, Barclays US TIPS, BofA ML High Yield Master II Constrained, JPM EMBI Global Diversified, BofA ML Investment Grade Convertibles
99th 14.3% 15.8% 16.3%75th 7.9% 9.0% 9.7%50th 4.0% 5.7% 6.3%25th 3.4% 4.8% 5.3%1st -0.3% 1.4% 1.7%
Historical Range of Five Year Returns
-2.0%
0.0%
2.0%
4.0%
6.0%
8.0%
10.0%
12.0%
14.0%
16.0%
18.0%
Long Term Target Case A Case B
79
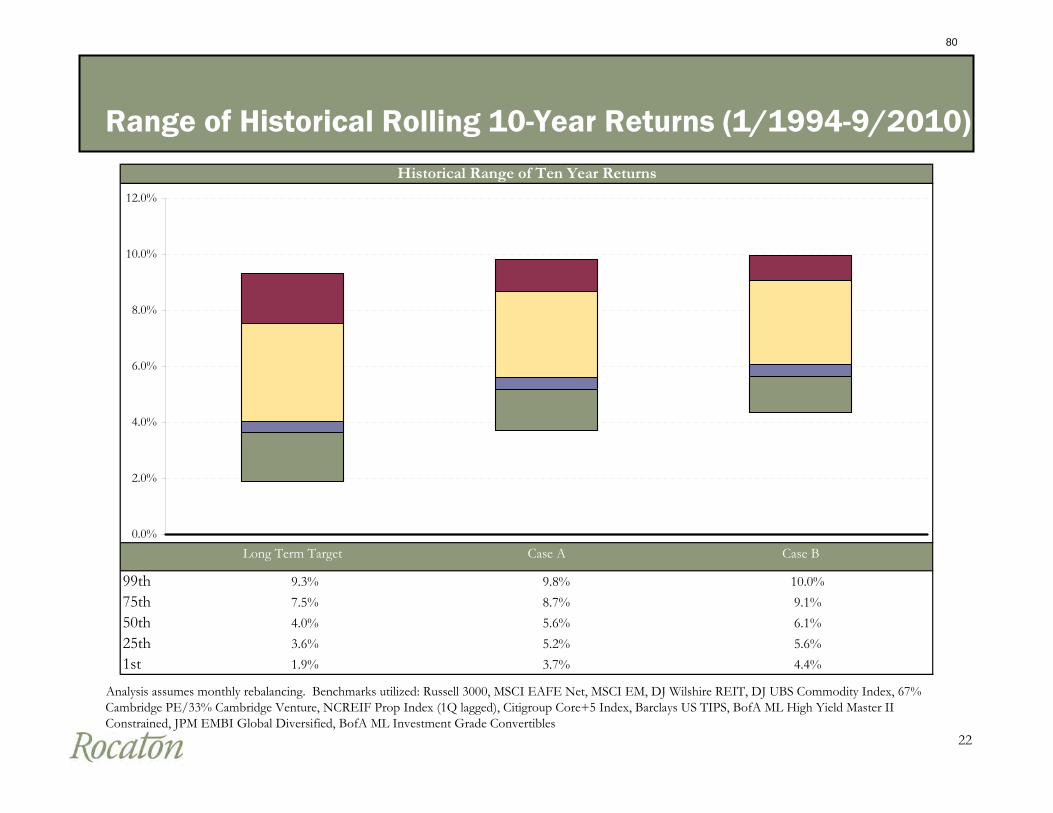
22
Range of Historical Rolling 10-Year Returns (1/1994-9/2010)
Analysis assumes monthly rebalancing. Benchmarks utilized: Russell 3000, MSCI EAFE Net, MSCI EM, DJ Wilshire REIT, DJ UBS Commodity Index, 67% Cambridge PE/33% Cambridge Venture, NCREIF Prop Index (1Q lagged), Citigroup Core+5 Index, Barclays US TIPS, BofA ML High Yield Master II Constrained, JPM EMBI Global Diversified, BofA ML Investment Grade Convertibles
99th 9.3% 9.8% 10.0%75th 7.5% 8.7% 9.1%50th 4.0% 5.6% 6.1%25th 3.6% 5.2% 5.6%1st 1.9% 3.7% 4.4%
Historical Range of Ten Year Returns
0.0%
2.0%
4.0%
6.0%
8.0%
10.0%
12.0%
Long Term Target Case A Case B
80

23
Environmental Analysis
81
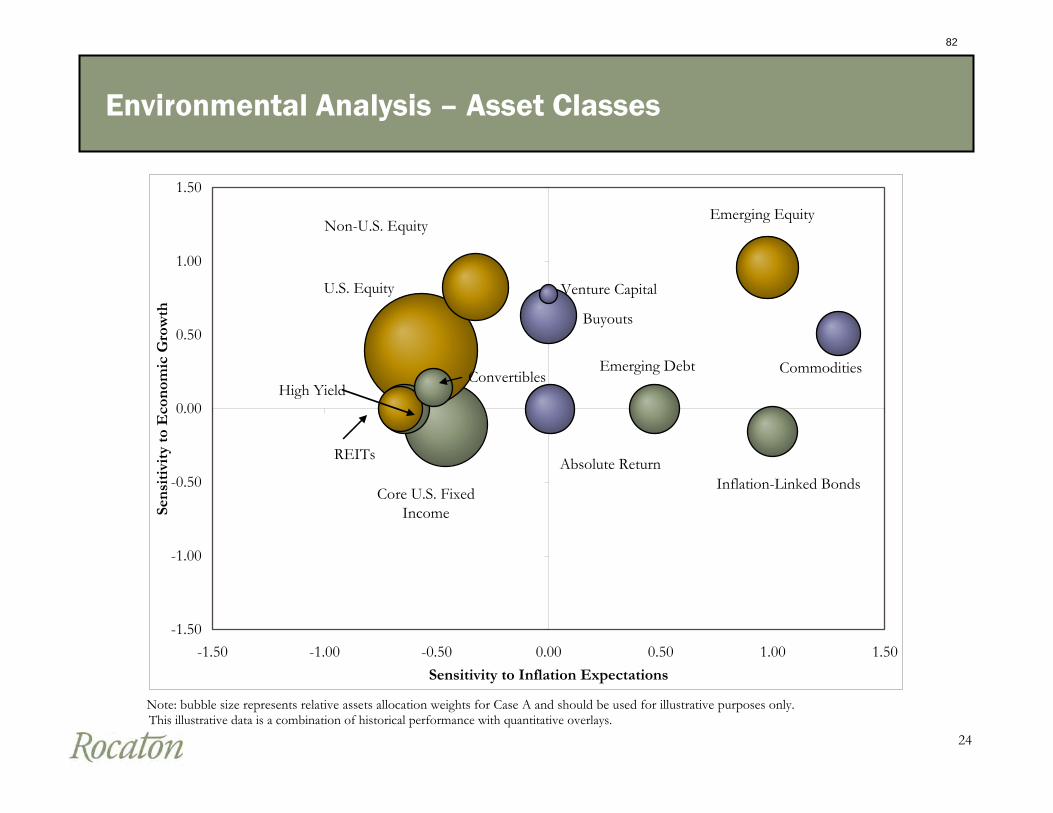
24
Note: bubble size represents relative assets allocation weights for Case A and should be used for illustrative purposes only.
Core U.S. Fixed Income
U.S. Equity
Non-U.S. EquityEmerging Equity
Inflation-Linked Bonds
Emerging Debt
Buyouts
Venture Capital
CommoditiesHigh Yield
REITs
Convertibles
Absolute Return
-1.50
-1.00
-0.50
0.00
0.50
1.00
1.50
-1.50 -1.00 -0.50 0.00 0.50 1.00 1.50Sensitivity to Inflation Expectations
Sen
siti
vity
to
Eco
nom
ic G
row
th
Environmental Analysis – Asset Classes
This illustrative data is a combination of historical performance with quantitative overlays.
82
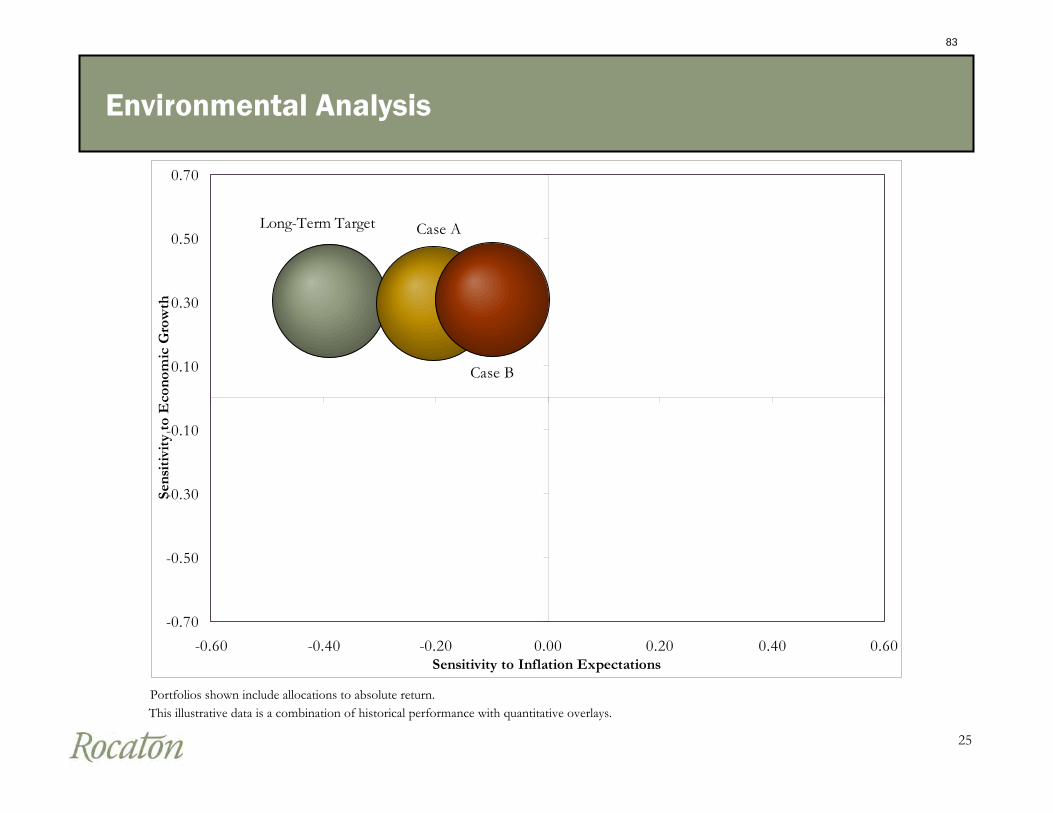
25
Environmental Analysis
Portfolios shown include allocations to absolute return.This illustrative data is a combination of historical performance with quantitative overlays.
Long-Term Target Case A
Case B
-0.70
-0.50
-0.30
-0.10
0.10
0.30
0.50
0.70
-0.60 -0.40 -0.20 0.00 0.20 0.40 0.60Sensitivity to Inflation Expectations
Sens
itiv
ity
to E
cono
mic
Gro
wth
83

26
Appendix
84
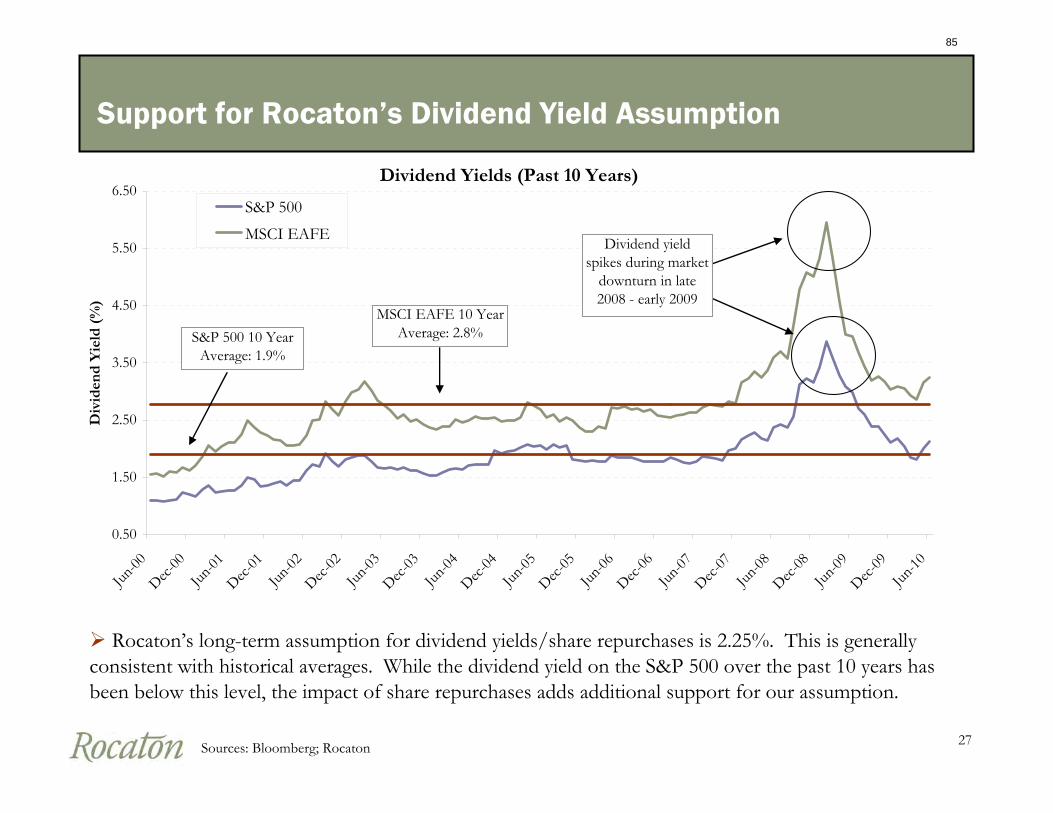
27
Support for Rocaton’s Dividend Yield Assumption
Rocaton’s long-term assumption for dividend yields/share repurchases is 2.25%. This is generally consistent with historical averages. While the dividend yield on the S&P 500 over the past 10 years has been below this level, the impact of share repurchases adds additional support for our assumption.
Sources: Bloomberg; Rocaton
Dividend Yields (Past 10 Years)
0.50
1.50
2.50
3.50
4.50
5.50
6.50
Jun-00
Dec-00
Jun-01
Dec-01
Jun-02
Dec-02
Jun-03
Dec-03
Jun-04
Dec-04
Jun-05
Dec-05
Jun-06
Dec-06
Jun-07
Dec-07
Jun-08
Dec-08
Jun-09
Dec-09
Jun-10
Div
iden
d Y
ield
(%
)
S&P 500
MSCI EAFE
S&P 500 10 Year Average: 1.9%
MSCI EAFE 10 Year Average: 2.8%
Dividend yield spikes during market
downturn in late 2008 - early 2009
85

28
Disclosures
The analysis contained in this document may contain historical information which may not be indicative of future experience.
The analysis contained in this document may contain long-term, forward-looking assumptions regarding risk and/or return. These assumptions are used for modeling purposes only and may not be realized.
The potential impact of active management may not be included in the analysis.
This analysis was prepared on a best-efforts basis and no warrantees or guarantees are made with respect to any reliance made on this analysis.
86

APPENDICES
87

TUCS Performance Rankings 4Q10
88
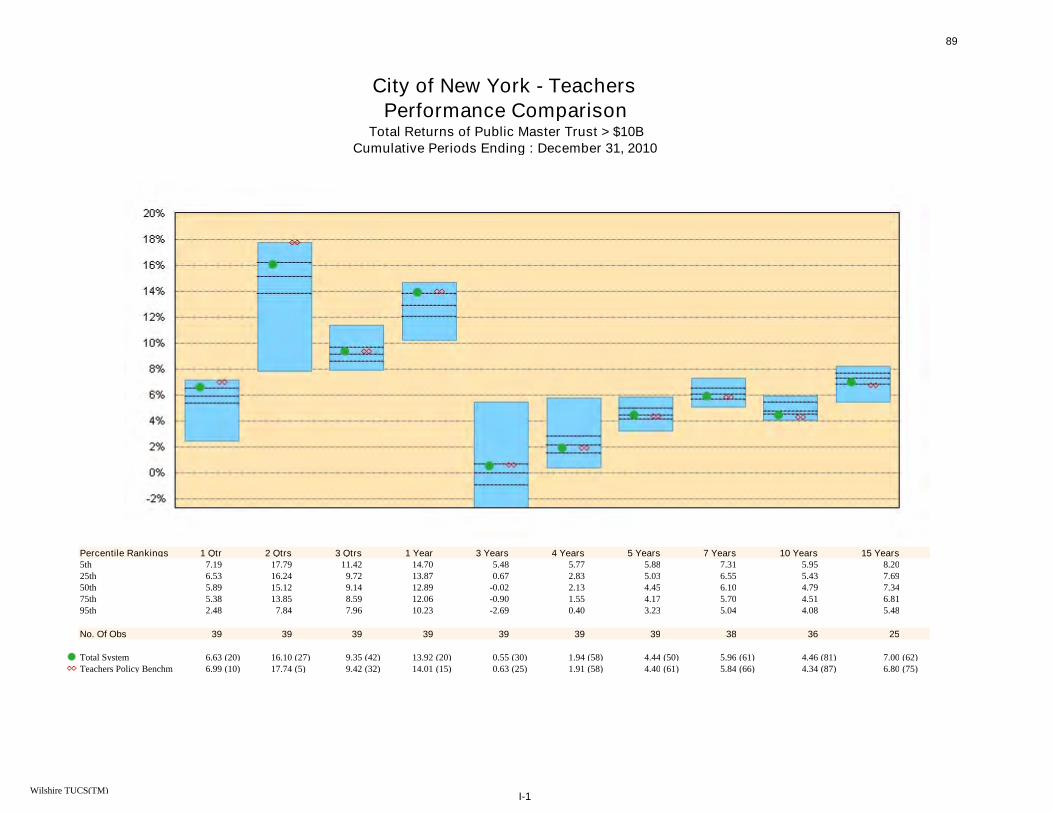
City of New York - TeachersPerformance Comparison
Total Returns of Public Master Trust > $10BCumulative Periods Ending : December 31, 2010
Percentile Rankings 1 Qtr 2 Qtrs 3 Qtrs 1 Year 3 Years 4 Years 5 Years 7 Years 10 Years 15 Years5th 7.19 17.79 11.42 14.70 5.48 5.77 5.88 7.31 5.95 8.2025th 6.53 16.24 9.72 13.87 0.67 2.83 5.03 6.55 5.43 7.6950th 5.89 15.12 9.14 12.89 -0.02 2.13 4.45 6.10 4.79 7.3475th 5.38 13.85 8.59 12.06 -0.90 1.55 4.17 5.70 4.51 6.8195th 2.48 7.84 7.96 10.23 -2.69 0.40 3.23 5.04 4.08 5.48
No. Of Obs 39 39 39 39 39 39 39 38 36 25 Total System 6.63 (20) 16.10 (27) 9.35 (42) 13.92 (20) 0.55 (30) 1.94 (58) 4.44 (50) 5.96 (61) 4.46 (81) 7.00 (62)Teachers Policy Benchm 6.99 (10) 17.74 (5) 9.42 (32) 14.01 (15) 0.63 (25) 1.91 (58) 4.40 (61) 5.84 (66) 4.34 (87) 6.80 (75)
Wilshire TUCS(TM)I-1
89

City of New York - TeachersPerformance Comparison
Total Returns of Public Master Trust > $10BConsecutive Time Periods: December 31, 2010
Percentile Rankings Dec. 10 Sep. 10 Jun. 10 Mar. 10 Dec. 09 Dec. 10 Dec. 09 Dec. 08 Dec. 07 Dec. 065th 7.19 10.72 0.30 4.28 4.97 14.70 24.24 -5.20 14.11 18.0125th 6.53 9.19 -4.00 3.75 3.87 13.87 21.54 -23.46 10.13 15.6650th 5.89 8.62 -5.35 3.39 3.55 12.89 19.47 -26.32 8.89 14.6775th 5.38 8.04 -5.82 2.95 3.23 12.06 15.51 -27.85 7.93 13.6695th 2.48 6.59 -6.42 2.64 1.85 10.23 9.17 -30.50 6.66 7.99
No. Of Obs 39 39 39 39 39 39 39 39 39 39 Total System 6.63 (20) 8.88 (37) -5.81 (72) 4.17 (13) 3.87 (25) 13.92 (20) 21.20 (30) -26.36 (52) 6.21 (100) 15.07 (32)Teachers Policy Benchm 6.99 (10) 10.05 (8) -7.07 (96) 4.20 (5) 4.06 (13) 14.01 (15) 25.00 (1) -28.50 (80) 5.86 (100) 14.97 (32)
Wilshire TUCS(TM)I-2
90

Basket Clause
91

TRS - BASKET/NON BASKET SUMMARY
As of March 31, 2011
Equity Non Basket Basket TotalNon
Basket Basket Total
Domestic Equity 38.00% 0.00% 38.00% 42.98% 0.00% 42.98%
REITS 4.00% 0.00% 4.00% 4.10% 0.00% 4.10%
Non-U.S. Equity 10.00% 9.00% 19.00% 10.00% 7.95% 17.95%
Private Equity 0.00% 4.00% 4.00% 0.00% 4.60% 4.60%
Real Estate 2.00% 3.00% 5.00% 0.69% 0.67% 1.37%Total Equity 54.00% 16.00% 70.00% 57.78% 13.23% 71.00%
Fixed IncomeCore+5 18.00% 0.00% 18.00% 15.92% 0.00% 15.92%
U.S. Gov't Sector 3.82% 0.00% 3.82% 2.56% 0.00% 2.56%Mortgage Sector 7.88% 0.00% 7.88% 7.79% 0.00% 7.79%
Credit Sector 6.29% 0.00% 6.29% 5.58% 0.00% 5.58%
High Yield 5.00% 0.50% 5.50% 3.53% 0.35% 3.87%
TIPS 3.25% 0.75% 4.00% 2.71% 0.63% 3.33%
Convertibles 0.80% 0.20% 1.00% 0.76% 0.28% 1.04%
Opportunistic 1.00% 0.50% 1.50% 0.19% 0.75% 0.94%
Other Fixed Income 0.00% 0.00% 0.00% 3.89% 0.00% 3.89%Total Fixed Income 28.05% 1.95% 30.00% 26.99% 2.01% 29.00%
Total Fund 82.05% 17.95% 100.00% 84.77% 15.23% 100.00%
Remaining Capacity 7.05% 9.77%
Fund Policy Fund Actual (PE & RE on an
invested basis)
92