Embed Size (px)
Citation preview

New York City Department of Transportation
Sustainable Streets Index2008
70
80
90
100
110
120
130
140
150
1990 1991 20071992 1993 1994 1995 1996 1997 1998 1999 2000 2001 2002 2003 2004 2005 2006

New York City Department of Transportation2 Sustainable Streets Index 2008 3
560 miles of bike lanes and paths in NYC, compared to 119 lane-miles in 1997. Source: NYCDOT
84%of Manhattan central business district workers get to work by transit, biking, or walking.Source: 2000 U.S. Census
56% of all auto trips citywide are under 3 miles.Source: 2001 National HouseholdTravel Survey
34% of all trips citywide are made by walking. 33% are made by auto and 30% are made by transit.
Source: 2001 National HouseholdTransportation Survey
10 of the 10 largest metro areas in the US saw transit ridership grow faster than vehicle miles traveled (VMT) from 2003 to 2007. Source: American Public TransportationAssociation, Texas TransportationInstitute
9% growth in bus and subway ridership in New York City from 2003 to 2007, while traffic volumes citywide were unchanged. Source: See text of report

New York City Department of Transportation4 Sustainable Streets Index 2008 1
2 Letter from the Commissioner
3 Executive Summary
6 Transportation Profile
8 Introduction
12 Citywide Trends
16 Travel into the CBD
24 Travel outside the CBD
35 Appendix
New York City Department of Transportation4
Contents

New York City Department of Transportation2 Sustainable Streets Index 2008 3
Dear City Council Members and fellow New Yorkers:
The Department of Transportation has set an ambitious new direction for managing our city’s transportation system. In April 2008, we released Sustainable Streets, the Department’s comprehensive strategic plan for Sustainable Streets, the Department’s comprehensive strategic plan for Sustainable Streetssustainable mobility and re-envisioning the urban environment. In early November, we published World Class Streets, which further details our World Class Streets, which further details our World Class Streetsstrategy for accomplishing these goals.
As we move forward, it is critical that we benchmark how people move around New York City and chart the results of our mobility and sustainability programs. Central to this effort is the Sustainable Streets Index. I am pleased to present this report to the New York City Council and all New Yorkers in accordance with Local Law 23 (Council bill Intro 199) which was signed into law by Mayor Bloomberg in June 2008.
Local Law 23 and the Sustainable Streets Index are the product of a collaboration among the City Council, transportation advocates and the Bloomberg Administration to strengthen our understanding of how our streets are used and the implications for transportation policy and street operations. This report assesses trends in the context of the overall transportation system, which includes driving, walking, biking, subway, bus, commuter rail and ferry systems.
This report is a living document that will be published annually. It will be expanded next year to include a detailed look at how recent changes in street design and operations affect different groups of users. The Sustainable Street Index will thus become the primary mechanism by which the Department reports on our continuing efforts to improve both the performance and use of sustainable forms of transportation.
Sincerely,
Janette Sadik-KhanCommissioner
From 2003 to 2007, rising levels of mass transit ridership and bicycling commuting accompanied New York City’s population and employment growth. Vehicle traffic levels, however, were essentially unchanged. These years mark the first time since World War II that the City experienced a period of entirely transit-centered growth, where non-auto modes absorbed all growth in travel in New York City. These trends bode well for the long range transportation and sustainability goals of encouraging mass transit, walking, cycling and ferries established in PlaNYC, the City’s sustainability plan for 2030, and Sustainable Streets, the Department of Transportation’s strategic plan.
Today’s headlines focus on the need to fund the city’s transit system. Funding decisions made in coming months will determine the mixture of transit fare increases, service cuts, higher taxes and new tolls that are used to address the transit system’s fiscal difficulties. This report makes clear that these decisions are not simply budget choices, but have the potential to profoundly impact the city’s mobility systems, its economic health and its environment and quality of life.
This report looks broadly at trends in how travelers use the city’s streets and transportation systems since 1990. The report focuses on the period of economic expansion from 2003 to 2007. It also compares trends during this recent period with trends during the economic expansion of the 1990s. These comparisons are essential to understanding how New Yorkers are changing the ways they travel in the face of the population and employment growth of recent years and changes in transportation systems and operations. The analysis thus illuminates how well the city is positioned for sustainable growth once the current downturn in the economic cycle plays out.
Key findings are:
– Citywide traffic volumes were generally flat from 2003 to 2007, in contrast to the 11% increase in traffic in the 1990s. Particularly notable is that areas outside the Manhattan Central Business District (CBD) that showed sustained growth in traffic as recently as 2002, such as on the Westchester/Bronx and Staten Island/New Jersey borders, have shown little or no growth in traffic since 2002.
– Citywide transit ridership increased 9% from 2003 to 2007. Transit ridership growth was particularly strong in 2006 and 2007, reflecting the accelerating pace of job growth in those years.
– Transit ridership entering the Manhattan CBD increased 12% from 2003 to 2007.
Executive Summary
Letter from the Commissioner

New York City Department of Transportation4 Sustainable Streets Index 2008 5
– Traffic entering the CBD from Brooklyn, Queens and New Jersey wasessentially unchanged from 2003 to 2007. Traffic entering the CBDacross 60th Street declined by 8%, suggesting an auto-to-transit modeshift in this travel market.
– Bikes are the fastest-growing mode of travel into the Manhattan CBD,with a 70% increase since 2002. The New York City Departmentof Transportation’s continued expansion of bike facilities, includingseparated bike lanes on some corridors, has helped spur this growth.
– Ferry ridership was about the same in 2007 as in 2004. Current ferryridership is 19% above the levels of the late 1990s, although not as highas the peak ferry ridership reached while PATH service was disrupteddue to the 9/11 attacks.
Overall, these findings show that from 2003 to 2007, New York City entered into a fully transit-centered phase of population and economic growth. Transit services absorbed all of the growth in travel, while traffic volumes were flat or, in limited instances, declining. The trends in this recent period contrast with the 1990s, when traffic volumes increased (albeit at a slower rate than transit ridership), and with earlier decades when traffic increased and transit ridership either grew more slowly or declined.
The 2003 to 2007 trends show historic progress toward the city’s sustainability goals. They also raise equally important challenges and opportunities for maintaining and extending this progress. The most critical challenge is to expand transit capacity to absorb ridership increases and relieve overcrowding. Findings in this report underscore the importance of providing sufficient funding to meet transit capital and operating needs, and of investing in bus service expansions and improvements in areas beyond the reach of the subway system and where subway ridership exceeds system capacity.
70
80
90
100
110
120
130
140
150
1990 1991 20071992 1993 1994 1995 1996 1997 1998 1999 2000 2001 2002 2003 2004 2005 2006
Transit RidershipTransit RidershipTransit Ridership
Traffic VolumesTraffic VolumesTraffic Volumes
Executive SummaryExecutive SummaryExecutive SummaryExecutive Summary
Citywide Traffic Volumes and Transit RidershipCitywide Traffic Volumes and Transit RidershipTraffic indexed to 1993 / Transit indexed to 1990Traffic indexed to 1993 / Transit indexed to 1990
From 2003 to 2007, New York City entered into a fully transit-centered phase of population and economic growth
Opportunities exist to enhance alternatives to motor vehicle use through continued expansion of the bike network, addition of bus lanes, and transformation of streets into places for pedestrian use and enjoyment. These improvements can play a key role in absorbing growth in travel in the city, expanding access to jobs and improving the environment. Enhancements to public space and streetscapes can both enhance the quality of life and produce economic benefits. Surveys in New York and London found that merchants and businesses identify streetscape quality as important to attracting tenants and customers, and that high quality public space is associated with increased property values.

New York City Department of Transportation6 Sustainable Streets Index 2008 7
New York CitySubway System
WestchesterCounty
NassauCounty
NewJersey
StatenIsland
Brooklyn
Queens
Man
hatt
an
The Bronx
Regional CommuterRail System
WestchesterCounty
NassauCounty
NewJersey
StatenIsland
Brooklyn
Queens
Man
hatt
an
The Bronx
New York CityBus System
WestchesterCounty
NassauCounty
NewJersey
StatenIsland
Brooklyn
Queens
Man
hatt
an
The Bronx
Regional Transit System
1-day, 7-day, 30-day and Bonus MetroCards
introduced
Toll on major MTA crossings rises to
$3.00 cash/$2.50 tokens
Transit fare increases from $1.00 to $1.15
Toll on major MTA crossings rises to $4.50 cash/$4.00
E-ZPass
1-day, 7-day, 30-day MetroCard fares increase
Central Park HOV introduced in November
2004
Full subway service restored on the
Manhattan Bridge
Toll on major Port Authority crossings
increases to$8.00 cash (all times) $8.00 Peak E-ZPass
$6.00 Off Peak E-ZPass
Toll on major MTA crossings increases
to $5.00 cash/ $4.15 E-ZPass
Increase in 1-day (7%), 7-day (4%) and 30-day
(6%) MetroCard fares
Select Bus Service debuts on Fordham Road,
Bronx, and 34th Street, Manhattan
63rd Street Tunnel opens to Qns. Blvd. IND Service
Travel restrictions implemented post-9/11 on major roadways (SOV Ban,
No Commercial Vehicles )
Toll on major Port Authority crossings increased to
$6.00 cash (all times)$5.00 E-ZPass Peak
$4.00 E-ZPass Off PeakIncentives for off-peak
truck trips with E-ZPass
Toll on major MTA crossings rises to $3.50
cash/$3.00 E-ZPass/token
NJ Transit opens Kearny Connection, beginning
Midtown Direct service
1990 1991 1992 1993 1994 1995 1996 1997 1998 1999 2000 2001 2002 2003 2004 2005 2006 2007 2008
Transit fare increases from $1.15 to $1.25
E-ZPass introduced in New York City
Transit fare increases from $1.25 to $1.50
E-ZPass accepted at all regional crossings
Full integration of MetroCard on Subway
and Bus System & Free transfers
First MetroCard
vending machines
introduced
Opening of Secaucus Junction in December
Toll on major MTA Crossings rises to $4.00 cash/
3.50 E-ZPass
Base transit fare increases from $1.50 to $2.00
PATH service restored to Lower Manhattan in
November 2003
TimelineTimeline
Manhattan Bridge peak hour HOV
restrictions put in place

New York City Department of Transportation8 Sustainable Streets Index 2008 9
IntroductionEnhancing transportation choices and encouraging the use of sustainable forms of transportation are core goals of both PlaNYC, New York City’s long-term sustainability plan, and Sustainable Streets, the New York City Department of Transportation’s strategic plan. Achieving these goals means facilitating walking, cycling and mass transit through a set of varied and mutually supportive measures. These include making streets and squares into more people-friendly places; providing fast, reliable and comfortable bus and train service; better managing curbside parking and delivery regulations; and ensuring the safety of all users of city streets and sidewalks.
Delivering on these goals requires a comprehensive understanding of how New Yorkers currently use the city’s streets and transportation systems, and current and historic trends in mobility and travel choices. By bringing together data on motor vehicle, transit, bicycle and ferry use, this report shows how travelers are changing the ways they travel in the face of the population and employment growth of recent years and of changes in transportation systems and operations. With a focus on recent trends, this report is intended to improve public understanding and to inform the agency’s efforts to enhance the sustainability of our streets and infrastructure.
In order to put information about a variety of transportation modes in context, this report presents performance metrics in an indexed time series format. This format allows readers to trace the relative pace of change for a variety of indicators over time, and to compare trends across modes and geographies, visually and quantitatively. Wherever possible, indexed data are presented for each year from 1990 through 2007. In addition to the indexed data, the underlying data for each time series is presented in the appendix to this report.
What is theSustainableStreets Index?

New York City Department of Transportation10 Sustainable Streets Index 2008 11
The Sustainable Streets Index report will be expanded in three important ways next year, when NYCDOT will report:
– A new Citywide Traffic Index*, which will fill gaps in the public’s current understanding of traffic levels,
– Performance indicators for key corridors where NYCDOT has made significant operational changes such as bike lanes and Bus Rapid Transit improvements, and
– Vehicle speeds determined using GPS technology.
* The Citywide Traffic Index will combine existing and new traffic counts to form a year-over-year time series that more precisely captures changes in travel patterns in the City. New traffic counts conducted for the Citywide Traffic Index will illuminate patterns of travel on streets and highways not currently measured.
Future Reports Data Sources The key sources for the findings are:
– The New York Metropolitan Transportation Council’s (NYMTC) annual Hub-Bound Reports, which themselves rely on reporting by all of NYMTC’s member agencies
– NYCDOT’s annual traffic reports, including• Manhattan River Crossings Reports• Borough Screenlines (Boundary) Reports• Bridge Traffic Volumes Reports• Bicycle Screenline (Boundary) Counts
– New York City Transit (NYCT) subway and bus boarding data– US Census Bureau annual population estimates, verified in conjunction
with the New York City Department of City Planning (DCP) – New York State Department of Labor monthly statistics for employment
in the five boroughs
The appendix to this report contains all underlying data used for the indexed time series presented in the report body.

New York City Department of Transportation12 Sustainable Streets Index 2008 13
CitywideTrends
70
80
90
100
110
120
130
140
150
1990 1991 20071992 1993 1994 1995 1996 1997 1998 1999 2000 2001 2002 2003 2004 2005 2006

New York City Department of Transportation14 Sustainable Streets Index 2008 15
70
80
90
100
110
120
130
140
150
1990 ’91 ’07’92 ’93 ’94 ’95 ’96 ’97 ’98 ’99 2000 ’01 ’02 ’03 ’04 ’05 ’06
Population of New York CityIndexed to 1990
Employment in New York CityIndexed to 1990
Source: NY State Dept. of Labor
New York City Transit revenue passenger boardingsIndexed to 1990
Source: New York City Transit
Citywide Trends
70
80
90
100
110
120
130
140
150
1990 ’91 ’07’92 ’93 ’94 ’95 ’96 ’97 ’98 ’99 2000 ’01 ’02 ’03 ’04 ’05 ’06
70
80
90
100
110
120
130
140
150
1990 ’91 ’07’92 ’93 ’94 ’95 ’96 ’97 ’98 ’99 2000 ’01 ’02 ’03 ’04 ’05 ’06
70
80
90
100
110
120
130
140
150
1990 ’91 ’07’92 ’93 ’94 ’95 ’96 ’97 ’98 ’99 2000 ’01 ’02 ’03 ’04 ’05 ’06
Employment Employment– 3.75 million people now work in
New York City, an all-time high
– Employment exceeded late 1990speak for the first time in 2007
Transit Transit RidershipRidership– 9% growth since 2003
– 30% growth from 1996 to 2000,coinciding with economic boom,introduction of unlimited-rideMetroCards and elimination oftwo-fare zones
– Overall, transit ridership was 42%higher in 2007 than in 1990
Population Population– 8.3 million people now live in
New York City, an all-time high
– 13% population growth since 1990
– Steady growth since 2000, but not as rapid as mid-1990s
Citywide Citywide TrTrafficaffic– Virtually unchanged between 2003
and 2007
– 2007 traffic is roughly equal toits late 1990s peak
– 11% growth during 1990sexpansion
– Truck traffic outpaced overall trafficgrowth, rising 22% in the 1990s and 9% from 2003 to 2007 at tolled crossings for which data is available.
Total vehicle traffic entering the CBD and crossing all borough and city boundariesTotal vehicle traffic entering the CBD and crossing all borough and city boundariesIndexed to 1993 (the first year comprehensive counts were available)Indexed to 1993 (the first year comprehensive counts were available)
Source: NYCDOT; Port Authority of NY & NJ; MTA Bridges and Tunnels, NYMTC
Transit ridership increased more rapidly than population or employment for the last fifteen years. The increasing attractiveness of transit can be attributed to the MTA’s program of capital improvements since 1980, the introduction of MetroCard fare incentives, service improvements throughout the subway and commuter rail systems, the drop in subway crime, and population growth in transit-accessible neighborhoods.
Meanwhile, overall citywide vehicle traffic levels have remained about the same for a decade, except for a brief drop during the 2001–2003 recession. Current traffic volumes are at or near the all-time high levels reached during the late 1990s economic expansion.
Since 2003, transit ridership has grown while traffic volumes remained flat
Source: US Census Bureau; NYC Dept. of City Planning

New York City Department of Transportation16 Sustainable Streets Index 2008 17
Travel into the CBD
70
80
90
100
110
120
130
140
150
1990 1991 20071992 1993 1994 1995 1996 1997 1998 1999 2000 2001 2002 2003 2004 2005 2006

New York City Department of Transportation18 Sustainable Streets Index 2008 19
Travel intothe CBDOverview
Traffic Traffic– 3% decline in traffic entering the
CBD since 2003
– 1999 was peak year for CBD-boundtraffic; traffic in 2007was 6% lower than during late1990s peak
– Truck– Truck– T traffic grew 9% from 2003 to 2007 at tolled crossings for which data is available; truck volumes in2007 were 14% higher than in 1990.
Transit Transit– 12% growth in transit riders since
2003—a period during whichvehicle traffic volumes declined
– 23% growth in transit trips intothe CBD since 1990
Bicycle Bicycle– Most growth in CBD-bound cycling
has occurred since 2002, as majorcycling facilities like the HudsonRiver Greenway and ManhattanBridge cycle path, and connectingon-street bicycle routes, haveopened
– 70% more cyclists entered the CBDin 2007 than 2002
Ferry Ferry– 19% more ferry riders in 2007 than
a decade earlier; including 47%more private ferry riders
– 63% of hub-bound ferry passengersare Staten Island Ferry riders;ridership on the Staten Island Ferryis flat since 2002
– 2001-2004 ridership swings weredue to private ferries carryingpassengers displaced by downtownPATH closures; private ferries haveheld onto some of this ridershipsince 2004
Transit ridership into the Manhattan Central Business District (CBD) has grown by 12% since 2003, while traffic volumes have declined by 3% over the same time period.
The travel demand patterns since 2003 (increasing transit ridership and decreasing traffic volume) stand in contrast to those seen during the last period of economic expansion. During the mid- to late-1990s, traffic and transit both increased simultaneously with population and employment, though even then transit increased more rapidly.
Meanwhile, bikes remain the fastest-growing mode of travel into the CBD, with particularly rapid increase since 2002. Ferry demand fluctuated from 2000–2004, but even after the restoration of full PATH service in 2004, ferries carried more riders than they did during the 1990s.
Transit has accommodated all growth in travel to the CBD since 2003
Transit riders entering the CBDTransit riders entering the CBDIndexed to 1990Indexed to 1990
Source: NYMTC
70
80
90
100
110
120
130
140
150
1990 ’91 ’07’92 ’93 ’94 ’95 ’96 ’97 ’98 ’99 2000 ’01 ’02 ’03 ’04 ’05 ’06
Commuter cyclists entering the CBDCommuter cyclists entering the CBDIndexed to 1990; three year rolling averageIndexed to 1990; three year rolling average
Source: NYCDOT Commuter Cycling Indicator
80
100
120
140
160
180
200
220
240
260
280
1990 ’91 ’07’92 ’93 ’94 ’95 ’96 ’97 ’98 ’99 2000 ’01 ’02 ’03 ’04 ’05 ’06
Vehicle traffic entering the CBDVehicle traffic entering the CBDIndexed to 1990Indexed to 1990
Source: NYMTC
70
80
90
100
110
120
130
140
150
1990 ’91 ’07’92 ’93 ’94 ’95 ’96 ’97 ’98 ’99 2000 ’01 ’02 ’03 ’04 ’05 ’06
Ferry riders entering the CBD Ferry riders entering the CBD Indexed to 1990; 2001 unavailableIndexed to 1990; 2001 unavailable
2001 data not available Source: NYMTC
70
80
90
100
110
120
130
140
150
1990 ’91 ’07’92 ’93 ’94 ’95 ’96 ’97 ’98 ’99 2000 ’01 ’02 ’03 ’04 ’05 ’06

New York City Department of Transportation20 Sustainable Streets Index 2008 21
Vehicle TrafficTravel into the CBD
60 60thth StreetStreet– 8% drop in traffic crossing 60th
Street since 2003
– Drop partly reflect restrictions onthe use of the Central Park Drives,although significant declines intraffic have also occurred on theavenues between Park andColumbus.
New New JerseyJersey– Flat traffic levels since 1990
indicates that Lincoln and HollandTunnel capacity is fully saturated
– Sharp drop in 2001-02 was dueto restrictions on the use of theHolland Tunnel
Queens Queens– 2003 was first year traffic returned
to its late-1990s peak level; trendhas been flat since then
– 29% growth in the 1990s, the mostrapid growth in traffic from anysector
Brooklyn Brooklyn– Flat traffic levels since 2003
– Sharp drop in 2001-02 was due torestrictions on the use of theBrooklyn-Battery Tunnel
– 5% less traffic enters the CBD fromBrooklyn than in late 1990s,reflecting that lower Manhattanemployment never returned to itspre- 9/11 levels
The decline in overall vehicle traffic into the CBD since 2003 is confined to the 60th Street sector in Manhattan. Within this sector, declines were concentrated on the avenues located between Park and Columbus Avenues. The increase in transit ridership across 60th Street suggests a mode shift from auto to transit.
Traffic from Brooklyn, Queens, and New Jersey remained virtually unchanged between 2003 and 2007. From Brooklyn and New Jersey, whose traffic patterns were most disrupted by road closures after September 11, 2001, this flattening reflected a return to 1990s trends. From Queens, this flattening occurred after a period of significant growth in traffic in the 1990s.
Traffic crossing 60th Street has dropped while traffic from Brooklyn, Queens, and New Jersey has been flat since 2003
Above 60Above 60thth Street traffic into the CBD Street traffic into the CBDIndexed to 1990Indexed to 1990
Source: NYMTC
70
80
90
100
110
120
130
140
150
1990 ’91 ’07’92 ’93 ’94 ’95 ’96 ’97 ’98 ’99 2000 ’01 ’02 ’03 ’04 ’05 ’06
Queens traffic into the CBDQueens traffic into the CBDIndexed to 1990Indexed to 1990
Source: NYMTC
70
80
90
100
110
120
130
140
150
1990 ’91 ’07’92 ’93 ’94 ’95 ’96 ’97 ’98 ’99 2000 ’01 ’02 ’03 ’04 ’05 ’06
Brooklyn traffic into the CBDBrooklyn traffic into the CBDIndexed to 1990Indexed to 1990
Source: NYMTC
70
80
90
100
110
120
130
140
150
1990 ’91 ’07’92 ’93 ’94 ’95 ’96 ’97 ’98 ’99 2000 ’02 ’03 ’04 ’05 ’06’01
New Jersey traffic into the CBDNew Jersey traffic into the CBDIndexed to 1990Indexed to 1990
Source: NYMTC
70
80
90
100
110
120
130
140
150
1990 ’91 ’07’92 ’93 ’94 ’95 ’96 ’97 ’98 ’99 ’02 ’03 ’04 ’05 ’0620002000 ’01

New York City Department of Transportation22 Sustainable Streets Index 2008 23
Transit RidershipTravel into the CBD
60 60thth StreetStreet– 8% more transit riders cross
60th Street than in 2003
– Evidence of a mode shift to transit, as vehicle traffic declined by 8% during this period
New New JerseyJersey– 16% more transit riders from 2003
to 2007
– Vehicle volumes are flat since late1990s, meaning transit absorbed allnew trans-Hudson travel
– NJ Transit brought major serviceenhancements online in 1996(Midtown Direct) and 2003(Secaucus Transfer)
– Loss of PATH capacity in 2001-02had only a small, temporary impacton trans-Hudson ridership
Queens Queens– 13% more transit riders than in
2003
– 63rd Street tunnel opened in 2001,providing additional subway capacityfrom Queens to Manhattan
– LIRR ridership was flat from 2003to 2007; all transit growth was onsubways
Brooklyn Brooklyn– 14% more riders than in 2003
– 4-track subway operation on theManhattan Bridge resumed in 2004,for the first time since 1986
Transit ridership into the CBD experienced strong growth since 2003. This growth accelerated each year from 2003 to 2007, reflecting faster annual rates of employment growth each year during this period. While growth from all sectors is significant, ridership from New Jersey is growing the fastest. New Jersey ridership never declined during the 2001-03 recession despite major service disruptions.
The fact that vehicle volumes have been steady or declining during this period indicates that all growth in travel to the CBD during the recent economic expansion was accommodated by transit and non-motorized modes of travel.
Transit ridership increased 12% since 2003, while employment increased 6%
Above 60Above 60thth Street transit into the CBD Street transit into the CBDIndexed to 1990Indexed to 1990
Source: NYMTC
70
80
90
100
110
120
130
140
150
1990 ’91 ’07’92 ’93 ’94 ’95 ’96 ’97 ’98 ’99 2000 ’01 ’02 ’03 ’04 ’05 ’06
Queens transit into the CBDQueens transit into the CBDIndexed to 1990Indexed to 1990
Source: NYMTC
70
80
90
100
110
120
130
140
150
1990 ’91 ’07’92 ’93 ’94 ’95 ’96 ’97 ’98 ’99 2000 ’01 ’02 ’03 ’04 ’05 ’06
Brooklyn transit into the CBDBrooklyn transit into the CBDIndexed to 1990Indexed to 1990
Source: NYMTC
70
80
90
100
110
120
130
140
150
1990 ’91 ’07’92 ’93 ’94 ’95 ’96 ’97 ’98 ’99 2000 ’01 ’02 ’03 ’04 ’05 ’06
New Jersey transit into the CBDNew Jersey transit into the CBDIndexed to 1990Indexed to 1990
Source: NYMTC
70
80
90
100
110
120
130
140
150
1990 ’91 ’07’92 ’93 ’94 ’95 ’96 ’97 ’98 ’99 2000 ’01 ’02 ’03 ’04 ’05 ’06

New York City Department of Transportation24 Sustainable Streets Index 2008 25
Travel outside the CBD
70
80
90
100
110
120
130
140
150
1990 1991 20071992 1993 1994 1995 1996 1997 1998 1999 2000 2001 2002 2003 2004 2005 2006

New York City Department of Transportation26 Sustainable Streets Index 2008 27
Travel outside the CBD Overview
Outside the Manhattan CBD, the total amount of travel increased slowly since 2003.
Overall, vehicle traffic volumes have been flat since 2001, after rising throughout the 1990s. As described in the following pages, traffic volumes at each borough or city boundary grew throughout the 1990s until flattening at some point before 2003. While the duration and magnitude of growth, and the year when growth flattened was different in each area, the overall pattern appeared in some form at each boundary.
After a brief period of rapid growth in the late 1990s (a time of employment growth and the introduction of the MetroCard fare incentives), bus ridership dipped after the 2003 fare increase and has grown by 6% since then.
Vehicle Vehicle traffictrafficcrossingcrossingBoroughBorough andand CityCityboundariesboundaries
– 12% more traffic now than in 1993
– Vehicle volumes flat since 2003
– Truck traffic grew 9% from 2003 to2007 at tolled crossings for whichdata is available; truck volumes were39% higher in 2007 than in 1990at non-CBD tolled crossings.
Bus Bus RidershipRidershipoutsideoutside thethe CBDCBD
– 25% more local bus riders now thanin 1998
– 6% growth since 2003
Note: Borough-level bus ridership is not available prior to 1998. Subway ridership is not shown because data for subway trips made exclusively outside the CBD cannot be separated from data for trips beginning or ending inside the CBD. Note that a large majority of subway trips that begin outside the Manhattan CBD are CBD-bound.
Bus ridership grew by 6%, while traffic volumes have been flat since 2003
Vehicle traffic crossing borough and city boundaries excluding CBD entries Vehicle traffic crossing borough and city boundaries excluding CBD entries Indexed to 1990Indexed to 1990
Source: NYCDOT, MTA Bridges and Tunnels, Port Authority of NY and NJ
70
80
90
100
110
120
130
140
150
1990 ’91 ’07’92 ’93 ’94 ’95 ’96 ’97 ’98 ’99 2000 ’01 ’02 ’03 ’04 ’05 ’06
Local bus boardings outside Manhattan CBDLocal bus boardings outside Manhattan CBDIndexed to 1998Indexed to 1998
Source: New York City Transit, MTA Bus Company, NYCDOT
70
80
90
100
110
120
130
140
150
1990 ’91 ’07’92 ’93 ’94 ’95 ’96 ’97 ’98 ’99 2000 ’01 ’02 ’03 ’04 ’05 ’06

New York City Department of Transportation28 Sustainable Streets Index 2008 29
Vehicle Traffic Travel Outside the CBD
Westchester/ Westchester/TheThe BronxBronx
– 23% growth from 1993 to 2002
– Transit ridership from the northernsuburbs is also increasing—23%more passengers ride Metro-Northto Grand Central than in 1990
George GeorgeWashingtonWashingtonBridgeBridge
– Traffic levels grew during themid- and late-1990s, then wereessentially flat through 2006
– 7% drop in traffic from 2006to 2007
Staten Staten Island/Island/NewNew JerseyJersey
– 27% growth from 1993 to 2002
– Traffic levels have been flat since 2002
Vehicle traffic volumes are flat across all borough and city boundaries since 2003. This flattening comes after each boundary experienced sustained traffic growth at some point between the early 1990s and 2003. These periods of growth varied by duration and magnitude, depending on the boundary, but each resulted in all-time high boundary volumes that, broadly speaking, continue to flow today.
Growth rates during the 1990s varied between individual boundaries. The greatest sustained growth, approximately 20% , occurred at the Westchester-Bronx boundary (1993-2002), the Staten Island-New Jersey boundary (1993-2002), and the Queens-Brooklyn boundary (1993-2000). More modest growth (under 10%) occurred on the Nassau-Queens boundary (1996-1999) and the Bronx-Manhattan boundary (1995-2000).
Queens/ Queens/BrooklynBrooklyn
– 18% growth during the mid- tolate 1990s
– Traffic levels have been flat since2000, reflecting a balance ofgrowing traffic on limited accesshighways (BQE, Jackie RobinsonParkway, and Belt Parkway) anddeclining traffic on local streetscrossing the Queens/Brooklyn line
After growing throughout the 1990s, traffic volumes have been flat since 2003
Westchester / Bronx boundary volumesWestchester / Bronx boundary volumesIndexed to 1993 Indexed to 1993
Source: NYC Dept. of Transportation
70
80
90
100
110
120
130
140
150
1990 ’91 ’07’92 ’93 ’94 ’95 ’96 ’97 ’98 ’99 2000 ’01 ’02 ’03 ’04 ’05 ’06
Staten Island / New Jersey boundary volumes Staten Island / New Jersey boundary volumes Indexed to 1993Indexed to 1993
Source: NYC Dept. of Transportation
70
80
90
100
110
120
130
140
150
1990 ’91 ’07’92 ’93 ’94 ’95 ’96 ’97 ’98 ’99 2000 ’01 ’02 ’03 ’04 ’05 ’06
Queens / Brooklyn boundary volumes Queens / Brooklyn boundary volumes Indexed to 1993Indexed to 1993
Source: NYC Dept. of Transportation
70
80
90
100
110
120
130
140
150
1990 ’91 ’07’92 ’93 ’94 ’95 ’96 ’97 ’98 ’99 2000 ’01 ’02 ’03 ’04 ’05 ’06
George Washington Bridge volumes George Washington Bridge volumes Indexed to 1990Indexed to 1990
Source: NYC Dept. of Transportation
70
80
90
100
110
120
130
140
150
1990 ’91 ’07’92 ’93 ’94 ’95 ’96 ’97 ’98 ’99 2000 ’01 ’02 ’03 ’04 ’05 ’06

New York City Department of Transportation30 Sustainable Streets Index 2008 31
The The Bronx/Bronx/QueensQueens
– 10% growth during the mid- tolate-1990s.
– One-year drop in volumes in 2005corresponds with MTA Bridges andTunnels toll hike
Nassau/Queens Nassau/Queens– 6% growth during late 1990s,
flat since 2003
– Slowest growth of any area inthe city
– Transit demand was also flat: LIRRridership to Penn Station grew in1990s but was 7% lower in 2007than in late 1990s peak
The The Bronx/Bronx/ManhattanManhattan
– 8% growth during mid- to late-1990s
– Flat traffic levels since late 1990sreflect rising traffic on MTA tolledcrossings and declining trafficvolumes on city-owned Harlem RiverBridges
– Many Bronx-Manhattan driving tripshave a time-competitive subway orbus alternative
Verrazano VerrazanoNarrowsNarrows BridgeBridge
– Short period of rapid growth in late1990s
– Traffic spike in 2001 correspondswith restrictions on use of Hollandand Brooklyn-Battery Tunnels, whichforced some regional traffic tore-route via Staten Island
– One-year drop in volumes in 2005corresponds with MTA Bridges andTunnels toll hike
Verrazano Narrows Bridge volumesVerrazano Narrows Bridge volumesIndexed to 1993Indexed to 1993
Source: NYC Dept. of Transportation
70
80
90
100
110
120
130
140
150
1990 ’91 ’07’92 ’93 ’94 ’95 ’96 ’97 ’98 ’99 2000 ’01 ’02 ’03 ’04 ’05 ’06
Nassau / Queens boundary volumes Nassau / Queens boundary volumes Indexed to 1993Indexed to 1993
Source: NYC Dept. of Transportation
70
80
90
100
110
120
130
140
150
1990 ’91 ’07’92 ’93 ’94 ’95 ’96 ’97 ’98 ’99 2000 ’01 ’02 ’03 ’04 ’05 ’06
The Bronx / Manhattan boundary volumes The Bronx / Manhattan boundary volumes Indexed to 1990Indexed to 1990
Source: NYC Dept. of Transportation
70
80
90
100
110
120
130
140
150
1990 ’91 ’07’92 ’93 ’94 ’95 ’96 ’97 ’98 ’99 2000 ’01 ’02 ’03 ’04 ’05 ’06
Brooklyn / Queens boundary volumesBrooklyn / Queens boundary volumesIndexed to 1993Indexed to 1993
Source: NYC Dept. of Transportation
70
80
90
100
110
120
130
140
150
1990 ’91 ’07’92 ’93 ’94 ’95 ’96 ’97 ’98 ’99 2000 ’01 ’02 ’03 ’04 ’05 ’06
Vehicle Traffic Vehicle Traffic Vehicle Traffic Vehicle Traffic

New York City Department of Transportation32 Sustainable Streets Index 2008 33
Bus RidershipTravel Outside the CBD
Outside the Manhattan CBD, bus ridership growth was very strong after the introduction of free transfers and MetroCard fare incentives in the mid-1990s. In each borough, local bus ridership increased steadily through 2002, dropped for one year after the 2003 fare increase, then flattened or continued to grow more slowly. In all areas outside the CBD, local bus ridership remains well above levels seen in the mid-1990s.
Because most subway trips begin or end in the CBD, and because subway ridership data does not allow differentiation of CBD and non-CBD travel, this section uses local bus ridership (NYCT, MTA Bus, and privately operated local routes), by borough, to describe non-CBD transit travel. For “Upper Manhattan,” data is reported for bus routes that operate exclusively north of 60th Street.
Queens Queens– 33% more riders now than in 1998
– Drop in 2003 reflects fare increase
– Ridership growth since 2004coincided with MTA Bus Companytakeover of many local busroutes in Queens from franchisebus operators
Brooklyn Brooklyn– 22% more riders than in 1998
– Drop in 2003 reflects fare increase
– Ridership has declined slightly since2002 peak but remains well abovemid-1990s levels
Upper UpperManhattanManhattan
– 35% more riders since 1998;fastest increase in the City
– Ridership above 60th Streetis flat, while ridership below60th Street is declining
The The BronxBronx– 20% more riders than in 1998
– Drop in 2003 reflects fare increase
Bus ridership grew slowly in all boroughs except Queens from 2003 to 2007
The Bronx local bus ridership The Bronx local bus ridership Indexed to 1998Indexed to 1998
Source: New York City Transit
70
80
90
100
110
120
130
140
150
1990 ’91 ’07’92 ’93 ’94 ’95 ’96 ’97 ’98 ’99 2000 ’01 ’02 ’03 ’04 ’05 ’06
Queens local bus ridership Queens local bus ridership Indexed to 1998Indexed to 1998
Source: New York City Transit
70
80
90
100
110
120
130
140
150
1990 ’91 ’07’92 ’93 ’94 ’95 ’96 ’97 ’98 ’99 2000 ’01 ’02 ’03 ’04 ’05 ’06
Brooklyn local bus ridership Brooklyn local bus ridership Indexed to 1998Indexed to 1998
Source: New York City Transit
70
80
90
100
110
120
130
140
150
1990 ’91 ’07’92 ’93 ’94 ’95 ’96 ’97 ’98 ’99 2000 ’01 ’02 ’03 ’04 ’05 ’06
Upper Manhattan local bus ridership Upper Manhattan local bus ridership Indexed to 1998Indexed to 1998
Source: New York City Transit
70
80
90
100
110
120
130
140
150
1990 ’91 ’07’92 ’93 ’94 ’95 ’96 ’97 ’98 ’99 2000 ’01 ’02 ’03 ’04 ’05 ’06

New York City Department of Transportation34 Sustainable Streets Index 2008 35
Staten Staten IslandIsland– 17% more riders than in 1998
– Drop in 2003 reflects fare increase
– In 2007, ridership regained 2002peak levels
Appendix
70
80
90
100
110
120
130
140
150
1990 1991 20071992 1993 1994 1995 1996 1997 1998 1999 2000 2001 2002 2003 2004 2005 2006
Staten Island local bus ridership Staten Island local bus ridership Indexed to 1998Indexed to 1998
Source: New York City Transit
70
80
90
100
110
120
130
140
150
1990 ’91 ’07’92 ’93 ’94 ’95 ’96 ’97 ’98 ’99 2000 ’01 ’02 ’03 ’04 ’05 ’06
Bus RidershipBus Ridership
New York City Department of Transportation36 Sustainable Streets Index 2008 37
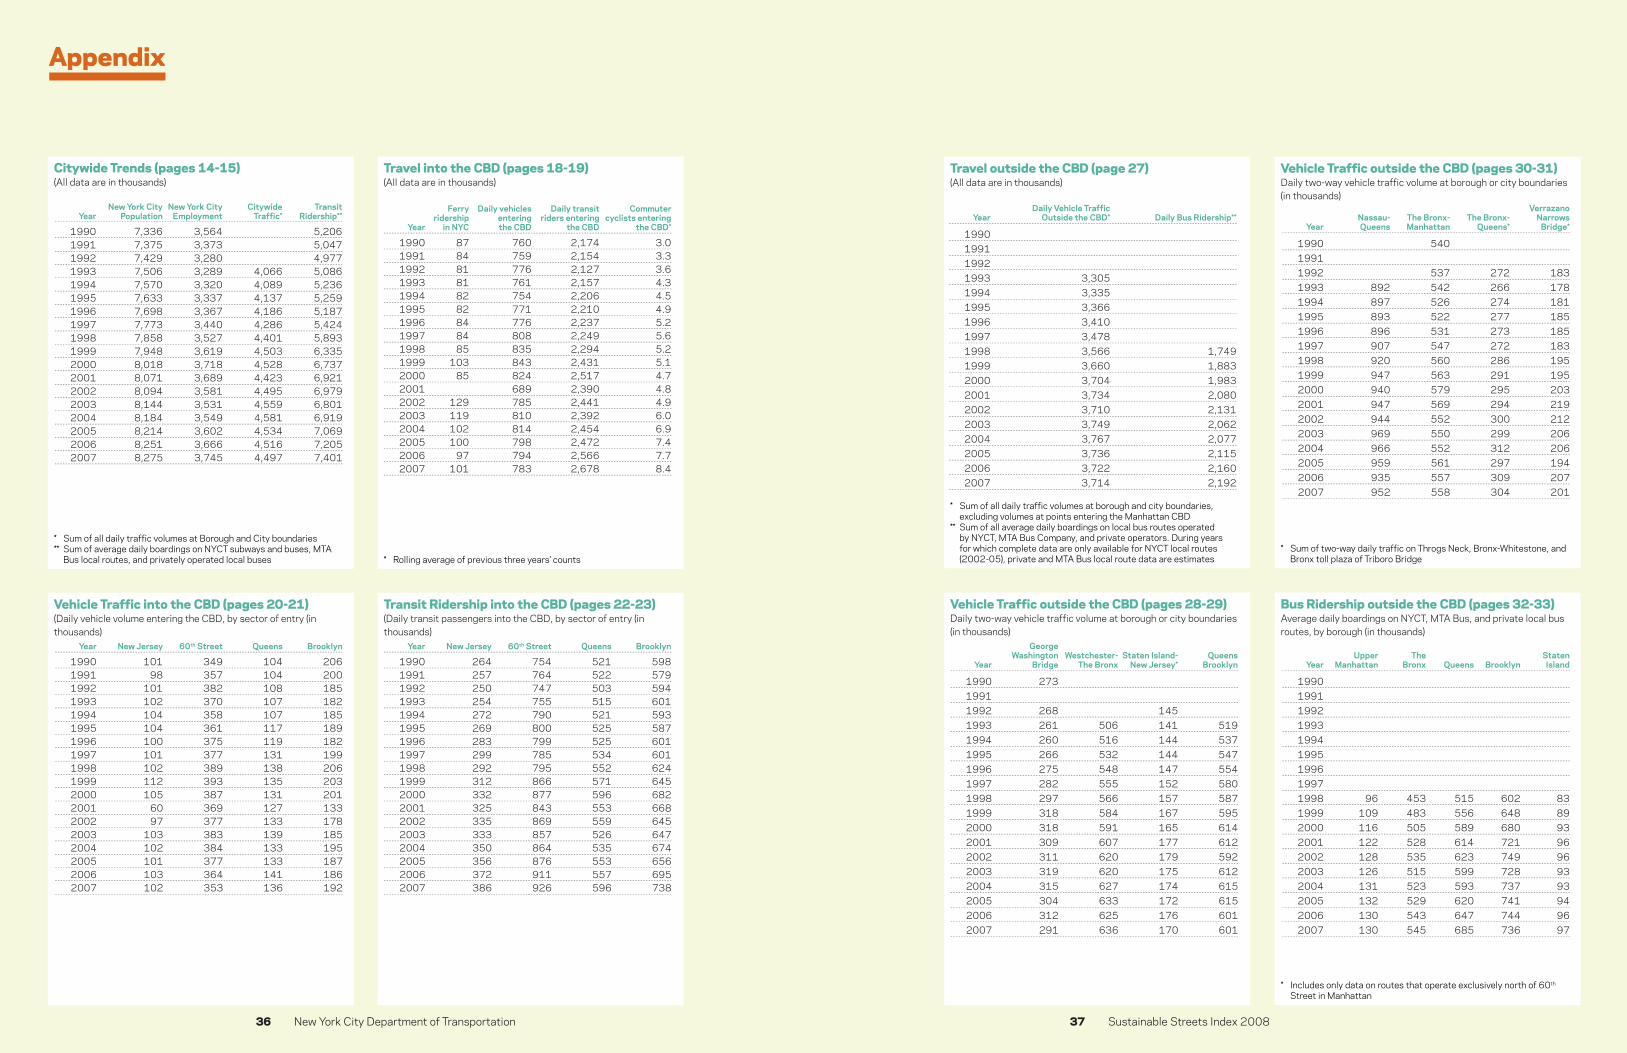
Citywide Trends (pages 14-15)(All data are in thousands)
Travel into the CBD (pages 18-19)(All data are in thousands)
Vehicle Traffic into the CBD (pages 20-21)(Daily vehicle volume entering the CBD, by sector of entry (in thousands)
Transit Ridership into the CBD (pages 22-23)(Daily transit passengers into the CBD, by sector of entry (in thousands)
* Sum of all daily traffic volumes at Borough and City boundaries** Sum of average daily boardings on NYCT subways and buses, MTA
Bus local routes, and privately operated local buses * Rolling average of previous three years’ counts
* Sum of all daily traffic volumes at borough and city boundaries, excluding volumes at points entering the Manhattan CBD
** Sum of all average daily boardings on local bus routes operated by NYCT, MTA Bus Company, and private operators. During years for which complete data are only available for NYCT local routes (2002-05), private and MTA Bus local route data are estimates
Travel outside the CBD (page 27)(All data are in thousands)
Vehicle Traffic outside the CBD (pages 28-29)Daily two-way vehicle traffic volume at borough or city boundaries (in thousands)
Vehicle Traffic outside the CBD (pages 30-31)Daily two-way vehicle traffic volume at borough or city boundaries (in thousands)
Bus Ridership outside the CBD (pages 32-33)Average daily boardings on NYCT, MTA Bus, and private local bus routes, by borough (in thousands)
* Sum of two-way daily traffic on Throgs Neck, Bronx-Whitestone, and Bronx toll plaza of Triboro Bridge
* Includes only data on routes that operate exclusively north of 60th Street in Manhattan
New York City New York City Citywide Transit Year Population Employment Traffic* Ridership**
1990 7,336 3,564 5,206 1991 7,375 3,373 5,047 1992 7,429 3,280 4,977 1993 7,506 3,289 4,066 5,086 1994 7,570 3,320 4,089 5,236 1995 7,633 3,337 4,137 5,259 1996 7,698 3,367 4,186 5,187 1997 7,773 3,440 4,286 5,424 1998 7,858 3,527 4,401 5,893 1999 7,948 3,619 4,503 6,335 2000 8,018 3,718 4,528 6,737 2001 8,071 3,689 4,423 6,921 2002 8,094 3,581 4,495 6,979 2003 8,144 3,531 4,559 6,801 2004 8,184 3,549 4,581 6,919 2005 8,214 3,602 4,534 7,069 2006 8,251 3,666 4,516 7,205 2007 8,275 3,745 4,497 7,401
Ferry Daily vehicles Daily transit Commuter ridership entering riders entering cyclists entering Year in NYC the CBD the CBD the CBD*
1990 87 760 2,174 3.0 1991 84 759 2,154 3.3 1992 81 776 2,127 3.6 1993 81 761 2,157 4.3 1994 82 754 2,206 4.5 1995 82 771 2,210 4.9 1996 84 776 2,237 5.2 1997 84 808 2,249 5.6 1998 85 835 2,294 5.2 1999 103 843 2,431 5.1 2000 85 824 2,517 4.7 2001 689 2,390 4.8 2002 129 785 2,441 4.9 2003 119 810 2,392 6.0 2004 102 814 2,454 6.9 2005 100 798 2,472 7.4 2006 97 794 2,566 7.7 2007 101 783 2,678 8.4
Year New Jersey 60th Street Queens Brooklyn
1990 101 349 104 206 1991 98 357 104 200 1992 101 382 108 185 1993 102 370 107 182 1994 104 358 107 185 1995 104 361 117 189 1996 100 375 119 182 1997 101 377 131 199 1998 102 389 138 206 1999 112 393 135 203 2000 105 387 131 201 2001 60 369 127 133 2002 97 377 133 178 2003 103 383 139 185 2004 102 384 133 195 2005 101 377 133 187 2006 103 364 141 186 2007 102 353 136 192
Year New Jersey 60th Street Queens Brooklyn
1990 264 754 521 598 1991 257 764 522 579 1992 250 747 503 594 1993 254 755 515 601 1994 272 790 521 593 1995 269 800 525 587 1996 283 799 525 601 1997 299 785 534 601 1998 292 795 552 624 1999 312 866 571 645 2000 332 877 596 682 2001 325 843 553 668 2002 335 869 559 645 2003 333 857 526 647 2004 350 864 535 674 2005 356 876 553 656 2006 372 911 557 695 2007 386 926 596 738
George Washington Westchester- Staten Island- Queens Year Bridge The Bronx New Jersey* Brooklyn
1990 273
1991
1992 268 145
1993 261 506 141 519
1994 260 516 144 537
1995 266 532 144 547
1996 275 548 147 554
1997 282 555 152 580
1998 297 566 157 587
1999 318 584 167 595
2000 318 591 165 614
2001 309 607 177 612
2002 311 620 179 592
2003 319 620 175 612
2004 315 627 174 615
2005 304 633 172 615
2006 312 625 176 601
2007 291 636 170 601
Upper The Staten Year Manhattan Bronx Queens Brooklyn Island
1990
1991
1992
1993
1994
1995
1996
1997
1998 96 453 515 602 83
1999 109 483 556 648 89
2000 116 505 589 680 93
2001 122 528 614 721 96
2002 128 535 623 749 96
2003 126 515 599 728 93
2004 131 523 593 737 93
2005 132 529 620 741 94
2006 130 543 647 744 96
2007 130 545 685 736 97
Daily Vehicle Traffic Year Outside the CBD* Daily Bus Ridership**
1990
1991
1992
1993 3,305
1994 3,335
1995 3,366
1996 3,410
1997 3,478
1998 3,566 1,749
1999 3,660 1,883
2000 3,704 1,983
2001 3,734 2,080
2002 3,710 2,131
2003 3,749 2,062
2004 3,767 2,077
2005 3,736 2,115
2006 3,722 2,160
2007 3,714 2,192
Verrazano Nassau- The Bronx- The Bronx- Narrows Year Queens Manhattan Queens* Bridge*
1990 540
1991
1992 537 272 183
1993 892 542 266 178
1994 897 526 274 181
1995 893 522 277 185
1996 896 531 273 185
1997 907 547 272 183
1998 920 560 286 195
1999 947 563 291 195
2000 940 579 295 203
2001 947 569 294 219
2002 944 552 300 212
2003 969 550 299 206
2004 966 552 312 206
2005 959 561 297 194
2006 935 557 309 207
2007 952 558 304 201
Appendix

New York City Department of Transportation38 Sustainable Streets Index 2008 39
This report was developed by the Department of Transportation’s Division of Planning and Sustainability. Under the direction of Deputy Commissioner Bruce Schaller, the report team consisted of Tom Maguire, Rui Mao, Michael Marsico, Catherine Matera and David Stein.
In addition, Deputy Commissioner Michael Primeggia and the staff of the Division of Traffic Operations assisted in the collection and analysis of many of the data sets contained within this document.
Finally, regional transportation agencies compiled and provided NYCDOT with many of the data sets used in this report. They include New York City Transit, MTA Bridges and Tunnels, the Port Authority of New York and New Jersey, the New York State Department of Transportation and the New York Metropolitan Transportation Council.
New York CityDepartment of Transportation Janette Sadik-Khan Commissioner
Bruce Schaller Deputy Commissioner,
Planning and Sustainability
Photography Credits:
Images courtesy of Flickr/Creative Commons. Copyright of photos are as noted.
front and back cover: Kevin Fitz; front endaper: Peter Dutton; table of contents: TimmyGunz;
page 8: phogel; pages 12-13: Travis Church; pages 16-17: Daniele Sartori; pages 24-25:
Matthew Jording; page 40: TimmyGunz; back endaper: Jeroen Iskoel

New York City Department of Transportation40 Sustainable Streets Index 2008 41
120 lane miles of bicycle lanes have been installed since July 2007. Source: NYCDOT
6.8milesAverage length of trip by NYC Resident Source: 2001 National HouseholdTravel Survey
49%of subway and bus trips are taken with an Unlimited-Ride MetroCard.
Source: NYC Transit
61% reduction in traffic fatalities in New York City since 1990.
Source: NYCDOT
14% of New York area residents’ annual spending goes toward transportation, compared with 18% for all Americans. Source: 2006-07 ConsumerExpenditure Survey
44% of NYC households own a car, compared to 90% nationwide. Source: 2000 U.S. Census

70
80
90
100
110
120
130
140
150
1990 1991 20071992 1993 1994 1995 1996 1997 1998 1999 2000 2001 2002 2003 2004 2005 2006www.nyc.gov/dot