Embed Size (px)
Citation preview

TheMillenniumDevelopment Goals
E C O N O M I C C O M M I S S I O N F O R E U R O P E
The Way Ahead
New York and Geneva, 2006
A PAN-EUROPEAN PERSPECTIVE

Note
The designations employed and the presentation of the material in this publication do not imply the expression of any opinion whatsoever on the part of the Secretariat of the United Nations concerning the legal status of any country, territory, city or area, or of its authorities, or concerning the delimitation of its frontiers or boundaries.
ii

Preface
The Millennium Development Goals (MDGs) translate into tangible targets the most vital and pressing development goals agreed upon by the international community at UN global Conferences and Summits, in particular at the Millennium Summit held in December 2000. Effectively reached, they would generate considerable economic, social and environmental progress for the benefit of the most disadvantaged part of the population worldwide.
In most UNECE countries, the MDGs appear to have been reached in terms of the minimum standards. Yet they are relevant for the UNECE region in two major respects. Firstly, in many of the less advanced economies in the region, most MDGs still require significant efforts to be fully achieved, especially if the related targets are adjusted in order to take into account the characteristics of the region. Secondly, there are some MDG areas where all UNECE countries – and this includes the most advanced countries of Western Europe and North America, and the emerging market economies – need to make substantial progress. This is particularly the case for poverty reduction (MDG 1) and gender equality (MDG 3). The MDGs thus constitute a significant policy challenge for the UNECE economies, and as such they demand careful monitoring and policy analysis. Monitoring and policy analysis are indeed the thrust of this report.
The report provides firstly an overview of the major trends of the MDG indicators in the UNECE region, highlighting the progress achieved so far and the gaps that still need to be filled. It then develops an integrated policy framework for achieving the MDGs, based on the view that these are interrelated and cannot be reached on a sustainable basis through targeted policies and measures only. This framework therefore defines major policy areas and presents for each of them a range of policy options, all aimed at making a substantial contribution to the achievement of the MDGs. Finally the report makes the case that regional cooperation and the provision of regional public goods matter for the achievement of the MDGs, and outlines the UNECE support to this regional dimension through its activities of a transboundary nature. It also presents those UNECE programmes and activities which support decision-making and institution-building at the national level in MDG related areas.
This publication complements the work on MDGs undertaken by other organizations and institutions in the UNECE region: it focuses on the policy options to be considered for an integrated and comprehensive approach to the achievement of the MDGs and on the regional dimension to be taken into consideration to support these national policies. The report is very much in line with the reform of the UNECE recently adopted by its member States which identifies the MDGs as one of the cross-cutting issues for UNECE work. In addition it responds to the need, also highlighted by the reform, to refocus UNECE’s analytical work on more policy-oriented analysis.
In this context, I trust that the report will contribute to promoting policy debate within the region on the most effective ways for UNECE countries to move ahead towards the full realization of the Millennium Development Goals.
Marek Belka Executive Secretary Economic Commission for Europe
iii

Acknowledgements
This report was prepared under the responsibility of Paolo Garonna, then Officer-in-Charge of the UNECE. Patrice Robineau, Acting Deputy Executive Secretary, guided and coordinated the team that produced the report. The members of the team were: Enrico Bisogno, Fabrizio Carmignani, Jaromir Cekota, Abdur Chowdhury, Vitalia Gaucaite, Angela Me, Jose Palacin, Ewa Ruminska-Zimny and Robert Shelburne. The contributions from other members of the UNECE secretariat are also noted with appreciation.
The Statistical Division prepared the statistical data, tables and charts. Parts of the manuscript were edited by Lucy Muir-Smith. Alison Mangin was responsible for copy-editing and electronic formatting of the report.
iv

Note ii Preface iii Acknowledgements iv
Chapter 1 THE MDG TRENDS IN THE UNECE REGION 1
MDG 1: Eradicate extreme poverty and hunger 2 MDG 2: Achieve universal primary education 5 MDG 3: Promote gender equality and empower women 7 MDG 4: Reduce child mortality 9 MDG 5: Improve maternal health 10 MDG 6: Combat HIV/AIDS, malaria, and other diseases 11 MDG 7: Ensure environmental sustainability 12 MDG 8: Develop a global partnership for development 13
Chapter 2 POLICY FRAMEWORK FOR ACHIEVING THE MDGS IN THE UNECE REGION 15
Cluster I Enabling environment for a pattern of sustained and pro-poor growth 16 Cluster II The equity issue 23 Cluster III Fostering employment and promoting human capital 28 Cluster IV The enabling external environment 34 Cluster V Environmental sustainability 39
Chapter 3 REGIONAL POLICIES AND PROVISION OF REGIONAL PUBLIC GOODS 43
Management of transboundary waters and water pollution control: a contribution to MDG 4 and 7 43
Development of transport infrastructure: a contribution to MDG 1 and MDG 8, target 14 44
Development of trade facilitation infrastructure: a contribution to MDG 8, target 12 46
Regional policy framework for the sustainable management of forests: a contribution to MDG 7, target 9 48
Chapter 4 UNECE SUPPORT TO NATIONAL POLICIES 49
Environmental Performance Reviews: a contribution to MDG 7, target 9 49
Support to the promotion of sustainable energy: a contribution to MDG 7, target 9 50
National capacity building for trade development: a contribution to MDG 8, targets 12 and 14 52
Support to national policies in the forest sector: a contribution to MDG 1, target 1, and MDG 7, target 9 53
Country support for sustainable human settlements and social housing: a contribution to MDG 1, target 1, and MDG 7, targets 10 and 11 53
Mainstreaming gender into economic policies: a contribution to MDG 3 and MDG 1, target 1 55
The role of UNECE in strengthening statistical capacity for monitoring the MDGs in SEE and EECCA countries 56
v
Contents

Annex I Millennium Development Goals and targets 58
Annex II Statistical appendix 59
Table
1.A Share of population living below national poverty line, measures of extreme poverty 60
1.B Share of population living below national poverty line, measures of relative poverty 62
2 Unemployment rate by sex, 1995, 2000, 2004 63
3 Net enrolment ratio in primary education by sex 1998/1999, 2000/2001 and 2002/2003 65
4 Net enrolment ratio in secondary education by sex, 1998/1999, 20002001 and 2002/2003 66
5 Gross enrolment ratio in tertiary education by sex, 1998/1999 and 2001/2002 67
6 Gender pay gap, 1995, 2000, 2003 68
7 Women in managerial positions, as percentage of total number of persons in manageria positions, 1995, 2000, 2004 69
8 Female employers as percentage of total number of employers, 1995, 2000, 2004 70
9 Percentage of women in national parliaments, 1990, 2000, 2005 71
10 Life expectancy at birth by sex 1995, 2000, 2003 72
11 Infant mortality rate by sex 1995, 2000, 2002 73
12 Maternal deaths per 100,000 live births, 1990, 1995, 2000, 2003 74
13 Abortions per 1,000 live births, 1990, 1995, 2000, 2003 75
14 Tuberculosis incidence per 100,000 inhabitants, 1995, 2000, 2003 76
15 DOTS treatment success for tuberculosis, 1995, 2000, 2003 77
16 Percentage of persons who have access to improved drinking water, by urban/rural area, 1990 and 2002 78
17 Percentage of persons who have access to improved sanitation, by urban/rural area, 1990 and 2002 79
18 Percentage of households with a personal computer 1998, 2000, 2003 80
19 Percentage of individuals regularly using the Internet, by sex, 2003 and 2004 81
20 Net official aid received by countries, 1997 and 2003 82
21 Membership of World Trade Organization 83
vi


E C O N O M I C C O M M I S S I O N F O R E U R O P E

CHAPTER 1
The MDG Trendsin the UNECE Region
The Millennium Declaration and the Millennium Development Goals (MDGs)1 defines economic, social and environmental challenges that, within the UNECE region, are particularly relevant to countries of Eastern Europe, Caucasus and Central Asia (EECCA) and South East Europe (SEE)2. However the quantitative targets fixed at the global level for each MDG do not always fit to the concrete situation faced by these countries. For example, the global target related to poverty that aims to halve the proportion of people living on less than a dollar a day is hardly applicable in the EECCA and SEE countries where the conditions needed for survival are above one dollar a day (even if calculated on the Purchasing Power Parity - PPP) and should take into consideration issues related to, for example, heating. Poverty monitoring indicators in the region would be more relevant if based on a national poverty line where national circumstances for survival are more properly taken in consideration. Along this line, the World Bank feels that the extreme poverty standard of $1 a day should be increased to $2 a day because of the cold climate which requires higher spending on heating, clothing, and food. Similarly, the goal of halting HIV/AIDS, which was originally developed for Africa, may need modification since the epidemic is in a different stage in Eastern Europe and Central Asia.
The MDGs and their related targets need also to be adapted in qualitative terms in order to make them more relevant to national needs. Some countries in the region have done so for a number of MDGs. For example, in Bosnia and Herzegovina, MDG 1 was reformulated as: “to reduce general poverty to the EU level average in 2015” and in The former Yugoslav Republic of Macedonia as “Reduction of poverty and social exclusion”. In Armenia, an additional goal was introduced on ensuring food security; while in Ukraine MDG 6 on HIV/AIDS was reformulated in “Reducing and slowing down the spread of HIV/AIDS and tuberculosis”.
In surveying trends, this report will take into account the relevance that different MDGs have for different countries in the UNECE region. More specifically, Western Europe and North America are among the most economically and socially advanced regions in the world. It is therefore clear that some of the MDGs could have very limited bearing for such countries. However others, such as those pertaining to poverty and gender equality, do. Thus, for MDG 1 (poverty reduction), MDG 3 (gender equality) and MDG 8 (target 18 – access to information technology) the analysis will cover the whole of the UNECE membership. For the other MDGs the focus will be on the countries with transition economies only.
1 For a list of Millennium Development Goals and associated targets, see Annex 1. 2 These abbreviations will be used throughout the text.
1THE MDG TRENDS IN THE UNECE REGION

2
MDG 1: Eradicate extreme poverty and hunger
Target 1: Income-Poverty
Table 1 reports poverty figures for most of the UNECE Member States (the countries not included in the table are those for which no information was available). For SEE and EECCA countries national definitions of extreme poverty are reported (Table 1.A). For EU members the EUROSTAT definition of relative poverty is considered instead (Table 1.B).
In the EU-15 countries, the figures show a trend of moderate increase in relative poverty. While this increase is indeed small, it might nevertheless reflect a structural trend towards a more unequal distribution of income across individuals. A more pronounced increase in relative poverty was observed in the new EU Member States at the beginning of the 1990s. This was due to the stagnation of economic activity during the recession of the first years of transformation. However, the progress made on structural and economic reforms achieved by these countries and the ensuing recovery of economic growth have resulted in fairly stable relative poverty towards the second half of the 1990s and the early 2000s.
In the EECCA countries and SEE countries the collapse of the centralized economy led to a sharp contraction in economic activity, with a consequent increase in levels of poverty. However, poverty data prior to 1995 are scarce and an analysis can only be done starting after the mid 1990s. In the majority of EECCA and SEE countries for which data are available, an increase in the proportion of people living under national poverty lines was observed from the mid 1990s to the beginning of 2000 when poverty levels started to decline throughout this part of the UNECE region. The major reason is the economic collapse in the 1990s but internal wars and natural disasters have also played a role with an increasing number of areas that are affected by droughts. The Aral Sea disaster3 is probably the most visible example of a natural disaster in the region where the consequences in terms of poverty and people’s living conditions are devastating: There was a total collapse in the fishing industry, a decrease in the productivity of agricultural land, an increase in serious diseases, respiratory system diseases and birth defects, and high infant mortality rates. For example, in 2001, in the regions of Kazakhstan surrounding the Aral Sea 46 per cent of people were living in poverty - almost double the national average of 28.4 per cent4.
Recent data covering the early 2000s suggest that the trend to increasing poverty is stabilising, and may be reversing, with poverty levels declining in most (albeit not all) EECCA and SEE economies. To a considerable extent, this general improvement was facilitated by the fast pace of economic growth in the sub-region. As shown in Graph 1 below, Georgia is a notable exception with a significant increase in poverty levels over the recent years (see also Table 1.A).
3 In the last decade, the Aral Sea has been desiccating with the result that in a few years what was the fourth-largest lake in the world will become the world’s eighth-largest lake. Along the former shoreline, salt has accumulated due to evaporation. The salt is picked up by strong winds prevalent in this area, transported by aeolic processes and deposited on irrigated fields in the south. The north of the Amu-Dar’ja delta used to be an important ecosystem with a large variety of flora and fauna but the increasing salinity and water shortage have led to a severe degradation of these areas. In addition the productivityof the agricultural fields has dropped significantly due to secondary salination as a result of capillary uprising of soil water.
4 MDG in Kazakhstan, United Nations 2002.

3THE MDG TRENDS IN THE UNECE REGION
Chart 1Trends in the percentage of people living under poverty in selected EECCA and SEE countries
Source: See Table 1.Note: Data are not comparable across countries but within countries they are comparable overtime.
Due to the lack of data on the early 1990s, it is difficult to assess if the high levels of poverty have come back down to the 1990s’ levels from where it originally started to grow. Looking at trends from the mid 1990s to the most recent years, some countries seem to have reached, and in some cases lowered, the 1990s’ poverty level (Belarus, Republic of Moldova, Russian Federation, Kazakhstan and Kyrgyzstan), while others are still experiencing higher prevalence rates. Countries where there is still a consistent proportion of people living in extreme poverty are Tajikistan (33% in 1999), Republic of Moldova (33% in 2002), Armenia (24% in 2000), and Albania (25.4% in 2002).
In the longer term, the likelihood that these countries will meet MDG 1 will depend crucially on their ability to strengthen the pro-poor content of economic growth. In fact, due to an initially unequal distribution of assets (and hence opportunities), growth in average per-capita income does not necessarily lead to comparable growth in the income of the poor. That is, without well targeted pro-poor policies, fast economic growth does not automatically reduce relative (or even absolute) poverty. Various areas of public policies to combat poverty in EECCA and SEE countries are discussed in Part II of the report.
Box 1. Measurement of income-poverty
For global monitoring of MDGs, the poverty line adopted is the standard PPP $1 a day. For South Eastern Countries (SEE) and EECCA countries, this threshold is not appropriate. The cold weather requires more resources for heating, clothes and food. PPP$1 a day does not qualify as an adequate level of subsistence as it may do in other regions. The World Bank advises the use of indicators in the region based on PPP$2.15 for international comparability, but for national purposes and in MDG national reports, countries have developed their own definition of poverty (often with the technical assistance of The World Bank). Extreme poverty lines are in general established at the level of consumption sufficient to provide for the minimum level of dietary energy consumption (as approved by the government). There are also general poverty lines that represent the minimum level of consumption taking into account expenditure for both foodstuff and non-food goods and services. These thresholds seem to be more relevant since they consider not only food but also other expenditure that is crucial for surviving in cold weather. Some EECCA and SEE countries particularly in Europe measure poverty using a relative concept (as the EU countries do), setting the poverty level to a defined percentage (from 50 to 75 per cent) of the median cumulative spending per adult. Accurate data on poverty are not available before 1995-1996 when some of the countries started to conduct relevant household budget surveys. From 2000 there are few countries that can provide poverty data on an annual basis, and some of them have collected data less than twice in the last decade.
4
Target 2: Hunger
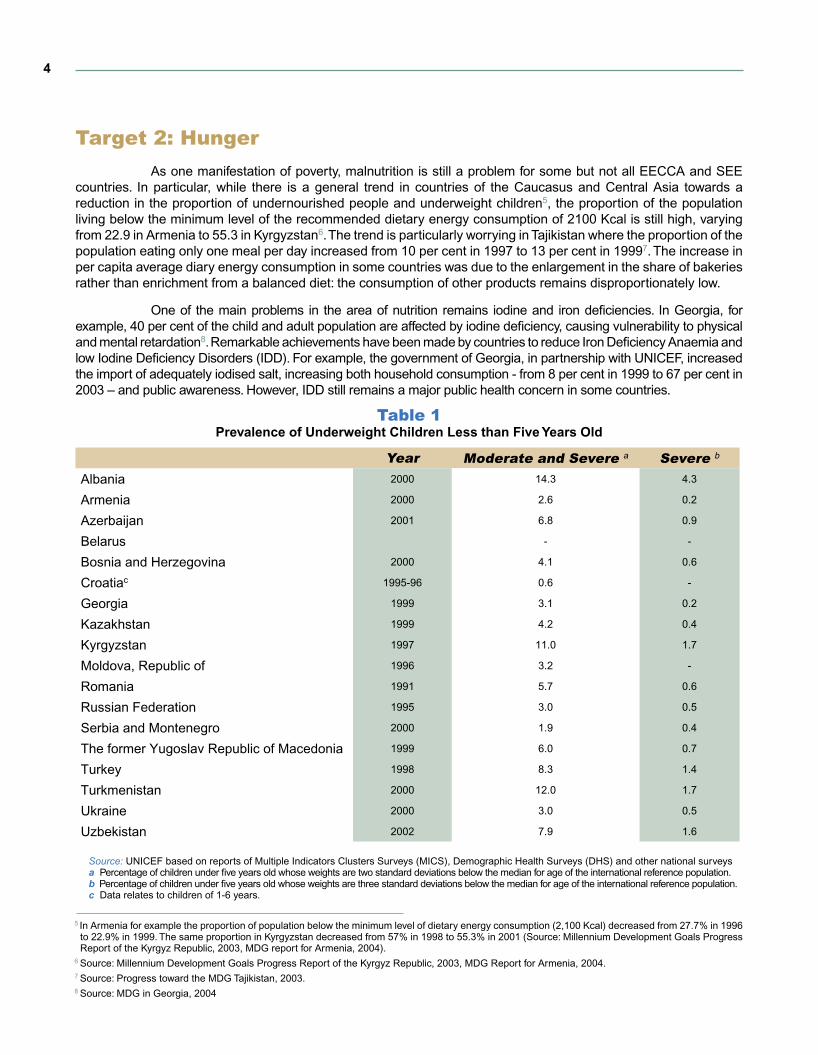
As one manifestation of poverty, malnutrition is still a problem for some but not all EECCA and SEE countries. In particular, while there is a general trend in countries of the Caucasus and Central Asia towards a reduction in the proportion of undernourished people and underweight children5, the proportion of the population living below the minimum level of the recommended dietary energy consumption of 2100 Kcal is still high, varying from 22.9 in Armenia to 55.3 in Kyrgyzstan6. The trend is particularly worrying in Tajikistan where the proportion of the population eating only one meal per day increased from 10 per cent in 1997 to 13 per cent in 19997. The increase in per capita average diary energy consumption in some countries was due to the enlargement in the share of bakeries rather than enrichment from a balanced diet: the consumption of other products remains disproportionately low.
One of the main problems in the area of nutrition remains iodine and iron deficiencies. In Georgia, for example, 40 per cent of the child and adult population are affected by iodine deficiency, causing vulnerability to physical and mental retardation8. Remarkable achievements have been made by countries to reduce Iron Deficiency Anaemia and low Iodine Deficiency Disorders (IDD). For example, the government of Georgia, in partnership with UNICEF, increased the import of adequately iodised salt, increasing both household consumption - from 8 per cent in 1999 to 67 per cent in 2003 – and public awareness. However, IDD still remains a major public health concern in some countries.
Table 1Prevalence of Underweight Children Less than Five Years Old
5 In Armenia for example the proportion of population below the minimum level of dietary energy consumption (2,100 Kcal) decreased from 27.7% in 1996 to 22.9% in 1999. The same proportion in Kyrgyzstan decreased from 57% in 1998 to 55.3% in 2001 (Source: Millennium Development Goals Progress Report of the Kyrgyz Republic, 2003, MDG report for Armenia, 2004).
6 Source: Millennium Development Goals Progress Report of the Kyrgyz Republic, 2003, MDG Report for Armenia, 2004.7 Source: Progress toward the MDG Tajikistan, 2003.8 Source: MDG in Georgia, 2004
Year Moderate and Severe a Severe b
Albania 2000 14.3 4.3
Armenia 2000 2.6 0.2
Azerbaijan 2001 6.8 0.9
Belarus - -
Bosnia and Herzegovina 2000 4.1 0.6
Croatiac 1995-96 0.6 -
Georgia 1999 3.1 0.2
Kazakhstan 1999 4.2 0.4
Kyrgyzstan 1997 11.0 1.7
Moldova, Republic of 1996 3.2 -
Romania 1991 5.7 0.6
Russian Federation 1995 3.0 0.5
Serbia and Montenegro 2000 1.9 0.4
The former Yugoslav Republic of Macedonia 1999 6.0 0.7
Turkey 1998 8.3 1.4
Turkmenistan 2000 12.0 1.7
Ukraine 2000 3.0 0.5
Uzbekistan 2002 7.9 1.6
Source: UNICEF based on reports of Multiple Indicators Clusters Surveys (MICS), Demographic Health Surveys (DHS) and other national surveysa Percentage of children under five years old whose weights are two standard deviations below the median for age of the international reference population. b Percentage of children under five years old whose weights are three standard deviations below the median for age of the international reference population. c Data relates to children of 1-6 years.

5THE MDG TRENDS IN THE UNECE REGION
MDG 2: Achieve universal primary educationGeneral indicators on enrolment in primary education and literacy show a relatively good system of
education in EECCA and SEE countries. However, the difficulties encountered during the transition period have affected the educational system. In the past, these countries were enjoying free access to a good system of primary and secondary education, but now the quality and access of education is becoming an issue. Many pupils’ access to education is being affected by the increased role of the private sector.
Net enrolment ratios in primary education in 2003 vary from 79 per cent in the Republic of Moldova and 80 per cent in Azerbaijan to 94 per cent in Armenia and Belarus. Trends over time also differ across countries. Over the period 1998/1999-2002/2003, net enrolment ratios in primary education decreased quite significantly in countries like Romania, Bulgaria, Georgia, and to a lesser extent in Kyrgyzstan, Lithuania (after peaking in 1999/2000) and Slovakia. Improvements were observed in Armenia, Ukraine, and Kazakhstan, even though for all three countries data have only been available since 1999/2000 (Table 3).
In contrast, secondary education enrolment ratios were on the rise in most countries (Table 4). In several SEE and EECCA countries this increase was relatively large (i.e. four percentage points in Russia and Bulgaria, five percentage points in Albania and Kazakhstan, seven percentage points in Romania). Notable exceptions with respect to secondary enrolment trends are Georgia and Ukraine, where the ratio apparently dropped significantly between 1999/2000 and 2002/2003. In the new EU member states, growth was on average more modest, probably because these countries already had quite high secondary enrolment at the beginning of the period of observation (1998/1999).
School attendance is also becoming a concern9. As shown in Chart 2, attendance ratios reveal an alarming situation in Albania and in Central Asia. However, national official statistics on attendance are very scarce (see Box 2).
Chart 2Comparison between attendance and enrolment ratios in primary education selected countries, 2000.
Source: UNICEF Multiple Indicator Clusters Surveys 2, National Reports for attendance ratios and UNESCO for enrolment ratios (see Table 3). Note: Attendance/Enrolment ratios are defined as the number of children of official school age who attend/are enrolled in primary school to the total population of children of official school age.
9In Kyrgyzstan for example, data from the National Statistical Committee show that 95% of 7-16 year old children receive basic secondary education, but studies conducted by UNICEF and UNESCO indicate that a significant number of children do not attend school and that this number is 7-10 times higher than the number of children officially registered as not having been enrolled (Source: Millennium Development Goals Progress Report of the Kyrgyz Republic, 2003).

6
The experience of most industrial economies suggests that there is a positive, strong link between spending on education, and education enrolment and attainment. However, there is also evidence that in UNECE emerging market economies (including new EU Member States, EECCA and SEE countries) this link is on average weaker than in Western Europe. Part II of the report discusses the relevant policy issues in this context.
Box 2. Measurement of MDG 2
Data for monitoring Goals related to education are based on enrolment ratios measured through administrative records and are regularly provided in almost all countries in the region. In countries where a recent census was not carried out, the lack of reliable data on population size has affected the quality of these indicators. National official statistics are based on registered enrolment but it is school attendance that is becoming a concern. Enrolment refers to the formal registration of boys and girls in a recognized educational institute, while attendance refers to the day-to-day participation in a formal course of study. In studying primary education, school attendance complements the information on enrolment because it measures the actual process of learning for boys and girls in their relevant age group. In Albania for example the percentage of children of primary school age attending primary school in 2000 was 52.2%, while the net enrolment ratio in primary education was 99% (see graph 2). Usually attendance ratios are lower than enrolment ratios, since a child could be enrolled in school but may not be attending. Enrolment rates that are higher than attendance rates may reveal a problem in the registration of children in educational institutions (this may happen where there is a consistent number of children who are enrolled in private schools that do not regularly report their enrolment statistics to the Ministry of Education). Thanks to administrative registers, data on enrolment are available yearly, while data on attendance (that can be collected mainly through surveys or censuses) are more scarce. In many countries, administrative sources do not provide data on the proportion of pupils starting grade 1 who reach grade 5 (one of the global MDG standard indicators) due to lack of data on repeaters by grade (data on repeaters may be available, but not by grade). Demographic Health Surveys (DHS) and Multi-indicators cluster survey (MICS)-type surveys provide data for this indicator but only in relation to the year when the survey was carried out and not on an annual basis. Data for this indicator are relevant for the assessment of the internal efficiency of the educational system. The main issues highlighted in national MDG reports with regard to measuring MDG 2 is on quality of education and drop-outs, but unfortunately a large majority of countries are unable to provide data on these issues.
MDG 3: Promote gender equality and empower women
Progress in the promotion of gender equality has been uneven. The level of women’s employment has improved in most countries in North America and in Western Europe as a result of a better legislative framework. Women’s position in the labour market instead appears to be more fragile in SEE and EECCA countries. Indeed, in a number of countries, the feminization of poverty appears to be a common phenomenon. In several economies, women were affected by disproportionate employment cuts especially up until the late 1990s and moved towards low-paid sectors, such as public services, and low-paid jobs with few or no social benefits, such as part-time jobs and jobs in the informal sector. However, since 1995 an increase in the proportion of women in managerial positions has been observed in several emerging market economies (see Table 7). Female unemployment rates are on average slightly higher than male unemployment rates (see Table 2). More significant is instead the gender wage pay gap, especially in the SEE and EECCA economies (see Chart 3 and Table 6). For example, women’s average wage is only around 60 per cent of men’s in Kazakhstan and around 40 per cent in Tajikistan.
Women were also affected by cuts in public services expenditures and are experiencing an increased burden of unpaid care work. In many countries, women have turned to self-employment to ensure an income. Trends show that the proportion of women employers has increased in most EU countries but also in the Baltics, in some countries in central Europe, and central Asia (see Table 8).

7THE MDG TRENDS IN THE UNECE REGION
Chart 3Trends in Gender Pay Gap for selected EECCA and SEE countries, 1995, 2000, 2003
Source: UNECE Gender Statistics DatabaseNote: Gender pay gap is defined as the difference between average gross earnings of male paid employees and of female paid employees as a percentage of average gross earnings of male paid employees. There are differences among countries in the earnings considered which may affect the comparability of countries.
Box 3. Measurement of MDG 3
The monitoring of gender equality in EECCA and SEE countries goes beyond the assessment of the participation of women and men in the labour market and education (as included in the global MDG standard indicators). From an assessment carried out by UNECE and the UNDP Regional Centre in Bratislava on the availability and quality of gender statistics in the region, it emerged that the major areas of concern where sex-disaggregated data and gender-sensitive information are lacking are the following:
The main problems are related to the lack of resources for undertaking data collection in certain areas (time-use, gender attitudes, informal employment), the low capacity to mainstream gender in the ongoing data collection activities (entrepreneurship, participation in election), and the underutilization of existing data.
(Source: Report on the Status of Official Statistics related to gender equality in the EECCA countries: http://www.unece.org/stats/documents/2004.10.gender.htm)
In the past decade, women’s participation in politics and decision-making has increased in line with democratic changes in many UNECE countries. All countries now recognize the Convention on the Elimination of All Forms of Discrimi-nation against Women (CEDAW) and its provisions on decision-making and power-related issues, such as the right to vote, the composition of govern-ment, civil servants, funding granted to women’s organizations, and quotas. Progress was, however, uneven and varied over election periods. It was also characterized by volatility and setbacks (see Table 9). While some countries increased the share of women in national parliaments between 1990 and 2005, e.g. The former Yugoslav Republic of Macedonia (up from 4 to 17 per cent) others experienced a decline, e.g. Albania (down from 29 to 6 per cent) and Romania (down from 34 to 11 per cent).
■ Participation in decision making■ Participation in elections■ Entrepreneurship■ Domestic violence
■ Poverty ■ Informal employment■ Time-use ■ Gender attitudes■ School attendance
8
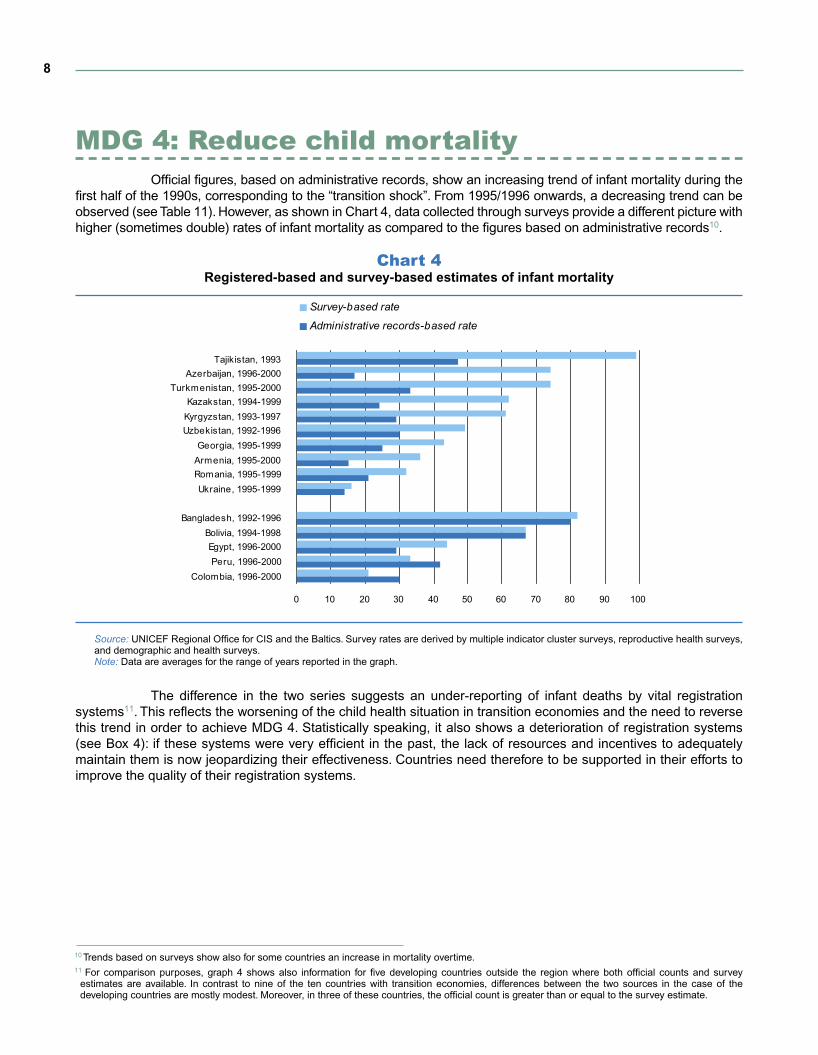
MDG 4: Reduce child mortalityOfficial figures, based on administrative records, show an increasing trend of infant mortality during the
first half of the 1990s, corresponding to the “transition shock”. From 1995/1996 onwards, a decreasing trend can be observed (see Table 11). However, as shown in Chart 4, data collected through surveys provide a different picture with higher (sometimes double) rates of infant mortality as compared to the figures based on administrative records10.
Chart 4Registered-based and survey-based estimates of infant mortality
Source: UNICEF Regional Office for CIS and the Baltics. Survey rates are derived by multiple indicator cluster surveys, reproductive health surveys, and demographic and health surveys.Note: Data are averages for the range of years reported in the graph.
The difference in the two series suggests an under-reporting of infant deaths by vital registration systems11. This reflects the worsening of the child health situation in transition economies and the need to reverse this trend in order to achieve MDG 4. Statistically speaking, it also shows a deterioration of registration systems (see Box 4): if these systems were very efficient in the past, the lack of resources and incentives to adequately maintain them is now jeopardizing their effectiveness. Countries need therefore to be supported in their efforts to improve the quality of their registration systems.
10 Trends based on surveys show also for some countries an increase in mortality overtime. 11 For comparison purposes, graph 4 shows also information for five developing countries outside the region where both official counts and survey
estimates are available. In contrast to nine of the ten countries with transition economies, differences between the two sources in the case of the developing countries are mostly modest. Moreover, in three of these countries, the official count is greater than or equal to the survey estimate.
9THE MDG TRENDS IN THE UNECE REGION
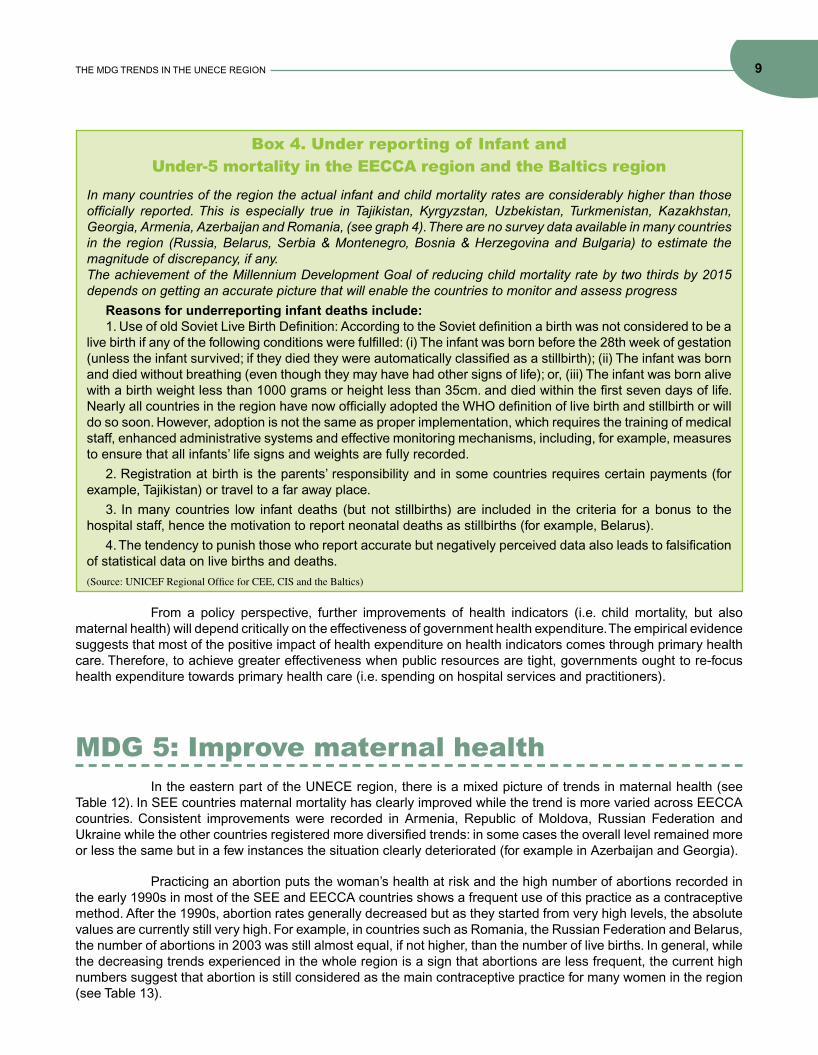
Box 4. Under reporting of Infant andUnder-5 mortality in the EECCA region and the Baltics region
In many countries of the region the actual infant and child mortality rates are considerably higher than those officially reported. This is especially true in Tajikistan, Kyrgyzstan, Uzbekistan, Turkmenistan, Kazakhstan, Georgia, Armenia, Azerbaijan and Romania, (see graph 4). There are no survey data available in many countries in the region (Russia, Belarus, Serbia & Montenegro, Bosnia & Herzegovina and Bulgaria) to estimate the magnitude of discrepancy, if any. The achievement of the Millennium Development Goal of reducing child mortality rate by two thirds by 2015 depends on getting an accurate picture that will enable the countries to monitor and assess progress
Reasons for underreporting infant deaths include:1. Use of old Soviet Live Birth Definition: According to the Soviet definition a birth was not considered to be a
live birth if any of the following conditions were fulfilled: (i) The infant was born before the 28th week of gestation (unless the infant survived; if they died they were automatically classified as a stillbirth); (ii) The infant was born and died without breathing (even though they may have had other signs of life); or, (iii) The infant was born alive with a birth weight less than 1000 grams or height less than 35cm. and died within the first seven days of life. Nearly all countries in the region have now officially adopted the WHO definition of live birth and stillbirth or will do so soon. However, adoption is not the same as proper implementation, which requires the training of medical staff, enhanced administrative systems and effective monitoring mechanisms, including, for example, measures to ensure that all infants’ life signs and weights are fully recorded.
2. Registration at birth is the parents’ responsibility and in some countries requires certain payments (for example, Tajikistan) or travel to a far away place.
3. In many countries low infant deaths (but not stillbirths) are included in the criteria for a bonus to the hospital staff, hence the motivation to report neonatal deaths as stillbirths (for example, Belarus).
4. The tendency to punish those who report accurate but negatively perceived data also leads to falsification of statistical data on live births and deaths.
(Source: UNICEF Regional Office for CEE, CIS and the Baltics)
From a policy perspective, further improvements of health indicators (i.e. child mortality, but also maternal health) will depend critically on the effectiveness of government health expenditure. The empirical evidence suggests that most of the positive impact of health expenditure on health indicators comes through primary health care. Therefore, to achieve greater effectiveness when public resources are tight, governments ought to re-focus health expenditure towards primary health care (i.e. spending on hospital services and practitioners).
MDG 5: Improve maternal healthIn the eastern part of the UNECE region, there is a mixed picture of trends in maternal health (see
Table 12). In SEE countries maternal mortality has clearly improved while the trend is more varied across EECCA countries. Consistent improvements were recorded in Armenia, Republic of Moldova, Russian Federation and Ukraine while the other countries registered more diversified trends: in some cases the overall level remained more or less the same but in a few instances the situation clearly deteriorated (for example in Azerbaijan and Georgia).
Practicing an abortion puts the woman’s health at risk and the high number of abortions recorded in the early 1990s in most of the SEE and EECCA countries shows a frequent use of this practice as a contraceptive method. After the 1990s, abortion rates generally decreased but as they started from very high levels, the absolute values are currently still very high. For example, in countries such as Romania, the Russian Federation and Belarus, the number of abortions in 2003 was still almost equal, if not higher, than the number of live births. In general, while the decreasing trends experienced in the whole region is a sign that abortions are less frequent, the current high numbers suggest that abortion is still considered as the main contraceptive practice for many women in the region (see Table 13).

10
MDG 6: Combat HIV/AIDS, malaria and other diseases
Target 7: HIV
According to UNAIDS, some of the EECCA countries are experiencing the world’s fastest growing HIV/AIDS epidemic, making it unlikely for them to achieve MDG 6. The number of officially detected cases underestimates the spread of infection in many countries12. In contrast, estimates provided by UNAIDS show a dramatic increase in the epidemic over the recent years. In the EECCA countries the number of people living with AIDS had reached an estimated 1.4 million at the end of 200413 (UNAIDS). Different ways and speeds of spreading HIV affect the region: Ukraine and the Russian Federation show the highest estimates of persons living with HIV (360,000 and 860,000 at the end of 2003, respectively) At the same time, several Central Asian and Caucasian countries are showing rapidly increasing estimates of infections: for example, from 2001 to 2003, UNAIDS data showed that in Kyrgyzstan the estimated number of people living with HIV had increased by 160 per cent14 . In most cases the epidemic is still concentrated among high-risk groups such as drug-users, but it is also clear that sexual transmission is increasing, thus showing that the epidemic is spreading progressively into the general population. However, it remains true that in most cases epidemics in the region are still in their early stages and rapid interventions could stop their spread.
Box 5. Monitoring HIV/AIDS
Target 8: Tuberculosis
One of the problems that is affecting both SEE and EECCA countries is the re-emergence of tuberculosis among the general population. While these countries have experienced a steady decline in tuberculosis over time, the number of cases, particularly in urban areas, has dramatically increased in recent years (see Table 14 and Chart 5). Direct Observed Therapy Short Course (DOTS)15 is one of the strategies recommended by WHO to treat tuberculosis because of its efficiency in eradicating it. The implementation of the DOTS strategy varies from country to country and its success varies also across countries (see Table 15).
With the exception of Ukraine and Russia, the number of HIV cases officially reported in MDG national reports and other official statistics is very low (not higher then 500). This can be explained by the fact that in many countries there are not reliable surveillance systems to detect the spread of HIV infections. Therefore, data reported by official statistics reflect only the reported cases and often are only able to describe the surface of the problem.
12In Kyrgyzstan for example there were only 402 HIV cases registered in 2003. But assessments conducted according to the UNAIDS recommendations, shows an actual number of HIV infected case of 3620 (Source: Millennium Development Goals Progress Report of the Kyrgyz Republic, 2003).
13Source: AIDS Epidemic Update 2004 (http://www.unaids.org/wad2004/report.html)14Source: UNAIDS 2004 Report on the Global AIDS Epidemic (http://www.unaids.org/bangkok2004/report.html)15There are five essential elements that are met in DOTS implementation (See: WHO, http://w3.whosea.org/en/Section10/Section18/Section356/Section421_1627.htm).

11THE MDG TRENDS IN THE UNECE REGION
Chart 5Trends in the incidence of tuberculosis per 100 in EECCA countries
Source: See Table 14.
MDG 7: Ensure environmental sustainability
Reversing the loss of environmental resources (target 9) and increasing sustainable access to safe drinking water and basic sanitation (target 10)
Until the 1990s, the environmental and health effects of water pollution, unsafe sources of water supply, inadequate sanitation and poor hygiene in EECCA countries were underestimated, mainly due to the non-availability of environmental data reports. It is now demonstrated that water pollution and overexploitation of resources for drinking water and irrigation are causing serious environmental problems. Moreover, in the 1990s, floods became one of the most costly “water-quantity” problems and large proportions of water supply networks have become seriously deteriorated, particularly in non-urban areas. There is a strong disparity between urban and rural areas with regard to the number of households connected to drinking water. For example, in Georgia, the proportion of people who had access to improved drinking water in 2002 was 90 per cent in urban areas and 61 per cent in rural areas (see Table 16).
The need to raise energy efficiency should also be addressed in the SEE and EECCA countries. Starting in the mid-1980s, energy intensity fell, although a few economies did not show declines until the latter part of the 1990s. However, energy intensity is believed to remain relatively high in several of these countries. Unfortunately, data on energy intensity of the economies in transition are “somewhat limited”, and where available raise doubts about accuracy16.
16Source: “Review of Progress on Sustainable Energy Development in the UNECE Region”, paper presented at the UNECE Committee on Sustainable Energy, 27-30 June 2005.

12
MDG 8: Develop a global partnership for development
Within the broad context of MDG 8, a target of relevance for the UNECE region concerns the access to information and communication technologies (target 18). Technological progress is the driving force behind long-term sustained economic growth, and filling the digital divide will significantly contribute to the eradication of poverty and facilitate per-capita incomes to catch up both within and across countries. Access to technologies will increase worker productivity. This will result in greater employment opportunities and a better lifetime earning potential.
Simple indicators such as the percentage of internet users and the share of households with a computer already point to the extent of the digital divide. Even in the EU-15, in spite of the fast increase observed since 1998 in the diffusion of IT, the share of households with a computer in 2003 varies from 30 per cent to 79 per cent (see Table 18). Within the group of the new EU members, the disparity is also quite large, ranging from 16 per cent in Latvia to 62 per cent in Slovenia. There is a similar picture with data on internet users, although in this case the ability to access the web from internet points (hence without the need to actually own a computer in the household) gives the impression that the dispersion across countries is less sharp (see Table 19).
Overall, there appears to be a positive correlation between economic development and access (and utilization) of new technologies, of ICT in particular. To improve access to the benefits of these technologies for a wider segment of the population, governments should make them more readily available to students at school and should include IT-related courses in re-training programmes for workers. The logistical and financial requirements involved in this strategy could be better met if partnerships were established between public and private sectors.
Another crucial dimension of Goal 8 is the establishment of an open, rule-based, non-discriminatory trading system (target 12). Membership in WTO is to be regarded as a commitment by the acceding countries to be part of this system and comply with its rules. As indicated in Table 21, the new EU Member States, the candidate countries and the Balkans (excluding Bosnia and Herzegovina, and Serbia and Montenegro) are already WTO members. Among EECCA countries, instead, membership is the exception more than the rule. This may result from the fact that the largest country in the sub-region, the Russian Federation, is still negotiating its terms of accession: smaller countries are likely to follow and enter WTO once this country has finalized its agreement. In some of the poorest economies, the lack of capacity to negotiate the terms of accession and to identify the benefits and costs of membership may also play a role. In this context technical assistance and capacity building projects are needed to facilitate accession of these poorest countries of the UNECE region.
Finally, a critical pillar of the MDG on partnership for development is financial assistance and support from advanced economies to developing countries - the least developed countries and landlocked countries in particular (targets 13 and 14). Table 20 shows that, between 1997 and 2002, official aid received by most countries with transition economies has increased, both in total and per-capita terms. Bosnia and Herzegovina, Belarus, and Kyrgyzstan represent the only exceptions. Still, there appears to be a wide dispersion across countries with respect to both the absolute level of aid and its growth rate. The key issue is thus to assess whether the current flow of aid is large enough to help countries to achieve the MDGs. The UN estimates of the “MDG financing gap” can be used to this purpose. The financing gap is defined as the difference between the investment needed to achieve the MDGs by 2015 and the resources that can be mobilized domestically (i.e. through government or household expenditure)17. It is therefore a measure of the volume of foreign aid that countries need for meeting the MDGs. In the UNECE region, the largest gap is estimated for the Central Asian Republics (excluding Kazakhstan and Turkmenistan), the Republic of Moldova and Armenia, where it is in the order of 10-20 per cent of GDP (possibly even more than 20 per cent of GDP in Tajikistan). In view of this assessment, the level of net official aid which these countries are currently receiving as shown in Table 20 suggests that this aid is significantly smaller than the estimated financing gap. It is therefore particularly important that greater aid flows are channelled towards theselower income economies in the future. An outstanding case is Kyrgyzstan where the negative trend in official aid puts at serious risk the development prospect of this country.
17 See UN Millennium Project. 2005. Investing in Development: A Practical Plan to Achieve the Millennium Development Goals. New York.


E C O N O M I C C O M M I S S I O N F O R E U R O P E

17THE MDG TRENDS IN THE UNECE REGION
CHAPTER 2
Policy Framework for Achieving the MDGs in the UNECE Region
Specific policies related to the MDGs should be part of an overall policy framework without which their achievement cannot be ensured in an effective and sustainable manner. This framework aims at articulating a wide range of policies - institutional, economic, social and environmental - which actually reflect the wide range of policy areas covered by the MDGs.
In such a perspective, a major issue at stake is the pattern of economic growth and its relationship with social and environmental concerns. Indeed, economic growth is essential for the achievement of the MDGs, both through its direct impact on income levels (MDG 1) and as a source of financing to attain other non-income goals, such as those pertaining to education (MDG 2), health (MDGs 4, 5 and 6) and environment (MDG 7). Moreover, there is a two-way linkage between these non-income goals and economic growth: economic growth provides resources that permit sustained improvements in human development, while better educated and healthier households in general, and the labour force in particular, prove to be key for sustained economic growth.
Although growth remains an important ingredient for success, growth by itself does not ensure attainment of the MDGs. Different patterns of growth can have different impacts on the elimination of poverty and the ability to mobilize public resources to achieve other MDGs.
A larger national income that is less equally divided does not necessarily result in an improvement in social welfare. An over-reliance on GDP as a measure of economic performance may produce less than optimal economic outcomes. Many efficiency-enhancing policies that are necessary for promoting growth in the region create as a secondary effect a worsening of the distribution of income. Thus policies promoting trade, privatization, financial liberalization, and labour market flexibility have a tendency to harm poorer members of society. Targeted policies that can minimize these distributional effects while still allowing efficiency enhancing effects are often difficult to design but are nevertheless important to implement in an MDG perspective.
The phasing of the implementation of policies also has important implications for a country’s human development and economic growth. Empirical analysis suggests that the improvement of human development should not be postponed until economic resource expansion makes it more affordable; in order to achieve best results, both have to be promoted simultaneously. It is essential that policies promote both growth and the development of human capital if progress is to be sustained in either.
Furthermore, the policy framework for pro-poor growth should be gender sensitive. Promotion of gender equality is explicitly addressed in MDG 3 but is also a cross-sectoral issue that impact significantly on other MDGs. In particular, gender equality is part of an effective strategy to reduce poverty in its many forms - including hunger and income poverty -, achieve universal primary education, reduce child and maternal mortality, and combat HIV
18
and other diseases. Furthermore, gender equality contributes to ensuring environmental sustainability (MDG 7), as women are responsible for water supplies for a family, sanitation and living conditions in slums.
The policy framework presented in this chapter is developed around five major clusters as follows: Cluster 1: The enabling environment for a pattern of pro-poor and sustained growth: the institutional framework, the economic and structural reforms, and the diversification of the productive base. Cluster 2: The equity issue: distribution of assets and opportunities, distribution of income, and social protection.Cluster 3: Fostering employment and promoting human capital: pro-employment policies and durable investment in human capital.Cluster 4: The enabling external environment: trade, capital account openness, Official Development Assistance (ODA) and workers’ remittances.
Cluster 5: Environmental sustainability: preservation of natural resources and energy efficiency policies.
The above clusters represent the components of a comprehensive and coherent policy framework for achieving all the MDGs. It is important to note that they are closely interrelated in the sense that if policies fail in one of them, it would be difficult to have success in another. Actually, the interdependence among these clusters and the policies attached to them mirror the interdependence among the MDGs themselves, and this correlation confirms the need for an overall and integrated approach.
For each of the above clusters, this chapter provides some analytical developments and a number of policy options (that in some countries have already been successfully implemented) for consideration by UNECE member states.
Cluster I. Enabling environment for a pattern of sustained and pro-poor growth
Achieving the MDGs, and in particular those pertaining to poverty reduction, requires that the benefits of economic growth also accrue to the lower end of income distribution; that is, growth must be pro-poor. For addressing this challenge, governments need to undertake appropriate policies that, while creating an environment conducive to business and investment, protect the vulnerable categories at risk of poverty and support their active participation into gainful economic activities.
Cluster I reviews the policy framework for establishing this pro-poor growth environment, focusing on three pillars: the institutional framework; progress on economic and structural reforms; and the diversification of the productive base.
The institutional frameworkThe quality of institutions affects the rate of growth of the economy and the distribution of income and
opportunities across individuals. Inefficient institutions favour rent-seeking activities and hence distort the pattern of development. These distortions mostly come at the expense of those who are initially poorer. In fact, in the presence of institutional failures, richer individuals can rely on their endowments and connections to exploit such failures to their own advantage Conversely, the poor, who lack endowments and connections, will be at greater risk of exclusion and hence become more vulnerable. Therefore, a sound institutional framework is not just conducive to faster growth on average, but also to poverty reduction, and hence to the achievement of the MDG.
The institutional framework for pro-poor strategies must thus ensure that those at the lower end of income and assets distribution are protected and their voice accounted for in the formulation and implementation of socio-economic policies. Centrepieces of this framework should be: democratic procedures for the selection and replacement of authorities, a transparent and accountable policy-making process, competent and efficient bureaucracy and civil services, an effective and predictable judiciary, legislation supportive of political and economic rights, and rule of law.

19THE MDG TRENDS IN THE UNECE REGION
With the end of the socialist era, formerly centrally planned economies undertook a complex process of building institutions. The pattern and pace of development of this process differ considerably across sub-regions. As a positive example, the Central European economies and the Baltic countries have progressed significantly, particularly with respect to the establishment of mechanisms of democratic representation and accountability and the design of regulations in key areas of economic activity, such as trade and business development. The socio-political environment in these countries is also fairly stable, thus reducing the degree of uncertainty about the future course of economic policy. However, in most of these countries the ability to control corruption remains generally low, and this has substantial adverse effects on the quality of the business environment. As a more negative example, the EECCA countries still have a rather weak institutional framework, and various aspects of the political process are far from the democratic standards of other economies with a comparable level of per-capita income. The regulatory burden is often cumbersome and/or inadequate for the provision of appropriate supervision and surveillance, corruption is widespread, and the rule of law fails to a considerable extent, particularly in the Central Asian region. Between the two ends of the spectrum are countries in Southern-Eastern Europe, with candidate accession countries closer to the Central European situation and the Balkans closer to that of the CIS.
There are various factors that explain these different institutional patterns. One is the historical background: the Central European economies retained a more limited imprint from the communist era. They had a better historical memory of non-communist institutions, and this facilitated the development of fresh institutions. A second factor is the anchoring role of the European Union: The prospect of accession to the European Union has stimulated institutional development in Central European countries, while the EECCA countries have missed an analogous external anchor. A third factor relates to the interplay of economic conditions and institutional reforms. The EECCA countries started the transition from a planned economy to a market economy from a weak economic base. They experienced a sharper and more prolonged contraction of GDP than Central European economies. The initially rapid deterioration, and later slower recovery, of economic conditions is likely to have severely hampered progress in institution building. This is because lower incomes and weaker growth prospects reduce a country’s ability to afford good institutions by reducing investment in human capital, constraining the ability to pay civil servants adequately and the financing of the public administration system, and disincentivating political participation. Finally, resource abundance might also have contributed to slower institutional development in some EECCA economies. It is widely acknowledged that resource-rich countries tend to be more prone to rent-seeking activities that involve politicians, bureaucrats and powerful lobbies. In this context, institutional reforms may find stronger opposition from the status-quo and hence may tend to proceed with more difficulty.
The above diagnosis shows that good institutions are a necessary component of pro-poor growth strategies, and are therefore a necessary condition for the achievement of MDG 1.
Policy options for consideration:
■ Strengthening capacity to control corruption as a way to improve governance and institutional quality. This can be achieved by eliminating red-tape, establishing rules that force the government to honour contracts and not to expropriate the private sector, introducing codes of conduct for public officials, creating a meritocratic civil service and simplifying its regulatory framework, increasing the transparency of decisions made by the civil service, and reducing its discretionary power over business and households.
■ Enforcing property rights for the poor through appropriate legislation and impartial judiciary. This might be particularly critical to combat poverty in a context where imperfectly developed financial markets make it very difficult for the poor to access loans. In the absence of clearly stated and enforced property rights (for instance on land), the poor would lack the collateral to access financing and therefore they would miss valuable investment opportunities that, if undertaken, could boost them out of poverty.
■ Specific areas of intervention to be specifically considered by EECCA and SEE economies:- Strengthening the public administration through investment in physical and human capital. Actions
towards this objective include making civil servant wages competitive with the private sector in order to attract the most qualified workers, and making proper information technology available to facilitate registration of property rights and to increase the transparency of procurement.
- Upholding the rule of law by appropriately training and staffing the police and ensuring that the judicial system is sufficiently resourced.

20
- Keeping up the pace of market-oriented and structural reforms to exploit the interplay between economic and institutional reforms (see below section on Economic and Structural reforms).
■ Central European economies and Baltic countries are on average endowed with better institutions than countries at a comparable level of economic development. Yet there is still scope for progress, especially in areas such as the quality of public service provision and the rule of law.
Economic and structural reformsEconomic reforms intrinsically complement institutional reforms in the transition from plan to market.
Starting from a system based on large state-owned monopolies, with centrally planned production and allocation of resources and administered prices; central European and SEE/EECCA countries have embarked on a fundamental reform of their economic structures. This has included the privatization of firms, the liberalization of prices and interest rates, the design of rules and mechanisms for competition policy, the establishment of financial systems (banking sector, securities market, non-banking financial institutions), and the liberalization of trade and foreign exchange systems. Furthermore, consistently with ongoing socio-economic transformations, countries have had to change the size and scope of government expenditure, adjust their system of labour market relations, and deliver a supportive macroeconomic framework for business (i.e., low inflation, stable exchange rates, and tighter public budget constraints).
The implementation of these reforms should generate efficiency and dynamic gains that support innovation and growth. Moreover, the creation of a market-oriented environment will facilitate the active participation in the economy of all segments of the population, thus improving opportunities for all and contributing to overall socio-economic development. However, economic reforms and liberalization together with the process of globalization might increase the vulnerability of some socio-economic groups, especially towards the lower tail of income distribution. The risk is therefore that the poor will bear a disproportionate share of the costs of transformation, while not fully benefiting from it. To tackle this increased vulnerability, governments ought to set-up a system of social protection that combines income-protection for the poor with measures for the re-integration of laid-off workers. In fact, a major feature of economic restructuring has been the redeployment of labour and the increase in unemployment rates within certain group of workers and sectors. To prevent the social exclusion of the newly unemployed, pro-active employment policies need to be integrated with the traditional forms of monetary compensation and redistribution (see also Cluster III). More generally, governments must internalise the potentially adverse consequences that the reform process has on some socio-economic groups and design appropriate policy responses. This is vital to make sure that economic reforms are instrumental to the achievement of the MDGs.
Progress on economic reforms has not been uniform in the region. In general, most countries have undertaken a comprehensive liberalization of prices, often achieving the standards of advanced industrial economies with basically no price controls outside a few sectors (e.g., housing, transport and natural monopolies). Similarly, many countries have opened up their trade and foreign exchange system (see Cluster IV). Small-scale privatizations have progressed reasonably well in the majority of countries in the region, with stalemates occurring again in few EECCA economies. The pattern of large-scale privatization has been much more varied across countries. In most Central European economies (including the Baltic countries) and candidate accession countries more than half of total assets of state-owned enterprises are now in private ownership, and the private sector share of GDP averages well above 70 per cent (hitting 80 per cent in some cases such as Czech Republic, Estonia, Hungary and Slovakia). In the rest of the region, conditions vary from practically no progress (in Belarus and Tajikistan, where the private sector share of GDP is estimated at 25 per cent) to situations where quite large shares of previously public assets are now in private ownership (in Georgia, Kyrgyzstan, The former Yugoslav Republic of Macedonia, Russian Federation).
A significant variation across countries is also observed with respect to banking reform and interest rate liberalization. The banking sectors of Central European countries operate with standards and a level of performance that approach those of other members of the European Union. Most of the EECCA countries lag significantly behind, particularly in terms of establishing a framework for supervision, surveillance and prudent lending. Moreover, in many low and middle income economies of the and SEE, the presence of private (domestic and foreign) banks is still limited, as shown by the rather large asset share of state-owned banks.

21THE MDG TRENDS IN THE UNECE REGION
With respect to competition policy, progress appears to be quite slow practically everywhere in the region. Most countries have adopted competition policy legislation, but only in the new EU member states are actions for the enforcement of legislation and for the reduction of entry restrictions observed.
Finally, transition has often been associated with a setback in gender equality. Social expenditure cuts and labour redeployment particularly hurt the situation of women. This setback is clearly at odds with the poverty and inequality reduction goals underlying the MDG. It is therefore important that countries make gender an integral part of their reform programmes.
Policy options for consideration
■ Implementing of a fully effective competition policy in order to reduce the inefficiencies and wastes (which then result in higher prices and lower quality of consumption goods) associated with monopolies and abuse of market power. While formal competition legislation and institutions often already exist, their effectiveness is still marginal due to the limited enforcement of pro-competition measures.
■ Making the macroeconomic policy mix more supportive of the process of economic reforms by providing a stable and predictable macroeconomic environment. The focus on fiscal and inflation stabilization could be made consistent with the role of government in providing public goods and social protection for the welfare of households, including those on lower incomes, and to improve the conditions of women in poverty situation. Any expenditure cuts could be designed so as to preserve (and possibly increase) the share of items such as education, health, and social protection.
■ Countries, especially those that are not expected to join the EU in the near future, might consider regional policies as a useful complement of national actions. Some possible areas where a regional approach might be desirable concern the coordination of macroeconomic policies (i.e. fiscal, monetary and exchange rate policies), which might also improve countries’ attractiveness for FDI (see discussion on the role of FDI in the Diversification of the productive base below), and the expansion of regional trade agreements.
■ Countries in the EECCA and in the Balkans region can consider strengthening their financial sectors, particularly the banking sector, in order to lift liquidity constraints on less-endowed agents and therefore ensure an efficient allocation of resources to valuable investment projects. Actions to be considered include pushing reforms to establish a coherent framework of banking supervision and regulation, enforcing prudent lending and monitoring of credit worthiness thereby reducing the share of bad loans, and strengthening competition in the sector by allowing a more consistent presence of solid private (domestic and foreign) banks.
■ Combining progress on privatization (particularly required for large-scale privatizations in many EECCA and SEE countries) with renewed efforts to promote good corporate governance and enterprise restructuring. In most EECCA and SEE countries there is still scope for hardening budget constraints by tightening public subsidy and credit policies, and enforcing bankruptcy laws.
Diversification of the productive baseThe diversification of the productive base can be an important element of development strategies.
First of all, a more diversified economy is less prone to external shocks and disturbances. Since these shocks and disturbances can induce economic crisis that are particularly hard on the poor, diversification is one way to deal with the vulnerability of the poor in the new global economy. Furthermore, diversified economies are generally associated with a more favourable pattern of employment and tend to generate a broader demand for education. In this sense, a strong and diversified productive base can help to reduce poverty and to attain other MDGs: education (MDG 2) by stimulating training schemes; gender equality by broadening employment opportunities (MDG 3); and environmental sustainability (MDG 7) by initiating activities which are less intensive in the use of some natural resources.
Within the UNECE region, different pattern of specialization/diversification can be identified, depending on the stage of economic development and resource endowments. The new EU member states and the candidate accession countries are characterized by a growth process that is becoming more broad-based, thus leading to some

22
significant diversification of their productive base. Conversely, in the CIS, a rather narrow pattern of specialization has emerged in few countries with significant reserves of oil and gas (i.e Russia, Kazakhstan, Turkmenistan). In fact, the robust economic expansion in the EECCA region has been largely driven by the development of the hydrocarbons sector and other natural resources, which have enjoyed a favourable price environment. Such growth however masks important structural weaknesses and will not sustain long-term economic expansion or generate needed employment. Social and territorial imbalances and weak institutional framework frequently accompany this development model and hence put diversification on the top of the policy agenda. The other EECCA and SEE countries lie somewhere in between the two extremes. The lack of natural endowments has prevented the emergence of narrow specialization in oil, gas and extractive sectors. At the same time, diversification efforts are limited by the lack of financial means and, as typical at this stage of development, the share of agriculture tends to be quite large. Furthermore, agricultural in rural districts tends to absorb the surplus of the labour force by the means of small subsistence farming, but fails to provide gainful employment.
FDI can be an important factor determining the pattern of specialization and the development model of emerging economies. First of all, the productive activities triggered by FDI add to the gross domestic product of the host country and hence contribute directly to its economic growth. Because most of the production of FDI firms is exported, exports from host countries will also increase, thus contributing to financing the current account. Moreover, FDI firms generate demand for both local labour and inputs, thereby increasing local employment and improving the business prospects of indigenous firms. These “direct” effects are complemented by important “indirect” effects. Increased competition due to the establishment of new firms will stimulate efficiency gains in domestic firms. At the same time, the links between FDI firms and the domestic economy (i.e., through individuals who work for FDI firms first and subsequently move to local firms or through business relations between FDI firms and local suppliers) will create channels for the transfer of technology, know-how and managerial skills. Indeed, this technological and knowledge spillover appears to be particularly important for most UNECE emerging market economies and such channels should therefore be fully exploited. Finally, the combination of increased demand for local inputs and the effects deriving from a knowledge and expertise accumulation will sustain industrial upgrading and technological innovation in the host country, thus providing solid ground for the further diversification of its productive base.
In fact, these potential benefits will effectively flow from FDI to the extent that governments in host countries undertake policies that create a supportive business environment, facilitate technology transfers and promote the emergence of a sufficiently large and skilled human capital. Failure in implementing such policies might then imply that countries are unable to fully exploit the opportunities that FDI opens in terms of development effects on the domestic economy.
In general, FDI flows towards the UNECE emerging market economies were on an upward trend until 2002, when they reached a peak of US$ 30.3 billion. The subsequent sharp decline in 2003 was reversed in 2004, with a new post-transition record of just below US$ 34 billion. Of these, the largest share went to Central European countries and the Baltic States. However, FDI inflows grew significantly in SEE, driven by the candidate accession countries. In the EECCA countries, FDI appears to be largely concentrated in energy-related sectors for the Russian Federation and the other oil-rich economies. For the poorer EECCA countries the challenge is how to attract FDI on a continued and sustainable basis given their lack of natural resources and their distance from the European market.
The discussion above calls for policy action along two main directions: diversification at large and the promotion of FDI.
Policy actions to be considered to facilitate diversification
■ In economies with abundant natural resources rents from natural resources might be deployed towards investment in physical and human capital to develop other sectors (i.e. services) and increase their productivity.
■ In order to promote diversification, countries could develop policies to support industries at the competitive edge may be needed. However, because those policies might fuel inefficient rent-seeking and discretionary allocation of resources, a certain level of institutional development is required as precondition,

23THE MDG TRENDS IN THE UNECE REGION
especially in resource-rich economies (see previous sections on Institutional Framework and Economic and Structural Reforms).
■ In low-income countries of the EECCA and South East Europe efforts should be made to identify and remove bottlenecks that constrain the competitiveness of manufacturers. As agricultural specialization may remain a dominant feature for some time in some countries, it would be advisable for farmers to develop closer ties with the food industry and move into markets and areas of specialization where premium prices can be achieved. High-income countries may contribute to these efforts by allowing appropriate market access.
■ A regional approach might be considered to exploit complementarities in endowments and production structures that exist across countries, particularly in the CIS. This regional approach could take several forms, including free trade areas and common markets, regional agreements for the use and management of natural resources and energy, and regional cooperation for the creation of infrastructures. (See also below Policies for FDI).
■ In the upper- and middle-income countries of UNECE, infrastructure and regional policies might provide a useful mean to address the problems created by territorial imbalances that result from the clustering of the most dynamic types of activity in specific areas.
Policy options to be considered for FDI promotion
■ To attract FDI, countries ought strengthen their business environment by progressing on institutional and economic reforms (see discussion on Institutional framework and Economic and Structural Reforms).
■ Countries can also use tax policies, in the form of cuts in the corporate tax rate or tax allowances, to draw foreign investment. However, competition for FDI might lead to a race to the bottom that has severe implications in terms of fiscal stability and equity. Regional agreements setting minimum tax floors could be therefore considered.
■ Regional cooperation can also help to increase countries’ attractiveness for foreign investment, for instance by facilitating the realization of large-scale transport (and other physical) infrastructures, or by enforcing a better macro-policy mix through the coordination of macroeconomic policies, or through the creation of larger markets. The regional approach might indeed be particularly helpful for poorer and smaller EECCA and SEE economies.
■ To strengthen spillover effects from FDI, governments should facilitate the integration of FDI firms and the domestic economy. This can be achieved for instance through special assistance programmes for domestic subcontractors.
■ The existence of a sufficiently skilled human capital is a factor driving FDI as well as a channel of technology transfer. Governments can support the formation of this stock of human capital through public expenditure on education and continuous training programmes for workers (see Cluster III).
■ Resource-abundant countries in the EECCA ought to take action to attract FDI in the non-energy/natural resources sector.

24
Cluster II: The equity issueThere are two fundamental forms of distributive inequality in a society: the unequal distribution of
opportunities (or initial endowments/assets) and the unequal distribution of incomes (or earnings). These two forms are closely correlated: the latter refers to the outcome of the economic process while the latter refers to the starting conditions of the same process. In this perspective, a skewed distribution of assets/opportunities ex-ante is most likely to result in a similarly skewed distribution of incomes ex-post. The action of governments to reduce economic inequality in a society should therefore address both forms. That is, governments can consider complement the standard fiscal redistribution policies that target income transfers from richer to poorer individuals in the economy with broader interventions that would grant equitable access to opportunities for large segments of the population. In fact, because they tend to result in the creation of new assets (rather than merely redistributing existing assets), the policies aimed at improving the distribution of opportunities yield a large pay-off in terms of economic growth and poverty eradication (MDG 1).
In UNECE emerging market economies, these two forms of inequality are driven both by internal and external factors. Internally, the privatization process often resulted in a highly concentrated ownership structure, thus contributing to inequality of asset distribution. Industrial restructuring led to labour redeployment, with the emergence of significant wage differentials across sectors, which have then resulted in greater income inequalities. For some categories of workers in particular (e.g., the youth and women), access to earning opportunities appears to be heavily restricted, as suggested by persistently higher unemployment rates and pay gaps. Inadequate mechanisms for financing retirement incomes have posed an issue of inequality across generations: many retirees have lost a major source of income that they had earned and were counting on, and the current working generation owes them a decent retirement income. External factors of growing inequalities are associated with integration into the world economy. International trade tends to tilt the distribution of wealth towards export-oriented sectors at the expense of inward-looking ones. FDI inflows might sharpen wage gaps between workers, depending on their skills. Moreover, because of externalities and agglomeration effects, FDI is also likely to generate regional income disparities.
Since most of the policies and factors that are driving inequalities are justified on other grounds (i.e., privatization and restructuring are required to create a solid private sector, wage differentials ensure a more efficient allocation of labour, global integration strengthen growth opportunities, etc.) and hence cannot be neglected, it is of crucial importance for governments to identify appropriate redistributive tools.
Distribution of assets and opportunitiesThe ability of people to earn an income is related to several factors: their skills, their initial endowment
of land and equity, and the existence of open markets that allow them to make profitable use of these endowments and human capital. A multidimensional strategy to reduce inequalities in assets and opportunities should therefore tackle each of these factors.
Human capital is formed through education and hence the equitable distribution of assets and opportunities requires widespread access to schooling for all individuals. In the context of UNECE emerging market economies, where the private supply of education is still limited and only affordable to richer households, the provision of public education plays a fundamental role. This role, the trends observed in public education expenditure over the past fifteen years, and some aims for future policy actions will be outlined in Cluster III.
The equitable distribution of land requires well-designed land reforms and the contemporaneous establishment of institutions to enforce land property rights for the poor. In Central European economies, land was returned to former owners or distributed to farm workers. Although these land reforms were complex, they ended up with relatively strong and well-defined property rights. The Russian and Central Asian land reforms distributed land as paper shares, leading to weak land rights. These differences then affected the patterns of farm restructuring and hence the evolution of agricultural productivity and ultimately food security. Particularly in EECCA and SEE economies, the absence of institutions together with weak financial intermediation reduced the incentive to restructure and caused serious disruptions throughout the agro-food chain. The consequence was a marked decline in food consumption, which hit the lower income groups in the first stages of transition more severely: In the first ten years of transition, food consumption fell by some 15 per cent on average in the EECCA/SEE region, with

25THE MDG TRENDS IN THE UNECE REGION
peaks of more than 20 per cent in the Russian Federation and Central Asia. This became a significant factor in the increase in national poverty measures observed in those countries.
The distribution of equity capital determines the distribution of ownership over production factors (other than land) as well as the distribution of the profits of productive activities. There is thus a strong case for redistributing equity capital in the context of a strategy to improve access to opportunities and assets. In the case of UNECE emerging market economies, privatization offers an important opportunity to achieve such redistribution. However, the pattern of redistribution and the way in which redistributive goals are balanced against other objectives of the privatization process (i.e., by enforcing good governance and tight budget constraints) depend on the method of privatization. An approach is to privatize state-owned companies through some form of ‘give away’ whereby property rights on those companies are freely and equally distributed among citizens. This approach was for instance taken in the Czech Republic and Russian Federation with mass privatization through voucher schemes. In the Czech Republic, assets were initially dispersed among millions of owners. However most of them subsequently placed their vouchers into investment funds controlled by large commercial banks, where the state was the dominant or even the sole owner. This ownership structure was not effective in building up strong corporate governance so restructuring dragged on. That is, redistribution came at the expense of efficiency in enforcing tight budget constraints. In the Russian Federation, mass manipulated transfers of property gave managers and privileged bureaucrats the opportunity to buy out companies at very low prices. The voucher scheme thus resulted in management takeovers and led to the emergence of an oligarchic ownership structure, especially in sectors like oil and gas. An alternative approach is to privatize through direct sales, as primarily done in Hungary and Poland for instance. With this method, ownership of the company remains concentrated in the hands of a core or dominant owner. However, some redistribution of equity can still be achieved by allowing for a non-dominant quota of shares to be dispersed among citizens.
Policy options for consideration:
■ Proceeds from privatization can be used to fund redistributive programmes. Some emerging economies outside the UNECE region for instance have funded minimum flat pension schemes out of privatization revenues. These schemes act for the elderly poor who are unable to save for retirement and hence have a strong redistributive content.
■ Privatization through employees’ ownership is another approach that countries could consider for redistributing capital assets. The success of this approach will hinge on the protection of property rights and ownership rights of the employees (see Cluster I on Institutional framework for specific policy directions on property rights for the poor).
■ The distribution of opportunities hinges on the existence of an open market environment conducive to private sector growth. By progressing on economic, structural and institutional reforms (as outlined in Cluster I), countries can therefore achieve a more equitable distribution.
■ To facilitate access to finance for profitable investment projects (including investment in education) more developed financial markets and deeper financial intermediation are needed. In the poorest countries, micro-credit schemes can be used to lift liquidity constraints on households who lack the collateral to borrow from commercial banks.
■ Human capital formation, especially for low-income groups, is a key factor for achieving poverty reduction. A strong contribution from the government through education and health-care programmes might therefore be needed. The government could also play a pivotal role in the creation of job opportunities through appropriate reform of the labour market institutions and through active labour market policies (See Cluster III for more specific policy guidelines).
Distribution of income Inequality and poverty affect each other directly and indirectly through their link with economic growth.
Small changes in income distribution can have a large effect on poverty. Consider a country where the share of

26
national income that goes to the poorest 20 per cent of the population increases from 6 to 6.25 per cent. A change in income distribution of one quarter of one per cent would barely affect the overall degree of income inequality but for the poor this represents a 4 per cent increase in their total income. Such a small redistribution would have the same effect on poverty as doubling the annual growth of national income from, say, 4 per cent to 8 per cent. This example highlights the fact that income distribution is important, not only for making progress towards the achievement of MDG 1 and the headcount, but even more so when considering the depth and severity of poverty.
All UNECE emerging market economies, and more markedly the EECCA countries, have experienced a significant increase in inequality since the beginning of transition. In 1989, average inequality in the region was much below the OECD average. By the early 2000s, inequality in several Central and East European countries had risen to around the OECD average, and in most EECCA countries it is above the top of the OECD range. Even more importantly, there is no systematic evidence of a decreasing trend in inequality over the past few years. The latest available data show there was some reduction in the late 1990s and early 2000s in Georgia, Kyrgyzstan and the Russian Federation, although levels of inequality remain high by international standards (especially in Georgia and the Russian Federation). Inequality increased in the Baltic countries, in some Central European economies (the Czech Republic and Hungary), and in Romania (data for other SEE are scarce). The question is, then, to what extent can fiscal policy be used to smooth out these inequalities?
In principle, redistributive fiscal policy should make use of progressive taxes to finance spending programmes whose benefits accrue to the lower end of income distribution more than to the upper end. There are however difficulties and limitations in the application of this principle. For instance, in some countries, efficiency considerations might favor the adoption of a flat, and hence less progressive, tax rate. With respect to expenditure, the pro-poor incidence of spending might be reduced because of inappropriate targeting of programmes, weak public sector management, the limited role of formal cash transfer and social protection policies, and inequitable (or unsustainable) pension schemes. Furthermore, redistribution through transfers and social expenditure financed out of progressive taxation is politically difficult to implement as it encounters strong opposition from powerful lobbies.
Several of the abovementioned difficulties are relevant to the experience of UNECE emerging market economies. The sharp decline in the pace of economic activity in the early transition phase combined with the collapse of the system based on large state-owned firms and weak tax administration caused a substantial drop in direct tax revenues. This drop was further deepened by the cuts in corporate income tax rates that some countries applied to attract FDI. Conversely, reliance on indirect domestic taxes (Value Added Tax and other sales taxes) and social security contributions (particularly in Central Europe) increased.
The composition of the expenditure side of the budget also went through significant changes, reflecting (i) the need to achieve fiscal stability in the face of falling tax revenues and (ii) the change in the role of government. These cuts had mixed redistributive implications: On the one hand, more resources to finance pro-poor expenditure were freed by a significant reduction in defense expenditure, particularly in the EECCA region (with perhaps the exception of Central Asian economies). On the other hand, monetary transfer programmes appear to have been inefficiently targeted towards the poor, possibly because of weak governance. Public expenditure on social protection sharply declined in the EECCA region, where governments sought to protect employment at the expense of real wages and pensions. Conversely, in Central European and Baltic countries, restructuring led to falling employment and countries supported workers and pensioners through a more generous social protection system (for a more detailed discussion of social protection see Cluster III). Total expenditure on education and health care decreased in terms of percentage of GDP, especially in poor EECCA countries in the first half of the 1990s, but was fairly stable in terms of percentage of total government expenditure. Moreover, expenditure was (and still is) higher than was observed in other countries at a comparable stage of economic development.
The setback in gender equality that occurred throughout the transition period (see discussion in Cluster I) implies that specific attention should also be paid to reducing income inequalities between men and women through gender sensitive budgetary policies. The existing pattern of gender inequality has to be taken into account in judging whether a budget promotes the achievement of substantive equality. It is not implied in the gender responsive budget (GRB) that the share of tax revenues or expenditure should be equal for men and women or that the budget must be presented showing a division of all tax revenues by gender. However, there is a need to

27THE MDG TRENDS IN THE UNECE REGION
develop a gender analysis of taxation which should focus on: (i) the content of tax rules in relation to the treatment of women as autonomous people; (ii) tax burden and incidence in relation to ability to pay; and (iii) the effect of fiscal incentives in relation to participation in different types of paid and unpaid work and the redistributive effect of these incentives (for example to what extent it can reduce the gender gap in incomes). While programmes vital for gender equality may include those specifically targeted to males or to females, major programmes that are not gender targeted should always take into account their gender impact when they are designed or adjusted.
Suggested Policy Actions:
■ Strengthening the business environment as a way to expand the tax base and therefore increase government’s capacity to rise resources and finance public programs and social transfers (see the discussion in Cluster I on Institutional Framework and Economic and Structural Reforms).
■ Improving the efficiency of tax administration needs to be improved to combat tax evasion and to ensure the timely and fair collection of revenues from the potential tax base.
■ In most EECCA and SEE economies a relevant policy option to be discussed is to gradually move away from flat income tax rate towards more progressive tax rates while preserving the simplicity of the tax system in order to reach jointly the objectives of efficiency and income redistribution.
■ Appropriate and efficient targeting mechanisms could be put in place in order to improve the selection and use of transfers and cash benefits.
■ Broadening and deepening initiatives to promote Gender Responsive Budgeting (GRB) based on good practices (United Kingdom, Belgium, Canada, the Czech Republic, France, Spain and Switzerland). Government budgets could be designed using incentives for change to offset pre-existing inequalities among men and women in the short term, and to reduce gender inequalities in the economy and society in the longer term.
Cluster III: Fostering employment and promoting human capital
Individuals make their income through employment. Achieving a high-employment equilibrium is therefore one of the most effective ways to support development and combat poverty. In this respect, pro-active policies aiming at establishing a dynamic labor market can be seen as a decisive component of the strategy to achieve Goal 1.
In addition to designing and implementing pro-active labor market policies, governments can foster employment by supporting human capital formation and by providing social protection. Human capital is often the main (and possibly only) asset that poorer households can use to improve their income prospects. Governments should therefore make public education services of good quality widely available. Moreover, governments can facilitate post-education investment in human capital by way of re-training programs and providing incentives for continued learning. Social protection schemes are required to ensure that the poor are shielded from the income loss due to unemployment or retirement, and hence that they can afford investment in human capital. Furthermore, social protection policies should improve access to health care services for more vulnerable individuals in the economy, thus preventing (or mitigating) the waste of human capital that is due to prolonged illness or inability to work.
Pro-active employment policiesThe availability of jobs in the formal economy is a necessary condition for individuals to earn a decent
income and exploit their investment in human capital. Creating a dynamic labour market with high employment has to be considered therefore as the basic component of an effective strategy for the achievement of the poverty reduction Goal. Moreover, employment is instrumental for the achievement of other MDGs, such as those relating to health status. Finally, it is under high employment conditions that a country can achieve the social cohesion needed for steady and durable economic growth.

28
In the UNECE emerging market economies, ongoing economic restructuring has led to a strong decline in industrial employment: on a cumulative basis it shrank by 30 to 50 per cent between 1990 and 2004. In the low and lower middle income economies in the EECCA/SEE region, agriculture played a buffer role in absorbing employment losses, whereas reallocation of employment towards the service sector progressed more notably in the middle income Central European and Baltic economies. Nonetheless, total job losses in the last decade were substantial across the region, and growth of employment has not yet resumed on a sustained basis in any of these countries. The female population was badly affected by employment cuts in all countries in the SEE and EECCA regions, especially in the first half of 1990s. Some improvement in women’s employability seen in a number of countries in the late 1990s has been accompanied by a concentration in women’s jobs at the lower end of the labour market and by the proliferation of part-time and other non-standard forms of employment with little security and low wages.
At the same time, unemployment has remained a major problem throughout the UNECE region. The unemployment rate is over 14 per cent in new EU Member States, 15 per cent in South-East Europe, and remains high in the EECCA (where comparable data is difficult to obtain). This unemployment is generally for long-term periods, and has hit the youth especially. In some countries, especially in SEE and the EECCA women’s unemployment is higher than men’s unemployment. The high proportion of long-term unemployment in total unemployment points to the persistence of structural problems.
Dealing with these uncomfortable trends requires an integrated approach. Various policy options can be considered. First, labour market institutions could be reformed to increase flexibility and labour mobility across regions and sectors. Second, social safety nets should be designed to ensure adequate income maintenance coverage while supporting the re-integration of the unemployed. This means focusing social expenditure more on active labour market policies (i.e., re-training programmes, job search and placement assistance, and subsidized employment). Third, the macroeconomic policy mix ought to be conducive to private sector growth and employment.
UNECE emerging economies still have considerable scope for progress in these areas. Barriers to entry and skill mismatches, evident with respect to youth employment for instance, denote the persistence of labour market rigidities that keep unemployment high. Sharp differences in the unemployment rate across sectors, and even more markedly across regions within a country, are indicative of limited labour mobility. Further reforms of labour markets can be therefore considered, especially in the low-middle income section of the of the EECCA and SEE population.
The social safety net for the unemployed is ineffective and inefficient in several countries. Ineffectiveness has to do with the ability of the net to insure the unemployed against income loss. Inefficiency relates instead to its ability to favour the re-employment of the unemployed. In most EECCA and SEE countries, the combined systems of unemployment benefits and social assistance do not provide adequate income maintenance coverage for the unemployed, in particular for the long-term unemployed. In addition, the existing systems by their design rarely support active re-integration of the unemployed; more often they tend to encourage passive receipt of social assistance, which in some cases could create an incentive for those who are not active job-seekers to register as unemployed. Streamlined links between the unemployment registration systems, unemployment benefits and administration of social assistance could help to improve the situation, particularly if complemented, in the delivery of social assistance, by better targeting and monitoring of payments.
Macroeconomic and structural policies are not always coherent and tend to lead to the inefficient allocation of available resources. They also tend to obstruct the business environment, hampering the development of the Small and Medium Enterprise (SME) sector especially. The new private sector, in particular SMEs, has emerged as the main driving force of economic recovery and job creation in Central European and Baltic countries and in some parts of South-East Europe, but the growth pattern developing in the EECCA economies that are rich in natural resources is neither job-rich by its nature (since the production of natural resources is capital intensive) nor is it conducive for new business and SME development without public sector support.

29THE MDG TRENDS IN THE UNECE REGION
Policy options for consideration:
■ Making macroeconomic policy must put more supportive of full employment. Countries can consider giving more weight to employment effects when making policy choices for interest rates, inflation targets, government expenditure and revenue policies or exchange rates.
■ Providing a stable legal and administrative framework for developing SMEs and improving the overall business environment, especially in low- and lower-middle income EECCA and SEE countries. The process of establishing new firms can be simplified and banking should provide incentives for SMEs. Special attention could be given to promote women’s entrepreneurship through targeted programmes.
■ Ensuring that women have equal access to jobs and career opportunities could well facilitate the achievement of MDG3.
■ Increasing the professional mobility of the work force across sectors are needed. This requires re-training programmes that will update and diversify competencies and job-search services to facilitate the match between demand and supply of skills.
■ These policies might be complemented by measures supporting geographical mobility, an essential factor for responding to job opportunities. In this respect, facilities for access to transport and housing need to be worked out, e.g. through the development of housing programmes for the poor and the development of public transport.
■ Social safety nets must be sufficient to protect those made unemployed by adjustment policies, although these need to be designed so as to ensure that there are sufficient incentives to find new employment (see discussion below on Social Protection).
Durable investments in human capital
Human capital is formed through education. Attending school is an investment that yields a future payoff (i.e., a steeper earning curve) against an immediate cost. This cost has two components. One is the direct cost of tuition fees, books and other studying material, and transportation. The second component is the indirect opportunity cost represented by the income foregone while going to school. Often this second component is dominant and tends to become more significant at the lower end of income distribution. Public education programmes and social protection nets can promote significant human capital formation by abating these costs of schooling.
The sharp revenue contraction that occurred in the early transition years and the need to achieve fiscal stabilization led most UNECE emerging market economies to cut public expenditure, including on public education. The strongest decrease was observed in the EECCA region, particularly in Central Asia. Its most acute effects were a decline in primary education, especially for girls, in the poorest countries such as Tajikistan and Turkmenistan, and a fairly widespread decline in secondary school enrolment in Central Asia. In most other countries, however, indicators of education enrolment remained high relative to other countries at a comparable stage of economic development, reflecting the legacy of the socialist era. Yet, the quality of education provided appears to be decreasing due to school closures, cuts in curricula, the introduction of users fees and higher prices of textbooks as well as loss of schools’ social functions such as provision of free preventive health services, meals or recreation. Governments can consider actions to address those quality issues to reinforce the contribution of public education to human capital formation.
A strategy to sustain durable investment in human capital should also take into account the role of health conditions (see the previous section on Social protection). In fact, the initial investment in education is lost if students/workers suffer from poor health and cannot work because of protracted illness or disability. The expected return from education tends to decrease when health conditions deteriorate. This is because worse health conditions reduce the expected length of a working life and hence the time over which individuals can benefit

30
from a steeper earning curve. The problem is certainly relevant for several UNECE emerging market economies. While some health indicators (e.g., the immunisation rate) display a comforting positive trend, others appear to be worsening over time. For instance, life expectancy is decreasing in most EECCA countries (e.g., between 1990 and early 2000s it went down by some seven years in Kazakhstan, six years in Azerbaijan, four years in Tajikistan, and three years in the Russian Federation, Belarus and Kyrgyzstan). Maternal health indicators also show some signs of deterioration, at least in the poorest countries. The persistence of the rapid spread of old diseases (e.g. tuberculosis) and the proliferation of new ones (AIDS/HIV above all), account for a shorter life expectancy to a considerable extent. More generally, increased economic vulnerability (due to falling per-capita incomes and high unemployment) and cuts on publicly provided health services have hampered the improvement of health conditions. Again, the effect is likely to have been stronger at lower income levels, thus adding to inequality in the distribution of assets and opportunities.
Governments ought to consider ways to strengthen the effectiveness of their health care spending. The practice suggests that primary health care services tend to have the strongest impact on the improvement of health indicators. Countries can therefore consider focusing public expenditure on the provision of those services. This might also be combined with the definition of health-care priorities, such as maternal and reproductive health, and prevention of HIV/AIDS and other diseases.
Policy options for consideration:
■ Using external assistance and debt relief for investment in health and education as a priority. This option might be particularly valuable for the poorer countries in the UNECE region.
■ Countries rich in natural resources should introduce the same type of priorities when proceeding to their budgetary choices.
■ Health-care priorities include maternal and reproductive health, including access to contraceptives, the fight against major endemic diseases and the control of HIV/AIDS. To address these priorities and to contribute to MDGs 4, 5 and 6, policies should aim to:
- Improve maternal care during pregnancy and childbirth;- Control tuberculosis through better diagnostics and immunization;- Implement innovative programmes to combat HIV/AIDS, considering unconventional policies such
as the use of clean needles, the improvement of prison conditions (an important source of HIV/AIDS spread), HIV/AIDS prevention programmes in schools, and programmes for the fight against discrimination; and
- Implement campaigns to promote the idea of making more informed choices about lifestyle in order to improve life expectancy, especially of males.
■ Addressing quality issues in education through education system reforms (MDG 2, target 3). This requires allocating public funds to upgrade curricula (to prevent skill mismatches), modernizing the education of teachers and increasing their salaries to foster motivation, providing students and teachers with appropriate material and equipment, and ensuring that enough hours of instruction are covered.
■ Linking the reform of the education system (MDG 2, target 3) to the establishment of a life-long learning system. An example is the need to re-train displaced workers, especially in those countries where high structural unemployment reduces avenues out of unemployment. Policies to promote lifelong learning need more attention and should be based on public-private partnerships.
Social protectionThe social protection system can make a crucial contribution to the achievement of MDGs along
two lines. First, by shielding individuals against income losses, it evens out inequalities in living standards and ensures that even the most vulnerable segments of the population have access to minimum levels of consumption (and welfare). Second, by promoting social cohesion and facilitating human capital formation, it encourages high employment and economic growth in the long-run. Social security expenditure in proportion of GDP tends to be higher in UNECE emerging market economies than in other counties at comparable levels of development. However,

31THE MDG TRENDS IN THE UNECE REGION
to strengthen its contribution to the MDGs, the social protection system ought to be streamlined around four pillars: a viable and fair pension system, an affordable unemployment protection scheme that does not distort supply-side incentives, health-care programmes, and well-targeted cash and other benefits in kind.
Pension reforms in a number of countries have moved towards establishing multi-pillar pension systems, with the state directly responsible for one of them, namely, the guaranteed minimum pension pillar. In many economies, the viability of the system has to be strengthened. This can be achieved through an increase in the degree of actuarial fairness (i.e. by tightening the link between contributions and benefits at individual level), without erasing the pay-as-you-go system that guarantees some form of protection for the elderly poor. Poland and Latvia have for instance recently moved into this direction. In some of the more prosperous emerging markets (including Russia) the financing of the existing pay-as-you-go system could be improved significantly through the formalization of labour contracts of illegal workers by means of a common labour market.
Early retirement also undermines the long-term viability of pension systems. In most east European countries, early retirement and disability benefits are still too generous, either by design or through tax administration. In southeast Europe and the EECCA regions, a large number of retirees work in the informal sector because the majority of non-working pensioners are threatened by poverty.
The fairly generous unemployment protection schemes (in terms of eligibility, the amount and duration of benefits) introduced at the outset of transition had to be tightened under the pressure of fiscal imbalances. As a result, the coverage and the amount of unemployment benefits have declined and in some East European countries were more than halved between 1991 and 2004. In 2004, in many of these countries, only one fifth or less of the jobless received unemployment benefit. This is partly due to the relatively high incidence of long-term unemployment in excess of the standard 6-month time limit for the provision of unemployment insurance (UI) benefits. In EECCA countries the amount of the UI benefit relative to the average wage is generally lower than in Eastern Europe. This and the poor accessibility of state employment agencies (travel costs have to be borne by the unemployed) or their services reduce the number of claims.
The policies of unemployment insurance in Central Europe differ from those in the EECCA in that they put more emphasis on incentives for active job search. While the East European policy approach shifts responsibility for supporting redundant workers away from enterprises and onto public institutions, the policy approach in the EECCA continues to rely mainly on employment protection within enterprises, and assistance provided by the public labour services is still relatively poor. These different models of unemployment protection have produced different outcomes with respect to labour market adjustment. The Central European model appears to have led to a more effective reallocation of labour within and across sectors, but it has also generated higher rates of open unemployment. In contrast, the EECCA model has been less conducive to the reallocation of labour and, consequently, adjustment has been slower.
The health care component of social protection is particularly important in view of human capital formation and inequality issues. A good health status favours a positive approach to education within families. Moreover, health shocks affect consumption and earnings opportunities, especially in low income groups. Long-term disability, injury and illness reduce people’s ability to work and earn, thus increasing economic vulnerability and depleting human capital. In this respect, governments ought to combine universal coverage of basic public health services with effective targeting towards those who are in greatest need. In fact, the budgetary cuts undertaken to stabilise the fiscal policy stance during transition have severely hit public health-care expenditure. This has resulted in somewhat deteriorating health indicators in several economies in the region, particularly in the poorer economies of the EECCA where poverty is more diffused (see also the discussion below on Durable investment in human capital). Some countries have now undertaken health care reforms to establish a health insurance system (combining state controlled and private health insurance institutions) and promote the commercialization and/or partial privatization of health care services. Where such privatization increases the cost of health care, governments must intervene to support the poor and grant them access at low (or no) price.
Social assistance is also provided indirectly through diverse subsidies and directly in cash and in-kind benefits, i.e., preferential VAT tax rates on food, energy, water and other municipal services; and family allowances,

32
including child and housing benefits. In this respect, stronger targeting ought to be achieved in order to reach effectively those suffering from poverty, mainly found among ethnic minorities and single parent households.
Social security reforms in the EECCA countries and some other countries in the UNECE region were not gender sensitive. Reforms were driven by cuts in public spending and the lowering of the level of universal coverage of social provisions through a shift towards market-based provisions. In consequence the “male bread winner model” is being eroded not by gender equitable reforms but by its drastic reduction. A shift towards a private pension system in particular has weakened the position of low-income women, increasing the risk of women’s poverty in old age across the region. This is related to lower incomes from work but also the less time that women spend at paid work due to raising a family.
Policy options for consideration:
■ Improving the existing unemployment insurance schemes so that they are consistent with tax-benefit systems that provide stronger incentives for active job search and make employment a worthwhile option. (see the discussion on Pro-active employment policies);
■ Strengthening women’s involvement in the labour-market through a provision of well designed family allowances, including financial support for day-care;
■ Improving the efficiency of social assistance delivery by better targeting benefits towards those who suffer from extreme hardship among the most socially disadvantaged groups (ethnic minorities, single-parent households);
■ Mainstreaming gender into welfare reforms, especially pensions, based on the analysis of their implications on men and women in the context of acknowledging women’s unpaid caring work;
■ Ensuring universal coverage of basic health cares and, when necessary, takes specific additional measures ensuring that the most vulnerable groups in society effectively benefit from such coverage.
■ Creating regional common labour markets in the EECCA and in non-EU South-Eastern Europe to foster the sustainability of the pay-as-you-go (PAYG) system and the fiscal balance of social-security funds while allowing working non-nationals to join social protection systems on equal terms;
Cluster IV: The enabling external environmentDevelopment assistance, along with increased foreign trade, capital inflows and workers’ remittances
can provide countries with additional resources to address many of the MDGs including eradicating poverty and improving education, health care, and environmental conditions. Increased trade and inward foreign investment can also contribute significantly towards increasing employment. However, in order for countries to benefit from these increased resources and opportunities it is necessary that countries have in place an appropriate set of complementary domestic institutions.
TradeIncreased trade allows countries to exploit their comparative advantage, reap the benefits of scale
economies, develop technologically by importing advanced technology, and create more competitive and efficient market structures. However, the benefits of trade liberalization can be negated if displaced workers become unemployed, if national income becomes more unequally distributed, or if foreign firms are allowed to monopolize sectors. Trade liberalization should be phased in so as to minimize adjustment costs. More generally, increased openness leads to increases in the need for economies to adjust to changing conditions. Structural policies that increase the flexibility of the economy, such as less regulation of labour and product markets, generally increase an economy’s ability to adapt. However these same ‘flexibility-increasing’ policies can have negative implications for

33THE MDG TRENDS IN THE UNECE REGION
some other social objectives and must be implemented in a careful, balanced manner (see also the discussion on Economic and structural reforms in Cluster I). Trade may (but need not) make markets less competitive by eliminating local competition; the appropriate policy response is to ensure that a competitive and properly functioning market is maintained. Internationally compatible national competition laws and adherence to them are also important.
The benefits of trade can be best achieved by pursuing an open, rule-based, predictable and nondiscriminatory trading system. Trade liberalization can be pursued bilaterally, regionally or multilaterally; however, when liberalizing trade bilaterally and regionally countries should attempt this not only amongst the countries’ own members but also with the rest of the world in order to avoid the undesirable effects of trade diversion. The creation of customs unions or free trade areas among several regions may offer a method for members to create enlarged markets that will allow them to develop increased competitiveness before more fully liberalizing into the global economy. The creation of a trading bloc would also provide an improved framework for harmonizing standards amongst its members.
Trade flows amongst the former transition economies declined significantly after the break up of the Soviet Union and the movement towards market economies. Many of the existing trading relationships no longer made economic sense and a complete reorientation of trade towards new partners and in new sectors was required. The New Member States (NMS) of the EU are now relatively open towards trade and capital flows. Having just recently been through this liberalization process, the NMS are capable of providing additional technical assistance to the remaining transition economies in the areas of trade and capital market openness. EU candidate countries in South-East Europe must follow through on their EU commitments in this area. However they must work to ensure that the domestic complementary institutions are sufficiently developed and should give special attention to ensuring that those disadvantaged by the liberalization policies receive appropriate assistance. For the other countries of South-East Europe that are unlikely to join the EU in the foreseeable future, they must continue to open their economies but will also need to decide on the appropriate direction that regional integration should follow. The current patchwork of bilateral agreements is administratively cumbersome not only for customs officials but also for the private sector. Economically, the creation of a customs union or a free trade area comprising the whole region (perhaps including the EU) would be advisable, but its implementation is complicated by the fact that (a) two of the largest countries in the region would leave to join the EU, (b) two countries: Bosnia and Herzegovina, and Serbia and Montenegro are not WTO members, (c) Turkey is already in a customs union with the EU, and (d) political divisions remain significant. Despite the need for further trade policy initiatives, the effects of already implemented reforms are obvious from the rapid 34 per cent increase in exports during 2004.
Trade amongst EECCA countries are hampered by inefficient customs procedures and extensive border delays. These are especially costly for landlocked countries of Central Asia whose trade must transverse through a number of other countries. The creation of a customs union amongst EECCA members offers an approach for the elimination of these border costs and delays and addresses MDG 8, target 14. The trade of these nations with the rest of the world is restricted by their limited access to world markets: only Armenia, Georgia, Kyrgyzstan, and the Republic of Moldova are current WTO members. Obtaining WTO membership for the remaining EECCA countries could provide increased market opportunities for their industries and provide a stable framework for developing trade amongst themselves. The EECCA have been increasing their trade quite substantially with exports increasing by 37 per cent in 2004 due significantly to higher prices for their natural resource products. A number of the EECCA are quite vulnerable to external shocks due to falling export prices due to their exports being concentrated in a few products and their economies being so dependent on exports. In 2004 exports accounted for over half of the GDP of Belarus, Kazakhstan, Tajikistan, and Ukraine; Armenia and Georgia are the only EECCA economies where exports are less than 30 per cent of GDP.
The Doha round of WTO trade negotiations has set improved market access for developing countries as one of its primary objectives. According to some analysis, developing countries are losing more in blocked access to rich country markets than they gain from aid. MDG objectives need to be given more weight in formulating trade policy at global and national level.

34
Capital Account OpennessCapital account openness can benefit an economy by (1) allowing foreign savings to increase domestic
investment, (2) encouraging domestic savings by allowing an increased diversification of financial assets, and (3) disciplining the government’s conduct of fiscal and monetary policy. The benefits of capital account openness are likely to be smaller for emerging markets than for more advanced economies due to the fact that emerging markets must issue debt in foreign currencies and accumulate international reserves. The premature opening of a capital account before the necessary domestic financial institutions and regulations are in place can lead to financial and currency crises. However, often totally external changes such as changing terms of trade or interest rates can lead to a crisis; thus increased openness is generally associated with increased macroeconomic volatility. The average currency crisis reduces GDP by 9 per cent and worsens the distribution of income through several channels. Employment of lower skilled workers is especially affected, and recapitalization of the banking system is generally accomplished with public money raised through taxes.
Foreign direct investment (FDI) into the region is significant and compares favourably with other developing countries and emerging markets. Inflows into South-East Europe (excluding Turkey) were close to 6 per cent of GDP and inflows into the EECCA (excluding the Russian Federation) were over 7 per cent of GDP in 2004. FDI remains relatively low in the Russian Federation (2 per cent of GDP) and Turkey (0.9 per cent of GDP). More volatile capital flows such as portfolio investment are increasingly significant and require a stable macroeconomic environment in order to contribute towards growth (see the discussion in Cluster III on The role of FDI).
Worker remittancesIncome from wages earned abroad is becoming an increasingly important source of foreign exchange
for SEE and EECCA countries. In 2004, worker remittances accounted for almost 27 per cent of the Republic of Moldova’s GDP and 15 per cent of GDP for Albania, Bosnia and Herzegovina, and Serbia and Montenegro, over 5 per cent for Armenia, Georgia, and Kyrgyzstan, and significant but under 5 per cent for most of the remaining countries in the region. As a source of foreign exchange this foreign-earned income is equivalent to over 70 per cent of the Republic of Moldova’s exports and is over four and a half times the amount of its FDI inflows. When transfers are of this size, they imply that there are levels of migration that will have significant implications for the labor market, Estimates are that at least 25 per cent of the Republic of Moldova’s economically active population has emigrated and the reduced supply of workers has increased wages within the country. Eastern European workers have tended to migrate to Western Europe while the workers of the other EECCA countries tend to go to the Russian Federation. Empirical studies have found that the volatility of remittances is lower than for either private or official capital inflows and often act as insurance in that they tend to increase when a country is subjected to a negative shock; thus these income flows appear to provide a relatively stable source of income. In addition, foreign residents abroad lead to even more emigration through networking effects, therefore these large remittances are likely to persist through time or at least until the domestic employment situation in these countries has improved significantly.
Development AidFor the poorer countries of the region, access to international capital markets is limited, both for
borrowing as well as attracting FDI, and they must rely on Official Development Assistance (ODA) in order to finance their development. Over the 2001-2003 period, ODA accounted for 12 per cent of Tajikistan’s GDP, 11 per cent for Bosnia and Herzegovina, and Kyrgyzstan, 10 per cent for Armenia, and Serbia and Montenegro, and over 5 per cent for Albania, Azerbaijan, Georgia, The former Yugoslav Republic of Macedonia, and the Republic of Moldova. For most of these recipients, the size of this ODA has been on a declining trend measured as a percentage of GDP and often in absolute amounts as well after adjusting for inflation and the depreciation of the U.S. dollar. In addition to ODA, many of the other CEE and EECCA countries have received official aid but it is not normally classified as ODA since these countries have income levels above some specified threshold. Much of the aid (including ODA) is not directed towards achieving MDGs and needs to be better allocated. CEE and EECCA countries have received a fairly stable share of between 12 to 15 per cent of total world net aid (ODA plus official aid) over the last decade and there has been a slight downward trend (as a percentage of total aid) since 1999. However, since 1999, the share of aid to SEE countries has more than doubled to 8 per cent. The specific MDGs that were established were based upon an implicit understanding that significant additional aid resources would be forthcoming. This has not been the case and this therefore is a factor in explaining why some of the goals in this region are not being met.

35THE MDG TRENDS IN THE UNECE REGION
Policy options for consideration:
Trade■ Further regional integration along with multilateral liberalization should be a priority in South-East Europe
■ In the EECCA region, and relating to MDG 8, target 14, customs procedures could be simplified and additional resources need to be allocated to customs agencies in order to reduce border delays.
■ Creating a preferential trade area covering some or all of the EECCA countries. This can help liberalization with the rest of the world and hence contribute towards MDG 8, target 12.
■ Increased priority might be given to multilateral trade liberalization and WTO membership for those amongst the UNECE countries that are still not members. These countries can take advantage of trade capacity building initiatives established by numerous international organizations and assistance that the NMS can provide due to their recent experience in liberalization.
Capital Inflows■ In South-East Europe and the EECCA regions, liberalization of capital markets should only be
implemented after the appropriate regulations and standards have been developed for domestic financial markets.
■ Capital market openness increases the probability of a currency crisis (in any of the regions) but this can be minimized by maintaining prudent macroeconomic policies, the stringent regulation of financial markets, political stability, and holding sufficient international reserves.
■ FDI can be encouraged through institutional reforms to protect property and intellectual property rights; policies can be implemented that promote the transfer of technology to local companies (see the discussion in Cluster III on The role of FDI).
Worker remittances■ Policies that liberalize worker movements can provide host countries with worker skills that are in
short supply, and these workers’ remittances can provide their home countries with a much-needed stable source of foreign exchange.
■ To reinforce the contribution of remittances to economic development and poverty reduction, governments ought to encourage their use for profitable investment (i.e. start-up of small business, education) and to bring more funds into formal channels. This in turn requires strengthening financial sector infrastructures, increasing financial literacy of workers and recipient families, and delivering a sound macro-economic policy framework.
Development Aid■ Strengthening the flow of ODA towards those countries in the UNECE region where the MDG
financing gap is largest (see Part I of the report, comment to MDG 8). These include the Central Asian Republics (excluding Kazakhstan and Turkmenistan), the Republic of Moldova and Armenia.
■ Countries relying on ODA should develop public policies that aim to create a stable macroeconomic climate and equitable growth and should ensure that strong actions are being taken against the inefficient use of resources, such as corruption. Just as important as actually achieving these objectives, these countries need to be able to convince donor countries that this is the case.

36
Cluster V: Environmental Sustainability There is a clear link between addressing environmental challenges and making progress in achieving
the MDGs on poverty and health. Conventional measures of economic performance, such as GDP growth, fail to take fully into account environmental costs and the depletion of natural resources. It is therefore clear that vigorous public action is required in environmental matters to overcome the limitations and short-sightedness of market mechanisms and organise an adequate supply of basic infrastructure in this area.
Budgetary problems, the dislocations caused by economic transition and increased economic competition, resulting from the liberalization and opening of the UNECE emerging markets economies, have resulted in a neglect of environmental matters and the deterioration of infrastructure. The costs of environmental damage and a crumbling infrastructure tend to fall disproportionately on the poor, who are forced to live in areas with bad sanitation facilities and who are more economically vulnerable to the spread of diseases that thrive in poor living conditions.
Two major policy areas for achieving MDG 7 in the UNECE region are addressed below: sustainable energy; and sustainable management of environmental resources and ecosystems.
Sustainable energy
The inefficient and polluting energy systems in the EECCA region are glaring economic and environmental problems interwoven with promising opportunities for reducing global greenhouse gas emissions. Eastern European economies suffered from the low productivity and living standards associated with inefficient energy use long before central planning came to an end. Since then, in many countries of this part of the UNECE region, the underpricing of energy resources and tolerance for the accumulation of arrears as well as the non renewal of old equipment have continued to create incentives for waste of energy. Existing high-energy consumption per unit of output levels thus reflect the inherited inefficiency of the planning system and the persistence of old practices.
Fortunately, several key features of these barriers also contain opportunities for them to be resolved or at least better managed. The reform of energy prices and subsidies are on the macro-economic agenda in most of these countries. Steps have been taken for increasing prices so that they better reflect the economic costs of production and externalities. At the same time, their impact on the poor and vulnerable that must be sheltered from price hikes should be addressed through targeted subsidies or tax exemption. Overall, diversions from sound energy pricing should be removed step by step while taking into account the need to support the poorest segments of the population as part of the process.
Energy efficiency and renewable energy investments can be at least partly financed by reforms in energy pricing. Efficiency improvements are also closely linked to increasing industrial and services sector productivity. Economic output in the EECCA region is growing at between 5 to 12 per cent annually and foreign direct investment continues to increase. Rationalizing the large fixed capital investments in their energy infrastructure could support economic growth through productivity gains and attract foreign investment. Market economies have abundant examples of every aspect of successful energy efficiency and renewable energy applications including innovative financing models. Indeed, Central European post-economic transition countries also have a growing range of experience in this field that can be readily transferred to their southern and eastern European neighbours.
Sustainable management of natural resources and ecosystems
Population growth and economic expansion are putting a huge pressure on freshwaters in the UNECE region. Water withdrawals, for instance, have increased six-fold since 1900, which is twice the rate of population growth. In addition, the quality of many water bodies is declining due to increased pollution from agriculture, industry, urban run-off and domestic sewage. Governments have invested and continue to invest large amounts of money in water-related infrastructure. But flood control, water supply for irrigation, drinking and recreation cannot rely solely on infrastructure. Considering the environmental services that water-related ecosystems, such as forests and wetlands can provide, using them wisely is a cost-effective alternative to infrastructure development.

37THE MDG TRENDS IN THE UNECE REGION
Cleaner water and better sanitation could prevent over 30 million cases of water-related diseases each year in the region. There are abundant examples how integrated water resources management (IWRM), including ecosystem protection, can contribute to securing safe drinking water. Furthermore, in many cases, preferring ecosystem protection to building a water-treatment plant has lowered health risks due to possible malfunction of sewage and water-treatment plants and disinfectant-resistant pathogens.
It has been shown that ecosystem protection and restoration can also contribute to mitigating the effects of climate change, such as the increased magnitude and frequency of floods, which became one of the most costly “water-quantity problem” in the region. There is a need for concerted action in the entire region as floods are often worsened due to improper land use practice, the center of action on the construction of dykes and other flood defense measures, and the disrespect of implementing non-structural measures of integrated flood management.
Bearing also in mind that about 60 per cent of the European cities with more than 100,000 inhabitants (or a total of 140 million people) are now supplied with water from overexploited or polluted groundwater resources, a number of countries have introduced new measures to prevent, control and reduce groundwater pollution and to restore damaged groundwater aquifers. The implementation of such new policies remains a challenge in other parts of the region.
These issues may have a transboundary character, which requires the definition of mechanisms for regional cooperation to deal with common environmental threats and to take into account the spillover effects of economic activities. With more than 150 major transboundary rivers, over 100 transboundary groundwater aquifers and around 30 international lakes in the region their reasonable and equitable use remains a major challenge and interstate distribution of water has to be particularly addressed in those countries with arid or semi-arid climate. There is a need for drafting agreements and setting up of joint bodies where they do not yet exist and the strengthening of existing international commissions. Capacity building on legal and regulatory instruments, joint institutions, monitoring and assessment, public participation in transboundary water management and planning of measures is a further necessity.
Policy options for consideration:
Overall directions■ Strengthening institutions, including the programming, monitoring and enforcing functions of the
environmental public agencies, in cooperation with line Ministries such as Agriculture, Energy, Industry and Transport.
■ Making appropriate budgetary allocations for financing the measures taken for achieving the environmental objectives defined in national plans.
■ Protecting poor households from the impact of efficiency increasing measures that result in price increases of such public utilities as water and energy; this might include the provision of tax exemptions or subsidies.
■ Strengthening regional cooperation on problems of a transboundary nature.
Sustainable energy ■ Enhancing specific policy reforms for energy efficiency and renewable energy developments;
■ International agencies could strengthen their efforts to: (i) facilitate access to finance for energy efficiency and renewable energy by supporting the creation of ad hoc investment funds for public–private partnerships (PPPs); (ii) support the public and private sector experts at the national and local level in developing their skills to identify, design and submit bankable projects in this area.
■ At all levels, governments should integrate energy efficiency considerations into sectoral policy decision- making and most notably in the energy intensive sectors; they should stimulate the private sector to incorporate also such considerations in their own decision making.

38
Environmental resources■ Giving greater emphasis to the protection and sustainable use of water-related ecosystems, such as
forests and wetlands, which are important suppliers of water and food. Possible policy actions include the promotion of good practice of protecting and using ecosystems by means of innovative economic tools, such as payments for environmental services. Linking social and economic development to the protection of ecosystems should be an additional aim;
■ Integrated water resources management and planning could be further promoted as a tool to integrate water supply and use with the management of waste and sewage;
■ Plans and effective measures to protect the water basin’s ecosystems could be adopted in order to safeguard water quality and to prevent contamination;
■ Priority might be given to the development and implementation of comprehensive groundwater protection policies that are not limited to water-production areas. The preservation of the quality of unpolluted aquifers, preventive measures at pollution sources, and the restoration of aquifers, rather than their abandonment in areas with limited alternative water resources, is a further necessity;
■ A region-wide framework for flood prevention, protection and mitigation could be drawn up. It should lay down good practices; stipulate action for policymakers, governmental authorities and municipal and local authorities; and provide for training of local and national authorities as well as joint bodies responsible for transboundary water cooperation.


E C O N O M I C C O M M I S S I O N F O R E U R O P E


43REGIONAL POLICIES AND PROVISION OF REGIONAL PUBLIC GOODS
CHAPTER 3
Regional Policies and Provision of Regional Public Goods
The successful achievement of MDGs 1 to 7 depends primarily on the efforts of each nation. However, a supportive environment, both at the global and regional level, also plays a crucial role in such achievement. As far as the regional context is concerned, a clear link can be established between some of the policy areas covered by the MDGs and issues of a transboundary nature. These issues, if adequately addressed through regional policies and the provision of regional public goods, should significantly contribute to the attainment of the MDGs concerned. This is particularly the case in three fields where regional and transboundary dimensions are decisive and where the UNECE is actively involved in, namely, environment, transport infrastructure and trade facilitation infrastructure.
Management of transboundary waters and water pollution control: a contribution to MDG 4 and 7
The availability of safe water and its sound management play an important role in reversing the loss of environmental resources (MDG7, target 9), in increasing the proportion of the population with sustainable access to safe drinking water and improved sanitation (MDG 7, target 10), and, through improving the health environment, in reducing child mortality (Goal 4).
Concerning MDG 7, target 9, the UNECE is highly involved in the management of transboundary water resources. The latter constitute a very large share of all water sources in the UNECE region and amount to more than 150 major transboundary rivers, over 100 transboundary groundwater aquifers and around 30 international lakes. As a major regional public good in the environmental field, these water resources can contribute significantly to the solution of some outstanding problems, for instance, those created by a situation where 31 per cent of Europe’s population lives in areas of high water stress and where the risk of pollution and overexploitation of resources for irrigation and drinking water is very high. Against this background, the challenge is to ensure that these transboundary water resources are shared and used in a reasonable and equitable way, and that they are protected from different types of pollution. This is precisely the objective of the specific actions conducted under two major policy tools developed in this area: the 1992 UNECE Convention on the Protection and Use of Transboundary Watercourses and International Lakes (Water Convention) and the EU Water Initiative where the UNECE is the lead organization for the section related to countries in Eastern Europe, the Caucasus and Central Asia (EECCA). All actions developed within these frameworks aim to implement measures for: better demand management; rational use of water for the enhancement of water productivity; and fair access to water. In addition to providing support for the effective implementation of these measures, and in order to extend their adoption to a large number of countries within the region, the UNECE actively promotes, as a priority, the ratification of the 1992 Convention by those countries in Central Asia, the Caucasus and South-East Europe that have not yet done so.

44
The protection of water-related ecosystems, such as forests and wetlands, can result in an important source of water supply. In this area, the UNECE is leading a joint initiative together with the Food and Agriculture Organization of the United Nations (FAO) and the secretariat of the Ramsar Convention on Wetlands. Floods have become a major and very costly problem of water quantity management in Europe. To address this problem the UNECE is developing support measures (legal, soft-law, capacity building) on sustainable flood prevention.
Furthermore, in partnership with ESCWA, the Economic Commission for Africa (ECA), FAO and UNESCO, the UNECE is part of the inter-regional cooperation for the protection and sustainable use of transboundary groundwaters, a priority issue related to MDG 7, target 9.
Concerning MDG 7 (target 10) and MDG 4, it should be noted that in the mid-1990s, the number of people in Europe affected by unsafe drinking water and lack of adequate sanitation was estimated at 120 million, or one person in seven of Europe’s population. This situation has led to health problems, particularly affecting children, in rural areas and urban areas where poor households live in unsafe and degraded housing settlements. The UNECE addresses these problems through its work under the UNECE-WHO/EURO Protocol on Water and Health to the above-mentioned UNECE Water Convention. It promotes the ratification and full implementation of this legally-binding instrument and includes a system that aims to monitor progress made in the improvement of access to safe drinking water and sanitation in countries that are Parties to the Convention. With the work plan established under the Protocol, actions are also being undertaken to promote at all appropriate levels, nationally as well as in transboundary and international contexts, the protection of human health, with two main targets for action: improving water management, including the protection of water ecosystems; and preventing, controlling and reducing water related disease. Actually, in Europe, 5.3 per cent of all deaths and 3.5 per cent of all DALYs18 in children of 0-14 years of age are caused by unsafe water and inadaquate sanitation.
In addition to the work under the Protocol, the UNECE is involved in the implementation of the Children’s Environment and Health Action Plan for Europe (CEHAPE), that was adopted by the European Conference of Ministers of Health and Environment under the auspices of WHO/EURO. This Action Plan calls for the improvement of access to safe and affordable water and for adequate sanitation for all children.
Development of transport infrastructure: a contribution to MDG 1 and MDG 8, target 14
As mentioned in Part II above, an extended transport infrastructure is a key factor for trade expansion and for access to job opportunities. It contributes to poverty reduction (MDG 1), and is directly related to MDG 8, target 14, which aims to address the particular needs of landlocked countries.
The development of a region-wide transport infrastructure network can therefore be considered as a regional public good that needs to be further extended and improved in order to be made accessible to all countries and populations in the UNECE region. The UNECE is a major contributor to such developments, in particular through its four main legally binding infrastructure agreements that focus on the coordinated development of road, rail, combined transport, and inland waterways. In addition to the promotion of these agreements for the whole region, the UNECE also promotes subregional cooperation with a special emphasis on Central, Eastern and South-Eastern Europe on the one hand, and the Euro-Asian link on the other.
In connection with this development, two major initiatives have been established under the aegis of the UNECE: the Trans-European North-South Motorway (TEM) Project and the Trans-European Railway (TER) Project. The elaboration of both projects’ Master Plans has recently been undertaken, including the identification of backbone networks for road and rail transport in 21 Central, Eastern and South-Eastern European countries as well as a realistic investment strategy to gradually develop these networks through the evaluation and prioritization of as many as 491 projects, with an aggregate estimated cost of € 101 billion. Monitoring the implementation of the TEM and TER Master Plans will be among the main objectives of future Projects.
18 Disability-adjusted Live Year: one DALY represents a lost year of healthy life.

45REGIONAL POLICIES AND PROVISION OF REGIONAL PUBLIC GOODS
Concerning the development of the Euro-Asian transport links (EATL), the UNECE is taking up their planning and development in close cooperation with the UN Regional Commission for Asia and the Pacific (UNESCAP). Eighteen countries from Eastern and South-Eastern Europe, the Caucasus, Central Asia as well as China and Iran benefit from this initiative. Main achievements include the agreement on main road and rail transport routes connecting Europe and Asia; the identification of main transshipment points along the routes; and the identification of priority projects along selected routes. Identifying border crossing obstacles and removing them through the implementation of relevant international agreements and conventions and through formulating national action plans are also focuses of the project, which is expected to be completed by 2006.
In addition, the UNECE and UNESCAP share a specific focus on Central Asian countries through their support for the Working Group on Transport and Border Crossing Facilitation of the UN Special Programme for the Economies of Central Asia (SPECA), established in 1998 within the framework of the SPECA Tashkent Declaration. Both regional commissions offer technical and backstopping support to the Working Group. The main achievements of this undertaking include:
■ The formulation of the SPECA road and rail networks;
■ The establishment of national transport facilitation committees/commissions;
■ Accession to and implementation of international conventions recommended by the Group;
■ The establishment of databases on international routes, major investment projects, and border crossing problems;
■ The analysis of major selected routes within the SPECA region using the UNESCAP time/cost methodology; and
■ Bilateral consultations between SPECA members on border-crossing issues.
The work presented above now has a global outreach through the participation of the UNECE in the implementation of the Almaty Programme of Action, adopted at the International Ministerial Conference of Landlocked and Transit Developing Countries and Donor Countries and International Financial and Development Institutions on Transit Transport Cooperation (Almaty, 28-29 August 2003). This Programme calls upon landlocked and transit developing countries to accede to and implement relevant international Agreements and Conventions on transport. In response, the UNECE has selected 17 of its international UNECE agreements and conventions that are the most relevant to the landlocked and transit developing countries and are directly linked with MDG 8, target 14 and the Almaty Programme of Action. These agreements, open to all UN member States beyond the UNECE region, aim to improve traffic safety, to increase traffic and transport efficiency, including simplification and harmonization of border procedures, and to reduce the environmental impacts of transport. Landlocked and transit developing countries have been encouraged to accede to and implement these major international conventions and agreements on transit transport on the occasion of a special event jointly convened by the Office of the High Representative for the Least Developed Countries, Landlocked Developing Countries and Small Island Developing States (UN-OHRLLS), the UN Office of Legal Affairs and the UNECE. The event took place in New York in July 2004 and gathered a large number of representatives from these countries.
Finally and along the same lines, the UNECE is constantly assisting its member countries, particularly landlocked and transit developing countries with economies in transition, in the accession to and implementation of UNECE legal instruments on transport through the provision of advisory services, and through the organization of and participation in special events, seminars and training courses. Such events were organized in all UNECE sub-regions, including the Caucasus and Central Asia, the Black Sea region and Central and South-Eastern Europe.
46
Development of trade facilitation infrastructure: a contribution to MDG 8, target 12
At a global level, international development and maintenance of a trade facilitation infrastructure is key for the achievement of MDG 8, target 12, namely to provide the framework for an open, rule-based, predictable and non-discriminatory trading environment. Trade facilitation tools and e-business standards that have to be publicly accessible provide significant benefits to both governments and firms through increased efficiency and improved market access. Furthermore, their implementation encourages the participation of less developed economies and small and medium-sized enterprises in the global economy through simplification of the trade transaction process. At the regional level, the objective of such a trade infrastructure is to facilitate and strengthen the economic integration of member States, and especially those with economies in transition, into the European and global economy.
Developing trade facilitation and e-business standards and procedures No single country can deliver in isolation the standards and procedures required for such a complicated
area as trade facilitation. Therefore, international dialogue and consensus building are essential. Further, the creation of global trade facilitation and e-business standards is critical because the development of unique regional or national standards would result ipso facto in technical barriers to trade in the growing area of electronically traded goods and services.
For these reasons the UNECE through its UN Centre for Trade Facilitation and Electronic Business (UN/CEFACT) fulfils the role of consensus builder and standards developer at a global level. This Center is open to participation from all UN Member States, intergovernmental organizations and sectoral and industry associations recognized by the Economic and Social Council of the United Nations (ECOSOC). Global input is achieved by working closely with: international organizations, in particular United Nations Conference for Trade and Development (UNCTAD), the World Bank, the World Customs Organization (WCO), United Nations Industrial Development Organization (UNIDO) and International Organization for Standardization (ISO); and regional organizations such as the other UN regional commissions and the Asia-Pacific Economic Cooperation (APEC).
This is a typical case of the development of an international public good, where over 400 representatives from UN Member States and the business community contribute to UN/CEFACT’s Working Groups for developing trade facilitation and e-business instruments that are available free of charge to all interested parties, in all countries.
Capacity building for regional implementation Because geographical proximity creates higher trading volumes among neighbouring countries and
also because a significant share of traded goods need to transit the territories of one or several countries before reaching their final destination the implementation of trade facilitation is above all a regional issue. This is why, in addition to developing norms and standards at global level, the UNECE is actively engaged in capacity building activities focused on countries with economies in transition. For example, during the first half of 2005, three technical workshops on trade facilitation were organized in Central Asia, in Almaty, Astana, Baku, and Tashkent.
The UNECE also participates in interregional activities, mainly through two projects financed by the UN Development Account. One is on capacity building for trade facilitation and electronic business in the Mediterranean region and is organized by the UNECE in collaboration with the Economic Commission for Africa (ECA) and the Economic and Social Commission for Western Asia (ESCWA). The other is on Trade Facilitation Implementation and is organized jointly by UNECE, ECA, ESCWA, the Economic Commission for Latin America and the Caribbean (ECLAC), and the Economic and Social Commission for Asia and the Pacific (ESCAP), with ECLAC as the lead agency and UNECE as the primary provider of technical expertise in standards.
Awareness raising and support to policymaking

47REGIONAL POLICIES AND PROVISION OF REGIONAL PUBLIC GOODS
The UNECE has also organized a series of high profile international forums on trade facilitation and electronic business in order to raise awareness at policymaker level and to provide countries with an open platform to discuss their views, concerns and aspirations for development in these areas. The most recent forums of this type were organized in 2002, 2003 and 2005. The 2005 Forum on “Paperless Trade in International Supply Chains: Enhancing Efficiency and Security” was organized in collaboration with the other four UN Regional Commissions and resulted in a final document outlining the steps that policymakers need to undertake in order to implement paperless trade within their countries (“A Roadmap Towards Paperless Trade, “ECE/Trade/371). This final document was presented to the Preparatory Committee of the World Summit on Information Society (WSIS) at its meeting in September 2005 in Geneva, and then at the Summit itself in Tunis in November 2005.
Regulatory CooperationThe development and implementation of a system of standards and quality assurance is crucial for
competitiveness and sustained growth as such standards have become an increasingly necessary instrument for successful exporting to regional and international markets.
To support the efforts made by regional organizations for promoting the convergence and consistency of standards, the UNECE has recently developed an “International Model for Technical Harmonization”. The International Model comprises a set of voluntary mechanisms and principles for good regulatory practices to be used by countries wishing to align their regulatory regimes in specific sectors or product areas to international standards. Based on this model, the UNECE supports regulatory convergence in transition economies. For example, the countries of the EECCA region, which faces particular problems in the mutual recognition of national standards, is supported in its preparation of an agreement based on the UNECE’s International Model. This agreement will pave the way for the development of a uniform regulatory framework for a number of products traded among EECCA countries and eventually with other countries.
Similarly, in South-East Europe where there are widely divergent product regulations and standards with only a few mutual recognition agreements, the UNECE has a project for The promotion of good regulatory practices and the elimination of technical obstacles to trade. As part of this project a number of regional meetings and consultations were organized in 2003-2004 that resulted in the identification of national regulatory priorities. This can now form the basis for further regulatory dialogue and model projects for regulatory convergence.
Regional policy framework for the sustainable management of forests: a contribution to MDG 7, target 9
Forest is part of MDG 7, target 9, which calls for the prevention of the loss of environmental resources and for the promotion of their sustainable development. While forest management is a national responsibility, forest programmes at country level must be formulated in a regional perspective that identifies common trends and perspectives, makes regional policy recommendations and can be the basis of more operational sub-regional agreements and strategies.
Along these lines, since the early 1950s the UNECE has been preparing forest sector outlook studies for Europe, which have played a key role in providing a strategic direction for European countries’ forest sector policies. The most recent, published in 2005, includes all of Europe including the Balkans and for the first time includes an outlook study for some EECCA countries (Belarus, the Republic of Moldova, the Russian Federation, and Ukraine). The existence of a regional planning and policy framework resulting from this activity can be considered as a “public good” provided by UNECE and its partners in support of forests, an important environmental resource for the UNECE region.

E C O N O M I C C O M M I S S I O N F O R E U R O P E

50

51REGIONAL POLICIES AND PROVISION OF REGIONAL PUBLIC GOODS
CHAPTER 4
UNECE Support toNational Policies
As demonstrated above, the UNECE promotes regional cooperation and supports the provision of regional public goods of high relevance to the MDGs. In addition, the UNECE organizes activities at regional level from which policymakers can benefit at national level for the shaping of policies and measures aimed at achieving the MDGs. These include policy dialogue and exchange of national experiences that result in: policy options or guidelines; activities focused on individual countries with transition economies such as the assessment of a country’s situation or support to national capacity-building in MDG related areas; and the creation and development of statistical databases that allow for informed decision-making in these areas.
Environmental Performance Reviews (EPR): a contribution to MDG 7, target 9
The Environmental Performance Review (EPR) Programme of the UNECE assesses the progress of its member countries that are not OECD members19 in the reconciling of their environmental and economic objectives and in the meeting of their international commitments in the field of sustainable development. EPRs contain recommendations for improvement in environmental protection that are addressed to the reviewed countries’ governments as the logical conclusion of this assessment. Almost all the countries in the region with economies in transition have been assessed once and most are now being assessed for a second time.
Since the first cycle of reviews (1996-2004), EPRs have always evaluated how countries integrated environmental concerns into their sectoral policies, strategies and programmes (in energy, agriculture, industry, transport and health), and have subsequently made recommendations that were fully in line with the principles of sustainable development. This cycle of EPRs has also reviewed the pattern of use of natural resources (mineral resources and biological resources, including water) by the different sectors of activities, and their protection, conservation and sustainable use. This corresponds exactly to the issues covered by MDG 7, target 9, which are thus systematically addressed for each country, leading to the identification of related measures to be set in motion.
The second cycle of reviews started in 2000 and will be pursued until 2010. The EPRs continue to review progress made in the implementation of environmental policies and of environmental components that are integrated into sectoral policies, as mentioned above. In addition, they go a step further in promoting sustainable development by looking also into the social and economic dimensions of all national policies and strategies when they are linked with environmental concerns. For example, in countries that have developed a strategy and objectives to combat poverty, a more in depth insight is given into the implementation of the environmental components of those objectives, as it was the case for Tajikistan (2004) and the Republic of Moldova (2005), both being among the poorest countries of the region.
19 OECD has developed a parallel programme for its member countries.

52
Support to the Promotion of Sustainable Energy: a contribution to MDG 7, target 9
MDG 7, target 9 covers the issue of energy use as a way to decrease CO² emissions and to contain the consumption of solid fuels. The UNECE Sustainable Energy programme has developed a range of activities on this subject, mainly through its work in three areas: energy efficiency, energy prices and clean coal technology.
Energy efficiencyDuring the last few years, national programmes, together with bilateral and international projects, have
begun to develop the policy reforms and financial engineering skills needed for energy efficiency and renewable energy investments in Eastern Europe. Most importantly, some projects have demonstrated that it is possible to identify, develop and finance energy efficiency and renewable investment projects that will reduce greenhouse gas emissions in Eastern Europe. But they have also shown that this is a time consuming and labour intensive process that needs to become much more fluid and routine for it to succeed on any meaningful scale.
The obstacles that have been addressed by UNECE work in this field together with the institutional inertia and initial policy priorities of economic transition reflect the roots of these problems. More experience would give decision makers the confidence that they still lack to promote energy efficiency and renewable energy investments. Energy managers have the technical skills to select, install and maintain the technology needed but generally they still lack expertise in preparing bankable projects. More importantly, both policymakers and their managers are reluctant to consider such investments without a dedicated source of project finance accompanied by a network of committed international partners to advise and encourage them.
The UNECE Energy Efficiency 21 Project is contributing substantially to addressing these problems by assisting South-Eastern European and EECCA countries to enhance their energy efficiency, reduce fuel poverty caused by economic transition, and meet international environmental treaty obligations under the UNFCCC and the UNECE. It intends to accelerate and broaden the impact of an earlier United Nations Foundation supported project that successfully leveraged financing for energy efficiency investments in Eastern European hospitals, municipal lighting and district heating systems. Indeed, during the last three years the UNECE Energy Efficiency 21 Project capacity building activities have produced 30 pre- feasibility business plans for US$ 60 million of energy efficiency investment project proposals with a total investment requirement of US$ 30 million and, if financed, an estimated reduction of 368,000 tonnes of carbon emissions per year. The World Bank and other investors have approved the financing of US$ 9.7 million for investment projects in Belarus, Bulgaria, the Russian Federation and Ukraine that would amount to an estimated reduction of 49,000 tonnes of carbon emissions per year. This helps illustrate how significant obstacles to the further development of environmental sustainability can be addressed by the UNECE programme of activities in this area.
This programme is also designed to link demonstration investments financed under special conditions in selected Eastern European locations, and an investment fund to be established as vehicle for the participation of private sector investors in partnership with public entities, including current and planned Global Environment Facility (GEF) projects.
The new phase of the project beginning in 2006 will:
(a) Support new and existing dedicated public-private partnership investment funds capable of providing up to US$ 250 million of debt, equity or both to project sponsors;
(b) Develop skills at local level to identify, design and submit bankable projects for financing to the fund managers, reducing transaction costs; including within the implementation of the UNFCCC Kyoto Protocol and voluntary schemes for ‘carbon neutral’ businesses.
(c) Assist municipal and national administrations to introduce institutional and regulatory reforms for a suitable and self-sustaining investment environment.
By triggering other sources of financing, these investment activities could lead to the financing of specific energy efficiency projects for a total value in the order of 1 billion dollars.

53REGIONAL POLICIES AND PROVISION OF REGIONAL PUBLIC GOODS
Reforming Energy Prices
The application of sustainable energy policies in the UNECE region will require reforms to energy prices and tariff structures, especially in countries with economies in transition. The widespread application of energy efficiency measures and deployment of renewable energy technologies calls for energy prices that are high enough to reflect energy production costs. In addition, the subsidies long used to promote indigenous energy production and to meet the social objective of providing low cost energy can also create market distortions and often fail to meet their intended objectives. The UNECE has provided assistance to member governments through its ‘Guidelines on Reforming Energy Prices and Subsidies’ prepared jointly by the UNECE Committee on Environmental Policy and the Committee on Sustainable Energy and subsequently endorsed by the fifth Ministerial Conference of Environment for Europe in Kiev (Ukraine) in May 2003.
Clean Coal Technology
Reducing greenhouse gas (GHG) emissions through the introduction of clean coal technology is a key UNECE activity in its work on the economic, social and environmental dimensions of coal in the economies of the EECCA region. Coal is expected to remain the dominant fuel for electricity generation in the world as a whole, and in particular in many Central and Eastern European countries, for a considerable time in the future. However, this opportunity for coal will depend on its ability to remain a competitive source of energy in terms of both environmental viability/acceptability and security of supply. As part of its programme on Clean Coal Technology, the UNECE launched a new project in 2004 on Coal Mine Methane in Central Europe and Eastern Europe and the CIS with extra-budgetary support from the US Environment Protection Agency (US EPA) and the United Nations Foundation. It is designed to find cost-effective self-financing methods of collecting methane - a greenhouse gas that is emitted from coal mines, landfills and the petroleum industry - and to sell it to local electric power and natural gas markets. In addition, a UNECE project on Capacity Building for Air Quality Management and the Application of Clean Coal Technologies in Central Asia (CAPACT) was launched in 2005 with funding from the UN Development Account as an inter-sectoral project between the Committee on Sustainable Energy and the Committee on Environmental Policy. It is designed to strengthen the capacity of air quality management institutions to be able to implement the UNECE Convention on Long Range Transboundary Air Pollution. It will provide assistance to participating governments on energy pricing policy reforms and promote clean coal technologies project finance.
National Capacity Building for Trade Development: a contribution to MDG 8, target 12 and 14
The UNECE Trade Development programme supports the implementation of MDG 8 (“Develop a global partnership for development”), and in particular two of the targets related to this Goal: develop further an open trading system that is rule-based, predictable and non-discriminatory”(target 12), and address the special needs of landlocked countries (target 14).
It does this by supporting policy-makers in their decision-making so that they can take informed decisions related to these targets, and by complementing such advice with capacity building activities. UNECE support takes different forms as follows:
■ Providing assistance with the implementation of trade facilitation related norms, standards and best practices. For example, workshops were held in the Republic of Moldova and the Russian Federation in 2004 and in Azerbaijan, Kazakhstan (2 seminars), Ukraine, and Uzbekistan in 2005 to assist with national implementation of standards for trade facilitation, including 8 in the case of the Republic of Moldova) commercial quality standards for agricultural products;
■ Preparing documentation that offer guidelines and policy advice to member States on trade related issues falling in the UNECE sphere of competence. For example, documents are being prepared on: “Building Trade Partnerships in the EECCA Region», which covers landlocked countries of Central Asia; and “UNECE instruments to address trade facilitation in the WTO Doha Work Programme”;

54
■ Assisting countries in addressing trade facilitation issues in the context of the WTO process. Two seminars were organized on these issues: one in 2004 in Bosnia and Herzegovina and one in 2005 in Serbia and Montenegro. These seminars promoted closer cooperation among various governmental agencies involved in the process, as well as between the public and private sectors.
■ Helping countries to examine ways in which regional trade can be improved. In 2004, the UNECE held a major Forum to examine how the enlargement of the European Union could serve as a catalyst for increased regional trade. In addition, a project was implemented in 2004 in Southeast Europe to help these countries to set priorities for regulatory cooperation between one another in support of trade in the sub-region; and
■ Developing regional and international contact networks for national administrations and business communities. Some of these contact networks are established via high-level events on topical issues. Others are based on Internet-based networks, such as the “Multiplier Point Network”. These are private or public organizations involved in trade, industry or enterprise development in countries in transition, which become national or regional focal points and allow the UNECE to reach out to national administrations and business communities on issues related to trade.
Support to national policies in the forest sector: a contribution to MDG 1, Target 1, and MDG 7, target 9
The UNECE work on sustainable management of forest is directly related to MDG 7 but also to MDG 1 because in many countries with economies in transition, poverty reduction strategies should include a component on populations living in forest areas. It thus appears that poverty reduction strategies combined with national forest programmes can maximize the contribution of the forest sector to these two MDGs and their related targets at national level. Along these lines, the UNECE provides assistance to national policies in a number of different ways:
■ By providing opportunities for policy dialogue and exchange of national experiences. This can be at annual sessions of the UNECE Timber Committee which addresses policy issues such as wood and energy or long term challenges of the forest sector; or at specialized workshops and seminars such as the two workshops in 2005 on the implementation of policy recommendations from the European forest sector outlook study;
■ By organizing capacity building activities like the workshops that have been held on transition issues in the forest sector and on the marketing of forest products.
■ By developing and maintaining statistical databases. For instance, on production, trade and prices of forest products, which are essential for developing a commercial timber sector, and on forest resources, notably to measure a country’s performance in the achievement of sustainable forest management through the use of internationally agreed indicators.
The terms and definitions used in the above mentioned statistical and indicator work provide a type of public good in the form of de facto norms and standards for national information systems, as countries which do not yet have an effective national forest information system will naturally adopt the very widely accepted international standards created under the auspices of UNECE, FAO and the Ministerial Conference on Forest in Europe (MCPFE).
Country support for sustainable human settlements and social housing: a contribution to MDG 1, target 1, and MDG 7, targets 10 and 11
As an overall policy framework for its future activities, the UNECE Committee on Human Settlements, which met at the Ministerial level in September 2000, adopted the UNECE Strategy for Sustainable Quality of Life in Human Settlements in the 21st Century. The Strategy integrates the principles of sustainable development into human settlements policies and guides the Committee to define priority areas to be addressed through a
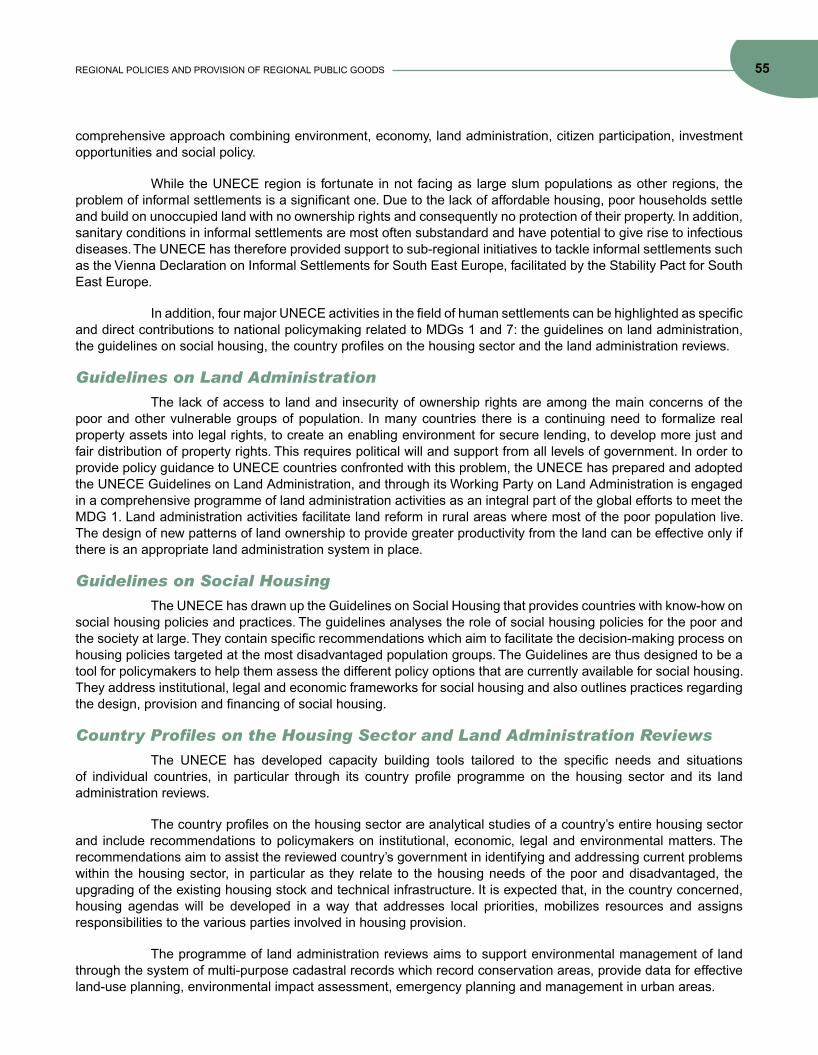
55REGIONAL POLICIES AND PROVISION OF REGIONAL PUBLIC GOODS
comprehensive approach combining environment, economy, land administration, citizen participation, investment opportunities and social policy.
While the UNECE region is fortunate in not facing as large slum populations as other regions, the problem of informal settlements is a significant one. Due to the lack of affordable housing, poor households settle and build on unoccupied land with no ownership rights and consequently no protection of their property. In addition, sanitary conditions in informal settlements are most often substandard and have potential to give rise to infectious diseases. The UNECE has therefore provided support to sub-regional initiatives to tackle informal settlements such as the Vienna Declaration on Informal Settlements for South East Europe, facilitated by the Stability Pact for South East Europe.
In addition, four major UNECE activities in the field of human settlements can be highlighted as specific and direct contributions to national policymaking related to MDGs 1 and 7: the guidelines on land administration, the guidelines on social housing, the country profiles on the housing sector and the land administration reviews.
Guidelines on Land Administration
The lack of access to land and insecurity of ownership rights are among the main concerns of the poor and other vulnerable groups of population. In many countries there is a continuing need to formalize real property assets into legal rights, to create an enabling environment for secure lending, to develop more just and fair distribution of property rights. This requires political will and support from all levels of government. In order to provide policy guidance to UNECE countries confronted with this problem, the UNECE has prepared and adopted the UNECE Guidelines on Land Administration, and through its Working Party on Land Administration is engaged in a comprehensive programme of land administration activities as an integral part of the global efforts to meet the MDG 1. Land administration activities facilitate land reform in rural areas where most of the poor population live. The design of new patterns of land ownership to provide greater productivity from the land can be effective only if there is an appropriate land administration system in place.
Guidelines on Social Housing
The UNECE has drawn up the Guidelines on Social Housing that provides countries with know-how on social housing policies and practices. The guidelines analyses the role of social housing policies for the poor and the society at large. They contain specific recommendations which aim to facilitate the decision-making process on housing policies targeted at the most disadvantaged population groups. The Guidelines are thus designed to be a tool for policymakers to help them assess the different policy options that are currently available for social housing. They address institutional, legal and economic frameworks for social housing and also outlines practices regarding the design, provision and financing of social housing.
Country Profiles on the Housing Sector and Land Administration Reviews
The UNECE has developed capacity building tools tailored to the specific needs and situations of individual countries, in particular through its country profile programme on the housing sector and its land administration reviews.
The country profiles on the housing sector are analytical studies of a country’s entire housing sector and include recommendations to policymakers on institutional, economic, legal and environmental matters. The recommendations aim to assist the reviewed country’s government in identifying and addressing current problems within the housing sector, in particular as they relate to the housing needs of the poor and disadvantaged, the upgrading of the existing housing stock and technical infrastructure. It is expected that, in the country concerned, housing agendas will be developed in a way that addresses local priorities, mobilizes resources and assigns responsibilities to the various parties involved in housing provision.
The programme of land administration reviews aims to support environmental management of land through the system of multi-purpose cadastral records which record conservation areas, provide data for effective land-use planning, environmental impact assessment, emergency planning and management in urban areas.

56
Mainstreaming gender into economic policies: a contribution to MDG 3 and MDG 1, target 1
The UNECE has engaged in a number of activities which supports both the implementation of MDG 3 on gender equality and empowerment of women, and MDG 1 on poverty reduction. The main thrust of these activities is to promote gender mainstreaming into economic policies. While gender is traditionally addressed through social policies, economic policies have a major impact on gender equality. This can be observed in particular during the transition process where the lack of a gender perspective in the redistribution of assets, changes in labour market institutions and welfare cuts result in feminization of poverty in many countries of the EECCA region, especially in Central Asia and the Caucasus. Raising awareness of economic policymakers that gender should be an integral part of budgetary and fiscal policies, employment and SMEs policies or pension reforms is thus essential to reduce pre-existing inequalities in the short run and provide incentives to reduce gender inequalities in the longer run. Further, it can substantially contribute to reducing extreme poverty and making full use of women’s economic potential for achieving sustainable development.
Along this line, the UNECE provides assistance to national policies through:
■ Providing a forum for a regional dialogue: this was done in particular on the occasion of the preparation of the Beijing Conference (Vienna 1994) and then for the implementation of the Beijing Platform for Action: Beijing +5 (Geneva, 2000) and Beijing +10 (Geneva, 2004). The outcome of these two major reviews took the form of agreed conclusions and recommendations for further action (E/ECE/RW.2/2000/7 and ECE/AC.28/2004/3).
■ Undertaking capacity building activities and promoting networks between line ministries, national gender machineries and NGOs through activities such as the Regional Symposium on Mainstreaming Gender into Economic Policies (Geneva, 2004), where all the represented stakeholders discussed the following issues: improved access of women to assets and employability, engendering national budgets and social security reforms.
■ Promoting women’s entrepreneurship and raising awareness on gender aspects of SME policies through: (i) the organization of Regional Forums of Women Entrepreneurs (Geneva, 2001 and 2003) and sub-regional workshops; and (ii) the dissemination of good practices in financing women’s businesses and improving their access to ICT.
■ Mainstreaming gender into the process of subregional economic cooperation under the UN Special programme for central Asia (SPECA) through a Working Group on Gender and the Economy, recently established as a follow-up to the SPECA Conference held in Astana (Kazakhstan) in May 2005.
■ Mainstreaming gender into the WSIS process through the organization of regional side-events at the Summit (both in Geneva and Tunis) and through the preparation of recommendations for further action to promote women’s access to ICT.
The role of UNECE in strengthening statistical capacity for monitoring the MDGs in SEE and EECCA countries
Monitoring the MDGs requires the collection of time series covering a wide range of subject areas. Not all countries of the SEE and EECCA regions are able to produce high quality data, on a regular basis, in all these MDG-related areas. Although these countries have inherited a comprehensive system of administrative records able to produce a large number of statistics, the transition from a planned economy to a market economy has affected not only the coverage of these administrative records but also their relevance.
In order to address this major problem, countries with economies in transition have started to move, since the mid 1990s, from a statistical system almost exclusively based on administrative registrations to a more complete one where sample surveys are also used. Household surveys have gradually spread in many of these countries, thus providing analytical and trustworthy data on issues like employment and income/expenditure. On the other hand, the quality of administrative data has in many cases deteriorated because of falling coverage and inaccurate reporting.

57REGIONAL POLICIES AND PROVISION OF REGIONAL PUBLIC GOODS
Population censuses have been held in most countries of the region, but financial and/or political problems led to their cancellation/postponement in a few countries. In addition, some of them, as well as some household surveys, do not cover the entire territory. This is particularly the case of countries where certain parts of the territory are not under the control of the government, such as Transnistria for the Republic of Moldova, and Abkhazia and South Ossetia for Georgia. Kosovo has also been left out in the 2000 round of censuses.
Against this background, the UNECE statistical work which is particularly relevant for monitoring the MDGs consists of:
■ The support to the implementation of Population and Housing Censuses in countries with transition economies. The population and housing census provides data that are fundamental for many of the indicators used to monitor MDGs. Through the census the calculation of population numbers can be accurately used as denominator for rates and ratios. In addition the census provides information related to education, employment and living conditions: it can therefore be a useful source (and indeed the only source in some countries) for constructing indicators on key MDG indicators such as participation in education, employment and unemployment, access to housing, water and sanitation, and availability of IT (computer and internet). In partnership with Eurostat and the Council of Europe, the UNECE continues to provide independent monitoring of the census operations for countries that ask for it20. The monitoring looks into the technical and procedural aspects of census-taking and has been particularly important in countries where the population distribution among territorial and ethnical groups is a sensitive issue.
■ Gender statistics programme. With a view of improving quality, availability, and use of gender-related statistics in the region, the UNECE has developed, in cooperation with the UNDP Regional Centre in Bratislava, a website and a database on gender statistics. These tools provide a framework for the collection and dissemination of data related to the MDG 3 (gender equality) and they help to establish a better use of gender-related data. Furthermore, in partnership with UNDP, UNFPA, US Census Bureau/USAID, and the World Bank Institute, the UNECE continues to provide technical support to transition economies in the area of gender statistics. Several regional and sub-regional workshops have been organized21 and other activities are at the planning stage. In 2003 and 2004, the UNECE and the UNDP Bratislava Regional Centre jointly carried out an assessment on the availability and quality of gender statistics in EECCA and SEE countries22.
■ UNDP-funded project on Building Capacity and Statistical Literacy for MDG Monitoring. In 2006, the UNECE, in collaboration with UNICEF, is undertaking a UNDP-funded project on capacity building which aims to increase the accessibility and use of statistics for monitoring the MDGs in selected countries from the SEE and EECCA regions, starting with Kazakhstan, Georgia and The former Yugoslav Republic of Macedonia. Two types of activities are being developed: one type targets the producers of statistics in order to improve the collection of MDG-related data and establish a central repository of these data at the national level, to be maintained and regularly updated; the other type of activities will target the users of these statistics (government officials, researchers, civil society) in order to increase their capacity to develop an evidenced-based management of MDG- related policies in the fields of monitoring, evaluation, advocacy and decision-making. Based on the experience gained in the three above-mentioned countries, the project may be extended to some other SEE and EECCA countries at a subsequent stage.
20The joint Eurostat-Council of Europe-ECE Census Monitoring was carried out for the last census in The former Yugoslav Republic of Macedonia and the Republic of Moldova. Other SEE countries are approaching the three organizations to monitor their forthcoming censuses.
21In 2004 a workshop on gender statistics for Central Asian countries was carried out in Turkmenistan (see documents at http://www.unece.org/stats/documents/2004.07.gender.htm), and a workshop on gender statistics for transition countries was carried out in Geneva back-to-back to the UNECE Work Session on gender statistics (see documents at http://www.unece.org/stats/documents/2004.10.gender.htm). A regional workshop on gender statistics was also organized in July 2005 in Uzbekistan (http://www.unece.org/stats/documents/2005.07.gender.htm).
22See the Report on the Status of Official Statistics related to Gender Equality in Eastern Europe and the EECCA countries by UNECE Statistical Division and UNDP Bratislava Regional Center (http://www.unece.org/stats/documents/2004.10.gender.htm).


Goal 1 : Eradicate extreme poverty and hungerTarget 1 : Halve, between 1990 and 2015, the proportion of people whose income is less than $1 a day.Target 2 : Halve, between 1990 and 2015, the proportion of people who suffer from hunger.
Goal 2: Achieve universal primary education.Target 3 : Ensure that, by 2015, children everywhere, boys and girls alike, will be able to complete a full course of primary schooling.
Goal 3 : Promoting gender equality and empower womenTarget 4 : Eliminate gender disparity in primary and secondary education, preferably by 2005, and in all levels of education no later than 2015.
Goal 4 : Reduce child mortality.Target 5 : Reduce by two-thirds, between 1990 and 2015, the under-five mortality rate.
Goal 5 : Improve maternal health.Target 6 : Reduce by three-quarters, between 1990 and 2015, the maternal mortality ratio.
Goal 6 : Combat HIV/AIDS, malaria, and other diseases.Target 7 : Have halted by 2015 and begun to reverse the spread of HIV/AIDS.Target 8 : Have halted by 2015 and begun to reverse the incidence of malaria and other major diseases.
Goal 7 : Ensure environmental sustainability.Target 9 : Integrate the principles of sustainable development into country policies and programmes and reverse the loss of environmental resources.Target 10 : Halve, by 2015, the proportion of people without sustainable access to safe drinking water and basic sanitation.Target 11 : Have achieved by 2020 a significant improvement in the lives of at least 100 slum dwellers.
Goal 8 : Develop a global partnership for developmentTarget 12 : Develop further an open, rule-based, predictable, non-discriminatory trading and financial system.Target 13 : Address the special needs of the Least Developed Countries.Target 14 : Address the special needs of landlocked developing countries and small island developing states.Target 15 : Deal comprehensively with the debt problems of developing countries through national and international measures in order to make debt sustainable in the long-term.Target 16 : In cooperation with developing countries, develop and implement strategies for decent and productive work for youth.Target 17 : In cooperation with pharmaceutical companies, provide access to affordable essential drugs in developing countries.Target 18 : In cooperation with the private sector, make available the benefits of new technologies, especially information and communication technologies.
Annex I
MillenniumDevelopment Goalsand Targets

60
ANNEX II
STATISTICAL APPENDIX
Table 1.AShare of population living below national poverty line, measures of extreme poverty a
Countries Year % Year % Year % Definition of poverty line Sources
South Eastern Europe
Albania 2002 25.4
Level of per-capita expenditure below a minimum level necessary to meet the basic food and non food needs (cost-of-basic-needs-methodology
NSO
Serbia and
Montenegro b2002 10.6 2003 10.5
Minimum consumer food basket (2,288 calories) plus other non-food expenses
Poverty Reduction Strategy Paper for
Serbia
Turkey 2000 2.0 2002 1.3 2003 1.3The cost of the food basket that would allow an individual to receive a minimum of 2,100 calories
NSO
Eastern Europe
Armenia 1999 27.2 2000 24.0 Families in system of family allowance National MDG report
Azerbaijan 2002 8.0 2003 9.6Income less than 124137 AZM, which is the value of the minimum food basket
National MDG report
Belarus 1995 38.4 1997 32.1 2002 30.5Incomes below minimum subsistence level
National Human Dev. Report
Georgia 2000 14.3 2001 13.8 2003 16.6Extreme poverty threshold is monthly GEL58-63 per adult equivalent to a working-age male.
National MDG report
Republic of Moldova 1997 33.3 2001 41.8 2002 33.0
US PPP 2.15 a day. This is the closest value of USPPP 2.82 a day which corresponds to the extreme povertyLine of 212 MDL per month as used officially by the government
National MDG Report
Russian Federation 1997 20.7 2000 28.9 2004 17.8
Cost value of consumer basket of goods, which includes the minimal set of foods and services necessary to support the health of the individual and ensure his vital activity, as well as his compulsory payments and duties
NSO
Ukraine 2001 14.9 2002 13.7 Not defined National MDG Report

61ANNEX II
Countries Year % Year % Year % Definition of poverty line Sources
Central Asia
Kazakhstan 1997 12.7 1998 16.2 2001 11.3Incomes below food basket cost
National MDG report
Kyrgyzstan 1996 19.1 1999 23.3 2001 13.5 Not definedNational MDG report
Tajikistan 1999 33.0
50% of the State Statistical Committee’s poverty line (10,000 Tajik roubles per month)
National MDG report
Uzbekistan 2001 27.5 2003 26.2Households percentage with an average per capita income less than one minimum wage
Welfare Improv. Strategy Paper for 2005-2010 - Interim PRSP Document 2005
North America
Canada 1995 19.7 2002 11.6 2003 11.5Proportion of people living below the low income cutoffs within a given group.
NSO
United States 1996 13.7 2002 12.1 2003 12,5
Poverty threshold calculated on the basis of the US Department of Agricultural food budgets designed for families under economic stress and data about what portion of their income families spend on food.
US Census Bureau
Table 1.A (Concluded)Share of population living below national poverty line, measures of extreme poverty a
Source: As indicated in the last column of table.a The data are not comparable across countries since different methodologies have been used to define poverty lines. The data can be used to assess the trends in poverty for each single country since the concepts are comparable over time within the same countryb Data refer to Serbia only

62
Countries Year % Year % Year % Definition of poverty line Sources
New EU Member States
Cyprus 1997 16.0 2003 15.0
Share of persons with an equivalized disposable income below the risk-of-poverty threshold, which is set at 60% of the national median equivalized disposable income (after social transfers)
Eurostat
Czech Republic 2001 8.0 2003 8.0 2004 8.0 * Eurostat, 2004:NSO
Estonia 2000 18.0 2002 18.0 2003 18.0 * Eurostat
Hungary 2000 11.0 2001 11.0 2002 10.0 * Eurostat
Latvia 1999 16.0 2000 16.0 2002 16.0 * Eurostat
Lithuania 2000 17.0 2001 17.0 2002 17.0 * Eurostat
Malta 2000 15.0 n.a. n.a. *
Poland 2000 16.0 2001 16.0 2002 17.0 * Eurostat
Slovenia 2000 11.0 2001 11.0 2002 10.0 * Eurostat
Slovakia 2003 21.0 *
EU 15Austria 1999 12.0 2001 12.0 2003 13.0 * Eurostat
Belgium 1996 17.0 1999 13.0 2003 15.0 * Eurostat
Denmark 1997 10.0 2001 10.0 2003 12.0 * Eurostat
France 1996 16.0 2000 16.0 2002 12.0 * Eurostat
Finland 1998 9.0 2002 11.0 2003 11.0 * Eurostat
Germany 1999 11.0 2002 15.0 2003 15.0 * Eurostat
Greece 1999 21.0 2001 20.0 2003 21.0 * Eurostat
Luxembourg 1999 13.0 2001 12.0 2003 10.0 * Eurostat
Ireland 1999 19.0 2001 21.0 2003 21.0 * Eurostat
Italy 1999 18.0 2000 18.0 2001 19.0 * Eurostat
Portugal 1999 21.0 2002 20.0 2003 19.0 * Eurostat
Spain 1999 19.0 2002 19.0 2003 19.0 * Eurostat
Sweden 1999 8.0 2001 9.0 2002 11.0 * Eurostat
The Netherlands 1999 11.0 2001 12.0 2002 12.0 * Eurostat
United Kingdom 1999 19.0 2002 18.0 2003 18.0 * Eurostat
Other countriesBulgaria 2000 14.0 2001 16.0 2002 13.0 * Eurostat
Croatia 2001 17.2 2002 18.2 2003 16.9 * NSO
The FYR of Macedonia 2002 30.2 2003 30.2 70 per cent of median equivalent expenditures NSO
Norway 1996 12.0 1999 11.1 2003 11.4 * NSO
Romania 2000 17.0 2001 17.0 2002 18.0 * Eurostat
Source: As indicated in the last column of table.Note: * Same as Cyprus
Table 1.BShare of population living below national poverty line, measures of relative poverty

63ANNEX II
Country Total Female Male1995 2000 2004 1995 2000 2004 1995 2000 2004
EU 15Austria 4.3 3.5 4.9 4.9 3.9 5.5 3.9 3.3 4.6
Belgium 9.3 7.0 8.4 12.2 8.7 9.5 7.3 5.8 7.5
Denmark 7.0 4.6 5.5 8.6 5.2 6.0 5.6 4.1 5.1
Finland 17.0 9.8 8.8 16.2 10.6 8.9 17.8 9.1 8.8
France 11.8 10.2 9.2 14.1 12.2 10.2 10.0 8.5 8.3
Germany 8.2 7.9 10.7 9.6 8.3 10.1 7.1 7.6 11.3
Greece 9.1 11.4 10.5 13.8 17.2 16.2 6.2 7.5 6.6
Ireland 12.0 4.3 4.5 12.1 4.3 4.1 11.9 4.4 4.9
Italy 11.7 10.6 8.1 16.1 14.5 10.5 9.1 8.2 6.4
Luxembourg 2.9 2.3 4.8 4.4 3.1 6.9 2.1 1.8 3.3
Netherlands 7.2 3.0 4.6 8.7 3.8 4.9 6.1 2.3 4.3
Portugal 7.1 4.0 6.7 7.8 5.0 7.6 6.5 3.3 5.9
Spain 22.7 13.9 11.0 30.5 20.5 15.0 17.9 9.6 8.2
Sweden 8.9 5.5 6.5 7.9 5.0 6.1 9.8 5.9 6.9
United Kingdom 8.7 5.6 4.7 6.9 5.0 4.2 10.1 6.0 5.1
New EU member statesCyprusa 2.6 5.0 4.7 3.7 7.3 6.2 1.9 3.2 3.5
Czech Republic 4.0 8.9 8.3 4.8 10.5 9.9 3.4 7.5 7.1
Estonia 9.7 13.6 9.7 8.9 12.7 8.9 10.5 14.5 10.4
Hungary 10.3 6.4 6.1 8.7 5.7 6.1 11.6 7.1 6.1
Latvia 20.2 b 14.3 10.4 19.8 b 13.3 10.2 20.7 b 15.3 10.6
Lithuania 14.1 16.4 11.4 13.9 14.0 11.8 14.2 18.8 11.0
Malta ... 6.3 7.2 ... 6.5 9.0 ... 6.2 6.4
Poland 13.3 16.1 19.0 14.7 18.1 19.9 12.1 14.4 18.2
Slovakia 13.1 18.8 18.3 13.8 18.6 19.2 12.6 18.9 17.4
Slovenia 7.4 6.7 6.3 7.0 7.1 6.8 7.7 6.5 5.9
Other developed countriesCanada 9.6 6.8 7.2 9.2 6.7 6.8 9.8 7.0 7.5
Iceland 5.2 1.9 3.0 4.9 2.6 2.9 5.5 1.3 3.1
Israel 6.9 8.8 10.7 c 8.6 9.2 11.3 c 5.6 8.4 10.2 c
Norway 6.3 3.3 4.2 6.3 3.2 3.7 6.3 3.5 4.6
Switzerland 3.3 2.7 4.3 3.9 3.1 4.7 2.9 2.3 3.9
United States 5.6 4.0 5.5 5.6 4.1 5.4 5.6 3.9 5.6
Table 2Unemployment rate by sex, 1995, 2000, 2004

64
a Data refer to the Government controlled area only.b Data refer to 1996.c Data refer to 2003.d Geographical coverage excludes Kosovo and Metohia since 1999.
e Data refer to 1997.f Data refer to registered unemployment, end of year.g Data cover the whole country with the exception of the Transnistria region and the town of Tighina.
Source: UNECE Gender Statistics Database, compiled from national and international (EUROSTAT and ILO) official sources.Note: The unemployment rate date. The unemployed comprise all persons above a specific age who during the reference period were: (a) without work - i.e. were not in paid employment or self-employment; and (b) current work - i.e. had taken specific steps in a specified reference period to seek paid employment or self-employment.
South Eastern European countries Albania 13.1 16.8 14.4 15.0 19.3 17.5 11.7 15.0 12.4
Bosnia andHerzegovina
... 38.7 43.4 ... ... ... ... ... ...
Bulgaria 15.7 16.9 12.1 15.8 16.7 11.5 15.5 17.2 12.6
Croatia ... 16.1 13.8 ... 17.3 15.7 ... 15.0 12.0
Serbia and Montenegrod 13.4 12.6 15.2 c 16.1 15.2 16.4 c 11.3 10.6 14.4 c
The FYR of Macedonia
... ... 37.2 ... ... 37.8 ... ... 36.7
Romania 8.0 7.2 8.1 8.6 6.4 6.9 7.5 7.9 9.1
Turkey 7.5 6.5 10.3 7.3 6.3 9.7 7.6 6.6 10.5
Eastern European and Caucasian countries
Armenia 36.4 e ... 31.6 34.4 e ... 37.6 38.0 e ... 26.6
Azerbaijan ... ... 10.7 c ... ... 12.2 c ... ... 9.6 c
Belarus f 2.5 2.1 2.5 3.1 2.4 3.1 1.9 1.7 1.8
Georgia 7.6 e 10.3 12.6 7.8 e 9.7 11.8 7.4 e 11.0 13.4
Republic of Moldova g ... 8.5 8.1 ... 7.2 6.3 ... 9.7 10.0
Russian Federation 9.5 9.6 7.9 9.2 9.4 8.0 9.7 10.2 7.8
Ukraine 5.6 11.6 8.6 4.9 11.6 8.3 6.3 11.6 8.9
Central Asian countries
Kazakhstan ... 12.8 8.4 ... ... 9.8 ... ... 7.0
Kyrgyzstan ... ... 9.9 c ... ... 10.5 c ... ... 9.4 c
Tajikistan ... 9.3 ... ... 9.6 ... ... 9.0 ...
Uzbekistan f 0.4 0.4 0.3 c 0.5 ... ... 0.3 ... ...
Table 2 (Concluded)
Unemployment rate by sex, 1995, 2000, 2004

65ANNEX II
Country Total Female Male1998/1999
2000/2001
2002/2003
1998/1999
2000/2001
2002/2003
1998/999
2000/2001
2002/2003
New EU member statesCyprus 96 95 96 95 96 96 96 95 96
Czech Republic 90 90 87 91 88 87 90 90 87
Estonia 97* 98 95 96* 95 94 98* 98 95
Hungary 89 90 91 89 90 90 90 90 91
Latvia 91 91 86 91 88 85 92 91 86
Lithuania 95 97 91 94 94 91 95 98 91
Malta 99 98 96 100 97 96 98 98 96
Poland 97 a 98 98 97 a 98 98 97 a 98 98
Slovakia … 89 86 … 88 86 … 89 85
Slovenia 94 93 93 93 93 93 94 94 94
South and Eastern European countriesAlbania 99* 97* 95 99* 97* 94 99* 97* 96
Bulgaria 96 93 90 95 90 90 96 94 91
Croatia 88 88 89 88 88 89 89 89 90
Serbia and Montenegro
96 a* 96 ... 96 a* 96 ... 97 a* 96 ...
The FYR of Macedoniab 99 99 96 98 98 95 99 99 96
Romania 96 93 89 95 88 88 96 93 89
Turkey … 88 c* 86 … 85 c* 84 … 91 c* 89
Eastern European and Caucasian countriesArmenia 85 a* 85 94 85 a* 84 93 85 a* 83 95
Azerbaijan 80* 80* 80 80* 79 79 80* 81* 81
Belarus … 94* 94 … 92* 94* … … 95*
Georgia 98 a* 95 89 98 a* 91 88 98 a* 95 89
Republic of Moldova 78* 79 79 … 78 79 … 80* 79
Russian Federation … ... 90* … … 90* … ... 89*
Ukraine … 81 84 … 81* 84* … ... 84*
Central Asian countriesKazakhstan 84 a* 87 91 85 a* 89 91 84 a* 87 92
Kyrgyzstan 91* 90 89 90 88 88 92 91 91
Tajikistan 94 … ... 91 … ... 97 … ...
Uzbekistand … ... ... … ... 90.5 … ... 90.9
Table 3Net enrolment ratio in primary education by sex 1998/1999, 2000/2001 and 2002/2003
Source: UNESCO Institute for Statistics. Note: net enrolment ratio in primary education is the ratio of the number of children of official school age (as defined by the national education system) who are enrolled in primary school to the total population of children of official school age.a Data refer to 1999/2000.b Data are from NSO of FYROM.c Data refer to 2001/2002.
d Data are from the «Economic Review of Uzbekistan»and refer to 2004.*UNESCO estimation.
66
Country Total Female Male1998/1999
2000/2001
2002/2003
1998/1999
2000/2001
2002/2003
1998/1999
2000/2001
2002/2003
New EU member statesCyprus 88 88 93 90 89 94 86 87 91
Czech Republic … 88* 90 … 89* 92 … 88* 89
Estonia 83 a 84 88 85 a 85 90 82 a 82 87
Hungary 87 a 90 94 87 a 90 94 87 a 90 94
Latvia 85* 89* 88 86* 89* 88 84* 88* 88
Lithuania 91* 93 b 94 91* 93 b 94 90* 93 b 94
Malta … 80* 87 … 80* 88 … 79* 86
Poland … 91 91 … 92 93 … 89 90
Slovakia … 87 b 88 … 87 b 88 … 86 b 88
Slovenia 89 93 b 93 91 93 b 94 88 92 b 93
South and Eastern European countriesAlbania 72* 74 77 73* 75 78 70* 73 76
Bulgaria … ... ... … … ... … … ...
Croatia 83 84* 87 83 84* 86 84 84* 88
Serbia and Montenegro … 90 88 b … 89 88.5 b … 90 87 b
The FYR of Macedoniac 66 70 72 65 69 71 67 71 73
Romania 74* 80 81 75* 81 82 74* 79 79
Turkeyd 38 40 43 b 34 36 39 b 42 44 47 b
Eastern European and Caucasian countriesArmenia 84 a* 84 83 84 a* 87 85 84 a* 82 82
Azerbaijan 74** 74* 76 74** 74* 75 74 75* 77
Belarus … 79* 85 … 82 b* 86* … 78 b* 83*
Georgia 71 59 b* 61 71 59 b* 61 71 59 b* 62
Republic of Moldova 69* 68 69 70 a* 70* 70 67 a* 67* 68
Russian Federation 95 a 96 96 b 96 a 96 96 b 95 a 95 95 b
Ukraine 89 a* 89 85 91 a* 90 85* 88 a* 89 84*
Central Asian countriesKazakhstan 82 a* 83 87 88 a* 82 87 82 a* 84 87
Kyrgyzstane … ... ... … 94 ... … 95 ...
Tajikistan 68 76 83* 64 69 76* 72 82 90*
Turkmenistan … ... ... … ... ... … ... ...
Uzbekistan … ... ... … ... ... … ... ...
Table 4Net enrolment ratio in secondary education by sex, 1998/1999, 20002001 and 2002/2003
Source: UNESCO Institute for Statistics and UNECE Gender Statistics Database.Note: net enrolment ratio in secondary education is the ratio of the number of children of official school age (as defined by the national education system) who are enrolled in secondary school to the total population of children of official school age. a Data refer to 1999/2000. b Data refer to 2001/2002. c Source: National Statistical Office of the fYR of Macedonia. d Source: National Statistical office of Turkey
e Source: MDG Report for Kyrgyzstan 2003. * UNESCO estimation.** National estimation.

67ANNEX II
Country Total Female Male19981999
20002001
19981999
20012002
19981999
20012002
New EU member statesCyprus 22 32 24 28 20 23
Czech Republic 26 36 26 35 26 32
Estonia 51 66 60 80 42 48
Hungary 33 51 37 50 30 39
Latvia 50 73 63 85 38 52
Lithuania 45 72 55 79 36 50
Malta 20 30 21 29 19 20
Poland 46 60 53 69 39 48
Slovakia 26 34 28 34 25 30
Slovenia 53 68 61 78 45 55
South and Eastern European countriesAlbania 15 a 16 18 a ... 11 a ...
Bulgaria 43 39 53 42 35 34
Croatia 32 39 34 39 30 34
Serbia and Montenegro 34 ... 37 ... 31 ...
The FYR of Macedonia 22 27 25 31 19 24
Romania 21 35 22 34 20 27
Turkey … 28 ... 21 ... 29
Eastern European and Caucasian countriesArmenia 25*a 27 27 *a 29 22*a 25
Azerbaijan 16 16 12 15 20 20
Belarus 48 62 55 70 42 51
Georgia 32 38 34 37 30 36
Republic of Moldova 29 30 33 33 26 25
Russian Federation ... 69* ... 80 ... 60
Ukraine 47 62 51 63** 44 54**
Central Asian countriesKazakhstan 24 45 25 43 22 35
Kyrgyzstan 30 42 31 48 30 42
Tajikistan 14 16 7 7 20 22
Uzbekistan ... 16 ... 14* ... 17*
Table 5Gross enrolment ratio in tertiary education by sex, 1998/1999 and 2001/2002
Source: UNESCO Institute for Statistics. Note: Gross enrloment ratio in te population in the five-year age group following on from the secondary school theoretical leaving age. a Data refer to 1999/2000. * UNESCO estimation. ** National estimation.

68
Table 6Gender pay gap, 1995, 2000, 2003
Source: UNECE Gender Statistics Database, compiled from national and international (EUROSTAT) official sources. Note: gender pay gap is the earnings of male paid employee data for other countries relate to monthly or annual earnings.
Country 1995 2000 2003South and Eastern European countries
Albania ... 31 c ...
Bulgaria 29 d 24 19
Romania 21 17 18
Serbia and Montenegroe ... ... 2
The FYR of Macedonia
... 18 18 b
Eastern European and Caucasian countries
Armenia 52 d 48 f 58
Belarus 21 19 20
Georgia ... 44 c 47
Republic of Moldova
... 28
Russian Federation ... ... 36
Ukraine 24 29 31
Central Asian countriesKazakhstan ... 39 39
Kyrgyzstan 27 32 35 b
Tajikistan 35 g 57 ...
Country 1995 2000 2003EU 15
Austria 22 20 17*
Belgium 12 13 12 a
Denmark 15 15 18
Finland ... 17 20
France 13 13 12*
Germany 21 21 23
Greece 17 15 11*
Ireland 20 19 14*
Italy 8 6 6 a
Luxembourg 19 15 15
Netherlands 23 21 18
Portugal 5 8 9
Spain 13 15 18
Sweden 15 18 16
United Kingdon 26 21 22
New EU member statesCyprus 29 26 25
Czech Republic ... 22 19
Estonia 27 25 24
Hungary 22 21 12
Latvia ... 20 16
Lithuania 27 16 17
Malta ... 11 4
Poland ... 12 a 11
Slovenia 14 12 9 b
Slovakia ... 22 23
Other developed countriesCanada 27 30 29
Norway ... 17 16
Switzerland 24 21 21 a
United States 27 26 22
* Break in series. a Data refer to 2001. b Data refer to 2002. c Data refer to 1998.
d Data refer to 1997.e Data refer only to Serbia.f Data refer to 1999.g Data refer to 1996.

69ANNEX II
Table 7Women in managerial positions, as percentage of total number of persons in managerial positions,
1995, 2000, 2004
Country 1995 2000 2004South and Eastern European countries
Albania e .. .. 17 f
Bulgaria 28.5 c 29.5 32.8
Croatia 22.6 24.7 23.1
Romania 28.2 26.0 29.3
Serbia and Montenegro g
.. .. 30.5 f
The FYR of Macedonia
.. .. 28.0
Turkey .. 8.0 h 6.6
Eastern European and Caucasian countries
Armenia 19.2 c .. 25 h
Belarus .. 45.5 i ..
Georgia .. 19.0 25.6
Republic of Moldova j
.. 33.2 39.0
Russian Federation 37.5 35.2 38.1
Ukraine .. 36.7 43.1
Central Asian countriesKazakhstan .. 32.8 h 38.0
Kyrgyzstan k .. 29.9 i 27.7
Country 1995 2000 2004EU 15
Austria 26.3 28.1 27.0
Belgium 31.4 31.4 30.0
Denmark 19.4 23.1 25.1
Finland .. 27.1 28.3
France 36.4 35.0 37.5
Germany 25.9 27.1 27.7
Greece 21.9 25.3 25.9
Ireland 27.3 26.3 28.4
Italy 15.6 14.5 32.7
Luxembourg 25.0 27.3 23.1
Netherlands 20.9 25.4 25.7
Portugal 30.3 31.9 32.8
Spain 31.3 31.2 32.1
Sweden .. 30.6 31.5
United Kingdon 33.6 35.2 33.5
New EU member statesCyprus a .. 11.1 12.5
Czech Republic 26.8 24.9 27.7
Estonia 36.6 37.5 35.0
Hungary 33.8 33.8 33.9
Latvia 37.5 b 37.4 41.5
Lithuania 35.8 c 43.3 42.2
Malta .. 20.0 15.1
Poland 34.7 32.5 33.7
Slovenia 27.4 30.4 33.8
Slovakia 27.2 31.6 32.5
Other developed countriesCanada 34.4 35.5 36.5
Iceland 27.3 30.0 32.6
Israel 19.5 25.9 28.6 d
Norway .. 25.1 29.6
Switzerland 23.9 23.3 26.5
United States .. 50.3 50.5
Source: UNECE Statistical Division Database, compiled from national and international (EUROSTAT and ILO) official sources. Note: the percentage of women in managerial positions is the percentage of female aged 15+ employed in the ISCO-88 category «legislators, senior officials and managers» over the total number of male and female aged 15+ employed in the same ISCO category.a Data refer to the government controlled area only. g Data refer only to Serbia. b Data refer to 1996. h Data refer to 2001. c Data refer to 1997. i Data refer to 1999. d Data refer to 2003. j Data cover the whole country with the exeption e Data refer only to the private sector. of the Transnistria region and the town of Tighina. f Data refer to 2002. k Data refer to heads of state administration and public enterprises.

70
Table 8Female employers as percentage of total number of employers, 1995, 2000, 2004
Country 1995 2000 2004South and Eastern European countries
Bulgaria 25 24.6 25.9
Croatia 28.5 g 28.6 28.1
Romania 27.4 23.0 26.9
The FYR of Macedonia
... 16.4 22.6
Turkey 3.5 3.9 4.8
Eastern European and Caucasian countries
Armenia 20.5 d ... 16 f
Belarus ... 19.9 ...
Georgia ... 12.0 18.0
Republic of Moldova h ... 16.3 38.1
Russian Federation 19.4 26.2 37.4
Ukraine e 56.8 50.7 48.7
Central Asian countriesKazakhstan … … 27.0
Kyrgyzstan ... 17.7 i 27.8 j
Country 1995 2000 2004EU 15
Austria 24.2 28.3 23.7
Belgium 13.9 21.3 20.2
Denmark 18.9 18.9 17.4
Finland 30.7 24.8 25.5
France 21.5 21.5 22.7
Germany 21.3 22.5 23.2
Greece 13.1 17.4 18.3
Ireland 16.4 18.5 19.1
Italy a 22.5 24.2 21.8
Luxembourg 20.0 27.3 20.0
Netherlands 18.8 22.6 23.4
Portugal 25.3 25.2 26.4
Spain 16.9 21.5 22.8
Sweden 21.0 21.5 19.0
United Kingdon 22.4 23.8 24.8
New EU member statesCyprus b ... 11.1 11.6
Czech Republic 24.1 23.1 22.4
Estonia c 26.8 31.6 26.7
Hungary 23.5 26.5 28.4
Latvia 27.4 29.1 35.7
Lithuania 37.9 d 36.8 29.6
Malta ... ... 12.3
Poland 31.3 31.4 30.6
Slovenia 25.0 24.0 24.2
Slovakia 24.5 28.4 24.7
Other developed countriesCanada e 32.5 34.6 33.9
Iceland 22.2 27.3 25.8
Israel 9.7 14.2 16.1 f
Norway 30.0 28 29.0
Switzerland 22.5 23.4 22.8
United States e 37.0 37.9 37.1
Source: UNECE Statistical Division Database, compiled from national and international (EUROSTAT and ILO) official sources. Note: Percentage of female employers over the total number of male and female employers. Employers are those workers who hold a self-employment job and have continuously engaged one or more persons to work for them as employees. a Data include members of producers cooperatives. b Data refer to the government controlled area only. c Data may include members of producers cooperatives. d Data refer to 1997. e Data include self-employed. f Data refers to 2003
g Data refer to 1996. h Data cover the whole country with the exeption of the Transnistria region and the town of Tighina. i Data refer to 1999. j Data refer to 2002.

71ANNEX II
Table 9Percentage of women in national parliaments, 1990, 2000, 2005
Country 1995 2000 2005South and Eastern European countries
Albania 29 5 6
Bosnia and Herzegovina
... 29 17
Bulgaria 21 11 26
Croatia ... 8 a 22
The FYR of Macedonia
4 7 b 17 c
Romania 34 7 11
Serbia and Montenegro
... 5 8
Turkey 1 4 4
Eastern European and Caucasian countries
Armenia 36 3 5
Azerbaijan ... 12 11
Belarus ... 5 29
Georgia ... 7 9
Republic of Moldova
... 9 16
Russian Federation ... 8 10
Ukraine ... 8 5
Central Asian countriesKazakhstan ... 10 10
Kyrgyzstan ... 1 10
Tajikistan ... 3 13
Turkmenistan 26 26 26 d
Uzbekistan ... 7 18
Country 1995 2000 2005EU 15
Austria 12 27 34
Belgium 9 23 35
Denmark 31 37 38
Finland 32 37 38
France 7 11 12
Germany ... 31 33
Greece 7 6 14
Ireland 8 12 13
Italy 13 11 12
Luxembourg 13 17 23
Netherlands 21 36 37
Portugal 8 19 19
Spain 15 22 36
Sweden 38 43 45
United Kingdom 6 18 18
New EU member statesCyprus 2 5 16
Czech Republic ... 15 17
Estonia ... 18 19
Hungary 21 8 9
Latvia ... 17 21
Lithuania ... 18 22
Malta 3 9 9
Poland 14 13 20
Slovakia ... 13 17
Slovenia ... 8 12
Other developed countriesCanada 13 21 21
Iceland 21 35 30
Israel 7 12 15
Norway 36 36 38
Switzerland 14 23 25
United States 7 13 15
Source: Inter-Parliamentary Union and UNECE Gender Statistics Database. Note: Percentage of Women who are in the lower or single house of the national parliaments (at January of the year indicated) to the total number of women and men who are in the lower or single house of the national parliaments. a Data refer to 1999. b Data refer to 1998. c Data refer to 2002. d Data refer to 2004.

72
Country Female Male Gender gap in life expectancy a
1995 2000 2003 1995 2000 2003 1995 2000 2003New EU member states
Cyprusb 79.8 80.4 81.4 75.3 75.3 77.0 4.5 5.1 4.4
Czech Republic 76.6 78.4 78.7 69.7 71.6 72.1 6.9 6.8 6.6
Estonia 74.5 76.4 76.9 61.9 65.6 66.0 12.6 10.8 10.9
Hungary 74.5 75.9 76.7 65.3 67.4 68.4 9.2 8.5 8.3
Latvia 73.1 76.0 75.9 60.3 65.0 65.7 12.8 11.0 10.2
Lithuania 75.0 77.4 77.7 63.3 66.8 66.5 11.7 10.6 11.2
Malta 79.5 80.3 80.7 74.9 76.2 76.7 4.6 4.1 4.0
Poland 76.4 77.9 78.8 67.6 69.7 70.5 8.8 8.2 8.3
Slovakia 76.3 77.4 77.8 68.4 69.1 69.9 7.9 8.3 7.9
Slovenia 77.8 79.7 80.4 70.3 72.3 72.6 7.5 7.4 7.8
South and Eastern European countriesAlbania 78.3 78.0 78.4 71.5 72.0 73.3 6.8 6.0 5.1
Bosnia and Herzegovina … 76.7 c 76.7 … 71.3 c 71.3 … 5.4 c 5.4
Bulgaria 74.6 75.1 75.9 67.1 68.4 68.9 7.5 6.7 7.0
Croatia 77.2 76.7 78.2 69.3 69.1 71.2 7.9 7.6 7.0
Serbia and Montenegro 75.0 75.2 75.4 c 70.4 70.4 70.0 4.6 4.8 5.4 c
The FYR of Macedonia 74.5 75.7 76.1 70.0 71.2 71.1 4.5 4.5 5.0
Romania 73.1 74.6 75.3 65.3 67.7 67.8 7.8 6.9 7.5
Turkey 70.3 72.1 d 72.2 65.7 67.0 d 68.6 4.6 5.1 d 3.6
Eastern European and Caucasian countriesArmenia 74.9 75.8 75.9 67.3 70.4 70.0 7.6 5.4 5.9
Azerbaijan 72.9 75.1 75.1 65.2 68.6 69.5 7.7 6.5 5.6
Belarus 74.4 74.8 74.7 62.9 63.4 62.7 11.5 11.4 12.0
Georgia 74.2 75.0 74.7 66.3 67.5 69.1 7.9 7.5 5.6
Republic of Moldova 69.7 71.5 71.7 62.0 64.0 64.4 7.7 7.5 7.3
Russian Federation 71.7 72.4 71.9 58.3 59.2 58.7 13.4 13.2 13.2
Ukraine 72.6 73.6 73.6 61.3 62.3 62.3 11.3 11.3 11.3
Central Asian countriesKazakhstan 70.4 71.7 71.5 59.3 60.2 60.6 11.1 11.5 10.9
Kyrgyzstan 69.9 72.0 71.9 61.3 63.8 64.1 8.6 8.2 7.8
Tajikistan 70.6 73.9 73.9 c 65.4 70.3 70.3 c 5.2 3.6 3.6 c
Turkmenistan 67.5 71.8 72.4 61.9 64.9 65.8 5.6 6.9 6.6
Uzbekistan 71.7 73.2 73.8 66.4 68.4 69.4 5.3 4.8 4.4
EU-15 Average d 80.4 81.4 81.7c 73.9 75.4 76c 6.5 6.0 5.7c
Source: UNECE Gender Statistics Database, compiled from national official sources, Eurostat, WHO-Europe and Unicef Transmonee database. Note: Life expectancy is the average number of years of life remaining to be lived by a female or male newborn based on current age-specific mortality rates.
Table 10Life expectancy at birth by sex 1995, 2000, 2003
a Difference between female life expectancy and male life expectancy. b Data refer to the government-controlled area only. Data for 2000 refer to 1999.
c Data refer to 2001. d WHO-Europe.

73ANNEX II
Country Female Male1995 2000 2003 1995 2000 2003
New EU member statesCyprus 8.3 5.5 3.6 8.7 5.7 4.6
Czech Republic 6.5 3.5 3.5 8.9 4.6 4.3
Estonia 13.1 7.2 5.5 16.6 9.5 8.5
Hungary 9.3 8.6 6.6 12.0 9.8 8.0
Latvia 16.7 8.9 8.0 20.9 11.8 10.8
Lithuania 11.0 8.9 5.9 13.9 8.3 7.5
Poland 12.4 7.4 6.4 14.7 8.8 7.7
Slovakia 9.6 7.2 8.0 a 12.4 9.9 7.3 a
Slovenia 5.1 4.2 3.9 6.0 5.5 4.2
South and Eastern European countriesAlbania 21.5 10.6 8.8 24.9 12.6 8.0
Bulgaria 13.0 12.0 10.5 16.6 14.6 13.3
Croatia 7.7 7.1 5.3 10.2 7.7 7.3
Serbia and Montenegro
15.5 11.2 8.6 a 18.1 15.2 11.7 a
The FYR of Macedonia 22.8 11.1 9.7 a 22.6 12.4 13.0
Romania 18.6 16.6 14.4 23.7 20.6 18.8
Turkey ... 37.0 34.7 ... 46.6 43.8
Eastern European and Caucasian countriesArmenia 12.6 12.3 10.1 15.7 18.6 13.3
Azerbaijan 22.2 12.0 12.3 a 26.2 13.5 13.3 a
Belarus 11.0 7.9 6.4 15.7 10.7 9.0
Georgia 24.3 19.2 22.4 32.1 25.6 26.9
Republic of Moldova 18.8 15.0 12.0 24.1 21.6 16.4
Russian Federation 15.6 13.1 10.9 20.7 17.2 13.8
Ukraine 12.9 9.9 8.0 16.7 13.9 10.9
Central Asian countriesKazakhstan 23.4 16.1 13.1 32.0 21.9 17.4
Kyrgyzstan 23.3 19.3 17.7 31.8 26.5 23.6
Tajikistan 16.9 c 10.9 d ... 21.7 c 14.9 d ...
Turkmenistan 38.0 28.2 d ... 47.4 37.2 d ...
Uzbekistan 22.5 16.7 14.5 a 29.9 21.4 18.5 a
Table 11Infant mortality rate by sex 1995, 2000, 2002
Source: WHO Europe and national official sources. Note: Infant mortality rate is given by the number of infants dying between birth and one year of age per 1,000 live births in a given year. a Data refer to 2002. b Data refer to 2001. c Data refer to 1997. d Data refer to 1999.
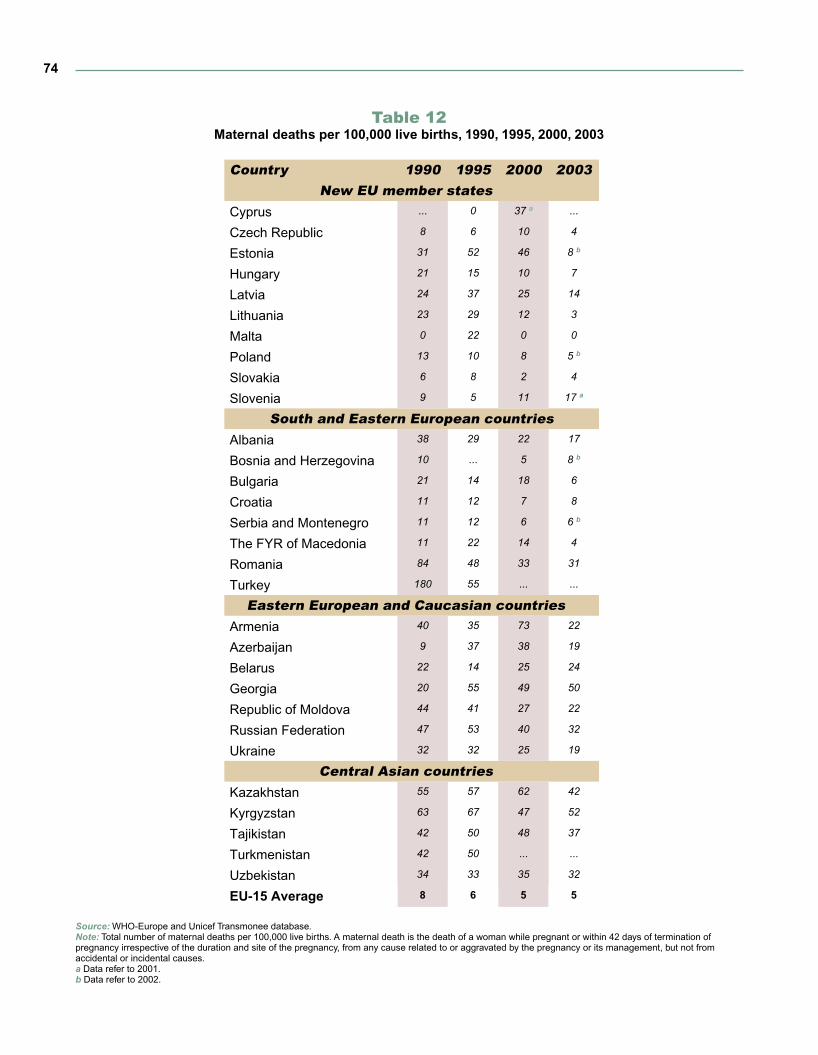
74
Table 12Maternal deaths per 100,000 live births, 1990, 1995, 2000, 2003
Source: WHO-Europe and Unicef Transmonee database. Note: Total number of maternal deaths per 100,000 live births. A maternal death is the death of a woman while pregnant or within 42 days of termination of pregnancy irrespective of the duration and site of the pregnancy, from any cause related to or aggravated by the pregnancy or its management, but not from accidental or incidental causes. a Data refer to 2001. b Data refer to 2002.
Country 1990 1995 2000 2003New EU member states
Cyprus ... 0 37 a ...
Czech Republic 8 6 10 4
Estonia 31 52 46 8 b
Hungary 21 15 10 7
Latvia 24 37 25 14
Lithuania 23 29 12 3
Malta 0 22 0 0
Poland 13 10 8 5 b
Slovakia 6 8 2 4
Slovenia 9 5 11 17 a
South and Eastern European countriesAlbania 38 29 22 17
Bosnia and Herzegovina 10 ... 5 8 b
Bulgaria 21 14 18 6
Croatia 11 12 7 8
Serbia and Montenegro 11 12 6 6 b
The FYR of Macedonia 11 22 14 4
Romania 84 48 33 31
Turkey 180 55 ... ...
Eastern European and Caucasian countriesArmenia 40 35 73 22
Azerbaijan 9 37 38 19
Belarus 22 14 25 24
Georgia 20 55 49 50
Republic of Moldova 44 41 27 22
Russian Federation 47 53 40 32
Ukraine 32 32 25 19
Central Asian countriesKazakhstan 55 57 62 42
Kyrgyzstan 63 67 47 52
Tajikistan 42 50 48 37
Turkmenistan 42 50 ... ...
Uzbekistan 34 33 35 32
EU-15 Average 8 6 5 5

75ANNEX II
Table 13Abortions per 1,000 live births, 1990, 1995, 2000, 2003
Source: WHO-Europe.Note: Total number of induced abortions, irrespective of the method, per 1,000 live births. Abortion is the termination of a pregnancy before the fetus has attained viability. a Data refer to 2002. b Data refer to 2001.
Country 1990 1995 2000 2003New EU member states
Czech Republic 821 502 358 290
Estonia 1 319 1 308 975 815
Hungary 719 687 607 568
Latvia 1 030 1 201 851 691
Lithuania 879 759 476 376
Slovakia 696 575 428 409
Slovenia 651 574 465 403
South and Eastern European countriesAlbania 318 448 318 257
Bulgaria 1 375 1 349 833 693
Croatia 697 285 172 149
Serbia and Montenegro 1 262 689 363 388
The FYR of Macedonia 618 492 389 316 b
Romania 3 153 2 125 1 100 1058
Eastern European and Caucasian countriesArmenia 327 628 343 300
Azerbaijan 134 200 150 149
Belarus 1 792 805 1 301 906
Georgia 613 702 320 187
Republic of Moldova 1 063 1 014 705 481
Russian Federation 1 971 1 888 1 548 1 157
Ukraine 1 551 1 452 1 062 716
Central Asian countriesKazakhstan 702 807 617 513
Kyrgyzstan 416 231 165 182
Tajikistan 96 109 77 59
Turkmenistan 285 266 ... ...
Uzbekistan 310 135 104 99
EU-15 Average 194 196 218 229 b

76
Table 14Tuberculosis incidence per 100,000 inhabitants, 1995, 2000, 2003
Source: WHO-Europe. Note: Number of newly diagnosed tuberculosis cases, all forms during the given calendar year per 100,000 resident people. a Data refer to 2002.
Country 1995 2000 2003New EU member states
Cyprus ... ... 4.7
Czech Republic 17.9 13.8 10.8
Estonia 42.3 55.4 41.2
Hungary 42.0 30.1 24.3
Latvia 62.0 83.5 72.5
Lithuania 65.1 75.9 74.3
Malta 2.7 4.2 1.5
Poland 41.4 28.3 25.1
Slovakia 28.7 18.7 16.6
Slovenia 26.5 18.6 13.8
South and Eastern European countriesAlbania 20.4 19.4 17.5
Bosnia and Herzegovina ... 65.6 45.6
Bulgaria 38.6 41.0 39.2
Croatia 44.3 37.2 33.6
Serbia and Montenegro 39.8 26.9 25.7
The FYR of Macedonia 40.0 31.6 32.2
Romania 102.6 122.4 130.4
Turkey 37.3 26.8 26.3
Eastern European and Caucasian countriesArmenia 21.6 35.1 47.9
Azerbaijan 44.4 64.5 62.9 a
Belarus 49.5 68.0 51.5
Georgia 101.1 105.3 97.3
Republic of Moldova 63.5 68.7 114.7
Russian Federation 65.9 95.2 86.5
Ukraine 41.9 66.9 77.8
Central Asian countriesKazakhstan 67.1 173.8 180.7
Kyrgyzstan 75.4 126.9 140.8
Tajikistan 35.8 44.9 64.8
Turkmenistan 44.8 90.6 74.5 a
Uzbekistan 43.1 63.9 80.6

77ANNEX II
Table 15DOTS treatment success for tuberculosis, 1995, 2000, 2003
Source: WHO-Unicef (data from the MDG database of the UN Statistics Division). Note: Treatment success is the proportion of registered patients who were cured plus the proportion who completed treatment to all registered cases. DOTS (Direct Observed Therapy Short Course) is the method of the therapy that is considered the most cost-effective strategy to reduce TB cases and deaths.
Country 1995 2000 2003New EU member states
Cyprus ... ... 75
Czech Republic 60 78 73
Estonia ... 63 67
Hungary ... ... 55
Latvia 61 74 76
Lithuania ... 84 72
Malta 100 75 60
Poland ... 69 86
Slovakia 64 79 85
Slovenia 90 88 85
South and Eastern European countriesAlbania ... ... 90
Bosnia and Herzegovina ... 90 95
Bulgaria ... ... 86
Serbia and Montenegro ... ... 91
The FYR of Macedonia ... ... 79
Romania ... 78 76
Eastern European and Caucasian countriesArmenia 83 88 79
Azerbaijan ... 88 84
Georgia 58 61 65
Republic of Moldova ... ... 61
Russian Federation 65 65 67
Central Asian countriesKazakhstan ... 79 78
Kyrgyzstan ... 83 82
Tajikistan … … 79
Turkmenistan ... ... 77
Uzbekistan ... 79 80
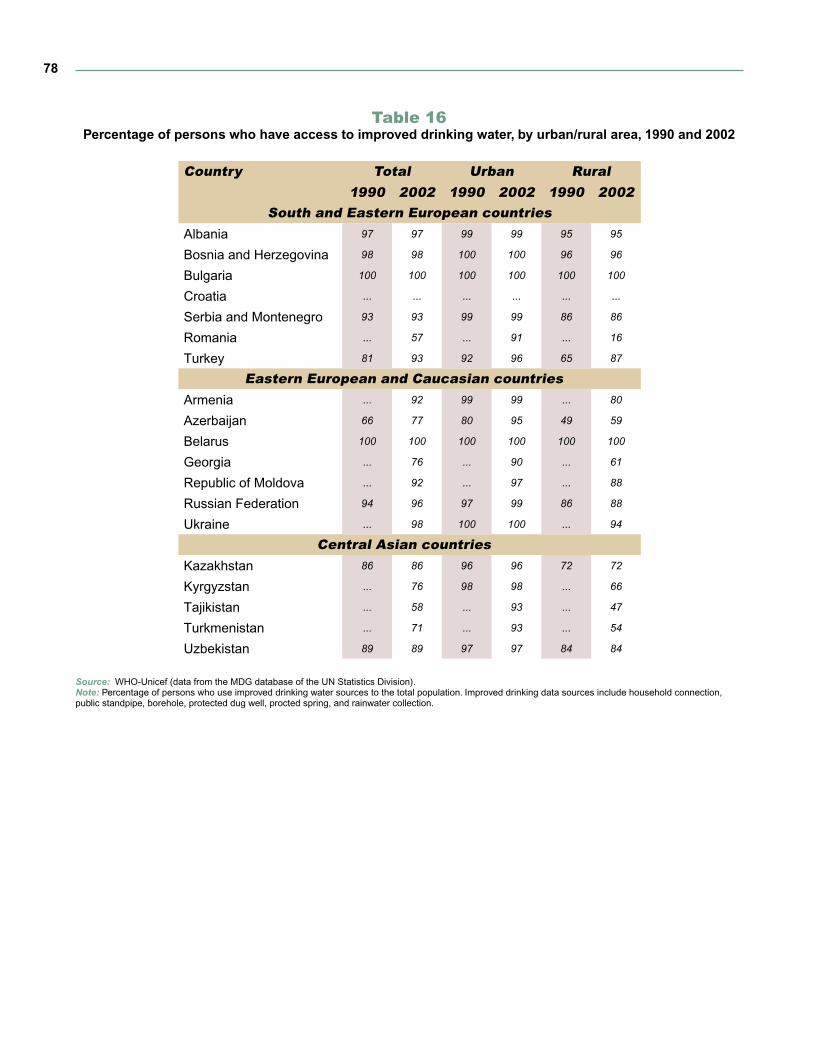
78
Table 16Percentage of persons who have access to improved drinking water, by urban/rural area, 1990 and 2002
Source: WHO-Unicef (data from the MDG database of the UN Statistics Division). Note: Percentage of persons who use improved drinking water sources to the total population. Improved drinking data sources include household connection, public standpipe, borehole, protected dug well, procted spring, and rainwater collection.
Country Total Urban Rural1990 2002 1990 2002 1990 2002
South and Eastern European countriesAlbania 97 97 99 99 95 95
Bosnia and Herzegovina 98 98 100 100 96 96
Bulgaria 100 100 100 100 100 100
Croatia ... ... ... ... ... ...
Serbia and Montenegro 93 93 99 99 86 86
Romania ... 57 ... 91 ... 16
Turkey 81 93 92 96 65 87
Eastern European and Caucasian countriesArmenia ... 92 99 99 ... 80
Azerbaijan 66 77 80 95 49 59
Belarus 100 100 100 100 100 100
Georgia ... 76 ... 90 ... 61
Republic of Moldova ... 92 ... 97 ... 88
Russian Federation 94 96 97 99 86 88
Ukraine ... 98 100 100 ... 94
Central Asian countriesKazakhstan 86 86 96 96 72 72
Kyrgyzstan ... 76 98 98 ... 66
Tajikistan ... 58 ... 93 ... 47
Turkmenistan ... 71 ... 93 ... 54
Uzbekistan 89 89 97 97 84 84

79ANNEX II
Table 17Percentage of persons who have access to improved sanitation, by urban/rural area, 1990 and 2002
Source: WHO-Unicef (data from the MDG database of the UN Statistics Division). Note: percentage of persons who use improved sanitation facilities to the total population. Improved sanitary facilities include connection to a public sewer, connection to a septic system, pour-flush latrine, simple pit latrine, ventilated improved pit latrine.
Country 1990 2002 1990 2002 1990 2002South and Eastern European countries
Albania ... 89 99 99 ... 81
Bosnia and Herzegovina ... 93 99 99 ... 88
Bulgaria 100 100 100 100 100 100
Serbia and Montenegro 87 87 97 97 77 77
Romania ... 51 ... 86 ... 10
Turkey 84 83 96 94 67 62
Eastern European and Caucasian countriesArmenia ... 84 96 96 ... 61
Azerbaijan ... 55 ... 73 ... 36
Georgia ... 83 96 96 ... 69
Republic of Moldova ... 68 ... 86 ... 52
Russian Federation 87 87 93 93 70 70
Ukraine 99 99 100 100 97 97
Central Asian countriesKazakhstan 72 72 87 87 52 52
Kyrgyzstan ... 60 ... 75 ... 51
Tajikistan ... 53 ... 71 ... 47
Turkmenistan ... 62 ... 77 ... 50
Uzbekistan 58 57 73 73 48 48

80
Table 18Percentage of households with a personal computer 1998, 2000, 2003
Source: International Telecomunication Union (ITU) and national official sources. Note: Percentage of households that have a personal computer used at home. a Data refer to 2002. b Data refer to 2001.
Countries 1998 2000 2003EU 15
Austria 41 46 45 a
Belgium 34.9 44.6 b 63
Denmark 53 64.7 79
Finland 37.8 48.2 61.8
France 19 27 37 a
Germany 30 47.3 61
Ireland 18.6 32.4 ...
Italy 18.8 27.2 ...
Luxembourg ... 43.2 70 a
Portugal 17 20 38
Spain 25.5 ... 43.3
Sweden 53 60 75 a
United Kingdom 34 48 54 b
New EU member statesCyprus ... 28 42
Czech Republic 13 21.4 ...
Estonia ... ... 30
Hungary 9 13.3 22 b
Latvia ... ... 16.2
Malta ... 34.4 38 b
Poland ... ... 25
Slovakia 6.2 12.9 38
Slovenia 35 46 62
Other developed countriesCanada ... 54.9 66.8
Iceland 61.1 ... ...
Norway 57 65 ...
Switzerland 51.1 61.3 64.2 b
United States 42.1 51.0 56.3 b
South and Eastern Europe countriesAlbania ... ... 1.4 b
Bulgaria ... 4 7.1
Romania ... 2.7 11.6
Turkey 6.5 12.3 ...
Caucasian countriesAzerbaijan 21 23.0 24.6 b

81ANNEX II
Table 19Percentage of individuals regularly using the Internet, by sex, 2003 and 2004
Source: Eurostat. Note: Percentage of individuals aged 16 to 74 who access the internet, on average, at least once a week, within the last three months before the survey to the total number of individuals aged 16 to 74.
Country Total Female Male2003 2004 2003 2004 2003 2004
EU 15Austria 36 46 31 39 42 53
Denmark 64 70 60 66 68 73
Finland 58 63 56 63 60 63
Germany 44 50 ... 44 ... 55
Greece 14 17 11 14 18 21
Ireland 25 27 23 26 26 28
Italy 25 26 20 20 30 31
Luxembourg 48 59 43 49 54 70
Portugal 22 25 ... 23 ... 27
Spain 29 31 26 27 33 36
Sweden 69 75 64 73 74 78
United Kingdom 46 49 43 43 50 55
New EU member statesCyprus ... 28 ... 23 ... 33
Czech Republic 20 25 17 22 23 28
Estonia ... 45 ... 44 ... 45
Hungary ... 21 ... 19 ... 24
Latvia ... 27 ... 27 ... 28
Lithuania 20 26 ... 25 ... 26
Poland ... 22 ... 21 ... 24
Slovakia ... 40 ... 36 ... 44
Slovenia ... 33 ... 31 ... 36
Other developed countriesCanadaa 61.6 64.2 ... ... ... ...
Iceland 75 77 72 75 77 79
Norway 66 68 59 63 73 73
United Statesb 55.3 ... 55.2 ... 55.4 ...
South European countriesBulgaria ... 13 ... 12 ... 15
Turkey ... 11 ... 6 ... 16

82
Table 20Net official aid received by countries, 1997 and 2003
Source: 2004 World Development Indicators, The World Bank based on data from the OECD DAC. Note: Net official aid refers to aid flows (net of repayments) from official donors.
Country Total $ millions Per capita $ millions1997 2003 1997 2003
New EU Member statesCzech Republic 117 263 11 26
Estonia 66 85 47 62
Hungary 180 248 18 25
Latvia 81 114 33 49
Lithuania 104 372 29 108
Poland 861 1191 22 31
Slovenia 99 66 50 33
Slovakia 71 160 13 30
South and Eastern European countriesAlbania 166 342 53 108
Bosnia and Herzegovina 862 539 231 141
Bulgaria 220 414 26 53
Croatia 40 121 9 27
Romania 219 601 10 28
Serbia and Montenegro 97 1317 9 162
The FYR of Macedonia 98 234 49 114
Turkey 7 166 0 2
Eastern European and Caucasian countriesArmenia 166 247 52 81
Azerbaijan 184 297 23 36
Belarus 55 32 5 3
Georgia 242 220 45 60
Republic of Moldova 65 117 15 28
Russian Federation 793 1255 5 9
Ukraine 268 323 5 7
Central Asian countriesKazakhstan 140 268 9 18
Kyrgyzstan 240 198 51 39
Tajikistan 86 144 14 27
Turkmenistan 12 27 3 6
Uzbekistan 140 194 6 8

83ANNEX II
Table 21Membership of World Trade Organization
Source: World Trade Organization (WTO).
Country Membership Date of membershipNew EU member states
Cyprus yes 30 July 1995
Czech Republic yes 1 January 1995
Estonia yes 13 November 1999
Hungary yes 1 January 1995
Latvia yes 10 February 1999
Lithuania yes 31 May 2001
Malta yes 1 January 1995
Poland yes 1 July 1995
Slovenia yes 30 July 1995
Slovakia yes 1 January 1995
South and Eastern European countriesAlbania yes 8 September 2000
Bosnia and Herzegovina no
Bulgaria yes 1 December 1996
Croatia yes 30 November 2000
Romania yes 1 January 1995
Serbia and Montenegro no
The FYR of Macedonia yes 4 April 2003
Turkey yes 26 March 1995
Eastern European and Caucasian countriesArmenia yes 5 February 2003
Azerbaijan no
Belarus no
Georgia yes 14 June 2000
Republic of Moldova yes 26 July 2001
Russian Federation no
Ukraine no
Central Asian countriesKazakhstan no
Kyrgyzstan yes 20 December 1998
Tajikistan no
Turkmenistan no
Uzbekistan no