Embed Size (px)
Citation preview

© 2014 The Korean Society of Rheology and Springer 319
Korea-Australia Rheology Journal, Vol.26, No.3, pp.319-326 (August 2014)DOI: 10.1007/s13367-014-0036-y
www.springer.com/13367
New way to characterize the percolation threshold of polyethylene and
carbon nanotube polymer composites using Fourier transform (FT) rheology
Deepak Ahirwal1,2
, Humberto Palza3, Guy Schlatter
2 and Manfred Wilhelm
1,*1Karlsruhe Institute of Technology (KIT), Institute of Chemical Technology and Polymerchemistry, Engesserstr. 18,
76131 Karlsruhe, Germany2Institut de Chimie et Procédés pour l’Energie, l’Environnement et la Sant, ICPEES-UMR7515,Universit de Strasbourg,
CNRS, Institut Carnot MICA, Ecole Européenne de Chimie, Polymères et Matériaux, 25 rue Becquerel,67087 Strasbourg, cedex 2, France
3Departamento de Ingenieria Quimica y Biotecnologia, Facultad de Ciencias Fisicas y Matematicas, Universidad de Chile, Beauchef 861, Casilla 277, Santiago, Chile
(Received January 28, 2014; final revision May 9, 2014; accepted May 23, 2014)
In this article, a new way to characterize the percolation threshold of polymer nanocomposites made ofpolyethylene (PE) with single and multi walled carbon nanotubes (SWCNTs and MWCNTs) is presented.Small and large oscillatory shear (SAOS and LAOS) experiments were performed to characterize the degreeof dispersion and percolation threshold. The analysis of the stress response in the LAOS regime as a func-tion of the applied deformation amplitude and frequency was performed using Fourier Transform (FT)-Rhe-ology. The zero strain intrinsic nonlinear parameter, Q0(ω), was calculated by extrapolation of I3/1(γ0, ω) andwas, used to quantify the nonlinearity measured by FT-Rheology. Interestingly, a drop in Q0 as a functionof the CNT weight fraction at a fixed frequency was found that was below the percolation threshold. Thiswas followed by, a steep rise in Q0 above the percolation threshold. Therefore, the new method based onthis observation that is proposed and described with this article has the potential to lead to a better under-standing of structure-property relationships in polymer nanocomposites.
Keywords: FT-Rheology, nanocomposites, carbon nanotubes, percolation threshold, LAOS
1. Introduction
Polymer nanocomposites based on carbon nanotubes
(CNTs) (Iijima, 1991) attracted enormous interest due to
their exceptional electrical (Baughman et al., 2002),
mechanical (Ajayan et al., 2000; Kharchenko et al.,
2004) and thermal (Huxtable et al., 2003) properties at a
relatively small concentration in the polymer matrix.
Due to the improvements in these properties relative to
the neat polymer, polymer nanocomposites based on
CNTs have found manufacturing applications in elec-
trostatic painting (Ramasubramaniam et al., 2003), pro-
tective coatings for electronic components (Terrones,
2003), radiation shielding (Kota et al., 2007) and flam-
mability reduction (Kashiwagi et al., 2002). The addition
of CNTs into a polymer matrix has a significant effect on
the processing conditions (e.g. mixing, moulding, extru-
sion, etc.) because of the substantial changes that occur
in the viscoelastic properties of polymer nanocomposite
materials. To optimize the processing conditions, it is
important to understand the changes in the flow prop-
erties that occur up upon addition of CNTs into a poly-
mer matrix. The important parameters which play a
significant role in this are the chemical composition of
the polymer, the aspect ratio of the CNTs, the orientation
of the CNTs, the type of CNT (e.g. single and multi
walled CNTs), the polymer-filler interactions and the
degree of dispersion in the polymer matrix.
To characterize the state of nanoparticle dispersion in a
polymer matrix, the percolation scaling law presents a the-
oretical basis for calculating the properties of composites
containing impenetrable particles (Sahimi, 1994; Vigolo et
al., 2005). The scaling law P (φ–φc)δ (Kota et al., 2007;
Huang et al., 2011), is valid for polymer composites
where P is a generalized material property, φ is the filler
volume fraction, δ is the critical scaling exponent and φc
is the volume fraction at the percolation threshold con-
centration. The P could be, for example, a rheological
property (G’, η, δ0) or an electrical property (e.g. DC con-
ductivity, σDC). Two material properties are widely used
with the percolation theory to describe the dispersion state
of CNTs in a polymer matrix: the electrical conductivity
(σ) and the dynamic elastic shear modulus [G’(ω)]. The
effect of CNT on the linear viscoelastic properties of var-
ious polymers has been addressed in the literature: poly-
styrene (PS) (Kota et al., 2007), polycarbonate (PC) (Sun
et al., 2010), poly(methyl methacrylate) (PMMA) (Du et
al., 2004), polyethylene (PE) (McNally et al., 2005) and
polypropylene (PP) (Lee et al., 2008). Winter et al. (2001)
described the rheological changes with increasing CNT
∝
*Corresponding author: [email protected]

Deepak Ahirwal, Humberto Palza, Guy Schlatter and Manfred Wilhelm
320 Korea-Australia Rheology J., Vol. 26, No. 3 (2014)
content within the framework of a liquid-like to solid-like
transition. Furthermore, Du et al. (2001) provided a per-
spective for both the rheological and conductivity per-
colation threshold by describing the network formation
between the polymer matrix and CNTs, and between the
CNTs themselves using percolation theory. However, most
industrial processes operate at large deformation ampli-
tudes where knowledge of the nonlinear viscoelastic
behavior is important. Furthermore, under these large
deformation amplitudes, there can be changes to the per-
colation behavior due to orientation and stretching of the
polymer and orientation of the CNTs, which can affect the
conductivity as previously reported (Alig et al., 2007;
Skipa et al., 2010; Alig et al., 2008a; Alig et al., 2008b).
Therefore, to optimize industrial processes and tailor
material properties, an understanding of polymer com-
posite flow behavior under large amplitude oscillatory
shear is necessary.
Recently, Large Amplitude Oscillatory Shear (LAOS)
was used to characterize the nonlinear behavior of a vari-
ety of soft materials (Hyun et al., 2007; Ewoldt et al.,
2007; Hyun and Wilhelm, 2009; Hyun et al., 2011; Rein-
heimer et al., 2012; Wilhelm et al., 2012; Kempf et al.,
2013; Ahirwal et al., 2014). The interest in LAOS flow for
characterization can be attributed to the development of
several methods to analyze the complex periodic flow
response, such as Fourier Transform (FT) rheology (Wil-
helm, 2002), Stress Decomposition (SD) (Cho et al.,
2005), which, was further developed to describe higher
order moduli in a meaningful way using Chebyshev poly-
nomials (Ewoldt et al., 2008), and the sequence of Phys-
ical Process (SPP) framework (Rogers and Lattinga,
2012). In particular, most attention has been focused on
FT-Rheology, where the stress response is analyzed in
Fourier space. Generally, the third order higher Fourier
harmonic relative to the fundamental Fourier harmonic, I3/1,
is used to quantify the nonlinear behavior in LAOS flow.
In the LAOS regime, for a range of applied deformation
amplitudes, a square scaling, , was observed both
experimentally (Hyun and Wilhelm, 2009; Reinheimer et
al., 2012; Kempf et al., 2013; Ahirwal et al., 2014) and in
simulations of various nonlinear constitutive equations
[Giesekus model (Gurnon and Wagner, 2013), Pom-Pom
model (Hyun et al., 2013) and the Molecular Stress Func-
tion (MSF) model (Wagner et al. 2011)]. Motivated by
this square scaling, Hyun and Wilhelm (2009) introduced
a new nonlinear parameter . In
the limit of small deformation amplitudes, the Q-param-
eter converges to a constant value, which they called the
zero strain intrinsic nonlinearity, .
Since then, Q0, has been used to characterize a variety of
complex fluids, e.g. polymer melts (Vittorias et al., 2011;
Kempf et al., 2013; Ahirwal et al., 2014), dilute emulsions
(Reinheimer et al., 2011; Reinheimer et al., 2012), micelle
systems (Gurnon and Wagner, 2013) and polymer com-
posites (Lim et al., 2013; Hassanabadi et al., 2013).
In this article, PE/MWCNTs and PE/SWCNTs nano-
composites were used for the rheological investigation. In
the LAOS regime, a minimum in the zero strain intrinsic
nonlinearity, Q0(ω), as a function of the weight fraction of
CNTs (φw) at a fixed frequency, ω, was observed. Palza et
al. (2011) observed qualitatively similar behavior for the
electrical conductivity measured under LAOS. The
asymptotic scaling (percolation scaling law) was valid for
both the linear viscoelastic material parameter (G’) and the
nonlinear viscoelastic material parameter (Q0). It was con-
firmed that the percolating networks of CNT-polymer and
CNT-CNT have a significantly higher influence on the
properties measured in the nonlinear viscoelastic regime
compared to those measured in the linear viscoelastic
regime. This was verified by calculation of the percolation
scaling exponent, δ, which had a higher value for the
intrinsic nonlinearity, Q0 (nonlinear viscoelastic regime),
relative to that for the elastic modulus, G’ (linear vis-
coelastic regime).
2. Materials and Experimental protocols
2.1. Materials and preparation of nanocompositesMWCNTs were bought from Bayer Material Science
(Baytubes C150P), while SWCNTs were provided by
Prof. Mr. Kappes (KIT) and were prepared by laser vapor-
ization as described in detail elsewhere (Lebedkin et al.,
2002). The PE polymer is a LLDPE ethylene copolymer
with 7 mol% of 1-octene (short chain branching) from
Dow (commercial name: Engage-8450). The following
data is provided by the supplier for the PE: Mw = 100 kg/
mol, Mn = 45 kg/mol and Tm (melting temperature) =
100oC. A detailed description of the polymer nanocom-
posite preparation method is given elsewhere (Palza et al.,
2011).
2.2. Experimental protocols for rheological measure-ments
The rheological measurements were carried out on an
ARES-G2 rotational rheometer from TA Instruments.
Oscillatory shear measurements in the linear regime were
performed using the cone and plate geometry (13 mm and
25 mm, α = 0.1 rad) at 140oC. This particular temperature
(140oC) was chosen to compliment previous results by
Palza et al. (2011) on the conductivity of PE, PE/
MWCNTs and PE/SWCNTs that were measured at this
temperature. Nonlinear were also performed on the same
ARES-G2 rheometer at 140oC using an implemented FT-
Rheology module. Strain amplitudes over the range γ0 =
0.001 – 1.5 were applied at various frequencies. The sam-
ples were press-molded under vacuum at 180oC into 13
and 25 mm discs for the experiments.
I3 1⁄ γ02
∝
Q γ0 ω T, ,( ) I3 1⁄ γ0 ω T, ,( ) γ02
⁄=
Q0 ω T,( ) Q γ0 ω T, ,( )γ0
0→lim=
New way to characterize the percolation threshold of polyethylene and carbon nanotube polymer composites......
Korea-Australia Rheology J., Vol. 26, No. 3 (2014) 321
3. Results and Discussions
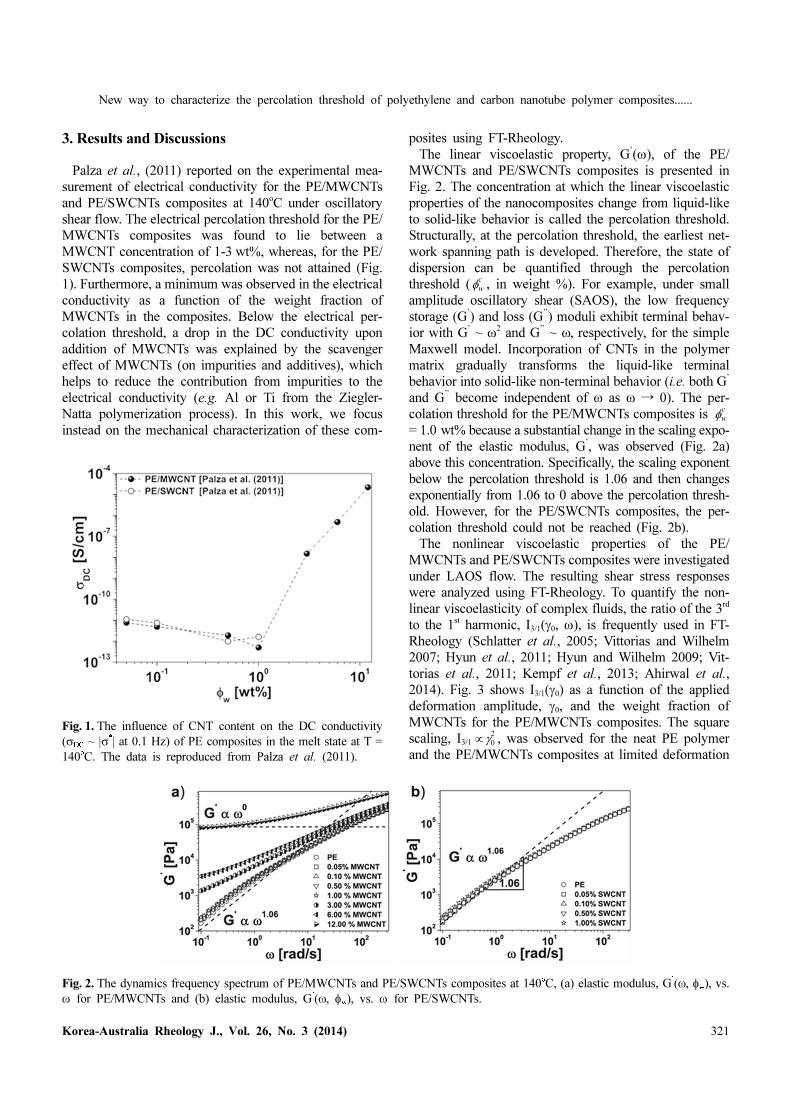
Palza et al., (2011) reported on the experimental mea-
surement of electrical conductivity for the PE/MWCNTs
and PE/SWCNTs composites at 140oC under oscillatory
shear flow. The electrical percolation threshold for the PE/
MWCNTs composites was found to lie between a
MWCNT concentration of 1-3 wt%, whereas, for the PE/
SWCNTs composites, percolation was not attained (Fig.
1). Furthermore, a minimum was observed in the electrical
conductivity as a function of the weight fraction of
MWCNTs in the composites. Below the electrical per-
colation threshold, a drop in the DC conductivity upon
addition of MWCNTs was explained by the scavenger
effect of MWCNTs (on impurities and additives), which
helps to reduce the contribution from impurities to the
electrical conductivity (e.g. Al or Ti from the Ziegler-
Natta polymerization process). In this work, we focus
instead on the mechanical characterization of these com-
posites using FT-Rheology.
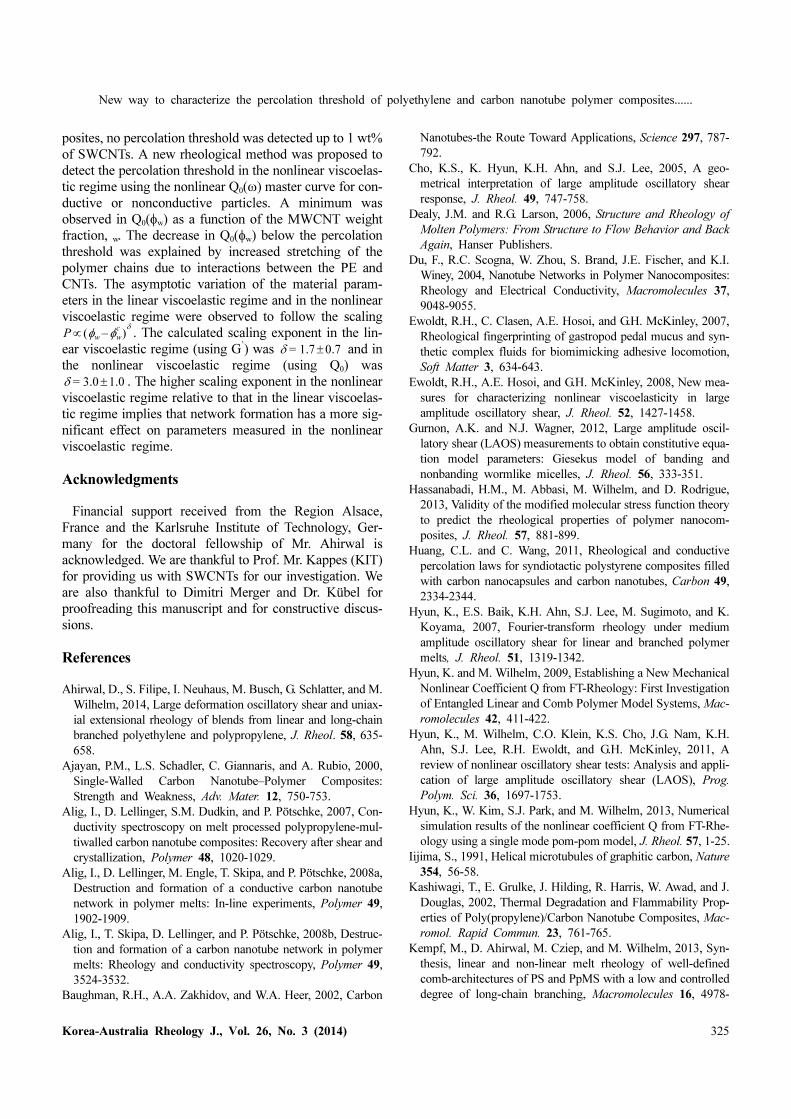
The linear viscoelastic property, G’(ω), of the PE/
MWCNTs and PE/SWCNTs composites is presented in
Fig. 2. The concentration at which the linear viscoelastic
properties of the nanocomposites change from liquid-like
to solid-like behavior is called the percolation threshold.
Structurally, at the percolation threshold, the earliest net-
work spanning path is developed. Therefore, the state of
dispersion can be quantified through the percolation
threshold ( , in weight %). For example, under small
amplitude oscillatory shear (SAOS), the low frequency
storage (G’) and loss (G’’) moduli exhibit terminal behav-
ior with G’ ~ ω2 and G’’ ~ ω, respectively, for the simple
Maxwell model. Incorporation of CNTs in the polymer
matrix gradually transforms the liquid-like terminal
behavior into solid-like non-terminal behavior (i.e. both G’
and G’’ become independent of ω as ω → 0). The per-
colation threshold for the PE/MWCNTs composites is
= 1.0 wt% because a substantial change in the scaling expo-
nent of the elastic modulus, G’, was observed (Fig. 2a)
above this concentration. Specifically, the scaling exponent
below the percolation threshold is 1.06 and then changes
exponentially from 1.06 to 0 above the percolation thresh-
old. However, for the PE/SWCNTs composites, the per-
colation threshold could not be reached (Fig. 2b).
The nonlinear viscoelastic properties of the PE/
MWCNTs and PE/SWCNTs composites were investigated
under LAOS flow. The resulting shear stress responses
were analyzed using FT-Rheology. To quantify the non-
linear viscoelasticity of complex fluids, the ratio of the 3rd
to the 1st harmonic, I3/1(γ0, ω), is frequently used in FT-
Rheology (Schlatter et al., 2005; Vittorias and Wilhelm
2007; Hyun et al., 2011; Hyun and Wilhelm 2009; Vit-
torias et al., 2011; Kempf et al., 2013; Ahirwal et al.,
2014). Fig. 3 shows I3/1(γ0) as a function of the applied
deformation amplitude, γ0, and the weight fraction of
MWCNTs for the PE/MWCNTs composites. The square
scaling, I3/1 , was observed for the neat PE polymer
and the PE/MWCNTs composites at limited deformation
φw
c
φw
c
γ02
∝Fig. 1. The influence of CNT content on the DC conductivity
(σDC ~ |σ*| at 0.1 Hz) of PE composites in the melt state at T =
140oC. The data is reproduced from Palza et al. (2011).
Fig. 2. The dynamics frequency spectrum of PE/MWCNTs and PE/SWCNTs composites at 140oC, (a) elastic modulus, G’(ω, φw), vs.
ω for PE/MWCNTs and (b) elastic modulus, G’(ω, φw), vs. ω for PE/SWCNTs.

Deepak Ahirwal, Humberto Palza, Guy Schlatter and Manfred Wilhelm
322 Korea-Australia Rheology J., Vol. 26, No. 3 (2014)
amplitudes (the points which are overlapping with the dot-
ted line in the Fig. 3). Interestingly, I3/1(γ0) at concentra-
tions below the percolation threshold (φw = 1.0 wt%) were
lower relative to neat PE and the square scaling was
observed over a wide range of deformation amplitudes, ã0
= 0.2−1.1. However, at concentrations above the perco-
lation threshold (φw = 3.0 and 12.0 wt%), the square scal-
ing was observed only over a very narrow range of
deformation amplitudes (for φw = 3.0, γ0 = 0.05−0.08 and
for φw= 12.0, γ0 = 0.01 − 0.02). The appearance of more
pronounced nonlinearities at much smaller applied defor-
mation amplitudes (relative to neat PE) could be attributed
to the formation of PE-MWCNT and MWCNT-MWCNT
networks above the percolation threshold for the PE/
MWCNTs composites.
It has been well established that the Q0(ω)−ω master
curve is extremely sensitive in the detection of different
relaxation processes relative to the dynamics frequency
curve (G’ and G’’ vs. ω) (Hyun and Wilhelm, 2009; Kempf
et al., 2013).
The two previous studies (Lim et al., 2013; Hassanabadi
et al., 2013) that were performed on polymer composites
under LAOS flow only investigated the influence of the
percolating network and were performed at low frequen-
cies (Lim et al., 2013 at ω = 1 rad/s and Hassanabadi et
al., 2013 at ω/2π = 0.05 Hz). However, no studies have
yet focused on the determination of the percolation thresh-
old using the Q0(ω)−ω master curve. This method has the
potential to provide us with a new and sensitive way to
detect the percolation threshold because, at the percolation
threshold, the polymer composites make a transition from
liquid-like to solid-like behavior. For the first time, an
investigation was made to measure the percolation thresh-
old in the nonlinear viscoelastic regime.
Fig. 4 shows the Q0(ω)−ω master curve for the PE/
MWCNT and the PE/SWCNT composites at 140oC. The
intrinsic nonlinearity, Q0(ω), increased monotonically with
increasing frequency, ω/2π, below the percolation thresh-
old for the PE/MWCNT and PE/SWCNT composites.
However, above the percolation threshold, the Q0(ω)
curve displayed a monotonic decrease with increasing fre-
quency. Furthermore, it is interesting to note that, upon
addition of CNTs to the PE polymer matrix, Q0(φw)
decreased monotonically at concentrations below the per-
colation threshold for any fixed frequency. For example,
Fig. 5 shows Q0(φw) as a function of the MWCNT weight
fraction at a fixed frequency, ω/2π = 0.1 Hz. This specific
frequency was chosen because it is well known that addi-
tion of nanoparticles into a polymer matrix significantly
affects the behavior at low frequencies (terminal regime).
Furthermore, Plaza et al. also used 0.1 Hz for dielectric
measurements of the conductivity of PE/MWCNTs com-
posites. Therefore, our rheological data at 0.1 Hz will be
correlated with their conductivity measurements. A sig-
nificant drop (60% decrease in Q0 relative to neat PE) was
observed for Q0(φw) until the percolation threshold was
reached. This was followed by a steep rise in Q0(φw) with
concentration above this threshold. It is important to note
that there is almost no literature available that focuses spe-
Fig. 3. Fourier intensity of the third harmonic relative to the fun-
damental harmonic, I3/1(γ0), as a function of the applied defor-
mation amplitude, γ0, at ω/2π = 0.1 Hz and 140oC for different
weight fractions of MWCNTs in the PE/MWCNTs nanocom-
posites.
Fig. 4. The intrinsic nonlinearity, Q0(ω), as a function of the applied angular frequency, ω, and the weight fraction of CNTs in the PE/
CNT composites at 140oC, (a) Q0(ω) vs. ω for PE/MWCNT composites and (b) Q0(ω) vs. ω for PE/SWCNT composites.

New way to characterize the percolation threshold of polyethylene and carbon nanotube polymer composites......
Korea-Australia Rheology J., Vol. 26, No. 3 (2014) 323
cifically on the rheological changes caused by CNT dis-
persion in a polymer matrix below the percolation
threshold. Of special interest to note is that the trend
observed for Q0(φw) as a function of the weight fraction of
MWCNTs, φw, is the same as the trend seen in the elec-
trical conductivity measurements in LAOS flow (Palza et
al., 2011). The following two important observations, (i)
Q0(ω) monotonically increases below the percolation
threshold and decreases above the percolation threshold,
and (ii) the appearance of a minimum in Q0(φw), are
explained in the following paragraphs.
To explain both observations, single mode Maxwell
(Dealy and Larson, 2011) and Pom-Pom model (McLeish
and Larson, 1998) simulations were performed where the
backbone relaxation, τ, was set to 1 sec and the modulus
was 105 Pa. The details of the Pom-Pom equations that
were used in our simulations can be found elsewhere
(Kempf et al., 2013). Fig. 6 shows the dynamic frequency
spectrum simulated using the Maxwell model and the non-
linear master curve, Q0(ω), simulated using the Pom-Pom
model for different branching degrees, q (Fig. 6a-6b). The
qualitative changes in the Q0(ω) master curve for different
branching degrees, q, were similar except for the case of
q = 1 (linear molecule) where a maximum was observed
Fig. 5. The intrinsic nonlinearity, Q0(φw), as a function of the
weight fraction of MWCNTs for PE/MWCNT composites at ω/
2π= 0.1 Hz and T=140oC where the percolation threshold is
= 1.0 wt%.φw
c
Fig. 6. The single mode Maxwell and Pom-Pom model simulations used to explain the experimental observations for the PE/MWCNT
composites at G0 = 105 Pa, τ = 1 sec, Sb = 10, where Sb is the normalized molecular weight of the backbone relative to the entanglement
molecular weight, and Sa = 4, where Sa is the normalized molecular weight of an arm relative to the entanglement molecular weight:
(a) the dynamic frequency spectrum obtained using the Maxwell model simulation, (b) the nonlinear master curve Q0(ω) obtained using
the Pom-Pom model at various number of branches, q, (c) schematic representation of the polymer composite system with increasing
weight fraction of CNTs and (d) the intrinsic nonlinearity, Q0, in the terminal regime as a function of increasing degree of branching, q.

Deepak Ahirwal, Humberto Palza, Guy Schlatter and Manfred Wilhelm
324 Korea-Australia Rheology J., Vol. 26, No. 3 (2014)
at the reptation relaxation frequency, ωd = 1/τ. From the
dynamic frequency spectrum, it is evident that, below ω <
ωd, the viscous response dominates and the polymer flow
behavior is liquid-like and, above ω > ωd, the elastic
response becomes dominant and the polymer behaves
more solid-like.
It is interesting to note in Fig. 6 that, in the liquid-like
regime, Q0(ω) is a monotonically increasing function of
the angular frequency, ω, and that, in the solid-like regime,
it is instead a monotonically decreasing function of the
angular frequency, ω. A similar trend for Q0(ω) was
observed in the experimental results for the PE/MWCNT
and PE/SWCNT composites as shown in Fig. 4. For the
simple case of a linear polymer, the transition from the liq-
uid-like regime to the solid-like regime can be monitored
by measuring the crossover in the dynamic frequency
spectrum (G’ and G’’ vs. ω), but for branched polymers it
is not necessarily true that the transition from liquid-like
to solid-like flow behavior occurs at the crossover. This
result was explained by Kempf et al. (2013) for the case
of comb polymers where the Q0(ω) master curve was used
to obtain the reptation relaxation time, τ. Using our sim-
ulations and experimental results on PE/MWCNT com-
posites and results from previous studies (Kempf et al.,
2013; Hyun and Wilhelm, 2009), we conclude that the
Q0(ω) master curve can be used to determine the per-
colation threshold or the transition from liquid-like to
solid-like flow behavior.
To explain the second observation, we first assume that
the stress response is a function of the polymer-polymer
and polymer-CNT interactions and that the CNT-CNT
interactions are negligible below the percolation threshold
(Fig. 6c). This assumption is reasonable because we know
that below this threshold there are negligible CNT-CNT
interactions. The decrease in Q0(φw) can be explained by
an increase in polymer chain stretching due to polymer-
CNT interactions. This result is, in a way, similar to the
effect of an increase in branching in a polymer because
addition of more CNTs to the polymer matrix causes the
weight fraction of the “branched” structure due to poly-
mer-CNT interactions to increase. The decrease in Q0 is,
therefore, a consequence of an increase in the average
polymer chain stretching, which is a result of the increas-
ing branch-like structure. This observation is supported by
a recently proposed analytical solution of the MSF model
(Wagner et al., 2011) using Q0(ω) (α – β) where α is the
orientation parameter and β is the stretching parameter.
Furthermore, this is consistent with our simulations as
shown in Fig. 6d. In the terminal regime, it was seen that,
as the branching parameter q increased, a decrease in Q0
was detected. The significant increase above the perco-
lation threshold can be explained by increasing contri-
butions from the CNT-CNT interactions.
It is well known that, above the percolation threshold,
the rheological and electrical properties show an asymp-
totic scaling P ~ where P represents the material
property and δ is a scaling exponent. The value of δ pro-
vides information on how strong the influence of the per-
colating network is on the rheological and electrical
properties. Fig. 7 shows the normalized electrical con-
ductivity (data taken from Palza et al., 2009) and material
parameters in the linear viscoelastic regime (G’) and the
nonlinear viscoelastic regime (Q0) as a function of φw. The
calculated scaling exponent, d, for the electrical conduc-
tivity is . For the elastic modulus, G’, it is
and for the intrinsic nonlinearity, Q0, it is
. The percolating network has the highest
effect on the electrical conductivity, σDC, followed by the
intrinsic nonlinearity, Q0 (nonlinear viscoelastic regime)
and then the elastic modulus, G’ (linear viscoelastic
regime). Interestingly, the influence of the percolating net-
work on Q0 is about a factor of 10 higher than its influence
on G’. This implies that network formation has a signif-
icantly higher effect on the parameters measured in the
nonlinear viscoelastic regime compared to those measured
in the linear viscoelastic regime. Therefore, we conclude
that Q0 is a more suitable material parameter for the detec-
tion of the percolation threshold than the elastic modulus,
G’. The zero strain intrinsic nonlinearity, Q0, could be
potentially useful in the characterization and process opti-
mization of polymer/CNT composites because of its
higher sensitivity compared to other rheological tools
available in (mostly) the linear viscoelastic regime.
4. Conclusions
The electrical and rheological percolation threshold for
the PE/MWCNT composites was found to be between 1-
3 wt% of MWCNTs. However, for the PE/SWCNT com-
∝
φw
φw
c
∼( )δ
δ 4.3 0.3±=
δ 1.7 0.7±=
δ 3.0 1.0±=
Fig. 7. The effect of the percolating network on the conductivity
(σDC) and the linear (G’) and nonlinear (Q0) viscoelastic prop-
erties for the PE/MWCNT composites at ω/2π = 0.1 Hz and T =
140oC.
New way to characterize the percolation threshold of polyethylene and carbon nanotube polymer composites......
Korea-Australia Rheology J., Vol. 26, No. 3 (2014) 325
posites, no percolation threshold was detected up to 1 wt%
of SWCNTs. A new rheological method was proposed to
detect the percolation threshold in the nonlinear viscoelas-
tic regime using the nonlinear Q0(ω) master curve for con-
ductive or nonconductive particles. A minimum was
observed in Q0(φw) as a function of the MWCNT weight
fraction, w. The decrease in Q0(φw) below the percolation
threshold was explained by increased stretching of the
polymer chains due to interactions between the PE and
CNTs. The asymptotic variation of the material param-
eters in the linear viscoelastic regime and in the nonlinear
viscoelastic regime were observed to follow the scaling
. The calculated scaling exponent in the lin-
ear viscoelastic regime (using G’) was and in
the nonlinear viscoelastic regime (using Q0) was
. The higher scaling exponent in the nonlinear
viscoelastic regime relative to that in the linear viscoelas-
tic regime implies that network formation has a more sig-
nificant effect on parameters measured in the nonlinear
viscoelastic regime.
Acknowledgments
Financial support received from the Region Alsace,
France and the Karlsruhe Institute of Technology, Ger-
many for the doctoral fellowship of Mr. Ahirwal is
acknowledged. We are thankful to Prof. Mr. Kappes (KIT)
for providing us with SWCNTs for our investigation. We
are also thankful to Dimitri Merger and Dr. Kübel for
proofreading this manuscript and for constructive discus-
sions.
References
Ahirwal, D., S. Filipe, I. Neuhaus, M. Busch, G. Schlatter, and M.
Wilhelm, 2014, Large deformation oscillatory shear and uniax-
ial extensional rheology of blends from linear and long-chain
branched polyethylene and polypropylene, J. Rheol. 58, 635-
658.
Ajayan, P.M., L.S. Schadler, C. Giannaris, and A. Rubio, 2000,
Single-Walled Carbon Nanotube–Polymer Composites:
Strength and Weakness, Adv. Mater. 12, 750-753.
Alig, I., D. Lellinger, S.M. Dudkin, and P. Pötschke, 2007, Con-
ductivity spectroscopy on melt processed polypropylene-mul-
tiwalled carbon nanotube composites: Recovery after shear and
crystallization, Polymer 48, 1020-1029.
Alig, I., D. Lellinger, M. Engle, T. Skipa, and P. Pötschke, 2008a,
Destruction and formation of a conductive carbon nanotube
network in polymer melts: In-line experiments, Polymer 49,
1902-1909.
Alig, I., T. Skipa, D. Lellinger, and P. Pötschke, 2008b, Destruc-
tion and formation of a carbon nanotube network in polymer
melts: Rheology and conductivity spectroscopy, Polymer 49,
3524-3532.
Baughman, R.H., A.A. Zakhidov, and W.A. Heer, 2002, Carbon
Nanotubes-the Route Toward Applications, Science 297, 787-
792.
Cho, K.S., K. Hyun, K.H. Ahn, and S.J. Lee, 2005, A geo-
metrical interpretation of large amplitude oscillatory shear
response, J. Rheol. 49, 747-758.
Dealy, J.M. and R.G. Larson, 2006, Structure and Rheology of
Molten Polymers: From Structure to Flow Behavior and Back
Again, Hanser Publishers.
Du, F., R.C. Scogna, W. Zhou, S. Brand, J.E. Fischer, and K.I.
Winey, 2004, Nanotube Networks in Polymer Nanocomposites:
Rheology and Electrical Conductivity, Macromolecules 37,
9048-9055.
Ewoldt, R.H., C. Clasen, A.E. Hosoi, and G.H. McKinley, 2007,
Rheological fingerprinting of gastropod pedal mucus and syn-
thetic complex fluids for biomimicking adhesive locomotion,
Soft Matter 3, 634-643.
Ewoldt, R.H., A.E. Hosoi, and G.H. McKinley, 2008, New mea-
sures for characterizing nonlinear viscoelasticity in large
amplitude oscillatory shear, J. Rheol. 52, 1427-1458.
Gurnon, A.K. and N.J. Wagner, 2012, Large amplitude oscil-
latory shear (LAOS) measurements to obtain constitutive equa-
tion model parameters: Giesekus model of banding and
nonbanding wormlike micelles, J. Rheol. 56, 333-351.
Hassanabadi, H.M., M. Abbasi, M. Wilhelm, and D. Rodrigue,
2013, Validity of the modified molecular stress function theory
to predict the rheological properties of polymer nanocom-
posites, J. Rheol. 57, 881-899.
Huang, C.L. and C. Wang, 2011, Rheological and conductive
percolation laws for syndiotactic polystyrene composites filled
with carbon nanocapsules and carbon nanotubes, Carbon 49,
2334-2344.
Hyun, K., E.S. Baik, K.H. Ahn, S.J. Lee, M. Sugimoto, and K.
Koyama, 2007, Fourier-transform rheology under medium
amplitude oscillatory shear for linear and branched polymer
melts, J. Rheol. 51, 1319-1342.
Hyun, K. and M. Wilhelm, 2009, Establishing a New Mechanical
Nonlinear Coefficient Q from FT-Rheology: First Investigation
of Entangled Linear and Comb Polymer Model Systems, Mac-
romolecules 42, 411-422.
Hyun, K., M. Wilhelm, C.O. Klein, K.S. Cho, J.G. Nam, K.H.
Ahn, S.J. Lee, R.H. Ewoldt, and G.H. McKinley, 2011, A
review of nonlinear oscillatory shear tests: Analysis and appli-
cation of large amplitude oscillatory shear (LAOS), Prog.
Polym. Sci. 36, 1697-1753.
Hyun, K., W. Kim, S.J. Park, and M. Wilhelm, 2013, Numerical
simulation results of the nonlinear coefficient Q from FT-Rhe-
ology using a single mode pom-pom model, J. Rheol. 57, 1-25.
Iijima, S., 1991, Helical microtubules of graphitic carbon, Nature
354, 56-58.
Kashiwagi, T., E. Grulke, J. Hilding, R. Harris, W. Awad, and J.
Douglas, 2002, Thermal Degradation and Flammability Prop-
erties of Poly(propylene)/Carbon Nanotube Composites, Mac-
romol. Rapid Commun. 23, 761-765.
Kempf, M., D. Ahirwal, M. Cziep, and M. Wilhelm, 2013, Syn-
thesis, linear and non-linear melt rheology of well-defined
comb-architectures of PS and PpMS with a low and controlled
degree of long-chain branching, Macromolecules 16, 4978-
P φw
φw
c
–( )δ
∝
δ 1.7 0.7±=
δ 3.0 1.0±=
Deepak Ahirwal, Humberto Palza, Guy Schlatter and Manfred Wilhelm
326 Korea-Australia Rheology J., Vol. 26, No. 3 (2014)
4994.
Kharchenko, S.B., J.F. Douglas, J. Obrzut, E.A. Grulke, and K.B.
Migler, 2004, Flow-induced properties of nanotube-filled poly-
mer materials, Nat. Mater. 3, 564-568.
Kota, A.K., B.H. Cipriano, M.K. Duesterberg, A.L. Gershon, D.
Powell, S.R. Raghavan, and H.A. Bruck, 2007, Electrical and
Rheological Percolation in Polystyrene/MWCNT Nanocom-
posites, Macromolecules 40, 7400-7406.
Lebedkin, S., P. Schweiss, B. Renker, S. Malik, F. Hennrich, M.
Neumaier, C. Stoermer, and M.M. Kappes, 2002, Single-wall
carbon nanotubes with diameters approaching 6 nm obtained
by laser vaporization, Carbon 40, 417-423.
Lee, S.H., M.W. Kim, S.H. Kim, and J.R. Youn, 2008, Rheo-
logical and electrical properties of polypropylene/MWCNT
composites prepared with MWCNT masterbatch chips, Eur.
Polym. J. 44, 1620-1630.
Lim, H.T., K.H. Ahn, J.S. Hong, and K. Hyun, 2013, Nonlinear
viscoelasticity of polymer nanocomposites under large ampli-
tude oscillatory shear flow, J. Rheol. 57, 767-789.
McNally, T., P. Pötschke, P. Halley, M. Murphy, D. Martin, S.E.J.
Bell, G.P. Brennan, D. Bein, P. Lemoine, and J.P. Quinn, 2005,
Polyethylene multiwalled carbon nanotube composites, Poly-
mer 46, 8222-8232.
McLeish, T.C.B. and R.G. Larson, 1998, Molecular constitutive
equations for a class of branched polymers: The pom-pom
polymer, J. Rheol. 42, 81-110.
Ramasubramaniam, R., J. Chen, and H. Liu, 2003, Homogeneous
carbon nanotube/polymer composites for electrical applica-
tions, Appl. Phys. Lett. 83, 2928-2930.
Reinheimer, K., M. Grosso, and M. Wilhelm, 2011, Fourier
Transform Rheology as a universal non-linear mechanical
characterization of droplet size and interfacial tension of dilute
monodisperse emulsions, J. Colloid Interf. Sci. 360, 818-825.
Reinheimer, K., M. Grosso, F. Hetzel, J. Kubel, and M. Wilhelm,
2012, Fourier Transform Rheology as an innovative mor-
phological characterization technique for the emulsion volume
average radius and its distribution, J. Colloid Interf. Sci. 380,
201-212.
Rogers, S.A. and M. P. Lettinga, 2012, A sequence of physical
processes determined and quantified in large-amplitude oscil-
latory shear (LAOS): Application to theoretical nonlinear mod-
els, J. Rheol. 56, 1-25.
Sahimi, M., 1994, Application of percolation theory, Taylor &
Francis.
Schlatter, G., G. Fleury, and R. Muller, 2005, Fourier Transform
Rheology of Branched Polyethylene: Experiments and Models
for Assessing the Macromolecular Architecture, Macromol-
ecules 38, 6492-6503.
Skipa, T., D. Lellinger, W. Böhm, M. Saphiannnikova, and I.
Alig, 2010, Influence of shear deformation on carbon nanotube
networks in polycarbonate melts: Interplay between build-up
and destruction of agglomerates, Polymer 51, 201-210.
Sun, G., G. Chen, Z. Liu, and M. Chen, 2010, Preparation, crys-
tallization, electrical conductivity and thermal stability of syn-
diotactic polystyrene/carbon nanotube composites, Carbon 48,
1434-1440.
Sun, T., R.R. Chance, W.W. Graessley, and D.J. Lohse, 2004, A
Study of the Separation Principle in Size Exclusion Chro-
matography, Macromolecules 37, 4304-4312.
Terrones, M., 2003, Science and technology of twenty-first cen-
tuary: Synthesis, Properties, and Applications of Carbon Nan-
otubes, Ann. Rev. Mater. Res. 33, 419-501.
Vigolo, B., C. Coulon, M. Maugey, C. Zakri, and P. Poulin, 2005,
An Experimental Approach to the Percolation of Sticky Nan-
otubes, Science 309, 920-923.
Vittorias, I. and M. Wilhelm, 2007, Application of FT Rheology
to Industrial Linear and Branched Polyethylene Blends, Mac-
romol. Mater. Eng. 292, 935-948.
Vittorias, I., D. Lilge, V. Baroso, and M. Wilhelm, 2011, Linear
and non-linear rheology of linear polydisperse polyethylene,
Rheol. Acta 50, 691-700.
Wagner, M.H., V.H. Rolon-Garrido, K. Hyun, and M. Wilhelm,
2011, Analysis of medium amplitude oscillatory shear data of
entangled linear and model comb polymers, J. Rheol. 55, 495-
516.
Wilhelm, M., 2002, Fourier-Transform Rheology, Macromol.
Mater. Eng. 287, 83-105.
Wilhelm, M., K. Reinheimer, and J. Kubel, 2012, Optimizing the
Sensitivity of FT-Rheology to Quantify and Differentiate for
the First Time the Nonlinear Mechanical Response of Dis-
persed Beer Foams of Light and Dark Beer, Z. Phys. Chem.
226, 547-567.
Winter, H.H. and M. Mours, 1997, Rheology of Polymers Near
Liquid-Solid Transitions, Adv. Polym. Sci. 134, 165-234.