Embed Size (px)
Citation preview

NEW SOUTH WALES TRANSMISSION ANNUAL PLANNING REPORT
2019
NEW SOUTH WALES TRANSMISSION ANNUAL PLANNING REPORT
2019

ForewordAustralia’s energy system is transitioning. Its development is being shaped by consumer demand, new technologies and global capital markets which favour investment in renewables. Transmission is central to the new energy system, linking new generation to demand centres, maintaining system security and delivering lowest possible energy costs.
The National Electricity Market (NEM) is transforming at a rapid rate and moving toward a system that requires the integration of more variable and distributed energy resources, driven by lower cost renewable generation, significant reductions in technology costs, changing consumer preferences, and the progressive retirement of coal-fired power stations over the next two decades. Transmission networks help firm intermittent renewables in a cost-effective manner, by using the high voltage network and interconnection, supporting the flow of energy between regions and take advantage of diverse weather patterns.
TransGrid is developing techniques and technologies to ensure network resilience and performance, as renewable connections increase. In the past three years, we have facilitated connection of over 1,000 MW of renewable generation to the network, and have managed the integration of higher levels of intermittent generation without destabilising the grid.
The 2019 Transmission Annual Planning Report (TAPR) provides an assessment of the capability and limitations of the New South Wales’ (NSW) transmission network over the next 10 years. The report outlines the outcomes of our planning review, and provides advance information to our stakeholders and market participants on the nature and location of emerging network constraints.
The challenges currently facing the electricity market and a pathway for transition, were identified in the Independent Review into the Future Security of the National Electricity Market (the Finkel Review) published in 2017. The Finkel Review listed the objectives of security, reliability, emissions reduction and customer reward for the energy sector. The review noted that delivering on these objectives would rely on strengthened governance, better system planning and on an orderly transition.
After the release of the Finkel Review, the Australian Energy Market Operator (AEMO) released its inaugural Integrated System Plan (ISP) in 2018. The ISP provides a roadmap to show how our energy system will adapt to the economic and technological developments that are now shaping energy systems both in Australia and globally. The ISP calls for significant transmission investment to respond to and underpin the growth of renewable energy in the NEM.
Many of the transmission investments recommended in the ISP are in NSW, which underscores the centrality of the State’s transmission network within the NEM and the role transmission will play in Australia’s energy future.
The ISP specifically states: � small scale upgrades to connections between NSW and
Queensland (QNI) and between NSW and Victoria (VNI) to be delivered by 2022;
� a new interconnector between South Australia and NSW (Project EnergyConnect, where TransGrid is partnering with ElectraNet; and,
� augmentation of the State’s southern shared network (HumeLink) arising from constraints in transfer capacity to major load centres in NSW.
To improve system-wide co-ordination, TransGrid is working with AEMO on the integration of large-scale renewable energy. To provide a future supply of safe, reliable and affordable electricity for Inner Sydney, TransGrid is delivering a new transmission cable project from Potts Hill to Alexandria.
TransGrid operates a high performing network with levels of reliability that exceed our obligations to NSW and the ACT. We use real-time condition monitoring in TransGrid’s Asset Monitoring Centre, apply a condition-based maintenance regime and qualitative and quantitative risk-based targeted asset replacement, which is underpinned by robust investment governance.
TransGrid is proudly one of the first signatories to The Energy Charter, a world-first, which publicly commits energy businesses in the NEM to report on actions taken to provide more benefits to consumers.
As the NEM evolves this will continue to fundamentally impact how the energy system operates. TransGrid is taking a key role in the evolution of the energy system, deploying our expertise to ensure the best outcomes for consumers.
Gerard Reiter Executive Manager/ Network Planning & Operations June 2019
1
Foreword
DisclaimerThe NSW Transmission Annual Planning Report (TAPR) 2019 is prepared and made available solely for information purposes. It is made available on the understanding that TransGrid and/or its employees, agents and consultants are not engaged in rendering professional advice. Nothing in this document is a recommendation in respect of any possible investment.
The information in this document reflects the forecasts, proposals and opinions adopted by TransGrid as at 30 June 2019, other than where otherwise specifically stated. Those forecasts, proposals and opinions may change at any time without warning. Anyone considering this document at any date should independently seek the latest forecasts, proposals and opinions.
This document includes information obtained from the AEMO and other sources. That information has been adopted in good faith without further enquiry or verification.
The information in this document should be read in the context of the Electricity Statement of Opportunities, Integrated System Plan, and the National Transmission Network Development Plan published by AEMO and other relevant regulatory consultation documents. It does not purport to contain all of the information that AEMO, a prospective investor, Registered Participant or potential participant in the NEM, or any other person or interested parties may require for making decisions. In preparing this document it is not possible, nor is it intended, for TransGrid to have regard to the investment objectives,
financial situation and particular needs of each person or organisation which reads or uses this document.
In all cases, anyone proposing to rely on or use the information in this document should: 1. Independently verify and check the currency, accuracy,
completeness, reliability and suitability of that information2. Independently verify and check the currency, accuracy,
completeness, reliability and suitability of reports relied on by TransGrid in preparing this document
3. Obtain independent and specific advice from appropriate experts or other sources.
Accordingly, TransGrid makes no representations or warranty as to the currency, accuracy, reliability, completeness or suitability for particular purposes of the information in this document.
Persons reading or utilising this TAPR 2019 acknowledge and accept that TransGrid and/or its employees, agents and consultants have no liability for any direct, indirect, special, incidental or consequential damage (including liability to any person by reason of negligence or negligent misstatement) for any damage resulting from, arising out of or in connection with, reliance upon statements, opinions, information or matter (expressed or implied) arising out of, contained in or derived from, or for any omissions from the information in this document, except insofar as liability under any NSW and Commonwealth statute cannot be excluded.
Purpose of the Transmission Annual Planning ReportThe National Electricity Rules (NER) requires TransGrid to conduct an annual planning to undertake an annual planning review and publish the results by 30 June each year. The purpose of the review is to identify an optimum level of transmission investment that will enable TransGrid to deliver at an efficient cost.
The review involves joint planning with each of the distribution network service providers in New South Wales (NSW) (Ausgrid, Endeavour Energy, and Essential Energy) and the Australian Capital Territory (ACT) (Evoenergy) as well as with Powerlink in Queensland, AusNet Services in Victoria, ElectraNet in South Australia and the Australian Energy Market Operator (AEMO). The objective of joint planning is to work together to develop the power system in the most efficient way for the benefit of consumers.
The annual planning review takes into account the most recent forecasts of generation planting and retirement, state and local demand and condition and ratings of existing network assets. These inputs are used to identify and analyse present and emerging network constraints and asset renewal requirements.
In particular, our review: � Identifies emerging constraints within the network and
possible options to alleviate them; � Assesses assets identified as reaching the end of their
serviceable lives, and confirms the ongoing requirements for the asset and considers options to address this; and
� Provides information to interested parties so that they may propose options to meet those needs, including non-network services.
Identified needs and opportunities, irrespective of the trigger for the need, are optimised within our network investment process. This is designed to respond to the changing needs of stakeholders and ensure the efficient delivery of our capital program.
As the Jurisdictional Planning Body for NSW, we provide input to AEMO’s Electricity Statement of Opportunities (ESOO) and Integrated System Plan (ISP) which incorporates the National Transmission Network Development Plan (NTNDP). Broadly, the ESOO considers the adequacy of generation while the ISP facilitates the efficient development and connection of new generation across the NEM. These reports serve as inputs to the TAPR, and we report on relevant matters arising from these publications.
1Foreword

About TransGridTransGrid operates and manages the high voltage electricity transmission network in NSW and the ACT. The network connects more than three million homes, businesses and communities to a safe, reliable and affordable electricity supply.
The transmission network transports electricity from generation sources such as wind, solar, hydro, gas and coal power plants to large directly connected industrial customers
and the distribution networks that deliver it to homes and businesses. Comprising 104 substations, over 13,000 kilometres of high voltage transmission lines, underground cables and five interconnections to QLD and VIC, the network is instrumental to the electricity system and economy and facilitates energy trading between Australia’s largest states.
Figure 1 sets out TransGrid’s role in the electricity supply chain. Figure 2 and Figure 3 show TransGrid’s network.
Figure 1 – TransGrid within the electricity supply chain
Figure 2 – TransGrid’s electricity network map
Figure 3 – TransGrid’s electricity network map – Inset
INSET
Red Cliffs
Dederang
Wodonga
Bulli Creek
Mudgeeraba
Yanco
Griffith
Buronga
Broken Hill
FinleyDeniliquin
Darlington Point
AlburyHume
Cooma
Munyang
Snowy Adit
Queanbeyan
Tumut
MurrumburrahBalranald
Coleambally
Murray
Upper Tumut
Lower Tumut
ANMJ indera
Wagga 132Burrinjuck
WaggaUranquinty
Wagga North
Williamsdale
Geehi
Blowering
Canberra
Jindabyne
Morven
YassMarulan
Cowra
Kangaroo Valley
Panorama
Molong
Orange
Parkes
Forbes
DaptoAvon
Wallerawang330
Gadara
Capital Wind Farm
Bannaby
Manildra
OrangeNorth Ilford
Murrumbateman
Mt Piper 132
Mt Piper 500
Gullen Range
Wallerawang132
BerylWellington
Bayswater Liddell
Muswellbrook
Tamworth 330
Armidale
Tamworth 132
Gunnedah
Narrabri
Moree
Inverell Glen InnesKoolkhan
Coffs Harbour
Nambucca
Kempsey
Port Macquarie
Raleigh
Wollar
Macksville
Boambee South
Stroud
Hawks Nest
Mudgee
Burrendong
Wellington Town
Herons Creek
BoggabriEast
BoggabriNorth
Dorrigo
DumaresqLismore
Tenterfield
Directlink
Casino
Taree
330
Guthega
Silverton
Bodangora
Crookwell 2
Sapphire WhiteRock
OPERATING SYSTEM VOLTAGESSubstations500 kV Transmission LinesSubstations330 kV Transmission LinesSubstations220 kV Transmission LinesSubstations132 kV Transmission Lines
Interstate Exchange Point
330 kV Underground CableCustomer Exchange Point
INSET
Regentville Sydney West
Sydney South
Liverpool
Ingleburn
to Bannaby
Haymarket
Macarthur
to Wallerawang
to Daptoto Avon
Beaconsfield
Mount Druitt
Holroyd Rookwood Road
Eraring
Vales Point
Vineyard
to Liddell
Kemps Creek
Tomago
Munmorah
Tuggerah
Sydney East
NewcastleWaratah West
Sydney North
Mount Colah
Brandy Hill to Stroud
OneSteel
to Bayswater
Ab
out Tra
nsG
rid
2 NSW Transmission Annual Planning Report 2019 3About TransGrid
Executive SummaryTransGrid plays a critical role in providing the platform for the evolving energy market, by expanding our network efficiently and developing new services to meet changing customer needs.
Transformation of the energy system:
Chapter 1 In the new energy system, transmission is central to the changing energy landscape and a timely and well delivered transition is essential to reduce electricity prices, maintain the reliability of the electricity system and lower carbon emissions. As the transition continues and the generation mix evolves, we are, however seeing emerging congestion in the power system.
Transmission development is essential to open capacity for new low-cost generation to enter the wholesale market, improve competition and place downward pressure on price and cost to consumers. Opening capacity for additional generation is essential to maintaining the reliability and resilience of the power system.
Transmission network developments:
Chapter 2 Our transmission network developments have been selected to transition to the energy system of the future, and ensure network resilience. We are developing plans in accordance with AEMO’s Integrated System Plan (the ISP) to enhance the capacity of interconnections with Queensland, Victoria, and South Australia, and between the Snowy Mountains and Sydney.
We aim to create value for society from reinvesting in our network, replacing or refurbishing transmission lines, substation assets and secondary systems to ensure network reliability.
Network support opportunities:
Chapter 3TransGrid is deploying innovative approaches and technologies that allow us to get more output from our existing network, reducing the need to invest in new transmission assets to meet growing customer needs.
We have identified two locations where an estimated reduction in forecast load would defer a forecast constraint for a period of 12 months.
A Request for Proposals has been issued for non-network solutions in Inner Sydney, and four further locations have been identified where there may be potential to issue Requests for Proposals for non-network solutions in the next 10 years.
Forecasts and planning assumptions:
Chapter 4Annual NSW & ACT energy consumption is forecast to grow at an average rate of 0.5% per annum over the next ten years under the most likely scenario, due to population and economic growth.
1,600 MW of new generation has committed to connect at various locations in NSW. This is expected to continue to grow as advances in renewable generation technologies improve the cost competitiveness of new renewable generation.
NSW transmission reliability standards commenced from 1 July 2018. We have assessed that the transmission network complies with the standards from 1 July 2018. However, during the next ten years, expected changes at Broken Hill will likely require transmission developments to maintain compliance with Broken Hill BSP. A project to address this has been included in Chapter 2.
Table of ContentsForeword 1About TransGrid 2Executive Summary 4
1. Transformation of the energy system 6
1.1 Transformation of the energy system 7
1.2 Reducing prices 8
1.3 Lowering emissions 9
1.4 Maintaining reliability 11
1.5 A way forward 13
2. Transmission network developments 14
2.1 Proposed major developments 15
2.2 Forecast of constraints 22
2.3 Subsystem developments 22
2.4 Replacement projects 35
2.5 Asset retirements and deratings 40
2.6 Regulatory Investment Test for Transmission (RIT-T) schedule 41
2.7 Changes from TAPR 2018 41
3. Network support opportunities 42
3.1 Opportunities for network support 43
3.2 Changes from TAPR 2018 43
4. Forecasts and planning assumptions 44
4.1 Key highlights 45
4.2 TransGrid’s 2019 NSW region forecast 46
4.3 Bulk supply point forecasts 55
4.4 TransGrid’s 2019 forecast vs AEMO’s 2018 ESOO forecast for NSW region 57
4.5 Joint planning 59
4.6 Assessment of power system security 60
4.7 Service standards 62
4.8 Alignment with ESOO and NTNDP 63
4.9 Changes from TAPR 2018 63
Appendix 1: TransGrid 2019 NSW region load forecasting methodology 64
Appendix 2: Individual bulk supply point projections 80
Appendix 3: How we plan 86
Appendix 4: Line utilisation report 100
Appendix 5: Transmission constraints 112
Appendix 6: Glossary 123
4 NSW Transmission Annual Planning Report 2019 5Table of Contents

Cha
pter 1
Chapter 1
Transformation of the energy system
� A timely and well delivered transition is essential toreduce electricity prices, maintain the reliability of theelectricity system and lower carbon emissions. As the transition continues and the generation mix evolves, we are, however seeing emerging congestion in the power system
� Transmission development is essential to opencapacity for new low-cost generation to enter thewholesale market, improve competition and place downward pressure on the wholesale market price and cost to consumers
� Transmission development is essential to opencapacity for new low-emissions generation and enableelectrification and fuel switching in other sectors such as transport
� Transmission development is essential to maintainthe reliability and resilience of the power system, byopening capacity for additional generation to reach the major load centres and additional energy to be imported from adjacent states.
1.1 Transformation of the energy system
Australia is transitioning to the energy system of the future. Across the system, new supply technologies are being introduced at unprecedented scale and pace.
In New South Wales (NSW), we have reached a record level of interest in the connection of new generation. The pipeline of generator connection enquiries now totals over 48,000 megawatts.
Last year, we connected almost 500 megawatts of renewable generation, and in the coming year, we expect to connect over 2,000 megawatts of new renewables.
The need for new, low-cost generation comes at a time of growing energy use in NSW. Electricity consumption has grown each year over the last five years, driven by economic growth, population growth, residential housing
development, increasing mining activity and development of new transport infrastructure. The growth in grid-supplied electricity consumption is set to continue.
At the same time, traditional baseload generation is progressively withdrawing from the power system. In the last 10 years, coal-fired generators at Munmorah, Redbank and Wallerawang have retired. In the next 5 years, Liddell Power Station will retire in 2022. Other coal-fired generators are expected to reach the end of their technical lives in the late 2020s and 2030s.
A timely and well delivered transition is essential to reduce electricity prices, maintain the reliability of the electricity system and lower carbon emissions. As the transition continues and the generation mix evolves, we are, however seeing emerging congestion in the power system.
Figure 4 shows the existing and forecast increase in congestion between areas with generator connection interest, on and west of the Great Dividing Range, and the major demand centres, on the east coast.
Figure 4 – Congestion at times of high electricity demand
SYDNEY
Existing (2019)
Area with generator connection interest
Area with some congestion
Area with material congestion
SYDNEY
With all connection applications progressed (estimated 2021)
Area with generator connection interest
Area with some congestion
Area with material congestion
SYDNEY
With committed generation (estimated 2020)
Area with generator connection interest
Area with some congestion
Area with material congestion
7Chapter 1 | The energy system of the future
Cha
pter 1
We expect that as new generation continues to connect, congestion will reach a level at which further new generation would displace other recently connected generation. This is forecast to happen by 2020 in southern NSW, and 2021 in central-western and northern NSW.
Additional transmission capacity is essential to integrate further new generation to enable a timely and well-delivered
transition. Insufficient or delayed development of the transmission system will hinder investment in new, low-cost generation and lead to sub-optimal outcomes for consumers.
Transmission development is essential to deliver affordable, low emissions and reliable electricity.
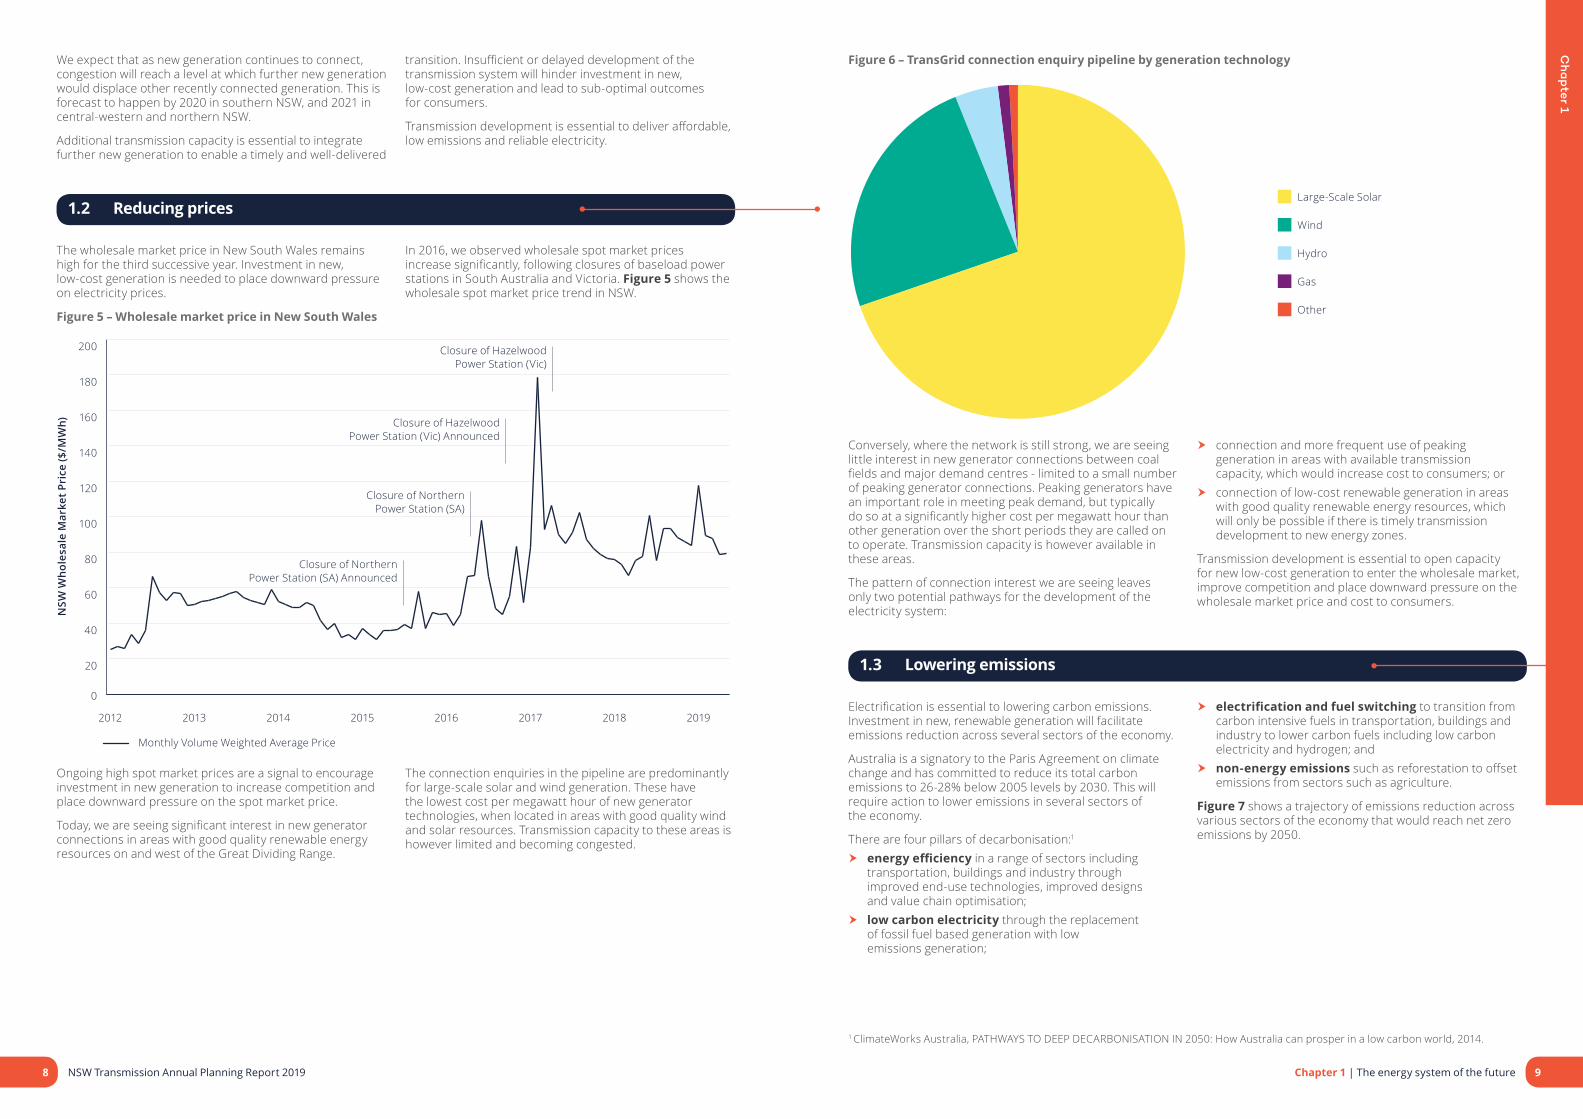
1.2 Reducing prices
The wholesale market price in New South Wales remains high for the third successive year. Investment in new, low-cost generation is needed to place downward pressure on electricity prices.
In 2016, we observed wholesale spot market prices increase significantly, following closures of baseload power stations in South Australia and Victoria. Figure 5 shows the wholesale spot market price trend in NSW.
Figure 5 – Wholesale market price in New South Wales
0
20
40
60
80
100
120
140
160
180
200
Monthly Volume Weighted Average Price
NSW
Who
lesa
le M
arke
t Pri
ce ($
/MW
h)
20192018201720162015201420132012
Closure of HazelwoodPower Station (Vic)
Closure of HazelwoodPower Station (Vic) Announced
Closure of NorthernPower Station (SA)
Closure of NorthernPower Station (SA) Announced
Ongoing high spot market prices are a signal to encourage investment in new generation to increase competition and place downward pressure on the spot market price.
Today, we are seeing significant interest in new generator connections in areas with good quality renewable energy resources on and west of the Great Dividing Range.
The connection enquiries in the pipeline are predominantly for large-scale solar and wind generation. These have the lowest cost per megawatt hour of new generator technologies, when located in areas with good quality wind and solar resources. Transmission capacity to these areas is however limited and becoming congested.
Figure 6 – TransGrid connection enquiry pipeline by generation technology
Other
Gas
Hydro
Wind
Large-Scale Solar
Conversely, where the network is still strong, we are seeing little interest in new generator connections between coal fields and major demand centres - limited to a small number of peaking generator connections. Peaking generators have an important role in meeting peak demand, but typically do so at a significantly higher cost per megawatt hour than other generation over the short periods they are called on to operate. Transmission capacity is however available in these areas.
The pattern of connection interest we are seeing leaves only two potential pathways for the development of the electricity system:
� connection and more frequent use of peaking generation in areas with available transmission capacity, which would increase cost to consumers; or
� connection of low-cost renewable generation in areas with good quality renewable energy resources, which will only be possible if there is timely transmission development to new energy zones.
Transmission development is essential to open capacity for new low-cost generation to enter the wholesale market, improve competition and place downward pressure on the wholesale market price and cost to consumers.
1.3 Lowering emissions
Electrification is essential to lowering carbon emissions. Investment in new, renewable generation will facilitate emissions reduction across several sectors of the economy.
Australia is a signatory to the Paris Agreement on climate change and has committed to reduce its total carbon emissions to 26-28% below 2005 levels by 2030. This will require action to lower emissions in several sectors of the economy.
There are four pillars of decarbonisation:1
� energy efficiency in a range of sectors including transportation, buildings and industry through improved end-use technologies, improved designs and value chain optimisation;
� low carbon electricity through the replacement of fossil fuel based generation with low emissions generation;
� electrification and fuel switching to transition from carbon intensive fuels in transportation, buildings and industry to lower carbon fuels including low carbon electricity and hydrogen; and
� non-energy emissions such as reforestation to offset emissions from sectors such as agriculture.
Figure 7 shows a trajectory of emissions reduction across various sectors of the economy that would reach net zero emissions by 2050.
1 ClimateWorks Australia, PATHWAYS TO DEEP DECARBONISATION IN 2050: How Australia can prosper in a low carbon world, 2014.
8 NSW Transmission Annual Planning Report 2019 9Chapter 1 | The energy system of the future

Cha
pter 1
The forecast increase in electricity consumption from electric vehicles has been taken into account in the forecasts in this report.
Fuel switchingEmerging low emissions fuel technologies such as hydrogen have potential for use in the energy system of the future. These technologies have several applications in transportation, energy storage, dispatchable power generation and as a substitute for natural gas.
Hydrogen can be produced from renewable energy. While hydrogen production is energy intensive and production costs are currently high, the costs are expected to halve by the mid-2020s as global investment increases.
Large-scale production of hydrogen by electrolysis would significantly increase demand for electricity in Australia and the need for additional renewable generation capacity to be connected to the grid.
Transmission development is essential to open capacity for new low-emissions generation and enable electrification and fuel switching in other sectors such as transport.
1.4 Maintaining reliability
Consumers are still relying on the power system, with grid-supplied energy consumption increasing. Leading indicators however are showing a trend towards a less reliable power system.
Over the last 10 years, we have observed a tightening of the supply-demand balance in New South Wales following retirements of baseload generators in several states. The retirement of baseload generators is forecast to continue, as shown in Figure 9.
Figure 9 – NEM coal generator operating lives to 20502
0
5,000
10,000
15,000
20,000
25,000
Gen
erat
ion
capa
city
(MW
)
Liddell
Vales Point
Yallourn
Gladstone
Eraring
Bayswater
TarongCallide B
Mount PiperLoy Yang BStanwell
LoyYang A
2018
2019
2020
2021
2022
2023
2024
2025
2026
2027
2028
2029
2030
2031
2032
2033
2034
2035
2036
2037
2038
2039
2040
2041
2042
2043
2044
2045
2046
2047
2048
2049
2050
Remaining coal generationQueenslandNew South WalesVictoria
The tightening of the supply-demand balance has increased the likelihood of load shedding and decreased the resilience of the power system to major disturbances.
Although the greatest risk of load shedding has traditionally been at times of high peak demand, it has recently started to become apparent at moderate peak demand when several baseload generating units are unavailable.
When there is tight supply-demand balance in real time, AEMO publishes a notice of “lack of reserve”. There are three levels of lack of reserve that have increasing severity:
� LOR 1 – The amount of supply in reserve is sufficient for the loss of only one large generating unit
� LOR 2 – The amount of supply in reserve is insufficient for the loss of one large generating unit, and load shedding would eventuate
� LOR 3 – Load shedding is being undertaken.
Figure 10 shows an increasing trend in the number of lack of reserve conditions, which indicates that the supply-demand balance is at risk more often. It also shows a trend of increasing severity of the lack of reserve conditions, which indicates that the supply-demand balance is becoming tighter.
At the same time, energy consumption in NSW is increasing and forecast to continue to increase.
Figure 7 – Trajectory to reach net zero emissions by 2050M
tCO
2e
-700
-600
-500
-400
-300
-200
-100
0
100
200
300
400
500
600
2016 2020 2024 2028 2032 2036 2040 2044 2048 2052 2056 2060
Electricity generation Other stationary energyTransport Fugitive emissions
Industrial processes Agriculture Waste Land Use Change/ Forestry
Total Electricity Supply Industry Key Role
Source: CSIRO, Australian National Outlook 2019 Technical Report, April 2019.
The electricity supply industry is essential to delivering around half of the emissions reduction required to reach zero net emissions. These include:
� introducing new, low carbon sources of electricity generation;
� enabling electrification of transportation (including electric vehicles), buildings and industry with electricity from low carbon generation; and
� enabling fuel switching by powering the transition to emerging low emissions fuel technologies such as hydrogen.
Low carbon sources of electricity generationGeneration technologies such as large-scale solar and wind are low carbon sources of generation. This generation is most efficiently located in areas with the best available fuel source.
In NSW, the areas of readily available fuel source are on and west of the Great Dividing Range.
ElectrificationThe electricity supply industry has a key role in decarbonisation through electrification of other sectors such as transportation. The emergence of electric vehicles facilitates the progressive replacement of liquid fuels such as petrol and diesel fuel with electricity from low emissions grid-supplied generation.
Sales of electric vehicles are expected to grow at an increasing rate, after they reach price parity with internal combustion engine vehicles at around 2023/24. The forecast of electric vehicle sales used in TransGrid’s demand forecast for NSW is shown in Figure 8.
Figure 8 – Forecast cumulative electric vehicle sales in NSW
Cum
ulat
ive
EV S
ales
(mill
ions
)
0.0
0.2
0.4
0.6
0.8
1.0
1.2
1.4
1.6
1.8
2.0
FY38FY37FY36FY35FY34FY33FY32FY31FY30FY29FY28FY27FY26FY25FY24FY23FY22FY21FY20FY19
Source: Energeia 2 Australian Energy Council, 2016. Based upon announced retirement date or 50th year from full operation
10 NSW Transmission Annual Planning Report 2019 11Chapter 1 | The energy system of the future

Cha
pter 1
Figure 10 – Trend in lack of reserve conditions in NSW
0
1
2
3
4
5
6
7
8
2018201720162015201420132012
Num
ber
of A
ctua
l Lac
k of
Res
erve
Not
ices
LOR 3LOR 2LOR 1
Figure 11 – Energy consumption forecast for NSW
0
10,000
20,000
30,000
40,000
50,000
60,000
70,000
80,000
90,000
100,000
GW
h
Forecast energy sent out
2028/29
2027/28
2026/27
2025/26
2024/25
2023/24
2022/23
2021/22
2020/21
2019/20
2018/19
2017/18
2016/17
2015/16
2014/15
2013/14
2012/13
2011/12
2010/11
2009/10
2008/09
2007/08
Energy sent out (native grid energy)Energy EfficiencyPV self generationVehicle charging and stationary batteries
ResidentialOther non-residentialMajor industrial (spot loads)
Considered together, these trends are leading indicators of an increased likelihood of load shedding in NSW in the future.
This is consistent with AEMO’s projection of an emerging and increasing reliability gap after the retirement of Liddell
Power Station.3 To maintain reliability and resilience of the power system to major disturbances, further new generation is required. The introduction of new dispatchable generation, or new intermittent generation firmed via geographical diversity and storage, will assist to maintain the reliability of the power system.
Further, improved interconnection to adjacent states will allow better sharing of existing generation across the NEM and also assist to maintain the reliability of the power system.
Transmission development is essential to maintain the reliability and resilience of the power system, by opening capacity for additional generation to reach the major load centres and additional energy to be imported from adjacent states.
1.5 A way forward
To reduce prices, lower emissions and maintain reliability, transmission development is essential. TransGrid has a plan for the transmission network in NSW to underpin the transition to the energy system of the future.
The plan is consistent with AEMO’s Integrated System Plan and the NSW Government’s Transmission Infrastructure Strategy and will provide the transmission infrastructure that will be the platform for this transition.
Existing transmission infrastructure will continue to be well utilised, and will be complemented by transmission
developments to reach the best resource areas for low-cost, low-emissions generation that are along and west of the Great Dividing Range.
The transmission development in the plan is estimated at a modest 5% of the overall cost of the transition.
The immediate developments in the plan, that will be required over the next 10 years, are set out in Chapter 2 of this report.
Figure 12 – Plan for the transmission network in NSW
SYDNEY
QNI Upgrade&
New England Energy Zone
Central-West Energy Zone
Project EnergyConnect&
South-West Energy Zone&
HumeLink
SnowyLink South
Area with generator connection interest
NSW Government energy zone
Existing transmission infrastructure
New transmission developments (ISP)
New transmission developments (Energy Zones)
3 AEMO, 2018 Electricity Statement of Opportunities, August 2018.
12 NSW Transmission Annual Planning Report 2019 13Chapter 1 | The energy system of the future

Cha
pter 2
2.1 Proposed major developments
TransGrid has an unprecedented volume of generation connection enquiries with over 48,000 MW of potential solar, wind and hydro projects at various stages of development. Most of these enquiries are seeking to connect to remote locations where the existing network capacity is limited. At the same time, large baseload generators are projected to retire, making the integration of new generation essential to maintain secure supply and provide effective competition in the wholesale market. In our 2018 annual planning review, we identified possible major network developments to address emerging constraints and support the connection of new renewable generation. These major projects include:
� Project EnergyConnect – a new interconnector betweenNSW and South Australia
� Expanding NSW to Queensland TransmissionTransfer Capacity
� Victoria to NSW Interconnector Upgrade � Reinforcement of the Southern NSW network � Support Central Western NSW Network for Renewables � Support North Western NSW Network for Renewables.
These proposed major developments align with the theme of AEMO’s ISP of greater interconnection within the NEM and supporting or facilitating the connection of large-scale energy zones.
The ISP, released by AEMO in July 2018, recommended several investments in transmission which should be undertaken and completed as soon as practical (called “Group 1 Development”). These developments include investment to expand NSW to Queensland transmission transfer capacity and Victoria to NSW interconnector upgrade. The ISP “Group 2 Development” forecast projects include a South Australia to NSW interconnector, which is expected to provide market benefits over the longer-term. The ISP also demonstrated the economic value of increasing transfer capacity from the Snowy Mountains to Sydney to efficiently support the transition to a lower emission power system, including in response to the development of Snowy 2.0 and new renewable generation in southern and south-western NSW.
2.1.1 Project EnergyConnect
Figure 13 – NSW to SA Interconnector preferred option
NEW SOUTH WALES
SOUTHAUSTRALIA
VICTORIA
QUEENSLAND
RobertstownBuronga
Wagga Wagga
DarlingtonPoint
~800 MW
Source: ElectraNet SAET PSCR
Chapter 2
Transmission network developments
� Our transmission network developments have beenselected to transition to the energy system of thefuture, and ensure network resilience
� We are developing plans in accordance with AEMO’sIntegrated System Plan (the ISP) to enhance thecapacity of interconnections with Queensland, Victoria, and South Australia, and between the Snowy Mountains and Sydney
� We plan to replace or refurbish transmission lines,substation assets and secondary systems to ensurenetwork reliability.
15Chapter 2 | Transmission network developments

Cha
pter 2
The South Australia Energy Transformation (SAET) RIT-T, completed by ElectraNet in February 2019, confirms that a new 330 kV interconnector between South Australia and NSW will deliver substantial economic benefits as soon as it can be built. This project, Project EnergyConnect4, is expected to deliver net market benefits of approximately $900 million including wholesale market fuel cost savings in excess of $100 million/year as soon as it is energised.
The new interconnector will provide diverse low-cost renewable generation sources to help service NSW demand going forward, particularly as existing coal-fired generators retire, and avoid substantial capital cost associated with enabling greater integration of renewables in the NEM.
The preferred interconnection option includes: � A new 330 kV double circuit line between Robertstown
and Buronga; � A new 330 kV double circuit line between Buronga and
Darlington Point; � A new single circuit 330 kV line between Darlington Point
and Wagga Wagga;
� A new 330 kV substation at Robertstown, including two275/330 kV transformers at Robertstown;
� New 330 kV Phase Shift Transformers (PSTs) at Buronga; � Two new 330/220 kV transformers at Buronga; � A new double circuit 220 kV line (conductor strung on
one side and operated as a single circuit) from Burongato Red Cliffs in Victoria;
� Augmentation of existing substations at Robertstown,Buronga, Darlington Point, Wagga Wagga and Red Cliffs;
� Turn in the existing 275 kV line between Robertstownand Para into Tungkillo;
� Static and dynamic reactive plant at Robertstown,Buronga and Darlington Point; and
� A Special Protection Scheme.
The notional maximum capacity of this interconnector is 800 MW. The high level cost estimate for the NSW component of the preferred option is $1,150 million. The interconnector has an estimated delivery time of 2022 to 2024, depending on the time taken to gain environmental and other necessary approvals.
2.1.2. Expanding NSW – Queensland transmission transfer capacity
Figure 14 – Transmission network in northern NSW
Moree
Narrabri
BoggabriNorth
BoggabriEast
Gunnedah
Tamworth 132Tamworth 330
ArmidaleRaleigh
Boambee South
Nambucca
Macksville
Kempsey
Port Macquarie
Herons Creek
Taree
Stroud
LiddellBayswater
MuswellbrookWollar
Hawks Nest
Coffs Harbour
Dorrigo
Inverell
WhiteRock
Sapphire
Dumaresq
Glen Innes
Tenterfield
CasinoLismore
Mudgeeraba
Directlink
Bulli Creek
Koolkhan
9U4
8J 8C
8L8M
9U2
96N
968
96M
9U3
969
9UJ
8685
97B
8488
835A4
5A5 5A332
81
82 9C8 96F31
97C
878E
96696T
96C
96G
965
9W9
964
96R
96L
96789
89
9W2
9W5
96H
9W8
9W3
9W7
9W6
96P
963
9UH
9UG
The AEMO ISP identified as a priority the need to provide additional transfer capacity via the Queensland to NSW Interconnector (QNI). TransGrid and Powerlink jointly commenced a RIT-T in November 2018 by publishing a Project Specification and Consultation Report that consulted on options to expand the NSW-Queensland transmission transfer capacity.
This project is expected to open up further access to the NEM for existing and future renewable generation, will help to meet renewable energy targets more efficiently, and support the transition to a lower carbon economy. There will be benefits to system security, which could further enable renewable generation development in Queensland and NSW. An upgrade may also provide greater capacity for both states to import power to help respond to unplanned network outages and other network events.
The options identified in the PSCR to reinforce capacity between NSW and Queensland include:
� Installation of Static VAr Compensators (SVCs)at Dumaresq and Tamworth, capacitor banks atTamworth, Armidale and Dumaresq and upgrades to 330 kV lines 83, 84 and 88 to 120 degree C maximum operating temperature rating (resulting in transfer capacity increases of 150 MW southbound and 160 MW northbound);
� Turning both transmission lines along QNI intotwo switching stations at Sapphire and mid-waybetween Dumaresq and Bulli Creek (135 MW increase southbound);
� Constructing a new single circuit 330 kV transmissionline between Liddell and Braemar via existingtransmission substations (resulting in transfer capacity increases of approximately 855 MW southbound and 445 MW northbound);
� Constructing new double circuit 330 kV transmissionlines, with options being• From Bulli Creek to Armidale (145 MW transfer
capacity increase southbound and 60 MW increasenorthbound); or
• From Braemar to Liddell via Uralla (1,130 MW transfercapacity increase southbound and 995 MW increasenorthbound); or
• From Braemar to Uralla, 500 kV single circuits betweenUralla and Wollar and between Uralla and Bayswater (1,510 MW transfer capacity increase southbound and 1,160 MW increase northbound)
� High Voltage Direct Current (HVDC) transmission links,with options being:5
• HVDC back-to-back link inserted in the AC connectionbetween NSW and Queensland (resulting in 750 MWtransfer capacity increase southbound and 660 MWincrease northbound);
• A new additional 180 MW HVDC link betweenMudgeeraba and Lismore (which increases overalltransfer capacity but has no impact on the AC transfercapacity); and
• A new additional 2,000 MW HVDC link betweenWestern Downs and Bayswater (which hasminor impacts on the AC transfer capacity ofa 40 MW reduction southbound and 55 MWincrease northbound).
� The use of batteries with fast response to increasestability limits (providing transfer capacity increasesof up to 600 MW southbound and northbound).
These options are estimated to cost between $28 million and $2.1 billion, and provide varying levels of market benefits commensurate with their capacities. The ISP released by AEMO in July 2018 recommended that the transmission investment for the first stage be completed as soon as possible. Following the evaluation of economic benefits, the preferred option will be identified in a Project Assessment Draft Report.
4 Further details of this project are expanded upon within the South Australia Energy Transformation Project Assessment Conclusion Report, found at https://www.electranet.com.au/wp-content/uploads/projects/2016/11/SA-Energy-Transformation-PACR.pdf 5 The indicative transfer improvement is for QNI only. It does not include the transfer capacity of existing HVDC link Directlink.
500 kV Transmission Lines
132 kV Transmission Lines330 kV Transmission Lines
16 NSW Transmission Annual Planning Report 2019 17Chapter 2 | Transmission network developments

Cha
pter 2
2.1.3 Victoria to New South Wales Interconnector upgrade
Figure 15 – Southern NSW network
Wagga North
Wagga 330
Wagga 132
Gadara
Tumut
Burrinjuck
Yass
Murrumbateman
Queanbeyan
Williamsdale
Upper Tumut
Murray
Geehi
Snowy Adit
Munyang
Jindabyne
Guthega
Dederang
Albury
Hume
ANMJindera
Morven
Cooma
Lower Tumut
Blowering
Canberra
Murrumburrah
MarulanKangaroo Valley
Dapto
AvonBannaby
To SydneyTo Central NSW
To South Western NSW
Gullen Range
Crookwell 2
Capital Wind Farm
Wodonga
99B060
68
97G
97997L
97K/2
97K/1
978
01
073C
9
976/2
6976/1
3W
5
3J
3H35
4
36 16
818
10
111739
5A75A6999973
99M
970990
992
097B
299P
99W, 99X, 9R5
9R6
993
051
3
977/1
97D65
64
66
67
99Z
995
99H
62
996
991
There is strong interest for the connection of new renewable generation in southern NSW. The network between southern NSW and Sydney is constrained at times of high demand, and has limited capacity to cater for further generation together with existing generation and import from Victoria to NSW. Thermal capacity constraints between the Riverina, Snowy Mountains and Sydney may limit generation output or import from VIC, as new generation is connected.
Upgrading the southern network transfer capacity may include new transmission lines and a generation runback (load curtailment) scheme, with low to high capacity options.
The AEMO ISP identified as a priority the need to provide additional transfer capacity via the Victoria to NSW Interconnector (VNI). TransGrid and AEMO Victorian Planning jointly commenced a RIT-T in November 2018 by publishing a Project Specification and Consultation Report.
The options being considered to enhance the Victoria to NSW transfer capability include:
� Installing a new 500/330 kV transformer atSouth Morang;
� Re-tensioning the South Morang – Dederang330 kV lines;
� Increase the transient stability limits from Victoria toNSW through installation of a braking resistor, Static VArCompensators (SVCs) or synchronous condensers; and
� Augmentations in NSW such as uprating of the Canberra– Upper Tumut 330 kV line, uprating additional selectedexisting 330 kV lines between Snowy and Sydney, oradvancing the construction of new 500 kV single circuitline between Snowy and Bannaby which is identifiedas an option in Snowy Mountains to Sydney transfercapacity upgrade.6
Depending on the configuration, the indicative increase in capacity of the interconnector options is likely to be between 170 – 500 MW. The NSW components for the various options are estimated to range from $28 million to $520 million. The ISP recommended that investment in transmission upgrades to address the limitation be made as soon as possible. Following the evaluation of economic benefits, the preferred option will be identified in the Project Assessment Draft Report.
2.1.4 Reinforcement of the southern NSW network
The existing transmission capacity between southern NSW and major load centres of Sydney, Newcastle and Wollongong is heavily utilised at times of peak demand. While low-cost projects have been initiated to maximise utilisation of the existing assets using flow control devices, these only provide relatively small increases in capacity.
TransGrid is currently considering 12 network options to provide additional transfer capacity between the Snowy Mountains and the major load centres of Sydney, Newcastle and Wollongong.
The network options considered reflect four alternative topologies for new major network developments to improve the transfer capacity of the southern shared network, reflecting:1. A ‘direct’ path between Maragle7 and Bannaby;2. A path from Maragle to Wagga Wagga, then Wagga
Wagga to Bannaby, which may provide greater market benefits;
3. A wider footprint via Wagga Wagga, that would openup additional capacity for new renewable generationin southern NSW, which may provide greater marketbenefits; and
4. A wider Maragle-Wagga-Bannaby footprint plusadditional capacity between Bannaby and Sydney,to further relieve constraints on that portion ofthe network.
Each topology is being considered across three voltages:A. Construction and operation at 330 kV with high
capacity conductor;B. Construction at 500 kV and initial operation at 330 kV,
with the optionality to augment substation equipment inthe future to operate at 500 kV; and
C. Construction and operation at 500 kV.
Figure 16 – Southern NSW to Sydney augmentation
Option 1
Sydney
CanberraMaragle
Wagga Wagga
PROJECTENERGYCONNECT Bannaby
Melbourne
Option 2
Sydney
CanberraMaragle
Wagga Wagga
PROJECTENERGYCONNECT Bannaby
Melbourne
Option 3
Sydney
CanberraMaragle
Wagga Wagga
PROJECTENERGYCONNECT Bannaby
Melbourne
Option 4
Sydney
CanberraMaragle
Wagga Wagga
PROJECTENERGYCONNECT Bannaby
Melbourne
6 Refer section 2.1.4 7 Maragle is approximately 85 km south of Tumut, in the Snowy Mountains.
These options cost between $790 million and $1,890 million. Increased access to generating capacity from the Snowy Mountains Hydroelectric Scheme and renewable generation in south west NSW has the potential to provide a benefit to the market through lowering the overall dispatch and
investment costs required to continue to meet New South Wales electricity demand in a secure and reliable manner.
500 kV Transmission Lines
132 kV Transmission Lines330 kV Transmission Lines
18 NSW Transmission Annual Planning Report 2019 19Chapter 2 | Transmission network developments

Cha
pter 2
2.1.6 Support north western NSW network for renewables
Figure 18 – Northern NSW network
Moree
Narrabri
BoggabriNorth
BoggabriEast
Gunnedah
Tamworth 132Tamworth 330
ArmidaleRaleigh
Boambee South
Nambucca
Macksville
Kempsey
Port Macquarie
Herons Creek
Taree
Stroud
LiddellBayswater
MuswellbrookWollar
Hawks Nest
Coffs Harbour
Dorrigo
Inverell
WhiteRock
Sapphire
Dumaresq
Glen Innes
Tenterfield
CasinoLismore
Mudgeeraba
Directlink
Bulli Creek
Koolkhan
9U4
8J 8C
8L8M
9U2
96N
968
96M
9U3
969
9UJ
8685
97B
8488
835A4
5A5 5A332
81
82 9C8 96F31
97C
878E
96696T
96C
96G
965
9W9
964
96R
96L
96789
89
9W2
9W5
96H
9W8
9W3
9W7
9W6
96P
963
9UH
9UG
TransGrid has received applications for a number of generator connections to the north western NSW transmission system. Some of these projects are proposed to connect at 132 kV and 66 kV, increasing the power flow from the local 132 kV network to 330 kV network.
TransGrid has received significant ongoing interest from renewable energy proponents seeking to connect to the network in this area. The NSW Government has identified the New England area as a prospective large-scale renewable energy zone. AEMO has also identified the North West NSW, Northern NSW Tablelands and the New England area for development as renewable energy zones in their ISP.
Presently, there is approximately 520 MW of renewable generation connected in the area. A further 115 MW is committed to connect and more than 1,180 MW is at an advanced stage in the connection process.
However, the limited capacity of the 330 kV and 132 kV networks will result in output limitation of connecting generators as the pool of generators in the area increases. This will also inhibit the connection of additional generation in the area. Increasing transmission capacity would maximise the existing renewable energy generation
opportunities, and facilitate new generator connections in Northern NSW that would deliver substantial additional market benefits. These benefits would be derived from:
� Lower costs for meeting the supply reliability standard in NSW, through facilitating access to the output from these generation connections
� Lower market dispatch costs (and hence lower prices for consumers).
A contingent project to support renewable energy development in North Western NSW was included in TransGrid’s revenue proposal to the AER. This project has a cost estimate ranging between $500 million to $945 million. The AER determined that the contingent project may be reasonably required within the current regulatory period.
Subject to evaluation of economic benefits, a project is expected to be initiated with the timing determined by the economic evaluation. The project may be staged if required to maximise economic benefits.
In addition, depending on the route adopted, the investments being considered have the potential to:
� open up additional capacity for new generation (primarily renewable generation) in areas of southern New South Wales, which has recognised high-quality wind and solar resources;
� increase the transfer capacity between Victoria and New South Wales, which would provide New South Wales with access to renewable generation developments anticipated in western Victoria; and
� allow the additional transfer capacity between South Australia and NSW which will be provided by the new South Australia–NSW interconnector (which is proposed to terminate at Wagga), to also flow to Sydney.
2.1.5 Support central western NSW network for renewables
Figure 17 – Central-western NSW network
Parkes
Forbes Manildra
Molong
Wellington Town
Wellington
Beryl
Mudgee
Bayswater
Wollar
OrangeNorth
Orange
Cowra
Ilford
Burrendong
Bodangora
Mt Piper 500/330
Mt Piper 132
Panorama
Wallerawang 132Wallerawang 330
To Northern NSW
To Sydney
To Sydney
To Southern NSW
3132
5A4
5A35A5
94B
79
94594K
94U
998948
999973
5A6 5A7
77
76
94E
944
94994T
94P94H
94X
947
72
94M
The Central West transmission network is a parallel network of 132 kV and 330 kV lines connecting to the 500 kV substations at Mt. Piper and Wollar. A relatively low capacity 132 kV network exists between Mt. Piper and Wellington.
TransGrid has received significant ongoing interest from renewable energy proponents seeking to connect to the network in this area. The NSW Government has identified Central West NSW as a prospective large-scale renewable energy zone. AEMO has also identified the Central West for immediate development as a renewable energy zone in their Integrated System Plan (ISP).
Presently, there is around 300 MW of renewable generation connected in the area. A further 400 MW is committed to connect and more than 500 MW is at an advanced stage in the connection process.
However, the amount of renewable energy generation proposing to connect to the network will result in the emergence of significant network constraints. Overcoming the 132 kV transmission constraints would maximise the existing renewable energy generation
opportunities, and facilitate new generator connections in Central Western NSW that would deliver substantial additional market benefits. These benefits would be derived from:
� Lower costs for meeting the supply reliability standard in NSW, through facilitating access to the output from these generation connections; and
� Lower market dispatch costs (and hence lower prices for consumers).
A contingent project to support renewable energy development in Central West NSW was included in TransGrid’s revenue proposal to the AER. The project has a cost estimate ranging between $120 million to $455 million. The AER determined that the contingent project may be reasonably required within the current regulatory period.
Subject to evaluation of economic benefits, a project is expected to be initiated with the timing determined by the economic evaluation. The project may be staged if required to maximise economic benefits.
500 kV Transmission Lines
132 kV Transmission Lines330 kV Transmission Lines
500 kV Transmission Lines
132 kV Transmission Lines330 kV Transmission Lines
20 NSW Transmission Annual Planning Report 2019 21Chapter 2 | Transmission network developments

Cha
pter 2
2.2 Forecast of constraints
NER Clause 5.12.2(c)(3) requires reporting the forecast of constraints and inability to meet the network performance requirements set out in NER Schedule 5.1 or relevant NSW legislations or regulations over one, three and five years. The above information has been set out in this Chapter. TransGrid has provided additional connection point and transmission line data, on an external website. To access this information go to the TransGrid website page: https://www.transgrid.com.au/what-we-do/Business-Planning/transmission-annual-planning/Pages/default.aspx
TransGrid’s Network Planning function analysed the expected future operation of its transmission networks over a ten year period, taking into account the relevant forecast loads, any future generation, market network service, demand side and transmission developments and any other relevant data to determine the anticipated constraints over one, three and five years.
TransGrid’s Network Planning group conducts its annual review which includes the following activities:
� Incorporation of the forecast loads as submittedor modified by relevant registered participants inaccordance with NER Clause 5.11.1;
� A review of the adequacy of existing connection pointsand relevant parts of the transmission system andplanning proposals for future connection points;
� Taking into account the most recent AEMO systemplanning updates, including the 2018 reviews of theIntegrated System Plan (ISP), the National Transmission Network Development Plan, and the issue of the 2018 System Strength Impact Assessment Guidelines;
� Consideration of the potential for augmentations, ornon-network alternatives to augmentations, that arelikely to provide a net economic benefit to all those who produce, consume and transport electricity in the market;
� Consideration of the condition of network assets; and � Consideration of the potential for replacements of
network assets, or non-network options to replacementsof network assets, that are likely to provide a net economic benefit to all those who produce, consume and transport electricity in the market.
These activities form the basis by which TransGrid reviews and updates the forecast constraints information provided in this report.
2.3 Subsystem developments
This section describes TransGrid’s capital works that are proposed to address specific area or regional network needs. The information provided in this section describes the work, the actual or potential constraint or inability to meet network performance requirements of NER Schedule 5.1, the need or proposed operational date, the proposed solution and its cost estimate.
These augmentation works do not cause any material inter-network impact as they address localised or site specific needs within each region. In assessing whether an augmentation to the network will have a material inter-network impact TransGrid has examined if its proposed works will impose power transfer constraints within other TNSPs’ networks or adversely impact the quality of supply in other TNSPs’ networks.
The information in this section also includes ongoing and recently completed replacement works to provide an integrated overall view of capital expenditure requirements within an area.
Planned projects included in the subsystem developments are aligned with the expenditure allowance approved in the AER’s final determination for our 2018/19-2022/23 revenue period. TransGrid considered credible network and non-network options to address the actual or potential constraints or the inability to meet network performance requirements. This includes the use of interconnectors with other regions, generation options, demand side options, market network service options and inter-network options.
The proposed subsystem developments outlined in this section, covering augmentation and replacement works align with the primary objectives of AEMO’s Integrated System Plan and National Transmission Network Development Plan, those being:
� Enhancing interconnection capacity between NSW andthe other states;
� Supporting the development and connection oflarge-scale renewable energy zones across the NEM; and
� Improving system strength and security in responseto the decline of thermal generation sources and theincrease in renewable energy sources, particularly in NSW and Victoria.
The information reported in this section meets the requirement of NER Clause 5.12.2(c)(5) and (6).
TransGrid presently does not anticipate any additional subsystem development network investment beyond that given in the following sections based on current planning information and requirements.
2.3.1 Greater Sydney
The Greater Sydney area includes the Central Business District (CBD) of Sydney which is the largest hub in Australia for economic activity, major transport infrastructure, industry and tourism. Increasingly, the Inner Sydney area is also home to a growing number of people attracted to shorter commutes, and access to entertainment and recreation attractions such as that offered by the central Sydney precincts and the Sydney Harbour foreshore.
The Inner Sydney area also provides a base for a number of major infrastructure and transport networks including road
tunnels, airports, ports, train networks and data centres. These entities require a high level of electricity reliability and security to maintain services required for Sydney to operate as a major international city. Many of these entities are currently implementing large developments or expansion plans, with many projects under construction or scheduled for the near term.
The following figure shows the Greater Sydney network, including transmission supplies to the area.
Figure 19 – Greater Sydney network
Regentville
Sydney South
Liverpool
Ingleburn
Haymarket
Macarthur
Beaconsfield
Holroyd Rookwood Road
Vineyard
Kemps Creek
Sydney East
Sydney North
Mount Colah
Sydney West
Mount Druitt
To Southern NSW
To Central NSW
To Central NSW To Newcastle and Central Coast
32 31 5A1
1420
26 29
28
2795992Z
932, 239
1C
1F30
1439
32
37
76
77
17
76
13 12
11
42
41
9S4
78
38
43
44
5A2
25 22
21
26
500 kV Transmission Lines
132 kV Transmission Lines330 kV Transmission Lines
22 NSW Transmission Annual Planning Report 2019 23Chapter 2 | Transmission network developments

Cha
pter 2
Planned projectsWe have planned several substation augmentation projects to address forecast load growth and connect new distribution zone substations in the Greater Sydney area.
We have also identified low-cost investment opportunities that may deliver economic benefits or improve system security.
Table 1 – Planned projects in Greater Sydney
Project description
Planned date
Total cost ($million June-18)
Purpose and possible other options Project justification
Installation of one 66 kV switchbay at Macarthur 330/132/66 kV substation
Oct 2019 1.4 For connection of Endeavour Energy’s planned Menangle Park Zone Substation to meet load growth in a new housing development at Menangle Park. Refer to Endeavour’s DAPR for more details.
Load driven
Installation of one 330/66 kV transformer at Macarthur 330/132/66 kV substation
Aug 2021 8.7 To address a capacity constraint in the Nepean area that has arisen from 2018.Temporary load transfers in the Endeavour Energy network are being enacted to defer the need date. To fully defer the need, demand management in the Nepean area of 100 MW would be required from 2019, increasing by 10-13 MW each year. This is not expected to be available at the required level.Other options would be to increase the transfer capacity to TransGrid’s Ingleburn 330/132 kV substation or increase the capacity of Endeavour Energy’s Nepean substation. These options are not as economic for consumers and have not been pursued.
Load driven
Installation of one 66 kV switchbay at Macarthur 330/132/66 kV substation
Jul 2022 1.3 For connection of Endeavour Energy’s planned Mt Gilead Zone Substation to meet load growth in a new housing development at Mt Gilead. Refer to Endeavour’s DAPR for more details.
Load driven
Load shedding scheme for mitigating risks of multiple 330 kV cable outages
By Jun 2023 0.2 This project implements a SCADA control scheme to selectively shed low-priority Inner Sydney loads following a contingent trip of both 330 kV cables 41 and 42, to reduce the amount of load at risk.8
Economic benefits
Facilitate Ausgrid connection works at Beaconsfield Substation.
Sep 2024 0.2 This project is to facilitate Ausgrid’s replacement of 132 kV feeder 9SA and 92P Beaconsfield to Campbell Street and Belmore Park. Refer to Ausgrid’s TAPR for more details.
Joint planning
Installation of one 132 kV switchbay at Vineyard 330/132 kV substation
Sep 2025 1.8 For connection of Endeavour Energy’s planned Box Hill Zone Substation, to supply a new urban development at Box Hill. Refer to Endeavour’s DAPR for more details.
Load driven
Construction of a new bulk supply point in the vicinity of upcoming Western Sydney developments
Feb 2025 TBD A new bulk supply point to be built connected to TransGrid’s 330 kV transmission line 39 Bannaby to Sydney West or adjacent to TransGrid’s Kemps Creek substation. The bulk supply point will support load growth in the Western Sydney region, including the new Western Sydney Airport and new residential and commercial precincts.
Load driven, Joint Planning
Eraring to Kemps Creek 500 kV smart grid controls
Jun 2025 2.6 Installation of a special protection scheme to protect against trips of both of the 500 kV lines from Eraring to Kemps Creek.For a double circuit trip, the scheme will run back generation and load to avoid cascading outages and further loss of load in the Greater Sydney area.
Economic benefits
Project description
Planned date
Total cost ($million June-18)
Purpose and possible other options Project justification
Sydney northwest 330 kV smart grid controls
Jun 2025 3.0 Installation of a special protection scheme to protect against trips of two or more of the following 330 kV lines: Sydney North to Tuggerah (21), Sydney North to Vales Point (22), Vineyard to Eraring (25), Sydney West to Tuggerah (26) and Munmorah to Tuggerah (2M).For multiple circuit trips, the scheme will run back generation and load to avoid cascading outages and further loss of load in the network.
Economic benefits
Sydney South 330 kV smart grid controls
Jun 2025 1.8 Installation of a special protection scheme to protect against trips of two or more of the 330 kV lines from Sydney South substation.For multiple circuit trips, the scheme will run back generation and load to avoid cascading outages and further loss of load in the network.
Economic benefits
Bayswater to Sydney West 330 kV smart grid controls
Jun 2025 2.8 Installation of a special protection scheme to protect against trips of two or more of the following 330 kV lines: Bayswater to Regentville (31), Bayswater to Sydney West (32) and Regentville to Sydney West (38).For multiple circuit trips, the scheme will run back generation and load to avoid cascading outages and further loss of load in the Greater Sydney area.
Economic benefits
Ongoing projectsPowering Sydney’s FutureThe Powering Sydney’s Future project underpins the future security of electricity supply arrangements to the inner Sydney and Sydney Central Business District areas. Security of supply will be achieved by installing a new 330 kV cable between the existing Rookwood Road and Beaconsfield substations with a capacity of ~750 MVA, due for completion by December 2022.
To cater for future electricity demand growth over the next 20 years, conduits for a second supply cable will also be laid at the same time.
This project was approved by the AER in the TransGrid’s 2019-23 Revenue Determination at a total capital allowance of $235m ($2017/2018). The AER approval also included a component for demand management during the 2019-2022 period. To keep consumers informed during project execution, a Stakeholder Management Committee (SMC) was formed to work with TransGrid through the delivery of the project. The SMC members are a subgroup of the TransGrid Advisory Council (TAC).
Fast Frequency ResponseAs part of the RIT-T for Powering Sydney’s Future, a large scale battery at Beaconsfield was considered as one element of the demand management solution.
The feasibility of a battery up to 40 MWh for demand response for summers 2020/21 and summer 2021/22 is being considered as part of the deferral of the cable installation by one year. A large-scale energy storage device is likely to readily support multiple value streams, including fast frequency response.
We propose to install a 10 MW, 10 MWh battery at Beaconsfield by November 2020. This will defer the cable installation, pilot the provision of fast frequency response, and enable us to understand its performance during disturbances over a wide range of system conditions and validate its characteristic in system stability models.
The installation of a pilot for fast frequency response is consistent with the AEMC’s recommendations in its System Security Frameworks Review Final Report. The report recommends an obligation on TNSPs to provide minimum levels of inertia, or alternative equivalent services, to allow the power system to be maintained in a secure operating state. We note that if a grid connected storage solution is shared with other value streams, we will apply our cost allocation methodology to allocate the costs, as required under the Rules.
Completed projectsWorks were completed to underground a section of transmission line 39 below the location for the future Western Sydney Airport and install Optical Ground Wires (OPGW) on the line to Sydney West BSP. Secondary system replacement works were completed at Sydney North 330/132 kV substation.
8This project is not related to Powering Sydney’s Future, and the two projects meet separate needs.
24 NSW Transmission Annual Planning Report 2019 25Chapter 2 | Transmission network developments

Cha
pter 2
2.3.2 Newcastle and Central Coast
Figure 20 – Newcastle and Central Coast network
To Sydney
To Northern NSW
NewcastleWaratah West
Eraring
OneSteel
Brandy Hill
Tomago
Vales Point
Munmorah
Tuggerah
5A15A2
82
81
94
96
9W
82
95
90 92
93
26
2M
24 92
23, 26
25 22
21
26
9C59C696F
Planned projectsWe do not have any planned prescribed augmentation projects in the Newcastle and Central Coast region.
Ongoing projectsWe do not have any ongoing prescribed augmentation projects in the Newcastle and Central Coast region.
Completed projectsRenewal works to address end-of-life condition of various Vales Point 330/132 kV substation assets were completed.
2.3.3 Northern NSW
Figure 21 – Northern NSW network
Moree
Narrabri
BoggabriNorth
BoggabriEast
Gunnedah
Tamworth 132Tamworth 330
ArmidaleRaleigh
Boambee South
Nambucca
Macksville
Kempsey
Port Macquarie
Herons Creek
Taree
Stroud
LiddellBayswater
MuswellbrookWollar
Hawks Nest
Coffs Harbour
Dorrigo
Inverell
WhiteRock
Sapphire
Dumaresq
Glen Innes
Tenterfield
CasinoLismore
Mudgeeraba
Directlink
Bulli Creek
Koolkhan
9U4
8J 8C
8L8M
9U2
96N
968
96M
9U3
969
9UJ
8685
97B
8488
835A4
5A5 5A332
81
82 9C8 96F31
97C
878E
96696T
96C
96G
965
9W9
964
96R
96L
96789
89
9W2
9W5
96H
9W8
9W3
9W7
9W6
96P
963
9UH
9UG
Planned projectsThermal and voltage constraints may arise in the Gunnedah area leading to an emerging risk to reliability if large mining or gas developments proceed in the area. These developments along with other planned projects that improve security of supply to customers and provide economic benefits are shown in the following table.
Ongoing projectsWe do not have any ongoing prescribed augmentation projects in the Northern region.
Completed projectsSecondary system replacement works were completed at Taree 132/66/33 kV substation in 2018.
500 kV Transmission Lines
132 kV Transmission Lines330 kV Transmission Lines
500 kV Transmission Lines
132 kV Transmission Lines330 kV Transmission Lines
26 NSW Transmission Annual Planning Report 2019 27Chapter 2 | Transmission network developments

Cha
pter 2
Table 2 – Planned projects in northern NSW
Project description
Planned date
Total cost ($million June-18)
Purpose Project justification
Gunnedah-Narrabri 66 kV Voltage Control
Aug 2020 <0.1 Provide Automatic Voltage Control of Capacitor Banks at Gunnedah. There is an opportunity to avoid the loss of load by implementing smart auto-tripping of the Gunnedah capacitors following a critical contingency.
Economic benefits
Capacitor bank to increase NSW to QLD transfer limit
Mar 2021 5.3 Installation of a 330 kV, 120 MVAr shunt capacitor bank at Armidale 330/132 kV substation to increase voltage stability limits on QNI.
Improve transfer capability
Armidale capacitor transfer tripping scheme
Mar 2021 0.2 Implementation of a transfer tripping scheme for the Armidale 132 kV capacitor bank to improve QNI transfer capability during an outage of an Armidale 330/132 kV transformer.
Improve transfer capability
Taree 132 kV bus capacity augmentation
Nov 2021 1.1 A trip of any 132 kV busbar section at Taree 132/66 kV substation will interrupt supply to the Taree area. Installation of a new circuit breaker bay to allow two busbar protection zones at Taree substation will allow continued supply to customers in the Taree area during a bus section outage.
Economic benefits
Armidale North Coast Line Overload Load Shedding (LOLS) expansion
Jan 2022 <0.1 Modification of the LOLS tripping scheme to include Essential Energy’s Koolkhan to Maclean 66 kV feeder.
Economic benefits
Transposition of 330 kV lines 87 (Coffs Harbour to Armidale) and 8C/8E/8J (Armidale to Dumaresq)
May 2022 1.4 These transpositions are to make the network more resilient to negative-sequence voltage levels greater than 0.5% within the northern NSW transmission network.
Economic benefits
Install capacitor banks at Narrabri substation
By Jun 2023
4.9 Required to manage voltage constraints if large mining or gas developments proceed in the area.
Load driven
Reconductor the Gunnedah to Tamworth 132 kV line (969)
By Jun 2023
6.3 Required to manage a thermal constraint due to the rating of the 969 line if large mining or gas developments proceed in the area.
Connection driven
Northwest NSW 330 kV smart grid controls
By Jun 2025
3.6 Installation of a special protection scheme to protect against trips of two or more of the 330 kV lines between Armidale and Liddell. For multiple circuit trips, the scheme will run back generation and load to avoid cascading outages and further loss of load in the network.
Economic benefits
2.3.4 Central NSW
Figure 22 – Central NSW network
Parkes
Forbes Manildra
Molong
Wellington Town
Wellington
Beryl
Mudgee
Bayswater
Wollar
OrangeNorth
Orange
Cowra
Ilford
Burrendong
Bodangora
Mt Piper 500/330
Mt Piper 132
Panorama
Wallerawang 132Wallerawang 330
To Northern NSW
To Sydney
To Sydney
To Southern NSW
3132
5A4
5A35A5
94B
79
94594K
94U
998948
999973
5A6 5A7
77
76
94E
944
94994T
94P94H
94X
947
72
94M
Planned projectsThe network in central NSW currently limits the connection of large loads or generation due to voltage and thermal limitations. Outages of elements in the network risk significantly limiting the capability to connect generation, mostly in the 132 kV network.
There is strong interest from renewable energy proponents seeking to connect to the 330 kV transmission line between Wollar and Wellington (the 79 line). The line is presently limited below its conductor rating due to secondary system limitations. TransGrid has initiated a project to remove these
limitations such that the maximum contingency conductor rating can be achieved.
The Molong to Orange North 132 kV transmission line has a relatively low thermal rating which makes it susceptible to overload as generators connect to the West of Molong substation. This issue is emerging and in order to prevent output limitations on connecting generation, the thermal capacity of the line will need to be increased. A number of options are currently being considered, with a preferred option yet to be identified.
500 kV Transmission Lines
132 kV Transmission Lines330 kV Transmission Lines
28 NSW Transmission Annual Planning Report 2019 29Chapter 2 | Transmission network developments

Cha
pter 2
Table 3 – Planned projects in central NSW
Project description
Planned date
Total cost ($million June-18)
Purpose Project justification
Thermal Limitation on 94T Molong – Orange North 132 kV Line
By 2022 TBD Increase the thermal capacity of Line 94T. With a number of renewable generators in service and committed to connect west of Molong substation, studies indicate that curtailment of generation may be required due to the relatively low thermal rating of the line.
Economic benefits
Increase capacity to Beryl area
New generation in the Central NSW network
~40.0 to 190.0 If all interested renewable generation proponents connect, their outputs will be constrained under system normal conditions to maintain the transmission network within acceptable limits. The existing line thermal limitations will limit the generation from the renewable sources. The operational management of voltage stability and minimum reactive margin may limit the load consumption at Beryl thereby imposing load shedding.Initial market modelling indicates there would be net market benefits from augmenting the transmission network to provide additional capacity should further capacity commit to connection in the network. TransGrid has identified a range of credible network options to address this network constraints ranging from a new Beryl 330 kV substation or upgrades to 132 kV lines from Mount Piper or Wellington.
Economic benefits
Voltage support in the Parkes area
Nov 2021 TBD Essential Energy have advised TransGrid of a potential spot load in the Parkes area. TransGrid have undertaken studies and concluded that the network will need to be reinforced with voltage support equipment. This may include the installation of one or more capacitor banks at optimal locations in the Parkes area. The optimal size and location for the support equipment is to be determined.
Compliance
Voltage support in the Orange area
2023 TBD The latest Essential Energy forecasts have indicated that demand is increasing in the Orange area. TransGrid have undertaken studies and concluded that the network in the Orange area will need to be reinforced. Options include the addition of voltage support equipment in the Orange area, establishment of a new 330/132 kV substation by cutting into Line 72 and linking with existing substations or additional 132 kV circuits to existing substations.
Compliance
Ongoing projectsWe do not have any ongoing prescribed augmentation projects in the Central Region.
Completed projectsTransGrid replaced approximately 70 wood pole structures on Line 944 between Orange and Wallerawang with concrete poles. The project addressed the requirement for critical voltage support to Orange and other Central West areas during emergency contingency events, and also supports the forecasted increase in the Central NSW region load.
Removal of a SCADA limitation on the Wellington – Wollar 330 kV 79 line increased its contingent line rating from 915 MVA to the maximum contingency conductor rating of 1048 MVA.
As a result of the implementation of the IPART reliability standard from 1st July 2018, action was required to reduce the expected EUE at Mudgee BSP to comply with the new standard. Through joint planning processes with Essential Energy, a project was initiated to automate the 66 kV backup supply to Mudgee. The auto-changeover scheme was commissioned and put into operation in September 2018.
2.3.5 Southern NSW and ACT
Figure 23 – Southern NSW and ACT network
Wagga North
Wagga 330
Wagga 132
Gadara
Tumut
Burrinjuck
Yass
Murrumbateman
Queanbeyan
Williamsdale
Upper Tumut
Murray
Geehi
Snowy Adit
Munyang
Jindabyne
Guthega
Dederang
Albury
Hume
ANMJindera
Morven
Cooma
Lower Tumut
Blowering
Canberra
Murrumburrah
MarulanKangaroo Valley
Dapto
AvonBannaby
To SydneyTo Central NSW
To South Western NSW
Gullen Range
Crookwell 2
Capital Wind Farm
Wodonga
99B060
68
97G
97997L
97K/2
97K/1
978
01
073C
9
976/2
6976/1
3W
5
3J
3H35
4
36 16
818
10
111739
5A75A6999973
99M
970990
992
097B
299P
99W, 99X, 9R5
9R6
993
051
3
977/1
97D65
64
66
67
99Z
995
99H
62
996
991
Planned projectsSeveral precincts in Canberra are experiencing high localised load growth from new residential and commercial developments, and several investment opportunities
that can deliver economic benefits to consumers have been identified.
Table 4 – Planned projects in southern NSW and ACT
Project description
Planned date
Total cost ($million June-18)
Purpose Project justification
99X Wagga 330 – Wagga 132 132 kV Line Capacity Augmentation
Oct 2020 0.6 Replace limiting equipment at Wagga 330 and Wagga 132.This will remove the need to reduce reliability of supply to Wagga Wagga at times of peak demand when there is high generation in the Wagga – Darlington Point area and high transfer on the main grid towards Yass / Canberra and Sydney.
Reliability
Install a 100 MVAr 330 kV Capacitor at Wagga 330
Mar 2021 4.7 The AEMO constraintN^^V_NIL_1: Avoid voltage collapse in southern NSW for loss of the largest VIC generating unit or Basslink is limiting the NSW – VIC transfer limit. A 100 MVAr capacitor at Wagga will lift the southward transfer limit by 30 MW and northward transfer limit by 75 MW.
Economic benefits
500 kV Transmission Lines
132 kV Transmission Lines330 kV Transmission Lines
30 NSW Transmission Annual Planning Report 2019 31Chapter 2 | Transmission network developments

Cha
pter 2
Project description
Planned date
Total cost ($million June-18)
Purpose Project justification
Install 132 kV line circuit breakers at Stockdill
Jul 2021 4.0 Evoenergy has identified a need to locate their mobile substation at Molonglo from 2021 to supply developments in the Molonglo Valley.Installation of 132 kV line circuit breakers at Stockdill is required to provide the necessary protection functionality and reliability. Refer to Evoenergy’s DAPR for more details.
Capacity
Install Static Synchronous Series Compensation on 2 Upper Tumut – Yass 330 kV Line
Jul 2021 6.0 To improve the sharing between the four 330 kV lines O1, 2, 3 and O7 and thereby enable higher transfer across the group.A 2Ω reduction in the line reactance will increase the Snowy to NSW transfer capability by 26 MW.
Economic benefits
Install Static Synchronous Series Compensation on 62 Jindera – Wagga 330 kV Line
Jun 2023 5.9 To improve the sharing between the three 330 kV lines 62, 65 and 66 and thereby enable higher transfer across the group.This facility will achieve a 12.8 MW increase on the NSW-VIC thermal constraint and a 5.6 MW increase on the NSW-VIC voltage constraint.
Economic benefits
Remote relay interrogation
By Jun 2023 2.0 Rollout of the Fault Data Interrogation System (FDIS) to all TransGrid sites that currently have protection relays capable of communicating information via. TCP/IP or serial connection. This will allow remote interrogation and provide a range of data about a fault.
Economic benefits
Albury area under-voltage load shedding (UVLS) scheme
By Jun 2023 0.2 Installation of UVLS scheme at Albury and ANM to enable the underlying 132 kV system to remain closed during outage of the Jindera 330/132 kV transformer and various transmission lines.
Economic benefits
Snowy area 330 kV smart grid controls
By Jun 2025 3.3 Installation of a special protection scheme to protect against trips of both the Murray to Lower Tumut (66) and Murray to Upper Tumut (65) 330 kV lines.For a double circuit trips, the scheme will run back generation and load to avoid cascading outages and further loss of load in the network.
Economic benefits
Yass area 330 kV smart grid controls
By Jun 2025 4.0 Installation of a special protection scheme to protect against trips of two or more of the following 330 kV lines: Yass to Gullen Range (3J), Yass to Marulan (4, 5), Bannaby to Gullen Range (61).For multiple circuit trips, the scheme will run back generation and load to avoid cascading outages and loss of further load in the network.
Economic benefits
Installation of one 132 kV switchbay at Canberra 330/132 kV substation
Nov 2025 1.7 Evoenergy has planned a Strathnairn Zone Substation, being built to meet the high maximum load growth caused by a new housing development in Canberra. Refer to Evoenergy’s DAPR for more details.
Load driven
Ongoing projectsSecond supply to the Australian Capital TerritoryWe are required to provide two independent, geographically separate 330 kV supplies to the ACT as a condition of the ACT transmission licence. Canberra 330/132 kV substation provides the existing supply.
We are planning to establish a second geographically separate supply at Stockdill Drive by diverting 330 kV lines 01 and 3C into a new substation, with a 330/132 kV transformer providing 132 kV supply to Evoenergy.
This provides an efficient solution to both comply with the ACT Electricity Transmission Supply Code and address the need to replace one of the existing 330/132 kV transformers at Canberra that has reached the end of its serviceable life. Completion is expected by December 2020 at an estimated cost of $50.7 million.
Completed projectsThe modernisation and rehabilitation of Wagga 132 substation was completed in August 2018. Three 45-year-old, 60 MVA transformers were replaced by two 120 MVA units and all disconnectors and all secondary systems were replaced. This project replaced our last electromechanical impedance protections.
In December 2017, a basic Gadara Transfer Tripping scheme was commissioned to prevent generators at Burrinjuck, Blowering, Gadara or Jounama being islanded with load. Further inputs were added through 2018 and the scheme was completed in February 2019.
The Murray – Guthega tee Geehi 132 kV Line traverses Schlink Pass in Kosciuszko National Park at an altitude of 1800 m. The line is subject to many transient faults in winter due to ice loading and in summer due to lightning strikes. Auto reclose was commissioned in April 2019 to improve reliability.
Equipment limiting the rating of O51 Lower Tumut – Wagga 330 kV Line was removed, which increased the summer day contingency rating from 982 MVA to 1155 MVA.
2.3.6 South western NSW
Figure 24 – South western NSW network
Griffith
Coleambally
FinleyDeniliquin
Yanco
WaggaNorth
Wagga 132
Wagga 330
AlburyHume
Jindera
Morven
ANM
Wodonga
Uranquinty
Broken Hill
Silverton
Buronga
Balranald Darlington PointRed Cliffs
99Z
99H
O60
99B
996
62
995
99499F
99J
99K
99T
X5/1
X5/3
X2
99L
99A
9R3
63
OX1
99D
X6
330 kV Transmission Lines
132 kV Transmission Lines220 kV Transmission Lines
32 NSW Transmission Annual Planning Report 2019 33Chapter 2 | Transmission network developments

Cha
pter 2
Planned projectsThe need for a SCADA capacity augmentation at Deniliquin 132/66 kV substation discussed in TAPR 2018 has been integrated into the Secondary Systems Renewal project in
section 2.4.3. The following are other projects identified in the south western NSW network.
Table 5 – Planned projects in south western NSW
Project description
Planned date
Total cost ($million June-18)
Purpose Project justification
Maintain supply reliability to Broken Hill
When the load exceeds capacity of backup gas turbines
52.0 to 177.0 To provide additional capacity to supply Broken Hill, if the load exceeds the capacity of the backup gas turbines owned by Essential Energy and the expected unserved energy exceeds the unserved energy allowance for Broken Hill of 10 minutes at average demandPossible options include:• Establishing a battery storage solution to
complement the existing gas-turbines • Installing additional Gas Turbine generation with a
short start-up time• Procuring demand management from the loads in
the area• Establishing a second duplicate 220 kV transmission
line between Broken Hill and Buronga.
Reliability compliance
99T Darlington Point – Coleambally 132 kV Line Capacity Upgrade
Oct 2019 5.5 To relieve forecast constraints on in-service and committed solar generation in the area.
Economic benefits
Install Dynamic Transformer Rating Equipment on Darlington Point 330/220/33 kV Tie Transformers
Oct 2020 0.7 X5 Darlington Point Balranald 220 kV Line has a potential rating of approximately 420 MVA but there are two 200 MVA transformers at Darlington Point that limit the line loading.Operating these transformers to their capability will allow despatch of low cost generation at Balranald and Broken Hill and in north-west Victoria.
Economic benefits
Dynamic reactive support installations at Broken Hill and Buronga
Mar 2022 26.8 Installation of reactors and SVCs at Broken Hill and Buronga to address voltage constraints should a large mining development proceed in the area.
Load driven
Ongoing projectsEquipment limiting the rating of OX1 Buronga – Red Cliffs 220 kV Line was removed at the Buronga (NSW) end, which increased the summer day rating of the line from 265 MVA
to 417 MVA. Reciprocal works at Red Cliffs are now being investigated in order to remove the limitation on the Victoria end. Works are scheduled to be completed by June 2020.
Completed projectsWe commissioned an eight-hop UHF radio data link between Broken Hill and Buronga in October 2018. This new link compliments the existing Power Line Carrier (PLC) systems on X2 Buronga – Broken Hill 220 kV Line. Protection
signalling and a transfer tripping scheme to prevent unstable operation of generation in the area is transmitted across this link.
2.3.7 Across NSW
NSCAS needsWe are contracted to provide 800 MVAr of absorbing reactive power services to meet a Network Support and Control Ancillary Services (NSCAS) gap until 30 June 2019. It is planned to continue providing these absorbing reactive power services as a prescribed service following expiry of the current contract.
The 2018 NTNDP published in June 2018 by AEMO did not identify any NSCAS gaps in NSW.
NSCAS are ancillary services procured in order to maintain power system security. Under the NER, AEMO identifies NSCAS needs and we are required to procure NSCAS services to address needs in NSW. AEMO is the NSCAS Procurer of Last Resort if a TNSP is not able to procure NSCAS to meet their requirements.
Planned projectsTable 6 – Planned projects across NSW
Project description
Planned date
Total cost ($million June-18)
Purpose Project justification
Provide Dynamic Line Rating on various lines
Mar 2021 4.0 Weather stations will be installed to allow Dynamic Line Ratings to be calculated for a number of lines.Replacement of limiting equipment will permit use of higher ratings.Operating these lines to a dynamic rating appropriate to ambient conditions will facilitate construction and dispatch of additional low-cost generation.
Economic benefits
Remote or self-reset of busbar protection
Mar 2022 4.5 Installation of high definition Closed Circuit Television (CCTV) on busbars and facilities to reset busbar protections remotely at selected sites. This will reduce restoration time and duration of supply interruptions following busbar faults.
Economic benefits
VHF Radio Network Upgrade [Improve the Operational Telephone Network (OTN)]
Jun 2022 2.8 Domestic and international experience in emergencies such as system black or widespread bushfires has demonstrated that public switched telephone networks (including satellite telephones) suffer severe congestion and short battery life.We have an extensive VHF radio network that provides a crucial backup communications system between AEMO, generators, TNSPs and DSNPs.This project is to replace end-of-life equipment and enhance the functionality of the network to ensure its serviceability and capability in a critical network event.
Compliance
Transformer automatic voltage regulator (AVR) function changes
Jan 2023 0.1 To fulfil the obligation under the National Electricity Rules (NER) to ensure voltage levels at customer connections points are controlled to an agreed supply point voltage.Modification of AVR logic to allow automatic voltage regulation during reverse power flow at locations with high levels of embedded renewable generation.
Economic benefits
Overvoltage control following under frequency load shedding events
By Jun 2025 4.1 Implementation of overvoltage control schemes to automatically switch existing reactive plant quickly to maintain system security when the system frequency falls below a certain level.
Economic benefits
Ongoing projectsRoutine customer requests for changes to secondary equipment such as protection or voltage regulation are ongoing.
Completed projectsNo prescribed augmentation state-wide projects were completed in the 2018/19 financial year.
2.4 Replacement projects
The retirement of assets is planned as they reach the end of their serviceable life. We continue to improve the asset management strategies and policies which underpin our capital investment process. The risk of asset failure is continually monitored, as well as its impact on reliability, safety and on communities through bushfire and other environmental damage. A risk profile for each major asset is used to identify when action needs to be taken for high risk assets. Options to mitigate the risk are evaluated, including:
� Do nothing or increase maintenance interventions; � Defer the need for replacement, if viable non-network
options are available; � Like-for-like replacement;
� Replacement with an asset of different capacity based on forecast demand; or
� Reconfigure the network.
Economic analysis and consideration of our regulatory safety obligations is used to determine the appropriate course of action.
The projects described in this section have used this approach to determine the best solution for the identified needs. This section will describe TransGrid’s capital replacement works grouped by asset classes or work programs.
34 NSW Transmission Annual Planning Report 2019 35Chapter 2 | Transmission network developments

Cha
pter 2
The information provided in this section describes the work, the actual or potential constraint or inability to meet network performance requirements of NER Schedule 5.1, the need date, proposed solution and its estimate. Given that they are mostly in-situ or like-for-like replacement projects, they do not cause any material inter-network impact.
The information reported in this section meets the requirement of NER Clause 5.12.2(c)(5) and (6).
These replacement projects align with the theme of AEMO’s ISP consultation paper of greater interconnection within the NEM and supporting or facilitating the connection of large-scale energy zone across the NEM.
TransGrid presently does not anticipate any replacement project required to address an urgent and unforeseen network issue.
2.4.1 Transmission lines
Steel tower corrosion managementA refurbishment program that addresses steel tower corrosion issues is being undertaken on coastal tower transmission lines in the Newcastle, Central Coast, Sydney and Illawarra regions. The program includes refurbishment of rusted steel towers and the replacement of conductor fittings, earth wires and insulators at risk of failure.
These identified condition issues increase the probability of failure of a steel tower, conductor fittings, earth wires and insulators. Analysis has shown that risk costs can be offset by extending the lives of transmission lines through targeted refurbishment and replacement of specific components.
Table 7 – Planned steel tower transmission line asset renewal projects
Transmission line location Operationaldate required
Total estimatedcost ($ million)
5A1/5A2 Eraring – Kemps Creek 500 kV line By Jun 2023 2.6
8 Dapto – Marulan 330 kV line By Jun 2023 7.2
2M Munmorah – Tuggerah 330 kV line By Jun 2023 5.6
24 Eraring – Vales Point 330 kV line By Jun 2023 6.2
25 & 26 Eraring – Vineyard 330 kV line & Munmorah – Sydney West 330 kV double circuit line By Jun 2023 11.6
3W Capital Windfarm – Kangaroo Valley 330 kV line By Jun 2023 7.8
81 Liddell – Newcastle 330 kV line By Jun 2023 4.9
20 Sydney West – Sydney North 330 kV line By Jun 2023 1.8
21 Sydney North – Tuggerah 330 kV line By Jun 2023 3.1
28 Sydney North – Sydney East 330 kV line By Jun 2023 2.0
23 Vales Point – Munmorah 330 kV line By Jun 2023 2.1
13 Kemps Creek – Sydney South 330kV line – single circuit section only By Jun 2023 1.3
14 Kemps Creek – Sydney North 330 kV line By Jun 2023 3.8
16 Avon – Marulan 330 kV line By Jun 2023 5.6
18 Dapto – Kangaroo Valley 330 kV line By Jun 2023 3.6
11 Dapto – Sydney South 330 kV Line By Jun 2023 25.5
27 Sydney North – Sydney East 330 kV line By Jun 2023 2.1
88 Muswellbrook – Tamworth 330 kV line By Jun 2023 12.7
90 Eraring – Newcastle 330 kV line By Jun 2023 2.7
93 Eraring – Newcastle 330 kV line By Jun 2023 1.7
22 Vales Point – Sydney North 330kV line By Jun 2023 20.9
959 & 92Z Sydney North – Sydney East 132kV double circuit line By Jun 2023 7.1
17 Macarthur – Avon 330kV line By Jun 2023 7.0
39 Bannaby – Sydney West 330kV line By Jun 2023 3.6
31/32 Bayswater – Regentville 330 kV double circuit line By Jun 2023 9.4
Wood pole replacementsWe are replacing wood pole structures in poor condition on some 132 kV transmission lines with concrete or steel
poles to address deterioration from wood rot, decay and termite attack.
Table 8 – Wood pole replacement projects
Transmission line location Operationaldate required
Total estimatedcost ($ million)
94X Wallerawang – Panorama 132 kV line and 948 Panorama – Orange North 132 kV line Jun 2020 10.0
993 Gadara – Wagga 132 kV line* Jun 2020 12.8
96L Tenterfield – Lismore 132 kV line Jun 2020 5.4
966 Armidale – Koolkhan 132 kV line Jun 2021 3.4
9U3 Gunnedah – Boggabri East 132 kV line and 9UH Boggabri North to Narrabri 132 kV line Jun 2021 5.1
96F Tomago – Stroud 132 kV line Jun 2021 3.6
94K Wellington – Parkes 132 kV line Jun 2021 22.2
99A Uranquinty – Finley 132 kV line Jun 2021 10.7
995 Hume – Albury, 97L Guthega – Jindabyne Pumps and 976 Canberra – Queanbeyan 132 kV lines
Jun 2022 5.0
99J Yanco – Griffith 132 kV line Jun 2023 9.4
99D Yanco – Darlington Point 132 kV line Jun 2023 8.3
*Includes some remediation of low spans
Remediation of low spansTransmission lines are designed and constructed to achieve standard electrical clearances of the conductor at specific operating conditions. The currently accepted industry standard is AS7000 for the Design of Overhead Lines, which specifies minimum electrical clearances that should be achieved when the conductor reaches its maximum operating temperature (also commonly referred to as the line design temperature).
We have conducted aerial laser surveys of its transmission lines to provide accurate measurement of span heights. Using this new technology that provides more accurate measurements than previous approaches, a number of transmission lines have been found to have spans violating AS7000 minimum clearances (low spans) at the normal foreseeable operating temperature. These low spans pose a risk to public safety.
We have conducted a risk assessment on the identified low spans. The risk assessment method evaluates each
low span violation in accordance with multiple risk criteria including magnitude (height and area), location and violation temperature. The spans have then been ranked accordingly, and categorised as presenting a higher risk and lower risk to public safety. The remediation options considered include:
� Remediate all low spans � Remediate higher risk low spans only, with the lower
risk spans addressed by means of administrative control measures.
The remediation of higher risk low spans is proposed to reduce the level of risk to public safety across the network. We are required to fulfil the requirements of AS5577 Electricity Network Safety Management Systems, and the public safety risk presented by the low spans must be reduced As Low As Reasonably Practical (ALARP). The proposed remediation works are expected to mitigate the public safety risk to an acceptable level.
Table 9 – Low Span Projects
Transmission line location Operationaldate required
Total estimatedcost ($ million)
Low spans on various lines By Jun 2023 4.6
Grillage TowersTransGrid’s earliest transmission towers (50 to 60 years old) have been installed with grillage foundations, where the footings are constructed from hot-dip galvanised steel members formed into a grill and direct buried.
This type of foundation did not use any concrete relying on the steel frame and the encapsulated soil as the foundation support for the tower superstructure.
36 NSW Transmission Annual Planning Report 2019 37Chapter 2 | Transmission network developments

Cha
pter 2
Sacrificial anodes have been installed at various times on these towers to provide galvanic cathodic protection as a mitigation measure against footing corrosion.
A field assessment of the cathodic protection system and grillage condition on a sample of towers conducted in April 2016 has concluded that the installed sacrificial anodes are no longer providing sufficient protection against tower footing steelwork corrosion. It is expected that these anodes have been consumed while providing sacrificial
protection to the buried tower foundations and therefore have reached the end of their useful life.
Corrosion of buried steelwork is coupled to the soil exposure classification, as described in AS2159, which determines the rate at which buried steel is expected to corrode in various ground and environmental conditions. Remediation could include tower footing concrete encapsulation (after required steel remediation) or anode replacement.
Table 10 – Grillage Tower Remediation
Transmission line location Operationaldate required
Total estimatedcost ($ million)
999 – Yass – Cowra 132 kV line By Jun 2023 7.9
01 Upper Tumut – Canberra and 9 Canberra – Yass 330 kV lines By Jun 2023 8.2
2 Upper Tumut – Yass 330 kV line By Jun 2023 9.6
4 and 5 Yass – Marulan 330 kV lines By Jun 2023 11.9
11 Sydney South – Dapto 330 kV line By Jun 2023 0.2
U1, U3, U5, U7 Upper Tumut 330kV Group Lines; 65 Murray – Upper Tumut 330 kV line; 66 Murray – Lower Tumut 330 kV line and 97K Cooma – Munyang 132 kV line
By Jun 2023 6.7
995 Hume Albury 132 kV line; 99X, 9R5, 9R6 and 990 Wagga area 132 kV double circuit structures; 970 Yass – Burrinjuck 132 kV lattice towers
By Jun 2023 1.8
2.4.2 Substation plant
We continually monitor the condition of our substation assets to ensure safe and reliable operation. We have established asset replacement programs to cover the replacement of identified circuit breakers, instrument transformers, bushing and disconnectors with poor condition.
Our replacement programs comprise the most economic combination of replacement and refurbishment options for transmission equipment reaching a condition that reflects the end of its serviceable life. The asset replacement
projects forming these programs are individually of relatively minor value.
The condition of larger assets such as transformers, reactors and capacitor banks is also monitored and replacement, retirement or refurbishment options are evaluated to result in individual projects to address condition as required.
The condition based replacement programs and projects help to ensure the continued safety of employees, contractors, and the public and to maintain a reliable electricity supply.
Table 11 – Planned substation primary (HV) asset renewal/replacement projects
Project description and location Area Operationaldate required
Total estimatedcost ($ million)
Armidale 330 kV substation No.2 reactor renewal Northern Sep 2020 4.1
Sydney East 330 kV substation No.2 and No.3 transformer replacements
Sydney Jun 2021 20.6
Wellington 330 kV substation No.1 reactor replacement Central Dec 2021 4.9
Forbes 132 kV substation transformer replacements Central Feb 2022 8.8
Transformer renewals at Ingleburn, Kemps Creek, Liverpool, Moree, Murray, Murrumburrah, Panorama, Sydney North
Across NSW By Jun 2023 13.6
Various steelwork renewals – (Overall programs currently being reassessed)
Across NSW By Jun 2024 TBD
2.4.3 Secondary systems
We continually strive to find a better solution for managing the various facets of secondary systems which covers amongst others the protection, metering, control, communications, AC, DC supply, alarm systems etc. The need to do thing better, smarter and more efficiently, by leveraging on new technologies such as IEC-61850.
To date, we have commissioned the first of TransGrid’s IEC-61850 digital substation employing both process bus and station bus, utilising optical fibres cables between substation switchyards and relay rooms.
We have an accredited Asset Management System to ensure that TransGrid’s assets are managed in accordance to the best practice. This further provides assurance to the stakeholders and community at large that the assets are being operated, maintained and replaced based on sound qualitative analyses to provide optimum benefits.
Strategies being rolled out will deliver benefits in the foreseeable future in areas such as reduced maintenance requirements, improve operational efficiencies, increased utilisation, improved visibility of assets, reduced life cycle cost and increased reliability.
Table 12 – Planned substation secondary asset renewal and replacement projects
Location Area Operationaldate required
Total estimatedcost ($ million)
Sydney West SVC Control System Replacement* Central Jul 2020 4.8
Muswellbrook Secondary Systems Renewal Newcastle and Central Coast
Nov 2020 6.0
Tuggerah Secondary Systems Renewal Newcastle and Central Coast
Dec 2020 6.7
Molong Secondary Systems Renewal Central May 2021 4.0
Marulan Secondary Systems Renewal Southern Jun 2021 5.6
Ingleburn Secondary System Renewal Sydney Sep 2021 5.9
Tamworth 330kV Secondary Systems Renewal Northern Dec 2021 6.1
Broken Hill Secondary Systems Renewal* South western Feb 2022 13.0
Darlington Point Secondary Systems Renewal South western Mar 2022 5.7
Wagga 330kV Secondary Systems Renewal Southern Mar 2022 8.6
Lismore SVC Control System Replacement* Northern Mar 2022 10.9
Deniliquin Secondary Systems Renewal South western Jun 2022 12.6
Coleambally Secondary Systems Renewal South western Aug 2022 2.5
Haymarket Secondary Systems Replacement Sydney Dec 2022 12.2
Liverpool Secondary Systems Renewal Sydney Oct 2023 4.5
Tenterfield Secondary Systems Renewal Northern Nov 2023 4.8
Murrumburrah Secondary Systems Renewal Southern Oct 2024 6.2
* Project includes some HV asset removals or replacements
2.4.4 SCADA system
The Supervisory Control and Data Acquisition (SCADA) system is a vital tool that allows us to efficiently operate and maintain our network, providing real-time visibility of the network status and alerting abnormal conditions. We use the SCADA system to operate, control and monitor the high voltage network remotely from our central control centre. The existing SCADA system will have been in service for seven years by 2020, using an operating platform and assets no longer supported by the providers.
A project to replace the existing system is underway. This will provide a completely new platform running on new hardware and a modern network architecture. The expected project cost is $15.0 million and is planned to be completed by December 2020.
38 NSW Transmission Annual Planning Report 2019 39Chapter 2 | Transmission network developments

Cha
pter 2
2.5 Asset retirements and deratings
Sydney East currently has four 330/132 kV transformers supplying the load in the surrounding area, three of which are reaching end-of-life. The demand forecast for the coming ten years does not justify the replacement of three transformers, therefore TransGrid will be replacing two transformers, as shown in section 2.4.2, and retiring one transformer. One of the replacements will be a new transformer, and one transformer will come from relocating a Rookwood Rd transformer to Sydney East.
Should the forecast load in the Sydney East area increase in the coming years that would lead to a constraint, TransGrid will investigate the installation of a fourth transformer at that time.
TransGrid is not planning to retire or derate any other assets in our network over the next 10 years that would result in network constraints. The information reported in this section meets the requirement of NER Clause 5.12.2(c)(1A) and (1B).
Regulatory Investment Test for Transmission (RIT-T)
2.6 Regulatory Investment Test for Transmission (RIT-T) schedule
TransGrid will be preparing a number of RIT-T assessments for the projects outlined within this chapter for the upcoming year with capital investment dollars above
$6 million. The table below outlines the expected kick off dates for various RIT-Ts.
Table 13 – Planned RIT-T projects
Project description
RIT-T Kick Off Quarter
Type of project
31-32 Bayswater - Regentville Double Circuit Refurbishment 2019Q3 Transmission Line
Ingleburn Secondary System Renewal 2019Q3 Secondary Systems
Tamworth 330kV Secondary Systems Renewal 2019Q3 Secondary Systems
Line 11 Suspension Structure Renewal 2019Q3 Transmission Line
Broken Hill Supply Reliability 2019Q3 Reliability
Broken Hill Secondary Systems Renewal 2019Q3 Secondary Systems
Forbes No1 and No2 Tx Replacements 2019Q3 Substation
Macarthur Second 330-66kV Transformer 2019Q3 Substation
Increasing thermal capacity between Molong and Orange 2019Q3 Transmission Line
Increasing thermal capacity in the South-western NSW network
2019Q4 (approx.)
Transmission Line
Western Sydney Development 2020Q1 Substation and Transmission Line
Beryl area renewables 2020Q1 (approx.)
Substation and Transmission Line
A list of TransGrid’s ongoing RIT-T consultations can be found at: https://www.transgrid.com.au/what-we-do/projects/regulatory-investment-tests/Pages/default.aspx
2.7 Changes from TAPR 2018
Updates in this chapter and referenced Appendices since TAPR 2018 includes the following:
� The project to rebuild the 86 line due to asset condition has been deferred and its timing will be reassessed
� Dates for load-driven projects reflect the most recent information on the timing of new loads
� Smart grid projects have been rescheduled to allow for scope and options of each project to be reviewed following finalisation of the preferred options for Integrated System Plan projects
� Projects for transfer tripping schemes have been removed as they are no longer required due to market participants installing anti-islanding schemes
� The installation of dynamic voltage support at various locations has been deferred while the process for actioning the ISP is underway, and will be reassessed at a later date
� Reference to a new TransGrid TAPR website has been included
� RIT-T projects are now listed in this chapter with a reference to TransGrid’s website for ongoing and upcoming RIT-T projects.
These changes are consistent with the requirements of NER Clause 5.12.2(c), (1A), (1B), (3), (5), (6), (7) and (8).
We recognise the importance of consulting with our stakeholders to plan, develop and maintain the network to ensure it meets expectations now and into the future. For significant augmentation and renewal investments, one of the avenues for consultation is the Regulatory Investment Test for Transmission (RIT-T).
This process is designed to notify stakeholders of the investment need, network or non-network solutions, invite the public to submit delivery proposals and advise stakeholders of the selection process.
The RIT-T applies to transmission network investments where the cost of the most expensive credible option is greater than $6 million. It currently applies to all investments, except those relating to maintenance or urgent and unforeseen investments.
The RIT-T normally involves publication of three reports that highlight key milestones in the consultative process: the Project Specification Consultation Report (PSCR), the Project Assessment Draft Report (PADR) and the Project Assessment Conclusion Report (PACR). Minimum consultation periods following publication of the PSCR and PADR are specified and there is a requirement for the consideration of submissions received in response to these documents. The PADR can be omitted under certain circumstances provided for in the NER.
For the category of ‘replacement transmission network asset’ there is a requirement to disclose information in annual planning reports that includes a brief project description, commissioning date, other reasonable options considered, estimated cost, and planned asset de-ratings and retirements.
TransGrid has initiated two RIT-Ts for major transmission development and PSCRs were published in November 2018. TransGrid is presently drafting several PSCR’s pertaining to asset condition driven investments.
Figure 25 – RIT-T consultation documents
Project SpecificationConsultation Report
Project Assessment Draft Report
Project Assessment Conclusion Report
40 NSW Transmission Annual Planning Report 2019 41Chapter 2 | Transmission network developments

Cha
pter 3
3.1 Opportunities for network support
The transition to a low emissions energy system will see a substantial change to the way electricity is generated. Traditional carbon intensive large-scale generation is expected to progressively retire, and replacement sources are likely to be a mix of large-scale variable renewable generation and distributed energy resources.
Operation of a secure and reliable power system will require the deployment of generation firming and ancillary services by alternative means. Demand management and energy storage technology is ideally placed to provide some of these ancillary services. Both demand management and energy storage, in the form of demand response, pumped storage and batteries, can complement renewable generation by balancing energy produced from intermittent
sources to ensure that it is available at the times it is required to meet demand.
We have identified the potential for network support opportunities to arise in the Inner Sydney and Broken Hill areas. The network constraint for Broken Hill is discussed in Section 2.3.6. The intent to issue Requests for Proposals (RfP) is set out in Section 3.1.1.
Both NER Clause 5.12.2(c)(4) and the transmission annual planning report guidelines require TransGrid to report the subset of forecast constraints identified earlier in Chapter 2, where an estimated reduction in forecast load would defer a forecast constraint for a period of 12 months. The ‘TAPR data’ for the subset of forecast constraints is reproduced below.
Table 14 – Forecast constraint information
Constraint or anticipated constraint Proposed timing Annual deferral value
Demand reduction required to defer investment by 1 year
Macarthur second 330/66 kV transformer (augmentation)
2021/22 $568,980 45-55 MW
Sydney East No.1 to 3 330/132 kV transformers (replacement)
2021/22 $492,000 20-50 MW
3.1.1 Requests for Proposals
TransGrid plans to issue RfPs for augmentation, replacement of network assets, or non-network options for the constraints listed in the table below.
Table 15 – Anticipated issue of a RfP
Constraint or anticipated constraint Intent to issue RfP Load reduction required
Constraint Date Release Date
Powering Sydney’s Future - Expected unserved energy associated with the deteriorating condition of Inner Sydney cables (replacement)
RFP – Round 2 20-60 MW from summer 2019/2020 to 2021/22
Summer 2021/22 May 2019
Supply to the Broken Hill area - Reliability (replacement)
To be assessed To be assessed To be assessed To be assessed
Forecast voltage and thermal constraints in the Gunnedah/Narrabri area
To be assessed To be assessed To be assessed To be assessed
Voltage support in the Parkes area To be assessed To be assessed To be assessed To be assessed
Voltage support in the Orange area To be assessed To be assessed To be assessed To be assessed
3.2 Changes from TAPR 2018
Updates in this chapter and referenced Appendices since TAPR 2018 includes the following:
� Reference to ‘TAPR data’ on TransGrid’s website consistent with the new transmission annual planning report guidelines
� Generation connection data has been moved to Chapter 4, with this Chapter focussed on network support opportunities
� Network support opportunities have been updated.
These changes are consistent with the requirements of NER Clause 5.12.2(c)(2).
Chapter 3
Network support opportunities
� TransGrid has identified two locations where an estimated reduction in forecast load would defer a forecast constraint for a period of 12 months
� TransGrid has issued a Request for Proposals for non‑network solutions in Inner Sydney
� TransGrid has identified four further locations where there may be potential to issue Requests for Proposals for non‑network solutions in the next 10 years.
43Chapter 3 | Network support opportunities

Cha
pter 4
4.1 Key highlights
4.1.1 Supply
Since the publication of TAPR 2018, the following levels of generation have signed connection agreements and are incorporated in our planning review as committed generation:
� 1,131 MW of solar generation capacity � 469 MW of wind generation capacity.
We expect further generation to sign connection agreements over the next 12 months as proponents advance through the connection process.
TransGrid continues to receive connection enquiries for projects at various stages of development across NSW. Only a fraction of this proposed generation can be accommodated in the spare capacity of TransGrid’s current network. The approximate available network capacity for generation connections in TransGrid’s identified large-scale energy zones in NSW is presented in the figure below.
Figure 26 – NSW Transmission Connection Activity 2016-2019
SYDNEY
Northern NSW
Solar
Avail Capacity
Wind
800 MW
Central NSW
Solar
Avail Capacity
Wind
400 MW
South-West NSW
Solar
Avail Capacity
Wind
0 MW
600 MW
South-East NSW & ACT
Solar
Hydro
Wind
5,200 MW
2,000 MW
Avail Capacity
2,000 MW
Southern NSW
Solar
Avail Capacity
Barrier Ranges
Solar
Avail Capacity
Wind
0 MW
350 MW
200 MW
9,500 MW
4,250 MW
8,000 MW
4,500 MW
4,200 MW
6,500 MW
0 MW
800 MW in north0 MW in south
YassMarulan
Yanco
Griffith
Buronga
Broken Hill
FinleyDeniliquin
Darlington Point
AlburyHume
Cooma
Munyang
Snowy Adit
Queanbeyan
Tumut
Murrumburrah
Cowra
Kangaroo Valley
Panorama
Molong
Orange
Beryl
Parkes
Forbes
Wellington Bayswater Liddell
Dapto
Muswellbrook
Tamworth 330
Armidale
DumaresqLismore
Tamworth 132
Gunnedah
Narrabri
Moree
Inverell Glen Innes
Tenterfield
Koolkhan
Coffs Harbour
Nambucca
Kempsey
Port Macquarie
Taree
Balranald
Coleambally
Murray
Upper Tumut
Lower Tumut
ANMJindera
Guthega
Avon
Wagga 132Burrinjuck
Wagga 330
Red Cliffs
Dederang
Wodonga
Bulli Creek
Mudgeeraba
Uranquinty
Gadara
Capital Wind Farm
Raleigh
Wollar
Macksville
Boambee South
Bannaby
Wagga North
Manildra
Orange North
Williamsdale
Stroud
Hawks Nest
Mudgee
Ilford
Burrendong
Wellington Town
Geehi
Blowering
Murrumbateman
Casino
Dorrigo
Canberra
Jindabyne
Morven
Mt Piper 132
Mt Piper 500
Gullen Range
Herons Creek
BoggabriEast
BoggabriNorth
White Rock
Wallerawang 330Wallerawang 132
Sapphire
Silverton
Crookwell 2
Bodangora
Connections
Wind
Solar
Hydro
In Service ConnectionApplication
ConnectionEnquiry
Available capacities are after the connection of committed generation.
LEGENDSubstations500 kV Transmission LinesSubstations330 kV Transmission LinesSubstations220 kV Transmission LinesSubstations132 kV Transmission Lines
Interstate Exchange Point
330 kV Underground CableCustomer Exchange Point
Chapter 4
Forecasts and planning assumptions
� Annual NSW & ACT energy consumption is forecast togrow at an average rate of 0.5% per annum over thenext ten years under the most likely scenario, due to population and economic growth
� Under the medium scenario and 50% Probabilityof Exceedance (POE) conditions, summer maximumdemand is expected to grow by around 0.8% per annum and winter maximum demand by around 0.6% per annum on average. The growth rate in summer is slightly higher than last year’s forecast and is mainly driven by long run growth in temperature sensitive demand
� 1,600 MW of new generation has committedto connect at various locations in NSW. This isexpected to continue to grow as advances in renewable generation technologies improve the cost competitiveness of new renewable generation
� NSW transmission reliability standards commencedfrom 1 July 2018. We have assessed that thetransmission network complies with the standards from 1 July 2018. However, during the next ten years, expected changes at Broken Hill will likely require transmission developments to maintain compliance with Broken Hill BSP. A project to address this has been included in Chapter 2.
45Chapter 4 | Forecasts and planning assumptions
9,500 MW

Cha
pter 4
4.1.2 Demand
Table 16 shows that demand growth was moderate in recent years and will most likely remain so over a ten-year forecast horizon.
Table 16 – NSW region medium scenario energy and demand (compound average annual growth rates)
Actual/estimated2013-14 to 2018-19(2013 to 2018 for winter)
Forecast 50% POE2019-20 to 2028-29(2019 to 2028 for winter)
Annual energy 1.0% 0.5%
Maximum demand (Summer) 1.3% 0.8%
Maximum demand (Winter) 0.3% 0.6%
4.2 TransGrid’s 2019 NSW region forecast
4.2.1 Introduction
TransGrid has prepared demand forecasts for the NSW region over a ten-year horizon under three scenarios: a medium (or most likely), a high growth and a low
growth scenario. The following sections describe the sources and assumptions behind the demand forecast and present the detailed forecast outcomes.
4.2.2 Definitions, assumptions and inputs
The forecasts include annual energy in GWh, summer maximum demand (MD) in MW and winter MD in MW. These measures are presented in terms of demand on the transmission network. This is measured by the output of all National Electricity Market (NEM) system connected scheduled, semi-scheduled and non-scheduled generating units. The sum of output from all these types of generating units is termed “native” energy or demand.
Generation measured at generator terminals includes any power used for generator auxiliaries and is termed “as generated”. Alternatively, generation measured at the point of connection with the network is termed “sent out”. In this report, energy is on a sent out basis and MDs are on an as-generated basis.
MDs are half-hour averages and are highly dependent on the prevailing weather. High temperatures on summer afternoons and low temperatures on winter evenings typically produce half-hourly demand peaks. To account for the imprecise nature of long range weather forecasting, forecast MDs are prepared in terms of 10 per cent probability of exceedance (10% POE), 50 per cent probability of exceedance (50% POE) and 90 per cent probability of exceedance (90% POE). POE delineates the frequency with which probable demand is expected to exceed the stated level. For example, a 10% POE level of demand is expected to be exceeded 10% of the time (i.e. once in every ten years).
Around 18 per cent of TransGrid’s load is accounted for by a handful of large industrial or mining customers, all of whom are connected at very high voltages and some directly to
the transmission network. These specific loads are denoted “spot loads”. They are not generally subject to incremental change as a result of economic conditions or population growth, and are typically weather insensitive. As a result spot loads are not included in the forecast process but are added back into the forecast at the end.
TransGrid prepared the forecasts based on top-down models of underlying consumer behaviour, in the absence of recent above-trend energy efficiency, using a measure of electricity services. This measure includes the impacts of estimated energy efficiency, and distributed energy resources (DER), including small-scale photovoltaic (PV) generation, and stationary and electric vehicle charging/discharging.
In order to prepare the forecasts TransGrid used projections of population and economic growth, policy and programme driven energy efficiency impacts and various DER components. Small projected changes to certain large mining, commercial and industrial loads (spot loads) were informed by TransGrid customer data. TransGrid used the projections of DER and spot loads to modify its modelled forecasts of underlying consumer demand.
Further information about the method of preparation of the forecast, and a review of previous forecast accuracy, is in Appendix 1.
4.2.3 Demand drivers
Underlying consumer demand for electricity is traditionally understood to be driven by population and economic growth, and energy prices, in the long term, and by weather in the short term. However, in the past decade, a coincidence of energy efficiency, take up of DER and rising electricity prices apparently acted to moderate demand. In preparing the NSW region demand forecasts, TransGrid has therefore considered the combined impacts of underlying consumer behaviour, energy efficiency and DER on the transmission network.
The forecasts are derived from a measure of “electricity services” which is derived as native energy or demand, plus out of trend energy efficiency and PV generation, minus battery charging, plus discharging.9 The economic drivers of electricity services remain consistent and are capable of being reliably modelled. TransGrid models residential and non-residential electricity services separately. In these models, population, household disposable income (HDI), residential electricity and gas prices and temperature, drive residential demand; while gross state product (GSP), non-residential electricity and gas prices and temperature drive non-residential demand. TransGrid obtained independent projections of population and economic growth10, as well as electricity and gas prices11. TransGrid’s models predict that:
� a one per cent increase in HDI will lead to an increase in residential electricity services of 0.55 per cent income electricity price;
� a one per cent increase in GSP will lead to an increase in non-residential electricity services of 0.74 per cent;
� a one per cent increase in the residential electricity price will lead to a decrease in residential electricity services of 0.21 per cent; and
� a one per cent increase in the non-residential electricity price will lead to a decrease in non-residential electricity services of around 0.21 per cent.
The models also predict small positive increases in electricity services as a result of an increase in gas prices, or increased summer or decreased winter temperatures.
It may be the case that, in addition to the pure price impacts allowed for in TransGrid’s models, there could be “rebound” effects from either increased energy efficiency, increased PV self-generation or the use of battery storage resulting in lower energy bills. TransGrid did not assess the potential for such rebound effects and as such the forecasts may be deemed to be relatively conservative. However, there is some evidence that electric vehicles may improve the payback for installing residential rooftop PV systems, which would increase the take-up of such systems above TransGrid’s forecast allowance.
TransGrid obtained independent advice12 on the impact of various energy efficiency programmes and policies to construct measures of electricity services for modelling purposes. The above-trend element of energy efficiency was subsequently removed from the modelled forecasts of electricity services to identify the expected grid impact.
TransGrid also obtained independent advice13 on the expected take-up by both residential and non-residential consumers of rooftop PV generation and accompanying battery storage, externally charged electric vehicles, and each of their associated load impacts on the power system.
4.2.4 Temperature sensitivity
TransGrid’s analysis of variation of maximum demand with temperature reveals that current summer temperature sensitivity is 353 MW per degree increase in the average daily temperature, which represents a doubling in sensitivity
in percentage terms in the last 25 years. Winter temperature sensitivity has increased only marginally in that time and is estimated to have been 193 MW increase per degree reduction in average daily temperature in 2018.
4.2.5 Climate change
TransGrid assumes that Australia will meet its existing obligation to reduce national greenhouse emissions by 26% on 2005 levels by 2030. Existing renewable certificate schemes (the Small-scale Renewable Energy Target and the Large-scale Renewable Energy Target) and State based renewable energy schemes will contribute to the emissions reduction target, as will the planned closure of coal fired power stations. Steady increases in renewable generation and withdrawal of non-renewable generation in large increments will affect the wholesale price of electricity and therefore indirectly affect demand.
Projected increases in future average temperatures of around 0.5 degrees every ten years are consistent with NSW average temperature trends over the last 20 years. This will make a small but significant contribution to annual energy and summer demand growth but will detract from winter demands.
9 Assuming all measures are expressed as positive terms.10 BIS Oxford Economics (2019) Economic and Dwelling Forecasts to FY2038 – NSW and ACT, Final, April 2019.11 Jacobs (2019) Retail Price Projections for NSW, Final Report, 7 June 2019.12 Energy Efficient Strategies (2019) Impact of Energy Efficiency Programs on Electricity Consumption in NSW and the ACT from 2000 to
2038, Final Report, 13 May 2019.13 Energeia (2019) Inputs to 2019 Transmission Annual Planning Report Load Forecast: Distributed Energy Resources Modelling, 5 June
2019. TransGrid also sourced alternative forecasts of small-scale PV generation and stationary battery usage from Jacobs (2019). The two sets of forecasts are broadly (and independently) aligned.
46 NSW Transmission Annual Planning Report 2019 47Chapter 4 | Forecasts and planning assumptions

Cha
pter 4
4.2.6 Forecast scenarios
The annual energy and maximum demand models are conditional on a number of input variables. Each of these inputs is varied in correspondence to either the medium, high or low energy scenario. TransGrid judges the probability of the future approximating the medium scenario to be greater than the probability of either the high or low scenario.
The medium, high and low annual energy forecasts result from use of the corresponding input variables. The maximum demand forecasts are derived in part from the forecast annual energy growth forecast and in part from extensive analysis of maximum demand-temperature relationships. The load forecasts are therefore driven by the inputs provided by each scenario.
A summary of the three scenarios is presented in Table 17.
Table 17 – Scenario inputs*
Input Variables Medium energy scenario
High energy scenario
Low energy scenario
Population growth (average 2020 to 2029) % 1.1 1.5 0.8
Real household disposable income (average 2020 to 2029) % 2.6 3.3 1.9
Economic growth GSP (average 2020 to 2029) % 2.5 3.1 1.7
Real residential electricity price (average 2020 to 2029) % -0.6 -1.1 0.0
Real non-residential electricity price (average 2020 to 2029) % -0.8 -1.4 -0.2
Real price of gas and other fuels (average 2020 to 2029) % -1.8 -0.2 -1.1
Average temperature increase (2020 to 2029), degrees 0.5 0.5 0.5
Additional energy residential efficiency savings in 2029 (compared to 2020), GWh 2174 2,174 2,174
Additional energy non-residential efficiency savings in 2029 (compared to 2020), GWh 5,853 5,853 5,853
Residential rooftop PV generation in 2029, GWh** 5,061 5,331 4,877
Non-residential rooftop PV generation in 2029, GWh** 1,328 1,236 1,167
Stationary battery net charging in 2029, GWh** 282 276 237
Vehicle battery charging in 2029, GWh 866 1,337 253
* Note: Compound average growth rates where shown as %.** Scenarios for rooftop PV and stationary battery projections follow similar trajectories and in some instances cross each other.
4.2.7 Annual energy forecasts
Figure 27 and Table 18 show annual energy forecasts for the medium, high and low scenarios. Energy sent out has been on an upward trend since 2013/14 even with the recent increases in wholesale prices, increases in rooftop PV and uptake of energy efficiency measures. Over the forecast horizon the main drivers of growth are:
� Continued population and economic growth � A small increase in spot loads in line with observed
change over the last five years
� Fluctuating retail electricity prices that, on average, experience a fall in real terms
� A small but significant increase in electric vehicle charging towards the end of the forecast horizon
� Offsets to growth as a result of energy efficiency programs and the up-take of small-scale PV systems
The 2019 energy forecast is on average 1.6 per cent, or 1,170 GWh below the 2018 forecast.
Figure 27 – NSW region sent-out annual energy consumption (GWh) forecast
0
10,000
20,000
30,000
40,000
50,000
60,000
70,000
80,000
90,000
TAPR 2018 lowTAPR 2018 highTAPR 2018 mediumTAPR 2019 lowTAPR 2019 highTAPR 2019 mediumActual
2028/29
2027/28
2026/27
2025/26
2024/25
2023/24
2022/23
2021/22
2020/21
2019/20
2018/19
2017/18
2016/17
2015/16
2014/15
2013/14
2012/13
2011/12
2010/11
2009/10
2008/09
GW
h
Table 18 – NSW region sent-out annual energy consumption (GWh) forecast
Actual Medium High Low
2013/14 67,073
2014/15 68,766
2015/16 70,020
2016/17 70,120
2017/18 70,423
2018/19 (Est.) 70,500
2019/20 70,990 71,580 70,390
2020/21 71,480 72,660 70,280
2021/22 71,650 73,120 70,100
2022/23 71,150 73,280 69,470
2023/24 71,160 74,140 68,630
2024/25 71,230 74,750 68,050
2025/26 71,900 76,040 68,220
2026/27 72,520 77,250 68,530
2027/28 73,440 78,750 68,710
2028/29 74,380 80,280 69,090
Compound Average Growth Rate 2019/20 – 2028/29 0.5% 1.3% -0.2%
48 NSW Transmission Annual Planning Report 2019 49Chapter 4 | Forecasts and planning assumptions

Cha
pter 4
Figure 28 shows the composition of historic energy and the medium growth forecast. A significant amount of potential load increase has been, and is forecast to continue to be, offset by accelerated energy efficiency and small-scale
PV take up. Meanwhile, the impact of battery charging on annual energy is forecast to remain modest over the forecast horizon.
Figure 28 – Composition of NSW region annual energy consumption (actual and medium forecast)
0
10,000
20,000
30,000
40,000
50,000
60,000
70,000
80,000
90,000
100,000
GW
h
Forecast energy sent out
2028/29
2027/28
2026/27
2025/26
2024/25
2023/24
2022/23
2021/22
2020/21
2019/20
2018/19
2017/18
2016/17
2015/16
2014/15
2013/14
2012/13
2011/12
2010/11
2009/10
2008/09
2007/08
Energy sent out (native grid energy)Energy EfficiencyPV self generationVehicle charging and stationary batteries
ResidentialOther non-residentialMajor industrial (spot loads)
4.2.8 Summer maximum demand forecast
Figure 29 and Table 19 show summer MD forecasts for the medium, high and low scenarios. The forecasts include the 10%, 50% and 90% POE levels for each scenario. Summer MD has increased at a higher rate than annual energy, due to increasing temperature sensitivity as the uptake of air-conditioning increased.
Over the forecast horizon, the main drivers of growth are: � Underlying market growth as reflected by the
energy forecast � Continued – albeit moderating - growth in
air-conditioning use, as air-conditioning ownership gets closer to saturation
� Offsets to growth from energy efficiency, roof-top PV generation and net battery discharging, in combination with the fixed or variable timing of these resources.
The 2019 50% POE summer MD forecast is on average 2.7 per cent, or 380 MW above the 2018 forecast.
Figure 29 – NSW region summer as-generated maximum demand (MW) medium forecast
0
2,000
4,000
6,000
8,000
10,000
12,000
14,000
16,000
18,000
MW
Actual
TAPR 2018 50% POE mediumTAPR 2018 10% POE mediumTAPR 2019 90% POE mediumTAPR 2019 50% POE mediumTAPR 2019 10% POE mediumActual 90% POEActual 50% POEActual 10% POE
TAPR 2018 90% POE medium
2028/29
2027/28
2026/27
2025/26
2024/25
2023/24
2022/23
2021/22
2020/21
2019/20
2018/19
2017/18
2016/17
*
2015/16
2014/15
2013/14
2012/13
2011/12
2010/11
2009/10
2008/09
Table 19 – NSW region summer as-generated maximum demand (MW) forecast
Actual Medium High Low
10% POE 50% POE 90% POE 10% POE 50% POE 90% POE 10% POE 50% POE 90% POE
2013/14 12,189 13,602 12,791 11,763
2014/15 12,093 13,709 12,824 11,726
2015/16 13,742 14,290 13,348 12,154
2016/17* 14,859 14,489 13,439 12,019
2017/18 13,284 14,437 13,347 11,997
2018/19 14,010 14,656 13,523 12,252
2019/20 14,790 13,670 12,400 14,890 13,770 12,490 14,650 13,540 12,280
2020/21 14,920 13,810 12,550 15,130 14,010 12,720 14,640 13,550 12,310
2021/22 15,160 14,010 12,700 15,390 14,230 12,900 14,870 13,750 12,460
2022/23 15,170 14,000 12,670 15,640 14,440 13,060 14,820 13,680 12,380
2023/24 15,200 14,010 12,660 15,810 14,580 13,170 14,710 13,560 12,250
2024/25 15,260 14,050 12,670 16,090 14,830 13,370 14,620 13,470 12,140
2025/26 15,510 14,270 12,840 16,270 14,980 13,490 14,820 13,630 12,270
2026/27 15,710 14,440 12,970 16,670 15,330 13,780 15,040 13,820 12,410
2027/28 15,940 14,640 13,140 17,070 15,690 14,080 15,090 13,860 12,430
2028/29 16,040 14,720 13,190 17,490 16,060 14,400 15,120 13,870 12,430
Compound Average Growth Rate 2019/20 – 2028/29
0.9% 0.8% 0.7% 1.8% 1.7% 1.6% 0.4% 0.3% 0.1%
* Note: 2016/2017 Summer MD (on 10 February 2017) was recorded as 14,233 MW at a time of substantial load curtailment. Estimated MD in the absence of such curtailment was 14,859 MW.
50 NSW Transmission Annual Planning Report 2019 51Chapter 4 | Forecasts and planning assumptions

Cha
pter 4
Figure 30 shows the composition of historic summer MD and the medium growth forecast. A significant amount of potential load increase has been, and is forecast to continue to be, offset by accelerated energy efficiency and small-scale
PV take up. In the later forecast years, batteries discharging around the time of the network peak also act to depress the impact of underlying demand on the power system.
Figure 30 – Composition of NSW region summer MD (actual and 50% POE medium forecast)
0
5,000
10,000
15,000
20,000
25,000
MW
Forecast summer MD as generated
2028/29
2027/28
2026/27
2025/26
2024/25
2023/24
2022/23
2021/22
2020/21
2019/20
2018/19
2017/18
2016/17
2015/16
2014/15
2013/14
2012/13
2011/12
2010/11
2009/10
2008/09
2007/08
Summer MD as generated (native grid demand)
Energy EfficiencyPV self generationVehicle charging and stationary batteries discharging
Temperature sensitive loadMajor industrial (spot loads)
4.2.9 Winter maximum demand forecast
Figure 31 and Table 20 show winter MD forecasts for the medium, high and low scenarios. The forecasts include the 10%, 50% and 90% POE levels for each scenario. Winter MD has increased at a lower rate than annual energy, potentially due to the greater efficiency of reverse cycle air-conditioning over other forms of electric space heating, increased uptake of air-conditioning and sustained high prices of competing fuels, such as natural gas.
Over the forecast horizon, the main drivers of growth are: � Underlying market growth as reflected by the
energy forecast � Offsets to growth from energy efficiency and net battery
discharging, in combination with the fixed or variable timing of these resources.
The 2019 50% POE winter MD forecast is on average 0.6 per cent, or 80 MW below the 2018 forecast.
Figure 31 – NSW region winter as-generated maximum demand (MW) medium forecast
0
2,000
4,000
6,000
8,000
10,000
12,000
14,000
16,000
18,000
20282027202620252024202320222021202020192018201720162015201420132012201120102009
MW
Actual
TAPR 2018 50% POE mediumTAPR 2018 10% POE mediumTAPR 2019 90% POE mediumTAPR 2019 50% POE mediumTAPR 2019 10% POE mediumActual 90% POEActual 50% POEActual 10% POE
TAPR 2018 90% POE medium
Table 20 – NSW region winter as-generated maximum demand (MW) forecast
Actual Medium High Low
10% POE 50% POE 90% POE 10% POE 50% POE 90% POE 10% POE 50% POE 90% POE
2013 11,786 12,483 12,167 11,890
2014 11,677 12,370 12,122 11,892
2015 12,298 12,612 12,286 12,023
2016 12,802 12,651 12,367 12,110
2017 12,150 12,616 12,297 12,000
2018 12,304 12,713 12,375 12,075
2019 12,860 12,510 12,210 12,890 12,550 12,240 12,800 12,450 12,150
2020 13,000 12,650 12,340 13,070 12,720 12,410 12,880 12,530 12,230
2021 13,200 12,840 12,520 13,420 13,060 12,740 12,910 12,550 12,240
2022 13,350 12,990 12,660 13,690 13,310 12,980 12,850 12,490 12,180
2023 13,330 12,960 12,640 13,790 13,410 13,070 12,710 12,350 12,030
2024 13,240 12,860 12,540 13,810 13,420 13,080 12,600 12,240 11,910
2025 13,250 12,880 12,540 13,940 13,540 13,190 12,570 12,210 11,880
2026 13,310 12,930 12,590 14,070 13,670 13,310 12,540 12,170 11,840
2027 13,450 13,070 12,720 14,260 13,850 13,480 12,520 12,140 11,810
2028 13,560 13,170 12,820 14,430 14,010 13,640 12,460 12,080 11,750
Compound Average Growth Rate 2019 – 2028
0.6% 0.6% 0.5% 1.3% 1.2% 1.2% -0.3% -0.3% -0.4%
52 NSW Transmission Annual Planning Report 2019 53Chapter 4 | Forecasts and planning assumptions

Cha
pter 4
Figure 32 shows the composition of historic winter MD and the medium growth forecast. A significant amount of potential load increase has been, and is forecast to continue to be, offset by energy efficiency. In the later forecast years, batteries discharging around the time of the network peak also act to moderate the impact of underlying demand on the power system.
Sunset in NSW during the winter months is around 5:00 pm to 5:30 pm. Accordingly there is no offset in winter from roof-top PV generation as such generation is not available at the time of the winter 6:00 pm to 6:30 pm peak.
Figure 32 – Composition of NSW region winter MD (actual and 50% POE medium forecast)
0
2,000
4,000
6,000
8,000
10,000
12,000
14,000
16,000
18,000
20282027202620252024202320222021202020192018201720162015201420132012201120102009
MW
Forecast winter MD as generated
Winter MD as generated (native grid demand)
Energy EfficiencyPV self generationVehicle charging and stationary batteries discharging
Temperature sensitive loadMajor industrial (spot loads)
14 Spot loads are step (one-shot) increases in load for a BSP due to new housing developments or large industrial customers. There could be spot load decreases in cases where there are withdrawals of large load customers from the grid.
4.3 Bulk supply point forecasts
Generally, the load changes at bulk supply points (BSPs) are organic. However, where there are spot loads14, they will be included in the relevant forecasts. The BSP forecasts incorporate the local knowledge of the relevant DNSPs and directly connected customers.
Macroeconomic data is generally not available at a BSP level. Consequently, it is generally not possible to develop macroeconomic models for individual BSPs and to produce forecasts for different economic scenarios. In practice, the BSP forecasts are produced in a variety of ways, reflecting the amount of data available and the nature of the loads.
Figure 33 shows the forecast growth rates for BSPs serving the respective DNSPs in summer, with annualised growth rates. The detailed year-on-year forecasts of summer and winter maximum demands at the individual BSP level are set out in Appendix 2. This data was provided by the relevant DNSPs and directly connected customers to TransGrid in early 2019. The DNSPs methodologies for load forecasting should be referred in the respective DNSP’s annual planning report.
The BSPs with the highest growth rates are those serving the following areas.
Figure 33 – BSP summer forecast growth rates
200 400 600 800 1,000 1,200
-4%
-3%
-2%
-1%
0%
1%
2%
3%
4%
5%
Ann
ualis
ed 1
0 ye
ar 2
019/
20 to
202
8/29
Gro
wth
Rat
e
Beryl
Orange 132kV
Macarthur
Liverpool
Holroyd
Vineyard
Sydney West
Rookwood Rd
BeaconsfieldSydney East
Sydney North Sydney SouthHaymarket
Pt Macquarie
Queanbeyan
Forecast Summer 2019/20 Maximum Demand (MW)
Sydney MetroWest & South West SydneyNorth West Sydney
West and South-west SydneyThis area is predominantly within the South West Sector Land Release and Broader Western Sydney Employment area where a large number of residential lot releases are planned. Load increases are also expected due to the new Western Sydney international airport at Badgerys Creek and other associated residential and light industrial/ancillary services growth in this region.
North-west SydneyThe development of North West Rail infrastructure and associated activity (medium/high density residential), commercial & industrial areas will drive load growth in this area.
54 NSW Transmission Annual Planning Report 2019 55Chapter 4 | Forecasts and planning assumptions

Cha
pter 4
Sydney Inner Metropolitan area This area continues to grow at a higher rate than the overall NSW region average. Real income and population growth is forecast to result in higher load growth. In next ten years, an extra one million people will call Sydney home. To cope with this extraordinary growth, the NSW Government is delivering and planning a range of projects (electricity loads) in Sydney Inner Metropolitan area including transportation
infrastructures and a number of precinct or urban developments (Waterloo, Bays, Ashmore, Barangaroo, Central Park, Green Square, Harold Park and the Southern Employment Lands).15 Beaconsfield and Haymarket BSPs are two of our largest exit points which supply the Sydney Inner Metropolitan area.
4.3.1 TransGrid’s 2019 NSW region forecast vs aggregate BSPs forecast
Unlike TransGrid’s NSW region forecast, none of the BSP loads, by definition, include transmission network losses and power station auxiliary load. Despite this difference, the individual BSP forecasts for each season can be aggregated to provide a useful comparison with the overall NSW region demand forecast. In order to achieve this, we consider the following:
� Diversity of load or timing of maximum demand � Transmission network losses � Power station auxiliary load
We attempt to account for the above mentioned limitations by:
� Using 50% POE forecasts where they are available, and where they are not available, by assuming that individual bulk supply point projections are likely to have been based on enough historical data to converge towards an approximate 50% POE forecast.
� ‘Diversifying’ individual bulk supply point forecasts to allow for the time diversity observed between historical local seasonal maximum demand and NSW maximum demand.
� Adding forecast aggregate directly connected industrial loads not included in the BSP forecasts.
� Incorporating transmission network losses and power station auxiliary loads, derived from recent historical observations, to express the forecasts in the same ‘as-generated’ basis for comparison with TransGrid’s 2019 NSW forecast.
Figure 34 and Figure 35 show aggregate BSPs summer and winter maximum demand forecasts compared with TransGrid’s 50% POE medium NSW region summer and winter maximum demand forecasts respectively for NSW and ACT region.
Figure 34 – TransGrid’s top down forecast vs aggregate BSPs forecast for summer maximum demand
0
2,000
4,000
6,000
8,000
10,000
12,000
14,000
16,000
18,000
NSW
Net
wor
k Su
mm
er M
axim
um D
eman
d (M
W)
2028/29
2027/28
2026/27
2025/26
2024/25
2023/24
2022/23
2021/22
2020/21
2019/20
2018/19
2017/18
2016/17
2015/16
2014/15
2013/14
2012/13
2011/12
2010/11
2009/10
2008/09
2007/08
2006/07
2005/06
TG 10% POE Medium 2019 Aggregate DNSP Projection Actual TG 50% POE Medium
15 City of Sydney project website, http://www.cityofsydney.nsw.gov.au/vision/changing-urban-precincts/city-transformation and http://www.cityofsydney.nsw.gov.au/vision/changing-urban-precincts. Viewed on 16 April 2018
16 AEMO’s ESOO 2019 forecasts will be published in August 2019 and hence not available for comparison before the publication of TransGrid’s TAPR 2019.
17 https://www.aemo.com.au/-/media/Files/Electricity/NEM/Planning_and_Forecasting/NEM_ESOO/2018/2018-Electricity-Statement-of-Opportunities.pdf
18 https://www.aemo.com.au/-/media/Files/Electricity/NEM/Planning_and_Forecasting/NEM_ESOO/2018/Electricity-Demand-Forecasting-Methodology-Information-Paper.pdf
Figure 35 – TransGrid’s top down forecast vs aggregate BSPs forecast for winter maximum demand
0
2,000
4,000
6,000
8,000
10,000
12,000
14,000
16,000
18,000
NSW
Net
wor
k W
inte
r M
axim
um D
eman
d (M
W)
TG 10% POE Medium 2019 Aggregate DNSP Projection Actual TG 50% POE Medium
20282027
20262025
20242023
20222021
20202019
20182017
20162015
20142013
20122011
20102009
20082007
2006
It is evident from the graphs that aggregate BSP forecast has a reasonable alignment with TransGrid’s 50%POE forecast for summer while aggregate BSP forecast for winter has a higher slope compared to TransGrid’s 50%POE forecast for winter. These differences are understandable as the two sets of forecasts (DNSP aggregate BSP vs TransGrid top down) are produced on a completely different basis.
Although the comparison between TransGrid’s 2019 top down forecasts and the DNSPs’ aggregate of BSP forecasts do not indicate which forecast is more accurate, they, nonetheless, allow for a high-level comparison to be made.
4.4 TransGrid’s 2019 forecast vs AEMO’s 2018 ESOO forecast for NSW region
The most recent update of AEMO’s top down forecasts for the NSW Region was published in February 2019 as an update to the 2018 Electricity Statement of Opportunities (ESOO)16, 17. This section compares TransGrid’s 2019 demand forecast and AEMO’s latest demand forecast update for the NSW region.
Both demand forecasts are presented on a ‘native as-generated’ basis. The methodology underpinning the AEMO demand forecast is provided on the AEMO website.18
In order to compare the TransGrid and AEMO summer maximum demand forecasts, TransGrid combined AEMO’s ‘native sent out’ neutral 50% POE forecast and AEMO’s ‘auxiliary load’ neutral 50% POE forecast. This summated AEMO forecast is compared to TransGrid’s ‘as-generated’ medium 50% POE forecast and is shown in the following figure.
56 NSW Transmission Annual Planning Report 2019 57Chapter 4 | Forecasts and planning assumptions

Cha
pter 4
Figure 36 – TransGrid’s 2019 vs AEMO’s ESOO 2018 summer maximum demand forecast for NSW region
0
2,000
4,000
6,000
8,000
10,000
12,000
14,000
16,000
NSW
reg
ion
sum
mer
max
imum
dem
and
MW
Actual
AEMO 11/02/2019 50% POE neutralTAPR 2019 50% POE mediumTransGrid actual 50% POE
2028/29
2027/28
2026/27
2025/26
2024/25
2023/24
2022/23
2021/22
2020/21
2019/20
2018/19
2017/18
2016/17
*
2015/16
2014/15
2013/14
2012/13
2011/12
2010/11
2009/10
Figure 37 shows a comparison between TransGrid’s 2019 energy medium scenario forecast and AEMO’s most recent medium scenario forecast in its 2018 ESOO. Both forecasts
are expressed on a “native sent out basis” and hence can be directly compared.
Figure 37 – TransGrid’s 2019 vs AEMO’s ESOO 2018 energy consumption forecast for NSW region
NSW
reg
ion
ener
gy s
ent o
ut G
Wh
2028/29
2027/28
2026/27
2025/26
2024/25
2023/24
2022/23
2021/22
2020/21
2019/20
2018/19
2017/18
2016/17
2015/16
2014/15
2013/14
2012/13
2011/12
2010/11
2009/10
AEMO 11/02/2019 neutralTAPR 2019 mediumActual
0
10,000
20,000
30,000
40,000
50,000
60,000
70,000
80,000
4.5 Joint planning
4.5.1 Co-ordination and working groups
TransGrid regularly undertakes joint planning with AEMO and Jurisdictional Planning Bodies from across the NEM. There are a number of working groups and reference groups in which TransGrid participates:
� Executive Joint Planning Committee
� Joint Planning Committee � Regulatory Working Group � Regular coordination meetings � NEM Planning & Design Working Groups of the Energy
Networks Association
Executive Joint Planning CommitteeThe Executive Joint Planning Committee coordinates effective collaboration and consultation between Jurisdictional Planning Bodies and AEMO on electricity transmission network planning issues so as to:
� Develop a framework for the Integrated System Plan (ISP).
� Continuously improve current network planning practices.
� Coordinate on energy security across the NEM.
The Executive Joint Planning Committee directs and coordinates the activities of the Market Modelling Working Group, the Forecasting Reference Group, and the Regulatory Working Group as outlined below. These activities ensure effective consultation and coordination between Jurisdictional Planning Bodies, Transmission System Operators and AEMO on a broad spectrum of perspectives on network planning, forecasting, market modelling, and market regulatory matters in order to deal with the challenges of a rapidly changing energy industry.
Joint Planning CommitteeThe Joint Planning Committee ( JPC) is a working committee supporting the Executive Joint Planning Committee (EJPC) in achieving effective collaboration, consultation and
coordination between Jurisdictional Planning Bodies, Transmission System Operators and AEMO on electricity transmission network planning issues.
Market Modelling Working GroupThe Market Modelling Working Group (MMWG) is a working committee supporting the Executive Joint Planning Committee (EJPC) in effective collaboration, consultation and coordination between Jurisdictional Planning Bodies,
Transmission System Operators and AEMO on modelling techniques, technical knowledge, industry experience, and a broad spectrum of perspectives on market modelling challenges.
Forecasting Reference GroupThe Forecasting Reference Group (FRG) is a monthly forum with AEMO and industry forecasting specialists. The forum seeks to facilitate constructive discussion on matters relating to gas and electricity forecasting and
market modelling. It is an opportunity to share expertise and explore new approaches to addressing the challenges of forecasting in a rapidly changing energy industry.
Regulatory Working GroupThe Regulatory Working Group (RWG) is a working group to support the Executive Joint Planning Committee (EJPC) in achieving effective collaboration, consultation and coordination between Jurisdictional Planning Bodies,
Transmission System Operators and AEMO on key areas related to the application of the regulatory transmission framework and suggestions for improvement.
Regular joint planning meetingsFor the purpose of effective network planning, TransGrid conducts regular joint planning meetings with:
� AEMO National Planning � AEMO Victoria Planning � ElectraNet � Powerlink � Ausgrid � Endeavour Energy � Essential Energy � Evoenergy
58 NSW Transmission Annual Planning Report 2019 59Chapter 4 | Forecasts and planning assumptions

Cha
pter 4
4.5.2 Joint Planning Projects
TransGrid has coordinated with other jurisdictional planners on the following projects:
� 2019-2020 Integrated System Plan � South Australian Energy Transformation and Project
EnergyConnect � QNI Upgrade
� Victoria to New South Wales Interconnector Upgrade � Wagga 330 kV 100 MVAr Capacitor Installation � 62 Wagga – Jindera 330 kV Line Static Synchronous
Series Compensator (SSSC) Installation
Details of the projects are listed in Chapter 2 of this TAPR.
4.6 Assessment of power system security
The transmission network provides the platform to transport energy from large-scale generation to major load centres. It also provides the platform for power system stability by sharing ancillary services provided by generators and some network assets.
We have undertaken an assessment of power system security against each of the criteria that contribute to the stability of the power system. The criteria are shown in Table 21.
Table 21 – Key considerations when developing the transmission network
Criteria Description
Maximum demand(or peak demand)
Demand is the amount of electricity being used at an instant in time. Maximum demand is the highest amount of electricity that has been used (or is expected to be used) at any instant in a period of time.
Minimum demand Minimum demand is the lowest amount of electricity that is used at any instant. Low minimum demand can present challenges to the stability of the power system.
Energy The total amount of electricity used over a period of time.
Voltage control The ability to maintain voltages throughout the power system within stable and safe limits.
System strength The ability of the power system to temporarily provide high energy to manage disturbances while maintaining voltage control.System strength is provided by synchronous rotating generators. Inverter-based generators such as wind and solar generators require system strength to operate correctly but do not produce it.
Frequency control The ability to maintain the frequency of the power system within stable limits.Traditional frequency control acts quickly for small changes in frequency under normal conditions, but slowly for large changes in frequency during disturbances. Therefore, it is complemented by inertia to ensure the power system can “ride through” disturbances without significant frequency variation while it responds.Fast frequency response (FFR) is a newer approach enabled by high speed power electronics. Battery storage devices and solar generators use these electronics in their inverters. FFR has the potential to act quickly during disturbances.
Inertia The ability of the power system to “ride through” disturbances without significant frequency variation. Inertia (shorthand for “synchronous inertia”) measures the physical capability of synchronous rotating generators to continue without slowing down significantly during a disturbance.Unlike synchronous generators, wind generators do not always turn at the same speed as the power system frequency. Therefore, they connect to the power system using power electronics that converts either all of their output to the power system frequency, or a portion of their output that is then superimposed on the remaining portion of the output that comes directly from the wind turbines. Wind generators of the latter type are known as “type 3” generators. These generators can provide “synthetic inertia” using the inertia present in the wind turbines. This has slightly different characteristics to synchronous inertia.
Reserve Extra generation that is readily available by increasing the output of generators already generating in the power system. The power system is normally operated with enough reserve to cover the loss of the largest generator unit.
Power system data communications High speed data communications to provide visibility, monitoring and control of the power system. This includes dispatching generation and operating networks.
Maximum demand and energyThe energy consumption in NSW region has generally grown over the last four years. Growth has been driven by population growth, hotter and more sustained summer temperatures and a reduction in electricity prices.
There is a projected shortfall in generation to meet maximum demand following the expected retirement of Liddell Power Station in 2022. A shortfall in generation to meet demand will result in unserved energy. When the shortfall is limited to a small number of high-demand
days, the unserved energy can be small. However, as the level of shortfall increases, the unserved energy increases significantly.
The shortfall can be met by additional new generation, greater interconnection, storage and demand management. This is being managed by the connection of new generation to the network and projects to increase network capacity, discussed in Chapter 2.
Voltage controlVoltage control is provided by generators and network assets such as transformer tapchangers, capacitor banks, reactors and Static VAr Compensators (SVCs).
There is sufficient voltage control capability in the NSW transmission network over the next ten years.
There are opportunities to make small increases to interconnector export capacity to Queensland (Qld) and Victoria (Vic) through the installation of additional network assets for voltage control. Projects to install capacitor banks in northern and southern NSW to increase export capacity have been included in Sections 2.1.2 and 2.1.3 respectively.
System strengthSystem strength is provided by synchronous rotating generators, and can also be provided by network assets such as synchronous condensers. SVCs can contribute to system strength by providing dynamic voltage control, but not fault currents.
There is sufficient system strength in most parts of the NSW transmission network at present. However, the system strength in south-western NSW is low and requires operational measures to manage under contingency events.
Wind, solar and other inverter-based generators require system strength to operate correctly. As the penetration of inverter-based generators increases, there will be a need to install network assets to provide additional system strength. Projects to install synchronous condensers or SVCs have been included in Sections 2.1.2, 2.1.3 and 2.3.6.
System frequency controlFrequency control is provided throughout the NEM. There is sufficient frequency control capability in the NEM over the next ten years.
Fast frequency response (FFR) has the potential to act quickly during disturbances, but the resilience of power
electronics during disturbances has yet to be verified in practice. A project to install a large-scale battery that provides FFR has been included in section 2.2.1. This will enable its application in practice to be understood and validated in system stability models.
InertiaIn 2017, we reviewed the adequacy of inertia in NSW to limit the rate of change of frequency (RoCoF) following a disturbance. An acceptable RoCoF of up to 3Hz/s was allowed, as the level at which automatic under-frequency load shedding (AUFLS) can manage system frequency. The review found that:
� The current inertia in NSW is adequate to limit the RoCoF to below 3Hz/s with up to 5 baseload generators out of service at all times
� The inertia in NSW after the retirement of Liddell Power Station will be adequate to limit the RoCoF to below 3Hz/s with up to 1 generator out of service at all times
� The inertia in NSW after the retirement of Liddell Power Station and Vales Point Power Station will be insufficient to limit the RoCoF to below 3Hz/s at all times. There is a small proportion of time (0.06%) when there will be a risk of a RoCoF greater than 3Hz/s.
Even after the retirement of Liddell Power Station and Vales Point Power Station, sufficient inertia is expected to remain across the NEM as a whole. Therefore, resilient interconnection to adjacent states can be used to manage the risk of insufficient inertia in NSW. If required, additional inertia can be provided by new synchronous condensers, conversion of retiring generators to synchronous condensers and/or ’synthetic inertia‘ from wind generators (subject to successful trial). The emergence of FFR devices is likely to allow the power system to operate securely at a RoCoF greater than 3Hz/s, reducing the level of inertia required in the future.
60 NSW Transmission Annual Planning Report 2019 61Chapter 4 | Forecasts and planning assumptions

Cha
pter 4
ReserveIn NSW, the power system is generally operated with a reserve level of 700 MW.
There will be a lack of reserve when there is a shortfall of generation to meet demand, or when the available generation is less than 700 MW above demand.
There is a projected shortfall in reserve under certain conditions over the period of this report. The shortfall can be met by additional new generation, greater interconnection, storage and demand management.
Power system data communicationsHigh speed data communications contributes to power system security by providing visibility, monitoring and control of the power system.
We are also working to develop least-cost communications solutions to areas of NSW with the best renewable resources, as new generation connects and large-scale energy zones are established.
4.7 Service standards
NSW Electricity Transmission Reliability and Performance StandardThe NSW Electricity Transmission Reliability and Performance Standard 2017 is administered by IPART. This Standard specifies two reliability criteria for each bulk supply point (BSP):
� The required level of network redundancy for each BSP or group of BSPs that function as a cohort; and
� An allowance of Minutes of Expected Unserved Energy, which is the maximum amount of energy at risk of being not supplied in a given year expressed as minutes at the average load on the BSP
The Standard is a planning, rather than performance, standard. This means that the network needs to be planned to meet the standards over the life-cycle of the assets on average, rather than be met in every year.
Network investment may be required to ensure compliance with the Standard. However, the Standard also provides flexibility to promote the most efficient network or non-network solution to meet the Minutes of Expected Unserved Energy allowance. This may include changes to the transmission network, the distribution network, network support arrangements (including the use of Demand Management options), existing backup supply arrangements, or a combination of these.
Our first annual compliance report, submitted August 2018, demonstrated that all BSPs except Mudgee were compliant and included a Flexibility Plan, already approved by IPART, to achieve compliance at Mudgee in FY18-19. The works to achieve compliance at Mudgee were completed in October 2018 and we anticipate that our second annual compliance report, to be submitted in August 2019, will demonstrate compliance at all BSPs.
ACT reliability standardWe are also subject to the Electricity Transmission Supply Code July 2016 under the transmission licence we hold in the ACT. The Code includes the requirement for the provision of two or more geographically separate points of supply at 132 kV or above. It also requires that there be a continuous electricity supply at maximum demand to the ACT network at all times, including following a single credible contingency event.
Canberra and Williamsdale substations currently supply the ACT load however, Canberra substation supplies Williamsdale substation. The construction of Stockdill 330/132 kV substation will separate Williamsdale from Canberra and achieve the Code requirement for two, fully independent supply points. More detailed information about this project is available in section 2.2.5.
4.8 Alignment with ESOO and NTNDP
As noted in Chapter 1, TransGrid observes that there is an increased likelihood of load shedding in NSW following the retirement of Liddell Power Station. Load shedding is required to maintain the stability of the power system when there is a shortfall in supply to meet demand.
This is consistent with AEMO’s projection of an emerging and increasing reliability gap after the retirement of Liddell Power Station in the 2018 Electricity Staement of Opportunities.19
Loss of an additional major power station in NSW after the retirement of Liddell Power Station could lead to a further shortfall in supply, unless sufficient additional firming capability is developed in time.
The plans set out in this report align with AEMO’s 2018 Integrated System Plan and 2018 National Transmission Network Development Plan.
4.9 Changes from TAPR 2018
Updates in this chapter and referenced Appendices since TAPR 2018 includes the following:
� TransGrid has updated its own forecasts for NSW energy consumption and maximum demands to provide a detailed outlook for electricity consumption and maximum demand for the region as a whole.
� The method of preparation of the TransGrid forecast is explained in Appendix 1: including a description of models, model evaluation, input variables and scenarios, other assumptions and independent advice.
� A comparison of annual energy consumption and maximum demand between TransGrid’s 2019 forecast and AEMO’s 2018 ESOO forecast has been added.
These changes are consistent with the requirements of NER Clause 5.12.2(c)(1), (6A), (9), (10) and (12).
19 The AEMO 2018 Electricity Statement of Opportunities, August 2018.
62 NSW Transmission Annual Planning Report 2019 63Chapter 4 | Forecasts and planning assumptions

Ap
pend
ix 1
Appendix 1
TransGrid 2019 NSW region load forecasting methodology
This appendix describes our forecasting methodology including the sources of input information, applied assumptions, load forecast components, model schema, weather correction steps and input data variables.
A1.1 Overall schema
The New South Wales (NSW) load forecast consists of medium, high and low future growth scenarios for annual
energy and summer and winter maximum demands.
A1.1.1 Definitions
Figure 38 shows a typical power system such as that operating in the NSW region of the National Electricity Market (NEM). AEMO classifies each unit of generation connected to the NEM as either a scheduled, semi-scheduled or a non-scheduled generating unit. There are several potential points of measurement of energy flows and possible changes in direction of flows. However, it is
generally easier to record energy flowing into the network based on a relatively small number of generating units than to record the consumption of millions of consumers. Revenue meters are generally located at the connections of power stations with the network, and SCADA generally records large generating unit output.
Figure 38 – Schematic power system20
Transmissionconnectedgenerating
units
Generatorauxiliary
loads
Generators Electricity networks Consumers
Self-generation
Distributionconnectedgenerating
units
Interconnectedpower systems
Transmissionlosses
Distribution
Transformers
Distributionlosses
Generatorauxiliary
loads
Transmissionconnected
Self-generation
Distributionconnected
Supply “as generated”
Supply “sent out”
Consumer loadssupplied fromthe network
“As generated” refers to energy or demand that includes generator auxiliary loads, and “sent out” refers to consumption or demand that excludes generator auxiliary loads.
“Native” energy is equal to “operational” energy as defined by AEMO, with the addition of energy supplied by non-scheduled generating units of less than 30 MW capacity, measured in GWh over a financial year. The operational measure includes generation by scheduled, semi-scheduled and non-scheduled generating units greater than or equal to 30 MW. TransGrid measures and forecasts native energy on a “sent out” basis.
“Native” demand is equal to “operational” demand as defined by AEMO, with the addition of demand supplied by non-scheduled generating units of less than 30 MW capacity. The operational measure includes generation by scheduled, semi-scheduled and non-scheduled generating units greater than or equal to 30 MW, measured in MW at a half-hourly resolution. TransGrid measures and forecasts native energy on an “as generated” basis.
20 Adapted from AEMO (2012) National Electricity Forecasting Report, Figure 2-1, p2-2.
65Appendix 1 | NSW region load forecasting methodology

Ap
pend
ix 1
A1.1.2 Recent NSW energy and demand compared to previous forecasts
The 2018 TAPR forecast of NSW region native energy for 2017/18 was 69,800 GWh, compared with an actual outcome of 70,423 GWh, an under-forecast of 623 GWh or 0.9 per cent. The forecast was based on a demand model informed by predicted input variables. TransGrid re-ran the forecasting model using actual right hand side (RHS) input variables to determine the extent to which the forecast outcome was driven by errors in predicted input variables,
and the extent to which the model itself was inaccurate.
Table 22 shows that about half the difference between the actual and forecast energy was due to inaccurate forecasts of input variables and about half may be attributed to the model itself. The model based residual is well within the 95 per cent range of forecast accuracy and would only be of concern if succeeding years’ forecast residuals displayed a persistent downward or upward bias.
Table 22 – The TAPR 2018 medium energy forecast for 2017/18 compared with the actual outcome
GWh
Actual 70,423
Published forecast 69,800
New model based prediction using actual RHS variables 69,546
Forecasting gaps GWh Difference
Total gap (published forecast less actual) -623 -0.9%
Error due to RHS variables (new model prediction less published forecast) -254 -0.4%
Model residual (total gap less error due to RHS variables) -369 -0.5%
Table 23 shows the 2018 TAPR forecasts of 10%, 50% and 90% POE NSW region summer MD. The 2018 forecasts were around 176 to 252 MW (1 to 2 per cent) lower than the actual POE values, based on actual data for the recent summer.
TransGrid estimates that the actual MD of 14,010 MW represents a 35% POE level of demand. This may be compared to the maximum daily average temperature in the recent summer of 31 degrees, which corresponds to a temperature of around 33% POE.
Table 23 – The TAPR 2018 medium maximum demand forecasts for summer 2018/19 compared with actual outcomes
Actual MW
POE % 10% POE MW
50% POE MW
90% POE MW
Actual MD MW 14,010 35
Published forecast 14,480 13,370 12,000
Estimated actual POE MD 14,656 13,523 12,252
Difference (published forecast less estimated actual) -176 -153 -252
Maximum average temperature degrees 31 33
A1.1.3 Load forecast components
TransGrid prepared the 2019 NSW load forecast taking into account outputs from the following components:
� econometric modelling of the impacts of population, price, economic growth, weather and other drivers of underlying consumer behaviour – undertaken independently by TransGrid
� weather correction of historical electricity maximum demands and the calculation of probability of exceedance levels – undertaken independently by TransGrid
� regional demographic and economic forecast scenarios – provided to TransGrid by BIS Oxford Economics21
� projections of future energy price paths – undertaken for TransGrid by Jacobs22
� assessment of recent energy efficiency policies and standards, and quantification of the energy savings impacts – undertaken for TransGrid by Energy Efficient Strategies23
� modelling of rooftop PV installation and generation, and distributed battery storage – undertaken for TransGrid by Energeia24
� projections of the take-up of externally charging electric vehicles – undertaken for TransGrid by Energeia.25
Figure 39 presents these components schematically with their interactions in and each is discussed in more detail in the following sections.
Figure 39 – Overall schema
Weather correction
Summer maximum demandPOE10POE50POE90
Summer maximumdemand (MW)
Summermaximumdemandmodel
Forecast scenarios
PopulationEconomic forecasts
Energy pricesRooftop PV / Batteries
Electric vehiclesMajor industrial loads
Annual energy (GWh)
Weather correction
Winter maximum demandPOE10POE50POE90
Winter maximumdemand (MW)
Wintermaximumdemandmodel
Residential model
Non-residential model
21 BIS Oxford Economics, “Economic and Dwelling Forecasts to FY2028 - NSW and ACT”, May 2019.22 Jacobs, “Australian Electricity Prices Assumptions Report”, April 2019.23 Energy Efficient Strategies, “Projected Impacts of Energy Efficiency Programs”, May 2019.24 Energeia, “PV and Battery Update and Impact Forecast”, June 2019. Jacobs also provided an alternative forecast of PV and battery
storage which was broadly similar. 25 Energeia, “Electric Vehicles”, June 2019.
66 NSW Transmission Annual Planning Report 2019 67Appendix 1 | NSW region load forecasting methodology

Ap
pend
ix 1
A1.2 Energy modelling
A1.2.1 Approach
Econometric modelling was used to estimate the independent impacts of population, price, economic growth and weather on annual native energy. Native energy is composed of energy consumed by residential customers, energy consumed by non-residential customers and energy consumed by major industrial customers.
Separate models were used for residential and non-residential energy. Historical estimates of residential energy consumed in NSW and the ACT are estimated using survey data published by the Department of the Environment and Energy26. Remaining net generation supplying the NSW region is classified by TransGrid as either major industrial load (refer to section A1.5) or
non-residential energy. Each model was developed as an equation, linear in logarithms, with annual “energy services” per head of population as the dependent (left-hand side) variable.
Energy services is derived by adding estimates of the following to metered network energy:
� historical out-of-trend energy efficiency savings � rooftop PV generation.
Future energy services conceptually does not include the impacts of stationary or vehicle battery charging or discharging.
A1.2.2 Results
The energy services construct allows for the accurate identification of price impacts independently of changes in energy efficiency. The equations were estimated and this
resulted in identifying the sensitivities shown in Table 24 and Table 25.
Table 24 – Estimated long-run price and income elasticities of demand for annual electrical energy per capita in NSW
Long run elasticity with respect to: Residential estimated value Non-residential estimated value
Electricity price -0.21 -0.21
Residential gas and other fuels price 0.03 0.03
Real income 0.55 0.74
Table 24 should be interpreted as follows. For a one per cent increase in any variable in the left-hand column, the long run impact on electricity consumption (for the respective consumer category) is a long-run percentage change as indicated in the corresponding right-hand columns. For example, an increase in residential electricity price of one per cent would lead to a long-run decrease
in residential electricity consumption (all other things remaining the same) of 0.21 per cent.
Weather is quantified as either heating or cooling degree days, or the number of degrees below or above the human comfort range inside buildings each day, for all days in a year. Future weather is modelled as a continuation of average warming trends over the last 30 years.
Table 25 – Estimated short-run temperature sensitivities of annual energy in NSW
Short run temperature sensitivities of annual energy
Residential sensitivity to cool weather 148 kWh/degree days below 18 degrees
Residential sensitivity to warm weather* 13 kWh/degree day above 21 degrees
Non-residential sensitivity to warm weather 90 kWh/degree day above 21 degrees
Non-residential sensitivity to cool weather** -50 kWh/degree day below 18 degrees
*Not statistically significant. **Not statistically significant and not included in the model.
Table 25 shows that for each day, for each degree that the average temperature drops below 18 degrees, NSW region residential energy consumed increases by 148 kWh. Similarly, for each day, for each degree that the average temperature rises above 21 degrees, NSW region non-residential energy increases by 90 kWh. Residential
energy is relatively insensitive to warm weather and non-residential sensitivity to cool weather cannot be reliably measured. This tells us that the transient effect of weather variation may have a small but significant impact on annual energy over the course of any individual year.
A1.2.3 Observations
The inverse impact of electricity prices on annual energy is important, albeit small relative to the impact of income and population growth.
In addition to forward projections of the items in Table 24, the forecasts of residential and non-residential energy are prepared subject to input forecasts of population, energy
efficiency savings and distributed energy resources (DER) - including rooftop PV generation, stationary battery net charging and vehicle battery charging. The impact of future energy efficiency and DER comprises a large part of the overall forecasts27.
A1.2.4 Model accuracy
The residential and non-residential models’ fit to the historical data sample and medium scenario forecasts are shown in Figure 40 and Figure 41. These figures were produced with data up to 2014-15, with the last three actual years forecast out-of-sample to test the models28. Some key indications of the reliability of the forecasts are:
� the fitted lines are well-contained within a plus or minus two standard error band
� calculated accuracy measures are low, for example Mean Absolute Percentage Error (MAPE) is low (1.58 for the residential model and 1.21 for the non-residential model)
� there is little apparent bias indicating very little tendency for either model to produce long run forecasts that are persistently too high or too low
� the downturn five years ago associated with rising prices is picked up in varying degrees by the residential and non-residential models (with the larger impact of price rises in the non-residential model indicating that energy efficiency may have had a greater effect in the residential sector).
The evidence suggests that the models are valid across the entire sample period, are relatively accurate and are not given to persistent bias up or down.
Figure 40 – Electricity services residential energy in-sample/out-of-sample fit
10,000
15,000
20,000
25,000
30,000
35,000
+/-2SEOut of sample forecastIn sample forecastActual
NSW
ele
ctri
city
ser
vice
s re
side
ntia
l ene
rgy
GW
h
2028/29
2023/24
2018/19
2013/14
2008/09
2003/04
1998/99
1993/94
1988/89
1983/84
1978/79
Mean absolute percentage error (MAPE) 1.58
27 Potential new sources of electricity demand are not included in the load forecast. For example, future electrification of transport may also entail new sources of demand for electricity as a result, not only of externally charged electric road vehicles, but also as a result of the potential production of hydrogen using electrolysis for fuel cells in domestic vehicle or for export, and extensions of the electrified rail network.
28 The published forecasts of native energy have a starting point of 2019/20 and are based on actual and estimated data up to and including June 2019.26 Australian Energy Statistics, 2018 https://www.energy.gov.au/publications/australian-energy-update-2018.
68 NSW Transmission Annual Planning Report 2019 69Appendix 1 | NSW region load forecasting methodology

Ap
pend
ix 1
Figure 41 – Electricity services non-residential energy in-sample/out-of-sample fit
10,000
20,000
30,000
40,000
50,000
60,000
+/-2SEOut of sample forecastIn sample forecastActual
NSW
ele
ctri
city
ser
vice
s no
n-r
esid
enti
al e
nerg
y G
Wh
2028/29
2023/24
2018/19
2013/14
2008/09
2003/04
1998/99
1993/94
1988/89
1983/84
1978/79
Mean absolute percentage error (MAPE) 1.21
A1.3 Weather correction of maximum demand
The purpose of weather correction of historical demands is to remove the influence of weather variation between consecutive like seasons and to calculation levels of maximum demand for each season that accurately correspond to 10, 50 and 90 per cent Probability of Exceedance (POE). Weather correction was carried out separately for summer and winter, using daily native
maximum demand observations, and for one season at a time.
Below is a description of the three steps in the weather correction process, which is undertaken independently for each season (summer and winter) and for each historical year.
A1.3.1. Statistical estimation of a demand-temperature equation
� Inputs are daily maximum demand – carefully reconstructed using half-hourly operational demand and TransGrid’s records of additional small non-scheduled generation – and measures of cooling degrees and maximum daily temperature (for summer) and heating degrees (for winter)
� Only temperature and no other dimensions of weather are included – temperatures are the daily average of maximum and minimum temperatures at Sydney Observatory and Parramatta (for winter and summer respectively), with the summer measure using the minimum temperature from the following, rather than concurrent, morning
� All days in a season are included, with dummy variables to account for weekends, public holidays and the two-week post-Christmas holiday period
� A three-season rolling sample is used with dummy variables for the two previous seasons
� A dummy variable for the months of January and February (a proxy for the coincidence of high working activity and the more frequent occurrence of high temperatures) is also included as it is found significant
� Summer temperature sensitivity has more than doubled from 81 MW (0.9%) per degree increase in average daily temperature in 1993-94 to 353 MW (2.5%) in 2018-19; while the impact of an increase of one degree in the maximum daily temperature, for a similar daily average, brings about a further increase of 70 MW.
� Winter temperature sensitivity has remained consistent in percentage terms from 1.4% (137 MW) per degree in 1994 to 1.6% (193 MW) per degree in 2018.
A1.3.2 Historical temperature variation
� The selected method uses a range of daily temperatures drawn in historically accurate time sequence from the past 20 years
� The data are transformed in the same manner as the temperature data used for estimating the demand-temperature equation
� Alternative temperature years for the respective season are substituted in the demand-weather equation to produce a variety of alternative demand traces for that-season.
A1.3.3 Synthesis of alternative residual values
� Since the statistical demand-temperature relationship is inexact, the residuals from the estimated equation represent variation in demand that is not explained by variation in temperature from one day to the next
� The mean estimated residual value is zero, and the most accurate forecast of daily maximum demand over the entire season would assume a zero residual value
� Seasonal maximum demand (the maximum of the daily maximum demands in a respective season) is most likely to occur on a working weekday with extreme temperature, and a high proportion of ‘unexplained’ demand variation – i.e. a large residual
� Statistically likely variation in the residuals is simulated by drawing from a random normal distribution with the same equation standard error as the equation that generated the original residuals. This assumes that: (i) actual residuals are independent of each other and randomly occurring; and (ii) drawn from a distribution that approaches a normal distribution with increasing sample size.
A1.3.4 Resampling process
� Alternative, randomly selected residual values (drawing from the same underlying distribution) are applied to each alternative temperature year demand trace, resulting in more alternative demand traces
� For summer seasons, there are 20 alternative temperature sets and 600 alternative residual sets, resulting in a total of 12,000 alternative demand traces in each summer season
� For winter, there are 20 alternative temperature sets and 540 alternative residual sets, resulting in a total of 11,800 alternative demand traces in each winter season.
A1.3.5 Calculation of historical POE levels
� For each season, for each year, the maximum for each alternative demand trace is selected
� From each of the (approximately 12,000) alternative maxima for each season/year, the 90th, 50th and 10th percentiles are calculated as the POE10, POE50 and POE90 maximum demand levels, respectively.
A1.3.6 Results
Historical maximum demands and the estimated POE10, POE50 and POE90 levels of demand are displayed in Figure 42 and Figure 43.
70 NSW Transmission Annual Planning Report 2019 71Appendix 1 | NSW region load forecasting methodology

Ap
pend
ix 1
Figure 42 – Summer maximum demand
8,000
9,000
10,000
11,000
12,000
13,000
14,000
15,000
16,000
POE90POE50POE10
MW
2018/19
2017/18
2016/17
2015/16
2014/15
2013/14
2012/13
2011/12
2010/11
2009/10
2008/09
2007/08
2006/07
2005/06
2004/05
2003/04
2002/03
2001/02
2000/01
1999/00
1998/99
1997/9
8
1996/97
1995/96
1994/95
1993/94
Actual
Source: TransGrid
Figure 43 – Winter maximum demand
8,000
9,000
10,000
11,000
12,000
13,000
14,000
15,000
16,000
POE90POE50POE10
MW
Actual
20182017
20162015
20142013
20122011
20102009
20082007
20062005
20042003
20022001
200019
9919
9819
9719
9619
9519
94
Source: TransGrid
A1.4 Summer and winter maximum demand models
1.4.1. Approach to forecasting electricity services maximum demands
It is useful conceptually to break down the maximum level of demand reached in a particular season into the following components:
� underlying, non-weather sensitive demand driven by factors that are similar to those driving annual energy, including population growth, income growth and changes in energy prices
� adjustments to measured network demand at particular times, due to out of trend energy efficiency and distributed energy resources such as rooftop PV generation and battery storage and discharge
� specific investment plans and/or closures driving changes in major industrial loads
� a highly variable, weather sensitive component which largely depends on prevailing weather conditions.
The non-weather sensitive component of demand may respond to prices in the same manner as energy. However, the weather-sensitive component is unlikely to be price-sensitive, as for the majority of consumers there is an insignificant impact on billing period energy charges for a few hours of additional consumption on a single day of extremely hot or cold weather.
In addition to traditional industrial loads, future electrification of transport will entail new sources of potential demand as a result of externally charged electric road vehicles.
Forecasts of summer and winter maximum demand are projected from the historical POE10, POE50 and POE90 electricity services maximum demands. This removes the year-to-year variability due to weather-sensitivity and the impact of accelerated energy efficiency and DER.
The maximum demand forecasts are prepared as follows: � major industrial loads are removed from each historical
POE level of demand and annual energy � historical electricity services maximum demands are
calculated from the POE10, POE50 and POE90 levels of native maximum demand, plus the estimated impact of rooftop PV generation, out-of-trend energy efficiency and battery charging/discharging at the times of maximum demand
� load factors (LF) are calculated for each of the electricity services POE10, POE50 and POE90 levels of MD as follows:• LF ratio =1000 × annual energy in GWh / (MD in MW ×
hours in the year) � a statistical relationship between each LF and air-
conditioning penetration in NSW is estimated � the estimated relationships are then used to predict
future load factors, conditional on a projection of NSW air-conditioning penetration (currently around 55 per cent) that levels out around 60 per cent.
� the predicted load factors are then converted back into their respective forecast electricity service MD levels using the energy forecast and values of major industrial loads at times of maximum demand
This method maintains a link between the energy forecast and its underlying drivers and the level of maximum demand, and maintains observed historical links between increasing air-conditioning penetration and growth in the weather-sensitive component of demand.
A1.4.2 Calculating the impact and timing of distributed energy services and energy efficiency on electricity services
The forecasts of electricity services MDs are first reduced by estimates of the impact of above-trend energy efficiency at times of MD, based on the report by EES . The resulting MD forecasts are termed “underlying” MDs, as this measure can be calculated for historical MD days by adding an estimated rooftop PV profile to a half-hourly profile of native demand.
Historical underlying MD profiles are increased in successive years by the respective rates of growth of the underlying MD forecasts. Profiles for various DER elements are then added to the forecast underlying demand profiles. The native MDs calculated in this manner therefore reflect the
changes in the respective underlying MDs caused by both the quantity and timing of each DER element.
Figure 44 and Figure 45 show the construction of native POE50 MD for the 2028-29 summer and the 2028 winter. In each figure, underlying demand (i.e. demand in the absence of any DER) is shown by the blue line, while native demand (representing the net impact on the transmission network) is shown by the brown line. In that summer, the maximum underlying POE50 MD occurs at 16:00 hours EST, whereas, the impact of DER (mainly rooftop PV) is to both reduce and delay the maximum native MD until 17:00 hours EST.
72 NSW Transmission Annual Planning Report 2019 73Appendix 1 | NSW region load forecasting methodology
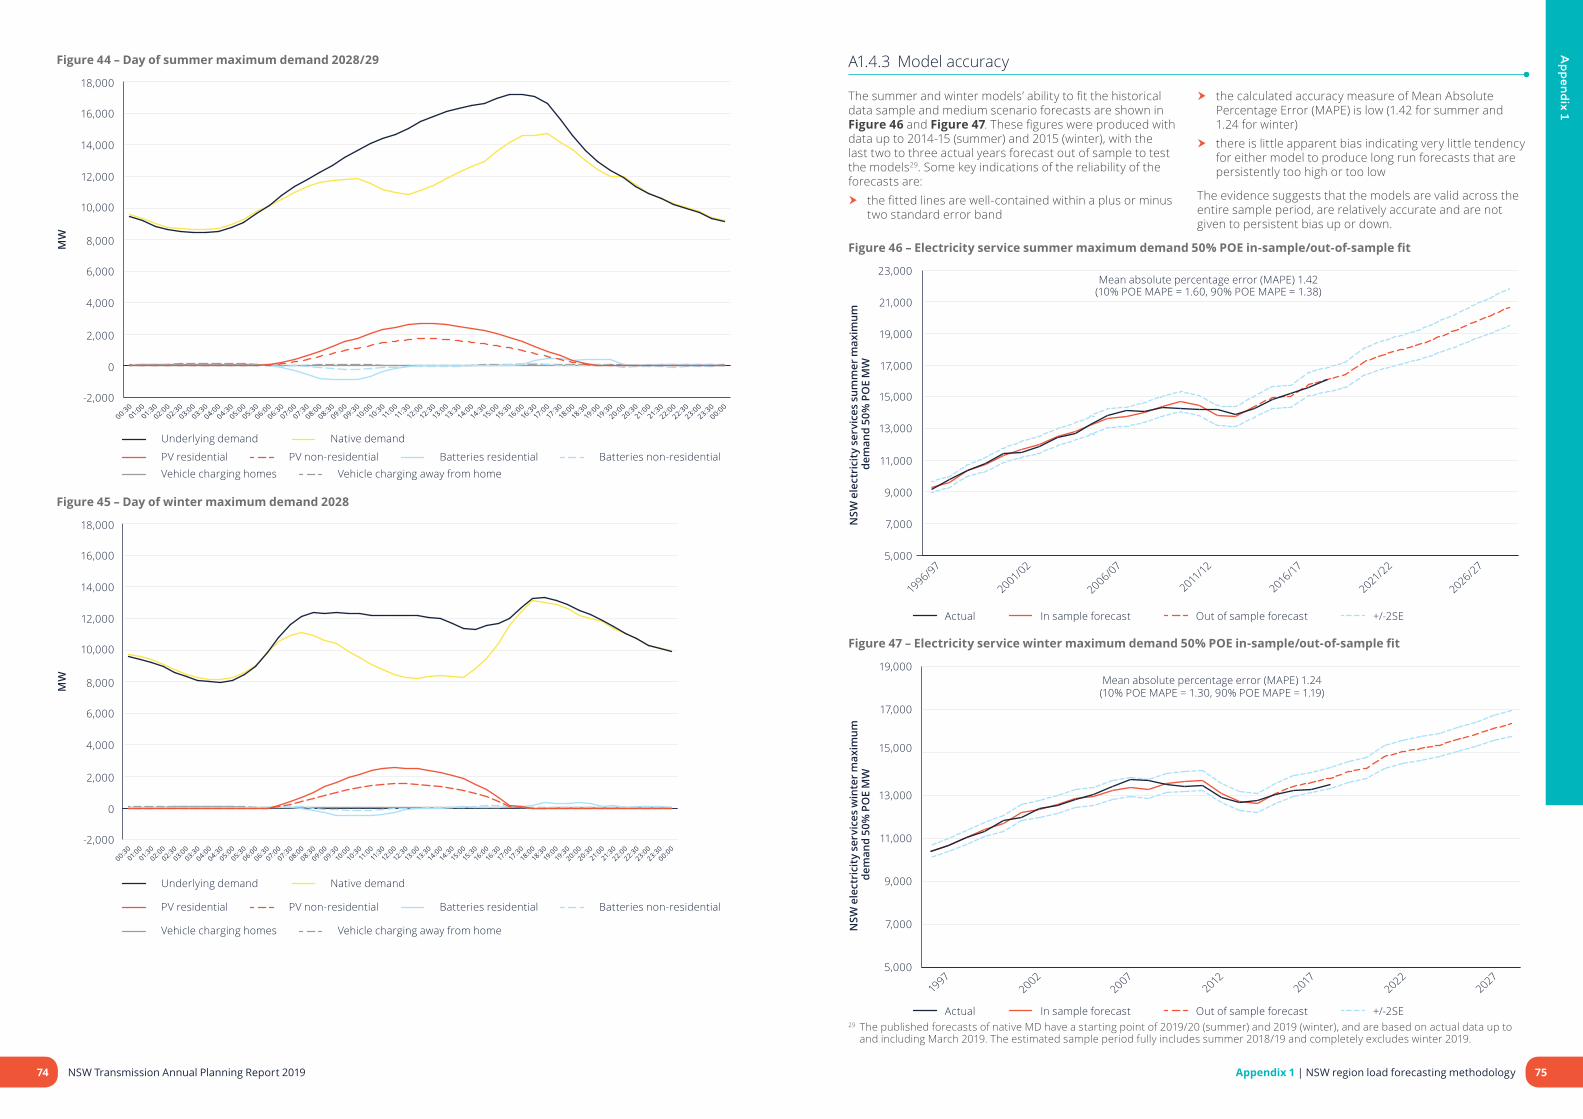
Ap
pend
ix 1
Figure 44 – Day of summer maximum demand 2028/29
-2,000
0
2,000
4,000
6,000
8,000
10,000
12,000
14,000
16,000
18,000
MW
00:0023:30
23:0022:30
22:0021:30
21:0020:30
20:0019:30
19:0018:30
18:0017:30
17:0016:30
16:0015:30
15:0014:30
14:0013:30
13:0012:30
12:0011
:3011
:0010:30
10:0009:30
09:0008:30
08:0007:30
07:0006:30
06:0005:30
05:0004:30
04:0003:30
03:0002:30
02:0001:30
01:0000:30
Native demand
Vehicle charging away from homeVehicle charging homesBatteries non-residentialBatteries residentialPV non-residentialPV residential
Underlying demand
Figure 45 – Day of winter maximum demand 2028
-2,000
0
2,000
4,000
6,000
8,000
10,000
12,000
14,000
16,000
18,000
MW
00:0023:30
23:0022:30
22:0021:3
021:0
020:30
20:0019
:3019
:0018
:3018
:0017
:3017
:0016
:3016
:0015
:3015
:0014
:3014
:0013
:3013
:0012
:3012
:0011
:3011
:0010:30
10:0009:30
09:0008:30
08:0007:30
07:0006:30
06:0005:30
05:0004:30
04:0003:30
03:0002:30
02:0001:3
001:0
000:30
Native demand
Vehicle charging away from homeVehicle charging homes
Batteries non-residentialBatteries residentialPV non-residentialPV residential
Underlying demand
A1.4.3 Model accuracy
The summer and winter models’ ability to fit the historical data sample and medium scenario forecasts are shown in Figure 46 and Figure 47. These figures were produced with data up to 2014-15 (summer) and 2015 (winter), with the last two to three actual years forecast out of sample to test the models29. Some key indications of the reliability of the forecasts are:
� the fitted lines are well-contained within a plus or minus two standard error band
� the calculated accuracy measure of Mean Absolute Percentage Error (MAPE) is low (1.42 for summer and 1.24 for winter)
� there is little apparent bias indicating very little tendency for either model to produce long run forecasts that are persistently too high or too low
The evidence suggests that the models are valid across the entire sample period, are relatively accurate and are not given to persistent bias up or down.
Figure 46 – Electricity service summer maximum demand 50% POE in-sample/out-of-sample fit
5,000
7,000
9,000
11,000
13,000
15,000
17,000
19,000
21,000
23,000
+/-2SEOut of sample forecastIn sample forecastActual
NSW
ele
ctri
city
ser
vice
s su
mm
er m
axim
um
dem
and
50%
PO
E M
W
Mean absolute percentage error (MAPE) 1.42(10% POE MAPE = 1.60, 90% POE MAPE = 1.38)
2026/27
2021/22
2016/17
2011/12
2006/07
2001/02
1996/97
Figure 47 – Electricity service winter maximum demand 50% POE in-sample/out-of-sample fit
5,000
7,000
9,000
11,000
13,000
15,000
17,000
19,000
+/-2SEOut of sample forecastIn sample forecastActual
NSW
ele
ctri
city
ser
vice
s w
inte
r max
imum
de
man
d 50
% P
OE
MW
Mean absolute percentage error (MAPE) 1.24(10% POE MAPE = 1.30, 90% POE MAPE = 1.19)
20272022
20172012
20072002
1997
29 The published forecasts of native MD have a starting point of 2019/20 (summer) and 2019 (winter), and are based on actual data up to and including March 2019. The estimated sample period fully includes summer 2018/19 and completely excludes winter 2019.
74 NSW Transmission Annual Planning Report 2019 75Appendix 1 | NSW region load forecasting methodology

Ap
pend
ix 1
A1.5 Major industrial loads
Very little change is predicted in major industrial loads. These loads accounted for 18 per cent of annual energy in 2017/18 and 10 per cent of last summer’s maximum demand which occurred on 31 January 2019. Existing major industrial loads include:
� Tomago Aluminium � Bluescope steel Port Kembla � Onesteel Waratah West � Visy Gadara � Norske Skog Albury � Broken Hill Mine � Cadia Mine Orange
� North Parkes Mine � Lake Cowal Mine � Ulan Area Mines � Boggabri East and North Mines � CSR Oberon
An estimated 102 MW of additional major industrial load is included in the forecasts based on information provided by TransGrid’s customers, including DNSPs. Additional loads include mine expansions, new industrial loads and large infrastructure projects, and has been generally discounted by between 20 and 57 per cent to allow for historical variations between planned power requirements and actual outcomes.
A1.6 Input data and scenario assumptions
Inputs to the load forecasting framework described above were supplied from independent advice on the following issues affecting the long-run use of electricity in NSW.
The tables below show changes in input variables corresponding to each respective NSW region energy and demand scenario.
A1.6.1. Demographic and economic forecasts
TransGrid obtained projections of future demographic and economic trends.30
Table 26 – NSW population growth and key macroeconomic forecasts CAGR 2019/20-2028/29
Variable Medium High Low
Resident population 1.1 1.5 0.8
Real household disposable income 2.6 3.3 1.9
Gross State Product 2.5 3.1 1.7
A1.6.2 Energy prices
Projections of future energy price paths were developed from the retail price projections report by using the yearly
residential price changes and by averaging the separate non-residential price series.31
Table 27 – NSW electricity and gas price forecasts CAGR 2019-2028
Variable Medium High Low
Real residential electricity price -0.6 -1.1 0.0
Real non-residential electricity price -0.8 -1.4 -0.2
Real gas and other fuels price -1.8 -0.2 -1.1
A1.6.3. Rooftop PV and distributed battery storage
TransGrid rooftop PV and stationary battery charge/discharge forecasts were prepared by Energeia using an agent-based model of rooftop PV installation and output, and distributed battery storage32. Projected PV output and battery charging/discharging annual energy and profiles
for specified days for all projected summer and winter periods were subtracted directly from the modelled energy and maximum demand forecast profiles, respectively, to estimate network energy and maximum demand.
Table 28 –NSW rooftop PV and battery storage forecasts total increase 2019/20-2028/29 (2019-2028 for winter)
Variable Medium High Low
Residential PV generation GWh 2,898 2,801 2,704
Non-residential PV generation GWh 765 618 580
Average shift in summer maximum demand due to PV and batteries (both due to capacity and time shift) MW
1,721 1,779 1,694
Average battery discharge at time of respective summer and winter system maximum demand MW
160 / 29 124 / 26 146 / 26
A1.6.4 Energy efficiency policies
On behalf of TransGrid, Energy Efficient Strategies33 conducted a thorough updated assessment of recent energy efficiency policies and standards, and quantified the
aggregate energy savings impacts on electricity demand. TransGrid extracted the projected historical trend from 2001 to 2009 from the projected total savings.
Table 29 – Energy efficiency out of trend total increase 2019/20-2028/29 (2019-2028 for winter)
Variable Medium High Low
Residential savings GWh 2,174 2,174 2,174
Non-residential savings GWh 5,853 5,853 5,853
Total savings at time of summer maximum MW 1,588 1,588 1,588
Total savings at time of winter maximum MW 1,366 1,366 1,366
A1.6.5 Electric vehicles
An allowance is included in the load forecast to account for future take-up of externally charged electric vehicles. TransGrid has considered charging loads of existing electric
vehicles and projected increasing take-up. The projections, including half-hourly profiles for specified days of interest, were provided by Energeia34.
Table 30 – Electric vehicle charging total increase 2019/20-2028/29 (2019-2028 for winter)
Variable Medium High Low
Annual charging energy GWh 855 1,320 243
Average load at time of summer and winter maximum MW 29 / 18 55 / 32 11 / 9
30 BIS Oxford Economics (2019) Economic and Dwelling Forecasts to FY2029 – NSW & ACT, April.31 Jacobs (2019) Retail Price Projections for NSW, Final, June.
32 Energeia (2019) Inputs to 2019 Transmission Annual Planning Report Load Forecast: Distributed Energy Resources Modelling, Final, June.33 Energy Efficient Strategies (2019) Impact of Energy Efficiency Programs on Electricity Consumption in NSW and ACT, Report for
TransGrid, May.34 Energeia (2019) Inputs to 2019 Transmission Annual Planning Report Load Forecast: Electric Vehicles Modelling, Final, June.
76 NSW Transmission Annual Planning Report 2019 77Appendix 1 | NSW region load forecasting methodology
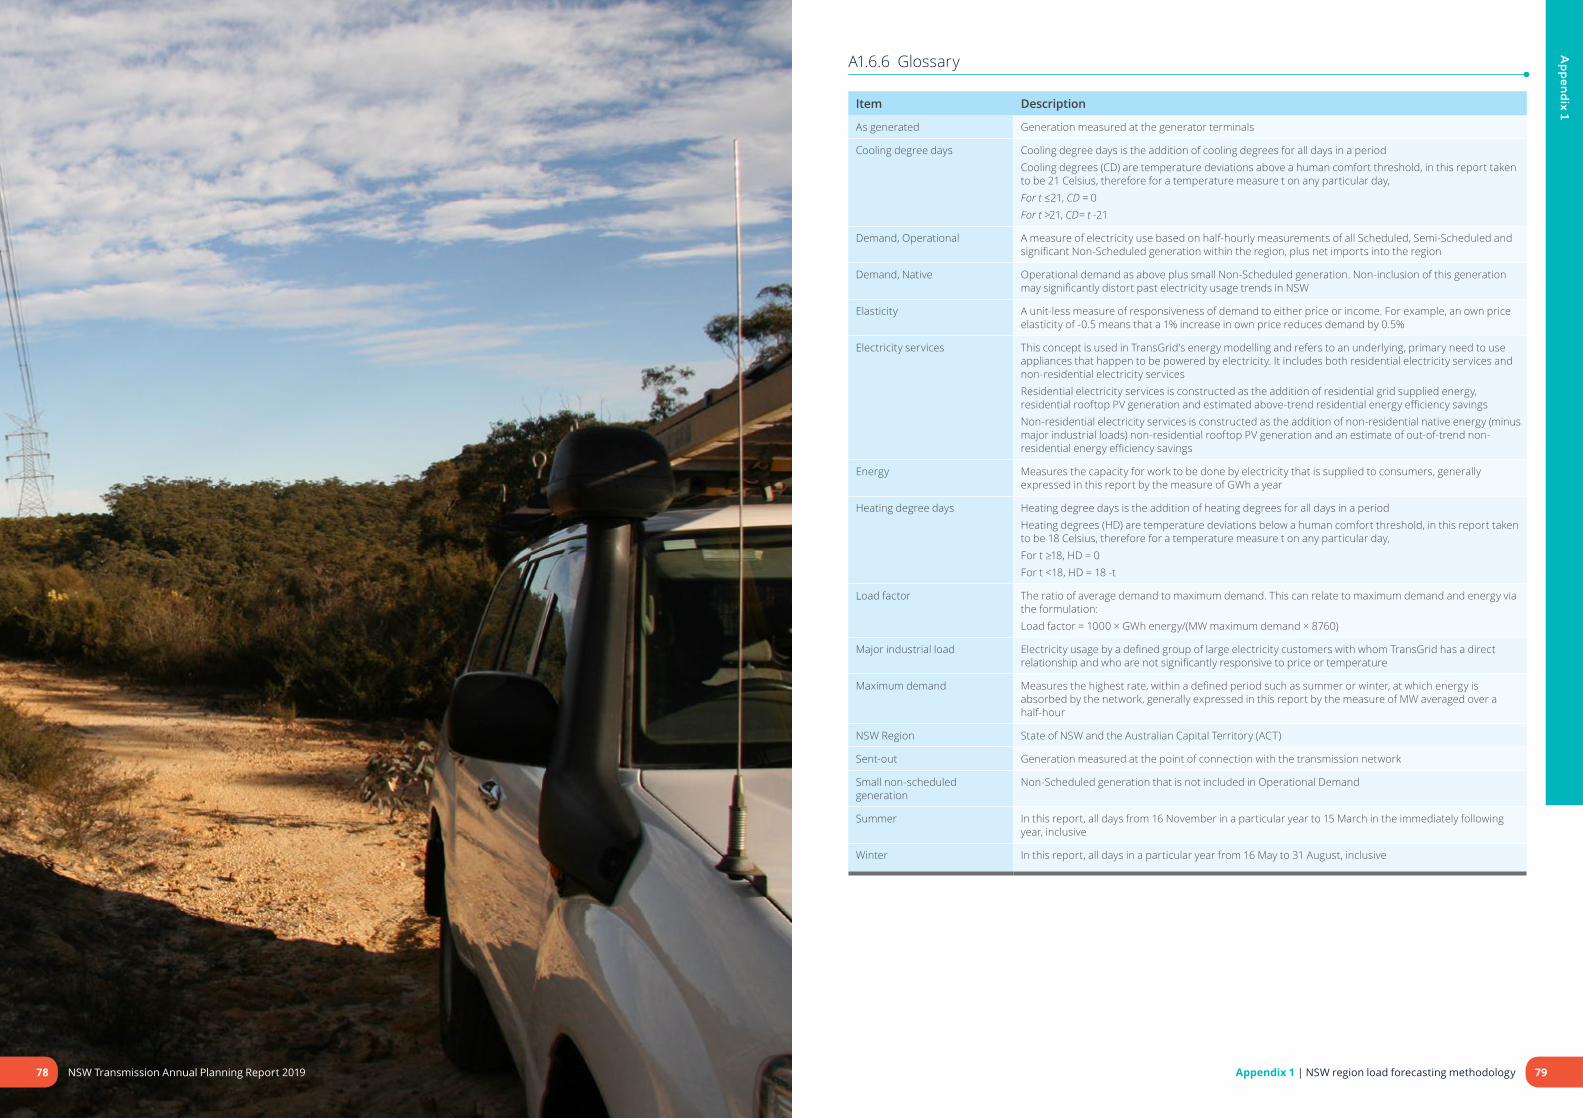
Ap
pend
ix 1
A1.6.6 Glossary
Item Description
As generated Generation measured at the generator terminals
Cooling degree days Cooling degree days is the addition of cooling degrees for all days in a periodCooling degrees (CD) are temperature deviations above a human comfort threshold, in this report taken to be 21 Celsius, therefore for a temperature measure t on any particular day,For t ≤21, CD = 0For t >21, CD= t ‑21
Demand, Operational A measure of electricity use based on half-hourly measurements of all Scheduled, Semi-Scheduled and significant Non-Scheduled generation within the region, plus net imports into the region
Demand, Native Operational demand as above plus small Non-Scheduled generation. Non-inclusion of this generation may significantly distort past electricity usage trends in NSW
Elasticity A unit-less measure of responsiveness of demand to either price or income. For example, an own price elasticity of -0.5 means that a 1% increase in own price reduces demand by 0.5%
Electricity services This concept is used in TransGrid’s energy modelling and refers to an underlying, primary need to use appliances that happen to be powered by electricity. It includes both residential electricity services and non-residential electricity servicesResidential electricity services is constructed as the addition of residential grid supplied energy, residential rooftop PV generation and estimated above-trend residential energy efficiency savingsNon-residential electricity services is constructed as the addition of non-residential native energy (minus major industrial loads) non-residential rooftop PV generation and an estimate of out-of-trend non-residential energy efficiency savings
Energy Measures the capacity for work to be done by electricity that is supplied to consumers, generally expressed in this report by the measure of GWh a year
Heating degree days Heating degree days is the addition of heating degrees for all days in a periodHeating degrees (HD) are temperature deviations below a human comfort threshold, in this report taken to be 18 Celsius, therefore for a temperature measure t on any particular day,For t ≥18, HD = 0For t <18, HD = 18 -t
Load factor The ratio of average demand to maximum demand. This can relate to maximum demand and energy via the formulation:Load factor = 1000 × GWh energy/(MW maximum demand × 8760)
Major industrial load Electricity usage by a defined group of large electricity customers with whom TransGrid has a direct relationship and who are not significantly responsive to price or temperature
Maximum demand Measures the highest rate, within a defined period such as summer or winter, at which energy is absorbed by the network, generally expressed in this report by the measure of MW averaged over a half-hour
NSW Region State of NSW and the Australian Capital Territory (ACT)
Sent-out Generation measured at the point of connection with the transmission network
Small non-scheduled generation
Non-Scheduled generation that is not included in Operational Demand
Summer In this report, all days from 16 November in a particular year to 15 March in the immediately following year, inclusive
Winter In this report, all days in a particular year from 16 May to 31 August, inclusive
78 79Appendix 1 | NSW region load forecasting methodologyNSW Transmission Annual Planning Report 2019

Ap
pend
ix 2
Appendix 2
Individual bulk supply point projections
This appendix provides the maximum demand projections supplied by our customers for individual bulk supply points, based on local knowledge and the availability of historical data.
A2.1 Individual bulk supply point projections
Our customers have provided maximum demand projections, in terms of both megawatts (MW), megavolt ampere reactive (MVAr) and megavolt ampere (MVA) for individual bulk supply points between the NSW transmission network and the relevant customer’s network. These projections are produced using methodologies that are likely to have been tailored to the circumstances relating to the load(s) at particular bulk supply point(s) such as the degree of local knowledge and the availability of historical data. The projections are given in the tables below.
Some large and relatively stable industrial loads mainly connected directly to TransGrid’s network that we isolate for modelling purposes have been removed from the bulk supply point projections and aggregated. The removal of
this data affects the projections shown for Broken Hill. Other industrial loads are included in bulk supply point forecasts provided by distributors. Aggregate projections for all identified major industrial loads (excluding those that are also in the bulk supply point forecasts) at the time of maximum NSW Region demand are given in Table 41 and Table 42.
Table 31 to Table 40 provide projections of non-coincident maximum demand occurring during a particular season at a particular bulk supply point (or group of bulk supply points) on the NSW transmission network. They do not represent projections of demand contributions at these bulk supply points to the overall NSW region maximum demand.
Table 31 – Ausgrid bulk supply point summer maximum demand35
2019/20 2020/21 2021/22 2022/23 2023/24 2024/25 2025/26 2026/27 2027/28 2028/29MW MVAr MVA MW MVAr MVA MW MVAr MVA MW MVAr MVA MW MVAr MVA MW MVAr MVA MW MVAr MVA MW MVAr MVA MW MVAr MVA MW MVAr MVA
Beaconsfield West 132 kV 395 30 396 389 62 394 393 24 394 504 -66 508 508 -45 509 507 -53 510 510 -77 516 484 -49 487 490 -39 491 494 -24 494
Rookwood Rd 132 kV 309 -44 312 306 -41 309 306 -54 311 258 3 258 257 -10 257 258 -17 258 260 -8 260 247 -2 247 250 4 250 253 11 253
Haymarket 132 kV 481 30 482 474 16 474 484 43 486 502 63 506 497 45 499 505 40 507 507 36 508 527 60 530 531 56 534 536 69 541
Liddell 33 kV 18 8 19 18 8 19 18 8 19 18 8 19 18 8 19 18 8 19 18 8 19 18 8 19 18 8 19 18 8 19
Munmorah 132 kV & 33 kV 136 31 140 135 30 139 135 30 138 131 30 134 131 30 134 130 29 133 132 31 135 128 33 132 128 33 132 128 33 132
Muswellbrook 132 kV 182 119 217 182 120 218 183 120 219 182 120 218 182 119 217 182 119 217 182 119 217 182 119 218 183 119 218 183 119 218
Newcastle 132 kV 514 207 554 514 181 545 515 181 546 516 213 559 514 212 556 514 215 557 515 214 557 507 196 544 510 207 550 511 208 551
Sydney East 132 kV 698 41 699 722 42 723 726 57 728 727 59 729 724 53 726 724 63 727 734 73 737 745 69 749 756 82 760 765 79 769
Sydney North 132 kV 982 195 1001 998 177 1014 998 175 1013 909 254 944 919 260 955 925 253 959 930 262 967 939 271 978 951 337 1009 957 285 999
Sydney South 132 kV 1177 -32 1178 1221 -22 1221 1234 -5 1234 1254 -59 1256 1257 -52 1258 1258 -8 1258 1261 -10 1261 1300 -49 1301 1312 -36 1313 1317 27 1318
Tomago 132 kV 340 86 351 344 103 359 345 104 360 343 89 354 342 88 353 340 92 352 342 91 354 328 85 338 330 89 342 331 90 343
Tuggerah 132 kV 231 89 247 230 81 244 229 81 243 226 75 238 224 75 236 222 69 232 222 73 234 224 75 236 224 71 235 224 71 235
Vales Point 132 kV 114 24 116 116 30 119 116 30 120 113 22 115 112 18 113 112 19 113 112 18 113 111 23 113 113 31 117 113 32 117
Waratah West 132 kV 243 111 267 246 126 276 245 126 276 243 112 268 241 112 266 240 111 265 240 111 264 242 130 274 240 110 263 240 110 264
Table 32 – Ausgrid bulk supply point winter maximum demand35
2019 2020 2021 2022 2023 2024 2025 2026 2027 2028MW MVAr MVA MW MVAr MVA MW MVAr MVA MW MVAr MVA MW MVAr MVA MW MVAr MVA MW MVAr MVA MW MVAr MVA MW MVAr MVA MW MVAr MVA
Beaconsfield West 132 kV 331 -8 331 343 11 343 341 16 341 347 8 347 437 -59 441 442 -80 449 444 -84 452 422 -82 430 426 -72 432 433 -77 440
Rookwood Rd 132 kV 253 -92 269 265 -89 280 261 -90 276 264 -73 274 224 -17 224 225 -15 226 225 -34 227 215 -17 216 216 -29 218 219 -25 221
Haymarket 132 kV 405 20 406 420 36 422 417 26 418 425 33 427 436 52 440 437 42 439 440 38 442 463 48 466 468 61 472 474 43 476
Liddell 33 kV 17 8 18 17 8 18 17 8 18 17 8 18 17 8 18 17 8 18 17 8 18 17 8 18 17 8 18 17 8 18
Munmorah 132 kV & 33 kV 115 28 118 115 25 117 115 25 118 116 30 120 115 28 118 114 27 117 115 29 119 116 26 119 116 26 119 117 26 120
Muswellbrook 132 kV 161 79 180 138 67 153 138 68 154 139 68 154 139 68 154 138 68 154 139 68 154 139 68 155 140 68 155 140 69 156
Newcastle 132 kV 375 120 393 375 123 395 378 124 397 379 126 400 377 113 394 382 141 408 382 127 402 383 115 400 386 116 403 390 118 407
Sydney East 132 kV 640 -7 640 668 13 668 672 11 672 683 14 683 679 6 679 679 4 679 679 4 679 692 14 692 700 10 700 716 31 716
Sydney North 132 kV 778 -18 779 766 -2 766 782 1 782 797 10 797 735 60 737 741 51 742 745 73 749 755 92 761 767 93 772 780 130 791
Sydney South 132 kV 1029 -70 1031 1047 -57 1049 1083 -47 1084 1099 -50 1100 1114 -9 1114 1116 -20 1116 1132 -25 1132 1163 -2 1163 1180 1 1180 1196 -12 1196
Tomago 132 kV 229 39 233 230 39 234 233 39 236 235 41 238 240 60 248 240 48 244 240 43 244 246 64 254 249 65 257 251 66 260
Tuggerah 132 kV 141 28 143 143 21 145 144 22 145 142 12 143 142 13 143 141 8 141 141 14 142 142 24 144 143 24 145 144 25 146
Vales Point 132 kV 86 15 87 90 8 91 91 8 91 91 10 92 91 9 91 92 12 93 92 9 92 91 8 92 92 8 92 93 8 93
Waratah West 132 kV 161 54 170 161 55 170 161 55 171 162 56 171 162 51 170 160 38 165 163 56 172 164 52 172 166 52 174 168 53 176
35 Zone substation projections aggregated to TransGrid bulk supply points using agreed load flow models.
81Appendix 2 | Individual bulk supply point projections

Ap
pend
ix 2
Table 33 – Endeavour Energy bulk supply point summer maximum demand36
2019/20 2020/21 2021/22 2022/23 2023/24 2024/25 2025/26 2026/27 2027/28 2028/29MW MVAr MVA MW MVAr MVA MW MVAr MVA MW MVAr MVA MW MVAr MVA MW MVAr MVA MW MVAr MVA MW MVAr MVA MW MVAr MVA MW MVAr MVA
Dapto 132 kV 603 97 611 618 99 626 620 100 628 623 100 631 633 102 641 642 103 650 644 104 653 649 104 657 652 105 660 655 105 663
Holroyd 132 kV 360 1 360 369 1 369 381 1 381 384 1 384 386 1 386 389 1 389 393 1 393 397 1 397 401 1 401 406 2 406
Ilford 132 kV 4 1 4 6 1 6 9 2 9 14 3 14 19 5 19 24 6 24 29 7 30 35 9 36 39 10 40 42 11 44
Ingleburn 66 kV 132 36 137 132 36 136 131 35 136 131 35 136 131 35 135 130 35 135 130 35 135 130 35 135 130 35 135 130 35 135
Liverpool 132 kV 412 67 418 423 69 428 434 70 439 443 72 449 454 74 459 460 75 466 467 76 473 472 77 478 477 77 483 482 78 489
Macarthur 132 kV & 66 kV 347 46 350 359 47 362 369 49 372 380 50 383 391 52 394 404 54 407 417 55 420 427 57 431 438 58 442 450 60 454
Marulan 132 kV 70 22 73 70 22 73 69 22 73 69 22 73 69 22 72 69 22 72 69 22 72 69 22 72 69 22 72 69 22 72
Mount Piper 66 kV 27 11 29 27 11 29 27 11 29 27 11 29 27 11 29 27 11 29 27 11 29 27 11 29 27 11 29 27 11 29
Regentville 132 kV 286 75 296 292 77 302 297 78 307 300 79 310 301 79 312 303 80 313 304 80 314 305 80 315 305 80 316 306 81 317
Sydney North 132 kV 33 3 33 33 3 33 33 3 33 32 3 33 32 3 32 32 3 32 32 3 32 32 3 32 32 3 32 32 3 32
Sydney West 132 kV 1174 133 1182 1197 135 1205 1219 138 1227 1243 140 1251 1259 142 1267 1274 144 1283 1292 146 1300 1309 148 1318 1325 150 1333 1341 151 1349
Vineyard 132 kV 527 120 540 555 126 569 583 133 598 615 140 631 651 148 667 676 154 693 700 159 718 722 165 741 742 169 761 762 174 782
Wallerawang 132 kV & 66 kV
60 16 62 61 16 63 61 16 63 60 16 63 60 16 62 60 16 62 60 16 62 60 16 62 60 16 62 60 16 62
Table 34 – Endeavour Energy bulk supply point winter maximum demand37
2019 2020 2021 2022 2023 2024 2025 2026 2027 2028MW MVAr MVA MW MVAr MVA MW MVAr MVA MW MVAr MVA MW MVAr MVA MW MVAr MVA MW MVAr MVA MW MVAr MVA MW MVAr MVA MW MVAr MVA
Dapto 132 kV 655 70 659 671 72 675 684 73 688 689 74 693 692 74 696 698 75 702 704 75 708 708 76 712 714 76 718 720 77 724
Holroyd 132 kV 371 80 380 379 82 388 386 83 395 397 86 406 400 87 410 405 88 414 409 89 419 414 90 424 422 91 431 429 93 439
Ilford 132 kV 5 1 5 5 1 5 6 2 6 9 2 9 12 3 13 16 4 17 20 5 21 25 6 25 29 7 30 32 8 33
Ingleburn 66 kV 121 13 122 123 13 124 123 13 124 123 13 124 123 13 124 123 13 124 123 13 124 123 13 124 124 13 125 125 13 125
Liverpool 132 kV 295 43 298 306 45 309 318 46 321 331 48 334 342 50 346 353 52 357 360 53 364 368 54 371 374 55 378 381 56 385
Macarthur 132 kV & 66 kV 299 36 302 320 39 322 337 41 340 352 43 354 362 44 364 370 45 372 379 46 382 389 48 392 401 49 404 412 50 415
Marulan 132 kV 86 33 92 86 33 93 86 33 93 86 33 92 86 33 92 86 33 92 86 33 92 86 33 92 87 33 93 87 34 93
Mount Piper 66 kV 30 10 31 30 10 32 30 10 32 30 10 31 30 10 31 30 10 31 30 10 31 30 10 31 30 10 32 30 10 32
Regentville 132 kV 205 54 212 219 58 226 223 59 230 226 60 234 228 60 236 230 61 238 232 61 240 233 61 241 236 62 244 238 63 246
Sydney North 132 kV 26 3 27 26 3 26 26 3 26 26 3 26 26 3 26 26 3 26 26 3 26 26 3 26 26 3 27 27 3 27
Sydney West 132 kV 952 57 954 988 59 989 1015 61 1017 1030 62 1032 1051 63 1053 1066 64 1068 1081 65 1083 1098 66 1099 1116 67 1118 1132 68 1134
Vineyard 132 kV 340 45 343 381 51 384 405 54 409 433 57 437 461 61 465 492 65 496 514 68 518 535 71 540 556 74 561 574 76 579
Wallerawang 132 kV & 66 kV
82 23 86 83 23 86 83 23 86 83 23 86 83 23 86 83 23 86 83 23 86 83 23 86 83 23 87 84 23 87
Table 35 – Essential Energy (North) bulk supply point summer maximum demand
2019/20 2020/21 2021/22 2022/23 2023/24 2024/25 2025/26 2026/27 2027/28 2028/29MW MVAr MVA MW MVAr MVA MW MVAr MVA MW MVAr MVA MW MVAr MVA MW MVAr MVA MW MVAr MVA MW MVAr MVA MW MVAr MVA MW MVAr MVA
Armidale 66 kV 28 5 28 28 5 28 28 5 28 28 5 28 28 5 28 28 5 28 28 5 29 28 5 29 28 5 29 28 5 29
Boambee South 132 kV 18 2 18 18 2 18 18 2 18 18 2 18 18 2 18 18 2 18 18 2 18 18 2 18 18 2 18 18 2 18
Casino 132 kV 27 7 28 27 7 28 27 7 28 27 7 27 26 7 27 26 7 27 26 7 27 26 7 27 25 7 26 25 7 26
Coffs Harbour 66 kV 61 11 62 62 11 62 62 11 63 62 11 63 63 11 63 63 11 64 63 11 64 64 11 65 64 11 65 64 11 65
Dorrigo 132 kV 2 1 2 2 1 2 2 1 2 2 1 2 2 1 2 2 1 2 2 1 2 2 1 2 2 1 2 2 1 2
Dunoon 132 kV 6 -1 6 7 -1 7 7 -1 7 7 -1 7 7 -1 7 7 -1 7 7 -1 7 7 -1 7 7 -1 7 7 -1 7
Glen Innes 66 kV 10 -2 10 10 -2 10 11 -2 11 11 -2 11 11 -2 11 11 -2 11 11 -2 11 11 -2 12 12 -2 12 12 -2 12
Gunnedah 66 kV 29 -6 29 29 -6 29 29 -6 29 28 -6 29 28 -6 29 28 -6 29 28 -6 29 28 -5 29 28 -5 29 28 -5 28
Hawks Nest 132 kV 11 1 11 11 1 11 11 1 11 12 1 12 12 2 12 12 2 12 13 2 13 13 2 13 13 2 13 13 2 14
Herons Creek 132 kV 11 3 11 11 3 11 11 3 11 11 3 11 11 3 11 11 3 11 11 3 11 11 3 11 11 3 11 11 3 11
Inverell 66 kV 35 -3 35 35 -3 35 35 -3 35 35 -3 35 35 -3 35 35 -3 35 35 -3 36 35 -3 36 36 -3 36 36 -3 36
Kempsey 33 kV 31 5 32 32 5 32 33 5 33 33 5 34 34 5 34 35 5 35 35 6 36 36 6 36 37 6 37 37 6 38
Koolkhan 66 kV 53 8 53 53 9 54 54 9 54 54 9 55 55 9 55 55 9 56 56 9 56 56 9 57 57 9 57 57 9 58
Lismore 132 kV 82 22 85 82 22 85 83 22 85 83 22 86 83 22 86 83 22 86 84 22 86 84 22 87 84 22 87 84 22 87
Macksville 132 kV 10 2 10 10 2 10 10 2 10 10 2 10 10 2 10 10 2 10 11 2 11 11 2 11 11 2 11 11 2 11
Moree 66 kV 28 3 28 28 3 28 28 3 29 29 3 29 29 3 29 29 3 29 30 3 30 30 3 30 30 3 30 31 3 31
Mullumbimby 132 kV 47 -3 47 47 -3 47 48 -3 48 48 -3 48 49 -3 49 50 -3 50 50 -3 50 51 -3 51 51 -3 51 52 -3 52
Nambucca 66 kV 7 1 7 8 1 8 8 1 8 8 1 8 8 1 8 8 1 8 8 1 9 9 1 9 9 1 9 9 1 9
Narrabri 66 kV 58 8 58 59 8 59 60 8 60 61 8 62 62 9 63 63 9 64 64 9 65 65 9 66 66 9 67 68 9 68
Port Macquarie 33 kV 73 12 74 75 12 76 77 12 78 78 12 79 80 13 81 82 13 83 84 13 85 85 13 86 87 14 88 89 14 90
Raleigh 132 kV 11 2 11 11 2 11 11 2 11 11 2 11 11 2 12 12 2 12 12 3 12 12 3 12 12 3 12 12 3 13
Stroud 132 kV 36 -3 36 37 -3 37 38 -3 38 39 -3 39 40 -3 40 41 -3 41 41 -3 42 42 -3 42 43 -3 43 44 -3 44
Tamworth 66 kV 113 24 115 113 24 115 113 24 115 113 24 115 113 24 115 113 24 115 113 24 115 113 24 115 113 24 115 113 24 115
Taree 33 kV 29 6 30 30 6 31 31 6 31 31 6 32 32 6 32 33 6 33 33 6 34 34 6 34 34 7 35 35 7 36
Taree 66 kV 55 9 56 56 10 57 57 10 58 58 10 59 59 10 60 60 10 61 61 11 62 63 11 63 64 11 65 65 11 66
Tenterfield 22 kV 4 1 4 4 1 4 4 1 4 4 1 4 4 1 4 4 1 4 4 1 4 4 1 4 4 1 4 4 1 4
Terranora 110 kV 97 7 98 98 7 98 99 7 99 103 7 103 104 7 104 104 7 104 104 7 104 103 7 104 103 7 104 103 7 103
Table 36 – Essential Energy (North) bulk supply point winter maximum demand
2019 2020 2021 2022 2023 2024 2025 2026 2027 2028MW MVAr MVA MW MVAr MVA MW MVAr MVA MW MVAr MVA MW MVAr MVA MW MVAr MVA MW MVAr MVA MW MVAr MVA MW MVAr MVA MW MVAr MVA
Armidale 66 kV 41 3 41 41 3 41 41 3 41 41 3 41 41 3 41 41 3 41 41 3 41 41 3 41 41 3 41 41 3 41
Boambee South 132 kV 19 0 19 19 0 19 19 0 19 19 0 19 19 0 19 19 0 19 19 0 19 19 0 19 19 0 19 19 0 19
Casino 132 kV 20 2 20 20 2 20 20 2 20 20 2 20 20 2 20 19 2 19 19 2 19 19 2 19 19 2 19 18 2 18
Coffs Harbour 66 kV 62 -8 62 62 -8 63 63 -8 63 63 -8 64 63 -8 64 64 -8 64 64 -8 65 64 -8 65 65 -8 65 65 -8 66
Dorrigo 132 kV 2 1 2 2 1 2 2 1 2 2 1 2 2 1 2 2 1 2 2 1 2 2 0 2 2 0 2 2 0 2
Dunoon 132 kV 6 0 6 7 0 7 7 0 7 7 0 7 7 0 7 7 0 7 7 0 7 7 0 7 7 0 7 7 0 7
Glen Innes 66 kV 13 -2 14 13 -2 14 13 -2 14 13 -2 14 13 -2 14 13 -2 14 13 -2 14 13 -2 14 13 -2 14 13 -2 14
Gunnedah 66 kV 24 -6 25 24 -6 25 24 -6 25 24 -6 25 24 -6 24 24 -6 24 24 -6 24 23 -6 24 23 -6 24 23 -6 24
Hawks Nest 132 kV 8 -1 8 9 -1 9 9 -1 9 9 -1 9 10 -1 10 10 -1 10 10 -1 10 11 -1 11 11 -1 11 11 -1 11
Herons Creek 132 kV 11 1 11 11 1 11 11 1 11 11 1 11 11 1 11 11 1 11 11 1 11 11 1 11 11 1 11 11 1 11
Inverell 66 kV 32 -8 33 32 -8 33 32 -8 33 32 -8 33 32 -8 33 32 -8 33 32 -8 33 32 -8 33 33 -8 33 33 -8 33
Kempsey 33 kV 31 4 31 32 4 32 33 4 33 33 4 33 34 4 34 35 4 35 35 4 35 36 4 36 37 5 37 37 5 38
Koolkhan 66 kV 44 -5 44 44 -5 44 43 -5 43 43 -5 43 43 -4 43 42 -4 43 42 -4 42 42 -4 42 42 -4 42 41 -4 42
Lismore 132 kV 78 13 79 78 13 79 78 13 79 78 13 79 79 13 80 79 13 80 79 13 80 79 13 80 80 13 81 80 13 81
Macksville 132 kV 10 1 10 10 1 10 10 1 10 10 1 10 10 1 10 11 1 11 11 1 11 11 1 11 11 1 11 11 1 11
Moree 66 kV 36 4 36 36 4 36 36 4 36 36 4 36 36 5 36 36 5 37 36 5 37 37 5 37 37 5 37 37 5 37
Mullumbimby 132 kV 55 -3 55 55 -4 55 56 -4 56 56 -4 57 57 -4 57 57 -4 58 58 -4 58 59 -4 59 59 -4 59 60 -4 60
Nambucca 66 kV 9 1 9 9 1 9 9 1 9 9 1 9 9 1 9 9 1 9 10 1 10 10 1 10 10 1 10 10 1 10
Narrabri 66 kV 57 5 57 58 5 58 59 5 60 61 5 61 62 5 62 63 5 63 64 5 64 65 5 65 66 5 66 67 5 67
Port Macquarie 33 kV 76 10 77 78 11 79 80 11 81 82 11 82 83 11 84 85 11 86 87 12 87 88 12 89 90 12 91 92 12 93
Raleigh 132 kV 10 1 10 11 1 11 11 1 11 11 1 11 11 1 11 11 1 11 12 1 12 12 1 12 12 1 12 12 1 12
Stroud 132 kV 33 -5 33 34 -5 34 35 -5 35 36 -5 36 36 -5 37 37 -5 38 38 -5 38 39 -5 39 40 -6 40 41 -6 41
Tamworth 66 kV 96 8 97 96 8 97 96 8 97 96 8 97 96 8 97 96 8 97 96 8 97 96 8 97 96 8 97 96 8 97
Taree 33 kV 27 4 27 27 4 27 28 4 28 28 4 29 29 4 29 30 4 30 30 4 30 31 4 31 32 4 32 32 4 32
Taree 66 kV 55 5 55 56 5 56 57 5 58 58 5 59 60 6 60 61 6 61 62 6 62 63 6 63 64 6 64 65 6 65
Tenterfield 22 kV 4 0 4 4 0 4 4 0 4 4 0 4 4 0 4 4 0 4 4 0 4 4 0 4 4 0 4 4 0 4
Terranora 110 kV 84 -5 84 87 -6 87 87 -6 87 87 -6 87 92 -6 92 92 -6 92 92 -6 92 92 -6 92 92 -6 92 92 -6 92
Table 37 – Essential Energy (Central) bulk supply point summer maximum demand
2019/20 2020/21 2021/22 2022/23 2023/24 2024/25 2025/26 2026/27 2027/28 2028/29MW MVAr MVA MW MVAr MVA MW MVAr MVA MW MVAr MVA MW MVAr MVA MW MVAr MVA MW MVAr MVA MW MVAr MVA MW MVAr MVA MW MVAr MVA
Beryl 66 kV 73 13 74 76 13 77 79 14 80 82 14 83 84 15 86 87 15 88 90 15 91 93 16 94 96 16 97 98 17 100
Cowra 66 kV 40 10 42 41 10 43 42 11 44 43 11 45 44 11 45 45 11 46 46 12 47 47 12 48 48 12 49 49 12 50
Forbes 66 kV 35 -10 36 35 -10 36 35 -10 36 35 -10 36 35 -10 37 35 -10 37 35 -10 37 36 -10 37 36 -10 37 36 -10 37
Manildra 132 kV 11 4 11 11 4 11 11 4 11 10 4 11 10 4 11 10 4 11 10 4 11 10 4 11 10 4 11 10 4 11
Molong 66 kV 5 0 5 5 0 5 5 0 5 5 0 5 5 0 5 5 0 5 6 0 6 6 0 6 6 0 6 6 0 6
Mudgee 132 kV 26 3 26 26 3 26 26 3 26 27 3 27 27 3 27 27 3 28 28 3 28 28 4 28 28 4 29 29 4 29
Orange 66 kV 50 17 52 50 17 52 50 17 52 50 17 52 50 17 52 50 17 52 50 17 52 50 17 52 50 17 52 50 17 52
Orange 132 kV 158 33 162 166 35 169 183 38 187 183 38 187 183 38 187 186 39 190 189 40 193 191 40 195 194 41 198 196 41 200
Panorama 66 kV 68 14 70 68 14 70 68 14 70 68 14 69 68 14 69 68 14 69 68 14 69 68 14 69 68 14 69 68 14 69
Parkes 66 kV 28 -9 29 28 -9 29 28 -9 29 28 -9 29 28 -9 29 28 -9 29 28 -9 30 28 -9 30 29 -9 30 29 -9 30
Parkes 132 kV 32 13 34 32 13 35 33 13 35 33 13 35 33 13 36 33 13 36 34 13 36 34 13 37 34 13 37 35 14 37
Wallerawang 66 kV 4 1 4 4 1 4 4 1 4 4 1 4 4 1 4 4 1 4 4 1 4 4 1 4 4 1 4 5 1 5
Wallerawang 132 kV 21 12 24 21 12 24 20 12 23 20 12 23 20 12 23 19 11 22 19 11 22 19 11 22 19 11 21 18 11 21
Wellington 132 kV incl Town 181 21 182 181 21 182 181 21 182 181 21 182 182 21 183 182 21 183 182 21 183 182 21 183 182 21 184 183 21 184
Table 38 – Essential Energy (Central) bulk supply point winter maximum demand
2019 2020 2021 2022 2023 2024 2025 2026 2027 2028MW MVAr MVA MW MVAr MVA MW MVAr MVA MW MVAr MVA MW MVAr MVA MW MVAr MVA MW MVAr MVA MW MVAr MVA MW MVAr MVA MW MVAr MVA
Beryl 66 kV 74 11 75 77 11 78 80 12 80 82 12 83 85 12 86 88 13 89 91 13 92 93 14 94 96 14 97 99 14 100
Cowra 66 kV 30 -3 30 31 -3 31 32 -3 32 33 -3 33 34 -3 34 35 -3 35 36 -3 36 37 -3 37 38 -4 38 39 -4 39
Forbes 66 kV 26 -7 27 26 -7 27 26 -7 27 26 -7 27 26 -7 27 26 -7 27 26 -7 27 27 -7 28 27 -7 28 27 -8 28
Manildra 132 kV 11 4 11 11 4 11 11 4 11 11 4 11 11 4 11 11 4 11 11 4 11 11 4 11 11 4 11 11 4 11
Molong 66 kV 5 -1 5 5 -1 5 5 -1 5 5 -1 5 5 -1 5 6 -1 6 6 -1 6 6 -1 6 6 -1 6 6 -1 6
Mudgee 132 kV 24 2 24 24 2 24 24 2 24 25 2 25 25 2 25 26 2 26 26 2 26 26 2 26 27 2 27 27 2 27
Orange 66 kV 61 9 61 61 9 61 61 9 61 61 9 61 61 9 61 61 9 61 61 9 61 61 9 61 61 9 61 61 9 61
Orange 132 kV 150 20 151 162 22 164 166 22 167 184 25 185 180 24 182 184 25 185 187 25 189 191 26 192 194 26 196 198 26 199
Panorama 66 kV 70 10 70 70 10 70 70 10 70 70 10 70 70 10 70 70 10 70 70 10 70 70 10 70 70 10 70 69 10 70
Parkes 66 kV 24 -6 24 24 -6 25 24 -6 25 24 -6 25 24 -6 25 24 -6 25 24 -6 25 25 -6 25 25 -6 25 25 -6 26
Parkes 132 kV 32 13 35 33 13 35 33 13 36 34 13 36 34 14 37 34 14 37 35 14 37 35 14 38 36 14 38 36 14 39
Wallerawang 66 kV 6 1 6 6 1 6 6 1 6 6 1 6 6 1 6 6 1 6 6 1 6 6 1 6 6 1 6 6 1 6
Wallerawang 132 kV 23 13 27 23 13 27 23 13 27 23 13 26 23 13 26 23 13 26 23 13 26 22 13 26 22 13 26 22 13 26
Wellington 132 kV incl Town
169 3 169 170 3 170 170 3 170 170 3 170 170 3 170 170 3 170 171 3 171 171 3 171 171 3 171 171 3 171
36 Marulan 132 kV: Both Endeavour Energy and Essential Energy take supply from Marulan. This forecast is for Endeavour Energy component. A diversity factor of 3% in summer should be applied to obtain the total forecast load at Marulan
37 Marulan 132 kV: Both Endeavour Energy and Essential Energy take supply from Marulan. This forecast is for Endeavour Energy component. A diversity factor of 2% in winter should be applied to obtain the total forecast load at Marulan
82 NSW Transmission Annual Planning Report 2019 83Appendix 2 | Individual bulk supply point projections

Ap
pend
ix 2
Table 39 – Essential Energy (South) bulk supply point summer maximum demand
2019/20 2020/21 2021/22 2022/23 2023/24 2024/25 2025/26 2026/27 2027/28 2028/29MW MVAr MVA MW MVAr MVA MW MVAr MVA MW MVAr MVA MW MVAr MVA MW MVAr MVA MW MVAr MVA MW MVAr MVA MW MVAr MVA MW MVAr MVA
Albury & Finley 132 kV 124 12 124 124 12 125 125 12 125 125 12 126 126 12 126 126 12 127 127 12 127 127 12 128 128 12 129 129 12 129
Balranald 22 kV 4 1 4 4 1 4 4 1 4 4 1 4 4 1 4 4 1 4 4 1 4 4 1 4 4 1 4 4 1 4
Broken Hill 22 kV 37 10 39 38 10 39 38 10 39 38 10 39 38 10 39 38 10 39 38 10 40 38 10 40 38 10 40 39 10 40
Canberra 132 kV 386 265 469 379 261 460 252 173 306 249 171 302 252 173 306 250 172 304 246 169 299 247 170 300 248 170 301 248 170 301
Coleambally 132 kV 12 6 14 12 6 13 12 6 13 12 5 13 12 5 13 12 5 13 12 5 13 12 5 13 12 5 13 12 5 13
Cooma 66 kV 17 2 17 17 2 17 16 2 17 16 2 16 16 2 16 16 2 16 16 2 16 16 2 16 16 2 16 16 2 16
Cooma 132 kV 45 -8 45 45 -8 45 45 -8 45 45 -8 45 45 -8 45 45 -8 45 45 -8 45 45 -8 45 45 -8 45 45 -8 45
Darlington Point 132 kV 22 -12 25 22 -12 25 22 -12 25 22 -12 25 22 -12 25 22 -13 25 22 -13 25 22 -13 26 22 -13 26 23 -13 26
Deniliquin 66 kV 49 9 49 49 9 50 49 9 50 49 9 50 49 9 50 50 9 50 50 9 50 50 9 51 50 9 51 50 9 51
Finley 66 kV 17 3 18 17 3 18 17 3 17 17 3 17 17 3 17 17 3 17 17 3 17 17 3 17 16 3 17 16 3 17
Griffith 33 kV 90 10 91 94 10 95 94 10 95 94 10 95 94 10 95 94 10 95 94 10 95 94 10 95 94 10 95 94 10 95
Marulan 132 kV 58 -9 59 58 -9 59 59 -9 59 59 -9 59 59 -9 60 59 -9 60 60 -9 60 60 -9 61 60 -9 61 61 -9 61
Morven 132 kV 8 1 8 8 1 8 8 1 8 8 1 8 8 1 8 8 2 8 8 2 8 8 2 8 8 2 8 8 2 8
Munyang 33 kV 3 1 3 3 1 3 3 1 3 3 1 3 3 1 3 3 1 3 3 1 3 3 1 3 3 1 3 3 1 3
Murrumbateman 132 kV 6 0 6 6 0 6 6 0 6 6 0 6 6 0 6 6 0 6 6 0 6 7 0 7 7 0 7 7 0 7
Murrumburrah 66 kV 42 5 42 43 5 43 43 5 43 44 5 44 44 5 45 45 5 45 46 5 46 46 5 46 47 5 47 47 5 48
Queanbeyan 66 kV 76 36 84 78 37 86 79 38 87 80 38 88 78 38 87 78 38 87 79 38 87 79 38 88 80 39 89 80 39 89
Queanbeyan 132 kV 7 -1 7 8 -1 8 9 -1 9 10 -1 10 13 -2 13 15 -2 15 16 -2 17 18 -2 18 20 -2 20 21 -3 21
Snowy Adit 132 kV 0 0 0 0 0 0 0 0 0 0 0 0 0 0 0 0 0 0 0 0 0 0 0 0 0 0 0 0 0 0
Stockdill 132 kV 0 0 0 0 0 0 126 126 178 125 125 176 126 126 178 125 125 177 123 123 174 124 124 175 124 124 175 124 124 175
Tumut 66 kV 36 18 40 36 18 40 36 18 40 36 18 40 36 18 40 36 18 40 36 18 40 36 18 40 36 18 40 36 18 41
Wagga 66 kV 90 7 91 91 7 91 91 7 91 91 7 92 92 7 92 92 7 92 93 7 93 93 7 93 93 7 93 94 7 94
Wagga North 132 kV 63 -2 63 63 -2 63 63 -2 63 63 -2 63 63 -2 63 63 -2 63 63 -2 63 63 -2 63 63 -2 63 63 -2 63
Wagga North 66 kV 25 7 25 25 7 25 25 7 25 25 7 25 25 7 25 25 7 25 25 7 25 25 7 25 25 7 25 25 7 25
Williamsdale 132 kV 174 48 181 171 47 178 171 47 177 169 47 175 171 47 177 170 47 176 167 46 173 167 46 174 168 46 174 168 46 174
Yanco 33 kV 45 12 47 46 12 47 47 12 48 47 12 49 48 12 49 48 12 50 49 13 50 50 13 51 50 13 52 51 13 52
Yass 66 kV 13 -2 13 14 -2 14 14 -2 14 14 -2 14 14 -2 15 15 -2 15 15 -2 15 15 -2 15 15 -2 15 16 -2 16
Table 40 – Essential Energy (South) bulk supply point winter maximum demand
2019 2020 2021 2022 2023 2024 2025 2026 2027 2028MW MVAr MVA MW MVAr MVA MW MVAr MVA MW MVAr MVA MW MVAr MVA MW MVAr MVA MW MVAr MVA MW MVAr MVA MW MVAr MVA MW MVAr MVA
Albury & Finley 132 kV 89 -11 90 90 -11 90 90 -11 91 91 -11 92 92 -11 92 92 -11 93 93 -11 93 93 -11 94 94 -11 94 94 -11 95
Balranald 22 kV 3 -1 3 3 -1 3 3 -1 3 3 -1 3 3 -1 3 3 -1 3 3 -1 3 3 -1 3 3 -1 3 3 -1 3
Broken Hill 22 kV 35 4 35 35 4 35 35 4 35 35 4 35 35 4 36 36 4 36 36 4 36 36 4 36 36 4 36 36 4 36
Canberra 132 kV 445 173 477 448 175 481 298 116 320 297 116 318 296 115 317 293 114 314 293 114 315 293 114 315 295 115 316 294 115 315
Coleambally 132 kV 8 3 8 8 3 8 8 3 8 8 3 8 8 2 8 8 2 8 8 2 8 8 2 8 8 2 8 7 2 8
Cooma 66 kV 35 2 35 35 2 35 35 2 35 35 2 35 35 2 35 35 2 35 35 2 35 35 2 35 34 2 34 34 2 34
Cooma 132 kV 57 -7 57 57 -7 57 57 -7 57 57 -7 57 57 -7 57 57 -7 57 57 -7 57 57 -7 57 57 -7 57 57 -7 57
Darlington Point 132 kV 20 -14 25 20 -15 25 21 -15 25 21 -15 25 21 -15 25 21 -15 26 21 -15 26 21 -15 26 21 -15 26 21 -15 26
Deniliquin 66 kV 38 5 38 38 5 38 38 5 38 38 5 39 38 5 39 39 5 39 39 5 39 39 5 39 39 5 39 39 5 40
Finley 66 kV 15 2 15 15 2 15 15 2 15 15 2 15 15 2 15 15 2 15 14 2 15 14 2 14 14 2 14 14 2 14
Griffith 33 kV 56 7 56 60 7 61 64 8 65 65 8 65 65 8 65 65 8 66 65 8 66 66 8 66 66 8 66 66 8 67
Marulan 132 kV 59 -6 60 62 -6 62 62 -6 62 62 -6 63 63 -7 63 63 -7 63 63 -7 63 63 -7 64 64 -7 64 64 -7 64
Morven 132 kV 7 0 7 7 0 7 7 0 7 7 0 7 7 0 7 7 0 7 7 0 7 7 0 7 7 0 7 7 0 7
Munyang 33 kV 27 9 29 28 9 29 32 10 33 31 10 33 31 10 32 30 10 31 30 9 31 33 10 34 32 10 34 32 10 33
Murrumbateman 132 kV 7 0 7 7 0 7 7 0 7 7 0 7 7 0 7 7 0 7 7 0 7 7 0 7 8 0 8 8 0 8
Murrumburrah 66 kV 36 1 36 36 1 36 37 1 37 38 1 38 38 1 38 39 1 39 39 1 39 40 1 40 41 1 41 41 1 41
Queanbeyan 66 kV 74 9 75 79 10 80 81 10 82 83 10 83 84 11 85 83 11 84 84 11 85 85 11 86 86 11 87 87 11 87
Queanbeyan 132 kV 9 -1 9 9 -1 9 10 -1 10 11 -1 11 12 -1 12 16 -1 16 17 -1 17 19 -1 19 20 -1 20 22 -1 22
Snowy Adit 132 kV 0 0 0 0 0 0 0 0 0 0 0 0 0 0 0 0 0 0 0 0 0 0 0 0 0 0 0 0 0 0
Stockdill 132 kV 0 0 0 0 0 0 149 58 160 148 58 159 148 58 159 146 57 157 147 57 157 147 57 157 147 57 158 147 57 158
Tumut 66 kV 31 14 34 31 14 34 31 14 34 31 14 34 32 14 34 32 14 34 32 14 35 32 14 35 32 14 35 32 14 35
Wagga 66 kV 74 5 74 75 5 75 75 5 75 75 5 75 76 5 76 76 5 76 76 5 77 77 5 77 77 5 77 78 5 78
Wagga North 132 kV 57 -9 58 57 -9 58 57 -9 58 57 -9 58 57 -9 58 57 -9 58 57 -9 58 57 -9 58 57 -9 58 57 -9 58
Wagga North 66 kV 22 4 22 22 4 22 22 4 22 22 4 22 22 4 22 22 4 22 22 4 22 22 4 22 22 4 22 22 4 22
Williamsdale 132 kV 196 20 197 198 20 199 198 20 199 197 20 198 196 20 197 194 19 195 194 19 195 194 20 195 195 20 196 195 20 196
Yanco 33 kV 34 6 35 38 7 39 39 7 39 40 7 40 40 7 41 41 7 41 41 7 42 42 7 43 43 7 43 43 8 44
Yass 66 kV 13 -2 13 13 -3 13 13 -3 13 13 -3 13 13 -3 13 13 -3 13 13 -3 13 13 -3 13 13 -3 13 13 -3 13
Table 41 – Major industrial customers – Sum of individual summer maximum demands
2019/20 2020/21 2021/22 2022/23 2023/24 2024/25 2025/26 2026/27 2027/28 2028/29
MW MW MW MW MW MW MW MW MW MW
Industrial Loads 1016 1017 1016 1018 1020 1020 1020 1020 1020 1021
Table 42 – Major industrial customers – Sum of individual winter maximum demands
2019 2020 2021 2022 2023 2024 2025 2026 2027 2028
MW MW MW MW MW MW MW MW MW MW
Industrial Loads 1036 1043 1042 1043 1045 1045 1045 1045 1045 1046
84 NSW Transmission Annual Planning Report 2019 85Appendix 2 | Individual bulk supply point projections

Ap
pend
ix 3
Appendix 3
How we plan
Our network investment process is designed to respond to the changing needs of stakeholders and ensure the efficient delivery of our capital program.
A3.1. Network Investment Process
The network investment process adopted at TransGrid includes the following:
� An integrated, whole-of-business approach to capital program management
� Optimisation of investments, and operating and maintenance costs, while meeting augmentation and asset management requirements
� Early resolution of key risk areas such as environmental approvals, property acquisition and scope definition in the project delivery process
� Documented options evaluations and project scoping to enhance transparency.
The key processes and steps, including where and how we engage with stakeholders, are set out in the figure below.
Figure 48 – Planning Methodology
TransGrid planning process Stakeholder involvement
Identify need
Look at demand forecasts, expected generation patterns and the condition of existing assets.Will there be a shortfall in supply if we do nothing?
Sense-check forecasts with• Distributors• Directly connected customers• AEMOSeek feedback from end users and their representatives on need assessment.
Identify possible network and non-network options to fulfil the need, including:• Demand management• Local or distributed generation• Network infrastructure optimised to
expected requirements• Improved operational and
maintenance regimes.
Input from large users, service providers and experts on potential for non-network options.Communicate with local community that may be impacted by network infrastructure.
Request proposals and undertake investmentanalysis on most viable options.
Encourage proposals from market participants for non-network options. Engage impacted communities in network corridor selection, if relevant.Involve end users and their representatives in final investment decision.
Enter into contracts for network or non-network solutions.Build or renew network infrastructure, if required.
Work with impacted community to supportbest local outcomes.Report progress in meeting identified need to end users and their representatives.
STAGE 1
STAGE 2 Reviewoptions
STAGE 4 Implementsolution
STAGE 3 Plan in detail
Planning approachAs a TNSP, we are obliged to meet the requirements of the National Electricity Rules (NER). In particular, we are obliged to meet the requirements of clause S5.1.2.1:
‘Network Service Providers must plan, design, maintain and operate their transmission networks and distribution networks to allow the transfer of power from generating units to Customers with all facilities or equipment associated with the power system in service and may be required by a Registered Participant under a connection agreement to continue to allow the transfer of power with certain facilities or plant associated with the power system out of service, whether or not accompanied by the occurrence of certain faults (called ‘credible contingency events’).’
The NER sets out the required processes for developing networks as well as minimum performance requirements of the network and connections to the network. It requires us to consult with Registered Participants and interested parties and to apply the Australian Energy Regulator’s (AER’s) Regulatory Investment Test – Transmission (RIT-T) as appropriate to development proposals.
Our planning obligations are interlinked with the reliability obligations placed on DNSPs in NSW. We must ensure that its system is adequately planned to enable these licence requirements to be met.
We plan the network to achieve supply at least cost to the community, without being constrained by state borders or ownership considerations.
87Appendix 3 | How we plan

Ap
pend
ix 3
Our approach to network planning includes consideration of non-network options, including demand side response and demand management and/or embedded generation, as an integral part of the planning process. Joint planning with DNSPs, directly supplied industrial customers,
generators and interstate TNSPs is carried out to ensure that the most economic options, whether network options or non-network options, consistent with customer and community requirements are identified and implemented.
Jurisdictional planning requirementsIn addition to meeting requirements imposed by the NER, environmental legislation and other statutory instruments, we have in the past been required to comply with the Transmission Network Design and Reliability Standard for NSW 2010 set by the NSW Government. This standard generally required us to plan and develop our transmission network in NSW on an N–1 basis. That is, unless specifically agreed otherwise with the affected distribution network owner or major directly connected end-use customer, there will be no inadvertent loss of load (other than load which is interruptible or dispatchable) following an outage of a single circuit (a line or a cable) or transformer, during periods of forecast high load.
The reliability requirements of our operating licence were reviewed by the NSW government in 2017, which led to a new probabilistic-based framework for determining the appropriate level of reliability that we provide at all of our bulk supply points. This new licence requirement, set out in the Electricity Transmission Reliability Standards 2017 came into effect on 1 July 2018, compliance with which is overseen and monitored by the NSW technical regulator, IPART. This TAPR has been prepared in accordance with our obligations to comply with new licence requirements.
The new probabilistic approach to determining the reliability standard at each of our bulk supply points has allowed us to develop alternate network plans with greater net market benefit, as demonstrated by using the cost-benefit methodology defined in the RIT-T process.
In fulfilling our obligations, we are obliged to recognise specific customer requirements as well as AEMO’s role as system operator for the NEM. To accommodate this, we consider the following circumstances based on the demonstration of greater net market benefit than the requirement to merely comply with the new standard:
� Where agreed with a distribution network owner or major directly connected end-use customer, agreed levels of supply interruption can be accepted for particular single outages, before augmentation of the network is undertaken (for example, the situation with radial supplies);
� Where requested by a distribution network owner or major directly connected end-use customer and agreed with us, there will be no inadvertent loss of load (other than load which is interruptible or dispatchable) following events more onerous than N–1 such as concurrent outages of two network elements; and
� The main transmission network should have sufficient capacity to accommodate AEMO’s operating practices without inadvertent loss of load (other than load which is interruptible or dispatchable) or uneconomic constraints on the energy market. AEMO’s operating practices include the re-dispatch of generation and ancillary services following a first contingency, such that within 30 minutes the system will again be ‘secure’ in anticipation of the next critical credible contingency.
These jurisdictional requirements and other obligations require the following to be observed in our planning process:
� At all times when the system is either in its normal state with all elements in service or following a credible contingency:• Electrical and thermal ratings of equipment will not
be exceeded;• Stable control of the interconnected system will be
maintained, with system voltages maintained within acceptable levels;
� A quality of electricity supply at least to NER requirements is to be provided;
� A standard of connection to individual customers as specified by Connection Agreements is to be provided;
� As far as possible connection of a customer is to have no adverse effect on other connected customers;
� Environmental and social objectives are to be satisfied; � Acceptable safety standards are to be maintained; and � The power system in NSW is to be developed at the
lowest cost possible whilst meeting the constraints imposed by the above factors.
A further consideration is the provision of sufficient capability in the system to allow components to be maintained in accordance with our asset management strategies.
Also, consistent with a responsible approach to the managing environmental impacts, our planning approach is also aimed at reducing system energy losses where it is economic to do so.
National planning requirementsAEMO has the role of the national transmission planner and is required to produce a National Transmission Network Development Plan (NTNDP) and Integrated System Plan (ISP). The ISP, which incorporates elements of NTNDP, has regard to jurisdictional planning and regulatory documents
(such as Transmission Annual Planning Reports (TAPRs)) and, in turn, the jurisdictional planning bodies need to have regard to the NTNDP/ISP in formulating their plans. Our plans are consistent with the ISP.
The network planning processThe network planning process is undertaken at three levels:
1. Connection planningConnection planning is focussed on local electricity networks that are directly related to the connection of loads and generators. Connection planning typically includes connection enquiries and the formulation of draft connection agreements leading to a preliminary review of the capability of connections. Further discussions are held with specific customers where there is a need for augmentation or for provision of new connection points.
2. Network planning within the NSW regionThe main 500 kV, 330 kV and 220 kV transmission system is planned and developed in response to overall load growth and generation developments and may also be influenced by interstate power transfers through interconnections with other regions in the NEM. Any proposed developments are
assessed through liaison with affected NSW and interstate parties using our joint planning processes.
The assessment of the adequacy of 132 kV bulk supply transmission systems requires that joint planning be undertaken in conjunction with DNSPs. This ensures that development proposals are optimal with respect to both transmission and distribution requirements, leading to the lowest possible overall network costs to the end customer. This is particularly important where the DNSP’s network operates in parallel with the transmission network.
3. Inter‑regional planningThe development of interconnectors between regions and of augmentations within regions that have a material effect on inter-regional power transfer capability are coordinated with network owners in other states in accordance with Clause 5.14.3 of the NER.
Consideration of non-network alternativesWhere economic to do so, our planning process includes consideration and adoption of non-network alternatives which can address the emerging constraints, and which may
defer or cancel the need for some network augmentations. These opportunities are assessed on a case-by-case basis.
Compliance with NER requirementsOur approach to the development of the network since the commencement of the NEM is in accordance with the NER,
other rules and guidelines published by the AER and the Australian Energy Market Commission (AEMC).
Planning horizons and reportingTransmission planning is carried out over a short-term time frame of one to seven years, medium-term time frames of seven to 15 years and long-term time frames of 15 to 50 years. The short-term planning supports commitments to network developments with relatively short lead-times. The medium-term planning looks at currently emerging technologies and their impact on the power system. The long-term planning considers options for future major
developments and provides a framework for the orderly and economic development of the transmission network and the strategic acquisition of critical line and substation sites.
In this TAPR, the constraints that appear over long-term time frames are considered to be indicative. The timing and capital cost of possible network options to relieve them may change as system conditions evolve.
Identifying network constraints and assessing possible solutionsAn emerging constraint is identified during various planning activities covering the relevant planning horizon. It may be identified through:
� Our planning activities, including joint planning with DNSPs;
� The impact of network developments undertaken by other TNSPs;
� The impact of prospective generation developments; � The occurrence of constraints affecting generation
dispatch in the NEM; or � As a result of a major load development.
During the initial planning phase, a number of options for addressing the constraint are developed. In accordance with NER requirements, consultation with interested parties is carried out to determine a range of options including network, demand management and local generation options and/or to refine existing network development options.
A cost-effectiveness or cost-benefit analysis is carried out, whereby the costs and benefits of each option are compared in accordance with the RIT–T process. The cost and benefit factors may include:
� Avoiding unserved energy caused by either a generation shortfall or inadequate transmission capability
� or reliability; � Reduction in greenhouse gas emissions or increased
capability to apply low emissions plant; � Loss reductions; � Alleviating constraints affecting generation dispatch; � Avoiding the need for generation developments; � More efficient generation and fuel type alternatives; � Improvement in marginal loss factors; � Deferral of related transmission works; and � Reduction in operation and maintenance costs.
88 NSW Transmission Annual Planning Report 2019 89Appendix 3 | How we plan
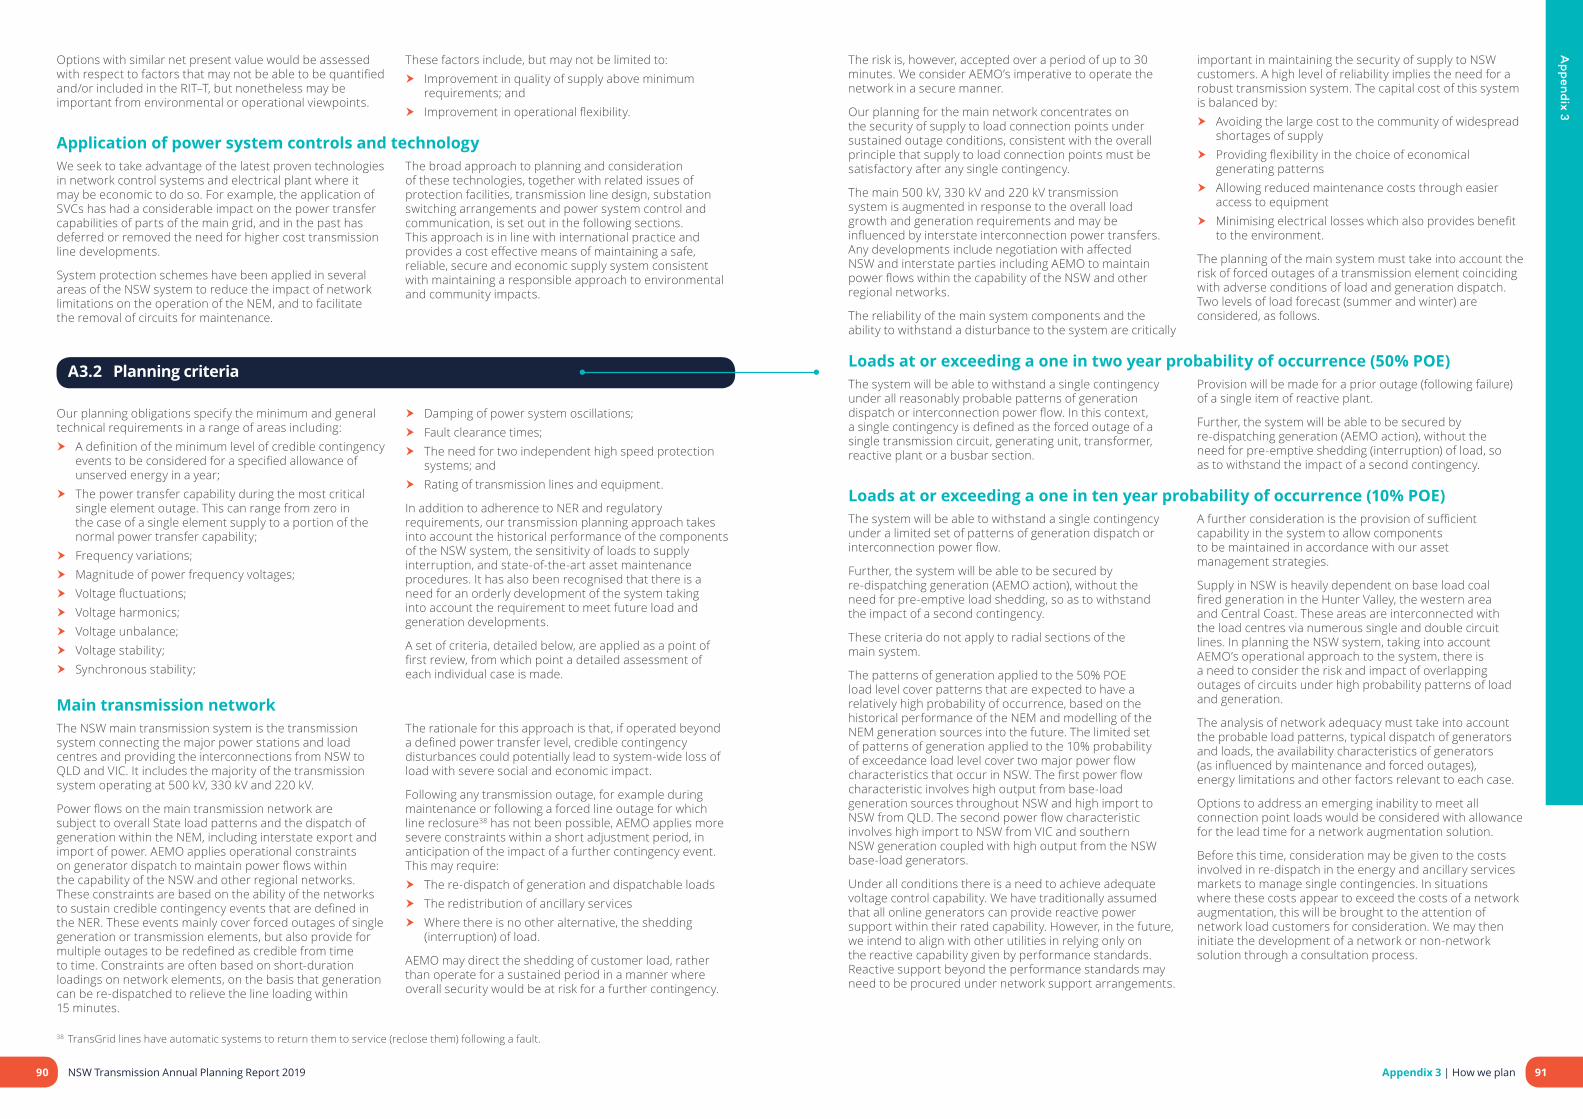
Ap
pend
ix 3
Options with similar net present value would be assessed with respect to factors that may not be able to be quantified and/or included in the RIT–T, but nonetheless may be important from environmental or operational viewpoints.
These factors include, but may not be limited to: � Improvement in quality of supply above minimum
requirements; and � Improvement in operational flexibility.
Application of power system controls and technologyWe seek to take advantage of the latest proven technologies in network control systems and electrical plant where it may be economic to do so. For example, the application of SVCs has had a considerable impact on the power transfer capabilities of parts of the main grid, and in the past has deferred or removed the need for higher cost transmission line developments.
System protection schemes have been applied in several areas of the NSW system to reduce the impact of network limitations on the operation of the NEM, and to facilitate the removal of circuits for maintenance.
The broad approach to planning and consideration of these technologies, together with related issues of protection facilities, transmission line design, substation switching arrangements and power system control and communication, is set out in the following sections. This approach is in line with international practice and provides a cost effective means of maintaining a safe, reliable, secure and economic supply system consistent with maintaining a responsible approach to environmental and community impacts.
A3.2 Planning criteria
Our planning obligations specify the minimum and general technical requirements in a range of areas including:
� A definition of the minimum level of credible contingency events to be considered for a specified allowance of unserved energy in a year;
� The power transfer capability during the most critical single element outage. This can range from zero in the case of a single element supply to a portion of the normal power transfer capability;
� Frequency variations; � Magnitude of power frequency voltages; � Voltage fluctuations; � Voltage harmonics; � Voltage unbalance; � Voltage stability; � Synchronous stability;
� Damping of power system oscillations; � Fault clearance times; � The need for two independent high speed protection
systems; and � Rating of transmission lines and equipment.
In addition to adherence to NER and regulatory requirements, our transmission planning approach takes into account the historical performance of the components of the NSW system, the sensitivity of loads to supply interruption, and state-of-the-art asset maintenance procedures. It has also been recognised that there is a need for an orderly development of the system taking into account the requirement to meet future load and generation developments.
A set of criteria, detailed below, are applied as a point of first review, from which point a detailed assessment of each individual case is made.
Main transmission networkThe NSW main transmission system is the transmission system connecting the major power stations and load centres and providing the interconnections from NSW to QLD and VIC. It includes the majority of the transmission system operating at 500 kV, 330 kV and 220 kV.
Power flows on the main transmission network are subject to overall State load patterns and the dispatch of generation within the NEM, including interstate export and import of power. AEMO applies operational constraints on generator dispatch to maintain power flows within the capability of the NSW and other regional networks. These constraints are based on the ability of the networks to sustain credible contingency events that are defined in the NER. These events mainly cover forced outages of single generation or transmission elements, but also provide for multiple outages to be redefined as credible from time to time. Constraints are often based on short-duration loadings on network elements, on the basis that generation can be re-dispatched to relieve the line loading within 15 minutes.
The rationale for this approach is that, if operated beyond a defined power transfer level, credible contingency disturbances could potentially lead to system-wide loss of load with severe social and economic impact.
Following any transmission outage, for example during maintenance or following a forced line outage for which line reclosure38 has not been possible, AEMO applies more severe constraints within a short adjustment period, in anticipation of the impact of a further contingency event. This may require:
� The re-dispatch of generation and dispatchable loads � The redistribution of ancillary services � Where there is no other alternative, the shedding
(interruption) of load.
AEMO may direct the shedding of customer load, rather than operate for a sustained period in a manner where overall security would be at risk for a further contingency.
The risk is, however, accepted over a period of up to 30 minutes. We consider AEMO’s imperative to operate the network in a secure manner.
Our planning for the main network concentrates on the security of supply to load connection points under sustained outage conditions, consistent with the overall principle that supply to load connection points must be satisfactory after any single contingency.
The main 500 kV, 330 kV and 220 kV transmission system is augmented in response to the overall load growth and generation requirements and may be influenced by interstate interconnection power transfers. Any developments include negotiation with affected NSW and interstate parties including AEMO to maintain power flows within the capability of the NSW and other regional networks.
The reliability of the main system components and the ability to withstand a disturbance to the system are critically
important in maintaining the security of supply to NSW customers. A high level of reliability implies the need for a robust transmission system. The capital cost of this system is balanced by:
� Avoiding the large cost to the community of widespread shortages of supply
� Providing flexibility in the choice of economical generating patterns
� Allowing reduced maintenance costs through easier access to equipment
� Minimising electrical losses which also provides benefit to the environment.
The planning of the main system must take into account the risk of forced outages of a transmission element coinciding with adverse conditions of load and generation dispatch. Two levels of load forecast (summer and winter) are considered, as follows.
Loads at or exceeding a one in two year probability of occurrence (50% POE)The system will be able to withstand a single contingency under all reasonably probable patterns of generation dispatch or interconnection power flow. In this context, a single contingency is defined as the forced outage of a single transmission circuit, generating unit, transformer, reactive plant or a busbar section.
Provision will be made for a prior outage (following failure) of a single item of reactive plant.
Further, the system will be able to be secured by re-dispatching generation (AEMO action), without the need for pre-emptive shedding (interruption) of load, so as to withstand the impact of a second contingency.
Loads at or exceeding a one in ten year probability of occurrence (10% POE)The system will be able to withstand a single contingency under a limited set of patterns of generation dispatch or interconnection power flow.
Further, the system will be able to be secured by re-dispatching generation (AEMO action), without the need for pre-emptive load shedding, so as to withstand the impact of a second contingency.
These criteria do not apply to radial sections of the main system.
The patterns of generation applied to the 50% POE load level cover patterns that are expected to have a relatively high probability of occurrence, based on the historical performance of the NEM and modelling of the NEM generation sources into the future. The limited set of patterns of generation applied to the 10% probability of exceedance load level cover two major power flow characteristics that occur in NSW. The first power flow characteristic involves high output from base-load generation sources throughout NSW and high import to NSW from QLD. The second power flow characteristic involves high import to NSW from VIC and southern NSW generation coupled with high output from the NSW base-load generators.
Under all conditions there is a need to achieve adequate voltage control capability. We have traditionally assumed that all online generators can provide reactive power support within their rated capability. However, in the future, we intend to align with other utilities in relying only on the reactive capability given by performance standards. Reactive support beyond the performance standards may need to be procured under network support arrangements.
A further consideration is the provision of sufficient capability in the system to allow components to be maintained in accordance with our asset management strategies.
Supply in NSW is heavily dependent on base load coal fired generation in the Hunter Valley, the western area and Central Coast. These areas are interconnected with the load centres via numerous single and double circuit lines. In planning the NSW system, taking into account AEMO’s operational approach to the system, there is a need to consider the risk and impact of overlapping outages of circuits under high probability patterns of load and generation.
The analysis of network adequacy must take into account the probable load patterns, typical dispatch of generators and loads, the availability characteristics of generators (as influenced by maintenance and forced outages), energy limitations and other factors relevant to each case.
Options to address an emerging inability to meet all connection point loads would be considered with allowance for the lead time for a network augmentation solution.
Before this time, consideration may be given to the costs involved in re-dispatch in the energy and ancillary services markets to manage single contingencies. In situations where these costs appear to exceed the costs of a network augmentation, this will be brought to the attention of network load customers for consideration. We may then initiate the development of a network or non-network solution through a consultation process.
38 TransGrid lines have automatic systems to return them to service (reclose them) following a fault.
90 NSW Transmission Annual Planning Report 2019 91Appendix 3 | How we plan

Ap
pend
ix 3
Relationship with inter-regional planningWe monitor the occurrence of constraints in the main transmission system that affects generator dispatch. Our planning therefore also considers the scope for network augmentations to reduce constraints that may satisfy the RIT-T.
Under the provisions of the NER, a Region may be created where constraints to generator dispatch are predicted to occur with reasonable frequency when the network is operated in the ‘system normal’ (all significant elements in service) condition. The creation of a Region does not consider the consequences to load connection points if there should be a network contingency.
The capacity of interconnectors that is applied in the market dispatch is the short-time capacity determined by the ability to maintain secure operation in the system normal state in anticipation of a single contingency. The operation of the interconnector at this capacity must be supported by
appropriate ancillary services. AEMO does not operate on the basis that the contingency may be sustained but we must consider the impact of a prolonged plant outage.
As a consequence, it is probable that for parts of the network that are critical to the supply to loads, we would initiate augmentation, if needed, to meet the new NSW Electricity Transmission Reliability and Performance Standard 2017 before the creation of a new Region.
The development of interconnectors between regions will be undertaken where the augmentation satisfies the RIT-T. The planning of interconnections will be undertaken in consultation with the jurisdictional planning bodies of the other states.
It is not planned to maintain the capability of an interconnector where relevant network developments would not satisfy the RIT-T.
Networks supplied from the main transmission networkSome parts of our network are primarily concerned with supply to local loads and are not significantly impacted by the dispatch of generation (although they may contain embedded generators). The loss of a transmission element within these networks does not have to be considered by AEMO in determining network constraints, although ancillary services may need to be provided to cover load rejection in the event of a single contingency.
Supply to major load areas and sensitive loads
The NSW system contains six major load areas: Northern; Newcastle and Central Coast; Greater Sydney; Central; Southern; and South Western NSW.
Some of these load areas, including individual smelters, are supplied by a limited number of circuits, some of which
may share double circuit line sections. It is strategically necessary to ensure that significant individual loads and load areas are not exposed to loss of supply in the event of multiple circuit failures for an extended duration of time. As a consequence, it is necessary to assess the impact of contingency levels that exceed the specified level of redundancy and expected unserved energy for the respective network nodes.
Outages of network elements for planned maintenance must also be considered. Generally this will require 75% of the maximum load to be supplied during the outage. While every effort would be made to secure supplies in the event of a further outage, this may not be always possible. In this case attention would be directed to minimising the duration of the plant outage.
Urban and suburban areas Generally, urban and suburban networks are characterised by a high load density served by high capacity underground cables and relatively short transmission lines. The connection points to our network are usually the low voltage (132 kV) busbars of 330 kV substations. There may be multiple connection points and significant capability on the part of the DNSP to transfer load between connection points, either permanently or to relieve short-time loadings on network elements after a contingency.
The focus of joint planning with DNSPs is the capability of the meshed 330/132 kV system and the capability of the existing connection points to meet expected maximum loadings. Joint planning addresses the need for augmentation to the meshed 330/132 kV system and our connection point capacity or to provide a new connection point where this is the most economic overall solution.
Consistent with good international practice, supply to high-density urban and central business districts is given special consideration. For example, the inner Sydney metropolitan network serves a large and important part of the State load. Supply to this area is largely via a 330 kV
and 132 kV underground cable network. The 330 kV cables are part of our network and the 132 kV cables are part of Ausgrid’s network.
The criterion applied to the Inner Sydney area is consistent with that applied in the electricity supply to major cities throughout the world. Most countries use an N–2 criterion, whereas some countries apply an N–1 criterion with some selected N–2 contingencies that commonly include two cables sharing the one trench or a double circuit line. This is similar to the approach adopted previously in NSW. Using the probabilistic approach specified under the new NSW Electricity Transmission Reliability Standard 2017, supply to the Inner Sydney load is required to design for Category 3 level of redundancy39 and maximum unserved energy allowance corresponding to 0.6 minute per year at average demand40.
Also, it should be noted that the reliability criteria (redundancy level and unserved energy allowance per year) at bulk supply points outside the Inner Sydney area are less onerous than that for Inner Sydney area.
39 NSW Electricity Transmission Reliability and Performance Standard 2017 Clause 340 NSW Electricity Transmission Reliability and Performance Standard 2017 Clause 4
41 Transformer nominal ratings are based on them carrying a constant load. However, loads are often cyclic (they vary throughout the day). In these cases transformers may be able to carry more than their nominal rating for a short period around the time of the maximum load as they are loaded less heavily before and after that period. A cyclic loading takes this into account.
42 Alternating current power systems generally have three phases. Faults on those systems can involve one, two or all three of those phases. Faults involving three phases are generally the most onerous.
Outages of network elements for planned maintenance must also be considered. Generally this will require 75% of the maximum load to be supplied during an outage. While every effort would be made to secure supplies in the event
of a further outage, this may not be always possible. In this case attention would be directed to minimising the duration of the outage.
Non-urban areas Generally, these areas are characterised by lower load densities and, generally, lower reliability requirements than urban systems. The areas are sometimes supplied by relatively long, often radial, transmission systems. Connection points are either on 132 kV lines or on the low voltage busbars of 132 kV substations. Although there may be multiple connection points to a DNSP, they are often far apart and there will be little capacity for power transfer between them. Frequently supply limitations will apply to the combined capacity of several supply points together.
The focus of joint planning with DNSPs usually relates to: � Augmentation of connection point capacity; � Duplication of radial supplies; � Extension of the 132 kV system to reinforce or replace
existing lower voltage systems and to reduce losses; and � Development of a higher voltage system to provide a
major augmentation and to reduce network losses.
Supply to one or more connection points is sometimes considered to require augmentation when the transmission network supplying the load does not provide the specified redundancy level or the probability of unserved energy (i.e. function of network failure rate, restoration duration and average load) at the end of the planning horizon exceeds the specified reliability criteria.
As a result of the application of the criteria, some radial parts of the 330 kV and 220 kV network are not able to withstand the forced outage of a single circuit line at time of maximum load, and in these cases provision has been made for under-voltage load shedding.
Provision is also required for the maintenance of the network. Additional redundancy in the network is required where maintenance cannot be scheduled without causing load restrictions or an unacceptable level of risk to the security of supply.
Transformer augmentationIn considering the augmentation of transformers, appropriate allowance is made for the transformer cyclic rating41 and the practicality of load transfers between connection points. Allowance is made for the outage of a single transformer (or single-phase unit) or a transmission line that supports the load carried by the transformer.
Provision is also required for the maintenance of transformers. This has become a critical issue at a number of sites in NSW where there are multiple transformers in service. To enable maintenance to be carried out, additional transformer capacity or a means of transferring load to other supply points via the underlying lower voltage network may be required.
Consideration of low probability eventsAlthough there is a low probability that supply to loads will need to be interrupted as a result of system disturbances, no power system can be guaranteed to deliver a firm capability 100% of the time, particularly when subjected to disturbances that are severe or widespread. It is also possible that extreme loads, above the level allowed for in planning, can occur, usually under extreme weather conditions.
The NSW network contains numerous lines of double circuit construction and, whilst the probability of overlapping outages of both circuits of a line is very low, the consequences could be widespread supply disturbances.
Thus there is a potential for low probability events to cause localised or widespread disruption to the power system. These events can include:
� Loss of several transmission lines within a single corridor, as may occur during bushfires;
� Loss of a number of cables sharing a common trench; � Loss of more than one section of busbar within a
substation, possibly following a major plant failure; � Loss of a number of generating units; or � Occurrence of three-phase faults42, or faults with
delayed clearing.
In our network, appropriate facilities and mechanisms are put in place to minimise the probability of such events and to lessen their impact. The decision process considers the underlying economics of facilities or corrective actions, taking account of the low probability of the occurrence of extreme events.
We will take measures, where practicable, to minimise the impact of disturbances to the power system by implementing power system control systems at minimal cost in accordance with the NER.
92 NSW Transmission Annual Planning Report 2019 93Appendix 3 | How we plan

Ap
pend
ix 3
A3.3 Protection requirements
Basic protection requirements are included in the NER. The NER requires that protection systems be installed so that any fault can be detected by at least two fully independent protection systems. Backup protection is provided against circuit breaker failure. Provision is also made for detecting high resistance earth faults.
Required protection clearance times are specified by the NER and determined by stability considerations as well as the characteristics of modern power system equipment. Where special protection facilities or equipment are
required for high-speed fault clearance, they are justified on either NER compliance or a benefit/cost basis.
All modern distance protection systems on the main network include the facility for power swing blocking (PSB). PSB is utilised to control the impact of a disturbance that can cause synchronous instability. At the moment PSB is not enabled, except at locations where demonstrated advantages apply. This feature will become increasingly more important as the interconnected system is developed and extended.
A3.4 Transient stability
In accordance with the NER, transient stability is assessed on the basis of the angular swings following a solid fault on one circuit at the most critical location that is cleared by the faster of the two protections (with intertrips assumed in service where installed). The determination of the transient stability capability of the main grid is undertaken using software that has been calibrated against commercially available system dynamic analysis software.
To assess this at the main system level a two phase-to-ground fault is applied. On 132 kV systems, which are to be augmented, a three-phase fault is applied.
Recognition of the potential impact of a three-phase fault at the main system level is made by instituting maintenance and operating precautions to minimise the risk of such a fault.
Where transient stability is a factor in the development of the main network, preference is given to the application of advanced control of the power system or high-speed protection systems, before consideration is given to the installation of high capital cost plant.
A3.5 Steady state stability
The requirements for the control of steady state stability are included in the NER. For planning purposes, steady state stability (or system damping) is considered adequate under any given operating condition if, after the most critical credible contingency, simulations indicate that the halving time of the least damped electromechanical mode of oscillation is not more than five seconds.
The determination of the steady state stability performance of the system is undertaken using software that has been calibrated against commercially available software and from data derived from the monitoring of system behaviour.
In planning the network, maximum use is made of existing plant, through the optimum adjustment of plant control system settings, before consideration is given to the installation of high capital cost plant.
A3.6 Line and equipment thermal ratings
Line thermal ratings have often traditionally been based on a fixed continuous rating and a fixed short-time rating. We apply probabilistic-based line ratings, which are dependent on the likelihood of coincident adverse weather conditions and unfavourable loading levels. This approach has been applied to selected lines whose design temperature is about 100°C or less. For these lines, a contingency rating and a short-time emergency rating have been developed. Typically, the short-time rating is based on a load duration of 15 minutes, although the duration can be adjusted to suit the particular load pattern to which the line is expected to be exposed. The duration and level of loading must take into account any requirements for re-dispatch of generation or load control.
We have installed ambient condition monitors on a number of transmission lines to enable the application of real-time line conductor ratings in the generation dispatch systems.
Transformers are rated according to their specification. Provision is also made for use of the short-time capability of the transformers during the outage of a parallel transformer or transmission line.
We own 330 kV cables and these are rated according to the manufacturer’s recommendations that have been checked against an appropriate thermal model of the cable.
The rating of line terminal equipment is based on the manufacturers’ advice.
A3.7 Reactive support and voltage stability
It is necessary to maintain voltage stability, with voltages within acceptable levels, following the loss of a single element in the power system at times of maximum system loading. The single element includes a generator, a single transmission circuit, a cable and single items of reactive support plant.
To cover fluctuations in system operating conditions, uncertainties of load levels, measurement errors and errors in the setting of control operating points, it is necessary to maintain a margin from operating points that may result in a loss of voltage control. A reactive power margin is maintained over the point of voltage instability or alternatively a margin is maintained with respect to the power transfer compared to the maximum feasible power transfer.
The system voltage profile is set to standard levels during generator dispatch to minimise the need for post-contingency reactive power support.
Reactive power plant generally has a low cost relative to major transmission lines, and the incremental cost of providing additional capacity in a shunt capacitor bank can be relatively low. Such plant can also have a very high benefit/cost ratio and therefore the timing of reactive plant installations is generally less sensitive to changes in load growth than the timing of other network augmentations. Even so, we aim to make maximum use of existing reactive sources before new installations are considered.
We have traditionally assumed that all online generators can provide reactive power support within their rated capability. However, in the future intend to align with other utilities in relying only on the reactive capability given by agreed performance standards of the generator. Reactive support beyond the performance standards may need to be procured under network support arrangements.
Reactive power plant is installed to support planned power flows up to the capability defined by limit equations, and is often the critical factor determining network
capability. On the main network, allowance is made for the unavailability of a single major source of reactive power support in the critical area affected at times of high load, but not at the maximum load level.
It is also necessary to maintain control of the supply voltage to the connected loads under minimum load conditions.
The factors that determine the need for reactive plant installations are:
� In general it has proven prudent and economic to limit the voltage change between the pre- and post-contingency operating conditions;
� It has also proven prudent, in general, and economic to ensure that the post-contingency operating voltage at major 330 kV busbars lies above a lower limit;
� The reactive margin from the point of voltage collapse is maintained to be greater than a minimum acceptable level;
� A margin between the power transmitted and the maximum feasible power transmission is maintained; and
� At times of light system load, it is essential to ensure that voltages can be maintained within the system highest voltage limits of equipment.
Following forced outages, relatively large voltage changes are accepted at some locations on the main network, and agreed with customers, providing voltage stability is not placed at risk. These voltage changes can approach, and in certain cases, exceed 10% at maximum load.
On some sections of the network, the possibility of loss of load due to depressed voltages following a contingency is also accepted. However, there is a preference to install load shedding initiated by under-voltage so that the disconnection of load occurs in a controlled manner.
When determining the allowable rating of switched reactive plant, the requirements of the NER are observed.
A3.8 Transmission line voltage and conductor sizes determined by economic considerations
Consideration is given to the selection of line design voltages within the standard nominal 132 kV, 220 kV, 275 kV, 330 kV and 500 kV range, taking due account of transformation costs.
Minimum conductor sizes are governed by losses, radio interference and field strength considerations.
We strive to reduce the overall cost of energy and network services by the economic selection of line conductor size. The actual losses that occur are governed by generation dispatch in the market.
For a line whose design is governed by economic loading limits, the conductor size is determined by a rigorous consideration of capital cost versus loss costs.
Hence the impact of the development on generator and load marginal loss factors in the market is considered. For other lines, the rating requirements will determine the conductor requirements.
Double circuit lines are built in place of two single circuit lines where this is considered to be both economic and is able to provide adequate reliability. Consideration would be given to the impact of a double circuit line failure, both over relatively short terms and for extended durations. This means that supply to a relatively large load may require single rather than double circuit transmission line construction where this is environmentally acceptable.
In areas prone to bushfire, any parallel single circuit lines are preferably routed well apart to avoid the risk of simultaneous outage during a bushfire event.
94 NSW Transmission Annual Planning Report 2019 95Appendix 3 | How we plan
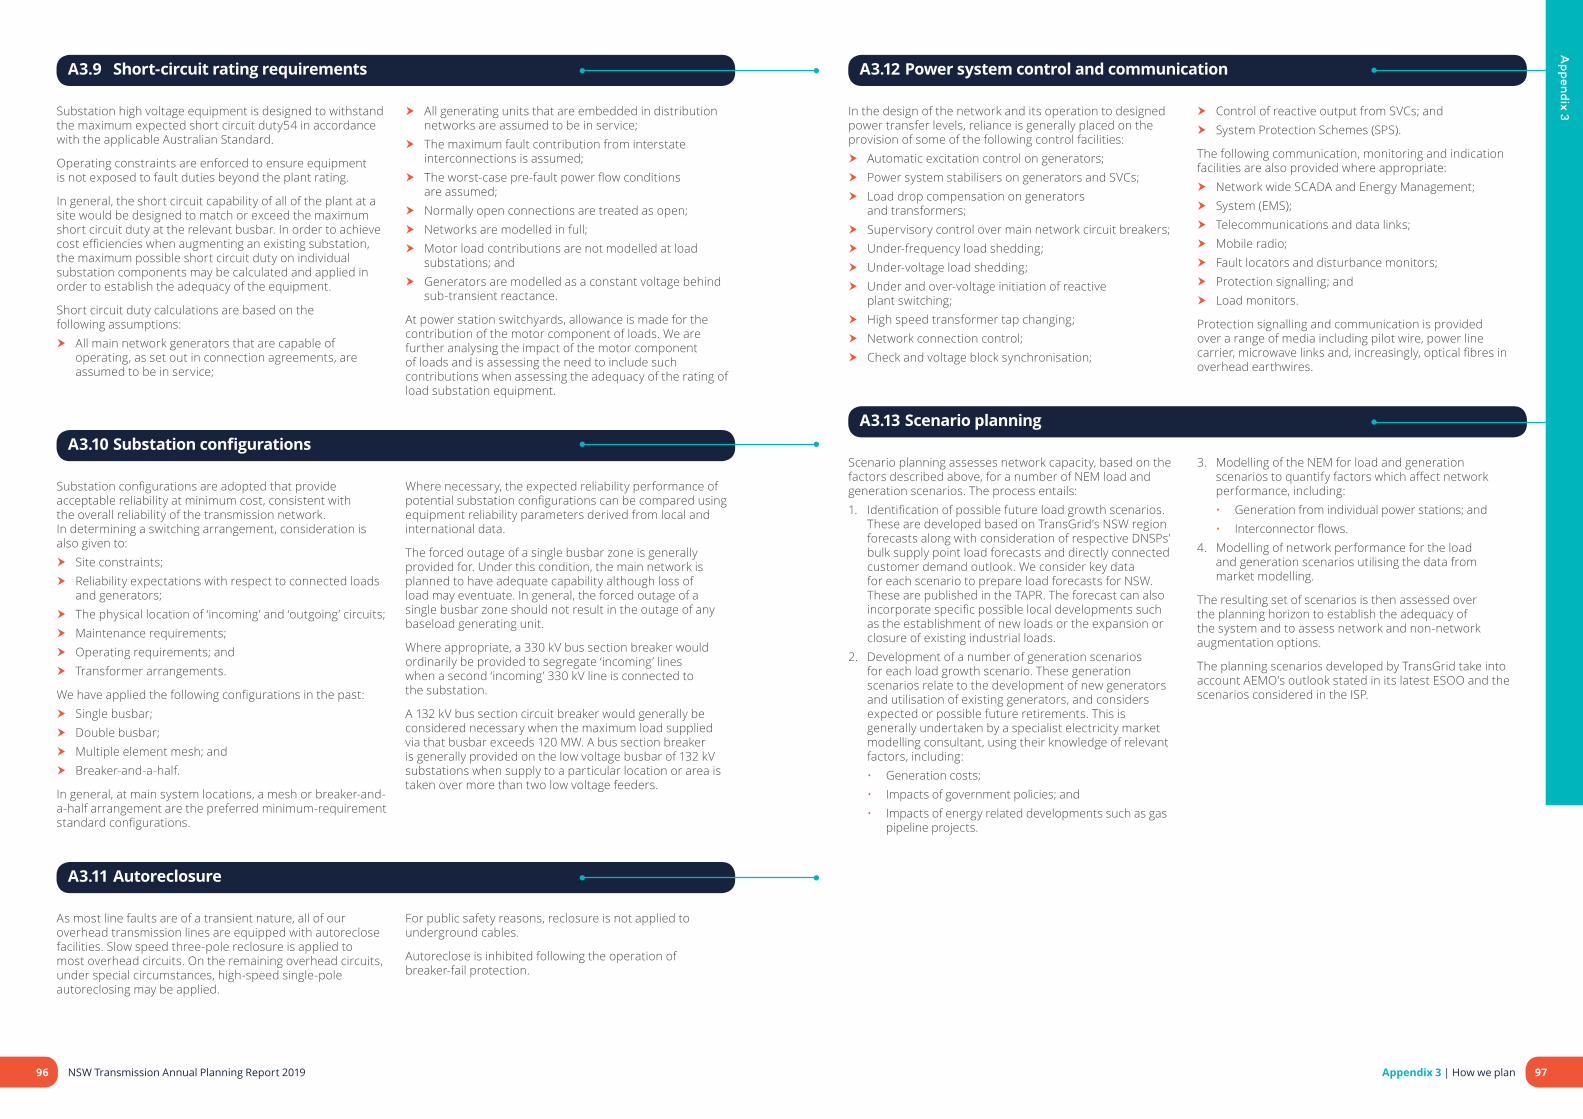
Ap
pend
ix 3
A3.9 Short-circuit rating requirements
Substation high voltage equipment is designed to withstand the maximum expected short circuit duty54 in accordance with the applicable Australian Standard.
Operating constraints are enforced to ensure equipment is not exposed to fault duties beyond the plant rating.
In general, the short circuit capability of all of the plant at a site would be designed to match or exceed the maximum short circuit duty at the relevant busbar. In order to achieve cost efficiencies when augmenting an existing substation, the maximum possible short circuit duty on individual substation components may be calculated and applied in order to establish the adequacy of the equipment.
Short circuit duty calculations are based on the following assumptions:
� All main network generators that are capable of operating, as set out in connection agreements, are assumed to be in service;
� All generating units that are embedded in distribution networks are assumed to be in service;
� The maximum fault contribution from interstate interconnections is assumed;
� The worst-case pre-fault power flow conditions are assumed;
� Normally open connections are treated as open; � Networks are modelled in full; � Motor load contributions are not modelled at load
substations; and � Generators are modelled as a constant voltage behind
sub-transient reactance.
At power station switchyards, allowance is made for the contribution of the motor component of loads. We are further analysing the impact of the motor component of loads and is assessing the need to include such contributions when assessing the adequacy of the rating of load substation equipment.
A3.10 Substation configurations
Substation configurations are adopted that provide acceptable reliability at minimum cost, consistent with the overall reliability of the transmission network. In determining a switching arrangement, consideration is also given to:
� Site constraints; � Reliability expectations with respect to connected loads
and generators; � The physical location of ‘incoming’ and ‘outgoing’ circuits; � Maintenance requirements; � Operating requirements; and � Transformer arrangements.
We have applied the following configurations in the past: � Single busbar; � Double busbar; � Multiple element mesh; and � Breaker-and-a-half.
In general, at main system locations, a mesh or breaker-and-a-half arrangement are the preferred minimum-requirement standard configurations.
Where necessary, the expected reliability performance of potential substation configurations can be compared using equipment reliability parameters derived from local and international data.
The forced outage of a single busbar zone is generally provided for. Under this condition, the main network is planned to have adequate capability although loss of load may eventuate. In general, the forced outage of a single busbar zone should not result in the outage of any baseload generating unit.
Where appropriate, a 330 kV bus section breaker would ordinarily be provided to segregate ‘incoming’ lines when a second ‘incoming’ 330 kV line is connected to the substation.
A 132 kV bus section circuit breaker would generally be considered necessary when the maximum load supplied via that busbar exceeds 120 MW. A bus section breaker is generally provided on the low voltage busbar of 132 kV substations when supply to a particular location or area is taken over more than two low voltage feeders.
A3.11 Autoreclosure
As most line faults are of a transient nature, all of our overhead transmission lines are equipped with autoreclose facilities. Slow speed three-pole reclosure is applied to most overhead circuits. On the remaining overhead circuits, under special circumstances, high-speed single-pole autoreclosing may be applied.
For public safety reasons, reclosure is not applied to underground cables.
Autoreclose is inhibited following the operation of breaker-fail protection.
A3.12 Power system control and communication
In the design of the network and its operation to designed power transfer levels, reliance is generally placed on the provision of some of the following control facilities:
� Automatic excitation control on generators; � Power system stabilisers on generators and SVCs; � Load drop compensation on generators
and transformers; � Supervisory control over main network circuit breakers; � Under-frequency load shedding; � Under-voltage load shedding; � Under and over-voltage initiation of reactive
plant switching; � High speed transformer tap changing; � Network connection control; � Check and voltage block synchronisation;
� Control of reactive output from SVCs; and � System Protection Schemes (SPS).
The following communication, monitoring and indication facilities are also provided where appropriate:
� Network wide SCADA and Energy Management; � System (EMS); � Telecommunications and data links; � Mobile radio; � Fault locators and disturbance monitors; � Protection signalling; and � Load monitors.
Protection signalling and communication is provided over a range of media including pilot wire, power line carrier, microwave links and, increasingly, optical fibres in overhead earthwires.
A3.13 Scenario planning
Scenario planning assesses network capacity, based on the factors described above, for a number of NEM load and generation scenarios. The process entails:1. Identification of possible future load growth scenarios.
These are developed based on TransGrid’s NSW region forecasts along with consideration of respective DNSPs’ bulk supply point load forecasts and directly connected customer demand outlook. We consider key data for each scenario to prepare load forecasts for NSW. These are published in the TAPR. The forecast can also incorporate specific possible local developments such as the establishment of new loads or the expansion or closure of existing industrial loads.
2. Development of a number of generation scenarios for each load growth scenario. These generation scenarios relate to the development of new generators and utilisation of existing generators, and considers expected or possible future retirements. This is generally undertaken by a specialist electricity market modelling consultant, using their knowledge of relevant factors, including:• Generation costs;• Impacts of government policies; and• Impacts of energy related developments such as gas
pipeline projects.
3. Modelling of the NEM for load and generation scenarios to quantify factors which affect network performance, including:• Generation from individual power stations; and• Interconnector flows.
4. Modelling of network performance for the load and generation scenarios utilising the data from market modelling.
The resulting set of scenarios is then assessed over the planning horizon to establish the adequacy of the system and to assess network and non-network augmentation options.
The planning scenarios developed by TransGrid take into account AEMO’s outlook stated in its latest ESOO and the scenarios considered in the ISP.
96 NSW Transmission Annual Planning Report 2019 97Appendix 3 | How we plan

Ap
pend
ix 3
A3.14 Asset management approach
Our Asset Management System (AMS) manages our transmission network assets over their entire lifecycle. The AMS covers management of assets from the planning stage through the build/acquire, operate, maintain, renew and decommissioning stages. Our approach to asset management encompasses our jurisdictional requirements and obligations to meet the service level requirements of our customers, consumers and other stakeholders. Development of our asset renewal program involves assessment of the most economic combination of replacement and refurbishment options.
The AMS has been developed in accordance with the principles of ISO 55001, the international standard for asset management. TransGrid has obtained external certification43 that this system meets or exceeds the requirements of ISO 55001.
The following figure illustrates our AMS structure under ISO 55001.
Figure 49 – Asset Management System (AMS)
TransGrid Business PlanStakeholderNeeds and
Expectations
OtherManagement
Systems
AssetManagement
Policy
Network Vision/Development Strategy
(future state)
Asset Management Strategies and Objectives
Asset Class Strategies
Asset Plans
Optimisation and Delivery
Asse
t Man
agem
ent S
yste
m E
nabl
ers
Monitoring and Review
(current state)
Procedures and Guidelines
Corporate Framew
ork
The decision-making processes within our AMS have improved through the development of a quantified methodology for assessing risk. This risk assessment methodology combines an understanding of the failure behaviour of an asset (the likelihood), and the expected consequences of failure (the consequence), to value the risk associated with an asset in monetary terms.
This risk management approach ensures that we are managing our significant risks as so far as practicable, or where this is not possible as low as reasonably practicable. The processes for managing key safety risks under this framework are described in our Electricity Network Safety Management System.
43 Currently the certification covers the extent of our prescribed NSW-based assets under our NSW operating licence. In practice, we apply the same processes and procedures to all our physical asset related activities.
98 NSW Transmission Annual Planning Report 2019 99Appendix 3 | How we plan

Ap
pend
ix 4
Appendix 4
Line utilisation report
This report sets out our transmission line utilisation for the period from 1 April 2018 to 31 March 2019.
A4.1 Line utilisation report
The line loading information from 1 April 2018 to 31 March 2019 was obtained from AEMO’s Operation Planning and Data Management System (OPDMS). This system produces half hourly system load flow models (snapshots) of the NEM.
For each half-hour period, the utilisation (loading) of each line was calculated as a proportion of the relevant rating.
The highest values of these proportions are reported here.
The utilisation of each line was calculated based on two conditions:1. With all network elements in service, referred to as the
‘N utilisation’. These utilisation figures are based on normal line ratings
2. With the most critical credible contingency (usually an outage of another line in the area), referred to as the ‘N–1 utilisation’. These utilisation figures are based on the line contingency ratings.
The N utilisation and N–1 utilisation of the transmission lines in the NSW transmission network are shown in Figures 51–58. For each line, the utilisations are shown in the box placed adjacent to the line. The box shows:A. The transmission line numberB. The maximum N utilisation of the transmission lineC. The maximum N–1 utilisation of the transmission lineD. The identity of the line that creates the critical
contingency in the event of an outage.
The box layout is shown in Figure 50.
Figure 50 – Key to interpreting the information shown in Figures 50 to 57
A – Line number: B – Maximum N Utilisation % C – Maximum N–1 Utilisation % [D – Line number out for N–1]
In some situations, the N–1 utilisation has been estimated to be more than 100%. These situations could be because of:
� A higher level of line loading being allowed, considering the operational line overloading control schemes, runback schemes available for managing the line loadings, and generation re-dispatch capability by AEMO
� The predicted dispatch conditions that change over the five-minute dispatch period, causing the line loadings to increase above the predicted values.
101Appendix 4 | Line utilisation report

Ap
pend
ix 4
Figure 51 – TransGrid N and N–1 line utilisations – Sydney and Newcastle
Regentville
Sydney South
Liverpool
Ingleburn
to Bannaby
Haymarket
Macarthur
toWallerawang
to Daptoto Avon
Beaconsfield
Holroyd
Rookwood Road
Eraring
Vales Point
Vineyard
to Liddell
KempsCreek
Tomago
Munmorah
Tuggerah
Sydney East
NewcastleWaratah West
Sydney North
MountColah
Brandy Hill
to Bayswater
Sydney West
5A1
5A2
32 31
8281
94
96
9W
82
95
90
92
93
26
2M
2492
23
25 22
21
29
14 20
38
32
30
14
1312 41
42
11
7678
76
39
17
37
2795992Z
28
26
77
4443
1F
1C
Key
Line No: N Util %.N-1 Util. % [Critical Outage Line No]
17: 4759 [11]
77: 5362 [76]
76: 5169 [77]
37: 3546 [13]
78: 3837 [76]
11: 4666 [37]
41:81101 [42]
42: 7164 [41]
12: 3640 [30]
13: 5058 [37]
30: 4056 [13]
39: 7881 [17]
38: 4257 [32] 1F: 27
44 [1C]
20: 3355 [14]
14: 4454 [13]
26: 3135 [22]
25: 4246 [23]
22: 4973 [23] 21: 33
36 [22]
32: 82101 [31]
31: 5972 [32]
5A2: 5654 [5A1]
82: 5770 [81]
81: 6476 [82]
93: 4260 [90]92: 23
25 [23]90: 4977 [93]
24: 3641 [93]
2M: 4750 [22]
23: 7987 [22]
95: 2734 [94]
94: 2935 [96]96: 3042 [95]
9W: 2134 [94]
5A1: 5654 [5A2]
28: 3357 [27]
27: 3557 [28]
959: 2325 [92Z]
92Z(1): 1922 [21]
92Z(2): 3335 [959]
43: 2933 [44]
1C: 2744 [1F]
44: 2933 [43]
29: 2423 [26]
Figure 52 – TransGrid N and N–1 line utilisations – North East NSW and Northern NSW
Wellington
Mt Piper
Wollar
Liddell
Muswellbrook
Tamworth
Armidale
Coffs Harbour
Sapphire
DumaresqLismore
Directlink
Mudgeeraba
Bulli Creek
Bayswater
8E
8C
89
87
86
85
88
84
83
5A3
5A5
81
82
31
32
72
79 5A4
8J
Key
Line No: N Util %.N-1 Util. % [Critical Outage Line No]
72: 1433 [79]
5A5: 1931 [5A3]
5A3: 2235 [5A4]
31: 5972 [32] 32: 82
101 [31]
81: 6476 [82]
82: 5770 [81]
83: 5799 [84]
5A4: 2637 [5A3]
79: 2738 [5A5]
33: 4469 [34]
34: 4469 [33]
88: 59110 [84]
84: 58109 [88]
86: 4881 [85]
8E: 4080 [8C]
85: 4881 [86]
87: 3538 [965]
89: 1516 [96R]
8C: 6088 [8J]
8J: 4073 [8C]
102 NSW Transmission Annual Planning Report 2019 103Appendix 4 | Line utilisation report

Ap
pend
ix 4
Figure 53 – TransGrid N and N–1 line utilisations – South and South East
Darlington Point
Wagga
Jindera
Wodonga
Dederang
LowerTumut
UpperTumut
Murray
Williamsdale
Canberra
Marulan
Kangaroo Valley
Dapto
AvonBannaby
Mt Piper
Wellington
Wollar
Bayswater Liddell
Wallerawang
GullenRange
Crookwell 2
Yass
CapitalWind Farm
INSET
5A6 5A7 77
72
79
76
61
3J
5A5
5A3
5A4
32 31
81
82
8384
39
18
16
5
4
923
97
01
07051
3W
6
3C
17 11
10
8
66 65
64
63
62
060
Key
Line No: N Util %.N-1 Util. % [Critical Outage Line No]
63: 4144 [99F]
3: 7588 [07]
2: 5782 [3]
9: 4656 [18]
61: 5474 [4]
5A6: 1934 [5A7]
5A7: 1934 [5A6]
3J: 5460 [18]
3H: 4868 [4]
051: 6355 [65]
64: 5361 [65]
66: 62125 [65] 65: 87
129 [66]
07: 76100 [3] 01: 67
89 [07]
6: 5157 [9]
3W: 5560 [9]
8: 5660 [16]
18: 7475 [9]
39: 7881 [17]
70: 5185 [71]
72: 1433 [79]
79: 2738 [5A5]
5A3: 2235 [5A4]
5A5: 1931 [5A3]
31: 5972 [32] 81: 64
76 [82]
82: 5770 [81]
83: 5799 [84]
84: 58109 [88]
5A4: 2637 [5A3]
32: 82101 [31]
71: 5085 [70]
5: 8088 [4]
4: 8491 [61]
10: 2952 [8]
16: 5663 [8]
3C: 140 [-]
62: 3542 [X5/1]
060: 5054 [65]
Figure 54 – TransGrid N and N–1 line utilisations – Far West
Broken Hill
Buronga
BalranaldDarlington Point
Red Cliffs
X5/1
63
X5/3
X2
OX1
Key
Line No: N Util %.N-1 Util. % [Critical Outage Line No]
X2: 910 [-]
OX1: 4960 [O60]
X5/3: 5568 [O60]
X5/1: 3949 [O60] 63: 41
44 [99F]
104 NSW Transmission Annual Planning Report 2019 105Appendix 4 | Line utilisation report
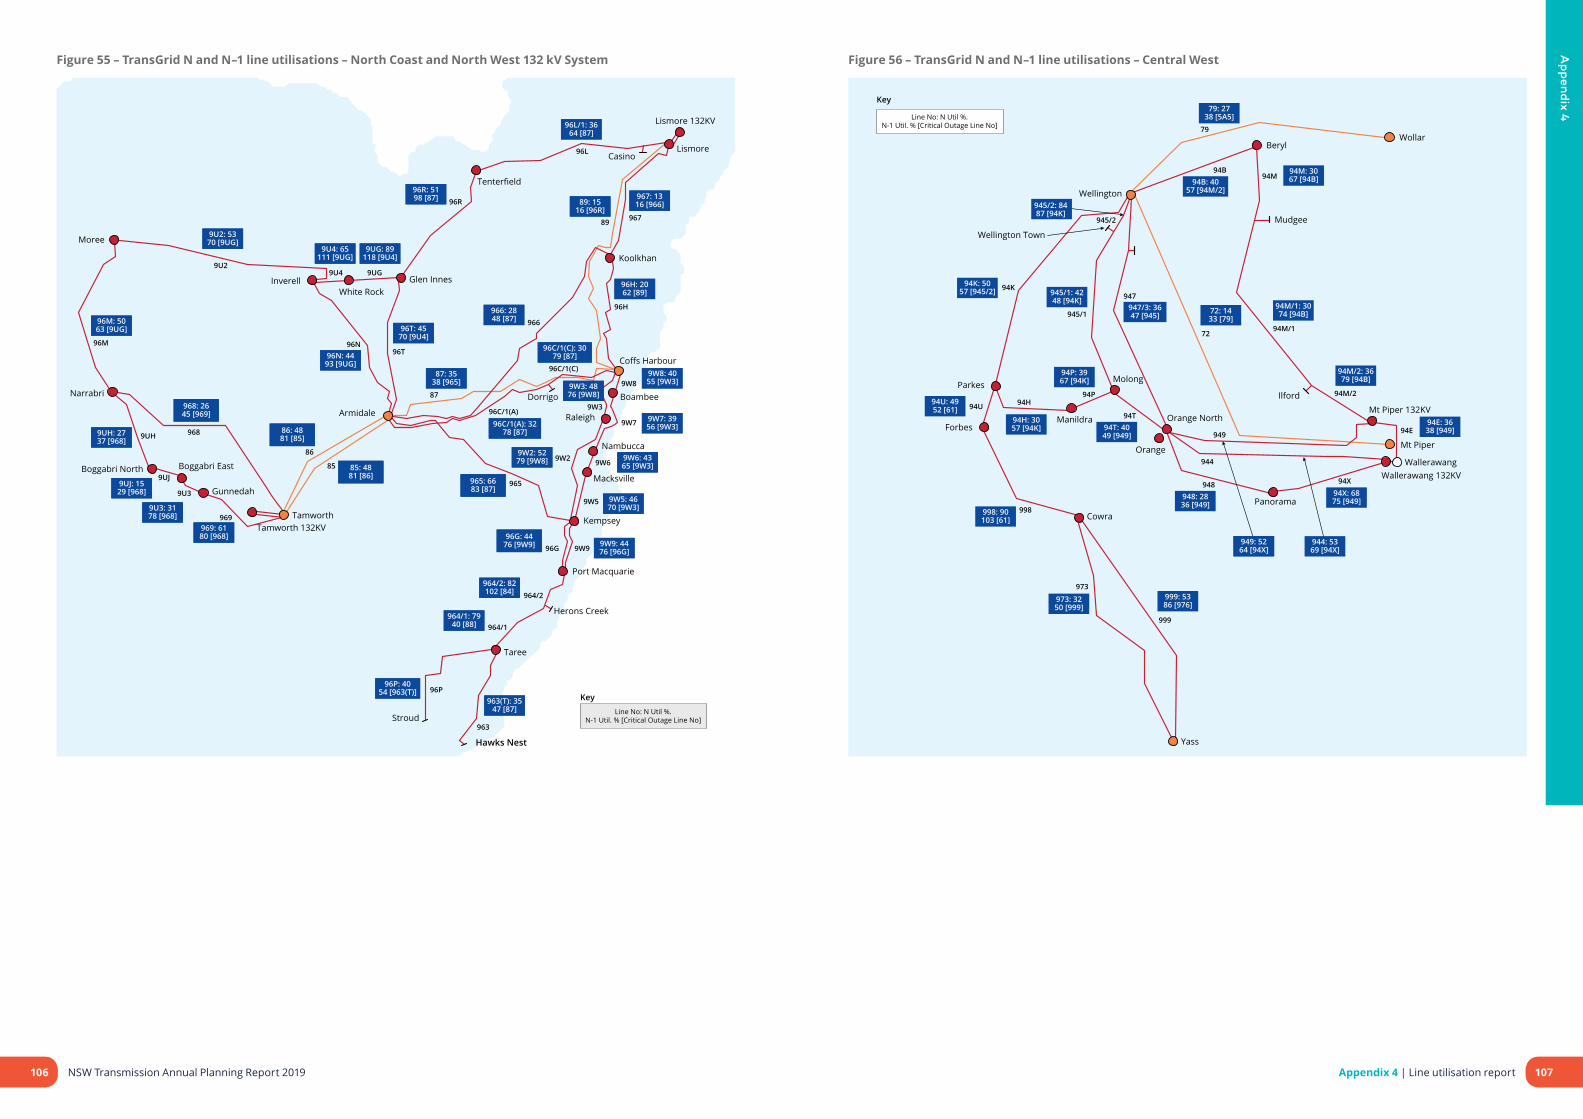
Ap
pend
ix 4
Figure 55 – TransGrid N and N–1 line utilisations – North Coast and North West 132 kV System
Moree
Narrabri
Boggabri North Boggabri East
Gunnedah
Tamworth 132KVTamworth
Armidale Raleigh
Boambee
Nambucca
Macksville
Kempsey
Port Macquarie
Herons Creek
Taree
Stroud
Hawks Nest
Coffs Harbour
Dorrigo
InverellWhite Rock
Glen Innes
Tenterfield
CasinoLismore
Lismore 132KV
Koolkhan9U4
9U2
96N
968
96M
9UJ
9U3
969
86
85
87
965
966
96T
96C/1(A)
96G 9W9
964/1
96R
96L
96789
9W2
9W5
96H
9W8
9W3
9W7
9W6
96P
963
964/2
9UH
96C/1(C)
9UG
Key
Line No: N Util %.N-1 Util. % [Critical Outage Line No]
96M: 5063 [9UG]
9UH: 2737 [968]
9UJ: 1529 [968]
9U3: 3178 [968]
969: 6180 [968]
86: 4881 [85]
96N: 4493 [9UG]
96T: 4570 [9U4]
87: 3538 [965] 9W3: 48
76 [9W8]
9W2: 5279 [9W8]
9W8: 4055 [9W3]
9W7: 3956 [9W3]
9W6: 4365 [9W3]
9W5: 4670 [9W3]
9W9: 4476 [96G]
964/2: 82102 [84]
964/1: 7940 [88]
963(T): 3547 [87]
96P: 4054 [963(T)]
965: 6683 [87]
966: 2848 [87]
96C/1(A): 3278 [87]
9U2: 5370 [9UG]
9U4: 65111 [9UG]
9UG: 89118 [9U4]
96R: 5198 [87]
96L/1: 3664 [87]
967: 1316 [966]89: 15
16 [96R]
96H: 2062 [89]
85: 4881 [86]
968: 2645 [969]
96C/1(C): 3079 [87]
96G: 4476 [9W9]
Figure 56 – TransGrid N and N–1 line utilisations – Central West
Parkes
ForbesManildra
Molong
Wellington Town
Wellington
Beryl
Mudgee
Wollar
Orange North
Orange
Cowra
Yass
IlfordMt Piper 132KV
Mt Piper
Panorama
Wallerawang 132KVWallerawang
94H
94E
973
999
998
94U
94K
945/1
947
94X
7294M/1
79
94B
94M/2
94M
945/2
949
944
948
94T
94P
Key
Line No: N Util %.N-1 Util. % [Critical Outage Line No]
79: 2738 [5A5]
94B: 4057 [94M/2]
94M: 3067 [94B]
94M/1: 3074 [94B]
945/2: 8487 [94K]
945/1: 4248 [94K]
947/3: 3647 [945]
94K: 5057 [945/2]
94P: 3967 [94K]
94U: 4952 [61]
94T: 4049 [949]
94H: 3057 [94K]
998: 90103 [61]
948: 2836 [949]
973: 3250 [999]
999: 5386 [976]
949: 5264 [94X]
944: 5369 [94X]
94X: 6875 [949]
94E: 3638 [949]
94M/2: 3679 [94B]
72: 1433 [79]
106 NSW Transmission Annual Planning Report 2019 107Appendix 4 | Line utilisation report

Ap
pend
ix 4
Figure 57 – TransGrid N and N–1 line utilisations – South East
Wagga North
Wagga
GadaraTumut
Burrinjuck
Yass
Murrumbateman
Queanbeyan
Williamsdale
Upper Tumut
Murray
Geehi
Snowy Adit
MunyangGuthega
AlburyHume
ANMJindera
Morven
Cooma
Lower Tumut
Canberra
Wagga 132KV
Murrumburrah
6566
64
07
3
051
99B
99H
62
996/1
970
99299P
993
990
99M991
9R6
9R5
99W 99X
995
996/2
97897D
3C
977/3
976/1
97K/1
01
2
97G/1
97K/2
979
9
97G/3
Key
Line No: N Util %.N-1 Util. % [Critical Outage Line No]
99B: 3367 [99H]
99H: 5186 [99B] 996/1: 46
87 [62]
62: 3542 [X5/1]
99W: 5892 [99X] 99X: 68
111 [99W]
9R6: 37100 [9R5]
9R5: 76101 [9R6]
991: 6069 [051]
990: 7179 [051]
01: 6789 [07]
66: 62125 [65]
65: 87129 [66]
978: 2039 [97D]
97D: 1734 [978]
97K/1: 300 [-]
97G/1: 900 [-] 97K/2: 30
0 [-]
97G/3: 900 [-]
979: 240 [-]
977/3: 4390 [976/1(Q)]
976/1(Q): 4390 [977/1]
3: 7588 [07]
99M: 4778 [051]
970: 71102 [051]
2: 5782 [3]
9: 4656 [18]993: 81
91 [051]
995: 420 [-]
3C: 140 [-]
99P: 6667 [051]
07: 76100 [3]
64: 5361 [65]
051: 6355 [65]
992: 6174 [051]
996/2: 5192 [62]
Figure 58 – TransGrid N and N–1 line utilisations – South West
Griffith
Darlington Point
Coleambally
Finley
Deniliquin
Yanco
WaggaNorth
Wagga 132KV
WaggaUranquinty99L
99T
9R3
99A
63994
99F
99K99J
9R6
9R2 9R1
99D
99X
99W
9R5
Key
Line No: N Util %.N-1 Util. % [Critical Outage Line No]
9R3: 2750 [99T]
99L: 3492 [99T]
99T: 104111 [99L]
99F: 60111 [63]
99K: 4374 [99J]
99D: 4782 [63]
63: 4144 [99F]
99A: 4454 [99T]
9R6: 37100 [9R5]
9R5: 76101 [9R6]
99X: 68111 [99W]
99W: 5892 [99X]
9R2: 5695 [9R1]
9R1: 5690 [9R2]
994: 3168 [63]
99J: 4161 [99K]
108 NSW Transmission Annual Planning Report 2019 109Appendix 4 | Line utilisation report

Ap
pend
ix 4
Summary of the N–1 utilisation of the transmission lines in the TransGrid’s networkThe distribution of the N-1 utilisation of the transmission lines across our network is shown in Figure 59.
The distribution shows that approximately 10% of the transmission lines in the network are utilised at more than their installed maximum capacity and over half of the lines are utilised at more than 65% of their installed capacity.
The distribution of the N–1 line utilisations reflects at least 40 years of planning history of the transmission network. It is considered to be typical of a well-planned network where various parts of the network are well-established, while other parts have had recent step augmentations that will be further utilised in future years.
Figure 59 – Distribution of TransGrid N–1 utilisations (1 April 2018-31 March 2019)
0
10
20
30
40
50
60
70
80
90
100
110
120
130
140
150
% N-1 (NSW)
0 10 20 30 40 50 60 70 80 90 100
MA
XIM
UM
N-1
UTI
LISA
TIO
N(%
OF
CON
TIN
GEN
CY
RAT
ING
)
110 NSW Transmission Annual Planning Report 2019 111Appendix 4 | Line utilisation report
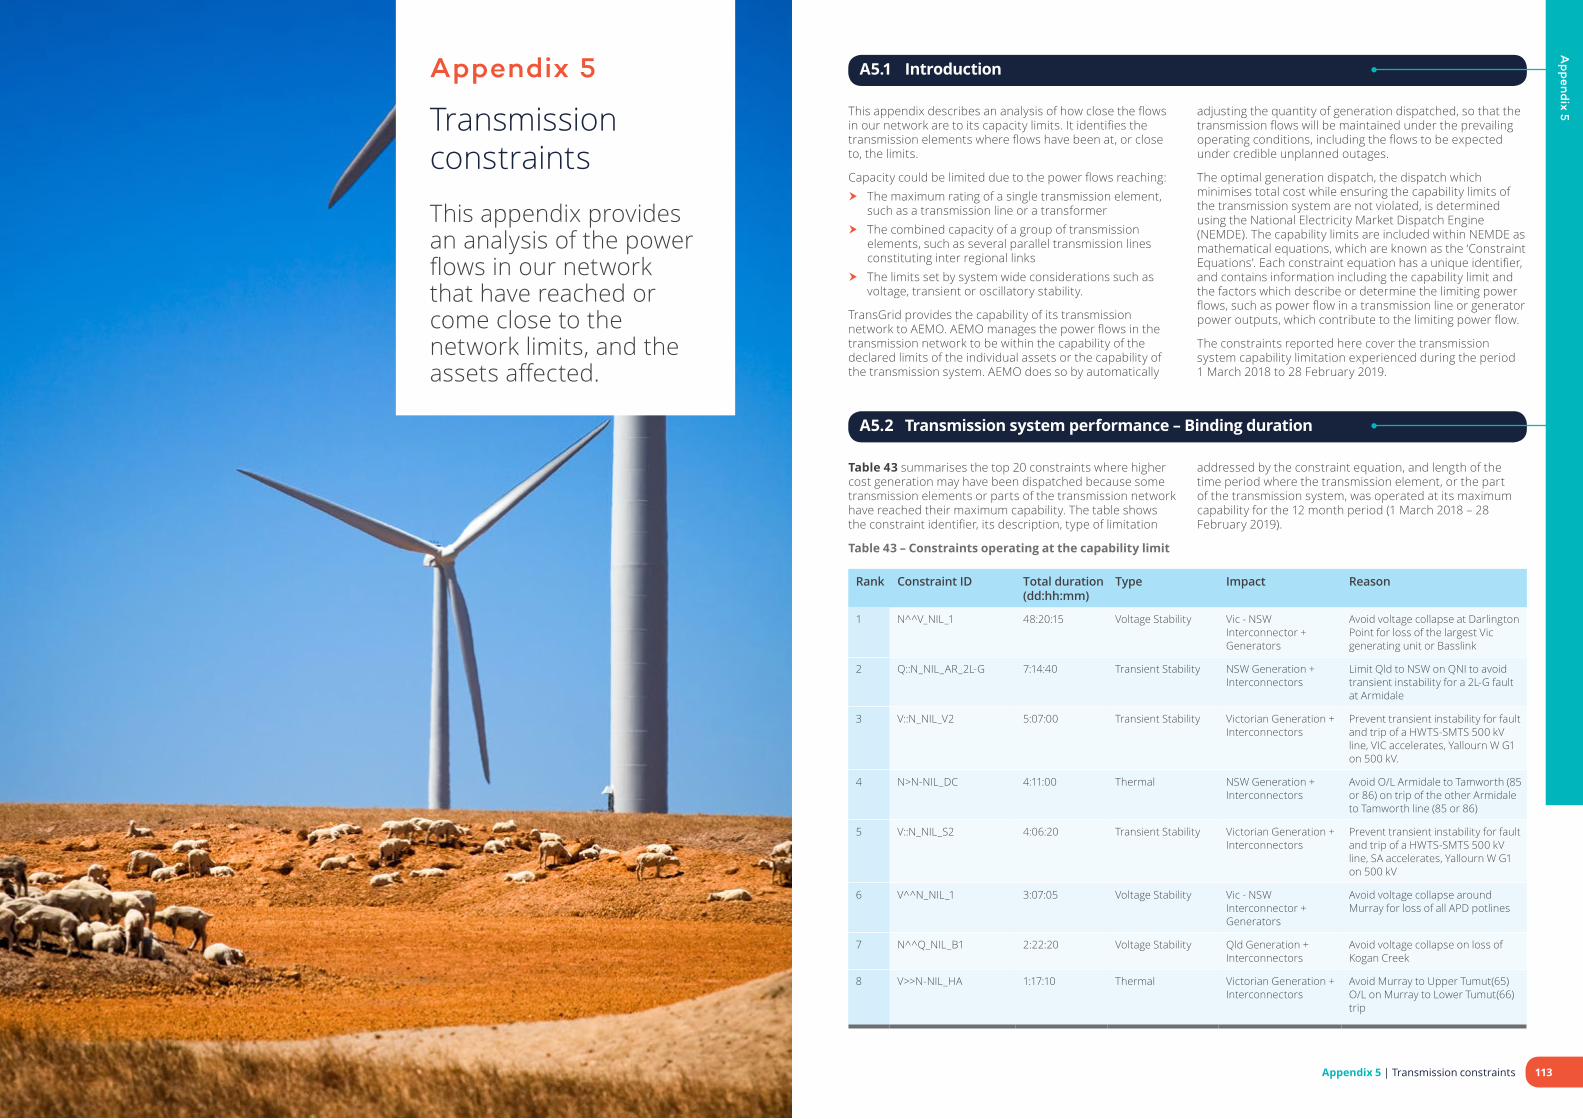
Ap
pend
ix 5
A5.1 Introduction
This appendix describes an analysis of how close the flows in our network are to its capacity limits. It identifies the transmission elements where flows have been at, or close to, the limits.
Capacity could be limited due to the power flows reaching: � The maximum rating of a single transmission element,
such as a transmission line or a transformer � The combined capacity of a group of transmission
elements, such as several parallel transmission lines constituting inter regional links
� The limits set by system wide considerations such as voltage, transient or oscillatory stability.
TransGrid provides the capability of its transmission network to AEMO. AEMO manages the power flows in the transmission network to be within the capability of the declared limits of the individual assets or the capability of the transmission system. AEMO does so by automatically
adjusting the quantity of generation dispatched, so that the transmission flows will be maintained under the prevailing operating conditions, including the flows to be expected under credible unplanned outages.
The optimal generation dispatch, the dispatch which minimises total cost while ensuring the capability limits of the transmission system are not violated, is determined using the National Electricity Market Dispatch Engine (NEMDE). The capability limits are included within NEMDE as mathematical equations, which are known as the ‘Constraint Equations’. Each constraint equation has a unique identifier, and contains information including the capability limit and the factors which describe or determine the limiting power flows, such as power flow in a transmission line or generator power outputs, which contribute to the limiting power flow.
The constraints reported here cover the transmission system capability limitation experienced during the period 1 March 2018 to 28 February 2019.
A5.2 Transmission system performance – Binding duration
Table 43 summarises the top 20 constraints where higher cost generation may have been dispatched because some transmission elements or parts of the transmission network have reached their maximum capability. The table shows the constraint identifier, its description, type of limitation
addressed by the constraint equation, and length of the time period where the transmission element, or the part of the transmission system, was operated at its maximum capability for the 12 month period (1 March 2018 – 28 February 2019).
Table 43 – Constraints operating at the capability limit
Rank Constraint ID Total duration (dd:hh:mm)
Type Impact Reason
1 N^^V_NIL_1 48:20:15 Voltage Stability Vic - NSW Interconnector + Generators
Avoid voltage collapse at Darlington Point for loss of the largest Vic generating unit or Basslink
2 Q::N_NIL_AR_2L-G 7:14:40 Transient Stability NSW Generation + Interconnectors
Limit Qld to NSW on QNI to avoid transient instability for a 2L-G fault at Armidale
3 V::N_NIL_V2 5:07:00 Transient Stability Victorian Generation + Interconnectors
Prevent transient instability for fault and trip of a HWTS-SMTS 500 kV line, VIC accelerates, Yallourn W G1 on 500 kV.
4 N>N-NIL_DC 4:11:00 Thermal NSW Generation + Interconnectors
Avoid O/L Armidale to Tamworth (85 or 86) on trip of the other Armidale to Tamworth line (85 or 86)
5 V::N_NIL_S2 4:06:20 Transient Stability Victorian Generation + Interconnectors
Prevent transient instability for fault and trip of a HWTS-SMTS 500 kV line, SA accelerates, Yallourn W G1 on 500 kV
6 V^^N_NIL_1 3:07:05 Voltage Stability Vic - NSW Interconnector + Generators
Avoid voltage collapse around Murray for loss of all APD potlines
7 N^^Q_NIL_B1 2:22:20 Voltage Stability Qld Generation + Interconnectors
Avoid voltage collapse on loss of Kogan Creek
8 V>>N-NIL_HA 1:17:10 Thermal Victorian Generation + Interconnectors
Avoid Murray to Upper Tumut(65) O/L on Murray to Lower Tumut(66) trip
Appendix 5
Transmission constraints
This appendix provides an analysis of the power flows in our network that have reached or come close to the network limits, and the assets affected.
113Appendix 5 | Transmission constraints

Ap
pend
ix 5
Table 44 – Marginal value of binding constraints
Rank Constraint ID Sum of Marginal Values
Total duration (dd:hh:mm)
Type Impact Reason
1 N^^V_NIL_1 $3,374,369.54 48:20:15 Voltage Stability
Vic - NSW Interconnector + Generators
Avoid voltage collapse at Darlington Point for loss of the largest Vic generating unit or Basslink
2 Q::N_NIL_AR_2L-G $165,486.74 7:14:40 Transient Stability
NSW Generation + Interconnectors
Limit Qld to NSW on QNI to avoid transient instability for a 2L-G fault at Armidale
3 V^^N_NIL_1 $67,951.82 3:07:05 Voltage Stability
Vic - NSW Interconnector + Generators
Avoid voltage collapse around Murray for loss of all APD potlines
4 N>N-NIL_DC $56,512.47 4:11:00 Thermal NSW Generation + Interconnectors
Avoid O/L Armidale to Tamworth (85 or 86) on trip of the other Armidale to Tamworth line (85 or 86)
5 N>>N-NIL_996_IN $51,269.04 0:00:20 Thermal NSW Generation + Interconnectors
Avoid Wagga to ANM(996) O/L on Wagga to Jindera (62) trip
6 V::N_NIL_S2 $47,771.01 4:06:20 Transient Stability
Victorian Generation + Interconnectors
Prevent transient instability for fault and trip of a HWTS-SMTS 500 kV line, SA accelerates, Yallourn W G1 on 500 kV
7 N^^N_NIL_1 $43,859.08 0:01:35 Voltage Stability
Vic - NSW Interconnector + Generators
Northerly flow on line 01,2,3 and 07 cut-set voltage stability limit
8 V::N_NIL_V2 $42,844.22 5:07:00 Transient Stability
Victorian Generation + Interconnectors
Prevent transient instability for fault and trip of a HWTS-SMTS 500 kV line, VIC accelerates, Yallourn W G1 on 500 kV
9 V>>N-NIL_HA $31,850.36 1:17:10 Thermal Victorian Generation + Interconnectors
Avoid Murray to Upper Tumut (65) O/L on Murray to Lower Tumut (66) trip
10 V>>N-NIL_HG $30,589.24 0:17:15 Thermal Victorian Generation + Interconnectors
Avoid Murray to Upper Tumut (65) O/L on Nil trip
11 N^^Q_NIL_B1 $18,158.34 2:22:20 Voltage Stability
Qld Generation + Interconnectors
Avoid Voltage Collapse on loss of Kogan Creek
12 N>>N-NIL_1G $16,285.65 0:04:10 Thermal NSW Generation + Interconnectors
Avoid O/L Vales Point to Munmorah (23) on trip of Vales Point to Sydney North (22) line
13 N^^V_NIL_MAXG_PP_N-2
$13,223.99 0:19:25 Voltage Stability
Vic - NSW Interconnector + Generators
Avoid voltage collapse at Darlington Point for loss of the largest Vic generating unit + Pelican Point when they declared as single credible contingency
14 N_NIL_TE_B $5,768.48 0:12:45 Other Terranora Interconnector
Terranora Interconnector Qld to NSW flow overall limits
15 V::N_NIL_V1 $5,564.28 0:17:05 Transient Stability
Victorian Generation + Interconnectors
Prevent transient instability for fault and trip of a HWTS-SMTS 500 kV line, VIC accelerates, Yallourn W G1 on 220 kV
16 N>>V-NIL_O $4,799.19 0:13:50 Thermal Vic - NSW Interconnector + Generators
Avoid overloading Upper Tumut to Murray (65) using 15 minute rating line on trip of Lower Tumut to Wagga (051) + 970,990,99M (out of Yass) line
Rank Constraint ID Total duration (dd:hh:mm)
Type Impact Reason
9 N>LSDU9U6_LSDU9U7 0:21:50 Thermal Terranora Interconnector
O/L 9U7/L @LISM132 for CTG LN9X on trip of LISM132-DUNOON 9U6/L 132 kV line
10 N^^V_NIL_MAXG_PP_N-2
0:19:25 Voltage Stability Vic - NSW Interconnector + Generators
Avoid voltage collapse at Darlington Point for loss of the largest Vic generating unit + Pelican Point when they declared as single credible contingency
11 V>>N-NIL_HG 0:17:15 Thermal Victorian Generation + Interconnectors
Avoid Murray to Upper Tumut(65) O/L on Nil trip
12 V::N_NIL_V1 0:17:05 Transient Stability Victorian Generation + Interconnectors
Prevent transient instability for fault and trip of a HWTS-SMTS 500 kV line, VIC accelerates, Yallourn W G1 on 220 kV
13 N>>V-NIL_O 0:13:50 Thermal Vic - NSW Interconnector + Generators
Avoid overloading Upper Tumut to Murray (65) using 15 minute rating line on trip of Lower Tumut to Wagga (051) + 970,990,99M (out of Yass) line
14 N_NIL_TE_B 0:12:45 Other Terranora Interconnector
Terranora Interconnector Qld to NSW flow overall limits
15 N>N-NIL_LSDU 0:07:35 Thermal Terranora Interconnector
Avoid overloading Lismore to Dunoon line (9U6 or 9U7) on trip of the other Lismore to Dunoon line (9U7 or 9U6)
16 N>>N-NIL__G_15M 0:05:55 Thermal Vic - NSW Interconnector + Generators
Avoid O/L Upper Tumut to Yass (2) using 15 minute rating on trip of Lower Tumut to Yass (3) line
17 N>N-NIL_TE_E1 0:05:40 Thermal Terranora Interconnector
Avoid Armidale to Coffs Harbour (96C) O/L on Armidale-Coffs Harbour(87) trip
18 V::N_NIL_SD 0:04:55 Transient Stability Victorian Generation + Interconnectors
Prevent transient instability for fault and trip of a HWTS-SMTS 500 kV line, SA decelerates. Constraint active for SA flows above 500 MW VIC to SA only, swamped otherwise.
19 N>N-NIL_MBDU 0:04:35 Thermal Terranora Interconnector
Avoid overloading Mullumbimby to Dunoon line (9U6 or 9U7) on trip of the other Mullumbimby to Dunoon line (9U7 or 9U6)
20 N>>N-NIL_1G 0:04:10 Thermal NSW Generation + Interconnectors
Avoid O/L Vales Point to Munmorah (23) on trip of Vales Point to Sydney North (22) line
The constraints listed in the tables above are reviewed by TransGrid to fully understand their nature, and to provide possible solutions to reduce the market impact of the transmission constraints. The solutions for highly ranked
constraints impacting the generators, NSW-QLD and VIC-NSW interconnectors are included in our proposed major developments and in subsystem developments described in Sections 2.2 and 2.3 respectively.
A5.3 Transmission system performance – Market Impact
Table 44 summarises the constraints with the 20 highest market impacts, measured by the marginal value. The table shows the constraint identifier, its description, type of limitation addressed by the constraint equation, the sum of the marginal values of the constraint binding and length of
the time period where the transmission element, or the part of the transmission system, was operated at its maximum capability for the 12 month period (1 March 2017 to 28 February 2019).
114 NSW Transmission Annual Planning Report 2019 115Appendix 5 | Transmission constraints

Ap
pend
ix 5
A5.4.1 Maximum demand event in New South Wales
Figure 60 – NEM overview map on Thursday 31 January 2019 at 16:30
Queensland Dispatch price = $101 Demand = 8,502 MW
Availability = 11,462 MW Generation = 9,685 MW
Victoria Dispatch price = $0.00 Demand = 4,795 MW
Availability = 8,773 MW Generation = 4,940 MW
Tasmania Dispatch price = $132.37
Demand = 1,056 MW Availability = 2,047 MW Generation = 786 MW
South Australia Dispatch price = $0.00 Demand = 1,117 MW
Availability = 3,144 MW Generation = 1,614 MW
New South WalesDispatch price = $167.99
Demand = 13,778 MW Availability = 13,707 MW Generation = 13,052 MW
776
MW
81
MW
73 M
W
390
MW
61 MW
211 MW
Table 46 – NSW binding constraints on Thursday 31 January 2019 at 16:30
Constraint ID Type Impact Reason
N>>N-NIL_64 Thermal NSW Generation + Interconnectors Avoid O/L Bannaby to Sydney West (39) on trip of Dapto to Sydney South (11) line
Rank Constraint ID Sum of Marginal Values
Total duration (dd:hh:mm)
Type Impact Reason
17 N>>N-NIL__G_15M $2,527.71 0:05:55 Thermal Vic - NSW Interconnector + Generators
Avoid O/L Upper Tumut to Yass (2) using 15 minute rating on trip of Lower Tumut to Yass (3) line
18 N>N-NIL_MBDU $2,476.53 0:04:35 Thermal Terranora Interconnector
Avoid overloading Mullumbimby to Dunoon line (9U6 or 9U7) on trip of the other Mullumbimby to Dunoon line (9U7 or 9U6)
19 N>LSDU9U6_LSDU9U7
$1,954.87 0:21:50 Thermal Terranora Interconnector
O/L 9U7/L @LISM132 for CTG LN9X on trip of LISM132-DUNOON 9U6/L 132 kV line
20 N>>N-NIL__H_15M $1,954.19 0:00:15 Thermal Vic - NSW Interconnector + Generators
Avoid O/L Lower Tumut to Canberra (07) using 15 minute rating on trip of Lower Tumut to Yass (3) line
A5.4 Possible future transmission system performance
The maximum demand event for each of NSW, Qld and Vic were analysed for the constraints that were binding (or violating) and the 10 constraints that were closest to binding at the time of the maximum demand in the period
1 March 2018 – 28 February 2019. The constraints that were not binding but close to binding were assessed to identify possible future transmission system limitations.
Table 45 – Maximum demand event in NSW, QLD and VIC
Region Max demand Date and time
NSW 13,778 MW Thursday 31 January 2019, 16:30
QLD 10,052 MW Wednesday 13 February 2019, 16:55
VIC 9,332 MW Thursday 24 January 2019, 17:55
116 NSW Transmission Annual Planning Report 2019 117Appendix 5 | Transmission constraints

Ap
pend
ix 5
A5.4.2 Maximum demand event in Queensland
Figure 61 – NEM overview map on 13 February 2019, 16:55
Queensland Dispatch price = $119.14 Demand = 10,052 MW
Availability = 10,989 MW Generation = 9,859 MW
Victoria Dispatch price = $102.00
Demand = 4,806 MW Availability = 9,071 MW Generation = 5,676 MW
Tasmania Dispatch price = $102.10
Demand = 1,084 MW Availability = 2,328 MW Generation = 1,040 MW
South Australia Dispatch price = $102.94
Demand = 1,097 MW Availability = 2,363 MW Generation = 1,143 MW
New South WalesDispatch price = $108.28
Demand = 9,146 MW Availability = 13,678 MW Generation = 9,011 MW
302
MW
8 M
W
577
MW
131
MW
18 MW
12 MW
There were no binding or violating constraints in NSW on 13 February 2019 at 16:55, i.e. when the demand in
Queensland reached maximum during the 1 March 2018 to 28 February 2019 period.
Table 47 – NSW constraints that were close to binding on Thursday 31 January 2019 at 16:30
Rank Constraint ID Headroom (MW)
Type Impact Reason
1 N>N-NIL_TE_E1 10 Thermal Terranora Interconnector
Avoid Armidale to Coffs Harbour (96C) O/L on Armidale-Coffs Harbour(87) trip
2 N>>N-NIL_65 20 Thermal NSW Generation + Interconnectors
Avoid O/L Bannaby to Sydney West (39) on trip of Avon to Macarthur (17) line
3 N>>N-NIL_1XN 52.55 Thermal Vic - NSW Interconnector + Generators
Avoid O/L Yass to Marulan (4) using 15 minute rating on trip of Yass to Marulan (5) line
4 N>>N-NIL_17N 57.17 Thermal Vic - NSW Interconnector + Generators
Avoid O/L Yass to Marulan (4) using 15 minute rating on trip of Kangaroo Valley to Dapto (18) line
5 N>>N-NIL__H_15M 67.05 Thermal Vic - NSW Interconnector + Generators
Avoid O/L Lower Tumut to Canberra (07) using 15 minute rating on trip of Lower Tumut to Yass (3) line
6 N>>N-NIL__B_15M 75.47 Thermal Vic - NSW Interconnector + Generators
Avoid O/L Upper Tumut to Canberra (01) using 15 minute rating on trip of Lower Tumut to Canberra (07) line
7 N_MBTE1_B 81 Unit Zero Terranora Interconnector
Out= one Directlink cable, Qld to NSW limit
8 N>>N-NIL_1WN 92.56 Thermal Vic - NSW Interconnector + Generators
Avoid O/L Yass to Marulan (5) using 15 minute rating on trip of Yass to Marulan (4) line
9 N>>N-NIL_01N 104.64 Thermal NSW Generation + Interconnectors
Avoid O/L Canberra to Yass (9) on trip of Kangaroo Valley to Dapto (18) line
10 N>>N-NIL__S 112.28 Thermal NSW Generation + Interconnectors
Avoid O/L Mt Piper to Wallerawang (70) on trip of Mt Piper to Wallerawang (71) line
118 NSW Transmission Annual Planning Report 2019 119Appendix 5 | Transmission constraints

Ap
pend
ix 5
A5.4.3 Maximum demand event in Victoria
Figure 62 – NEM overview map on Thursday 24 January 2019 at 17:55
Queensland Dispatch price = $104.73
Demand = 8,787 MW Availability = 11,611 MW Generation = 9,230 MW
Victoria Dispatch price = $14,500.00
Demand = 9,332 MW Availability = 8,538 MW Generation = 8,511 MW
Tasmania Dispatch price = -$0.74 Demand = 1,106 MW
Availability = 2,213 MW Generation = 1,742 MW
South Australia Dispatch price = $14,500.00
Demand = 2,944 MW Availability = 3,055 MW Generation = 3,198 MW
New South WalesDispatch price = $105.76
Demand = 10,687 MW Availability = 13,431 MW Generation = 10,903 MW
174
MW
17
MW
317
MW
478
MW
44 MW
82 MW
Table 49 – NSW binding constraints on Thursday 24 January 2019 at 17:55
Constraint ID Type Impact Reason
N^^V_NIL_1 Voltage stability Vic - NSW Interconnector + Generators
Avoid voltage collapse at Darlington Point for loss of the largest Vic generating unit or Basslink
Table 48 – NSW constraints that were close to binding on 13 February 2019 at 16:55
Rank Constraint ID Headroom (MW)
Type Impact Reason
1 N>LSDU9U6_LSDU9U
0 Thermal Terranora Interconnector
Avoid O/L 9U7/L @LISM132 for CTG LN9X on trip of LISM132-DUNOON 9U6/L 132 kV line
2 N>N-NIL_LSDU 6.69 Thermal Terranora Interconnector
Avoid overloading Lismore to Dunoon line (9U6 or 9U7) on trip of the other Lismore to Dunoon line (9U7 or 9U6)
3 N>N-NIL_TE_D2 41.77 Thermal Terranora Interconnector
Avoid overloading Lismore 330 to Lismore 132 (9U) on trip of Lismore 330 to Lismore 132 (9U8) line
4 N_MBTE1_A 49.2 Unit Zero Terranora Interconnector
Out= one Directlink cable, NSW to Qld limit
5 N^^Q_NIL_A 73.9 Voltage Stability NSW - Qld (QNI) Interconnector + Directlink
Avoid voltage collapse on loss of Liddell to Muswellbrook (83) line
6 N^^Q_NIL_B1 84.55 Voltage Stability Qld Generation + Interconnectors
Avoid voltage collapse on loss of Kogan Creek
7 N_NIL_TE_A 112.2 Other Terranora Interconnector
Upper limit on Directlink NSW to Qld
8 N^^Q_NIL_B4 185.85 Voltage Stability Qld Generation + Interconnectors
Avoid voltage collapse on loss of Tarong North
9 N_MBTE1_B 187.8 Unit Zero Terranora Interconnector
Out= one Directlink cable, Qld to NSW limit
10 N>>N-NIL__3_OPENED
208.52 Thermal NSW - Qld (QNI) Interconnector + Directlink
Avoid overloading Liddell to Muswellbrook (83) on loss of Liddell to Tamworth (84) line
120 NSW Transmission Annual Planning Report 2019 121Appendix 5 | Transmission constraints

Appendix 6
Glossary
Table 50 – NSW constraints that were close to binding on 24 January 2019 at 17:55
Rank Constraint ID Headroom (MW)
Type Impact Reason
1 N>N-NIL_LSDU 42.96 Thermal Terranora Interconnector
Avoid overloading Lismore to Dunoon line (9U6 or 9U7) on trip of the other Lismore to Dunoon line (9U7 or 9U6)
2 N>LSDU9U6_LSDU9U7
45.3 Thermal Terranora Interconnector
O/L 9U7/L @LISM132 for CTG LN9X on trip of LISM132-DUNOON 9U6/L 132 kV line
3 N_MBTE1_A 82.6 Unit Zero Terranora Interconnector
Out= one Directlink cable, NSW to Qld limit
4 N>>N-NIL_996_IN 87.24 Thermal NSW Generation + Interconnectors
Avoid Wagga to ANM(996) O/L on Wagga to Jindera(62) trip
5 N>N-NIL_TE_D2 119.35 Thermal Terranora Interconnector
Terranora Interconnector
6 V>>SML_NSWRB_11 139.29 Thermal Victorian Generation + Interconnectors
NSW Murraylink runback scheme, avoid O/L of Wemen to Red Cliffs 220 kV line section for loss of Balranald to Darlington Point (X5/1) 220 kV line
7 N_NIL_TE_A 145.6 Other Terranora Interconnector
Upper limit on Directlink NSW to Qld
8 N_MBTE1_B 154.4 Unit Zero Terranora Interconnector
Out= one Directlink cable, Qld to NSW limit
9 N>>N-NIL_DPTX 165.49 Thermal NSW Generation + Interconnectors
Avoid overloading a Darlington Point transformer on trip of the other Darlington Point transformer
10 N>N-NIL_MBDU 213.25 Thermal Terranora Interconnector
Avoid overloading Mullumbimby to Dunoon line (9U6 or 9U7) on trip of the other Mullumbimby to Dunoon line (9U7 or 9U6)
122 NSW Transmission Annual Planning Report 2019

Ap
pend
ix 6
Term Explanation/Comments
Native energy (demand) Energy (demand) that is inclusive of Scheduled, Semi-Scheduled and Non-Scheduled generation
NEFR National Electricity Forecasting Report
Non-network options Alternatives to network augmentation which address a potential shortage in electricity supply in a region, e.g. demand response or local generation
NSCAS Network Support and Ancillary Services. Services used by AEMO that are essential for managing power system security, facilitating orderly trading, and ensuring electricity supplies are of an acceptable quality.
NSW region With respect to energy consumption and demand, the term ‘NSW region’ refers to the combined NSW and ACT electricity loads.
NTFP National Transmission Flow Path
NTNDP National Transmission Network Development Plan
Outage An outage is when part of the network is switched off. This can be either planned (i.e. when work needs to be done on the line) or unplanned
POE Probability of Exceedence. This is the probability a forecast would be met or exceeded, e.g. a 50% POE demand implies there is a 50% probability of the forecast being met or exceeded
PV Photovoltaic
Reliability Reliability is a measure of a power system’s capacity to continue to supply sufficient power to satisfy customer demand, allowing for the loss of generation capacity
RET Renewable Energy Target
Secondary system Equipment used to control, automate and monitor the network
Substation A set of electrical equipment used to step high voltage electricity down to a lower voltage. Lower voltages are used to deliver power safely to small businesses and residential consumers
SVC Static VAr Compensator. An electrical device installed on the high voltage transmission system to provide fast acting voltage control to regulate and stabilise the system
Transmission Annual Planning Report (TAPR) This document that sets out issues and provides information to the market that is relevant to transmission planning in NSW.
Transmission line A high voltage power line running at 500 kV, 330 kV, 220 kV or 132 kV. The high voltage allows delivery of bulk power over long distances with minimal power loss
Transmission Network Service Provider, TNSP
A body that owns controls and operates a transmission system in the NEM
The following table gives some of the common electricity measurements used:
Property Unit
Voltage Volts (V) and kilovolts (kV). 1 kV = 1,000 V
Power Watts (W), usually expressed in kilowatts (kW) and megawatts (MW). 1 MW = 1,000 kW = 1 million W
Energy consumption The amount of energy consumed in an hour is usually expressed as kilowatt-hours (kWh) or megawatt-hours (MWh). 1 MWh = 1,000 kWh
Maximum power that a transformer can deliver
Usually expressed in megavolt-ampere (MVA)
Reactive power Usually expressed in megavolt-ampere reactive (MVAr)
Term Explanation/Comments
AEMC The Australian Energy Market Commission
AEMO The Australian Energy Market Operator. Responsible for operation of the NEM and has the role of Victorian JPB
AER (‘the regulator’) The Australian Energy Regulator
Assets TransGrid’s ‘towers and wires’, all the substations and electricity transmission lines that make up the network
Augmentation Expansion of the existing transmission system or an increase in its capacity to transmit electricity
Bulk supply point (BSP) A point of supply of electricity from a transmission system to a distribution system
Connection point The agreed point of supply established between the network service provider and another registered participant or customer
Constraint (limitation) An inability of a transmission system or distribution system to supply a required amount of electricity to a required standard.
Consumers Any end user of electricity including large users, such as paper mills, and small users, such as households
Demand The total amount of electrical power that is drawn from the network by consumers. This is talked about in terms of ‘maximum demand’ (the maximum amount of power drawn throughout a given period) and ‘total energy consumed’ (the total amount of energy drawn across a period)
Demand management (DM) A set of initiatives that are put in place at the point of end-use to reduce the total and/or maximum consumption of electricity
Direct customers TransGrid’s customers are those directly connected to our network. They are either Distribution Network Service Providers, directly connected generators, large industrial customers, customers connected through inter-regional connections or potential new customers
Distribution Network Service Provider, DNSP (Distributor)
An organisation that owns, controls or operates a distribution system in the National Electricity Market. Distribution systems operate at a lower voltage than transmission systems and deliver power from the transmission network to households and businesses
Easement A designated area in which TransGrid has the right to construct, access and maintain our assets, while ownership of the property remains with the original land owner
Electricity Statement of Opportunities (ESOO)
A document produced by AEMO that focuses on electricity supply demand balance in the NEM
Embedded generation A generating unit connected to the distribution network, or connected to a distribution network customer. (Not a transmission connected generator)
Generator An organisation that produces electricity. Power can be generated from various sources, e.g. coal fired power plants, gas-fired power plants, wind farms
Interconnection The points on an electricity transmission network that cross jurisdictional/state boundaries
ISP Integrated System Plan
Jurisdictional Planning Body ( JPB) The organisation nominated by a relevant minister as having transmission system planning responsibility in a jurisdiction of the NEM
Load The amount of electrical power that is drawn from the network
Local generation A generation or cogeneration facility that is located on the load side of a transmission constraint
LRET Large Scale Renewable Energy Target
‘N – 1’ reliability The system is planned for no loss of load on the outage of a single element such as a line, cable or transformer
National Electricity Law Common laws across the states which comprise the NEM, which make the NER enforceable
National Electricity Market (NEM) The National Electricity Market, covering Queensland, New South Wales, Victoria, South Australia and Tasmania
National Electricity Rules (NER or ‘the Rules’) The rules that govern the NEM. The Rules are administered by the AEMC
124 NSW Transmission Annual Planning Report 2019 125Appendix 6 | Glossary

Version 0 | Date Issued 28 June 2019 | Comment Original issue
CONTACT DETAILS
For all enquiries regarding the Transmission Annual Planning Report and for making written submissions, contact:
© TransGrid 2019.
All rights reserved.
NSW Electricity Networks Operations Pty Limited (ACN 609 169 959), as trustee for NSW Electricity Networks Operations Trust (ABN 70 250 995 390). Registered business name is TransGrid (ABN 70 250 995 390).
www.transgrid.com.au