Embed Size (px)
Citation preview

New South Wales Auditor-General’s ReportFinancial Audit
Volume Thirteen 2015Electricity

The role of the Auditor-GeneralThe roles and responsibilities of the Auditor- General, and hence the Audit Office, are set out in the Public Finance and Audit Act 1983.
Our major responsibility is to conduct financial or ‘attest’ audits of State public sector agencies’ financial statements. We also audit the Total State Sector Accounts, a consolidation of all agencies’ accounts.
Financial audits are designed to add credibility to financial statements, enhancing their value to end-users. Also, the existence of such audits provides a constant stimulus to agencies to ensure sound financial management.
Following a financial audit the Audit Office issues a variety of reports to agencies and reports periodically to parliament. In combination these reports give opinions on the truth and fairness of financial statements, and comment on agency compliance with certain laws, regulations and government directives. They may comment on financial prudence, probity and waste, and recommend operational improvements.
We also conduct performance audits. These examine whether an agency is carrying out its activities effectively and doing so economically and efficiently and in compliance with relevant laws. Audits may cover all or parts of an agency’s operations, or consider particular issues across a number of agencies.
Performance audits are reported separately, with all other audits included in one of the regular volumes of the Auditor-General’s Reports to Parliament – Financial Audits.
audit.nsw.gov.au
GPO Box 12Sydney NSW 2001
The Legislative AssemblyParliament HouseSydney NSW 2000
Pursuant to the Public Finance and Audit Act 1983, I present Volume Thirteen of my 2015 report.
A T Whitfield PSMActing Auditor-General 15 December 2015
© Copyright reserved by the Audit Office of New South Wales. All rights reserved. No part of this publication may be reproduced without prior consent of the Audit Office of New South Wales.
The Audit Office does not accept responsibility for loss or damage suffered by any person acting on or refraining from action as a result of any of this material.
The Legislative CouncilParliament HouseSydney NSW 2000

NSW Auditor-General's Report to Parliament | Volume Thirteen 2015 | Electricity | Contents
1
Contents
Section One 3
Executive Summary ________________________________________________________ 4
Introduction _______________________________________________________________ 7
Financial Performance and Reporting _________________________________________ 9
Financial Controls _________________________________________________________ 30
Governance ______________________________________________________________ 36
Service Delivery __________________________________________________________ 41
Section Two – Appendices 45
Appendix One – Financial Information ________________________________________ 46
Appendix Two – Performance Against Budget _________________________________ 47
Appendix Three – Financial Sustainability _____________________________________ 48
Appendix Four – Cluster Information _________________________________________ 50


Section One
Electricity

NSW Auditor-General's Report to Parliament | Volume Thirteen 2015 | Electricity | Executive Summary
4
Executive Summary
This report sets out the results of the financial statement audits of the NSW Government
electricity businesses and their controlled entities for the year ended 30 June 2015.
Unqualified audit opinions were issued on all NSW
Government electricity businesses’ financial statements
for the year ended 30 June 2015.
The quality of financial reporting continues to improve
since the introduction of early close procedures.
The recent Australian Energy Regulator (AER)
determination for electricity distribution businesses
resulted in lower revenue, operating expenditure and
capital expenditure allowances over the next five years.
The main impact of the AER’s determination for TransGrid
is a lower capital expenditure allowance.
The NSW Government continues to divest its interest in
NSW electricity businesses. It recently announced the
successful consortium which will lease TransGrid for 99
years. Financial completion of this transaction is expected
to occur mid December 2015.
No high risk internal control weaknesses were identified in
NSW Government electricity businesses.
The Distributors and TransGrid have continued to improve
the management of overtime.
External debt held by the Distributors and TransGrid
increased.
The NSW Government enacted legislation to lease 49 per
cent of the State’s electricity networks.
Demand for electricity is falling, but the percentage
decrease in energy consumption was less in 2014-15
compared to the previous year.
Network reliability improved for TransGrid and Ausgrid,
but deteriorated for Essential Energy and Endeavour
Energy.
Financial and performance reporting
Financial reporting
Industry events
Sale/lease of electricity businesses and assets
Financial controls
Internal controls
Human resources
Borrowings
Governance
Legislative changes
Service delivery
Demand for electricity
Network reliability

NSW Auditor-General's Report to Parliament | Volume Thirteen 2015| Electricity | Executive Summary
5
The quality of financial reporting continues to improve
Unmodified audit opinions were issued for all electricity entities’ 30 June 2015 financial
reports. Misstatements have fallen by 90 per cent, from 30 in 2011-12 to three in 2014-15. All
material misstatements were corrected in the financial reports.
Early close procedures contributed to improving financial reporting
All electricity businesses performed all early close procedures except for the revaluation of
system assets. This was not finalised because the impact of the Australian Energy
Regulator’s (AER) determination could not be assessed until it was released on 30 April 2015.
Treasury was advised of the delay in completing the asset revaluations.
Actual revenues for the Distributors and TransGrid were stable, but combined net
profits fell
For the year ended 30 June 2015, the Distributors and TransGrid earned $7.7 billion
($7.7 billion in 2013-14) in revenue and achieved a combined net profit after tax of $1.1 billion
($1.4 billion). The combined net profit was $460 million higher than the Statements of
Corporate Intent target.
The NSW Government’s investment in electricity businesses decreased in 2014-15
The value of the NSW Government’s investment in electricity businesses totalled $10.8 billion
at 30 June 2015 ($11.4 billion at 30 June 2014). This comprised total assets of $38.5 billion
($41.0 billion) less total liabilities of $27.7 billion ($29.6 billion).
Dividends payable by Distributors to the NSW Government decreased by 25 per cent
Total dividends payable by Distributors to the NSW Government decreased to $520 million
in 2014-15 ($694 million in 2013-14). This was primarily due to lower profits and reduced
dividend payout ratios for the electricity Distributors.
Over 1,100 employees left the Distributors and TransGrid during 2014-15
The Distributors and TransGrid continued to reform the businesses to achieve operational
efficiencies and reduce unfunded costs arising from lower approved AER allowances.
Redundancy costs for the year ended 30 June totalled $180 million.
The recent AER determination is less favourable for the Distributors than the previous
determination
The AER determination for the regulatory period 2014-2019 for the electricity Distributors
allows for lower revenue, operating expenditure and capital expenditure. The allowance for
network revenue is $2.6 billion lower, operating expenditure $1.6 billion lower, and capital
expenditure $8.0 billion lower.
TransGrid’s determination resulted mainly in a lower capital expenditure allowance.
TransGrid’s AER determined revenue allowance for the four year regulatory period 2014-2018
is $3.0 billion ($4.0 billion for the previous five year period 2009-2014).
NSW Distributors are appealing the recent AER determination
The NSW Distributors have lodged an appeal to the Australian Competition Tribunal against
the significant cuts to operating programs in the AER’s final determination. The Distributors
estimate they had 2,750 unfunded employee positions at 1 July 2015 as a result of the AER’s
reduced allowance for operating and capital expenditure in the 2014-2019 determination
period.
Financial and performance reporting

NSW Auditor-General's Report to Parliament | Volume Thirteen 2015 | Electricity | Executive Summary
6
The NSW Government continues to divest its interest in electricity businesses.
Macquarie Generation and Delta Electricity’s Colongra power stations were sold in 2014-15
for $1.5 billion and $234 million respectively. On 19 November 2015, the NSW Government
announced the sale of Delta Electricity’s Vales Point power station for $1.0 million. On
25 November 2015, the NSW Government also announced the successful consortium to
lease TransGrid for 99 years for $10.3 billion. Completion of this transaction is expected
mid December 2015. While the State retains its ownership of the electricity distribution
businesses, it has announced plans to lease 50.4 per cent of Ausgrid and Endeavour Energy
to the private sector.
Distributors will have spent almost $7.0 billion less than planned under the five year
network reform program
The Distributors estimated the network reform program will result in $7.0 billion less in capital
and operating expenditure over the five years to 30 June 2016 when compared against the
2010-11 Statement of Corporate Intent forecast. This reduced spend is mainly attributed to
reduced capital expenditure programs.
No high risk control weaknesses identified by the 2014-15 audits
The audits did not identify any high risk internal control weaknesses. Areas were identified
where internal controls could be improved and these were reported to the relevant agencies’
management together with a recommendation to address the weakness.
Overtime and associated allowances were lower in 2014-15
Total overtime and associated allowances paid by Distributors and TransGrid decreased to
$114 million in 2014-15 ($120 million in 2013-14).
External debt held by Distributors and TransGrid increased by 3.5 per cent in 2014-15
The Distributors’ and TransGrid’s total external debt increased to $20.6 billion at
30 June 2015 ($19.9 billion). Almost half, $10.1 billion, must be repaid or refinanced over the
next five years.
Legislation enacted to lease 49 per cent of the State’s electricity networks.
Recent legislation allows the NSW Government to deliver its policy to lease 49 per cent of the
State's electricity networks and to use the net proceeds from those transactions to build new
infrastructure.
Demand for electricity continues to fall
The downward trend in energy consumption has slowed mainly due to the repeal of the
carbon price, lower electricity price movements and a cooler winter season.
Network reliability improved for TransGrid and Ausgrid
Network reliability for all Distributors was impacted by severe unfavourable weather events
throughout 2014-15.TransGrid’s network reliability improved by over 50 per cent compared
to 2013-14. Ausgrid’s network reliability was better than target and 2013-14.
Lost Time Injury Rates decreased for most Distributors, but increased for TransGrid
All Distributors’ lost time injury rates were better than the previous year. TransGrid’s lost time
increased due to a small increase in minor injuries.
Financial controls
Governance
Service delivery

NSW Auditor-General's Report to Parliament | Volume Thirteen 2015| Electricity | Introduction
7
Introduction
This report sets out the results of the financial statement audits of NSW electricity businesses’
for the year ended 30 June 2015. It provides Parliament and other users of the financial
statements an analysis of the results and key observations in the following areas:
• Financial Performance and Reporting
• Financial Controls
• Governance
• Service Delivery.
The commentary covers the electricity businesses controlled by the State, as shown below:
Snapshot of ownership
The NSW Government continues to divest its interest in electricity businesses through sales
and complex, long term leasing arrangements.
At the time of writing this report, the NSW Government retained ownership of the electricity
businesses shown below.

NSW Auditor-General's Report to Parliament | Volume Thirteen 2015 | Electricity | Introduction
8
Changes to ownership from 1 July 2014
Delta Electricity’s Munmorah power station and the remaining renewable assets of Green
State Power are still under State ownership (Munmorah power station was closed in July
2012). Macquarie Generation and Delta Electricity’s Colongra power station was sold in
2014-15. On 19 November 2015, the NSW Government executed the sale of Delta
Electricity’s Vales Point power station. Completion of this sale is expected to occur
mid December 2015. Green State Power was deregistered on 5 July 2015 following the
transfer of its remaining assets to Delta Electricity.
On 25 November 2015, the NSW Government announced the successful consortium to lease
TransGrid for 99 years. At the time of writing this report, the State still retains ownership of the
distribution of electricity through Ausgrid, Endeavour Energy, and Essential Energy. However,
the NSW Government has announced plans to enter into long term leases of 50.4 per cent of
the distribution assets of Ausgrid and Endeavour Energy to the private sector. Essential
Energy will remain under Government ownership.
The Government also holds a 58 per cent stake in Snowy Hydro Limited, with the balance
owned by the Victorian and Australian Governments. Snowy Hydro Limited is the parent
company of Red Energy, an electricity and gas retail business operating in Victoria, New
South Wales and South Australia.
For further analysis on generation assets sold in 2014-15 and proposed network transactions
in 2015-16, refer to the ‘Financial and Performance Reporting’ section of this report.
Industry Snapshot
A financial snapshot of the NSW Government electricity businesses for the year ended
30 June 2015 is shown below. The snapshot below includes results of the distribution,
transmission and generation businesses.
Revenue
Distributors
$6.8 billion
TransGrid
$887 million
Generators
$464 million
Profit/(loss) after tax
Distributors
$930 million
TransGrid
$203 million
Generators
$(743) million
Return on assets
Distributors
8 per cent
TransGrid
7 per cent
Assets
Distributors
$31.5 billion
TransGrid
$6.6 billion
Generators
$325 million
Debt
Distributors
$17.8 billion
TransGrid
$2.9 billion
Equity (Net Assets)
Distributors
$8.7 billion
TransGrid
$2.1 billion
Generators
$14 million

NSW Auditor-General's Report to Parliament | Volume Thirteen 2015| Electricity | Financial Performance and Reporting
9
Financial Performance and Reporting
Financial performance and reporting are important elements of good governance. Confidence
in public sector decision making and transparency is enhanced when financial reporting is
accurate and timely. Effective financial management and reporting by agencies helps key
stakeholders, such as the NSW Government, make effective decisions and achieve desired
outcomes efficiently.
This chapter outlines audit observations, conclusions and recommendations related to the
financial performance and reporting of the NSW electricity entities for 2014-15.
Unqualified audit opinions were issued for all the
NSW electricity entities.
Ongoing improvements in financial statement
preparation processes helped to identify and resolve
material misstatements.
The number of reported misstatements has fallen
from 30 in 2011-12 to three in 2014-15.
The number of misstatements has fallen since
Treasury introduced its ‘early close procedures’
initiative in 2011-12.
All electricity entities performed all early close
procedures except for the revaluation of system
assets. This was not finalised because the impact of
the Australian Energy Regulator’s (AER)
determination could not be assessed until it was
released on 30 April 2015. Treasury was advised of
the delayed completion of revaluation procedures.
Despite the delays in finalising asset revaluations,
early close procedures facilitated the effective
resolution of issues and risk areas early in the audit
process.
The combined profit after tax for Distributors
decreased to $930 million in 2014-15. Revenue
remained stable at $6.8 billion, but total expenses
increased by $279 million.
Lower Distributor profits contributed to a decrease in
distributions to the NSW Government.
The recent AER determination will reduce network
revenue, operating expenditure and capital
allowances over the next five years.
As a result, at 1 July 2015, the Distributors and
TransGrid estimated that 2,752 jobs were unfunded.
The NSW Distributors have appealed to the
Australian Competition Tribunal against cuts to
operating programs and to review the cost of capital
allowed by the AER.
In recent years, the NSW Government has reduced
its ownership of electricity generation businesses
and is in the process of leasing 100 per cent of
TransGrid and 50.4 per cent of Ausgrid and
Endeavour Energy.
The NSW Government continues to divest its
interest in electricity businesses. It recently
announced the successful consortium which will
lease TransGrid for 99 years. The sale of Delta
Electricity’s Vales Point power station was also
announced. The details, including dates, for leasing
Ausgrid and Endeavour Energy have not been
announced.
Over 1,100 employees left the Distributors and
TransGrid during 2014-15.
The continuing reform of electricity businesses has
resulted in further employee redundancies.
Financial and performance reporting
Observation Conclusion

NSW Auditor-General's Report to Parliament | Volume Thirteen 2015 | Electricity | Financial Performance and Reporting
10
Quality of Financial Reporting
Unqualified audit opinions issued for all agencies’ 30 June 2015 financial statements
Unqualified audit opinions were issued on the 2014-15 financial statements of electricity
entities. Sufficient audit evidence was obtained to conclude the financial statements were free
of material misstatements.
No significant matters were reported to those charged with governance of the entities, the
portfolio Minister, Treasurer or the agency head.
The quality of financial reporting continues to improve
Misstatements for all electricity entities have fallen by 90 per cent, from 30 in 2011-12 to three
in 2014-15. This reflects the improved quality of financial reporting since Treasury introduced
its ‘early close procedures’ initiative in 2011-12 and the efforts of Networks NSW to harmonise
accounting policies and process across the electricity Distributors.
Three misstatements individually greater than $5.0 million were identified and corrected in
the 2014-15 financial statements.
A material misstatement relates to an incorrect amount, classification, presentation or
disclosure in the financial statements that could reasonably be expected to influence the
economic decisions of users.
Timeliness of Financial Reporting
Financial statements were submitted on time by all businesses
The Audit Office completed the audits and issued the audit opinions for all seven NSW
Government electricity businesses within statutory deadlines.
Early close procedures contributed to improved financial reporting
Overall, all NSW electricity businesses complied with early close procedures.
Treasury required early close procedures be completed at 31 March, but the three Distributors
received approval from Treasury to complete these procedures by 30 April 2015. The
deadline was extended to give them time to consider the financial impact of the final AER
determination, which was made on 30 April 2015.
TransGrid performed its early close procedures at 31 March, but the valuation of its system
assets was not finalised until the impact of the final AER determination was understood on
30 April 2015.
Early close procedures are designed to bring forward year-end activities, such as valuing
assets and resolving financial reporting issues, to reduce reporting timeframes and improve
quality.

NSW Auditor-General's Report to Parliament | Volume Thirteen 2015| Electricity | Financial Performance and Reporting
11
Financial performance against Budget (Target)
The Distributors and TransGrid’s revenues and profits were higher than budget
In 2014-15, the Distributors and TransGrid generated revenues of $7.7 billion, $523 million
higher than Statement of Corporate Intent (SCI) approved targets. They also exceeded a
combined net profit after tax target of $673 million by $460 million.
Appendix Two compares the actual results of all the Distributors and TransGrid against the
SCI-approved targets.
Source: Financial statements (audited) and Statements of Corporate Intent presented to Parliament (unaudited).
Ausgrid achieved a net profit after tax of $420 million ($151 million higher than the SCI target).
This was mainly due to higher than budgeted energy consumption, lower than budgeted
amortisation and depreciation of assets, and lower interest costs.
Endeavour Energy achieved a net profit after tax of $244 million ($93.0 million higher than the
SCI target). This was mainly attributable to higher than budgeted energy consumption and
other income, including capital contributions.
Essential Energy achieved a net profit after tax of $266 million ($189 million higher than the
SCI target). This was mainly due to higher than budgeted energy consumption, higher capital
contributions, and lower than budgeted labour costs.
In April 2015, the AER published its final determination, which retrospectively reduced the
Distributor’s allowable network revenue for 2014-15 by $815 million. This will be built into the
pricing of distribution network charges from 1 July 2015. The AER’s final determination is
discussed in detail later in this report.
TransGrid achieved a net profit after tax of $203 million, ($27.0 million higher than the SCI
target). This was mainly due to lower interest costs, lower regulated and other expenditure,
and an increase in fair value gains for investment property.
0
50
100
150
200
250
300
350
400
450
Ausgrid Endeavour Essential TransGrid
$m
NSW Distributors' and TransGridactual net profit after tax against budget
for the year ended 30 June 2015
Actual Budget

NSW Auditor-General's Report to Parliament | Volume Thirteen 2015 | Electricity | Financial Performance and Reporting
12
Key Financial Information
Actual revenues for the Distributors and TransGrid were stable, but combined net
profits fell
For the year ended 30 June 2015, the Distributors and TransGrid earned $7.7 billion
($7.7 billion in 2013-14) in revenue and achieved a combined net profit after tax of $1.1 billion
($1.4 billion).
The Distributors’ revenue totalled $6.8 billion in 2014-15 ($6.8 billion) while expenses totalled
$5.9 billion ($5.6 billion). The total net profit after tax was $274 million lower than in 2013-14.
The lower combined net profit was mainly due to a $188 million reduction in Ausgrid’s net
profit for the year. This was mainly due to Ausgrid’s prior year result including $151 million in
one-off proceeds from the sale of its office premises.
Endeavour Energy and Essential Energy contributed $86.5 million to the lower combined net
profit after tax. This was mainly due to increases in income tax, asset write-offs and finance
costs.
Total expenses for the Distributors increased by $279 million in 2014-15 mainly due to costs
associated with distributing electricity, employees, financing and asset write offs. The increase
in expenditure was partially offset by lower depreciation and amortisation costs at Ausgrid.
TransGrid’s net profit after tax for 2014-15 was $12.0 million higher than in 2013-14, mainly
driven by a $29.4 million increase in revenue. Changes in the fair value of an investment
property resulted in a $15.0 million gain and non-regulated services revenue increased by
$10.3 million.
The NSW Government’s investment in electricity businesses decreased in 2014-15
The value of the NSW Government’s investment in the electricity businesses totalled
$10.8 billion at 30 June 2015 ($11.4 billion at 30 June 2014). This comprised total assets of
$38.5 billion ($41.0 billion) less total liabilities of $27.7 billion ($29.6 billion).
* Includes revenue, gain on disposals, financial instrument fair value gains, and income tax benefits.
** Includes loss on disposals, financial instrument fair value losses, and income tax expenses.
^ 2014 includes the full year results of Macquarie Generation and Delta Electricity. Macquarie Generation’s power stations were sold
in September 2014 and the entity dissolved in February 2015
Source: Financial statements (audited).
Appendix One summarises the key financial results for the NSW Government electricity
businesses.
Distributors and TransGrid
At 30 June 2015, the Distributors’ assets totalled $31.5 billion, an increase of $314 million
from the previous year. The increase was primarily due to new capital expenditure, partially
offset by increased depreciation costs. None of the Distributors recognised significant
movements in asset valuations in 2014-15.
Year ended 30 June 2015 2014 2015 2014 2015 2014 2015 2014
$m $m $m $m $m $m $m $m
Total assets 325 3,319 31,510 31,196 6,647 6,550 38,482 41,065Total liabilities 311 2,375 22,785 22,923 4,554 4,342 27,650 29,640Net assets 14 944 8,725 8,273 2,093 2,208 10,832 11,425Total revenue* 464 1,888 6,803 6,798 887 858 8,154 9,544Total expense** 1,207 1,717 5,873 5,594 684 667 7,764 7,978
Net profit/(loss) after
tax (743) 171 930 1,204 203 191 390 1,566Dividend provided from
net profit -- 9 520 694 295 179 815 882
GeneratorsElectricity
DistributorsTransGrid Total

NSW Auditor-General's Report to Parliament | Volume Thirteen 2015| Electricity | Financial Performance and Reporting
13
The Distributors’ total liabilities remained fairly stable, decreasing by $138 million to
$22.8 billion at 30 June 2015. All Distributors experienced a decrease in employee benefit
liabilities, mainly due to the number of employee redundancies during the year. Essential
Energy’s dividend provision reduced by $75.2 million as it was not required to pay an ordinary
dividend to the NSW Government in 2014-15. These decreases were partially offset by a
$611 million increase in borrowings for all NSW Distributors.
The Distributors’ net assets increased by 5.5 per cent to $8.7 billion at 30 June 2015.
TransGrid’s net assets reduced by 5.2 per cent to $2.1 billion at 30 June 2015, mainly due to
an increase in borrowings.
Generators
The Generators recorded $464 million in revenue in 2014-15, a decrease of $1.4 billion from
the previous year. This was mainly due to the sale of Macquarie Generation’s operations
in September 2014. It generated revenue of $1.3 billion in 2013-14.
The Generators’ total expenses decreased by $510 million to $1.2 billion in 2014-15. The
decrease was mainly due to the sale of Macquarie Generation’s operations, which was
partially offset by a $228 million increase in Delta Electricity’s expenses. This was mainly
attributable to higher finance costs and revaluation decrements on property, plant and
equipment.
The Generators’ total net loss was $743 million in 2014-15 (net profit after tax of $171 million
in 2013-14).
At 30 June 2015, the Generators’ total assets decreased by $3.0 billion and liabilities
decreased by $2.1 billion compared to the previous year. This was mainly due to the sale of
Macquarie Generation and the sale of Delta Electricity’s Colongra power station in 2014-15.
The Generators’ total net assets decreased by 98.5 per cent in 2014-15 to $14.0 million.
Distributions to Government
Dividends payable by Distributors to the NSW Government decreased by 25 per cent
Total dividends payable by Distributors to the NSW Government decreased to $520 million
in 2014-15 ($694 million in 2013-14). This was primarily due to lower Distributor profits and a
reduction in the dividend payout ratio.
Under Treasury’s Financial Distributions Policy for government businesses, dividend targets
are negotiated annually between the shareholders and the board of each Distributor. These
targets are agreed in the Statement of Corporate Intent.
In 2014-15, the agreed dividend payout ratio was 50 per cent of after tax profits (adjusted for
non-cash items) for Ausgrid and Endeavour Energy, and nil for Essential Energy. The
dividend payout ratio in previous years was 70 per cent for all three Distributors.
The lower dividend payout ratio for Ausgrid and Endeavour Energy was due to the immediate
impact of the AER’s final determination and its potential impact on the agencies’ future
financial positions. The payout ratio for Essential Energy was nil due to the impact of AER’s
determination and a capital program planned for 2015-16.
Total distributions made by the Distributors and TransGrid to the NSW Government
decreased in 2014-15
In 2014-15, Distributors and TransGrid accrued and paid $1.4 billion ($1.7 billion in 2013-14)
in distributions to the NSW Government. No dividends were provided for by the Generators for
the year ended 2014-15. No income taxes were paid by the Generators during 2014-15.
Total distributions include:
• $551 million ($829 million) in income tax equivalent payments
• $815 million ($881 million) in dividends accrued.

NSW Auditor-General's Report to Parliament | Volume Thirteen 2015 | Electricity | Financial Performance and Reporting
14
The lower income tax payments in 2014-15 were mainly due to the lower net profits after tax
for all three Distributors.
* Excludes special dividends by Ausgrid of $1.4 billion, Essential Energy of $1.2 billion and Endeavour Energy of $900 million, for the sale of
the retail operations of their businesses in 2011.
** Excludes a special dividend of $118 million relating to the sale of Ausgrid’s head office building in 2013-14. Includes special dividend
relating to the energy rebate and changes to the tax treatment for unread meters.
Source: NSW Distributors, NSW generators and TransGrid Financial Statements (audited).
Redundancy
More than 1,100 employees left the Distributors and TransGrid during 2014-15
During 2014-15, the Distributors and TransGrid continued to reform their businesses to
achieve operational efficiencies and reduce costs. Total redundancy costs for the year ended
30 June 2015 are shown below.
Source: NSW Distribution and Transmission Business (unaudited).
Essential Energy’s provision for 310 employees relates mainly to employees who became
surplus to business needs after the Transitional Service Arrangement period ended and
restructuring from the network reform program. The provision mainly comprises the costs
associated with having to continue paying surplus retail staff. The other network providers did
not have these costs as affected staff exited the business or were redeployed.
Redundancies in response to the final AER determination on 30 April 2015 are discussed later
in this report. The redundancies are not related to the proposed leasing transactions.
Impact of recent events on electricity businesses
The financial results and operations of the electricity businesses have been significantly
impacted by industry wide reforms and decisions of the NSW Government.
The financial impact of these events is outlined in this section.
Australian Energy Regulator (AER) Determination 2014-2019
The AER is responsible for economic regulation of electricity transmission and distribution
systems in all states and territories except for Western Australia and the Northern Territory.
The revenue caps determined by the AER affect the distribution and transmission
components of an electricity bill.
Regulated electricity network businesses must periodically apply to the AER to assess their
revenue requirements. In November 2012, changes were introduced to the regulation of
distribution and transmission businesses under the National Electricity Rules. The NSW
Distributors and TransGrid determination was due to commence on 1 July 2014 and apply for
a period of five years. The AER established two regulatory control periods: a transitional
period from 1 July 2014 to 30 June 2015; and a subsequent regulatory control period
commencing 1 July 2015. The AER made a placeholder determination for 2014-15, which was
adjusted or trued up in the final decision.
Dividends provided during the year and income
taxes paid for the year ended 30 June
2015
$m
2014
$m
2013
$m
2012
$m
2011
$m
Generators -- 33 177 304 310
TransGrid 423 260 247 189 156
Distributors 943** 1,417 1,335 945 698*
Total 1,366 1,710 1,759 1,438 1,164
Year ended 30 June 2015 TransGrid AusgridEndeavour
Energy
Essential
EnergyTotal
Redundancy expense ($m) 8.2 128.5 25.5 17.5 179.7
Total employees provided for -- 402 124 310 836
Total employees who exited through
redundancy 51 783 119 162 1,115

NSW Auditor-General's Report to Parliament | Volume Thirteen 2015| Electricity | Financial Performance and Reporting
15
The AER agreed to a four year determination for TransGrid covering the period 2014-2018 to
align it with the regulatory control periods of other transmission businesses and allow a more
efficient and integrated approach to future transmission revenue determinations by 2022.
In making its determination the AER must be satisfied the level of capital and operating
expenditure proposed by distribution and transmission businesses reflects costs that a
prudent benchmark operator with efficient costs would need to operate its network safely and
comply with its obligations and safety standards.
For comparative purposes, all AER figures reported in this section are expressed in nominal
terms. This report refers to the revised proposals made by Distributors and TransGrid in
response to the draft decision made by the AER.
Distributors
The recent AER determination for Distributors is less favourable than the previous
determination
The AER’s recent determination for the Distributors’ 2014-2019 regulatory period resulted in
the following changes to allowable revenues and expenditures compared to the 2009-2014
determination:
• $2.6 billion lower network revenue allowance
• $8.0 billion lower capital expenditure allowance
• $1.6 billion lower operating expenditure allowance.
The diagram below summaries the differences in the revenue and expenditure allowance
impacts on the distribution businesses for the 2014-2019 regulatory period.
Source: Determination obtained from Ausgrid, Endeavour Energy and Essential Energy (unaudited). Figures are presented in nominal values. These are rounded for presentation purposes.
The impacts of key decisions from the determination are discussed later in this report.

NSW Auditor-General's Report to Parliament | Volume Thirteen 2015 | Electricity | Financial Performance and Reporting
16
The AER estimates lower distribution charges, if passed through to customers, will result in
the following reductions to average annual electricity bills for 2015-16:
• $106 - $313 for residential customers
• $152 - $528 for small business customers.
The AER expects electricity bills to remain stable after 2015-16 for the rest of the regulatory
period.
Impact on Distributors’ revenue
Revenue allowances for 2014-2019 are 12.6 per cent lower than the previous regulatory
period
Total network revenue the distribution businesses can recover in the 2014-2019 period is
$18.0 billion ($20.6 billion in 2009-2014). Essential Energy’s network revenue allowance is
$1.0 billion lower than the previous determination, Endeavour Energy’s revenue is
$695 million lower and Ausgrid’s network revenue is $826 million lower than the previous
determination.
With effect from 1 July 2014, the determination moved the Distributors from a weighted
average price cap to a revenue cap model. Under the weighted average price cap model,
actual revenue was based on units sold, exposing distribution businesses to volume risk.
Under the revenue cap pricing model, revenue should not exceed the Maximum Allowable
Revenue cap (MAR) over the five year period. Prices are adjusted for excess revenue earned
or shortfalls in revenue year to year to achieve this outcome.
Distributors will receive $6.2 billion less revenue than that proposed to the AER
The graph below shows the difference between revenue approved by the AER in its recent
determination compared to the revenue proposed by the Distributors in their submission to the
AER. This excludes the transitional year 2014-15.
Note:
The 2015-19 determination and proposal figures exclude revenues for type 5-6 metering (household/small business meters) because these were
reclassified as ‘Alternative Control Services’ in the 2014-19 determination. The 2009-14 figures include revenues for metering type 5-6 related
services
Source: Data obtained from Ausgrid, Endeavour Energy and Essential Energy (unaudited). Figures are presented in nominal values. These are rounded for presentation purposes.
0
1
2
3
4
5
6
7
8
9
10
Ausgrid 2015-2019 Endeavour Energy 2015-2019 Essential Energy 2015-2019
$ b
illi
on
s
Comparison between final AER determination and revenue proposed by Distributors
AER Revised Proposal
NSW Auditor-General's Report to Parliament | Volume Thirteen 2015| Electricity | Financial Performance and Reporting
17
The final AER determination allows the Distributors 31.5 per cent less than their combined
revised proposal for standard control services of $19.7 billion. Ausgrid experienced the largest
variance, with the AER determining a total revenue allowance 32.6 per cent lower than its
proposal of $9.8 billion.
The difference between the AER approved revenue allowance and the Distributors’ proposed
revenue is mainly due to differences in the rate of return used. The rate of return used by the
AER is the annual income it believes represents a fair return on the value of the entities’
regulated assets. The AER determined a rate of return of 6.68 per cent, 2.17 per cent lower
than that proposed by the Distributors. A small difference in the rate of return significantly
impacts revenue allowance.
The AER used a different methodology to the Distributors to determine the rate of return. It
believes lower rates are justified because of the improved investment environment since the
last regulatory period, which has resulted in lower financing costs.
Impact on Distributors’ Operating Expenditure
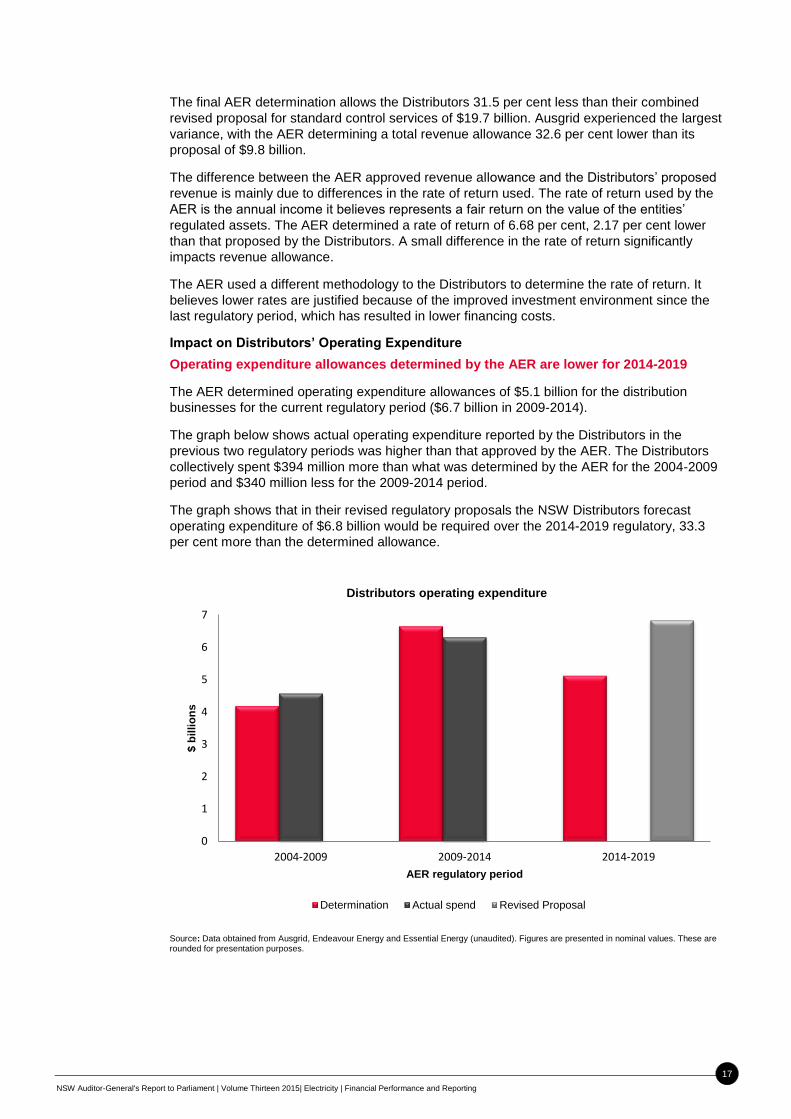
Operating expenditure allowances determined by the AER are lower for 2014-2019
The AER determined operating expenditure allowances of $5.1 billion for the distribution
businesses for the current regulatory period ($6.7 billion in 2009-2014).
The graph below shows actual operating expenditure reported by the Distributors in the
previous two regulatory periods was higher than that approved by the AER. The Distributors
collectively spent $394 million more than what was determined by the AER for the 2004-2009
period and $340 million less for the 2009-2014 period.
The graph shows that in their revised regulatory proposals the NSW Distributors forecast
operating expenditure of $6.8 billion would be required over the 2014-2019 regulatory, 33.3
per cent more than the determined allowance.
Source: Data obtained from Ausgrid, Endeavour Energy and Essential Energy (unaudited). Figures are presented in nominal values. These are rounded for presentation purposes.
0
1
2
3
4
5
6
7
2004-2009 2009-2014 2014-2019
$ b
illi
on
s
AER regulatory period
Distributors operating expenditure
Determination Actual spend Revised Proposal

NSW Auditor-General's Report to Parliament | Volume Thirteen 2015 | Electricity | Financial Performance and Reporting
18
The chart below shows the share of percentage difference between the AER determined
operating expenditure allowance and that proposed by each Distributor. Essential Energy has
the largest difference when comparing total operating expenditure determined by the AER
against their proposal, closely followed by Ausgrid.
Source: Determination and Revised Proposal obtained from Ausgrid, Endeavour Energy and Essential Energy (unaudited).
The Distributors have lodged an appeal with the Australian Competition Tribunal over the cuts
to operating expenditure allowances. Details on this appeal are discussed later in this report.
Impact on Distributors’ Capital Expenditure
AER capital expenditure allowances are 9.2 per cent lower than those proposed by
Distributors
The AER approved lower total capital expenditure allowances of $7.6 billion for 2014-2019
($15.6 billion for 2009-2014) for the distribution businesses.
Capital expenditure by the Distributors for the 2009-2014 regulatory period was $3.2 billion
(20.5 per cent) lower than the AER allowance of $15.6 billion. The lower capital spend is
attributed to reduced peak demand, and strategies and initiatives implemented in the latter
part of the regulatory period, which allowed the Distributors to deliver capital programs at a
lower cost proportionate with network risk.
Ausgrid42%
Endeavour Energy15%
Essential Energy43%
Share of difference between AER determined operating expenditure and proposal made by Distributors

NSW Auditor-General's Report to Parliament | Volume Thirteen 2015| Electricity | Financial Performance and Reporting
19
In both the 2009-2014 and the 2014-2019 regulatory periods, revised proposals submitted by
the Distributors have exceeded the amount approved by the AER. The AER approved capital
expenditure allowances of $7.6 billion for the 2014-2019 regulatory period is $773 million less
than that proposed by the Distributors. This is reflected in the graph below.
Source: Data obtained from Ausgrid, Endeavour Energy and Essential Energy (unaudited). Figures are presented in nominal values. These are rounded for presentation purposes.
The AER determines the capital expenditure allowance it believes a prudent and efficient
operator requires to operate its network safely, meet realistic demand expectations and
comply with its obligations and service standards.
In 2014-15, the number of capital asset management plans completed by Ausgrid and
Essential Energy were below target by nine per cent and eight per cent respectively. They
attribute this to more efficient cost delivery models, and cancelling or deferring projects due to
low energy demand. Asset conditions were also reassessed in response to the decline in
electricity consumption. Endeavour Energy achieved its target by three per cent.
TransGrid
The AER made a four year determination for TransGrid to align regulatory review periods
across all transmission businesses in Australia. The previous determination period was for
five years.
0
2
4
6
8
10
12
14
16
2009-2014 2014-2019
$ b
illi
on
s
AER regulatory period
Distributors capital expenditure - Determined, proposed and actual
AER determination Revised Proposal Actual spent

NSW Auditor-General's Report to Parliament | Volume Thirteen 2015 | Electricity | Financial Performance and Reporting
20
The diagram below summaries the combined revenue and expenditure impacts of the AER’s
determination on TransGrid for the 2014-2018 regulatory period.
Source: Data obtained from TransGrid (unaudited). Figures are presented in nominal values. These are rounded for presentation purposes.
If the current and previous regulatory periods are annualised for comparative purposes, there
was no significant change to TransGrid’s revenue or operating expenditure allowances for
the 2014-2018 period. The main impact of the AER’s determination for TransGrid is a lower
capital expenditure allowance. The previous regulatory period allowed for higher network
investment to meet projected growth in maximum demand.
The AER estimates the lower transmission charges, if passed through to customers, will result
in the following reductions to average annual electricity bills for 2015-16:
• $22 - $25 for residential customers
• $34 - $41 for small business customers.
Impact on TransGrid’s revenue
The AER’s annualised revenue allowance for TransGrid decreased by five per cent
TransGrid’s AER determined revenue allowance for 2014-2018 is $3.0 billion ($4.0 billion
for 2009-2014). The four year allowance is 25 per cent lower than the previous five year
determination. For comparative purposes, if the 2014-2018 determination is annualised,
TransGrid is allowed to earn $40.4 million less revenue each year than in the 2009-2014
period, a five per cent decrease.

NSW Auditor-General's Report to Parliament | Volume Thirteen 2015| Electricity | Financial Performance and Reporting
21
TransGrid’s revenue allowance is $715 million less than that proposed to the AER
The chart below shows TransGrid’s total revenue of $2.2 billion approved by the AER
for 2015-2018 is 24.7 per cent less than their revised proposal of $2.9 billion. The difference is
mainly due to the rate of return the AER believes represents a fair return on the value of
TransGrid’s assets. The AER determined a fair rate of return at 6.75 per cent, 1.9 per cent
lower than TransGrid’s proposed rate of return.
Source: Data obtained from TransGrid (unaudited). Figures are presented in nominal values. These are rounded for presentation purposes.
The AER believes lower rate of return for TransGrid is justified due to the improved
investment environment since the last regulatory period, which has resulted in lower financing
costs.
Impact on TransGrid’s Operating Expenditure
The AER operating expenditure allowance is lower for the current regulatory period
The AER has approved an operating expenditure allowance of $708 million for TransGrid in
the current regulatory period ($800 million in 2009-2014).
AER approved, $2.2 billion
$715 million not approved by the
AER
Portion of TransGrid's revenue proposal approved by AER

NSW Auditor-General's Report to Parliament | Volume Thirteen 2015 | Electricity | Financial Performance and Reporting
22
The graph below shows actual operating expenditure reported by TransGrid for the previous
period was $52.9 million lower than that approved by the AER for the 2009-2014 period.
TransGrid’s revised operating expenditure proposal of $766 million for the 2014-2018 period
exceeds the AER approved allowance by $58.5 million. This is mainly due to a different
forecasting method used by TransGrid and the AER. TransGrid is not appealing the AER’s
recent determination.
Source: Data obtained from TransGrid (unaudited). Figures are presented in nominal values. These are rounded for presentation purposes.
Impact on TransGrid’s Capital Expenditure
The AER capital expenditure allowance of $1.1 billion is 25.4 per cent lower than that
proposed by TransGrid
The AER has approved a total capital expenditure allowance for TransGrid of $1.1 billion
($2.6 billion for 2009-2014). TransGrid mainly attribute the decrease to a reduction in forecast
network load growth.
0
100
200
300
400
500
600
700
800
2009-2014 2014-2018
$ m
illi
on
s
TransGrid Operating Expenditure
AER Determination Actual Spend Revised Proposal

NSW Auditor-General's Report to Parliament | Volume Thirteen 2015| Electricity | Financial Performance and Reporting
23
The graph below shows TransGrid’s actual capital expenditure was $559 million less than the
AER approved expenditure of $2.6 billion for the 2009-2014 regulatory period. This
expenditure is attributed to reduced energy demand, and strategies and initiatives
implemented in the latter part of the regulatory period, which allowed TransGrid to deliver its
capital programs at a lower cost.
Source: Data obtained from TransGrid (unaudited). Figures are presented in nominal values. These are rounded for presentation purposes.
The AER approved capital expenditure allowance of $1.1 billion for the 2014-2018 regulatory
period is $356 million less than that proposed by TransGrid.
Response to AER Determination
NSW Distributors are appealing the recent AER determination
Merit Appeal
In May 2015, the NSW Distributors lodged appeals with the Australian Competition Tribunal
(ACT) and the Federal Government against the cuts to operating programs in the AER’s final
determination. The application lodged with the ACT appeals the determination because:
• of the impact on vegetation and bushfire risk mitigation programs
• it does not provide a workable transition plan to implement continued efficiency
improvements.
The Distributors are also seeking a review of the cost of capital allowed by the AER because it
reduces the allowed interest rate on debt below the efficient benchmark cost of debt for an
entity with an efficient debt portfolio.
The Distributors did not appeal the capital expenditure reductions because they have
developed strategies to align revised capital expenditure with the AER’s approved capital
allowance.
The outcome of the appeal will be known during the 2015-16 financial year. TransGrid did not
lodge an appeal.
0.0
0.5
1.0
1.5
2.0
2.5
3.0
2009-2014 2014-2018
$b
illi
on
s
AER regulatory period
TransGrid Capital Expenditure - Determined, Revised Proposal and Actual
AER determination Revised Proposal Actual spend

NSW Auditor-General's Report to Parliament | Volume Thirteen 2015 | Electricity | Financial Performance and Reporting
24
Unfunded Employee Positions
At 1 July 2015, 2,752 employee positions were unfunded
Distributors estimate they had 2,750 unfunded employee positions at 1 July 2015 as a result
of the AER’s allowance for capital and operating expenditure during the 2014-2019
determination period.
The chart below shows Essential Energy has the most unfunded positions amongst the
Distributors, accounting for 51 per cent of the total. Endeavour Energy has the least,
accounting for nine per cent of the total. TransGrid estimates it only had two unfunded
positions.
Source: Network NSW Recognition of Restructure and Redundancy Provisions 30 June 2015 – Position Paper (unaudited).
To meet the AER reduced capital and operating expenditure allowance the electricity
businesses are implementing the following initiatives to improve efficiency and reduce
operating expenditure. These include:
• voluntary employee redundancies
• continuous review of asset management programs, including the timing of critical
projects and maintenance works
• implementing strategic procurement processes, including obtaining the most
competitive prices for products and services purchased
• improved asset utilisation, including fleet reduction programs and termination of leases
for office accommodation and storage facilities
• improving capital investment
• benchmarking internal delivery of services with external providers.
Ausgrid40%
Endeavour Energy9%
Essential Energy51%
Total Distributors' Unfunded Employee Positions at 1 July 2015

NSW Auditor-General's Report to Parliament | Volume Thirteen 2015| Electricity | Financial Performance and Reporting
25
Sale and Lease of Electricity Businesses and Assets
The NSW Government continues to divest its interest in NSW electricity businesses
Lease of TransGrid
On 25 November 2015, the NSW Government announced the successful consortium to lease
TransGrid for 99 years for $10.3 billion. TransGrid will be leased to a private consortium
comprising a Canadian pension fund, the Abu Dhabi Investment Authority, Kuwait Investment
Authority and local infrastructure funds. Net proceeds from this transaction will be used to
build new infrastructure. Financial completion of this transaction is expected to occur
mid December 2015.
Sale of Delta Electricity assets
On 30 January 2015, Colongra power station was sold to Snowy Hydro Limited. The NSW
Government announced the sale of Delta Electricity’s Vales Point coal-fired power station to
Sunset Power International Pty Ltd and a joint venture between Vales Point Investments Pty
Limited and Waratah Energy Pty Limited in November 2015 for $1.0 million, but retains
Munmorah power station and the remaining renewable assets of Green State Power.
Cobbora
On 19 November 2015, the NSW Government announced its decision to stop the sale
process for the Cobbora Coal mine. Instead, it plans to sell the land for agricultural use. The
valuation of the land for this purpose exceeds all offers made by parties interested in
developing a mine on the site. Plans to sell the Cobbora landholdings will commence shortly.
Sale of Macquarie Generation
On 2 September 2014, the NSW Government completed the sale of Liddell and Bayswater
power stations to AGL Energy for $1.5 billion. Macquarie Generation was dissolved on
27 February 2015 after vesting its remaining assets and liabilities to other government
agencies.
Transfer of Green State Power
On 18 July 2014, the NSW Government sold a significant portion of Green State Power’s
renewable assets for $72.2 million. On 8 December 2014, it transferred the remaining assets
to Delta Electricity and deregistered Green State Power on 5 July 2015.
Long-term Lease of the Distribution Businesses
On 4 June 2015, the Electricity Network Assets (Authorised Transactions) Act 2015 and the
Electricity Retained Interest Corporations Act 2015 were enacted to allow New South Wales
to proceed with the long term lease of 49 per cent of the State’s electricity network (the
Transaction), including 100 per cent of TransGrid and 50.4 per cent of Ausgrid and Endeavour
Energy. The net proceeds from the lease transactions will directly fund Rebuilding NSW, a
$20.0 billion program to improve infrastructure to meet the State’s needs.
On 14 July 2014, the NSW Government appointed UBS and Deutsche Bank to oversee a
scoping study for the long-term leasing of the State’s electricity network. The advisors found
the network businesses were likely to attract a broad range of domestic and international
investors due to their long-term strategic value as regulated assets.

NSW Auditor-General's Report to Parliament | Volume Thirteen 2015 | Electricity | Financial Performance and Reporting
26
Electricity Distribution Business Reform
Distributors will spend almost $7.0 billion less than planned under the five year
network reform program
The Distributors estimated the reform program would result in $7.0 billion less in capital and
operating expenditure over the five years to 30 June 2016. The table below shows the
difference between actual expenditure over the past five years and the forecast spend
determined in the 2010-11 Statement of Corporate Intent. The reforms were intended to
improve efficiency and reduce costs to keep average network electricity price increases at or
below the Consumer Price Index over the five-year period.
* Forecast relates to the 2010-11 Statement of Corporate Intent.
** 2016 is forecast expenditure.
Source: NSW Distributors (unaudited).
The Distributors advise the reduced spend is being achieved through reduced capital
expenditure programs due to declining consumer demand, common management structures
across the Distributors, fewer employees, improved management of overtime and targeted
sales of non-system assets. The fall in employee numbers was achieved through natural
attrition, reduced hiring and voluntary redundancies.
Transitional Service Arrangements
For each of the Distributors, Transitional Service Arrangements (TSAs) were entered into as
part of the Sale and Purchase Agreements for the electricity retail businesses in March 2011.
All award staff affected by the sale were given a five year job guarantee from the sale date.
Ausgrid continued providing services to EnergyAustralia during 2014-15. This service
arrangement expired on 19 December 2014, but Ausgrid continued supplying the transitional
services until 24 February 2015.
In 2014-15, $25.5 million ($7.2 million in 2013-14) was paid or payable to permanent retail
employees who accepted voluntary redundancies.
Financial and Sustainability Analysis
The liquidity (current ratio) and gearing ratios of TransGrid and the Distributors indicate they
may have short term sustainability concerns. However, these entities are able to support
ongoing operations with ratios at these levels, because they have:
• access to regulated revenue streams and rates of return
• assets with long useful lives to generate revenue
• debt funding limits approved by the NSW Treasurer under the Public Authorities
(Financial Arrangements) Act 1987
• access to debt markets through the New South Wales Treasury Corporation
• safeguards within Treasury’s Commercial Policy Framework, including constraints on
the payment of dividends.
2016** 2015 2014 2013 2012 Total
$m $m $m $m $m $m
Ausgrid 1,136 1,071 1,139 791 166 4,303
Endeavour Energy 320 276 141 141 14 892
Essential Energy 565 568 395 207 33 1,768
Total decrease in
expenditure 2,021 1,915 1,675 1,139 213 6,963
Difference between forecast and actual expenditure*
Year ended 30 June
NSW Distributor

NSW Auditor-General's Report to Parliament | Volume Thirteen 2015| Electricity | Financial Performance and Reporting
27
The table below summarises the performance of the Distributors and TransGrid against some
key financial indicators at, and for, the year ended 30 June 2015. Refer to Appendix Three of
this report for further description of ratios and risk assessment.
* Capitalised depreciation has been excluded.
Note: Indicators are calculated based on continuing and discontinued operations.
Source: Financial statements (audited).
Liquidity
The Distributors’ and TransGrid’s liquidity ratios were less than one at 30 June 2015.
TransGrid had the lowest ratio of 0.1. A liquidity ratio of one is generally considered an
appropriate level of liquidity to support business operations. However, in circumstances where
businesses have access to regulated revenue streams, regulated rates of return and strong
cash inflows, businesses can operate at lower levels of liquidity.
Gearing
The NSW Distributors are operating with gearing ratios greater than 60 per cent
(60 per cent debt: 40 per cent equity) at 30 June 2015. The AER uses this benchmark as an
efficient gearing ratio for the NSW Government electricity businesses to ensure customers do
not bear the costs of inefficient financing structures.TransGrid is operating below the AER’s
benchmark. Endeavour Energy has the highest gearing ratio of 68.5 per cent.
Underlying Result
An entity’s underlying result reflects the profit or loss from its ongoing activities. TransGrid and
the Distributor businesses achieved favourable underlying results in 2014-15. Further analysis
of revenue and net results is included earlier in this report.
Capital Replacement Ratio
All entities recorded capital replacement ratios greater than one at 30 June 2015. A ratio
greater than one indicates capital expenditure is greater than the rate of depreciation.
Endeavour Energy had the highest capital replacement ratio, while Ausgrid had the lowest. As
outlined earlier in this report, Endeavour Energy was the only Distributor to achieve its capital
asset management plan target in 2014-15.
Cluster agencies LiquidityGearing
%
Underlying
result
%
Capital
replacement*
Self-
financing
%
Indicator
Electricity transmitters
TransGrid 0.1 58.0 22.9 1.4 43.0
Electricity distributors
Ausgrid 0.4 66.6 13.2 1.1 26.2
Endeavour Energy 0.3 68.5 15.4 2.0 22.5
Essential Energy 0.4 66.8 13.0 1.4 25.2
Financial Sustainability Indicators as at 30 June 2015

NSW Auditor-General's Report to Parliament | Volume Thirteen 2015 | Electricity | Financial Performance and Reporting
28
Long Term Sustainability Trends
The following ratios are derived from the consolidated operations of TransGrid and the
Distributors.
Note: Indicators are calculated based on continuing and discontinued operations.
* excludes the impact for the sale of the retail operations of the electricity Distributor businesses.
Source: Financial statements (audited).
Combined revenue generated by the Distributors and TransGrid increased by $34.0 million to
$7.7 billion in 2014-15. Profit after tax decreased to $1.1 billion for the year ($1.4 billion in
2013-14).
Return on equity fell in 2014-15 mainly due to an overall decrease in the combined net profit
after tax for the Distribution businesses.
The liquidity ratio fell in 2014-15 mainly due to increased borrowings during the year.
Long Term Sustainability for Transmission and Distribution businesses
The following table shows key financial ratios for TransGrid and the Distributors.
Note: Indicators are calculated based on continuing and discontinued operations.
Source: Financial statements (audited).
Distributors
Return on Equity
Return on equity ratios decreased for the Distributors in 2014-15 as all entities generated less
profit after tax. The lower combined profit for the Distributors was mainly attributed to Ausgrid.
Return on Assets
Return on assets ratios decreased for the Distributors in 2014-15 mainly due to Ausgrid’s
reduced profit before interest and tax.
Gearing
At 30 June 2015, total external debt for Distributors was $17.8 billion ($17.2 billion). Gearing
ratios fell slightly in 2014-15 across the Distributors due to higher net assets.
Year ended 30 June 2015 2014 2013 2012 2011
Return on equity (%) 10.6 13.7 18.4 13.0 8.1*
Return on assets (%) 7.8 8.2 10.3 8.7 7.0*
Interest coverage ratio (times) 2.1 2.2 2.7 1.9 1.8*
Gearing ratio (%) 65.6 65.5 65.3 70.1 67.3
Liquidity ratio (times) 0.3 0.4 0.4 0.4 0.4
Long Term Sustainability Trends
Year ended 30 June 2015 2014 2013 2015 2014 2013
Return on equity (%) 9.4 8.7 10.4 10.9 15.1 21.2
Return on assets (%) 7.0 6.7 7.5 8.0 8.5 10.9
Interest coverage ratio (times) 2.7 2.4 2.9 2.0 2.2 2.6
Gearing ratio (%) 57.9 55.4 52.7 67.1 67.5 67.7
Liquidity ratio times 0.1 0.2 0.2 0.4 0.4 0.5
TransGrid Distributors
Long Term Sustainability - TransGrid and Distributors

NSW Auditor-General's Report to Parliament | Volume Thirteen 2015| Electricity | Financial Performance and Reporting
29
TransGrid
Return on Equity and Assets
Returns on equity and on assets increased in 2014-15 as TransGrid generated a higher profit
after tax.
Gearing
TransGrid’s gearing ratio increased in 2014-15 mainly due to a $192 million increase in
short-term borrowings.
Liquidity
TransGrid’s liquidity deteriorated further in 2014-15 due to an increase in short-term
borrowings and the dividend provision.

NSW Auditor-General's Report to Parliament | Volume Thirteen 2015 | Electricity | Financial Controls
30
Financial Controls
Appropriate financial controls help ensure the efficient and effective use of resources and the
implementation and administration of entity policies. They are essential for quality and timely
decision making to achieve desired outcomes.
No high risk internal control weaknesses were
identified in the electricity businesses.
Internal controls were generally designed
appropriately and operated effectively to produce
reliable and timely financial reports.
The information system audits identified only three
issues in 2014-15, compared to 21 issues
in 2013-14.
Information technology (IT) processes and controls
improved in 2014-15 and supported the integrity of
financial data used to prepare the financial
statements.
The costs of overtime and associated allowances
were lower in 2014-15 than 2013-14.
The Distributors and TransGrid have continued to
improve the management of overtime.
External debt held by Distributors and TransGrid
increased by 3.5 per cent to $20.6 billion in 2014-15.
Over $10.1 billion in debt must be repaid or
refinanced over the next five years.
Internal Controls
No high risk control weaknesses were identified by the 2014-15 audits
The 2014-15 audits did not identify any high risk internal control weaknesses, but areas were
identified where internal controls could be improved. These were reported to the relevant
agencies’ management together with recommendations to address the weaknesses. The
audits identified common lower level risks in areas such as information technology, asset
management, segregation of duties and human resource management.
Audits involve performing procedures to obtain sufficient evidence to support the amounts and
disclosures in financial statements. The procedures depend on the auditor’s judgement,
including an assessment of the risks of material misstatement of the financial statements.
When assessing the risks, the auditor considers internal controls relevant to the preparation of
the financial statements, but not for the purpose of expressing an opinion on the effectiveness
of internal control.
Information Technology
The number of IT issues identified in NSW electricity businesses fell in 2014-15
The information system audits identified three issues in the electricity businesses in 2014-15,
compared to 21 issues in 2013-14. All issues reported in the previous financial year were
addressed during 2014-15.
Information technology processes and controls support the integrity of financial data used to
prepare the financial statements and reduce the risk of unauthorised access, security attacks,
data privacy breaches and identity theft.
Financial controls
Observation Conclusion

NSW Auditor-General's Report to Parliament | Volume Thirteen 2015| Electricity | Financial Controls
31
Human Resources
Overtime and Associated Allowances
Overtime and associated allowances were lower in 2014-15
The Distributors and TransGrid have continued to improve the management of overtime,
which is impacted by the frequency of network-related incidents, such as fault and emergency
responses to weather conditions, the need for capital and maintenance work to be completed
outside employees' scheduled operating hours, and the remoteness of some locations where
work is required.
Overtime is paid at a premium rate and, if not effectively managed, may result in unnecessary
costs and increased work, health and safety issues, particularly when fatigued employees
perform high-risk tasks. Previous Auditor-General’s Reports to Parliament have identified the
need to closely monitor overtime levels to ensure business needs are met efficiently.
NSW Distributors and TransGrid
Total overtime and associated allowances paid by Distributors and TransGrid decreased to
$114 million in 2014-15 ($120 million in 2013-14). Ausgrid, the largest Distributor, paid
$49.1 million (43 per cent) of the total overtime expense.
Note: Graph composition does not add due to rounding.
Source: NSW Distributors and TransGrid (unaudited).
43% ($49.1m)
25% ($28.9m)
20% ($22.7m)
12% ($13.8m)
Total overtime and associated allowances for the year ended 30 June 2015
Ausgrid Essential Energy Endeavour Energy TransGrid

NSW Auditor-General's Report to Parliament | Volume Thirteen 2015 | Electricity | Financial Controls
32
The graph below shows overtime and associated allowances, as a percentage of base pay,
fell for TransGrid and all Distributors during 2014-15, except for Ausgrid.
Ausgrid’s overtime increased due to additional work associated with severe weather, which
caused substantial damage to its network in April 2015.
Source: NSW Distributors and TransGrid (unaudited).
In 2014-15, total overtime as a percentage of total base pay ranged from 8.7 per cent for
Essential Energy to 10.9 per cent for TransGrid. Essential Energy and Endeavour Energy
experienced the largest reductions with overtime and associated allowances falling by
$2.6 million and $2.7 million respectively.
In 2014-15, 168 employees were paid more than 50 per cent of their base salary in overtime
and associated allowances, compared to 217 in the prior year. This represents an overall
decrease of 22.6 per cent.
Source: NSW Distributors and TransGrid (unaudited).
Asset Management
Borrowings
External debt held by Distributors and TransGrid increased by 3.5 per cent in 2014-15
The Distributors’ and TransGrid’s total external debt increased to $20.6 billion at
30 June 2015 ($19.9 billion at 30 June 2014). Ausgrid accounted for 43.7 per cent of the total
debt with borrowings of $9.0 billion ($8.7 billion). It has the largest capital investment program
of the Distributors.
9.19.5
10.3
12.7
9.5
8.79.3
10.9
0.0
2.0
4.0
6.0
8.0
10.0
12.0
14.0
Ausgrid Essential Energy Endeavour Energy TransGrid
%
Year ended 30 June
NSW Distributors and TransGridOvertime and associated allowances as a percentage of base pay
2014 2015
Year ended 30 June 2015 2014 2013
NSW Distributor
Ausgrid 144 169 245 (14.8)
Essential 11 32 144 (65.6)
Endeavour 12 6 17 100.0
TransGrid 1 10 11 (90)
Total 168 217 417 (22.6)
Number of employees receiving more than 50% of their base salary in
overtime and associated allowances
Increase/(Decrease)
from 2014
%

NSW Auditor-General's Report to Parliament | Volume Thirteen 2015| Electricity | Financial Controls
33
The chart below shows Distributors account for 86.1 per cent of the total external debt held by
electricity businesses at 30 June 2015. Generators had no debt at 30 June 2015.
Source: NSW Distributors, NSW generators and TransGrid Financial Statements (audited).
Over $10.1 billion in debt must be repaid or refinanced over the next five years
The Distributors and TransGrid are due to repay or refinance 49.3 per cent of their total debt
in the next five years.
Historically, debt levels have increased with the Distributors and TransGrid rolling over debts
as they fall due.
The following graph shows the debt maturity profile of the Distributors and TransGrid:
> 2026 includes all debt maturing in the financial year ending 30 June 2026 and beyond.
Source: NSW Distributors and TransGrid (audited).
86.1%
13.9%
Share of total external debt at 30 June 2015
Distributors TransGrid
0.0
0.5
1.0
1.5
2.0
2.5
3.0
2016 2017 2018 2019 2020 2021 2022 2023 2024 2025 >2026
$b
Year ended 30 June
Debt maturity profile for NSW Distributors and TransGridat 30 June 2015

NSW Auditor-General's Report to Parliament | Volume Thirteen 2015 | Electricity | Financial Controls
34
Borrowing costs of electricity businesses increased marginally in 2014-15
Borrowing costs (including capitalised interest) totalled $1.6 billion in 2014-15, marginally
higher than 2013-14. External debt held by all electricity businesses at 30 June 2015 was
$20.6 billion ($21.3 billion). The decrease in external debt was mainly due to the repayment of
debt from the proceeds received from the sale of Macquarie Generation and Colongra power
station. Delta Electricity’s remaining debt of $259 million was assumed by the Crown.
Source: NSW Distributors, NSW generators and TransGrid Financial Statements (audited).
Asset Maintenance
Maintenance expenditure in 2014-15 is consistent with the previous year
The following table shows the value of the Distributors and TransGrid’s property, plant and
equipment (PPE) increased 35 per cent ($9.2 billion) over the past five years. However, the
ratio of maintenance expenditure to PPE values has decreased from 3.4 per cent in 2010-11
to 2.4 per cent in 2014-15.
Source: NSW Distributors and TransGrid (audited).
More than $4.4 billion has been spent on maintenance over the past five years
The Distributors and TransGrid have spent over $4.4 billion on maintenance over the past five
years. Essential Energy accounted for 44.4 per cent of this expenditure. It maintains the
electricity distribution network in regional New South Wales, servicing 95 per cent of the area
within the State.
Ausgrid incurred 31.9 per cent of total maintenance expenditure. It maintains the electricity
distribution network in Sydney, Newcastle, the Hunter Valley and Central Coast of New South
Wales.
Year ended 30 June 2015 2014 2013
$m $m $m
Borrowing costs 151 112 129
External debt -- 1,370 1,530
Distributors
Borrowing costs 1,231 1,237 1,220
External debt 17,771 17,161 16,197
TransGrid
Borrowing costs 173 176 166
External debt 2,875 2,738 2,436
Total borrowing costs 1,555 1,525 1,515
Total external debt 20,646 21,269 20,163
Borrowing Costs and External Debt
Year ended 30 June 2015 2014 2013 2012 2011
Maintenance expenditure ($m) 865 864 918 901 882
PPE values at 30 June ($b) 35.5 34.7 33.5 29.1 26.3
Maintenance expenditure/PPE values (%) 2 3 3 3 3.4
Asset Maintenance Expenditure

NSW Auditor-General's Report to Parliament | Volume Thirteen 2015| Electricity | Financial Controls
35
Endeavour Energy incurred 15.5 per cent of total maintenance expenditure. It maintains the
electricity distribution network in Sydney’s Greater West, the Blue Mountains, Southern
Highlands, Illawarra and South Coast of New South Wales.
Source: NSW Distributors and TransGrid (audited).
Distributors spent less than budget on maintenance in 2014-15, but met maintenance
targets
In 2014-15, the Distributors spent a total of $794 million on maintenance, compared to the
budget of $807 million. Ausgrid exceeded its $229 million budget by $47.0 million mainly due
to repairs associated with severe storm damage in April 2015. Essential Energy and
Endeavour Energy spent $56.0 million and $4.0 million less than budget respectively.
Source: NSW Distributors (unaudited).
Endeavour15.5%
Essential44.4%
Ausgrid31.9%
Transgrid8.2%
Total maintenance expense over the past five years
229
440
138
276
384
134
100
150
200
250
300
350
400
450
500
Ausgrid Essential Energy Endeavour Energy
$ m
illio
ns
2014-15 Distributors' Maintenance Expense vs Budget
Budget Actual

NSW Auditor-General's Report to Parliament | Volume Thirteen 2015 | Electricity |
36
Governance
Governance refers to the framework of rules, relationships, systems and processes within,
and by which, authority is exercised and controlled. It includes the systems the entities, and
those charged with governance, use and are held to account by others.
This chapter outlines key findings about Governance relating to the Distributors and TransGrid
for 2014-15. The key findings and conclusions are summarised in the following table.
The NSW Government enacted legislation to lease
49 per cent of the State’s electricity networks.
In 2014-15, the NSW Government confirmed
TransGrid, Ausgrid and Endeavour Energy would be
leased in full or in part to the private sector.
On 25 November, the NSW Government announced
the successful consortium to lease TransGrid for 99
years for $10.3 billion.
Net proceeds from these transactions will be used to
build new infrastructure.
In 2014-15, the Distributors and TransGrid referred
33 incidents of fraud, three less than in 2013-14.
The Distributors and TransGrid have continued to
implement frameworks to prevent, identify,
investigate and report suspected and actual fraud.
Governance reporting
Observation Conclusion

NSW Auditor-General's Report to Parliament | Volume Thirteen 2015| Electricity | Governance
37
Governance Frameworks
Key Legislative Changes
Legislation enacted to lease 49 per cent of the State’s electricity networks
On 4 July 2015, the Electricity Network Assets (Authorised Transactions) Act 2015 and the
Electricity Retained Interest Corporations Act 2015 were enacted by the NSW Government.
Electricity Network Assets (Authorised Transactions) Act 2015
The Electricity Network Assets (Authorised Transactions) Act 2015 (ENA Act) allows the NSW
Government to lease 49 per cent of the State's electricity networks to the private sector for an
initial term of up to 99 years. Net proceeds from the transactions will be used to build new
infrastructure. The ENA Act prevents transfer of Essential Energy’s assets, rights or liabilities.
Key elements of the ENA Act include:
• cessation of the joint board arrangements for Ausgrid, Endeavour Energy and Essential
Energy, when requested by the Treasurer
• successful bidders are required to guarantee total network charges for the 2018-19
financial year are lower than in 2013-14
• successful bidders will need to promote efficient investment in operations, protect the
long term interests of electricity consumers and comply with the AER’s Efficiency
Benefit Sharing Scheme
• transferred employees will be entitled to the same work terms and conditions when the
leases commence. A five year employment guarantee period will exist from 1 July 2015
to 30 June 2020
• the following minimum numbers of full time employees must be maintained, 3,570 for
Ausgrid, 2,100 for Endeavour Energy and 1,000 for TransGrid
• no forced redundancies can occur during the guarantee period other than by agreement
or in accordance with the Fair Work Act 2009 for continuing employees
• the Treasurer may direct that no State tax is payable on the privatisation of a network.
Electricity Retained Interest Corporations Act 2015 (NSW)
The Electricity Retained Interest Corporations Act 2015 (NSW) (ERIC Act) addresses how
residual electricity network assets, retained by the State, will be managed following the long
term leases to the private sector.
The key elements of the ERIC Act include:
• the creation of corporations to hold the retained interests on behalf of the State
• ensuring the corporations properly manage the retained assets and maximise their
returns to the State
• the governance arrangements for each corporation.
Since 1 July 2012, all three NSW Distributors operated as separate legal entities managed by
a joint Board of Directors and common Chief Executive Officer. In preparation for the partial
lease of Ausgrid and Endeavour Energy, the group management structure of Networks NSW
was dissolved on 1 July 2015.
Parliamentary Review
In May 2015, an inquiry was held into the leasing of the State’s electricity infrastructure. The
final report was released on 2 June 2015. It concluded that leasing the electricity infrastructure
is expected to result in lower electricity network and retail prices.
The inquiry also concluded the leasing arrangements are expected to have a neutral impact
on the safety and reliability of the services provided by the leased network businesses.

NSW Auditor-General's Report to Parliament | Volume Thirteen 2015 | Electricity | Governance
38
Risk Management
Risk management has been implemented across the NSW electricity businesses
Effective risk management can improve decision making and lead to significant efficiencies
and cost savings. By embedding risk management directly into processes, agencies can
derive additional value from their risk management programs. The more mature an agency’s
risk management, the stronger its culture in balancing the tension between value creation and
protection.
Treasury Policy Paper TPP 15-03: Internal Audit and Risk Management Policy for the NSW
Public Sector requires an agency to establish and maintain an appropriate risk management
framework and related processes.
A mature risk management process should:
• foster an embedded risk aware culture
• align strategic and business decision making processes with risk management activities
• improve resilience in dealing with adversity
• increase agility in pursuing new opportunities.
Agencies will need to evaluate the costs and benefits of risk management capability if they are
to achieve a desirable balance between risk and reward. Some agencies may need more
sophisticated risk management processes than others to suit the size and complexity of their
activities.
During 2014-15, NSW electricity businesses self-assessed their overall risk maturity. The
assessments indicate that the respondents believe:
• risk management is fully implemented across the businesses and used in day to day
management activities
• there is strong recognition of risk management at Board level
• aggregated risk reports are prepared and reported to executive management
• risk management is proactive and key risk indicators are collected and monitored
consistently.

NSW Auditor-General's Report to Parliament | Volume Thirteen 2015| Electricity | Governance
39
Fraud Control
Instances of alleged fraud and corruption have reduced
In 2014-15, 33 incidents of alleged fraud and corruption were reported to the Independent
Commission Against Corruption (ICAC) or were referred to the Chief Executives of the
Distributors or TransGrid by ICAC. This compares to 36 in 2013-14 and equates to an
average of one alleged incident per 400 employees. The businesses employed over 14,000
employees during 2014-15.
The chart below shows that a similar number of the alleged incidents occurred in Essential
Energy, Endeavour Energy and Ausgrid. TransGrid only referred one incident to the ICAC
in 2014-15.
Note: Graph composition does not add due to rounding.
Source: TransGrid and NSW Distributors (unaudited).
Endeavour Energy33%
Ausgrid30%
Essential Energy33%
TransGrid3%
Share of alleged incidents of fraud and corruption in 2014-15Distributors and TransGrid

NSW Auditor-General's Report to Parliament | Volume Thirteen 2015 | Electricity | Governance
40
The following chart shows the outcome of the entities’ investigations into the alleged incidents
of fraud and corruption in 2014-15.
The main types of substantiated incidents were breaches of codes of conduct, misuse of
resources, timesheet fraud and theft. Other types of substantiated incidents of fraud or
corruption mainly relate to falsifying records and recruitment.
Substantiated incidents mainly resulted in the termination of employees or contractors,
counselling or formal warnings.
Source: TransGrid and NSW Distributors (unaudited).
The Distributors and TransGrid have strong frameworks to help prevent, identify, investigate
and report suspected and actual fraud. In 2014-15, they conducted the following fraud and
corruption activities:
• reviewed and updated the fraud risk registers during the year to respond to changes in
business environments
• developed a new Fraud and Corruption Control Plan for 2015-2017.
The Distributors’ fraud investigation procedures require all allegations to pass through a
three-stage process of assessment and investigation. This process ensures only allegations
supported by evidence progress to investigation.
Breach of code17%
Timesheet fraud10%
Theft10%
Misuse of resources10%
Other: 53%
Substantiated Types of Fraud or Corruption in 2014-15Distributors and TransGrid

NSW Auditor-General's Report to Parliament | Volume Thirteen 2015| Electricity | Service Delivery
41
Service Delivery
This chapter outlines key findings about Service Delivery for the Distributors and TransGrid for
2014-15. The key findings and conclusions are summarised in the following table.
Demand for electricity is falling, but the total amount
of energy used fell less than it did in 2013-14.
The downward trend in energy consumption slowed
in 2014-15 mainly due to the repeal of the carbon
price, lower electricity price movements and a cooler
winter season.
Network reliability improved for TransGrid and
Ausgrid, but deteriorated for Essential Energy and
Endeavour Energy.
Severe unfavourable weather events throughout
2014-15 impacted network reliability for Essential
Energy and Endeavour Energy.
TransGrid’s attribute network reliability improved
mainly due to effective maintenance and operation of
the network, and improvements to design standards.
Customer satisfaction, controllable network incidents
and lost time injury rates improved for Distributors.
Increased focus on customer orientated processes
and safety has improved customer satisfaction and
safety.
Customer Demand for Electricity
Demand for electricity continues to fall
The Australian Energy Market Operator (AEMO) reported the following average growth rates
in energy consumption and peak demand for electricity in New South Wales over the last four
years.
Source: AEMO National Electricity Forecasting Report 2015 (unaudited).
The decrease in the peak demand for electricity in 2014-15 is attributed to fewer days with a
maximum temperature over 30°C compared to previous years.
Energy consumption has declined since 2011-12 partly due to penetration of energy efficient
appliances, rising electricity prices, loss of major industrial load and an increase in the number
of rooftop solar panel systems.
The downward trend in energy consumption slowed in 2014-15 mainly due to the repeal of the
carbon price in 2014-15, lower electricity price movements and a cooler winter season.
Average growth rate for the year ended 30 June 2015 2014 2013 2012
Peak demand increase/(decrease) (%) (1.2) 0.5 1 1.2
Energy consumption increase/(decrease) (%) (0.1) (2.8) (2.1) 1.2
Service Delivery
Observation Conclusion

NSW Auditor-General's Report to Parliament | Volume Thirteen 2015 | Electricity | Service Delivery
42
Although the trend for energy consumption has generally been falling in recent years, the
electricity businesses are still required to meet set reliability and performance standards. The
cost of maintaining this capacity and reliability is reflected in network costs and customers’
electricity bills.
The graph below shows electricity peak demand in New South Wales was well below the total
system capacity for the entire financial year. Electricity prices are based on the cost of system
capacity, not the cost of electricity used.
* NSW regulated capacity includes all fuel sources of NSW registered participants with the NEM. The graph assumes capacity levels remain
constant for the entire year.
Source: Maximum (Peak) Demand from AEMO aggregated price and demand data 2014 and 2015. NSW Regulated Capacity sourced from AEMO registration and exemption list as at 24 March 2015 – accessed 14 October 2015 (unaudited).
Industry Benchmarks
The Distributors and TransGrid use a range of common benchmarks to assess their financial,
operational and environmental performance.
Distributors’ Benchmarks
* SENI is defined as significant electrical network incidents.
Source: NSW Distributors Draft Annual Report 2014-15 and Statement of Corporate Intent 2014-15 (unaudited).
0
5,000
10,000
15,000
20,000
July Aug Sep Oct Nov Dec Jan Feb Mar Apr May Jun
Me
ga
wa
tts
Year ended 30 June 2015
Electricity demand in New South Wales versus capacity
Maximum demand NSW regulated capacity*
Year ended 30 June 2015 2015 2014 2015 2015 2014 2015 2015 2014
Actual Target Actual Actual Target Actual Actual Target Actual
Operational statistics
Network reliability – unplanned system average
interruption duration index SAIDI (minutes)71.4 83.3 76.5 222 236 181 104 89 83
Customer satisfaction (%) 79 80 78 82 80 81 80 80 78
Employee statistics
Lost time injury frequency rate 1.4 2 1.8 1.5 2 2 2.7 2 4.8
Reportable incidents - controllable SENI* 44 49 50 12 11 11 16 18 18
Reportable incidents – environment 4 6 5 2 4 5 -- 1 --
Ausgrid Essential Energy Endeavour Energy
Environmental statistics

NSW Auditor-General's Report to Parliament | Volume Thirteen 2015| Electricity | Service Delivery
43
Network reliability performance varies for each Distributor
The system average interruption duration index (SAIDI) is a measure of network reliability and
represents the number of minutes, on average, a customer is without electricity. In 2014-15,
Ausgrid improved its SAIDI compared to 2013-14, while Endeavour’s and Essential Energy’s
performance fell. Ausgrid and Essential Energy performed better than their targets, while
Endeavour Energy performed below its target.
SAIDI for all Distributors was impacted by severe unfavourable weather events
throughout 2014-15.
Customer satisfaction improved marginally from the previous year for all Distributors
In 2014-15, Ausgrid did not meet its customer satisfaction target, but performed better than
the previous year. Essential Energy and Endeavour Energy either met or exceeded their
customer satisfaction targets.
Customer satisfaction improved partly due to the Distributors having more focus on customer
orientated processes, which included the introduction of Customer Commitment Statements to
raise customer awareness and ensure better alignment of business decisions to customers’
needs and priorities.
Lost time Injury Rates improved for all Distributors compared to 2013-14
The lost time injury frequency rate (LTIFR) represents lost time injuries per one million hours
worked. In 2014-15, Ausgrid and Essential Energy performed better than target and the
previous year, primarily due to work on their health and safety strategic plans. Endeavour
Energy did not achieve its LTIFR target of 2.0, but its performance improved compared to the
previous year. Endeavour Energy is continuing to implement key strategic elements of its
health, safety and environment plan.
Controllable network incidents fell for most Distributors in 2014-15
The reportable incidents, controllable significant electrical network incidents (SENI), were
better than target and the previous year for both Ausgrid and Endeavour Energy. The SENI
was higher than target and 2013-14 for Essential Energy. Improvements in the SENI are
attributed to the implementation of safety action plans to improve safety behaviours, culture
and performance. The plans focus on fatal risk management, safety management systems
and, safety training and development.
Reported environmental incidents fell for all Distributors
All Distributors experienced reductions in reportable environmental incidents in 2014-15 and
performed better than target. An Environment Strategy has been implemented across all
Distributors to reduce and manage such incidents.
TransGrid’s Benchmarks
Source: TransGrid data return (unaudited).
N/A: No target exists for TransGrid’s network reliability as there are no external regulatory targets established.
Year ended 30 June 2015 2015 2014
Actual Target Actual
Operational statistics
Network reliability – system minutes lost 0.31 N/A 0.64
Customer satisfaction (%) 74 >72.0 70.9
Employee statistics
Lost time injury frequency rate (LTIFR) 1.9 -- 0.9
Number of 'high consequence’ incidents 10 -- 7
Environmental statistics
1 -- --
TransGrid
Reportable environmental incidents requiring
regulatory sanctions
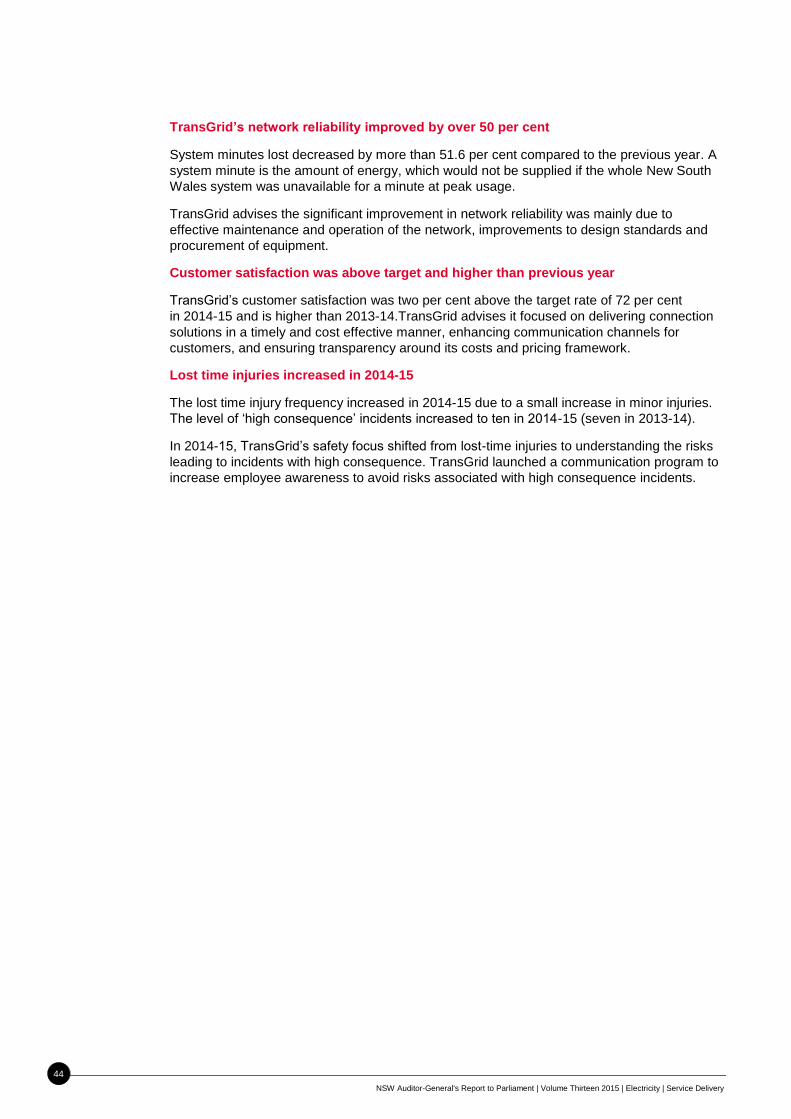
NSW Auditor-General's Report to Parliament | Volume Thirteen 2015 | Electricity | Service Delivery
44
TransGrid’s network reliability improved by over 50 per cent
System minutes lost decreased by more than 51.6 per cent compared to the previous year. A
system minute is the amount of energy, which would not be supplied if the whole New South
Wales system was unavailable for a minute at peak usage.
TransGrid advises the significant improvement in network reliability was mainly due to
effective maintenance and operation of the network, improvements to design standards and
procurement of equipment.
Customer satisfaction was above target and higher than previous year
TransGrid’s customer satisfaction was two per cent above the target rate of 72 per cent
in 2014-15 and is higher than 2013-14.TransGrid advises it focused on delivering connection
solutions in a timely and cost effective manner, enhancing communication channels for
customers, and ensuring transparency around its costs and pricing framework.
Lost time injuries increased in 2014-15
The lost time injury frequency increased in 2014-15 due to a small increase in minor injuries.
The level of ‘high consequence’ incidents increased to ten in 2014-15 (seven in 2013-14).
In 2014-15, TransGrid’s safety focus shifted from lost-time injuries to understanding the risks
leading to incidents with high consequence. TransGrid launched a communication program to
increase employee awareness to avoid risks associated with high consequence incidents.

Section Two
Appendices

NS
W A
ud
itor-G
en
era
l's R
ep
ort to
Parlia
me
nt | V
olu
me
Th
irtee
n 2
01
5 | E
lectric
ity | A
pp
en
dix
On
e –
Fin
an
cia
l Info
rmatio
n
46
Appendix One – Financial Information
Source: Financial statements (audited).
2015 2014 2015 2014 2015 2014 2015 2014 2015 2014
$m $m $m $m $m $m $m $m $m $m
Generator
Delta Electricity 325 1,053 311 1,035 293 581 791 563 (498) 18
Macquarie Generation -- 2,266 -- 1,340 171 1,307 416 1,154 (245) 153
Electricity transmitter
TransGrid 6,647 6,550 4,554 4,342 887 858 684 667 203 191
Electricity distributors
Ausgrid 16,084 16,246 11,575 11,811 3,173 3,335 2,753 2,727 420 608
Endeavour Energy 7,198 6,913 5,364 5,193 1,577 1,498 1,333 1,197 244 301
Essential Energy 8,228 8,037 5,846 5,919 2,053 1,965 1,787 1,670 266 295
Total assets Total liabilities Total revenue Total expense Net result

NS
W A
ud
itor-G
en
era
l's R
ep
ort to
Parlia
me
nt | V
olu
me
Th
irtee
n 2
01
5 | E
lectric
ity | A
pp
en
dix
Tw
o –
Pe
rform
an
ce
Ag
ain
st B
ud
ge
t
47
Appendix Two – Performance Against Budget
* Includes NUOS, capital contributions, solar bonus recovery and other income
** Includes transactions taken directly to equity, such as asset revaluation movements and actuarial movements on defined benefit superannuation plans.
2015 SCI 2015 SCI* 2015 SCI* 2015 SCI*
$m $m $m $m
Total revenue 887 904 3,173 3,002 1,577 1,436 2,053 1,825
Profit before tax 292 -- 597 385 348 215 381 109
Profit after tax 203 176 420 269 244 151 266 77
Total other comprehensive income/(expense)** (25) -- 67 -- 37 -- 57 --
Total comprehensive income/(expense) 178 -- 487 -- 281 -- 323 --
Total assets 6,647 -- 16,084 -- 7,198 -- 8,228 --
Total liabilities 4,554 -- 11,575 -- 5,364 -- 5,846 --
Net assets 2,093 -- 4,509 -- 1,834 -- 2,382 --
Purchases of property, plant and equipment 339 -- 640 -- 391 -- 490 --
Abridged statement of cash flows - year ended 30 June 2015
Abridged statement of comprehensive income - year ended 30 June 2015
TransGrid
2015 actual
$m
Abridged statement of financial position - at 30 June 2015
Endeavour Energy
2015 actual
$m
Essential EnergyAusgrid
2015 actual
$m $m
2015 actual

NS
W A
ud
itor-G
en
era
l's R
ep
ort to
Parlia
me
nt | V
olu
me
Th
irtee
n 2
01
5 | E
lectric
ity | A
pp
en
dix
Th
ree –
Fin
an
cia
l Su
sta
ina
bility
48
Appendix Three – Financial Sustainability
Indicator Formula Description
Underlying result
per cent
Adjusted net
surplus / total
underlying
revenue
A positive result indicates a surplus, and the larger the percentage, the stronger the result. A negative result indicates a deficit.
Operating deficits cannot be sustained in the long term.
Underlying revenue does not take into account one-off or non-recurring transactions.
Net result and total underlying revenue is obtained from the comprehensive operating statement and is adjusted to take into
account large one-off (non-recurring) transactions.
Liquidity
(ratio)
Current assets /
current liabilities
This measures the ability to pay existing liabilities in the next 12 months.
A ratio of one or more means there are more cash and liquid assets than short-term liabilities.
Current liabilities exclude long-term employee provisions and revenue in advance.
Debt-to-equity (%) Debt / equity
This is a longer-term measure that compares all current and non-current interest bearing liabilities to equity.
It complements the liquidity ratio, which is a short-term measure.
A low ratio indicates less reliance on debt to finance the capital structure of an organisation.
Self-financing (%)
Net operating
cash flows /
underlying
revenue
Measures the ability to replace assets using cash generated by the entity’s operations.
The higher the percentage the more effectively this can be done.
Net operating cash flows are obtained from the cash flow statement.
Capital
replacement
(ratio)
Cash outflows for
property, plant
and
equipment and
intangibles /
depreciation and
amortisation
Comparison of the rate of spending on infrastructure, property, plant and equipment and intangibles with their depreciation and
amortisation. Ratios greater than one indicate that spending is greater than the depreciating rate.
This is a long-term indicator, as capital expenditure can be deferred in the short term if there are insufficient funds available
from operations, and borrowing is not an option. Cash outflows for infrastructure, property, plant and equipment and intangibles
are taken from the cash flow statement. Depreciation and amortisation is taken from the comprehensive operating
statement.
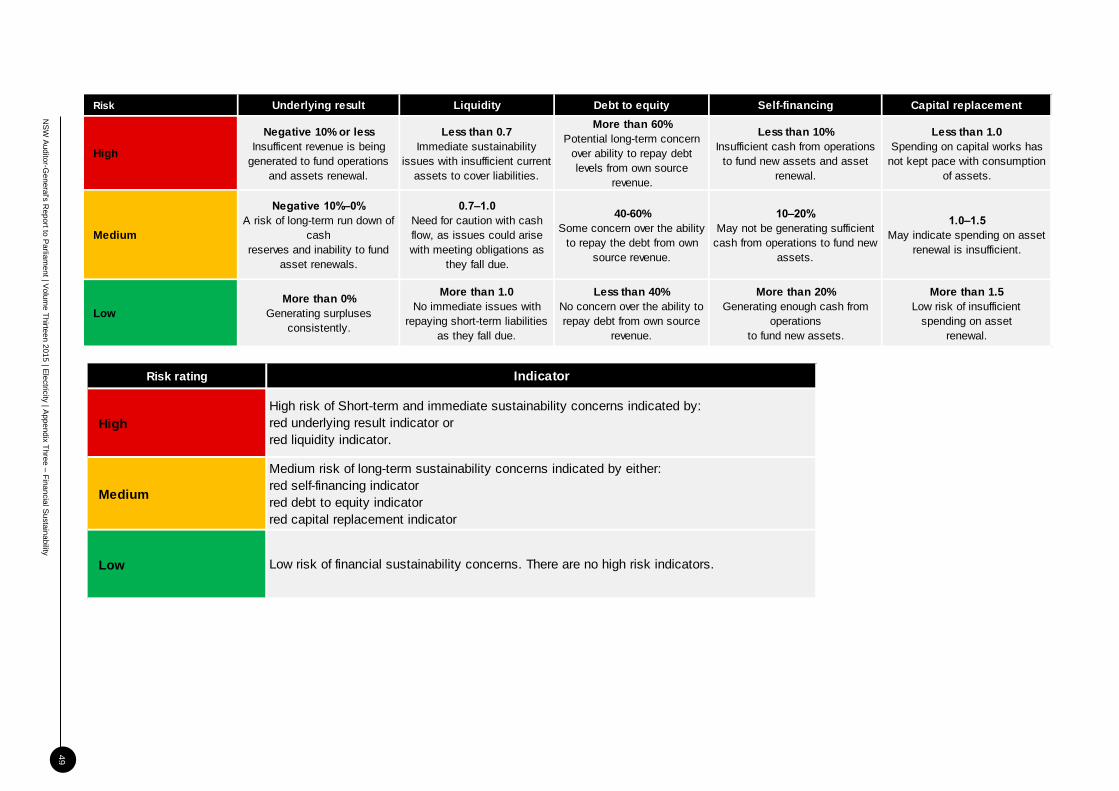
NS
W A
ud
itor-G
en
era
l's R
ep
ort to
Parlia
me
nt | V
olu
me
Th
irtee
n 2
01
5 | E
lectric
ity | A
pp
en
dix
Th
ree –
Fin
an
cia
l Su
sta
ina
bility
49
Risk Underlying result Liquidity Debt to equity Self-financing Capital replacement
High
Negative 10% or less
Insufficent revenue is being
generated to fund operations
and assets renewal.
Less than 0.7
Immediate sustainability
issues with insufficient current
assets to cover liabilities.
More than 60%
Potential long-term concern
over ability to repay debt
levels from own source
revenue.
Less than 10%
Insufficient cash from operations
to fund new assets and asset
renewal.
Less than 1.0
Spending on capital works has
not kept pace with consumption
of assets.
Medium
Negative 10%–0%
A risk of long-term run down of
cash
reserves and inability to fund
asset renewals.
0.7–1.0
Need for caution with cash
flow, as issues could arise
with meeting obligations as
they fall due.
40-60%
Some concern over the ability
to repay the debt from own
source revenue.
10–20%
May not be generating sufficient
cash from operations to fund new
assets.
1.0–1.5
May indicate spending on asset
renewal is insufficient.
Low
More than 0%
Generating surpluses
consistently.
More than 1.0
No immediate issues with
repaying short-term liabilities
as they fall due.
Less than 40%
No concern over the ability to
repay debt from own source
revenue.
More than 20%
Generating enough cash from
operations
to fund new assets.
More than 1.5
Low risk of insufficient
spending on asset
renewal.
Risk rating
High
Medium
Low
Indicator
High risk of Short-term and immediate sustainability concerns indicated by:
red underlying result indicator or
red liquidity indicator.
Medium risk of long-term sustainability concerns indicated by either:
red self-financing indicator
red debt to equity indicator
red capital replacement indicator
Low risk of financial sustainability concerns. There are no high risk indicators.

NSW Auditor-General's Report to Parliament | Volume Thirteen 2015 | Electricity | Appendix Four – Cluster Information
50
Appendix Four – Cluster Information
* This entity has no website.
Agency Website
Generator 2,500
Delta Electricity http://www.de.com.au
Transmitter
TransGrid http://www.transgrid.com.au
Distributors
Ausgrid https://www.ausgrid.com.au
Endeavour Energy http://www.endeavourenergy.com.au
Essential Energy https://www.essentialenergy.com.au

Professional people with purpose
audit.nsw.gov.au
Our visionMaking a difference through audit excellence.
Our mission To help parliament hold government
accountable for its use of public resources.
Our values Purpose – we have an impact, are accountable, and work as a team.
People – we trust and respect others and have a balanced approach to work.
Professionalism – we are recognised for our independence and integrity
and the value we deliver.

Professional people with purpose
Making a difference through audit excellence.
Level 15, 1 Margaret Street Sydney NSW 2000 Australia
t +61 2 9275 7100 f +61 2 9275 7200e [email protected] office hours 8.30 am–5.00 pm
audit.nsw.gov.au