Embed Size (px)
Citation preview

Executive Search
RPOServices
ITSearch
IT labour market monitor 2018 Netherlands
TM
New sourcing & recruitment opportunities in the Dutch IT labour market
2
Mei 2018
Donald DerksenMaarten RouschopPaul Storimans
Eva van den BemdVéronique OonkGeert-Jan Waasdorp
Copyright © Intelligence Group and Sterksen, 2018. The copyright of this report remains property of Intelligence Group and
Sterksen. This version may not be replicated. For publication of (parts of ) this report in media, literature or other forms of
publication, a permission of Intelligence Group and Sterksen is required. In case of publication, the client must always state
Intelligence Group and Sterksen as the source.
Colofon
TM

3
Introduction
We are happy to present you our new 2018 edition of the Dutch IT labour market monitor. Previous editions are still available at www.sterksen.com.
With this new report we would like to bring you up to speed with the trends in the Dutch IT labour market. We have updated our reports with latest developments and specific labour market data. In earlier editions we concluded that demand for IT professionals is at boiling point. This has not changed over the last 12 months. We experience shortage or scarcity of available skills in more and more segments of IT competences.
Supply of IT professionals is still not sufficient to cover all demand across all regions. Supply shortage is vast in the Young Professionals market. For every 15 vacancies there is one junior IT professional available. In case of mid-career IT professionals, we face 10 vacancies for one professional. The best recruitment results are still to be expected in the senior target group. As in previous years, companies have a strong focus on hiring junior to mid-career professionals. Overall the vacancy demand in IT markets is much higher than the availability of talent.
We see a serious shift in media spend in job marketing. The use of traditional job boards or job postings is declining rapidly, the use of continued campaign efforts on Google, Indeed and socials is rising.Moving this media spend results in a decline of accuracy of the total counted number of vacancies across the Netherlands. Less job openings result in a unique job posting.
Note: Some figures in this report have changed compared to previous editions. We have corrected the data over previous years in this report to make comparison more easy. This all is related to improved jobfeed technology and data, available since earlier this year. Be aware that, with this, stats have changed (in some situations substantially).
We hope this edition again provides you with new insights into sourcing facts and figures, market competition and employee drivers in choosing a new employer. Enjoy reading. All questions, remarks and additions are welcome at [email protected]. When more specific questions arise, feel free to contact us.
Donald Derksen, Maarten Rouschop

4
Table of content
40.000 IT professionals are actively looking for a new job 5
Demand for IT Talent remains very high; shift in used online job marketing channels 11
Shortage remains extreme amongst junior IT professionals 16
Focus campus recruitment on Randstad and North-Brabant 21
51.000 IT professionals are not yet approached even though they want to be 28
How to make an appealing offer: drivers and preferences 34
More challenges expected for HR in the IT industry 40
Research justification 44
Intelligence Group & Sterksen 45

40.000 IT professionals are actively looking for a new job

Increased supply of IT professionals
Number of IT professionals in 2016
6
Increased supply of IT professionals
Number of IT professionals in 2017
Junior< 4 years work experience
Junior< 4 years work experience
Mid-career4-10 years work experience
Mid-career4-10 years work experience
Senior> 10 years work experience
Senior> 10 years work experience
+11% comparedto 2016
45,000
+24% compared to 2016
-42% compared to 2016
+3% compared to 2016
-15% compared to 2016
+1% compared to 2016
+21% compared to 2016
22,000
1,000
63,000
6,000
247,000
38,000
18%
11%
82%
89%
IT professionals on Dutch labour market
377,000
+3% comparedto 2016
IT professionals with permanent labour contract
332,000
Self-employedIT professionals
6
Side note when interpreting growth percentages: Be aware that percentages of low figures seem relatively more extreme (e.g. growth percentages of self-employed juniors).
Source: Intelligence Group (2017)
New young IT Professionals have entered the market. Youngsters usualy start on a permanent labour contract. Especially experienced workers are more likely to work as Self Employed / Freelancer. The number of self employed senior professionals is increasing.

Increased supply of IT professionals
7
Are you looking for a new job?
Similar to 2016, 11% of all IT professionals (40,000) is actively looking for a new job
7
8% of IT professionals with a permanent labour contract is actively seeking, which is lower than the average in the Dutch employed workforce (11%). 27% of self-employed IT professionals are looking for new assignments, which is in line with the average activity amongst all Dutch self-employed workers.
Permanent labour contract
Junior< 4 years work experience
Female
Non-Dutch inhabitants
Self-employed
Mid-career4-10 years work experience
Male
Senior> 10 years work experience
-3% compared to 2016
-16% compared to 2016
-6% compared to 2016
-26% compared to 2016
+15% compared to 2016
+4% compared to 2016
+4% compared to 2016
+3% compared to 2016
8% (28,000)
11% (2,500)
13% (8,500)
14% (9,000)
27% (12,000)
11% (8,000)
10% (31,500)
10% (29,500)+1% compared
to 2016
IT professionals actively looking for
a new job
11% (40,000)
Source: Intelligence Group (2017)

Increased supply of IT professionals
Number of IT professionals in 2016
8
Did you change jobs/get new assignments in the past 12 months at a new employer/client?
8
Source: Intelligence Group (2017)
Side note when interpreting number of new assignments: Self-employed IT professionals may have received more than one types of new assignments in the past 12 months; therefore the total amount of new assignments (47.500) exceeds the total amount of persons (36.500)
The percentage of IT professionals who have switched employer in 2017 (9%) is stable compared to 2016. Strong increase in mobility for self-employed IT professionals: many of them found new assignments, both at new and existing or former clients.
Junior< 4 years work experience
New assignment at a new client
Mid-career4-10 years work experience
New assignment at a current client
Senior> 10 years work experience
New assignment at a previous client
+26% comparedto 2016
Self-employedIT professionals with a
new assignment
81% (36,500)
+20% compared to 2016
+40% compared to 2016
+20% compared to 2016
+40% compared to 2016
-7% compared to 2016
+29% compared to 2016
25% (5,500)
41% (18,500)
13% (8,500)
32% (14,500)
7% (17,000)
32% (14,500)
11%
76%
9%
82%
+3% comparedto 2016
IT professionals with permanent
labour contract who joined a new employer
9% (31,000)

The number of independent IT professionals is growing. We see more individual professionals with an interest in both permanent as well as contracted positions. Independent IT professionals have longer assignments and are more often rehired (or extended) on new projects at existing clients. Hourly rates are increasing faster than compensation levels do in permanent position. Companies with a flexible attitude towards salary compensation of permanent IT/Tech professionals have a competitive edge in the actual labour market.
TM

10
How many paid clients did you have in the past 12 months?
Problems in filling positions with permanent employees, force employers to move to temp hiring resulting in a higher volume of temporary assignments for self-employed professionals.
The number of clients for self-employed IT professionals has strongly increased in the past year
2016
2017
1-3 clients 4-5 clients 6-10 clients More than 10 clients
61% 10% 17% 12%
36% 20% 24% 21%
Source: Intelligence Group (2017)

The demand for IT Talent remains very high; shift in used online job marketing channels

Increased supply of IT professionals
Number of IT professionals in 2016
12
More vacancy demand but a decrease in the number of published vacancies
Total amount of published unique IT job vacancies Vacancies which not have been published, are not recorded in these figures. Actual demand is possibly higher than the figures show.
12
Source: Jobfeed (published vacancies in 2013-2017)
No increase in online published vacancies for IT professionals, however, the scarcity is higher than ever.
-6%-1%
20172013 2014 2015 2016
+23%
119,759
91,782
104,374
128,255+14% 120,823
Important note: The figures have decreased compared to previous year reports due to improvements in Jobfeed’s deduplication methods of identical vacancies that have been posted through different channels. The figures are adjusted retroactively for all years; the most recent presentations of figures are most accurate and leading.
13
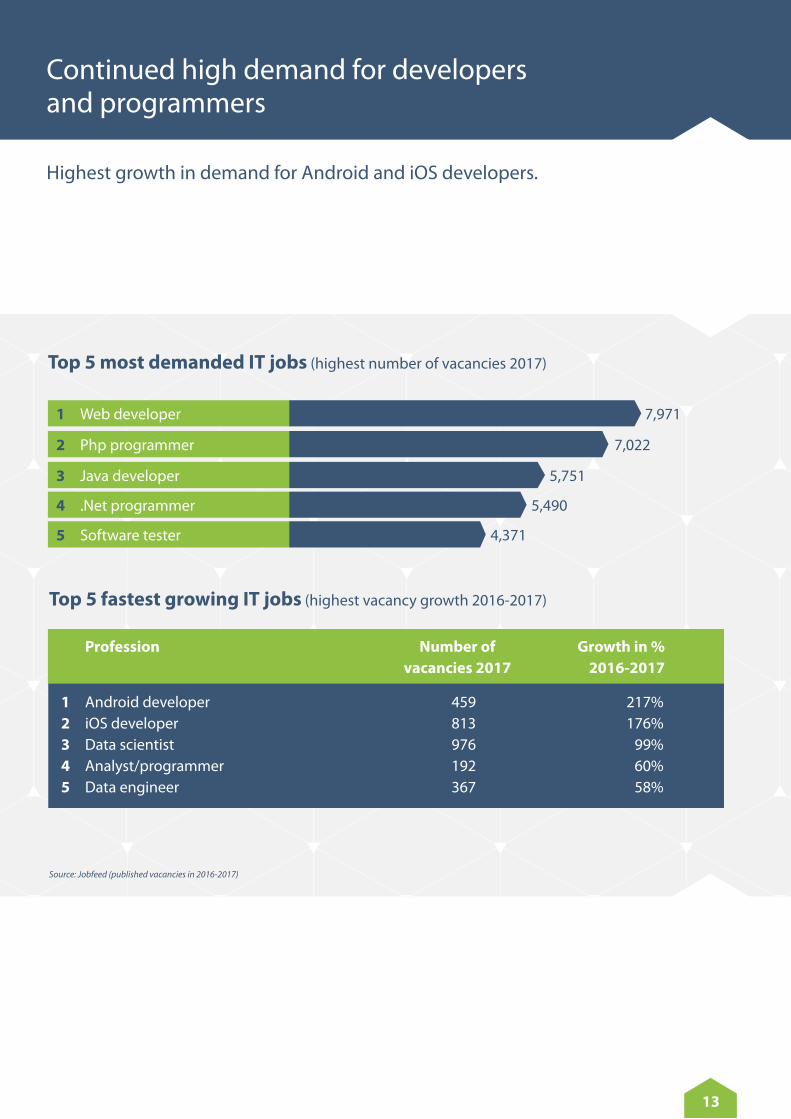
Highest growth in demand for Android and iOS developers.
Continued high demand for developers and programmers
Top 5 most demanded IT jobs (highest number of vacancies 2017)
Top 5 fastest growing IT jobs (highest vacancy growth 2016-2017)
1 Web developer
2 Php programmer
3 Java developer
4 .Net programmer
5 Software tester
7,971
7,022
5,751
5,490
4,371
1 Android developer 459 217%2 iOS developer 813 176%3 Data scientist 976 99%4 Analyst/programmer 192 60%5 Data engineer 367 58%
Profession Number of Growth in % vacancies 2017 2016-2017
Source: Jobfeed (published vacancies in 2016-2017)

14
Labour shortage is much more extreme for IT (42%) than for the total Dutch labour market (18%).
4 out of 10 IT Professional Services companies now experience limitations in production/activities due to labour shortages
Labour shortage
50%
40%
30%
20%
10%
0%
Q1 Q2 Q3 Q4 Q1 Q2 Q3 Q4 Q1 Q2 Q3 Q4 Q1 Q2 Q3 Q4 Q1
IT services
Total labour market
42%
2014 2015 2016 2017
18%
Source: CBS (2018) – Conjunctuurenquête Nederland (COEN)

15
Nowadays, one third of media budget is spent on continuous campaigning: on Google, Social Media and niche websites such as Github and StackOverflow. Mainly ICT Professional Services companies - companies focused on IT professionals as their key target group - show an increase in media spend on structural recruitment campaigns rather than job postings. Non IT Professionals Services companies still mainly invest in traditional job postings. The cost per job posting campaign has increased 26% from 2015 to 2017 to € 1,341.
Shift in media spend for target group IT professionals from job postings to campaigns: costs per applicant has doubled
Media spend on IT Professionals
Source: VONQ (2018)
2017
2014
Job postings Continuous campaigns
68% 32%
79% 21%
IT job postings costs
2017 € 1,341 € 71,44
2016 € 1,269 € 54,44
2015 € 1,065 € 35,02
Year Cost per campaign Cost per applicant

Shortage remains extreme amongst junior IT professionals
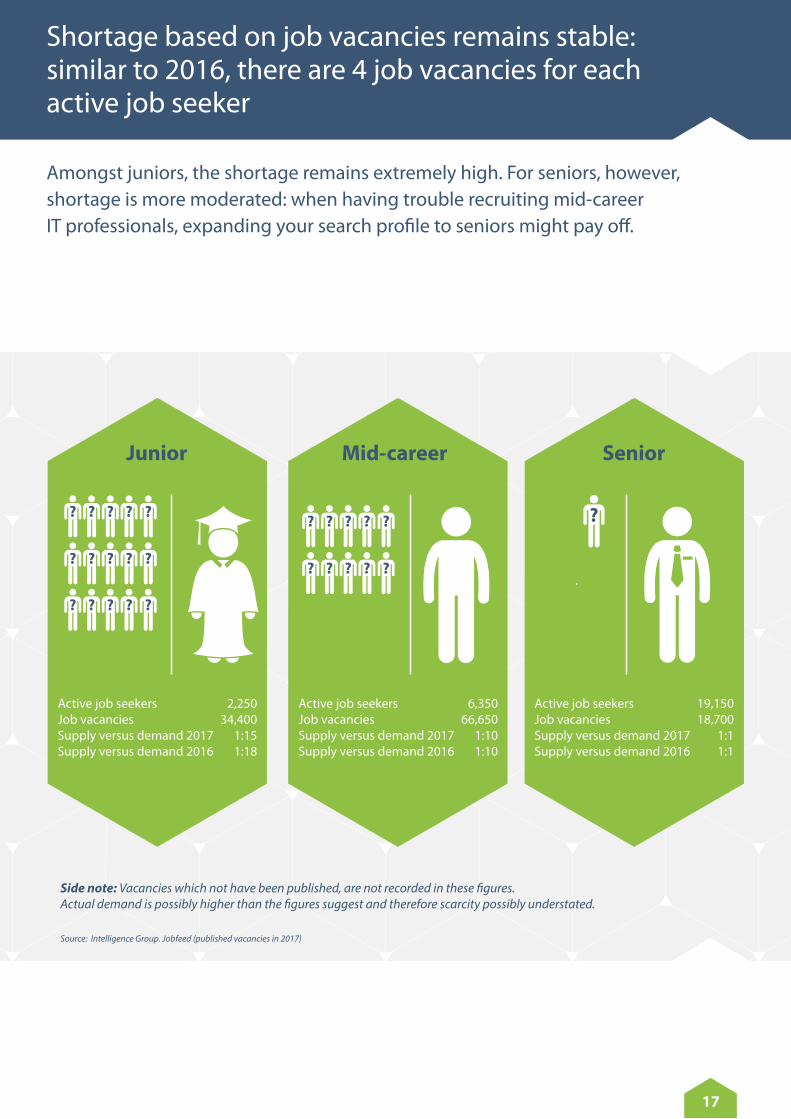
17
Amongst juniors, the shortage remains extremely high. For seniors, however, shortage is more moderated: when having trouble recruiting mid-career IT professionals, expanding your search profile to seniors might pay off.
Shortage based on job vacancies remains stable: similar to 2016, there are 4 job vacancies for each active job seeker
Source: Intelligence Group. Jobfeed (published vacancies in 2017)
? ? ? ?
? ? ? ?
??
?
? ? ? ?
? ? ? ?
? ? ? ?
?
?
?
Junior SeniorMid-career
Active job seekers 2,250 Job vacancies 34,400 Supply versus demand 2017 1:15 Supply versus demand 2016 1:18
Active job seekers 6,350 Job vacancies 66,650 Supply versus demand 2017 1:10 Supply versus demand 2016 1:10
Active job seekers 19,150 Job vacancies 18,700 Supply versus demand 2017 1:1 Supply versus demand 2016 1:1
Side note: Vacancies which not have been published, are not recorded in these figures. Actual demand is possibly higher than the figures suggest and therefore scarcity possibly understated.

Everybody knows IT vacancy demand exceeds IT supply in the labour market. One of the basic problems is that we still select candidates by looking through a straw. We just do not seem to be capable to widen the search profile and thus expand the candidate target group. This applies to all IT vacancies except for Graduates/Junior hires. Companies could take a different view on hiring Senior IT Candidates. This group consists of 247.000 professionals, with a much lower vacancy demand. Graduates are hired on basic competences and personality only. Why not hire an ‘old’ professional for new technology on the same competence and personality profile?
TM
19
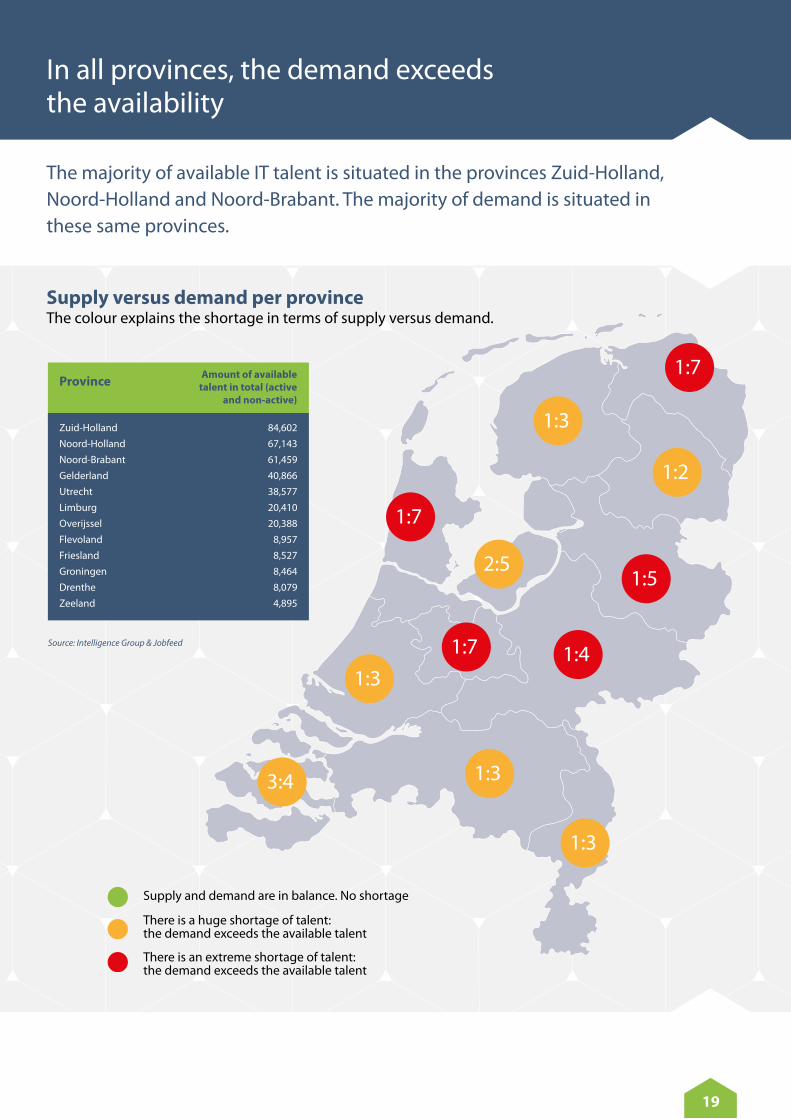
The majority of available IT talent is situated in the provinces Zuid-Holland, Noord-Holland and Noord-Brabant. The majority of demand is situated in these same provinces.
In all provinces, the demand exceeds the availability
Supply versus demand per provinceThe colour explains the shortage in terms of supply versus demand.
1:3
1:3
1:33:4
1:3
1:2
2:5
1:7
1:4
1:5
1:7
1:7
Supply and demand are in balance. No shortage
There is a huge shortage of talent: the demand exceeds the available talent
There is an extreme shortage of talent: the demand exceeds the available talent
Province Amount of availabletalent in total (active
and non-active)
Zuid-Holland 84,602
Noord-Holland 67,143
Noord-Brabant 61,459
Gelderland 40,866
Utrecht 38,577
Limburg 20,410
Overijssel 20,388
Flevoland 8,957
Friesland 8,527
Groningen 8,464
Drenthe 8,079
Zeeland 4,895
Source: Intelligence Group & Jobfeed
20
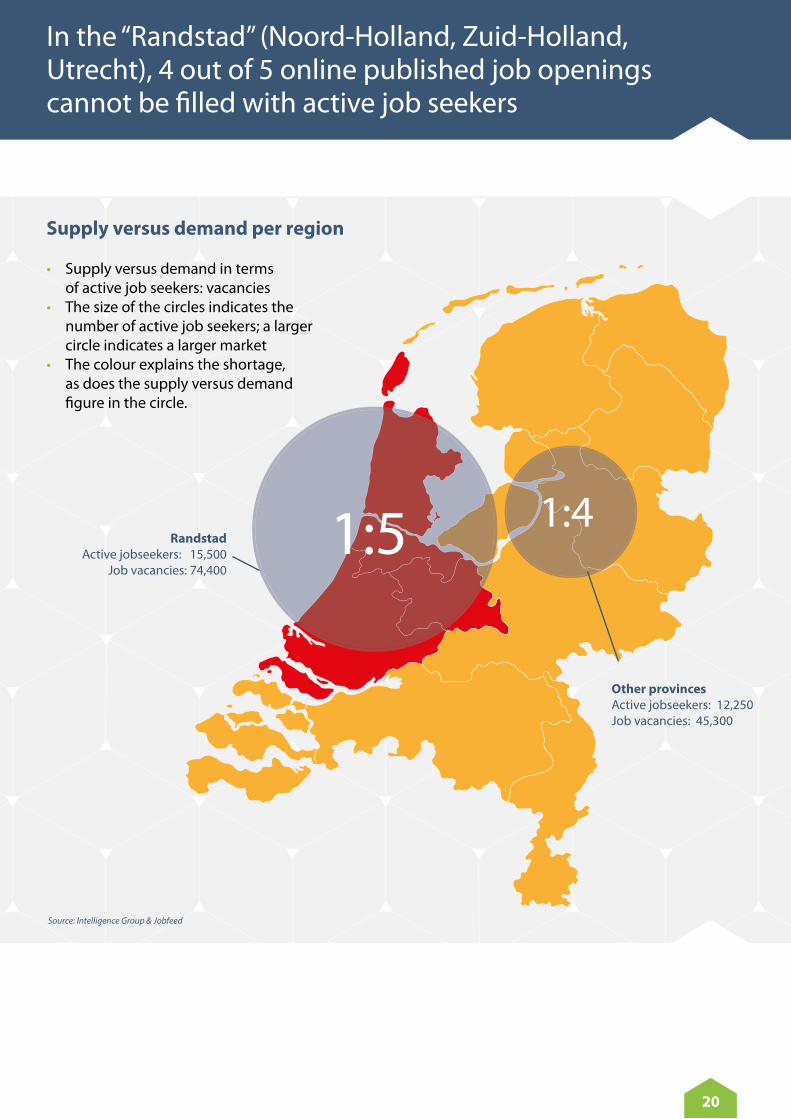
In the “Randstad” (Noord-Holland, Zuid-Holland, Utrecht), 4 out of 5 online published job openings cannot be filled with active job seekers
Supply versus demand per region
• Supply versus demand in terms of active job seekers: vacancies• The size of the circles indicates the number of active job seekers; a larger circle indicates a larger market• The colour explains the shortage, as does the supply versus demand figure in the circle.
1:5 1:4Randstad
Active jobseekers: 15,500Job vacancies: 74,400
Other provincesActive jobseekers: 12,250Job vacancies: 45,300
Source: Intelligence Group & Jobfeed

Focus campus recruitment on Randstad and North-Brabant
Increased supply of IT professionals
Number of IT professionals in 2016
22
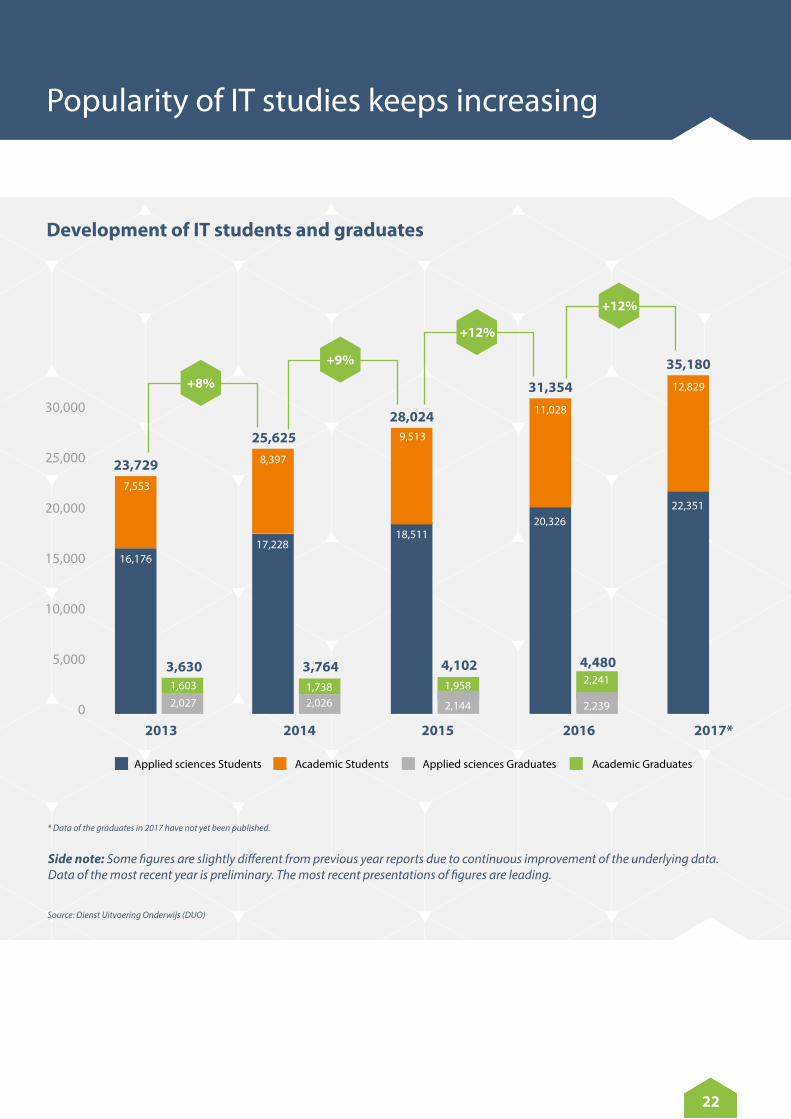
Popularity of IT studies keeps increasing
Development of IT students and graduates
22
Source: Dienst Uitvoering Onderwijs (DUO)
* Data of the graduates in 2017 have not yet been published.
30,000
25,000
20,000
15,000
10,000
5,000
02013 2014 2015 2016
7,553
16,176
8,397
18,51117,228
9,513
20,326
11,028
1,6032,027
1,7382,026
1,958
2,144
23,729
25,62528,024
31,354
3,764 4,1022,241
2,239
4,480
2017*
22,351
12,829
35,180
3,630
Applied sciences Students Applied sciences GraduatesAcademic Students Academic Graduates
+8%
+9%
+12%
+12%
Side note: Some figures are slightly different from previous year reports due to continuous improvement of the underlying data. Data of the most recent year is preliminary. The most recent presentations of figures are leading.

23
Artificial Intelligence is now also offered as a bachelor study.
Campus recruitment should focus on IT bachelor studies at Universities of Applied Sciences
1 IT Applied Sciences 16,141
2 Information Science 3,767
3 Business IT & Management 1,470
Most popular applied sciences IT studies (in number of students in 2017, all grades)
Bachelor1 Technical Information Science 2,182
2 Information Science 1,898
3 Artificial Intelligence 1,170
Master1 Computer Science 827
2 Artificial Intelligence 756
3 Business Information Management 466
Most popular academic IT studies (in number of students in 2017, all grades)
Digital Design [M] 24
Serious Gaming [M] 9
New applied sciences IT studies in 2017
Artificial Intelligence [B] 444
Business Intelligence and Smart Services [M] 34
New academic IT studies in 2017
Only 44% of the IT applied sciences students finish their education successfuly in 5 years. Moreover, only 69% of the academic IT students finish their first and start their second year at university as IT student. 21% choose another study. Source: AGconnect.nl
Source: Dienst Uitvoering Onderwijs (DUO)
24
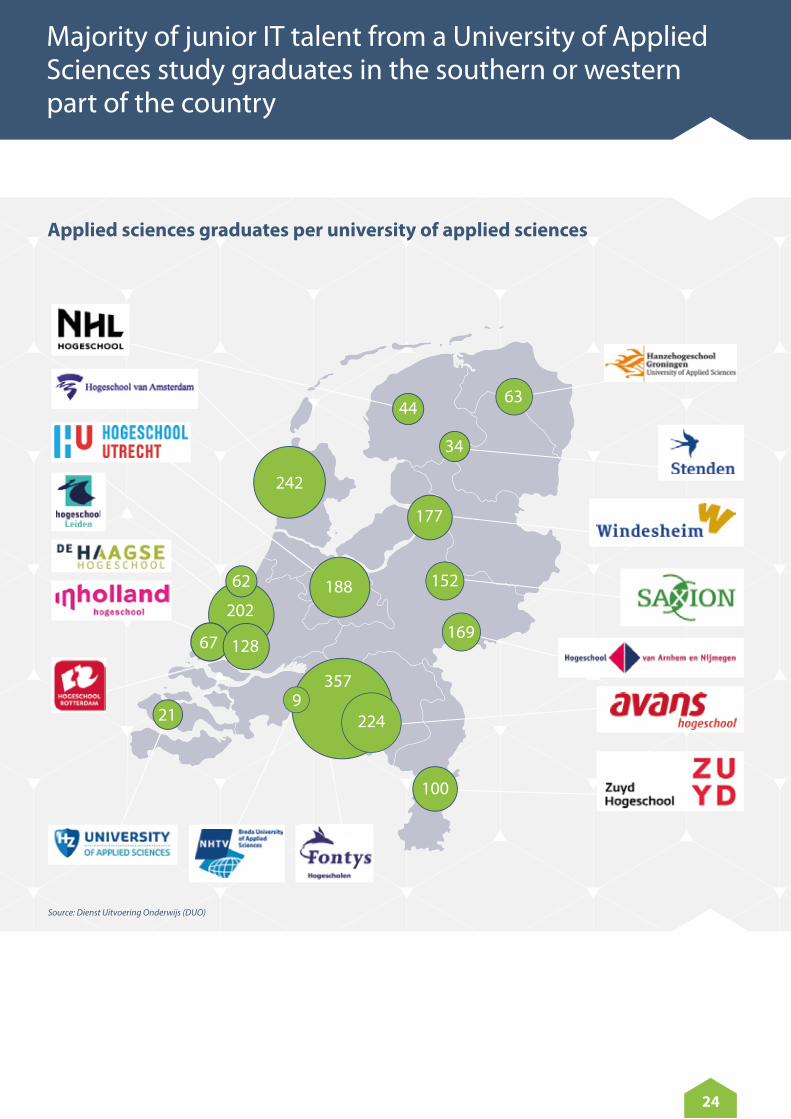
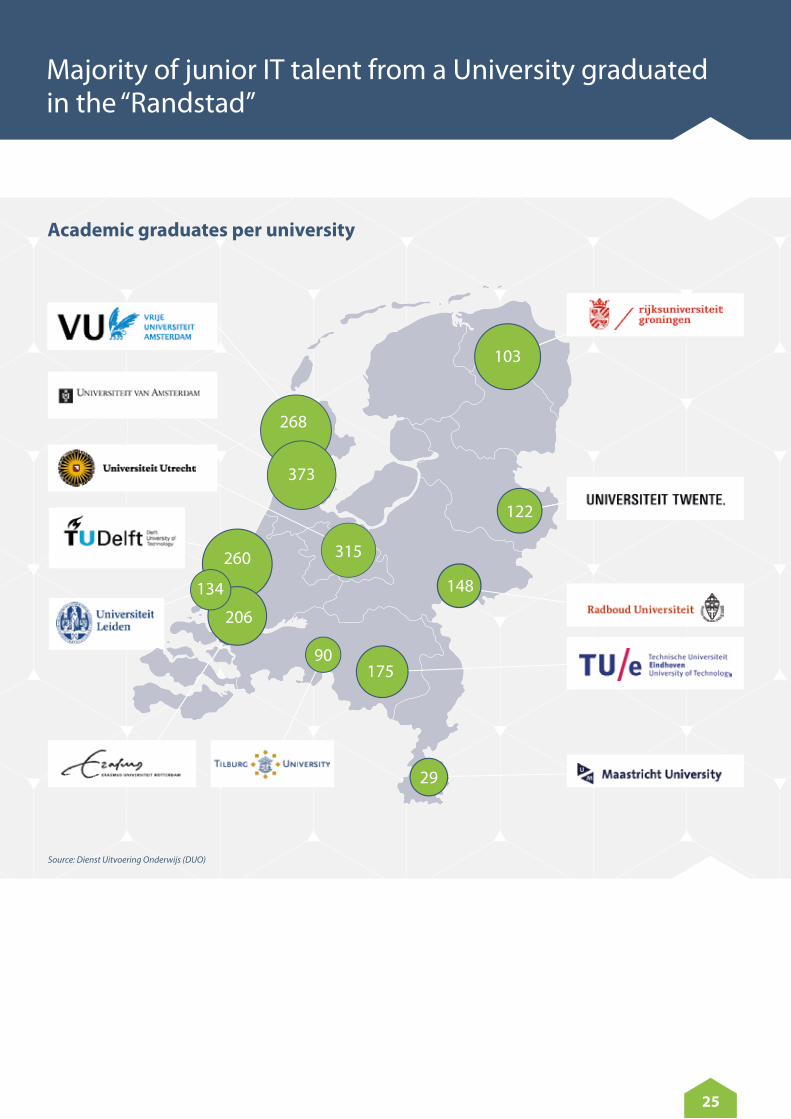
Applied sciences graduates per university of applied sciences
Majority of junior IT talent from a University of Applied Sciences study graduates in the southern or western part of the country
242
188
44
67
202
128
62
21
34
63
169
100
357
2249
152
177
Source: Dienst Uitvoering Onderwijs (DUO)
25
Academic graduates per university
Majority of junior IT talent from a University graduated in the “Randstad”
90
373
315
268
122
103
29
148
175
260
134
206
Source: Dienst Uitvoering Onderwijs (DUO)
26
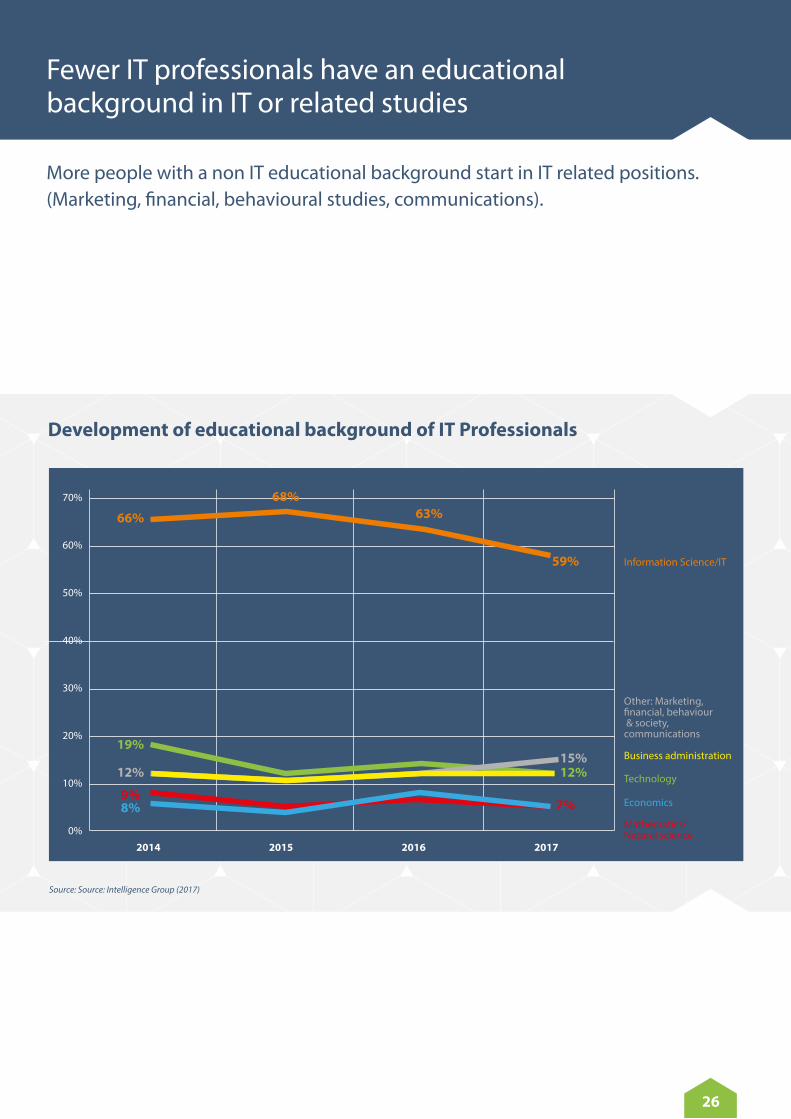
More people with a non IT educational background start in IT related positions. (Marketing, financial, behavioural studies, communications).
Fewer IT professionals have an educational background in IT or related studies
Development of educational background of IT Professionals
Source: Source: Intelligence Group (2017)
70%
60%
50%
40%
30%
20%
10%
0%
Information Science/IT
Technology
Business administration
Economics
Mathematics/Natural science
Other: Marketing,financial, behaviour & society, communications
66%
2014 2015 2016 2017
19%
12%12%
9%8% 7%
15%
68%63%
59%
The number of IT students is slowly increasing year over year. We see a strong growth of Graduate Hires in IT competences with a non IT or IT related educational background.
TM

51.000 IT professionals are not yet approached even though they want to be
29
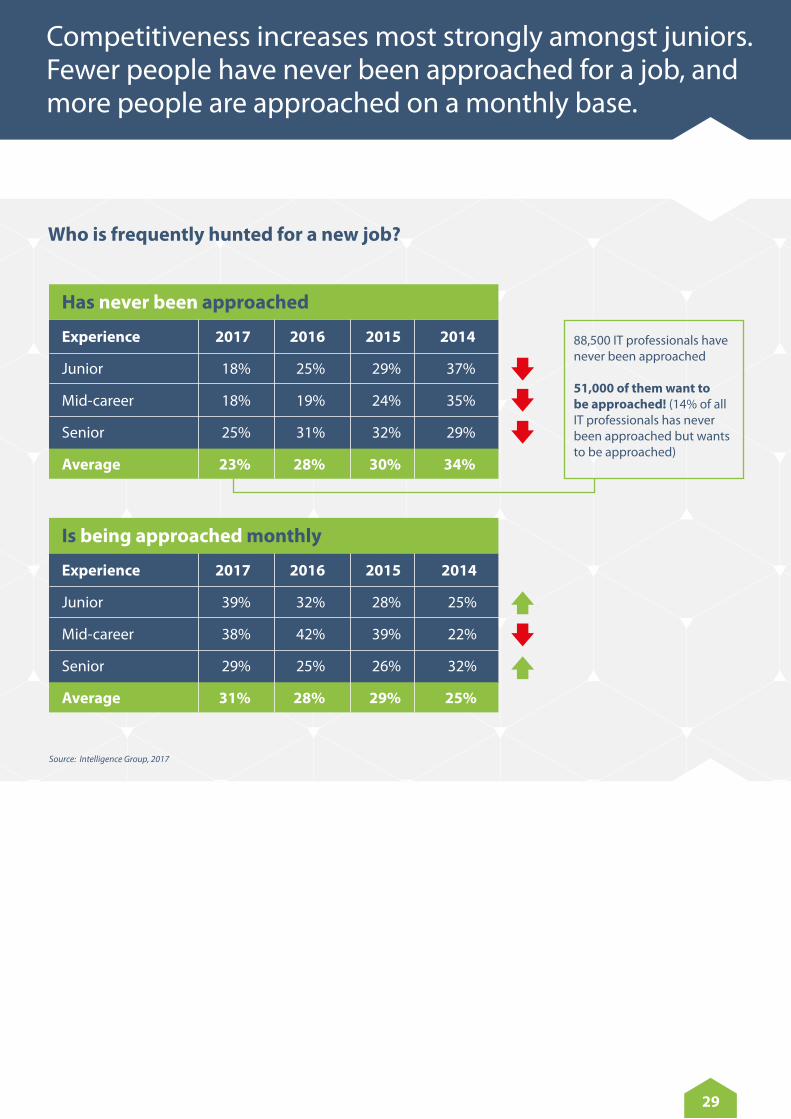
Competitiveness increases most strongly amongst juniors. Fewer people have never been approached for a job, and more people are approached on a monthly base.
Who is frequently hunted for a new job?
Source: Intelligence Group, 2017
Experience 2017 2016 2015 2014
Junior 18% 25% 29% 37%
Mid-career 18% 19% 24% 35%
Senior 25% 31% 32% 29%
Average 23% 28% 30% 34%
Experience 2017 2016 2015 2014
Junior 39% 32% 28% 25%
Mid-career 38% 42% 39% 22%
Senior 29% 25% 26% 32%
Average 31% 28% 29% 25%
Has never been approached
Is being approached monthly
88,500 IT professionals have never been approached
51,000 of them want to be approached! (14% of all IT professionals has never been approached but wants to be approached)
30
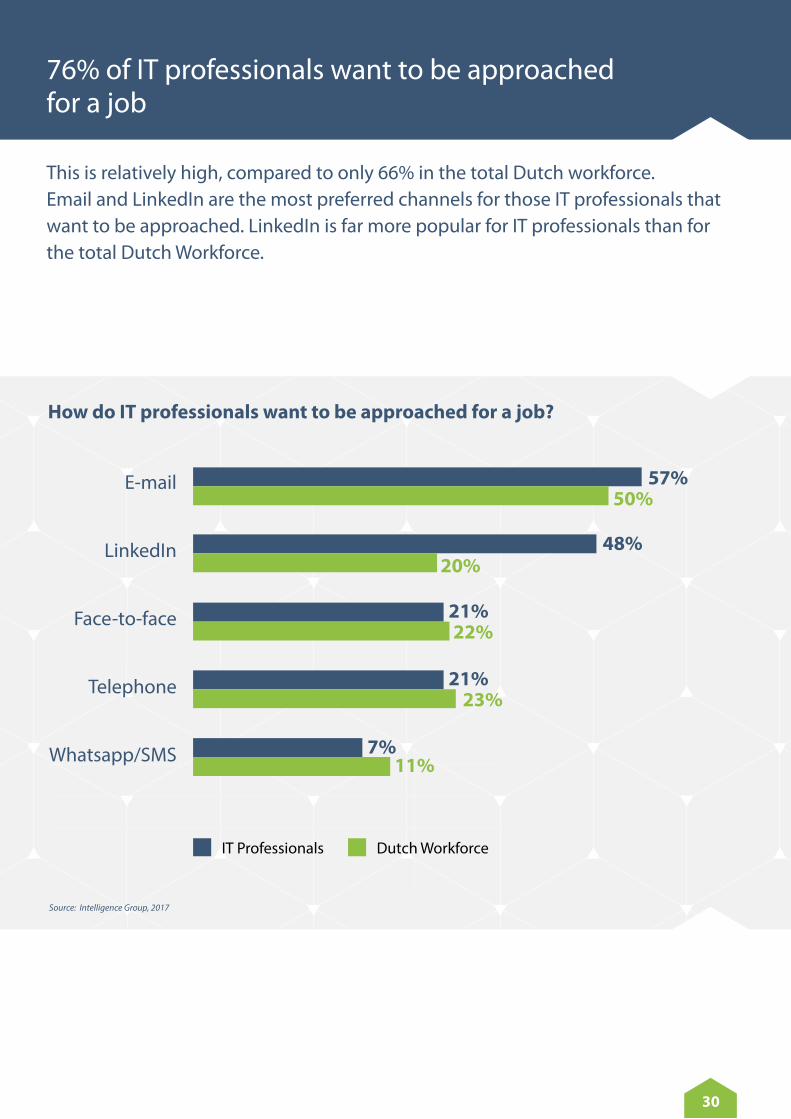
This is relatively high, compared to only 66% in the total Dutch workforce. Email and LinkedIn are the most preferred channels for those IT professionals that want to be approached. LinkedIn is far more popular for IT professionals than for the total Dutch Workforce.
76% of IT professionals want to be approached for a job
How do IT professionals want to be approached for a job?
Source: Intelligence Group, 2017
Face-to-face
Telephone
Whatsapp/SMS
57%50%
48%20%
21%
21%
7%
22%
23%
11%
Dutch WorkforceIT Professionals

31
Clarity about the salary is clearly a less important factor for junior IT professionals.
When sourcing IT professionals, gain and keep their attention with the interesting content of the job
Keep into consideration while sourcing IT professionals
Source: Intelligence Group, 2017
Clarity about what the job entails76%
72%38%
56%48%
45%
36%
51%
45%
44%28%
23%
Junior
Mid-career
Senior
14%
17%14%
9%8%
8%11%
3%

32
Besides the technology industry, consultancy and government are the most desired industries for IT professionals
Top 10 most desired industries (next to the current industry)
Source: Intelligence Group, 2017
Information & Communication technology
Advisory/Consulting/Professional Services
National Government
Local Government
Research
Education
Media & Telecommunications
Energy Sector
Sports & Recreation
24%
20%
16%
13%
12%
12%
8%
7%
7%
Financial sector 9%
2016
2017
Side note: Compared to the previous versions of the IT Monitor, this ranking of industries is more detailed. Therefore an comparison with 2016 is added to the graph.

33
Coolblue and National Police are new top 10 players. New top 10 employers publishing vacancies: Ministry of Defence and Qualogy.
Google remains number 1 most attractive employer among IT professionals
Source: Intelligence Group, 2017 & Jobfeed (published vacancies 2017)
Top 10 top-of-mind most favourite employers for IT professionals
Google ASML
Philips Accenture
Shell Ministerie van Defensie
ASML ING
ING Sogeti
Coolblue KPN
Belastingdienst CGI
Politie Capgemini Nederland
Rabobank Qualogy
KLM Deloitte
Top 10 employers publishing vacancies for IT professionals
1 1
2 2
3 3
4 4
5 5
6 6
7 7
8 8
9 9
10 10

How to make an appealing offer: drivers and preferences

35
Seniors are relatively more keen on salary, a permanent contract and independency in their work.
When choosing an employer, juniors focus relatively more on career opportunities
Top 10 most important drivers when choosing an employer for IT professionals
Good salary
Job content
Permanent contract
Working atmosphere
Close to home/acceptable travel time
Challenging work
Flexible working hours
Independency in work
Good secondary employee benefits
Career opportunities
44%
56%44%
41%30%
40%
32%
43%
39%
39%33%
33%
Senior
Mid-career
Junior
18%
26%11%
27%23%
25%34%
13%
Source: Intelligence Group, 2017

However, this mainly applies to senior IT professionals, whereas junior IT professionals strongly value education and training budget. As the expectations and wishes differ for different experience levels, keep in mind on which level you are hiring.
The possibility to work from home and pension arrangement are the most important employee benefits
Top 10 most important employee benefits when choosing an employer for IT professionals with a permanent labour contract
42%
52%25%
44%35%
35%
26%
38%
29%
30%41%
24%
Senior
Mid-career
Junior
21%
22%17%
19%12%
14%17%
14%
Source: Intelligence Group, 2017
36
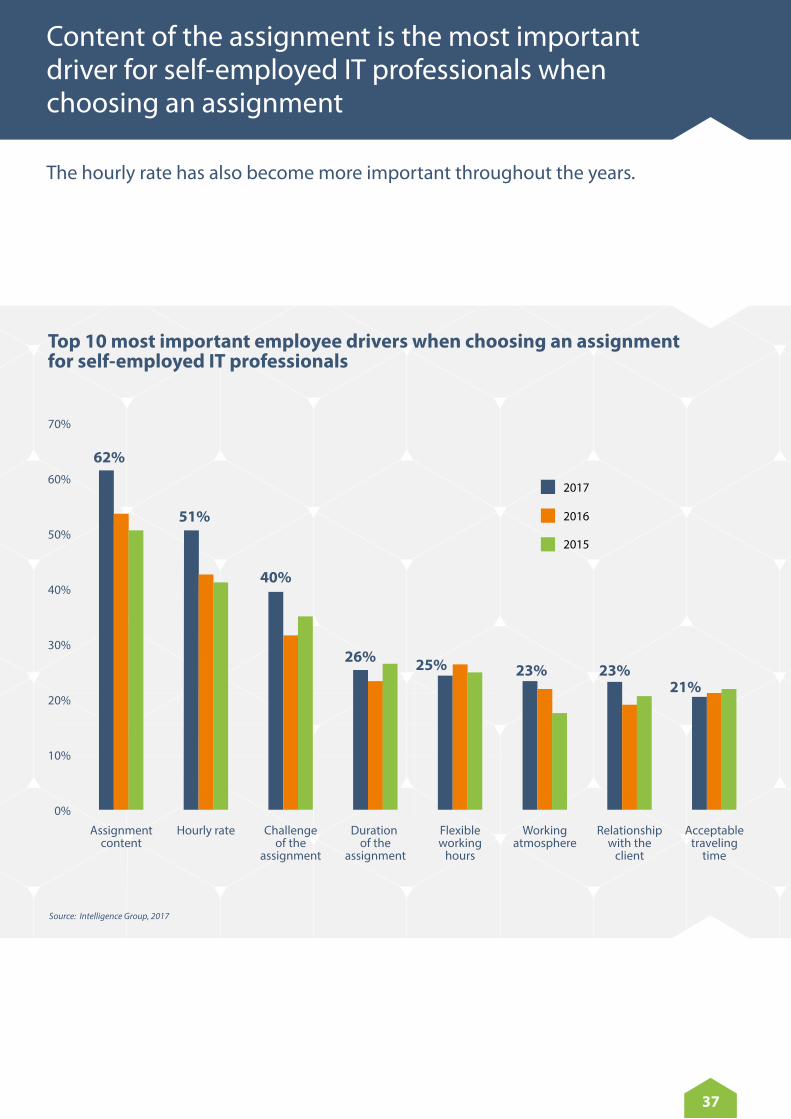
The hourly rate has also become more important throughout the years.
Content of the assignment is the most important driver for self-employed IT professionals when choosing an assignment
Top 10 most important employee drivers when choosing an assignment for self-employed IT professionals
70%
60%
50%
40%
30%
20%
10%
0%Assignment
contentHourly rate Challenge
of theassignment
Duration of the
assignment
Flexibleworking
hours
Workingatmosphere
Relationshipwith the
client
Acceptabletraveling
time
62%
51%
40%
26% 25% 23%21%
23%
2015
2016
2017
Source: Intelligence Group, 2017
37
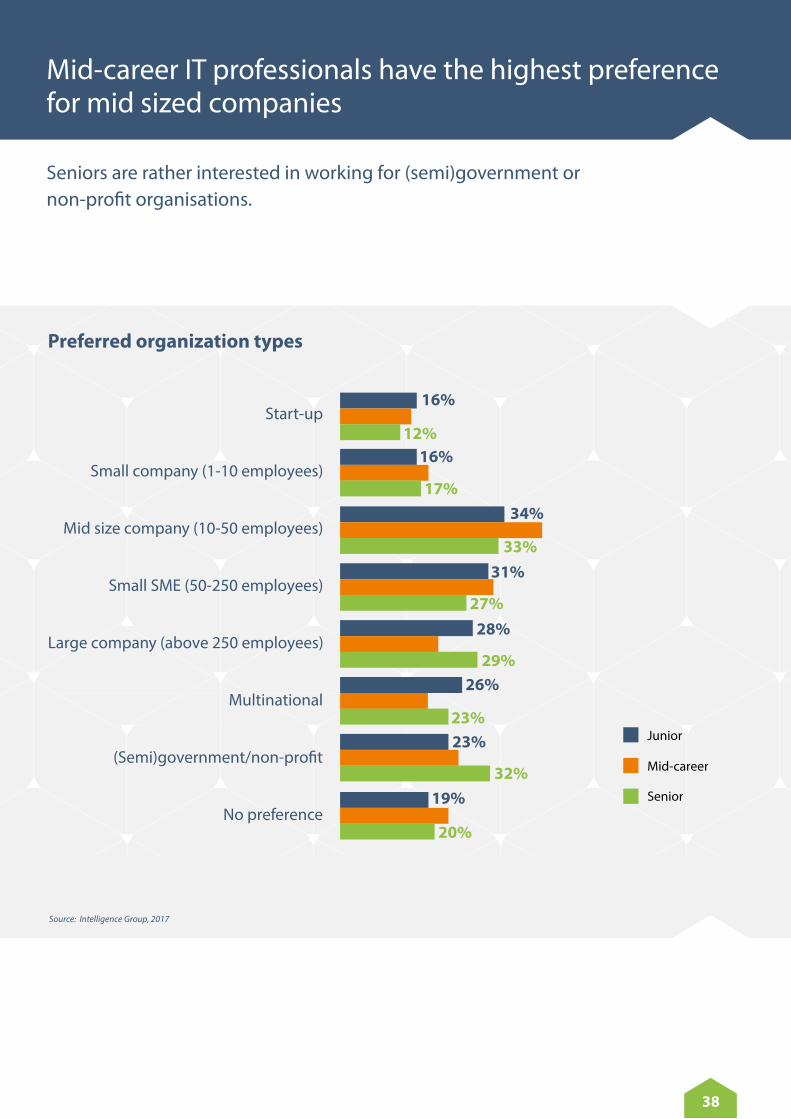
Seniors are rather interested in working for (semi)government or non-profit organisations.
Mid-career IT professionals have the highest preference for mid sized companies
Preferred organization types
Start-up
Small company (1-10 employees)
Mid size company (10-50 employees)
Small SME (50-250 employees)
Large company (above 250 employees)
Multinational
(Semi)government/non-profit
No preference
16%
12%16%
17%34%
31%
28%
33%
27%
29%26%
23%
Senior
Mid-career
Junior23%
32%19%
20%
Source: Intelligence Group, 2017
38
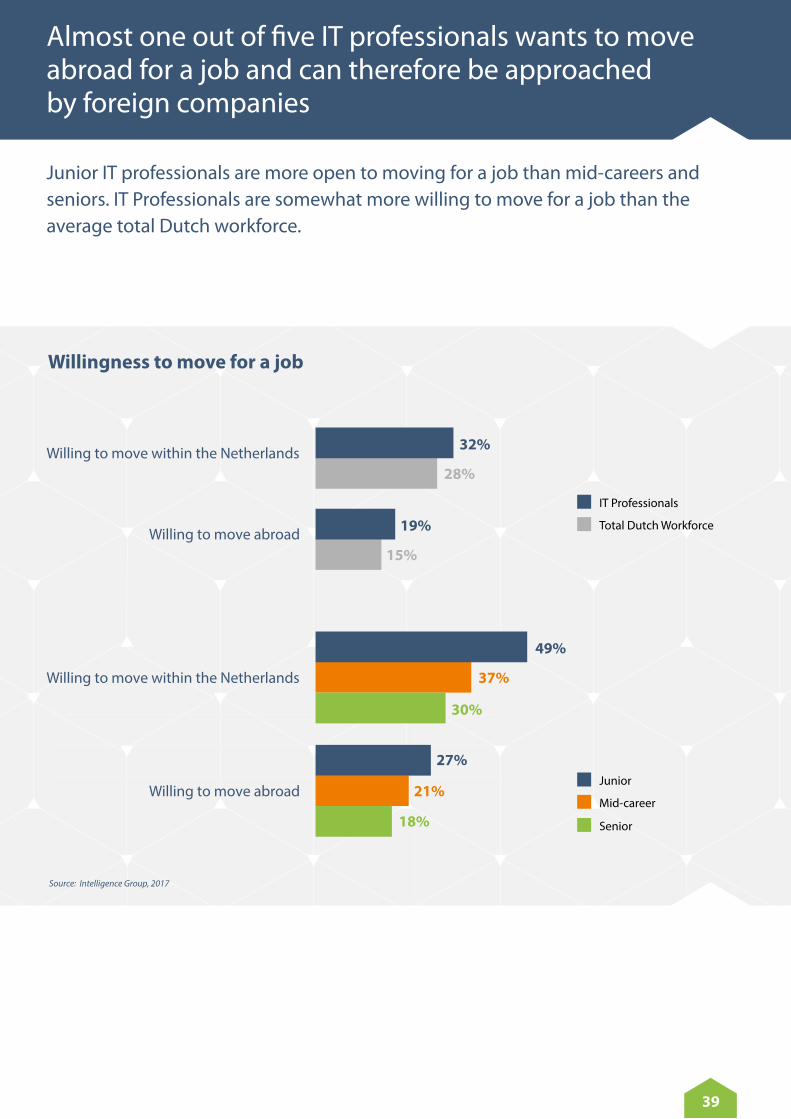
Junior IT professionals are more open to moving for a job than mid-careers and seniors. IT Professionals are somewhat more willing to move for a job than the average total Dutch workforce.
Almost one out of five IT professionals wants to move abroad for a job and can therefore be approached by foreign companies
Willingness to move for a job
Willing to move within the Netherlands
Willing to move abroad
IT Professionals
Total Dutch Workforce
Junior
Mid-career
Senior
32%
28%
19%
15%
Willing to move within the Netherlands
49%
37%
30%
Willing to move abroad
27%
21%
18%
Source: Intelligence Group, 2017
39

More challenges expected for HR in the IT industry
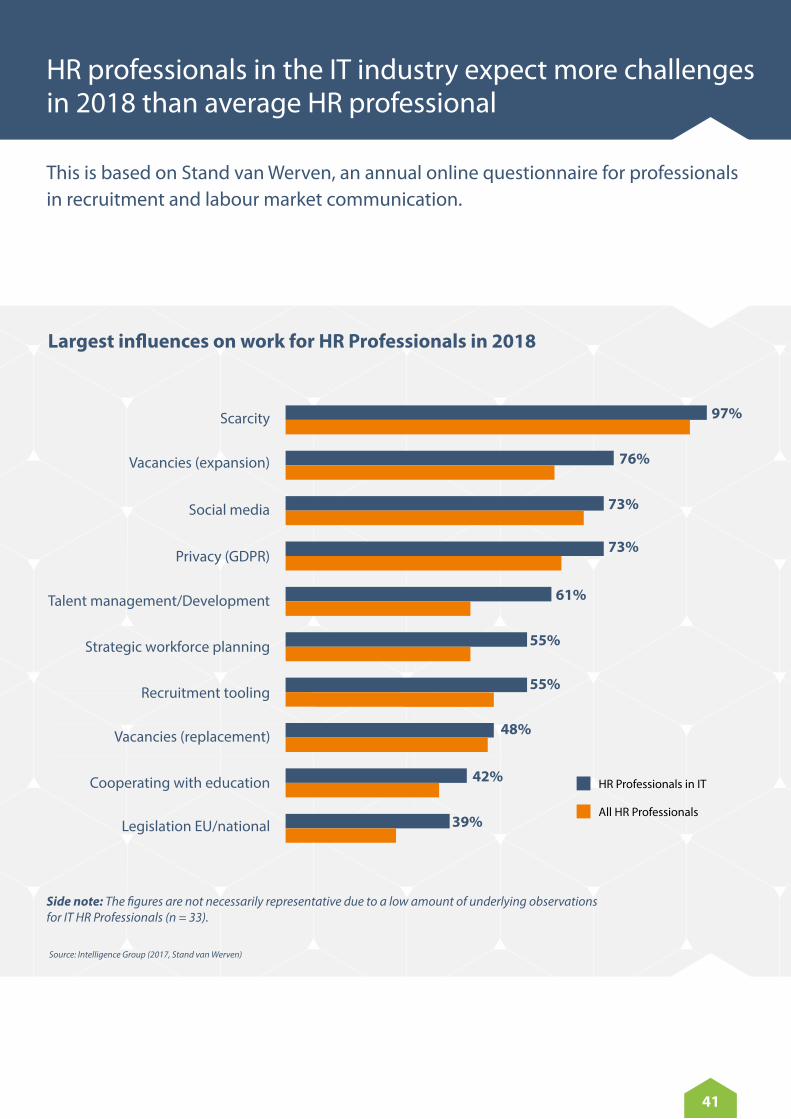
This is based on Stand van Werven, an annual online questionnaire for professionals in recruitment and labour market communication.
HR professionals in the IT industry expect more challenges in 2018 than average HR professional
Largest influences on work for HR Professionals in 2018
Scarcity
Social media
Vacancies (expansion)
Privacy (GDPR)
Talent management/Development
Strategic workforce planning
Recruitment tooling
Cooperating with education
Vacancies (replacement)
Legislation EU/national
97%
HR Professionals in IT
All HR Professionals
76%
73%
73%
61%
55%
55%
48%
42%
39%
Source: Intelligence Group (2017, Stand van Werven)
41
Side note: The figures are not necessarily representative due to a low amount of underlying observations for IT HR Professionals (n = 33).

Priorities in 2018 for HR professionals in the IT industry seem to be more focused on employer branding and recruitment marketing, and less on filling vacancies
Priorities for HR Professionals in 2018
Employer branding
Improve recruitment website
Labour Market communication
Improve candidate experience
Optimalisation of recruitment process
Social media
Filling vacancies
Improve vacancy texts
Recruitment marketing
Talent pooling/pipelines
82%
HR Professionals in IT
All HR Professionals
71%
64%
64%
61%
57%
54%
54%
50%
46%
Source: Intelligence Group (2017, Stand van Werven)
42
Side note: The figures are not necessarily representative due to a low amount of underlying observations for IT HR Professionals (n = 33).

We face a strong digitalisation in the external recruitment workflow. However, the selection cycle of permanent hiring has not changed over the last 15 years. The selection processes are as analogue and slow as they have ever been.
So, even in 2018, it is much easier and cost efficient to improve results by speeding up the processes than it will be to improve your attraction power.
TM

44
Research justification
• This paper has been created by means of Intelligence Group’s data. Intelligence Group conducts the biggest and broadest labour market research in the Netherlands since 2003 on an ongoing basis: the Labour Market Behavioural Research [Arbeidsmarkt GedragsOnderzoek] (AGO), which is characterized by up-to-dateness, reliability, representativeness and independence. The most recent dataset is used for this paper and consists of 33,339 respondents and is weighted based on the numbers of the the National Statistics Bureau (Centraal Bureau voor de Statistiek, CBS).
• The target group IT professionals is very well represented in Intelligence Group’s Dutch database. The quantitative research for this paper concerns highly educated IT professionals.
• Additional sources have been addressed to obtain more detailed information about the demand for this target group and the new generations on the labour market: Jobfeed, VONQ, CBS and Dienst Uitvoering Onderwijs (DUO: registration of students and graduates of all public education institutes).
45
Intelligence Group is 100 % labour market data. We have the largest recruitment and labour market datalake in Europe. This data is used in APIs, interactive dashboards and research reports to support our clients in solving employment and labour market problems on a local and international scale.
Geert-Jan Waasdorp, CEO Intelligence Group [email protected]
Sterksen is a Dutch-based recruitment services company. Sterksen specializes in executive search, RPO/recruitment outsourcing and IT & Technology Talent Search. With offices in Breda and Utrecht we deliver recruitment services to a variety of Corporate and Corporate Mid Market clients in The Netherlands and work on vacancy demand in North Western Europe.
Donald Derksen, Managing Partner Sterksen [email protected]
Intelligence Group & Sterksen
TM