Embed Size (px)
Citation preview

1
New Product Success in the Consumer Packaged Goods Industry:
A Shopper Marketing Approach
Lien Lamey*
Barbara Deleersnyder
Jan-Benedict E.M. Steenkamp
Marnik G. Dekimpe
Lien Lamey is Associate Professor of Marketing, KU Leuven, Belgium (e-mail: [email protected]). Barbara
Deleersnyder is Associate Professor of Marketing, Tilburg University, the Netherlands (e-mail:
[email protected]). Jan-Benedict E.M. Steenkamp is C. Knox Massey Distinguished Professor of Marketing and
Marketing Area Chair, University of North Carolina at Chapel Hill (e-mail: [email protected]). Marnik G. Dekimpe is
Research Professor and Marketing Area Chair, Tilburg University, the Netherlands, and Professor of Marketing, KU
Leuven, Belgium (e-mail: [email protected]).
*corresponding author ([email protected] – Naamsestraat 69 B3000 Leuven, Belgium)
We thank AiMark for providing the data. This work was financially supported by GfK Verein; the Marketing Science
Institute (grant number #4-1684); the Netherlands Organization for Scientific Research (grant number 452-10-004);
and the Flemish Organization for Scientific Research (grant number G057014N).

2
New Product Success in the Consumer Packaged Goods Industry:
A Shopper-Marketing Approach
ABSTRACT
Marketing activities that influence shoppers along the various stages of their path-to-purchase are
gaining attention from both manufacturers and retailers. Using a dataset with detailed information
on 105 new products (NPs) launched in the U.K. by 44 leading brands and sold across 13 major
retail banners, we provide strong support for the prominent role of both upper- and lower-funnel
marketing actions that influence consumers before (upper) or during (lower) their shopping trip.
We show which of these shopper-marketing instruments have the largest effect on NP
performance at a retailer, and whether and how their effect is moderated by the retailer’s store
context. When it comes to NP success, the lifeblood of CPG companies, the lower-funnel
marketing actions targeting shoppers directly at the point-of-purchase predominantly decide your
fate. Thus, manufacturers should work ever harder to collaborate with retailers and push the store-
specific shopper-marketing instruments in a favorable direction through information sharing and
tailoring of their marketing program to individual retailers. Indeed, not all news is bleak for brand
manufacturers. We identify five pieces of good news that brand manufacturers can use to their
advantage.
Keywords: New products, Shopper marketing, Retailing, Brands, Store context.

3
1. Introduction
For consumer packaged goods (CPG) manufacturers, the introduction of new products (NPs) is
recognized as one of the most important marketing activities (Sorescu and Spanjol 2008). Thus, it
is not surprising that brand manufacturers spend significant resources on the development and
launch of NPs. Unfortunately, despite these efforts, a large majority of new CPG products fail in
the marketplace (Gielens and Steenkamp 2007). Consequently, the question what drives NP
success in the CPG industry has attracted considerable research attention (e.g., Ataman, Mela, and
van Heerde 2008; Steenkamp and Gielens 2003).
While important, earlier studies have often focused on the overall, market-level effect on NP
sales of marketing-mix instruments like advertising and NP innovativeness that influence
consumers in the pre-purchase stage of the consumer purchase cycle (Lemon and Verhoef 2016).
More recently, an expanded perspective has been proposed that focuses on the entire path-to-
purchase customers go through. In this view, firms should design and manage the entire process a
customer engages in before making a purchase (Lemon and Verhoef 2016, p. 71). This new
perspective, sometimes called shopper marketing, emerged in the wake of studies that found that
50-70% of shoppers’ decisions are made in-store (Shankar 2011). It encourages manufacturers to
broaden their thinking and manage national brands (NBs) across multiple stages along the
purchase funnel (Lemon and Verhoef 2016), and to also consider how retailer-specific activities in
the store influence the ultimate purchase decision (Shankar 2011).
However, two important considerations arise when adopting such a broader view that
considers the entire customer journey. First, while manufacturers are in control of the upper-funnel
marketing activities (related to branding, advertising and product innovativeness), competition
laws in many countries, including the U.S. and the U.K., have limited the ability of manufacturers
to enforce the retail prices of their goods. Nevertheless, manufacturers attempt to negotiate with

4
their main retail clients to jointly decide on retail prices while both the manufacturer and the
retailer exert some influence on the promotion calendar (Guyt and Gijsbrechts 2014). Also,
literature on retailer pass-through (e.g., Ailawadi and Harlam 2009) shows considerable variability
in promotional pass-through. This supports the notion that even if the retailer ultimately is in
control of pricing and promotional decisions in its stores, such decisions are influenced (and, in
case of promotions, often funded) by the manufacturer.
Second, the shopper-marketing approach emphasizes that product success varies in function
of the retail-shopper environment, recognizes the importance of both out-of-store and in-store
marketing stimuli, and allows for the distinct possibility that the effectiveness of marketing efforts
can – and will – vary based on the shopper retail context. This applies not only to the lower-funnel
marketing stimuli at the actual point-of-purchase; also the effect of upper marketing actions may
not be the same across store contexts. If anything, this holds especially for decisions related to the
purchase of NPs, as these decisions are not yet part of consumers’ habitual buying behavior that
characterizes most CPG purchases. As a result, NPs can be very successful in some retail contexts
but less so in others.
So, to improve NP performance, brand manufacturers need to move from traditional
marketing to shopper marketing that (1) considers marketing actions along the entire path-to-
purchase, and (2) allows for retailer-specific influences. In the words of Shankar et al. (2011, p.
S36), “[T]he programs must be customized to the retailer’s shopper base. The days of cookie
cutter programs are a thing of the past.” This observation provided the impetus for our study. We
will investigate the effects of both market-level, out-of-store shopper-marketing variables that are
under the control of the NB manufacturer, as well as retail specific, in-store marketing actions that
are the outcome of frequent negotiations between a manufacturer and each individual retailer on
the performance of the NP at that retailer. We also consider whether and how the effectiveness of
5
these shopper-marketing instruments is moderated by the general and category specific store
context in which NP purchases take place.
Our research seeks to provide an initial answer to the following four research questions. First,
how important is shopper marketing in determining NP performance at the retailer? Is it really the
important driver that shopper-marketing enthusiasts envisage? Second, what is the collective
importance of the manufacturer-controlled, out-of-store shopper-marketing variables versus
retailer-manufacturer negotiated, in-store shopper-marketing variables in explaining NP success?
Is NP performance largely driven by manufacturer market-level actions or do retailer-specific
factors take the front seat? Or are they roughly equally important? The implications for the relative
power of manufacturer versus retailer are profoundly different. Third, what is the substantive
impact of the different shopper-marketing variables in driving NP performance? While the
direction of most drivers is, arguably, well-established, we know less about their relative impact
on NP success. Fourth, to what extent do the effects of the various shopper-marketing variables
differ according to the store context in which the NP is sold?
Collectively, the answers to these research questions provide brand manufacturers with
important shopper-marketing insights. This not only allows them to develop more effective
shopper-focused, as well as trade-targeted, NP marketing strategies per se, but also provides a
platform to work towards a better strategic alignment between retailers and brand manufacturers.
The insights generated by this study are based on the performance of 105 NPs launched in the
U.K. across 21 CPG categories by 44 leading NBs during a three-year period. We will evaluate the
success of each NP across 13 leading U.K. retail banners from 10 retail firms.
2. Research Framework
Our focal variable is NP performance at an individual retailer, which is operationalized as the
NP’s category share at that retailer in the year after that retailer included it into its assortment.

6
Industry studies (Ernst&Young/ACNielsen 2000) and academic research (Steenkamp and Gielens
2003) regard the first year to be crucial for the success of new CPGs.
Our research framework (Figure 1) conceptualizes the impact of various marketing-mix
instruments around the marketing funnel. The marketing funnel is especially popular among
practitioners (e.g., Court et al. 2009; Rubinson 2010). In our funnel, we distinguish between
upper- and lower-funnel shopper-marketing variables. By taking into consideration the entire path-
to-purchase, shopper marketing emphasizes the complimentary importance of upper-funnel
(mainly out-of-store) marketing stimuli that influence consumers early in the purchase cycle and
lower-funnel marketing stimuli that affect shoppers once they enter the store (Shankar et al. 2011).
--- Insert Figure 1 about here ---
We use this insight to identify two groups of marketing-mix variables that affect NP performance.
The first group consists of upper-funnel shopper-marketing variables that influence consumers
before they enter the store. These factors can - and often do - exist distinct from any particular
retailer, and are under the exclusive control of the brand manufacturer. Using the 4P’s as
organizing framework, the key instruments under the exclusive control of the brand manufacturer
are the product – where we consider both the brand equity of the mother brand under which the
NP is introduced and the innovativeness of the NP – and the advertising component of the
promotion mix.
The second group consists of shopper-marketing variables that influence consumers directly
while they are shopping in the store. Here, in terms of the 4Ps, we consider the NP’s price (relative
to the category price) and the price-promotion component of the promotion mix. Note that both of
these in-store variables are specific to any individual retailer. Collectively, our set of five drivers
are among the marketing instruments that are widely considered as highly relevant in explaining
NP success.
7
Another tenet of shopper marketing is the importance of the store context in purchase
decisions (Shankar 2011). Our research framework distinguishes between retailer-wide store-
context effects as opposed to context effects at the category level in which the NP is offered. It
includes three store-context factors – one at the retailer level (the brand equity associated with the
retail banner itself) and two at the category level (category private-label (PL) share and NP
uniqueness relative to the retailer’s established category offerings).
In our conceptualization, we outline two ways in which the store context affects NP
performance (Figure 1). First, there is the direct effect in that we expect that NP performance
varies systematically across store contexts. Second, we allow for the possibility that the
effectiveness of specific shopper-marketing variables depends on the store context. Shopper-
marketing theory is not sufficiently developed yet to advance a comprehensive set of a priori
expectations concerning the moderating effects of particular store-context factors on specific NP
drivers. Therefore, following Steenkamp and Geyskens (2014), we use inductive reasoning to
investigate the moderating role of the store context. In the next section, we develop the rationale
underlying the expected main effects of the key variables.
3. Drivers of NP Performance at the Retailer
3.1 Upper-funnel shopper-marketing activities
Brand equity (+). The NP benefits from being sold under a high-equity brand name as
consumers can plausibly believe that the NP is also of high quality. The incentive to cheat by
extending the reputable brand with a low-quality product is reduced by the loss of repeat sales of
the NP, the loss of repeat sales of other products sold under the same brand name, and the loss of
future sales due to the reduced extension potential of the brand (Erdem 1998; Klein and Leffler
1981).

8
Brand advertising (+). Advertising influences the early stages of consumers’ path-to-
purchase by building NP awareness and activating the motivation to buy it. Heavy advertising is
also a signal for NP quality. The rationale is that firms spend money up-front, expecting to recover
it through future sales. These marketing investments will be lost if the firm cheats on its assurance
of quality, and thus, rational consumers can reliably use advertising as a signal to infer the NP’s
quality (Klein and Leffler 1981).
NP innovativeness (+). Following Sorescu and Spanjol (2008) and Lamey et al. (2012), we
distinguish between breakthrough NPs and incremental NPs. These authors define breakthrough
innovations in the CPG industry as NPs that are the first to bring novel and significant consumer
benefits to the market. These benefits may come in different forms ranging from improvements to
product features, such as packaging (e.g., yogurt packaged in a tube that eliminates the need for a
spoon or refrigeration), to opening up an entirely new market (e.g., homemade sugar-free jam by
allowing customers to make freezer jam with a higher fruit content and less sugar than the pectin
method), or introduction of a new technology (e.g., wrap that seals to various surfaces, including
paper, plastic, and wood, using a proprietary gripping technology) (Sorescu and Spanjol 2008,
Table 2). Incremental innovations are NPs that deliver minor consumer benefits. We can expect
that the performance of breakthrough manufacturer innovations exceeds that of incremental NPs
(Sorescu and Spanjol 2008).
3.2 Lower-funnel shopper-marketing activities
NP price premium (-). All things equal, economic theory suggests that the higher the average
price of the NP relative to in-store alternatives in the product category, the lower the inclination of
shoppers to buy the product. Steenkamp and Gielens (2003) found that the trial probability was
lower for high-priced NPs.
NP promotion intensity (+). NPs need to gain a foothold in the market and shoppers will

9
recognize that firms use promotions to stimulate trial (Steenkamp and Gielens 2003). The
marketing literature provides strong support for the effectiveness of price promotions in increasing
sales.
3.3 The role of the store context
Retailer-wide store context: RBBE (+). The retail banner is a brand in its own right, affecting
shopper response, and creating value to the company (Ailawadi and Keller 2004; Kumar and
Steenkamp 2007). The retail banner acts as an umbrella brand spanning the entire assortment.
From an information-economics perspective (Erdem 1998), when consumers are uncertain about
the product’s quality, purchasing the product at a retailer with high RBBE lowers their perceived
purchase risk, which is especially important for NPs as they are inherently riskier than existing
ones (Steenkamp and Gielens 2003).
Category-specific store context: PL share (-). In categories where the retailer’s PL has
succeeded in capturing a large share of total sales, the performance of NPs introduced by a brand
manufacturer is likely to be lower. In these categories, many people have gotten used to buying
PLs, and have become less inclined to even consider buying branded products (Lamey et al. 2007).
Category-specific store context: Uniqueness (+/-). The same NP can be very unique in the
category at one retailer, but not so much at a competing retailer. We operationalize differences
between product offerings using two pertinent assortment attributes – package size (ter Braak,
Dekimpe, and Geyskens 2013a) and the number of sub-brands (i.e., brand-product varieties such
as Quaker Oat Crisp, Quaker Oat Crunch, etc.; Morgan and Rego 2009) that bear the same mother
brand name (i.c., Quaker) as the NP. If the package size is different from other products already
offered by the retailer or if the mother brand is not well-represented in the assortment, this
indicates higher uniqueness. One could argue that high uniqueness has a positive impact on NP
sales as the NP stands out more against the backdrop of other offerings in the category. On the

10
other hand, CPG shopping tends to be of a routinized nature, and shoppers who are in a routinized
shopping mode might have formed the habit of purchasing a particular package size. They also
may not notice the NP brand as hitherto it had not featured prominently in the retailer’s category
assortment. This should have a dampening effect on NP performance.
3.4 Covariates
Several other covariates are included in our framework (Figure 1) and analyses. First, NP speed of
adoption varies because retailers often do not adopt the NP at the same time– provided they decide
to include it in their assortment at all. Over time, the degree of market innovativeness wears off as
people learn about the NP through advertising, word-of-mouth, or other means, which is likely to
reduce demand. This suggests that NP performance is higher at retailers that adopt it earlier than
their competitors. Second, we consider whether the retailer is a hard discounter or a mainstream
retailer. Hard discounters have by a strong emphasis on PLs, small, austere stores, an unrelenting
focus on price, and bare-bone product presentation in carton boxes. This may not be the best
environment for an NP to prosper (Deleersnyder et al. 2007). Third, the overall economic context
at the time the NP is introduced can influence its performance (Lamey et al. 2012). Consumers are
known to be more risk averse in bad economic times. Thus, we expect that NPs perform better
when retailers add them to their assortment under more favorable economic conditions.
Finally, several category characteristics are expected to make it more or less attractive for
consumers to purchase NPs. Both category proliferation and category concentration are expected
to diminish NP performance. If the retailer already carries a large number of sub-brands in the
category, it is more difficult for the NP to stand out and influence brand choice. Similarly, it is
generally more difficult for a new entrant to gain a foothold in highly-concentrated markets than in
less-concentrated markets. As concentration increases, the importance of each brand to the total
output will increase and firms are less likely to ignore the possible effect of any action by a rival.
11
Apart from these retailer-specific variables, also some general (not retailer-specific) category
characteristics will make it more or less attractive for consumers to purchase NPs. If a category is
characterized by a higher proportion of shoppers who seek out a particular brand, this indicates
greater relevance of brands and this would have a positive effect on NP performance. Furthermore,
Steenkamp, van Heerde, and Geyskens (2010) show that consumers’ beliefs about how difficult it
is to make a good quality product in a particular category affects their perception of the quality
gap between NBs and PLs, and their willingness to pay more for brands. These are conditions
favorable to brands and their NPs. Finally, we control for purchase frequency (Steenkamp and
Geyskens 2014).
4. Method
4.1 Research setting
Our research setting is the U.K., one of the biggest European grocery markets. It is the home
market of Tesco, one of the world’s largest and most sophisticated global retail chains. Other
leading retailers in the U.K. market include Asda, the most important wholly-owned subsidiary of
Walmart, and Sainsbury’s, one of the world’s pioneers in PL development. The world’s leading
hard discounters, Germany’s Aldi and Lidl, are also active in the U.K.
4.2 Data
Our main data source is six years of scanner panel data (from June 2004 until June 2010) covering
grocery purchases of a representative sample of 15,000+ U.K. households, provided by Kantar
Worldpanel. We augmented this database with consumer survey data and secondary data to
operationalize the variables included in our research framework.
Identification of NPs. Category experts from Kantar Worldpanel identified 105 NPs launched
in the U.K. market across 21 broad CPG categories with frequent NP activities during the period

12
June 2005 to June 2008.1 For each of these 21 categories, the experts identified all NPs launched
in the U.K. by one of the top 50 CPG manufacturers in the European grocery market (ranking
based on the first full year of our screening period, source: Datamonitor).2 The categories cover a
mix of foods, beverages, personal-care products, and household-care products.
Retailer NP adoption. From the panel data, we assessed whether (when) these NPs were
adopted in the first year after their market launch by each of the 13 largest retail banners in the
U.K. grocery business. These retailers collectively represent almost 80% of U.K. grocery sales,
and they encompass hard discounters as well as mainstream retailers operating in different sizes.
This resulted in a set of 105x13=1,365 NP-retailer combinations. In two instances, the retailer did
not offer the specific category in its stores, leaving us with 1,363 observations for further analysis.
On average, a retailer accepted 66% of the NPs, with hard discounter Lidl accepting the fewest
(17%), and Asda, Morrisons, Sainsbury’s, and Tesco accepting around 90% of all NPs. Table 1
offers descriptive statistics on the 13 retail banners, along with NP acceptance and average
performance at each retailer.
--- Insert Table 1 about here ---
4.3 Measurement
We operationalized NP performance as the NP’s category volume share at the retailer in the first
year after its listing at that retailer. Across the 13 retailers, the average market share of the NPs in
the first year is 1.07%, but considerable variation across retailers is observed in Table 1. Hard
1 The period between June 2004 and June 2005 is used to initialize certain variables. The data after June 2008 are still
used to assess the post-introduction performance: we consider whether retailers accept the product within one year
after market entry, and determine NP performance in the first year following a retailer’s adoption. 2 To identify the NPs, the category experts identified those product lines/sub-brands for which the first purchase
records occurred during the screening time window, and for which the EAN product description in the panel data
identified a new benefit/attribute. In line with Gielens (2012), this allows us to abstract from promotional SKU
additions and/or additions that reflect a mere SKU proliferation of the existing offerings (e.g., an additional fruit
flavor in an existing yogurt line). As a validation, we cross-checked against the Product Launch Analytics database to
identify CPG NPs. All our NPs were also identified by this source.

13
discounters Aldi and Lidl show average first-year shares below .5%, while NPs at Iceland obtain
an average share of 2.94%.
Table 2 provides the measures and sources for all variables. Both RBBE and the equity of
the brand under which the NP was introduced were measured in an online consumer survey. The
retailer and brand surveys were administered in 2009 among members of Kantar Worldpanel’s
online panel. Each retail banner was evaluated by at least 250 respondents, and each innovating
brand by 45 to 50 respondents, conditional on their awareness of the retailer or brand. Table 3
reports means, standard deviations, and correlations for the variables in our NP performance
equation. All time-varying variables are operationalized the year prior to the retailer’s adoption
(or, in case of non-adoption, the year prior to the right-censoring date),3 unless explicitly specified
otherwise in Table 2.
--- Insert Tables 2 and 3 about here ---
4.4 Model specification
From the data, it is clear that not all 105 NPs are accepted by each of the 13 U.K. retailers in our
sample. NP adoption by a retailer is likely to be a strategic choice driven by various motives,
among which (potentially) the expected NP performance. If NPs that secure shelf presence at a
particular retailer differ in important, but unobserved, characteristics from those that fail to obtain
shelf presence, a problem of sample selection arises. Therefore, we simultaneously model NP
performance at the retailer (=our focal outcome equation), conditional upon the retailer’s decision
to adopt the NP (= selection equation) with a selection model.
NP performance equation. Our NP performance equation has the following specification:
(1) ln(𝑁𝑃𝑆𝑖𝑟
1−𝑁𝑃𝑆𝑖𝑟) = 𝛾0 +∑ (𝛾𝑘 ∗ 𝑈𝑃𝑆𝐻𝑂𝑃𝑖𝑟𝑘)
3𝑘=1 +∑ (𝛾𝑙+3 ∗ 𝐿𝑂𝑆𝐻𝑂𝑃𝑖𝑟𝑙)
2𝑙=1
3 Determined as one year after the NP’s initial launch in the U.K. market.

14
+∑ (𝛾𝑚+5 ∗ 𝑆𝑇𝑂𝑅𝐸𝐶𝑂𝑁𝑇𝐸𝑋𝑇𝑖𝑟𝑚)3𝑚=1
+∑ (𝛾𝑘+8 ∗ 𝑈𝑃𝑆𝐻𝑂𝑃𝑖𝑟𝑘 ∗ 𝑅𝐵𝐵𝐸𝑟)3𝑘=1 + ∑ (𝛾𝑙+11 ∗ 𝐿𝑂𝑆𝐻𝑂𝑃𝑖𝑟𝑙 ∗ 𝑅𝐵𝐵𝐸𝑟)
2𝑙=1
+∑ (𝛾𝑘+13 ∗ 𝑈𝑃𝑆𝐻𝑂𝑃𝑖𝑟𝑘 ∗ 𝑃𝐿𝑆𝑖𝑟)3𝑘=1 + ∑ (𝛾𝑙+16 ∗ 𝐿𝑂𝑆𝐻𝑂𝑃𝑖𝑟𝑙 ∗ 𝑃𝐿𝑆𝑖𝑟)
2𝑙=1
+∑ (𝛾𝑘+18 ∗ 𝑈𝑃𝑆𝐻𝑂𝑃𝑖𝑟𝑘 ∗ 𝑈𝑁𝐼𝑄𝑖𝑟)3𝑘=1 + ∑ (𝛾𝑙+21 ∗ 𝐿𝑂𝑆𝐻𝑂𝑃𝑖𝑟𝑙 ∗ 𝑈𝑁𝐼𝑄𝑖𝑟)
2𝑙=1
+𝛾24 ∗ 𝑆𝑃𝐸𝐸𝐷𝑖𝑟 + 𝛾25 ∗ 𝐷𝐼𝑆𝐶𝑟 +𝛾26 ∗ 𝐸𝐶𝑂𝑁𝑂𝑀𝑌𝑖𝑟
+∑ (𝛾𝑛+26 ∗ 𝐶𝐴𝑇𝐶𝑂𝑉𝐴𝑅𝐼𝐴𝑇𝐸𝑆𝑖𝑟𝑛)5𝑛=1 +∑ (𝛾𝑙+31 ∗ 𝐶𝑂𝑃𝑈𝐿𝐴𝑆𝑖𝑟𝑙) + ε1𝑖𝑟
2𝑙=1 ,
where ln (𝑁𝑃𝑆𝑖𝑟
1−𝑁𝑃𝑆𝑖𝑟) is the logistic transformation of the volume share of NP i (i=1,..,105) at retailer
r (r = 1,..,13) in the first year after the adoption at that retailer (NPS). Importantly, in calendar
time, this time window can vary across retailers, as they did not all adopt the NP on the same day
following its market introduction. We use the logistic transformation to account for the range
constraint in market share. UPSHOP denotes the three upper-funnel shopper-marketing variables
brand equity, brand advertising, and NP innovativeness, LOSHOP refers to the two lower-funnel
shopper-marketing variables NP price premium and NP promotion intensity. STORECONTEXT
denotes the three in-store context variables RBBE, PL share in the category (PLS), and uniqueness
in the assortment (UNIQ). We further control for each retailer’s speed of NP adoption (SPEED),
whether the retailer is a hard discounter or not (DISC), and ECONOMY reflects the state of the
economy. The five category variables indicated by CATCOVARIATES are category proliferation
and category concentration at the retailer, as well as the general category characteristics brand
loyalty, difficulty of making the category, and purchase frequency. Finally, COPULAS refers to
the two copula-based variables to control for endogeneity in the lower-funnel shopper-marketing
activities (see below).
Adoption equation. While the focus of this paper is not on why some retailers adopt certain
NPs while others do not, failure to control for this can result in biased parameter estimates in our
15
focal model. As such, we estimate the likelihood that retailer r (r = 1,..,13) adopts NP i (i=1,..,105)
in the first year after the national launch with the following probit model:
(2) 𝐴𝐷𝑂𝑃𝑇𝑖𝑟∗ = 𝛽0 +∑ (𝛽𝑘 ∗ 𝑈𝑃𝑆𝐻𝑂𝑃𝑖𝑟𝑘)
3𝑘=1 +∑ (𝛽𝑙+3 ∗ 𝐿𝑂𝑆𝐻𝑂𝑃𝑖𝑟𝑙)
2𝑙=1 + ∑ (𝛽𝑚+5 ∗ 𝑆𝑇𝑂𝑅𝐸𝐶𝑂𝑁𝑇𝐸𝑋𝑇𝑖𝑟𝑚)
3𝑚=1
+𝛽9 ∗ 𝑆𝑃𝐸𝐸𝐷𝑖𝑟 + 𝛽10 ∗ 𝐷𝐼𝑆𝐶𝑟 + 𝛽11 ∗ 𝐸𝐶𝑂𝑁𝑂𝑀𝑌𝑖𝑟
+∑ (𝛽𝑛+11 ∗ 𝐶𝐴𝑇𝐶𝑂𝑉𝐴𝑅𝐼𝐴𝑇𝐸𝑆𝑖𝑟𝑛)5𝑛=1 +∑ (𝛽𝑜+16 ∗ 𝑀𝐶𝑂𝑁𝑇𝑅𝑂𝐿𝑖𝑟𝑜)
4𝑜=1 +ε2𝑖𝑟 ,
where ADOPTir = 1 if ADOPT*ir > 0 and zero otherwise. The factors that increase (decrease) NP
performance at the retailer are likely to also affect a retailer’s incentive to accept the NP into its
assortment. Accordingly, the same drivers of NP performance appear in the NP adoption equation.
Importantly, post-adoption advertising, price, and promotion variables are not yet known at the
time of the adoption decision (and NP price and promotion are never observed in case of
rejection). We develop proxies for these variables (see below). Moreover, MCONTROL contains
four manufacturer variables that are expected to drive retailers’ decision to adopt NPs, but not
necessarily NP performance at that retailer.4 Given that shoppers are typically familiar with the
brand under which a product is sold, but much less knowledgeable about the manufacturer behind
these products,5 we make use of four manufacturer-related variables: their overall innovativeness,
their power relative to the retailer - both within the category and across categories - and the price
premium commanded by the mother brand which signals the manufacturer brand’s potential to
contribute to the retailer’s profit.6 We add these manufacturer variables only to the adoption
equation. The other variables are as defined before.
4 The exclusion restrictions, while not absolutely necessary, are useful for identification purposes (Johnston and
Dinardo 1997, p. 450). When these variables are also added to the NP performance equation, none of our key findings
are affected. Moreover, these variables are insignificant in this equation, providing empirical support for their
exclusion. 5 This is consistent with the idea that NBs in CPG follow mostly a ‘house of brands’ rather than a ‘branded house’
strategy. Our data confirms that all manufacturers in our sample own and market multiple brands. 6 Ideally, our adoption equation would also include profit-related drivers like slotting allowances and NP margin
information. Unfortunately, this information is notoriously hard to get for any retailer, let alone for 13 retail banners.

16
4.5 Model estimation
We estimate our model with a joint Maximum Likelihood estimation, which has been shown to be
more efficient than the more traditional two-stage estimation (Breen 1996).7 To allow for the
possibility that unobserved characteristics may affect both retailer NP adoption and performance,
no restrictions are imposed on the correlation between the error terms 𝜀1𝑖𝑟 and 𝜀2𝑖𝑟. In estimating
our model, we take into account several additional issues. First, to limit the influence of outlying
observations in our analysis and to reduce skewness, we ln-transform all continuous predictors8,
and mean-center these variables for ease of interpretation. We use effects coding for the dummy
variables NP innovativeness and hard discounter.
Second, even though we focus on several shopper-marketing instruments, there may be other
shopper-marketing activities (such as aisle and display-management strategies) that are not
explicitly measured, but which could have important effects on the NP performance at the retailer.
To control for potential within-retailer correlations across the different NPs, we employ cluster-
robust standard errors, in which the error terms are allowed to be correlated across the NPs within
a retail banner.
Third, we develop proxies for the not-yet-observed/missing values for post-adoption
advertising, price, and promotion. The fraction of brand advertising in total mother-brand sales in
the year prior to adoption is used to signal the manufacturer’s support for and investment in its
NPs after launch. The price premium for the NP prior to adoption is measured as the average price
of the NP at all other adopting retailers relative to the weighted national category price (with the
7 A condition number of 14.7, well below the proposed threshold of 20 (Leung and Yu 1996), indicates that our
model does not suffer from collinearity problems between the inverse Mills ratio and the outcome regressors. Thus, a
sample-selection specification is appropriate. 8 A formal joint skewness test (Mardia’s mSkewness) reveals that the independent continuous variables in the NP
performance equation are highly skewed (p < .01), with also 14 out of the 16 individual skewness tests significant at p
< .10. For variables that took the value of zero in our sample (NP promotion intensity, category PLS and uniqueness
in assortment), a value of one was added to every observation prior to the ln-transformation.

17
respective brands’ value share as the weight). This measure captures whether the focal NP is
relatively expensive compared to current category offerings in the market. We infer the
promotional intensity for the NP based on the promotional intensity the mother brand received in
the year prior to NP adoption at this retailer. Furthermore, we measure uniqueness in the
assortment as well as our purchase frequency and state of economy variable one year prior to
adoption (instead of the post introduction variant included in the outcome equation).
Fourth, the retailer may a priori have certain expectations about the NP at its stores, and act
accordingly. As a result, the proposed lower-funnel shopper-marketing drivers may not be
exogenously determined. To account for this, we adopt the instrument-free Gaussian copulas
approach (Park and Gupta 2012). This approach is especially useful when it is hard to find good
instruments, as in our case. We add two copula-based control variables linked to the two lower-
funnel shopper-marketing activities that are measured at the retailer level (i.e., NP price premium
and NP promotion intensity) to the performance equation, operationalized as follows:
(3) 𝐶𝑂𝑃𝑈𝐿𝐴𝑆𝑙 = 𝛷−1(𝐻(𝐿𝑂𝑆𝐻𝑂𝑃𝑙)),
where Φ-1 is the inverse of the cumulative normal distribution function, and H(.) the empirical
distribution of the respective shopper-marketing variable. For identification, it is necessary that
each variable is non-normally distributed. This was confirmed by a Shapiro-Wilk test for both
lower-funnel shopper-marketing variable (p’s <.10). Only retailer promotion intensity for the NP
is found to be endogenous (p < .01).
Finally, instead of retaining all 15 interactions specified in Equation 1, which would lead to
unstable results and multicollinearity, we estimate a trimmed model in which only interactions that
are significant at p < .20 are retained (see Steenkamp and Geyskens 2014 for a similar practice).

18
5. Results
5.1 Adoption equation
The maximum VIF factor for this equation is 4.25. This suggests multicollinearity is not a major
issue. We obtain a hit rate of 81.66%, which is significantly better than chance (55% = α2 + (1-
α)2, with α = 66%). The parameter estimates are shown in Table 4. A retailer is more likely to
include the NP in its assortment if it is a breakthrough NP (β3 = .195, p < .01) and when they come
with more promotional support (β5 = 2.049, p < .01). The retail context also drives NP adoption
decisions. High RBBE retailers are more likely to adopt an NP compared to low RBBE retailers
(β6 = 3.937, p < .01), while more unique products that stand out in package size and/or brand name
from other assortment offerings are less likely to gain acceptance among retailers (β8 = -3.213, p <
.01), suggesting that retailers strive for cohesion in their assortments. Further, NPs are less likely
to gain acceptance at limited-assortment hard discounters (β10 = -.541, p < .05), and in highly
concentrated categories (β13 = -1.136, p < .01). Thus, category concentration not only acts as
barrier to entry in an industry, but also at the micro level of individual retailers. Adoption of
branded NPs is also more likely in categories where consumers believe it is difficult to make a
quality product (β15 = 4.901, p < .01).
Finally, all four manufacturer variables are found to drive retailer NP adoption, even
though they are unrelated to consumer NP acceptance (see footnote 4). An NP is more likely to be
included in the assortment of a retailer if the NP is introduced by a manufacturer that has a history
of frequent NP introductions (β17 = .549, p < .01), if the manufacturer has considerable power over
the retailer - both across categories (β18 = 1.357, p < .01) and within the category in question (β19
=.059, p < .10) - and if a higher price premium can be charged for the NP at that retailer (β20 =
.271, p < .05), The hit rate and the face validity of the parameter estimates provide support for the
validity of the adoption equation.

19
--- Insert Table 4 about here ---
5.2 Model selection
We build our model by successively adding blocks of predictors as specified in Equation 1 (the
selection equation remains the same). Table 5 provides the results of the incremental model
building approach. As can be seen, all blocks of variables contribute to the explanatory power of
NP performance. Thus, our discussion will focus on Model M6.
The maximum VIF factor for Model M6 is 6.52. The error-correlation between 𝜀1𝑖𝑟 and 𝜀2𝑖𝑟
is negative and significant (ρ = -.164; p < .05), which underscores the importance of using a
selection model in our modeling effort. Its negative sign implies that, on average, the remaining
unobserved factors (e.g., slotting allowances or trade promotions that convinced an initially
reluctant retailer) may have an opposite effect on NP performance once offered in its stores.9
--- Insert Table 5 about here ---
5.3 Drivers of retailer NP performance
The parameter estimates for Model M6 are reported in Table 6. However, the estimates per se do
not give a good idea about the substantive impact of the various drivers on NP share at a retailer
because they are measured on different scales. To get a sense of their substantive impact, we
calculate for each variable in our NP performance equation how much the NP category share at the
retailer will change (in percentage points) if this variable goes from one standard deviation below
its mean to one standard deviation above its mean (Table 7).10 For the dichotomous variables NP
9 Many of such unobserved factors may be at play and only their net effect is reflected in ρ (some other factors may
well have a positive association). Clearly, this resulting net effect of the not-included factors will vary with the set of
included factors (several of which turn out to have a common effect across the selection and outcome equation). 10 To illustrate, we show how we arrive at these results for brand equity. We calculate the logit-transformed NP
retailer share for brand equity (with a standard deviation for the ln-transformed variable of .073) at one standard
deviation below zero (given mean centering) as -5.214 + .909*(-.073) = -5.280 with -5.214 the intercept γ0 and .909
the parameter estimate γ1 for brand equity in Table 6. The resulting NP retailer share, after reconversion, is .51%. We
repeat these calculations at one standard deviations above the mean as -5.214 + .909*(.073) = -5.148, resulting in an
NP retailer share of .58%. The difference (in percentage points) for a variation of one standard deviation on both sides
of the variable’s mean is .58% - .51% = +.07%.

20
innovativeness and hard discounter, we report the market share effect of the logical variation in the
variable (breakthrough NP/hard discounter versus incremental NP/other store format). To
determine the NP retailer shares, all other variables are fixed at their mean level (or zero for effect-
coded dummy variables).
We will now turn to a discussion of the results. We will structure our overview around the
four research questions identified in Section 1.
--- Insert Tables 6 and 7 about here ---
5.3.1 How important is shopper marketing in determining NP performance at the retailer?
The first question concerns the importance of shopper marketing in the context of NP
performance. Is it truly that important? The answer is a definite yes. We find that collectively,
shopper-marketing efforts related to the NP explain 26.78% of the variance in NP performance
(i.e., 53.08 – 26.30; Table 5). If we next allow for the idea that the idiosyncratic in-store shopper
context affects the effectiveness of shopper-marketing instruments, this percentage further
increases to 29.22%.
5.3.2 What is the relative importance of the set of upper-funnel vs. lower-funnel shopper-
marketing variables?
The second question is about the relative importance of the set of upper-funnel (market-level)
shopper-marketing variables versus the set of retailer-specific, lower-funnel shopper-marketing
variables in explaining NP success. Which group of factors is more important? Aggregated across
the individual main effects reported in Table 7, lower-funnel marketing actions, which ultimately
vary by retailer and that are the outcome of intense retailer-manufacturer negotiations, have more
than three times the impact on NP performance than the upper-funnel marketing actions used by
manufacturers to affect consumers early in the NP purchase cycle.

21
5.3.3 What is the substantive impact of the different shopper-marketing variables on NP
performance?
What can we say about the importance of individual shopper-marketing instruments on NP
success? Which are the key drivers? We propose that a driver that has a relative market-share
effect of one standard deviation around the mean of at least 25% might be considered a strong
driver, while a driver that has a relative market-share effect of at least 10% might be considered a
medium driver. We classify drivers with an effect below 10% as small. The average category
share of an NP at a retailer is 1.07% (Table 1). This means that effects in Table 7 that give rise to
an absolute market share change of at least .27% (.11%) can be interpreted as large (medium).
We find that two shopper-marketing variables have a large effect, using this classification
scheme: NP price premium (γ4 = -.835, p < .01) and NP promotion intensity (γ5 = 2.386, p < .01).
High-priced NPs achieve a market share that is on average .51 percentage points lower than low-
priced NPs.11 Highly promoted NPs achieve a market share that is .33% higher than NPs that
received little promotional support at the retailer in question.
The main effects of the upper-funnel shopper-marketing activities are all significant: brand
equity (γ1 =.909, p < .05), brand advertising (γ2 = .054, p < .01), and NP innovativeness (γ3 = .100,
p < .05). However, the magnitude of their impact is medium or less. NPs of heavily advertised
brands capture a .13% higher share than those that are not heavily advertised, while the market
share achieved by breakthrough NPs is, on average, .11% higher than that of incremental NPs. The
main effect of brand equity is small (Δ market share = .07%).
We further find support for the main effect of the two category-context variables in our
research framework (Figure 1), but not for the overall retail-banner context. NP performance is
11 Unless indicated otherwise, in the remainder of the paper when we talk about percentages, we refer to percentage
points.

22
lower in categories where the retailer’s own PL is stronger (γ7 = -.825, p < .01) and if the NP is
more unique in the assortment at the retailer (γ8 = -3.138, p < .01). Both effects (uniqueness: Δ
market share = -.21%; category PL share: Δ = -.13%) can be classified as medium in magnitude
size. However, the more important role of the store-context variables is in moderating the effect of
shopper-marketing instruments on NP performance, to which we now turn.
5.3.4 To what extent do the effects of the various shopper-marketing variables differ according to
the store context in which the NP is sold?
In line with Greene (2010), we focus on the significance of the relevant product terms in Table 6.12
The substantial number of significant interactions indicates that the effectiveness of shopper-
marketing activities indeed depends on the store context. Table 7 (right-hand side) provides
information on the substantive importance of the interactions for two levels (one standard
deviation above and below the mean) of the moderating variables RBBE, category PL share and
NP uniqueness in the assortment at the retailer.
Below, we focus on interactions that are associated with a medium or large effect size (i.e.,
a difference in market share between high and low values of the store-context variable in question
of at least .11 percentage points). We graphically depict all significant interactions in Figure 2 for
the upper-funnel shopper-marketing variables, and in Figure 3 for the lower-funnel shopper-
marketing variables, where we show the impact of a gradual increase in the shopper-marketing
instruments across the full range observed in our data.13 Note that the lower importance of the
upper-funnel marketing activities is already reflected in the different scaling that we adopted for
Figure 2 versus Figure 3.
--- Insert Figures 2 and 3 about here ---
12 Thus, we do not focus on the significance of changes in the partial effects, since these can be seen as an artifact of
our non-linear functional form (Greene 2010, p. 295). 13 In Table 7 and Figures 2 and 3, the other continuous variables are held at their mean level (or zero for effect-coded
dummy variables).

23
Upper-funnel shopper-marketing variables. The equity of the brand under which the NP is
introduced plays a considerably larger role at high RBBE retailers than at low RBBE retailers (Δ
market share = .12%). See Figure 2 (panel A.1) for the graph. We find further that the effect of
brand equity on NP performance varies systematically in function of the share of the retailer’s PL
(Δ = .16%). As shown in Figure 2 (panel B.1), if the retailer has been able to achieve a strong
position for its store brand in the category, brand equity does not really contribute to NP success.
However, in categories where the retailer’s own brand is in a weak position, brand equity has an
appreciable effect on NP performance. Combined, this means that the brand matters the most at
highly regarded retailers and in product categories where a retailer has not achieved a strong
position with its own brand.
The effect of NP innovativeness on its performance is amplified at high RBBE retailers (Δ =
.19%). As Figure 2 (Panel A.3) shows, for low RBBE retailers, NP innovativeness matters
relatively little. Any new product already might render the in-store shopping context a little more
appealing. However, for high RBBE retailers, a breakthrough NP is necessary to stand out against
a competitive context of a strong assortment and a reputable store brand. In addition, NP
assortment uniqueness moderates the positive effect of NP innovativeness on its performance (Δ =
.23%). As visualized in Figure 2 (panel C.1), the positive effect of NP innovativeness only holds
for NPs that are low on uniqueness in the assortment. For NPs high on assortment uniqueness, in
contrast, the breakthrough value of the product does not result in a higher NP performance. This is
consistent with consumer’s familiarity-safety association documented in Zajonc (1984): people
generally prefer previously seen, familiar stimuli over novel ones and hence, more familiar NP
traits will make it less risky for consumers to try out breakthrough NPs in such retailer
assortments.

24
Lower-funnel shopper-marketing variables. The negative effect of NP price premium on its
performance is even stronger at high RBBE retailers (Δ = .12%) – see Figure 3 (panel A.1).
Hence, the ability of the manufacturer to negotiate the price of the NP is of greater importance at
high RBBE retailers. Alternatively, while promotion intensity always improves NP performance,
it is significantly less effective at high RBBE retailers (see Figure 3, panel A.2). In fact, this is the
strongest moderating effect of them all. Compared to running price promotions in high RBBE
retailers, doing the same price promotion in a low RBBE retailer is associated with a market share
that is, on average, .41% higher.
PL share moderates the effectiveness of promotion support for the NP (Δ = .12%). If the
retailer’s PL is strong in the category, and supporting the NP with heavy promotion is even more
important. This is graphically reflected in the steeper slopes for NP promotion intensity (upward)
in high PL share categories (see Figure 3, panel B.2). This finding corroborates Pauwels and
Srinivasan (2004), who show that the presence of a strong PL at the retailer increases consumers’
sensitivity to price-related instruments.
5.3.5 Effect of covariates
Finally, we briefly turn to the role of the covariates in NP performance. One covariate clearly
stands out - within-retailer category proliferation. In categories with many (sub)brands, expected
NP share is .57% lower than in categories with a more limited assortment. Three other covariates
have a medium effect size. NP performance is lower at hard discounters (Δ = -.19%) and in more
concentrated categories ( Δ = -.20%), while NP performance is higher in categories that according
to consumers are difficult to make (Δ = .21%).
6. Robustness Checks
We perform a series of robustness tests to ensure the stability of our results, which we summarize
in Table 8.

25
Sensitivity to the time window. In our analysis, we evaluated retailer NP performance over a
time period of one year following the NP adoption by the retailer. As a robustness check, we re-
estimated our models with the retailer NP performance metric evaluated over a shorter and longer
time period of, respectively, 9 and 18 months after retailer adoption.
Alternative estimation method. To evaluate the sensitivity of our results to our estimation
method, we re-estimated the system with the more traditional two-stage estimation approach,
instead of the adopted joint Maximum Likelihood estimation advocated by Breen (1996).
Alternative clustering. Tesco operates four separate chain formats in the U.K. market: Tesco
(regular), Tesco Express, Tesco Extra, and Tesco Metro. In our analysis, we treat these four Tesco
formats as separate retail banners, since they vary considerably on multiple dimensions such as
store size, perceived RBBE, retailer NP adoption, and average NP performance at the retailer (see
Table 1). Nonetheless, there may be a closer relationship in NP acceptance and NP performance
among the Tesco formats than with other U.K. retail chains. Therefore, we also estimated the
model with an alternative error structure, i.e. where we allow the error terms of all Tesco
observations to be correlated with one another (irrespective of the specific Tesco banner), while
those of the non-Tesco observations remain correlated within their respective banner (hence,
allowing for 10 rather than 13 clusters).
Alternative transformation on the DV. Instead of using the logit transformation on the NP
share metric, we re-estimated our NP performance equation with the ln-transformed NP share as
dependent variable (resulting in a log-log model specification).
Controlling for retailer NP activity. We evaluated if NP performance is worse when the
retailer launches (more) NPs under its own store brand in the same time period. Data on retailer
NP activity was acquired through Product Launch Analytics. It was operationalized as the number
of new PL sub-brands in the category at the retailer in the year after the focal NP was added to the

26
assortment relative to the number of PL sub-brands available at the retailer in that year. This
variable was added to the performance equation.
Controlling for seasonality. To control for potential seasonality that may affect both NP
adoption and subsequent performance, we re-estimated our models with three additional quarterly
dummies (quarter dummy = 1 if the retailer adopted the NP within that quarter, 0 otherwise).
Controlling for other retail formats. Besides controlling for the hard-discounter store format,
we added an additional format dummy to our models, indicating whether the retail banner is a
convenience store. The only convenience retail banner in our sample according to PlanetRetail is
Tesco Express.
--- Insert Table 8 about here ---
Our results are very stable, as Table 8 details. For the five shopper-marketing main effects, the
findings replicate in 38 of the 40 instances. Similarly, all 24 main effects of the three store-context
variables are replicated across the eight robustness checks. With respect to the interactions
between the shopper-marketing instruments and the store context, our results are robust across 78
out of 80 instances. Moreover, also the effects of our covariates were very robust, with the hard-
discounter dummy losing its significance in only one instance and the effects of all others
consistent across all validations.
7. Discussion
Shopper marketing has recently gained prominence as a more comprehensive way to understand
and influence consumers along their path-to-purchase. In this paper, we examine the role of
shopper-marketing activities in the performance of NPs introduced by NB manufacturers at the
level of individual retailers. We distinguish between upper-funnel marketing instruments that
influence consumers early in the NP shopping cycle (brand equity, brand advertising, NP
innovativeness) and lower-funnel, retailer-specific, instruments that affect consumers later in the

27
purchase cycle right before or during the actual shopping trip (NP price premium and NP
promotion intensity). Consistent with shopper-marketing’s recognition of the importance of the
shopping context in which purchases take place, we allow for contingency effects of the overall
retailer-wide store context (RBBE) and the retailer category-specific context (category PL share
and NP uniqueness in the assortment) on the effects of the shopper-marketing factors.
We summarize our findings in Table 9. We classify the magnitude of each factor as large,
medium, or small, based on the analysis of their substantive importance as provided in Table 7,
using the classification scheme proposed above. We now turn to managerial implications of our
results.
--- Insert Table 9 about here ---
7.1 Managerial implications
Our study has two main findings of overarching managerial relevance. First, brand managers need
to take a comprehensive shopper-marketing view when it comes to introducing NPs. They need to
consider the entire path-to-purchase. Shopper environments differ between retailers and this has a
profound impact on NP success. NP marketing plans at the market level that fail to take this into
account will be deficient. Second, we show that the pendulum has shifted decisively from the
manufacturer to the retailer as manufacturers are not fully in control of what happens with their
NPs in store. Marketing-mix instruments that are a shared retailer-manufacturer responsibility
have at least three times the impact of the set of factors that are still under the manufacturer’s
exclusive control. When it comes to NP success, the lifeblood of CPG companies, lower-funnel
marketing actions targeting shoppers directly at the point-of-purchase ultimately decide your fate.
That does not mean that manufacturers are powerless, but rather that they should work ever
harder to collaborate with retailers and push the store specific shopper-marketing instruments in a
favorable direction. The way forward is information sharing and the development of NP marketing

28
programs tailored to individual retailers. Shankar et al. (2011, p. S37) note that retailers believe
that it is primarily the manufacturers’ responsibility to bring shopper-marketing insights to the
planning table. Our study provides such pertinent insights. It highlights the key importance of NP
pricing and promotion. Assuming that if a retailer adopts an NP, it has an interest in making it
successful (otherwise, why bother to do it in the first place), the manufacturer can work with the
retailer in setting adequate prices and designing promotion calendars and programs that maximize
the pass-through, e.g., by tying consumer promotions to trade promotions. The manufacturer can
customize the shopper-marketing insights by taking into account the retailer’s RBBE. If the
manufacturer does not have information on RBBE, it is easy to collect with our measurement
instrument. The manufacturer could consider allocating more of its promotion budget to low
RBBE retailers, given the very strong effect of promotions at these retailers. Conversely, it could
offer the NP at a lower price at high RBBE retailers – and negotiate that these retailers pass-
through the lower price to their shoppers. Table 9 provides suggestions for tailoring your NP
marketing program in function of the within-retailer category context.
However, not all news is bleak for brand manufacturers. There is a silver lining to our
findings – more specifically five silver linings. First, it has been ever more difficult for CPG firms
to come up with breakthrough NPs (Sorescu and Spanjol 2008). While we find that breakthrough
NPs generate on average a higher market share (+.11%) than incremental NPs, the effect is modest
compared to other factors, and even smaller than the effect of advertising (+.13%). Especially in
assortments where NPs are more unique, incremental NPs do hardly worse than breakthrough
NPs. So incremental NPs continue to offer something new and different.
Second, hard discounters are on the rise in Western countries. NB manufacturers are
increasingly interested to sell through this retail channel but are uncertain whether sales will make
it worth their while (Deleersnyder and Koll 2012). Note that NPs perform worse at hard

29
discounters than at other retailers. Hence, if the challenge is to be more represented in the hard
discounter assortment, we advise manufacturers to push first their mature brands rather than their
NPs at those outlets, which are more likely to create a win-win situation for both channel parties
(Deleersnyder et al. 2007).
A third silver lining is the role of consumer beliefs about the difficulty of making high quality
products in a given category. While such consumer beliefs are not easy to change, it is worth the
effort given that 1) the effect is considerable (+.21%) and 2) investments in changing such
perceptions can be leveraged across all retailers as it is distinct from any particular retailer. One
way to enhance this belief is through advertising that stresses the amount of experience and
knowledge that goes into producing good-quality products. For example, the Dutch beer
manufacturer Grolsch used to run TV commercials showing the amount of craftsmanship required
in many different professions (e.g., making musical instruments), and by projection, in brewing
good beer.
Fourth, Lamey et al. (2012) recommend that brand manufacturers ramp up their NP activity in
recessions to arrest the growth of PLs, but find that they do the opposite. Two reasons for this are
the uncertainty whether retailers might be willing to adopt them and whether shoppers are inclined
to try out something new in tough times. We find no strong evidence for either. The effect of the
state of the economy on the likelihood of adopting NPs is not significant (Table 4) and its effect
on NP performance, while significant, is below the cutoff of even a medium effect size (+.05%).
This finding is especially noteworthy as our sample includes the Great Recession that hit the U.K.
from March 2008 through June 2009.
Finally, while the manufacturer has limited control over NP performance, performance can
only transpire if the retailer decides to adopt the NP. Table 4 shows that the manufacturer has
influence on the retailer’s adoption decision. It can use its power in the market and against the

30
retailer as well as its record of NP launches to persuade the retailer to adopt the product.
7.2 Limitations and future research
Our study has several limitations that offer interesting avenues for future research. First, while we
cast a fairly wide net in terms of shopper-marketing variables, there are other variables that could
be considered (Shankar 2011). Future research could enrich our understanding of retailer-specific
NP performance by considering shelf layout and facings, store layout, atmospherics, navigation,
and especially in-store promotion support in the form of displays, features and other type of
merchandising, while also taking into account whether, e.g., slotting allowances were used to
persuade the retailer to list the NP. Second, the shopper-marketing concept acknowledges the
importance of shopping trip motivations and influences, and post-purchase evaluation and
recommendation. This requires other research approaches like experiments, surveys, and in-store
observations. Third, in our work, RBBE was measured at a single point in time. There is some
evidence that RBBE ratings are indeed rather stable over time. Since 2007, branding consultancy
Brand Finance estimates a brand’s strength annually using a balanced score card approach. It
reports for the period 2007-2009 ratings AA+, AA+, AA+ for Tesco, and AA-, A+, and A+ for
Asda. Yet, we acknowledge that RBBE may evolve over time as a function of retailers’ strategic
decisions. The same applies to brand equity. Future research could replace our static measures
with annual updates.
Fourth, all stores of a given banner tend to use similar marketing and merchandising
strategies, and offer the same, or nearly the same, variety of products. We model NP adoption by
the retailer as a binary choice (yes/no) at the level of the retail banner. In this context, it is
important to note that even though retailer Tesco operates in the U.K. market with four different
formats (Tesco, Tesco Express, Tesco Extra and Tesco Metro), we treated these as separate
banners in our analysis, given that some NPs are not adopted in all Tesco banners (or not at the

31
same time). Future research could examine if and when NP roll-out differs across stores from the
same banner, making the individual stores (rather than individual banners) the unit of analysis.
Controlling for region-specific economic indicators rather than the current national-level indicator
would then be called for in such an individual store setting. In addition, we implicitly assumed that
the observed absence of an NP at a banner is due to the retailer refusing to accept the NP, which is
in line with the dominant view in the literature (van Everdingen et al. 2011). Still, the observed
absence might also be due to manufacturers refusing to offer the product to a given retailer.
In this paper, we have adopted the perspective of the brand manufacturer. We examined
which factors drive NP success at individual retailers. Still, our performance metric is not
informative on the sources of the NP’s sales at the retailer. These may come at the expense of the
mother brand or other brands owned by the manufacturer (undesirable for the manufacturer), at the
expense of the retailer’s PL (undesirable for the retailer), at the expense of brands of other NB
firms (desirable for the manufacturer and (un)desirable for the retailer, dependent on profit
margins), and/or from category expansion (desirable for both parties). Future research should
examine alternative NP performance measures at the level of the retailer to identify the source of
the NPs’ sales. Dependent on the results, this may increase (or hamper) the strategic alignment
between the brand manufacturer and the retailer advocated by Shankar et al. (2011).
From the retailer’s point of view, an equally – if not more – important question is the role of
the NP in growing its national share of the category. That is an important complementary topic
worthy of more research. Our context does not allow us to study this issue as the average market
share of an NP at a retailer is only 1.07%. While such a low share is not at all atypical in the
mature CPG industry with its many sub-brands and SKUs per category, it is too small to reliably
identify any category market share expansion for the retailer.

32
References
Ailawadi, Kusum L. and Bari Harlam (2009), “Retailer Promotion Pass-Through: A Measure, Its
Magnitude, and Its Determinants,” Marketing Science, 28 (Summer), 782-791.
------- and Kevin L. Keller (2004), “Understanding Retail Branding: Conceptual Insights and
Research Priorities,” Journal of Retailing, 80 (December), 331-342.
------, Norm Borin, and Paul W. Farris (1995), “Market Power and Performance: A Cross-Industry
Analysis of Manufacturers and Retailers,” Journal of Retailing, 71 (Autumn), 211-248.
Ataman, M. Berk, Carl F. Mela, and Harald J. van Heerde (2008), “Building Brands,” Marketing
Science, 27 (Winter), 1036-1054.
Breen, Richard (1996), Regression Models – Censored, Sample Selected, or Truncated Data,
London/New Delhi: Sage Publications.
Cleeren, Kathleen, Harald J. van Heerde, and Marnik G. Dekimpe (2013), “Rising from the Ashes:
How Brands and Categories Can Overcome Product-Harm Crises,” Journal of Marketing, 77
(March), 58-77.
Corstjens, Judith and Marcel Corstjens (1995), Store Wars: The Battle for Mindspace and
Shelfspace, Chicester: Wiley.
Court, David Dave Elzinga, Susan Mulder, and Ole Jørgen Vetv (2009), “The Consumer Decision
Journey,” McKinsey Quarterly, June. http://www.mckinsey.com/business-
functions/marketing-and-sales/our-insights/the-consumer-decision-journey.
Deleersnyder, Barbara, Marnik G. Dekimpe, Jan-Benedict E.M. Steenkamp, and Oliver Koll
(2007), “Win-Win Strategies at Discount Stores,” Journal of Retailing and Consumer
Services, 14 (5), 309-318.
------- and Oliver Koll (2012), “National Brands at Discount Stores: A Winning Proposition?”
European Journal of Marketing, 46 (9), 1150-1170.
Dhar, Sanjay K. and Stephen J. Hoch (1997), “Why Store Brand Penetration Varies by Retailer,”
Marketing Science, 16 (Summer), 208-227.
Erdem, Tülin (1998), “An Empirical Analysis of Umbrella Branding,” Journal of Marketing
Research, 35 (August), 339-351.
Ernst&Young/ACNielsen (2000), New Product Introduction, Successful Innovation/Failure: A
Fragile Boundary, Paris: Ernst&Young Global Client Consulting.
Gielens, Katrijn (2012), “New Products: The Antidote to Private Label Growth?” Journal of
Marketing Research, 49 (June), 408-423.
------- and Jan-Benedict E.M. Steenkamp (2007), “Drivers of Consumer Acceptance of New
Packaged Goods: An Investigation Across Products and Countries,” International Journal of
Research in Marketing, 24 (June), 97-111.
Greene, William H. (2010), “Testing Hypotheses about Interaction Terms in Nonlinear Models,”
Economic Letters, 107 (May), 291-296.
Guyt, Jonne Y. and Els Gijsbrechts (2014), “Take Turns or March in Sync? The Impact of the
National Brand Promotion Calendar on Manufacturer and Retailer Performance,” Journal of
Marketing Research, 51 (December), 753-772.
Heeler, Roger M., Michael J. Kearney, and Bruce J. Mehaffey (1973), “Modeling Supermarket
Product Selection,” Journal of Marketing Research, 10 (February), 34-37.
Johnston, Jack and John Dinardo (1997), Econometric Methods, New York, NY: McGraw Hill
Co, 4th ed.
Klein, Benjamin and Keith B. Leffler (1981), “The Role of Market Forces in Assuring Contractual
Performance,” Journal of Political Economy, 89 (4), 615-641.

33
Kumar, Nirmalya, and Jan-Benedict E.M. Steenkamp (2007), Private Label Strategy: How to
Meet the Store Brand Challenge, Cambridge, MA: Harvard Business School Press.
Lamey, Lien, Barbara Deleersnyder, Marnik G. Dekimpe, and Jan-Benedict E.M. Steenkamp
(2007), “How Business Cycles Contribute to Private-Label Success: Evidence from the U.S.
and Europe,” Journal of Marketing, 71 (January), 1-15.
-------, -------, Jan-Benedict E.M. Steenkamp, and Marnik G. Dekimpe (2012), “The Effect of
Business-Cycle Fluctuations on Private-Label Share: What Has Marketing Conduct Got to Do
With It?” Journal of Marketing, 76 (January), 1-19.
Lehmann, Donald R., Kevin L. Keller, and John U. Farley (2008), “The Structure of Survey-Based
Brand Metrics,” Journal of International Marketing, 16 (December), 29-56.
Lemmens, Aurélie, Christophe Croux, and Marnik G. Dekimpe (2007), “Consumer Confidence in
Europe: United in Diversity?” International Journal of Research in Marketing, 24 (June),
113-127.
Lemon, Katherine N. and Peter C. Verhoef (2016), “Understanding Customer Experience
Throughout the Customer Journey,” Journal of Marketing, 80 (November), 69-96.
Leung, Siu F. and Shihti Yu (1996), “On the Choice Between Sample Selection and Two-Part
Models,” Journal of Econometrics, 72 (May-June), 197-229.
Morgan, Neil A. and Lopo L. Rego (2009), “Brand Portfolio Strategy and Firm Performance,”
Journal of Marketing, 73 (1), 59-74.
Nijs, Vincent R., Shuba Srinivasan, and Koen Pauwels (2007), “Retail-Price Drivers and Retailer
Profits,” Marketing Science, 24 (July-August), 473-487.
Park, Sungho and Sachin Gupta (2012), “Handling Endogenous Regressors by Joint Estimation
Using Copulas,” Marketing Science, 31 (July-August), 567-586.
Pauwels, Koen and Shuba Srinivasan (2004), “Who Benefits from Store Brand Entry?” Marketing
Science, 23 (Summer), 364-390.
Rubinson, Joel (2010), “Marketing from the Other End of the Funnel,” presentation at the MSI
Conference, June.
Shankar, Venkatesh (2011), Shopper Marketing, Cambridge (MA): Marketing Science Institute.
-------, Jeffrey J. Inman, Murali Mantrala, Eileen Kelley, and Ross Rizley (2011), “Innovations in
Shopper Marketing: Current Insights and Future Research Issues,” Journal of Retailing, 87S
(July), S29-S42.
Sorescu, Alina B. and Jelena Spanjol (2008), “Innovation’s Effect on Firm Value and Risk:
Insights from Consumer Packaged Goods,” Journal of Marketing, 72 (April), 114-132.
Steenkamp, Jan-Benedict E.M. and Inge Geyskens (2014), “Manufacturer and Retailer Strategies
to Impact Store Brand Share: Global Integration, Local Adaptation, and Worldwide Learning,”
Marketing Science 33 (Winter), 6-26.
------- and Katrijn Gielens (2003), “Consumer and Market Drivers of the Trial Probability of New
Consumer Packaged Goods,” Journal of Consumer Research, 29 (December), 368-384.
-------, Harald J. van Heerde, and Inge Geyskens (2010), “What Makes Consumers Willing to Pay a
Price Premium for National Brands over Private Labels?” Journal of Marketing Research, 47
(December), 1011-1024.
ter Braak, Anne, Marnik G. Dekimpe, and Inge Geyskens (2013a), “Retailer Private-Label
Margins: The Role of Supplier and Quality-Tier Differentiation,” Journal of Marketing, 77
(July), 86-103.
-------, Barbara Deleersnyder, Inge Geyskens, and Marnik G. Dekimpe (2013b), “Does Private-
Label Production by National-Brand Manufacturers Create Discounter Goodwill?”
International Journal of Research in Marketing, 30 (December), 343-357.

34
van Everdingen, Yvonne M., Laurens M. Sloot, Erjen van Nierop, and Peter C. Verhoef (2011),
“Towards a Further Understanding of the Antecedents of Retailer New Product Adoption,”
Journal of Retailing, 87 (December), 579-597.
Zajonc, Robert B. (1984), “On the Primacy of Affect,” American Psychologist, 39 (2), 117-123.

35
Table 1: NPs at the Top-13 U.K. Grocery Retail Banners
Retail banner Market share
(%)
Average
penetration within
a categorya
(%)
RBBE
Average PL
share within
a category
(%)
Number of
adopted
(breakthrough)
NPsb
Percentage of
NPs adopted
(%)
Average NP
performancec
(%)
n=105 (5)
Aldi 1.47 7.06 4.23 84.18 50 (3) 47.60 .17
Asda 16.14 36.55 4.83 21.24 92 (5) 87.60 .88
Iceland 1.51 4.26 4.28 1.74 26 (1) 24.80 2.94
Lidl 1.83 7.39 4.31 87.16 18 (1) 17.10 .32
Morrisons 11.00 26.96 4.50 15.34 95 (5) 90.50 1.13
Netto .82 3.53 3.82 17.62 40 (2) 38.10 .61
Sainsbury’s 11.88 25.71 4.94 16.58 94 (5) 89.50 1.09
Somerfield 2.27 7.97 3.96 10.91 80 (5) 76.20 1.10
Tesco 17.73 41.93 5.20 19.80 94 (5) 89.52 .89
Tesco Express .50 3.18 4.40 16.70 77 (5) 73.30 1.24
Tesco Extra 8.12 19.08 4.59 19.05 95 (5) 90.50 1.08
Tesco Metro .76 2.75 4.39 20.56 70 (4) 66.70 .94
Waitrose 1.53 3.73 4.31 12.46 76 (5) 72.40 1.67
Mean 5.81 14.62 4.44 21.73 70 (3.92) 66.50 1.07 a Represents the average share of all U.K. panel members that buy in the category at the specific retailer averaged across our 21 categories
during our data period. b An NP is adopted if the retailer adds the product to its assortment within the first year following the NP’s market entry. The number of
breakthrough NP adoptions is reported between brackets. c Retailer NP performance is the volume share (%) of an adopted NP in the category at a given retailer in the first year after its adoption by
that retailer.

36
Table 2: Measures and Operationalization
Variable Operationalization Data source Supporting
reference
Upper-funnel shopper-marketing
Brand equity
Brand equity was measured by items 1-16 given under RBBE below. XXX in these items
refers to the brand under which the NP was introduced and “store” is replaced by “product”
in item 12, 14 & 15.
Brand equity = [Esteem + Differentiation + Relevance + Energy] / 4
consumer
survey
adapted from
Lehmann et al.
(2008)
Brand advertising
National advertising share-of-voice for the mother brand in the category in the year after
retailer adoption.
Nielsen Media Cleeren et al.
(2013)
NP innovativeness
= 1 if an NP is classified as a breakthrough NP, -1 otherwise.
A breakthrough NP is an NP that is the first in the industry to offer one or more of the 6
innovativeness dimensions: (1) positioning the product to new users or usage, (2) providing
a consumer benefit with new packaging, (3) opening up a new market for the product, (4)
merchandising, (5) offering additional value through a new formulation, and (6) introducing
a new technology.
Product Launch
Analytics
Sorescu and
Spanjol (2008)
Lower-funnel shopper-marketing
NP price premium
Price premium of the NP over retailer’s category price = ratio of the NP unit price at the
retailer to the weighted category unit price at the retailer (with the respective brands’ value
share at the retailer as the weight) in the year after retailer adoption.
panel data Lamey et al.
(2012)
NP promotion intensity
Promotion frequency of the NP at the retailer = the number of weeks with a negative price
shock of more than 5% of the offering’s regular (average) price in the year after retailer
adoption relative to a maximum of 52 weeks.
panel data Nijs et al.
(2007)
Store context
Retail-banner brand
equity
(RBBE)
1. I hold XXX in high regard.
2. XXX is a leader in its field.
3. XXX has earned a strong reputation.
4. XXX respects me.
5. XXX stands out from its competitors.
6. XXX stands for something unique.
7. XXX is in a class by itself.
8. XXX is relevant to me.
9. XXX is relevant to my family and/or close friends.
10. XXX is a good one for me.
11. XXX fits my lifestyle.
12. I would be tempted to buy in any store of XXX.
13. XXX is innovative.
14. I would buy in any type of store concept introduced by XXX.
15. Based on my experience with XXX, I would strongly consider looking for a XXX store
when I move to a new area.
consumer
survey
adapted from
Lehmann et al.
(2008)

37
Variable Operationalization Data source Supporting
reference
16. XXX constantly introduces NPs.
17. XXX constantly introduces new services.
Esteem = Σ(items1-4)/4; Differentiation = Σ(items 5-7)/3; Relevance = Σ(items 8-11)/4;
Energy = Σ(items 12-17)/6. Items are scored on 7-point Likert scale.
XXX refers to the retail banner in question.
RBBE = [Esteem + Differentiation + Relevance + Energy] / 4
Category PL share
(PLS)
Value share of the PLs in the category at the retailer in the year prior to retailer adoption. panel data Dhar and Hoch
(1997)
Uniqueness in
assortment
(UNIQ)
= 1 – [∑ (𝑆𝑘
𝑁)2
𝑘=1 ]/2) with Sk the number of sub-brands with a similar value on attribute k in
the category at the retailer, and N the total number of sub-brands in the category at the
retailer in the year after retailer adoption. The two attributes are package size (k=1) and
mother brand presence (k=2). If an NP is sold in multiple pack sizes at a retailer, S1 is
determined as a weighted average across all different NP package sizes offered at the retailer
(with the respective NP package sizes’ volume share at the retailer as the weight).
panel data ter Braak et al.
(2013a)
Covariates Speed of adoption
= 14 - number of retailers (out of the 13 U.K. retailers in our sample) that already adopted
the NP prior to adoption by the focal retailer.
If the focal retailer did not accept the NP within the 1st year after its market launch, it
represents the total number of retailers (out of the 13 U.K. retailers) that accepted the NP
within the first year after market launch.
panel data Heeler et al.
(1973)
Hard discounter = 1 if the retailer is hard discounter Aldi or Lidl, -1 otherwise. panel data
State of the economy Consumer sentiment index in the U.K. in the year after retailer adoption (measured as an
average over 12 months).
Eurostat Lemmens et al.
(2007)
Category proliferation Total number of sub-brands offered in the category at the retailer in the year prior to retailer
adoption.
panel data Gielens (2012)
Category concentration Sum of the value market shares of the top 3 brands in the category at the retailer in the year
prior to retailer adoption.
panel data ter Braak et al.
(2013a) Category brand loyalty The percentage of respondents that indicated they are brand loyal based on the following
question: “What action would you take when your preferred brand in the category XX is out
of stock?”
1 = purchase the desired item at another store
2 = buy another type / version / pack size of the same brand at this store
3 = buy another brand/shop's own label at the same store
4 = return to the store another day to buy the brand I wanted
Respondent is classified as brand loyal if s/he chooses option 1 or 2.
consumer
survey
Corstjens and
Corstjens
(1995)
Difficulty of making the
category
“In the category XX, making good quality products is difficult”
Item is scored on a 5-point Likert scale.
consumer
survey
Steenkamp et
al. (2010)

38
Variable Operationalization Data source Supporting
reference
Category purchase
frequency
Total number of purchase records in the panel dataset in the category divided by the number
of unique panel members who buy in the category in the year after retailer adoption.
panel data Steenkamp and
Geyskens
(2014)
Manufacturer
innovativenessa
Number of NPs launched by the manufacturer in the category over the last 5 years prior to
retailer adoption relative to the number of brands offered in the U.K. market by the
manufacturer in the category in the year prior to retailer adoption.
Product Launch
Analytics &
panel data
Sorescu and
Spanjol (2008)
Manufacturer power
across categoriesa Total assets of the manufacturer relative to total assets of the retailer in year 2007. Orbis Ailawadi et al.
(1995)
Manufacturer power
within the categorya
Value share of the manufacturer in the category at the retailer in the year prior to retailer
adoption.
panel data ter Braak et al.
(2013b)
Mother brand price
premiuma Price premium of the NP mother brand at the retailer over retailer’s category price = ratio of
the mother brand unit price at the retailer to the weighted category unit price at the retailer
(with the respective brands’ value share at the retailer as the weight) in the year prior to
retailer adoption.
panel data Lamey et al.
(2012)
a Variable does not directly explain retailer NP performance, but it is added as an additional control variable to the selection equation to control for potential
sample selection bias.

39
Table 3: Descriptive Statistics and Correlations of the Drivers of NP Performance at the Retailera
Meanb S.D. Correlation matrix
1 2 3 4 5 6 7 8 9 10 11 12 13 14 15 16
1. Brand equity 4.77 0.34 1
2. Brand advertising 0.36 0.26 0.65 1
3. NP innovativeness 5.62% - -0.01 0.23 1
4. NP price premium 1.5 1.17 0.15 0.22 0.16 1
5. NP promotion intensity 0.16 0.16 0.03 0.03 0.10 -0.08 1
6. Retail-banner brand equity 4.52 0.37 -0.02 -0.02 -0.01 -0.06 0.41 1
7. Category private-label share 0.22 0.21 0.03 0.03 -0.07 0.19 -0.19 -0.08 1
8. Uniqueness in assortment 0.84 0.11 -0.21 -0.28 -0.15 -0.09 0.06 0.10 0.04 1
9. Speed of adoption 8.61 3.08 -0.08 -0.06 -0.04 -0.06 0.35 0.56 -0.20 0.06 1
10. Hard discounter 11.91% - 0.03 0.02 0.00 0.20 -0.27 -0.43 0.67 -0.04 -0.42 1
11. State of the economy 104.93 7.5 -0.01 -0.08 0.02 0.04 0.02 -0.01 0.02 0.22 0.01 0.03 1
12. Category proliferation 112.46 72.73 0.04 -0.08 -0.11 -0.15 0.21 0.35 -0.15 0.50 0.28 -0.29 0.11 1
13. Category concentration 0.57 0.15 0.39 0.25 0.17 0.28 -0.02 -0.02 -0.02 -0.41 0.00 0.01 -0.05 -0.40 1
14. Category brand loyalty 0.52 0.1 0.30 0.07 0.04 -0.06 0.01 -0.05 0.00 0.32 -0.07 0.04 0.09 0.26 0.29 1
15. Difficulty of making the category 2.64 0.14 -0.05 0.02 0.16 0.20 -0.02 -0.01 -0.13 -0.29 -0.05 0.02 -0.10 -0.40 0.32 -0.29 1
16. Category purchase frequency 19.44 21.49 0.04 -0.14 -0.15 -0.02 0.04 -0.02 0.05 0.37 -0.05 -0.02 0.07 0.48 -0.30 0.06 -0.16 1 a Before ln-transformation and mean-centering. b For NP innovativeness and Hard discounter, we report the percentage of observations having the value of one.

40
Table 4: Drivers of NP Adoption by the Retailer
Variable Estimate Z-value
Intercept (β0) .688 * 1.82
Shopper-marketing variables Upper-funnel shopper marketing Brand equity (β1) -.856 -1.19
Brand advertising (β2) -.014 -.61
NP innovativeness (β3) .195 *** 3.03
Lower-funnel shopper marketing Price premium at other retailers (β4) .060 .69
Promotion intensity at focal retailer (β5) 2.049 *** 5.20
Store context Retailer-wide store context Retail-banner brand equity (β6) 3.937 *** 3.40
Category-specific store context Category PL share (β7) .837 .93
Uniqueness in assortment (β8) -3.213 *** -3.23
Covariates Speed of adoption (β9) -.050 -.30
Hard discounter (β10) -.541 ** -2.07
State of the economy (β11) -.747 -1.08
Category proliferation (β12) -.023 -.08
Category concentration (β13) -1.136 *** -3.62
Category brand loyalty (β14) .216 .45
Difficulty of making the category (β15) 4.901 *** 2.92
Category purchase frequency (β16) .049 .30
Manufacturer innovativeness (β17) .549 *** 8.90
Manufacturer power across categories (β18) 1.357 *** 2.82
Manufacturer power within the category (β19) .059 * 1.75
Mother brand price premium (β20) .271 ** 2.03
Pseudo R² 34.69%
N 1,363
*** p < .01, ** p < .05, * p < .10 (p-values are two-sided).
Table 5: Model Fit
Model
Deviance (-2LL) ∆Dev df a AIC R²
Model M1 = intercept only 4,188.76 - - 4,236.76 - Model M2 = M1 + covariates 3,962.57 226.19*** 8 4,039.11 23.28% Model M3 = M2 + store context 3,925.01 37.56*** 3 4,008.01 26.30% Model M4 = M3 + shopper-marketing variables 3,516.27 408.74*** 7 3,612.21 53.08%b Model M5 = M4 + interactions shopper marketing with store
context 3,465.64 50.63*** 15 3,591.61 55.63% Model M6 = M5 with only interactions at p < .20 retained 3,467.41 -1.77 5 3,583.48 55.52%
*** p < .01. a The degrees of freedom of the likelihood-ratio test equals the number of variables added (or removed) in each
step. b Without the two copula terms, R²=52.15%.
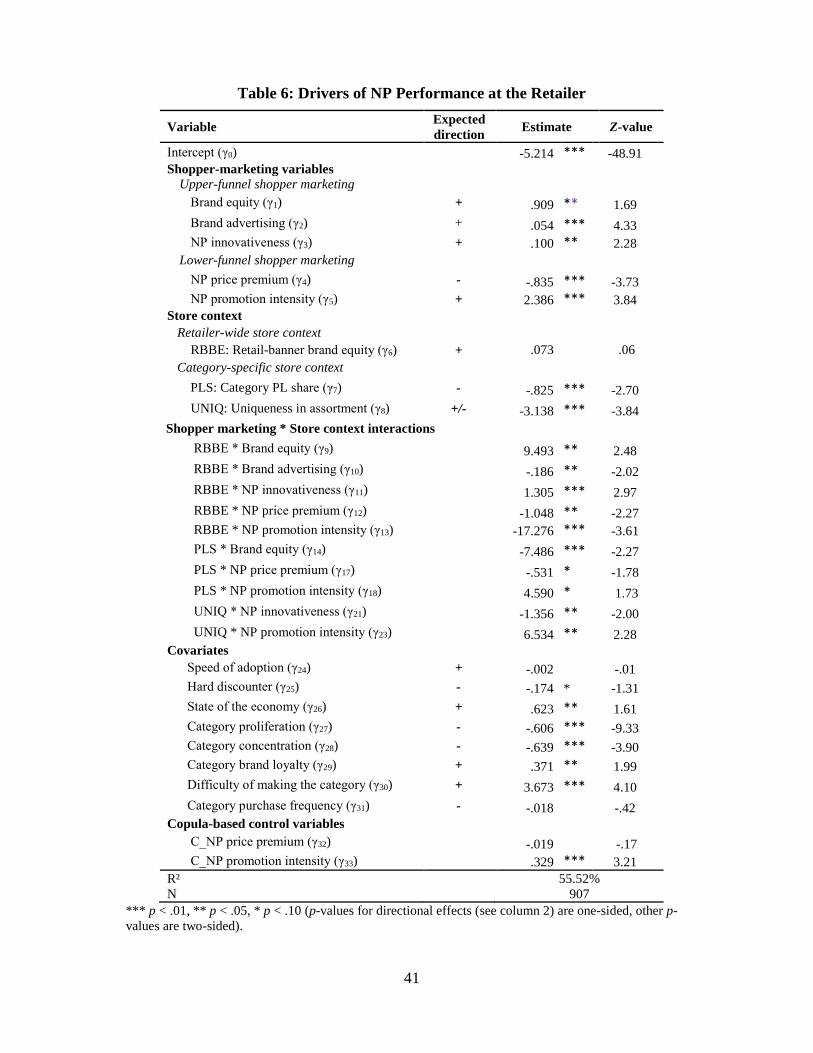
41
Table 6: Drivers of NP Performance at the Retailer
Variable Expected
direction Estimate Z-value
Intercept (γ0) -5.214 *** -48.91
Shopper-marketing variables
Upper-funnel shopper marketing
Brand equity (γ1) + .909 ** 1.69
Brand advertising (γ2) + .054 *** 4.33
NP innovativeness (γ3) + .100 ** 2.28
Lower-funnel shopper marketing
NP price premium (γ4) - -.835 *** -3.73
NP promotion intensity (γ5) + 2.386 *** 3.84
Store context
Retailer-wide store context
RBBE: Retail-banner brand equity (γ6) + .073 .06
Category-specific store context
PLS: Category PL share (γ7) - -.825 *** -2.70
UNIQ: Uniqueness in assortment (γ8) +/- -3.138 *** -3.84
Shopper marketing * Store context interactions
RBBE * Brand equity (γ9) 9.493 ** 2.48
RBBE * Brand advertising (γ10) -.186 ** -2.02
RBBE * NP innovativeness (γ11) 1.305 *** 2.97
RBBE * NP price premium (γ12) -1.048 ** -2.27
RBBE * NP promotion intensity (γ13) -17.276 *** -3.61
PLS * Brand equity (γ14) -7.486 *** -2.27
PLS * NP price premium (γ17) -.531 * -1.78
PLS * NP promotion intensity (γ18) 4.590 * 1.73
UNIQ * NP innovativeness (γ21) -1.356 ** -2.00
UNIQ * NP promotion intensity (γ23) 6.534 ** 2.28
Covariates
Speed of adoption (γ24) + -.002 -.01
Hard discounter (γ25) - -.174 * -1.31
State of the economy (γ26) + .623 ** 1.61
Category proliferation (γ27) - -.606 *** -9.33
Category concentration (γ28) - -.639 *** -3.90
Category brand loyalty (γ29) + .371 ** 1.99
Difficulty of making the category (γ30) + 3.673 *** 4.10
Category purchase frequency (γ31) - -.018 -.42
Copula-based control variables
C_NP price premium (γ32) -.019 -.17
C_NP promotion intensity (γ33) .329 *** 3.21
R² 55.52%
N 907
*** p < .01, ** p < .05, * p < .10 (p-values for directional effects (see column 2) are one-sided, other p-
values are two-sided).
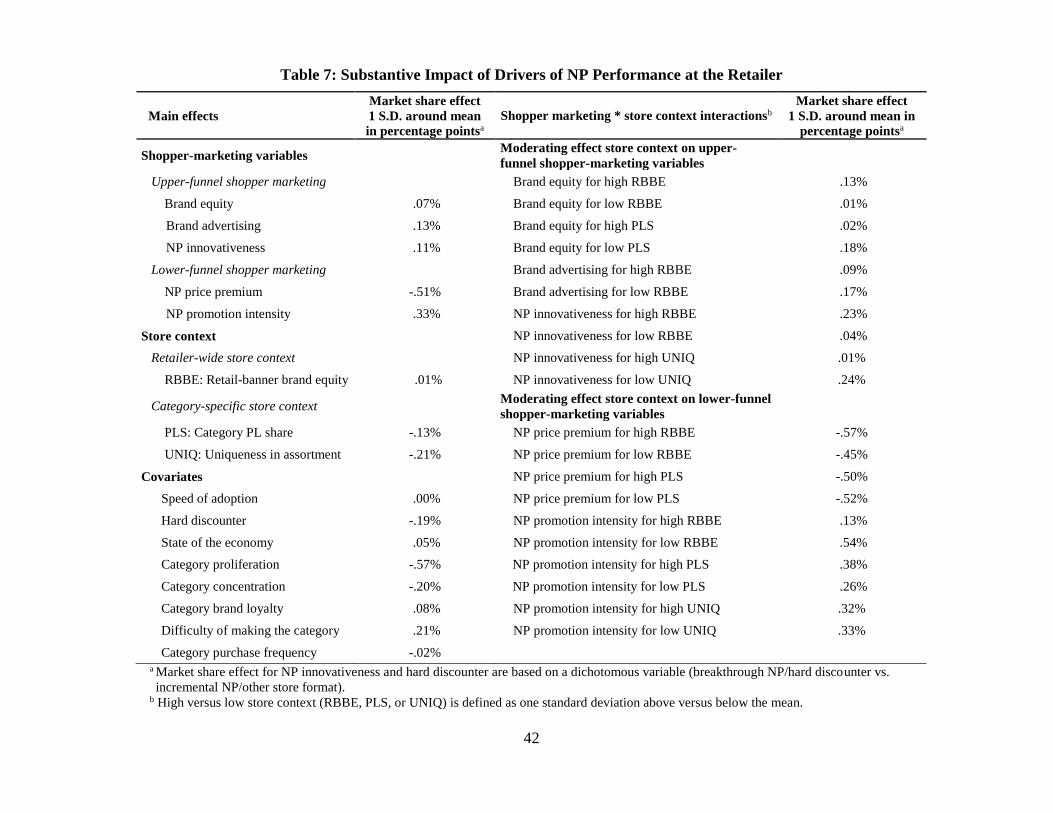
42
Table 7: Substantive Impact of Drivers of NP Performance at the Retailer
Main effects
Market share effect
1 S.D. around mean
in percentage pointsa
Shopper marketing * store context interactionsb
Market share effect
1 S.D. around mean in
percentage pointsa
Shopper-marketing variables Moderating effect store context on upper-
funnel shopper-marketing variables
Upper-funnel shopper marketing Brand equity for high RBBE .13%
Brand equity .07% Brand equity for low RBBE .01%
Brand advertising .13% Brand equity for high PLS .02%
NP innovativeness .11% Brand equity for low PLS .18%
Lower-funnel shopper marketing Brand advertising for high RBBE .09%
NP price premium -.51% Brand advertising for low RBBE .17%
NP promotion intensity .33% NP innovativeness for high RBBE .23%
Store context NP innovativeness for low RBBE .04%
Retailer-wide store context NP innovativeness for high UNIQ .01%
RBBE: Retail-banner brand equity .01% NP innovativeness for low UNIQ .24%
Category-specific store context Moderating effect store context on lower-funnel
shopper-marketing variables
PLS: Category PL share -.13% NP price premium for high RBBE -.57%
UNIQ: Uniqueness in assortment -.21% NP price premium for low RBBE -.45%
Covariates NP price premium for high PLS -.50%
Speed of adoption .00% NP price premium for low PLS -.52%
Hard discounter -.19% NP promotion intensity for high RBBE .13%
State of the economy .05% NP promotion intensity for low RBBE .54%
Category proliferation -.57% NP promotion intensity for high PLS .38%
Category concentration -.20% NP promotion intensity for low PLS .26%
Category brand loyalty .08% NP promotion intensity for high UNIQ .32%
Difficulty of making the category .21% NP promotion intensity for low UNIQ .33%
Category purchase frequency -.02% a Market share effect for NP innovativeness and hard discounter are based on a dichotomous variable (breakthrough NP/hard discounter vs.
incremental NP/other store format). b High versus low store context (RBBE, PLS, or UNIQ) is defined as one standard deviation above versus below the mean.

43
Table 8: Robustness Checks
Focal
model
Alternative
evaluation
window
2-step
estim.
Alter-
native
clustering
Ln
transform.
DV
Additional
control
variables
9 m 18 m (1) (2) (3)
Shopper-marketing variables
Brand equity (γ1) + ✓ ✓ ✓ ✓ ✓ ✓ ✓ ✓
Brand advertising (γ2) + ✓ ✓ ✓ ✓ ✓ ✓ ✓ ✓
NP innovativeness (γ3) + n.s. n.s. ✓ ✓ ✓ ✓ ✓ ✓
NP price premium (γ4) - ✓ ✓ ✓ ✓ ✓ ✓ ✓ ✓
NP promotion intensity (γ5) + ✓ ✓ ✓ ✓ ✓ ✓ ✓ ✓
Store context
Retail-banner brand equity (RBBE) (γ6) n.s. n.s. n.s. n.s. n.s. n.s. n.s. n.s. n.s.
Category PL share (PLS) (γ7) - ✓ ✓ ✓ ✓ ✓ ✓ ✓ ✓
Uniqueness in assortment (γ8) - ✓ ✓ ✓ ✓ ✓ ✓ ✓ ✓
Shopper marketing * store context interactions
RBBE * Brand equity (γ9) + ✓ ✓ ✓ ✓ ✓ ✓ ✓ ✓
RBBE * Brand advertising (γ10) - ✓ ✓ ✓ ✓ ✓ ✓ ✓ ✓
RBBE * NP innovativeness (γ11) + ✓ ✓ ✓ ✓ ✓ ✓ ✓ ✓
RBBE * NP price premium (γ12) - (✓)a n.s. ✓ ✓ ✓ ✓ ✓ ✓
RBBE * NP promotion intensity (γ13) - ✓ ✓ ✓ ✓ ✓ ✓ ✓ ✓
PLS * Brand equity (γ14) - ✓ ✓ ✓ ✓ ✓ ✓ ✓ ✓
PLS * NP price premium (γ17) - ✓ ✓ ✓ ✓ ✓ ✓ ✓ ✓
PLS * NP promotion intensity (γ18) + n.s. ✓ (✓)a ✓ ✓ ✓ ✓ ✓
UNIQ * NP innovativeness (γ21) - ✓ ✓ ✓ ✓ ✓ ✓ ✓ ✓
UNIQ * NP Promotion intensity (γ23) + (✓)a ✓ ✓ ✓ ✓ ✓ ✓ ✓
Covariates
Speed of adoption (γ24) + ✓ ✓ ✓ ✓ ✓ ✓ ✓ ✓
Hard discounter (γ25) - ✓ (✓)a (✓)a ✓ ✓ ✓ (✓)a n.s.
State of the economy (γ26) + ✓ ✓ ✓ ✓ ✓ ✓ ✓ ✓
Category proliferation (γ27) - ✓ ✓ ✓ ✓ ✓ ✓ ✓ ✓
Category concentration (γ28) - ✓ ✓ ✓ ✓ ✓ ✓ ✓ ✓
Category brand loyalty (γ29) + ✓ ✓ (✓)a ✓ ✓ ✓ ✓ ✓
Difficulty of making the category (γ30) + ✓ ✓ ✓ ✓ ✓ ✓ ✓ ✓
Category purchase frequency (γ31) n.s. n.s. n.s. n.s. n.s. n.s. n.s. n.s. n.s.
Additional control variables
Retailer NP activity (1) +
Seasonal dummies (2) (+)b
Convenience store format (3) +
✓ indicates that the parameter is similar in both sign and significance (p < .10) to the focal model results. a Even though the parameter is robust in sign and magnitude, it has a p-value between .10 and .15, just outside the 10%
significance level. b NPs introduced in quarter 3 perform better relative to the other quarters (1, 2, and 4).

44
Table 9: Summary of Findings
Driver of NP performance
Direction
of the
overall
effect
Magnitude of
effect on NP
performance
Implications
Shopper-marketing variables
Upper-funnel shopper marketing
Brand equity for low PLS
categories and high RBBE
retailers
Positive Medium Brand equity is of medium importance in categories where the retailer’s PL is weak and for high RBBE
retailers. In other situations, brand equity has a negligible effect on NP performance.
Brand advertising for low
RBBE retailers
Positive Medium Brand advertising does contribute to NP performance although the effect is only of medium importance
and has only a small effect for high RBBE retailers.
NP innovativeness for high
RBBE retailers and for NP
with low uniqueness in the
assortment
Positive Medium The effect of NP innovativeness differs strongly across retailers in function of their RBBE and the
uniqueness of the innovation in the retailer’s category assortment. Breakthrough NPs do especially well
at high RBBE retailers and in assortments where they are less unique. The effect of NP innovativeness
is small at a low RBBE retailer and in assortments where the NP is more unique.
Lower-funnel shopper marketing
NP price premium Negative Large Although the effect of NP price premium is moderated by RBBE and PLS, it is always large. A larger
price premium versus the category price level at that retailer reduces NP performance at any retailer.
Apart from category proliferation, price premium has the largest generalized effect on retailer NP
performance.
NP promotion intensity Positive Large The effect of NP promotion intensity is large across different levels of PLS and UNIQ in the category
and for all retailers but high RBBE retailers, where the effect of promotion intensity is only medium. At
low RBBE retailers, heavy promotions is absolutely crucial for NP performance.
Store context
Retailer-wide store context
Retail-banner brand equity
(RBBE)
Null - The main effect of RBBE per se is negligible. That means that an NP can succeed in highly regarded
and less-highly regarded retailers. However, RBBE does moderate the effects of all five shopper-
marketing variables. This underlines the importance of tailoring NP introduction strategies to individual
retailers - a core tenet of shopper marketing.
Category-specific store context
Category PL share (PLS) Negative Medium The overall effect of category PLS is medium. However, PLS also systematically affects the effects of
NP price premium, NP promotion intensity and especially brand equity (see above).
Uniqueness in assortment
(UNIQ)
Negative Medium The greater the deviation (uniqueness) in terms in package size and/or brands, the lower NP
performance. The effect size is medium. However, UNIQ also systematically affects the impact of NP
promotion intensity and especially NP innovativeness.

45
Driver of NP performance
Direction
of the
overall
effect
Magnitude of
effect on NP
performance
Implications
Covariates
Speed of adoption Null - NP performance at the retailer does not depend on the retailer’s speed of adoption.
Hard discounter Negative Medium NP performance is lower at hard discounters. This suggests that manufacturers’ growing interest to
introduce their brands at hard discounters (Deleersnyder and Koll 2012) should push their mature
products rather than NP offerings in such outlets.
State of the economy Positive Small NP performance is higher when they are introduced by the retailer under favorable economic
conditions. However, the effect is small. This supports recommendations to ramp up NP activity in
economically tough times to fight the growth of PLs (Lamey et al. 2012) as one can expect only a
minor downward effect on NP performance.
Category proliferation Negative Large NPs have greater difficulty in capturing market share in categories with many product types and sub-
brands. This is the single most important generalized driver of NP performance.
Category concentration Negative Medium NPs are less successful in highly concentrated categories.
Category brand loyalty Positive Small The small effect size suggests that NPs can be successful in both categories characterized by high brand
loyalty and categories where shoppers are primarily loyal to their store rather than to any particular
brand.
Difficulty of making the
category
Positive Medium NPs are more successful in categories where consumers think it is difficult to make a good quality
product.
Category purchase frequency Null - NP performance does not depend on how often consumers buy the category.

46
Figure 1: Research Framework
NP performance
Category share of NP
at a particular retailer
Upper-funnel shopper marketing (manufacturer controlled)
Brand equity
Brand advertising
NP innovativeness
Category-specific store context
Category PL share
Uniqueness in category
Lower-funnel shopper marketing (based on retailer-manufacturer
negotiations)
NP price premium
NP promotion intensity
Retailer-wide store context
Retailer-banner brand equity
Covariates
Speed of adoption
Hard discounter
State of the economy
Category proliferation
Category concentration
Category brand loyalty
Difficulty of making the category
Category purchase frequency

47
Figure 2: Moderating Effect of Store Context on the Impact of Upper-Funnel Shopper-Marketing Variables on NP
Performancea
PANEL A: Retail-banner brand equity (RBBE)
A.1 RBBE x Brand equity
A.2 RBBE x Brand advertising
A.3 RBBE x NP innovativeness
0
0.1
0.2
0.3
0.4
0.5
0.6
0.7
0.8
-0.25 -0.20 -0.15 -0.10 -0.05 0.00 0.05 0.10 0.15
NP
Per
form
ance
(%
)
Brand equity
0
0.1
0.2
0.3
0.4
0.5
0.6
0.7
0.8
-16 -14 -12 -10 -8 -6 -4 -2 0 2
NP
Per
form
ance
(%
)
Brand advertising
0
0.1
0.2
0.3
0.4
0.5
0.6
0.7
0.8
-1 0 1
NP
Per
form
ance
(%
)
Incremental vs. breakthrough NP

48
PANEL B: Category PL share (PLS)
B.1 PLS x Brand equity
PANEL C: Uniqueness in assortment (UNIQ)
C.1 UNIQ x NP innovativeness
a The X-axis covers for the respective upper-funnel shopper-marketing variable the full range of the mean-centered ln-transformed variable as used in Equation 1
(going from the minimum value to the maximum value observed in our data). The Y-axis quantifies the NP share at the retailer holding all other continuous
variables at their mean level (or zero for the effect-coded dummy variables). Low (high) values for store context (RBBE, PLS, and UNIQ) are defined as one
standard deviation below (above) the variable’s mean.
0
0.1
0.2
0.3
0.4
0.5
0.6
0.7
0.8
-0.25 -0.20 -0.15 -0.10 -0.05 0.00 0.05 0.10 0.15
NP
Per
form
ance
(%
)
Brand equity
0
0.1
0.2
0.3
0.4
0.5
0.6
0.7
0.8
-1 0 1
NP
Per
form
ance
(%
)
Incremental vs. breakthrough NP

49
Figure 3: Moderating Effect of Store Context on the Impact of Lower-Funnel Shopper-Marketing Variables on NP
Performancea
PANEL A: Retail-banner brand equity (RBBE)
A.1 RBBE x Price premium
A.2 RBBE x Promotion intensity
PANEL B: Category PL share (PLS)
B.1 PLS x Price premium
B.2 PLS x Promotion intensity
0
0.5
1
1.5
2
2.5
3
3.5
4
-2.50 -2.00 -1.50 -1.00 -0.50 0.00 0.50 1.00 1.50 2.00 2.50
NP
Per
form
ance
(%
)
Price Premium
0
0.5
1
1.5
2
2.5
3
3.5
4
-0.15 -0.10 -0.05 0.00 0.05 0.10 0.15 0.20 0.25 0.30 0.35 0.40 0.45
NP
Per
form
ance
(%
)
Promotion intensity
0
0.5
1
1.5
2
2.5
3
3.5
4
-2.50 -2.00 -1.50 -1.00 -0.50 0.00 0.50 1.00 1.50 2.00 2.50
NP
Per
form
ance
(%
)
Price Premium
0
0.5
1
1.5
2
2.5
3
3.5
4
-0.15 -0.10 -0.05 0.00 0.05 0.10 0.15 0.20 0.25 0.30 0.35 0.40 0.45
NP
Per
form
ance
(%
)
Promotion intensity

50
PANEL C: Uniqueness in assortment (UNIQ)
C.1 UNIQ x Promotion intensity
D.2 PLS x Promotion intensity
a The X-axis covers for the respective lower-funnel shopper-marketing variable the full range of the mean-centered ln-transformed variable as used in Equation 1
(going from the minimum value to the maximum value observed in our data). The Y-axis quantifies the NP share at the retailer holding all other continuous
variables at their mean level (or zero for the effect-coded dummy variables). Low (high) values for store context (RBBE, PLS, and UNIQ) are defined as one
standard deviation below (above) the variable’s mean.
0
0.5
1
1.5
2
2.5
3
3.5
4
-0.15 -0.10 -0.05 0.00 0.05 0.10 0.15 0.20 0.25 0.30 0.35 0.40 0.45
NP
Per
form
ance
(%
)
Promotion intensity