Embed Size (px)
Citation preview

New Paradigms in Banking, Financial Markets and Regulation?


NEW PARADIGMS IN BANKING,FINANCIAL MARKETS AND
REGULATION?
Edited by Morten Balling, Frank Lierman, Freddy Van den Spiegel,
Rym Ayadi & David T. Llewellyn
Chapters by:Martin Merlin
Donato MasciandaroMarc Quintyn & Rosaria Vega-Pansini
Adam SzyszkaRym Ayadi
Frank de JongheHans Groeneveld
Malgorzata PawlowskaEmil l zak
Suzanna Walter & Matthias SchallerPeter Reedtz
Lars Machenil & Lieve Mostrey
SUERF – The European Money and Finance ForumVienna 2012
SUERF Study 2012/2

CIP
New Paradigms in Banking, Financial Markets and Regulation?
Editors: Morten Balling, Frank Lierman, Freddy Van den Spiegel, Rym Ayadi and David T. LlewellynAuthors: Martin Merlin, Donato Masciandaro, Marc Quintyn & Rosaria Vega-Pansini, Adam Szyszka, Rym Ayadi, Frank de Jonghe, Hans Groeneveld, Malgorzata Pawlowska, Emil l zak, Susanna Walter & Matthias Schaller, Peter Reedtz, Lars Machenil & Lieve Mostrey
Keywords: Basel III, financial supervision, macroprudential supervision, regulatory framework, transformation of financial markets, neoclassical economics, behavioural finance, financial crisis, cooperative banks, banking, corporate governance, performance, stability, diversity, deposit insurance, risk-based premium, covered deposits, expected loss, option pricing, competition, concentration, market structure
JEL Codes: F36, G1, G2, G18, G21, G22, G28, G30, G32, G33, G34, L1, L25, P13
Vienna: SUERF (SUERF Studies: 2012/2) – April 2012
ISBN: 978-3-902109-62-0
© 2012 SUERF, Vienna
Copyright reserved. Subject to the exception provided for by law, no part of this publica-tion may be reproduced and/or published in print, by photocopying, on microfilm or inany other way without the written consent of the copyright holder(s); the same applies towhole or partial adaptations. The publisher retains the sole right to collect from thirdparties fees payable in respect of copying and/or take legal or other action for this purpose.

1
l a r c i e r
TABLE OF CONTENTS
List of Authors. . . . . . . . . . . . . . . . . . . . . . . . . . . . . . . . . . . . . . . . . . . . . 5
1. Introduction . . . . . . . . . . . . . . . . . . . . . . . . . . . . . . . . . . . . . . . . . . 7Morten Balling, Frank Lierman, Freddy Van den Spiegel, Rym Ayadi & David T. Llewellyn
2. Financial Supervision in Europe after the Crisis. . . . . . . . . . . . . . . . 13Martin Merlin
3. The Economic Crisis: A Story of Supervisory Failure and Ideas for the Way Forward . . . . . . . . . . . . . . . . . . . . . . . . . . . . . . . . . . . . . . . . . 19Donato Masciandaro, Rosaria Vega-Pansini and Marc Quintyn
3.1. Introduction . . . . . . . . . . . . . . . . . . . . . . . . . . . . . . . . . . . . . 193.2. Background . . . . . . . . . . . . . . . . . . . . . . . . . . . . . . . . . . . . . . 203.3. Supervision and the 2008-09 Crisis . . . . . . . . . . . . . . . . . . . . 233.4. Financial Supervision: What is next? . . . . . . . . . . . . . . . . . . . 313.5. Conclusion . . . . . . . . . . . . . . . . . . . . . . . . . . . . . . . . . . . . . . 35References . . . . . . . . . . . . . . . . . . . . . . . . . . . . . . . . . . . . . . . . . . . . 36
4. Systemic Changes in the Financial World and the Search for the New Paradigm of Finance . . . . . . . . . . . . . . . . . . . . . . . . . . . . . . . . . . . . 41Adam Szyszka
4.1. Introduction . . . . . . . . . . . . . . . . . . . . . . . . . . . . . . . . . . . . . 414.2. Systemic Changes in the Financial World . . . . . . . . . . . . . . . 424.3. In the Search for the New Paradigm of Finance. . . . . . . . . . . 444.4. Practical Implications . . . . . . . . . . . . . . . . . . . . . . . . . . . . . . 494.5. Behavioral Aspects of the Recent Financial Crisis . . . . . . . . . 524.6. Conclusions and Final Remarks . . . . . . . . . . . . . . . . . . . . . . 60References . . . . . . . . . . . . . . . . . . . . . . . . . . . . . . . . . . . . . . . . . . . . 61
5. On Basel Regulation and Banks’ Incentives . . . . . . . . . . . . . . . . . . . 65Rym Ayadi
5.1. Introduction . . . . . . . . . . . . . . . . . . . . . . . . . . . . . . . . . . . . . 655.2. The Evolving Role of the Basel Committee on Banking
Supervision (BCBS) . . . . . . . . . . . . . . . . . . . . . . . . . . . . . . . . 675.3. Basel Capital Requirements as Essential but not Sufficient
Regulatory Tool . . . . . . . . . . . . . . . . . . . . . . . . . . . . . . . . . . 705.4. From Basel I to Basel III: What has Changed? . . . . . . . . . . . . 75

2 NEW PARADIGMS IN BANKING, FINANCIAL MARKETS AND REGULATION?
l a r c i e r
5.5. What are the Unresolved Flaws of Basel Regulations. . . . . . . 825.6. Basel Regulation, Incentives and Role of Pillars 2 and 3 . . . . 83References . . . . . . . . . . . . . . . . . . . . . . . . . . . . . . . . . . . . . . . . . . . . 85
6. Perfect Models, Fallible Humans? . . . . . . . . . . . . . . . . . . . . . . . . . . 91Frank De Jonghe
6.1. Perfecting Models through Model Validation . . . . . . . . . . . . 926.2. Human Beings are Inherently Fallible... . . . . . . . . . . . . . . . . . 986.3. But do not Discard the Value of Risk Modeling Altogether. . 99References . . . . . . . . . . . . . . . . . . . . . . . . . . . . . . . . . . . . . . . . . . . . 100
7. The Cooperative Banking Model: Performance and Opportunities. . . 101Hans Groeneveld
7.1. Introduction . . . . . . . . . . . . . . . . . . . . . . . . . . . . . . . . . . . . . 1017.2. Changing or Changed Characteristics of the Global Financial
System? . . . . . . . . . . . . . . . . . . . . . . . . . . . . . . . . . . . . . . . . . 1037.3. Differentiators of ECBGs. . . . . . . . . . . . . . . . . . . . . . . . . . . . 1067.4. The Value of ECBGs in National Financial Systems . . . . . . . 1207.5. Opportunities and Challenges of Financial Cooperatives in the
Future Financial System. . . . . . . . . . . . . . . . . . . . . . . . . . . . . 124References . . . . . . . . . . . . . . . . . . . . . . . . . . . . . . . . . . . . . . . . . . . . 126
8. Competition on the Polish Banking Market (before the financial crisis and during the crisis) – Empirical Results . . . . . . . . . . . . . . . . . . . . 131Malgorzata Pawlowska
Introduction . . . . . . . . . . . . . . . . . . . . . . . . . . . . . . . . . . . . . . . . . . 1318.1. Methods of Competition Measurement . . . . . . . . . . . . . . . . . 1338.2. Results of the Measurement of Competition in European
Banking Sectors – Overview of Literature . . . . . . . . . . . . . . . 1368.3. Structural and Technological Changes in the Polish Banking
Sector between 1997 and 2009 . . . . . . . . . . . . . . . . . . . . . . . 1398.4. Analysis of the Level of Competition of the Polish Banking
Sector between 1997 and 2009 – Empirical Results with Use of Three Different Models . . . . . . . . . . . . . . . . . . . . . . . . . . . . . 145
Conclusions . . . . . . . . . . . . . . . . . . . . . . . . . . . . . . . . . . . . . . . . . . . 153References . . . . . . . . . . . . . . . . . . . . . . . . . . . . . . . . . . . . . . . . . . . . 154
9. The Revisited Concept of Bank Liquidity in the Theory of Bank Intermediation . . . . . . . . . . . . . . . . . . . . . . . . . . . . . . . . . . . . . . . . . 159Emil l zak
9.1. Introduction . . . . . . . . . . . . . . . . . . . . . . . . . . . . . . . . . . . . . 159

TABLE OF CONTENTS 3
l a r c i e r
9.2. Neoclassical Concept of Bank Liquidity . . . . . . . . . . . . . . . . 1629.3. Towards a New Paradigm of Bank Liquidity. . . . . . . . . . . . . 1689.4. Concluding Remarks . . . . . . . . . . . . . . . . . . . . . . . . . . . . . . . 175References . . . . . . . . . . . . . . . . . . . . . . . . . . . . . . . . . . . . . . . . . . . . 175
10. An Alternative Way of Calculating Risk-based Deposit Insurance Premiums. . . . . . . . . . . . . . . . . . . . . . . . . . . . . . . . . . . . . . . . . . . . . 179Susanna Walter and Matthias Schaller
10.1. Introduction . . . . . . . . . . . . . . . . . . . . . . . . . . . . . . . . . . . . . 17910.2. Literature Review . . . . . . . . . . . . . . . . . . . . . . . . . . . . . . . . . 18010.3. Methodology. . . . . . . . . . . . . . . . . . . . . . . . . . . . . . . . . . . . . 18210.4. Data Sample . . . . . . . . . . . . . . . . . . . . . . . . . . . . . . . . . . . . . 18610.5. Empirical Validation . . . . . . . . . . . . . . . . . . . . . . . . . . . . . . . 19310.6. Discussion . . . . . . . . . . . . . . . . . . . . . . . . . . . . . . . . . . . . . . . 197References . . . . . . . . . . . . . . . . . . . . . . . . . . . . . . . . . . . . . . . . . . . . 198Abbreviations . . . . . . . . . . . . . . . . . . . . . . . . . . . . . . . . . . . . . . . . . 201
11. Conflicts of Interest in Investment Advice to Private Customers – A Call for Greater Transparency and Better Alignment of Interests . . . . . . . . 203Peter Reedtz
11.1. Bad Advice . . . . . . . . . . . . . . . . . . . . . . . . . . . . . . . . . . . . . . 20311.2. What is Impartiality?. . . . . . . . . . . . . . . . . . . . . . . . . . . . . . . 20511.3. How Should an Investment Adviser be Remunerated?. . . . . . 20711.4. Suggested Improvements . . . . . . . . . . . . . . . . . . . . . . . . . . . . 20911.5. The MiFID Review and the UK Retail Distribution Review . 21411.6. Conclusion . . . . . . . . . . . . . . . . . . . . . . . . . . . . . . . . . . . . . . 215References . . . . . . . . . . . . . . . . . . . . . . . . . . . . . . . . . . . . . . . . . . . . 215
12. Views on Bank Strategy and Capital Market Infrastructure. . . . . . . 217Lars Machenil and Lieve Mostrey
12.1. The BNP Paribas Fortis View by Lars Machenil . . . . . . . . . . 21712.2. Euroclear’s View by Lieve Mostrey . . . . . . . . . . . . . . . . . . . . 220
SUERF – Société Universitaire Européenne de Recherches Financières . . . . 225
SUERF Studies. . . . . . . . . . . . . . . . . . . . . . . . . . . . . . . . . . . . . . . . . . . . . 225


5
l a r c i e r
LIST OF AUTHORS
Rym AYADI
Senior Research Fellow and Head of Research of the Financial Institutions, Prudential Policy and Tax Unit at the Centre for European Policy Studies, Brussels
Hans GROENEVELD
Senior Vice President Cooperative Affairs and Governance at Rabobank Nederland, Utrecht
Frank DE JONGHE
Professor, University of Ghent
Lars MACHENIL
Chief Financial Officer, BNP Paribas Fortis, Brussels
Donato MASCIANDARO
Professor of Economics and Director, Paolo Baffi Centre on Central Banking and Financial Regulation, Universita Bocconi, Milan
Martin MERLIN
Head of Unit O2 responsible for financial services policy and relations with the Council, DG Internal Market, European Commission, Brussels
Lieve MOSTREY
Executive Director and Chief Technology and Services Officer of the Euroclear Group, Brussels
Malgorzata PAWLOWSKA
Economic Advisor, Economic Institute, National Bank of Poland
Marc QUINTYN
Division Chief at the IMF Institute, International Monetary Fund, Washington DC
Peter REEDTZ
Founding Partner of Asset Allocation Institute, Copenhagen
Matthias SCHALLER
Ph.D. candidate in Finance at the University of St. Gallen, Switzerland
Emil L ZAK
Assistant Professor, Banking Department, Warsaw School of Economics

6 NEW PARADIGMS IN BANKING, FINANCIAL MARKETS AND REGULATION?
l a r c i e r
Adam SZYSZKA
Professor of Finance and Economics at the Pozna University of Economics, Poland
Rosaria VEGA-PANSINI
Research Assistant, Department of Economics, Paolo Baffi Research Centre on Central Banking and Financial Regulation, Università Bocconi, Milan
Susanna WALTER
Financial Risk Manager and Lecturer at the Swiss Institute of Banking and Finance at University of St. Gallen, Switzerland

7
l a r c i e r
1. INTRODUCTION
Morten Balling, Frank Lierman, Freddy Van den Spiegel, Rym Ayadi & David T. Llewellyn
On May 11-12, 2011, SUERF, the Belgian Financial Forum, the Brussels FinanceInstitute and the Centre for European Policy Studies (CEPS) jointly organised the29th SUERF Colloquium New paradigms in money and finance? The papersincluded in this SUERF Study are based on contributions to the Colloquium. The2008-11 financial crisis has demonstrated unsatisfactory performance in finan-cial institutions and in financial regulation and supervision all over the world.The contributors to the present volume look with critical eyes on financial theo-ries, supervisory structures, (mis)pricing of risk and distorted incentives, riskmanagement models and procedures, conflicts of interest and bank strategies.Their perspectives are quite different, but they share the ambition of findingimproved analytical, organizational or managerial approaches so that decision-makers have a better chance of showing good performance in the future. Inessence, they are looking for new paradigms in banking, financial markets andregulation.
In Chapter 2, “Financial supervision in Europe after the crisis”, Martin Merlin,Head of the Financial Services Policy Unit, European Commission, gives an over-view of the development of financial supervision in Europe. We have seen a movefrom a situation where national supervisors focussed essentially on nationalissues, while financial markets were becoming increasingly integrated. It becameevident that you cannot have integration and stability at a regional level ifnational supervisors remain fully in charge, and if their only mandate is to caterfor the protection of national consumers and for financial stability at the nationallevel. There was no adequate macro prudential supervision, no macro prudentialsupervision in Europe, none in the US and none internationally. Early warningmechanisms were ineffective. It is against this background that it was decided tocreate four new bodies in Europe: the European Systemic Risk Board based inFrankfurt, and three European Supervisory authorities for Banking, Securitiesand Markets and Occupational Insurance and Pensions – based in London, Parisand Frankfurt respectively. The new supervisory authorities and new crisis man-agement and resolution packages must of course be seen in a broader global con-text. The Basel 3 Accord points to more transparency and more responsibility.The European tax payers cannot afford another round of bank failures and weowe it to them to prevent that from happening again. This is best achieved byintroducing more European coordination and cooperation, not less.

8 NEW PARADIGMS IN BANKING, FINANCIAL MARKETS AND REGULATION?
l a r c i e r
Chapter 3, “The economic crisis: a story of supervisory failure and ideas for theway forward” by Donato Masciandaro, Bocconi University, Marc Quintyn, IMFInstitute, and Rosaria Vega-Pansini, Bocconi University, contains a detaileddescription of the failures in many supervisory systems in the run-up to the recentfinancial crisis. The authors give a systematic analysis of the impact of two keyfeatures of the supervisory architecture – consolidation and quality of governance– and come to the conclusion that both were negatively correlated with economicresilience. Also central bank involvement in supervision did not seem to matter.After pointing out the limitations of the governance arrangements and using anew distinction between macro and micro prudential surveillance, the authorssuggest that supervision be assigned to two separate institutions (macro vs.micro) rather than a single integrated agency so that checks and balances, as acomplement to governance, rather than consolidation, can assist in reducing thepossibility of failure.
In Chapter 4, “Systemic changes in the financial world and the search for the newparadigm of finance”, Adam Szyszka, Poznan University of Economics, confrontstraditional neoclassical financial economics with behavioural finance focusing onthe key assumptions, predictions, and findings of each of these schools ofthought. After several turbulent years in global financial markets, it has beenasked if the traditional paradigms of economics – and within it, the neoclassicaltheory of finance – adequately describe economic reality and events occurring inthe financial world. In contrast to traditional theory, behavioural finance assumesthat agents may be irrational in their reactions to new information and invest-ment decisions. People make mistakes, they may have unstable preferences andthey may have changing emotions and moods. Noise traders risk may disturbarbitrage. Financial markets are not always efficient. Market regulators must takeinto account the possibility of irrational behaviour. Investors may suffer fromoverconfidence and unrealistic optimism. According to the author, there is a needfor an interdisciplinary approach where the neoclassical paradigm might be seenas an idealised normative benchmark, while behavioural finance may help toexplain deviations from this benchmark, showing how psychological biases maycause irrational behaviour of investors.
In Chapter 5, “Basel regulation and banks’ incentives”, Rym Ayadi, Centre forEuropean Policy Studies (CEPS), provides a critical assessment of the evolution ofthe Basel Committee’s role and of the rules it has produced over the years. TheBasel I, Basel II and Basel III accords have impacted banks’ incentives all over theworld in recent decades. In her conclusion, she offers some proposals forimprovements.

INTRODUCTION 9
l a r c i e r
In Chapter 6, “Perfect models, fallible humans?”, Frank de Jonghe, Ghent Uni-versity, describes the development, problems and use of internal mathematicalmodels designed to support risk management in financial institutions. Data thatfeed such models should ideally be current, accurate and complete. In practice,data may be missing in the source systems or may be erroneous. Data cleaning bymeans of correction rules may, however, introduce bias in the results of the model.Model development is subject to key-person risk in the sense that only a fewmodel developers completely understand the assumptions and the technical plat-form. Managers may use the model for an unintended purpose due to insufficientunderstanding of the strengths and weaknesses of the model. So-called user testsshould be crucial ingredients for having the internal models accepted for calculat-ing and reporting regulatory capital requirements. People involved in the assess-ment of model risk and model validation may suffer from cognitive biases indifferent forms. Confirmation bias is the tendency to look for information thatconfirms your preconceptions. Mental anchoring means that there is a tendencyto take arbitrary reference points or values in decisions involving numbers, evenwhen they may not be relevant for the actual decision. Clustering illusion is thehuman tendency to detect patterns in a priori purely randomly generated series ofdata. The role of models depends on the mathematical literacy of the decisionmakers in a financial institution. In insurance companies, mathematically trainedactuaries often reach the highest levels in the organisation and this may lead to amore supportive attitude towards the role of models in decision making. In hisconclusion, the author warns the reader that the described problems in modellingpractice should not be understood as a justification to ignore mathematical mod-els entirely. The process of model construction enforces a minimum degree oflogical consistency in thinking about risk.
In Chapter 7, “The cooperative banking model: performance and opportunities”Hans Groeneveld, Rabobank Nederland, documents that European cooperativebanking groups have escaped relatively unscathed from the financial crisis andthat they did not need large-scale government support. The author looks for pos-sible explanations of their relatively good performance and achievements. One ofthe explanations seems to be their corporate governance structure. They areowned by members, who have beneficial influence on managers. Partly due to thisinfluence, the banks have consistently focussed on providing traditional bankservices at competitive prices and efforts to improve the efficiency of operationshave been stressed. The cooperative banks aim to be well-capitalised and to havemoderate risk profiles.
In Chapter 8, “Competition on the Polish banking market (before the financialcrisis and during the crisis) – empirical results”, Malgorzata Pawlowska,National Bank of Poland, estimates the level of competition in the Polish banking

10 NEW PARADIGMS IN BANKING, FINANCIAL MARKETS AND REGULATION?
l a r c i e r
sector in 1997-2009 with the use of quantitative methods based on the theory ofcompetition measurement in the banking sector. She applies three models: thePanzar and Rosse model, the Lerner Index model and Boone’s model. In most ofthe period, commercial banks in Poland operated in an environment of monopo-listic competition. All models demonstrate a strong increase in competitionbetween 1999-2004 caused by Poland’s accession to the EU and a slight decreasein competition in 2008-09 caused by the financial crisis.
In Chapter 9, “The revisited concept of bank liquidity in the theory of bank inter-mediation”, Emil Slazak, Warsaw School of Economics, studies the variousaspects of the concept of liquidity in banking under asymmetric information. Theauthor explains why banks are becoming more prone to highly volatile idiosyn-cratic liquidity shocks. Traditionally, funding liquidity refers to the liability sideof the bank’s balance sheet. Banks are assumed to fund themselves by takingdeposits from interbank operations and central bank operations. The recent crisismeant that interbank markets broke down and materialised funding risks. A con-tamination process caused illiquidity of many banks and created need for bail-outs. Central banks intervened on a large scale. There is a need to rethink bankintermediation theory.
In Chapter 10, “An alternative way of calculating pragmatic risk-based premi-ums”, Susanna Walter and Matthias Schaller, Swiss Institute of Banking andFinance, University of St. Gallen analyse deposit insurance schemes. During thecrisis, deposit insurance schemes managed to prevent bank-runs apart fromminor exceptions. Such schemes do, however, involve moral hazard. Risk-adjusted premiums can partially mitigate the incentives for banks to increase lev-erage and the disincentives for bank customers to monitor their banks. The twoauthors introduce a Merton-based calculation of deposit insurance premiums.They measure bank risk based on the Basel 2 and Basel 3 frameworks using cap-italization and liquidity as major approximations for bank stability. They arguethat their empirical evidence provides support for the view that Basel 3 capitalrequirements are too low.
In Chapter 11, “Conflicts of interest in investment advice to private customers –A call for greater transparency and better alignment of interests”, Peter Reedtz,Asset Allocation Institutet, looks at the concept of impartiality and ways ofavoiding the classic conflicts of interest between the adviser and the client. Aselements in the provision of poor investment advice, the author distinguishesbetween professional incompetence, inadequate risk assessment, lack of imparti-ality and dishonesty. The chapter focuses on the lack of impartiality in the provi-sion of investment advice to private clients. Impartial advice means that theadviser takes only the client’s interests into account and is not influenced by fac-

INTRODUCTION 11
l a r c i e r
tors such as his or her own earnings or a desire to sell a certain product. In prac-tice, few private client advisers meet the requirements for pure, impartial advice.Performance-related forms of payment are often problematic and far from con-sistent with the principle of pure impartiality. Possible solutions for improving thesituation are: general education and informing of clients, improved informationon products and services, certification of advisers, product restrictions, manda-tory ethical standards and new forms of remuneration. According to the author,the solution lies in a combination of several initiatives. He concludes that it isrealistic to achieve a considerably higher degree of impartiality and quality in theprovision of investment advice to private clients.
Chapter 12, “Views on bank strategy and capital market infrastructure” containscontributions by Lars Machenil, BNP Paribas Fortis and Lieve Mostrey, Euro-clear. Lars Machenil describes how BNP Paribas Fortis in Belgium and Luxem-bourg organised an exit from non-core business and geographical areas. Thebank decided to divest many activities which were no longer considered to be corebusiness. The strategic decision to exit from non core business and some geo-graphic areas within eighteen months was linked to a refocus on the core mission:being a universal bank in Belgium and Luxembourg with reinforced commercialbanking networks. Valuation and cut-off dates had to be handled carefully. LieveMostrey describes in a diagram the roles of different layers of market infrastruc-ture in the international capital market value chain. The first layer is trading,where orders are negotiated and agreed. The second layer is composed of clearingactivities, where a central counterparty stands between the different trading coun-terparties. The third layer is settlement, where the securities and cash are actuallyexchanged by firms such as Euroclear. Risk management is critical. Consequently,Euroclear has to operate in a very safe way. Almost all clients have to provide fullcollateralisation. The risk mitigation process and asset protection approach haveworked very well. Euroclear is therefore considered to be a safe haven. The mar-ket infrastructure has proved its robustness in turbulent times.


13
l a r c i e r
2. FINANCIAL SUPERVISION IN EUROPE AFTER THE CRISIS
Martin Merlin
If there is one area where after the crisis in Europe we definitely need a paradigmshift, it is in the area of financial supervision. What was the paradigm prevailingbefore the crisis? We had fully independent national supervisors focusing essen-tially on national issues, national concerns, with some loose coordination of theiractivities at European level. We already had fairly integrated markets, especiallywholesale markets, but we were trying even further to integrate these markets andof course we wanted to maintain stable financial markets. This was the paradigmand we realise now that this was not tenable. This paradigm has been portrayedby some as being the fundamental trilemma of financial supervision, and we cameto the conclusion that we had to leave aside one of the three elements. Integratedand stable financial markets can go hand in hand, and even though it is quite achallenging task to make sure that this is the case, it is nevertheless possible, andyou do not need a trail between integration and stability as long as you haveadequate cross border financial stability arrangements in place. That is what weare now trying to build in Europe. You cannot have integration and stability at aregional level if national supervisors remain fully in charge and if their only man-date is to cater for the protection of national consumers and for financial stabilityat national level. We now all agree that there is no such thing as national financialstability anymore. Financial stability has to be international or it has to be at leastregional.
The UK’s Financial Services Authority in its post-crisis Turner Review1 has under-lined very well the need for a paradigm shift and states the need for more Euro-pean coordination or more national powers, more or less Europe, but in anyinstance not allowing the system to stay as it was. So it should not be a surprisethat the Commission has opted for more Europe – and luckily the EU Council ofMinister and the European Parliament have followed us in this direction. If welook at financial supervision, what are the lessons from the crisis and what wentwrong? Firstly there was no adequate macro-prudential supervision, no macroprudential supervision in Europe, none in the US and none internationally.Nobody was examining the interaction between macroeconomic developments,monetary developments in particular, and developments within financial institu-tions from a prudential standpoint. Early warning mechanisms were ineffective.If you look at some IMF reports produced between 2004 and 2007, or at thework of some academics, you do see that in some cases people were pointing to
1 Financial Services Authority, 2009, “The Turner Review: A regulatory response to the global banking crisis”.

14 NEW PARADIGMS IN BANKING, FINANCIAL MARKETS AND REGULATION?
l a r c i e r
the risks that were building up in the system. People were talking about the risksinherent in the securitisation process, and people were worried about the transferof risks from one financial sector to another. However, there was no mechanismin place to make sure that these early warnings were translated into recommen-dations to address the risks that had been anticipated. Consequently these earlywarnings remained unheard. We failed in Europe to challenge supervisory prac-tices on a cross-border basis, so national supervisors were sat in a cosy cornerdoing whatever they felt was appropriate for their national financial systems. Insome Member States we have witnessed that there have been major failings in thesupervision of national financial institutions and cross-border financial institu-tions. We had a lack of frankness and cooperation between supervisors, difficul-ties in exchanging information between supervisors, even in normal circum-stances, let alone in prevailing crisis situations. We had almost no resourcesdevoted to European coordination of financial supervision, and while we hadthree advisory committees to the Commission, they were not properly staffed:finally, and this is probably the most important point, we had no means for finan-cial supervisors to take common decisions, European decisions regarding Euro-pean problems. Wholesale markets, especially as some of their segments arehighly integrated, e.g. the banking and insurance markets which are both domi-nated by a few pan-European groups that hold something like 70% of bankingand insurance assets. In spite of this high level of integration it was impossible totake a European legally-binding decision pertaining to wholesale markets or tocross-border banks and cross-border insurance companies. I think it would beexaggerated to say that this mismatch between integrated markets and nationalsupervision has been a major cause of the crisis; but while it certainly did not helpbefore the crisis and during the crisis, however, we would definitely want to avoidthat this mismatch becomes a source of a crisis in the future. And that is whypolicy makers in Europe have decided to try and put some order into the Euro-pean house for financial supervision.
What have we agreed upon? We have agreed on the creation of four new bodiesin Europe: the European Systemic Risk Board based in Frankfurt; and three Euro-pean supervisory authorities for Banking, Securities and Markets and Occupa-tional Insurance and Pensions – based in London, Paris and Frankfurt respec-tively. I would like to say a few words about the European Supervisory Authori-ties (ESAs). It is very important to bear in mind that their role is not to replacenational supervisors. National supervisors remain competent for the supervisionof the financial institutions established in their territories, but these nationalsupervisors will now have to work in tandem with the new European supervisoryauthorities to safeguard financial soundness at the level of individual financialfirms. We are trying to build a European network with the ESAs at the centre ofthe network and with strong coordination at European level, so that we have

FINANCIAL SUPERVISION IN EUROPE AFTER THE CRISIS 15
l a r c i e r
harmonised rules as well as coherent supervisory practices and enforcement in asingle market.
The new European supervisory authorities will have the power to draw up tech-nical rules that then will be transformed into law and addressed either to nationalsupervisors or to financial institutions. They will be able to take action in crisissituations, with coordinated action between national supervisors, somethingwhich has been clearly been missing during the crisis – in particular, rememberingthe Deposit Guarantee Schemes (DGS) or short selling episodes. The Europeansupervisory authorities will be able to mediate and settle disputes in a legally-binding way between national supervisors when such disputes arise, and they do.The new authorities will also be there to assist the Commission in ensuring thecorrect and consistent application of European law and, in particular, of Euro-pean prudential legislation; and, they will have the capacity to address legally-binding decisions to national supervisors. If national supervisors do not complywith these decisions they will have, on the basis of European regulations, thepower to address legally-binging decisions directly to financial institutions, whichis quite a breakthrough for Europe. In addition, since 1st January 2011, we haveestablished a European Systemic Risk Board in order to monitor and assesspotential threats to financial stability that arise from macroeconomic develop-ments and from within the financial system as a whole, that is macro prudentialsupervisory issues. The ESRB will provide an early warning of system-wide risksthat may be building up and, where necessary, issue recommendations for actionsto deal with these risks. The new European supervisory authorities and the ESRBare now up and running, so we hope that they will reach their cruising speed veryquickly.
They have the potential, we believe, to make a real difference through their con-tribution to a safer, sounder, and more financially-responsible system, but theywill have a challenging task. The main challenge that we see is that these areEuropean bodies with a legal personality created by Council and Parliament, butthey are composed of national supervisors and national central banks (NCBs). Sothe question is, will national supervisors, for example, be able to take off theirnational ‘hat’ when they enter the European authorities in order to take decisionsthat are adequate for the European interest? We will have to see. That will largelydepend on the Chairs of the new authorities and on their staff, as well as on theEuropean spirit of their members. Will this new system be enough and is it goingto work? Frankly, we do not know, although we are very confident that it willmake a major difference in comparison to the pre-crisis situation. The ball isfirmly in the court of the supervisors and the governors of the 27 central banksof the EU member states and of the ECB, and we will take stock after three yearsof operation with a review planned for 2014 of how the system works. We haveno pre-conceived ideas in relation to this review, and the Commission really

16 NEW PARADIGMS IN BANKING, FINANCIAL MARKETS AND REGULATION?
l a r c i e r
wants the new system to succeed; but, if it happens not to work and if it doesn’tdeliver European solutions to European problems, then we will need to be able todraw the lessons from that.
Until now, I have mainly spoken about crisis prevention and I think we areputting a more robust system in place in Europe to prevent crises in the future;but of course, crises can still occur, and they will occur, and therefore we also needa better system to manage and resolve crises. We need a system to deal with bankfailures in particular, in an orderly fashion. And here I would like to quoteanother distinguished British regulator, the Deputy Governor of the Bank of Eng-land, Paul Tucker, who remarked in an interview in January 2011, “If we have asystem where banks take the upside but the taxpayer takes the downside some-thing has gone wrong with capitalism, with the very heart of capitalism, and weneed to repair this. Capitalism can’t work unless these financial firms at the centreof the heart of capitalism can be subject to orderly failure. The rules of capitalismneed to apply to them just as they do to non-financial companies.” And indeed,currently in Europe, and here we are lagging far behind in comparison to the US,if a bank fails unexpectedly, it can hold a government to ransom over a weekendand insist on a bail-out to prevent market chaos and panic on Monday morning.We have seen that happening on many occasions.
So the key to preventing this is, of course, close monitoring, active and intrusivesupervision, appropriate rules, and also early intervention powers for supervi-sors. Banks must prepare themselves for the event of a failure and supervisorsmust be prepared for them to fail. We need recovery and resolution plans and weare also looking at the issue of bail-in, despite many technical and legal issuesinvolved there. We will table a quite ambitious legislative proposal on crisis man-agement and crisis resolution whereby we want to give supervisors adequate toolsand powers to intervene along a continuum that ranges from early interventionwhen a bank first encounters difficulties and that goes into more intrusive super-vision when these difficulties are of greater concern; and, that ends up with thecapacity effectively and efficiently to resolve a bank that is no longer viable. Wewant all competent authorities in Europe to have adequate and consistent toolsand powers to manage crises effectively, and we also want them to cooperatebetter. That is why we will propose to have cross-border resolution colleges forall major cross-border banks and investment firms in Europe.
Let me now conclude. The new supervisory architecture and new crisis manage-ment and resolution package must of course be seen in a broader context. Firstlyin the G20 context: what we do is very much in line with what the G20 hasdecided. There needs to be international consistency and that has to be seen in thebroader context of the various new rules that are being put in place in Europe inorder to have a more solid financial system. These rules that aim at having finan-

FINANCIAL SUPERVISION IN EUROPE AFTER THE CRISIS 17
l a r c i e r
cial institutions that are prudentially more solid, hence the movement in Europetowards the Basel III Accord, and the Solvency2 framework for insurance com-panies. We want also more transparency in the market, hence our rules on creditderivatives markets and in particular over the counter (OTC) derivatives markets,where supervisors need to know what is happening in these markets to be able torespond to the accumulation of risks. We also need more transparency in the wayin which hedge funds operate, so that macro prudential oversight can be effectiveand so that risks of excessive leverage, in particular creating systemic risks, canbe detected by supervisors. We also want more responsibility in the financial sec-tor, hence our rules on remuneration practices, so that we have a better balancebetween the short-term risk-taking and the long term performance of companies.We also want more responsibility on the side of boards of financial institutions.They have to take a more active regarding the oversight of the management of thefirms and we will propose legislation on that very soon.
The bottom line is that the European tax payer cannot afford another round ofbank failures and we owe it to them to prevent that from happening again, andshould ensure a stable financial system while retaining the benefits of the singlemarket. Clearly this is best achieved by introducing more European coordinationand cooperation, not less.


19
l a r c i e r
3. THE ECONOMIC CRISIS: A STORY OF SUPERVISORY
FAILURE AND IDEAS FOR THE WAY FORWARD
Donato Masciandaro, Rosaria Vega-Pansini and Marc Quintyn
3.1. Introduction
In the aftermath of the Asian financial crisis, international financial institutions(IFI), national stakeholders and academia took several initiatives to improve thequality of the regulatory and supervisory framework for finance. It was hopedthat a combination of stronger regulatory frameworks and better quality super-vision would help to avoid, or at least mitigate the effects of, a possible next crisis.Emerging initiatives, such as the Basel Core Principles for Effective Bank Super-vision (BCP), were expedited and new initiatives, such as the IMF-World BankFinancial Sector Assessment Programs or FSAPs, were introduced. In the sameperiod work on the Basel II regulatory framework saw the light of day. Theseinternational efforts were complemented by revisions, by several national author-ities, of their supervisory architecture in order to enhance the effectiveness ofsupervision. This wave of revisions was inspired by the unification of all financialsupervisors in the Financial Services Authority (FSA) in the UK in 1997. Crisismitigation brought additional arguments to the table for revising the nationalsupervisory architecture. Finally, work was also undertaken to strengthen govern-ance of supervisory agencies.
Several studies in the pre-2007-crisis years showed some, albeit not conclusive,evidence that the above changes were generating a positive impact on financialsector stability and soundness. So, hope was growing that the improvements insupervisory quality (reflected by a more effective supervisory architecture andgood supervisory governance) would foster financial stability.
The financial and economic crisis that started in 2008 was a rude awakening.Supervisory failure was mentioned by several scholars and policymakers as oneof the main contributing factors, besides macroeconomic factors, regulatory fail-ures, failures in other parts of the governance of the financial system (such asrating agencies, accounting practices, transparency). However, no systematicanalysis of the linkages between the two above mentioned features of supervisionand the depth of the crisis has been undertaken1.
1 This paper focuses exclusively on supervision. Supervision concerns the implementation, monitoring andenforcement of the regulatory framework.
20 NEW PARADIGMS IN BANKING, FINANCIAL MARKETS AND REGULATION?
l a r c i e r
So the objective of this paper is twofold. First we will empirically test the impactof supervisory architecture and governance (SAG) on the resilience of the econ-omy to the crisis. Our main finding is that the quality of supervision (degree ofunification and supervisory governance) was negatively associated with economicresilience and that the degree of involvement of the central bank in supervisiondid not have any significant impact on resilience. Second, arriving at the conclu-sion that supervisory quality is negatively associated with economic resilience, wewill review the proposals that so far have been offered for improving the qualityof supervision. While certainly valuable, a common weakness of most of them isthat they do not really tackle the underlying problem of incentives-misalignmentof supervisors. We therefore add our own proposal to the discussion. We arguethat conducting supervision through two separate agencies could be a way ofintroducing checks and balances in the supervisory process which could poten-tially address the incentives problems in supervision.
The paper is structured as follows. Section II sets out the background. Section IIIsummarizes the empirical evidence on the impact of SAG on financial and eco-nomic resilience. Section IV presents a proposal as to how, under the emergingcircumstances, architecture can be combined with supervisory governance to bet-ter align supervisory incentives. Section V concludes.
3.2. Background
Since the mid-1990s, international financial institutions (BIS, IMF, World Bank),academics and national authorities have started to pay attention to the quality ofsupervision, as a complement to the long-standing interest in financial regulation.For the purpose of this paper we define supervisory quality as being composed oftwo building blocks: supervisory architecture and supervisory governance. Atleast four broad initiatives were taken to improve the quality of supervision.
• As a first initiative, the Basel Core Principles for Effective Banking Supervi-sion (BCP) were issued in 1996 (Basel Committee, 1996), more or less at theeve of the Asian financial crisis. The objective of the BCPs was to promotebest practices in the content of the regulatory framework, as well as in banksupervision. Efforts to apply these principles intensified greatly in responseto the Asian crisis. This crisis had indeed brought to the surface a numberof major flaws in the supervisory process (see Lindgren et al., 1999), in addi-tion to regulatory flaws. Thus, the BCPs (in addition to several other stand-ards and codes) were used for peer reviews as part of the Financial SectorAssessment Program (FSAP) jointly conducted by IMF and World Bank.The principles themselves were subject to a major revision in 2006.

THE ECONOMIC CRISIS: A STORY OF SUPERVISORY FAILURE 21
l a r c i e r
• A second development was the search by national authorities for that super-visory architecture that would increase effectiveness and efficiency of thesupervisory process as much as possible. Although it was obvious from thestart that the supervisory architecture was a second order issue, and that thequality of regulation and supervision were of predominant importance, agreat deal of attention went to the architecture. Unifying all sector supervi-sors under one roof was increasingly considered the most effective solution,given the blurring of demarcation lines between several types of financialinstitutions and the formation of all-encompassing financial conglomerates(Abrams and Taylor, 2000 and Llewellyn, 2006). The ‘reform hype’ startedin the wake of the establishment of the FSA in UK in 1997. Since then, manycountries have reformed their supervisory architecture. As it turned out, notall opted for unification, but several configurations emerged, with varyingroles for the central banks in the supervisory process (for an overview, seeMasciandaro and Quintyn 2009). Masciandaro and Quintyn (2009) foundthat before the crisis the trend in the changes in supervisory structuresseemed to be characterized by two intertwined features: consolidation (orunification) of supervision goes hand in hand with the specialization of thecentral bank in pursuing its monetary policy mandate, and vice versa: whereseveral authorities are present, the central bank is likely to be deeplyinvolved in supervision.
• A third development concentrated on identifying principles of good super-visory governance in order to withstand the various sources of capture(political, industry and self-capture) that supervisors are facing. Das andQuintyn (2002) and Quintyn (2007) proposed a governance frameworkconsisting of four reinforcing pillars (independence, accountability, trans-parency and integrity). Further work on supervisory independence (Quintynand Taylor, 2002) and accountability (Hüpkes, Quintyn and Taylor, 2005)spelled out the necessary operational components of these governance pil-lars. Ponce (2009) developed a theoretical model showing that supervisoryindependence had a positive impact on financial sector soundness2. The bot-tom line of the work on governance was that independent supervisors needan elaborate set of accountability arrangements to offset the fact that forfinancial supervision a very specific contract (in the principal-agent sense) isimpossible, given the great range of contingencies that can occur in supervi-sion (see also Schuler, 2003, Majone, 2005 and Dijkstra, 2010).
• Finally, several scholars argued that financial sector governance could ben-efit from more reliance on market discipline, as it would introduce an addi-
2 The 2006 BCP revision took on board more elements of operational independence, accountability and trans-parency as best practices.

22 NEW PARADIGMS IN BANKING, FINANCIAL MARKETS AND REGULATION?
l a r c i e r
tional check on the supervisory process. Calomiris (1999a and 1999b)argued that requiring banks to maintain a minimal proportion of subordi-nated debt finance would reduce the moral hazard typically created by gov-ernment safety nets (which include supervision), In the same vein, Barth,Caprio and Levine (2006) argue that the supervisors’ incentive structure cannever be perfectly aligned, mainly because of political and bureaucratic cap-ture. Therefore, mechanisms and incentives need to be created to foster mar-ket discipline as an additional check on the supervisory system and on finan-cial institutions governance.
Empirical evidence gathered before the crisis on the impact of these variousapproaches to enhance SAG on financial sector soundness raised expectations,although not unequivocally so.
On the impact of compliance with BCPs on the soundness of the financial system,Podpiera (2006) showed that higher degrees of BCP compliance have positiveeffects on the quality of bank assets and also lower the net interest margin.Demirgüç-Kunt, Detragiache, and Tressel (2006) concluded that compliance withthose principles that have a bearing on disclosure and transparency – in particularprinciple 21 – had the most significant impact on financial sector soundness3.This is in line with the findings of Beck, et al. (2003). In a later study, Demirgüç-Kunt and Detragiache (2010) conclude that compliance with BCPs is in no wayrobustly associated with bank soundness indicators such as Z-scores.
On the impact of supervisory architecture, Barth, Nolle, Phumiwasana and Yago(2002) found no correlation between the number of supervisory authorities andany of the key features of a banking system. ihák and Podpiera (2007) foundthat the unified regime is associated with higher degrees of compliance with BCP,IOSCO and IAIS standards. Arnone and Gambini (2007) showed that a higherdegree of compliance with BCPs is achieved by those countries applying a unifiedsupervisory model, with some evidence in favor of those established inside thecentral bank.
Regarding the impact of the quality of supervisory governance on financialsoundness, Das, Quintyn and Chenard (2004) show that the quality of govern-ance matters for banking soundness. Their results also indicate that good publicsector governance amplifies the impact of supervisory governance on financialsystem soundness.
3 Principle 21 states that “Each bank must maintain adequate records that enable the supervisor to obtain a trueand fair view of the financial condition of the bank, and must publish on a regular basis financial statementsthat fairly reflect this condition.”

THE ECONOMIC CRISIS: A STORY OF SUPERVISORY FAILURE 23
l a r c i e r
3.3. Supervision and the 2008-09 Crisis
3.3.1. Literature Overview: Supervisory Flaws as a Contributing Factor
The literature on the causes and origins of the financial and economic crisis of2008-09 focuses mainly on macroeconomic imbalances, macroeconomic policyfailures, as well as regulatory failures in all segments of the financial system asmajor contributing factors4. We need to go to a more specialized literature to finda more complete account of the contribution of supervisory failures to the crisis.
Failures attributable to supervisory architectures (the first element in our analy-sis) as such are only mentioned in two specific cases. For the United States, somefingers have pointed at the fragmented US supervisory system as a major contrib-utor to the crisis (Leijonhufvud, 2009). In the United Kingdom coordination fail-ures between FSA and Bank of England (and UK Treasury) have been mentionedat the time of the Northern Rock episode, thereby indirectly referring to thesupervisory architecture (Buiter, 2008 and FSA, 2009). The other generally heardclaim is that, in all of the countries stricken by the crisis, no institution was incharge of macro-prudential or systemic supervision, which is now generally rec-ognized as a architectural failure. Finally there are also the counterfactuals: in thewake of the crisis several countries revamped their supervisory architecture (Bel-gium, Germany, Ireland) which could serve as an indication that flaws in thearchitecture were blamed in part for the crisis in these countries.
Flaws in supervisory governance (our second feature) are well-documented. Mostauthors identify more or less the same issues, often named somewhat differently,with Palmer and Cerutti (2009) presenting the most thorough and completeaccount. Thus, authors identify weak supervisory independence and accountabil-ity, industry or political capture, wrong incentive structures provided by the polit-ical establishment, lack of audacity to probe or to take matters to their conclusionand to be intrusive. Several authors also point at a general lack of skills to under-stand the risks related to the new and sophisticated financial products and under-lying operations. At the international level (with respect to cross-border supervi-sion) most authors point at a misalignment of incentives for supervisors to volun-tarily cooperate, a lack of binding coordinating mechanisms, and differences inlevels of supervisory quality.
In sum, the narrative account of the role of supervision – or lack thereof – in thefinancial crisis indicates that several of the hoped-for improvements in the incen-tive structure for supervision have not been effective. The same behaviors, docu-mented during previous crises, such as the ‘not on my watch’ approach and the
4 See among others, Allen and Carletti (2009), Brunnemeier et al. (2009), Buiter (2008) and Roubini (2008).

24 NEW PARADIGMS IN BANKING, FINANCIAL MARKETS AND REGULATION?
l a r c i e r
‘sweeping of problems under the carpet’ have occurred again, sometimes at mas-sive scales.
3.3.2. Our Contribution: Empirical Evidence
A thorough empirical analysis of the role that supervisory architecture and gov-ernance played during the crisis has not yet been undertaken. This section reportson our main findings. We employ a new and complex database on supervisoryarchitecture and governance for 102 countries, which will allow us to disentanglethe relative effects of different dimensions of supervisory quality on resilience.More detailed results can be found in Masciandaro, Pansini, Quintyn, (2011).
Our interest is in analyzing how differences in supervisory architecture and gov-ernance affected country performances during the financial-cum-economic crisis.The global nature of the crisis and the cross country heterogeneity of the impactrepresent a unique opportunity to shed light on the relationships – if any –between the institutional features of the national systems and their resilience withrespect to relevant economic and financial shocks (Giannone et al. 2010), Wefocus our attention on the supervisory features. The study closest to ours is Cap-rio et al. 2011, which, among other indicators, uses an index of supervisory prac-tices to assess its relationship with the probability of a crisis. The index measuresthe degree to which the country’s bank supervisors have the authority to takespecific actions, and is not significant. Our analysis differs in several dimensions,given our aim to focus in a deep and systematic way on architecture and govern-ance regimes and the role they played in affecting country performances.
3.3.2.1. Quantifying Dimensions of Supervisory Quality
Our first task is to quantify the two measures of supervisory quality that we wantto analyze. For the supervisory architectures, we introduce two indicators theevaluate the two main characteristics highlighted in the literature: the degree ofsupervisory consolidation (or unification) and of central bank involvement insupervision. For both indices we apply in this novel field the classical index pro-posed by Herfindahl and Hirschman (Hirschman, 1964)5.
The Financial Supervision Herfindahl Hirschman (FSHH) Index measures thelevel of consolidation of the supervisory powers. It provides a quantitative per-spective on the state of the art of the supervisory architectures. Figure 1 presentsthe situation before and after the recent crisis for groups of countries. Before thecrisis (2007, light grey bars) the degree of consolidation was on average greaterin the European Union (EU) than in the industrial countries as a whole, or
5 See Masciandaro and Quintyn (2011) and Masciandaro, Pansini and Quintyn (2011) for a detailed justificationand elaboration of this index.

THE ECONOMIC CRISIS: A STORY OF SUPERVISORY FAILURE 25
l a r c i e r
Europe. The consolidation process in the above three grouping has continuedduring the crisis (2009, dark bars) while for the entire sample, we notice a slightreduction in the degree of consolidation. In sum, during the crisis the supervisoryreforms in the advanced countries continued to be driven by a general tendencyto reduce the number of agencies to reach the unified model or the so-called peakmodel – which dominated the trends in the two decades 1986-2006 (Mas-ciandaro and Quintyn, 2009).
The methodology is also used to construct the index of central bank involvementin supervision: the Central Bank as Financial Supervisor (CBFS) Index. The intu-ition is quite simple: central bank involvement in supervision is likely to be at itsmaximum when the central bank is the unified supervisor, while the involvementis likely to be low the smaller the number of sectors where the central bank hassupervisory responsibilities. To construct the CBFS index we simply have to takethe share of the central bank in each country which can range from 0 to 1.
Figure 2 presents the changes in the CBSS Index before and after the crisis. Twofacts emerge. Before the crisis (2007, lighter bars) the advanced countries showon average a lower level of central bank involvement in supervision than theentire sample. In turn, among the advanced countries, the European countriesand the EU members demonstrate higher degrees of central bank involvement insupervision. However, during the crisis we witness a sort of ‘Great Reversal’: the2009 data (dark bars) show that in the advanced, European and EU countriescentral bank involvement has increased, while it decreased slightly for the entiresample.
Figure 1: Financial Supervision Unification
0
10
20
30
40
50
60
70
80
ALL OECD EUROPE EU
COUNTRIES
FSH
H IN
DEX

26 NEW PARADIGMS IN BANKING, FINANCIAL MARKETS AND REGULATION?
l a r c i e r
This new trend can be explained by two types of considerations. First, in somecountries, such as those belonging to the Euro-zone, central banks want to bemore involved in supervision because the monetary policy responsibilities are notcompletely in their hands. Several central banks have become predominantlyfinancial stability agencies (Herrings and Carmassi, 2008). Secondly, and nottotally disconnected from the first one, the increasing emphasis on macro super-vision following the crisis, forces policymakers to identify specific agenciesresponsible for macro supervision. In that context, the view is gaining momentumthat central banks are in the best position to collect and analyze this kind ofinformation, given their role in managing monetary policy in normal times andthe lender of last resort function in exceptional times.
For supervisory governance, we build on the earlier work by Quintyn, Ramirezand Taylor (2007) on the computation of independence and accountability rat-ings for bank supervision agencies. We refer to that paper for the justification ofthe criteria. Figure 3 presents the ratings for independence and accountability,taken together. Before the crisis (2007, light grey bars) the quality of governancearrangements was rated the highest in the EU, followed by Europe and finally theindustrial countries. These three groupings score significantly higher than theoverall country sample. In the wake of the crisis (2009, dark bars) all the group-ings show further increases in the governance quality.
3.3.2.2. Economic Resilience and Supervisory Regimes: Empirical Evidence6
The purpose of our empirical analysis is to determine to what extent and how theabove indicators of supervisory quality, as computed before the crisis, are associ-ated with the cross-country variation of macroeconomic and financial perform-
Figure 2: Central Bank Involvement in Supervision
6 For the detailed empirical analysis, we refer to Masciandaro, Pansini and Quintyn (2011).
0
5
10
15
20
25
30
35
ALL OECD EUROPE EU
CB
SS IN
DEX

THE ECONOMIC CRISIS: A STORY OF SUPERVISORY FAILURE 27
l a r c i e r
ances during the crisis. In principle, higher rated supervisory quality is expectedto positively influence the soundness of the financial system. In turn financialsoundness can have positive effect on macroeconomic stability: less financial sec-tor disturbances can mean less related losses in the real economy (Cecchetti et al.2009).
We address this question by analyzing the explanatory power of three indicatorsof supervisory quality – the FSHH Index (unification effect), the CBSF Index (cen-tral bank effect), and the total rating of governance (governance effect), all calcu-lated in 2007. Our dependent variable is the average real output growth in theyears 2008 – 2009. A graphical inspection of the relationship (figures 4, 5 and 6)already gives a strong indication of the direction of our findings: the degree ofsupervisory consolidation and the quality of supervisory governance are nega-tively related to output growth. The degree of central bank involvement shows aweakly positive relationship.
Our regressions (table 1) include three macro key control variables: (i) the loglevel of income per capita 1996-2006, to control for the relationship betweenstructural richness and crisis (richness effect), which seems to have characterizedthe crisis; (ii) the average growth rate of GDP in the 2004-06 period, to controlfor the cross country heterogeneity (heterogeneity effect); and (iii) the log of pop-ulation in 1996-2006, which captures the structural size effect (size effect). Allleft-hand side variables in the regressions are dated before 2008, to eliminateendogeneity.
Figure 3: Supervisory Governance Rating
58
60
62
64
66
68
70
72
ALL OECD EUROPE EU
COUNTRIES
GO
VER
NA
NC
E R
ATI
NG

28 NEW PARADIGMS IN BANKING, FINANCIAL MARKETS AND REGULATION?
l a r c i e r
Regressions I and II include the two aspects of supervisory architecture: supervi-sion unification and central bank involvement. The results strongly confirm theimpressions obtained from the figures above: more consolidation is correlatedwith less resilience: the unification effect is negative. Deeper involvement of thecentral bank in the supervision increases resilience: the central bank effect is pos-itive. These results are confirmed if we consider the two variables together(Regression IV), and the overall regression significance increases slightly. Regres-sion III shows that the quality of the governance is also negatively related to eco-
Figure 4: GDP Resilience & FSHH (99 countries)
Figure 5: GDP Resilience & CBSS (99 countries)
R² = 0,0444
-15
-10
-5
0
5
10
15
0,00 0,20 0,40 0,60 0,80 1,00 1,20
%G
DP0
809
FSHH (MQ) INDEX
R² = 0,0378
-15
-10
-5
0
5
10
15
0,00 0,20 0,40 0,60 0,80 1,00 1,20
%G
DP0
809
CBSS (MQ) INDEX

THE ECONOMIC CRISIS: A STORY OF SUPERVISORY FAILURE 29
l a r c i e r
nomic resilience7. Considering the three indicators jointly (Regression V) weobtain the same results, with the exception of the central bank effect, which isnow not significant. Thus, supervisory unification and good supervisory govern-ance are negatively associated with economic resilience, while the central bankinvolvement is weakly positive.
To test the robustness of these results, we added in several iterations a number ofother potentially relevant variables. These results are not shown here, but we cansummarize as follows: adding a variable representing the quality of public sectorgovernance did not change the direction of our results. However this variable initself is significantly negatively related to output resilience: countries with thehighest marks in the quality of public sector governance had the deepest reces-sion. The same is true for the degree of financial liberalization: the highest liber-alized countries had the deepest recession, while the impact of our three key var-iables did not change significantly8. Finally, adding a set of variables reflecting thesize, depth and performance of the banking and financial industry, also didchange the main thrust of our findings.
These results are broadly in line with what others in similar research concluded:Giannone et al. (2010) found that the indicators of the quality of public sectorregulations – which proxy the ‘market friendliness’ of the economy – are nega-tively correlated with economic growth: countries which scored the highest in
Figure 6: GDP Resilience & Supervisory Governance (50 countries)
7 The set of data on supervisory governance is more limited than on architectures, so the sample in this regressionis smaller than in regressions I and II.
8 We use the corresponding sub-component of the Worldwide Governance Index – quality of regulation –computed by the World Bank, calculated for 1996-2006. As a proxy for banking regulation/liberalization(banking regulation effect) we use the index computed by the Frazer Institute, calculated for 2004-06.
R² = 0,3208
-15
-10
-5
0
5
10
15
0,00 0,20 0,40 0,60 0,80 1,00
%G
DP0
809
SUPERVISORY GOVERNANCE (QRT) INDEX

30 NEW PARADIGMS IN BANKING, FINANCIAL MARKETS AND REGULATION?
l a r c i e r
terms of quality of regulation have also been the least resilient to the global reces-sion. The same seems to be true when considering financial resilience, as Caprioet al. (2011) do. They find that, other things being equal, more restrictions onbank activities seem to have reduced the likelihood of suffering the recent finan-cial crisis.
Our results convincingly reveal that those features that were meant to strengthensupervision and, through it, financial and economic resilience – supervisory uni-fication and better governance – have not really met those objectives. Both fea-tures are across our regressions associated with weaker resilience. Secondly, wealso notice that the countries with the best ratings in terms of public sector regu-latory framework, as well as those countries with the most far reaching financialderegulation were hit the hardest economically. We also noticed the impact of the
Table 1: Resilience, Supervisory Architecture and Governance
I II III IV V
FSHHI 2007 -2.296 -2.93 -5.1
(1.68)* (2.16)** (3.00)***
CBSS 2007 2.455 2.936 -0.002
(2.08)** (2.49)** 0
GOVRATING07 -16.688 -15.107
(3.52)*** (3.42)***
GDP grow th 040 0.273 0.23 0.216 0.101 0.074
-1.75 -1.47 -1.41 -0.51 -0.41
log POP 0.433 1.089 0.654 1.221 0.45
-0.37 -0.95 -0.57 -0.65 -0.26
log GDP/POP 0.236 -0.021 0.137 0.229 0.4
-0.24 -0.02 -0.14 -0.15 -0.28
Constant 0.311 -2.08 -0.095 8.546 11.549
-0.21 -1.8 -0.07 (2.30)** (3.25)***
Observations 96 96 96 49 49
R-squared 0.09 0.1 0.15 0.36 0.49
Absolute value of t-statistics in parentheses
*,**,*** signif icant at 10%,5%,1% level
dependent variable: average real GDP growth 2008-09

THE ECONOMIC CRISIS: A STORY OF SUPERVISORY FAILURE 31
l a r c i e r
supervisory features under discussion may differ somewhat, depending on theoverall (governance) setting. Finally, the degree of involvement of the centralbank in supervision did not seem to have had any significant impact on resilience.
3.4. Financial Supervision: What is next?
The preceding empirical analysis confirms that neither supervisory architecturenor improvements in supervisory governance have been able to prevent or miti-gate the crisis, putting into question a large number of assertions that were madebefore the crisis. Several authoritative voices have proposed modifications – par-adigm changes – aimed at remedying some of the ills.
On supervisory architectures we can be short: the foregone conclusion now is that(i) macroprudential supervision should be established as a supervisory activitydistinct from microprudential supervision; and (ii) central banks should play amajor role in this new field. Work in this area is evolving rapidly. Thus, the pre-crisis paradigm, supporting a trend towards supervision unification and centralbank specialization is being replaced by a twin-peak model in supervision (macro-micro), with central bank involvement, at least in macro supervision.
On supervisory approaches and practices, the crucial question that we are facingonce again is, how can incentive structures for supervisors be better aligned inorder to avoid a repeat of what happened in the run-up to the latest crisis? Nearlyall recommendations go in the same direction9. A consensus is emerging that inthis post-crisis environment, supervision needs to be more intrusive (the new buzzword), proactive, risk-based, and result-oriented. This new supervisory approachshould be achieved by improving the incentive structure for supervisors so thatthe capture traps are avoided. Most analysts converge on measures such as clari-fying the mandate for supervisors, having more independence and accountability,and bringing in more and higher skilled professionals that enjoy higher monetarycompensation, to achieve this objective. Higher skilled professionals with highercompensations are also needed to avoid that the profession stays behind the curvewhen it comes to new developments in the financial system.
While we concur in principle with this analysis and the proposed way forward,we would like to point out some of its limitations and potential pitfalls. It isbeyond doubt that financial supervision needs indeed to have the qualities listedabove. Palmer and Cerutti (2009) show that those countries (such as Australia,Canada and Spain for instance), where supervisors had these qualities, fared on
9 For the most authoritative reports, see M. BRUNNEMEIER et al., 2009, CLAESSENS et al., 2010, DE LA TORRE andIZE, 2009, ENRIQUES and HERTIG, 2010, FSA, The Turner Review 2009, PALMER and CERUTTI, 2009,TABELLINI; 2008, VINALS et al., 2010, WEDER DI MAURO, 2009, and WELLINCK, 2011.

32 NEW PARADIGMS IN BANKING, FINANCIAL MARKETS AND REGULATION?
l a r c i e r
average better in the crisis (other factors also contributed to their relative suc-cess).
These new accents in the supervisory approach can indeed be fostered by moresolid governance arrangements. It is beyond doubt that supervisory governanceneeds further improvements to provide the right incentives to cope with threetypes of capture: political, industry and self-capture (Masciandaro, Quintyn andTaylor, 2010 and Dijkstra, 2010). As discussed elsewhere, levels of supervisoryindependence and accountability vary widely across the world (see rankings infigure 3). Independence is on average much lower than for central banks as mon-etary policy agents. Accountability arrangements – the indispensable complementto independence – are often poorly developed. Hence, improvements are desira-ble, and, as Figure 3 shows, several countries have already taken action.
However, experience of the last two decades also points in the direction of somecritical limitations with respect to the potential impact of supervisory governance.These limitations stem from the fact that, by the nature of the supervisory work,the contract between the supervisor and society will always be radically incom-plete given the great range of contingencies that can occur in regulation andsupervision. Thus, it will be extremely difficult to precisely specify the agent’sobjectives (Goodhart, 2001, Schuler, 2003 and Quintyn and Taylor, 2007).Hence, it is misleading to believe that supervisory governance arrangements canbe defined and implemented in such a way that each and every possibility ofpolitical, industry and self-capture can be eliminated. So, the first best solution,i.e. define the right governance arrangements to address the supervisors’ incentiveproblems has its own limitations.
Moreover, recent experiences during the crisis have demonstrated that some ofthe more successful approaches to supervision are the result of long-establishedand long-fostered corporate cultures that have helped to brace the institutionagainst various forms of capture. So, de facto independence seems at least asimportant as de iure independence. The crisis record (corroborated by the empir-ical findings in this paper) shows indeed that, on the one hand, several countrieswith strong (de iure) independence and accountability arrangements were mostseverely hit by the crisis, while others with relatively weaker arrangements onpaper emerged relatively unscathed from the crisis. Take the example of Canada:the supervisory agency does not score very high on de iure independence. How-ever, practice shows that its de facto independence is high, which, combined witha strong supervisory tradition (Palmer and Cerutti, 2009) has contributed toescaping from the crisis. Conversely, countries with higher governance ratings,either did not fully use them, or missed the proper supervisory culture asdescribed above, and failed. So the bottom line is that improvements in supervi-sory governance per se, are not a panacea for all supervisory failures, as proven

THE ECONOMIC CRISIS: A STORY OF SUPERVISORY FAILURE 33
l a r c i e r
by our empirical analysis. Improvements in supervisory governance take time tochange supervisory approaches and cultures.
Combining these two major points – governance arrangements will always havetheir limitations, because of the impossibility to write a contract (in the principal-agent sense) that fully aligns incentives, and governance arrangements do not perse lead to improvements in supervisory approach and culture – forces us to thinkabout second-best solutions to align supervisory incentives.
The new financial architecture that is emerging in the wake of the crisis – separa-tion of macro and micro prudential supervision – offers a great opportunity toconceive such a second-best solution that potentially can offset some of the inher-ent weaknesses in our first-best approach: let us combine the new architecturewith good governance practices to better align supervisory incentives.
Here is the reasoning: in response to the crisis, the new trend in several countriesis to establish a separate function for macroprudential supervision. Although theinstitutional forms vary and are evolving, a common trend seems to be to assignthis task to the central bank, or for the central bank to play a pivotal role. Basedon a survey of 63 countries IMF (2011) reports that in 19 out of 22 countries thathave a formal mandate for macroprudential supervision the central bank is thesole institution in charge, or plays a key role, together with one or more otherinstitutions10. So, the more fundamental movement seems now to go in the direc-tion of a two peak model with one peak for macroprudential supervision, theother for microprudential supervision. However, these peaks are in the first placefunctional peaks. While there is a growing consensus on these functional peaks,the architecture is still largely under discussion. Some countries are assigning thetasks to two separate agencies, while others prefer to have micro- and macropru-dential supervision under one roof.
The presence of two institutions involved in the same field of operation (but witha different mandate) would allow for check and balances to operate among bothinstitutions. These checks and balance could reduce the likelihood of capture (ofany type). The proposal to rely on checks and balances between two institutionsinvolved in supervision is based on a model developed by Laffont and Martimort(1999) and a recent extension of their work by Boyer and Ponce (2010).
Laffont and Martimort’s model starts from the idea that the power of a supervi-sory agency is its ability to use some piece of information it has learned on thesupervised entity to improve social welfare. They show that, when benevolentsupervisors are in charge of implementing the socially optimal contract, there isno reason for the separation of powers, i.e., for splitting authorities among dif-
10 These institutions include financial stability council, ministry of finance, bank supervisor, integrated supervisor,supervisor of other subsector or deposit insurance agency.

34 NEW PARADIGMS IN BANKING, FINANCIAL MARKETS AND REGULATION?
l a r c i e r
ferent supervisory agencies. They always use their possible discretion, i.e., theirpower, to maximize social welfare.
However, non benevolent supervisors may use their power to pursue personalagendas, for example by colluding with the supervised entity. They show that inthis case there is scope for separation. Separation of supervisors divides the infor-mation at their disposal and thus limits their discretion in engaging in sociallywasteful activities. Instead of having a unique supervisor implementing the pri-vately efficient collusive offer to the regulated firm, separation introduces a Baye-sian-Nash behavior between partially informed supervisors. When this Bayesian-Nash behavior is such that the regulators offer safe bribes that can always beprovided by the interest group, the outcome of this collusion game reduces thetotal collusive offers they make. As a result, the transaction costs of collusiveactivities increase and preventing collusion becomes easier. Separation improvessocial welfare.
Boyer and Ponce (2010) adapt this framework to analyze the implications of cap-ture on the optimal allocation of micro and macroprudential supervision. Theyconclude from their model that concentration of both supervisory powers in oneagency could be harmful because the monopoly of information acquisition maybe a curse when capture is a concern. In other words, institutional separation ofthe micro and the macro pillar of supervision now offers a unique opportunity tocreate a system of checks and balances that should have a positive impact on theincentive structure of supervisors and – provided both agencies have good gov-ernance arrangements – would enhance effectiveness and responsiveness of super-vision. While the two models start from industry capture as the main threat,Boyer and Ponce (2010) show that their results hold for any type of capture. Inreality, the demarcation line between the three types of capture mentioned earlieris often hard to draw and capture is very often of a mixed nature.
A likely architecture would be to house macroprudential supervision in the cen-tral bank (for the reasons given in the literature) and microprudential supervisionin an agency at arms’ length from the central bank. The advantages of this archi-tecture would be that (i) it provides checks and balances that would better alignsupervisors’ incentives; (ii) not all power is concentrated in one agency; (iii) syn-ergies are created because the analytical scope of macroprudential supervision iscloser to the core focus of the central bank; (iv) there is a clear link betweenmacro-prudential supervision and the central bank’s function of liquidity provi-sioning.
The proposed division of labor would also entail some costs: (i) in order to main-tain the checks and balances, there would be a need for some double reporting bythe financial sector; (ii) there is a need for general coordination between bothagencies while maintaining the checks and balances; (iii) coordination is also

THE ECONOMIC CRISIS: A STORY OF SUPERVISORY FAILURE 35
l a r c i e r
needed when it comes to deciding who will take specific measures (against indi-vidual banks or groups of banks) and even more so when authority needs to betransferred to a resolution agency (see also Palmer and Cerutti, 2009, p. 43).Finally, these arrangements could potentially introduce some competition amongsupervisors but since their mandates would be different it would not be the typeof competition that financial institutions could exploit. In any case, the modelson which our proposal is founded indicate that these costs are lower than thepotential benefits.
3.5. Conclusion
The end of the Asian systemic financial crisis marked the beginning of intenseefforts on several fronts to improve the quality and impact of financial sectorsupervision. The BCPs were promulgated as best practices to frame and guide thesupervisory process; attention went to arrangements to improve supervisory gov-ernance, both internally (integrity) and externally (independence, accountability,transparency); and supervisory architectures were revisited to enhance efficiencyand effectiveness of supervisory processes. Finally, more reliance on market dis-cipline was also promoted as a check on the supervisory process.
During the ‘high tide’ in the first years of the new millennium, empirical evidenceon the positive impact of these new initiatives on bank soundness was not con-clusive, but hope remained that a possible new crisis could be mitigated by thesenew arrangements and processes.
However, the financial and economic crisis that started in 2007-08 meant thegreat awakening from a dream: countries that were believed to be among thosewith the most solid supervisory systems were hardest hit by the crisis. Severalaccounts by academia and policymakers now point at major failures in the super-visory systems in the run-up to the crisis. Our empirical analysis, undertaken witha new database on indicators of the quality of supervision, leaves little doubt:consolidation in supervision and good supervisory governance are negatively cor-related with resilience; the degree of involvement of the central bank in supervi-sion did not have any significant impact on resilience.
So, given this major defeat, the question is what to do next. Recommendationsby several authors converge on promoting more intrusive and proactive supervi-sion implemented by staff with higher skills. All scholars and policymakers agreethat this new approach needs to be backed by better governance arrangements.We pointed out that improvements in supervisory governance, while certainlyneeded, have their limitations. Better governance will never be able to completelyalign the supervisory incentive structure because the supervisory contract will, byits nature, always be incomplete. We therefore suggest (based on the Laffont and

36 NEW PARADIGMS IN BANKING, FINANCIAL MARKETS AND REGULATION?
l a r c i e r
Martimort (1999) model) to exploit the opportunities offered by the newlyemerging supervisory architecture, with one pillar in charge of macroprudentialsupervision and one in charge of microprudential supervision: if both pillars areinstitutionally separated, a system of checks and balances between both is cre-ated, which would reduce the opportunities for political, industry and self-cap-ture. It seems that the benefits of such an arrangement would be greater than thecosts it involves. Several countries are still in the (re)design phase of their super-visory architecture and this second-best mechanism can be used in conjunctionwith improvements in supervisory governance to better align supervisory incen-tives.
References
ALLEN, F. and CARLETTI, E., 2009, The Global Financial Crisis: Causes and Con-sequences, Mimeo.
ARNONE, M. and GAMBINI, A., 2007, “Architecture of Supervisory Authoritiesand Banking Supervision” in MASCIANDARO, D. and QUINTYN, M. (eds.),Designing Financial Supervision Institutions: Independence, Accountabilityand Governance, Edward Elgar, Cheltenham, 262-308.
BARTH, J.R., NOLLE, D.E., PHUMIWASANA, T. and YAGO, G., 2002, A CrossCountry Analysis of the Bank Supervisory Framework and Bank Perform-ance. Financial Markets, Institutions & Instruments, vol. 12, No. 2, 67-120.
BARTH, J., CAPRIO, G. and LEVINE, R., 2006, Rethinking Bank Supervision andRegulation: Till Angels Govern, Cambridge, U.K., Cambridge UniversityPress.
Basel Committee on Banking Supervision, 1997, Core Principles for EffectiveBanking Supervision, Basel, Bank for International Settlements.
BECK, Th., DEMIRGÜÇ-KUNT, A. and LEVINE, R., 2003, Bank Supervision andCorporate Finance, NBER Working Paper 9620, Cambridge, Massachu-setts, National Bureau of Economic Research.
BOYER, P. and PONCE, J., 2010, Central banks, regulatory capture and bankingsupervision reform, Paper presented ath Finance Seminar at Banco Centraldel Uruguay.
BRUNNEMEIER, M. et al., 2009, “The fundamental principles of financial regula-tion”, Geneva Reports on the World Economy 11.
BUITER, W., 2008, Lessons from the North Atlantic financial Crisis, Paper pre-sented at the conference “The role of Money Markets”, Columbia BusinessSchool and Federal Reserve of New York, May 29-30.
CALOMIRIS, Ch., 1999a, “Building an incentive-compatible safety net”, Journalof Banking and Finance, Vol. 23, pp. 1499-1519.

THE ECONOMIC CRISIS: A STORY OF SUPERVISORY FAILURE 37
l a r c i e r
CALOMIRIS, Ch., 1999b, “Market-based banking Supervision”, The FinancialRegulator, Vol. 3, No. 4, March, pp. 33-36.
CARDARELLI, R., ELEKDAG, S. and LALL, S., 2011, “Financial Stress and Eco-nomic Contractions”, Journal of Financial Stability, Vol. 7, n. 2, 78-97.
CAPRIO, G., DEMIRG Ç-KUNT, A. and KANE, E., 2008, The 2007 Meltdown inStructured Securitization: Searching for Lessons not Scapegoats.
CAPRIO, G.J., D’APICE, V., FERRI, G. and PUOPOLO, G.W., 2011, Macro FinancialDeterminants of the Great Financial Crisis: Implications for Financial Reg-ulation, IstEin Working Paper Series, No. 12.
CECCHETTI, St., 2008, “The subprime series, part 3: Why central banks shouldbe financial supervisors” in A. FELTON and C. REINHART, The First Glo-bal Financial Crisis in the 21st Century – A VoxEU.org Publication,CERP.
CECCHETTI, S.G, KOHLER, M. and UPPER, C., 2009, Financial Crises and Eco-nomic Activity, Federal Reserve Bank of Kansas City, Mimeo.
CLAESSENS, S., KOSE, M.A and TERRONES, M.E., 2010, The Global FinancialCrisis: How Similar? How Different? How Costly?
IHÁK, M. and PODPIERA, R., 2007, “Experience with Integrated Supervisors:Governance and Quality of Supervision” in MASCIANDARO, D. andQUINTYN, M. (eds.), Designing Financial Supervision Institutions: Inde-pendence, Accountability and Governance, Edward Elgar, Cheltenham,309-341.
DAS, U. and QUINTYN, M., 2002, “Financial Crisis Prevention and Crisis Man-agement – The Role of Regulatory Governance” in Financial Sector Govern-ance: The Roles of the Public and Private Sectors, ed. by R. LITAN,M. POMERLEANO and V. SUNDARARAJAN, Washington: Brookings Institu-tion Press.
DAS, U., QUINTYN, M. and CHENARD, K., 2004, Does Regulatory GovernanceMatter for Financial System Stability?, IMF Working Paper, WP04/89.
DE LAROSIÈRE GROUP, 2009, Report of the High Level Group on Supervision.
DE LA TORRE, A. and IZE, A., 2009, Regulatory Reform: Integrating Paradigms,Policy Research Working Paper 4842, World Bank.
DEMIRGÜÇ-KUNT, A., DETRAGIACHE, E. and TRESSEL, Th., 2006, Banking on thePrinciples: Compliance with Basel Core Principles and Bank Soundness,IMF Working Paper 06/242, Washington: International Monetary Fund.
DEMIRGÜÇ-KUNT, A. and DETRAGIACHE, E., 2010, “Basel Core Principles andBank Soundness: Does Compliance Matter?”, Journal of Financial Stability,forthcoming.
DIJKSTRA, R., 2010, “Accountability of financial supervisory agencies: An Incen-tive Approach”, Journal of Banking Regulation, Vol. 11, 115-128.

38 NEW PARADIGMS IN BANKING, FINANCIAL MARKETS AND REGULATION?
l a r c i e r
ENRIQUEZ, L. and HERTIG, G., 2010, The Governance of financial Supervisors:Improving Responsiveness to Market Developments, Paper presented at the5th International Conference on Financial Regulation and Supervision, Uni-versita Bocconi, Milan, June 24-25th.
FINANCIAL SERVICES AUTHORITY, 2009, The Turner Review. A RegulatoryResponse to the Global Banking Crisis, FSA, London, March.
GIANNONE, D., LENZA, M. and REICHLIN, L., 2010, Market Freedom and theGlobal Recession, Discussion Paper Series, CEPR, No. 7884.
GOODHART, C., 2001, “Regulating the Regulators – Accountability and Con-trol” in Ferran and Goodhart, Regulating Financial Services and Markets inthe 21st Century, Oxford, Hart Publishing.
GOODHART, C. and others, 1998b, “Incentive Structures for Financial Regula-tion” in Financial Regulation: Why, How and Where Now?, London andNew York, Routledge.
HIRSHMAN, A.O., 1964, The Paternity of an Index, American Economic Review,Vol. 54, No. 5, pp. 761-762.
HÜPKES, E., QUINTYN, M. and TAYLOR, M., 2005, “The Accountability of Finan-cial Sector Supervisors: Theory and Practice”, European Business LawReview, Vol. 16, No. 6, pp. 1575-1620.
IMF, 2011, Macroprudential Policy: An Organizing Framework, March.
LAFFONT, J-J. and MARTIMORT, D., 1999, “Separation of Regulators against col-lusive behavior”, RAND Journal of Economics, Vol. 30, No. 2, Summer,pp. 232-262.
LEIJONHUFVUD, A., 2009, “Curbing instability: policy and regulation”, CEPRPolicy Insight, No. 36, July.
LINDGREN, C.-J., BALINO, T., ENOCH, C. et al., 1999, Financial Sector Crisis andRestructuring – Lessons from Asia, IMF Occasional Paper 188, IMF Wash-ington DC.
LLEWELLYN, D., 2006, “Integrated Agencies and the Role of Central Banks” inD. MASCIANDARO (ed.), Handbook of Central Banking and FinancialAuthorities in Europe, Edward Elgar, UK and USA, p. 566.
MAJONE, G., 2005 “Strategy and Structure: The Political Economy of AgencyIndependence and Accountability” in Designing Independent and Account-able Regulatory Agencies for High Quality Regulation, Proceedings of anExpert Meeting in London (January 10-11th), Organization for EconomicCooperation and Development, pp. 126-55.
MASCIANDARO, D., 2009, “Politicians and Financial Supervision outside the Cen-tral Bank: Why Do They Do it?”, Journal of Financial Stability, Vol. 5,No. 2, 124-147, 2009.

THE ECONOMIC CRISIS: A STORY OF SUPERVISORY FAILURE 39
l a r c i e r
MASCIANDARO, D., PANSINI, R. and QUINTYN, M., 2011, “The Economic Crisis:Did Financial Supervision Matter?”, IMF Working Paper, WP 11/261.
MASCIANDARO, D. and QUINTYN, M., 2009, “Reforming Financial Supervisionand the Role of the Central Banks: a Review of Global Trends, Causes andEffects (1998-2008)”, CEPR Policy Insight, No. 30, 1-11, 2009.
MASCIANDARO, D. and QUINTYN, M., 2011, “The Architecture of InsuranceSupervision: Global Trends Before and After the Financial Crisis” inP. LIEDTKE and J. MONKIEWICK, The Fundamentals of Future InsuranceRegulation and Supervision. A Global Perspective, Palgrave Macmillan,Forth.
MASCIANDARO, D., QUINTYN, M. and TAYLOR, M.W., 2008, “Inside and outsidethe central bank: Independence and Accountability in Financial Supervision:Trends and Determinants”, European Journal of Political Economy,Vol. 24, No. 4. 833- 848.
MASCIANDARO, D., QUINTYN, M. and TAYLOR, M.W., 2010, “Independence andAccountability in Supervision. Comparing Central Banks and FinancialAuthorities” in SIKLOS, BOHL and WOHAR, Challenges in Central Banking.The Current Institutional Environment and Forces Affecting Monetary Pol-icy”, Cambridge University Press.
PALMER, J. and CERRUTI, C., 2009, Is there a need to rethink the supervisoryprocess?, Paper presented at the International Conference “ReformingFinancial Regulation and Supervision: Going back to Basics”, Madrid,June 15.
PODPIERA, R., 2006, “Does Compliance with Basel Core Principles Bring AnyMeasurable Benefits?”, IMF Staff Papers, Vol. 53 (June), pp.306-25.
PONCE, J., 2009, A Normative Analysis of Banking Supervision: Independence,Legal Protection and Accountability, Paolo Baffi Centre Research PaperNo. 2009-48, Available at SSRN.
QUINTYN, M., 2007, “Governance of Financial Supervisors and its Effects – AStocktaking Exercise”, SUERF Studies 2007/4, 64 p.
QUINTYN, M. and TAYLOR, M., 2003, “Regulatory and Supervisory Independ-ence and Financial Stability”, CESifo, Economic Studies, Vol. 49, No. 2,pp. 259-94.
QUINTYN, M. and TAYLOR, M., 2007, “Robust Regulators and their PoliticalMasters: Independence and Accountability in Theory”, Chapter 1 inDesigning Financial Supervision Institutions: Independence, Accountabil-ity, and Governance, ed. by D. MASCIANDARO and M. QUINTYN, Chelten-ham, U.K., Edward Elgar.
QUINTYN, M., RAMIREZ, S. and TAYLOR, M.W., 2007, “The Fear of Freedom.Politicians and the Independence and Accountability of Financial Supervi-sors” in MASCIANDARO, D. and QUINTYN, M. (eds.), Designing Financial

40 NEW PARADIGMS IN BANKING, FINANCIAL MARKETS AND REGULATION?
l a r c i e r
Supervision Institutions: Independence, Accountability and Governance,Edward Elgar, Cheltenham.
ROSE, A. and SPIEGEL, M., 2011, Cross Country Causes and Consequences of theCrisis: an Update, Mimeo.
ROUBINI, N., 2008, Ten Fundamental Issues in Reforming Financial Regulationand Supervision in a World of Financial Innovation and Globalization,RGE Monitor.
SCHULER, M., 2003, Incentive Problems in Banking Supervision – The EuropeanCase, Centre for European Economic Research, Discussion paper 03-62.
TABELLINI, G., 2008, “Why did bank supervision fail?” in A. FELTON andC. REINHART, The First Global Financial Crisis in the 21st Century – AVoxEU.org Publication, CERP.
VINALS, J., FIECHTER, J. et al., 2010, The Making of Good Supervision: Learningto Say ‘No’, IMF Staff Position Note SPN/10/08.
WELLINK, N., 2011, “Remarks” at the High Level Meeting on Better Supervisionand Better Banking in a Post-crisis era, Kuala Lumpur, Malaysia, Janu-ary 17.
WEDER DI MAURO, B., 2009, “The Dog that didn’t Bark”, The Economist, Octo-ber 1.

41
l a r c i e r
4. SYSTEMIC CHANGES IN THE FINANCIAL WORLD AND
THE SEARCH FOR THE NEW PARADIGM OF FINANCE
Adam Szyszka
Abstract
The paper discusses a hypothesis that the neoclassical theory of finance lost itscredibility due to systemic changes that have happened within institutions, mar-kets, and instruments over the last three decades. It is suggested that the theoryshould be modified in line with dynamically changing financial environment. Theneoclassical financial economics is challenged with the behavioral approach tocapital markets. Practical implications of the behavioral view for market partici-pants: investors, corporate managers, and regulators are discussed. Behavioralaspects of the recent financial crisis are also presented. Finally, conclusion isreached that an interdisciplinary approach is needed in the search for an adequatetheory of finance. The neoclassical paradigm might be seen as an idealized nor-mative benchmark. On the other hand, behavioral finance help explain deviationsfrom this benchmark, however itself it lacks the normative character. Behavioralapproach is a valuable supplement when trying to understand financial markets,but so far should not be treated as a rigorous and completed alternative theory.
Keywords: paradigm of finance, transformation of financial markets, neoclassicaleconomics, behavioral finance, psychology of capital market, financial crisis.
JEL Classification: G1, G2
4.1. Introduction
The recent financial crisis gave rise to questions regarding fundamental issues ofthe current paradigm of finance. Dramatic events opened our eyes and let us seethat behavior of financial markets is far from what we had imagined them tofunction like.
In this paper first we look at systemic changes that financial institutions, markets,and instruments have undergone. We wonder if the these transformations andtheir effects give grounds to modify theoretical background of finance and tosearch for a new paradigm that could better describe processes occurring in theglobal financial market.
We confront the traditional neoclassical financial economics with behavioralfinance focusing on key assumptions, predictions, and findings of each of theseschools of thought. We state that the neoclassical paradigm might be seen as anidealized normative benchmark which predictions – although derived from neatmathematical models and formulas – are often very far from reality. On the other

42 NEW PARADIGMS IN BANKING, FINANCIAL MARKETS AND REGULATION?
l a r c i e r
hand, behavioral finance is more intuitive and descriptive. Behavioral approachhelps explain deviations from the neoclassical benchmark, however itself it lacksthe normative character. Behavioral approach might be a valuable supplementwhen trying to understand financial markets, but so far should not be treated asa rigorous and completed alternative theory.
Later we discuss consequences for investors, corporate managers, and regulatorsof capital markets. We show how adopting the behavioral view impacts thesethree groups of market participants and how it should influence their actions.
In the last section we present behavioral issues that demonstrated themselves par-ticularly during the recent financial crisis. Although direct reasons for the crisishad macroeconomic grounds, behavioral aspects greatly contributed to the scaleand scope of the trouble. In this context we discuss psychological background ofgreed, underestimation of risk, herding, limited rationality and mistakes of ratingagencies, as well as fear as a reason for excessive selling and resulting undervalu-ation.
In final remarks we postulate an interdisciplinary approach in building a newadequate theory of financial markets.
4.2. Systemic Changes in the Financial World
Over last two decades we have witnessed processes of economic globalization,increasing international and inter-industrial ties, growing global macroeconomicimbalances, and strengthening competition both on local and global markets.Financial sector has been a subject of particularly significant changes. Transfor-mation, or rather revolution as one should say, took place in three main areas:within financial institutions, in the way of organization and functioning of finan-cial markets, and among financial instruments.
4.2.1. Institutions
During last 20 years investment banks have greatly gained in importance. Hold-ing capital amounts in many cases greater than state budgets of many countries,investment banks became global players with wider and wider profile of activi-ties, beyond traditional understanding of investment banking (greater spectrumof investing on own books, including pure speculation, tendency to engage inareas reserved previously for insurance companies, growing connection to retailbanking and consumer finance). The segment of investment funds has changed,too. Speculative funds and hedge funds have been developing dynamically andgained a vast share in the asset management market. A completely new categoryof institutions – sovereign wealth funds – has also occurred. They supply lots of

SYSTEMIC CHANGES IN THE FINANCIAL WORLD 43
l a r c i e r
capital and often provide liquidity when it is needed, but on the other hand theirappearance has risen a question about geopolitical and strategic criteria in assetallocation. These state controlled investors may have other than purely financialcriteria of investment. Finally, not without an impact to the institutional spherewas the liberalization of the US law. The Depository Institutions Deregulatoryand Monetary Control Act of 1980 among others gave birth to development ofnon-banking financial organizations targeted at high risk lending, includingmortgages offered to people with low creditworthiness (so called NINJA).
4.2.2. Markets
Financial market trading platforms have also been subject of vital transforma-tion. We have witnessed a process of consolidation of exchanges and a tendencyto cross-list the same financial instruments on different markets over the globe.Development of telecommunication means, and Internet in particular, made deal-ing with financial instruments really global and active practically 24 hours a day.Exchanges started to implement electronic trading systems, gradually diminishingthe role of the traditional human factor (market makers). Automatic order sys-tems have gained in importance, particularly among big institutional players. Vol-atility has greatly increased in almost all categories of assets. Volume and valueof transactions have significantly grown in all markets, but predominantly incommodities and derivatives. These two markets have been subject to most sig-nificant changes of systemic character.
4.2.3. Instruments
Commodities became commonly treated as any other financial assets, and tradedto a great extend for speculative purposes. Since the beginning of 2002 we havewitnessed dynamic price growth in commodity markets, which continued andreached its peak only in mid-2008. Initially it could seem that the boom wasjustified in the context of an intensified demand for raw materials coming fromfast-developing economies. However, the growth dynamics of commodity priceswas much higher than the accompanying increase in global demand. Investorsstarted treating e.g. crude oil or copper as ordinary financial assets in which theycould invest the surplus of cheap money, hoping for further growth in demandand hence – also growth in prices.
Even greater and more dynamic changes happened in markets for derivatives.Over two recent decades derivatives have been more and more frequently usedfor speculative purposes rather than risk hedging, which was their primary pur-pose. According to the data of the Futures Industry Association (FIA), in 2007 thetotal trade volume of derivatives in 54 stock exchanges worldwide amounted to15.2 billion pieces (of futures contracts and options), whereas in 1999 that vol-

44 NEW PARADIGMS IN BANKING, FINANCIAL MARKETS AND REGULATION?
l a r c i e r
ume only amounted to 2.4 billion pieces. The Bank for International Settlement(BIS) estimated that in 2007 the value of the stock exchange trading of derivativesamounted to almost USD 2.3 trillion, and at the end of the year the take up valueon exchange derivatives amounted to over USD 28 billion. This value should alsobe increased by the value of derivatives transactions entered into on the OTCmarket. Statistics concerning the total volume of transactions in the global OTCmarket are not available but its size is reflected by the actual value of outstandingcontracts which the data of BIS valued at USD 595.3 billion at the end of 2007.A vast majority of derivatives transactions concerned financial underlying assets.The share of derivatives transactions associated with non-financial assets (e.g.agricultural produce, energy, precious metals, raw materials) did not exceed10%1.
One might risk a conclusion that the dynamic development of the derivativesmarkets led to abandoning the typical function of money in economy, i.e. its tra-ditional currency function. In the beginning, money followed merchandise. Whenspecific goods were purchased, money was used to pay for them. Now, moneyand goods circulations became largely separated. Money and monetary productsbecame merchandise themselves, with an increasing number of derivative trans-actions based on them. The volume of trade in the derivatives markets becameeven 10 times higher the volume in the markets of their underlying assets. Therewere two primary reasons for this effect. First, the development of the derivativesmarket was driven by greed and a chase after profits accompanied by a simulta-neous growing tolerance for risk. Various derivatives with built-in leverage mech-anism were needed, which, though highly risky, were able to deliver high returns.Second, a high supply of cheap money in the economy facilitated asset monetiza-tion, and new derivative products made it possible to trade new asset categoriesin the financial markets. The most spectacular and, as it later turned out, the mostfateful type of asset monetization was the creation of derivatives the value ofwhich was associated with a mortgage portfolio.
4.3. In the Search for the New Paradigm of Finance
Consequences of above mentioned changes in financial institutions, markets, andinstruments demonstrated themselves particularly in the time of the global finan-cial crisis in 2008. In the lieu of those turbulences of extraordinary scale, dynam-ics, and range, a question has been asked if the traditional paradigm of economics– and within it, the neoclassical theory of finance – adequately describe the eco-nomic reality and events occurring in the financial world. Any theory is only asgood as its ability to explain or predict the processes actually taking place.
1 FIA Annual Volume Survey 2007, BIS Quarterly Review 2009.
SYSTEMIC CHANGES IN THE FINANCIAL WORLD 45
l a r c i e r
4.3.1. The Traditional View
The key element of the neoclassical theory of finance is the Efficient MarketHypothesis (EMH) that states that financial markets always efficiently incorpo-rate all available information into asset prices (Fama 1970). The argumentationin favor of the EMH seems quite appealing. In short, it follows like that: Whenall people are rational markets are efficient by definition. When some people areirrational, their behavior is usually uncorrelated and the impact of their trades istoo weak to influence prices. Finally, when sometimes irrational investors behavein a correlated manner (like a herd) and they sometimes have enough of a marketforce to drive the prices away from fundamentals, then active and unlimitedtrades of rational arbitrageurs will countervail and bring the prices back to rightlevels.
The EMH is closely related to two other cornerstones of neoclassical financialeconomics: the Capital Asset Pricing Model (CAPM) developed independently bySharpe (1964), Lintner (1965) and Mossin (1966), and the portfolio theory ofMarkowitz (1952). If market is efficient and all available information is correctlyreflected in asset prices than investors should not expect to achieve in a long termhigher returns than the level justified by the amount of systematic risk. In such acase each investor should hold a well-diversified efficient portfolio – this means acollection of assets that altogether either have a minimum covariance with themarket portfolio (minimum systematic risk) for a given level of expected returnor offer maximal expected return for a given level of systematic risk.
The traditional school of financial economics has one main advantage – It is of anormative character. The key elements of the theory are coherent and allow deriv-ing predictive models that might be tested. It also has one main disadvantage – Ithas been based on many unrealistic assumptions. The building blocks of the tra-ditional finance rely mainly on investors’ rationality (the concept of homo eco-nomicus) and on strength of the self-correcting mechanism of arbitrage (thenotion of perfect market). However, these features are not always confirmed inrealistic market circumstances.
4.3.2. The Behavioral Approach
Behavioral finance is an area within the finance discipline that focuses on inves-tors’ behavior and the decision making process in order to understand anomalouspricing of assets and other puzzling observations taken empirically from capitalmarkets. It has emerged in the response to the difficulties faced by the traditionaltheory in explaining some financial phenomena. In the contrary to the classicalparadigm, behavioral finance assumes that agents may be irrational in their reac-tions to new information and investment decisions. The sources of irrationalityare psychological biases and heuristics of a human mind. It can be difficult for

46 NEW PARADIGMS IN BANKING, FINANCIAL MARKETS AND REGULATION?
l a r c i e r
rational traders to undo the mispricing caused by irrational investors due to exist-ing limits of arbitrage. As a result, markets will not always be efficient and assetpricing may deviate from predictions of traditional market models2.
4.3.2.1. Investor’s Psychology
Psychological sources of irrationality may be categorized in a following way.First, people make mistakes when they perceive information and form theirbeliefs. Extensive evidence shows that individuals are overconfident in their judg-ments (Odean 1998, Barber & Odean 2001). They are typically also overoptimis-tic and see things better than they really are. Sometimes their optimism comesfrom wishful thinking. Generally overconfidence and over-optimism make inves-tors trade too much and too intensively. In the result they take too much undiver-sified risk and lose money on heavy transaction costs. This also may cause marketto overreact to new information. Further, people have problem with representa-tiveness, sample size and understanding the law of return to the mean (Shefrin2000). This leads to difficulties in drawing correct conclusions based on availableinformation. Among other things, it increases the belief in trend continuation orreversal of direction in which prices change. Once people have formed an opin-ion, they often stick to it and inadequately update their beliefs in the lieu of newinformation (Edwards 1968). The initial value may sometimes be even suggestedsubconsciously and still strongly influence the agent’s opinion (so called anchor –Kahneman & Tversky 1974). Conservatism, belief perseverance and anchoringslow down the reaction of the market to new information.
Second important source of irrationality comes from unstable preferences thatmay vary depending on a context in which the alternatives are presented. Logi-cally the same decision problems may be solved differently by the same peoplewhen the situation is described in another way. This contradicts the axioms of thestandard utility theory. Kahneman and Tversky (1979) propose the prospect the-ory in which utility is defined over changes of wealth comparing to a given refer-ence point rather than over final wealth positions. The main finding of the pros-pect theory is that people are risk-averse over gains and risk-seeking over losses.This means that they usually prefer a certain gain than a gamble of the sameexpected value with a chance for much higher win. On the other hand, whenfaced with a choice between a certain loss and a gamble of the same negativeexpected value (that potentially may lead to even a greater loss, but also gives achance to avoid the loss), people usually prefer to take the risk and to gamble.Kahneman and Tversky argue that the sensitivity to losses is greater than thesensitivity to gains. In other words, a loss of 1000 US$ is more painful than the
2 Thaler (1993, 2005) edited two collections of most significant papers in the area of behavioral finance. Booksby Shefrin (2000, 2005), Shleifer (2000), Szyszka (2007, 2009), and Baker & Nofsinger (2010) are also goodsources for readers interested to find out more about the behavioral approach to finance.

SYSTEMIC CHANGES IN THE FINANCIAL WORLD 47
l a r c i e r
satisfaction from a gain of 1000 US$. The prospect theory explains so calleddisposition effect – eagerness of people to sell an asset that has just brought profitand strong reluctance to close a position that has been bringing losses. The dis-position effect may be responsible for market underreaction to new information,particularly for slower reflection of bed news in prices.
Szyszka (2010a) proposes the Generalized Behavioral Model which describeshow aggregate errors in the processing of information signals, aggregate repre-sentativeness errors, and the biases in investor preferences may influence pricesand returns from assets.
Further cause of irrationality often lays in human emotions and moods. Generallypeople who are in good moods are more optimistic in their choices and judgmentsthan those in bad moods. Investors in good moods are ready to accept higher risk.Bad moods are associated with more scrutiny and criticism when evaluating newinformation (Petty, Gleicher & Baker 1991). Shefrin (2000) points at two kindsemotions – greed and fear – that have contradictive influence on investors’ riskapproach and strongly influence the way they construct their investment portfo-lio. Greed pushes people to treat stocks as lottery tickets – they want to win asmuch as possible and as quickly as possible. In the result, they do not diversifyand take risky positions in two-three assets hoping to earn high returns if theirpicks are right. On the other hand, fear is like brakes in a speeding car. It giveslimits to greed. People usually care about the future and are afraid of unexpectednegative events that could dramatically lower the level of their consumption.They tend to hold some proportion of their wealth in very safe assets (cash depos-its or T-bonds) that serve like a security policy (‘just-in-case…’). In other word, acombination of greed and fear leads to wrong diversification of investment port-folios. Investors do not use the Markowitz’s theory and overlook the covariancebetween assets. They isolate mentally the few risky assets and the ‘just-in-case’safe investment they hold.
Finally, social influence and interaction with other people also may cause irra-tional behavior. Investors may make common mistakes in a correlated manner asthe result of their learning process in a society, direct interpersonal communica-tion, influence of social groups in which they live, and – most of all – because ofthe force of media news. People often behave like sheep – they follow each otherlike in a herd. But what is interesting – herding does not always have to be irra-tional. Rational traders may also decide to follow the group if they rationallycalculate that making money ‘on the wave’ is more likely than fighting against theflow of irrational players. Herding leads to a situation when investors concentratemore on predicting what other market participant think than on real informationrelated to a particular security. When investors are pronoun to various fashionsand fads, market quotes may deviate far from fundamental values.

48 NEW PARADIGMS IN BANKING, FINANCIAL MARKETS AND REGULATION?
l a r c i e r
4.3.2.2. Limits to Arbitrage
Behavioral finance does not negate the arbitrage mechanism per se and its price-correcting ability. However, it argues that not every deviation from fundamentalvalue created by actions of irrational traders will be an attractive investmentopportunity for rational arbitrageurs. Even when an asset is widely mispriced,arbitrage strategies designed to correct the mispricing can be risky and costly,rendering them unattractive, and sometimes can be even impossible to conduct atall. As a result, the deviation from fundamental value may remain unchallengedfor a relatively long time.
When arbitrageurs discover an asset that is wrongly priced on a market, they needto find the same asset priced correctly on another market or a perfect substituteof this asset, in order to take opposite arbitrage positions. When they are not ableto do so, they face the fundamental risk – the risk that some new informationcomes to the market and changes the fundamental value of the asset in the unde-sired direction.
Even when arbitrageurs are able to hedge the fundamental risk completely andtake a long position in the asset where it is cheaper and a short position in thesame asset on the other market where it is more expensive, they still face so callednoise traders risk. This is the risk that irrationality on the market may becomestronger and may drive the mispricing to even a greater extent (DeLong Shleifer,Summers & Waldmann 1991, Shleifer & Vishny 1997, Shleifer 2000). As themispricing increases, the gap between long and short positions gets wider andagainst the strategy of rational arbitrageurs. If such a tendency continuous overtime, arbitrageurs – whose investment horizon is usually relatively short and whooften borrow money and securities to put on their trades – may be forced to closetheir positions before the mispricing is corrected. If this is a case, they will sufferlosses.
But a single arbitrageur who spots the mispricing faces not only the noise tradersrisk, but also the risk of synchronization of actions of other rational traders(Abreu & Brunnermeier 2002). Typically a single arbitrageur does not haveenough of market force to correct the mispricing individually. He needs otherarbitrageurs who will follow his strategy. However, he does not know if and howquickly other rational traders notice the same arbitrage opportunity and takeadequate positions. Waiting might be costly and each arbitrageur has a finite timeand cost limits.

SYSTEMIC CHANGES IN THE FINANCIAL WORLD 49
l a r c i e r
4.4. Practical Implications
Behavioral finance changes the way we should look at capital markets. This newapproach has significant consequences not only directly to investors, but also tocorporate finance, market regulators and policy makers.
4.4.1. Implications to Investors
The EMH rules out the possibility of repeatable investment strategies based oncurrently available information that have expected returns in excess of the marketexpected return for a particular level of systematic risk. In other words, an aver-age investor – whenever an individual or professional – should not hope to con-sistently beat the market. In a short term achieving abnormal returns is possible,but only as a simple result of luck, and not due to whatever trading strategy usedor resources spent on analysis. In the light of the EMH the best investment strat-egy is the passive ‘buy & hold’ approach – investors should hold well-diversifiedportfolios, allowing only for the systematic risk in the amount adjusted to a sub-jective degree of risk aversion and expectation of returns. Often changes to theportfolio are not recommended, as active trading only generates transaction costsand cannot help at all to achieve long-term abnormal returns.
Behavioral finance challenges this view, what is a natural consequence of con-fronting the EMH. According to the behavioral approach market is not alwaysefficient and investors who make a better than average use of available informa-tion are able to make abnormal returns. In this light, it might be worth to seekgood investment opportunities and to spend resources on investigation of themispricing that occur from time to time on the market. Active trading strategiesmight be indeed better in some cases than passive ‘buy & hold’. This is a rationalefor various hedge funds, so called opportunity funds, and other active portfoliomanagement. However, active investors should bear in mind that they also maybe a subject of behavioral biases and heuristics. Therefore, achieving higherreturns is possible not only thanks to better analysis and strategies, but alsorequires a better self-control.
Behavioral finance does not rule out completely the utility of traditional analyti-cal tools and pricing methods derived from traditional finance. However, thesemodels should not be treated dogmatically as the only precise way to judge invest-ment choices. In the end, they are only a simplification of complex processesongoing in reality on capital markets. Traditional finance should be seen morelike a theoretical benchmark that needs to be enriched by various aspects of inves-tors’ psychology and human actions. Behavioral market models concentrate onpredicting deviations from traditional models. They focus on investors’ irration-ality and attempt to identify factors responsible for its direction and strength.

50 NEW PARADIGMS IN BANKING, FINANCIAL MARKETS AND REGULATION?
l a r c i e r
When mispricing is noticed investors should ask themselves about the reasons forthe situation and should try to predict its future development. If behavioral anal-ysis indicate a high probability of further increase of irrationality that potentiallymay lead to even a bigger mispricing and at the same time there are limits toarbitrage, than also for a rational investor it might be worth to ‘hop on a train’and to buy assets that according to traditional valuation methods might seemoverpriced. In the lieu of traditional finance such a decision would be irrational,but in the framework of the behavioral approach it is acceptable. It might bringabnormal profits as long as the investor is able to sell these assets for a higherprice before irrationality gets weaker and finally stocks are brought back to fun-damental levels. Obviously such practices of rational speculators do not servewell market efficiency and stabilization.
4.4.2. Consequences to Corporate Finance
If markets are efficient, then the cost of equity is always priced correctly. Currentmarket situation should not influence corporate capital structure. Companiesshould not be extra motivated to make additional equity offerings in a bull mar-ket – when they are potentially overpriced, nor to buy-back their stocks in a bearmarket – when they seem to be undervalued.
Behavioral finance offers a different view. High market valuations are motivationfor increasing equity. Relatively cheap equity often lowers total weighted averagecost of capital (WACC) for the company. This may boost investment, as moreprojects have positive net present value (NPV). In bad times the company willtend not to make new equity offerings. New investment projects will be financedwith a higher leverage or put on hold. More debt will be allowed in the capitalstructure. Low market valuation may also stimulate the company to buy-back itsstocks.
Behavioral approach may help to choose an optimal moment for a new offeringor a buy-back transaction. It is also helpful when planning a takeover of anotherfirm in a public tender offer. Knowledge of investors’ preferences is necessarywhen structuring the transaction and to set the price right. For example, even ifa price in a tender offer is higher than a current market price (takeover premium),but the tender offer takes place after a series of negative returns, the reply to theoffer may not be sufficient. This may happen, because investors are stopped by astrong aversion to losses, if the tender price is set below their reference point thatusually is their buying price.
Psychological aspects are also important when communicating with the market.The way the news is put into words or numbers may influence the strength ofmarket reaction to it. People usually overreact to good information and underre-

SYSTEMIC CHANGES IN THE FINANCIAL WORLD 51
l a r c i e r
act to bad news. They pay more attention to a descriptive report than to statisticalor numeric data. They are sensitive to the context in which the information isgiven. For example, assume that the current firm’s performance is better than lastyear, but worse than earlier forecast and market expectation. News like “Thecurrent profit is higher than the last year’s profit by…” will be definitely betterreceived than the same information formulated “The current profit is lower thanexpected by…”.
Finally, we should not forget that corporate managers may also be a subject tobehavioral biases. Wrong judgment of probability accompanied by overconfi-dence may lead to underestimating risk of an investment project. Particularlystrong and dangerous inclination is associated with so called sunk costs. Decisionmakers are usually unwilling to give up a project that has already consumed a lotof money and effort. Even if it becomes more and more obvious that the projecthas little chance to be profitable, managers are often ready to spend more andmore money on it. They do not want to admit their mistake and attempt to delaythe moment they have to report a loss on the investment. This is similar to thedisposition effect observed among stock market investors. The sunk cost effectand the disposition effect have both their roots in the strong human aversion toaccept final losses.
4.4.3. Consequences to Market Regulators and Policy Makers
Rejection of the efficient market paradigm results in a serious challenges for thosewho are responsible for the market infrastructure and regulations. It clearly turnsout that the self-regulating market mechanism is imperfect and requires properregulations that take into account a possibility of irrational human behavior. Theaim of regulators and policy makers should focus on creation of such conditionsin which behavioral inclinations have minimum impact on asset pricing and themarket behaves as close as possible to the idealistic predictions of the neoclassicaltheory.
First, a wide-scale educational action is needed. Individual investors should betaught about psychological traps, in particular they should be warned about allsorts of manias, fads and other cases of herding. The more investors are awareabout possible sources of price deviation, and the more they search for cases ofmispricing to use them for their own profits, the higher the market efficiency.
Second, the sector of institutional investors should be shaped in the way thataccounts for possible behavioral biases of professional asset managers. Amongother things, there should be incentives for professionals to think more in a long-term perspective, and not only to pay attention to relatively short reporting peri-ods. Window dressing practices should be discouraged by closer evaluation and

52 NEW PARADIGMS IN BANKING, FINANCIAL MARKETS AND REGULATION?
l a r c i e r
audit. Compensation structures should be designed with consideration andshould offer deliberately higher bonuses for being above the average than penal-ties for results below the benchmark. Benchmarks should be set appropriately.
Finally, regulators and policy makers should work hard on minimizing limits toarbitrage, at least in cases where it is reasonable. Support of stocks’ liquidity,unproblematic possibility to short all assets, low borrowing fees and other trans-action costs, easy access to information are among most straightforward postu-lates. Fewer limits to arbitrage both for individuals and professionals enhance theself-regulating market mechanism and reduce the impact of behavioral biases onasset pricing.
4.5. Behavioral Aspects of the Recent Financial Crisis
4.5.1. Greed of Investors and Managers
According to the behavioral portfolio theory (Shefrin & Statman 2000) peopleare guided by two kinds of emotions when investing: fear and greed. Because ofthe fear of drop in consumption below their existing standard of living they areinclined to keep a portion of their savings in very safe securities designed mostlyto preserve the real value of money in time (e.g. treasury bonds). Greed, in turn,arouses hope for a rapid growth in consumption and a fast jump to a higherstandard of living. Because of greed investors fail to properly diversify theirinvestment and accept high often unnecessary risk in hope of gaining high profits,oftentimes betting on investment in selected financial instruments as on lotterynumbers.
During a long-lasting prosperity the fear of a drop in consumption weakens andhence an increasingly small portion of people’s investment is mentally accountedas security for incidental needs. Greed comes forward and it motivates people tomake increasingly risky investment. It seems that greed has been the main drivingfactor of investors’ behaviors at least several years before the financial crisisoccurred. Encouraged by the long-lasting market boom, investors required higherand higher rates of return, oblivious to the risk. At the same time, they exertedpressure on both corporate managers and on investment fund managers demand-ing high profits from them. In turn, both corporate and asset managers adoptedmore and more risky business and financial strategies to meet expectations of theinvestors.
The main instrument that made it possible to ensure returns on equity (ROE) atthe level significantly higher than that resulting from the natural pace of eco-nomic development was to apply the financial leverage to a greater and greaterextent. In the case of corporations this was most frequently reflected in an

SYSTEMIC CHANGES IN THE FINANCIAL WORLD 53
l a r c i e r
increased share of debt in financing of operations, whereas financial assets man-agers increasingly often used derivatives along with traditional credit lines.
The high share of debt in the corporate financing makes it possible to ensurereturn on equity (ROE) significantly exceeding the total return on assets (ROA).Financial risk related to the debt actually increases, but in the times of cheap andcommonly available capital investors seemed not to notice that risk. As the result,high profitability of equity was one of the factors that drove and seemingly fun-damentally justified the high market price of shares.
A similar mechanism was applied by asset managers. Using increasingly complexderivatives, they were getting involved in financial transactions with valuesexceeding multiple times the equity held in management. Because of the financialleverage, the rise in the price of underlying assets by several percentage pointsoften made it possible to obtain the return on investment in derivatives of severaldozen percent. Unfortunately, it was obviously forgotten that this mechanismworks both ways and if the value of underlying assets falls, losses on investmentin derivatives can also be many times higher.
Greed that pushed investors and managers towards riskier and riskier investmentstrategies did not as such directly contribute to the financial crisis whose sourcesshould be sought in the global macroeconomic imbalance, but it rather deter-mined its scale, arising from material leveraging of business operations andinvolvement in derivatives.
4.5.2. Underestimation of Risk
It can be said that greed blinded investors and managers. Risk was often forgottenin the midst of the chase after higher and higher rate of return. Several strongbehavioral inclinations, mostly related to overconfidence were also conducive tounderestimating risk (Szyszka, 2010b). The literature distinguishes between fourgeneral manifestations of overconfidence: above-average effect, calibration effect,illusion of control and unrealistic optimism (Odean 1998, Barber and Odean2001, Glaser and Weber 2003).
Overconfidence is supported by the self-attribution bias which consists in attrib-uting successes (even random ones) to ourselves and our capabilities and explain-ing failures by independent factors, e.g. bad luck, mistakes of others etc. (Taylorand Brown 1988). Lack of objectivity in assessment of successes and failures lim-its our ability to learn from our own mistakes and enables people to permanentlydisplay overconfidence.
Overconfidence and unrealistic optimism were conducive to underestimation ofrisk, particularly that the confirmation bias prevented certain warning signalsthat could have eroded investors’ faith in the never-ending bull market from being

54 NEW PARADIGMS IN BANKING, FINANCIAL MARKETS AND REGULATION?
l a r c i e r
noticed. During the relatively long period of market prosperity investors got usedto easy and high profits. As the result of the self-attribution effect many marketplayers attributed the gained profits primarily to their own skills rather than tothe general market situation. Investment successes intensified their confidenceand encouraged them to take even higher risks.
Extrapolation error consists in attaching too much weight to past trends, partic-ularly those observed during a relatively short period of time and in inadequatelyextending them onto subsequent future periods. An example of the extrapolationerror is assuming the same sales or profits dynamics of a given corporation inlong-term financial forecasts as that observed during the last several reportingperiods, often without consideration for extraordinary events that could haveaffected the sales and profits levels only temporarily during the recent periods. Itshould be remembered that an Excel spreadsheet is only a tool for developmentof forecasts and that it accepts all values of dynamics that are entered into it.Extending a forecast onto several future periods with the assumption of a con-stant high pace of growth may lead to no less than absurd results. Psychologicalgrounds for the extrapolation error are related to the representativeness heuristicand in particular its variation referred to as the short-series bias. It consists inpremature conclusions and generalization of patterns on the grounds of too lim-ited amount of observations (Gilovich, Vallone and Tversky 1985).
During the last bull market period people commonly committed the extrapola-tion error claiming that since the prices had been growing for a long time, thesame trend was expected to continue. A claim was often heard that some types ofinvestment simply could not bring losses. This was e.g. the case of the propertymarket where the prices had been continuously growing for several decades. Thesituation was similar at the last stage of the economic boom in the commoditymarket. Many analysts argued publicly that price rally was justified by the inten-sified demand on the part of the dynamically developing Asian economies andthat a price drop could not be expected in view of the limited worldwideresources.
Underestimation of risk was also fostered by people’s tendency to treat unlikelythings as if they were completely impossible and on the other hand to treat highlyprobable events as if they were to certainly occur. Hence, it was not accepted thatan unfortunate coincidence of several macroeconomic factors may ultimately leadto a sequence of negative events that individually seemed very unlikely. Similarly,the risk of failure of positive developments that were assessed as highly probableand treated almost as a certainty was played down. The reality showed that thecoincidence of such almost impossible situations not only came true but alsoproved to have colossal impact on the entire global economy.

SYSTEMIC CHANGES IN THE FINANCIAL WORLD 55
l a r c i e r
People’s inclination to exclude the possibility of occurrence of unlikely develop-ments and simultaneously to treat highly probable scenarios as certain was empir-ically documented by Fischhoff et al. (1977), and theoretically it was alsoaccounted for in the prospect theory of Kahneman and Tversky (1979).
4.5.3. Herding
At the time of the rapid growth of property prices followed by the price rally inthe stock and commodity markets we were undoubtedly experiencing a specula-tive bubble, significantly affected by herd behavior of market participants. It isknown that herding may occur both among irrational and rational investors(Devenow & Welch 1996, Bikhchandani & Sharma 2000, Hirshleifer & Teoh2003).
During the period of the bull market the irrational players made decisions con-cerning the purchases of specific assets not on the basis of fundamental informa-tion but rather based on observations of earlier increase in prices, and imitatingthe behaviors of others. They would decide to invest, expecting further increasesand ignoring the fact that the assets were already relatively expensive. Their moti-vation and way of thinking could be more or less recreated as follows: the priceof assets goes up because people invest in them. Since others are buying thatmeans that they are certainly assuming that the prices will rise even more and thatprofits can be made. Therefore, it’s worth it to follow the market and join thegame that bets on the continuation of the growth trend. The mechanismdescribed below is referred to in the literature as the so-called feedback trading.
A relatively large group of similarly thinking players triggered the mechanism tostart working as a self-fulfilling prophecy. More and more new investors werejoining the upward spiral, generating yet another demand impulse and raisingprices to new maximum levels. All this was fostered by the growing marketeuphoria and by the media publicizing a spectacular rise in prices and commentsby experts.
Cutler, Poterba and Summers (1990) as well as DeLong, Shleifer, Summers andWaldmann (1990) previously presented feedback trading models describing suchbehavior mechanisms of irrational players. Additionally, DeLong et al. (1990)suggested that rational players can anticipate the presence of feedback tradingamong irrational investors and deliberately destabilize the prices. In other words,by anticipating the behaviors of irrational players rational speculators coulddecide in advance about purchasing a higher number of assets than would bedictated solely on fundamental grounds. Simultaneously, they would hope that inthe future when the herding of irrational investors results in an increasing diver-gence from the true value, they will have enough time to sell the assets with profit.

56 NEW PARADIGMS IN BANKING, FINANCIAL MARKETS AND REGULATION?
l a r c i e r
Very favorable forecasts of analysts and comments of professional market playerswere also not without importance, although it is difficult to judge whether theygave in to the irrational mania or in their own opinion they were acting rationally.For example, Trueman (1994) argues that financial analysts, acting rationally intheir own opinion, may aspire to publish forecasts and recommendations concur-ring with predictions of other analysts.
Even rational professionals may tend to get engaged in herding. Their actionsmay be based on the premises related to the fear of loss of reputation as the resultof making claims that contradict the general market consensus (Sharfstein &Stein 1990), or on specific remuneration or evaluation terms (e.g. bonuses oninflow of new money to the funds under their management, bonus on achievedinvestment results, benchmarking of achieved results).
Generally, a hypothesis may be formulated that during the last bull market pro-fessionals were much more motivated to undertake actions focused on the con-tinuing price growth rather than bet on decreases, even if they might have beenaware of the fact that prices of asset categories exceeded the levels that could bejustified on fundamental grounds.
Finally, it should also be noted that herding resulting in mispricing of assets couldhave also theoretically occurred even if all investors maintained complete ration-ality, as the result of the so-called information cascades (Banerjee 1992, Bikh-chandani, Hirshleifer and Welch 1992). The lesser the amount and precision ofthe information available to the decision-maker or the more complex and difficultjudgments to make, the greater tendency to ignore private signals and to copybehaviors of other players.
Lee (1998) presents a model in which large quantities of cumulated private infor-mation previously blocked as the result of a cascade could suddenly appear in themarket as a reaction to a relatively insignificant event, creating an unexpectedinformation avalanche and leading to sudden price changes. The model, althoughdeveloped a long time ago, seems to fit well with the sudden market breakdownthat followed the burst of the Internet bubble in 2000 and to correctly describethe events that occurred in the markets in 2008.
4.5.4. Limited Rationality and Mistakes of Rating Agencies
During the last several-year period of global prosperity we witnessed a spectacu-lar development of the derivatives market, not only with regard to the increasingvolume of this type of transactions but also the degree of their complexity. Fre-quently, they constituted a complex and less obvious combination of many classicderivatives. At the same time, the clarity of the underlying assets that constitutedbasis for calculation of the derivative’s value was decreasing. Increasingly often,

SYSTEMIC CHANGES IN THE FINANCIAL WORLD 57
l a r c i e r
the value of the derivative depended on a specific industry index with a compli-cated structure and ambiguous rules of inclusion or exclusion of components andtheir weights. Derivatives for which other derivatives acted as underlying assetswere often also created. Securitized mortgage portfolios increasingly often consti-tuted a mixture of different quality debts, very difficult to evaluate by an externalinvestor.
All this led to the situation in which it was not ultimately clear what the potentialpay-off structure was and what factors actually affected its real value. Obviously,the human brain’s perception ability and the ability to process numerous varia-bles is limited. Therefore, even professional investors were forced to apply spe-cific heuristics and simplifications in evaluation of individual financial productsto a greater and greater degree. Many of them unquestioningly accepted recom-mendations and evaluations of rating agencies. It was also common to rely on theinstitutions that construed and defined parameters for yet newer base indexeswhich constituted basis for evaluating derivatives.
The last financial crisis confirmed the failure of rating agencies. They committeda number of mistakes, particularly with regard to the assessment of risk of mort-gage-based financial products. Many of these mistakes might be explained onbehavioral grounds.
By nature, loans drawn to purchase property are long-term liabilities. Meanwhile,to evaluate worthiness of mortgage debt portfolios rating agencies applied statis-tical data based on a relatively short historical sample, often going back onlyseveral or a dozen or so months. While assessing the risk it was wrongly con-cluded that since a small percentage of cases of failure to meet obligations wasrecently observed in a given category of borrowers, the situation was going to besimilar during the entire lending period. It could be said that in that case ratingagencies committed a type of the short-series error.
Rating agencies also believed that major diversification of debt within a givenportfolio could practically eliminate the insolvency risk of an individual bor-rower. A certain analogy to the Markowitz portfolio theory (1952) could befound here. Just like in a well diversified portfolio of stocks it is possible to elim-inate a unique non-systematic risk of an individual asset, also in the case of debtportfolio it was assumed that the possible insolvency of one of several hundredborrowers will not have any material impact on the total value of the specificgroup of mortgages. And hence, CDOs issued on the basis of securitized debtportfolios were assessed as safe and rated high.
At the same time, rating agencies committed a mistake of underestimating thesystematic risk. It was reflected in the fact that a major number of borrowerscould simultaneously, as the result of the same factors, find themselves in finan-

58 NEW PARADIGMS IN BANKING, FINANCIAL MARKETS AND REGULATION?
l a r c i e r
cial trouble and stop paying off their liabilities. When the unexpected system riskfactors affected a relatively numerous group of borrowers, it certainly had animpact on the total value of an even well diversified mortgage portfolio. A coin-cidence of negative events that could materially affect the condition of numerousborrowers and shake the entire system was assessed as very unlikely or simplyimpossible in the minds of many. In that case, rating agencies fell victim to apsychological inclination consisting in treating events that are very unlikely as ifthey were not to take place at all (the previously mentioned non-continuity of theweighing function for low values of probability arguments in the prospect theoryof Kahneman and Tversky 1979).
In their estimations, rating agencies also fell victim to the extrapolation error.This was because even if while assessing the instruments issued on the basis ofdebt portfolios it was assumed that a certain percentage of borrowers could beinsolvent (the estimation of that value was still understated as the result of theabove-mentioned short-series error effect), the final assessment of the portfolioquality still was based on the fact that the debt was secured by mortgages. It wascommonly believed that a mortgage security is highly credible, as property pricescould not go down. Therefore, for the purposes of risk assessment it was assumedthat in the worst case scenario temporary liquidity difficulties may occur if bor-rowers stop making payments (that element was to be eliminated by the debtdiversification) but practically the possibility of the ultimate loss of value of aportion of the debt was not assumed, since in the end it was always possible toreach out to an actual security which seemed to be offered by the mortgage. Theerror of extrapolation of a long-term growth trend contributed to a belief thatproperty prices would not decrease in the future.
4.5.5. Fear as Reason for Excessive Selling and Undervaluation
Fear and greed are two types of emotions that have opposing effects on investors’behavior. Depending on whether fear dominates or greed wins at a given moment,we will respectively observe an increase or decline in risk aversion.
In the times of the bear market it is fear that prevails among the investors. Duringthe initial phase of the crisis fear turned into panic which intensified asset depre-ciation and fueled its extraordinary pace. Later, several sellout waves were fol-lowed by a slowdown in price drops, but the fear among investors with bitterexperiences remained. It caused an inflow of capital to the categories of assetsthat are commonly considered very safe although not high-profit yielding (treas-ury bills and safe bonds, gold) and an outflow of funds from more risky markets,including naturally the stock market. During certain periods, when credibility ofAmerican banks was particularly strained and the market was dominated by thefear of bankruptcy, a particular economic paradox even occurred, whereby yields

SYSTEMIC CHANGES IN THE FINANCIAL WORLD 59
l a r c i e r
for some of the American short-term treasury instruments were indicating nega-tive values. In other words, investors were willing to buy securities guaranteed bythe US Fed even assuming a slight loss only to be able to safely invest their capitalin these assets.
Kahneman and Tversky (1979) theory claims, among others, that decision-mak-ers are specified by risk aversion when they make decisions regarding profits (e.g.whether an asset that has yielded profits since it was purchased should be kept inthe portfolio or sold), whereas with regard to losses (whether an asset whose pricehas dropped since it was purchased should be kept or sold) they tend to showaversion to realize losses, i.e. a tendency to take further risk. The differentapproach to risk with regard to profits and losses combined with the previouslymentioned mental accounting effect, as the result of which, among others, inves-tors mentally account their earned profits and incurred losses separately, isreflected in a higher tendency to keep in the portfolio the assets whose pricesdecreased since they were purchased rather than the stocks which when soldcould generate capital earnings. Shefrin and Statman (1985) called it the disposi-tion effect.
The disposition effect is usually used to explain the existence of short-term con-tinuations of rates of return and the effectiveness of the so-called momentumstrategy (Jegadeesh & Titman 1993, 2002, Grinblatt & Han 2005). In particular,aversion to realize losses may result in periodical limitation of supply and causethe fundamentally bad information to relatively slowly and gradually be reflectedin the asset prices. Under normal circumstances of a relatively stable market theinvestors whose stocks went down would usually hope for the rates to go backup and are willing to wait rather than immediately sell the loss-incurring items.Very often as a consequence the market’s reaction to bad news is spread over timeand the price drops are gentler.
However, it seems that during the last financial crisis the disposition effect gaveway to the panic-driven sellout. This hypothesis has not been precisely verifiedempirically, but it is supported by the scale and pace of quotation drops. Inves-tors’ emotions were dominated by fear and higher risk aversion which promptedthem to get rid of value-losing securities as fast as possible and that added impetusthe drop spiral.
The panic phase was followed by the phase of stagnation, during which fear pre-vented investors from returning to the stock market even though valuations ofnumerous corporations had depreciated and could seem attractive. The secondphase of the bear market witnesses not so much rapid price drops as rather grad-ual further decline of quotations, interrupted from time to time by timid attemptsat bouncing back. The characteristic feature of this phase is the relatively lowvolume of trading. Those investors who managed to wait through the panic

60 NEW PARADIGMS IN BANKING, FINANCIAL MARKETS AND REGULATION?
l a r c i e r
period and do not have to liquidate particular items for liquidity reasons are def-initely less prone to sell stocks at very low prices. Hence, during the second phaseof the bear market the disposition effect comes to prominence again.
4.6. Conclusions and Final Remarks
In the finance literature of last two or even three decades there are many empiricalfindings which are at odds with the traditional perception of the capital market.In response to a growing number of market anomalies, behavioral financeemerged. This relatively new vein of finance delivers highly intuitive and convinc-ing explanations referring to irrational behavior and psychological biases. In thecontext of recent market turbulences it has particularly gained in popularity(Szyszka 2010b). However, there are also doubts if behavioral finance, at least atcurrent stage of development, may fully replace the neoclassical theory and beclaimed as a new theory of capital markets.
Behavioral finance is affected by an ailment typical of relatively young andscarcely penetrated areas of knowledge. That is, a plethora of research carried outin an uncoordinated manner produced fragmentary outcomes that are difficult tocohere into a comprehensive theory. Issues related to investors’ behavior and theway it affects valuation of assets are complex. Thus, researchers face much diffi-culty in specifying all the factors and relationships that describe the phenomenataking place in the capital market. However, limiting attention to selected aspectsof the market leads to behavioral models that appear fragmentary and designedonly to fit selected peculiarities.
Unlike behavioral finance, the complex and coherent neoclassical theory is repletewith mathematical functions and equations that offer predictions of a normativecharacter. This is the main advantage and beauty of well established and neatlydesigned area of knowledge. The major disadvantage comes from many strongassumptions and simplifications that lay at its foundations. Full rationality of allinvestors and no impact of psychological biases on asset prices are among those.
Unrealistic assumptions and simplifications are often unavoidable compromiseon the way to build a formal theoretical model. They do not depreciate the theory,as long as the theory generally describes the reality correctly and it is not empiri-cally overthrown. And, this is where the actual problem of the neoclassical para-digm of finance is. Empirical studies conducted on market data for the periodwhen the keystone elements of the neoclassical theory where designed, that isfrom the end of the 1930s till the end of 1970s, generally did not reveal contra-dictive observations. Models seemed to be quite nicely fitted to the empirical datafrom that period. Empirical findings at odds with the neoclassical theory startedpopping up in the literature in 1980s, and intensify later over last two decades. In

SYSTEMIC CHANGES IN THE FINANCIAL WORLD 61
l a r c i e r
terms of timing, studies on anomalies cover more or less the same period as thesystemic changes discussed in the previous section of this paper.
Therefore, a hypothesis may be formulated that the neoclassical theory offinance lost its credibility (understood as an ability to describe the capital mar-kets reality) due to systemic changes that have happened within institutions,markets, and instruments over the last three decades. The theory should bemodified in line with dynamically changing financial environment. Among keyelements that should be considered are globalization of financial markets,greater significance of institutional investors, including appearance of the newcategory of state controlled investors, higher cross-correlation between variouscategories of assets, monetization of new classes of assets, and increased volatil-ity of almost all economic factors. In other words, the new modified theory offinancial markets should take into account that we live in relatively smallerworld (global village), but the world which at the same time is far more complexand dynamic.
In contemporary circumstances an interdisciplinary approach is needed in thesearch for an adequate theory. The neoclassical paradigm might be seen as anidealized normative benchmark. On the other hand, behavioral finance helpexplain deviations from this benchmark, showing how psychological biases maycause irrational behavior of investors. Behavioral approach is a valuable supple-ment when trying to understand financial markets. However, it would be of agreater usefulness if it allowed not only explain events ex post, but also if it deliv-ered some normative tools for modeling the market and predicting behavior ofinvestors ex ante. Perhaps the theory of finance should be also enriched by otherdisciplines of science than only psychology, for example neuropsychology, sociol-ogy, economic cybernetics, geopolitics. There is a lot to be done. Thanks to inter-disciplinary cooperation of scientist we shall learn more about processes under-going in global financial markets, and hopefully we shall be able to built a newcoherent theory of finance, reflecting the complexity of contemporary state ofaffairs.
References
ABREU, D., BRUNNERMEIER, M., 2002, “Synchronization risk and delayed arbi-trage”, Journal of Financial Economics 66, 2-3, 341-360.
BAKER, H.K., NOFSINGER, J. (eds.), 2010, Behavioral Finance, Hoboken, NJ,John Wiley & Sons.
BANERJEE, A., 1992, “A Simple Model of Herd Behavior”, Quarterly Journal ofEconomics 107, 797-818.

62 NEW PARADIGMS IN BANKING, FINANCIAL MARKETS AND REGULATION?
l a r c i e r
BARBER, B., ODEANN T., 2001, “Boys will be Boys: Gender, Overconfidence, andCommon Stock Investment”, Quarterly Journal of Economics 141, 2, 261-292.
BIKHCHANDANI, S., HIRSHLEIFER, D., WELCH, I., 1992, “A Theory of Fads, Fash-ion, Custom and Cultural Change as Informational Cascades”, Journal ofPolitical Economy 100, 5, 992-1026.
BIKHCHANDANI, S., SHARMAN S., 2000, Herd Behavior in Financial Markets: AReview, Working Paper WP/00/48, International Monetary Fund.
CUTLER, D., POTERBA, J., SUMMERS, L., 1990, “Speculative Dynamics and theRole of Feedback Traders”, American Economic Review 80, 2, 63-68.
DE LONG, B., SHLEIFER, A., SUMMERS, L., WALDMANN, R., 1990, “Positive Feed-back Investment Strategies and Destabilizing Rational Speculation”, Jour-nal of Finance 45, 2, 379-395.
DE LONG, B., SHLEIFER, A., SUMMERS, L., WALDMANN, R., 1991, “The Survivalof Noise Traders in Financial Markets”, Journal of Business 64, 1, 1-19.
DEVENOW, A., WELCH, I., 1996, “Rational herding in financial economics”,European Economic Review 40, 603-615.
EDWARDS, W., 1968, “Conservatism in Human Information Processing” inKLIENMUTZ, B. (ed.), Formal Representation of Human Judgment, NewYork: Wiley, 17-52.
FAMA, E., 1970, “Efficient Capital Markets: A Review of Theory and EmpiricalWork”, Journal of Finance 25, 2, 383-417.
FISCHHOFF, B., SLOVIC, P., LICHTENSTEIN, S., 1977, “Knowing with Certainty:The Appropriateness of Extreme Confidence”, Journal of ExperimentalPsychology 3, 552-564.
GILOVICH, T., VALLONE, R. and TVERSKY, A., 1985, “The Hot Hand in Basket-ball: On the Misperception of Random Sequences”, Cognitive Psychology17, 295-314.
GLASER, M., WEBER, M., 2004, Overconfidence and Trading Volume, AFA 2004San Diego Meetings.
GRINBLATT, M., HAN, B., 2005, “Prospect theory, mental accounting, andmomentum”, Journal of Financial Economics 78, 2, 311-339.
HIRSHLEIFER, D., TEOH, S.W., 2003, “Herd Behavior and Cascading in CapitalMarkets: A Review and Synthesis”, European Financial Management 9, 1,25-66.
JEGADEESH, N., TITMAN, S., 1993, “Returns to Buying Winners and Selling Los-ers: Implications for Stock Market Efficiency”, Journal of Finance 48, 1, 65-91.
JEGADEESH, N., TITMAN, S., 2002, “Cross-Sectional and Time Series Determi-nants of Momentum Returns”, Review of Financial Studies 15, 1, 143-158.

SYSTEMIC CHANGES IN THE FINANCIAL WORLD 63
l a r c i e r
KAHNEMAN, D., TVERSKY, A., 1974, “Judgment Under Uncertainty: Heuristicsand Biases”, Science 185, 1124-1131.
KAHNEMAN, D., TVERSKY, A., 1979, “Prospect Theory: An Analysis of DecisionUnder Risk”, Econometrica 47, 2, 263-292.
LEE, I., 1998, “Market crashes and informational avalanches”, Review of Eco-nomic Studies 65, 741-759.
LINTNER, J., 1965, “Security Prices, Risk and Maximal Gains from Diversifica-tion”, Journal of Finance, December Issue.
MARKOWITZ, H., 1952, “Portfolio Selection”, Journal of Finance 7, 1, 77-91.
MOSSIN, J., 1966, “Equilibrium in a Capital Market”, Econometrica, OctoberIssue.
ODEAN, T., 1998b, “Volume, Volatility, Price, and Profit When All Traders AreAbove Average”, Journal of Finance 53, 6, 1887-1934.
PETTYN, R., GLEICHER, F., BAKER, P., 1991, “Multiple Roles for Affect in Persua-sion” in FORGAS, J. (ed.), Emotion and Social Judgments, Oxford, Perga-mon, pp. 181-200.
SHARPE, W.F., 1964, “Capital Asset Prices: A Theory of Market Equilibrium”,Journal of Finance, September Issue.
SHEFRIN, H., 2000, Beyond Greed and Fear. Understanding Behavioral Financeand the Psychology of Investing, Boston, MA, Harvard Business SchoolPress.
SHARFSTEIN, D., STEIN, J., 1990, “Herd Behavior and Investment”, AmericanEconomic Review 80, 3 465-479.
SHEFRIN, H., 2005, A Behavioral Approach to Asset Pricing, Elsevier AcademicPress.
SHEFRIN, H., STATMAN, M., 1985, “The Disposition to Sell Winners Too Earlyand Ride Losers Too Long: Theory and Evidence”, Journal of Finance 40,3, 777-790.
SHEFRIN, H., STATMAN, M., 2000, “Behavioral Portfolio Theory”, Journal ofFinancial and Quantitative Analysis 2000, 35, 2, 127-151.
SHLEIFER, A., 2000, Inefficient Market. An Introduction to Behavioral Finance,Oxford University Press.
SHLEIFER, A., VISHNY, R., 1997, “The Limits of Arbitrage”, Journal of Finance52, 1, 35-55.
SZYSZKA, A., 2007, A Behavioral Approach to Financial Market. How Psycho-logical Biases Influence Asset Pricing, published in Polish by the PoznanUniversity of Economics Press, available as e-book at www.e-wydawnictwo.eu.

64 NEW PARADIGMS IN BANKING, FINANCIAL MARKETS AND REGULATION?
l a r c i e r
SZYSZKA, A., 2009, Behavioral Finance. A New Approach to Investing in CapitalMarket, published in Polish by the Poznan University of Economics Press.
SZYSZKA, A., 2010a, “Belief and Preference Based Models” in BAKER, H.K. andNOFSINGER, J. (eds.) Behavioral Finance, Hoboken, NJ, John Wiley & Sons.
SZYSZKA, A., 2010b, Behavioral Anatomy of the Financial Crisis, Journal of Cen-trum Cathedra, Vol. III, Issue II.
TAYLOR, S., BROWN, J., 1988, “Illusion and Well-Being: A Social PsychologicalPerspective on Mental Health”, Psychological Bulletin 103, 193-210.
THALER, R., 1993, Advances in Behavioral Finance (ed.), Russell Sage Founda-tion, New York.
THALER, R., 2005, Advances in Behavioral Finance, Vol. II, (ed.), Russell SageFoundation & Princeton University Press.
TRUEMAN, B., 1994, “Analysts Forecasts and Herding Behavior”, Review ofFinancial Studies 7, 97-124.

65
l a r c i e r
5. ON BASEL REGULATION AND BANKS’ INCENTIVES
Rym Ayadi
Abstract
In view of Basel regulation deficiencies and to address the regulatory gaps identi-fied during the financial crisis, the Basel Committee opted for fundamental revi-sions to strengthen global banking regulation and introduced fundamentalchanges under Basel III aimed at aligning bank incentives to regulation. Thispaper provides a critical assessment of the evolution of the Basel Committee role’sand the rules it has produced – the so-called Basel I, Basel II and Basel III over thelast decades, delves into how these rules impacted banks’ incentives and concludeswith some proposals for improvement.
5.1. Introduction
Multi-billion euro losses suffered by the world’s largest and most reputable finan-cial institutions following the 2007 subprime lending crisis and other scandalshave cast doubts on the credibility of banks’ internal governance and risk assess-ment and management systems, the role of credit rating agencies in externallyassessing the risk of complex structured products and the capacity of regulatorsto prevent financial crises. The market turmoil was a response to long-lastingexcess liquidity coupled with flawed internal governance and risk managementand inappropriate incentives, which in combination created a delusion in thefinancial markets that everything was possible. In less than one year, the globalfinancial scene experienced episodes of liquidity dry-ups, disruptions in inter-bank lending, a general loss of confidence in asset-backed securities, bank runs.Facing these serious consequences of ill-considered risk-taking, central banksacross the Atlantic indulgently stepped-in to prevent worse scenarios fromunfolding. Despite heroic central bankers’ actions including maintaining interestrates at their lowest levels, quantitative easing, flooding the markets with liquid-ity facilities etc the global financial and economic disaster was hardly avoided andlarge bail-outs were inevitable.
In a period of protracted turbulence, it is only human nature to seek a ‘culprit’.Although credited with having achieved a certain level of convergence of capitaladequacy across the globe, Basel I adopted in 1988, failed to achieve its chiefpurpose which was to strengthen the capital base of the banking system. In par-ticular it failed to adapt to market developments and, more dangerously, createdperverse incentives and ultimately contributed to the delusions suffered by thefinancial market participants. The use of broad-based risk buckets without taking

66 NEW PARADIGMS IN BANKING, FINANCIAL MARKETS AND REGULATION?
l a r c i e r
account of relative risk, the focus on a single credit risk indicator, outdated treat-ments of securitisation and trading book risks, the zero-risk weight, short-termstand-by credits and the cap on the counterparty-risk weight for swaps and for-ward contracts spawned an army of financial engineers and encouraged many ofthe imprudent practices that are being ruthlessly exposed by an extreme reassess-ment of credit counterparty risk.
Seeking to address the weaknesses of Basel I, the Basel Committee’s sustainedefforts and resources for more than a decade managed in producing the so-called‘Basel II’ Accord which was issued in 1999. Basel II was thought to be an evolu-tionary and flexible approach to banking regulation and supervision, whichwould reflect the rapid progress and sophistication of banking practices and risk-management techniques, including securitisation. It sought to align supervisionand regulation with market developments and to provide incentives for banks tocontinue improving their internal risk-management capabilities and to enhancecorporate governance and disclosure. It was also intended to give supervisors anumber of tools to enable them to react to emerging developments, therebyreducing the regulatory arbitrage opportunities that Basel I created. However,Basel II suffered major weaknesses, which were inherent to its design and hencefailed to address the underlying problems of the 2007 financial crisis. The over-reliance on poorly performing quantitative risk measures provided by externalrating agencies and banks’ internal models, the low levels and poor quality capi-tal, the imbalance and weak interaction between its three pillars and the inherentflaws in the treatment of securitisation and trading book instruments are onlysome of its weaknesses.
The 2007 financial crisis equally revealed that authorities are ill-equipped tomonitor complex and risky activities of large cross-border institutions, not onlydue to insufficient resources and capabilities but also because of lack of relevantinformation about banks, poor information exchange and cooperation in bothstable and crisis situations.
In view of these deficiencies and to address the regulatory gaps identified duringthe financial crisis, international policy makers and regulators have opted for afundamental revision of the Basel II accord to strengthen global banking regula-tion and introduced fundamental changes in Basel III.
This paper provides a critical assessment of the evolution of the Basel Committeerole’s and the rules it has produced – the so-called Basel I, Basel II and Basel IIIover the last decades, delves into how these rules impacted banks’ incentives andconcludes with some proposals for improvement.

ON BASEL REGULATION AND BANKS’ INCENTIVES 67
l a r c i e r
5.2. The Evolving Role of the Basel Committee on Banking Supervision (BCBS)
Created in 1974 by the G-10 central bank governors, the main aim of the BaselCommittee on Banking Supervision (BCBS) has been to serve as an internationalforum for cross-border cooperation on banking supervision. Although the Com-mittee has no formal authority, its proposals and standards have served as theblueprint of banking supervision for the past three decades. The original member-ship base, comprising of industrialized nations, has been expanded substantiallyin 2009 in the aftermath of the financial crisis with the addition of several emerg-ing G-20 economies1. With these additions, the current members of the institu-tion increased to 27 jurisdictions, represented by heads of the national supervi-sory authorities or senior officials2.
Originally, the Committee was established as a club of bank supervisors from thedeveloped G-10 economies to agree on the regulatory and supervisory standardsthat would be applicable for the internationally active banks. By the late 1990s,the BCBS’s role changed from an informal club of supervisors to a global legisla-tor for prudential standards applicable to banks.
In 1997, it developed the “Core Principles for Effective Banking Supervision”,which has become the gold standard on sound banking supervision, incorporatedinto Financial Sector Assessment Program (FSAP) of the IMF and the WorldBank. Perhaps more importantly, BCBS served a vital role in developing the glo-bal capital adequacy standards under the Basel I (1988) and Basel II (2004)Accords. In addition, the BCBS has also addressed topical issues of significantsupervisory interest, including accounting, auditing as well as credit, liquidity,market and operational risks.
The Committee’s first public response to the crisis came in 2008, with the publi-cation of documents outlining the challenges and principles on liquidity risk man-agement3. Although an outcome of a pre-crisis working group established at theend of 2006, the severe funding stresses faced by global banks heightened theimportance of updating and strengthening the global approach to liquidity regu-lation. However, the documents only served to update the BCBS’s 2000 guidelines
1 The original members of the BCBS comprised of the G-10 countries – i.e. Belgium, Canada, France, Germany,Italy, Japan, the Netherlands, Sweden, the United Kingdom, and the United States – plus Luxembourg, Spain,and Switzerland, where the hosting and funding institution, Bank for International Settlements (BIS), is estab-lished. The BIS also provides the secretariat for the BCBS. In 2009, the membership base was more than doubledwith the addition of 14 emerging economies, including Argentina, Australia, Brazil, China, Hong Kong SAR,India, Indonesia, Korea, Mexico, Russia, Saudi Arabia, Singapore, South Africa, and Turkey.
2 The current members include Argentina (since 2009), Australia (2009), Belgium, Brazil (2009), Canada, China(2009), France, Germany, Hong Kong SAR (2009), India (2009), Indonesia (2009), Italy, Japan, Korea (2009),Luxembourg, Mexico (2009), the Netherlands, Russia (2009), Saudi Arabia (2009), Singapore (2009), SouthAfrica (2009), Spain, Sweden, Switzerland, Turkey (2009), the United Kingdom and the United States.
3 The BCBS’s response to liquidity challenges, as posed by the crisis, has culminated into two reports: BCBS (2008a, b).

68 NEW PARADIGMS IN BANKING, FINANCIAL MARKETS AND REGULATION?
l a r c i e r
on liquidity risk management and stopped well short of introducing new stand-ards.
Responding to a mandate for banking sector reforms from G-20 leaders in theSeptember 2009 Pittsburgh Summit, headed most notably by the newly-electedObama Administration, the BCBS developed standards in December 2010, col-lectively referred to as the Basel III Accord4. The new framework supplementedthe capital adequacy standards by requiring banks to hold more loss-absorbingcapital, introducing new capital buffers and leverage ratio requirements andstrengthening the risk coverage of specific securitization, trading and derivativesactivities, counterparty credit, and exposures to central counterparties. In addi-tion, a new global framework for liquidity requirements (i.e. liquidity coverageand net stable funding ratios) and monitoring standards were also put forwardfor the first time. Under the rules, the standards will be phased in relatively grad-ually to allow the banking sector to “move to the higher capital and liquiditystandards while supporting lending to the economy.”5
Since December 2010, the BCBS has also addressed a number of topical issuesrelevant for the framework. To give several notable examples, in close coopera-tion with the Financial Stability Board (FSB), the Committee addressed inNovember 2011 the cross-border externalities created by global systemicallyimportant banks (G-SIBs) by proposing a set of measures for identifying (or‘bucketing’) such institutions and to increase their capital buffers, where neces-sary6. Later, by December 2011, the BCBS published a consultative document onthe capital disclosure requirements to supplement Basel III’s Pillar 3 require-ments, aiming to ensure a minimum level of comparability in capital-relatedinformation between jurisdictions7.
Several issues may be highlighted regarding the changing role of the BCBS overthe years.
First, ever since mid-1990s, the Committee has encouraged and facilitated theformation of groups of regional banking supervisors, including not only emergingcountries but also some offshore jurisdictions. Despite these efforts and the recentenlargement of the Committee’s membership base, the effective role and incen-tives of emerging economies to contribute to global standard-setting remains lim-ited which led to substantial delays in implementation of the global rules. In addi-
4 The Basel III framework is summarized in two documents: BCBS (2010 a, b). Both documents, consultationresults and the quantitative impact studies are available at www.bis.org/bcbs/basel3.htm.
5 Reference from www.bis.org/press/p101216.htm.6 BCBS (2011a).7 Accordingly, the Committee has proposed a uniform disclosure template for capital after 2018, following the
phasing-in period for the specific regulatory adjustments (i.e. goodwill, intangibles, deferred tax assets, etc.) toCommon Equity Tier 1 capital, introduced under Basel III. The proposal also requires institutions to reconcileand map the figures and definitions reported in the template and the original financial reports made availableunder Pillar 3 reporting. Interestingly enough, however, the proposed disclosure requirements fail to specifydisclosure requirements for the risk-weighted assets. For more, see BCBS (2011b).

ON BASEL REGULATION AND BANKS’ INCENTIVES 69
l a r c i e r
tion, the growing level of complexity of the rules (since the publication of Basel II)which is a result of the growing sophistication of the banking practices in thedeveloped nations makes it more difficult to emerging economies to justify theneeds and the investment to implement these rules. According to BCBS’s October2011 monitoring results, five of the newer members (and the US) are behind inthe full implementation of the Basel II standards8. As regards the Basel III frame-work, a draft proposal was only published in the EU9 and is unlikely to be pro-posed in other jurisdictions before later in 2012 and possibly beyond.
Second, the Committee has been often criticized for reaching its decisions behindclosed doors, lacking diversified expert opinion, public involvement, or a criticalapproach incorporating ideas from the legal, economic, finance, and interna-tional relations fields. The measures put forward by the BCBS are ultimatelyagreed by its governing board, or the Group of Central Bank Governors andHeads of Supervision, through consensus. In turn, the BCBS’s secretariat is com-prised of 17 staff members, mostly seconded officers from the 13 original mem-bers, including most notably the Committee’s secretary general. Interestingly, theBCBS may indeed be one of the rare organizations that proposes, rubberstamps,and assists the implementation of legislation worldwide, all at the same time.Furthermore, the lack of transparency may indeed increase the likelihood of reg-ulatory capture and politicization of the global regulatory standards. Indeed, theincreased politicization is evident from the fact that the call for new regulationshad to come from the G-20 and not the BCBS in of itself in the aftermath of therecent crisis.
Third, the lack of external expert opinion and transparency in the early design-phases may contribute to a narrow approach to regulation. For example,although the Committee pushed global standards on capital adequacy require-ments ever since the Basel I Accord in 1988, it has failed to address some of thekey challenges, including liquidity risks, systemic risks, and the absence of reso-lution schemes for international banks. All of these issues remain within the remitof the BCBS and, although some recent headway, especially in liquidity require-ments, the progress up-to-date remains incomplete and too simplistic. For exam-ple, cross-border resolution issues have been partly addressed by a generic set ofgeneral and largely nondescript recommendations10. On systemic risk, the indica-tors used to identify systemically important banks (G-SIBs) rely extensively on
8 According to the October 2011 results of BCBS’s monitoring effort, full implementation of the Basel II frame-work remained incomplete in Argentina, China, Indonesia, Russia, Turkey, and the United States. For more, seethe latest monitoring report at www.bis.org/publ/bcbs203.htm.
9 After the adoption by the European Commission of the Proposal on Capital Requirements Directive and Regu-lation IV.
10 BCBS (2010), Report and Recommendations of the Cross-border Bank Resolution Group, March, available atwww.bis.org/publ/bcbs169.pdf.

70 NEW PARADIGMS IN BANKING, FINANCIAL MARKETS AND REGULATION?
l a r c i e r
size and not on sophisticated measures of inter-connectedness among financialinstitutions.
Fourth, the rules produced by the BCBS are not legally binding; they are simplybest practices that are produced on a consensual basis. Their implementation bythe BCBS members’ countries is voluntary and subject to national and regionalspecificities which dilute the original objective of the BCBS which is to ensuremore convergence on banking regulation world-wide.
In short, due to its limited resources, narrow interests, and lack of authority andtransparency, the BCBS is likely to produce loosely followed guidance on regula-tion. The recent developments clearly warrant a gradual shift to the creation ofglobal institutions with the power to propose and enforce regulations includingall version of Basel independently. The BCBS’s current soft-law, principle-basedapproach is unlikely to produce that result. Instead, the Committee will likely beused increasingly as a political tool, representing the politically-oriented ideals ofits most active members subject to the reluctance and aversion of others. Such aprospect would loosen its credibility and hence the credibility of the rules it pro-duces.
5.3. Basel Capital Requirements as Essential but not Sufficient Regulatory Tool
Two justifications11 are often adduced for regulating banks: the risk of a systemiccrisis12 and the inability of depositors to monitor banks13. Here comes the role ofdeposit insurance and its associated costs since it leads to moral hazard. When itis not fairly priced, deposit insurance gives banks an incentive to increase risk,which they can pursue by increasing the risk of their assets and/or their leverage.This risk-shifting incentive, together with the potential externalities resultingfrom bank failures, has been one of the main justifications for regulating bankcapital14.
11 For other rationales for regulating banks, see Goodhart et al. (1998).12 According to Diamond & Dybvig (1983), a bank’s provision of liquidity services leaves it exposed to runs. For
example, if depositors panic, they may try to withdraw their funds out of fear that other depositors will do sofirst, thus forcing an otherwise sound bank into bankruptcy (witness the recent case of Northern Rock).Furthermore, in an environment of asymmetric information, a bank run may trigger contagion runs, which canculminate in a system failure (Aghion et al., 1999), showing how the failure of one bank may trigger a conta-gious run on other banks in a model with multiple competing banks and an interbank market.
13 Dewatripont & Tirole (1993a, 1993b) propose a rationale for banking regulation – the representation hypoth-esis – that builds on the corporate governance problems created by the separation of ownership from manage-ment and on the inability of depositors to monitor banks. The point of departure of their argument is thatbanks, like most businesses, are subject to moral hazard and adverse selection problems Therefore, it is impor-tant that investors monitor them, but that is an expensive activity and requires, among other things, access toinformation.
14 For an extensive review of the literature, see Santos (2000).
ON BASEL REGULATION AND BANKS’ INCENTIVES 71
l a r c i e r
In the wake of the 2007-08 crisis, another justification to further regulate banksrelates to the implicit guarantee that was heavily enacted through governmentbail outs, enhancing moral hazard and leading to more incentives to risk shifting.
However they may be justified, the central aim of the Basel regulations is torequire banks to hold more capital to absorb any shocks and reduce the likeli-hood of insolvency. Studies have shown that requirements to hold a fixed level ofcapital often leads to ambiguous results and may even harbour more risk-taking.Kahane (1977), Koehn and Santomero (1980), and Kim and Santamero (1988)illustrate that some banks may attempt to offset their losses from higher capitallevels by increasing their portfolio risks. Other studies have shown that fixedcapital requirements may increase or decrease risk, depending on the size and thelevel of capitalization of the bank, (Furlong and Keeley, 1989; Gennotte and Pyle,1991; Calem and Rob, 1999)15. Shrieves and Dahl (1992) use a sample of USbanks in mid-1980s when fixed-capital requirements were in effect. The authorsfind that increasing capital is associated with a greater portfolio risk althoughthere is evidence that the results is partly attributable to the owners’ or managers’private risk preferences and do not arise from binding regulatory requirements.
Faced with both theoretical and empirical support that fixed capital requirementshave might increase bank risks, attention turned in 1980s to risk-sensitive meas-ures, which is one of the key properties of Basel regulations. In an early work,Sharpe (1978) shows that when designed ‘correctly’, risk-sensitive capitalrequirements can reduce bank risks exactly in the way that risk-based insurancepremiums do. Similarly, Rochet (1992) illustrates theoretically that the incentiveto take more risks to counteract the losses from holding greater capital can beaddressed by properly designed risk-sensitive capital requirements.
Turning to empirical studies, Jacques and Nigro (1997) examine whether theintroduction of risk-based standards under the Basel Accord in 1991 had animpact on portfolio risk of US banks. The authors find that significant increasesin capital ratios lead to drops in risk exposures, although once again there arequestions on whether these behavioural changes can be fully attributable to reg-ulatory changes. Aggarwal and Jacques (2001) study the bank-level data from thesame period and to showing that banks responded to the introduction of theprompt corrective action (PCA) provisions by increasing their capital ratios andlowering their portfolio risks16.
15 In a related vein, Diamond and Rajan (2000) argue that although a greater level of capital leads to a less riskyasset portfolio (at least in the short-term) it may reduce the ability of banks to create liquidity and mayencourage banks to liquidate loans sooner, reducing the amount they collect and their ability to fulfill theirdeposit obligations.
16 Using the option pricing framework, Furlong (1988) and others find little evidence that the introduction ofBasel I rules have led to increased risk-taking, although these results are put to question as the studies make noattempt to control for other reasons that might have cause risk-taking to differ, (Stolz, 2002).

72 NEW PARADIGMS IN BANKING, FINANCIAL MARKETS AND REGULATION?
l a r c i e r
In practice, bank prudential supervisors, who are responsible for financial stabil-ity, have the important task of ensuring that banks (notably systemic and too bigto fail banks) maintain an adequate fixed cushion of capital (Box 1) and liquiditythat takes account of the potential for risk assessment and management failures,particularly during times of stress. So far, minimum capital requirements are amajor (only) tool for maintaining an adequate cushion to absorb losses thatwould otherwise cause the failure of a bank. However, although a minimum levelof capital was maintained over years, history has shown the grim reality of thebanking industry tainted with worldwide failures and fiascos17 arising from dif-ferent sources of risks and heavy exposures to risky portfolios coupled with riskmismanagement.
Among the risks that a bank must manage adequately, credit risk18 is fundamen-tally important particularly when a bank focuses on traditional retail and corpo-rate activities. Moreover, a bank must manage market risk19 when it deals withsecurities and bonds in its balance sheet, operational risk20 when it relies heavily
17 In 1995 the UK’s oldest merchant bank, Barings, also known as the ‘Queen’s bank’, went bankrupt as a resultof the embezzling actions of a single trader based at a small office in Singapore and the incapacity of the risk-management team to avoid the worst consequences. In 2007-08, several highly reputed global and regionalbanks suffered hefty write-downs and losses due to inconsiderate exposures to the US subprime market andrelated poor risk management, control and governance.
Box 1. What is capital in a regulatory context?
In the regulatory context and according to BCBS (1988), capital is defined on a two-tiered basis:– Tier 1 capital (or core capital) includes stock issues (shareholders’ equity) and dis-
closed reserves. Disclosed reserves can take the form of loan-loss reserves set asideto cushion future losses and smooth out income volatility;
– Tier 2 capital (or supplementary capital) includes perpetual securities, unrealisedgains on investment securities, hybrid capital instruments (e.g. mandatory convert-ibles), long-term subordinated debt with maturities greater than five years and hid-den reserves, such as excess allowance for losses on loans and leases. The total oftier 2 capital is limited to a maximum of 100% of the total of tier 1 capital.
The 1995 framework (BCBS, 1995) also provided – at the discretion of national super-visors – for a third tier of capital consisting of short-term unsecured subordinated debtsthat can only be used for meeting market-risk capital requirements.The BIS press release of October 1998 provided stringent conditions for the inclusionof innovative capital instruments in tier 1 capital. These instruments will be limited toa maximum of 15% of tier 1 capital.
Source: BCBS (1988, 1995, 1998 (press release)).
18 Credit risk is the risk of loss due to the failure of the counterparties to meet their obligations as stated in a loancontract.
19 Market risk is the risk of loss owing to a change in market prices, such as equity prices, interest or exchange rates.20 Operational risk is the risk of loss resulting from inadequate or failed internal processes, persons or IT systems,
or from external events.

ON BASEL REGULATION AND BANKS’ INCENTIVES 73
l a r c i e r
on information technology and human resources, liquidity risk21 (market andfunding22) when it relies on the market to secure funding of its operations, con-centration risk23 when it deals with large exposures and other types of risk24 suchas counterparty credit risk25, reputation risk, business risk, interest rates risk,pricing and correlation26 risks due to flaws in modelling and data collection andsystemic risk when banks are of systemic importance and thus pose serious threatto financial stability when they are mismanaged. The interaction between theserisks is very important as well in the overall risk measurement and managementframework of a bank.
A bank that manages some of these risks is required to hold capital, to manageits liquidity, to limit its leverage and to provide a buffer against unexpected losses.The retention of sufficient capital decreases the likelihood of a bank becominginsolvent and reduces the negative impact of bank failure through its loss absorp-tion capacity and ensures increased public confidence. It is important to noticethough that holding capital does not eliminate the probability of failure. Highcapital adequacy ratios do in themselves not guarantee the bank’s soundness, par-ticularly if all types of risks have not been adequately measured and managed atan individual and wide-firm level27, or the risks being taken are not fully identi-fied28 or the bank is misgoverned29.
21 Liquidity risk is a risk of not maintaining or generating sufficient cash resources to meet payment obligationsin full as they fall due, or can only do so at materially disadvantageous terms.
22 The recent episode of Northern Rock revealed the importance of managing liquidity risk, which is not takeninto consideration under Basel I.
23 Concentration risk is the risk when an exposure has the potential to produce losses large enough to threaten afinancial institution’s health or ability to maintain its core operations.
24 The management of a number of these risks proved to be rather weak during the market turmoil that began in2007. See BCBS (2008).
25 As mentioned by BCBS (2008), counterparty risk measurement has always acknowledged a concern with so-called ‘wrong way’ exposures, namely, those exposures that are likely to be largest precisely when the counter-party’s creditworthiness is lowest.
26 Correlation risk exists in many credit risk transfer (CRT) products, such as CDOs (collaterised debt obligation).These are structured based on assumptions about the degree of diversification of an underlying portfolio. Anestimate of the correlation of defaults among the exposures in the portfolio is a key input into a model used todesign, value or risk-manage CDOs. The statistical concept of correlation refers to the average co-movement oftwo assets or prices over time. But often what matters for the performance of more senior CDO tranches is theworst-case co-movement, because that generates the largest losses in the underlying portfolio. This is especiallytrue for the senior part of the CRT capital structure, which only suffers a loss when the losses in the underlyingportfolio are very large. This difference between average and worst-case correlation can be difficult to incorpo-rate into models and difficult for market participants to understand. It is important to mention that for ABSCDOs, the correlation parameters in the rating agencies’ models were not derived from any empirical data, dueto the short data history available on the default history of the underlying subprime residential mortgage-backed security (RMBS). For more discussion on the sensitivity of senior tranches of ABS CDOs to correlated,economy-wide shocks, see BCBS (2008).
27 In the case of Northern Rock, the bank was apparently solvent but a poor liquidity risk management wasexacerbated by market liquidity dry-ups, which triggered the bank run and in order to avoid a subsequentfailure, the bank was nationalised.
28 As recognised by the Committee on Market Best Practices of the Institute of International Finance (IIF, 2008),certain risk management practices and methodologies failed to identify the real risk profile of structured finan-cial instruments.
29 In this respect, supervisors should consider a bank’s capital adequacy in the context of a broader set of factors,including a bank’s corporate governance. The BCBS (1999) clearly recognised the importance of a sound corpo-rate governance system as a condition for a well functioning banking supervision. In 2006, the Committeepublished an updated guidance paper (BCBS, 2006), containing eight clear principles for a sound corporategovernance framework.
74 NEW PARADIGMS IN BANKING, FINANCIAL MARKETS AND REGULATION?
l a r c i e r
The 2007 financial crisis30 showed that many banks and securities firms seem-ingly operating well above minimum regulatory requirements entered in seriousdistress because of lousy risk assessment and measurement and governance sys-tems, leading to a wave of write-downs, unexpected losses, share prices plungesand ultimately bail-outs with tax payers’ money. The bottom line is that regula-tory ‘good quality’ capital is an important factor of a bank’s general conditionand a sound signal to financial markets but it is not the only one. Therefore, ifwell designed, the minimum capital requirements provide one essential prudentialregulatory instrument that could be efficiently used as a defence line in case ofdistress. Holding capital31 (whatever its level and quality of capital instruments)without a comprehensive and integrated risk assessment and management frame-work at the institution-wide level, without an appropriate management of lever-age, without an adequate and ethical corporate governance rules at all levels ofthe organisation and without a credible threat from the market and supervisorsmay not be sufficient and may still expose a bank to a failure with all subsequentcosts to the tax-payers and the economy.
Basel I was the first step forward in capital regulation. However, this frameworkhas proved to be too simple to address all types of risks and the inherent complex-ities of large banks’ activities, particularly securitisation. In addition, the defini-tion of capital adopted by then (Box 1) was simply too lax as the loss absorptioncapacity of some capital instruments in Tier 2 is weaker than the capital instru-ment in Tier 1. As a partial response to the limitations of Basel I, the Basel Com-mittee on Banking Supervision (the Committee) released a more updated Accord(the so-called Basel II) in 2004 that reflects the changes in the structure and prac-tices of banking and financial markets, by giving more flexibility to banks tocompute their risk weighted assets (RWA), by either using external ratings or theirown internal models, without amending the definition of capital. Soon after, thefinancial crisis hit global financial markets and confirmed the inherent flaws inthe original and the updated framework. However, the Basel Committee contin-ued to fall short against the expectations to seriously address the major weak-nesses of the framework amidst the global political pressure that followed themajor trillions’ banks bails outs.
30 Triggered by a sharp loss in the value of subprime mortgages and related mortgage-backed securities and thedeterioration of investors’ appetite during the summer of 2007. For more extensive discussion on the factorsunderlying the market turmoil, see FSF (2008).
31 When looking at the history of banking capital ratios in the US over the past 100 years, the ratio of equity toassets has fallen remarkably. In 1840, equity funded over 50% of banks’ assets, after which the ratio fell fairlysteadily for about 100 years until it settled in the 6% to 8% range from the mid-1940s until today. The aggre-gate equity/asset ratio rose from 6.21% at the end of 1989 to 8.01% at the end of 1993, an increase of almost30% in four years due to combined effects of various US regulatory actions including Basel I. See Berger et al.(1995) for a more extensive discussion on the role of capital in financial institutions. Nowadays, capital ratiosonly account for certain types of risks (particularly credit risk), which is necessarily the reflection of modernbanking activities.
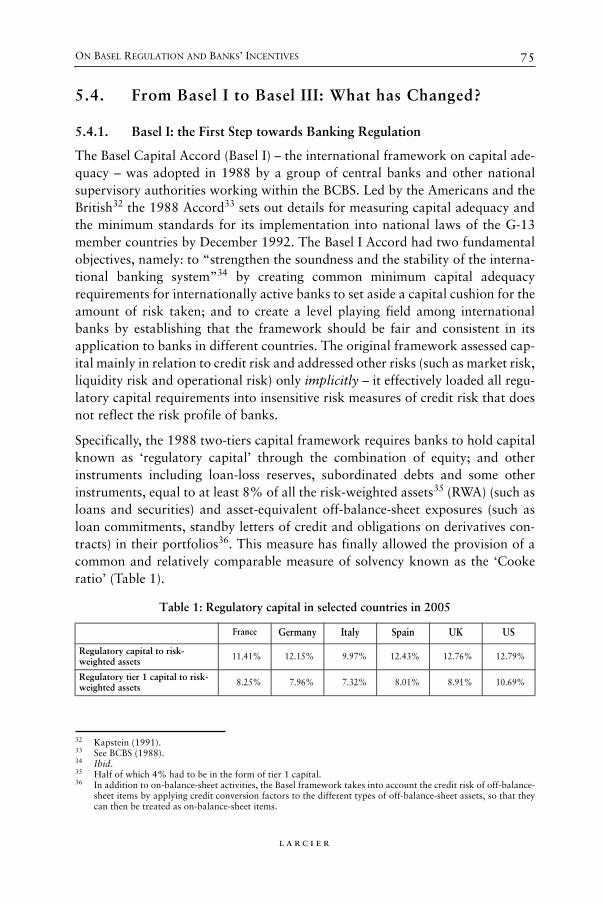
ON BASEL REGULATION AND BANKS’ INCENTIVES 75
l a r c i e r
5.4. From Basel I to Basel III: What has Changed?
5.4.1. Basel I: the First Step towards Banking Regulation
The Basel Capital Accord (Basel I) – the international framework on capital ade-quacy – was adopted in 1988 by a group of central banks and other nationalsupervisory authorities working within the BCBS. Led by the Americans and theBritish32 the 1988 Accord33 sets out details for measuring capital adequacy andthe minimum standards for its implementation into national laws of the G-13member countries by December 1992. The Basel I Accord had two fundamentalobjectives, namely: to “strengthen the soundness and the stability of the interna-tional banking system”34 by creating common minimum capital adequacyrequirements for internationally active banks to set aside a capital cushion for theamount of risk taken; and to create a level playing field among internationalbanks by establishing that the framework should be fair and consistent in itsapplication to banks in different countries. The original framework assessed cap-ital mainly in relation to credit risk and addressed other risks (such as market risk,liquidity risk and operational risk) only implicitly – it effectively loaded all regu-latory capital requirements into insensitive risk measures of credit risk that doesnot reflect the risk profile of banks.
Specifically, the 1988 two-tiers capital framework requires banks to hold capitalknown as ‘regulatory capital’ through the combination of equity; and otherinstruments including loan-loss reserves, subordinated debts and some otherinstruments, equal to at least 8% of all the risk-weighted assets35 (RWA) (such asloans and securities) and asset-equivalent off-balance-sheet exposures (such asloan commitments, standby letters of credit and obligations on derivatives con-tracts) in their portfolios36. This measure has finally allowed the provision of acommon and relatively comparable measure of solvency known as the ‘Cookeratio’ (Table 1).
32 Kapstein (1991).33 See BCBS (1988).34 Ibid.35 Half of which 4% had to be in the form of tier 1 capital.36 In addition to on-balance-sheet activities, the Basel framework takes into account the credit risk of off-balance-
sheet items by applying credit conversion factors to the different types of off-balance-sheet assets, so that theycan then be treated as on-balance-sheet items.
Table 1: Regulatory capital in selected countries in 2005
France Germany Italy Spain UK US
Regulatory capital to risk-weighted assets 11.41% 12.15% 9.97% 12.43% 12.76% 12.79%
Regulatory tier 1 capital to risk-weighted assets 8.25% 7.96% 7.32% 8.01% 8.91% 10.69%

76 NEW PARADIGMS IN BANKING, FINANCIAL MARKETS AND REGULATION?
l a r c i e r
The assignment of risk weights is based on the perceived credit quality of anindividual obligor and each off-balance-sheet exposure is converted to its equiv-alent amount of asset and then weighted accordingly. Four broad categories ofcapital charges are set by the Basel I Accord following six months of consultationwith the banking industry: a) government exposures with OECD countriesreceive 0% credit-risk capital charges; b) OECD banks and non-OECD govern-ments receive a 1.6% capital charge (which corresponds to a risk weight of 20%);c) mortgages receive a 4% capital charge (which corresponds to a risk weight of50%) and; d) other remaining exposures such as those to other banks and allcorporates including SMEs receive a capital charge of 8% (which corresponds toa risk weight of 100%). Later on, the 1996 amendment37 to the Basel CapitalAccord extended the initial requirement to include risk-based capital adequacyfor market risk in the trading books of the banks with very low amount ofrequired capital.
Basel I had indirectly guided international banks to allocate financial resources.Banks were given clear and powerful incentives to invest in government securities(zero to very low risk charges), no matter what could be the real risk profile ofthese exposures and were more encouraged to be exposed to the mortgage marketthan to the SME and unrated corporate segment. These regulatory treatmentshave initiated the wrong incentives and sowed the seeds to larger future problemsin the mortgage market in the US and in sovereign debt market in Europe.
Over time, the inherently-flawed Basel I succumbed to market developments andits growing sophistication and complexity. Dangerously it has created perverseregulatory incentives to move exposures off the balance sheet and excessive useof derivatives to avoid the capital charges on credit risk.
The ‘over’ simplified and partial approach inherent in its architecture onlyaccounted for credit risk, while omitting voluntarily many other risks that aremore important in today’s banking business. For credit risk, the use of only fourbroad credit risk-weighting categories for capital charges does not provideenough granularity in the measurement or distinction of different levels of creditrisk and other risks embedded in banking portfolios, especially to address theactivities of the most complex organisations. This limited differentiation amongdegrees of risks means that calculated capital ratios are often uninformative andmay provide misleading information about a bank’s capital adequacy relative toits real risk profile. The limited differentiation among degrees of risks, createdincentives for banks to engage in ‘gaming’ through regulatory arbitrage providedby asset securitisation and other innovative financial vehicles including creditderivatives (credit derivatives swaps, collateralised debt, loan, notes obligationsand alike). The general idea behind these new instruments is to allow banks to
37 BCBS (1996).

ON BASEL REGULATION AND BANKS’ INCENTIVES 77
l a r c i e r
trade their credit risk exposures in order to transfer the risk to other financialactors in the market38. In other words, thanks to these new instruments, bankstend to trade exposures for whatever regulatory capital requirement is higherthan what the market requires. As an example, residential mortgages are types ofassets that banks securitised in large volume because they believe the requiredregulatory capital would be greater than economic capital39. As a consequence,asset securitisation has rendered the 1988 Accord’s minimum capital require-ments ineffective as a tool to maintain adequate regulatory capital against the realrisk taken. Through asset securitisation, banks have been able to significantlylower their credit risk-based capital requirements without reducing the actualcredit risk embedded in their banking portfolios, as the recent crisis in the creditderivatives market has demonstrated.
5.4.2. Basel II and Basel III: Does a Flexible and Sophisticated Approach to Banking Regulation Regulate Banks’ Incentives
Since 1998, the BCBS has been engaged in a revision process of the 1988 CapitalAccord in an extensive consultation process with the banking industry from 2001to June 2004 when the new Basel Capital Accord (Basel II) was formally released.The implementation of the new Accord has been gradual and probably too lateto enable an informed assessment of its effectiveness during the crisis. In January2007, European banks applied the simpler standardized approaches and in Janu-ary 2008, the rest applied the more advanced. US banks instead did not applyBasel II.
Basel II introduced an evolutionary, more flexible and more complex risk-sensi-tive approach to banking regulation and supervision, which reflects a response tothe weaknesses of the Basel I Accord and the rapid progress and sophistication ofbanking practices and risk-management techniques. It significantly refines theframework’s risk sensitivity by avoiding cross-subsidisation and thus requiringhigher (lower) levels of capital for high-risk (low-risk) borrowers according to theexternal risk inputs from external rating agencies or from the inputs of banks’internal models. It also allows for the treatment of risk mitigation techniques andsecuritisation which have been in use by banks over the past years. In addition,the updated framework provides ruled for market disclosure and therefore sup-ports market discipline and finally it offered guidance on the supervisory reviewof banks’ risk assessment and management practices. The new aspects introducedby Basel II are structured around three mutually reinforcing pillars (diagrammedin Figure 1):
38 See Ayadi & Behr (2008).39 An economic capital framework allows banking institutions to derive a return on equity objective into indi-
vidual transaction decisions through risk-based pricing. Risk-based pricing can be a key competitive differenti-ator.

78 NEW PARADIGMS IN BANKING, FINANCIAL MARKETS AND REGULATION?
l a r c i e r
– Pillar 1: minimum capital requirements.– Pillar 2: supervisory review.– Pillar 3: market discipline.
The computation of the minimum supervisory capital under the first Pillar isbased on the simple sum of the capital requirements originating from: 1) creditrisk, 2) market risk and 3) operational risk (see Box 2). Such approach assumesa linear and static nature of risk, which makes it largely flawed and subject toserious contention.
To estimate the minimum required capital, a variety of approaches are availableto banks. These include the standardized, in which risk charges are chiefly pro-vided by external credit ratings agencies and the internal rating based (IRB) pro-duced internally by banks, are available for banks. The standardised approachprovides simplicity to banks which do not have the necessary risk measurementand management capacities to qualify for the advanced approaches. These banksthus rely on risk charges provided by external rating agencies to compute theirrisk weighted assets. Operating under this approach weakens banks’ incentives to
Figure 1: An overview of the new Basel framework
Box 2. The capital ratio under Basel II
Regulatory capital (definition unchanged) = Minimum required capital ratio (8%minimum unchanged)Risk-weighted assets (measure revised) *
*Credit risk exposure (measure revised) + market risk exposure (measure unchanged) + operationalrisk exposure (explicit measure added)
Pillar I Minimum
capital requirements
Basel II Framework
Pillar IISupervisory
review process
Pillar IIIMarket
discipline
Risk- weighted assets
Operational risk
Own funds
Credit risk
Market risk
Core capital Supplementarycapital
Standardisedapproach
Internal models
approach
Standardised approach
Advanced approach
Basic indicator approach
Internal ratings- based
approach
Standardised approach
Foundation IRB
Advanced IRB

ON BASEL REGULATION AND BANKS’ INCENTIVES 79
l a r c i e r
upgrade their risk measurement and management systems and therefore creates a‘second-best’ tier of banks whose risk is not managed at its optimum level. Thisapproach delivers partial risk sensitivity only if all corporates are rated40 and iftheir ratings properly reflect their risk profiles. Unrated corporates are expectedto face the same risk charges as in the Basel I Accord. Therefore there is a strongexpectation that highly risky exposures will be better off in terms of capitalcharges when they are simply unrated. In an extreme-case scenario, banks optingfor this ‘somewhat adverse’ behaviour would be inclined to specialise in highlyrisky portfolios. In addition, if their business models coincide with the ‘originateand distribute’ model type, then a widespread market impact will be a repetitionof the 2007 financial turmoil. This perverse incentive may be overcome byenhancing the incentives to broaden ratings to un-rated companies. Importantlyon the demand side, since unrated companies incur a lower risk weight than com-panies rated B and below, using the standardised approach may create negativeincentives for risky companies to prefer forgoing ratings to obtain cheaperfinance41. Such behaviour may be encouraged by the emergence of private ratingassessment services providers, which perform confidential ratings for companieswithout committing to make the results public. This creates an incentive to shoparound for better ratings.
Similar to the standardised approach, the IRB approaches42 distinguish betweenasset classes (sovereign, bank, corporate43, retail44 and equity exposures) towhich different supervisory risk weight functions apply. If a bank chooses (and isallowed by the national supervisor) to create its own rating system (instead ofdepending on external agencies), the capital against each credit exposure will bea function of four basic risk parameters: the probability of default45 (PD), the loss
40 Small- and medium-sized enterprises are generally not rated.41 Ayadi & Resti (2004) and Danielson et al. (2001).42 The IRB approaches are derived from the academic work of Gordy (2003) on credit risk modeling. Its theo-
retical basis is the asymptotic single risk factor (ASRF) model of credit risk. According to this model, defaultoccurs when a borrower’s assets do not cover its debt. The corresponding measure of credit risk within acertain time frame (commonly set at one year, also in Basel II) is the probability of default (PD). The ASRFmodel implies that it does not take into account borrowers’ idiosyncratic risks, i.e. risks that can be diversifiedin the bank’s loan portfolio. Instead, the model measures the marginal risk contribution of an exposure that itwould add to an already well diversified portfolio. In this respect the IRB approach differs from models thatsome banks apply internally which measure a loan’s risk contribution to a bank’s actual portfolio, inclusive ofa potential additional diversification effect achieved by adding an exposure to this specific borrower (the‘credit risk portfolio model’). The IRB approach therefore contains a deliberate simplification compared withthe most advanced techniques currently applied. This simplification allows for a model that is standardisedand can be applied uniformly to banks of different sizes and portfolio compositions. The horizon of the riskassessment is set at one year. The IRB model also assumes a 99.9% confidence level. For more details, see Resti(2002).
43 Broken down into exposures to small- and medium-sized enterprises, specialised lending, purchased receivablesand other corporate exposures.
44 Broken down into residential mortgage loans, qualifying revolving credit exposures, purchased receivables andother retail including loans to small businesses.
45 The default probability for a borrower over a one-year period. It is also known as the expected defaultfrequency. A starting point of the measurement of PD is the definition of default. In general, the default eventarises from the non-payment of principal or interest. It is commonly admitted that default occurs if payment ispast due 90 days. These types of loans are characterised as ‘non-performing’.

80 NEW PARADIGMS IN BANKING, FINANCIAL MARKETS AND REGULATION?
l a r c i e r
given default46 (LGD), the exposure at default47 (EAD) and the remaining matu-rity of the exposure48 (m) of the credit portfolio to which the exposure belongs.The expected loss is a simple multiplication of (PD*LGD*EAD). In conjunctionwith the maturity estimate of the exposure (m) and the diversification coefficient(rho), these risk parameters are used to determine capital for both economic cap-ital and Basel II regulatory capital models. Risk weights and thus capital require-ments would be determined by a combination of a bank providing the quantita-tive inputs and the supervisor providing the formulas (the risk weight functions).As designed by the BCBS, the treatment of retail portfolio is more favourable thanthat of large corporate borrowers49. There are two IRB approaches: the founda-tion and the advanced. The difference between the two is that the former wouldrequire the bank only to determine each loan’s probability of default and thesupervisor would provide the other risk inputs; under the latter, the bank woulddetermine all the risk parameters internally, based on estimations and proceduresvalidated by the supervisor. In principle, both the foundation and the advancedIRB approaches are available for all asset classes, with the exception of the retailclass where the advanced IRB is available. The choice of operating under eitherof the two approaches would in theory require meeting minimum qualifying cri-teria based on the comprehensiveness and integrity of the banks’ internal capabil-ities for assessing the risk inputs relevant for each approach. It is important tonote that the use of internal banking models to assess credit risk exposures,although seemingly powerful tools, in some instances may have suffered fromoverly optimistic assumptions. In addition, banks have incentives to operate withminimum capital to satisfy the shareholder value creation constraint. Therefore,internal models maybe designed to satisfy such constraint, which make them lessreliable to compute the minimum required regulatory capital.
Although Basel II is an improved version of Basel I, many weaknesses persist.These range from the imbalance and weak interaction between its pillars50 to theflaws in the treatment of several technical aspects which will be later addressedin Basel III. Most importantly, in its first pillar, Basel II relies on a silo approachfor assessing and managing three types of risks (credit, market and operational),while using a flawed definition of capital and very low equity levels; does notaddress excessive leverage and liquidity management at all and heavily relies onexternal ratings by rating agencies that were largely criticized during the crisis
46 The expected amount of loss on a facility provided to the borrower when s/he defaults. To determine LGD, abank must be able to identify the borrowers who defaulted, the exposures outstanding at the time of defaultand the amount and timing of repayments ultimately received. In addition, private information on the borrowerand the availability of collateral could serve to develop the LGD estimates.
47 The amount the borrower owes at the time of default. The EAD is the sum of the current utilisation expressedas a percentage of the total commitment and the loan equivalent, which is the additional utilisation as apercentage of the unused commitment.
48 Which raises the possibility that the original probability of default needs to be revised and possibly increased.49 For a more extensive discussion on the impact of Basel II on SME portfolios, see Ayadi & Resti (2004).50 See Ayadi (2008).

ON BASEL REGULATION AND BANKS’ INCENTIVES 81
l a r c i e r
and banks’ internal models which in best case scenario use optimistic risk andcorrelation assumptions to fit into the minimum capital required. The Basel IIapproach maybe an improvement when compared to Basel I but it was not suffi-cient to respond to the reality of complex banking institutions that deal with avariety of other risks including the ones that initiated the crisis.
In 2008, during the tipping point of the financial crisis, the most powerful bank-ing lobby, the Institute of International Finance (IIF, 2008) recognised the need tofurther integrate risk management systems, breaking down silos that may resultin missed issues across credit, market and operational risks. Equally, in anotherreport published in March 2008 on risk management practices in the aftermathof the 2007 financial crisis, the Senior Supervisors Group51 recognised the neces-sity to be armed with a comprehensive approach to viewing firm-wide exposuresand risk. In the same line of thinking, the FSF (2008) underscored the importanceof Pillar 2 in strengthening banks’ risk assessment and management practices.
The financial crisis has urged international regulators to upgrade their regulatorytools to aspire for a better regulation of the banking sector in the future, in whatwas called Basel III. However, the main concern, as will be explained in whatfollows is the loss of momentum after the decision of the Basel Committee to optfor a transition period until 2019 for the implementation of the rules.
To strengthen the capital framework globally, international regulators within theBasel Committee agreed to raise the minimum and quality of capital instrumentto ensure that they fully absorb losses and do not expose tax payers’ money anylonger. The minimum common equity requirement will be increased from 2% to4.5% progressively until January 2019. In addition, banks will be required tohold a capital conservation buffer of 0.625% in 2016 up to 2.5% in 2019 towithstand future periods of stress. This will bring the total common equityrequirements from 3.5% in 2013 to 7% in 2019. As for trading, derivatives, andsecuritizations activities, a new capital requirement will be introduced at the endof 2011. These capital requirements will be supplemented by a non-risk-basedleverage ratio that will serve as a backstop to the risk-based measures. A mini-mum Tier 1 leverage ratio will be tested during the parallel run period. In addi-tion, a liquidity coverage ratio (LCR) will be introduced on 1 January 2015 andthe net stable funding ratio (NSFR) will move to a minimum standard by 1 Jan-uary 2018.
Notwithstanding the efforts by the Basel Committee to improve the quality ofcapital (key in the design of the regulatory capital ratio), the consideration of theleverage and liquidity ratios to complement the risk-sensitive minimum capitalrequirements, the length of the transition period watered down these upgrades.
51 From France, Germany, Switzerland, the UK and the US.

82 NEW PARADIGMS IN BANKING, FINANCIAL MARKETS AND REGULATION?
l a r c i e r
This long transition period was the result of the banking industry’s efforts to thesechanges that would certainly lead to some fundamental changes in their businessmodels.
5.5. What are the Unresolved Flaws of Basel Regulations
Amidst the crisis, there has been no discussion to rethink the fundamental flawsin the calculation of the Basel II capital ratio – notably the Risk Weighted Asset(RWA) concept. Indeed, because of the inherent flaws of the Basel II design, theRWA can easily be optimised particularly when major banking risks are not con-sidered and their interaction is not counted in the formulas used and when prob-abilities of default and loss given default are static measures and do not accountfor the swings in the cycle. By construction, the risk concept used is a static oneand does not move along with the economic cycle and therefore does not giveincentives for banks to re-price risk when economic conditions are improving (ordeteriorating).
Furthermore, banks are companies where control and ownership are separated inmost of the cases and where agency problems are common. Banks’ CEOs arerequired to maximize the value to the shareholders’, while being compliant withnational regulation. Since they also tend to be engaged in empire building (eitherthrough maximizing their executive compensation and/or political leverage),CEOs’ may have more incentives to serve the interests of the shareholders bytaking more risk for the amount of capital they allocate for regulatory purposes.In other terms, a rational behavior of CEOs of shareholder’s value banks is tomaximize returns and to minimize equity or both (See Table 2, p. 83).
When giving more flexibility to banks to measure their capital requirements ratio(own funds/RWA) using their internal models and comply with a minimum of 8%set by the regulators, there is a high probability that they opt to minimize thecalculation of RWA by getting the recognition to use lax assumptions on theiroverall exposures and maximize own funds by getting recognition of innovativehybrid capital instruments.
This hypothesis has been confirmed in an empirical study on the European bank-ing sector by Ayadi et al. (2011) confirming the need to revisit the use of RWA.
This incentive which is a direct consequence of the design of Basel II results in anacute regulatory arbitrage that may not be avoided albeit the application ofBasel III.

ON BASEL REGULATION AND BANKS’ INCENTIVES 83
l a r c i e r
5.6. Basel Regulation, Incentives and Role of Pillars 2 and 3
Most of the theoretical literature describes capital regulations as a system of ex-ante enforcement in which compliance is exogenous. Several recent papers havechallenged this approach by considering banks that weigh the costs and benefitsof complying. Milne (2002) argues that banks’ risk-taking behaviour can becurbed by toughening regulatory penalties rather than using more stringent cap-ital requirements. Estrella (2004), on the other hand, considers the role of anumber of regulatory tools. The author finds that neither the voluntary disclosurenor the capital requirements can alone be successful in aligning the interests of thebanks with those of the regulator. Moreover, heavy sanctions are unlikely to workbecause they are unlikely to be deemed credible, since the regulator’s ability toimpose such penalties on potentially failing institutions is likely to be very limited.Lastly, both capital regulations and voluntary disclosure rules need to be supple-mented by financial supervision and market discipline in order to achieve ex-postefficiency gains, providing justification for the supervisory review process (Pil-lar 2) and market discipline (Pillar 3).
Considering the menu of approaches to capital requirements under Basel II,Repullo and Suarez (2004) analyze the implications of the reform on loan pricing.The authors find that the low risk banks will tend to favour the internal ratingsbased (IRB) approach, which allows banks to compute their own charges usingtheir risk models. In turn, higher risk banks will favour standardized approach,which refines the Basel I rules by applying the external ratings, whenever possi-ble. The introduction of the IRB approach allows banks to separate themselvesaccording to their risk preferences and provide loan pricing benefits to low riskfirms. The authors highlight, however, that their results rest crucially on theirability and willingness to truthfully report the underlying risks, which highlightsthe importance of the supervisory review process (Pillar 2) of Basel II.
In view of these results, banking regulation must be viewed as an integrated riskgovernance, management and assessment framework. In this respect, Pillar 2
Table 2: Tier 1 and Equity/assets of top banks before and during the crisis
Tier 1 ratio of top banks (%) Equity/Assets (%)
2008 2007 2006 2005 2008 2007 2006 2005
BELGIUM 11.5% 8.8% 9.5% 9.4% 2.9% 4.0% 3.2% 3.1%
ICELAND 9.4% 11.3% 10.2% 1.8% 6.1% 7.3% 7.4%
IRELAND 8.8% 8.1% 8.4% 7.9% 2.2% 3.5% 3.6% 2.9%
NETHERLANDS 9.7% 9.8% 8.9% 9.8% 2.9% 3.8% 3.1% 3.2%
UK 6.8% 7.5% 7.5% 6.9% 1.8% 3.0% 3.3% 3.4%
USA 8.4% 8.2% 8.4% 8.2% 8.0% 8.7% 8.8% 9.1%
CANADA 9.5% 9.6% 10.4% 10.0% 4.2% 4.1% 4.4% 4.4%
84 NEW PARADIGMS IN BANKING, FINANCIAL MARKETS AND REGULATION?
l a r c i e r
must play the leading role in prompting banks to govern risk on an integratedbasis and at all organisational levels with a systematic oversight by the seniormanagement and the board and to constantly develop, refine and make better useof risk-measurement and management techniques. Pillar 1 should be viewed ascomplementing Pillar 2 to achieve effective supervision. Several indicators shouldbe looked at under Pillar 1, including the Basel II risk sensitive ratio, a liquiditycushion and a leverage ratio.
The policy move in Europe to enable supervisory authorities to impose capitalsanctions on financial institutions when remuneration policies are not in line witheffective risk management is one step in the right direction. Not only should awell designed remuneration package discourage excessive risk taking and be inline with long term objective of the firm, but also payment of bonuses should bedeferred or clawed back. Capital sanctions must be undertaken on the basis ofclear, harmonised and enforceable criteria.
In Europe, full implementation of Pillar 2 at a bank level will ensure an effectivecapital adequacy, leverage and liquidity assessment and may avoid capital add-onrequirements and possible sanctions that can be arbitrary and risk insensitive.Such threat is an additional incentive for banks to establish a coherent risk gov-ernance, assessment and measurement framework that takes into account the‘real’ risk profile of the institution.
Supervisors must run stress tests regularly and make the results available to themarket. Relevant elements of the supervisory review process must be disclosed tothe market to discipline banks. Towards this end, international regulators shouldrethink – in view of strengthening – the contents and role of and the interactionbetween the 3 Pillars (See Figure 2). Today the interaction between Pillar 2 and 3is non existent and largely ineffective. In this vein, it is essential to establish anintegrated regulatory approach to risk governance in line with internal modernrisk management and measurement techniques that foster better overall institu-tion-wide risk pricing and transparency, a clearly defined interaction between thefinancial institution and its supervisors (including a system of rewards and sanc-tions), and a proper and effective disclosure for market discipline purposes (suchas credible and annual stress tests.
The interaction between the financial institution and its supervisors must be builton clearly defined principles based on a sound corporate governance system inwhich risk measurement and management are key and in which implementationcan be easily monitored. To achieve this objective, supervisors should be armedwith adequate capabilities and sufficient resources and tools to cope with thechallenge. Needless to say that for Pillar 2 to work effectively, a full convergenceof supervisory practices is essential. Moreover, solutions contemplating increas-ing the resources of regulators will have to be prioritized. Today, supervisory

ON BASEL REGULATION AND BANKS’ INCENTIVES 85
l a r c i e r
authorities face an important challenge to efficiently monitor complex activitiesof banking institutions. First, they are expected to build a substantial body ofquantitative and qualitative expertise and to work closely with banks (with aparticular focus on systemic banks). In practice, this will translate into the effi-cient use of larger human and technical resources in place. Second, they have toapply a clear and consistent approach on prudential measures resulting in capitaladd-ons. Third, they have to establish a mechanism for timely cooperation andexchange of information in both favourable and adverse market conditions.
Finally under Pillar 3, market discipline has to be viewed as an important mech-anism to induce banks to assess and manage effectively their risks and to maintainsufficient levels of capital accordingly. Effective market discipline requires notonly that relevant information is available to investors but also that it is possibleto use this information to discipline institutions. Disclosing specific aspects of thesupervisory review process, such as stress tests results, capital add-ons, counter-cyclical requirements may be considered to achieve this purpose.
References
AGGARWAL, R. and JACQUES, K.T., 2001, “The Impact of FDICIA and PromptCorrective Action on Bank Capital and Risk: Estimates Using a Simultane-ous Equations Model”, Journal of Banking and Finance, Vol. 25, No. 6,pp. 1139-1160.
Risk
Governance Remuneration policies
Board responsibility….
Pillar 2
Pillar 1
Supervisory
Review Remuneration policies,
Stress tests
Capital Add-ons
Counter cyclical
requirements
Minimum
capital
requirements (RWA)
Leverage Ratio
Liquidity Cushion
Pillar 3

86 NEW PARADIGMS IN BANKING, FINANCIAL MARKETS AND REGULATION?
l a r c i e r
AGHION, P., BOLTON, P. and DEWATRIPONT, M., 1999, “Contagious Bank Fail-ures”, Mimeo, University College London.
AYADI, R. and RESTI, A., 2004, The New Basel Capital Accord and the Future ofthe European Financial System, CEPS Taskforce Report No. 51, CEPS,Brussels, April.
AYADI, R. and BEHR, P., 2008, “On the required regulatory support for creditderivatives” in L. ANDERLONI (ed.), Financial Innovation in Retail and Cor-porate Banking, Cheltenham, Edward Elgar Publishing Ltd. (forthcoming).
AYADI, R., ARBAK, E. and DE GROEN, W.P., 2011, Business Models in EuropeanBanking: A pre- and post-crisis screening, Brussels, Centre for EuropeanPolicy Studies (CEPS).
BCBS, 1995, Planned supplement to the capital accord to incorporate marketrisks, BCBS, Basel, April.
BCBS, 1996, Amendment of the Capital Accord to incorporate market risks,BCBS, January.
BCBS, 2004, International convergence of capital measurement and capitalstandards, BCBS, Basel, June.
BCBS, 2006, Enhancing corporate governance for banking organisations, BCBS,Basel, February.
BCBS, 2008c, Credit risk transfer – Developments from 2005 to 2007, Consult-ative Document, Joint Forum, BCBS, Basel, April.
BCBS, 1988, International convergence of capital measurement and capitalstandards, BCBS, Basel, July.
BCBS, 1998, “Instruments eligible for inclusion in Tier 1 capital”, BIS, Basel, 27October (retrieved from: www.bis.org/press/p981027.htm).
BCBS, 1999, Enhancing corporate governance for banking organisations, BCBS,Basel, September.
BCBS, 2008a, Liquidity Risk: Management and Supervisory Challenges, Febru-ary (www.bis.org/publ/bcbs136.pdf).
BCBS, 2008b, Principles for Sound Liquidity Risk Management and Supervision,September, Basel, Switzerland, (www.bis.org/publ/bcbs144.pdf).
BCBS, 2010a, Basel III: A global regulatory framework for more resilient banksand banking systems, December, which was further revised on July 2011.
BCBS, 2010b, Basel III: International framework for liquidity risk measurement,standards and monitoring, December, available at www.bis.org/bcbs/basel3.htm.
BCBS, 2011a, Global systemically important banks: assessment methodologyand the additional loss absorbency requirement, November, available atwww.bis.org/publ/bcbs207.pdf.

ON BASEL REGULATION AND BANKS’ INCENTIVES 87
l a r c i e r
BCBS, 2011b, Consultative Document: Definition of capital disclosure require-ments, December, Basel, Switzerland, www.bis.org/publ/bcbs212.pdf.
BENSTON, G.J., EISENBEIS, R.A., HORVITZ, P.M., KANE, E.J. and KAUFMAN,G.G., 1986, Perspectives on Safe and Sound Banking, Cambridge, MA,MIT Press, p. xiii.
BERGER, A.N., HERRING, R.J. and SZEGO, G.P., 1995, “The role of capital infinancial institutions”, Journal of Banking and Finance, Vol. 19, Nos. 3-4,pp. 393-430.
BRYANT, J., 1980, “A Model of Reserves, Bank Runs, and Deposit Insurance”,Journal of Banking and Finance, Vol. 4, No. 4, pp. 335-44.
CALEM, P. and ROB, R., 1999, “The Impact of Capital-Based Regulation on BankRisk-Taking”, Journal of Financial Intermediation, Vol. 8, No. 4, pp. 317-352.
DANIELSON, J., EMBRECHTS, P., GOODHART, C., KEATING, C., MUENNICH, F.,RENAULT, O. and SONG SHIN, H., 2001, An academic response to Basel II,Special Paper No. 130, Financial Market Group, London School of Eco-nomics, May.
DEWATRIPONT, M. and TIROLE, J., 1993a, The Prudential Regulation of Banks,Cambridge, MA, MIT Press.
DEWATRIPONT, M. and TIROLE, J., 1993b, “Efficient Governance Structure:Implications for Banking Regulation” in C. MAYER and X. VIVES (eds.),Capital Markets and Financial Intermediation, Cambridge, MA, CambridgeUniversity Press, pp. 12-35.
DIAMOND, D.W., 1984, “Financial Intermediation and Delegated Monitoring”,Review of Financial Studies, Vol. 51, No. 3, pp. 393-414.
DIAMOND, D.W. and DYBVIG, P.H., 1983, “Bank Runs, Deposit Insurance andLiquidity”, Journal of Political Economy, Vol. 91, No. 3, pp. 401-19.
DIAMOND, D.W. and RAJAN, R.G., 2000, “A Theory of Bank Capital”, Journalof Finance, Vol. 55, No. 6, pp. 2431-2465.
ESTRELLA, A., 2004, “Bank Capital and Risk: Is Voluntary Disclosure Enough?”,Journal of Financial Services Research, Vol. 26, No. 2, pp. 145-160.
EUROPEAN CENTRAL BANK (ECB), 2005, The new Basel Capital framework andits implementation in the European Union, Occasional Paper No. 42, ECB,Frankfurt, December.
FINANCIAL STABILITY FORUM (FSF), 2008, Report of the financial forum onenhancing market and institutional resilience, FSF, Basel, April.
FURLONG, F.T., 1988, “Changes in Bank Risk-Taking”, Federal Reserve Bank ofSan Francisco Economic Review, No. 2, pp. 45-56.
FURLONG, F.T. and M.C. KEELEY (1989), “Capital regulation and bank risk-tak-ing: A note”, Journal of Banking and Finance, Vol. 13, No. 6, pp. 883-891.

88 NEW PARADIGMS IN BANKING, FINANCIAL MARKETS AND REGULATION?
l a r c i e r
GENNOTTE, G. and PYLE, D., 1991, “Capital Controls and Bank Risk”, Journalof Banking and Finance, Vol. 15, No. 4-5, pp. 805-824.
GOODHART, C., HARTMANN, P., LLEWELLYN, D., ROJAS-SUÁREZ, L. and WEIS-BROD, S., 1998, Financial Regulation: Why, how, and where now?, NewYork, NY, Routledge.
INSTITUTE OF INTERNATIONAL FINANCE (IIF), 2008, Final Report of the IIF Com-mittee on Market Best Practices: Principles of Conduct and Best PracticeRecommendations, IIF, Washington, July.
INTERNATIONAL MONETARY FUND (IMF) (2007), Coordinated CompilationExercise for Financial Soundness Indicators, IMF, Washington (retrievedfrom www.imf.org/external/np/sta/fsi/eng/cce/index.htm).
JACQUES, K. and NIGRO, P., 1997, “Risk-Based Capital, Portfolio Risk, and BankCapital: A Simultaneous Equations Approach”, Journal of Economics andBusiness, Vol. 49, No. 6, pp. 533-547.
KAHANE, Y., 1977, “Capital adequacy and the regulation of financial intermedi-aries”, Journal of Banking and Finance, Vol. 1, No. 2, pp. 207-218.
KAPSTEIN, E.B., 1991, Supervising International Banks: Origins and Implicationsof the Basle Accord, Essays in International Finance, 185. Princeton, N.J.:Department of Economics, Princeton University.
KIM, D. and SANTOMERO, A.M., 1988, “Risk in Banking and Capital Regula-tion”, Journal of Finance, Vol. 43, No. 5, pp. 1219-1233.
KOEHN, M. and SANTOMERO, A.M., 1980, “Regulation of Bank Capital andPortfolio Risk”, Journal of Finance, Vol. 35, No. 5, pp. 1235-1244.
MILNE, A., 2002, “Bank Capital Regulation as an Incentive Mechanism: Impli-cations for Portfolio Choice”, Journal of Banking and Finance, Vol. 26,No. 1, pp. 1-23.
REPULLO, R. and SUAREZ, J., 2008, “The Procyclical Effects of Basel II”, CEPRDiscussion Papers, No. 6862.
RESTI, A., 2002, The New Basel Capital Accord: Structure, Possible Changes,Micro- and Macroeconomic Effects, CEPS Research Report No. 30, CEPS,Brussels, September.
ROCHET, J.-C., 1992, “Capital Requirements and the Behaviour of CommercialBanks”, European Economic Review, Vol. 36, No. 5, pp. 1137-1170.
SANTOS, J.A.C., 2000, Bank capital regulation in contemporary banking theory:A review of the literature, BIS Working Paper No. 90, BIS, Basel, September.
SENIOR SUPERVISORS GROUP (SSG), 2008, Observations on Risk ManagementPractices during the Recent Market Turbulence, SSG, Basel, March.
SHARPE, W.F., 1978, “Bank Capital Adequacy, Deposit Insurance and SecurityValues”, Journal of Financial and Quantitative Analysis, Vol. 13, No. 4,pp. 701-718.

ON BASEL REGULATION AND BANKS’ INCENTIVES 89
l a r c i e r
SHRIEVES, R.E. and DAHL, D., 1992, “The Relationship between Risk and Capi-tal in Commercial Banks”, Journal of Banking and Finance, Vol. 16, No. 2,pp. 439-457.
STOLZ, S.M., 2002, “The Relationship between Bank Capital, Risk-Taking, andCapital Regulation: A Review of the Literature”, Kiel Working Papers,No. 1105


91
l a r c i e r
6. PERFECT MODELS, FALLIBLE HUMANS?
Frank De Jonghe
Mathematical models of financial phenomena, either for valuation or for riskmodeling purposes, have certainly received some criticism after the recent finan-cial crisis. The presumed omnipotence of mathematical models and the cost andeffort needed to arrive at the results, often made that the qualitative analysis andprofessional judgement were neglected. Model results sometimes reigned unchal-lenged. Fortunately, this is no longer the case. To cite just one source, the deLarosière report1 stated in 2009 that “Future rules will have to be better comple-mented by more reliance on judgement, instead of being exclusively based oninternal risk models”. The purpose of this paper is not to contribute to the theo-retical discussions as to the applicability of models to get a grip on specific finan-cial processes. Many papers and books have already been written on that subject.The aim is rather to give a testimonial of the common practices of model devel-opment and usage, in both the banking and insurance industry, based on theauthor’s experience as advisor to the industry. As such, it is to be classified as‘anecdotal evidence’. After commenting on the current reality of the practical useof models, we briefly touch upon the inherent limitations of human beings indealing with probabilistic phenomena.
It is currently common to prudential regulation in both banking and insurance,that financial institutions have the option to use so-called internal models todetermine their regulatory capital requirements. In exchange for this freedom, theregulation of course imposes several criteria that should together provide comforton the results of those internal models. One can think in this context of dataquality requirements, a system of governance by which institutions decide to usea model, the use test (to show that the models used actually serve to make busi-ness decisions), and a formal approval process by the institution’s supervisor.
One other requirement is that these internal models are subjected to a validationprocess by a team of persons that are independent from the model developers.While this regulatory requirement originated in the models used for regulatorycapital requirements, which both under Basel II(I) and Solvency II would becalled Pillar I models, the regulatory scope of model validation is expanding. Forexample, the recent BIS/IOSCO paper on Financial Market Infrastructures [FMI]also imposes model validation, and regulators regularly ask for validation proce-dures on economic capital (Pillar II, ICAAP or ORSA) models as well. Given the
1 The High-Level Group on Financial Supervision in the EU, Chaired by Jacques de Larosière, Report, Brussels,25 February 2009.

92 NEW PARADIGMS IN BANKING, FINANCIAL MARKETS AND REGULATION?
l a r c i e r
challenge and cost of maintaining in an institution two equally skilled teams ofmodeling experts that can act in full independence of each other, the scope of themodel validation teams is in practice still often limited to these Pillar I internalmodels. However, most practitioners would agree that in principle, these valida-tion processes would deserve to be applied to all other types of models that arebeing used in financial institutions, such as pricing models of client products,valuation models of complex financial instruments, algorithmic trading modelsamong others.
6.1. Perfecting Models through Model Validation
Recently published Solvency II Level 2 regulation, CEIOPS (2009), defines8 areas of model development and use that should be covered by the model vali-dation process. These are: data, model documentation, methods used, the IT sys-tems on which the model is implemented, the assumptions in the model, themodel governance, the role of expert judgement and the use test. We now zoomin and comment on each of these domains, providing our personal interpretationof what exactly falls in each of these categories as we go along.
6.1.1. The Use of Data in Models
By data, we roughly mean all data that directly or indirectly feed the model. Thiscan be the contractual information on a portfolio of mortgages or insurance pol-icies, the contractual properties of financial instruments in a trading book, busi-ness volume data feeding an operational risk model, data on the behavior of cli-ents (for instance prepayment on mortgages or the reactivity of deposits withrespect to changes in interest rates), historical time series of market prices fromwhich volatilities and correlations are determined, external loss data for opera-tional risk etc. The last few are examples of data that is in itself input for analysesto determine assumptions of the model, e.g. on how deposit stability is incorpo-rated, what yield curve to use, etc.
The objective is of course that the data that feed the model should be current,accurate and complete. Any translation of legal contracts into standardized char-acteristics that are amenable to mathematical modeling, will involve some levelof simplification. One area of specific risk in this respect are all sorts of explicitor implicit options that for instance retail customers may have (e.g. guaranteedreturns and profit sharing in investment like insurance products, prepayment inmortgages, etc.). Another aspect is that, even with current computer processingpower, exposure data may need to be aggregated or simplified in order to keepthe throughput time of the calculation acceptable. Choices made in this domain,are particularly time consuming to assess in a validation process, e.g. through the

PERFECT MODELS, FALLIBLE HUMANS? 93
l a r c i e r
review of a sample of contracts. Sometimes it may even be impossible to objec-tively challenge the approach due to prohibitive costs related to getting other dataor differently aggregated data from the source systems.
Data may be missing in the source systems, or may clearly be erroneous, such thatbefore starting the model calculations, data is cleaned and enriched. Even ifaccording to best practices, the changes/improvements to the data are madereversible by keeping a full audit trail, there is an important risk that the commonsense correction rules in fact introduce a bias in the results of the model. Forexample, in Stahl et al. (2007), it is demonstrated that in a credit scoring modelfor low default portfolios, different common sense rules to complete missing data,could lead to credit ratings that differed not just one but several notches.
From an operational and process point of view, the following issues are frequentlyobserved in the context of data. It is important to have a single version of thetruth of the data within the organisation. In particular with the growing need fordata by the risk departments, unclear ownership of the data (e.g. the risk or thefinance department) leads to duplicate data sets and reconciliation problemsdownstream in the reporting flows. Secondly, multiple legacy systems lead notonly to an explosion of the IT costs for unlocking the data, but they also oftenpresent organisations with inconsistent definitions for the same data element inthe different systems. The way to handle these problems is by formalising datadefinitions and structures in a data model embedded in a robust data governancestructure. This is a non-trivial undertaking, that currently many insurance com-panies are going through, under the impetus of Solvency II.
6.1.2. Model Documentation
Model documentation should contribute to the mitigation of at least two risksthat the use of models entails. The first is the key-person risk, both at the level ofthe development of the model and its daily operation. This means that the docu-mentation should be such that if the model developers are not available, a knowl-edgeable third party should be able to run the model, or, if need be, rebuild it ona different technological platform using the documentation. The second is the riskthat business users and management use the model for an unintended purposedue to insufficient understanding of the strengths and the weaknesses of themodel. This implies that there are at least three levels of documentation requiredwhich are, in no particular order: 1) a detailed documentation of the mathemat-ical aspects of the model, including numerical procedures, 2) a qualitativedescription of the model and its underlying assumptions, including an overviewof the limitations (of use) of the model, and 3) an operational procedure settingout how to run the model on which data on a step by step basis.

94 NEW PARADIGMS IN BANKING, FINANCIAL MARKETS AND REGULATION?
l a r c i e r
It goes without saying that maintaining a high quality set of model documenta-tion along the above lines, for an ever expanding scope of models, represents asignificant administrative burden, also on the human resources side. Overall,there is a trend towards improving quality of the documentation in the financialservices industry over the past years, although very few standards or market bestpractices are available. Since regulation mostly expects companies to have an asgood understanding of vendor models as of entirely in-house developed models,vendors are improving documentation as enabler for selling their product, despitelegitimate concerns over intellectual property.
6.1.3. Methodology
This pertains to the mathematical procedures and approaches at the heart of themodel. Overall, standard theoretical concepts are often taken for granted, eventhough their widespread use may be more driven by mathematical tractability(e.g. normal distributions), than by their power to describe real world phenom-ena. A recent example is the almost universal use of correlations in portfoliocredit models, even though this parameter is not really observable. Model valida-tion is probably contributing to, if not reinforcing, this herding behavior in mod-eling, since the references to academic literature, evidence of peer group practicesand the relevant regulatory requirements are the three most obvious referencepoints for the model validator when accepting a model’s mathematical approach.A further contribution to this model herding comes from vendor models, that area de facto incorporation of market practice. For example, most vendor economicscenario generators (ESG) for life insurance modeling have over the last few yearprogressed from one factor models, to two-factor models, leading to peer grouppressure, sometimes enhanced by regulators, on all insurance undertakings withan in-house ESG to also go down this road.
For the individual modeler and model validator, in particular when working inthe domain of capital models, the range of mathematical theories and capitalmarket practices that needs to be mastered, is enormous. She needs to know allthe implications for the discounting in the models of the recent developments inthe money markets with the appearance of basis spreads, up to the characteristicsof different copulas and how to choose the one that is best suited for the applica-tion at hand and to calibrate it in a relevant way. The modeler must have a goodunderstanding of the different products being offered by the company to its cli-ents, and must have a firm grasp of how implicit options and client behaviour canimpact the company’s exposure. And given that a lot of the modeling is based onnumerical simulations, good knowledge of numerical and coding procedures isnecessary. Finally, to really make an impact, the modeler should not just be anextremely good technician, but also a gifted communicator who can help man-

PERFECT MODELS, FALLIBLE HUMANS? 95
l a r c i e r
agement understand the strengths and limitations of the models in layman terms,to ensure that the models are used for the purpose they were designed for.
When one has such extremely talented modelers the designing and implementingof sophisticated mathematical models risks becoming a goal in itself. Resourcesare sometimes spent on refining the model, increasing its precision (roughlyspeaking, the number of meaningful digits in the outcome) while losing sight ofsome structural simplifications and assumptions made in the early stages of themodel design that make the model biased and inaccurate (think of a bent needlein an speedometer, the precision stays, but the result is no longer accurate). Hav-ing a constructive and open dialogue between the business users, who master theunderlying phenomena being modeled, and the technical experts putting all thisinto model structures, should provide some mitigation to this risk. After all, asthe financial crisis has shown, during many crucial weekends, there was only timefor order of magnitude estimates of values and expected losses, and many dra-matic decisions were out of necessity based on such simple analyses.
Combining the difficulties of the modeling itself, with the challenge of getting theright data for the models, often within the context of short reporting cycles,makes that sometimes time is lacking to reflect on the weaknesses of the modelsand their limitations, and to ask the basic question on whether intuitively andbased on knowledge of the exposures, the result can be grasped qualitatively.Moreover, there is of course always the risk that after working for months on aparticular model, the developer loses the capacity to objectively assess the endresult.
A small remark concerning numerical procedures is also in order. Most of themodels rely on statistical procedures, either to compute averages of distributionslike in risk neutral derivative pricing, or to estimate percentiles of distributionsfor example from histograms. All such calculations are subject to numerical esti-mation errors, that are function of the complexity of the phenomenon being mod-eled. It would be best scientific practice to always determine the estimation error,and to incorporate it in the decision process based on the model’s outcome. Onlya minority of financial institutions are doing this in a systematic way.
All these are obviously arguments reinforcing the need for appropriate modelvalidation procedures, even if not required from a regulatory perspective.
6.1.4. Systems & IT
Even if from a mathematical and academic perspective the model is appropriateand correct, things can still go wrong upon its implementation in IT tools andsystems. The source of error can be multiple. For instance, the designer of themodel is not necessarily the same as the person who actually programs it, and a

96 NEW PARADIGMS IN BANKING, FINANCIAL MARKETS AND REGULATION?
l a r c i e r
misinterpretation of the model as defined in the business specifications takesplace. Libraries providing for standard numerical procedures such as optimiza-tion or random number generation are maybe not well understood black boxesand are used wrongly. Moreover, in the omnipresent world of spreadsheet mod-els, there is little control over the evolution of the model. Even if a first versionwas found to be correct during a validation process, there is no guarantee thatone year later this still is the case. Obviously, given that more robust IT imple-mentations are usually more available for more mature and plain vanilla models(of products or risk exposures), this ‘spreadsheet risk’ is more important for thosemodels where also model risk is more present in the first place due to their com-plexity or novelty.
From a model validation perspective, the only really satisfactory approach toaddress the model implementation risk, is to be allowed from a timing and budgetperspective, to rebuild the model based on the theoretical documentation, and tocompare the results so obtained with the implementation of the model that isbeing validated. In reality, validators mostly have to settle for a step-by-step walkthrough of the model in a spreadsheet tool for a few cases, and for a read-throughof the code.
Therefore, the trend most recently observed in the insurance industry, wherepushed by Solvency II, model development and implementation is being designedalong the well-known lines applied to software acceptance and change control, isa more than welcome evolution that can only be encouraged, even though it hasa cost.
6.1.5. Assumptions
Given a mathematically sound model, the value for the assumptions being put in,can still influence the outcome of the model and its relevance for the businessdecision it needs to support. Sometimes statistical data or other sources allow foran almost objective setting of the assumptions, but sometimes significantamounts of professional judgement are potentially required. Examples of the lat-ter include the parameters determining the stability of non-maturing deposits inbanks, mortgage prepayment rates and insurance lapse rates, but also the liquid-ity premium introduced recently in the valuation of insurance liabilities.
At the very least should the reporting on the models contain a sensitivity analysisindicating how much the output varies in function of the different assumptions.Some assumptions are expected to have a more important impact than others.Policy lapse rates, for example, often have more impact on the cash flow esti-mated in life insurance models for technical provisions than mortality tables.These sensitivity analyses should allow management to actually perform the task

PERFECT MODELS, FALLIBLE HUMANS? 97
l a r c i e r
that is naturally theirs, namely to set formally the assumptions that are used inthe calculations. After all, these assumptions may impact product pricing, capitalrequirements, hedging strategies etc. which all clearly are management responsi-bilities.
6.1.6. Model Governance
Historically, the development of mathematical models was often the realm oftechnical experts, developing models and tools on desktop applications, subjectto very little formalised controls both during the model development and themodel execution phases. With the more widespread adoption and use of modelsin the decision processes throughout the organisation, many models are movingaway from the desktop (end user computing) into the domain of the regular ITapplications. Also the governance structures around their design and use arebeing upgraded. Choosing which model to use as organisation, is not unlike mak-ing a choice of accounting rules that will be applied. Implementing a model in anIT environment, is not dissimilar to putting into production a new transactionprocessing piece of software. Hence, the governance and processes applied tothese two domains are more and more also applied to risk and valuation mode-ling in financial institutions. In this respect, the tracking of changes and modifi-cations to existing models, both in their mathematical design and their IT imple-mentation, and the reason to do so, receives ever more attention of the supervi-sors.
In fact, by demonstrating that the model development process is a conscious col-laboration between different stakeholders in the organisation, that the choicesmade are not the point of view of any single individual but of the entire company,that the applications are rigorously tested before being put in production, andthat ultimately senior management takes ownership of the models, one lendscredibility to the outcome of the models. This should also strengthen the positionof the institution when discussing with third parties, such as rating agencies andregulators, that may have their own, differing views of the exposures and modelsneeded to describe those.
6.1.7. Expert Judgement
In particular in the domain of risk and capital models, aiming to peek into thedomain of the improbable events, happening once every 200 years or even onceevery several 1000 years, lack of objective data implies that expert judgementplays an important role. This can range from the ultimate loss that can come froman insured catastrophe, to the probability that a major financial crisis in the cap-ital markets like in October 2008, coincides with important operational errors in

98 NEW PARADIGMS IN BANKING, FINANCIAL MARKETS AND REGULATION?
l a r c i e r
the organisation. Even when made in good faith, this importance of expert judge-ment can potentially bias the outcome of the models.
As a first safeguard, it is therefore good practice to at least identify and list explic-itly all the areas in the models that rely on expert judgement, in order to avoidthat less transparent mathematical procedures obscure the fact that deep down itis really merely an expert’s opinion that determines the outcome of the model.Once it is known where expert judgement plays, it is easier to start addressingsome of the risks of expert judgement, such as stale judgements that have not beenchallenged nor updated for years, the dominant person effect where the mostsenior person in the room de facto determines the group opinion by speakingfirst, and the general short-sightedness of the human mind that we briefly touchupon below.
6.1.8. Use Test
Both in Basel II and Solvency II, the so-called ‘use test’ is a crucial ingredient forhaving the internal models accepted for calculating and reporting regulatory cap-ital requirements. There are at least two reasons for this. First of all, if manage-ment itself does not have enough confidence in its own models to base businessdecisions on them, such as underwriting a certain risk at a given price, or grantinga credit against a certain interest rate, how would one expect the regulator to relyon those models? Secondly, it is expected that if models are used in practice, thattheir weaknesses will show up more readily by confronting them with reality,leading to a natural pressure from the users to enhance the models.
Demonstrating this use test is gaining traction, but many institutions, in particu-lar in the insurance industry where internal models are much richer and broaderthan in banking, are still defining the way forward in this respect.
6.2. Human Beings are Inherently Fallible...
Even if all due care was taken to address the modeling risks reviewed above, itremains that any mathematical model is designed and operated by human beings,within the context of a commercial enterprise that has cost consciousness andrevenue generation as justified objectives.
Over the last decades, under the name of ‘behavioural finance’ an enormous bodyof academic research was produced, demonstrating how inherent psychologicalcharacteristics of human beings make the fundamental tenet of finance theory,namely that economic actors only take rational decisions based on a full knowl-edge of the facts, may not be a faithful representation of reality in a model. Oneparticular area, termed cognitive biases, investigates how information that

PERFECT MODELS, FALLIBLE HUMANS? 99
l a r c i e r
human beings receive, influences their thought processes and decision making.We cite just three examples that are of particular relevance in the context ofassessing model risk and model validation. First there is the confirmation bias, thetendency to look for information that confirms your preconceptions or to inter-pret new data first as a confirmation rather than as contradiction of your priorideas. The second example, the mental anchoring phenomenon, states that indecisions involving numbers, there is a tendency to take arbitrary reference pointsor values, even though they may not be relevant for the actual decision. Probablythe most familiar example of this is the fact that in deciding on whether or not tosell an investment, we often compare to the (historical) purchase price, eventhough the really relevant question whether a security is fairly priced or not, doesnot depend on the price we paid for it, possibly years ago, but only on theexpected future cash flows. A third one is the clustering illusion, for which Taleb(2007) uses the more pictorial term ‘narrative fallacy’, which is the human ten-dency to detect patterns in a priori purely randomly generated series of data orevents (and in the worst of all cases, to then extrapolate this phantom pattern toattempt to predict the future). Clearly, a risk manager should be alerted to thepossible effects of these cognitive biases on her and the company’s decisions.
Next to these biological limitations of human beings when it comes to modelingrisk, the overall risk culture of the organisation, the general mathematical literacyof the decision makers and the prevailing attitude towards the use of mathemat-ical models to try to come to grips with the risks the company is facing, are impor-tant potential enablers or disablers for making the organisation use mathematicalmodels intelligently. Having worked for a variety of financial institutions in bothbanking and insurance, it seems that different attitudes with respect to the role ofmathematical models in decision making, can be observed in these two sub-indus-tries of the financial services universe.
6.3. But do not Discard the Value of Risk Modeling Altogether
The above brief overview of the weaknesses in currently common modeling prac-tices, in combination with the inherent limitations of the human mind, should notof course be read as a justification to ignore the mathematical models entirely asa tool supporting risk analysis and risk management decisions, and to revert backto qualitative and judgmental processes only. Good risk modeling should in a firststep contribute to an improved qualitative understanding of the risk exposures,including non-linearity and feedback mechanisms, and of how the different expo-sures and risk drivers interact. Only with a good understanding of the financialand economical properties of the problem at hand, can one start their translationin mathematical structures. To paraphrase Donald Rumsfeld, one first needs to

100 NEW PARADIGMS IN BANKING, FINANCIAL MARKETS AND REGULATION?
l a r c i e r
transform the unknown unknowns into known unknowns before one can makea probabilistic model for the latter.
Whatever the limitations of the mathematical models of financial reality, mostpractitioners will agree that the process of model construction enforces a mini-mum degree of logical consistency in our thinking about risk.
These two points, namely the goal of improving our understanding of the proc-esses at work, and ensuring that our models are at least logically coherent evenwhen based on expert judgement, are two objectives of a recent attempt to opennew avenues for risk modeling, while using generally accepted mathematical rec-ipes. In Rebonato (2010), the author shows how one can incorporate both one’sview on how different risk factors influence each other (causal relation) and thefact that one may have to rely on expert judgement to set the parameters in themodel in the absence of relevant and sufficient frequentist data, in a mathemati-cally consistent framework to estimate for example capital requirements. How-ever, re-introducing qualitative aspects and arguments in risk modelling does notnecessarily imply a reduction in the cost of making the model, both in data andin human terms.
Many risk managers realized and were ready to admit in 2008 that we collectivelyhad spent more time running models than thinking about what was really goingon. So it is time to do some more thinking again...
References
BIS/IOSCO, 2011, Principles for Financial Market Infrastructures, BIS–OICV/IOSCO, March 2011, (www.bis.org/publ/cpss94.pdf).
CEIOPS, 2009, Tests and Standards for Internal Model Approval, CEIOPS-DOC-48/09, October 2009.
REBONATO, R., 2010, Coherent Stress Testing, A Bayesian approach to the anal-ysis of financial stress.
STAHL, G., NILL, E., SIEHL, B. and WILSBERG, J., 2007, Risk Modeling and ModelRisk – the IRBA Case, Bundesanstalt fur Finanzdienstleistungsaufsicht,Bonn, August 2007.
TALEB, N.N., 2007, The Black Swan: The Impact of the Highly Improbable, NewYork, Random House and Penguin.

101
l a r c i e r
7. THE COOPERATIVE BANKING MODEL: PERFORMANCE
AND OPPORTUNITIES
Hans Groeneveld1
Abstract
By comparison with European Shareholder Value banks, European cooperativebanking groups (ECBGs) appear to have been dealt only a glancing blow by theimmediate effects of the credit crisis. Financial indicators show that they escapedrelatively unscathed from the crisis and did not need large-scale government sup-port. In this article, we look for possible explanations for their relatively goodperformance and achievements in recent years. To this end, the unique differenti-ators and the resulting visible market manifestations of financial cooperatives areexplored. Special attention is devoted to their corporate governance with memberownership and influence. Subsequently, theoretical, practical and empiricalinsights are combined to investigate how ECBGs are positioned for the comingyears. This question is discussed against the background of imminent changes inthe rules of the game, the business principles and business models in the globalfinancial system. A new dataset for leading ECBGs is used to underpin thedescriptive and qualitative considerations. An important conclusion is thatECBGs contribute to diversity in banking, and, consequently, to the stability ofnational financial systems.
JEL-codes: G21, G30, L25, P13
Keywords: European cooperative banks, corporate governance, performance, sta-bility, diversity
7.1. Introduction
The financial perils for countries and banks are not over yet. The situation is farfrom stable and public confidence in financial institutions is still weak. However,several studies point to the fact that individual European cooperative bankinggroups (henceforth ECBGs) have weathered previous and current periods offinancial distress relatively well (EACB, 2010). ECBGs also came through thecrisis of 2007-08 in a quite good shape compared to some large ShareholderValue (henceforth SHV) or listed banks2. All European cooperative bankstogether are responsible for 8 percent of all direct losses and write downs of theentire European banking sector as a result of the credit crisis (Groeneveld, 2011).
1 The views in this paper are personal and do not necessarily reflect those of Rabobank Nederland.2 For the purpose of the discussion, SHV banks may be regarded as those whose business focus is maximizing
shareholder interests and the rate of return on equity capital. SHV banks, of which cooperative banks form thelargest part, have a broader focus and in particular maximizing consumer surplus for their owner-members (seeAyadi et al., 2010).

102 NEW PARADIGMS IN BANKING, FINANCIAL MARKETS AND REGULATION?
l a r c i e r
Without any doubt, this is a large amount in euro, but compared to their averagemarket shares of around 20 percent, this is a relatively small percentage and stillbearable. Consequently, ECBGs did not need large scale government support andkept relatively good access to the public money and capital markets in the middleof the crisis.
For several reasons, the characteristics and recent performance of ECBGs haveremained notably underexposed in recent publications, the press and variousreports. Kalmi (2007) ascribes this to the prevalence of the Anglo-Saxon bankingmodel aimed at profit and shareholder value maximization in the last decades.Cooperative institutions were not considered the most efficient, vibrant, or inno-vative institutions for a long time (Kodres and Narain, 2010). Another reason forthe limited attention for financial cooperatives is the lack of empirical data orsomewhat longer and consistent time series for key financial indicators, whichhampers an objective evaluation of their specific business model. Furthermore,their organizational structures and multiple goals are generally more difficult tounderstand for ‘outsiders’ than the corporate governance of SHV banks withtheir more easily interpretable and single goal of profit maximizing. The Euro-pean cooperative banking sector can be characterised as ‘commonality withdiversity’ in that there are a set of basic principles that are common to all coop-erative banks while at the same time differences exist in some other areas. Theyare, however, unifying governance features. Anyway, the – run-up to the – sub-prime crisis triggered an increasing academic and policy interest in the coopera-tive banking model in recent years (Ayadi et al., 2010; The Economist 2010;
ihák and Hesse, 2007; Oliver Wyman, 2008).
This article contains three important novelties and complements previous studieson cooperative banks in various ways. Firstly, it offers an integral picture of manyinterlinked issues of cooperative banks by combining theoretical, practical andempirical insights in a concise way. Most existing studies or reports are only of adescriptive or qualitative nature and deal with partial aspects of cooperativebanks, without providing consistent ‘empirical evidence’. Secondly, it linksimportant contemporary trends in the banking industry to the position and roleof ECBGs in the future financial system. Thirdly, a newly constructed empiricaldatabase of leading ECBGs is used to corroborate the descriptive and analyticalconsiderations.
Section 2 sketches major changes and planned reforms in the financial system andtheir consequences for the business principles and market conditions in banking.In Section 3, the specific internal features and performance of ECBGs are ana-lyzed. It is discussed how they impact on their financial structure and other quan-titative indicators. Section 4 looks at the presence value of ECBGs in national

THE COOPERATIVE BANKING MODEL: PERFORMANCE AND OPPORTUNITIES 103
l a r c i e r
financial systems. Section 5 describes their opportunities and challenges in thecoming five years.
7.2. Changing or Changed Characteristics of the Global Financial System?
The financial crisis has led to critical assessments of the rules, business principlesand business models in banking. Understandably, top priority has been given tosafeguarding the stability of the global financial system. A major effort concernedthe restoration of confidence and customer focus in the financial sector. Variousactions have been undertaken or are underway to achieve these objectives. Prom-inent initiatives are the far reaching reforms in regulatory and supervisoryregimes in the US and in Europe3. The Basel Committee on Banking Supervision(BCBS, 2010a) announced higher capital and liquidity requirements for banks aspreventive measures to reduce the likelihood of future crises. The regulatoryreform will inevitably result in funding structures moving away from volatile andshort-term sources, i.e. towards more stable and long-term sources, such as cap-ital and deposits. However, the crisis has also increased investors’ awareness ofbanks’ capital endowments. It is thus likely that market participants will end uprequesting additional buffers on top of the minimum regulatory requirements.The limited funding resources together with the increased demand are probablyresulting in increased competition and funding costs in the medium to longer term(ECB, 2010b). This will lead to higher credit interest rates and could lower thepotential economic growth rate.
Key is that regulation and supervision should be reformed to encourage a finan-cial system that better mitigates systemic risks (Kodres and Narain, 2010). Impor-tant elements in many proposals are strengthening transparency and accountabil-ity, enhancing sound regulation, promoting integrity in financial markets andreinforcing international cooperation among regulators and supervisors. Evenwithout regulatory reform and pressure from the BCBS (2010b), many institu-tions should rethink their risk taking activities and how they can better align risktaking with employee compensation.
Tighter regulation and supervision are necessary to restore confidence and main-tain financial stability, but are not sufficient to prevent a next crisis. The sameholds for the possible introduction of financial transaction taxes, banking taxesor resolution funds. All these measures cannot prevent a systemic crisis. Thesesuggestions can be understood from the perspective of policymakers and taxpay-ers, who had to pay for rescuing troubled banks in the end. However, banking
3 For example, Financial Stability Forum (2008), G-20 (2009a/b), The de Larosière Group (2009).

104 NEW PARADIGMS IN BANKING, FINANCIAL MARKETS AND REGULATION?
l a r c i e r
taxes and resolution funds do not contain incentives for banks to behave moreprudently or less risky in the future. Actually, a fund could aggravate the problemof moral hazard on behalf of banks. Knowing that a well filled fund is availableas a safety net in case of problems could even provoke riskier behavior by certainfinancial institutions. A better way to discourage excessive risk taking by finan-cial institutions is that banks’ shareholders and bond holders are exposed tofinancial risks if a bank gets into difficulties. This will induce shareholders andbond holders to monitor and steer the risk profile of a financial institution morecarefully. The suggested incentives could be introduced via so-called risk-sharinginstruments, like contingent convertibles. Contingent capital is debt that convertsinto equity or is written off when a bank is experiencing huge losses and/or writedowns which leads to an evaporation of capital, or when certain triggers for theminimum required capital buffers are hit.
A change in the business principles of the financial system will contribute mostlyto the restoration and maintenance of financial stability and prudent behavior byfinancial institutions. These behavioral changes cannot be enforced easily. Whilethe financial sector has traditionally thrived on trust, a general distrust of thebanking sector has now emerged. Financial markets and consumers must regainand keep confidence in banks. And banks must have confidence in each other.There have been accusations of corporate greed due to the sustained and oftenrecord profits that bank shareholders and management earned until the financialcrisis broke out. This led to a public condemnation of the focus on short-termgains and materialism by banks. In this light, governments and society have right-
Table 1: Main effects of the financial crisis for the entire banking industry
Main effects Characteristics of the new financial system
1. Different rules of the game • Corporate governance, clear attention to risk management• Compensation schemes to introduce the right incentives• Tighter supervision and regulation for banks and other financial institutions on
an international level.• Higher liquidity and solvency requirements for banks• Lasting political and policy influence: issues of gradual run down of government
intervention, exit strategies, reversal of extraordinary monetary actions, proposals for financial transaction taxes, banking taxes and resolution funds.
2. Different business principles • Customer focus • Morality and integrity • Healthy risk attitude• Long-term perspectives instead of short-term profits• Attention to all stakeholders, not just shareholders• Attention to externalities of behavior• Transparency in products and organization
3. Different business models • Less, but simpler and transparent products and activities• Focus on retail banking• Reorientation towards home markets due to national support• Less scope for large-scale international aspirations, partly due to support from
national governments• Dismantling of some large financial conglomerates

THE COOPERATIVE BANKING MODEL: PERFORMANCE AND OPPORTUNITIES 105
l a r c i e r
fully demanded behavioral changes from financial institutions: a greater focus onmorality and integrity, a healthy risk attitude, a longer-term perspective,improved (product) transparency and, last but not least, a much stronger cus-tomer focus.
According to Michie (2010), the financial sector has taken fairly halfheartedattempts to improve its ethics, risk perception and risk attitudes by its own afterthe crisis. By late 2008, tough proposals were put forward for healthier and moremodest executive and employee compensation structures in the financial servicesindustry (Financial Stability Board, 2009)4. Michie finds it disappointing that thelarger part of the financial services sector has apparently returned to the ‘businessas usual’ model that has proved so costly to the economy and to public finances.Around the beginning of 2011, a return to the bonus culture was discernible inthe United States and the United Kingdom in particular, which was largely fuelledby profits boosted by the increased market power of banks which have been res-cued by the taxpayer. Perhaps, the future disclosure requirements on remunera-tion of the BCBS will bring about the necessary changes (BCBS, 2010b)5.
Directly following the crisis, a relatively large number of universal and specializedbanks also expressed their intention to give the interest of customers again a moreprominent place in their daily business (Eurofound, 2010). After the massive bail-outs, society is understandably expecting financial institutions to adjust theirbehavior to reflect the wider public interest and not, necessarily, shareholderinterests only. More attention must be paid to the externalities of financial insti-tutions’ behavior and priority should be given to collective and sustainable inter-ests6. As part of their damaged reputation, the scope of complaints regardingbanks has widened considerably. Every aspect in banking is heavily scrutinizedand easily criticized by customers. For instance, customers are increasingly com-plaining about perceived low deposit interest rates and high credit interest rates.
4 These schemes induced risky behavior and led to a fixation on short-term profit maximization and consequentlyacted as a catalyst for the emergence of the crisis. Periodically, the FSB is performing reviews of the steps takenor planned by its member jurisdictions to implement these principles. Notwithstanding different starting pointsin terms of pre-existing national frameworks addressing compensation issues and the degree of misalignmentwith prudent risk-taking, the FSB concludes that, on the whole, material progress and a movement towardsconvergence across jurisdictions have taken place (FSB, 2010).
5 The objective of these additional requirements on remuneration is to enhance effective market discipline and toallow market participants to assess the quality of the compensation practices. These requirements should alsocontribute to promote a greater convergence and consistency of disclosure on remuneration. As a result, bankswill be requested to disclose qualitative and quantitative information about their remuneration practices andpolicies covering the following areas: the governance/committee structures; the design/operation of remunera-tion structure, frequency of review; the independence of compensation from short term results (cash/equity,fixed/variable).
6 To stimulate these behavioral changes in banking, proposals have been put forward in the Netherlands tointroduce a banker’s oath as a public ceremony (Advisory Commission ‘Future of Banks’, 2009). It is intendedto radiate self-awareness by bankers of their social responsibilities and the acknowledgement of the crucial rolebanks are playing in society. The author believes that an oath is not a meaningful and recognizable ritual thatappeals to new generations, breaches cynicism and contributes to a subservient attitude of bankers. It cannotensure any intrinsic commitment on behalf of bankers.

106 NEW PARADIGMS IN BANKING, FINANCIAL MARKETS AND REGULATION?
l a r c i e r
Interim assessments reveal that the promises above are as yet not completelyredeemed (Financial Stability Board, 2010).
Due to the envisaged new business principles and tighter regulation and supervi-sion, many banks have reconsidered the nature, size, geographical distributionand goals of their activities. The diversified banking model has shown to haveacted as a shock absorber in times of stress, and market participants expect it toincrease in importance at the cost of specialized banking models (ECB, 2010b). Itis a fact that banks have become more dependent on interest income instead offee and commission revenues. At the same time, owing to the recent drop in andfuture pressure on profitability, banks are likely to search for additional profitsand economies of scale in selected areas by focusing on their core – domestic –markets, activities and clients. Consolidation in the banking sector and a moreefficient use of resources, for instance as measured by bank assets per employee,has continued after the crisis. The financial turmoil has also led to a – temporary– retrenchment of financial markets within national borders and consequently toa reversal of the European financial integration process in banking (ECB, 2010a).Domestic banks have slightly increased their market shares in EU Member Statesat the expense of foreign branches. More than half of the large European bankinggroups stated that they amended their internationalization strategies as a result ofthe financial crisis (ECB, 2010b). Large parts of the shadow banking system andsome large international financial conglomerates have been dismantled and amove back towards retail banking has taken place7. Finally, the public and poli-ticians have developed an aversion to financial institutions that are considered‘too big to fail’, ‘too big to manage’ or ‘too big to save’, because this has intro-duced moral hazard problems in the financial system.
7.3. Differentiators of ECBGs
ECBGs have undergone tremendous transformations and developments sincetheir establishment more than a century ago (Oliver Wyman, 2008)8. On the faceof it, one could conclude that the traditional features and added value of thecooperative banking model have faded away; they gradually looked and startbehaving like SHV banks. This assertion rests on a great fallacy, as evidenced bythe solid performance of cooperative banks during and after the global creditcrisis. It is true that it has been fairly difficult to see that ECBGs differ from theirlisted competitors in social, economic and financial respects for a long time.Financial products, services, prices and distribution concepts are almost identical
7 This does not mean that it concerns an irreversible development. Retail business is defined as financial productsand services distributed through physical and non-physical networks to retail customers and SMEs.
8 Many ECBGs have published extensive books on their history in the course of time. See for instance Mooij(2009).

THE COOPERATIVE BANKING MODEL: PERFORMANCE AND OPPORTUNITIES 107
l a r c i e r
across banks. All banks were also perceived as equally safe and financially sounduntil the crisis emerged. In fact, ECBGs were sometimes forced into a defensiveposition prior to the crisis. PA Consulting Group (2003) accused cooperativebanks of ‘spoiling’ the market conditions for other banks. Others (Oliver Wyman,2008) criticised the sluggishness of decision making processes or exaggerated theprincipal-agent problem inside ECBGs on merely theoretical considerations(Groeneveld and Llewellyn, 2011)9.
To rebut these misconceptions, the European Association of Cooperative Banks(EACB, 2005, 2006, 2007) as well as the International Cooperative BankingAssociation (ICBA) have put a lot of effort in emphasizing the divergent and spe-cial nature of cooperative banks in various reports before 2008. They were onlypartly successful, since these documents have a predominantly qualitative charac-ter. A major weakness concerned the lack of ‘hard’ data on a wide range of issuesconcerning cooperative banks and the dominance of the shareholder value think-ing. All these reports stress that the mission, vision and considerations of cooper-ative banks have basically remained the same since their creation. For instance,the EACB (2005) states that:
“The primary mission of cooperative banks is to promote the economicinterest of their members, who are their customers. cooperative banksstrive to do so by offering quality products and services at attractiveprices from the perspective of what is good for the customer. They havean impact presence on the conditions of products in the whole bankingmarket and support the economic and social integration of individuals”.
This concise formulation embodies the roots of cooperative banking in a newphrasing. Apparently, the customer has always been and is still at the core of theiroperations and, at a local level, members have a say in the local member bank’spolicy. Thus, the ‘promised’ greater focus on the customer by many financialinstitutions following the crisis should sound quite awkward to cooperativebanks. The passage above also suggests that cooperative banks have an ‘impactpresence’ on the banking market. To define and quantify this presence value,however, is a difficult undertaking. Even more so, because they actually hint at anoticeable causal relationship between cooperative banks and society and thestructural characteristics of banking markets. Such a causality is hard to demon-strate empirically, as it really only manifests itself on the entry or exit of a largecooperative bank or during financial crises (Groeneveld and Sjauw-Koen-Fa,2009). But it also works the other way round: society and the market environ-ment influence cooperative banks. Another implicit EACB claim is that coopera-
9 This refers to potential conflicts of interest between managers and owners of a bank. Agency issues arise in anyorganisation in which there is a separation of decision and risk-taking functions. In the case of cooperativebanks, these issues emerge between the management and the members. In the case of shareholder value compa-nies, these issues occur between the management and shareholders.

108 NEW PARADIGMS IN BANKING, FINANCIAL MARKETS AND REGULATION?
l a r c i e r
tive banks apply an external and long term orientation. They assert not be aimingat – short term – benefits of their operations, services and products for members/customers and themselves, but also want to contribute to economic and socialwell being in local communities. This alleged longer term perspective and priorityto collective and sustainable interests are precisely the behavioural changes whichthe public, politicians and regulators are demanding from financial institutionsfollowing the credit crisis.
What can be stated with certainty is that cooperative banks stand out regardingtheir history, structure, organisational form and original business objectives fromSHV or listed banks. The main observable differentiator of ECBGs is their spe-cific corporate governance with member ownership. Theoretically, this intrinsicfeature is only a precondition to be able to operate or to position yourself in aspecific way in the market. In practice, this differentiator did reveal pronouncedexternal market results of cooperative banks, which were fairly unnoticed orinvisible until the crisis hit. Hence, this differentiator has effectively provokedcooperatives to steer a certain ‘business’ course and to aim at particular social,economic and financial objectives (Ayadi et al., 2010). One of the results is thatthey exert a positive impact on the stability of national financial systems and havea presence value to date. These specifics are visualized in diagram 1 with the maindifferentiator ‘Corporate governance’ in the middle. Of course, the elementsinteract and are interrelated. In the next subsections, the characteristics and exter-nal financial results stemming from this main differentiator are discussed. Theimpact of the coming changes in the rules of the game, business principles andbusiness models on ECBGs will be analyzed as well.
7.3.1. Member Influence
Cooperative banks are owned by their members who are private citizens. Mem-bers have significance not only by virtue of being owners but also because theyare an integral part of the governance structure although the precise arrange-ments vary considerably. In most cases, ownership is at the local and regionallevel, although there are notable exceptions (e.g. Rabobank, Crédit Agricole andBanche Popolari). Voting rights conferred by membership are based on the prin-ciple of One-Member-One-Vote (OMOV) and are not proportional to the size ofa member’s stake in the bank. This also means that members cannot accumulatevotes through purchases of shares in a market. The implication is that the owner-ship rights inherent in OMOV model are necessarily widely dispersed with noindividual or group able to build up a controlling position. This does not poseserious problems though. Members are represented in many commissions andconsultative bodies. Besides, members elect the supervisory boards of local orregional banks and – indirectly of – the Central Network Institution (CNI) orAPEX.
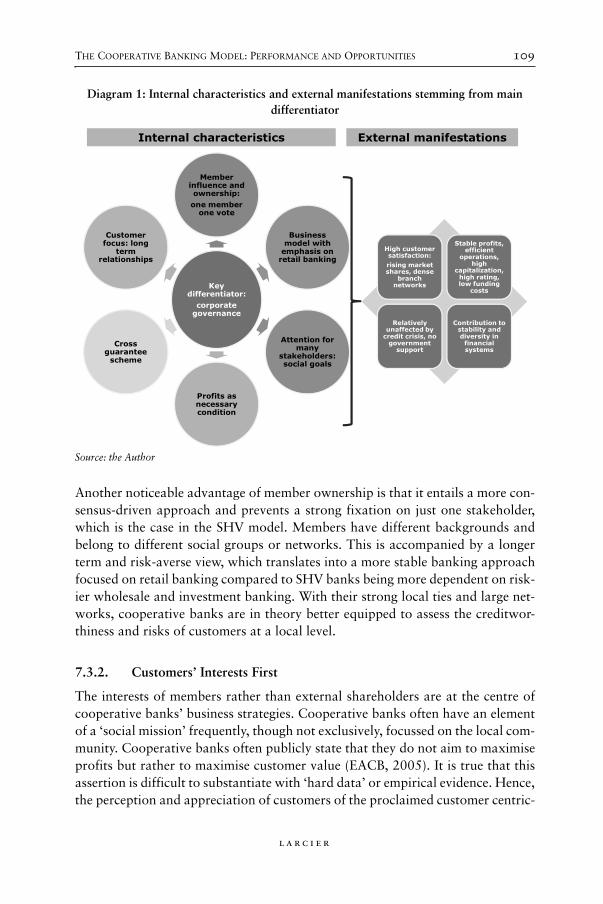
THE COOPERATIVE BANKING MODEL: PERFORMANCE AND OPPORTUNITIES 109
l a r c i e r
Another noticeable advantage of member ownership is that it entails a more con-sensus-driven approach and prevents a strong fixation on just one stakeholder,which is the case in the SHV model. Members have different backgrounds andbelong to different social groups or networks. This is accompanied by a longerterm and risk-averse view, which translates into a more stable banking approachfocused on retail banking compared to SHV banks being more dependent on risk-ier wholesale and investment banking. With their strong local ties and large net-works, cooperative banks are in theory better equipped to assess the creditwor-thiness and risks of customers at a local level.
7.3.2. Customers’ Interests First
The interests of members rather than external shareholders are at the centre ofcooperative banks’ business strategies. Cooperative banks often have an elementof a ‘social mission’ frequently, though not exclusively, focussed on the local com-munity. Cooperative banks often publicly state that they do not aim to maximiseprofits but rather to maximise customer value (EACB, 2005). It is true that thisassertion is difficult to substantiate with ‘hard data’ or empirical evidence. Hence,the perception and appreciation of customers of the proclaimed customer centric-
Diagram 1: Internal characteristics and external manifestations stemming from main differentiator
Source: the Author
Key differentiator:
corporate governance
Member influence and ownership:
one member one vote
Business model with
emphasis on retail banking
Attention for many
stakeholders: social goals
Profits as necessary condition
Cross guarantee
scheme
Customer focus: long
term relationships
High customer satisfaction:
rising market shares, dense
branch networks
Stable profits, efficient
operations, high
capitalization, high rating, low funding
costs
Relatively unaffected by
credit crisis, no government
support
Contribution to stability and diversity in
financial systems
Internal characteristics External manifestations

110 NEW PARADIGMS IN BANKING, FINANCIAL MARKETS AND REGULATION?
l a r c i e r
ity of cooperative banks are unknown, which is quite unsatisfactory for bothresearchers, policy makers and cooperative banks themselves. One could arguethat customer satisfaction is ultimately visible in member to population ratios,market shares or financial performance of cooperative banks, but obtainingdirect insights and opinions from customers would provide more powerful evi-dence. It is all about the perception of customers whether cooperative banks‘walk their talk’. Or in other words, keep their promises and treat their customersfairly.
7.3.2.1. Member Ratios and Market Shares
Contrary to the limited attention for the cooperative banking model among aca-demics and policy makers in the recent past, this model has been rather successful,as measured by the rise in the member to population ratio (Chart 1) and indomestic market shares (Chart 2). Average market shares as well as member-to-population ratios of ECBGs continued to increase in the financially and econom-ically turbulent years 2008-09. If the number of members would drop considera-bly, this would eventually erode the legitimacy and an important discriminatingfeature of cooperative banks. In six EU countries where ECBGs have domesticmarket shares of more than 25 percent, the member to population ratio increasedfrom 14 percent in 1997 to 19 percent in 2009. These countries include Austria,Finland, France, Germany, Italy and the Netherlands (henceforth EU6). Theincrease in members was most pronounced in 2009. The underlying reasons forthe increasing popularity are hard to isolate and are of a financial and immaterialnature10. The ratios indicate that cooperative banks have succeeded in attractingnew members with their products, services, cooperative business models or otherdistinguishing features. It should be noted that most ECBG’s have abolished com-pulsory membership some 20 years ago. Before that, customers had to becomemembers if they wanted to apply for a credit or loan from a cooperative bank (SeeChart 1, p. 111).
Regarding market shares, European cooperative banks were able to graduallystrengthen their position in the loan and deposit markets over the last decade andin the financially turbulent years 2007 and 2008 (Chart 2). This trend continuedin 2009. The rise in market shares has been due to exogenous factors and acqui-sitions of other financial institutions. The market shares for deposits and loansare significant, but below the market shares for branches. The market shares forbranch offices are in EU6 approximately 10 percentage points higher than thosefor deposits. Over the last decade, cooperative banks have gained branch market
10 Some of these reasons could be financial conditions, but also the degree of customer satisfaction, the extent towhich banks act in the interest of customers, access to the bank’s networks and knowledge, the stability/dura-tion of relationships, the way banks deal with environmental and sustainability issues, the degree of productand price transparency, etc.

THE COOPERATIVE BANKING MODEL: PERFORMANCE AND OPPORTUNITIES 111
l a r c i e r
share for two reasons. The first is that cooperative banks in France and Italy haveexpanded their branch office networks either organically or via acquisitions. Thesecond explanation is that cooperative banks in the other EU countries haveslimmed down the number of branch offices to a lesser extent than their compet-itors in the context of cost-cutting or efficiency programmes. As a result, cooper-ative banks have strengthened their local presence. Against the background of theexpected ‘return to retail banking’ of many financial players in the coming years,cooperative banks can take advantage of this fact. Amidst of the crisis, the pos-session of a dense branch network has proven its value. Customers viewed coop-erative banks as safe havens and transferred substantial volumes of deposits tocooperative banks, leading to the visible increase in deposit market shares. Theincrease in loan market shares in recent years was partly attributable to the solidcapitalisation of cooperative banks. They were better able to continue lending tothe private sector in the crisis, whereas quite some SHV banks could not attractfunding without some form of government support (See Chart 2, p. 112).
7.3.3. Stable Business Model and Stable Profits
Member ownership leads to a stable business model, focused on sustainable retailbanking with stable and moderate profit levels. This leads to good liquidity andsound asset quality. The structure, knowledge of local customers and risk diver-
Chart 1: Members and member to population ratio of ECBGs in EU6
Source: Annual reports of cooperative banks and national population statistics.Note: Members of all ECBGs in Austria, Finland, France, Germany, Italy and the Netherlands are added.
0
5
10
15
20
25
0
5.000.000
10.000.000
15.000.000
20.000.000
25.000.000
30.000.000
35.000.000
40.000.000
45.000.000
50.000.000
1996 1997 1998 1999 2000 2001 2002 2003 2004 2005 2006 2007 2008 2009 2010
Members of EU6 cooperative banks (left scale)
Member to population ratio of EU6 cooperative banks (right scale)

112 NEW PARADIGMS IN BANKING, FINANCIAL MARKETS AND REGULATION?
l a r c i e r
sification all work in favour of cooperative banks. In contrast to SHV banks,maximising the rate of return on capital is not the exclusive or even dominantbusiness objective of cooperative banks. The essence of the cooperative bankmodel is that there is no myopic focus on maximising shareholder value. Thetypical cooperative bank seeks to maximise the benefit of their members (who arealso customers) and to maximise consumer surplus. However, as with all banks(irrespective of their capital structure), healthy profitability is an important nec-essary condition for cooperative banks to safeguard their continuity, to financegrowth and credit, and to provide a buffer for inclement times. But, unlike withSHV banks, profit is not a goal in itself but are necessary for continued growth:it is a ‘means to an end’ rather than the ‘end’ itself.
The features of their business model are clearly visible in the development of theReturn on Equity (ROE; Chart 3). In ‘normal’ times, cooperative banks actuallyrealize lower but also more stable returns on equity. They are less profit-orientedthan commercial banks and manage risks differently. The average ROE of coop-erative banks dropped significantly from 10 percent in 2007 to 5 percent in 2008,but this decline was fairly modest compared to the fall in the average ROE of theentire banking sectors from 13 percent in 2007 to minus 0.5 percent in 2008 inthe countries under review. The crisis has revealed that this most common meas-
Chart 2: Domestic market shares of ECBGs in EU6
Source: Annual reports of ECBGs and the ECB.Note: The average domestic market shares of all ECBGs in Austria, Finland, France, Germany, Italy and theNetherlands are plotted.
0
5
10
15
20
25
30
35
40
45
50
0
5
10
15
20
25
30
35
40
45
50
199619971998199920002001200220032004200520062007200820092010
EU6 deposits EU6 loans EU6 branches

THE COOPERATIVE BANKING MODEL: PERFORMANCE AND OPPORTUNITIES 113
l a r c i e r
ure of a bank’s performance is only one part of the story, since a satisfactory levelof ROE may reflect either high profitability or more limited equity capital. Thehigh profits of other banks before the crisis were in any case more related to highrisks in derivatives markets and other investments (IMF, 2010). Profitability istherefore no reliable indicator for sustainability. In an environment with a highvolatility, such as during the global financial crisis, the ROE does not help toprovide an understanding of the potential trade-off between risk and return inperformance (ECB, 2010c).
7.3.4. High Capitalisation, High Rating and Low Funding Costs
Cooperative banks barely distribute profits but add it to their reserves or thebanks’ own funds, although members may sometimes be able to vote for a limiteddistribution of profits11. Consequently, cooperative banks are some of the morehighly capitalised institutions in Europe as a result of their unique model andownership structure. Cooperative banks accumulate capital by design, as theiroriginal purpose was to overcome a shortage of capital for their chosen activities.The knowledge that this carefully built-up capital cannot be easily replaced byexternal sources after considerable losses stimulates cooperative bank managers
Chart 3: Return on Equity of ECBGs and entire banking systems
Source: Annual reports and data from national central banks or supervisors.Note: The chart displays data of ECBGs in Austria, Finland, France, Germany, Italy, the Netherlands, Spainand Switzerland and entire banking systems in these countries.
11 However, some banks do pay limited dividends and have instituted loyalty schemes for members.
-2
0
2
4
6
8
10
12
14
16
-2
0
2
4
6
8
10
12
14
16
2002 2003 2004 2005 2006 2007 2008 2009 2010
Entire banking systemCooperative banks

114 NEW PARADIGMS IN BANKING, FINANCIAL MARKETS AND REGULATION?
l a r c i e r
to apply a relatively low risk appetite. This disciplining factor partly explainedthe relatively good performance of financial cooperatives during and after theinitial credit crisis.
Since ECBGs managed to come through the crisis without much difficulties, thereis no real need for introducing any new regulatory standards and/or additionalliquidity or capital requirements from their perspective. As an illustration, Box 1discusses some adjustments to various initial regulatory and supervisory reformsin order to do justice to the specifics of the cooperative banking model. Chart 4shows that the tier 1 ratio of cooperative bank groups has always been higherthan the tier 1 ratio of entire banking systems, with the exception of 2009 whenquite a few SHV banks received capital injections from national governments andwere forced by the financial markets to increase their capital buffers and/or toreduce their balance sheet (deleveraging).
Chart 4: Tier 1 ratio of cooperative bank groups and entire banking systems
Source: Annual reports and data from national central banks or supervisors.Note: The chart displays data of all ECBGs in Austria, Finland, France, Germany, Italy, the Netherlands,Spain and Switzerland and entire banking systems in these countries.
0
2
4
6
8
10
12
14
0
2
4
6
8
10
12
14
2002 2003 2004 2005 2006 2007 2008 2009 2010
Cooperative banks Entire banking system

THE COOPERATIVE BANKING MODEL: PERFORMANCE AND OPPORTUNITIES 115
l a r c i e r
Box 1. Adjustments to the Initial Supervisory and Regulatory Proposals for ECBGs
The G20 have committed to developing rules to improve the quality and quantity ofbanks’ capital and to introduce new global liquidity standards as a measure to makefinancial institutions more resilient to future crises. The Basel Committee on BankingSupervision (BCBS) started to work on this issue in 2009. At the same time, a lot ofattention is devoted to the adjustment of compensation schemes to stimulate adherenceto a longer term perspective by executives and certain groups of employees. Withouttaking into account the specifics of the cooperative banking model, the measures pro-posed at the international level to strengthen the quality of the capital and liquidity baseof financial institutions would have put ECBGs in a disadvantageous position. Thedraft guidelines and rules were adjusted for cooperative banks at a fairly late stage.
Definition of Tier 1 Capital Base
An important element in the discussions concerns the definition of the Tier 1 capitalbase. The BCBS has indicated that the predominant form of Tier 1 capital is commonshares and retained earnings. Regarding these shares, a set of criteria applies whetherthey can be considered as Core tier 1 capital. However, these criteria pertain to theshares of listed banks. Shares of cooperative banks will never meet these criteria, sincethe participation of members in the net assets of the cooperative is limited and theyusually have no access to the retained earnings added to the capital. This necessitated aspecial treatment of cooperative shares in the new supervisory framework. In the policydocuments, reference is made that shares of cooperative banks can deviate from thecriteria as long as they are comparable in major aspects, especially regarding their loss-absorbing capacity.
Liquidity Requirements
The Basel Committee has proposed two liquidity standards: Liquidity Coverage Ratio(LCR) and Net Stable Funding Ratio (NSFR). The purpose of the LCR is to ensure theshort-term liquidity of banks. The ratio imposes a minimum amount of high-qualityliquid assets to be available in order to balance presumed outgoing cash flows in a stressscenario. For cooperative banks, it is crucial that the existing internal liquidity structu-res are been taken into account. Initially, stress scenarios in the first consultation paperby the BCBS assumed an unrealistic outflow of deposits from cooperative central insti-tutions. This would create serious problems, especially for non-consolidating ECBGslike in Italy. In the final paper, this inaccuracy has been addressed and two paragraphsare devoted to “Treatment of deposits in institutional networks of cooperative banks”.Again, it is indispensable to look at the facts before, during and after the financial crisis.Cooperative banks were definitely not confronted with outflows of deposits. On thecontrary, they gained market share in the deposit markets. Hence, Basel III will increasethe demand for (long) deposits and will lead to more competition on savings and depo-sit markets.

116 NEW PARADIGMS IN BANKING, FINANCIAL MARKETS AND REGULATION?
l a r c i e r
Nevertheless, the new tightened capital requirements will represent a challengefor cooperative banks. The reason is that they cannot easily access capital mar-kets to issue new stocks and raise capital like listed banks12. Historically, cooper-ative banks have predominantly relied on retained profits to increase their capitalbuffers. Apart from the impassable road to issue stocks, the general pressure onbanking profitability due to increasing competition on domestic retail marketsmay pose difficulties for cooperative banks to significantly expand their capital
Remuneration Policies
In October 2010, CEBS issued a consultation paper on “Guidelines on RemunerationPolicies and Practices”. Member states and banks are expected to implement these gui-delines by 1 January 2011. The background is that the crisis was partly caused byremuneration schemes focusing on short-term economic performance rather than sus-tainability and long-term business targets. This created risk profiles that were not con-sistent with reliable and trusted banking practices.
However, excesses of remuneration systems did not occur at cooperative banks at thatscale. Cooperative banks operate more in retail banking markets where a bonus cultureis less prevalent than in wholesale and investment banking. In the latter markets, bonussystems provided payments immediately after selling the contract or closing a deal wit-hout paying little attention to the longer-term risks of the business (Eurofound, 2010).The Guidelines on Remuneration Policies were made suitable for cooperative banks.Initially, the proposal envisaged the obligation to pay a part of the variable remunera-tion in shares. However, ECBGs and other non-listed banks do not have shares. Con-sequently, cash pay-out plans for cooperative and non-listed banks were added to theGuidelines.
Leverage Ratio
One of the underlying features of the crisis was that mainly US banks were leveragedwith excessive on- and off-balance sheet leverage. Therefore, Basel III introduces a le-verage ratio to set a limit on the leverage in the banking system as a non-risk based‘backstop’ measure based on gross exposure. The two elements of the ratio are capital(numerator) and gross exposure (denominator) measures. Between 2013 and 2017, aminimum ratio of 3% will be tested. This proposed ratio will have a more severe impacton one bank than on another. ECBGs with a relatively large retail business may be putat a disadvantageous position. The reason is that the ratio is not risk adjusted, whereasretail activities contain relatively little risks. It is unsure yet whether all ECBGs will notbe limited in their activities by the leverage ratio. Hence, this remains a point of parti-cular interest for the time being.
12 This argument can be equally questioned for listed banks, though. The recent financial crisis has demonstratedthat these banks were unable to attract new high quality capital on the capital markets, when their capitalvanished into thin air as a result of substantial losses and write-downs. Instead, quite a few SHV needed statesupport.

THE COOPERATIVE BANKING MODEL: PERFORMANCE AND OPPORTUNITIES 117
l a r c i e r
levels via the approved method of retaining profits. In conclusion, it is essentialthat the overall calibration of the Basel package and its phasing-in do not createa non-level playing field to the detriment of cooperative banks. The higher capitalrequirements and scarcity of capital will undoubtedly raise the price of the mostimportant ‘production factor’ of banks, which will translate in higher credit inter-est rates. Like all other banks, cooperative banks will find it more difficult andmore expensive to attract funding on the public capital markets.
Another important feature is that current members cannot extract the capital ofthe bank and gain for themselves an inter-generation transfer: capital belongs tothe cooperative bank itself. Capital (reserves) is an endowment to be managed forthe benefit of current and future generations of members. Managers of a cooper-ative bank are effectively managers of an inter-generation endowment. Unlikewith SHV banks, ownership stakes are not marketable in that members cannotsell their ownership stakes in an open secondary market but in some cases can sellthem back to the bank. Of course, members can withdraw from the bank bywithdrawing funds (deposits). In a few cases, however, members may trademembership certificates in a closed market available only to members.
Cooperative banks are only rarely quoted on a stock exchange. In most cases thereare no external shareholders/owners who are not themselves members of thecooperative. Because of this, and the absence of a stock exchange listing, there isno market in corporate control in that it is virtually impossible for hostile bids forownership to take place: a cooperative bank cannot be bought by new owners.This does not mean that there is no need for cooperative banks to operate effi-ciently. If they are not efficient, they will be wiped out by competitors sooner orlater. As argued in Groeneveld and Llewellyn (2011), competition between coop-erative banks and their SHV counterparts is a major discipline on all banks com-peting in the same or similar markets and can certainly compensate for any allegedweaknesses in governance arrangements within both the STV and SHV sectors.
All other things being equal, the cost of capital for cooperative banks is lowerthan that of SHV banks because, unlike the latter, it is typically not required toremunerate externally held equity capital. This gives the bank a potential marginadvantage which can be used in various (good or bad) ways such as higher depositand/or lower lending rates to members. In addition, mutual support mechanismsbetween cooperative banks within Central Network Institutions that exist in var-ious countries contribute to high ratings. These collective guarantee schemesreduce, or even exclude, the risk of individual cooperative bank failure. Finally,high capital reserves and high ratings provide cooperative banks with opportuni-ties to obtain relatively cheap capital market funding, because this entails lessrisks for other creditors and thus lower risk premiums. The available evidencealso supports the argument that cooperative banks have relatively easy access to

118 NEW PARADIGMS IN BANKING, FINANCIAL MARKETS AND REGULATION?
l a r c i e r
a fairly cheap, risk-free and stable funding source, i.e. a relatively large depositbase. This contributes to a healthy balance sheet composition and high creditratings (Fitch, 2001 and Moody’s, 2003).
The funding situation of ECBGs has always been on a more stable footing thanthat of other banks. Their loan-to-deposit ratios have always hovered below theaverage of all other banks in the respective countries, though this gap has nar-rowed in the last years (Chart 5). This finding reflects the greater focus on retailbanking by cooperative banks. From 2001 up to 2006, this ratio has fluctuatedjust below 1.4 for the category ‘all other banks’. In the last three years of thesample, this indicator came down considerably to 1.2, mainly due stagnatingcredit growth to the non-financial sector. In 2009, the volume of outstandingloans even declined by almost 1 percent at ‘all other banks’, which clearly mir-rored their weakened capital position and limited room to expand their creditportfolio. By contrast, the solid capitalization of ECBGs enabled them to increasetheir lending to the non-financial sector in the economically dramatic year 2009by 3.5 percent.
Since deposit funding is part of the current ‘back to basics’ policy implementedby numerous banks, it will become an even more heavily demanded source offunding in the medium term. The new liquidity requirements under Basel III willalso intensify the demand for savings and deposits. However, the crisis hasresulted in an increased awareness of differences in risk profiles between banksamong the public. In the middle of the crisis, cooperative banks were demonstra-bly considered as safe havens for deposits. After the normalization of the situa-tion in banking markets, it is an open question whether and how long cooperativebanks can benefit from this ‘reputation’ premium. It is certain that competitionbetween banks will become fiercer (See Chart 5, p. 119).
7.3.5. Proximity to Customers: Dense Branch Networks
As many cooperative banks are locally based (even though they may be part of apowerful network) they typically have a close proximity to their customers. Thisgives the bank certain information advantages. Large branch networks also pro-vide cooperatives with an important, albeit declining, comparative advantage inretail markets (see Chart 2). Cooperative banks are literally and figurativelycloser to their customers and know those customers well through participation innumerous social networks. This is because the cooperative banking model centresabove all on ‘relationship banking’ via local presence. Proximity to their custom-ers is reinforced by actively supporting local communities. Finally, large branchnetworks facilitate mobilising and retaining a relatively cheap and importantfunding source, provided that their deposit rates are competitive with thoseoffered by competitors.

THE COOPERATIVE BANKING MODEL: PERFORMANCE AND OPPORTUNITIES 119
l a r c i e r
However, local or regional cooperative banks are often part of a network with anintegrated structure with extensive vertical and horizontal cooperation via a Cen-tral Network Institution (CNI) or APEX. Prime examples include Rabobank, OP-Pohjola and, to some extent, Crédit Agricole and Crédit Mutuel. These institu-tions centralise the provision of certain services and production processes, espe-cially where benefits of economies of scale are significant. The services and proc-esses provided range from back-office and representation services to others suchas centralised product, liquidity and risk management and the role as a supervi-sor. A unique feature is that such CNIs in some cases (such as Rabobank in theNetherlands) operate as internal central banks within the network of cooperativebanks. The APEX institutions are not particularly close to the end-customers andalso more difficult to monitor by members due to their remoteness and complexorganisation and activities.
7.3.6. Qualifications of the Cooperative Banking Model and Governance
These observable and actual features are generally considered benefits for coop-erative banks, but it is fair to make some important qualifications (Fonteyne,
Chart 5: Loan-to-deposit ratios of cooperative banks and national banking systems
Source: Calculations based on data from annual reports of ECBGs, the EACB and the ECB. Note: The data are adjusted for breaks in the time series resulting from acquisitions of non-cooperative banksby cooperative banks. The chart displays data of cooperative banks in Austria, Finland, France, Germany,Italy, the Netherlands and Spain and the entire banking sector in these countries excluding ECBGs. It con-cerns loans to and deposits from the non-financial sector.
0,6
0,8
1
1,2
1,4
1,6
0,6
0,8
1
1,2
1,4
1,6
1997 1999 2001 2003 2005 2007 2009
Cooperative banks Countries (excl. cooperative banks)

120 NEW PARADIGMS IN BANKING, FINANCIAL MARKETS AND REGULATION?
l a r c i e r
2007). For instance, it has become more difficult for members to monitor theorganisation due to the increased organisational complexity of cooperatives inwhich management is carried out by dedicated professionals. It is also argued thatmember ownership makes decision-making slower or hinders innovation andadjustment to new developments. Theoretically, members would have a reducedincentive to stimulate an optimum use of the high capital base (or excess capital),because they mostly do not have a direct claim to the capital (it is ‘capital in deadhands’). This could give rise to a risk of opportunistic investments by bank exec-utives outside the traditional core of the ECBGs. Evidence of these suspicions canbe found in their foreign operations. Large scale entry of foreign, and thus fairlyunknown markets could ultimately endanger the traditional cooperative heart ofthe organisation. Indeed, a rough historical examination reveals that substantiallosses and write downs of ECBGs mostly originated outside the cooperative heartof the organisations. However, in most ECBGs internal and external mechanisms(governance structures) exist to prevent serious agency conflicts that would putthe stability of the organisation in peril. Agency problems in SHV banks wereactually an important cause of the crisis.
In this respect, it must be noted that the introduction of external shareholders intoa cooperative system could create tensions regarding control. If capital is onlyprovided by members, the voting power as member of a cooperative bank and thevoting power as capital provider coincide within the same group. When owner-ship is shared with external capital providers, voting power will also have to beshared. Another qualification is that physical distribution networks of ECBGsimply large fixed costs. At the same time, the distribution of quite some financialproducts has shifted from expensive physical channels towards virtual channelsin the last decades.
7.4. The Value of ECBGs in National Financial Systems
The financial crisis has shaken up (inter)national banking market structures withfar reaching long term implications for competition, capacity, efficiency and prof-itability in banking. The understandable top priority for restoring and maintain-ing financial stability has led to large scale government intervention and distortedmarket conditions for cooperative banks. Be that as it may, regulatory and super-visory responses seem to ignore a very important underlying cause of the creditcrisis and of the global financial recession that followed in 2008-09. It concernsthe lack of financial diversity within the financial services system as a contribu-tory factor to these developments. Most financial services sectors, and those inthe United States and United Kingdom in particular, are dominated dispropor-tionally by a single business model, namely the large, shareholder-owned com-

THE COOPERATIVE BANKING MODEL: PERFORMANCE AND OPPORTUNITIES 121
l a r c i e r
pany13. The purpose of the shareholder value model is simply to maximize finan-cial returns to the shareholders.
This business orientation proved a lethal combination with the deregulation overthe past decades, which led to the creation of new financial instruments, and analmost uncontrollable desire to grow fast either organically or via (inter)nationalacquisitions into large international financial conglomerates. This trend has cul-minated in banks that are too important to fail and have received disproportion-ate taxpayer support during the crisis (Bank of England, 2010). These identicalbusiness models have caused a gradual and invisible erosion of financial stabilityuntil the crisis broke out. This notion appears to be dawning on the EuropeanCentral Bank as it states that diversity in business models at the macroeconomiclevel can offer benefits in terms of enhanced financial stability. The ECB addsthat: “if all banks in the system were to have similar business models, their assetswould be more likely to be invested in similar activities and, as a consequence,characterized by a larger degree of commonality” (ECB, 2010b, p. 33).
Part of the problem is that competition has been assessed on false notions for along time. It has been frequently argued that the number of banking firms deter-mines the level of competition. The crisis has clearly demonstrated the opposite.Competition depends more heavily on the variety in different business models,and surely not solely on the level of concentration. More competition does notresult from just adding more firms with the same business model but by alsoadding firms with different business models to those which are already there.Diversity in ownership and business orientation leads to diversity in risk appetite,management, incentive structures, policies and practices and behaviors and out-comes. It offers wider choice for consumers through enhanced competition thatderives in part from the juxtaposition of different business models (Michie,2010).
Policy makers and supervisors should therefore acknowledge the importance ofdiversity of ownership types and business models in banking (Ayadi et al., 2010).The crisis has clearly shown the added value or presence value of the cooperativebanking model. Fostering diversity in financial services also implies the acknowl-edgement of the specifics of cooperative banks. By nature, cooperative banks donot pursue highly aggressive growth strategies, which would conflict with theircorporate governance and prudent use of their capital. Hence, they stayed wellaway from critical financial thresholds. Cooperative banks are Stake-Holder-Value institutions with a fairly modest risk appetite.
13 For the United Kingdom, Michie and Llewellyn (2010) propose to convert the failed financial institutions, e.g.Northern Rock, into mutual organizations to rebalance the financial sector along more robust and sustainablelines. They assert that diversity of structure, risk taking, corporate behavior and enhancing competition in thefinancial sector will be promoted this way.

122 NEW PARADIGMS IN BANKING, FINANCIAL MARKETS AND REGULATION?
l a r c i e r
However, the contribution of cooperative banks to banking market structures isonly noticeable if the cooperative banking model enjoys a critical mass. Thismeans that financial cooperatives must have a certain market share to enable thatmodel to operate successfully and thus to provide real competitive pressure on theother players within in the market. This is not to argue that the cooperative modelis superior to other models, but that systemic advantages accrue through diver-sity. In addition, Cuevas and Fischer (2006) argue that a financial system thatpresents a diversified institutional structure, including institutional types, will bemore efficient in promoting economic growth and reducing poverty.
The point about the advantages of a variety of business models is closely relatedto the question of systemic stability. Chart 3 already illustrated that ECBGs per-formed less badly in the crisis than national banking sectors. The impact of coop-erative banks on the stability of national financial systems can be better assessedby calculating the so-called Z-scores. The Z-score is used to analyse the financialsoundness of ECBGs versus entire banking system in which they operate. The Z-score is determined by three factors: the return on assets (ROA), the equity capitalas a share of assets (E/A) and the stability of the return on total assets ( (ROA)).The Z-score indicates how many standard deviations from the mean income haveto fall to make the institution insolvent by depleting its equity. It is a measure ofbank risk and indicates a bank’s capacity to absorb deviations in income. Thehigher the value, the more stable is the bank and the lower is the probability ofdefault (Mercieca et al., 2007). The Z-score is calculated as follows:
Chart 6 plots the average Z-score for a number of ECBGs and for entirenational banking systems. In the entire time span, the Z-score of ECBGs is asmuch as twice as high as the Z-score of the entire banking system. The Z-scoresof both categories dropped in 2008, but improved again in 2009. The largestimprovement took place at ECBGs. According to this measure, and based onthis sample and time series, ECBGs are more stable, which is in line with thefindings of existing other studies (Cihák and Hesse, 2007; Beck et al., 2009;Ayadi et al., 2010)14. This relative stability could be attributed to the inherentlylow profitability in good times and the use of consumer surplus as a buffer inhard times to keep proceeds relatively fixed over time. Iannotta et al. (2007) alsohighlight that the better loan quality and lower asset risk of ECBGs is a sourceof stability.
14 In all countries other than Austria, ECBGs are significantly more stable than entire banking systems. In Luxem-bourg, the Netherlands and Switzerland, ECBGs enjoy Z-scores which are 70 to 100 percentage points higherthan Z-scores of the respective entire banking systems. The entire Austrian banking sector appears to be morestable than both ECBGs (Raiffeisen Banking Group and Volkbanken Group).
Z-score ROA E/A+( ) σ ROA( )⁄=

THE COOPERATIVE BANKING MODEL: PERFORMANCE AND OPPORTUNITIES 123
l a r c i e r
In terms of the three components, the ratio of equity/total assets (E/A) at ECBGsis systematically higher (Chart 7). This again supports the notion that cooperativebanks maintain larger capital buffers, on average. A notable feature is that thelevel of E/A declined significantly in the entire banking system since 2003. At thesame time, this ratio improved at ECBGs up to 2008. A possible reason is thattotal assets rose strongly at commercial banks and that they only partly retainedtheir profits according to the wishes of their shareholders. Hence, ECBGs enteredthe crisis with larger buffers. The drop in the E/A ratio of ECBGs in 2008 can belargely attributed to declining E/A ratios of Austrian and French ECBGs. Theysuffered substantial capital losses in their foreign, more risky operations. In 2009,all banks made up their capital losses and strengthened their capital position. Forthe entire banking system, improvements in this ratio were to some extent causedby capital injections and government support.
By contrast, the return on assets (ROA) was somewhat lower for ECBGs up to2008. This is again a reflection of their business model focussing on the maximi-sation of customer value. In 2008, the ROA of entire banking systems plungedmuch stronger than the ROA of ECBGs. In 2009, the ROA of ECBGs and entire
Chart 6: Average Z-score for ECBGs and entire banking systems
Source: Annual reports of cooperative banking groups and data from national central banks and/or supervi-sors.Note: The chart displays data of ECBGs in Austria, Finland, France, Germany, Italy, Luxembourg, the Neth-erlands, Spain and Switzerland and the entire banking systems in these countries.
0
10
20
30
40
50
60
70
0
10
20
30
40
50
60
70
2001 2002 2003 2004 2005 2006 2007 2008 2009 2010
Entire banking systemCooperative banks

124 NEW PARADIGMS IN BANKING, FINANCIAL MARKETS AND REGULATION?
l a r c i e r
banking systems improved again, but did not reach their pre-2008 levels. Thethird component of the Z-score, the volatility of profits, was on average 25 per-centage points lower at cooperative banks in the entire sample, again in line withtheoretical expectations. This can be largely explained by the relatively extensiveretail operations of ECBGs, which on the whole generate more stable profits inless risky banking markets. In this respect, cooperative banks have possibly anincreased ability to smooth their profit streams, giving them an additional boostin terms of stability.
7.5. Opportunities and Challenges of Financial Cooperatives in the Future Financial System
It is generally accepted that the recent financial crisis will change the economicand political environment of the banking industry stronger than any other eventduring the last decades. The crisis has brought to light the serious challenges thatthe European financial services sector is facing. Hence, cooperative banks areconfronted with a wide array of far-reaching regulatory and policy measures to
Chart 7: Equity to assets ratio of ECBGs and entire banking systems
Source: Annual reports of cooperative banking groups and data from national central banks and/or supervi-sors.Note: The chart displays data of ECBGs in Austria, Finland, France, Germany, Italy, Luxembourg, the Neth-erlands, Spain and Switzerland and the entire banking systems in these countries.
2001 2002 2003 2004 2005 2006 2007 2008 2009 2010
Entire banking systemCooperative banks
7.0%
6.8%
6.6%
6.4%
6.2%
6.0%
5.8%
5.6%
5.4%
5.2%
5.0% 5.0%
5.2%
5.4%
5.6%
5.8%
6.0%
6.2%
6.4%
6.6%
6.8%
7.0%

THE COOPERATIVE BANKING MODEL: PERFORMANCE AND OPPORTUNITIES 125
l a r c i e r
reduce the risk of future financial crises, despite their recent good performanceand solid track record. The other side of the picture is that some discussions andproposals hardly apply to cooperative banks. For example, the question of under-capitalization does not really pertain to cooperative banks. Moreover, the possi-ble introduction of general banking taxes or resolution funds could be interpretedas a punishment for ‘good and prudent’ behavior by cooperative banks andwould ignore their stabilizing impact amidst the crisis. The losses and write-downs related to the initial credit crisis were largely suffered outside their tradi-tional home markets and have been completely covered by financial cooperativesthemselves (EACB, 2010). Domestic banking based on cooperative principles hasproven to be a solid shock absorber and robust backbone of the entire coopera-tive banking organization.
From these bare facts, it automatically follows that European cooperative bankshave contributed to financial stability in their home markets in the middle of thefinancial crisis. They neither caused nor added to the financial turbulences andfollowing economic recession. This achievement has increased the interest in theirbanking model among analysts, policy makers and supervisors. Earlier criticismabout tedious decision making processes resulting from the cooperative govern-ance (Fonteyne, 2007), inefficiencies in their business and distribution conceptsand their potentially detrimental effect on market conditions for other banks (PAConsulting Group, 2003) has died down15. The recent performance and decadesof experience of prudent management demonstrate the presence and added valueof financial cooperatives in national financial systems.
The banking sector will undergo further drastic changes and has to adapt to thelong term consequences of the crisis. Competition will increase, operationalexcellence is necessary, equity and liquidity ratios will – have to – rise and profit-ability is consequently constrained. Moreover, the influence of economies of scaleand scope will become stronger. These changing market conditions and bankingstructures will have a tremendous impact on financial cooperatives as well. Thesuggested supervisory, regulatory and policy reforms urge cooperative banks toemphasize their special features and recent achievements and performance. Poli-cymakers and regulators have to be kept aware of the specifics of cooperativebanks. It would be unfair if these banks would ultimately become victims ofreforms and policy proposals meant to discipline SHV banks that were largelyresponsible for the emergence of the crisis. Particularly, they should stress theirvisible contribution to diversity within banking systems. Cooperative banks
15 The line of reasoning of PA Consulting Group (2003) that cooperative banks spoil market conditions for profitor shareholder-orientated banks and may eventually undermine financial stability, is fairly far-fetched and ener-vated by recent events. ECBGs did not need taxpayer recapitalization and were surely not the cause of excessiverisky behavior by commercial banks in the area of securitization or off balance sheet activities to achieve size-able profits. Cooperative banks simply have a profit target that is based on the objective to serve customers ona continuity basis.

126 NEW PARADIGMS IN BANKING, FINANCIAL MARKETS AND REGULATION?
l a r c i e r
should not stop pushing for establishing an agenda that encourages alternativefinancial institutions that will provide competition to the commercial bankingsector, expand access to financial services and promote stability within the finan-cial sector.
Apart from these necessary efforts to raise the familiarity of the cooperative bank-ing model, the analysis of this paper indicates that ECBGs appear to be well posi-tioned to benefit from the opportunities resulting from the financial crisis due totheir long standing business philosophy and good reputation among customers.For instance, ECBGs already comply with most of the ‘new’ ethical and moralrequirements in banking; they already have to take into account the interests ofmany stakeholders, pursue a low risk business model with a strong retail orienta-tion, have a strong capitalization and do not aim at profit maximization whichreduces the probability of excessive risk taking and the existence of exorbitantcompensation schemes. Besides, most financial cooperatives have a diversifiedportfolio of activities. The appreciation of a diversified banking model hasincreased considerably, because specialized banks were particularly affected bythe financial crisis (ECB, 2010b).
But one has to bear in mind that cooperative banking is not by definition betterthan other banking models and after all, past performance is not a guarantee offuture success. Irrespective of the merits and drawbacks of different governancearrangements in the cooperative and SHV sectors in banking, there is merit indiversity. No governance model is unambiguously superior and it needs to reflectthe nature and ownership structure of different businesses. Thus, the main con-clusion is that cooperative banking is not a panacea for post-crisis banking ingeneral, but should be viewed as a viable, enduring and parallel alternative to theSHV banking model that has been in the spotlight for most of the time in recentdecades. There is no presumption that the STV model is to be regarded as thenorm as SHV and cooperative banks have equal status as contributors to theservices provided by the financial sector of the economy. The strength of compe-tition lies in diversity with different models playing to their particular strengths.
References
AYADI, R., LLEWELLYN, D., SCHMIDT, R.H., ARBAK, E., DE GROEN, W.P., 2010,Investigating Diversity in the Banking Sector in Europe: Key Developments,Performance and Role of Cooperative Banks, Centre for European PolicyStudies, Brussels.
BANK OF ENGLAND, 2010, Financial Stability Report, Issue No. 27, June, Bankof England.

THE COOPERATIVE BANKING MODEL: PERFORMANCE AND OPPORTUNITIES 127
l a r c i e r
BASEL COMMITTEE ON BANKING SUPERVISION, 2010a, A global regulatory frame-work for more resilient banks and banking systems, Basel, 16 December2010.
BASEL COMMITTEE ON BANKING SUPERVISION, 2010b, “Consultative Document:Pillar 3 Disclosure Requirements for Remuneration”, Basel.
BECK, T., HESSE, H., KICK, T. and VON WESTERNHAGEN, N., 2009, Bank Own-ership and Stability: Evidence from Germany, Bundesbank Working PaperSeries.
CEBS, 2010, Consultation Paper on Guidelines on Remuneration Policies andPractices, 10 October 2010, London.
IHÁK, M. and HESSE, H., 2007, Cooperative Banks and Financial Stability, IMFWorking Papers, No. WP/07/02, SSRN, International Monetary Fund,Washington. D.C.
CUEVAS, C.E., FISCHER, K.P., 2006, Cooperative Financial Institutions: Issues inGovernance, Regulation and Supervision, World Bank Working PaperNo. 82.
ECONOMIST, THE, 2010, Europe’s cooperative banks: mutual respect, 21st of Jan-uary, 2010.
EACB, 2005, Cooperative banks in Europe: values and practices to promotedevelopment, Brussels.
EACB, 2006, Corporate Governance Principles in Co-operative Banks, Brussels,June 2006.
EACB, 2007, Cooperative banks: Catalysts for economic and social cohesion inEurope, March 2007, Brussels.
EACB, 2010, European Cooperative Banks in the Financial and Economic Tur-moil: First Assessments, Research Paper, European Association of Cooper-ative Banks, Brussels.
ECB, 2010a, Financial Integration in Europe, Frankfurt am Main, April 2010.
ECB, 2010b, EU Banking Structures, Frankfurt am Main, September 2010.
ECB, 2010c, Beyond RoE: How to measure bank performance, Appendix to theReport on EU Banking Structures, Frankfurt am Main, September 2010.
EUROFOUND, 2010, Financial services: Challenges and prospects, Overviewreport, Dublin, Ireland.
FITCH RATINGS, 2001, The European Cooperative Banking Sector, Financialinstitutions Special Report, by analyst A. Le Bras, November 2001.
FINANCIAL STABILITY BOARD, 2009, FSB Principles for Sound CompensationPractices Implementation Standards, 25 September 2009.
FINANCIAL STABILITY BOARD, 2010, Thematic Review on Compensation, PeerReview Report.

128 NEW PARADIGMS IN BANKING, FINANCIAL MARKETS AND REGULATION?
l a r c i e r
FINANCIAL STABILITY FORUM, 2008, Report of the Financial Stability Forum onEnhancing Market and Institutional Resilience, Basel.
FONTEYNE, W., 2007, Cooperative Banks in Europe – Policy issues, IMF Work-ing Paper.
G20, 2009a, Global Plan for Recovery and Reform, Communiqué, London,2 April 2009.
G20, 2009b, Declaration on Strengthening the Financial System, Communiqué,London, 2 April 2009.
GROENEVELD, J.M., 2011, “Morality and Integrity in Cooperative Banking”,Ethical Perspectives, Vol. 18, No. 4, pp. 515-540.
GROENEVELD, J.M. and SJAUW-KOEN-FA, A., 2009, Cooperative banks in thenew financial system, report prepared by Rabobank for the IMF/WorldBank meeting in Istanbul, Turkey, October 2009.
GROENEVELD, J.M. and DE VRIES, B., 2009, “European Cooperative banks: Firstlessons of the subprime crisis”, The International Journal of CooperativeManagement, Vol. 4, No. 2, September 2009, pp. 8-21.
GROENEVELD, J.M. and LLEWELLYN, D.T., 2011, “Corporate Governance inCooperative Banks, Working Paper Rabobank Nederland, Utrecht, theNetherlands.
IANNOTTA, G., NOCERA, G., SIRONI, A., 2007, “Ownership Structure, Risk andPerformance in the European Banking Industry”, Journal of Banking andFinance, Vol. 31, Issue 7, pp. 2127-2149.
IMF, 2010, Global Financial Stability Report: Meeting New Challenges to Stabil-ity and Building a Safer System, International Monetary Fund, WashingtonDC. April 2010.
KALMI, P., 2007, “The disappearance of co-operatives from economics text-books”, Cambridge Journal of Economics 2007, 31, pp. 625-47.
KODRES, L. and NARAIN, A., 2010, Redesigning the Contours of the FutureFinancial System, IMF Staff Position Note, August 16, 2010, SPN/10/10.
MERCIECA, S., SCHAECK, K. and WOLFE, S., 2007, “Small European Banks: Ben-efits from Diversification?”, Journal of Banking and Finance 31, pp. 1975-98.
MICHIE, J., 2010, Promoting corporate diversity in the financial services sector,Kellogg College, University of Oxford.
MICHIE, J. and LLEWELLYN, D.T., 2010, “Converting failed financial institutionsinto mutual organizations”, Journal of Social Entrepreneurship, Volume 1,Number 1, pp. 146-170.
MOODY’S, 2003, European Cooperative Banks: Moving Beyond Issues of Costsand Efficiency, Moody’s Investors service, Special Comment by A. Cun-ningham, London.

THE COOPERATIVE BANKING MODEL: PERFORMANCE AND OPPORTUNITIES 129
l a r c i e r
MOOIJ, J. (ed.), 2009, Rabobank matters, Rabobank, Utrecht, The Netherlands.
OLIVIER WYMAN, 2008, Cooperative Bank: Customer Champion, FinancialServices.
PA CONSULTING GROUP, 2003, Mutually assured destruction?, PA Consulting,London.
THE DE LAROSIÈRE GROUP, 2009, Report of the High Level Group on FinancialSupervision in Europe, Brussels, 25 February 2009.


131
l a r c i e r
8. COMPETITION ON THE POLISH BANKING MARKET
(BEFORE THE FINANCIAL CRISIS AND DURING
THE CRISIS) – EMPIRICAL RESULTS1
Malgorzata Pawlowska
Abstract
The aim of this analysis is to assess the changes in the level of competition of thePolish banking sector in the period between 1997 and 2009 (before the financialcrisis and during the crisis) with the use of quantitative methods based on thetheory of competition measurement in the banking sector (the Industrial Organi-sation Approach to Banking). In this paper three models have been used for eval-uation of the competition: Panzar and Rosse (P-R) model, Lerner index andBoone’s Indicator.
The results of the empirical analysis concerning the Polish banking sector demon-strated that between 1997-2007 and 2008-09 (before and during the financialcrisis) commercial banks in Poland operated in the environment of monopolisticcompetition. The level of competition before the crisis in the Polish banking sectorwas similar to the level of competition in banking sectors of euro zone countries(as indicated by values of the Panzar and Rosse measure).
Results of the competition measurement with all the methods used (P-R method,Lerner index and Boone method) demonstrated a strong increase in competitionbetween 1999-2004 caused by Poland’s accession to the EU and slight decrease incompetition in 2008-09 caused by financial crisis.
JEL Codes: F36; G2; G21; G34; L1.
Keywords: Competition; Concentration; Market structure, Panzar-Rosse Model,Boone Indicator, Lerner Index.
Introduction
In the period of 1997-2009 rapid changes were made in the Polish banking sectorwhen the ownership structure changed and consolidation processes intensified.However, it should be noted that consolidation processes in the Polish bankingsector were to a great extent a natural consequence of the earlier privatisation ofdomestic banks and attracting strategic investors for those banks as well as thefact that an increased number of mergers took place in the euro zone countries.Due to the fact that foreign capital in banks operating in Poland comes largelyfrom the euro zone countries, the factors that triggered changes in the competi-
1 The views expressed in this paper are the views of the author and do not necessarily reflect those of the NationalBank of Poland.
132 NEW PARADIGMS IN BANKING, FINANCIAL MARKETS AND REGULATION?
l a r c i e r
tion in banking systems of the euro zone countries also had an indirect impact onthe Polish banking sector.
The aim of the study is to estimate the level of competition in the Polish bankingsector in 1997-2009 (before the financial crisis and during the crisis) with the useof quantitative methods based on the theory of competition measurement in thebanking sector (the Industrial Organisation Approach to Banking). The degree ofcompetition in the Polish banking sector was estimated with the use of three mod-els: Panzar and Rosse (P-R) Model, Lerner index and Boone’s method. In orderto determine the impact of the establishment of the euro zone (in 1999) and theaccession of Poland to the European Union (1 May 2004) and financial crisis(between 2008-09) on changes in the level of competition, the latter was meas-ured for the following periods: 1997-982,1999-2003, and 2004-073, 2008-094.
Between 1997 and 2007 (before the financial crisis), competition in the Polishbanking system was the effect of numerous different determinants, such as glo-balisation, deregulation, progress in IT technologies, progress in European inte-gration, implementation of FSAP programme and implementation of the NewCapital Accord (Basel II). Between 2008-09, the main source of short and mid-term threats for Polish economy, and thus for banking sector were external fac-tors, caused by ‘subprime crisis’ in 2007 which in 2008 transformed into globalcrisis of the financial system. In 2009 very strong disturbance in functioning offinancial markets slowly started to transfer to the real economy. Thus the finan-cial crisis transformed into an economic crisis. Between 2008-09, also the finan-cial crisis had the main impact on the competition in the Polish banks.
Liberalisation had an impact on the increase in the competition of the financialintermediaries and also on the financial crisis. The same channels (before the cri-sis – increase in mergers and acquisitions and deregulation and during the crisis– increase in mergers and acquisitions as well and new regulations) which affectedchanges in the competition of banking sectors in the euro zone countries, affectedthe Polish banking sector due to the involvement of capital from the euro zone.
The results of the empirical analysis concerning the Polish banking sector demon-strated that between 1997 and 2009 (before and during the financial crisis) com-mercial banks in Poland operated in the environment of monopolistic competi-tion. The level of competition in the Polish banking sector was similar to the levelof competition in banking sectors of the euro zone countries (as indicated byvalues of the Panzar and Rosse measure). Results of the competition measure-ment with all the methods used (P-R method, Lerner index and Boone method)demonstrated a strong increase in competition between 1999-2003 caused by
2 Period prior to euro introduction.3 Period after the accession of 10 new countries (including Poland) to the European Union.4 Period of financial crisis.

COMPETITION ON THE POLISH BANKING MARKET 133
l a r c i e r
Poland’s accession to the EU and slight decrease in competition between 2008-09caused by the financial crisis.
The study consists of four parts and a summary. The first part presents the broadscope of the research methods for the measurement of competition. The secondpart contains an overview of the literature concerning competition measurementin EU banking sectors. The third part describes structural and technologicalchanges in the Polish banking sector in 1997-2009 causing changes in competi-tion. The fourth part presents the results of the analysis of changes in the degreeof competition of the Polish banking sector (based on data from balance sheetsand profit and loss accounts of commercial banks) with the use of three models:Panzar and Rosse (P-R) model, Lerner index and Boon’s indicator. The last partpresents conclusions.
8.1. Methods of Competition Measurement
Competition in the banking sector is analysed through the market force and effec-tiveness measure. Research on competition is currently conducted as part of theindustrial organisation approach to banking.
The following research trends can be distinguished in literature concerning theresearch on competition: a trend developed on the basis of economic theoriesinvestigating the Industrial Organisation (IO)5 and the New Empirical IndustrialOrganisation Theory (NEIO). The traditional IO theory comprises the followingtheories: structure-conduct-performance paradigm (SCP) describing the relation-ship between the market structure, company conduct and the performance, anda theory based on the efficient structure hypothesis (ESH).
The structure-conduct-performance paradigm (SCP) based on testing the rela-tionship between the market structure, company conduct and its performance,was defined by Bain (1951), thus concepts such as Bain’s research programme orBain’s paradigm are also found in the literature. According to this approach, mar-ket performance depends on the market conduct which is determined by the mainelements of the market structure determining its competitiveness. Under the SCPtheory the mechanism of the market structure’s influence on competitive conductand the results of management come down to a conventional approach to therelationship between the level of competition and the market structure. Thisapproach is based on the assumption that a higher concentration is accompaniedby lower competition between companies. The above theory assumes that the
5 In the above theory that deals with market organisation and competition, behaviour of firms is investigatedunder certain limitations imposed by consumers and competitors. The central issue of this theory was an expan-sion of the micro-economic analysis with imperfectly competitive markets and the main model discussed in thistheory is the oligopoly model. Cf. Łyszkiewicz (2002).

134 NEW PARADIGMS IN BANKING, FINANCIAL MARKETS AND REGULATION?
l a r c i e r
probability of collusion is higher in a more concentrated system. Market collu-sion leads to higher prices (increase in margins) for consumers and higher busi-ness profitability for firms (banks).
The theory based on the efficient structure hypothesis was developed by econo-mists connected with the Chicago School: Demsetz (1973) and Peltzman (1977).The authors of the ESH theory proposed a different approach to explaining therelationship between the market structure and firm performance, i.e. an approachbased on the efficiency. The theory based on the ESH also defines a positive influ-ence of concentration on the performance, similarly to the SCP theory, howeverthe justification for that phenomenon is different. According to the ESH theory,more efficient firms have lower operating costs and therefore achieve higher prof-its. In addition, the ESH theory assumes that if a firm (bank) is more efficient thanother competitors, it must choose between two mutually exclusive strategies. Thefirst strategy concerns the maximisation of profit for shareholders by maintainingexisting prices and the firm’s size. According to the other strategy, profit maxim-isation consists in price reduction, thus in increasing the firm’s market share.Under those assumptions, increasing efficiency of firms leads to higher concentra-tion. Therefore, the size of the market share reflects approximately the degree ofbusiness efficiency and for this reason it is positively correlated to the profitabil-ity. According to the ESH, concentrated markets are markets where highly effec-tive firms (banks) operate. However, higher profits of firms with high marketshares do not result from their power (size) but from higher effectiveness whichcreates their power. It should be noted, that the ESH theory was criticised by someeconomists who proved that its theoretical and empirical foundations are weakbecause concentrated markets are relatively less efficient.
Both in the SCP model and the ESH model the measures of market concentration(i.e. CRk and Herfindahl-Hirschman indices) are used for explaining reasons fornon-competitive behaviours and are also treated as measures of the consequencesof different efficiency of market players6. Both in SCP and ESH models, empiricalresearch consisted in adopting a specific initial market structure and in formulat-ing and testing hypotheses on the basis of the sign and value of individual param-eters in the models. As a consequence of using such methodology, the marketstructure, determining the behaviour of firms, was usually used in structural mod-els as an exogenous variable.
An incentive for developing a new analytical theory of competition (NEIO) in theearly 1970s was abstracting the market structure as an endogenous variable. Theauthors of the new theory dealing with market organisation and competitionstated that the market form is created evolutionarily and depends on many mar-ket characteristics as well as strategic behaviours of firms/banks themselves.
6 Pawłowska (2005), p. 12.

COMPETITION ON THE POLISH BANKING MARKET 135
l a r c i e r
According to NEIO, the concentration is an endogenous variable and depends onthe behaviours of individual market players that are exogenous from the firm’sperspective (Breshnahn (1988)).
Methods based on NEIO do not take into account the direction of changes in thelevel of concentration and they presume that the degree of competition does notalways depend on concentration measures because other market characteristics,such as dynamic barriers to entry and exit, are more important. According to thenew NEIO competition theory, when assessing the intensity of competition twofactors should be assessed jointly: the level of concentration and the scope of thepossibility to enter a particular industry, determined by dynamic barriers to entry.Therefore, structural concentration measures are excluded in the measurement ofthe competition level.
In the contestable markets theory (CMT), proposed for the first time by Baumol(1982), regarded as a non-structural model, authors explicitely take into consid-eration strategic behaviours of firms/banks and the presence of potential compe-tition. According to CMT, the absence of barriers to entry and exit forces analready existing firm to take into account the possibility of new firms entering themarket (potential competitors)7.
Methods based on the new empirical industrial organisation (NEIO) include theIwata method (1974), Bresnahan (1989) and Lau method (1982), andPanzar-Rosse (1987) model, the Panzar and Rosse provided a measure calledthe H statistic8. The Panzar and Rosse approach (P-R) also has some limita-tions: general limitations are the assumptions underlining its use as a measureof competition in banking industry as well as the resulting biases. Furthermore,Bikker et al. (2007a) provided empirical evidence that the level of competitionin the banking industry in the existing empirical P-R literature is systematicallyoverestimated. The reason for the misspecifications is that most studies use dif-ferent definitions of the appropriate variable to represent banks’ revenue (moststudies use scaled versions of bank income as the dependent variable in the P-Rmodel and work with revenues divided by total assets, but scaling changes thenature of the model fundamentally, since it transforms the revenue equationinto a price equation). However, despite these limitations, the P-R model hasbeen extensively applied to the banking sector in a number of countries.
Alternative indicator of the degree of competition in banking markets based onthe NEIO theory empirical research is the estimation of the Lerner index, widelyused in the specific case of banks on the basis of the Monti-Klein oligopolisticmodel9. In the Lerner index, it is the mark-up of price (average revenue) over
7 Łyszkiewicz (2002), p. 266.8 For more formal specification see: Bikker (2004, pp. 85-86).9 Freixas and Rochet (2008), pp. 72-73.
136 NEW PARADIGMS IN BANKING, FINANCIAL MARKETS AND REGULATION?
l a r c i e r
marginal cost and the divergence of price. The higher the mark-up, the greater isthe realized market power.
Recently, literature on the measurement of competition in the banking sectoruses, apart from a widely used Panzar-Rosse measure (1987) and the Lernerindex, the so-called Boone indicator, proposed by Boone (2000), which is basedon the ESH. Boone assumed that more efficient firms (with lower marginal costs)have greater market power and thus achieve higher profits. The higher the com-petition, the stronger this effect is. In order to support this quite intuitive marketcharacteristic, Boone developed a broad set of theoretical models (see Boone,2000, 2001 and 2004). Boone proved that the market shares of more efficientbanks (that is, with lower marginal costs MC) increase both under regimes ofstronger substitution and amid lower entry costs (see. Leuvensteijn et al. (2007)).Of note is that the Boone indicator model, like every other model, is a simplifica-tion of reality. Efficient banks may choose to translate lower costs either intohigher profits or into lower output prices in order to gain market share. Hence,like many other model-based measures, the Boone indicator approach focuses onone important relationship, affected by competition, thereby disregarding otheraspects (see also Bikker and Bos, 2005).
8.2. Results of the Measurement of Competition in European Banking Sectors – Overview of Literature
The importance of competition in the financial sector is the subject of research bybank analysts because the degree of competition in the financial sector may influ-ence the effectiveness of financing and availability of financial services to compa-nies and households and may have an impact on the quality of products but morecompetitive pressure may increases the probability of a crisis). Empirical cross-country investigation in this research area related primarily to the issue of theinfluence of competition in the financial sector on its stability, the access to exter-nal financing and the economic development. In addition, the relationshipbetween market concentration, market regulation and the level of competitionwas analysed.
The establishment of the euro zone also posed a challenge to analysts conductingresearch on the degree of competition. It was expected that accession to the eurozone would increase competition in the financial sector, exert pressure on banks’profitability, causing an increase in the efficiency of financial institutions (ECB1999). It was argued that the accession to the euro zone would change the posi-tion of the bank being the main financial intermediary (disintermediation), whichmight cause changes in the financial result and an increase in competitive pressurefrom the capital market (McCauley and White 1997). In view of these challenges,
COMPETITION ON THE POLISH BANKING MARKET 137
l a r c i e r
the banking system of the euro zone countries undertook appropriate strategicprecautionary measures to increase the effectiveness by, among others, improvingthe quality of services, reducing costs, developing alternative sources of incomethrough geographic expansion (ECB 1999). Banks became involved in mergersand acquisitions, in particular cross-border M&A transactions, and entered intostrategic alliances10. The greatest wave of mergers was recorded just before euroadoption and in subsequent years the pace of consolidation slowed down. How-ever, the number of financial institutions in the euro zone has been decreasingcontinually.
It should be noted, however that the number of empirical studies concerningsolely changes in the competition in the financial sector in the Economic andMonetary Union (ex post) on the basis of quantitative methods is not high andpanel studies (cross-country) are still at their initial development phase and nounequivocal conclusions have been made yet. The majority of papers written sofar concerns a broad issue of the financial integration.
One of the few empirical studies using cross-country statistics that relate specifi-cally to the impact of joining EMU on increased competition in the financial sec-tor was carried out by Utrero-Gonzalez and Callado-Muñoz (2007). Using acomparative analysis of changes in the degree of competition of the banking sec-tors in the euro and the non-euro area countries, and the P-R methodology, theauthors demonstrated a positive impact of the single currency on increased com-petition in the euro area banking sector. Furthermore, Boucinha and Ribeiro(2009) confirmed increase in competition in the Portuguese banking system dueto the euro area participation, as well Luis Gutiérrez de Roza (2007) for Spanishbanks. Increased competition in the credit market in the euro area countries wasalso reported by Leuvensteijn et al. (2007). Leuvensteijn et al. (2007) were thefirst which applied a new measure of competition – the Boone indicator – in thecredit market in the euro area countries. However, the paper pointed to differ-ences in the degree of competition among the euro area countries.
Another issue, is the link between competition and concentration. A number ofanalysts, who investigated the trade-off between competition and concentration,found that there is no evidence that banking sector concentration negativelyrelates to the level of competition, Gelos and Roldos (2002) using the P-R meth-odology and BankScope data, found that banking markets in Central Europeancountries (including Poland), did not become less competitive, even though con-centration increased. Above results were confirmed by Yildrim and Philippatoas(2007) and by Claessens and Laeven (2004) on cross-country research (including
10 In 2005 cross-border transactions accounted for 51% of total M&A transactions – due to the merger ofUnicredito and HypoVerensbank, ABN Amro and Banca Antonveneta as well as Swedbank and Hansabank.

138 NEW PARADIGMS IN BANKING, FINANCIAL MARKETS AND REGULATION?
l a r c i e r
Poland). Hempell (2002) reached a similar conclusion related to the Germanbanking industry and Coccorese (2004) related to the Italian banking industry.Fillipaki and Staikouras (2006) showed that banks in the new EU countries,among others in Poland, operate under conditions of stronger competition thanthe old EU countries, due to lower market entry barriers and the presence offoreign capital.
A cross-country analysis for Central and Eastern European countries was alsoconducted by Philippatos and Yildirim (2003) between 1993 and 2000 and byKoutsomanoli-Fillipaki and Staikouras between 1998 and 2002. The results oftheir analyses indicated there existed monopolistic competition in most analysedbanking sectors in Central and Eastern European countries. In addition, Koutso-manoli-Fillipaki and Staikouras (2006) concluded that between 1998 and 2002only in EU-10 countries, due to lower barriers to entering the market and anincrease in the share of foreign capital, the increase in concentration did not causea decrease in the level of competition in the analysed period.
Bikker (2004) reported that Herfindahl-Hirschman (HHI) indices and the k bankconcentration ratios (CRk) tend exaggerate the level of competition in small coun-tries and are increasingly unreliable when the number of banks is limited. Howeverin recent papers, Bikker et al. (2006) and (2007a), (2007b) demonstrated that thelevel of competition in the existing P-R literature was systematically overestimated(all 28 studies considered – included above mention studies – suffered from thesetypes of misspecification). The reason of this misspecifications was that the moststudies used scaled version of bank income as the dependent variable in the P-Rmodel and work with revenues divided by total assets. With the correctly specifiedP-R model Bikker et al. proved that monopoly or perfect cartel cannot be rejectedin 28% of the analyzed countries (against 0% in the misspecified model). Theyanalysis has made clear that further consolidation would reduce competitionamong banks, which would impair the welfare of consumers and companies.
Finally, Bikker and Spierdijk (2008) who were the first to analyse changes incross-country competition in 101 countries in the period of the last 15 years,using proper dependent variable in P-R model, found significant changes in thedegree of competition in the analysed countries. In addition, they reported adecrease in competition in the banking sector of Western Europe (in particular, inthe euro area) and an increase in competition in the banking sectors of EasternEurope and that the degree of competition between banking sectors of the ‘old’and the ‘new’ EU levelled off. The reason for the decrease in competition in thebanking sector of Western economies was, on the one hand, the establishment ofvery large banks with considerable market strength. On the other hand, thechange of the banks’ role as the key financial intermediaries, owing to the increas-

COMPETITION ON THE POLISH BANKING MARKET 139
l a r c i e r
ing significance of the capital market in lending to enterprises and the increase inbanks’ non-interest income.
Using the Lerner index, Angelini and Cetorelli (2003) demonstrated an increasein competition despite an increase in concentration in the Italian banking sector(between 1984 and 1997 the market power decreased); de Guevara et al. (2004)demonstrated an increase in competition between 1992 and 1999 in Germanyand UK; Fischer and Hempell (2005) confirmed an increase in competition in theGerman banking sector between 1993 and 2001. However, de Guevara and Mau-dos, (2004, 2007); de Guevara et al., (2007); Carbó and Rodrıguez, 2007; foundthe reduction of competition during the 90s and higher Lerner index in EMUcountries.
Finally, Carbó et al. (2009) found using five measure of competition (net interestmargin (NIM), Lerner index, return on assets (ROA), H-statistic, HHI marketconcentration index) that the various indicators of competition yield differentresults about competitive behaviour due to that fact that those competition indi-cators measure different things.
8.3. Structural and Technological Changes in the Polish Banking Sector between 1997 and 2009
Deregulation in 1989 radically restructured the banking system in Poland11 andin the majority of the new EU countries. It started the process of privatization andconsolidation of the banking industry, previously dominated by very few govern-ment-controlled banks. Currently, the financial system in Poland is mainly basedon commercial banks whose share in assets of the financial sector as a whole isapproximately 70%. The role of other financial institutions has been increasingsteadily, although it is still low.
The period of 1997-2009 was a period of rapid changes in the Polish bankingsector when the ownership structure changed and consolidation process intensi-fied. However, it should be noted that the consolidation process in the Polishbanking sector was to a great extent a natural consequence of the earlier privati-sation of domestic banks and the attracting of strategic investors for those banksas well as the fact that an increased number of mergers took place in euro zonecountries. Due to the fact that foreign capital in banks operating in Poland comeslargely from the euro zone countries, the factors that triggered changes in thecompetition in the banking systems of euro zone countries also had an indirectimpact on the Polish banking sector.
When analysing processes that took place in the Polish banking sector between
11 In 1989 a two-tier structure of Polish banking was established, with 9 regional commercial banks.

140 NEW PARADIGMS IN BANKING, FINANCIAL MARKETS AND REGULATION?
l a r c i e r
1997 and 2009 it should be noted that privatisation led to an increase in the shareof foreign capital in the Polish banking sector. As of the end of 2009, the share ofbanks with predominantly foreign capital was approximately 70%, while as ofthe end of 1997 it was approximately 15% (see figure 1). When analysing owner-ship transformations in the Polish banking sector in recent years, the stabilisationof the share of foreign capital since 2000 should be emphasised. In 2009, foreigninvestors controlled 39 commercial banks and all branches of credit institutions.Their market share measured by assets amounted to 68.1% (the dominant rolewas played by Italian investors who controlled 13.3% of the sector assets, fol-lowed by German (9.9%), Dutch (8.7%), American (7.4%) and Belgian (5.7%)),see: figure 212.
The consolidation in the Polish banking sector (similarly to euro zone countries)led to changes in concentration. The analysis of the variability of concentrationratio in the Polish banking sector shows that in part of the analysed period (1997-2001) those ratios followed an upward trend due to mergers and acquisitions(M&A) conducted by large banks which were influenced by international consol-idation. The study of M&A processes in 1997-2001 showed the following typesof mergers in the Polish banking sector: merger between a Polish bank acquiredby a foreign investor and a foreign bank operated subsidiary in Poland13, mergerbetween two Polish banks having a common foreign shareholder14, mergerbetween banks operating within the same capital group15, merger between banksin Poland initiated by merger of shareholding banks outside Poland16.
In turn, between 2002 and 2007 concentration measure was decreasing. Thedecrease in concentration ratios was caused by a slowdown in the consolidationprocess and a slower development of large banks. In the period 2008-09 as aconsequence of the crisis, due to the strategy weakening of the financial conditionof the parent company, changes of strategic investors of Polish banks happenedand the consolidation process intensified17.
Due to consolidation activities in 1997-2009, the number of Polish commercialbanks significantly dropped, but at the same time the number of branchesincreased (it should be noted that the number of branches includes branches offoreign credit institutions, 18 in 2009, and their market share was 5.1%) see
12 See: Polish Financial Supervision Authority, Report on the condition of Polish banks in 2009, pp. 42-44.13 For example: Citibank (Poland) SA merged with Bank Handlowy w Warszawie SA, and both banks are
controlled by Citibank Overseas Investment Corp.), acquisition of ING Bank N.V. Oddział w Warszawie byING Bank l ski SA owned by ING Bank NV.
14 For example: merger of the Bank Zachodni SA and Wielkopolski Bank Kredytowy SA, both controlled by AlliedIrish Bank European Investments Ltd.
15 For example: acquisition of the banking group Pekao SA which was formed from four state banks that werepart of this group.
16 For example: merger of Powszechny Bank Kredytowy SA with Bank Przemysłowo Handlowy SA as the resultof the merger of shareholders – Bank Austria Creditanstalt and HypoVereinsbank.
17 For example: M&A between GE Money Bank and Bank BPH, Dominet Bank with Fortis Bank and CetelemBank with Sygma Bank branch in Poland.

COMPETITION ON THE POLISH BANKING MARKET 141
l a r c i e r
figure 418. Despite the dominant role of several large banks, the level of concen-tration of the Polish banking sector remains moderate in comparison with otherEU countries. At the end of 2009, the share of the five largest banks in assets inthe banking sector was 44.5%. Changes in concentration in the Polish bankingsector measured with CR5 ratio are illustrated in figure 3. PKO BP and Pekaoremain unquestionable leaders on the market, their total share in the bankingmarket exceeds 25%19.
18 But, in 2008 the number of Polish commercial banks increased from 50 to 52, as a result of commencement ofoperations by Alior Bank and Allianz Bank Polska, in 200, due to the new wave of consolidation processes inthe Polish banking sector the number of commercial banks decreased.
Figure 1: Share of foreign investors in assets of the Polish banking sector (1997-2009), in (%)
Source: NBP and FSA.
Figure 2: Share of foreign investors in assets of the Polish banking sector in 2003, 2007 and 2009 by country of origin, in (%)
Source: NBP and FSA.
80
60
70
50
60
30
40
20
30
0
10
1997 1998 1999 2000 2001 2002 2003 2004 2005 2006 2007 2008 2009
6
8
10
12
14
16
18
20
0
2
4
Italy Germany USA France Portugal Austria
2003 2007 2009
Holland Ireland Belgium

142 NEW PARADIGMS IN BANKING, FINANCIAL MARKETS AND REGULATION?
l a r c i e r
19 See: Polish Financial Supervision Authority, Report on the condition of Polish banks in 2009, pp. 23-24.
Figure 3: CR5 ratio in the Polish banking sector (1997-2009), in (%)
Source: NBP and FSA.
Figure 4: Number of commercial banks and branches in Poland (1997-2009)
Source: NBP and FSA.
2001
2002
2003
2004
2005
2006
2007
2008
2009
0 10 20 30 40 50 60
1997
1998
1999
2000
2001
COMPETITION ON THE POLISH BANKING MARKET 143
l a r c i e r
The period of 1997-2009 was also a period of the development of electronic tech-nology in banking. Owing to new technical solutions banks were able to improvethe quality of their operations, streamline settlement procedures and acceleratecash turnover. In the last decade, technical solutions (including the developmentof IT technologies and the Internet) became an important internal factor enablingbanks to improve their management systems and contributed to the developmentof modern banking products and their distribution channels.
An important (possibly the most important) factor which influenced the shape ofthe banking sector in the analysed period was Poland’s accession to the EuropeanUnion. Owing to this fact, Polish financial law was harmonised with EuropeanUnion regulations. It should be noted that as of the date of Poland’s accession toEU, one of the entry barriers20 for EU banks was removed as a result of introduc-ing a single passport law in Poland21.
Other factors driving recent changes in the banking sector were the introductionof the New Capital Accord (NCA) (Basel II) and implementation of FSAP pro-gramme. NCA was implemented in Poland in 2007, while the possibility to useIRB approach in banks was introduced as of 1 January 200822. It should bestressed, that in 2009 The Basel Committee issued a final package of measures toenhance the three pillars of the Basel II framework and to strengthen the 1996rules governing trading book capital. These measures were originally publishedfor public consultation in January 2009.
The profitability of commercial banks in Poland between 1997 and 2009 wasinfluenced by a large number of internal and external factors: consolidation andtechnological processes, real economy, Poland’s accession to the European Unionand the financial crisis. After a significant decrease in the profitability of commercialbanks between 2001 and 2003 related to the economic slowdown, between 2004and 2007 a clear improvement in profitability was observed (the improvement inbanks’ profitability was facilitated by, among others, a decrease in the share of non-performing loans23 in assets, in particular loans granted to companies). the slightdecrease in the profitability indicators in the period 2008-09 caused by financialcrisis (see figure 5), it should be noticed.
20 Bikker and Bos (2005), p. 39.21 Pursuant to the single passport rule, a credit institution which obtained a banking licence in one EU country
may undertake and conduct the activity in the territory of another EU country, without having to undergoanother licence procedure. The credit institution is only required to notify the banking supervisor of the hostcountry of its intention to undertake the activity in its territory. See NBP (2004).
22 In Poland, draft legal acts were developed which govern the new manner of risk management in banks on thebasis of draft EU directives (directives 2006/48/EC and 2006/49/EC). This concerned a draft amendment to theBanking Law act and drafts of new resolutions of the Commission for Banking Supervision (including Resolu-tion No. 1 to 9 of 13 March 2007).
23 It should be noted that since Poland’s accession to the EU the classification of non-performing loans changedto a less restrictive classification, for instance for sub-standard receivables from 1 to 3 months into from 3 to6 months, for doubtful receivables from 3 to 6 months into from 6 to 12 months, for lost receivables fromabove 6 months to above 12 months. See NBP (2003).

144 NEW PARADIGMS IN BANKING, FINANCIAL MARKETS AND REGULATION?
l a r c i e r
During the analysed period a downward trend of the net interest margin (NIM)was also observed. In the Polish banking industry, similarly to other EU countries,a downward trend for this factor was observed, but it was two times higher thanthe average in EU-2524.
In 2008, the turbulences on the global financial market, which was reflected at thePolish level as lower confidence between financial institutions, led to obstacles inthe liquidity management and risk hedging, as well as emphasised the need tofocus on obtaining long-term and stable sources of financing. In 2008, bankingoperations can be divided into two periods. The first period, covering the threefirst quarters, was characterized by fast development thanks to relatively favorablemacroeconomic conditions. The second period covered Q4 and featured a signifi-cant slowdown of lending activity and a deterioration in banking performance dueto the ‘second wave’ of the financial crisis, deteriorating financial situation of cer-tain borrowers. As a result of the crisis escalation a sharp increase in rates occurredon the interbank market and difficulties appeared in managing current liquidityand securing the risk. In order to stabilize and improve the situation on the finan-cial market the National Bank of Poland developed a so-called ‘Confidence Pack-
Figure 5: Commercial Banking Sector’s Efficiency Indicators in Poland 1997-2009 (%)
Source: NBP. Note: Net interest margin (NIM) = net interest income (interest income minus interest expenses) over averageassets. Non-performing loans (NPL) = the share of loans which are classified as: substandard, doubtful andloss, in total assets.
24 In 2001 the average net interest margin for EU countries was 1.51%. See ECB (2003). In 2004 the average netinterest margin for Germany was 0.89%, for Spain 0.95%, while for Italy it was 2.48%, see Banque de FranceBulletin (2005). During the analysed period, the decrease in net interest margin in Poland was also caused by adecrease in nominal interest rates resulting from a lower inflation rate.
COMPETITION ON THE POLISH BANKING MARKET 145
l a r c i e r
age’ which enabled banks to expand the possibilities for banks to obtain liquidityin zloty and also the Polish Government took legislative activity25.
In 2009 the accumulation of adverse events translated into a significant worsen-ing of effectiveness measures of the banking sector. In particular, due to reduc-tions in the NBP interest rates, and the growth of unsupported loans, interestmargins declined. The decrease in ROA was also the consequence of the declinedperformance of banks. The quality of credit portfolio of banks strongly deterio-rated in 2009, the portfolio of non-performing loans increased by 76.1%26. How-ever, despite the strong deterioration in financial performance, the situation of thebanking sector was quite stable in 2009, also in terms of liquidity. The mainsource of risks was inadequate lending procedures. In response to the identifiedphenomena of loosening credit policy standards for retail loans, the PFSAadopted Recommendations that were quickly implemented into banking practice.
8.4. Analysis of the Level of Competition of the Polish Banking Sector between 1997 and 2009 – Empirical Results with Use of Three Different Models
8.4.1. Results of Competition Measurement with the Panzar and Rosse Method
In this chapter, the level of competition of Polish commercial banks was evalu-ated. In order to estimate the H-statistic for the Polish banking sector, the follow-ing reduced form revenue equation was estimated (for details see also Bikker andBos, 2008, Claessens and Laeven, 2004, Yildrim and Philippatoas, 2007):
(1)
dependent variable: – the natural logarithm of interest income or the natural logarithm
of interest income divided by total assets of bank i in time t.
the price of input is defined as follows: – the price of labour is the ratio of personnel expenses to total assets of bank
i in time t; – the price of funds is the ratio of interest expenses to total deposits of bank
i in time t;
25 See: Polish Financial Supervision Authority, Report on the condition of Polish banks in 2008, pp. 32-38.26 See: Polish Financial Supervision Authority, Report on the condition of Polish banks in 2009, pp. 42-44.
IRit α a1* lnwlit a2* lnwpit a3* lnwcit+ + +=
+ η OI II⁄( )it bj * othit
j 1=
N
εit+ +
IRit ln II( )it
ln II TA⁄( )i t
wlit
wpit

146 NEW PARADIGMS IN BANKING, FINANCIAL MARKETS AND REGULATION?
l a r c i e r
– the price of capital is the ratio of other operating and administrativeexpenses to fixed assets of bank i in time t.
other bank specific variables:– other income/interest income of bank i in time t27,
– other bank-specific variables that affect long-run equilibrium bank
revenues: the share of loans which are classified as: substandard, doubtful andloss, in total assets, the ratio of loans to total assets, the ratio of deposits to totalassets, the ratio of fixed assets to total assets, of bank i in time t,
– is a constant term, – error,
The sum of the factor prices function (denoted with the coefficients a1, a2 and a3)of the reduced-form of revenues (see equation (1)) constitutes the value of the H-statistic for the Polish banking industry. To assess the impact of misspecification,two variants of equation (1) were estimated. The first variant explains the naturallogarithm of interest income divided by total assets as a dependentvariable, whereas the second model was based on the natural logarithm of inter-est income . The panel data for this analysis comprises all Polish commer-cial banks for each year (see figure 4) covered by the National Bank of Poland’sbalance sheet and income statement. These statistics consist of annual data fromall banks reporting to the National Bank of Poland and cover the period from1997 to 2009.
In order to check the assumptions of the P-R method on a long-run equilibriumin the Polish banking sector, a test was performed by inserting ROA for 1997-2009 in place of the dependent variable in equation (1) (results of the above testsare presented in table 1). After replacing the dependent variable with ROA orROE, the value of H statistic equals to 0 means that the banking system is in along-run equilibrium28.
27 With the aim to capture the increasing role of non-interest revenue in banks’ income.
Table 1. Value of the Wald test to determine a long-run equilibrium in the Polish banking sector between 1997-2009, H0: H = 0, H1: H < 0
ROA Wald test value for H = 0
H Statistic value: Probab.
0.03271893 0.5681
Source: Own calculations.
28 This test can be easily performed with the use of the above ratios because in the long-run equilibrium profitsare equal to zero and both in the case of ROA and ROE they do not depend on input prices. Based on the Waldtest performed, the hypothesis on a long-run equilibrium in the banking sector at a conventional significancelevel cannot be rejected, which means that the condition for applying the Panzar and Rosse method is satisfied.
wcit
OI II⁄( )it
othit
j 1=
N
α εit
ln II TA⁄( )i t
ln II( )

COMPETITION ON THE POLISH BANKING MARKET 147
l a r c i e r
In order to analyse changes in the level of competition in the Polish banking sectorthe value of H statistic function was calculated for the entire period analysed(1997-2009) and sub-periods: 1997-98 (H1), 1999-2003 (H2), 2004-07, (H3)2008-09 (H4). In order to estimate the elasticity of the revenue function the modelof an analysis of panel data depending on the value of Hausman test was used29.Values of H statistic for 1997-2009 and for each of sub-periods for two depend-ent variables ( , ) are presented in table 2.
Based on the values of H statistic (from table 2) it can be concluded that the levelof competition indicates a monopolistic competition and values of H statistic arehigher when the dependent variable is scaled by assets (see Bikker et al. (2006),
29 In order to estimate panel analysis coefficients on non-balanced data panel, the STATA 9.2 package was used.
Table 2: Value of H statistic for commercial banks operating in Poland
Sample: 1997-1998 1999-2003 2004-2007 2008-2009 1997-2007 1997-2009
ln(II/TA)
wl 0.371 0.359 0.1696 0.2448 0.42523 0.4526
(0.000)*** (0.000)*** (0.000)*** (0.000)** (0.000)*** (0.000)***
wp 0.106 0.2426 0.29602 0.06877 0.2018 0.1421
(0.000)*** (0.000)*** (0.000)*** (0.000)** (0.000)*** (0.000)***
wc 0.027 0.0395 0.1373124 0.085135 -0.00989 -0.0278
(0.525) (0.541) (0.014)* (0.000)** (0.014)* (0.000)***
H-statistic 0.51 0.64 0.60 0.39 0.62 0.57
Housman test 27.0 40.95 24.10 13.98 90.67 63.49
(p value) (0.000) (0.000) (0.002) (0.016) (0.000) (0.000)
Number of obs. 157 325 228 112 710 815
Number of groups 84 83 66 62 106 109
ln(II)
wl -0.591 -0.504 -0.7796 0.02151 -0.552 -0.38268
(0.000)*** (0.000)*** (0.000)*** (0.000)*** (0.000)*** (0.000)**
wp 0.149 0.2685 0.14863 0.00540 0.195 0.07856
(0.000)*** (0.000)*** (0.000)*** (0.000)*** (0.000)*** (0.000)**
wc 0.878 0.7944 0.8686 0.00536 0.817 0.50872
(0.000)*** (0.000)*** (0.000)*** (0.000)*** (0.000)*** (0.000)**
H-statistic 0.44 0.56 0.54 0.03 0.46 0.21
Housman test 13.98 63.49 -59.62 108.33 184.77 15.13
(p value) (0.016) (0.000) (0.000) (0.000) (0.000) (0.0098)
Number of obs. 157 325 228 112 710 815
Number of groups 84 83 66 62 106 109
Source: Own analysis. Note: Dependent variable: interest income/total assets - is sign as “II/A”, interest income – is sign as “II”.Unit factor prices: wl – unit price of labor, wp – unit price of funds, wc – unit price of capital, p values inbrackets, * significant at 10%; ** significant at 5%; *** significant at 1%, Hypothesis on H 0 and H = 1was rejected at the significance level of 1%. See: Pawlowska (2010).
ln II TA⁄( )i t ln II( )

148 NEW PARADIGMS IN BANKING, FINANCIAL MARKETS AND REGULATION?
l a r c i e r
p. 17). Between 1999 and 2004 the level of competition in the commercial bankswas higher than in the period of 1997-98. An increase in competition in the Polishbanking sector was caused by Poland’s accession to the EU. On one hand, thesingle passport law facilitated the so-called entries of new banks into Poland. Onthe other hand, technical solutions and a fast development of the Internet bankingwere important factors affecting the increase in competition in that period. Insubsequent periods the degree of competition started to even out. In the period2008-09 we can notice the slight decrease in competition caused by the financialcrisis.
The results obtained by other authors for the Polish banking sector before thecrisis, on the basis of data from the BankScope database with the P-R method arepresented in table 3.
In addition, results of the analysis of competition levels performed by otherauthors on the basis of the H statistic indicate that the level of competition of thePolish banking sector was similar to the competition level in euro zone countries(see Claessens and Laeven (2004), p. 573).
Transformations in European banking before the crisis resulted from the effect ofnumerous and different factors (not only the introduction of the single euro cur-rency). Those factors include: globalisation, liberalisation, deregulation, progressin IT technologies, changes in demand for banking services, progress in the Euro-pean integration, implementation of the FSAP programme and the introductionof the New Capital Accord (Basel II). Therefore, it is difficult to establish une-quivocally which of those factors had the strongest impact on the effectivenessand competition of financial institutions.
Table 3: Values of H statistic for the Polish banking sector
Year H value The dependent variable Number of banks
Claessens and Laeven (2004) 1994-2001 0.77 ln(II/TA) 40
Gelos and Roldos (2002) 1994 0.54 ln(II/TA) 55
Gelos and Roldos (2002) 1999 0.53 ln(II/TA) 55
Yildrim and Philippatoas (2007) 1993-2000 0.50 ln(II/TA) 53
Bikker and Spierdijk (2008) 1992 0.45 ln(II) 50
Bikker and Spierdijk (2008) 2004 0.03 ln(II) 50
Source: Gelos and Roldos (2002), p. 47, Claessens and Laeven (2004), p. 573, Yildrim and Philippatoas(2007), p. 203, Bikker and Spierdijk (2008), p. 26.

COMPETITION ON THE POLISH BANKING MARKET 149
l a r c i e r
8.4.2. Results of Competition Measurement on the Polish Banking Sector with the Application of the Lerner Index
The calculation of the Lerner index in the Polish banking sector as well as a panelof annual data from balance sheets and profit and loss accounts of Polish banksfor 1997-2009, as in the case of the P-R method.
The translogarithmic cost function (Berger and Mester (1997)) was used to meas-ure the marginal cost:
(2)
where TC is the firm’s total costs including financial costs and operating costs. Asa measure of production y we use total assets, Wi – input prices are estimated inthe same way as in the P-R model, see equation 1; W1 – unit price of labour, W2
– unit price of capital, W3 – unit price of deposits (see also Angelini and Cetorelli(2003), de Guevara et al. (2007)).
The estimation of the costs function (and hence of the marginal costs) was donefor all panel data. Fixed effects are also introduced, in order to capture the influ-ence of variables specific to each firm. Finally as usual, the estimation is doneunder the imposition of restrictions of symmetry and of grade one homogeneityin input prices.
Next, the marginal cost MC was calculated as a derivative of the cost functionagainst y (output here total assets):
(3)
System of equations were estimated simultaneously by employing fixed effectsestimation. The Lerner index was calculated for each bank in the panel data for1997-2009 as the quotient of the difference between the input price and marginalcost to the input price. The input price in the banking sector is assumed to beinterest revenue divided by assets for each bank i in the period t (Angelini andCetorelli (2003)); means of the Lerner indices also were computed for each year.
The main results concerning marginal cost (MC) and Lerner index for Polishbanking sector for each year are displayed in table 4. Results of the measurementof the marginal cost indicate its decrease between 1997 and 2009. Between 2008-09 we can notice the slight decrease in competition. It should be noted that, in
lnTC β0 β1lny 1 2 * β2 lny( )2 βjlnWj
j 1=
3
+⁄+ +=
+ βjklnWjlnWk
k 1=
3
j 1=
3
γjlnylnWj
j 1=
3
νit zi+ + +
MCTC
y------- β1 β2 lnyiy( ) γjlnWj
j 1=
3
+ +=

150 NEW PARADIGMS IN BANKING, FINANCIAL MARKETS AND REGULATION?
l a r c i e r
2009 the group of commercial banks was not homogeneous. The Lerner index isinverse measure of competition, i.e. a greater Lerner index means lower competi-tion.
In order to determine the impact of the establishment of the euro zone (in 1999),and of the accession of Poland to the European Union (1 May 2004) and thefinancial crisis on the changes in competition, average values of the Lerner indexwere estimated for the following periods: 1997-98, 1999-2003, 2004-07, 2008-09. The estimated values of the Lerner index for each period are presented intable 5, p. 151.
Average values of the Lerner index demonstrate a similar trend as P-R measures.Between 1999 and 2004 the level of competition in the entire sector of commer-cial banks was higher than in 1997-98, as demonstrated by a decrease in themarket power.
Results of the estimated Lerner index in the banking sector in Spain, Germanyand the Czech Republic are presented in table 6 (p. 151). It should be noted thatin countries with lower concentration measures the Lerner index indicates lowermarket power, i.e. higher competition. It should be noted that the Lerner indexfor the EU is 0.16 (it is mean value over 1995-2001, see. Carbó et. al. (2009),p. 120).
Table 4: Results of the calculation of the Lerner index per Year for the Polish banking sector
Year Std. Dev. Lerner Index (mean) Std. Dev. MC (mean) Number of obs.
1997 0.425254 0.3802458 0.009015 0.07307695 83
1998 0.386123 0.3816084 0.008732 0.07155848 81
1999 0.340915 0.2866669 0.009159 0.06980097 73
2000 0.306847 0.4192944 0.008604 0.06887544 72
2001 0.684271 0.3019527 0.008770 0.06913474 70
2002 0.416789 0.0973307 0.008439 0.06642440 67
2003 1.695749 0.1360234 0.008662 0.06589605 59
2004 1.596667 0.1892985 0.008575 0.06461746 59
2005 0.862366 0.2846030 0.008973 0.06457389 58
2006 0.531301 0.2788467 0.008505 0.06336119 59
2007 1.031755 0.2591705 0.008568 0.06254121 60
2008 0.479565 0.3700726 0.008604 0.06174030 64
2009 0.960399 0.4222222 0.022010 0.02149720 62
Source: Own calculations.

COMPETITION ON THE POLISH BANKING MARKET 151
l a r c i e r
8.4.3. Results of Competition Measurement of the Polish Banking Sector with the Application of the Boone Method
Boone indicator in the Polish banking was estimated on the basis of the followingequation:
(4)
where: – bank’s market power defined as the market share of bank i of totalbanking sector assets in the period t, – marginal cost of bank i in the period
Table 5: Results of the calculation of the Lerner index for the Polish banking sector for 1997-1998, 1999-2003, 2004-2007, 2004-2007, 2008-2009 and 1997-2007, 2008-2009
Years Lerner index Std. Dev.
1997-1998 0.3809356 0.4046345
number of observations 160
1999-2003 0.2503539 0.9259546
number of observations 256
2004-2007 0.2534153 1.066649
number of observations 229
2008-2009 0.2839089 0.7528025
number of observations 126
1997-2007 0.2839089 0.8487746
number of observations 723
1997-2009 0.3005048 0.8357595
number of observations 849
Source: Own calculations.
Table 6: Values of the estimated Lerner index for selected banking sectors in EU countries
Spain Germany Czech Republic
Year Lerner index CR5 (%) Lerner index CR5 (%) Lerner index CR5 (%)
1997 0.186 45.2 0.17 16.7 – –
1998 0.209 44.6 0.16 19.2 – –
1999 0.228 51.9 0.17 19.0 0.3076 –
2000 0.225 54.0 0.14 20.0 0.3111 –
2001 0.236 53.0 0.12 20.0 0.2912 68.4
2002 0.249 53.0 – 20.0 0.1703 65.8
2003 – 43.1 – 21.6 0.4344 65.8
2004 – 41.9 – 22.1 0.4575 64.0
2005 – 42.0 – 21.6 0.4209 65.5
Source: ECB, de Guevara et. al. (2007) p. 285, Podpiera et. al. (2007) p. 90, Fischer and Hempell (2005)p. 24.
lnsit α β * lnMCit εit+ +=
sit
MCit

152 NEW PARADIGMS IN BANKING, FINANCIAL MARKETS AND REGULATION?
l a r c i e r
t, (MC was calculated like in case of estimation of Lerner index see equation 2and 3), – estimated Boone indicator.
The measure of the degree of competition is parameter which takes on valuesbelow zero. The higher the degree of competition, the greater the absolute valueof negative parameter specifying the Boone indicator30.
We present estimates of for each year separately referred to annual esti-mates. The value of the Boone indicator calculated for the Polish banking sectorbetween 1997 and 2004 based on equation 4 indicated the highest level of com-petition (see Figure 6). In 2009 we can notice the slight decrease in competitioncaused by the financial crisis.
The Boone method (2000) was used by Leuvensteijn et al. (2007) to measure thelevel of competition on the loan market in euro zone countries (Germany, Italy,Spain), countries from outside the euro zone (e.g. UK). A comparative analysisshowed that the level of competition in the euro zone countries varies (the highestcompetition on the credit market was identified in Germany and Spain, while inFrance and Italy it was lower, however it is higher than in UK, see Figure 6).
30 Leuvensteijn et al. (2007), pp. 9-12.
Figure 6: Competition measures (Boone Indicator)
Source: Leuvensteijn et al. (2007), pp. 27-28. For Poland own analysis.
β
β
β
β
-6
-5
-4
-3
-2
-1
0
1
1997 1998 1999 2000 2001 2002 2003 2004 2005 2006 2007 2008 2009
Poland Germany Spain Netherlands UK

COMPETITION ON THE POLISH BANKING MARKET 153
l a r c i e r
Conclusions
Between 1997-2007 (before the crisis) similar to other new EU-10 countries, thePolish banking sector was undergoing intense transformation and development.The modernization of distribution channels and the implementation of new tech-nologies have increased the availability of services and the effectiveness of banks’operations. Between 2008-09, the Polish banking system was mainly under theimpact of the financial crisis. As a result of the crisis escalation a sharp increasein rates occurred on the interbank market transactions’, the financing costsincreased and appeared difficulties in managing current liquidity and securing therisk. In order to stabilize and improve the situation in the financial market thePFSA adopted Recommendations that were quickly implemented into bankingpractice, also the Polish Government took legislative activity.
The results of the empirical analysis concerning the Polish banking sector demon-strated that between 1997-2007 and 2008-09 (before and during the financialcrisis) commercial banks in Poland operated in an environment of monopolisticcompetition. The degree of competition in the Polish banking sector before thecrisis was close to that in the euro area banking sectors which was reflected in thevalues of P-R measure (H-statistic).
Results of the competition measurement with all the methods used (P-R method,Lerner index and Boone method) demonstrated a strong increase in competitionbetween 1999-2004 caused by Poland’s accession to the EU and slight decrease incompetition between 2008-09 caused by the financial crisis.
Between 2008 and 2009 the Polish banking system was mainly under the impactof the financial crisis, competition measures confirm that the degree of competi-tion in the Polish banking sector during the crisis decreased.
Finally, liberalisation had an impact on the competition of the financial interme-diaries and also on the financial crisis. As well as, the same channels (before thecrisis – increase in mergers and acquisitions and deregulation and during the crisis– increase in mergers and acquisitions as well and new regulations) which affectedchanges in the competition of banking sectors in the euro zone countries, affectedthe Polish banking sector due to the involvement of capital from the euro zone.
However the last crisis was a testimony to the failure of the three pillars of theBasel II system. The evidence points out that liberalisation increased banking cri-ses, while strong institutional environment and adequate regulation reducesthem. This suggests that coordinating regulation and competition policy is neces-sary (see: Vives, 2010).

154 NEW PARADIGMS IN BANKING, FINANCIAL MARKETS AND REGULATION?
l a r c i e r
References
ANGELINI, P., CETORELLI, N., “The effects of regulatory reform on competitionin the banking industry”, Journal of Money, Credit and Banking 35,pp. 663-684, 2003.
Banque de France Bulletin, 2005.
BAIN, J.P., “Relation of profit rate to industry concentration: American manufac-turing 1936-40”, Quarterly Journal of Economics 65, pp. 293-324, 1951.
BAUMOL, W., “Contestable markets: an uprising in the theory of industry struc-ture”, American Economic Review 72, 1-15, 1982.
BERGER, N., L., MESTER, J., “Beyond the Black Box: What Explains Differencesin the efficiencies of Financial Institutions”, Journal of Banking and Finance21, s. 895-947, 1997.
BIKKER, J.A., Competition and Efficiency in Unified European Banking Market,Edward Elgar, Cheltenham, UK&Northampton, MA, USA, 2004.
BIKKER, J.A., BOS, J.W.B., Trends in Competition and Profitability in the bankingIndustry: A Basic Framework, SUERF Studies 2005/2.
BIKKER, J.A., SPIERDIJK, L., FINNIE, P., The impact of market structure, contesta-bility and institutional environment on banking competition, DNB WorkingPaper, No. 156/November 2007.
BIKKER, J.A., LEUVENSTEIJN, M., An exploration into competition and efficiencyin the Dutch life insurance industry, DNB Working Paper, 2005.
BIKKER, J.A., SPIERDIJK, L., How Banking Competition Changed over Time, DNBWorking paper, No. 167/February 2008.
BOONE, J., “Competition”, CEPR DP 2636, December, 2000.
BOONE, J., “Intensity of competition and the incentive to innovate”, Interna-tional Journal of Industrial Organization 19, 705-726, 2001.
BOONE, J., “A New Way to Measure Competition”, CEPR Discussion PaperSeries No. 4330, March (2004).
BRESNAHAN, T., “Empirical studies in industries with market power” in SCHME-LENSEE, R., WILLIG, R. (eds.), Handbook of Industrial Organisation, Vol. II,pp. 1011-1058, 1989.
CABRAL, F., DIERICK and VESALA, J., Banking Integration in the euro area, ECBOccasional Paper Series, No. 6, 2002.
CARBÓ, S., HUMPHREY, D., MAUDOS, J. and MOLYNEUX, P., 2006, “Cross-Coun-try Comparisons of Competition and Pricing Power in European Banking”,Journal of International Money and Finance, 28, 2009, 115-134.
COCCORESE, P., “Banking competition and macroeconomic conditions: a disag-gregate analysis”, Journal of International Financial Markets, Institutions& Money 14, pp. 203-219, 2004.

COMPETITION ON THE POLISH BANKING MARKET 155
l a r c i e r
CETORELLI, N., “Real Effects of Bank Competition”, Journal of Money, Credit,and Banking, Vol. 36, No. 3 (June 2004, Part 2), The Ohio State UniversityPress, 544-558, 2004.
CLAESSENS, P., LAEVEN, L., “What drives bank competition? Same internationalevidence”, Journal of Money, Credit, and Banking, Vol. 36, No. 3 (June2004, Part 2), The Ohio State University Press, pp. 564-583, 2004.
ECB, Possible Effects of EMU on the EU Banking Systems in the Medium toLong term, February 1999.
ECB, Banking in the Euro Area: structural features and trends, Monthly Bulletin,2005.
ECB, Consolidation and Diversification in the euro area banking sector, MonthlyBulletin, May 2005.
ECB, Corporate finance in the euro area – including background material, Occa-sional Paper No. 63, 2007.
ECB, EU Banking Structures, October 2008.
FREIXAS, X., ROCHET, J-Ch., Microeconomics of Banking, The MIT Press, Cam-bridge, London, England, pp. 72-73, 2008.
GELOS, R.G., ROLDOS, J., Consolidation and Market structure in Emerging Mar-ket Banking Systems, IMF Working Paper, WP/02/186, 2002.
GUTIERREZ DE ROZAS, L., Testing for Competition in the Spanish Banking Idus-try: the Panzar-Rosse Aproach Revisited, Banco de Espana, Documentos deTrabajo, N. 0726, 2007.
DE GUEVARA, F., J., MAUDOS, J., 2004, Measuring welfare loss of market power:an application to European banks, Applied Economics Letters 11, 833-836.
DE GUEVARA, F., J., MAUDOS, J., PEREZ, F., “Integration and competition in theEuropean financial markets”, Journal of International Money and Finance26, 26-45, 2007.
HEMPELL, H., Testing for Competition among German Banks. EconomicResearch Centre, Deutsche Bundesbank, Discussion Paper 04/02, 2002.
IWATA, G., “Measurement of conjectural variations in oligopoly”, Econometrica42, 947-966, 1974.
KOUTSOMANOLI-FILLIPAKI, N., STAIKOURAS, Ch., Competition and concentrationin the new European banking landscape, European Financial Management,Vol. 12, No. 3, 443-482, 2006.
LAU, L., On identifying the degree of competitiveness from industry price andoutput data, Economics Letters 10, 93-99, 1982.
LANE, P.R., WÄLTI, S., The Euro and Financial Integration, IIIS Discussion PaperNo. 139, 2006.

156 NEW PARADIGMS IN BANKING, FINANCIAL MARKETS AND REGULATION?
l a r c i e r
LEUVENSTEIJN, M., BIKKER, J.A., RIXTEL, A., SØRENSEN, C.K., A new Approachto measuring competition in the loan markets of the euro area, EBC, Work-ing Paper Series, No. 768, June 2007.
LERNER, A., “The concept of monopoly and the measurement of monopolyPower”, Review of Economic Studies 1, 157–175, 1934.
LÖTHGREN, M., TAMBOR, W., Alternative Approaches to Estimate Returns toScale in DEA-Models, Stockholm School of Economics, Working PaperSeries in Economics and Finance, No. 90, 1996.
ŁYSZKIEWICZ, W., Industrial Organization, Organizacja Rynku i Konkurencja,Dom Wydawniczy Elipsa, Warszawa, 2002.
MARTIN, P., Industrial Economics, Economic Analysis and Public Policy, Mac-millan Publishing Company New York, Collier Macmillan PublishersLondyn, 1989.
MCCAULEY, R.N., WHITE, W.R., The Euro and European Financial Markets,BIS, Working Papers No. 41, May 1997.
MFW, Global Financial Stability Report, Market Developments and Issues, April2007.
MONGELLI, F.P., VEGA, J.L., What Effects is Emu Having on the Euro Area andits Member Countries? An Overview, EBC, Working paper series, No. 559,March 2006.
MAUDOS, J., F., DE GUEVARA, J., “Factors explaining the interest margin in thebanking sectors of the European Union”, Journal of Banking and Finance28, 2259-2281, 2004.
MAUDOS, J., F. DE GUEVARA, J., “The cost of market power in banking: socialwelfare loss vp. inefficiency cost”, Journal of Banking and Finance, 31 (7),2103-2125, 2007.
MOLYNEUX, P., LLOYD-WILLIAMS, D., THORNTON, J., “Competitive conditionsin European banking”, Journal of Banking and Finance 18, 445-459, 1994.
NATHAN, A., NEAVE, E., 1989, “Competition and contestability in Canada’sfinancial system: Empirical results”, Canadian Journal of Economics 22,576-594,1989.
PANZAR, J.C., ROSSE, J.N., “Testing for ‘monopoly’ equilibrium”, Journal ofIndustrial Economics 35, pp. 443-456, 1987.
POLISH FINANCIAL SUPERVISION AUTHORITY, Report on the condition of Polishbanks in 2008.
POLISH FINANCIAL SUPERVISION AUTHORITY, Report on the condition of Polishbanks in 2009.
PAWLOWSKA, M., 2005, “Competition, Concentrations, Efficiency and theirRelationship in the Polish Banking Sector”, Materiały i Studia, No. 32,NBP, Warsaw.

COMPETITION ON THE POLISH BANKING MARKET 157
l a r c i e r
PAWLOWSKA, M., 2010, “Competition in the Polish Banking Sector”, Gospo-darka Narodowa (National Economy), Vol. 21, number: 5-6, pp. 91-119.
PAWLOWSKA, M., KOZAK, S., 2008, “Efficiency and Competition of the PolishBanking Sector – if euro adoption changed them?”, Bank and Credit,No. 12, NBP, Warsaw.
PRUTEANU-PODPIERA, A., WEILL, L., SCHOBERT, F., Market Power and Effi-ciency, in the Czech Banking Sector, CNB Working paper 6, 2007.
SHAFFER, P., Competition in the US banking industry, Economics Letters 29,321-323, 1989.
VESALA, J., “Testing for competition in banking: behavioural evidence from Fin-land”, Bank of Finland Studies, E:1, 1995.
UTRERO-GONZÁLEZ, N., CALLADO-MUNOZ, F.J., “Can Monetary unionEnhance Banking Competition?: A Multicase Study”, Journal of EconomicIntegration, Vol. 22, No. 1, March 2007, pp. 128-155, 2007.
VIVES, X., “Competition and stability in banking”, CEPR, No. 50, August 2010.
YILDIRIM, H.P., PHILIPPATOS, G.C., Competition and Contestability in Centraland Eastern European Banking Markets, Managerial Finance, Vol. 33,No. 3, 2007, pp. 195-209.


159
l a r c i e r
9. THE REVISITED CONCEPT OF BANK LIQUIDITY
IN THE THEORY OF BANK INTERMEDIATION
Emil l zak
Abstract
The role of liquidity in banking sector has soared in recent years. Before theworldwide financial crisis of 2007-10, liquidity risk had been gradually consid-ered in banking as ‘forgotten risk’, which was supported by boosted liquiditycreation on the basis of derivatives in securitization processes. However, in recentyears the spectacular illiquidity turmoil in the global banking sector has evidentlydemonstrated that even though the liquidity issues have enormous influence onbanks stability, the concept of liquidity itself has far evaluated from its originconnected with deposits. Consequently, strong relationships between assets andliability side of the balance sheet have been largely undermined in modern finan-cial intermediary processes. Moreover, the safety net measures organized withinthis traditional framework have proved to ensure limited relief to funding prob-lems of banks in advanced economies.
The main aim of this paper is to expand the various aspects of concept of liquiditytransformation in banking under the growing impact of asymmetric informationin the financial market that make banks prone to highly volatile idiosyncraticliquidity shocks. Thus, this paper highlights the most significant features of thenew regard to the bank liquidity by contrasting neo-classical models of fundingliquidity in banks (i.e. a deposit pool provides liquidity insurance and determineslong-term investments on the assets-side of balance sheet) and market liquidity(i.e. liquidity creation with off-balance sheet nature and crucial importance ofmarket asymmetric information on banks liquidity position).
JEL Codes: G01, G02, G21
Keywords: Funding Liquidity, Market Liquidity, Asymmetric information.
9.1. Introduction
One of the pillars of neoclassical bank intermediation theory is the concept ofbanks perceived as ‘pools of liquidity’ (Diamond and Dybvig 1983; Bryant 1980).Within this framework, the primary role of banks in the economy is focused onproviding the real economy agents with a set of safeguards against economicshocks. As the matter of the fact, granting long-term credits on the basis of short-term deposits brings about the liquidity mismatch in banks’ balance sheets withapparent exposure to the idiosyncratic liquidity shocks.
The problem is the liquidity risk in banking activity cannot be defined in oneuniform way as it is closely connected with idiosyncratic nature of diversified

160 NEW PARADIGMS IN BANKING, FINANCIAL MARKETS AND REGULATION?
l a r c i e r
bank intermediary functions in the economy both in saving and loans. Within theliquidity models, the bank may rely on either funding and market liquidity tomeet its liquidity shortfall (Brunnermeier and Pedersen 2009).
Traditionally, funding liquidity refers to the liability side of the bank’s balancesheet. This approach to the bank liquidity is based on funding the pool of liquiddeposits or other liabilities from interbank operations and monetary policyinstruments of central bank. The bank may also issue straight equity or othersecurities. On the other hand, within the concept of market liquidity the bankmay generate cash beyond the yield accruing from assets of its balance sheet sincethe bank can sell easily-tradable assets such as T-bills. Over last decade the mar-ket liquidity has become closely connected with raising cash solely on the assetsside of bank’s balance sheet and off-balance operations in order to securitize dif-ferent loan portfolios.
The recent financial crisis severely undermined the capital base of a number ofbanks by massive turmoil in the financial markets that has led to unprecedentedhigh level of illiquidity but under new formula. The crisis has showed that capitaland liquidity risk tend to be far much closely correlated than it previously consid-ered. The increasing role the market liquidity risk has proved the most evidentmajor shortcoming in detecting the roots of severe and worldwide instability ofbanking system only on the liability side of banks’ balance (Tirole 2009). As thematter of the fact, a traditional regard of the bank liquidity risk is commonlyassociated with the materialization of this risk in form of a bank run. However,the sudden withdrawal of deposits was not in the core of substantial liquiditydistress that has stricken the banking sector globally in recent years.
The rapid development of innovative financial instruments allowed banks toundermine traditional and strong correlation of assets and liabilities in banks’books boosting spectacularly maturity transformation on the basis of off-balancesheets operations. Consequently, the financial crisis has shown very high scale ofcorrelation of market liquidity exposure of banks and the scale of losses puttingaside the liabilities structure. This was a direct consequence of unprecedenteddrive to boost liquidity on the assets side of balance sheet in banks. The subse-quent large exposure to financial markets caused high level of distress triggeredby growing inefficiency of structured credit derivatives market.
As a result, the new paradigms of liquidity risk in banks has manifested abruptlyin recent financial crisis period posing a number of challenges to the stability ofthe banking sector. It is worth stressing before 2007 these new paradigms ofliquidity risk had not attracted much attention of regulators. Classical liquidityrisk safeguards, implemented after the Great Depression, such as deposit guaran-tee schemes, time diversion of interbank operations and central bank role as apool of reserve liquidity have manifested recently their limited efficiency. All these

REVISITED CONCEPT OF BANK LIQUIDITY IN THE THEORY OF BANK INTERMEDIATION 161
l a r c i e r
measures have been launched in the crisis time under the neoclassical perceptionof bank activity based on the funding liquidity risk based on transformation liq-uid deposits into illiquid loans. However, within new paradigms of liquidityboosted by off-balance operations banks incurred losses much faster and in a veryunprecedented way proving indirectly large inefficiencies of VaR risk manage-ment based mainly on the historical data.
The liquidity crisis in the banking sector have demonstrated a major and so farunderestimated shift from the traditional role of banks as financial intermediarieswith a pool of liquidity to real economy agents into investment vehicles involvedin mixed cycles of intermediary procedures. The recent banks’ fragility stemmedmainly from a abrupt decrease in the system-wide market liquidity where bankswere performing the active roles of dealers and traders in securities and creditderivates. Accordingly, banking activity aimed at providing funding liquidity andthus creating exposure to the materialization of bank run had much less impor-tance among triggers for last turbulences in the worldwide banking sector. Con-sequently, the neoclassical conceptual models of bank liquidity based on the proc-ess of issuing short-term deposits in order to finance long term productive invest-ments have become largely obsolete in modern circumstances.
The growing importance of assets-based and off-balance market liquidity ofbanks has brought about severe repercussions for the financial contagion andfinal bailout of illiquid banks. The injection into banking sectors of massive liquidfunds by central banks has not brought about the expected improvement becausethe ‘wrong medicine’ was applied to ‘banks’ disease’.
This paper therefore highlights the most significant features of new paradigms ofliquidity concept in banking activity on the basis of experience drawn from recentfinancial crisis. The paper is structured as follows.
The first section deals with major characteristics and their shortcoming of neo-classical funding liquidity concept with the aim to depict the most crucial strandsin the evolutionary changes of the liquidity in the theory of bank intermediation.The special emphasis has been put on demonstrating a gradual shift towards mar-ket liquidity in modern bank activity.
The second section focuses on the main features of market liquidity in banksdenoting the off-balance operations such as structured asset-backed securitieshave only initiated the inflammation process in the banking sector. The roots ofrecent turbulence should be searched in growing asymmetric information thatfailed to be recognized until the moment of the abrupt and devastating financialcrisis.

162 NEW PARADIGMS IN BANKING, FINANCIAL MARKETS AND REGULATION?
l a r c i e r
9.2. Neoclassical Concept of Bank Liquidity
9.2.1. Origins of Funding Liquidity
Traditionally, a maturity mismatch in the balance sheet of banks is the naturalconsequence of providing liquidity to real economy agents by accepting depositson the liability side, which in turn are reinvested into illiquid loans on the assetsside. This neoclassical concept of banking activity implies that banks structurallycreate funding liquidity and their role of financial intermediation leads to matu-rity transformation as liquid and thus low-yield deposits are transformed intoilliquid and hence high-yield loans (Strahan 2008). Since most bank assets areilliquid as they cannot be converted into cash without incurring losses, banksneed to maintain a certain degree of liquid assets implying a large prudence inregard to depositors’ decisions of their funds withdrawal.
The assets-liabilities mismatch gives grounds for funding liquidity risk, whichembraces the situation that a bank is unable to match cash outflows with cashinflows without affecting either daily operations or the financial standing. Thecash flows lies at the core of the initial concept of liquidity in banking acceptedby Joint Forum of the Basel Committee of Banking Supervision, that perceivedthis risk as inability of meeting efficiently both expected and unexpected currentand future cash flows and collateral needs without affecting either daily opera-tions or the financial condition (BCBS 2006). In this case the bank defaults on itsobligations due to a materialization of funding liquidity risk driven by the possi-bility that over a specific horizon the bank will become unable to settle obliga-tions with immediacy (Drehmann and Nikolaou 2009). However, the later con-cept of the liquidity in the Basel Committee of Banking Supervision has evaluatedtowards a market liquidity by the assumption of losses when the bank’s obliga-tions are not met at a reasonable cost (BCBS 2008).
The concept of the funding liquidity in banks is not necessarily in line with thenotion of Brunnermeier and Pedersen (2009) or Borio (2000) that define fundingliquidity as an ability of raising cash at short notice either via assets sales or newborrowing with securities as collateral. In my view, the core of funding liquidityshould be associated with bank’s obligations on the liability side of the balancesheet. Consequently, funding liquidity risk stems from a maturity transformationin the originate-to-hold banking activity. However, the above notions illustratehow far is the current notion of funding liquidity from its origin.
The substantial economic literature has been developed in the attempt to identifythe main reasons for idiosyncratic bank fragility under the funding liquidity. Bry-ant (1980) and Dimond and Dybvig (1983) provided the coherent theory of lia-bilities-assets maturity transformation, where a bank run may occur if there is ascare liquid assets to meet depositor withdrawals. Depositors are identical ex-

REVISITED CONCEPT OF BANK LIQUIDITY IN THE THEORY OF BANK INTERMEDIATION 163
l a r c i e r
ante and risk-averse with respect to future liquidity shocks facing idiosyncraticuncertainty about their future liquidity needs. Hence, there exist clear benefitsfrom pooling liquid resources ex ante and invest them in the long-term technol-ogy with payments ex post contingent to depositors’ demand for liquidity. It isassumed that depositors’ preferences about liquidity is private information,which creates the two Nash equilibriums in the deposit market.
In the ‘good’ equilibrium, solely depositors who face premature instant needs forliquidity (liquidity shocks) demand an early withdrawal from a bank. Theirreceive more than liquidation value of the long-term assets at the expense of otherdepositors who wait until maturity and receive less than their full long-termreturn. However, banks form pools of liquidity insuring against liquidity shocksso their intermediary role constitutes a welfare-improving risk sharing. On theother hand, the privacy of information about depositors’ preferences for early orlate liquidity creates the risk of coordinated inducement in form of a bank run.This illustrates ‘bad’ equilibrium of the withdrawal game in which all depositors,despite their original preferences, influence each other to induce their prematuredemand for an early withdrawal from banks. As a result, the bank fails to meettheir obligations and a social welfare is much lower than it could have beobtained without banks.
However, the threat of possible withdrawals in the funding liquidity concept canserve as a commitment device to discipline banks in their assets managementprocesses (Calomiris and Kahn 1991; Diamond and Rajan 2001). Refinancingfrom numerous small depositors enables banks – in contrast to other financialinstitutions – to credibly commit not to renegotiate on the repayment obligationson deposits, because this would immediately trigger a run (See Figure 1, p. 164).
Traditional theory of funding liquidity determines that a bank is a subject to runscaused by excessive deposits withdrawals and bank defaults in result of the lackof liquid assets or new deposits from other substantive resources. Funding liquid-ity implies that a suspension of convertibility may prevent bank runs and thegovernment intervention is necessary to maintain bank stability. Within fundingliquidity, a deposit insurance scheme is a necessary to mitigate depositors’ incen-tives to withdraw savings prematurely. Moreover, a deposit insurance schemealso supports the stability of the banking system reducing systemic risk exposureeven though the scheme itself might not introduce bailout plans for a failing bank.
The importance of assets side of the balance sheet in maintaining bank foundingliquidity could not be neglected so another strand of the banking literature, fol-lowing Holmstrom and Tirole (1998), considers liquidity demand on the corpo-rate borrowers’ side rather than on depositors’ side in order to present how effi-ciently this liquidity demand can be met through bank lines of credit. Aggregatedemand shocks public liquidity should reinforce the private liquidity.

164 NEW PARADIGMS IN BANKING, FINANCIAL MARKETS AND REGULATION?
l a r c i e r
This new strand in bank liquidity literature has resulted in new findings. WhileDiamond and Dybvig pointed out that idiosyncratic liquidity shocks and the riskof panic runs may arise as a result of banks’ attempts to insure depositors againstthese shocks, Allen and Gale (1998) consider aggregate business-cycle shocks andpoint at the need for equilibrium banking crises to achieve optimal risk-sharingbetween depositors. In their model aggregate shocks may trigger the need for saleof assets with no regard at their face value.
9.2.2. Funding Liquidity and Interbank Market
In order to ensure appropriate funding liquidity, banks can benefit from borrow-ing and lending in the interbank market, which plays a crucial role in recyclingliquidity through the banking system. Bhattacharya and Gale (1986) provide oneof first models bank liquidity by extending the Diamond and Dybvig frameworkto allow for multiple banks, which may face different liquidity shocks. Thismodel is one of the first signs that the funding liquidity should not be consideredonly from bank’s liabilities prospective. They distinguished core liquidity basedon the bank’s own reserves and supplementary liquidity with the proceeds frombank assets sales to other investors in the market. An individual bank may meetdepositor withdrawals with either inside liquidity or outside liquidity by selling
Figure 1: Main pillars of funding liquidity
Source: Own analysis
Deposit pool as a trigger for loans
activity
Safeguards of
Deposit Insurance Scheme
Reputation risk
exposure of bank towards
depositors
Liquid assets needed to
overlap deposit withdrawal
Transformation of liquid
deposits into illiquid loans
Funding liquidity pillars

REVISITED CONCEPT OF BANK LIQUIDITY IN THE THEORY OF BANK INTERMEDIATION 165
l a r c i e r
claims to long-term assets to other banks who may have excess cash reserves. Animportant insight of their analysis is that individual banks may free-ride on otherbanks’ liquidity supply and choose to hold too little liquidity in equilibrium.Moreover, liquidity reserves are likely to fluctuate considerably under the impactof a set of triggers for reputation risk. Consequently, the access to interbank bor-rowing is not usually equal to all banks regardless their size and scope and activ-ities in favour of large banks (Bolton, Santos, Scheinkman 2009).
Allen and Gale (2000) and Freixas, Parigi, and Rochet (2000) have analyzedmodels of liquidity provided through the interbank market, which can give riseto contagious liquidity crises. The main mechanism they highlight is the defaulton an interbank loan which depresses secondary-market prices and pushes otherbanks into a liquidity crisis. The common behavior of banks play a crucial role inmaking liquidity dry up in the interbank market. Rising liquidity risk underaggravated reputation risk causes the situation that interbank market might be nolonger a source of funding liquidity. The adverse selection mechanism bringsabout two consequences. On the one hand, banks short of liquidity are temptedto sell illiquid assets and suffer significant liquidation costs. On the other hand,liquid banks start to hoard their liquidity aggrieving the problems of efficiency ofinterbank markets.
Ashcraft, McAndrews, Skeie (2008) provided empirical evidence that the rise ofliquidity risk brings about a precautionary hoarding of reserves and widespreadreluctance to lend, which triggers an extreme volatility of interbank market rates.Banks rationally hold excess reserves intraday and overnight as a precautionarymeasure to self-insure against liquidity shocks. The interbank market is prone tonegative shocks to such an extent that some participants suffer too large losses toretain solvency. However, the distribution of these losses is private information,implying an adverse selection problem (Angelo and Monticini 2009). The liquid-ity risk in the interbank market starts to manifest when banks are loosing theconfidence that they will be able to raise liquidity in the future if they need to doso in order either to fund a long term interbank loan or to roll-over a short terminterbank debt. During last crisis similar findings were made in banking sectorswith evident lack of assets transformation in the securitization process.
9.2.3. Funding Liquidity and the Central Bank as a Lender of Last Resort
Under the concept of funding liquidity, the central bank acts as a lender of the lastresort with a crucial role of a liquidity recycler. The central bank, by selling gov-ernment-backed securities, can attract money from banks holding liquid assetsand then inject it into the banking system, preventing a costly liquidation of bankassets. The problem is that recent financial crisis has manifested that the droughtof liquidity in the banking sectors could not be offset by central bank. The core

166 NEW PARADIGMS IN BANKING, FINANCIAL MARKETS AND REGULATION?
l a r c i e r
of the soaring reputation risk in banking sector has not stemmed from liability-side of banking sheets. The central banks needed to develop special measures tocombat these unprecedented liquidity infections in the banking sectors world-wide.
For example, in UK banking system the Special Liquidity Scheme was designed toprovide that support on a one-off basis, in large size and for a long maturity. Theform of the Scheme was an asset swap (effectively a collateral upgrade). In prac-tice the commercial banks were lent for a fee nine-month Treasury bills againstresidential mortgage backed securities (RMBS and covered bonds). The bankscould use the Treasury bills to raise liquidity in the market and these bills werealso eligible in the Bank’s repo operations (Fisher 2009).
Despite massive injection of liquidity into banking systems, a liquidity scarebecame an urgent issue not only in these banking sectors that were heavilyinvolved into securitization process but also in these ones that have not traded incredit derivatives markets.
In course of recent financial crisis a number of financial institutions experiencedsudden and massive windrawals of their deposit closely related to abrupt loss offunding liquidity. For example, in 2007 Northern Rock in the US was the firstbank in 150 years to suffer a bank run after having had to approach the Bank ofEngland for a loan facility that ended with being taken into state ownership.Other example Indy Mac Bancorp Inc. was seized by U.S. regulators after a runby depositors left the California mortgage lender short on cash. Moreover, thefourth largest US Bank, 227 year old Wachovia bank, experienced rapid loss offunding and has been taken by Wells Fargo to avoid its outright failure.
The above examples illustrate the materialization of the risk connected with fund-ing liquidity but the origin of the huge problems stems mainly from the bankinvolvement in financial market operations both to acquire funds and to reinvestthem. Consequently, it was not the collective behavior of the depositors searchingfor liquid funds placed in form of deposits that sparked the world wide strain inthe banking system. As a result the cases of bank run were not numerous andpublic confidence towards banks maintained thanks to deposit insurance systemsbut lack of liquidity on the assets side of the bank balance shift moved a numberof banks and financial intermediaries at the brink of collapse comparable toGreat Depression period.
Furthermore, it must be emphasized that the funding liquidity is traditionallyconnected with the core of banking activity and in modern banking system a setof measure have been developed to combat funding liquidity (with apparent lackof such measures in terms of market liquidity), so the scope of these bank runturbulences were heavily limited. On the other hand, parallel measures have not

REVISITED CONCEPT OF BANK LIQUIDITY IN THE THEORY OF BANK INTERMEDIATION 167
l a r c i e r
been set to combat the concept of illiquidity based solely on the assets manage-ment with tradable securities.
9.2.4. Funding Liquidity Risk and Narrow Banking Concept
The crucial importance of the funding liquidity and its systemic risk contagionmechanism traditionally force banks to maintain their depositors’ confidence andother debtors on the liabilities side of balance sheet assuring in practice borderlesspossibility of withdrawing their deposits on demand or at the scheduled moment.This reliance on depositors’ decisions implies that banking activity is inherentlyfragile in the sense of its high susceptibility to a self-fulfilling collective run oftheir depositors. Consequently, the funding liquidity risk has led to the conceptof the narrow banking, where banks are required to cover entirely demand depos-its with safe liquid assets (Wallace 1996, Kashyan, Rajan, Stein 2002)1.
Accordingly, thanks to eliminating fractional-reserve activity banks are morelikely to achieve Pareto optimum without moral hazard problems in loan activity.The sole accessible form of investments are short-term safe assets such as Treas-ury bills (Pierce 1991). This regard at narrow banking is in line with the origin ofthis concept advocated by Fisher (1935) and Fiedman (1960) who claimed thatbanks’ idiosyncratic susceptibility to failure should be eliminated by prohibitingbanks from conducting lending activity within ‘full-reserve banks’. This sort ofbanking would eliminate systemic risk and its financial contagion, so the centralbank acting as a lender of last resort would be unnecessary. Litan (1987) pro-posed to set up ‘financial holding companies’ – diversified financial conglomer-ates composed of banks and separately incorporated lending subsidiaries. Thebanks would be a transition processors accepting deposits and investing in highlyliquid safe securities (T-bonds). The financial holding companies could extendlending services wholly funded by commercial papers and equity.
Contrary to initial core pillars of non-lending nature of narrow banking othereconomists (Bryan 1991) permit the full reserve banks to extend mortgage loansand loans to small and medium companies. The concept of narrow banks wouldallow the banking system to preserve liquidity without any reliance on liabilitiessubordinated to deposits2.
1 The origins of narrow banking concept should be associated with searching for a remedy to offset devastatingeffects of Great Depression manifested in “Chicago plan” memorandum (1933) and “A Program for MonetaryReform” (1939). The authors of the latter claimed that “the 100% reserve system was the original system ofdeposit banking” and fractional-reserve banking “was considered to be a breach of trust. But what thus beganas a breach of trust has now become the accepted and lawful practice. Nevertheless, the practice is incomparablymore harmful today than it was centuries ago, because, with increased banking, and the increased pyramidingnow practiced by banks, it results in violent fluctuations in the volume of the circulating medium and ineconomic activity in general”. (Douglas, Hamilton, Fisher, King, Graham, Whittlesey, 1939) Source:www.economicstability.org.
2 Thorough examination of narrow banking concept can be found in Kobayakawa and Nakamura 2000.

168 NEW PARADIGMS IN BANKING, FINANCIAL MARKETS AND REGULATION?
l a r c i e r
After the worldwide financial crisis 2007-10, the concept of narrow banking hasregained its popularity. Kotlikoff (2010) proposes a limited purpose bankingorganized according to rules of mutual fund companies’ activity with third-partycustodians to hold the loans extended to public. Moreover, banks would acceptchecking account deposits, but they would not have exposed to a bank run as theywould be required to hold 100 percent reserves (in cash and short-term Treasur-ies) against these deposits. Similarly, Phillips and Roselli (2010) recommend toreform financial system by limiting the role of banks to a source of supply for asafe and stable means of payment separately from the system of credit creationby financial institutions. They claim the need to transform checkable deposits assafe a means of payment as currency presently issued by central bank but withoutthe need for the elaborate supervisory and regulatory structure required whendeposit insurance and the discount window are part of the financial safety net.
Proponents of narrow banking point at the excessive ability of banks and otherfinancial institutions to leverage not just their own money but public fundsbecause governments routinely bail out creditors of these over-leveraged institu-tions. Consequently, instead of bailouts ban they postulate to change radically thewhole financial intermediation by imposing ban on leverage.
The main problem with the concept of narrow banking is the right trade-offbetween risk-awareness and profitability of banks. A system of full-reserve banksmight be safe but the core banking function of maturity transformation wouldbecome extinct. Consequently, banks would be likely to be marginalized in themarkets by other financial institutions. The high probability of this scenario hasbeen recently demonstrated by fast development of the institutions, which act astypical financial intermediaries between investors and borrowers. However, con-trary to full reserve or fractional reserve banking, these institutions do not acceptdeposits but play a critical role in lending activity by supplying massive liquidmoney. Their activity has created a new paradigm of liquidity (i.e. market liquid-ity) and a new paradigm of banking (i.e. shadow-banking institutions).
9.3. Towards a New Paradigm of Bank Liquidity
9.3.1. Market Liquidity and ‘Shadow Banking’
In recent decade, the growth rate of deposits as main liquidity resources has stag-nated or decreased in advanced economies, which is apparently correlated withslower low ratio of public saving. As the consequence, deposits largely failed tokeep up with the growth in bank assets. On the other hand, the consumptionexpansion geared with increasing bank loans availability, either in the durablegoods and mortgage markets, put pressure on banks to search for the solutions

REVISITED CONCEPT OF BANK LIQUIDITY IN THE THEORY OF BANK INTERMEDIATION 169
l a r c i e r
that would allow the breaking of constraints within traditional loan activitybased on the pool of deposits.
In response to these trends, many banks have had to supplement traditional fund-ing sources with a variety of new, but potentially less stable, financial instrumentsthat allowed them to boost the value of loans coupled with further optimizationof the credit risk allocation. It gave the birth to the dynamic growth of structuredasset-backed securities (ABS) markets, especially Collateralized Debt Obligations(CDO) that form structured credit derivates.
Innovative financial instruments allowed banks to borrow heavily in the domesticand international money markets together with cutting back on their holdings ofcash and securities. The impressive growth rate of extended loans was easilymaintained with selling or securitizing parts of their loan portfolio. Thus, banksboosted their liquid assets on the basis of the market liquidity by re-selling theseloans in the financial markets or by originating the issue of securities spitted intodifferent risk classes from ‘senior’ tranches to ‘junior’ tranches.
Securitization has soon became a highly effective channel to convert illiquid loansinto liquid securities and started to leverage the banks’ profits by substitutingfounding liquidity with market liquidity. Accordingly, securitization increased thecredit availability across all sectors of economy and at the same time reduced thesensitivity of bank loan portfolios according to availability of deposits. More con-troversially, securitization began to be deployed in banks as an efficient liquidity-risk management tool, which allows credit risk to be transferred from banks’books to the financial market on the basis of CDO mechanisms. The increasingrole of market economy created a ‘shadow banking system’ consisting of off-balance-sheet investment vehicles and conduits (Brunnermeier, 2009)3.
The pillars of stability in the classical banking system with founding liquidity riskis the deposit insurance and liquidity provision provided by the public sector. Onthe contrary the shadow banking system is supposed to be safe due to liquidityand credit puts provided by the private sector. This regard has underpinned theperceived risk-free, highly liquid nature of most AAA-rated assets that gave boostto the shadow banks’ liabilities in form of CDO. These AAA-rated tranches aregenerally structured to withstand idiosyncratic risk, but by their nature are vul-nerable to systematic risk and tail risk (Coval, Jurek and Stafford, 2009). Conse-quently, the performance of CDO exhibits higher correlation in an extreme envi-ronment than one would predict from observed behavior in a more benign envi-ronment. The growing importance of market liquidity in banking sector increased
3 “Shadow banking system” term is attributed to McCulley (2007), who points out that “unregulated shadowbanks fund themselves with uninsured commercial paper, which may or may not be backstopped by liquiditylines from real banks. Thus, the shadow banking system is particularly vulnerable to runs – commercial paperinvestors refusing to re-up when their paper matures, leaving the shadow banks with a liquidity crisis – a needto tap their back-up lines of credit with real banks and/or to liquidate assets at fire sale prices.”

170 NEW PARADIGMS IN BANKING, FINANCIAL MARKETS AND REGULATION?
l a r c i e r
correlations of bank and the efficiency of CDO markets lowering simultaneouslytraditional imperatives to maintain availability of liquid assets to meet abnormaldeposit withdrawals.
The distinguished characteristic of market liquidity is new financial intermediarymodel. The funding liquidity is based on holding the assets on a balance sheetfinanced with liquid deposits as a result of assets transformation. The marketliquidity transforms the assets itself from illiquid pools of loans into liquid secu-rities. It allows the originating bank to sell assets in the financial markets and re-cycle their capital to originate new loans, which can in turn be transformed andsold. Consequently, the innovative form of financial intermediary conducts matu-rity, credit, and more importantly liquidity transformation without access to cen-tral bank liquidity or deposits. Shadow banks comprise a long intermediationchain, which transforms credit through a wide range of secured funding tech-niques such as asset-backed securities, CDO and repo (Pozsar, Adrian, Ashcraft,Boesky, 2010).
The above processes are a pure consequence of the more complex systemic shiftfrom the classical bank-dominated originate-to-hold intermediation model to
Figure 2: Main pillars of market liquidity
Source: Own analysis
Reduced role of deposit
insurance schemes and central banks
Off balance liquidity
Correlated market
valuation
High
information asymmetry
Assets transformation
– financial leverage
Market liquidity pillars

REVISITED CONCEPT OF BANK LIQUIDITY IN THE THEORY OF BANK INTERMEDIATION 171
l a r c i e r
market-oriented originate-to-distribute financial market systems. Thus, marketoperations on the asset-side of banks’ balance sheet are triggered by growing effi-ciency of financial markets to redistribute the capital in the economy. Empiricalevidences provided by Beck and Levine (2002) suggest, that the more developedfinancial system is, the more important these intermediation shifts are. Securiti-zation increases profits as banks can more easily redeploy liquid capital resourcesto more profitable business opportunities (Parlour and Plantin, 2007) (Schuer-mann, 2004).
On the other hand, securitization promotes market liquidity but simultaneouslymakes banks highly prone to a liquidity squeeze. On the contrary, classical bank-ing relies primarily on retail deposits as stated Shin (2009), Brunnermeier (2009)and Ashcraft, McAndrews, Skeie (2008). The increased risk of market liquidityfinds illustration in Fecht’s theory (2004) that allows for a contagion mechanismwhere a liquidity shock at one bank propagates itself through the financial systemby depressing asset prices in securities markets. In a nutshell, recent systemicchanges in bank liquidity management led to increasing challenges that banksface in maintaining liquidity and profitable operations away from core bankingactivity.
The initial nature of recent financial crisis was major liquidity crisis, because mostsecurities become highly correlated in downturn trend as all investors and fundedinstitutions were forced to sell high quality assets in order to generate liquidity.This is an idiosyncratic fragility of market-based financial system, where financialinstitutions’ balance sheets are tied together with mark-to-market leverage con-straints (Pozsar, Adrian, Ashcraft, Boesky, 2010)
9.3.2. Asymmetric Information Hazards of Market Liquidity
The contagion mechanism of market liquidity crisis was sparked by massive col-lapse of CDOs, which is commonly considered the origin of the worldwide finan-cial crisis. However, it should be pointed out that these structured credit deriva-tives should not be considered the main reason for worldwide turbulences inbanking sectors, taking into account the widespread dispersion of CDO investorsand relatively small part of subprime mortgage loans in total loan portfolio(about 16 percent of all U.S. mortgage debt in 2008).
An analysis of subprime mortgages provides the evidence (Demyanyk, 2009) thatwithin the first year of origination, approximately 10 percent of the mortgagesbetween 2001 and 2005 were delinquent or in default, and It was the case ofapproximately 20 percent of the mortgages in 2006 and 2007. Moreover, thedeterioration of quality of subprime mortgage loans for six consecutive yearsbefore the crisis with securitizes awareness of it (Demyanyk and Van Hemert

172 NEW PARADIGMS IN BANKING, FINANCIAL MARKETS AND REGULATION?
l a r c i e r
2007), show much more complex spectrum triggers of the market liquidity crisisthan solely CDOs’ collapse.
The case of CDOs has revealed main challenges to market liquidity risk manage-ment. First of all, CDOs started to be perceived as independent category of assetsdespite the fact that they were issued as a credit derivates based on the specificassets with perspective cash flow scheme (Krzesniak, 2009). The example of sucha regard is emergence of CDO issuances that based entirely on the equity layertrenches issued by former CDOs. Consequently, CDOs increased asymmetricinformation hazards in banking system as their issuers had little incentive to cre-ate high-value instruments since they anticipated smooth sells of all tranches(Keys et al., 2008).
Moreover, despite their large scale, CDOs investment portfolios have not broughtabout the common market standards that would allow objective and comparablerisk assessments like in option markets with a useful approximation of Black-Scholes equitations. On the contrary the structure of tranches within CDOs issu-ances was arranged in accordance with the objectives of particular group of inves-tors. Consequently, there were no market-wide and sole mechanism of projectingfuture flows of tranches and risk evolution. Due to impressive diversity of CDOmarket, credit rating agencies failed to adequately account for set of risk andvalidate it respectively. The issuance flexible methodology under which the bankwas able to cherry pick the loans to be put on the market deepened asymmetricinformation hazards in form of adverse selection.
The lack of market standardization gave grounds for another problem – limita-tions to regular updating of the risk exposure conveyed to the CDO investors.The historical value of referent assets portfolio was not enough even for a rough
Figure 3: Global CDO Market Issuance (USD thousand)
Source: SIFMA
78 454 83 074 86 630
157 821
251 265
455 545430 458
61 887
4 336 8 003050 000
100 000150 000200 000250 000300 000350 000400 000450 000500 000
2001 2002 2003 2004 2005 2006 2007 2008 2009 2010

REVISITED CONCEPT OF BANK LIQUIDITY IN THE THEORY OF BANK INTERMEDIATION 173
l a r c i e r
estimation of current risk of CDOs. In time this process caused a growing infor-mation asymmetry that has finally led to the materialization of reputation riskand the abrupt value decrease. It had devastating effects on market liquidity,which stems not only from the scope of relevant information of overall quality ofassets but also fluctuated market sentiments (Malherbe 2009). This aspect ofasymmetric information produced a very fragile balance in the CDOs’ marketwith its high proneness to large liquidity shifts.
Asymmetric information can be perceived also among reasons for the failure ofsafeguards against the risk in CDOs, i.e. over-collateralization and ‘liquiditybackstop’ (Brunnermeier 2009). The lack of up-dated validation of bank assets,which served as basis for CDO issues, increased risk premiums highly beyond thehaircut within over-collateralization. Moreover, the banking system still bore theliquidity risk from holding long-term assets and making short-term loans eventhough it does not appear on the banks’ balance sheets.
Market liquidity affects considerably the fair value of traded securities. Conse-quently, market prices deviate widely from ‘fundamental’ values of assets, puttingat stake the regulatory capital of banks. In financial markets with large informa-tion asymmetry the fair value accounting can become inaccurate generating highfluctuations of price. The effectiveness of fair value is closely connected with levelof liquidity of the market and corresponding ability to accurately set collectivelyvalue of marketable securities. Adjusting the value of CDOs to their market valuewas difficult due to lack of market standardization and tailored-made proceduresof issue.
Banks were dealing with fair value accounting problem using as benchmarkprices of new CDO issues or implanting internal valuation methods. The firstmethod turned out to be greatly illusive as sharply fluctuating structure of newportfolio failed to supply banks with appropriate benchmarks. The secondmethod also failed as the internal valuations were difficult to validate and in factthey merely mask the acute problems. As the consequence, the fair value account-ing led to write-offs not only actual losses but also potential ones underminingthe credibility of the market. Materialization of reputation risk has led to thespiral of self-aggregative financial distress due to lack of natural market stabiliz-ers such as speculative purchases. Many banks and other financial institutionshad to write off significant losses as a result of marking-down CDO’s prices tomarket value, which aggravated market illiquidity creating the stigma of collater-als.
Limited market liquidity triggers large value volatility especially in terms ofdownturn trend. In a situation of rising information asymmetry the materializa-tion of reputation risk is initiated by a mere concern of wider risk exposition andmarket demand for securities collapses. In the illiquid markets banks are exposed

174 NEW PARADIGMS IN BANKING, FINANCIAL MARKETS AND REGULATION?
l a r c i e r
to abrupt dry-ups. To make matters worse, the automatic transaction systemsbased on stop-losses undermined the ability of investment companies to maintainfurther such assets in their portfolio. Highly correlated liquidity of CDOs resultedin the chain reaction without stabilizing speculation associated with other finan-cial markets.
Market liquidity favors the short-term financing to test the confidence in bank’sability to perform market operations (Stein 2005). On the other hand, most mort-gages have maturities measured in long term, which creates an increase in thematurity mismatch on the balance sheet of banks. This mismatch is amplified bythe moves towards financing balance sheets with short-term repurchase agree-ments (repos). The fraction of total bank assets financed by overnight reposroughly doubled from 2000 to 2007 (Brunnermeier, 2009). Consequently, marketliquidity led to greater banks reliance on short term financing requiring to rollover a large part of their funding even on a daily basis. The tremendous increasein the market liquidity has brought about wider maturity mismatches based onthe banks reliance on short-term market liabilities (Tirole 2009).
Figure 4: Pitfalls of market liquidity in banking sector
Source: Own analysis
Fair value accounting
System-wide liquidity shocks
Adverse selection and moral hazard
Lack of intrinsic
stabilizers
Off balance liquidity risk
Market liquidity

REVISITED CONCEPT OF BANK LIQUIDITY IN THE THEORY OF BANK INTERMEDIATION 175
l a r c i e r
9.4. Concluding Remarks
Despite the fact that classical model of funding liquidity in banking has beenlargely reshaped by new financial intermediation with market liquidity impera-tives, it has little consequences for institutional framework so far. The mecha-nisms of intrinsic stabilizers in banking sector are still organized mainly aroundthe concept of transformation of liquid deposits into illiquid assets together witha predominate role of central banks and deposit insurance schemes as pillars ofsecurity net. The last worldwide financial crisis has made it evident that the clas-sical role of banking intermediary has undergone profound changes in advancedeconomies.
The most apparent proof of this transformation is the limited importance of clas-sical bank runs and system-wide liquidity crisis geared by massive trade of assetsbased securities such as CDOs. The fragility of liquidity stability in bankingaddresses the important weaknesses of classical theory of banks as liquiditypools. Undermined liaisons between banking assets and deposits create new chal-lenges to the theory of banking intermediary functions. The contradictory solu-tions to the above phenomena such as the concept of narrow banking or shadowbanking system create the scope of fruitful progress in understanding liquidityshortages both at empirical and academic levels of knowledge.
References
ALLEN, F. and GALE, D., 1998, “Optimal Financial Crisis”, Journal of Finance,Vol. 53(4), pp. 1245-1284.
ALLEN, F. and GALE, D., 2005, “Financial Fragility, Liquidity, and Asset Prices”,Journal of the European Economic Association, Vol. 2(6), pp. 1015-1048.
ASHCRAFT, A., MCANDREWS, J. and SKEIE, D., 2008, “Precautionary Reservesand the Interbank Market”, Federal Reserve Bank of New York StateReports, No. 370.
BHATTACHARYA, S. and GALE, D.S., 1986, “Preference Shocks, Liquidity, andCentral Bank Policy”, CARESS Working Paper, University of Pennsylvania,Vol. 86/01.
BOLTON, P., SANTOS, T. and SCHEINKMAN, J.A., 2009, “Market Liquidity andPublic Liquidity”, American Economic Review, Vol. 99, pp. 594-599.
BAGLIONI, A. and MONTICINI, A., 2008, “The intraday interest rate under aliquidity crisis – the case of August 2007”, DISCE – Quaderni dell’Istitutodi Economia e Finanza, No. 0083, pp. 1-16.
BASEL COMMITTEE ON BANKING SUPERVISION, 2008, Principles for SoundLiquidity Risk Management and Supervision.

176 NEW PARADIGMS IN BANKING, FINANCIAL MARKETS AND REGULATION?
l a r c i e r
BECK, T. and LEVINE, R., 2002, “Stock Markets, Banks and Growth: Panel Evi-dence”, NBER Working Paper Series, No. 9082.
BRYANT, J., 1980, “A Model of Reserves, Bank Runs, and Deposit Insurance”,Journal of Banking and Finance, Vol. 3, pp. 335-344.
BRUNNERMEIER, M.K. and PEDERSEN, L.H., 2005, “Predatory Trading”, Journalof Finance, Vol. 60 (18), pp. 25-63.
BRUNNERMEIER, M.K. and PEDERSEN, L.H., 2009, “Market Liquidity and Fund-ing Liquidity”, Review of Financial Studies, Vol. 22, pp. 2201-2238.
BRUNNERMEIER, M., 2009, “Deciphering the liquidity and credit crunch 2007-2008”, Journal of Economic Perspectives, Vol. 23(1), pp. 77-100.
BRYAN, L., 1991, “The core of banking”, McKinsey Quarterly, Vol. 1.
BORIO, C., 2000, “Market Liquidity and Stress: Selected Issues and Policy Impli-cations”, BIS Quarterly Review, November 2000, pp. 38-51.
CALOMIRIS, C. and KAHN, C.M., 1991, “The Role of Demandable Debt in Struc-turing Optimal Banking Arrangements”, American Economic Review, June,pp. 497-513.
MCCULLEY, P., 2007, “Teton Reflections”, PIMCO Global Central Bank Focus.
DEMYANYK, Y., 2009, “Quick Exits of Subprime Mortgages”, St. Louis Review,Vol. 91-2, pp. 79-93.
DEMYANYK, Y. and VAN HEMERT, 2007, “Understanding the Subprime Mort-gage Crisis”, SSRN PAPERS, pp. 1-40.
DIAMOND, D.W. and DYBVIG, P.H., 1983, “Bank Runs, Deposit Insurance, andLiquidity”, Journal of Political Economy, Vol. 91, pp. 401-419.
DIAMOND, D.W., 1997, “Liquidity, Banks, and Markets”, Journal of PoliticalEconomy, Vol. 105, pp. 928-956.
DIAMOND, D.W. and RAJAN, R. G., 2005, “Liquidity shortages and banking cri-ses”, Journal of Finance, Vol. 60 (2), pp. 615-647.
DREHMANN, M. and NIKOLAOU, K., 2009, “Funding liquidity risk. Definitionand measurement”, ECB Working Paper, No. 1024.
FECHT, F., 2004, “On the stability of different financial systems”, Journal of theEuropean Economic Association, Vol. 2, pp. 969-1014.
FISHER, I., 1935, “100% Money”, Adelphi.
FISHER, P., 2009, “Managing liquidity in the system – the Bank’s liquidity insur-ance operations”, published speech.
FRIEDMAN, M., 1960, “A Program for Monetary Stability”, Fordham UniversityPress, 1960.
FREIXAS, X., PARIGI, B. and ROCHET, J.-Ch., 2000, “Systemic Risk, InterbankRelations, and Liquidity Provision by the Central Bank”, Journal of Money,Credit and Banking”, Vol. 32, pp. 611-638.

REVISITED CONCEPT OF BANK LIQUIDITY IN THE THEORY OF BANK INTERMEDIATION 177
l a r c i e r
HOLMSTROM, B. and TIROLE, J., 1998, “Private and Public Supply of Liquidity”,Journal of Political Economy, Vol. 106, pp. 1-40.
KRZESNIAK, A., 2009, “Brak płynnosci i transparentnosci rynkow finansowychjako wybrane przyczyny zaburzen w latach 2007-08”, Finanse, Vol. 1.
KOBAYAKAWA, S., NAKAMURA, H.A., 2000, “Theoretical Analysis of NarrowBanking Proposals”, Monetary and Economic Studies.
LITAN, R., 1987, What should banks do?, Brookings Institution, Washington,D.C.
MALHERBE, F., 2010, “Self-fulfilling liquidity dry-ups”, National Bank of Bel-gium, Research series, March 2010.
MORRIS, S. and SHIN, H., 2004, “Liquidity Black Holes”, Review of Finance,Vol. 8(1), pp. 1-18.
KASHYAP, A.K. and RAGHURAM, R., STEIN, J.C., 2002, “Banks as Liquidity Pro-viders: An Explanation for the Coexistence of Lending and Deposit-Tak-ing”, The Journal of Finance, Vol. 57, No. 1, pp. 33-73.
KOTLIKOFF, L., 2010, Jimmy Stewart Is Dead: Ending the World’s OngoingFinancial Plague with Limited Purpose Banking, Hoboken, N.J., JohnWiley & Sons.
PARLOUR, Ch. and PLANTIN, G., 2008, “Loan Sales and Relationship Banking”,Journal of Finance, Vol. 63, pp. 1291-1314.
PIERCE, J., 1991, “The future of banking”, Yale University Press.
PEDERSEN, L.H., 2009, “When everyone runs for the exit”, The InternationalJournal of Central Banking, Vol. 5, pp. 177-199.
POZSAR, Z., ADRIAN, T., ASHCRAFT, A. and BOESKY, H., 2010, “Shadow Bank-ing”, Federal Reserve Bank of New York Staff, Report No. 458.
PHILLIPS, R.J. and ROSELLI, A., 2011, “How to Avoid the Next Taxpayer Bailoutof the Financial System: The Narrow Banking Proposal” in TATOM, J.,Financial Market Regulation Legislation and Implications, Springer.
STRAHAN, P., 2008, “Liquidity production in 21st century banking”, NBERWorking paper series, Working Paper 13798.
TIROLE, J., 2009, “Illiquidity and All its Friends, draft”, Journal of EconomicLiterature.
WALLACE, N., 1996, “Narrow Banking Meets the Diamond-Dybvig Model”,Federal Reserve Bank of Minneapolis Quarterly Review, Vol. 20 (1), pp. 3-13.


179
l a r c i e r
10. AN ALTERNATIVE WAY OF CALCULATING RISK-BASED
DEPOSIT INSURANCE PREMIUMS
Susanna Walter and Matthias Schaller
Abstract
The pricing of deposit insurance premiums traditionally uses expected lossapproaches for the calculation of premium charges. Merton (1977) opened up asecond branch using option pricing methods for the evaluation of the risk a bankposes to the deposit insurance scheme. We present an innovative methodology toallocate deposit insurance premiums among financial institutions that uses ele-ments of both approaches: We use standard key figures on capitalization andliquidity from expected loss models on deposit insurance pricing and integratethese figures into a stochastic process based on the Merton framework. Hence,we are able to build on the advantages of a multi-indicator model while still usingthe dynamic information of option pricing models. Our empirical validation ofthe model suggests that our pricing algorithm is in fact able to discriminatebetween the riskiness of banks and it is also highly sensitive to worsening condi-tions of a financial institution.
Keywords: Deposit Insurance, Risk-based premium, Covered Deposits, Expectedloss, Option Pricing, Basel 3
JEL Code: G1, G18, G21, G22, G28, G30, G32, G33.
10.1. Introduction
The recent financial crisis once again proved that the financial industry is deci-sively different from other industries. One of the major differences is that thecollapse of a competitor does not strengthen the position of everybody else in themarket but can rather lead to a domino effect that ultimately drags down thewhole financial system and, undoubtedly then, the economy. Even though mostgovernments were ultimately forced to take steps in mitigating the turmoil, thefinancial safety nets of most countries proved to be quite effective in protectingthe financial institutions. This is especially true for deposit insurance as one of thecore elements of a financial safety net. While the financial system as a whole wasvery fragile during the crisis, the deposit insurance schemes at least managed toprevent bank-runs throughout most of the crisis.
Deposit Insurance schemes (in short: DIS), however, are no free lunch. Traditionalmoral hazard theory argues that deposit insurance creates a strong incentive forthe management of banks to choose exceptionally high leverage and for the cus-tomers of banks to loosen their monitoring activities. As with other types of insur-

180 NEW PARADIGMS IN BANKING, FINANCIAL MARKETS AND REGULATION?
l a r c i e r
ance, moral hazard is most important when the premium of deposit insurancedoes not properly reflect the effective underlying risk associated with the activitiesof the banks. Accordingly, moral hazard could be partially mitigated by introduc-ing risk-adjusted premiums to deposit insurance schemes. This, however, proofsto be a very challenging subject as it is all but clear, what the actual bank risk isand how it should be measured.
Current academic as well as practical literature shows that there is still no fairand pragmatic calculation method according to the broad requirements for thecalculation of risk-based premiums in deposit insurance as specified by JRC(2009). However, the need for such a system is going to be explicitly anchoredin the revision draft of the Directive 94/19/EC and the complementary Directive2009/14/EC (2009) (see JRC 2010b). As a typical feature of a self-regulatoryframework, the original Directives (as well as relating recommendations andprinciples such as FSF 2001 and IADI 2009) and the revision endeavours stipu-late that the costs of funding deposit insurance systems should be borne by theappropriate members (i.e. the credit institutions). However, the regulations giveno details on how such risk-based premiums should be determined in order toaugment an ex-ante deposit insurance fund (DIF).
The aim of our paper is therefore to contribute to this discourse by introducing aMerton-based, risk-adjusted calculation of deposit insurance premiums. Ourapproach combines the advantages of expected loss pricing and option pricingtheory in an innovative framework. It relies on established key figures fromexpected loss pricing for the assessment of a bank’s riskiness, but at the sametime, incorporates the time-variant information included in option-pricingtheory.
The remainder of this article is organized as follows: The next section providesan overview of the relevant previous research in the area of the risk-based pricingof deposit insurance premiums. The third section elaborates on our theoreticalmodelling framework. In the fourth and fifth section, we test our model based ondata of the US banking sector for the years 2002 to 2009. The final section dis-cusses and concludes the paper.
10.2. Literature Review
There is a strong consensus in research as well as in practice that risk-based pre-miums for deposit insurance schemes are – mainly in combination with ex-antefunding – preferable to flat premium pricing. The reason is that risk-adjustedpremiums for deposit insurance are most capable of preventing moral hazardousbehaviour since it penalizes riskier banks (Keeley 1990, Marshall and Prescott2001, Bartholdy et al. 2003, Demirguç-Kunt and Huizinga 2004, Demirguç-Kunt

AN ALTERNATIVE WAY OF CALCULATING RISK-BASED DEPOSIT INSURANCE PREMIUMS 181
l a r c i e r
et al. 2007). Additionally, as Pennacchi (2005) shows, risk-based deposit insur-ance premiums generate smaller pro-cyclical effects than risk-based capitalrequirements. Thus, the pro-cyclical impact of Basel II can be reduced bystrengthening risk-based deposit insurance premiums.
There are two relevant streams for the calculation of deposit insurance, expectedloss pricing and Merton-type approaches. Expected loss pricing, originally stem-ming from credit risk management, is centred on a bank’s expected probability ofdefault (PD). This PD can be estimated using fundamental data (i.e. capitalizationratios) or market data (i.e. credit spreads). Since market data is not available forthe large part of most banking sectors, risk-adjusted deposit insurance premiumsthat are currently in place rely on expected loss pricing based on fundamentaldata. A comprehensive overview on the risk-based methods that are currentlyadopted in five countries in the EU27 (Germany, France, Portugal, Italy, Finlandand Sweden) as well as on the method currently in place in the US are summarizedin JRC (2008). The major drawback of expected loss pricing is its strong focus onpoint-in-time assessment of PDs. Hence, expected loss pricing mostly disregardsany dynamic behaviour in the development of relevant key figures.
Merton-type approaches for the calculation of deposit insurance premiums areable to remedy this shortfall of expected loss pricing. These approaches employelements of option pricing theory based on Black and Scholes (1973). The origi-nal Merton framework (1977) uses these principles in order to estimate the prob-ability of default of companies in a time-continuous setting. The default processof a company is driven by the value of assets and the value of liabilities. Theresulting default probability is therefore explicitly linked not only to current val-ues of the firm’s assets, but also to its variability. One major drawback of Mer-ton’s (1977) original framework is that it uses the asset value and volatility of abank’s assets in order to derive its riskiness. Both parameter are unobservable andtherefore prevent the model from practical adoption. Marcus and Shaked (1984)and Ronn and Verma (1986) were the first to address this issue using the observ-able market value of equity and its volatility of listed banks. Additionally, thereare several papers proposing methods on how to estimate the effective and mar-ket-based equity value as well as its volatility (Kuester and O’Brien 1991, Barthet al. 1992, Cooperstein et al. 1995, Duffie et al. 2003, Falkenheim and Pennac-chi 2003, Eom et al. 2004).
We contribute to both streams of literature on risk-adjusted deposit insurancepremiums: Regarding the Merton approach, our model circumvents to problemof estimating equity values by using data that is readily available for most banksin all developed countries. We then use key figures derived from expected losspricing for the estimation of probabilities of default of banks and incorporatethese figures into the time-continuous setting of the Merton-type approaches.

182 NEW PARADIGMS IN BANKING, FINANCIAL MARKETS AND REGULATION?
l a r c i e r
10.3. Methodology
As a necessary requirement of our approach, we assume that the total fund pay-ments per period are exogenously pre-specified. This is in line with mostapproaches currently in use (EBF 2010, JRC 2010) and also most likely to passpolitical decision processes. This reflects a DIS where the target rate of total fundsize to total insured deposits is pre-defined as well as the period during which thistarget rate should be reached (accumulation period). This assumption of an exog-enously determined fund sizes considerably facilitates the calculation of premiumpayments since it reduces the question of the absolute riskiness of the banks to aquestion of the relative riskiness of a bank compared to the other banks in thesector. Additionally, any systemic risk components in the banking industry mightbe neglected under the assumption that the systemic risk is distributed homoge-nously across the financial institutions. Assuming exogenously fixed total pre-mium payments and abstracting from systemic risk components, the only remain-ing relevant factors for the calculation of deposit insurance premiums are a con-tribution base and a factor reflecting the risk profile of a bank (JRC 2008, JRC2009, Bernet and Walter 2009).
Our model uses several steps for the calculation of a bank’s contribution to theoverall fund inflows of a certain period: In the first step, it is necessary to identifythe set of p relevant variables X that are useful for predicting stability of bank i.Depending on the focus of the setup for the DIS, the variables could either bederived from credit rating analysis, research on bank stability, or key figures ofregulatory schemes. It is worthwhile noting that the set of variables could consistof any number of variables. In the second step, these variables are included in alogistic regression as independent variables, whereas bank default is the depend-ent variable. The resulting propensity score of bank i for period t is calculatedusing the following equation:
: Propensity Score: Bank: Period: Coefficient: Independent Variable: Number of Covariates
The usage of logistic regression does, of course, restrict the model to bankingsystems with a sufficient number of bank failures in order to calibrate the model.However, if this requirement is met, the calculation of propensity scores automat-
PSi t,β0 β1 X1⋅ β2 X2⋅ … βp Xp⋅+ + + +( )exp
1 β0 β1 X1⋅ β2 X2⋅ … βp Xp⋅+ + + +( )exp+---------------------------------------------------------------------------------------------------------------=
PS
i
t
βX
p

AN ALTERNATIVE WAY OF CALCULATING RISK-BASED DEPOSIT INSURANCE PREMIUMS 183
l a r c i e r
ically includes statistically optimized weightings to each of the variables based onthe coefficient estimated by the logistic regression. The calculated propensityscore reflects a value that corresponds to the riskiness of bank i in period t,based on the historical information of failed versus non-failed banks in therespective banking sector. In order to come up with a time series of propensityscores, this procedure has to be repeated for each bank and each period. Theresulting time series’ of propensity scores constitutes a vector of a single variablethat incorporates the relevant and available information on each particular bank.
Now, taking the stochastic process of bank i,
,
: Propensity Score: Bank: Period
it is possible to calculate the corresponding mean µi and standard deviation i ofpropensity scores. Assuming log-normally distributed values of propensity scores,it is then possible to specify the bank-specific stochastic process associated withthe propensity scores as:
: Propensity Score: Bank: Period
: Standard Wiener Process: Mean: Standard Deviation
Staying with the Merton terminology, the time-constant value of liabilities is setto unity. Since the range of values of the propensity scores and the survival pro-pensity is [0;1] this means that the put option associated with the stochastic proc-ess is always at- or in-the-money. From an economic perspective, this might beinterpreted as the immanent risk of default, every, even the safest, financial insti-tution poses to the banking system. Following Merton (1977), the fair value ofthe put option associated with the process can be written as:
PSi t,
PSi PSi 1, … PSi T,[ ]=
PS
i
t
dPSi t, µidt σidWt+=
PS
i
t
W
µσ
P PSi T,( ) θ h2( ) 1PSi T, 1+( )
--------------------------- θ h1( )⋅–=

184 NEW PARADIGMS IN BANKING, FINANCIAL MARKETS AND REGULATION?
l a r c i e r
where
: Put Option Value: Propensity Score
: Observation Period: Standard Deviation
Whereas the Merton model uses the deposit-to-asset value ratio, our model usesthe propensity score of the banks increased by one. The constant addition of oneis necessary as the average propensity scores are very low, i.e. closer to zero thanto one. The original Merton framework works with deposit-to-asset values in therange close to one and accordingly, the model has the best discriminatory powerin this area. By adding one to the propensity scores, we are able to make betteruse of the discriminatory power, while the basic concept of the pricing algorithmremains unchanged.
The put value calculated for each bank reflects the risk component. In the nextstep, this risk component is multiplied with the bank-specific contribution base.In the case of deposit insurance, the contribution base are the covered depositsCDi,t of the bank which reflect the effective exposure to a DIF. In order to comeup with the final contribution of each financial institution, these risk components– weighted by the contribution base – need to be transformed into values relativeto the overall payment. The relative risk contribution, multiplied with the totalpayments per period, constitute the deposit insurance premium per bank in therespective period DIPi,T:
: Deposit Insurance Premium: Put Option Value: Covered Deposits: Total Premium Payments
: Bank: Period
h1
PSi T, 1+( )logσi
2T⋅
2--------------–
σi T---------------------------------------------------------------=
h2 h1 σi T+=
P
PS
T
σ
DIPi T,Pi T, CDi T,⋅
Pi T,i 1=
1
CDi T,⋅------------------------------------- PPt⋅=
DIP
P
ID
PP
i
t

AN ALTERNATIVE WAY OF CALCULATING RISK-BASED DEPOSIT INSURANCE PREMIUMS 185
l a r c i e r
This model requires a set of assumptions: Regarding assumptions related to tech-nical and structural aspects of premiums, we incorporate no regulatory forbear-ance or other bailout assistance options (such as M&A). Furthermore, we assumecompulsory membership of banks as recommended by most academic literature(Garcia 1999, Demirguç-Kunt et al. 2003) as well as (self-) regulatory frameworkcomponents and underlying principles (Directive 94/19/EC 1994, JRC 2010, andIADI 2009). This compulsory membership prevents adverse selection problemsotherwise associated to deposit insurance schemes. We further assume that allbanks actually pay their risk-based premiums (e.g. the government has the powerto oblige banks which accept domestic covered deposits to pay for their risk-based premiums). Finally, we abstract from any auditing or fund-related over-head costs and abstract from interest income of financial investments of accumu-lated fund assets.
In the following section, we want to present one potential alteration to the pricingmodel that uses an Ornstein-Uhlenbeck process as underlying stochastic process:
: Propensity Score: Bank: Period
: Standard Wiener Process: Mean: Standard Deviation: Mean-Reversion Factor
This process is able to capture mean-reverting behaviour in the propensity scoresof the banks. The, now time-variant drift of the process is calculated as the dif-ference of the long-run average of propensity scores and the current propensityscore, scaled by a mean-reversion factor between zero (no mean-reversion) andone (complete mean-reversion). If a significant part of the predictor variables inthe logistic regression exhibit a mean-reverting behaviour, this characteristicshould also be incorporated to the process of propensity scores.
To illustrate the adequacy of mean-reversion, we assume a model that includesthe capitalization of banks as predictor of bank riskiness. The basic Gaussianstochastic process is designed to meet the development of stock prices. Abstract-ing from a constant drift, the best estimator of the next value is the current value.This, however, might not be reasonable for capitalization levels of banks. To agreat extent, the general level of capitalization of a bank is a strategic decision ofthe bank’s management that trades-off aspects of profitability and bank stability.Only subsequent to regime changes in the regulatory or competitive environment,which we do not incorporate in our model, capitalization ratios should evolve to
dPSi t, ω µi PSi t,–( )dt σidWt+=
PS
i
t
W
µσω

186 NEW PARADIGMS IN BANKING, FINANCIAL MARKETS AND REGULATION?
l a r c i e r
new stationary levels. Accordingly, the best estimator for a capitalization mightnot be the current value, but a value somewhere between the current value andthe target capitalization of the bank. This results in a mean-reverting process,described by the Ornstein-Uhlenbeck characterization. The introduction of themean-reverting process, however, distinctively complicates the calculation of theput values and the respective premium payments.
10.4. Data Sample
In this section, we test our model using data of the US banking sector. We requireinformation on the contribution base of each bank (i.e. the size component), therisk factors used to derive the propensity scores and assumptions regarding thetotal premium payments per period.
As contribution base, we choose the covered deposits of each bank. Covereddeposits include all deposits of banks that are insured by deposit insurance. Asthe exposure of the DIF is restricted to these deposits, covered deposits effectivelymirror the maximum exposure a bank imposes on the DIF. In the case of the USA,covered deposits are protected or insured deposits repayable by the guaranteescheme under the appropriate national law. In the USA, all traditional types ofbank accounts – checking, savings, trust, certificates of deposit (CDs), moneymarket deposit accounts and IRA retirement accounts – are insured by the Fed-eral Deposit Insurance Corporation (FDIC) if the respective financial institutionis a member of the FDIC. The insurance is limited at an amount of $250,000 percustomer.
It is important to note that the empirical analysis is only one illustration of thepotential applications of the calculation methodology. There is a wide variety offactors that might be included in the determination of bank risk. The actualchoice of variables might also be influenced by several external factors, e.g. polit-ical, academic, or the availability of data. In this example, we focus on variablesderived from the Basel III framework. Two major pillars of the current Baselframework are capitalization and liquidity. Accordingly, we incorporate one var-iable on each of these two dimensions of bank stability. With regard to capitali-zation, we choose tier 1 ratios as indicator. This variable is – designed as mini-mum requirement – also the variable that is included into the Basel framework.In accordance with current regulatory efforts to strengthen liquidity requirementsof banks, we also include the liquidity cushion of banks into our analysis.Basel III proposes two different key figures on liquidity: The liquidity coverageratio and the net stable funding ratio. The data required for the calculation of anyof the two figures, however, is not yet available. Hence, we restrain our analysisto the cash ratio. The cash ratio indicates to what extent an institution is able tomeet its short-termed obligations using its most liquid assets. In the beginning of

AN ALTERNATIVE WAY OF CALCULATING RISK-BASED DEPOSIT INSURANCE PREMIUMS 187
l a r c i e r
the empirical analysis, we will provide evidence on the separation power of bothvariables with regard to bank default.
Concerning the total premium payments per year, there are two relevant factors:the designated reserve ratio and the accumulation period. The reserve ratio (orrelative fund size) of a deposit insurer is the ratio of fund reserves to total covereddeposits. In general, it needs to be “adequate to at least cover the potential lossesof the insurer under normal circumstances” (IADI 2009). The Dodd-Frank Actestablishes a maximum designated reserve ratio for the USA of 1.5% of estimatedcovered deposits (FDIC 2011). As a comparison, in the EU27, the practicallyadopted target ratio relative to covered deposits is at a median of 1.75%, exclud-ing Romania as an outlier with a target coverage of 10% (Hoelscher et al. 2006).In accordance to the US and European specifications we fix our relevant coverageratio at 1.5% of covered deposits.
Regarding the accumulation period of the target fund size, recommendationsrange from 5 to 17 years (JRC 2008, EBF 2010, FDIC 2011). For our analysis,we choose a time frame of 10 years or a respective 40 quarters. This periodreflects a hypothetical example of a newly established ex-ante financed depositinsurance fund in the US banking sector. For our calculations, we need to detectthe quarterly amount of premium inflows that reaches the target size of 1.5% ofthe CD within the period of 10 years. To keep the calculations simple, we abstractfrom any compounding effects in real terms. This results in quarterly target pre-mium payments of 0.0375% of covered deposits across all banks, assuming astable economic environment with a negligible amount of bank failures.
Our empirical analysis is based on quarterly balance sheet as well as income state-ment data of all US-American banks and thrift institutions registered with andreported to the Federal Deposit Insurance Corporation (FDIC) for the time period01/01/2001 – 6/30/2010. For financial years before 2001 the FDIC does notreport quarterly figures. Therefore, our data sample is limited to a total of 38periods. Over the investigated time period, a total of 10,966 different financialinstitutions reported to the FDIC on a quarterly basis (see Table I, p. 188). 329of these institutions either failed in the course of the sample period or needed anassistance transaction to be able to continue business. In the following, this sub-sample is referred to as failed banks (F).
The second subsample amounts to 10,637 non-failed banks (NF), which reportedat least once in the course of the observation period to the FDIC and neitherdefaulted nor required any assistance transactions. For each year we display thenumber of reports available for the respective subsample (e.g. in 2001 there were270 reports available of banks that eventually defaulted in the subsequent years).In order to avoid a selection bias we also include all quarterly reports submittedby banks that were acquired by a competitor in the course of the observation

188 NEW PARADIGMS IN BANKING, FINANCIAL MARKETS AND REGULATION?
l a r c i e r
Table I: Summary Statistics on FDIC Data on Bank Statistics
Year
Report
s
Availa
ble
Rep
ort
s
Avail
able
Ba
nk
Defa
ult
s
Em
plo
yees
(Media
n)
Emplo
yees
(Media
n)
Em
plo
yees
(Mean)
Emplo
yees
(Mea
n)
Bala
nce
Sheet
Tota
l*
(Media
n)
Bala
nce
Sh
eet T
otal*
(Media
n)
Bala
nce
Sheet
Tota
l*
(Mean)
Bala
nce
Sh
eet T
otal*
(Mea
n)
NF
F
N
F
F
NF
F
N
F
F
NF
F
20
01
9,3
43
2
70
9
32
41
173
1,3
06
92.5
1
22
.4
679.3
5,6
54
.1
20
02
9,0
86
2
69
6
33
46
181
1,4
00
99.1
1
47
.6
744.0
6,2
47
.1
20
03
8,9
06
2
76
5
34
49
187
1,3
92
105.2
17
1.1
809.7
6,7
68
.8
20
04
8,6
93
2
84
1
34
55
193
1,5
00
110.6
21
4.4
904.1
7,9
27
.1
20
05
8,5
39
2
96
-
35
61
196
1,6
51
117.2
25
1.0
957.6
9,1
52
.9
20
06
8,3
78
3
05
1
36
65
199
1,7
82
122.8
30
4.1
1,0
17.4
10
,99
5.0
20
07
8,2
34
3
05
4
36
70
203
1,8
02
128.8
33
7.0
1,1
22.3
12
,48
6.9
20
08
8,0
35
2
74
5
7
37
61
210
1,6
82
138.0
31
6.1
1,2
88.8
12
,67
6.1
20
09
7,8
83
1
37
1
60
37
50
210
2,7
47
149.1
29
6.1
1,2
80.4
20
,27
3.5
H1
- 2
01
07,8
47
3
2
8
6
37
57
207
4,4
39
151.8
33
1.1
1,3
00.0
33
,16
1.7
Tot
al10
,637
32
9
329
35
55
19
5
1,74
6
119.
0
22
7.4
99
8.0
10
,655
.7
* i
n milli
on
USD

AN ALTERNATIVE WAY OF CALCULATING RISK-BASED DEPOSIT INSURANCE PREMIUMS 189
l a r c i e r
period. Comparability and correctness of the data points reported by the banksis ensured by the standardized FDIC data collection process. This holds in partic-ular for the classification of individual positions. Accordingly, the definition ofour tier 1 capital matches with the FDIC and includes common equity plus non-cumulative perpetual preferred stock plus minority interests in consolidated sub-sidiaries less goodwill and other ineligible intangible assets. The amount of eligi-ble intangibles, including mortgage servicing rights in core capital is limited inaccordance with supervisory capital regulations. By limiting the data sample toFDIC-registered banks we ensure that all banks are obliged to a comparable reg-ulation framework.
In the first year, the sample of non-failing institutions contains 9,343 reports. Thisnumber continuously decreases to 7,847 reports filed at the end of 06/2010. Thedecrease of filed reports is a result of industry consolidation through mergers andacquisitions. The pattern behind the number of reports available for failed insti-tutions is determined by the recent financial crisis. Throughout the period beforethe current crisis, the number of reports filed every year slightly increased from270 in 2001 to 305 in the period just before the financial crisis started in 2007.With an increasing number of banks defaulting from the beginning of 2007, thisfigure starts to decrease until the end of mid-2010 (32). In the last two years, thefailed sample decreases dramatically as the majority of the failures happenedwithin these two years. Generally, the failed sample contains larger institutions interms of workforce and balance sheet total than the sample of non-failing insti-tutions. The median of failing banks employs 55 full time equivalents (FTE)whereas the median of non-failing banks employs only 35 FTEs. The respectivemean values are by far larger, which is due to the largest banks in both samplesthat skew mean values to higher levels. Similar relations are also reflected in thebalance sheet total as a second proxy for bank size.
In the next section, we want to elaborate on the applicability of the data for ourpricing methodology. We proceed in three steps: In the first section, we show theseparation power of tier 1 ratios and cash ratios with regard to bank default. Inthe second section, we test the lognormal distribution of the respective underlyingtime series’. In the third section, we test for mean-reverting behaviour as one ofthe potential extensions to our model.
In Figure 1 and Figure 2 (p. 190) systematic changes in the tier 1 and liquidtylevels. There are three interesting findings in these developments: First, for the tier1 ratios, the non-failing banks show relatively stable values throughout the wholeobservation period. This suggests that changes in industry dynamics, if so, onlyplay a minor role in the changes of tier 1 ratios. Second, the tier 1 ratios of thefailing sample are distinctively lower over the whole observation period than fortheir surviving peers. Third, tier 1 ratios drop in the direct advent of defaultresulting in a median value directly before default of only 2.2%.

190 NEW PARADIGMS IN BANKING, FINANCIAL MARKETS AND REGULATION?
l a r c i e r
For the liquidity ratio the picture is somewhat different: First, there is some vari-ance in the control groups, which suggests that, especially during the recent finan-cial crisis, there were distinctive alterations in the liquidity cushion in the wholebanking industry. Second, we find that failing banks have on average a lowerliquidity cushion throughout most of the observation period. Third, in the directadvent of default, which corresponds to the period of the financial crisis for mostof the bank failures, there is clear evidence for liquidity hording. To account for
Figure 1: Development of Tier 1 Ratios towards Default
Figure 2: Development of Liquidity Ratios towards Default
5 10 15 20 25 30 350
0.02
0.04
0.06
0.08
0.1
0.12
0.14
0.16
0.18
0.2
Quarter
Tie
r 1
Rat
io
Median of Tier 1 Ratios, FailedMedian of Tier 1 Ratios, Non-Failed
0
0.01
0.02
0.03
0.04
0.05
0.06
0.07
0.08
0.09
0.1
Quarter
Sha
re o
f Ite
m to
Tot
al A
sset
s
Median of Item to Total Assets, FailedMedian of Item to Total Assets, Non-Failed
5 10 15 20 25 30 350

AN ALTERNATIVE WAY OF CALCULATING RISK-BASED DEPOSIT INSURANCE PREMIUMS 191
l a r c i e r
this effect, we exclude the last year before default in our analysis on the discrim-inatory power of the liquditiy ratio.
We deepen this analysis by looking at the density distribution of both, the tier 1ratio and the liquidity ratio. Figure 3 and Figure 4 show the results for the twosubgroups of failing and non-failing banks. The results match with the findings ofthe previous analysis and show that both variables appear to have high discrimi-natory power with regard to bank default. Most importantly, this does not onlyaccount for the direct advent of default but also for the medium- to long-term.
Figure 3: Tier 1 Ratios at Default vs. Control Group
Figure 4: Liquidity Ratios at Default vs. Control Group
5 10 15 20 25 300
0.05
0.1
0.15
0.2
0.25
Tier 1 Ratio (in %)
Rel
ativ
e D
ensi
ty
Median of Tier 1 Ratios, FailedMedian of Tier 1 Ratios, Non-Failed
1 2 3 4 5 6 7 8 9 10 11 12 13 14 150
0.05
0.1
0.15
0.2
0.25
Liq. Ratio (in %)
Rel
ativ
e D
ensi
ty
Median of Liq. Ratios, FailedMedian of Liq. Ratios, Non-Failed

192 NEW PARADIGMS IN BANKING, FINANCIAL MARKETS AND REGULATION?
l a r c i e r
In order to apply most of the approaches based on Black and Scholes, a log-normal distribution of the underlying values is required. We examine the log-normal distribution of propensity scores using the Lilliefors specification test (Lil-liefors 1967). It uses the null hypothesis that the sample stems from a distributionin the normal family. Our approach requires a separate simulation for everyfinancial institution. Hence, log-normal distribution is a necessary requirementfor the data on every bank that is included in the simulation.
Using a significance level of 1%, we find that overall 70.1% of the samples donot require rejecting the null hypothesis of log-normally distributed values. Eventhough this value suggests that there is indeed a significant share of financialinstitutions whose propensity scores do not exhibit a log-normal distribution,there is a large degree of heterogeneity in the results. When we control for outlierand size effects, the results look quite different: An exclusion of changes in pro-pensity scores larger than +/-30% increases the share of non-rejected null hypoth-eses to a value of 88.6%. If we control for differences in the size of banks bydividing the sample into ten cohorts of increasing balance sheet size, the corre-sponding results are depicted in Figure 5. The share of non-rejected null hypoth-eses and, therefore, supposedly log-normally distributed values increases with adecrease in balance sheet size. For the sample with the smallest banks, this ratioreaches 97.7%. For the largest sample, the value does not exceed 75.1%.
As with most applications of the option pricing approaches, the tests of the log-normal properties of the underlying data deliver mixed results. The modelassumptions are most accurately met for smaller banks and hence the pricing
Figure 5: Share of log-normally Distributed Propensity Scores over Size
1 2 3 4 5 6 7 8 9 100
0.1
0.2
0.3
0.4
0.5
0.6
0.7
0.8
0.9
1
Groups (1: smallest banks)
Sha
re o
f non
-rej
ecte
d N
ull H
ypot
hesi
s
Ratio of normally distributed samples
AN ALTERNATIVE WAY OF CALCULATING RISK-BASED DEPOSIT INSURANCE PREMIUMS 193
l a r c i e r
results are most accurate for this subsample. Our analysis suggests that mostrejections of the lognormal distribution stem from the disproportionate share ofoutlier values. Overall, we are not able to reject or confirm the assumption of log-normally distributed propensity scores. However, since the findings rather sug-gest not rejecting the null hypothesis of lognormal distribution, we proceed withthe full data sample for the empirical analysis.
10.5. Empirical Validation
We test our model using the data sample as described in the previous section.Additionally, the input parameters reflect the results of our analyses. We assumelog-normal distribution of propensity scores within banks. Following ourdescription of the pricing methodology for risk-adjusted deposit insurance premi-ums, we calculate the value of the bank-specific put option for each bank sepa-rately, based on the propensity score and a time horizon of one year. This horizoncorresponds to a scenario with quarterly premium payments. We assume totaltarget premium payments of 0.0375% of covered deposits per quarter in order toreach the target fund size of 1.5% within a period of ten years.
To test our methodology, we split our data sample in two periods, one for thequarters 1-18 and one for the quarters 19-38. The first period is used to calculatethe hypothetical premium payments in a calm market environment. We then usethese payments and the information on which banks defaulted during the secondperiod to compare the premium payments of failing banks with their survivingpeers. If our pricing methodology is in fact able to identify banks with a riskierbusiness model, we should find that premium payments are distinctively higherfor the failed sample. Figure 6 Panel A to C (p. 194) show the resulting distribu-tion of premium payments across banks. Panel A shows the distribution of theput values as calculated with our pricing methodology. The values range from0.0000195 to 0.0639, with a mean of 0.0270 and a standard deviation of 0.0106.For the failing banks, the average is distinctively higher at a value of 0.0326.Keeping in mind that these hypothetical premium payments are calculated for ascenario where the failing banks are 5 years prior to their actual default date, itappears that tier 1 ratio and cash ratio do well in discriminating risky from savebanks even in the medium- to long run. Panel B shows the actual premium pay-ments in USD for one year based on our pricing algorithm. According to thefindings of Panel A, the least risky banks in the non-failing sample are onlycharged marginal premium payments of USD 509. The maximum premium pay-ment for the bank with the largest single risk amounts to USD 79.8 million, whilethe mean is USD 135,000. Taking the relatively long accumulation period intoaccount, the average premium payments are necessarily quite modest. The largerdifferences between the failing sample and the non-failing sample as compared to

194 NEW PARADIGMS IN BANKING, FINANCIAL MARKETS AND REGULATION?
l a r c i e r
Figure 6: Resulting Values at the End of Quarter 18
0 .01 .02 .03 .04 .05Put Value in Quarter 18
Failure (N=259)
No Failure (N=8416)
Panel A
0 50 100 150 200 250Absolute Premium (in 1000 USD)
Failure (N=259)
No Failure (N=8416)
Panel B
0 .0002 .0004 .0006Premium Relative to Deposits
Failure (N=259)
No Failure (N=8416)
Panel C

AN ALTERNATIVE WAY OF CALCULATING RISK-BASED DEPOSIT INSURANCE PREMIUMS 195
l a r c i e r
the put values reflect the above-average amount of deposits in the failing sample.Here, the mean premium payment amounts to USD 938,800 with a minimum ofUSD 59,000 and a maximum of USD 163 million. Panel C shows the differencesin the premium payments per bank in relation to the respective insured deposits.By design, the dollar-weighted average of payments is 0.375% of insured depos-its. The actual premium payments, however, range from virtually zero to 0.692%of insured deposits. While failing banks pay an (unweighted) average of 0.353%of insured deposits, their surviving peers only pay 0.293% of insured deposits.
In the next step, we test whether our model is also able to capture the worseningstrength of banks on their immediate path towards default. Following our previ-ous analyses on the discriminatory power of tier 1 ratios and cash ratios, weexpect to find that, using a rolling window for the premium calculation, depositinsurance premiums should significantly increase for the banks that approach adefault situation as opposed to the banks that did not default. Figure 7 Panel Ato C (p. 196) show the results of this calculation using a rolling window of 18quarters. All findings confirm the results from the previous analysis with a dis-tinctive difference between failing and non-failing sample in quarter 18. Addi-tionally, Panel A and Panel C show that the discrepancy between failing and non-failing banks dramatically increases when approaching the default date. Mostimportantly, the put values and premium payments of the non-failing sampleremain at relatively constant levels throughout the whole simulation period whilethe payments for the failing sample sharply increase. With regard to premiumpayments relative to insured deposits, Panel C shows that the increase in premiumcharges is economically significant for the failing sample. Five years prior todefault, the average premium payment amounts to 0.365%. In the quarterdirectly prior to the default, this value more than doubles to an average of0.755%. When looking at the absolute premium payments in Panel B, it is inter-esting to see that all payments increase modestly over time, which suggests anincrease in total deposits. However, this increase is more pronounced for the fail-ing sample and adds to the increasing premium charges for this group.
In the final step, we want to test whether using a mean reverting process insteadof the ordinary stochastic process in the calculation is reasonable based on theproperties of our data. In the theoretical description of our methodology, weargue that mean reversion might be applicable for the evolution of tier 1 ratiosand cash ratios. Additionally, we find that for both, tier 1 ratios and cash ratios,the values of most banks appear to cluster around pre-set target ranges. Theseranges are influenced by a trade-off of higher costs associated with higher levelsof capitalization and liquidity and higher risk of default associated with lowerlevels. Accordingly, it might be necessary to incorporate mean-reverting behavioralso int the resulting propensity scores. Assuming a linear relationship betweenthe propensity score and the mean reversion factor, it is possible to conduct an

196 NEW PARADIGMS IN BANKING, FINANCIAL MARKETS AND REGULATION?
l a r c i e r
Figure 7: Development of Values towards Default
0.0
1.0
2.0
3.0
4.0
5.0
6.0
7Pu
t Val
ue
18 20 22 24 26 28 30 32 34 36 38Quarter
Failed Non-Failed
Panel A
050
010
0015
0020
00P
rem
ium
in 1
000
US
D
18 20 22 24 26 28 30 32 34 36 38Quarter
Failed Non-Failed
Panel B
0.0
002
.000
4.0
006
.000
8Pr
emiu
m R
elat
ive
to D
epos
its
18 20 22 24 26 28 30 32 34 36 38Quarter
Failed Non-Failed
Panel C

AN ALTERNATIVE WAY OF CALCULATING RISK-BASED DEPOSIT INSURANCE PREMIUMS 197
l a r c i e r
OLS-regression to estimate the magnitude of the mean-reverting effect. Thedependent variable is the percentage deviation of the propensity score from itsbank-specific long-run average; the independent variable is the percentage changein the propensity score in the subsequent quarter. The coefficient resulting fromthe regression is then equal to the mean-reversion factor in the Ornstein-Uhlen-beck process. The results of the regressions are summarized in Table II:
The results suggest a statistically significant correlation between the change inpropensity scores and its current deviation from the mean value. According to thecoefficient, the mean reversion of propensity scores amounts to -2.2%, whichmeans that, abstracting from any constant drift, the expected value of a tier 1ratio in period t + 1 is 2.2% closer to its mean level than the ratio in t = 0. Thisvalue is statistically significant at the 1%-level. The negative sign of the coeffi-cient is also in line with expectations meaning that the deviation from the meanvalue is expected to be decreased in the next step. These results suggest that thereis in fact mean-reverting behaviour in the propensity scores of banks. However,the magnitude of this effect with 2.2% is very small and the effect would beconstant across all banks in our calculation. In unreported robustness checks, wetest the actual impact on our previous results. We find only marginal deviationsfrom the base case without mean-reversion. Taking this finding into account, weconclude that, even though there is evidence for mean-reverting behaviour in theactual data, the effect seems to be too small to justify the additional complexityassociated with the solution of the Ornstein-Uhlenbeck process.
10.6. Discussion
In the light of the recent financial crisis, the European directives on deposit insur-ance premiums, 94/19/EC as well as 2009/14/EC, are going to be revised, whilethe U.S.A already adopted several improvements (FDIC 2011). Accordingly, thedesign of risk-adjusted deposit insurance premiums is a hot topic in the academic
Table II: Results of OLS-Regression of PD-factors for Mean Reversion
Dependent: Change in Propensity Score During Next Period
Independent Coefficient Std. Error t P > |t|
Deviation from Propensity
Score Mean -0.0216*** 0.00442 -4.88 0.000
Constant 0.110*** 0.0109 10.09 0.000
Method OLS
R-squared 0.001
Observations 318,284

198 NEW PARADIGMS IN BANKING, FINANCIAL MARKETS AND REGULATION?
l a r c i e r
and the political discourse. While the theoretical concept of the approaches basedon Merton are highly sophisticated, they are hardly feasible since the datarequired is simply not available. On the contrary, traditional expected loss modelsbuild on a point-in-time evaluation of bank stability and lack the ability to incor-porate any time-variant dynamics. Since our approach combines elements of amultiple indicator model and option pricing theory, it is able to capture advan-tages of both approaches. The advantage of the option pricing approach is that ituses both, information on the actual value of assets as well as its historic valuesfor the estimation of bank riskiness. A bank is hence c.p. more prone to defaultwhen it a) has a lower current asset value and b) historically higher changes in theasset values. This dynamic perspective comes at the cost that only one process istaken into account (e.g. the asset value). On the other hand, a simple multipleindicator model for the prediction of bank default offers the possibility to includeseveral predictor variables, such as in our example one figure on capitalizationand one on liquidity. It suffers, however, from the shortcoming that it only takesthe current state into account and hence neglects any information on the variabil-ity of the variables. Our approach, in contrast, uses the dynamic perspective ofoption pricing models but is still able to aggregate several variables into theunderlying process.
Our empirical analysis with data from the US banking sector shows that ourpricing methodology is able to discriminate between risky and safe banks bycharging higher rates to the failing banks. We additionally find that worseningconditions of a banking institution are also reflected in the premium. An intro-duction of mean-reversion in the underlying stochastic process might be reason-able in this context. However, we find that the data support mean-reversion onlyto a marginal extent. Our model might certainly be improved by extending theinput variables for the logistic regression to a more sophisticated identificationmodel of bank riskiness. Hence, we want to stress that our application with onlytwo predictor variables is only an illustration of the potential applications of thepricing methodology. The liquidity figures introduced in Basel III are certainlyone very interesting alternative to our current liquidity figure, once the data isavailable over a reasonable horizon.
References
BARTH, J.R., PAGE, D.E. & BRUMBAUGH, D., 1992, “Pitfalls in Using MarketPrices to Assess the Financial Condition of Depository Institutions”, Journalof Real Estate Finance and Economics, 5(2), pp. 151-166.
BARTHOLDY, J., BOYLE, G.W. & STOVER, R.D., 2003, “Deposit Insurance andthe Risk Premium in Bank Deposit Rates”, Journal of Banking and Finance,27(4), pp. 699-717.

AN ALTERNATIVE WAY OF CALCULATING RISK-BASED DEPOSIT INSURANCE PREMIUMS 199
l a r c i e r
BERNET, B. & WALTER, S., 2009, Design, Structure and Implementation of aModern Deposit Insurance Scheme, Vienna, SUERF.
BLACK, F. & SCHOLES, M., 1973, “The Pricing of Options and Corporate Liabil-ities”, Journal of Political Economy 81, pp. 637-654.
COOPERSTEIN, R., PENNACCHI, G.G. & REDBURN, S.F., 1995, “The AggregateCost of Deposit Insurance: A Multiperiod Analysis”, Journal of FinancialIntermediation 4, pp. 242-271.
DEMIRGUÇ-KUNT, A. & HUIZINGA, H., 2004, “Market Discipline and DepositInsurance”, Journal of Monetary Economic, 51, pp. 375-399.
DEMIRGUÇ-KUNT, A., KANE, E.J. & LEAVEN, L., 2003, “Adoption and Design ofDeposit Insurance” in A. DEMIRGUÇ-KUNT, E. KANE & L. LEAVEN, 2008,Deposit Insurance Around the World: Issues of Design and Implementa-tion, Cambridge, MIT press.
DEMIRGUÇ-KUNT, A., KANE, E.J. & LAEVEN, L.A., 2007, “Determinants ofDeposit-Insurance Adoption and Design”, Journal of Financial Intermedia-tio, 17(3), pp. 407-438.
DUFFIE, D., JARROW, R., PURNANANDAM, A. & YANG, W., 2003, “Market Pric-ing of Deposit Insurance”, Journal of Financial Services Researc, 24(2-3),pp. 93-119.
EBF, 2010, Positioning in respect of the European Commission’s proposal for arecast Directive on Deposit Guarantee Schemes – EBF final position,Unpublished document.
EOM, Y., HELWAGE, J. & HUANG, J.Z., 2004, “Structural Models of CorporatePricing: An Emopirical Analysis”, Review of Financial Studie, 17, No. 2,pp. 499-544.
FALKENHEIM, M. & PENNACCHI, G., 2003, “The cost of deposit insurance forprivately held banks: A market comparable approach”, Journal of FinancialServices Researc, 24, pp. 121-148.
FDIC, Federal Deposit Insurance Corporation, 2011, Designated Reserve Ratio.
FSF, Financial Stability Forum, 2001, Guidance for Developing Effective DepositInsurance Systems, Working Group on Deposit Insurance, Report, Foundon www.fdic. gov/deposit/deposits/international/guidance/guidance/finalre-port.pdf.
GARCIA, G., 1999, Deposit Insurance: A Survey of Actual and Best Practices,IMF. Internatinoal Monetary Fund, Working Paper, No. 99/54.
HOELSCHER, D.S., TAYLOR, M. & KLUEH, U.H., 2006, The Design and Imple-mentation of Deposit Insurance Systems, IMF, Occasional Paper.
IADI, International Association of Deposit Insurers, 2009,. Funding of DepositInsurance Systems, Bank for international settlements. Found on

200 NEW PARADIGMS IN BANKING, FINANCIAL MARKETS AND REGULATION?
l a r c i e r
www.iadi.org/docs/ Funding%20Final%20Guidance%20Paper%206_May_2009.pdf.
JRC, Joint Research Centre, 2008, Risk-Based Contributions in EU DepositGuarantee Schemes: Current Practices. Found on http://ec.europa.eu/internal_market/ bank/guarantee/index_en.htm.
JRC, Joint Research Centre, 2009, Possible Models for Risk-Based Contributionsto DGS. Found on http://ec.europa.eu/internal_market/bank/guarantee/index_en.htm.
JRC, Joint Research Centre. (2010). Deposit Guarantee Schemes. Impact Assess-ment. Found on http://ec.europa.eu/internal_market/bank/guarantee/index_en.htm.
KEELEY, M.C., 1990, “Deposit Insurance, Risk, and Market Power in Banking”,The American Economic Review 80(5), pp. 1183-1200.
KUESTER, K.A. & O’BRIEN, J., 1991, Market-Based Deposit Insurance Premi-ums: An Evaluation, Board of Governors of the Federal Reserve System.Finance and Economics Discussion Series, No. 150.
LILLIEFORS, J., 1967, “On the Kolmogorov-Smirnov Test for Normality withMean and Variance Unknown”, Journal of the American Statistical Associ-atio, 62, pp. 399-402.
MARCUS, A.J. & SHAKED, I., 1984, “The Valuation of FDIC Deposit InsuranceUsing Option-pricing Estimates”, Journal of Money, Credit, and Bankin,16, pp. 446-460.
MARSHALL, D.A. & PRESCOTT, E.S., 2001, “Bank capital regulation with andwithout state-contingent penalties”, Carnegie-Rochester Conference Serieson Public Polic 54(1), pp. 139-184.
MERTON, R., 1977, “An Analytic Derivation of the Cost of Deposit Insuranceand Loan Guarantees”, Journal of Banking & Finance 1, pp. 3-11.
ORNSTEIN, L.S., UHLENBECK, G.E., 1930, “On the theory of Brownian Motion”,Physical Review 36, pp. 823–841.
PENNACCHI, G., 2005, “Risk-based capital standards, deposit insurance, and pro-cyclicality”, Journal of Financial Intermediation, 14, pp. 432-465.
RONN, E. & VERMA, A., 1986, “Pricing Risk-Adjusted Deposit Insurance: AnOption-Based Model”, Journal of Finance 11, pp. 871-895.

AN ALTERNATIVE WAY OF CALCULATING RISK-BASED DEPOSIT INSURANCE PREMIUMS 201
l a r c i e r
Abbreviations
Basel III International framework for liquidity risk measure-ment, standards and monitoring
DIF Deposit Insurance FundDirective 2009/14/EC Directive of the European Parliament and of the Coun-
cil of 11 March 2009 amending Directive 94/19/EC onDeposit-Guarantee Schemes as regards the CoverageLevel and Payout Delay
Directive 94/19/EC Directive of the European Parliament and of the Coun-cil of 30 May 1994 on deposit-guarantee schemes
DIS Deposit Insurance System (i.e. other word for DGS)JRC Joint Research Centre (European Commission)


203
l a r c i e r
11. CONFLICTS OF INTEREST IN INVESTMENT ADVICE TO
PRIVATE CUSTOMERS – A CALL FOR GREATER
TRANSPARENCY AND BETTER ALIGNMENT OF
INTERESTS
Peter Reedtz
Abstract
The financial crisis has placed renewed focus on the quality of investment advicegiven to private clients, and the issue of the impartiality of the adviser in particu-lar. This paper looks at the concept of impartiality and ways of avoiding the clas-sic conflicts of interest between the adviser and the client. It argues that a new setof rules should be introduced, governing the provision of advice to private clients,inspired by the standards and customs that apply on the professional advice mar-ket. It also calls for a paradigm shift in remuneration for the provision of invest-ment advice. Implementing genuine impartial investment advice will inevitablylead to lower earnings for banks and others advisors in the short term, but longterm, it will be amply offset by the benefits of a more balanced and ethical busi-ness model – especially when you take reputation risk into the equation.
11.1. Bad Advice
The financial crisis has made it all the more obvious that the quality of investmentadvice given to private clients large and small often falls way short of the mark.The phenomenon has been going on for many years, with the industry’s ills esca-lating over the past 5-7 years. This unfortunate development is the result ofaggressive financial product development, combined with the clients’ increasingdemand for a high return without significant focus on risk. Inappropriate incen-tive systems in the financial sector have only helped to make things worse. Here,we are not so much talking about bonus schemes and share options for seniormanagement and specialists in market functions, but primarily the internal profitgoals and sales campaigns, which largely determine the behavior of client advis-ers. Commission-based salaries (directly dependent on the sale of products andservices) are not actually all that common among mainstream investment advis-ers. On the other hand, the indirect effect of organizational rewards (increasedfocus and promotion) is a highly significant behavior-regulating mechanism,which, in recent years, has in many places led to an aggressive sales culture indirect conflict with the interests of the client.

204 NEW PARADIGMS IN BANKING, FINANCIAL MARKETS AND REGULATION?
l a r c i e r
Figure 1 shows the four main elements of bad advice with appurtenant examples.The bad advice often contains more than one of the elements listed, in variousunfortunate combinations.
Though it is fair to say that the quality of advice has not been good enough inmany cases, it should also be stressed that luckily there are also many examplesof qualified investment advice, which fully live up to both professional and ethicalstandards.
As is the case in all other industries, the financial sector has its good companiesand its bad companies, and naturally, individual advisers cannot be gone overwith a fine-toothed comb. Based on many years’ practical experience and knowl-edge of the sector, it is the opinion of the author that there are, thankfully, manywell-qualified and serious advisers.
Figure 1: Elements in the provision of poor investment advice
Problem Description Example
Professional incompetence
The client receives a poor solution due to the adviser’s lack of product knowledge and/or inadequate knowledge of the financial markets’ functions and options.
A client wants a high spread of risk in his portfolio. The adviser puts together a portfolio of 10 different unit trusts, which, in spite of their different names and providers have a high level of correlation and considerable overlap in the portfolios.
Inadequate risk assessment
Failure to analyse the client’s risk capacity and risk attitude and/or inadequate knowledge of the products’ risk characteristics.
An elderly widow, living off her savings, is recommended to buy bank shares and hedge funds for all her money.
Lack of impartiality The adviser acts wholly or partially in his own interest rather than solely looking after the interests of the client. The adviser recommends the investment options which generate the best income for the adviser and/or his company in spite of the existence of better solutions for the client.This is a classic principal-agent issue.
An adviser recommends the client an investment product provided by the adviser’s own company (with a relatively high sales commission) in spite of the existence of comparable or better products on the market, which would cost the client less.
Dishonesty Fraud and deception to varying degrees. In extreme cases, the adviser simply steals the client’s money.In milder cases, the adviser knowingly provides misleading/highly inadequate information or manipulates data in order to enrich himself at the client’s expense.
Extreme case: Bernard Madoff’s pyramid-like investment company is the most extreme example of dishonest investment advice to date.Milder case: Advisers who recommend high-risk, non-transparent products with very high sales commission, and who provide misleading information on the product’s risk and/or fees to entice clients to buy the product.

CONFLICTS OF INTEREST IN INVESTMENT ADVICE TO PRIVATE CUSTOMERS 205
l a r c i e r
This does not, however, change the fact that the system in general has a problemwith the quality of advice given, and the question of impartiality in particular.
The main focus of this article will therefore be on the lack of impartiality in theprovision of investment advice to private clients.
11.2. What is Impartiality?
Impartial advice means that the adviser takes only the client’s interests intoaccount and is not influenced by factors such as his or her own earnings or adesire to sell a certain product.
On the surface, this is a very basic and obviously reasonable demand to make onany form of advice giving.
Many forms of advice are, however, given in connection with a customer’s pur-chase of a product or service. The purchase of cars, household appliances andother small consumer goods is often accompanied by advice on the product’squalities and suitability with regard to meeting the customer’s needs. This is per-fectly acceptable as long as the customer is fully aware of it. When the Fordretailer advises the customer looking to purchase a car, it is only to be expectedthat he will try to persuade the customer to buy a Ford and not a Toyota. It is notquite as obvious to the customer what the motive of the investment adviser iswhen he or she recommends a given investment product. Historically, many pri-vate clients have been under the impression that the investment adviser is impar-tial, and that the advice given is in the client’s interest only. As there is majorinertia in clients’ perceptions and behavior in the financial sector, this remains acommon picture today, in spite of the many scandals involving investment adviceand significant media focus in recent years. Many people perceive the bankadviser as being on a par with solicitors or accountants, who, by law and theirobservance of professional standards, principally look after the client’s interests(within the framework of the law, naturally). In the same way that a consultingengineer is typically perceived as independent, i.e. not in league with a particulartradesman or contractor, whose services he secretly tries to sell in order to earncommission for himself.
Today, it is a fact that the financial sector is run in the same way as any othersales-oriented business. There is nothing wrong in that, but it is important to beopen about this to clients to create consistency between the client’s expectationsand reality.
In figure 2, a more detailed explanation of impartiality in the provision of adviceis given by outlining three comparisons of the concept.

206 NEW PARADIGMS IN BANKING, FINANCIAL MARKETS AND REGULATION?
l a r c i e r
Figure 2: Three comparatives of impartiality in the provision of advice
Pure impartiality Pragmatic solution Unacceptable lack of impartiality
Only takes the client’s interests and needs into account.
Takes the client’s interests into account to the greatest possible extent, but the adviser has a preference for products which generate the best possible income for the advisory firm, unless obviously in conflict with the wishes and interests of the client.
The adviser’s earnings motive weighs heavily in the choice of solution, which is often based on campaign sales rather than the client’s actual needs.
Does not sell own products Primarily sells own products combined with the external products of business partners selected on the basis of competence and quality.
Sells own products and external products from the business partners that offer the highest commission
The adviser’s income is solely based on a set, agreed fee (fee-only structure). Irrespective of the choice of products, no commission and noperformance-dependent fee.
The adviser’s income consists of a combination of visible, agreed fees and hidden sales commission, stock commission, etc. Portfolio management agreements generally contains performance fees to the adviser with benchmark and high-watermark.a
The adviser’s income is typically hidden in the form of kick-backs from the sale of specific products. Performance fees are calculated without a proper benchmark and without high-watermark.
The client is informed proactively, and without having to ask, of any conflicts of interest, business partners, etc. There is complete openness about the adviser’s earning structure and incentives.
Information about any conflicts of interest, business partners, etc. is given reactively and is typically available on the adviser’s website or appears in disclaimers.There is partial openness about the adviser’s income, as the principles are stated, but not the specific rates and implications for the client’s return.
Information is not provided on any conflicts of interest, business partners, etc., and the client is generally kept in the dark about the adviser’s earnings structure and incentives
The adviser works on the basis of a specific written ethical standard, which is more stringent than the statutory minimum requirement. The client is informed proactively about the ethical standards.
The advice provided meets the minimum requirements of the MiFID rulesb, but is not based on specific ethical standards, which are more binding than formal statutory requirements. The rules are typically available via a website, and compliance with the MiFID obligations takes place via standardised IT solutions in an “assembly line” style.
Ethics is a foreign word and the MiFID rules are complied with formally and to the letter only, far from in keeping with the spirit of the rules.
a. A high-watermark clause takes fluctuating return into account in the individual measurement periods, so thatnegative return from earlier periods is offset in future positive return before calculation of the performance fee.The performance fee is not triggered until the portfolio’s historical peak (high-watermark) is exceeded.
b. The MiFID Directive (Markets in Financial Instruments Directive) contains a number of rules designed toprotect the investor and was implemented in EU in November 2007. The EU Commission has initiated a reviewand reinforcement of the rules, and a draft version of the new Directive is expected to be published in July 2011.

CONFLICTS OF INTEREST IN INVESTMENT ADVICE TO PRIVATE CUSTOMERS 207
l a r c i e r
In practice, few private client advisers, today, meet the requirements for pure,impartial advice. The vast majority of advisers should probably be placed in thepragmatic middle solution or in combinations of the different comparisons withthe weight in the middle category. Unfortunately, there are also some adviserswhose activity is primarily characterised by an unacceptable lack of impartiality.Many of the adviser liability cases in recent years are rooted in behavior matchingthe third column in the figure.
11.3. How Should an Investment Adviser be Remunerated?
As figure 2 shows, much of the problem involving impartiality relates to the formof remuneration. There is often a fundamental conflict between the adviser’sfinancial interests and consideration for the client.
The pure solution to the problem is that the adviser is only paid a set, agreed feefor his efforts and knowhow, either based on an hourly rate (as used by otherimpartial, professional advisers and consultants) or possibly a percentage shareof the assets under advicement.
In the model, the adviser’s pay is totally independent of transactions, choice ofspecific investment products and performance.
The pure model is used to certain extent on the professional market, where clientstypically have the same professional insight as the advisers, and where negotia-tion of the terms for the provision of advice takes place on an equal basis. Whereperformance pay is used on the professional market, more sophisticated modelsare typically used which take account of the benchmark and level of risk andcontain high-watermark clauses.
It is quite a different story on the general private market, where there is consider-able informational asymmetry. The client is not typically aware of what it actuallycosts, as most of the payment is not directly visible, but consists of hidden com-mission. The advice itself is often seen by many retail clients as a free service.
This form of remuneration is problematic both for the client and the adviser. Theclient can neither grasp nor compare costs and will often end up paying too much.And the adviser is in a dilemma. If you provide pure, impartial advice at a highprofessional level, you earn very little as the transaction volume is low and theproducts selected are cost-effective (i.e. low sales commission). If the adviserwishes to earn a decent salary – and thus stay in business – he has no choice butto compromise on impartiality and seriousness and recommend the client a rela-tively high transaction level and a choice of product with slightly higher costs(= commission earnings). In the long-term, however, the latter solution makes forless satisfied clients (on the basis of the motto that the truth will always out) and

208 NEW PARADIGMS IN BANKING, FINANCIAL MARKETS AND REGULATION?
l a r c i e r
may, in extreme cases, lead to compensation cases and negative press with subse-quent significant loss of image. Reputation risk has for many bank managersshifted from being a theoretical concept in a risk management report to anextremely serious challenge in the real world.
In theory, the solution to this dilemma is simple. Banks and other advisors mustmake a paradigm shift. The form of remuneration must be changed radically sothat the client pays a fair and transparent price for the advice – according to thepure, impartiality principles described above. In return clients only pay modesttransaction fees, which cover the costs associated with the transactions as well asa reasonable profit margin.
Performance-related pay is seen by many – including the more critical clients – asa fair and adequate form of remuneration. As many see it, the adviser and clientachieve a healthy shared destiny.
If all goes well, you pay a high fee; if it goes badly, it is free. No cure no pay. It isnot, however, quite that simple and the performance-related form of remunera-tion is often problematic and far from consistent with the principle of pure impar-tiality. The problem is the model’s built-in asymmetry. The client bears the fullrisk of the investment, but shares the gain when it goes well. Admittedly, theadviser does not receive payment when there is no return, but the adviser does notshare the risk of loss, as any loss is borne by the client alone. This typically makesthe average payment much higher than the client believes. The adviser also has anincentive to run relatively high risks, as the adviser de facto has an option, which,as we know, increases in value with increasing volatility in the underlying asset.Box 1 illustrates the problem by a simple calculation example from the realworld.
Box 1The inappropriateness of performance-related pay, illustrated by an example.
A client has entered into an agreement for the management of a portfolio of US smallcap shares. The agreement has been in force for 10 years (1999-2008). It has beenagreed that the agent will receive a fee of 15% on the excess return achieved every yearin addition to the market yield on short-term US Treasury Bills.It is assumed that the portfolio has provided a return equal to market return. The aver-age return on the share portfolio has during the period amounted to 6.44% p.a., andthe return on the short-term Treasury Bills has on average been 3.20% p.a. The clientwill therefore expect, on average, to pay (6.44% -3.20%) x 15% = 0.49% p.a. in per-formance fee to the agent.The figures below show the actual return and excess return year-by-year in the period1999-2008.Furthermore, the performance fee is shown, both with and without a high-watermarkclause.

CONFLICTS OF INTEREST IN INVESTMENT ADVICE TO PRIVATE CUSTOMERS 209
l a r c i e r
High-watermark clauses may reduce the problem of asymmetry, but they far fromsolve it completely. If the good periods come before the bad, there is no help tobe had from these clauses, and the clauses’ calculation technique typically has aclear bias in favor of the adviser/agent.
Another fundamental problem with performance-based remuneration is thelength of the period of the return statement. With relatively short time horizons,it is well-known that return and performance are fairly random and far fromindicative of the adviser’s competence. You often have to look at periods of fiveto seven years to separate good fortune from competence (or misfortune fromincompetence). Added to this is the fact that intelligent and accurate benchmark-ing is no easy discipline. All factors that help to make it extremely problematicalto use this form of remuneration in a fair and impartial business model.
11.4. Suggested Improvements
How can we improve the situation so as to achieve higher quality in general andthe greatest possible impartiality?
Pure impartiality is best achieved in a system where advice on and the sale ofproducts are entirely separate. This principle is not unusual in the professionalmarket, but for typical private clients it is probably more utopian than realism to
Year Return US small cap shares
Excess return on US Treasury Bills
Performance fee without high-watermark
Performance fee with high-watermark
1999 29.79% 25.11% 3.77% 3.77%
2000 -3.59% -9.48% 0 0
2001 22.77% 18.94% 2.84% 1.42%
2002 -13.28% -14.93% 0 0
2003 60.70% 59.68% 8.95% 6.71%
2004 18.39% 17.19% 2.58% 2.58%
2005 5.69% 2.71% 0.41% 0.41%
2006 16.17% 11.37% 1.71% 1.71%
2007 -5.22% -9.88% 0 0
2008 -36.72% -38.32% 0 0
Geometric average
6.44% 3.15% 1.99% = 63% of excess return
1.64% =52% of excess return
Source: Ibbotson SBBI 2009 Classic Yearbook, 2009 and own calculations
The figures show that the considerable variation in the annual return means that theactual average performance fee is significantly higher than the average returns wouldlead one to believe.This changes only slightly with the use of high-watermark. In this example, the per-formance fee amounts to 63% and 52% respectively of the excess return (average overthe 10-year period), and not 15% as you would expect.

210 NEW PARADIGMS IN BANKING, FINANCIAL MARKETS AND REGULATION?
l a r c i e r
achieve this desired state in practice. This is due both to the costs of distributionand the difficulty in breaking a longstanding pattern1.
Figure 3 provides an oversight of the more realistic options for improving thesituation. In the following, the individual options will be discussed briefly.
Ad 1. In theory, all problems could be solved if the clients gained greater profes-sional insight, thus levelling out the ‘balance of power’ between the client andadviser. This could for example be done by increased public information on basicinvestment theory. There is plenty of inspiration to be had from the excellentinformation campaigns and websites developed by the supervisory authorities inthe US and England2. Even the financial media and private shareholder associa-tions and the like may play a role in the education of private clients.
But unfortunately, it is not realistic to believe that the problem could seriously besolved this way. The majority of clients have neither the interest in nor theresources (time or intellect) to do anything about this. Added to this is the factthat the financial world is becoming more and more complex, making it difficultfor clients to remain sufficiently updated to challenge the advisers to any realdegree.
Ad 2. This has historically been the preferred tool of the politicians and regula-tors. Over the years, a number of disclosure obligations have been introduced forproviders of financial services. There are comprehensive prospectus requirementsfor different kinds of investment products, duty of disclosure in respect of fees,commission rates, brokerage, etc. Added to this are rules about information onhistoric return and risks as well as information to the clients about potential con-flicts of interest. The European Union implemented in 2007 the well-knownMiFID directive, which contains comprehensive investor protection rules. All
1 On the European market, there are still relatively few impartial investment advisers who target their services atprivate clients. In other countries such as the US, impartial advice is more widespread and is part of a realindustry with a growing market share.
Figure 3: Possible solutions
1. General education and informing of clients
2. Improved information on products and services
3. Certification of advisers
4. Product restrictions
5. Mandatory ethical standard
6. New form of remuneration
2 See, for example, the informative websites of the American Securities and Exchange Commission (SEC),www.investor.gov and the British Financial Services Authority, FSA, www.moneymadeclear.fsa.gov.uk.

CONFLICTS OF INTEREST IN INVESTMENT ADVICE TO PRIVATE CUSTOMERS 211
l a r c i e r
laudable and well-intentioned initiatives, which unfortunately has not solved thefundamental problem.
The problem with the obligation to provide information is that clients either can-not find the information in the ever-growing jungle of information or do notunderstand how to use to information for any real purpose.
Ad 3. Another proposed solution, also based on information and education, is theidea of introducing the mandatory certification of investment advisers. The objec-tive is both to improve and streamline the professional standard, but also to dis-cipline the stand, so that bad advisers can be stripped of their right to provideadvice. This proposal will, without doubt, be a step in the right direction and willalso help to solve the issue of quality in advisory services in particular.
But certification is not in itself a guarantee of impartiality and does not solve theproblem of inappropriate remuneration.
Ad 4. Bans and restrictions are classic forms of regulation, which have also beenput forward in this context. It could quite simply be made illegal to sell complexinvestment products to private clients, and it could be decided by law whichstandard portfolios, etc., different client profiles are to be offered. Grosen andTanggaard (2009a and 2009b) argue for the introduction of certain specific pro-duct restrictions to protect clients.
However, experience of this type of restrictions is not good. It puts an unneces-sary damper on healthy, legitimate innovation and product development, proba-bly doing more harm than good. Furthermore, restrictions and bans can often becircumvented by creative maneuvers and promote unhealthy parallel markets.Ultimately, in conflict with the interests of the clients and society in general.
Ad 5. Ethical standards ring hollow in many people’s ears. But for those compa-nies and organizations that work seriously and continuously with ethical stand-ards as a major part of the company’s/organization’s core values, they are a pow-erful tool, which solve many problems before they arise. A good example of thisis the serious and extensive work with ethical standards carried out by the CFAInstitute, an international organization for investment professionals3. What mat-ters here is that the rules are mandatory for all members and candidates of theCFA Institute, and that there are strict disciplinary sanctions if the rules are notfollowed. The seriousness is underlined by the fact that ethics are an importantpart of both the teaching and exam for CFA Charterholders. The rules are sup-plemented by a comprehensive 220-page handbook, which sets out how the prin-ciples should be used in practice and contains a number of illustrative examples.
3 For further information, see CFA Institutes website: www.cfainstitute.org.

212 NEW PARADIGMS IN BANKING, FINANCIAL MARKETS AND REGULATION?
l a r c i e r
The European organization, EFPA (European Financial Planning Association)works with an ethical standard for financial advice, which can be a good sourceof inspiration, although it is not nearly as comprehensive and consistent as theCFA standard. Many countries has chosen not to work with disciplinary sanc-tions for the breach of EFPA’s ethical standard and awareness and use of thestandard is still modest in many countries.
An actual mandatory ethical code would solve many of the problems involvingthe provision of advice mentioned in this paper. Such standards contain rules andprinciples which ensure a high professional quality, whilst also ensuring a highlevel of fairness in the advisory work. It is stated by the CFA Institute that “mem-bers and candidates must act for the benefit of their clients and place their clients’interest before their employer’s or their own interests.” A simple, yet strong prin-ciple.
Very few of the investment advisers who advise retail investors are currentlymembers of the CFA Institute. It is typically for people who work with profes-sional clients. And EFPA’s standard has not yet been implemented in practice inEurope. But it would be reasonable for the authorities, in collaboration withtrade associations, to establish a European ethical standard for the provision ofinvestment advice to private clients. Possibly a ‘light version’ compared to theambitious CFA Institute standard, but without compromising on the basic sub-stance: high professional standard, integrity and impartiality, with the client’sinterests at the centre.
This would benefit both clients and advisory companies alike (both banks andindependent advisors). The advantages for the clients are obvious, but the intro-duction of such a standard would also be beneficial for the advisory firms. Awhole-hearted and committed approach by the companies is vital. Traditionally,these kinds of standards are seen by far too many as a necessary evil, which sim-ply has to satisfy a few statutory requirements, and provides no real businessvalue. The far-sighted, intelligent advisor has another proactive approach to eth-ical standards entirely, and will soon realize that, ultimately, they can be highlyproductive.
It would be a strong pull of the management if some of the large banks led theway and took the initiative to implement a high ethical standard on the initiativeof and anchored in the senior management. It would certainly eliminate any mis-trust in the concept of ethical standards.
Ad 6. As noted earlier, there is a need for a fundamental paradigm shift in theremuneration model and pricing structure typically used when providing invest-ment advice to private clients. There needs to be transparency and logical consist-ency between what you get and what you pay for it. Set agreed fees and/or hourly

CONFLICTS OF INTEREST IN INVESTMENT ADVICE TO PRIVATE CUSTOMERS 213
l a r c i e r
rates must be the mainstay of the remuneration form, and transaction fees shouldonly reflect the use of resources and a reasonable profit margin. This way, boththe client and the adviser will be better off than with the opaque and illogicalconfusion of ‘free services’ and hidden and visible fees, which are the norm in theindustry today. See a simple illustrative example in box 2.
It should be noted that the adviser’s fee/hourly rate, with the tax rules that applyin some countries, represent a challenge, as private clients are not typically ableto deduct adviser fees. Naturally, this can be solved by converting the fee to bro-kerage, but the ideal solution is to change tax laws so that costs for investmentadvice are deductable, regardless of the collection form.
Some would probably argue that banks and advisors would thereby experience adrop in income on the lucrative investment advisory business. This wouldundoubtedly be the consequence, but it would then be amply offset by the posi-tive earning effect of the increased credibility and re-established trust, whichwould be the consequence of the paradigm shift.
The current model gives periods of high earnings but also generates losses for thebanks (both image-wise and also directly on the short-term bottom line), whenthe party is over and market development turns abruptly (which, experience
Box 2Comparison of two models of pay – a simple example
A client has inherited EUR 100,000 and seeks the advice of an investment adviser. Theadviser spends a total of 3 hours analyzsing the situation and meeting with the client.Based on the client’s investment motive, risk profile and tax conditions, the adviserrecommends a portfolio of different unit trusts.
MODEL 1(current remuneration principle)
MODEL 2(new and improved principle)
Fee for time spent EUR 0 3 hours @ EUR 150 = EUR 450.
Sales commission 1% of EUR 100,000 = EUR 1,000 EUR 0
Brokerage 0.25% of EUR 100,000 = EUR 250 0.15% of EUR 100,000 = EUR 150.
In total EUR 1,250 EUR 600
Of this visible to the client EUR 250 EUR 600
Model 1 is characterised by a relatively high cost, the majority of which is not immedi-ately visible to the client. Note that the ‘canny’/informed client in this model can receive‘free’ advice and then carry out the transaction himself via a cheap online broker, whohas low brokerage and offers unit trusts without sales commission. Model 2 has fulltransparency and is fairest to both the client and the adviser.The client pays for the advice received and execution of the transaction (the actualservice), and the adviser does not risk being used simply for free advice, without anybusiness coming from it.

214 NEW PARADIGMS IN BANKING, FINANCIAL MARKETS AND REGULATION?
l a r c i e r
shows, happens 1-2 times during a typical decade). The proposed new model will,however, give a lower, yet far more stable and sustainable income. As a curiosity,you could probably argue that the new model will lead to a lower capital require-ment than at present (on the concept of economic capital), as the operational risk(including reputation risk) will be considerably lower than with an ethicallysound business model with a fair and logical form of remuneration.
11.5. The MiFID Review and the UK Retail Distribution Review
As a follow-up on the financial crisis the European Commission have launched aconsultation on the review of the MiFID directive. A draft version of the newDirective is expected to be issued in July 2011. The review contains some minormeasures to strengthen retail investor protection, but the main focus of the revi-sion are in the areas of market structures and securities trading with little realimpact on retail clients.
There is much more value for money in the Retail Distribution Review (RDR)launched by the British FSA. The RDR will come into effect at the end of 2012 inthe UK and the aim is to go beyond simply treating the symptons and address theroot causes.
By introducing the RDR the FSA will set a new standard of independent invest-ment advice to retail customers. The RDR will ban the use of commission paidby product providers to advisors. The clients will pay directly for the services tothe advisor.
The RDR also introduces a clear distinction between ‘independent advice’ and‘restricted advice’, the latter describes a situation where the advisor is only offer-ing a limited range of products (often his own) to the client. Independent advicehas to be based on a comprehensive and fair analysis of the relevant market. TheRDR also introduces measures to increase the professional standards of invest-ment advisors, including the introduction of an annual statement of professionalstanding from an accredited body. A new Code of Ethics is also part of RDR.
Overall, one must characterize RDR as a groundbreaking step towards a betterand more sustainable market for impartial investment advice to private clients.Hopefully the European Commission will be inspired by the work of the FSA intheir efforts to improve the MiFID directive.

CONFLICTS OF INTEREST IN INVESTMENT ADVICE TO PRIVATE CUSTOMERS 215
l a r c i e r
11.6. Conclusion
According to the author, the solution to the fundamental problem addressed bythis paper lies in a combination of several initiatives. First and foremost by theintroduction of an obligatory new ethical standard for the provision of invest-ment advice to private clients. Inspiration can be drawn from the internationalstandard developed by the CFA Institute and from the work done by the BritishFSA. Anyone wishing to operate an investment advice business would have tosubmit to this new standard. Notwithstanding the mandatory element, it is vitalthat the initiative has the full backing of senior management and that the standardbecomes a natural part of the business culture. It is the management’s responsi-bility to ensure a high advisory ethic and an appropriate incentive structure. Theindividual adviser is dependent on his employer’s business model and is not nor-mally in a position to change things.
Secondly, there is a need for a new form of remuneration which can reduce thebuilt-in conflicts of interest and create greater transparency and natural cohesionbetween what you get and what you pay for it. Again the proposals from RDRshows the way.
In addition, the work to improve the level of education of clients and adviserswould have to continue, ensuring that relevant consumer information is availableand usable to a higher degree than is the case today. These initiatives do nothowever move the fence posts, but can provide excellent support for the above-mentioned main initiatives.
Overall we must conclude that it is highly realistic to achieve a considerablyhigher degree of impartiality and quality in the provision of investment advice toprivate clients. But, besides good initiatives from farsighted regulators, above all,it requires a willingness and initiatives on the part of the management of thefinancial advisory firms. Without this, impartiality will remain a utopian state4.
References
CFA INSTITUTE, 2010, Standards of Practice Handbook, Tenth edition 2010.
DANISH FSA, February 2011, “The Danish FSA’s response to the Review of theMarkets in Financial Instruments Directive (MiFID)”.
EUROPEAN COMMISSION, December 2010, “Public Consultation: Review of theMarkets in Financial Instruments Directive (MiFID)”.
EUROPEAN COMMISSION, September 2010, “Summary of public hearing onMiFID review 20-21 September 2010, Brussels”.
4 For further information, see EFPA’s website: www.efpa-europe.org and www.efpa-danmark.dk.

216 NEW PARADIGMS IN BANKING, FINANCIAL MARKETS AND REGULATION?
l a r c i e r
FSA, 2009, “Distribution of retail investments: Delivering the RDR”, Consulta-tion Paper 09/18, June 2009.
FSA, 2010, “Distribution of retail investments. Delivering the RDR – feedback toCP09/18 and the final rules”, Policy Statement 10/6, March 2010.
FSA, 2011, Retail Distribution Review Newsletter, Issue 1, February 2011.
GROSEN, A. and TANGGAARD, C., 2009a, “Finansiel rådgivning – et forbruger-politisk rædselskabinet (Financial advice – a consumer political chamber ofhorrors)”, Finans/Invest 4/09, pp. 2-4 and p. 16.
GROSEN, A. and TANGGAARD, C., 2009b, “Finansiel rådgivning – behov for enkelog effektiv finansaftalelov (Financial advice – a need for a simple and effec-tive financial agreement act)”, Finans/Invest 5/09, pp. 2-4.
HM TREASURY AND FSA, February 2011, “UK response to the Commission Serv-ices’ consultation on the Review of the Markets in Financial InstrumentsDirective (MiFID)”.
KAY, J., 2009, The long and the short of it, The Erasmus Press Ltd.
NICOLL, S., FSA, 2011, “Product intervention and European Union engagement:two key strands of our consumer protection strategy”, Speech presented atthe Danish Money and Pension Panel conference in Copenhagen, 25th Jan-uary 2011.

217
l a r c i e r
12. VIEWS ON BANK STRATEGY AND CAPITAL MARKET
INFRASTRUCTURE
Lars Machenil and Lieve Mostrey
12.1. The BNP Paribas Fortis View by Lars Machenil
First of all, allow me to present some core figures about BNP Paribas Fortis: it isa company with around EUR 350 billion in assets, around EUR 1 billion inprofit, and about 16.5% in Tier 1. What I would like to do here is to build basi-cally on what Rudi Vander Vennet has shown us about the use of levers and theirdifferent impacts. I will give a practitioner’s view on what this means in practicebecause you see these levers and you have regulation in general which is changingand then you have all kinds of stakeholders in banking from the board to thecommercial banker, who basically have to implement and execute this and haveto deliver on those choices made. I will do this through 2 approaches: I will giveyou an example of how a board is impacted by all these changes and I’ll do thisby showing divestment, because, many banks are having to make a choice ofbeing a retail bank or being a universal bank. Typically the bank has to make astrategic choice and divest many activities which are no longer core, whether bychoice, or by regulatory decree, or due to whatever environment prevails. Doingthis is not necessarily easy, indeed, it would be appropriate to liken it to being aminefield, where strategic choices must be taken to successfully negotiate the safepath through the minefield. Regulation is restrictive in many aspects, then thereis also the whole element of valuation as well as several operational constraints.So indeed tackling such constraints, we started by focussing on the bank’s core –which in the case of BNP Paribas Fortis is Belgium, Luxembourg, and Europeancommercial banking platforms. Figure 1 (p. 218) gives the key elements of theindustrial plan.
But regulation is also involved. I will return to Basel III and others, but there aremany other regulations that are also applicable in Belgium. For example, Article524 of the Belgian Company Code (BCC) tries to manage intra-group conflictsbecause many banks today have a typical stakeholder but typically have a/ormany minority stakeholder(s). In the case of BNP Paribas Fortis, this is the Bel-gian state. This Article is very prescriptive, in protecting intra-group conflicts. Itsets out four guidelines: firstly, it has to create a committee of independent direc-tors, secondly, this committee has to appoint independent experts, thirdly, man-agement has to make proposals and finally the committee has to render a moti-vated opinion to the board. Now this might sound quite easy but it has a strongdegree of regulation, because many lawyers are involved as well as, many invest-

218 NEW PARADIGMS IN BANKING, FINANCIAL MARKETS AND REGULATION?
l a r c i e r
ment bankers, for example you have your minority stakeholder and their invest-ment banker, you have your management with another investment banker, youhave majority stakeholder and their investment banker. So it is something whichquickly becomes quite complicated to do and in particular if you want to do manydivestments within a short period time, it is quite a complicated process.
Furthermore, the handling of valuations and cut off dates is essential. It startswith the defining of the tangible net asset value which you is defined at a singlepoint in time by external auditors, and defining goodwill on investment bankers.This process allows you to channel all this regulation in a framework, gettingeveryone involved and allowing for a period of less than 18 months to go from abalance sheet which was close to EUR 600 billion to one which is at EUR 345 bil-lion today. I am sure that you recognise many of the countries where these divest-ments have taken place. This is a small example of the new paradigm as well ofregulation. Figure 2 illustrates this process.
Now I want to express some views on Basel III. I have previously talked abouthow to make sure the board can play its role, I would also like in turn to talkabout how the banker can play his role because while it is very nice to set up anoverall strategy, in the end you have to make it happen on the floor. I would liketo share with you what Basel II and Basel III do.
Basel II had a heavy impact on systems because you have to be able to reflect allthe risks of the assets into your systems and your calculations and so on and soforth. However, in Basel III it will be quite different. The system impact will bevery limited, but there will be a very big impact on the business. Why? Because it
Figure 1: Divestments as part of the Industrial PlanArticulate an overall strategy from which priorities (e.g. divestments) are derived

VIEWS ON BANK STRATEGY AND CAPITAL MARKET INFRASTRUCTURE 219
l a r c i e r
involves many more aspects: it used to be only capital, whereas now it also han-dles accounting, risk, regulation and many other measures. So what happens ifyou are the commercial banker who is confronted with all these things even if youhave made a choice to be a retail banker with a commercial European footprint?This is still a challenge to make it happen on a day to day basis. Let me illustratethis. In the past, Basel III focused on the assets and it focused on the capitalrequirements, and basically was handled through transfer pricing service. Nowa-days things are be totally different, you have many criteria and they will notalways necessarily be coherent and they are not necessarily expressed in very sim-ple matrices. If you look at the capital elements contained in Basel III you wouldlike to get your leverage as low as possible. We have seen that low leverage mightbe a good thing and you could say I have investment books e.g. investments ingovernment bonds and I would like to get them out because I would like to re-usemy assets, it will improve my leverage. However, if you then go into the liquidityrules you will see that it is not necessarily a very bright idea because the liquidityrule says that you need assets which can be made liquid in the very short term. Soif you are a banker on the floor and you have to decide how to implement it ona day-to-day basis, it will not necessarily be that simple. Once we have fathomedthe whole impact, we then have to address the regulatory environment, and thena challenge which will remain is how to manage this in a very pragmatic manner,so that basically Basel III is far from over. It will prove to be a long and windingroad.
Figure 2: Handle valuations & cut-off dates

220 NEW PARADIGMS IN BANKING, FINANCIAL MARKETS AND REGULATION?
l a r c i e r
12.2. Euroclear’s View by Lieve Mostrey
I would like to start my presentation by reminding you how the different layersof market infrastructure within the international capital markets interact witheach other.
The first layer in the value chain is trading, where orders are negotiated andagreed. This can happen on stock exchanges, multilateral trading facilities, overthe counter or off market. Orders can be instructed by humans or throughmachines. It is here that the binding agreements to trade securities for cash aremade.
The second layer is composed of clearing activities. Clearing today involves acentral counterparty that stands between the different trading counterparties. Itspurpose is to match all the buy and sell positions between the two counterparties,reduce risks by standing between the two counterparties and net all the transac-tions in the same security before sending instructions to the settlement agent. Thethird tier – settlement – is where the securities and cash are actually exchanged byfirms such as Euroclear. This is where the change of ownership occurs, irrevoca-bly.
Let’s now take a look at Euroclear operating in that settlement space. Euroclearis first of all a user-owned, user-governed company. This means that around1,300 broker dealers, local and global custodians, commercial banks and otherfinancial institutions worldwide strongly influence our direction, strategy anddevelopment. This is quite a different governance model. We believe that thisform of ownership and governance ensures that we give high priority to the inter-ests of our clients. At the same time, we operate under what is called a profit-
Figure 3: The Roles of Different Market Infrastructure in the International Capital Market Value Chain

VIEWS ON BANK STRATEGY AND CAPITAL MARKET INFRASTRUCTURE 221
l a r c i e r
constraint model. We think this strikes a good balance between, on the one hand,bringing the necessary cost discipline in the company to reach a certain level ofprofit, but which, on the other hand, allows us to sometimes make importantinvestments that benefit the entire market, but generate no profits for us. You willsee what I mean later on.
If we look at the composition of the Euroclear group, there is Euroclear Bank, theInternational Central Securities Depository, or the ICSD as we call it. It is thelargest of its kind in the world. We also serve as the national CSD for seven coun-tries, namely Belgium, France, Finland, Ireland, Sweden, the Netherlands and theUK. Together, we cover about 65% of the EuroTop 300 equities, 50% of theEuropean domestic debt markets and 60% of the Eurobond markets. This trans-lates into huge volumes of activity. Euroclear settled transactions over the courseof 2011 valued in excess of EUR 580 trillion, representing more than 163 milliontransactions. We hold today in our different entities securities deposits worthmore than EUR 22 trillion. And, we move EUR 500 billion of collateral everyday. We estimate that every six days we process transactions that are equivalentto the GNP of the entire European Union. Therefore, we think it is logical thatwe are considered to be a systemically important provider of infrastructure serv-ices.
Obviously, risk management is very critical – not only for ourselves, but for entiremarkets and market participants. First of all, market participants increasingly aretrying to protect themselves from credit and counterparty risks, which translatesinto moving from unsecured to secured transactions. Clients are now using vari-ous forms of collateral to secure exposures that arise from repo transactions,derivative transactions and from a wide range of other security financing trans-actions. Accordingly, we have seen demand for our tri-party collateral manage-ment services soar. As said earlier, we now manage EUR 500 billion of collateralmovements every day; volumes continue to grow regularly.
Given our critical role, we also have to operate in a very safe way and protectourselves against risks, including credit risk, although in practice most of ourcredit risk exposure is intra-day as it relates exclusively to the transaction settle-ment process. Nevertheless, in practice, we demand from almost all our clientsfull collateralisation of our credit extensions in order to remain the systemicallysafe service provider we have to be. We can say that this business practice wasmost severely tested during the recent financial crisis, when Lehman Brothers andMF Global went bankrupt. Our risk mitigation processes and asset protectionmodels worked very well. We suffered no credit losses whatsoever during thecrisis and continued to operate safely and consistently. This record has beenrecognised systematically over the years as we have maintained very high creditratings. I can also confirm that our solvency ratio is very high, currently at a

222 NEW PARADIGMS IN BANKING, FINANCIAL MARKETS AND REGULATION?
l a r c i e r
strong and healthy 55%. We are also observing in the national markets where weoperate a growing demand from clients for collateral management services. Weare developing that part of the business further within our national CSDs.
A very particular and peculiar phenomenon that we witness during periods ofcrisis is that Euroclear is considered by market participants as a source of protec-tion against market risk. This was evidenced by our clients leaving huge cashbalances with us during the crisis. We were seen as a safe haven, as an entitywhich market participants would trust with their cash, even though we paid nointerest on cash balances. Settlement infrastructures have also been substantiallyhelpful to market participants in managing their liquidity risks. As you know,central banks have played an important role in sustaining liquidity during thecrisis, in particular by accepting various types and grades of collateral. As a result,collateral criteria shifted very quickly, with central banks accepting lower gradesecurities as collateral. This resulted in big securities movements within the mar-kets, where the settlement agents played a material role in supporting them. Gov-ernment debt only accounts for around 11% of the collateral that is held withinthe Eurosystem today where 77% of the collateral that is used in the Europeaninterbank repo market is now government debt. This is quite different from pre-crisis trends.
A further dimension is operational risk. Very clearly, in the post-trading businesswe have no ambition to be glamorous; we perform a back-office function whichis often considered boring and dull, but which has to be unquestionably safe. So,we have been working and we are continuing to work on tightening our opera-tional controls to be extremely reliable in our function. For example, we areamong the few infrastructures that operate three data centres, of which two arepermanently live and the third is located in a different country. In the event of alocal crisis, we can ensure that all data will be restored in a second centre withintwo hours, without any loss of client transaction data. This is not only a testedscenario, but is deployed operationally every two months. This means that everytwo months, we fully change the environment in which we run our operations.
Our manpower and office structures are equally important. We have a dual-officepolicy in all of our countries, which means that we have two fully manned andoperating sites that are mirrored back-ups of each other. Each can replace theother if needed. The origins of this policy are linked to the 9/11 attacks, whereour US clients became highly sensitive to office back-up issues. This policy alsorelates to our profit-constrained business model in that we have not been pushedby our owners to look for cost-cutting or economy measures for these set ups.They have remained unchanged during the financial crisis because they add value,and not necessarily profits.

VIEWS ON BANK STRATEGY AND CAPITAL MARKET INFRASTRUCTURE 223
l a r c i e r
Post-trade infrastructures are highly regulated entities. For Euroclear alone, weare regulated or supervised by no less than 13 public authorities. It looks verylikely that this number will not be reduced, and in fact, we see the EuropeanCommission also entering this space with the introduction of a CSD Regulation.
Regulation will change market behaviours. We expect to see extended fundingmaturities, thereby preserving liquidity pools. We also expect to see a greater needfor collateral. Collateral requires moving not only cash-based collateral, but alsosecurities-based collateral in order to make the financial markets safer.
There has been a lot of talk about introducing more central clearing counterpar-ties in some markets and also for a number of transactions that have not beencleared thus far. It is expected that multilateral netting could act as a kind offirewall against defaults. But let us not forget, and let us remain very realistic, inremembering that central counterparties do not eliminate the risks totally; theytransform and concentrate them. So, we will also have to look at how these cen-tral counterparty models evolve and how they will be introduced. We stronglybelieve that bridging infrastructures across assets classes could bring a lot of valueto the market. We believe that the governance models, how we manage the bridg-ing process and how we use them, will have great importance for market partic-ipants and the infrastructures. There is a risk with some of the current models thatclearing counterparties may start to compete for market share at the expense ofsound risk management practices.
The crisis has substantially increased awareness of and attention to the manyforms of risk in our financial markets. At Euroclear, astute risk management ispart of our DNA. Although we instil strict policies on our clients, we think pastevents have proven this approach to be very important. We, just like the otherproviders, have learned some lessons and a number of tough decisions in the pasthave been vindicated. We are constantly improving and strengthening our riskmanagement and systems and, as always, they don’t necessarily have to be com-plex models. Old fashioned common sense can achieve a lot as well.
We will see new market initiatives, the implementation of lots of regulations andTARGET2-Securities, and new business models. We believe that what has beengleaned through past experience should not be lost. We’ve heard a lot aboutbanks being ‘too big to fail’ and by paying attention to that, we have realised inthe infrastructure business that we also need to manage our business as if failureis not an option.
Obviously, future risks are ahead of us. I think that every type of new regulationwill merely alter the extent of the next crisis, rather than totally remove the pros-pect of a future crisis.

224 NEW PARADIGMS IN BANKING, FINANCIAL MARKETS AND REGULATION?
l a r c i e r
I would like to conclude with a word of recognition for the robustness of themarket infrastructures, which comes from a highly valued, but neutral observer,Baron Lamfalussy, who said:
“The clearing, settlement and payment systems deserve particular praise.Few people, including financial market participants, let alone govern-ments and the general public, are aware of the amount of effort that hasbeen invested over the past 20 years into enhancing the crisis resistanceof these systems. The investment has been rewarded by high returns.”1
1 Baron Alexandre Lamfalussy, former Chairman of the Committee of Wise Men on the Regulation of EuropeanSecurities Markets, 2009.

225
l a r c i e r
SUERF – SOCIÉTÉ UNIVERSITAIRE EUROPÉENNE DE
RECHERCHES FINANCIÈRES
SUERF is incorporated in France as a non-profit-making Association. It wasfounded in 1963 as a European-wide forum with the aim of bringing togetherprofessionals from both the practitioner and academic sides of finance who havean interest in the working of financial markets, institutions and systems, and theconduct of monetary and regulatory policy. SUERF is a network association ofcentral bankers, bankers and other practitioners in the financial sector, and aca-demics with the purpose of analysing and understanding European financial mar-kets, institutions and systems, and the conduct of regulation and monetary policy.It organises regular Colloquia, lectures and seminars and each year publishes sev-eral analytical studies in the form of SUERF Studies.
SUERF has its full-time permanent Executive Office and Secretariat located atthe Austrian National Bank in Vienna. It is financed by annual corporate, per-sonal and academic institution membership fees. Corporate membership cur-rently includes major European financial institutions and Central Banks. SUERFis strongly supported by Central Banks in Europe and its membership comprisesmost of Europe’s Central Banks (including the Bank for International Settle-ments and the European Central Bank), banks, other financial institutions andacademics.
SUERF STUDIES
1997-2010
For details of SUERF Studies published prior to 2011 (Nos. 1 to 22 and 2003/1-2010/5) please consult the SUERF website at www.suerf.org.
2011
2011/1 The Future of Banking in CESEE after the Financial Crisis, editedby Attilla Csajbók and Ernest Gnan, Vienna 2011, ISBN 978-3-902109-56-9
2011/2 Regulation and Banking after the Crisis, edited by Frank Browne,David T. Llewellyn and Philip Molyneux, Vienna 2011, ISBN 978-3-902109-57-6

226
l a r c i e r
2011/3 Monetary Policy after the Crisis, edited by Ernest Gnan, RyszardKokoszczynski, Tomasz Łyziak and Robert McCauley, Vienna2011, ISBN 978-3-902109-58-3
2011/4 Divergence of Risk Indicators and the Conditions for Market Disci-pline in Banking, Vienna 2011, ISBN 978-3-902109-59-0
2011/5 Roles, Missions and Business Models of Public Financial Institu-tions in Europe, Vienna 2011, ISBN 978-3-902109-60-6
2012
2012/1 New Paradigms in Monetary Theory and Policy?, edited by MortenBalling and David T. Llewellyn, Vienna 2012, ISBN 978-3-9021-0961-3