Embed Size (px)
Citation preview

Institute of Business and Economic Research
Fisher Center for Real Estate and Urban Economics
PROGRAM ON HOUSING AND URBAN POLICY WORKING PAPER SERIES
Prepared for the February 2009 Affordable Housing Policy Forums sponsored by BRIDGE Housing Corporation, Urban Land Institute, Fisher Center for Real Estate and Urban Economics (Berkeley) and Lusk Center for Real Estate (USC)
WORKING PAPER NO. W09-002
NEW OR REHAB:STRIKING A NEW BALANCE UNDER
CALIFORNIA'S AFFORDABLE HOUSING STANDARDS
By
Larry A. Rosenthal David Listokin
March 2009
These papers are preliminary in nature: their purpose is to stimulate discussion and comment. Therefore, they are not to be cited or quoted in any publication without the express permission of the authors.
UNIVERSITY OF CALIFORNIA, BERKELEY

preliminary draft ‐ please do not cite without authors’ permission
New Or Rehab: Striking A New Balance Under California's Affordable Housing Standards
Larry A. Rosenthal, UC Berkeley David Listokin, Rutgers University
Table of Contents
I. Introduction .......................................................................................................................................... 1
II. Choosing Rehab: Modes of Developer Choice ..................................................................................... 3
A. Relative Cost Advantages by Type of Construction: The Economics ............................................... 3
B. Rehab by Degrees ............................................................................................................................. 7
III. Evolution of Federal Rehab Policy .................................................................................................... 9
IV. Rehab as “Preservation”: At‐Risk Projects ..................................................................................... 12
A. LIHTC and Tax‐Exempt Bond Finance ............................................................................................. 12
B. State and Local Trust Funds and Preservation Programs. .............................................................. 13
V. Comparing LIHTC Allocations: California vs. Elsewhere in the US ..................................................... 14
A. Nonprofit and For‐Profit Development .......................................................................................... 17
B. Type of Credit Allocated: 4%, 9%, and Mixed Awards ................................................................... 19
C. Unit Size .......................................................................................................................................... 22
D. Qualified Census Tracts (QCTs) and Difficult Development Areas (DDAs) ..................................... 22
E. Metro/Non‐Metro Location ............................................................................................................ 23
F. California’s LIHTC Rankings Nationally ............................................................................................ 24
G. Explaining Proportion‐Rehab Construction Across States .............................................................. 30
VI. New and Rehab Construction: Differences in Development Cost, Operation Cost, and Economic Impacts ........................................................................................................................................................ 32
A. Total Development Cost: Data from Enterprise Community Partners .......................................... 32
B. Operating Cost Analysis: LISC‐NEF California Portfolio, 1992‐2008 .............................................. 36
C. Effects on California Employment, Income, and State Output: Regional Economic Impacts of New Construction, Rehab, and Other Activities ............................................................................................. 39
VII. Redevelopment Finance of Rehab Activity: The Hazards of High Asset Values ............................. 43

preliminary draft ‐ please do not cite without authors’ permission
VIII. New Policy Directions: Improving Rehab Efforts in California ........................................................ 46
A. Construction Regulation: “Smart” Codes for Rehab ...................................................................... 46
B. Streamlining Resources for Rehab: Unwinding the Excessive Layering of Subsidies Per Project ... 50
C. Recalibrating Rehab Priorities in California’s LIHTC Allocation System .......................................... 55
D. Enhancing Rehab with a California State Historic Tax Credit Program ........................................... 58
E. Rebalancing the New‐Rehab Mix in the Housing Element Law ...................................................... 60
IX. Concluding Remarks ........................................................................................................................ 62
References
Acknowledgments
Appendix A: Analytic Framework for Regulatory Barriers to Rehab Construction
Appendix B: Case Study ‐ Little Tokyo Service Center Development Corporation, Far East Building Project, Los Angeles
Appendix C: Case Study ‐ Unreinforced Masonry Rehab in Los Angeles and Glendale

1
New Or Rehab: Striking A New Balance Under California's Affordable Housing Standards
Larry A. Rosenthal, UC Berkeley David Listokin, Rutgers University
I. Introduction
Rehabilitation of existing structures, as opposed to new construction, deserves close examination by affordable housing developers and policymakers alike. In California as elsewhere, development opportunities arise on either side of the coin; civic promoters and builders freely choose how to concentrate their efforts and whether it is economical to specialize in one type of construction or the other. As in the private market, what gets built when and where is largely the result of private choice. All the same, government may choose, and often has chosen, how to target housing development beneficial to low‐ and moderate income (LMI) households. What is most efficient and advantageous, for the productivity of the subsidy and the business realities of the developer, depends in large part on the particulars of each location and building under consideration.
Despite these idiosyncrasies, the balance between new and rehab construction may be ripe for fresh attention in policy terms. If rehab has systematic advantages over new construction, policymakers ought to explore how to enhance incentives and reduce barriers accordingly. It may be that adding to the useful life of existing structures is cheaper, on a housing‐service‐year basis, than building new ones from the ground up. This is particularly important given the narrow margins on which subsidized project‐finance must operate. One method for effecting a shift of shares among construction categories (i.e, new, rehab, and mixed) would be to revise regulations governing tax credits, bond finance, and other subsidy streams necessary to make these deals pencil.
Without attempting to quantify the potential advantages of doing so, renovating existing buildings likely has ancillary benefits relative to construction placed on vacant land or demolition sites. Rehab helps preserve neighborhood features and efficiently reuses existing structures and infill parcels, all while revitalizing surrounding property values. Rehab rarely tampers with existing land use, making community buy‐in easier to secure. It bolsters specialized renovation building‐trades to the extent they prove necessary on a given project. Environmentally, rehab can be used to foster higher‐densities, walkable neighborhoods, transit‐oriented development, use of low‐carbon‐impact building practices and utilities, and a variety of other green‐building goals. Particularly in this era of carbon consciousness, demolition on
2
properties amenable to rehab is likely wasteful from a resource standpoint, and it uses up landfill capacity at excessive rates.
In this paper we attempt to characterize the status quo balance of new and rehab construction in California and set it in national context. We tackle this challenge utilizing a variety of data sources, literature, and informal interviews with participants in the state’s low‐ and moderate income housing (LMIH) sector. Our approach is essentially threefold. First, we wish to place California’s numerical new‐rehab balance in some quantitative perspective, identifying how it compares to other jurisdictions financing and constructing assisted shelter for needy households. Second, we explore California’s key regulatory and market features influencing development choice and ponder whether rehab is receiving fair treatment in the mix. Third, and in that same connection, we suggest some very general areas of policy reform which rehab promotion might usefully target.
Section II briefly outlines some pertinent economic theory, providing context and helping inform current policy choice for California specifically. Section III sketches key points in the development of federal rehab policy, since much of what California chooses depends upon resources and regulation set in place nationally. Section IV addresses in general terms California’s approaches to a specific, and urgent, form of rehab, namely, that associated with the preservation of multifamily properties “at risk” of being converted to market rents due to the expiration of governing income‐restriction terms and owners’ opting‐out of renewal opportunities. Section V utilizes national data on the Low Income Housing Tax Credit (LIHTC) program to identify the prevailing balance between new and rehab construction funded by tax‐credit finance in California and elsewhere. Section VI relies upon the investment portfolios of Enterprise Community Partners (national data) and the Local Initiatives Support Corporation’s National Equity Fund (California data) to explore development and operating cost differences between new and rehab construction. The section proceeds to report the findings of an input‐output model showing regional economics impacts relative to construction type. Section VII notes certain rehab‐specific trends in redevelopment finance in California, particularly salient during the recent unprecedented run‐up in real estate prices. Section VIII provides a series of possible policy reforms, including building code revision, reduction of the high‐cost and inefficient “layering” of multiple subsidy streams, recalibration of priorities in the state’s tax‐credit allocation system, adoption of a new state‐level historic tax credit, and reevaluation of the current housing element law and its treatment of rehab construction. Section IX supplies some concluding remarks.
A series of appendices provides detail on two case studies and an analytic framework applicable to regulatory barriers affecting rehab investment.

3
While a number of developers and local and state agencies are involved in rehab directed toward the single‐family homeowner and this is an important area for investment in housing improvement, our discussion will focus almost exclusively upon construction of assisted units in multifamily structures targeted toward the state’s low‐ and moderate‐income households.
II. Choosing Rehab: Modes of Developer Choice
The stylized choice housing policy confronts would appear simple on its face: either devote resources to new construction or divert them to renovating existing structures. We must acknowledge, however, that framing the question in this way assumes a number of critical policy facts and simply ignores others.
First, flows of resources available for such activities are neither fixed over time nor indifferent to the kind of construction chosen. Tax‐credit dollars depend greatly upon the opportunity costs of the investors and the quite individualized circumstances they face annually as taxpayers. Second, private and nonprofit firms alike have their own particular perspectives, risk perceptions, and philosophies toward assisting low‐ and moderate‐income (LMI) households, and these characteristics can lead them to prefer rehab or new construction for their own, often complex and difficult to observe reasons. Overall investment between the two categories is hardly allocated in a vacuum.
A. Relative Cost Advantages by Type of Construction: The Economics
Economists’ formal attention to this topic has been decidedly sparse. However, In the 1960s economists did briefly wrestle with a question related to the one under consideration here, relative to California housing practice. The focus of housing policy and research at the time concerned the upgrading of substandard units already existing within the stock. Such a target diverges from the goals which have since that time come to dominate the scene: (1) expanding the stock of rental units affordable to LMI households and (2) assisting such households with demand‐side rent and ownership subsidies to be expended in the private market. Nonetheless, the earlier debate provides helps us analyze the net social benefit of investments on either side of the new/rehab divide.
The late Professor Albert Schaaf of the business faculty at UC Berkeley attempted in 1969 to point the way, and the fundamentals of his theories still apply today.1 In a paper published in the Journal of the American Planning Association entitled “Economic Feasibility Analysis for Urban Renewal Housing Rehabilitation,” Schaaf grounded his approach on the same foundation housing policy does: without subsidy, private investment in LMI housing is not economically
1 Earlier in his career Professor Schaaf developed an innovative metric for estimating rehabilitation cost utilizing the “penalty scores” for shelter deterioration published by the American Public Health Association (APHA) (Schaaf, 1960).

4
sustainable because profits are insufficient. Despite this reality, Schaaf suggested a “modified least cost” approach toward choosing between new construction and rehabilitation in expending that subsidy. Investors and policymakers ought to choose among new and rehab, Schaaf argued, simply by determining which strategy produces the greatest housing output at the least cost.
In essence, rehabilitation prevails in the housing investment analysis whenever the cost of new construction exceeds the sum of rehabilitation costs, maintenance savings losses over the useful life of the rehabbed building, and the present value of an eventual full‐scale replacement down the road (reasonably assumed in the model to be an inevitability for any rehab). The choose‐rehab condition is summarized in the following equation Schaaf offers:
,
where: C is the cost of new construction; R is the cost of rehab; M is the annual maintenance‐expenditures saved when opting for new construction; r is rental‐income advantage of new units in the marketplace (often based on amenity perceptions and the like); i is the interest rate; d is the annualized depreciation rate; and n is the useful life in years of the structure following rehab. In general, as the model makes obvious higher interest rates and building‐life increases ought to steer investment toward rehab and away from new construction (Schaaf, 1969; Sternlieb and Listokin, 1976).
Not so obvious are the ways in which subsidy‐program rules complicate the comparison. For example, the Schaaf approach does not freeze in place regulatory time‐periods governing funding streams (e.g., the LIHTC fifteen‐year window). These artificial accounting periods reflect administrative convenience and are completely inflexible relative to the efficiency of choosing new versus rehab construction. Also, the model does not account for possible differences in operating‐revenues based opportunity cost, i.e., those based upon varying affordability restrictions and the greater market rents newer buildings might otherwise command.
A more detailed analysis will take into account the fact that investors and policymakers choose among varying quality standards for new construction and varying upgrade levels for rehab. R can be set in ways which decrease maintenance savings M (i.e., via full‐scale replacement of common‐use and unit‐specific equipment) and commensurately extend the building’s useful life (n). So long as such quality standards are held constant when comparing new construction with rehab opportunities, the above decision‐rule would appear to govern. Alternatively, for a fixed new‐construction expenditure level C, and the M savings involved, one can determine the maximum level of rehab investment R one might feasibly consider, beyond which the C cost‐level becomes most advantageous.
5
There are at least five key considerations required to modernize this decision rule and make it most useful for current application.
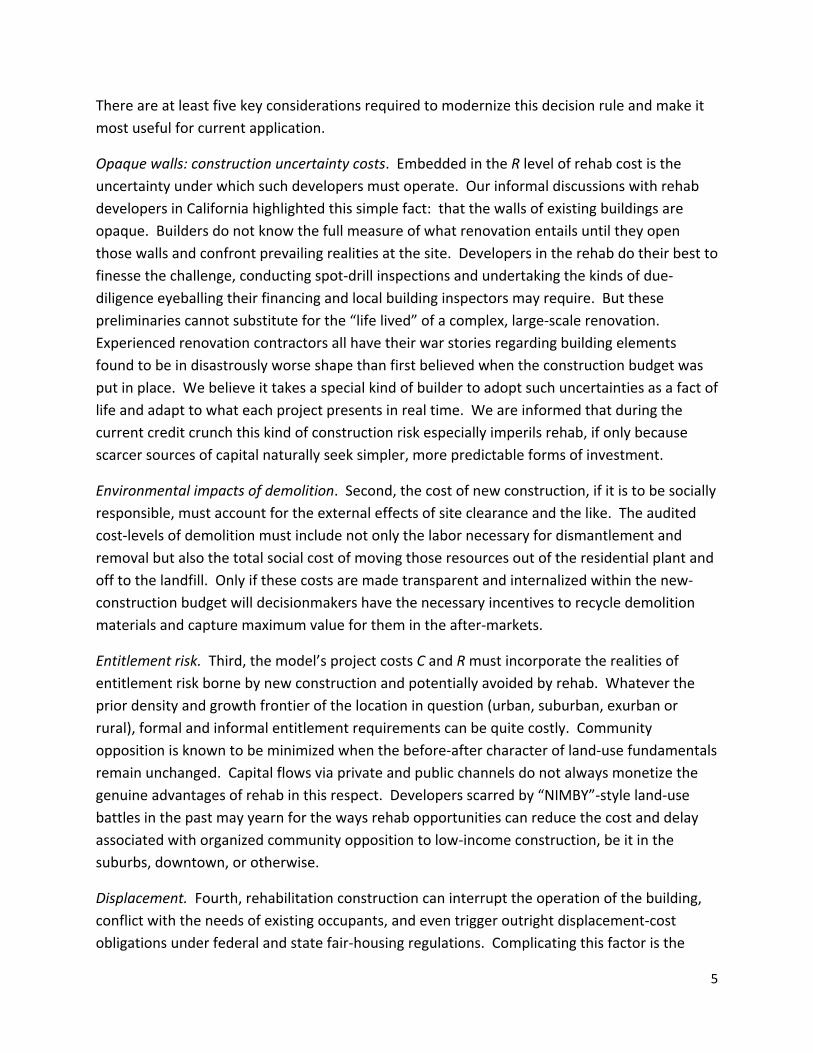
Opaque walls: construction uncertainty costs. Embedded in the R level of rehab cost is the uncertainty under which such developers must operate. Our informal discussions with rehab developers in California highlighted this simple fact: that the walls of existing buildings are opaque. Builders do not know the full measure of what renovation entails until they open those walls and confront prevailing realities at the site. Developers in the rehab do their best to finesse the challenge, conducting spot‐drill inspections and undertaking the kinds of due‐diligence eyeballing their financing and local building inspectors may require. But these preliminaries cannot substitute for the “life lived” of a complex, large‐scale renovation. Experienced renovation contractors all have their war stories regarding building elements found to be in disastrously worse shape than first believed when the construction budget was put in place. We believe it takes a special kind of builder to adopt such uncertainties as a fact of life and adapt to what each project presents in real time. We are informed that during the current credit crunch this kind of construction risk especially imperils rehab, if only because scarcer sources of capital naturally seek simpler, more predictable forms of investment.
Environmental impacts of demolition. Second, the cost of new construction, if it is to be socially responsible, must account for the external effects of site clearance and the like. The audited cost‐levels of demolition must include not only the labor necessary for dismantlement and removal but also the total social cost of moving those resources out of the residential plant and off to the landfill. Only if these costs are made transparent and internalized within the new‐construction budget will decisionmakers have the necessary incentives to recycle demolition materials and capture maximum value for them in the after‐markets.
Entitlement risk. Third, the model’s project costs C and R must incorporate the realities of entitlement risk borne by new construction and potentially avoided by rehab. Whatever the prior density and growth frontier of the location in question (urban, suburban, exurban or rural), formal and informal entitlement requirements can be quite costly. Community opposition is known to be minimized when the before‐after character of land‐use fundamentals remain unchanged. Capital flows via private and public channels do not always monetize the genuine advantages of rehab in this respect. Developers scarred by “NIMBY”‐style land‐use battles in the past may yearn for the ways rehab opportunities can reduce the cost and delay associated with organized community opposition to low‐income construction, be it in the suburbs, downtown, or otherwise.
Displacement. Fourth, rehabilitation construction can interrupt the operation of the building, conflict with the needs of existing occupants, and even trigger outright displacement‐cost obligations under federal and state fair‐housing regulations. Complicating this factor is the
6
reality that such disruptions often cannot be quantified with precision in advance. Until the walls are opened and the true condition of unseen building components is assessed, a developer may not confidently know whether the project can “rehab around” current occupants or whether extensive relocation costs will have to be borne. This is but one of many risk factors due to the increased uncertainty under which rehab construction must operate.
In California rehab efforts as elsewhere, the existing occupancy status, and income levels of current tenants, are matters a developer often must reveal to funding sources. For example, applicants seeking tax‐exempt bond authority from the California Debt Limit Allocation Committee (CDLAC) or low income housing tax credits from the California Tax Credit Allocation Committee (TCAC) are required to submit a market study completed by a “disinterested third party.” Pertinent, compulsory elements reviewable by funding authorities in market studies for rehab are “current occupancy levels, operating expenses and rents being charged, identification of any existing assisted housing program at the property such as Section 8, Section 202, Section 811, BMIR, Section 236, etc., and tenant incomes ...” (CDLAC, 2005).
Examination of demand conditions for various income groups in the context of rehab buildings, known generally as the “capture analysis” required in all such market studies, likewise must account for “the number of units [existing] tenants will be required to vacate for failing to income qualify for a unit, during the year the project is projected to be placed in service.” (Ibid.) Such analyses represent additional cost in rehab projects, for which there is no corresponding burden in new construction. There is also the matter of prevailing displacement and relocation cost obligations imposed under state and federal housing law.2 Even when rehab developers make reasonable efforts to observe the letter and spirit of these requirements, an active and motivated plaintiffs’ bar – driven largely by nonprofit legal services firms – may sue nonetheless, forcing construction to bear excess legal and insurance fees even where its defense to such lawsuits is entirely meritorious. Obviously, new construction avoids relocation‐oriented complications entirely.
To this list we might add a number of additional considerations tending to steer developers and investors toward rehab, or away from it. It is quite possible that increasing green‐building and environmental impact requirements will not impact such projects equally by type of construction. Additionally, if the cost frontier of internationally traded input commodities (e.g.,
2 Key provisions include the federal Uniform Relocation Assistance and Real Property Acquisition Policies Act of 1970 (42 U.S.C. § 4601 et seq.), the California displacement‐rights statute (California Government Code § 7260 et seq.), and the similar provision governing households impacted by redevelopment‐agency projects in the state (California Health & Safety Code § 33410 et seq.). The federal law provides the national model, guaranteeing assistance to those affected by the acquisition, rehabilitation, or demolition of real property for federally funded projects. “This law was enacted by Congress to ensure that people whose real property is acquired, or who move as a direct result of projects receiving Federal funds, are treated fairly and equitably and receive assistance in moving from the property they occupy”

7
lumber, steel, concrete) changes dramatically, rehab projects currently priced out of competition for the marginal investment dollar may get a fresh look based upon market forces alone. Other signals may arise from elsewhere in construction law and regulation. Interestingly, to the extent one might finance all construction labor from tax‐credit‐finance alone, it is possible that such projects will be deemed unaffected by the Davis‐Bacon Act and/or state prevailing wage requirements. Such wage premiums are imposed upon publicly funded construction, and the mere allocation of tax credits by the state may not be treated legally as constituting direct government funding of construction.3
B. Rehab by Degrees
Schaaf simulated rehab cost based in part on the extent of renovation required by subsidy regulators and desired by the developer, manager, residents, and neighborhood stakeholders. In point of fact, just as there are different market goods called “new construction” (from luxury condominiums to bare‐bones apartments), there are differential quality outcomes in rehab, depending upon both initial condition at the time of renovation and the degree of work undertaken.4 Table 1 below distinguishes among three styles of renovation by building component. The first, termed cosmetic rehab, retains all the buildings existing facilities and equipment, simply patching, painting, and repairing leaks to the point an operator’s maintenance budget may be exhausted. The second, known popularly as gut rehab, involves the full‐scale replacement of all such components outside of the framing and other salvageable elements. A mid‐range option, moderate rehab, skimps on replacement but adds in considerable ways to the mere superficial approach of cosmetic work.
3 See State Building & Construction Trades Council Of Calif. v. Duncan (2008 [Calif. Ct. of Appeal, 1st Dist., Div. 2]), 162 Cal.App.4th 289 76 Cal.Rptr. 3d 507. 4 This section draws upon earlier, unpublished HUD research by David Listokin and colleagues.

8
For windows, cosmetic rehab pursues replacement only for broken panes and may repaint sills for lead containment. Moderate rehab would do the same, but might also fix all operating appliances attached to window frames, install new sashes and add aluminum balances. Gut
rehab could involve replacing all windows with double‐glaze and enlargement, being careful at the same time to upgrade all closures to current energy‐code requirements. The art of renovation consists of knowing what to keep and what to remove and/or replace.
Construction Activity by Rehabilitation Option
Building Items Cosmetic Rehab Moderate Rehab Gut Rehab
Windows Old Old All New
Doors Old Old All New
Roof Old Partially New All New
Unit layout Old Partially New All New
Flooring Old All New All New
Walls and ceilings Old Old All New
Kitchens Old Old All New
Closets Old Old All New
Fire alarm systems Old Partially New All New
Fire sprinkler systems
Old Partially New All New
Wiring Old Partially New All New
Electrical fixtures Old All New All New
Plumbing lines Old All New All New
Plumbing fixtures Old Partially New All New
Heating Old All New All New
Table 1

9
Before departing this discussion of the still‐relevant Schaaf model of construction choice, we must acknowledge that key policy dimensions now quite frequently part of the discourse are missing from the equation we have specified and described here. Chief among these is the entire matter of external effects of construction, rehabilitation, LMIH social investment, preservation of at‐risk properties and the like. The cost effectiveness of construction strategies of different stripes is endogenous to sociodemographics and urban conditions of the neighborhoods where need is often concentrated. For example, “[r]ehabilitation of existing structures in poor neighborhoods … may be more expensive because the buildings are often older and may be more likely to have fallen into disrepair as a result of underinvestment.” (Cummings and DiPasquale, 1999.) Finding the appropriate mix for new construction and rehabilitation depends in large part upon localized circumstances. Among the particulars influencing the determination would be the age and condition of the existing multifamily stock, vacancy rates, depth in the rehabilitation development arts and related trades, rate and substantiality of recent building‐code revision, a a variety of other factors. Though the federal government and large states like California can influence the new/rehab subsidy ratio, such judgments arguably should be left to city‐level policymakers and, of course, the market itself.
III. Evolution of Federal Rehab Policy
As an initial area of focus mid‐century, federal policy was preoccupied more with substandard housing conditions than housing affordability.
Federal involvement in housing rehabilitation actually dates from the National Housing Act of 1934, which some thing was the starting point for federal housing policy as a going concern.5 Tracing the participation of federal grants and loans in the rehabilitation of housing best follows three tracks: mortgage insurance, direct subsidy, and tax incentive. What was a centralized approach managed in Washington evolved over time, like so many social expenditure efforts, towards a decentralized, state‐administered set of programs. The layering of various subsidy streams, so often derided for the excess transactions costs it introduces, has been a fact of life in the political balancing act supporting rehab investment, for many years.
Title I mortgage insurance, a Depression‐era strategy protecting lenders against risks of default and deterioration of security for loans financing household upgrades, is a model which laid the groundwork for some of the recession‐driven owner‐assistance programs HUD is pursuing today. From the 1940s through the 1960s, federal policy on rehab lending sought to boost private sector participation and essentially demonstrated the sustainability of rehab‐project credit markets.
5 This section of the discussion draws upon Duda (2001).

10
During the Truman and Eisenhower administrations, rehab activities spurred by federal largesse were deemphasized, as the forces of urban renewal took hold. Even during the heyday of slum clearance laws in the 1950s, there was some recognition that national grants and loan programs should be devoted at least in part toward salvaging above‐average‐quality units in marginal neighborhoods by helping rebuild them rather than demolishing them.
The Housing Act of 1954 amended the 1949 Act to provide funding, not only for new construction and demolition, but for the rehabilitation and conservation of deteriorating areas. These amendments represented a substantive change in the evaluation of housing problems. The gradual shift from new construction to conservation has had a major impact on today’s housing policies where rehabilitation rather than demolition is encouraged.
(HUD[3], 2009.) FHA's Section 220 and 221(d)(3) programs, later superseded by Section 236 added in the Housing and Urban Development Act of 1968, made interest subsidies for multifamily acquisition and renovation a real priority. Along with Section 312 funds, these programs rehabilitated upwards of 40,000 units annually.
By the 1970s, however, perceptions of housing needs in Washington had shifted substantially toward assisting people more than projects. Following the Nixon administration’s moratorium on all housing assistance in the 1973, the Housing and Community Development Act of 1974 ushered in project‐based Section 8 rental subsidies and community development block grants (CDBG). The block‐grant framework, shifting authority for priority‐setting and program sustainability largely to the states’ housing agencies, laid the groundwork for the ways in which the bulk of HUD’s rehab grants in CDBG and the HOME program (part of the Cranston‐Gonzales housing legislation in 1990) are administered today.
1983 saw the repeal of section 8’s existing aid programs for new construction and substantial rehabilitation. (Listokin, 1991.) With the drastic reduction in federal activity on rehab, states like California did their best to make up the difference. That is, until the adoption of the Low Income Housing Tax Credit (LIHTC), part of the Reagan‐era Tax Reform Act of 1986, changed everything.
Early experience with tax‐incentive driven rehabilitation in the housing sector came in the form of historic rehabilitation programs developed by the National Park Service. Thereafter the tax code began to provide particularly favorable treatment to development, rehabilitation and ownership of multifamily properties, in the form of depreciation schedules and deductibility of construction‐phase tax and interest. These provisions in part led to the early‐1980s construction boom in apartment building.

11
Senator George Mitchell, the principal author of the LIHTC component of TRA86, identified rehabilitation as a focal purpose of the legislation. In his statement on the Senate Floor, Mitchell pointed out that “Congress and successive administrations have long recognized the necessity of using tax incentives to attract private capital to low‐income housing development and rehabilitation. These provisions recognize that absent some incentives, investment in low‐income housing is a fundamentally uneconomic activity.”6 Senator Mitchell proceeded to link the influx of new tax‐credit capital to the rehabilitation needs of the aging assisted stock: “Without a continuing tax‐based incentive for new investors to put up capital, many [existing HUD‐subsidized] units will be sold for conversion to some other use – for higher income rentals, or for conversion to nonrental housing. Many other units will simply be allowed to deteriorate, and eventually they will have to be taken over by HUD or FmHA, resulting in tremendous losses to Federal insurance and loan funds.”7
For various reasons, the tax code has imposed upon tax‐credit applicants for rehab projects minimum construction requirements to ensure the upgrade of units’ condition met certain standards. Until recently, for example, to qualify for an allocation, rehabilitation expenditures would have to equal the greater of (1) at least 10 percent of the adjusted basis or (2) at least $3,000 per low‐income unit in the building being rehabbed. Congress increased the minimum expenditure requirement in 2008 to be the greater of (1) at least 20 percent of the adjusted basis or (2) at least $6,000 per low‐income unit.8 Minimum construction requirements may help insure that tax credits applied toward rehab bring units to (or near) the same quality conditions as new construction, and the commensurate years of service to qualifying households under essentially parallel depreciation schedules.
Since LIHTC’s adoption, a professionalized development sector has evolved, devoted to utilizing the tax‐credit system toward expanding supplies of shelter for low‐ and moderate‐income families. Because of the predominance of the LIHTC in the construction and rehabilitation of the assisted stock nationwide, the modern history of the tax‐credit program in California provides a handy method for analyzing the state’s rehab practices in comparative terms. This analysis proceeds in a later section of the paper.
6 Congressional Record, 132nd Congress, June 23, 1986, p. 14,918. 7 Ibid. 8 Housing Assistance Tax Act of 2008 (P.L. 110‐289): Joint Committee Technical Explanation, JCX‐63‐08. To qualify as an “at‐risk” project deserving of state tax‐credit support, the twenty‐percent rule does not apply (California Revenue and Taxation Code, §17058(c)(4)(d)).
12
IV. Rehab as “Preservation”: At-Risk Projects
One key set of issues relating to housing rehabilitation in California is the needed influx of capital in existing buildings in the assisted stock.9
We might analyze these needs in two categories. Older mortgage‐subsidy programs (pre‐Section 8) produced about 700,000 units nationwide in the 1960s and 1970s (e.g., Federal Housing Administration (FHA) Section 221(d)(3) “Below Market Interest Rate” (BMIR) program and the Section 236 program). The newer project‐based stock developed under the Section 8 New Construction/Substantial Rehabilitation and Moderate Rehabilitation programs came on line in the later 1970s through the mid‐1980s. These units number some 800,000 and feature substantial state‐level funding via mortgage revenue bonds, as well as direct 202 loans and Farmers Home Administration (FmHA) Section 515 program moneys. Approximately 800,000 units were developed during this period, including roughly 200,000 units that received both Section 8 rental subsidies and development loans under the Section 202 program for elderly and disabled residents.
The “preservation” challenge for deteriorating components of the aging stock forces daunting policy choices. Owners or their successors must identify strategies for sustaining affordability and a mode of income restriction workable in fluctuating marketplaces over the long term. Additionally, confronting known repair needs and assessing large‐dollar items which may require immediate or eventual attention compels developers and operators toward capital needs assessments and recapitalization (LISC, 2005).
In recent years California’s state housing agencies and its localities have provided a number of incentives which can be devoted towards necessary recapitalization of aging structures.10 Buildings conceivably eligible for such programs include existing structures in the assisted stock (i.e., preservation candidates) and others which, by virtue of new, public participation in the financing, can be added to that stock. The programs that those developers most oriented towards rehab can utilize in California include those outlined below.
A. LIHTC and TaxExempt Bond Finance
California’s Qualified Allocation Plan (QAP) provides a five‐percent set‐aside for properties having subsidies expiring within two years.11 (Some observers report that the set‐aside is
9 This section draws upon a HUD report entitled Multifamily Properties: Opting In, Opting Out and Remaining Affordable (Econometrica, 2006). 10 This section draws upon a state summary of California programs provided by the National Housing Trust (NHT, 2007). 11 The state designates twenty percent of the federal credit ceiling toward rural projects; fourteen percent of the resulting earmark is reserved for new projects, leaving a substantial share available for rural rehab, which can also use whatever proportion of the rural‐new set‐aside may go unused in any given year.

13
“habitually undersubscribed” [NHT, 2007].) Points are awarded in the competitive 9%‐credit award system for such “at risk” properties. Existing buildings must meet threshold per‐unit “hard construction cost” requirements for the rehab work proposed: $20,000 per unit for the competitive 9% credit and $10,000 for the automatic 4% credit and accompanying private‐activity bond financing via the California Debt Allocation Committee (CDLAC). At risk properties need only comply with the $10,000 level. Newer regulations implement priorities in California for energy‐efficient “green rehabilitation” in the tax credit program and elsewhere.
Recent years have seen regulatory changes meant to facilitate coupling bond financing with 4%‐credit awards; this strategy targets acquisitions of at‐risk properties requiring with only minor to mid‐range renovation. Of course, part of the overarching challenge to rehab transactions generally is the possibility for cost overruns given uncertainty regarding older buildings’ true condition. Awards by the state’s Tax Credit Allocation Committee (TCAC) and bonds administered by CDLAC finance sixty to seventy 9% projects and 120 to 130 4% projects annually. In 2006 40% of projects awarded tax credit were in the 4% group, a share close to the historical average for the state.
Set in perspective relative to other states, California’s attention to rehab follows national norms and in other regards must be characterized as exemplary.
B. State and Local Trust Funds and Preservation Programs.
California adopted a statewide housing trust fund in 1985,12 and conceivably it is available for rehab efforts supported by the state’s Department of Housing and Community Development. However, that statewide trust fund has never been endowed with a freestanding, renewable, off‐budget revenue source. Without a sufficient corpus the program is has for the most part remained essentially an empty shell.
However the state does have a matching program meant to enhance the capacity of local housing trust funds operated by cities, counties, and nonprofit organizations. There are a number of quite successful trust funds operating around the state. The City of Los Angeles Affordable Housing Trust Fund (LAAHTF) is operated by the city’s Department of Housing and has seen annual appropriations exceeding $100 million in recent years. LAAHTF is a ready source of “gap financing” for LIHTC awardees, benefiting the construction and rehabilitation of hundreds of units each year restricted to households earning less than sixty percent of area median income (AMI). The city often uses the trust fund vehicle to deposit proceeds from older subsidized buildings where HUD requires those moneys be reinvested by the nonprofit seller toward new construction of acquisition and rehab of structures added to the local assisted
12 California Health & Safety Code, §50841, created by Chapter 1584, California Statutes of 1985 and made durable by Chapter 1570, California Statutes of 1988.

14
stock. The city also operates a separate Affordable Housing Preservation Program, and such efforts can be observed operating in places like San Francisco and Sacramento as well.
The City of Citrus Heights in the Sacramento area places proceeds of its development impact fees into its affordable housing trust fund, for distribution in grants and loans dedicated to local preservation efforts. The program imposes a minimum level of $7,500 per unit (or 15% of the improvements’ value) in hard construction costs. Similar impact fees operate in San Diego and San Jose, funding trust‐based housing finance programs. Other cities ‐ like Menlo Park, Pasadena, and Santa Monica ‐ fuel local trust funds with payments of “in lieu” fees, by developers choosing to opt out of below‐market‐rate inclusionary requirements for their new commercial, multifamily and condominium conversion projects.
The list of rehab‐friendly grant and loan programs in California goes on. There are also a number of other programmatic activities at the California Housing Finance Agency (CalHFA) and the state’s Department of Housing and Community Development; it is beyond the scope of this paper to list them in greater detail here. Suffice it to say that, along with whatever barriers one might identify in California impeding the expansion of rehab activity, one simply must take stock of the substantial promotional activity in that realm in order to draw a fair picture of the state’s overall inclinations towards rehab.
V. Comparing LIHTC Allocations: California vs. Elsewhere in the US
In the tax credit program nationally, new construction has been favored over rehabilitation. About 60 percent of all LIHTC units have been developed through new construction and the remainder through rehabilitation. Since tax credits are greater for newly constructed units, this is not surprising. While the actual construction costs of either new construction or substantial rehabilitation enjoy the same 9 percent credit rate, the nonland acquisition costs of a development earn only a 4 percent credit rate. Because all rehabilitation projects involve purchasing an existing building, this portion of the total development costs receives a smaller tax credit, making rehabilitation a less favorably treated form of construction.” (McClure, 2000 [emphasis added; summarizing project‐level studies of the 1990s].) Based on mandatory state reporting to the federal government, HUD maintains a database of LIHTC‐funded projects, providing complete historical coverage back to the establishment of the program and the first tax‐credit awards initiated in 1987.

15
Figure 1
10.2%
0% 10% 20% 30% 40% 50% 60% 70% 80%
NevadaFloridaHawaii
WashingtonColorado
ArizonaOregon
CaliforniaNorth Carolina
WisconsinNew Hampshire
New JerseyAlaska
GeorgiaIdahoUtah
North DakotaSouth Carolina
New YorkMinnesota
IllinoisVirginia
NebraskaIndiana
MontanaConnecticut
IowaTexas
MissouriTennessee
MarylandArkansas
South DakotaOhio
MassachusettsMichiganAlabamaKentucky
KansasMaine
New MexicoDelaware
PennsylvaniaDistrict of …Vermont
Rhode IslandMississippi
WyomingOklahoma
West VirginiaLouisiana
Proportion of Permitted Multifamily UnitsFinanced by the Low Income Housing Tax Credit,
By State (1987-2006)
Source: http://www.danter.com.

16
Some states are more dependent upon the LIHTC program than others for their multifamily production. As Figure 1 attests, overall California’s production of multifamily is among the least tax‐credit dependent in this sense; barely one in ten of the multifamily‐unit permits California jurisdictions issue features tax‐credit finance. All the same, the great share of non‐single‐family construction in the state is market‐rate and therefore out of reach financially for the state’s neediest families. As will be seen in the analysis below, the sheer volume of tax‐credit financed activity in California makes the LIHTC experience a useful window through which to view the state’s policies relative to rehab construction of assisted housing. This is especially pertinent in terms of the state’s highest‐cost areas.
The national LIHTC database provides a variety of information at the project level. The variable of interest in the data is “TYPE,” a categorical indicator identifying whether a tax‐credit project is (1) new construction, (2) acquisition and “substantial rehabilitation” construction, (3) elements of both new and rehab within one project, and (4) “existing” construction (i.e., acquisition of a structure essentially in as‐is condition, without financing for improvements beyond moderate rehabilitation incorporated in the tax‐credit basis). Throughout our analysis of that data, we divide this classification into dichotomous categories, combining all the “non‐entirely new” construction types in the data into one “rehab” grouping.13
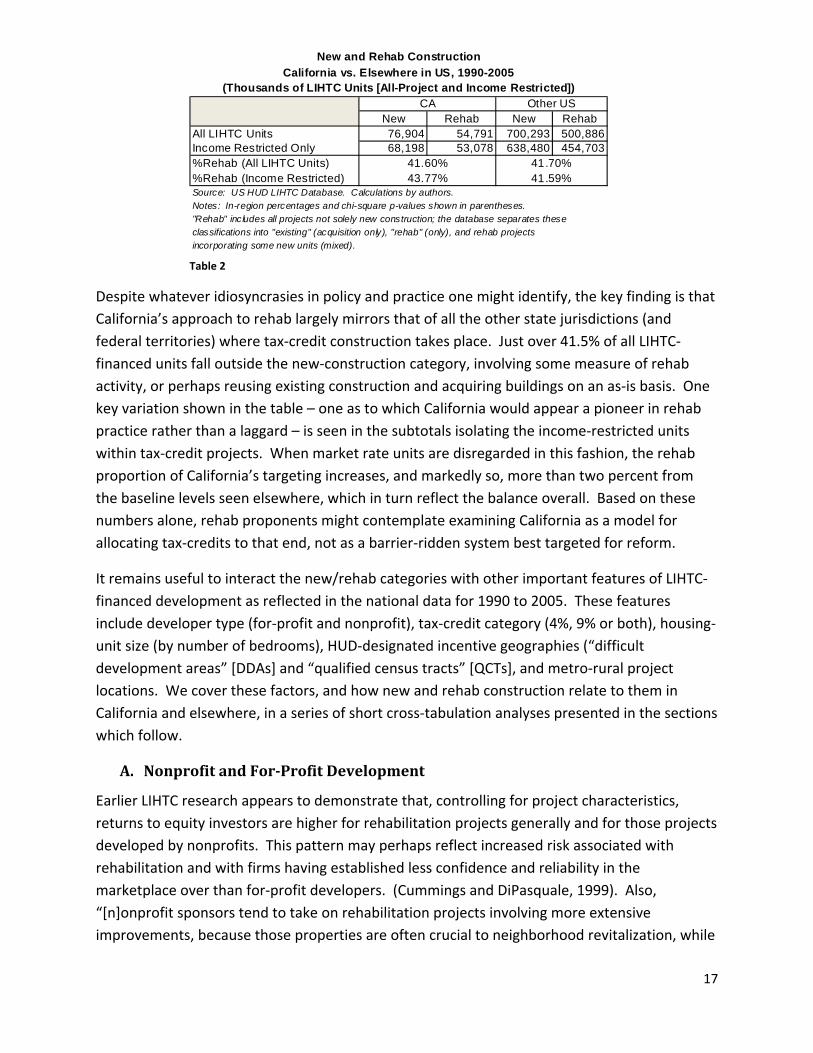
We utilize HUD’s national LIHTC database to identify where California’s new‐to‐rehab ratio ranks relative to the rest of the country. The data is drawn from HUD records for allocations conferred from 1990 through 2005 inclusive.14 Table _ shows overall ratios separately for unit totals in all LIHTC funded projects during the period; the table also identifies proportions only for those units which are income‐restricted, excluding the non‐subsidized portion of the portfolio and providing a different glimpse of unit production in the targeted outcome‐category over time.
13 In the context of Section 8 supply‐side programs, HOME, and other funding categories, HUD tends to define three types of “housing”: “[N]ew construction, substantial rehabilitation, and existing housing/moderate rehabilitation.” 24 CFR §883.302. 14 Data on projects initiated starting in 1990 have more complete information in the HUD database. Starting the analysis in 1990 also omits early years of the tax‐credit financial system, when the program and regulations were just getting off the ground.
17
Despite whatever idiosyncrasies in policy and practice one might identify, the key finding is that California’s approach to rehab largely mirrors that of all the other state jurisdictions (and federal territories) where tax‐credit construction takes place. Just over 41.5% of all LIHTC‐financed units fall outside the new‐construction category, involving some measure of rehab activity, or perhaps reusing existing construction and acquiring buildings on an as‐is basis. One key variation shown in the table – one as to which California would appear a pioneer in rehab practice rather than a laggard – is seen in the subtotals isolating the income‐restricted units within tax‐credit projects. When market rate units are disregarded in this fashion, the rehab proportion of California’s targeting increases, and markedly so, more than two percent from the baseline levels seen elsewhere, which in turn reflect the balance overall. Based on these numbers alone, rehab proponents might contemplate examining California as a model for allocating tax‐credits to that end, not as a barrier‐ridden system best targeted for reform.
It remains useful to interact the new/rehab categories with other important features of LIHTC‐financed development as reflected in the national data for 1990 to 2005. These features include developer type (for‐profit and nonprofit), tax‐credit category (4%, 9% or both), housing‐unit size (by number of bedrooms), HUD‐designated incentive geographies (“difficult development areas” [DDAs] and “qualified census tracts” [QCTs], and metro‐rural project locations. We cover these factors, and how new and rehab construction relate to them in California and elsewhere, in a series of short cross‐tabulation analyses presented in the sections which follow.
A. Nonprofit and ForProfit Development
Earlier LIHTC research appears to demonstrate that, controlling for project characteristics, returns to equity investors are higher for rehabilitation projects generally and for those projects developed by nonprofits. This pattern may perhaps reflect increased risk associated with rehabilitation and with firms having established less confidence and reliability in the marketplace over than for‐profit developers. (Cummings and DiPasquale, 1999). Also, “[n]onprofit sponsors tend to take on rehabilitation projects involving more extensive improvements, because those properties are often crucial to neighborhood revitalization, while
New and Rehab ConstructionCalifornia vs. Elsewhere in US, 1990-2005
(Thousands of LIHTC Units [All-Project and Income Restricted])CA Other US
New Rehab New RehabAll LIHTC Units 76,904 54,791 700,293 500,886Income Restricted Only 68,198 53,078 638,480 454,703%Rehab (All LIHTC Units) 41.60% 41.70%%Rehab (Income Restricted) 43.77% 41.59%Source: US HUD LIHTC Database. Calculations by authors.Notes: In-region percentages and chi-square p-values shown in parentheses."Rehab" includes all projects not solely new construction; the database separates theseclassifications into "existing" (acquisition only), "rehab" (only), and rehab projectsincorporating some new units (mixed).
Table 2

18
for‐profit sponsors often prefer less difficult and economically more feasible properties requiring more modest rehabilitation.” (Roberts and Harvey, 1999.) The competition for tax‐credit allocations between for‐profit and nonprofit firms ‐ with their varying motivations, financial realities and organizational cultures – is an idiosyncrasy of housing policy driven by the LIHTC program. That competition is not viewed as wholesome and productive by all observers (Ballard, 2003).
The national LIHTC database identifies new and rehab construction across sectors, allowing comparison between development patterns involving for‐profit firms and others (non‐profit
corporations and government‐based tax‐credit developer applicants). Table 3 shows the breakdowns separately for California compared to elsewhere in the US, for all LIHTC‐financed construction and for only the income‐restricted units within those developments. In this panel (taken from the smaller number of project records where firm type is reliably identified), total rehab construction accounts for nearly 39% of all LIHTC‐financed construction in the US; the proportion of rehab within income‐restricted units in LIHTC projects being only slightly more. In California, rehab speaks for nearly 42% of all tax‐credit construction and over 44% of development of income‐restricted units. In both cases, the proportion of rehab is above national benchmarks for the LIHTC program historically.
For each panel in this cross‐tabulation, despite the greater rehab activity in California than elsewhere nationally, chi‐square tests for goodness of fit between California’s proportions and those identified nationally show no statistically significant difference. This means that California is essentially in the middle of the pack when it comes to the rehab proportion of tax‐
New and Rehab Construction, By Firm Type:California vs. Elsewhere in US
(Thousands of LIHTC Units, 1990-2005 [All Project and Income-Restricted])California Other US
For Profit Nonprofit For Profit NonprofitNew Construction 45.34 (45.9%) 12.16 (12.3%) 518.39 (49.8%) 121.67 (11.7%)Rehab/Existing/Mixed 31.01 (31.4%) 10.37 (10.5%) 303.87 (29.2%) 97.44 (9.4%)Chi-Square Independence (CA) 0.21 (0.65)Chi-Square Independence (Other US) 4.13 (0.04)Chi-Square Goodness of Fit 0.89 (0.83)
California Other USFor Profit Nonprofit For Profit Nonprofit
New Construction 38.68 (42.7%) 11.73 (13.0%) 470.68 (49.2%) 114.37 (12.0%)Rehab/Existing/Mixed 29.96 (33.1%) 10.14 (11.2%) 279.49 (29.2%) 92.11 (9.6%)Chi-Square Independence (CA) 2.90 (0.09)Chi-Square Independence (Other US) 31.98 (0.00)Chi-Square Goodness of Fit 4.49 (0.21)Source: US HUD LIHTC Database. Calculations by authors.Notes: In-region percentages and chi-square p-values shown in parentheses.
All LIHTC Units
Income-Restricted Units Only
Table 3

19
credit construction. We also conducted within‐region tests of the potential association between sector (for‐profit vs. nonprofit) and type of construction. Nationally, whether one analyzes total construction or income‐restricted units in isolation, there appears a significant association between the sector in which investment takes place and the split between new and rehab projects.
Compared with expectations based on overall proportions across categories, the for‐profit sector produces a significantly smaller proportion of its output in rehab projects, which the nonprofit sector produces more. While the general pattern is the same within California, the departures from expectation are much smaller in proportional terms, and are not significant statistically. However, differences between for‐profit and non‐profit firms in California border on significance at the 95% confidence level (with a p‐value of 0.09). The table makes clear that for‐profit firms in California speak for a smaller share of new construction relative to the rest of the country, and the nonprofit sector in assisted‐housing development is better developed in the state than nationally at least in terms of market‐share.
B. Type of Credit Allocated: 4%, 9%, and Mixed Awards
The LIHTC subsidizes either thirty or seventy percent of the low‐income‐unit development‐cost basis in a qualifying project.15 The thirty‐percent subsidy, referred to in practice as the “automatic” four‐percent tax credit, covers construction financed in part via supplemental federal‐source subsidies (often tax‐exempt bond funds) and/or the acquisition cost for renovation of existing buildings. The seventy‐percent subsidy, referred to as the “competitive” nine‐percent credit in California because applications exceed quantities to be allocated, covers construction where additional federal subsidies are excluded. For the 9% credit, the stream of tax credits flowing for the 10‐year credit has a present value of 70% of eligible costs at the time of the award, while the 4% credit provides tax benefits equal to 30% of such costs in present‐value terms.
Awards of four‐percent and nine‐percent credits, and mixed awards combining the two within individual projects, have been used nationally to fund substantial numbers of units in both the new and rehab categories. Generally the nine‐percent credit applies toward new construction and substantial rehabilitation without other federal sources of finance, while the four‐percent credit is targeted for “1) acquisition of existing buildings for substantial rehabilitation; 2) new construction or substantial rehabilitation subsidized with other federal funds; or 3) projects financed with tax‐exempt bonds” (Fischer, 2008). Where existing buildings are substantially rehabilitated under federal standards, they may receive the four‐percent credit while the
15 This description draws upon a cogently drafted resource document developed by the National Low Income Housing Coalition (Fischer, 2008).

20
rehabilitation expenses (if not receiving other federal subsidies) are eligible for the nine‐percent credit.16
The data compiled in Table 4 indicates that California’s allocation of new and rehab construction among the credit‐type categories diverges significantly from national totals from other states. The increased attention to rehab relative to new construction seen in other tables is reflected here as well. In California and elsewhere, the type of credits awarded does seem significantly associated with types of construction, merely indicating that the overall mix reflects applicability of varying credit‐types under the federal law and regulations governing the LIHTC program. Mixed awards covering rehab projects account for nearly percent of all tax‐credit units completed during 1990 through 2005 elsewhere in the US. Not so in California, a place that demonstrates the extent of state discretion in the tax‐credit allocation system. New and rehab construction utilizing a mix of 4% and 9% credits are virtually nonexistent in the state (about two per thousand units produced under the LIHTC program). At the same time, California appears to utilize the different tax‐credit levels more flexibly. Whether measured by all LIHTC‐funded project units or just the income‐restricted ones, 4%‐only allocations outside California represent about 40% of units produced (new and rehab), while in California such allocations fund well over half the new and rehab units combined. The difference may indicate a shift from mixed‐credit‐type allocations elsewhere, necessitated by scarcer flows of other federal moneys to be combined with 4%‐credits. This possibility would account for only about half the overall shift toward 4%‐only projects in California, however.
16 Housing Assistance Tax Act of 2008 (P.L. 110‐289): Joint Committee Technical Explanation, JCX‐63‐08.

21
Table 4
Table 5
New and Rehab Construction, By Credit Type:California vs. Elsewhere in US
(Thousands of LIHTC Units, 1990-2005 [Total and Low-Income Only])California Other US
Four Percent Nine Percent Both Four Percent Nine Percent BothNew Construction 29.98 (30.8%) 32.02 (32.9%) .00 (0.0%) 243.10 (23.4%) 400.45 (38.5%) 7.87 (0.8%)Rehab/Existing/Mixed 26.63 (27.4%) 8.42 (8.7%) .20 (0.2%) 184.60 (17.8%) 121.54 (11.7%) 81.73 (7.9%)Chi-Square Independence (CA) 7.37 (0.03)Chi-Square Independence (Other US) 161.46 (0.00)Chi-Square Goodness of Fit 23.44 (0.00)
California Other USFour Percent Nine Percent Both Four Percent Nine Percent Both
New Construction 24.53 (27.4%) 30.92 (34.5%) .00 (0.0%) 211.05 (22.1%) 378.47 (39.7%) 6.95 (0.7%)Rehab/Existing/Mixed 25.60 (28.6%) 8.25 (9.2%) .20 (0.2%) 168.97 (17.7%) 111.94 (11.7%) 76.88 (8.1%)Chi-Square Independence (CA) 8.72 (0.01)Chi-Square Independence (US) 158.03 (0.00)Chi-Square Goodness of Fit 23.78 (0.00)Source: US HUD LIHTC Database. Calculations by authors.Notes: In-region percentages and chi-square p-values shown in parentheses.
All LIHTC Units
Income-Restricted Units Only
New and Rehab Construction, By Unit Size:California vs. Elsewhere in US
(Thousands of LIHTC Units, 1990-2005)California Other US
SROs and 1BR 2BR Family SROs and 1BR 2BR FamilyNew Construction 25.06 (23.9%) 18.81 (17.9%) 18.27 (17.4%) 180.26 (18.8%) 252.81 (26.4%) 151.63 (15.8%)Rehab/Existing/Mixed 18.63 (17.8%) 17.95 (17.1%) 6.21 (5.9%) 155.38 (16.2%) 158.15 (16.5%) 60.24 (6.3%)Chi-Square Independence (CA) 3.45 (0.18)Chi-Square Independence (Other US) 17.50 (0.00)Chi-Square Goodness of Fit 6.41 (0.27)Source: US HUD LIHTC Database. Calculations by authors.Notes: In-region percentages and chi-square p-values shown in parentheses."Family" units are those with three or more bedrooms.
All LIHTC Units

22
C. Unit Size
The relationship between unit size and type of construction, from a policy standpoint, appears rather complex. On the one hand, many advocates of infill rehab would prefer to target taller SRO and 1BR buildings in dense, rundown urban neighborhoods, bringing affordability and quality upgrades to places where poverty and special‐needs concentrations are already to be found. Such projects also feature easy adaptation for homeless, seniors, and other recipient categories. Firms specializing in new construction might well point out, however, that economies based on structural assets salvaged in tall buildings may well be swallowed whole by riskier and often substantially costlier rehab expenses required on a per‐unit basis. Focusing upon existing small‐unit floorplans in rehab projects necessarily deemphasizes shelter and services for larger families. Localized circumstances relative to rehab opportunities, preservation demands and the like frustrate broad‐stroke state and federal policy steering credits among competing conceptions of need.
In similar fashion to LIHTC tabulations we have undertaken, Table 5 identifies how California’s allocations by unit‐size compare to other places throughout the US. Here California’s assignment of credits historically does not vary substantially from national practice, inasmuch as a goodness‐of‐fit statistic fall short of significance at the 95% confidence level. That being said, the state’s emphasis on new construction of smaller units relative to other jurisdictions is plain. Particularly compared to states in the Northeast and elsewhere having older multifamily stock and therefore, perhaps, greater rehab opportunities in buildings with smaller unit‐floorplans, California’s stock was built later and regularly suffers greater impacts from natural hazards and the like.
D. Qualified Census Tracts (QCTs) and Difficult Development Areas (DDAs)
“As defined in Section 42 of the Internal Revenue Code, QCTs [Qualified Census Tracts] are areas where 50 percent or more of the households have incomes below 60 percent of the area median income, or where the poverty rate is 25 percent or higher …. QCTs likely were intended to provide additional incentives for the rehabilitation or replacement of substandard rental housing in low‐income areas” (Hollar and Usowski, 2007). “Difficult Development Areas” (DDAs) for LIHTC purposes are those identified by HUD as having particularly high land, construction, and operating costs relative to area incomes. Projects in QCTs and DDAs are eligible for allocations of tax credits at 130% of qualified basis, a substantial increase in development costs covered under the LIHTC program. These areal designations represent efforts to induce additional investment where incomes are lowest and poverty rates highest, or where construction‐ and operating‐cost realities arguably justify targeted augmentation of the affordable multifamily stock.

23
When it comes to such siting incentives, the differences between practice in California and elsewhere are unremarkable. As Table 6 identifies, a slighter greater proportion of LIHTC‐project units overall have found their way into DDAs and QCTs than elsewhere, but the margin is slight (over 14% in California as compared to 12% elsewhere). The shift toward these HUD‐designated geographies in California is greater in new construction; the proportion of tax‐credit units representing rehab in DDAs and QCTs is substantially less, on a percentage basis, than in other states. However, even this difference fails to render California significantly different than the rest of the country on this dimension, in statistical terms.
E. Metro/NonMetro Location
Housing stock and regulatory environments can vary greatly depending upon whether a project is located in the central city, in the suburbs, or outside metropolitan areas altogether. We expect the multifamily stock to be oldest in the inner cities, but distinctions between downtown areas and bordering towns become harder to detect, at least in relative terms, over time. Proportional building‐age differences fall as inner‐ring suburbs originally developed mid‐century evolve and begin to face many of the traditional central‐city challenges vis a vis tax base, crime and poverty concentrations, deteriorating school quality and the like. It is useful to explore whether the western‐style metropolis typified in California’s urban areas has a distribution of new and rehab tax‐credit construction anything like the rest of the country.
In this instance California’s allocations stand in marked contrast. In the rest of the US, metropolitan projects are about evenly divided between tracts located in central‐city areas and suburban locations, as shown in Table 7. Outside California, central cities and suburbs each host slightly less than one‐quarter of all LIHTC‐financed units in the form of new construction; about 11% of projects are new construction in rural areas. However, still as to states other than California, rehab dominates downtown development, as one might expect; more than twice as many rehab units are in central cities compared to numbers located in suburban areas. Rural rehab is sparse, speaking for just one in twenty tax‐credit units.
As to both new construction and rehab, California allocations place a far greater proportion in the suburbs than do other jurisdictions. Irrespective of construction type, LIHTC‐financed units in California are forty‐seven percent suburban, and only thirty‐six percent suburban elsewhere. Part of the statistically significant difference is drawn from rural projects, where California’s allocations are a mere pittance; non‐metro areas speak for over fifteen percent of all tax‐credit construction nationally; in California rural areas claim only four percent of the units. It may be that greater emphasis on suburban development represents successful desegregation on the part of the tax‐credit allocator. It may also be the case that areas outside California’s largest urban centers, such as places in the San Joaquin valley, qualify as metropolitan in the HUD
24
geography while providing shelter for low‐income households commuting to rural employment destinations.
F. California’s LIHTC Rankings Nationally
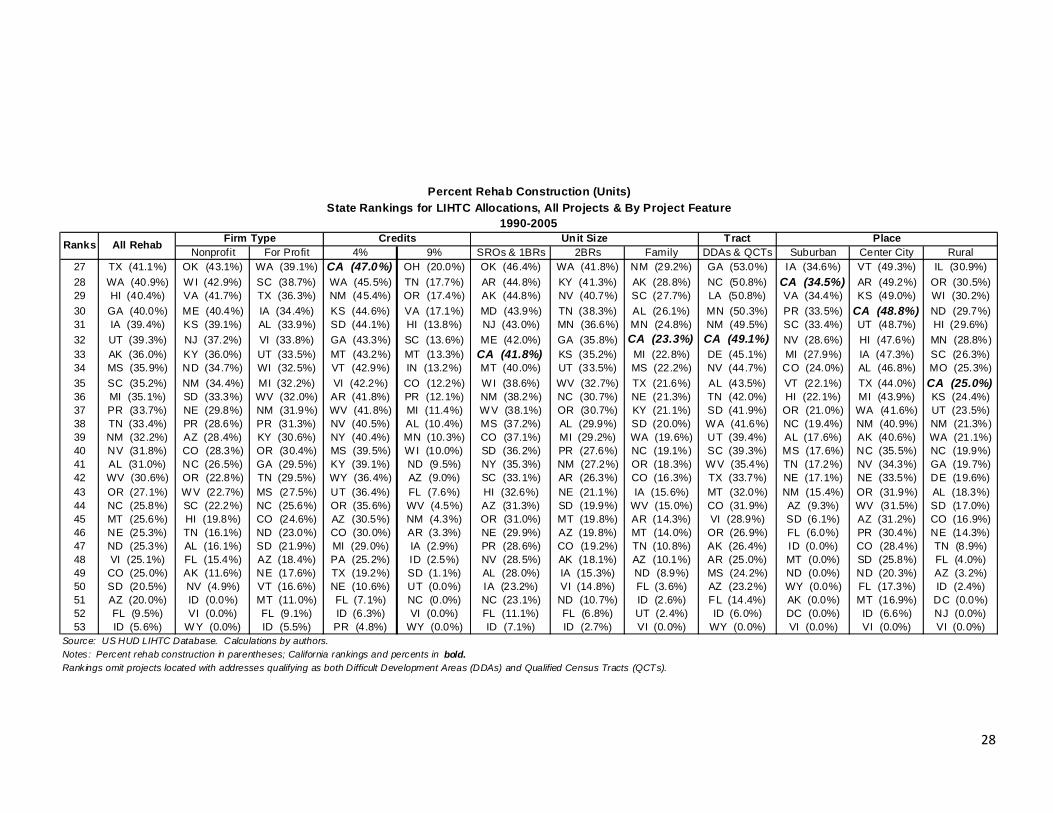
Another way to track California’s tax‐credit allocations between new and rehab construction is to determine how it ranks relative to other states along this same set of project‐level dimensions. Table 8 sets forth the proportion rehab, from highest to lowest, for projects of varying firm type, credit type, unit size in bedrooms, tract location, and urban/rural categories. The rankings run from first to fifty‐third, because places like the District of Columbia and Puerto Rico are included.
These rankings provide a handy summary of the overall findings: that California state allocations between new and rehab construction are far from remarkable. In every category the state finds itself in or near the middle. In no circumstance is it ranked higher than eighteenth (because 48.8% of its two‐bedroom construction is rehab) or lower than thirty‐fifth (because only one in four of its rurally located units is rehab).
Proponents of greater emphasis on rehab construction, accomplished by a shift of resources away from new projects, might argue that California’s rankings need to be “improved.” Objective voices without a horse in that race might see California soundly in the middle of the pack on the new‐rehab balance and ask whether there is really any allocative problem worth fixing.

25
Table 6
New and Rehab Construction, By HUD-Designated Need Geographies:California vs. Elsewhere in US
(Thousands of LIHTC Units, 1990-2005 [Total and Low-Income Only])California Other US
Difficult Devt. Areas (DDAs)
Qualif ied Census Tracts (QCTs) Other Difficult Devt.
Areas (DDAs)Qualif ied Census
Tracts (QCTs) Other
New Construction 2.58 (2.0%) 16.21 (12.4%) 57.26 (43.8%) 25.12 (2.1%) 129.52 (10.8%) 543.49 (45.5%)Rehab/Existing/Mixed .97 (0.7%) 17.15 (13.1%) 36.48 (27.9%) 15.59 (1.3%) 173.69 (14.5%) 308.09 (25.8%)Chi-Square Independence (CA) 1.88 (0.39)Chi-Square Independence (Other US) 41.18 (0.00)Chi-Square Goodness of Fit 2.03 (0.85)
California Other USDifficult Devt. Areas (DDAs)
Qualif ied Census Tracts (QCTs) Other Difficult Devt.
Areas (DDAs)Qualif ied Census
Tracts (QCTs) Other
New Construction 2.52 (2.1%) 15.17 (12.6%) 49.66 (41.3%) 23.71 (2.2%) 117.85 (10.8%) 494.93 (45.5%)Rehab/Existing/Mixed .95 (0.8%) 16.76 (13.9%) 35.17 (29.3%) 14.40 (1.3%) 159.36 (14.6%) 277.54 (25.5%)Chi-Square Independence (CA) 1.55 (0.46)Chi-Square Independence (Other US) 39.27 (0.00)Chi-Square Goodness of Fit 2.08 (0.84)Source: US HUD LIHTC Database. Calculations by authors.Notes: In-region percentages and chi-square p-values shown in parentheses.Totals exclude LIHTC DDA projects located in QCTs; such projects represent just 0.5% of all LIHTC projects, 1990-2005.
All LIHTC Units
Income-Restricted Units Only

26
Table 7
New and Rehab Construction, By Metro Location:California vs. Elsewhere in US
(Thousands of LIHTC Units, 1990-2005 [Total and Low-Income Only])California Other US
Central City Suburb Rural Central City Suburb RuralNew Construction 32.23 (25.2%) 39.46 (30.8%) 3.59 (2.8%) 262.77 (23.4%) 268.38 (23.9%) 118.27 (10.5%)Rehab/Existing/Mixed 30.68 (24.0%) 20.77 (16.2%) 1.20 (0.9%) 290.09 (25.8%) 129.98 (11.6%) 55.27 (4.9%)Chi-Square Independence (CA) 3.13 (0.21)Chi-Square Independence (Other US) 46.47 (0.00)Chi-Square Goodness of Fit 19.45 (0.00)
California Other USCentral City Suburb Rural Central City Suburb Rural
New Construction 28.49 (24.2%) 34.59 (29.4%) 3.53 (3.0%) 230.80 (22.6%) 246.97 (24.2%) 112.69 (11.0%)Rehab/Existing/Mixed 29.73 (25.3%) 20.09 (17.1%) 1.18 (1.0%) 264.18 (25.8%) 115.10 (11.3%) 52.36 (5.1%)Chi-Square Independence (CA) 3.03 (0.22)Chi-Square Independence (Other US) 48.83 (0.00)Chi-Square Goodness of Fit 17.77 (0.00)Source: US HUD LIHTC Database. Calculations by authors.Notes: In-region percentages and chi-square p-values shown in parentheses.
All LIHTC Units
Income-Restricted Units Only

27
Table 8
Percent Rehab Construction (Units)State Rankings for LIHTC Allocations, All Projects & By Project Feature
1990-2005Firm Type Credits Unit Size Tract Place
Nonprofit For Profit 4% 9% SROs & 1BRs 2BRs Family DDAs & QCTs Suburban Center City Rural1 DC (95.1%) DC (100.0%) DC (89.8%) NC (100.0%) DC (100.0%) RI (93.1%) DC (90.7%) WY (95.5%) PR (100.0%) RI (89.4%) WY (100.0%) PR (100.0%)2 RI (88.8%) RI (94.6%) RI (84.5%) CT (99.7%) RI (76.7%) DC (91.9%) RI (82.3%) DC (86.8%) RI (95.9%) MD (60.0%) RI (96.5%) MA (92.3%)3 WY (86.8%) CT (82.8%) MA (74.2%) DC (92.9%) MA (55.1%) W Y (83.8%) WY (78.4%) RI (80.9%) DC (93.8%) DE (57.5%) DC (95.0%) WY (91.6%)4 MA (75.3%) MA (77.0%) CT (67.1%) RI (89.6%) CT (55.0%) CT (75.6%) MA (75.3%) CT (77.9%) ND (91.1%) IL (52.5%) CT (84.8%) CT (80.5%)5 CT (70.9%) NH (73.6%) ME (64.3%) IL (89.3%) NY (54.7%) OH (75.5%) CT (73.9%) MA (76.6%) KS (88.4%) W A (49.5%) MA (83.0%) VT (75.1%)6 MD (61.6%) UT (72.6%) OK (60.0%) HI (88.1%) PA (48.9%) MA (73.8%) ME (67.1%) VT (71.4%) WI (85.1%) MA (49.4%) DE (80.2%) NH (62.1%)7 OK (61.2%) VT (66.9%) OH (56.1%) MO (78.9%) NH (47.0%) MN (63.5%) NH (59.1%) MD (58.8%) CT (82.4%) KS (48.3%) OK (79.5%) ME (62.1%)8 NH (56.9%) MT (60.8%) MD (54.9%) MA (76.1%) VT (44.5%) ND (62.7%) OK (58.0%) ME (58.7%) MA (80.5%) OK (48.2%) ME (73.2%) KY (55.9%)9 IL (56.4%) GA (60.3%) MO (54.6%) ND (75.3%) OK (38.2%) IN (60.5%) HI (55.7%) NY (55.7%) MD (79.5%) NH (47.0%) MD (72.8%) OK (55.6%)10 ME (55.8%) NY (60.3%) IL (53.7%) OK (72.1%) NJ (35.3%) DE (58.4%) MD (55.1%) OK (49.2%) OK (75.3%) KY (46.4%) MO (70.2%) MD (53.1%)11 VT (53.9%) MI (59.2%) PA (52.7%) OH (67.9%) IL (34.8%) NH (58.4%) LA (53.8%) IL (47.7%) VA (75.1%) OH (45.5%) NJ (69.1%) AR (50.9%)12 KY (53.3%) MS (58.1%) AK (52.2%) MD (62.7%) ME (34.1%) TX (56.9%) IL (52.7%) DE (46.6%) IL (73.5%) LA (45.1%) VA (69.0%) IN (47.9%)13 OH (52.1%) MO (56.9%) NJ (51.4%) IA (61.7%) MD (31.5%) LA (56.8%) MS (52.0%) HI (44.9%) NY (73.3%) ME (43.8%) PA (63.5%) LA (45.9%)14 PA (51.4%) IA (55.9%) DE (50.8%) DE (61.4%) GA (30.8%) MO (56.4%) VT (51.6%) MO (43.8%) OH (73.0%) PA (42.7%) LA (61.8%) AK (43.9%)15 LA (51.3%) IL (54.8%) VA (50.8%) TN (59.4%) KY (29.8%) IL (56.1%) TX (50.6%) PR (43.4%) VT (67.7%) MO (41.8%) OH (61.4%) NV (43.8%)16 NY (51.2%) AR (54.6%) LA (50.6%) SC (59.3%) MO (27.7%) KS (55.5%) NY (50.3%) NH (40.1%) NJ (65.3%) UT (41.7%) IL (60.8%) VA (43.8%)17 DE (51.1%) DE (53.3%) AR (47.6%) AL (59.1%) KS (26.2%) VT (52.6%) PA (50.3%) OH (39.7%) MO (65.2%) MN (40.9%) GA (59.7%) MS (37.6%)18 IN (51.0%) LA (52.0%) NH (46.8%) VA (54.8%) NV (26.2%) UT (52.2%) CA (48.8%) VA (39.2%) ME (64.7%) CT (40.6%) W I (59.0%) NY (37.6%)19 MO (50.5%) MN (50.9%) HI (46.7%) NH (54.7%) W A (25.6%) TN (50.9%) MO (47.9%) WI (38.8%) PA (62.8%) NY (39.6%) NH (58.3%) RI (37.3%)20 VA (48.9%) PA (49.0%) NY (46.6%) AK (54.5%) TX (24.8%) GA (50.3%) OH (47.8%) PA (37.6%) IA (62.0%) AR (39.4%) NY (57.6%) MI (36.5%)21 AR (48.2%) OH (46.3%) IN (42.4%) MN (54.0%) AK (23.0%) W A (50.2%) DE (47.4%) LA (37.3%) NH (58.8%) NJ (37.4%) IN (57.2%) TX (35.8%)22 NJ (46.4%) CA (46.0%) WY (41.1%) WI (53.1%) MS (21.5%) VI (49.7%) IN (46.3%) IN (34.9%) MI (56.4%) WI (37.0%) KY (54.1%) MT (33.5%)23 WI (44.1%) IN (45.9%) MN (40.6%) IN (53.0%) NE (21.3%) VA (49.2%) VA (44.6%) KS (34.3%) IN (54.8%) GA (36.7%) TN (52.5%) IA (33.5%)24 CA (41.6%) W A (44.0%) CA (40.6%) ME (52.8%) DE (21.0%) PA (47.8%) WI (42.7%) NV (30.8%) NE (54.2%) W V (36.7%) MN (52.2%) PA (33.2%)25 KS (41.4%) TX (43.9%) KS (40.0%) LA (51.7%) CA (20.8%) KY (46.9%) SC (42.3%) NJ (30.7%) HI (54.2%) TX (35.4%) MS (50.5%) WV (32.9%)26 MN (41.3%) MD (43.7%) NV (40.0%) NJ (47.7%) LA (20.6%) MI (46.7%) NJ (42.0%) GA (29.9%) KY (53.7%) IN (35.2%) SC (49.9%) OH (31.4%)
Source: US HUD LIHTC Database. Calculations by authors.Notes: Percent rehab construction in parentheses; California rankings and percents in bold. (table continues on next page)Rankings omit projects located with addresses qualifying as both Difficult Development Areas (DDAs) and Qualified Census Tracts (QCTs).
Ranks All Rehab
28
Percent Rehab Construction (Units)State Rankings for LIHTC Allocations, All Projects & By Project Feature
1990-2005Firm Type Credits Unit Size Tract Place
Nonprofit For Profit 4% 9% SROs & 1BRs 2BRs Family DDAs & QCTs Suburban Center City Rural27 TX (41.1%) OK (43.1%) WA (39.1%) CA (47.0%) OH (20.0%) OK (46.4%) WA (41.8%) NM (29.2%) GA (53.0%) IA (34.6%) VT (49.3%) IL (30.9%)28 WA (40.9%) W I (42.9%) SC (38.7%) WA (45.5%) TN (17.7%) AR (44.8%) KY (41.3%) AK (28.8%) NC (50.8%) CA (34.5%) AR (49.2%) OR (30.5%)29 HI (40.4%) VA (41.7%) TX (36.3%) NM (45.4%) OR (17.4%) AK (44.8%) NV (40.7%) SC (27.7%) LA (50.8%) VA (34.4%) KS (49.0%) WI (30.2%)30 GA (40.0%) ME (40.4%) IA (34.4%) KS (44.6%) VA (17.1%) MD (43.9%) TN (38.3%) AL (26.1%) MN (50.3%) PR (33.5%) CA (48.8%) ND (29.7%)31 IA (39.4%) KS (39.1%) AL (33.9%) SD (44.1%) HI (13.8%) NJ (43.0%) MN (36.6%) MN (24.8%) NM (49.5%) SC (33.4%) UT (48.7%) HI (29.6%)32 UT (39.3%) NJ (37.2%) VI (33.8%) GA (43.3%) SC (13.6%) ME (42.0%) GA (35.8%) CA (23.3%) CA (49.1%) NV (28.6%) HI (47.6%) MN (28.8%)33 AK (36.0%) KY (36.0%) UT (33.5%) MT (43.2%) MT (13.3%) CA (41.8%) KS (35.2%) MI (22.8%) DE (45.1%) MI (27.9%) IA (47.3%) SC (26.3%)34 MS (35.9%) ND (34.7%) WI (32.5%) VT (42.9%) IN (13.2%) MT (40.0%) UT (33.5%) MS (22.2%) NV (44.7%) CO (24.0%) AL (46.8%) MO (25.3%)35 SC (35.2%) NM (34.4%) MI (32.2%) VI (42.2%) CO (12.2%) W I (38.6%) WV (32.7%) TX (21.6%) AL (43.5%) VT (22.1%) TX (44.0%) CA (25.0%)36 MI (35.1%) SD (33.3%) WV (32.0%) AR (41.8%) PR (12.1%) NM (38.2%) NC (30.7%) NE (21.3%) TN (42.0%) HI (22.1%) MI (43.9%) KS (24.4%)37 PR (33.7%) NE (29.8%) NM (31.9%) WV (41.8%) MI (11.4%) W V (38.1%) OR (30.7%) KY (21.1%) SD (41.9%) OR (21.0%) WA (41.6%) UT (23.5%)38 TN (33.4%) PR (28.6%) PR (31.3%) NV (40.5%) AL (10.4%) MS (37.2%) AL (29.9%) SD (20.0%) W A (41.6%) NC (19.4%) NM (40.9%) NM (21.3%)39 NM (32.2%) AZ (28.4%) KY (30.6%) NY (40.4%) MN (10.3%) CO (37.1%) MI (29.2%) WA (19.6%) UT (39.4%) AL (17.6%) AK (40.6%) WA (21.1%)40 NV (31.8%) CO (28.3%) OR (30.4%) MS (39.5%) W I (10.0%) SD (36.2%) PR (27.6%) NC (19.1%) SC (39.3%) MS (17.6%) NC (35.5%) NC (19.9%)41 AL (31.0%) NC (26.5%) GA (29.5%) KY (39.1%) ND (9.5%) NY (35.3%) NM (27.2%) OR (18.3%) W V (35.4%) TN (17.2%) NV (34.3%) GA (19.7%)42 WV (30.6%) OR (22.8%) TN (29.5%) WY (36.4%) AZ (9.0%) SC (33.1%) AR (26.3%) CO (16.3%) TX (33.7%) NE (17.1%) NE (33.5%) DE (19.6%)43 OR (27.1%) W V (22.7%) MS (27.5%) UT (36.4%) FL (7.6%) HI (32.6%) NE (21.1%) IA (15.6%) MT (32.0%) NM (15.4%) OR (31.9%) AL (18.3%)44 NC (25.8%) SC (22.2%) NC (25.6%) OR (35.6%) WV (4.5%) AZ (31.3%) SD (19.9%) WV (15.0%) CO (31.9%) AZ (9.3%) WV (31.5%) SD (17.0%)45 MT (25.6%) HI (19.8%) CO (24.6%) AZ (30.5%) NM (4.3%) OR (31.0%) MT (19.8%) AR (14.3%) VI (28.9%) SD (6.1%) AZ (31.2%) CO (16.9%)46 NE (25.3%) TN (16.1%) ND (23.0%) CO (30.0%) AR (3.3%) NE (29.9%) AZ (19.8%) MT (14.0%) OR (26.9%) FL (6.0%) PR (30.4%) NE (14.3%)47 ND (25.3%) AL (16.1%) SD (21.9%) MI (29.0%) IA (2.9%) PR (28.6%) CO (19.2%) TN (10.8%) AK (26.4%) ID (0.0%) CO (28.4%) TN (8.9%)48 VI (25.1%) FL (15.4%) AZ (18.4%) PA (25.2%) ID (2.5%) NV (28.5%) AK (18.1%) AZ (10.1%) AR (25.0%) MT (0.0%) SD (25.8%) FL (4.0%)49 CO (25.0%) AK (11.6%) NE (17.6%) TX (19.2%) SD (1.1%) AL (28.0%) IA (15.3%) ND (8.9%) MS (24.2%) ND (0.0%) ND (20.3%) AZ (3.2%)50 SD (20.5%) NV (4.9%) VT (16.6%) NE (10.6%) UT (0.0%) IA (23.2%) VI (14.8%) FL (3.6%) AZ (23.2%) WY (0.0%) FL (17.3%) ID (2.4%)51 AZ (20.0%) ID (0.0%) MT (11.0%) FL (7.1%) NC (0.0%) NC (23.1%) ND (10.7%) ID (2.6%) FL (14.4%) AK (0.0%) MT (16.9%) DC (0.0%)52 FL (9.5%) VI (0.0%) FL (9.1%) ID (6.3%) VI (0.0%) FL (11.1%) FL (6.8%) UT (2.4%) ID (6.0%) DC (0.0%) ID (6.6%) NJ (0.0%)53 ID (5.6%) W Y (0.0%) ID (5.5%) PR (4.8%) WY (0.0%) ID (7.1%) ID (2.7%) VI (0.0%) WY (0.0%) VI (0.0%) VI (0.0%) VI (0.0%)
Source: US HUD LIHTC Database. Calculations by authors.Notes: Percent rehab construction in parentheses; California rankings and percents in bold.Rankings omit projects located with addresses qualifying as both Difficult Development Areas (DDAs) and Qualified Census Tracts (QCTs).
Ranks All Rehab

29
Table 9
Correlations of Selected Project CharacteristicsAmong LIHTC-Allocating States and Territories, 1990-2005
(n=53; proportions based on # of units)%central
city%
suburban%rural %DDA
&QCT%SRO&1BR
%2BR %family %4pct credit
%9pct credit
%both 4pct&9pct
%nonprofit
%rehab
total units f inanced
%central city 1.00%suburban -0.23 1.00%rural -0.32* -0.43** 1.00%DDA&QCT 0.21 -0.19 -0.31* 1.00%SRO&1BR -0.10 0.10 -0.09 0.38** 1.00%2BR -0.31* -0.01 0.25 -0.19 0.03 1.00%family -0.34* -0.07 0.22 -0.42** -0.12 0.47** 1.00%4pct credit 0.02 0.19 -0.35** 0.44** 0.08 0.15 -0.04 1.00%9pct credit -0.02 -0.01 0.21 -0.05 0.18 0.07 -0.03 -0.29* 1.00%both 4pct&9pct 0.00 -0.18 0.12 -0.33* -0.22 -0.18 0.06 -0.59** -0.60** 1.00
%nonprofit -0.13 -0.06 0.15 0.42** 0.55** -0.16 -0.17 -0.02 0.24 -0.18 1.00%rehab 0.36** -0.03 -0.21 0.35* 0.14 -0.32* -0.34* -0.02 -0.55** 0.48** 0.07 1.00total units financed 0.25 0.43** -0.45** -0.07 -0.22 -0.20 -0.14 0.15 -0.16 0.01 -0.22 -0.08 1.00
**Correlation is s ignificant at the 0.01 level; * correlation is significant at the 0.05 level (2-tailed).NOTES: "Family"-size units have more than two bedrooms."Rehab" includes projects which are all rehab, mixed new and rehab, and existing construction.
G. Explaining ProportionRehab Construction Across States
California’s patterns of tax‐credit allocation toward rehab, and its national rankings, thus appear rather normal relative to other places. This may mean that the determinants of the LIHTC share devoted to rehab nationally are useful in explaining the patterns we observe in the Golden State. Indeed, they may be those factors which are most useful, given how unexceptional California appears to be concerning the new vs. rehab divide.
We might begin a national exploration of these features by exploring state‐level correlations and identifying significant relationships among various LIHTC‐project features. One advantage to this approach is simply the law of large numbers; state‐level variation in programmatic features and allocative priorities may influence patterns less than do the federal tax code and regulatory realities to which all local efforts are exposed.
Table 9 is a correlation matrix showing interactions among the overall allocation patterns in the fifty‐three states and territories tracked in HUD’s LIHTC database. Aside from the proportion of units in rehab construction, included are the percentage of a state’s units in the central city, rural areas, and incentive‐qualifying tracts; in various unit‐size categories; in four‐percent and combined four‐and‐nine‐percent award groups; in nonprofit development; and total numbers of units financed (a combination of population and intensity of development activity).
A number of interesting interactions emerge, at statistically significant levels of association. As expected, proportion rehab is strongly negatively correlated with proportion 9%‐credit‐only projects and quite positively associated with mixed‐credit ones. In addition, rehab construction is negatively correlated with both two‐bedroom units and larger ones. Not surprisingly, rehab construction is concentrated in downtown development and in projects placed in tracts identified as DDAs or QCTs. A number of other correlations shown in the matrix are confirmatory in nature; fewer larger units (with two bedrooms or more) are built in the central city; DDA and QCT projects are less frequently rural but often involve small units (efficiencies and one‐bedrooms) in 4%‐only projects undertaken by nonprofit firms. Non‐profit development is strongly associated with small‐unit projects. The larger quantity of tax‐credit development a state undertakes, the more suburban its activities tend to be and the less rural.
Table 10 places these characteristics into context nationally and for California, with descriptive statistics. Despite its normative tendencies in proportion‐rehab within these various categories, the table makes clear that California’s overall LIHTC activities, with respect to national mean: are more suburban‐ and downtown‐focused, less rural; are more dependent on 4% and combined credit transactions; less frequently involve nonprofit firms; and feature almost exactly the national average of rehab units as a proportion of all tax‐credit construction.

31
Regression analysis utilizing backward‐entry model‐selection generated the following relatively simple equation for predicting proportion rehab construction for states in the LIHTC program from 1990 through 2005:
0.13 0.144 0.726 0.149 0.169 ,
where R is the share of a state’s LIHTC units which are rehab, new and rehab mixed, or existing construction; D is the proportion of such units located in DDAs or QCTs, combined; CR is the share of central‐city development in the rehab category; Cr9 is the percentage of projects financed via nine‐percent credits alone; and S is the fraction of units located in suburban areas. The equation is a particularly tight fit to the data; single‐starred coefficients above are significant at the 95% confidence level, double‐starred at the 99% level, and the R2 statistic for the model is 0.91. California’s proportion rehab units overall in the data is 0.416. The model based on national tax‐credit practice would predict California’s rehab share almost exactly (0.402), providing yet another indication that California parallels, or sets, national rehab trends, rather than bucking them.
Descriptive Statistics, Selected Project CharacteristicsAmong LIHTC-Allocating States and Territories, 1990-2005
(n=53; proportions based on # of units)Min Max Mean Std.Dev. CA
%suburban 0 0.62 0.27 0.15 0.46%central city 0 0.98 0.42 0.17 0.48%rural 0 0.56 0.20 0.14 0.04%dda&qct 0 0.87 0.30 0.18 0.28%sro&1br 0.07 0.65 0.29 0.10 0.27%2br 0.13 0.49 0.36 0.09 0.28%family 0.06 0.38 0.18 0.07 0.17%4pct only 0.1 0.69 0.34 0.14 0.43%9pct only 0.04 0.79 0.45 0.14 0.31%combined credit
0 0.83 0.21 0.16 0.26
%nonprofit 0.02 0.74 0.22 0.14 0.17%rehab 0.06 0.95 0.43 0.18 0.42total units financed
541 131,695 25,149 28,222 131,695
Source: HUD LIHTC Database. Authors' Calculations
Note: Unit‐size proportions do not add to unity due to
incomplete project information.
Table 10

32
VI. New and Rehab Construction: Differences in Development Cost, Operation Cost, and Economic Impacts
Attention to the new-rehab divide in assisted-housing finance focuses naturally upon cost dimensions and regional economic impacts. One problem in such analyses, of course, centers upon the difficult in knowing the state of repair before rehab construction takes place, and the quality and durability of finished units in both categories. Good data on quality differences is scarce and expensive, rarely available at any scale near sufficient to allow national inferences between construction categories. Prior analysis of LIHTC cost data, itself lacking information in this before-after quality dimension, has generally concluded there are cost savings in rehab construction qualifying for subsidies, i.e., delivering minimal quality and duration of housing services to end-users. “[O]n average, new construction projects are more expensive per unit than rehabilitation projects” (Cummings and DiPasquale, 1999). We surmise that sustaining rehab’s cost advantages over new construction depends at minimum upon: economies of scale in value-recapture of reused components; market prices of new materials relative to those in reuse; and magnitude of such savings sufficient to absorb costs of repair and replacement in threshold rehab upgrade projects.
We present our analysis of two data sources to explore the new-rehab cost relationships for development and operation. We then turn to the results of an input-output analysis to test rehab’s effects on productivity and economic growth relative to new construction and other investments.
A. Total Development Cost: Data from Enterprise Community Partners
First, we have obtained from colleagues at Enterprise Community Partners17 information on that firm’s national investment portfolio for assisted housing covering the years 2006, 2007, and the first three quarters of 2008. Descriptive statistics characterizing these data are laid out in Table 11. The data analyzed covers about 1,400 projects in forty-six states, representing nearly 63,500 units and a total development cost of over $13.25 billion. (We are not privy to Enterprise’s precise role or level of financial participation in these projects, however; Enterprise engages in a variety of development investment and lending roles.) This data provides total development cost figures for projects identified as new and rehab construction, and this allows us to venture some comparative observations. However, the data does not provide us project-level information detailing unit size and quality, or pre-construction condition of rehab.
17 Enterprise is a national nonprofit corporation founded by urban redevelopment pioneers Jim and Patty Rouse. The firm has a quarter-century of experience in affordable housing development and serves as a leading funding provider and aggregator operating throughout the US. For more background on the firm see http://www.enterprisecommunity.org.

33
As the table shows, rehab speaks for about 44% of units in this national portfolio of housing investment. By affordability category, both new and rehab construction are divided rather evenly among extremely low-income, very low-income and low-income households. More rehab units are delivered to the poorest income cohort, and new construction’s dominant share of units overall is reflected in each of the less needy income groups. More than twice the number of units are produced in new construction, relative to the rehab share, for households earning more than 120% of area median income and for recipients of affordable homes destined for ownership tenure. The great bulk of the Enterprise portfolio remains in the rental category, however.
The cost data Enterprise provided is summarized in Table 12.
Our strategy is to identify shares of housing expenditure, by state and for the entire nation, between new and rehab construction. The table provides for each geography in the Enterprise portfolio for the years in question the following information: total units in funded projects, total development cost, average cost per unit for new and rehab construction, the rehab:new ratio for unit volume and average cost, the observed difference in average-cost means, the pooled standard deviation among construction categories, and the results of a two-tailed t-test of cost differences.
As mentioned above, it is not possible with this data (nor any other large-scale dataset readily available to us) to capture with any precision key factors regarding preconstruction condition
and post-project upgrade quality-levels for rehab buildings. That being said, however, we are able to utilize national portfolio measures at a scale of aggregation appropriate to the task. Particularly in states such as Connecticut and Minnesota, which speak for relatively small shares of Enterprise’s 2006-2008 activities measured by units and total development costs, it would be particularly difficult to reach comfortable conclusions about costs. This would be decidedly less
Frequency of Income-Restruction Categoriesand Tenure Targeting, By Construction Type
Investment Portfolio of Enterprise Community Partners, 2006-2008Affordability Category
(Share of Area Median Income)Tenure
≤ 30%31%-50%
51%-80%
81%-120%
≥ 121 % Rental Owner
New Construction (56%) 14.2% 18.0% 16.7% 3.1% 2.3% 47.0% 7.5%
Rehab (44%) 15.6% 15.1% 13.3% 1.1% 0.7% 42.2% 3.3%Source: Enterprise Community Partners. Authors' calculations.
Construction Type(percent of units)
Table 11
34
the case in higher-volume Enterprise states like New York and Maryland, and we are guardedly confident that measures across the entirety of the portfolio have some real meaning regarding relative cost advantages and disadvantages. In this respect, it is important to recognize that California places second in terms of units in development and third in terms of total development cost in the Enterprise data we analyzed.
On this basis we can conclude the cost advantages of rehab are substantial throughout the nation as a whole and in California. Mean cost difference for the nation is over $123,000; in California it is nearly $135,000. In both the difference is statistically significant at the 95% confidence level, as it is in nearly every state represented in the portfolio data. Only four places have per-unit rehab-cost savings greater than in California (MD, MN, MO, and NC). Slightly less than one in three California units Enterprise financed over this period involved rehab, and this proportion is significantly lower than the average for the national over all (approaching 44%).18 In only three places (NJ, VA and VT) does the cost difference have a different sign (indicating that new construction is cheaper, and only slightly so in those cases). Only in Virginia is new construction’s cost advantage statistically significant, however.
18 In a number of the states where it does business, Enterprise-funded rehab units outnumber those newly constructed by more than two to one (DC, GA, MI, TX, and VA).

35
Per Unit Development Cost: New vs. RehabInvestment Portfolio of Enterprise Community Partners, 2006-2008
Average CostPer Unit ($)
RatioRehab:New
Results
New Rehab UnitsAvg.Cost
Student's t
p-value
AL 764 99.89 160,038 111,395 1.51 0.70 48,643 2,057 23.644 0.000CA 6,523 1,911.82 335,935 201,308 0.47 0.60 134,627 2,676 50.314 0.000CO 2,686 436.23 185,957 103,488 0.40 0.56 82,469 11,744 7.022 0.000CT 265 54.11 283,823 161,863 1.88 0.57 121,959 14,351 8.498 0.000DC 3,552 701.58 240,947 184,625 3.37 0.77 56,322 3,490 16.140 0.000FL 488 144.48 306,048 257,292 0.26 0.84 48,756 10,688 4.562 0.000GA 3,632 265.29 179,137 61,440 9.15 0.34 117,697 2,200 53.491 0.000IL 1,325 191.84 150,215 128,944 0.34 0.86 21,270 2,456 8.662 0.000LA 2,696 454.01 202,643 120,726 0.72 0.60 81,917 1,828 44.817 0.000MD 5,186 2,253.84 543,861 126,612 0.35 0.23 417,249 33,471 12.466 0.000MI 721 77.15 184,594 93,632 5.80 0.51 90,962 2,502 36.352 0.000MN 497 64.02 224,797 80,233 1.98 0.36 144,565 2,766 52.255 0.000MO 1,171 408.81 371,524 230,434 0.19 0.62 141,090 9,622 14.663 0.000NC 1,133 256.42 295,138 107,252 0.58 0.36 187,885 10,087 18.627 0.000NJ 669 160.24 237,040 242,151 0.94 1.02 -5,111 5,240 -0.975 0.330NY 13,852 3,069.32 248,297 188,672 0.81 0.76 59,626 2,005 29.740 0.000OH 3,523 494.27 153,530 119,403 0.63 0.78 34,127 1,681 20.300 0.000OR 1,853 310.45 186,156 109,835 0.32 0.59 76,322 2,862 26.668 0.000PA 698 150.53 215,735 215,232 0.20 1.00 502 5,918 0.085 0.932SC 577 53.56 122,079 74,395 1.59 0.61 47,684 1,942 24.550 0.000SD 159 20.91 139,983 125,684 1.45 0.90 14,299 5,682 2.517 0.013TX 3,394 240.15 95,827 59,168 2.16 0.62 36,659 2,385 15.373 0.000VA 946 122.60 119,697 131,954 4.20 1.10 -12,256 5,244 -2.337 0.020VT 269 40.63 145,061 162,915 0.50 1.12 -17,855 10,674 -1.673 0.096WA 2,153 435.88 222,036 133,264 0.28 0.60 88,771 3,555 24.973 0.000WI 294 40.02 144,074 113,671 0.35 0.79 30,403 7,320 4.153 0.000Total 63,493 13,236.93 262,258 138,723 0.77 0.53 123,535.07 1,725 71.610 0.000Source: Enterprise Community Partners. Authors' calculations.Notes: National totals include states not shown; table includes only those states having sufficient Enterpriseinvestment in both new and rehab construction to allow meaningful comparison. Total development costs includesall financial sources, not just Enterprise's contribution. National difference of means test conducted at the projectlevel, counting as rehab any project not composed entirely of new construction.
Total Devt. Cost
($Millions)State
Total Units
Pooled St.Dev.(vars. ≠)
Diff. of Means ($)
Table 12

36
B. Operating Cost Analysis: LISC-NEF California Portfolio, 1992-2008
Another question is whether, after construction is complete, income-restricted units in new buildings are less expensive to operate than those which have undergone rehab. As depicted in the Schaaf financial model discussed above, one might expect that rehab work essentially postpones the needed replacement of vital components, ones which start in better condition when the entire building is new construction. If this is the case, one would expect to see a systematic difference in operating costs, particularly those expended upon maintenance and repairs.
We are able to analyze this question in California specifically. We obtained annual operating cost data for income-restricted projects currently held in the portfolio of the National Equity Fund (NEF), the tax credit syndicator established by the Local Initiatives Support Corporation (LISC) a generation ago. Operating costs are broken down by category, including administrative, payroll, utilities, maintenance and repair, marketing and leasing, tax, and insurance. The dataset provides useful geographic and service-population coverage of multifamily development in both new construction and rehab in urban, suburban and rural locations throughout the state. It includes about 200 buildings and totals over 10,400 units, placed in service after construction from 1992 through 2008. The net equity participation for LISC/NEF in this portfolio of business reaches about $725 million.
As shown in Table 13, the LISC-NEF portfolio helps deliver a comprehensive illustration of assisted housing operations throughout California, by construction type, location, population served, and scale. Of course, there could be funder-specific phenomena and other selection features we may wish to consider, but this would require substantial project-level data collection beyond that we have accomplished to date.
Figure 2 shows the breakdowns in units between new and rehab construction in the LISC-NEF projects, for the entire portfolio and for the categories broken out in the figure. A little less than one-third of all the units LISC-NEF finances are rehab, but this proportion varies greatly by
LISC-NEF CA Portfolio (Units)By Region, Density, Population Served,
and Project ScaleNew Rehab
All Projects 71.1% 28.9%Bay Area 24.1% 9.9%Coast 5.5% 1.4%Inland 16.7% 4.6%Los Angeles 13.3% 10.0%San Diego 11.5% 2.9%Rural 15.9% 1.9%Suburban 23.7% 3.2%Urban 31.5% 23.8%Elderly 10.4% 4.4%Family 57.4% 17.0%SRO 3.4% 7.5%< 20 3.2% 1.5%20 to 50 22.9% 5.7%51 to 80 18.1% 8.5%> 80 26.9% 13.2%
Source: Local Initiatives Support Corporation(LISC) and National Equity Fund (NEF).Authors' calculations. Cells in row categoriessum to unity.
Building Size (Units)
Region
Urban Density
Population Served
Table 13

37
region within the state and by the level of area urban density. Bay Area rehab activities for these projects follows statewide trends; in Los Angeles nearly half of all units developed are in rehab buildings, while in San Diego and other coastal counties rehab accounts for less than one in four units. The great bulk of the LISC-NEF rehab activity occurs in downtown areas, not surprisingly. Statewide rehab proportions increase in close connection with the economies of scale available in larger structures.
Table 14 provides detail on the operating cost breakdowns for the LISC-NEF projects, allowing analysis of total costs and individual subcategories. This data on operating costs supplements the development-cost picture we have drawn earlier using the Enterprise portfolio. Project-wide differences by type of construction of course depend on some combination of what it costs to build the unit and the budget for carrying the building on one’s books for the duration of the affordability terms applied.19
The clear development-cost advantages of rehab relative to new construction, showing at the national and state levels in the Enterprise data, do not carry over very well to the operations side of the ledger. In California at least, operating costs per unit for rehab are slightly but significantly higher. The mean operating cost for rehab units in the LISC-NEF portfolio is $5,722, about 1% higher than units placed in service after new construction. Just as one might expect, general administrative costs do not vary significantly by type of construction. Interestingly enough, the difference does not appear to be driven by higher maintenance and repair expenditures. In fact, the rehab buildings in this California portfolio perform substantially
19 Differential operating costs alone do not fairly depict the true financial picture for management of these assets. Sufficiency of rental revenues matters. Neither the Enterprise nor the LISC-NEF portfolio data permits us to estimate the extent to which rental revenues cover costs, and it is quite possible that rents vary systematically by type of construction.
Per-Unit Operating Cost: New vs. RehabInvestment Portfolio of LISC-NEF, 2006-2008 (California Only)
Annual Op. CostPer Unit ($)
RatioRehab:New
Results
New Rehab UnitsAvg.Cost
Student's t
p-value
All Operating Costs 10,432 5,652.18 5,722.10 0.41 1.01 -69.92 32.09 -2.179 0.029General & Admin. 1,288.70 1,284.48 1.00 4.22 12.34 0.342 0.732Payroll & Related 1,560.94 1,614.30 1.03 -53.36 17.01 -3.137 0.002Utilities 899.08 847.97 0.94 51.11 8.17 6.253 0.000Maint. & Repair 1,430.64 1,277.32 0.89 153.32 15.63 9.810 0.000Taxes 251.88 269.25 1.07 -17.37 6.79 -2.557 0.011Insurance per Unit 393.30 479.24 1.22 -85.94 5.68 -15.133 0.000Source: Local Initiatives Support Corporation & National Equity Fund. Authors' calculations.
Total Units
Diff. of Means ($)
[Rehab Savings]
Pooled St.Dev.(vars. ≠)
Operating Costs
Table 14

38
better from a maintenance standpoint then do newly constructed units. Instead, the most substantial operating‐cost disadvantages for California rehab appear in expenses relating to insurance, tax, and payroll.
Figure 2
Region
Bay Area35%
Coast7%
Inland21%
Los Angeles23%
San Diego14%
Metro - RuralRural18%
Suburban27%
Urban55%
Population Served
Elderly15%
Family74%
SRO11%
Building Size < 205%
20 to 5029%
51 to 8027%
> 8039%
New-Rehab
New71%
Rehab29%

39
C. Effects on California Employment, Income, and State Output: Regional Economic Impacts of New Construction, Rehab, and Other Activities
Much has been made in debate over the economic stimulus package, pursued during the early days of the Obama Administration, regarding the job‐generation and other economic impacts of residential rehabilitation, particularly in the “green” category. But little has been done to systematically compare the employment and other economic effects of rehab with those of residential new construction and other forms of regional investment. The popular literature on the subject often claims, based upon anecdotal evidence, that rehabilitation is a more potent employment generator and economic catalyst. Yet, new construction also has its own chorus extolling its economic virtues. Still other construction endeavors have their own economic proponents. For instance, the highway lobby traditionally has claimed that building roads is a potent economic primer of the pump. Indeed, as the United States economy has entered the current severe downturn, there are calls from many quarters to spend massive amounts on such infrastructure as road building in order to revitalize the economy. Input‐output (I‐O) models can be brought to bear to project relative impacts of various kinds of government spending, and it is in that context we wish to examine the suggested benefits of rehab construction in comparative terms.
Here we consider the relative economic benefits of five activities. Three are in the construction category: residential rehabilitation, residential new construction, and highway investment. We also include in the analysis two prominent features of California’s economy in other sectors: (a) computer and data processing, and (b) wine production. In considering the relative economic contributions of these five activities (three in construction, one in services, and one in agriculture), the most comprehensive assessment would tally the total economic impacts, encompassing both the immediate and multiplier effects. We will parse “direct,” “indirect,” and “induced” impacts of added dollars of activity by sector.
The direct‐impact component consists of labor and material purchases made specifically for the activity being considered. The multiplier effects incorporate what are referred to as indirect and induced economic consequences. The indirect‐impact component consists of spending on goods and services by industries that produce the items purchased for the activity. The induced impact component focuses on the expenditures made by the households of workers involved either directly or indirectly with the activity. To illustrate, lumber purchased at a hardware store for rehabilitation is a direct impact. The purchases of the mill that produced the lumber are an indirect impact. The household expenditures of the workers at both the mill and the hardware store are induced impacts.
This section specifies the total economic effects of the five California activities described. The I‐O model
utilized is one developed by the Center for Urban Policy Research at Rutgers University and termed the
“Preservation Economic Impact Model” (PEIM). In the current analysis in California, the PEIM quantifies
the following:
• Jobs consists of employment, both part‐ and full‐time, by place of work, estimated
using the typical job characteristics of each industry.
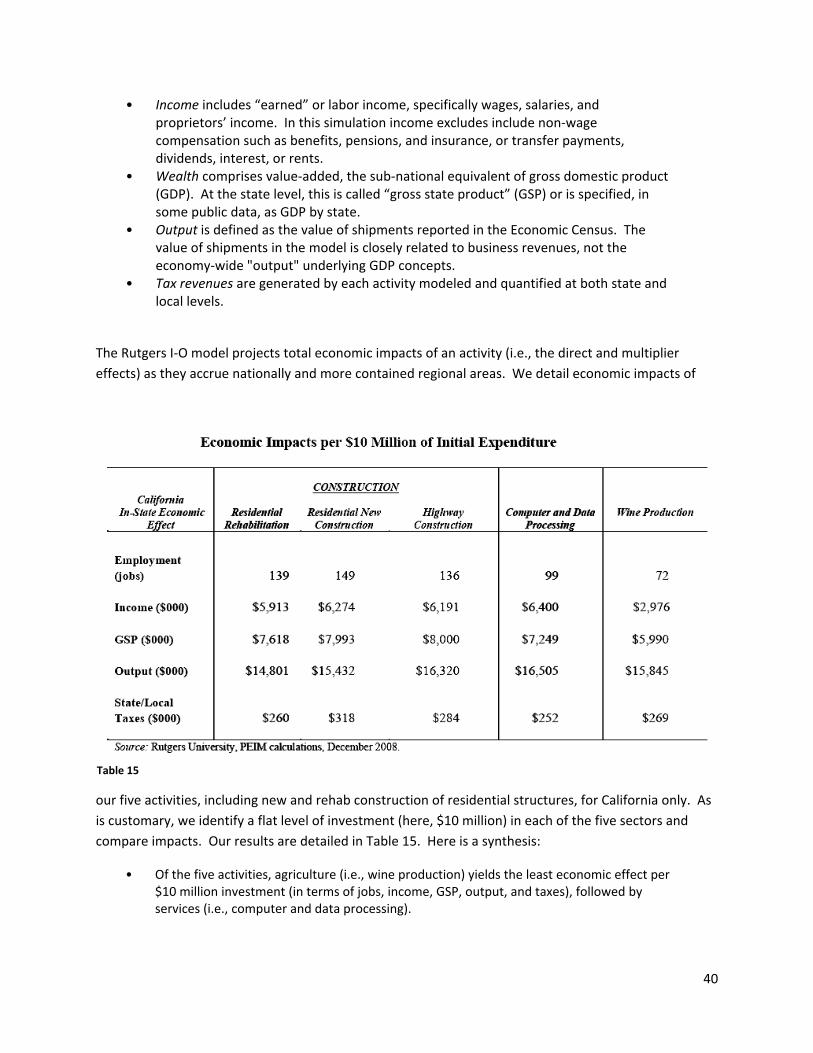
40
• Income includes “earned” or labor income, specifically wages, salaries, and proprietors’ income. In this simulation income excludes include non‐wage compensation such as benefits, pensions, and insurance, or transfer payments, dividends, interest, or rents.
• Wealth comprises value‐added, the sub‐national equivalent of gross domestic product (GDP). At the state level, this is called “gross state product” (GSP) or is specified, in some public data, as GDP by state.
• Output is defined as the value of shipments reported in the Economic Census. The value of shipments in the model is closely related to business revenues, not the economy‐wide "output" underlying GDP concepts.
• Tax revenues are generated by each activity modeled and quantified at both state and local levels.
The Rutgers I‐O model projects total economic impacts of an activity (i.e., the direct and multiplier effects) as they accrue nationally and more contained regional areas. We detail economic impacts of
our five activities, including new and rehab construction of residential structures, for California only. As is customary, we identify a flat level of investment (here, $10 million) in each of the five sectors and compare impacts. Our results are detailed in Table 15. Here is a synthesis:
• Of the five activities, agriculture (i.e., wine production) yields the least economic effect per $10 million investment (in terms of jobs, income, GSP, output, and taxes), followed by services (i.e., computer and data processing).
Table 15

41
• The greatest economic impact by far is derived from the three construction activities as a group. Construction generates noticeably more jobs, income, GSP, output, and taxes for a simulated $10 million outlay compared with agriculture and services.
• Of the three construction activities studied here — residential rehabilitation, new construction, and highway construction — none particularly dominates in terms of its overall economic effects within California. While the job and other figures shown in the results differ somewhat for the three construction categories, from a statistical variance and reliability perspective (given the capacity of any I‐O model to quantify results) the output and other impacts generated of the three construction activities are practically the same.
This finding of the in‐state economic similarity across construction activities, and particularly within residential development, may very well disappoint proponents of rehabilitation versus new construction, who often assert the economic superiority of their respective endeavors. Yet there is another dimension to our finding. Housing, both new construction and rehabilitation ‐ can prime the economic pump in California as well as the more traditional remedy of infrastructure spending in the form of highway construction.
Of further note are the widespread benefits from the investments considered here. For example, as noted in the results table, a $10 million investment in residential rehabilitation generates some 139 jobs. Table 16 details the industry distribution of these jobs, as well as the other categorical impacts, for the PEIM’s specifications of historic structure rehabilitation in particular.
As one might expect, most of the jobs (in this model, some fifty‐four) are construction. However, because of the interconnectedness of the California economy and the direct and multiplier impacts we model, other areas of the California economy may also benefit. In addition to the construction jobs, twenty‐five positions would be supported in services, twenty‐two in manufacturing, and seventeen jobs in retail trade. Even agricultural services secure three jobs as a result.
The same widespread benefits are observed with respect to the other economic effects studied here—income, GSP, and output. For instance, of the $14.8 million of California output generated by the $10 million in rehabilitation activity, the construction sector secures $4.4 million of output, the manufacturing sector garners $4.1 million, followed by $2.3 million and $0.9 million in output associated with the services and retail trade sectors, respectively. Thus, not only can an investment in housing, be it new or rehabilitation, aid the California economy, but additionally this economic success is widely distributed across sectors. However, on the basis of the Rutgers I‐O model we cannot at this time strongly validate the claim that rehab has systematic advantages over new construction in this regard.
We are mindful that such I‐O models lack the received wisdom of ex post accountings of statewide employment, output, revenue, income, and the like. The devil is in the detail in economic simulation packages such as Rutgers’s PEIM model. All the same, the techniques it uses are conservative and mainstream approaches, and the assumptions underlying its multiplier effects are reasonable and useful, if only for prompting reflection and discussion on these matters.

42
Economic/Tax Impacts of $10 Million in Historic Rehab Activity for Single-Family Homes on California’s Economy Economic Component Output (000$) Employment (Jobs) Income (000$) GDP (000$)
— Initial Expenditure in Dollars: $10 Million —I. TOTAL EFFECTS (Direct and Indirect/Induced)* Private 1. Agricultu re 36.3 0 5.4 7.7 2. Agri. Serv., Forestry, & Fish 156.7 3 64.3 109.8 3. Mining 316.2 1 92.7 232.2 4. Construct ion 4,417.7 54 2,534.3 3,056.3 5. Manufacturing 4,087.0 22 957.1 1,329.7 6. Transport. & Public Utilities 937.8 6 257.5 397.6 7. Wholesale 680.3 5 276.7 290.8 8. Retail Trade 943.0 17 350.5 597.9 9. Finance, Ins., & Real Estate 826.9 5 275.7 517.0 10. Services 2,330.3 25 1,077.8 1,047.1 Private Subtotal 14,732.3 138 5,891.9 7,585.9 Public 11. Government 69.0 0 20.8 32.3 Total Effects (Private and Publ ic) 14,801.3 139 5,912.7 7,618.3 II. DISTRIBUTION OF EFFECTS/MULTIPLIER 1. Direct Effects 8,953.4 86 4,107.3 4,905.0 2. Indirect and Induced Effects 5,847.9 52 1,805.4 2,713.3 3. Total Effects 14,801.3 139 5,912.7 7,618.3 4. Mult ipliers (3 /1) 1.653 1.607 1.440 1.553 III. COMPOSITION OF GROSS STATE PRODUCT 1. Wages--Net of Taxes 5,109.5 2. Taxes 1,079.0 a. Local 116.5 b. State 143.0 c. Federal 819.5 General 185.5 Social Security 633.9 3. Profits, dividends, rents, and other 1,429.7 4. Total Gross State Product (1+2+3) 7,618.3 IV. TAX ACCOUNTS Business Household Total 1. Income --Net of Taxes 5,109.5 5,912.7 --------- 2. Taxes 1,079.0 1,216.4 2,295.4 a. Local 116.5 92.0 208.6 b. State 143.0 213.0 356.0 c. Federal 819.5 911.3 1,730.8 General 185.5 911.3 1,096.8 Social Security 633.9 0.0 633.9 EFFECTS PER MILLION DOLLARS OF INITIAL EXPENDITURE Employment (Jobs) 13.9 Income 591,270.6 State Taxes 35,602.3 Local Taxes 20,859.2 Gross State Product 761,826.9
Notes: Detai l may not sum to totals due to rounding. Direct Effec ts : Proportion of direct spending on goods and services produced in the region; Indirect Effects : Value of goods and services needed to suppor t the provision of those direct economic impacts; Induced Effects : Value of goods and services needed by households that provide the direct and indirect labor.
Table 16

43
VII. Redevelopment Finance of Rehab Activity: The Hazards of High Asset Values
California finances a substantial share of its low‐ and moderate‐income housing development through its local, community redevelopment agencies (RDAs). Utilized originally as a method for eliminating urban blight, redevelopment has evolved into a flexible source of community‐improvement funding statewide, and housing is a programmatic imperative.
In revenue terms, RDAs essentially feed themselves through their investments in upgraded property value. State law authorizes these agencies to leverage future growth in property tax and repay current borrowing with the “tax increment” new development and rehab help generate. How local RDAs spend the moneys they raise is largely determined by local prerogative, but is constrained by some general distributional guidelines.20 RDA funds are frequently used to supplement LIHTC‐project budgets.
California redevelopment law mandates that twenty percent of tax increment revenue derived from redevelopment projects be used toward low‐ and moderate‐income housing development. The set‐aside’s requirement is so strict in its focus upon serving the original project zone that, if the agency instead desires to provide housing subsidies elsewhere, the required set‐aside doubles. Aside from new construction and rehabilitation activity, the housing‐provision requirement may be satisfied in a variety of other ways, from mobile home construction and housing‐related infrastructure improvement to acquisition of properties bearing affordability covenants imposed under other federal and state subsidies.
In addition to the set‐aside, the law also imposes numerical, inclusionary requirements for residential projects RDAs fund. At least 30 percent of all units (new or rehab) must be affordable to low‐ and moderate‐income households, and half of those must be affordable to persons of very low incomes (less than 50% of area median income). In general, the watchword for redevelopment‐financed housing activity in California is flexibility. A great variety of expenditures in the sector allows RDAs to comply with the set‐aside and inclusionary requirements.
Our research did not reveal any systematic tilt in redevelopment law and regulation towards or away from rehab construction. We are persuaded that the balance in specific jurisdictions derives from essentially idiosyncratic circumstances. However, according to the data we have analyzed, there are systemic disincentives toward rehab construction in redevelopment during run‐ups in real estate value.
20 General information regarding California redevelopment practice was provided via the California Redevelopment Association (http://www.calredevelop.org/).

44
The California Department of Housing and Community Development (DHCD) collects and publishes data concerning the statewide balance between redevelopment‐financed new and rehab construction. DHCD operates a reporting system mandated by statute, under which the RDAs must provide information allowing for oversight upon the funding set‐aside and the inclusionary project‐based mandates. Omitting all expenditure categories outside new and rehab construction funded by RDAs, Figure 3 shows these trends over time from 1998 to the present, both in terms of households benefited by redevelopment investments and the yearly proportion benefited by rehab specifically.
From a high of 56% of all RDA‐funded construction‐oriented housing benefits in 2000, the share of rehab has deteriorated significantly after hovering between forty and fifty percent of redevelopment construction in the residential category overall. During fiscal year 2007 the statewide share for rehab had fallen to just 24.3% of all activity, less than half its share early in the decade.
An obvious hypothesis why this has been the case is that run‐ups in real estate value have essentially priced rehab out of the market for most efficiently providing affordability. In mixed‐income development of the type frequently undertaken by RDAs – in fact, almost necessitated from a financial standpoint by the need to generate increased property values and tax increment – the revenue generated by market prices within new projects may be just too attractive to resist, whether from a strictly fiscal perspective or in terms of subsidy efficiency. This is a very difficult hypothesis to test in practice. Ironically, however, the historic slowdown in California real estate markets during 2007‐2008 provides a natural experiment, and it will be interesting to see whether the rehab share of redevelopment construction begins trending upward over the next several years.
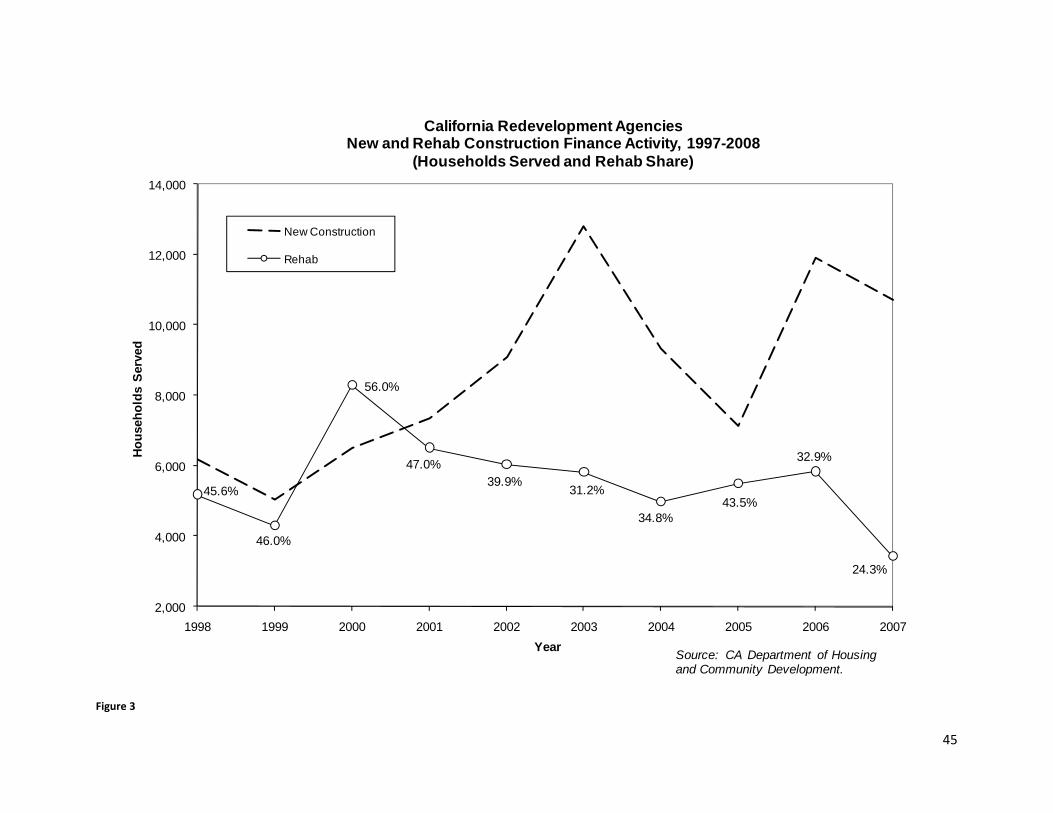
45
Figure 3
45.6%
46.0%
56.0%
47.0%39.9%
31.2%
34.8%43.5%
32.9%
24.3%
2,000
4,000
6,000
8,000
10,000
12,000
14,000
1998 1999 2000 2001 2002 2003 2004 2005 2006 2007
Hou
seho
lds
Serv
ed
Year
California Redevelopment AgenciesNew and Rehab Construction Finance Activity, 1997-2008
(Households Served and Rehab Share)
New Construction
Rehab
Source: CA Department of Housing and Community Development.

46
VIII. New Policy Directions: Improving Rehab Efforts in California
From a subsidy‐performance standpoint, our research has not identified glaring, systematic impediments to rehab, or inordinate advantages for new construction, which represent urgent challenges to California’s LMIH development system. Not every jurisdiction, or developer, agrees that more rehab is in all circumstances necessary, desirable, or cost‐effective. At the same time, the state should aim to ensure that policies are updated relative to leading rehab practice elsewhere, and on that score there are several points which should be borne in mind. Specific policy initiatives are outlined in the subsections which follow.
A general framework for analyzing regulatory impediments to rehab construction is set out in an appendix to this paper, and this rubric may well guide a more thorough review of statewide practices – state and local – than we offer here. The analysis should proceed from the fundamental understanding that rehab opportunities are, compared to new construction, (1) less standard, (2) more difficult to undertake at replicable scales of production, and (3) susceptible to drastic cost uncertainties concerning extent of necessary repair and replacement of residential building components and systems. Development, construction, and occupancy each present their own challenges to rehab, and regulatory reform and the provision of added incentives can follow a number of potentially useful strategies.
A. Construction Regulation: “Smart” Codes for Rehab
Our view is that building regulations in California, such as the state’s building code, and the administration of these regulations, are generally pose no great impediment toward rehab, relative to other jurisdictions. However, improvements in this arena should be considered if the state wishes to
Table 17

47
promote rehab construction as a greater share of residential development moving forward. By way of background in this rather technical area, state building codes in the US are often influenced by model codes, one example being regulations promulgated by the International Code Council (ICC). An overview of ICC regulations is shown in Table 17. It indicates that rehab under the ICC is regulated by Chapter 34 unless the ICC’s International Existing Building Code (IEBC) is adopted. The California Code of Regulations (CCR), Title 24, also known as the California Building Standards Code (CBSC), builds largely from the ICC’s International Building Code (IBC), with some exceptions (e.g., regarding seismic, historic building, and “green” standards).21 The CBSC’s regulation of rehab in existing buildings is largely drawn from the IBC’s Chapter 34.
Chapter 34 offers a workmanlike approach toward regulating construction in existing buildings. As a
baseline for comparison, with a “change of use” (e.g., an industrial building that is adaptively reused for
housing) Chapter 34 nominally demands that the reused building must comply with new construction
requirements for the new occupancy. In practice these can be quite onerous when imposed across the
board on all such applications. However, Chapter 34 also allows what are referred to as “compliance
alternatives” where, for instance, the full new construction requirements can be waived if added
compensatory safeguards are incorporated. Thus, the Chapter 34 foundation for rehab is a reasonable
regulatory framework, especially if code officials are flexible in administration through such means as
granting such flexible accommodations where warranted.
Incorporated within the CBSC is a separate State Historical Building Code22 ‐ one of the first in the nation
‐ as well as other regulatory provisions that are supportive of rehab, such as California Health and Safety
Code §17958.8.23 California and national building code experts, and other evidence, together point to
the generally supportive nature of the CBSC toward rehabilitation of the state’s existing stock (Alderson
and Kaplan 2008). 24 Yet inevitably, this sound regulatory base can be improved.
One issue is the need to enhance education and knowledge concerning the code among local officials
and others. One person contacted in the course of this study observed: “It [CBSC] works fine in major
[California] jurisdictions most of the time … and code officials tend to be knowledgeable and will flexibly
21 As described by the California Building Standards Commission, the CBSC contains: (1) building standards adopted without change from the national model codes; (2) building standards adopted with some modifications from the national model codes; and (3) building standards that constitute extensive additions, not covered by the model codes, adopted to address particular California concerns. 22 Building codes are often especially problematic when rehabilitation is effected in historic structures. 23 Health and Safety Code §17958.8 states in pertinent part: “Local governments must permit the replacement, retention, and extension of original materials and original methods of construction during alterations and repair of existing buildings as long as the original materials/methods comply with building code provisions governing that portion of the building at the time of its construction and the building does not become or continue to be substandard.” 24 An example is the State of California description of its rehab building code regulations in HUD’s America’s Affordable Communities Initiative (AACI). In response to the AACI’s query concerning “Has your jurisdiction adopted specific building code language regarding housing rehabilitation that encourages such rehabilitation through graduated regulatory requirements?”, the State of California replied “Yes” and cited such California Health and Safety Code provisions as §17958.8, §17958.9, and §17922(d).

48
grant [compliance] alternatives. The problem is in some rural and suburban areas where rehabilitation is
less routine and more generally when dealing with inexperienced inspectors.” Additionally, the need for
education to foster optimal administration of California’s building code regulation of rehabilitation was
underscored in the following recommendation of the California Department of Housing and Community
Development:
Educate and Enforce the Building Code to Facilitate Rehabilitation. Bringing older homes into compliance with current building codes can be costly, is not required, and can deter rehabilitation. The building code requires local government flexibility to facilitate rehabilitation while maintaining health and safety standards (Health and Safety Code 17958.8). To encourage rehabilitation, communities should conduct education programs for public officials, contractors and property owners to ensure public knowledge of flexibility in building codes for rehabilitation (i.e., minor or moderate).25
Moreover, California might well consider adopting, or drawing from, (1) the ICC’s International Existing
Building Code (IEBC), (2) Nationally Applicable Recommended Rehabilitation Provisions (NARRP)
developed by HUD, and (3) the Rehabilitation Subcode developed by the State of New Jersey (NJRS).
Table 18 summarizes some of the provisions of the ICC’s IEBC, NARRP, and the NJRS and, for comparison
purposes, also provides the ICC’s Chapter 34, the latter being the current major underpinning for the
regulation of rehab in California. Conceptually, the NARRP and New Jersey Subcode, as well as the IEBC,
are regarded as being “smart codes” because they all incorporate variably demanding requirements, as
per the nature of the work being done in an existing building, and allow for flexible regulation in a
change‐of‐use situation.
By way of example, when an existing building is being altered, the NARRP, NJRS and the IEBC all
differentiate the alteration into scalar categories of lesser to greater changes being made (e.g.,
“renovation,” “alteration,” or “reconstruction” [NARRP, NJRS] or “alteration levels 1‐3” [IEBC]). In
tandem, code requirements increase respectively. In the NARRP, for instance, at the lowest level of
change (“renovation”), existing conditions that violate the building code may be continued, but not
made worse. “Reconstruction,” however, triggers specified life‐safety improvements within the work
area, and when the work area exceeds specified percentages, the life‐safety improvements extend
beyond the work area to other parts of the building.
A more in‐depth review of the technical specifications of these possible additions to California’s building
codes for rehab lies beyond the scope of this paper. As we have pointed out in general, for smart rehab
codes to work in practice, municipalities require regulatory flexibility as well as the requisite, skilled
support staff on the ground. The greater the investment California and its localities make in these
upgrades to building‐code regimes applicable to rehab, the more streamlined and productive such
efforts are likely to become, for affordable housing redevelopment and otherwise.
25 http://www.hcd.ca.gov/hpd/housing_element2/PRO_conserve.php.

49
Table 18

50
B. Streamlining Resources for Rehab: Unwinding the Excessive Layering of Subsidies Per Project
Housing rehabilitation affordable to low‐ and moderate‐income (LMI) households and others of constrained resources is typically made possible through creative financial grantsmanship that secures multiple public (state, federal, and local), private, and third‐sector (e.g., foundation) sources of funds. A national example of such “layering” of subsidies for rehab is detailed in an analysis by Listokin et al. (2006). That research covered twenty rehabilitation projects nationally, all serving LMI and similar populations and including many buildings of historic character so that they qualified for special historic tax credits. These projects are summarized in Table 19.
In brief, the 20 projects contained 1,029 housing units, or an average of fifty‐one units per project. The twenty projects comprised 1,278,163 square feet, about 63,908 square feet per structure. About half of the cases comprised nonresidential uses as well. In the aggregate, the projects had total costs of $116,050,959, with cost per residential unit of $108,404 and about $130 per square foot. Of the total project costs, the construction rehabilitation outlay was the most significant, $87 million (75%), followed by $24 million (20%) for soft costs; and $5 million (4%) for acquisition costs. Project financing came from a variety of sources, including $55 million in equity (47%), $38 million (32%) in debt, $10 million (9%) in federal assistance (non‐tax credit), and a similar amount ($7 million) from other sources such as foundations.
The lion’s share of the $55 million in equity came from tax credits—a crucial source. The tax credits included $19 million in low‐income housing tax credits (LIHTC), $7 million in historic tax credits (HTC), and $28 million in combined LIHTC‐HTC resources. Other major sources of funds included bank debt (comprising $28 million of the total $38 million debt category) and HOME and Community Development Block Grants (CDBG) subsidies (comprising almost all of the $10 million in federal aid).
In summary, the 20 projects’ realization of affordable‐housing and preservation are enabled by a layering of sources of funds and various subsidies. Given the LMI households they serve, the projects could secure or afford only $38 million in bank debt of the total $116 million project costs, representing a very modest loan‐to‐project cost ratio of thirty‐two percent.
The national cases included in the Listokin et al. (2006) study only begin to convey the many subsidies that often must be tapped to make affordable housing rehabilitation “work” financially. It is not uncommon to bring together five to ten alphabet‐soup, acronym‐titled federal and state financial sources. The panoply of major federal and state programs that might very well be tapped for packaging a rehab project in California are listed noted in Table 20. These include such federal subsidies as CDBG, HOME, LIHTC, and OAHP; these might very well be joined by such state/other aids available in California as MHP, FWHP, and RHF.

51
Summary of Historic Affordable Housing Projects PROFILE/SCALE Project Average Total Percentage Housing Units 51 1,029 NA Gross Building ft2 63,908 1,278,163 NA Nonresidential ft2 5,978 119,562 NA Total Cost per ft2 ($) 107 NA NA Residential Cost per ft2 ($) 130 NA NA Cost per Residential Unit 116,401 NA NA COSTS ($) Acquisition 247,591 4,951,821 4% Rehabilitation 4,366,341 87,326,827 75% Soft Cost 1,181,128 23,622,556 20% Other Cost 7,478 149,557 0% Total Cost 5,802,548 116,050,959 100% SOURCES OF FUNDS ($) Debt Bank Loan 370,250 7,405,000 78% Bonds 45,000 900,000 20% Other 1,846,476 36,929,521 2% Debt Subtotal 1,431,226 28,624,521 100% Equity ($) LIHTC 943,931 18,878,625 34% HTC (Federal) 373,347 7,466,930 14% LIHTC and HTC (Federal) 1,394,006 27,880,117 51% HTC (State) 9,635 192,704 0% Other Tax Credit 19,638 392,750 1% Other 13,463 269,250 0% Equity Subtotal 2,754,024 55,080,476 100% Federal – HUD ($) HOME 404,533 8,090,654 80% CDBG 90,400 1,808,000 18% Other HUD 12,500 250,000 2% HUD Subtotal 507,433 10,148,654 100% Other Public ($) FHLB 73,650 1,473,000 20% State 84,478 1,689,550 23% Local 149,575 2,991,502 41% Property Tax Related 55,900 1,118,000 15% Other Public Subtotal 363,603 7,272,052 100% Other ($) Foundation 52,925 1,058,499 15% Owner 67,359 1,347,185 19% Other 233,083 4,661,653 66% Other Subtotal 353,367 7,067,337 100% Total Funds ($) 5,859,397 117,187,944 Note: NA = not applicable Source: Listokin et al. 2006.
Table 19

52
Table 20

53
Table 20 (cont’d)

54
Given the high property acquisition costs in California, coupled with relatively more expensive construction and other expenses, affordable housing rehabilitation in this state may sometimes require extreme levels of layered financing. The renovation of the Far East Building in Los Angeles by the Little Tokyo Services Center Community Development Corporation (LTSC CDC) is illustrative. This case is detailed in an appendix and is synopsized here.
The Far East Building had formerly contained 24 single‐room‐occupancy (SRO) units and some commercial space, and was renovated and converted to 16 housing units (14 studios) affordable to households of very modest incomes, as well as some restaurant and community uses. The total project cost (TPC) was about $3.81 million. While property acquisition costs were low ($61,000, or 2 percent of TPC), construction expenses amounted to about $2,800,000 (73 percent of TPC), and there were added soft costs of about $970,000 (25 percent of TPC).
It took 11 subsidies to make this $3.8 million development affordable to its intended low‐income clientele. The 11 aids are detailed in table 3. “Hard” (amortizing) debt from the California Housing Finance Agency and other sources amounted to only $0.4 million ‐ a modest one‐tenth of the $3.8 million total project cost (TPC). Soft (non‐amortizing) debt totaled about $1.8 million, or slightly less than half of the TPC; this soft debt was cobbled together from 5 sources, principally of state and city origins (e.g., California Department of Housing and Community Development and Los Angeles Housing Department and Economic Development Office). About $1.3 million, or approximately one‐third of the TPC, consisted of tax credit–secured equity (LIHTC and the federal HTC). The remaining $0.6 million, or about one‐sixth of the TPC, was secured from HUD and LTSC CDC sources.. In short, much toil and creative fundraising and funder‐satisfying was necessary (and continues to be so) in the Far East Building case, just to rehabilitate 16 housing units and ancillary nonresidential space. It is no wonder that the LTSC CDC recommended “the need for larger commitments from fewer funders so that the developer does not have to assemble so many sources.”
The time has come for California to strongly consider some form of state‐financed consolidation of housing subsidies into a more compact number of block grants. Such a step would greatly simplify the grantsmanship hurdle faced by groups such as LTSC CDC. This change would mirror the reformatting of aid at the federal level when numerous categorical programs connected with housing, community, and economic development were consolidated into CDBG. A full examination of the policy alternatives for achieving some streamlining of these programs and reducing the redundancy and transactions costs endemic in the system will have to await another day. Suffice it to say that a number of rehabilitation opportunities, with their narrow operating margins and higher‐risk construction features, bear the sting of layering inefficiencies as a severe burden, perhaps more severe on average than new construction.
55
C. Recalibrating Rehab Priorities in California’s LIHTC Allocation System
As noted earlier in this paper, the LIHTC is an important subsidy for affordable housing, both new construction and rehabilitation. As such, matters relating to the LIHTC, such as the state’s Qualified Allocation Plan (QAP) and regulations implementing its priorities, merit consideration of potential policy actions to foster rehabilitation in California.
To provide some brief background on this subject, the LIHTC is jointly administered by the Internal Revenue Service (IRS) and state agencies. The process of securing tax credits is competitive. Awards are based on the project criteria specified in the QAP prepared by each state, following IRS guidelines.
Federal expectations for the QAP include the low‐income occupancy tests and general categories of selection criteria that reflect each state’s affordable‐housing priorities. The synthesis of the federal and state requirements results in scoring or other selection criteria used in the evaluation of LIHTC project applications. This competition is popularly referred to as the “beauty contest.”
In a national study, Listokin et al. (2006) found 10 state QAP criteria that may encourage (4 QAP criteria) or hinder (6 QAP criteria) rehabilitation projects in the LIHTC “beauty contests.” Examples of factors favoring rehabilitation applications are added QAP points for projects involving rehabilitation (present in 13 states) or specifically for buildings that can be considered historic (found in 10 states). Examples of factors working against rehabilitation applications include points for new construction (6 states) and points for large units (e.g., requiring a minimum percentage of 3‐bedroom apartments) or units with other characteristics (e.g., multiple bathrooms or high levels of energy efficiency), sometimes difficult to realize when renovating an existing building.
The California Health and Safety Code Section 50199.10 designates the Tax Credit Allocation Committee (TCAC) as the state agency responsible for implementing the federal (and state) LIHTC programs in California.26 The TCAC is charged with funding the federal LIHTC awards in each funding round in the approximate following percentages:
Housing Type Goal Large Family 65% Single Room Occupancy 10% “At‐Risk” 5% Special Needs 5% Seniors 15%
There are both basic and additional thresholds to the California QAP, as follows:
26 Taken from California Code of Regulations, Title 4, Division 17, Chapter 1 (Aug. 20, 2008).

56
Basic Threshold A complete application must meet the following criteria: 1. Housing need and demand 2. Demonstrated site control 3. Enforceable financing commitments 4. Local approvals and zoning 5. Financial feasibility27 6. Sponsor characteristics28 7. Minimum constructing standards 8. Deferred payment financing, grants and subsidies 9. Project size and credit amount limitations29 10. Additional Threshold
There are specific requirements for each housing type (i.e. large family, single room occupancy, “at‐risk,” special needs, and seniors). In addition, the California rules include ten specific “selection criteria,” including such factors as “leveraging,”30 “amenities beyond those required as additional thresholds,”31 “sustainable building methods,”32 and “readiness to proceed.”33
The authors have considered the above‐described California QAP considerations vis‐à‐vis how they might encourage or discourage LIHTC rehabilitation applications. Our sense is that most criteria are generally neutral with respect to selection of applications that are rehab versus new construction. The state’s track record on allocation among construction categories – reviewed in great comparative detail relative to elsewhere in the US earlier in this paper – indicates as much.
Nevertheless, a rehab‐promotion program might attend to a number of existing allocative criteria to assess the ways they might work to the disadvantage of a rehab applications, particularly with respect to competitive 9% credits. An example of a potentially hindering impact is a criterion in the California regulations leaning toward “large family,” defined as follows:
27 Applicants must provide the financing plan for the proposed project and demonstrate the project’s feasibility throughout the extended use period. 28 Proposed project participants must demonstrate the knowledge, skills, experience and financial capacity to successfully develop, own, and operate the proposed project. 29 These limitations include unit type and size, total number of units (150 units for projects other than rehabilitation, HOPE VI or large neighborhood redevelopment proposals), and maximum annual Federal Tax Credits (shall not exceed $2 million, except for projects waiving unit size requirements, based on their status as rehabilitation projects, which cannot exceed $2.5 million). 30 Points are awarded based on cost efficiency, tax credit reduction, and public funds commitment. 31 The site amenities include transit‐oriented amenities, park location, public library, full scale grocery stores, public schools, senior centers, disabled services, hospitals, and pharmacies. 32 New or adaptive reuse projects must exceed California Title 24 energy standards by at least 10%; rehabilitation projects not subject to Title 24 must reduce energy use per square foot by 25%, as calculated and approved by the California Energy Commission. 33 Commitment requirements include: enforceable commitment for all construction financing, evidence of site plan approval and all local land use environmental review clearances, evidence of all necessary public approvals except building permits, and evidence of design review approval.

57
At least 30 percent of the units shall be 3‐bedroom units or larger; 1‐bedroom units must include at least 500 square feet and 2‐bedroom units must include at least 750 square feet of living space; 4‐bedroom units shall have a minimum of 2 full baths.
It may be problematical to achieve “large family” status in rehabilitating older apartment buildings with fewer 3‐bedroom units, compact apartment sizes (square footage), and fewer bathrooms per apartment.
Beyond the large‐family issue, the TCAC regulations as they relate to “sustainable building methods” – promoting energy reductions per square foot by 25 percent ‐ may also generate barriers to rehab investment. Problems likewise may arise due to the “Readiness to Proceed” criteria. Because of building code, historic code, and other requirements that can be more challenging with rehab, it may be harder for rehab projects to be deemed “ready” by regulators. (Ironcially, a countervailing consideration is that existing apartments may encounter less NIMBYism relative to new construction.) Any requirement which adds to the proof burden rehab must bear, on balance, is a potential avenue for pro‐rehab reform if that initiative is on balance the soundest approach for California statewide.
Other California QAP criteria might work to the advantage of rehab applications. Examples are QAP scores for SROs, “at risk” properties, properties in Neighborhood Revitalization areas, and site amenities such as proximity to existing transit, parks, and so on. All of the above may be easier to realize in existing‐building and rehabilitation situations relative to LIHTC applications consisting of new construction.
In short, relative to criteria in prominent use elsewhere, the California LIHTC allocation system has some factors perhaps discouraging rehab applications and/or leading to the rejection or underfunding of rehab applications actually submitted. State policymakers might well consider the addition of criteria specifically favoring rehab applications. These include added point‐categories for rehab in general, and for historic renovations specifically. If California desires to foster additional rehabilitation through the LIHTC, it behooves the state to revisit its QAP and implementing regulations accordingly.
It bears mention that the recent landmark federal housing law — the Housing and Economic Recovery Act (HERA) signed July 30, 2008 [HR3221] — requires state housing finance agencies t o include “the historical nature of the project” as part of their required selection criteria for LIHTC allocation decisions. To that end, the following model language has been suggested by the National Conference of State Historic Preservation Officers (NCSHPO):

58
___ Points are available for projects of “Historic Character.” “Historic Character” means any project consisting of one or more structures 1. (a) individually listed in the National Register of Historic Places; (b) located in a registered historic district and certified by the Secretary of the
Interior to the Secretary of the Treasury as being of historic significance to the district;
(c) that have received local landmark designation through a local historic preservation commission through an ordinance; or
(d) located within an area that has been zoned as a historic area; and 2. the rehabilitation of which will be completed in such a manner as to be eligible for
(federal and/or state] historic rehabilitation credits.
Addition of such considerations to the California allocation criteria would further aid the rehabilitation of existing residential buildings, particularly those deemed to be of historic character, via the LIHTC.
D. Enhancing Rehab with a California State Historic Tax Credit Program
Another key way California can foster rehabilitation of both its existing residential and nonresidential stock is to adopt a state historic tax credit (SHTC). While this support would be limited to California’s historic buildings, the definition of what is historic is, in practice, quite broad and includes many ostensibly “garden variety” properties. For instance, residential buildings at least 50 years old with some architectural panache or cultural association could be designated as historic , or may already be located in historic districts. A survey of eligible properties might come to include many residential structures and neighborhoods throughout the state. We do, of course, recognize that offering an SHTC — which stand to reduce state revenues and represent a tax expenditure — seems particularly inopportune given California’s very real current budget crunch. Nevertheless, given national experience with the device, such a program merits consideration, especially since about 30 states already have taken such action and have realized substantial rehab gains as a result.
By way of background, the federal historic tax credit (FHTC) currently offers a 20 percent credit34 against federal taxes, provided certain conditions are met.35 From its inception in the late 1970s to date, the FHTC has cumulatively been associated with $40 billion of rehab investment nationally, involving both residential and nonresidential buildings. The FHTC has cumulatively aided the rehab of about 370,000 housing units, including about 90,000 units, or roughly one‐quarter, which are mandated and/or marketed as affordable to low‐ and moderate‐income families.
34 A credit offers a dollar‐for‐dollar reduction in taxes owed. The FHTC was originally pegged at 25 percent but was reduced to 20 percent in 1986. 35 To qualify for the 20 percent historic ITC, the rehabilitated property had to be a “certified historic structure” (i.e., a building individually listed on the National Register of Historic Places, or located in, and contributing to, the historic significance of a registered historic district); a rehab had to be “substantial” (i.e., $5,000 or the adjusted basis of the renovated property, whichever was greater); and finally, the rehab had to be certified. To be certified, the rehab must be approved by the National Park Service (NPS) as being consistent with the historic character of the property and, where applicable, the district in which it is located, using the Secretary of the Interior’s Standards for Rehabilitation as a guide.

59
While the FHTC is a significant subsidy, it is often not enough. To illustrate, housing developers interviewed by Rutgers University in Ohio, a state where the FHTC was being used by a jurisdiction without an SHTC (i.e., in the same situation as currently is the case in California), made such comments as “[a] state tax credit would have funded the gap for unforeseen engineering changes” and “[a] state credit would have allowed for additional finishes that would have benefited the rental units.”
In response to such sentiments, about 30 states have enacted SHTCs. These state efforts are identified in an appendix table at the end of the paper, and some highlights of various provisions are noted below.
Tax Credit Level. The percentage of the rehabilitation investment against which a credit is given for state tax purposes (e.g., individual income or corporate) ranges from five percent (Montana) to fifty percent (New Mexico). Many states track the federal provisions and allow a twenty‐percent credit. Some states provide different credits depending on the type of historic property. Delaware, North Carolina, and Rhode Island extend a twenty‐percent state tax credit for income‐producing historic properties and a higher, thirty‐percent state tax credit for homeowner‐occupied historic buildings.
Applicability. This varies tremendously. The SHTC is often available to income‐producing properties (as the FHTCs), may be available to homeowner occupants (going beyond the current FHTC), and may have further targeting, such as to downtown development districts (Louisiana).
Investment Requirements. Reflecting dynamic federalism, investment requirements for SHTCs are quite disparate. States may require a minimum dollar investment (e.g., $5,000 in Indiana, Kansas, Maryland, and Maine; and $25,000 in Connecticut and North Carolina), may have no minimum dollar investment (e.g., Delaware, Georgia, Iowa, and Louisiana), may adhere to the FHTC minimum investment (i.e., the greater of $5,000 or the adjusted basis), or may revise the federal blueprint (e.g., the Rhode Island minimum investment is 50 percent of the adjusted basis, or $2,000). While the FHTC has no cap or maximum once its requirements are met, the less “deep pocketed” states often cap their SHTC. Caps may be imposed per project (e.g. $50,000 per property in Colorado and $30,000 per dwelling unit in Connecticut) and/or statewide (e.g., $2.4 million in Iowa, $3 million in Delaware, and $15 million in Maryland). States that allow a high credit percent understandably more often impose caps. For example, while New Mexico allows the nation’s highest SHTC (50 percent), that high percentage can be applied to a maximum project investment of $25,000 (or 50 percent of the amount spent on historic rehab).
Coordination with existing preservation governance. California’s State Historic Preservation Office has existing authority to conduct reviews of projects impacting the state’s historical resources, and at times this authority is interpreted with expansive breadth and coverage. Should the state consider adoption of a SHTC program, approaches reducing review‐process delays – including possibly streamlining review for those projects combining SHTC and FHTC – would be a welcome improvement given what numerous residential projects in the state already face.
60
The State of Missouri has one of the most extensive state tax credits for historic rehabilitation, and to demonstrate what a state can do in this arena we report on this program in greater detail. From its inception (1998) through fiscal year 2007, more than $2.7 billion ($2,732 million) of historic rehabilitation has cumulatively been effected under the Missouri Historic Tax Credit (MHTC) auspices. The rehab was often supplemented by new construction so total investment over the program’s duration amounted to $3.4 billion ($3,445 million). A 25 percent state tax credit applied to the rehab, amounting to about $682 million, encouraged the MHTC investment. Completed MHTC projects are concentrated in the City of St. Louis and to a lesser extent Kansas City, Lexington, and Jefferson City. Projects outside of these cities are located in dozens of other towns, dispersed throughout the state. MHTC projects are concentrated in areas with higher population densities, significant minority presence, and lower household incomes. MHTC recipient areas tend to have an older housing stock, higher vacancy rates, and lower owner occupancy than the state of Missouri as a whole. Many MHTC locations are classified by the Missouri Department of Economic Development as “distressed.” Credit‐inspired historic preservation investment in these areas was thus quite welcome.
Illustrative of the application of the MHTC is a $200 million rehabilitation project in downtown St. Louis. Lenders would extend only about $90 million for a first mortgage, or a modest 45 percent loan‐to‐value (LTV) ratio. This low LTV reflected a high perceived risk of investing in downtown St. Louis at the time (late 1990s). With only $90 million in a first mortgage, the developer had to garner an additional some $110 million in other sources—a daunting challenge. This challenge was met by layering subsidies. About $25 million came from investors seeking federal FHTCs. An additional $12 million was realized from Missouri investors taking advantage of this state’s historic tax credits, the MHTC described earlier. An additional large sum, about $34 million, was realized from property tax increment financing (TIF), and another $25 million came from funds from the U.S. Department of Housing and Urban Development (Section 108).
In sum, more than half of the states in the country have invigorated their rehab activity with an SHTC. The SHTC–FHTC combination is potent and has often been used for housing purposes. It behooves California to consider this strategy, effected by many of its peers—if not immediately, then perhaps when a calmer state budgetary climate returns.
E. Rebalancing the NewRehab Mix in the Housing Element Law
California can be proud of its housing element system, part of the general plan obligation under state law. One of very few such formal regimes in the nation and the world, the housing element requirement imposes upon every city and county the responsibility of planning and zoning in a way which provides residential development sites at levels commensurate to their “fair share” of regional affordable housing need by income strata. The housing‐element documents prepared by localities and reviewed for compliance by the state’s Department of Housing and Community Development (DHCD) represent, at least in principle, a declaration by municipal governments they will accommodate quantities and distributions of higher‐density multifamily production necessary to host expected population growth, particularly among an area’s needier households.
61
California’s Department of Finance undertakes statewide demographic projections. The law then tasks regional councils of government (like the Association of Bay Area Governments [ABAG] and the Southern California Association of Governments [SCAG]) to develop regional housing needs assessments and inform localities concerning the income‐based residential development targets they must incorporate within their planning, zoning , and promotion of needed construction. Only New Jersey, Washington, Oregon, and Massachusetts have experimented with similar legal requirements keeping localities from shirking their regional responsibilities to contribute threshold land‐use allocations toward LMI shelter needs (Pendall, 2007).
At its most effective, the promise of the housing element system is fulfilled with a combination of centralized cajoling via state oversight, legal wrangling by housing advocates, and value‐for‐value exchanges among reluctant neighbors as incumbents, would‐be LMI entrants and their tax‐ and services‐bases, and developers willing to participate in density bonuses to increase returns on land investment. However, there is a general sense around California that state government lacks the necessary legal enforcement mechanisms to genuinely shift incentives among these players. Only , the most energized and intervention‐minded courts can successfully sway recalcitrant suburbs that are manifestly unwilling to introduce substantial numbers of new, affordable multifamily units into their local stock. Nevertheless, as an anti‐NIMBY device – one which provides right‐minded city councils cover during overheated land‐use conflicts on new housing – the housing‐element “fair share” regime remains important and useful.
Several facets of the housing element law should be reconsidered, and potentially redesigned, if the state is intent upon delivering more and more LMI rehab construction over time.
Reforming site‐based compliance. The fair‐share vision was born of the famous Mount Laurel litigation in the 1970s and 1980s in New Jersey. Since its genesis it has targeted planning and zoning as the nexus of its impact. The unreasonable denial of building permits, conditional use permits, variances, and rezonings – or the perennial exclusion of necessary reform in planning documents – was seen as the evil to be corrected. The problem is that needed development has always been heavily tilted towards “sites” suitable for genuine additions to the existing stock – new construction. California Government Code sections 65583 and 65583.1 orient the compliance system essentially toward the process of setting aside sites where added residential facilities could be placed, rather than the continued civic and financial investment in sites where existing, affordable multifamily units are already operating but potentially in need of rehabilitation. Evidence of municipal bona fides in this compliance process is achieved primarily via evidence of the intensification and densification of land use.
Increasing and expanding the 25% “at‐risk” rule. In principle, particularly from the vantage of a pro‐rehab legislative program of reform, local government should be provided the greatest possible flexibility to demonstrate its willingness to host a fair share of regional housing need. This would mean that local officials and developers should be allowed to comply with housing‐element requirements by as high a proportion of new investment in rehab construction for existing housing as the prevailing set of development opportunities, subsidy sources, and economic realities might allow.
62
The current regime places itself far outside this level of flexibility. Instead, only up to 25% of a community’s fair‐share obligation for site identification may be satisfied via added investments in existing units deemed to be “at risk” of “imminent loss” of their affordability features and being released into the unregulated market or being dropped from the stock altogether. Not only is the 25% exception limited to the at‐risk category; use of that exception requires “committed” assistance (i.e., financial participation) flowing from the city or county in question itself. It is difficult to interpret the at‐risk exception to site‐provision requirements as welcoming municipalities to comply via high levels of additional rehab investment at all, let alone those supported by subsidy mixes from external sources.36
A fair reading of the “at risk” provision in the housing element law demonstrates that it presumes new construction is a more valid form of compliance than new rehab investment in existing buildings. Too much attention is paid toward impeding perhaps “artificial,” rehab‐based compliance, by localities intent on skirting their responsibilities and avoiding new construction which would provide countable “net increases” on a unit‐basis. In turn, too little attention is given the alternate circumstance that added building life via even only moderate rehab projects provides a “net increase” of service‐years in existing locations, often in more efficient and cost‐effective ways, and without occasioning the kinds of community opposition the housing element law was intended to override in the first place.
Hence a program of rebalancing shares of construction toward greater rehab investment in California moving forward would ask three key questions regarding the current housing element system: (1) whether an inflexible, uniform 25% share is the appropriate ceiling statewide for rehab investment; (2) whether limiting that provision only to urgent preservation (as opposed to moderate rehab for buildings where affordability is not so immediately threatened) is optimal; and (3) whether delivery of financial commitments by the city or county involved is a sensible requirement to impose on forms of compliance outside traditional planning‐zoning set‐asides.
IX. Concluding Remarks
This paper has taken a relatively neutral view on whether California’s balance between new and rehab construction in assisted multifamily housing is currently optimized. Viewed from a variety of perspectives, the impediments toward increasing rehab’s share are national, systemic, and not necessarily worsened by state‐level irregularities of any particular kind. Based upon our discussions with developers, regulators, and other observers, the health of the new‐rehab balance may depend greatly upon a wealth of localized circumstances, in terms of investment and regulatory philosophy, as well as the market and economic realities on the ground. Positioned among its state‐level peers nationally, California’s system for steering opportunities among construction categories is hardly unusual and appears to be functioning soundly.
However, there are a number of policy directions the state can pursue as its housing stock ages and in case overall affordability conditions tend to worsen. Whether these initiatives are undertaken locally or on a statewide basis, via full‐fledged legislative reforms or more informally, depends greatly upon how the new‐rehab balance (or imbalance) shifts over time. Ever moreso, support for a greater share of
36 See California Government Code § 65583.1(c).

63
construction being devoted towards rehab will be driven by the perceived financial and other advantages of doing so, and whether those advantages appear sustainable and worthwhile over the longer haul. In preparation for such conditions obtaining, we suppose there is little reason not to attend to such tasks as building code reform, revision of the housing element law, and tackling the perennial cost and redundancy of excessive programmatic layering in various projects. Indeed, such ferment may bear fruit not only in the ways it frees up a greater share of investment to be devoted towards rehab, but also in the salutary impacts it may have on affordable housing and finance in California generally.
Much work remains in order for this analysis to find translation in the form of new approaches and altered ways of doing business (and regulating it). For example, further research could usefully add dimension to project‐level cost differences between new and rehab construction. Project‐ and city‐level study would help identify the most serious glitches in the current system and foster the case for pinpoint reforms on select barriers to rehab construction. Tracking rehab as a proportion of the total flow of construction activity in building permit data, for assisted development and otherwise, would provide a deeper understanding of multifamily development and its potential improvement environmentally.
A full treatment of the shadow‐price of transactions costs in the subsidy layering regime would also be helpful, because it might help demonstrate the great numbers of needy households being deprived affordable shelter as a result.
REFERENCES
Alderson, Caroline and Marilyn Kaplan. 2008. “Building Codes and Historic Rehabilitation Conference: Synopsis and Reflections.” AIA Preservation Architect (Newsletter of the American Institute of Architects Historic Resources Committee), September 15. http://www.aia.org/nwsltr_hrc.cfm?pagename=hrc_a_20050214_codes.
Ballard, Megan J. 2003. “Profiting from Poverty: The Competition Between For‐profit and Nonprofit Developers for Low‐income Housing Tax Credits.” Hastings Law Journal 55(1):211‐244.
CDLAC. 2005. “Joint Market Study Guidelines of the California Debt Limit Allocation Committee and Tax Credit Allocation Committee for the California Multi‐Family Housing Tax‐Exempt Bond And Tax Credit Programs.” Sacramento: California Debt Limit Allocation Committee [mimeo]. http://www.treasurer.ca.gov/CDLAC/procedures/market.pdf.
Cummings, Jean L. and Denise DiPasquale. 1999. “The Low‐Income Housing Tax Credit: An Analysis of the First Ten Years.’” Housing Policy Debate 10(2):251‐307.
Duda, Mark. 2001. “Federally Sponsored Rehabilitation Activity.” Cambridge, MA: Joint Center on Housing Studies, Working Paper W01‐8. http://www.jchs.harvard.edu/publications/governmentprograms/duda_w01‐8.pdf.

64
Econometrica. 2006. “Multifamily Properties: Opting In, Opting Out and Remaining Affordable.” Washington: US HUD Office of Policy Development and Research. http://www.huduser.org/Publications/pdf/opting_in.pdf.
Fischer, Danna. 2008. “Low Income Housing Tax Credit.” Washington, DC: National Low Income Housing Coalition (February 1). https://www2398.ssldomain.com/nlihc/detail/article.cfm?article_id=5233&id=23.
Hollar, Michael and Kurt Usowski. 2007. “Low‐Income Housing Tax Credit Qualified Census Tracts.” Cityscape 9(3):153‐160.
LISC. 2005. “Recapitalizing Affordable Rental Housing.” New York: Local Initiatives Support Corporation. http://www.lisc.org/files/897_file_asset_upload_file444_8165.pdf.
Listokin, David. 1991. “Federal Housing Policy and Preservation: Historical Evolution, Patterns, and Implications.” Housing Policy Debate 2(2):157‐186.
Listokin, David et al. 2006. Best Practices for Effecting the Rehabilitation of Affordable Housing: Framework and Findings (Vol. I). Washington, DC: US HUD, Office of Policy Development and Research.
Meléndez, Edwin, Alex F. Schwartz & Alexandra De Montrichard. 2008. “Year 15 and Preservation of Tax‐Credit Housing for Low‐Income Households: An Assessment of Risk.” Housing Studies 23(1):67‐87.
McClure, Kirk. 2000. “The Low‐Income Housing Tax Credit as an Aid to Housing Finance: How Well Has It Worked?” Housing Policy Debate 11(1):91‐114.
NHT. 2007. “California: Affordable Housing Preservation in 2007.” Washington: National Housing Trust [mimeo]. http://www.nhtinc.org/documents/CA_Preservation.pdf.
Pendall, Rolf. 2007. “From Hurdles to Bridges: Local Land‐Use Regulations and the Pursuit of Affordable Rental Housing.” Cambridge, MA: Joint Center for Housing Studies, Working Paper RR07‐11. http://www.jchs.harvard.edu/publications/rental/revisiting_rental_symposium/papers/rr07‐11_pendall.pdf
Roberts, Benson F. and F. Barton Harvey III. 1999. “Comment on Jean L. Cummings and Denise DiPasquale’s ‘The Low‐Income Housing Tax Credit: An Analysis of the First Ten Years.’” Housing Policy Debate 10(2):309‐320.
Schaaf, Albert H. 1960. “Economic Aspects of Urban Renewal: Theory, Policy, and Area Analysis.” Berkeley: Real Estate Research Program, Institute of Business and Economic Research, University of California [working paper].
___________. 1969. “Economic Feasibility Analysis for Urban Renewal Housing Rehabilitation.” Journal of the American Institute of Planners 35(6):399‐404.

65
Stegman, Michael A. 1990. “The Excessive Costs of Creative Finance: Growing Inefficiencies in the Production of Low‐Income Housing.” Housing Policy Debate 2(2):357‐374.
Sternlieb, George and David Listokin. 1976. “Rehabilitation Versus Redevelopment: Cost‐Benefit Analyses,” in Housing in the Seventies Working Papers 2: National Housing Policy Review (Washington, DC: US HUD), pp. 1033‐1103.
TCAC[1]. 2007. “State of California Low Income Housing Tax Credit Programs Qualified Allocation Plan.” Sacramento: State Treasurer’s Office, California Tax Credit Allocation Committee. As amended January 3, 2005; on‐line version dated February 21, 2007. http://www.treasurer.ca.gov/ctcac/qap.pdf.
US GAO. 1990. “Rental Housing: Inefficiencies From Combining Moderate Rehabilitation and Tax Credit Subsidies.” Washington: US General Accounting Office, RCED‐90‐168.
US HUD[1]. 2009. “Allocating Housing Tax Credits.” http://www.hud.gov/offices/cpd/affordablehousing/training/web/lihtc/basics/allocating.cfm.
US HUD[2]. 2009. “Eligibility (Low‐Income Housing Tax Credits).” http://www.hud.gov/offices/cpd/affordablehousing/training/web/lihtc/basics/eligibility.cfm.
US HUD[3]. 2009. “HUD Historical Background.” http://www.hud.gov/offices/adm/about/admguide/history.cfm.
US HUD[4]. 2009. “Real Estate Acquisition and Relocation.” http://www.hud.gov/offices/cpd/library/relocation/index.cfm.
ACKNOWLEDGEMENTS
A number of colleagues unselfishly made themselves available for informal telephone and in‐person discussions or provided data, useful information, and/or other forms of research support . The authors wish to thank the following individuals for their valuable time, input, and assistance:
Gayle Berens Urban Land Institute (Los Angeles) Raphael Bostic University of Southern California (Los Angeles) James Buckley Citizens Housing Corporation (San Francisco) Glen Campora California Department of Housing and
Community Development (Sacramento) Tom Collishaw Self‐Help Enterprises (Visalia) Mary Corley Fisher Center for Real Estate and Urban
Economics, UC Berkeley Dave Ferrier Community Housing Improvement Program
(Chico)
66
Karen Flock Cabrillo Economic Development Corporation (Ventura)
Stephanie Forbes Bay Area LISC (San Francisco) Carol Galante BRIDGE Housing Corporation (San Francisco) Dora Leong Gallo A Community of Friends (Los Angeles) Melvyn Green Melvyn Green & Associates (Torrance) Rich Gross Enterprise Community Partners (San Francisco) David Hattis Building Technology, Inc. (Silver Spring, MD) Lyn Hikida BRIDGE Housing Corporation (San Francisco) Michael Lahr Rutgers University (New Brunswick, NJ) Richard Mandel California Housing Partnership Corporation
(San Francisco) Lee Milman A Community of Friends (Los Angeles) Ron Nahas Rafanelli & Nahas (Orinda) Jeff Newbury California Department of Housing and
Community Development (Sacramento) Ben Phillips Mercy Housing (Los Angeles) Elizabeth Reginio National Equity Fund (Chicago) Joel Rubenzahl Community Economics Inc.(Oakland) Ken Sauder Wakeland Housing & Development Corporation
(San Diego) Matthew Schwartz California Housing Partnership Corporation
(San Francisco) Sharon Sprowls Housing California (Sacramento) Jacqueline Waggoner Enterprise Community Partners (Los Angeles Peter Werwath Enterprise Community Partners (Columbia, MD) Anne Wilson Community HousingWorks (San Diego) Kate White Urban Land Institute (San Francisco) Paul Zimmerman Southern California Association of Nonprofit
Housing (Los Angeles)

67
APPENDIX A
Analytic Framework for Regulatory Barriers to Rehab Construction

68
Analytic Framework: Barriers to Affordable Housing Rehabilitation (Listokin et al., 2006)

69

70
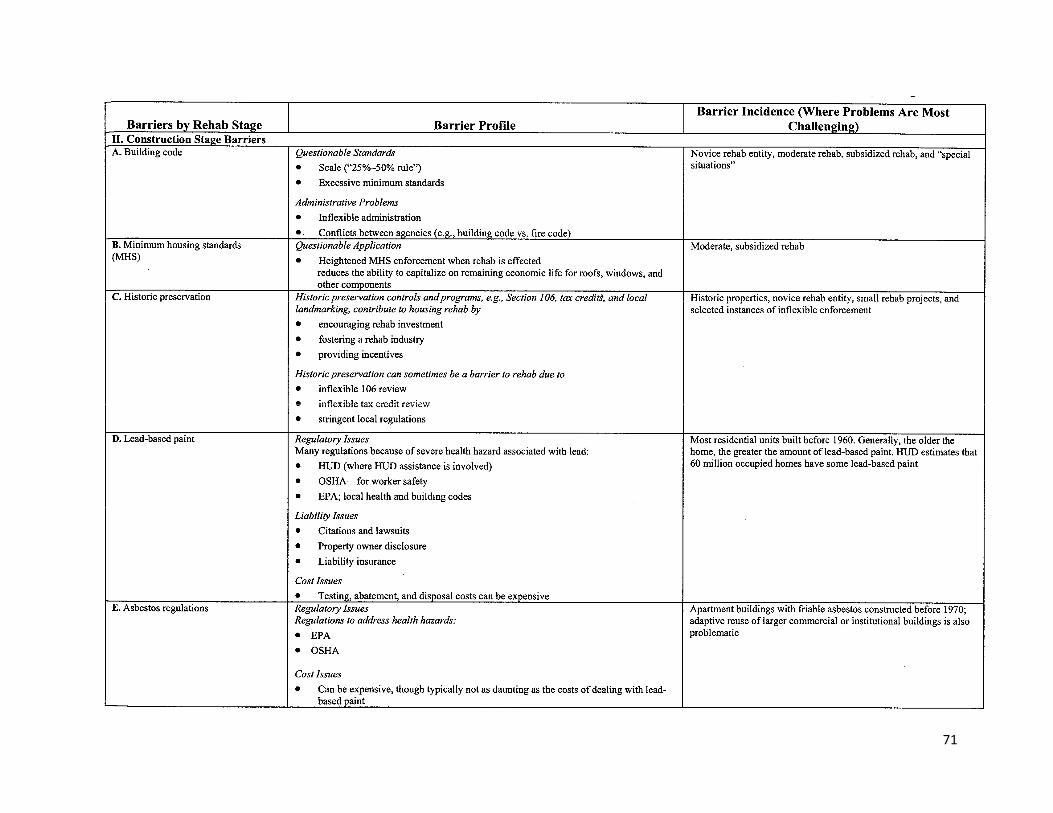
71

72
73
APPENDIX B
Case Study: Little Tokyo Service Center Development Corporation
Far East Building Project Los Angeles

74
PROJECT PROFILE Current Name of Project: Far East Building Historic Name: none Address: 347‐353 E. 1st Street, Los Angeles, CA 90012 Date of Original Construction: 1890 Date of Rehabilitation: Commenced December 2002; completion date: August 2003 Original Use: Mixed use ‐ resident hotel, commercial New Use: Same. Total Non‐Residential Square Footage: 5,562 square feet Total Non‐Residential Project Costs: $876,590 Gross Building Area: 17,454 square feet (including basement) Number of Housing Units Created: 16
BACKGROUND The mission of the Little Tokyo Service Center Community Development Corporation (LTSC CDC) is to contribute to the revitalization of the Little Tokyo community, as a multi‐ethnic neighborhood, and as the cultural center for the broader Japanese American community of Southern California. The Far East Building is located in the heart of the designated National Park Service (NPS) National Landmark Little Tokyo Historic District on First Street. Comprised of mom‐and‐pop retail stores, restaurants, and residential hotels, this community is very poor and has a median income well below the county median income level. Formerly housing 24 Single Room Occupancy (SRO) units and two commercial spaces, the three‐and‐ a‐ half story Far East Building has been vacant since it suffered significant structural damage during the 1994 Northridge Earthquake. The proposed rehab will restore the existing historic fabric, reinforce the un‐reinforced masonry building’s structural integrity, and convert the SRO units into 14 studios and 2 one‐bedroom units. All of the units will be affordable to households earning less than 50% of the area median income (AMI) and the remaining 8 units at 35% of AMI. The latter 8 units will be subsidized by project based Section 8 Rental Subsidies to provide housing for homeless persons. The famous Far East Cafe space on the ground floor has been a community institution for decades . It will be restored and brought back to life as a new restaurant, which will create jobs and help stimulate the local economy. A second ground floor commercial space will be the new home for LTSC’s DISKovery Computer Learning Center, providing technology access to Far East and area residents. On‐site supportive services will be provided by LTSC CDC and its parent social service organization, Little Tokyo Service Center. Services to be provided include job development services, computer training, case management, and emergency food and clothing distribution.

75
PROJECT FINANCING Acquisition*: $ 60,993 Rehabilitation**: $2,780,105 Other (e.g. soft costs): $ 970,501 Total Cost of Project: $3,811,599 Per Unit Housing Cost: $ 183,483 * Building was donated ‐ includes closing and holding costs as well as back taxes that were paid in return for the building donation ** Represents total rehab and construction costs ‐ not just qualifying costs SOURCES OF FUNDS Debt (soft)
• Los Angeles Housing Department: $525,000 • Los Angeles Mayor's Office of Economic Development: $400,000 • FHLB Program (sponsor: Washington Mutual Bank): $ 80,000 • CA Dept. of Housing & Community Development: $515,380 • Housing Authority of the County of Los Angeles: $288,086
Debt (hard or amortizing)
• California Housing Finance Agency (CHFA) *** Special Needs Loan $160,000
• Valley Economic Development Center (EDA Revolving Loan Funds) $240,000
*** CHFA is also issuing a tax exempt bond allocated by the California Debt Limit Allocation Committee of $1,835,000 which is primarily being loaned to the construction lender, Washington Mutual Bank under CHFA's Loan to Lender program, with $160,000 remaining in after permanent closing. Equity
• LIHTC ‐ 4% credit (National Equity Fund): $731,335 • HTC (National Equity Fund): $600,309
Other • HUD Supportive Housing Program grant: $250,000 • Capital Campaign by LTS CDC: $400,000****
**** Of the $400,000 capital campaign amount, $21,489 will be used in the rehab project; the remaining funds go towards tenant improvements and program start‐up costs. The Housing Authority of the City of Los Angeles will also provide 8 project‐based Section 8 rental subsidies for 8 units reserved for formerly homeless (via an SRO Moderate Rehabilitation subsidy award from HUD).

76
PROJECT CHALLENGES & SOLUTIONS Property Acquisition. Building originally owned by 5 families. It was damaged and closed by the City after the 1994 Northridge Earthquake. Since 1994, two key family members passed away, requiring ownership/title changes and quitclaims; other owners had put severe title problems on the property (liens) which had to be cleared before the developer could receive the building as a donation and secure financing. The family wanted to remain a part of the building in some way (it had been in their possession for 3 generations), so the developer had to work out a groundlease for the land (building donated, not land) that could enable the project to secure financing against the groundlease. Donation and groundlease finally implemented in 2001. Land Use Requirements. The project had to be designed in such a way that there were no new parking requirements created (there is no parking available or possible on site). Other Public Regulations. The building had lead‐based paint and asbestos, requiring studies and mitigation plans; had to invoke State Historic Building Code on several issues to address code non‐compliance in several areas (e.g., open [i.e., non‐fire‐rated] interior staircase typically not allowed; had to increase fire sprinklering to mitigate); and had to attach new exit staircase to back of building to meet exiting/egress requirements. Use of Tax Credits. Always a challenge to balance the Secretary of Interior standards with new uses/users (e.g., the old restaurant did not change much in 5 decades; new restaurant operator wants/needs more modern facility in order to be viable business; original use was SRO, yet a new project encompasses apartment units with private bathroom and kitchen for residents, thus requires reconfiguration of interior, while preserving configuration of public corridor. Also, the project involved the insertion of an elevator because most residents are seniors). Project Financing. Required so many sources, closing all of them, and getting funders to coordinate and be consistent with one another was the biggest challenge. Specific Lessons Learned. There is a need for larger commitments from public sources so the developer does not have to assemble so many sources. FOR FURTHER INFORMATION Name of firm/organization: Little Tokyo Service Center CDC Contact person: Erich Nakano Address: 231 E. Third Street, Suite G106 Los Angeles, CA 90013 Type of Developer: Nonprofit Telephone: 213‐473‐1685 email address: [email protected]

77
APPENDIX C
Case Study: Unreinforced Masonry Rehab in Los Angeles and Glendale
(Cost Estimates by The Enterprise Foundation, 1998)

78
Case Study: Unreinforced Masonry Rehab in Los Angeles and Glendale
(Cost Estimates by The Enterprise Foundation, 1998*)
Earlier in this paper, we identified varying “rehab by degrees” that ranged from the lowest level of intervention (“cosmetic rehab”) to a mid‐range of renovation (“moderate rehab), culminating in the most extensive construction and change in an existing building (“gut rehab”).
In a previously unpublished set of cost estimates performed a decade ago, the Enterprise Foundation examined the cost of these three levels of rehabilitation in residential unreinforced masonry (URM) buildings in the Los Angeles County, California, cities of Glendale and Los Angeles. The two communities were chosen as representative of smaller and larger cities, respectively; both had a substantial stock of URMs. To lend further perspective, the Enterprise study compared rehab costs to that of new construction in the same communities. While this Enterprise analysis is now a decade old, we excerpt the major findings here because of the insights it still offers.
• The rehab costs vary from the new construction costs, as indicated in the accompanying appendix table. The highest to lowest costs are scaled from new construction to gut rehab, moderate rehab, and finally cosmetic rehab. Generally speaking, the moderate rehabbed units cost about half (per unit), 60 percent (per square foot or sf.) and 80 percent (per bedroom) of new construction, whereas the gut rehabbed units can be built for either no savings (per unit) or at best about three‐quarters (on a sf. basis) the cost of new units. Cosmetic rehab is the least expensive, but the housing quality it delivers is not comparable to the other strategies.
• There is enough difference in cost between the moderate rehab option and the gut rehab option to justify pursuing that mid‐level strategy. The real variable is how quickly the higher maintenance costs of the moderate rehab option eat up the cost difference. While that consideration is beyond the scope of this study, because with moderate rehab the plumbing is new, the wiring is partially new, and the heating system is new (not to mention the new roof, repainting, new flooring and carpeting, and virtually new “wearing” surfaces), maintenance costs should be quite manageable.
• Not only does rehabbing at a moderate level cost less, it is significantly quicker. New buildings with subterranean parking take a year to 14 months to build. Moderate rehab should take six to seven months, while gut rehab will take eight to nine months minimum.
• In summary, the moderately rehabbed units cost roughly half (unit comparison) to 60 percent (square foot comparison) of new construction, whereas the gut rehabbed units can be built for either no savings or at best three‐quarters the cost of new units. The significant public policy conclusion is: Almost all old brick buildings are worth saving at a moderate level of rehab if the reconfiguration costs are kept to a minimum and if the owners and funding sources will accept a 20‐ to 30‐year projected life.
• Additional research will be needed to identify and project costs for those elements of the building that will significantly impact the owner’s maintenance budget before we can be absolutely certain this moderate rehab strategy is truly cost‐effective. However, in a time of massive housing shortages in southern California, half the life (20 versus 40 years) at half the cost built in half the time is still a cost‐effective strategy.
*Unpublished study provided to David Listokin by William Duncan and Peter Werwath of Enterprise.

79
This overall Enterprise support for moderate rehab as advantageous policy in California is echoed by many seasoned rehab organizations nationwide.
Cosmetic Rehab Moderate Rehab Gut Rehab New ConstructionCOST PER UNITRange $8,000-$13,000 $51,000-$57,000 $75,000-$137,000 $105,000-$138,000Average $10,500 $53,100 $106,000 $122,000Range as % of New Construction 8%-9% 41%-49% 71%-99% 100%-100%Avergae as % of New Construction 9% 46% 87% 100%
COST PER SQUARE FOOTRange $15-$17 $61-$76 $82-$90 $92-$140Avergae $16 $66 $87 $116Range as % of New Construction 12%-16% 54%-66% 64%-89% 100%-100%Average as % of New Construction 14% 59% 74% 100%
COST PER BEDROOMRange $8,000-$13,000 $51,000-$57,000 $42,000-$75,00 $52,000-$105,000Average $10,500 $53,100 $56,000 $67,600Range as % of New Construction 12%-15% 54%-98% 71%-81% 100%-100%Average as % of New Construction 16% 79% 83%¹ Rehabilitation costs do not include acquisition costs for the unit and new construction does not include land costs.
Cost Factor Construction Option
Construction Costs¹ of Rehabilitation Versus New Construction

80
APPENDIX C
Summary Table: State Programs for Historic Tax Credits

81

82

83