Embed Size (px)
Citation preview

New Nature Economy Report II
The Future Of Nature And BusinessIn collaboration with AlphaBeta

World Economic Forum91-93 route de la CapiteCH-1223 Cologny/GenevaSwitzerlandTel.: +41 (0)22 869 1212Fax: +41 (0)22 786 2744Email: [email protected]
© 2020 World Economic Forum. All rights reserved. No part of this publication may be reproduced or transmitted in any form or by any means, including photocopying and recording, or by any information storage and retrieval system.

3New Nature Economy Report II – The Future Of Nature And Business
The Future of Nature and Business is published by the World Economic Forum in collaboration with AlphaBeta (www.alphabeta.com). It is the second in a series of reports from the New Nature Economy project, the first being Nature Risk Rising that was published in January 2020.
About the New Nature Economy Report (NNER) series
The series of New Nature Economy Reports (NNER) is being developed under the umbrella of the World Economic Forum’s work on nature, a platform for committed actors to join up ideas and efforts in the run-up to the UN Convention on Biological Diversity (CBD) COP15 – and in support of the related Business for Nature agenda. The NNER series aims to make the business and economic case for action.
The series will span three reports that focus on the following priorities:
1. Make the case for why nature loss is a material risk to business and the economy, including:
a. The scale and urgency of the nature crisis
b. The potential consequences for society if the crisis remains unchecked
c. The need for business to mainstream nature risk in corporate enterprise risk management
2. Provide the insights needed to develop practical roadmaps that address the most important drivers of nature loss, and build a nature-positive future, including:
a. The most pressing business-related threats to nature, which require urgent individual and collective action from business and other economic actors
b. The key socio-economic transitions needed to tackle the nature crisis; and the potential financial upside from concerted business action
c. The enforceable, supporting and coherent enabling mechanisms that will be needed to catalyse change at scale
3. Scope the market and investment opportunities for nature-based solutions to environmental and humanitarian challenges:
a. Research solutions across the biodiversity, climate mitigation, climate resilience and ocean agendas
b. Assess their economic and nature-building potential
c. Identify areas and approaches most relevant for private-sector finance
About the World Economic Forum
The World Economic Forum, committed to improving the state of the world, is the international organization for public-private cooperation. The Forum engages the foremost business, political and other leaders of society to shape global, regional and industry agendas.
4New Nature Economy Report II – The Future Of Nature And Business
Foreword
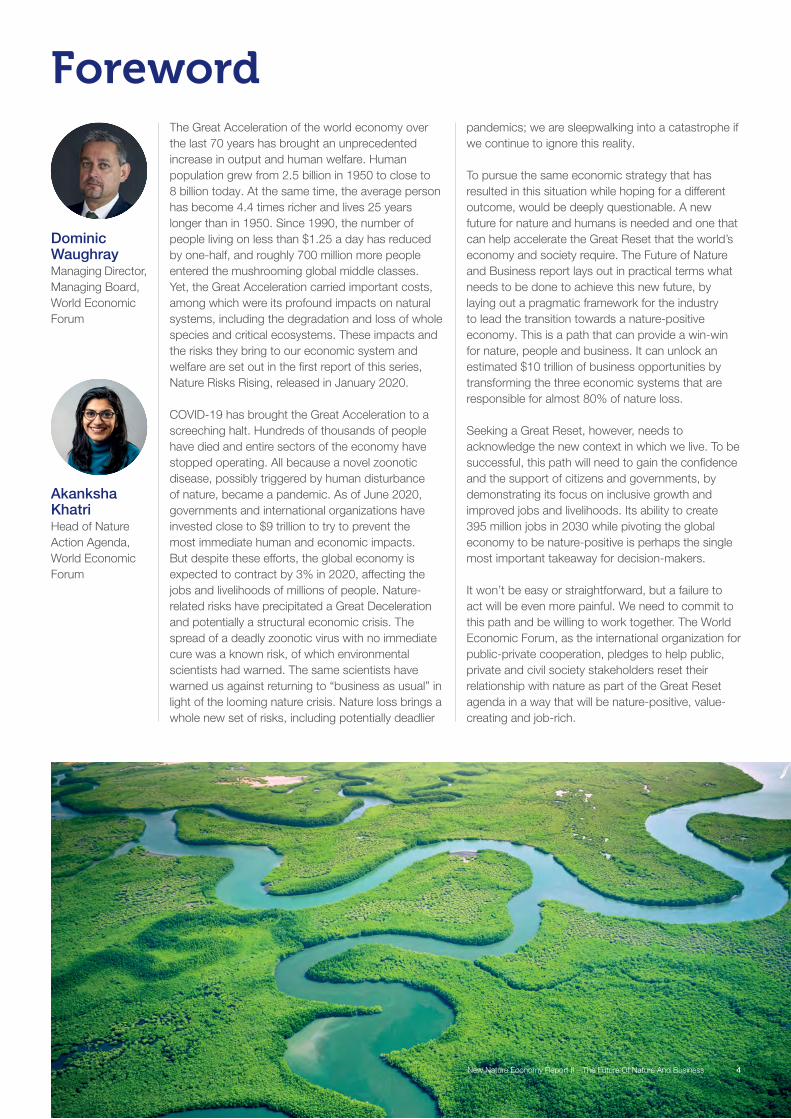
Dominic WaughrayManaging Director, Managing Board, World Economic Forum
Akanksha KhatriHead of Nature Action Agenda, World Economic Forum
The Great Acceleration of the world economy over the last 70 years has brought an unprecedented increase in output and human welfare. Human population grew from 2.5 billion in 1950 to close to 8 billion today. At the same time, the average person has become 4.4 times richer and lives 25 years longer than in 1950. Since 1990, the number of people living on less than $1.25 a day has reduced by one-half, and roughly 700 million more people entered the mushrooming global middle classes. Yet, the Great Acceleration carried important costs, among which were its profound impacts on natural systems, including the degradation and loss of whole species and critical ecosystems. These impacts and the risks they bring to our economic system and welfare are set out in the first report of this series, Nature Risks Rising, released in January 2020.
COVID-19 has brought the Great Acceleration to a screeching halt. Hundreds of thousands of people have died and entire sectors of the economy have stopped operating. All because a novel zoonotic disease, possibly triggered by human disturbance of nature, became a pandemic. As of June 2020, governments and international organizations have invested close to $9 trillion to try to prevent the most immediate human and economic impacts. But despite these efforts, the global economy is expected to contract by 3% in 2020, affecting the jobs and livelihoods of millions of people. Nature-related risks have precipitated a Great Deceleration and potentially a structural economic crisis. The spread of a deadly zoonotic virus with no immediate cure was a known risk, of which environmental scientists had warned. The same scientists have warned us against returning to “business as usual” in light of the looming nature crisis. Nature loss brings a whole new set of risks, including potentially deadlier
pandemics; we are sleepwalking into a catastrophe if we continue to ignore this reality.
To pursue the same economic strategy that has resulted in this situation while hoping for a different outcome, would be deeply questionable. A new future for nature and humans is needed and one that can help accelerate the Great Reset that the world’s economy and society require. The Future of Nature and Business report lays out in practical terms what needs to be done to achieve this new future, by laying out a pragmatic framework for the industry to lead the transition towards a nature-positive economy. This is a path that can provide a win-win for nature, people and business. It can unlock an estimated $10 trillion of business opportunities by transforming the three economic systems that are responsible for almost 80% of nature loss.
Seeking a Great Reset, however, needs to acknowledge the new context in which we live. To be successful, this path will need to gain the confidence and the support of citizens and governments, by demonstrating its focus on inclusive growth and improved jobs and livelihoods. Its ability to create 395 million jobs in 2030 while pivoting the global economy to be nature-positive is perhaps the single most important takeaway for decision-makers.
It won’t be easy or straightforward, but a failure to act will be even more painful. We need to commit to this path and be willing to work together. The World Economic Forum, as the international organization for public-private cooperation, pledges to help public, private and civil society stakeholders reset their relationship with nature as part of the Great Reset agenda in a way that will be nature-positive, value-creating and job-rich.

5New Nature Economy Report II – The Future Of Nature And Business
Preface by the Co-chairs of the Champions for Nature community
The economic, humanitarian and social fall-out from the COVID-19 pandemic crisis is far more severe than than the 2008-09 global financial crisis. Even with great uncertainty, IMF projects the global economy to contract by 3% in 2020. This shock will mostly affect the poor, informal and marginalized sections of society everywhere. As governments around the world are creating stimulus packages and reassigning budgets to fight this unprecedented crisis, it is imperative to also recognize this opportunity to reset humanity’s relationship with nature.
This crisis has reminded us that human and planetary well-being are intertwined. Nature must be at the heart of all our efforts and economic incentives aligned to promote the protection of biodiversity and integrate nature recovery goals into our business and financial decisions.
The human footprint on the planet has had an immense impact on the natural world. Unsustainable consumption and production patterns have come at the cost of healthy ecosystems, biodiversity, and human resilience.
Nature is the foundation of economic growth. As the world seeks to build back better, following the devastating impacts of COVID-19 there are no individual solutions to the challenges that lie ahead, only global ones. Building a healthier planet is the collective responsibility of all of us.
As we enter a historic decade of action to halt and reverse biodiversity loss by 2030 and address climate change, businesses have a critical role to play. They have the technology, innovation and resources to make the needed shifts towards increased investment in nature and nature-based solutions.
The global economy is inextricably linked to the health of our planet. How we produce, manufacture, consume and ultimately manage our waste is straining nature’s ability to cope. COVID-19 has shown the need to drive greater resilience in our global supply chains, food systems and healthcare delivery. Whilst there is still uncertainty in how the pandemic will unfold, we must recognise this as an opportunity to accelerate efforts to put nature at the centre of all decision-making.
This report identifies that 80% of biodiversity loss is driven by three economic sectors: food, land and ocean use, extractives and energy, and infrastructure and the built environment. As the dependence of our economies and businesses on nature is clear, we must identify and mitigate the risks of nature loss
Carlos Alvarado QuesadaPresident of Costa Rica
Inger AndersenUnder-Secretary-General of the United Nations and Executive Director, UN Environment Programme
Alan JopeChief Executive Officer, Unilever
As Co-chair of the Champions for Nature community and member of the High-Ambition Coalition for Nature and People, I welcome the clear transition pathways provided by this report.
Multilateral and multistakeholder cooperation will be key to realizing the opportunities identified in this report across three key socio-economic systems that can create USD 10 trillions of global GDP growth and 395 million jobs by 2030.
Leaders of the world today have a moral and pragmatic imperative to take bold decisions that protect, restore and sustainably manage the only planet we have and safeguard it for future generations.
The work of the United Nations Environment Programme and partners has shown that the restoration of land to achieve land degradation-neutrality by 2030 is cost effective and helps reduce poverty and inequality. And as we do so, we must call on and empower indigenous people, who have long been deploying the kind of solutions the world needs to adopt.
COVID-19 responses have shown us that we are capable of listening to science, changing behaviours and working collectively for a global solution. We must embrace these skills and support business in re-engineering their businesses towards sustainability. To do so, we will be enabled by the UN Decade for Action on Ecosystem Restoration which UNEP is proud to co-lead with numerous partners. The time to act together for nature is now.
from our business operations. There will be no jobs or prosperity on a dead planet!
That’s why last month Unilever set out a range of new, ambitious commitments and actions to fight climate change and protect nature, including net zero emissions for all our products by 2039 to point of sale and a €1 billion Climate and Nature fund for brands to take meaningful and decisive action. The climate crisis, nature loss, water scarcity are all interconnected and we must address them simultaneously to achieve a decarbonised, nature-positive world.
As Co-Chair of the Champions for Nature community and supporter of Business for Nature, I welcome this report and look forward to working with my peers for an ambitious action agenda for nature.

6New Nature Economy Report II – The Future Of Nature And Business
Towards a nature-positive food, land, and ocean use system
28
Nature’s call to action
17
Executive summary
7
Towards a nature-positive infrastructure and built environment system
54
Towards a nature- positive energy and extractives system
73
From opportunity to reality: Catalysing action for a nature-positive economy
92
CHAPTER
1 Ecosystem restoration and avoided land 31 and ocean use expansion
2 Productive and regenerative agriculture 33
3 Healthy and productive ocean 35
4 Sustainable management of forests 36
5 Planet-compatible consumption 38
6 Transparent and sustainable supply chains 40
Contents
1 Compact built environment 57
2 Nature-positive built environment design 59
3 Planet-compatible urban utilities 60
4 Nature as infrastructure 62
5 Nature-positive connecting infrastructure 63
1 Circular and resource efficient models for materials 76
2 Nature-positive metals and minerals extraction 78
3 Sustainable materials supply chains 80
4 Nature-positive energy transition 81
I
II
III
IV
V

EXECUTIVE SUMMARY
7New Nature Economy Report II – The Future Of Nature And Business
of people around the world. Addressing this humanitarian and health crisis is a clear priority. And yet the impact of the crisis on livelihoods is already putting additional strain on nature. Governments are redirecting funds away from conservation activities causing revenues of parks and nature reserves to dry up, and the rising rural poverty and reverse migration from urban areas is bringing additional pressure on wildlife and ecosystems. As the global focus turns from the health crisis to economic rebuilding and recovery, concerns for the health of the planet risk being side-lined.
This would be a mistake. COVID-19 is a stark reminder of how ignoring biophysical risks can have catastrophic health and economic impacts at the global scale. If recovery efforts do not address the looming planetary crises – climate change and nature loss – a critical window of opportunity to avoid their worst impact will be irreversibly lost. Decisions on how to deploy the post-COVID crisis stimulus packages will likely shape societies and economies for decades, making it imperative to “build back better” and not return to an unsustainable and dangerous business-as-usual
Executive summary
Nature is declining at an unprecedented rate, with nearly 1 million species at risk of extinction because of human activity. Earth system scientists have warned that the Amazon rainforest, the world’s coral reefs and the boreal forest biomes are all fast approaching the cusp of irreversible tipping points with far-reaching effects on the economy, society and life as we know it. The consequences are just as alarming for business and humanity as they are for the environment. The first report of the World Economic Forum’s New Nature Economy Report (NNER) series, Nature Risk Rising, highlighted that $44 trillion of economic value generation – over half the world’s total GDP – is potentially at risk as a result of the dependence of business on nature and its services. Biodiversity loss and ecosystem collapse ranked as one of the top five threats humanity will face in the next 10 years in the World Economic Forum’s 2020 Global Risks Report.
The window for action is narrowing at an alarming rate, while the cost of inaction is increasing. At the time of writing, the breakout of the COVID-19 crisis in early 2020 is tragically impacting the lives of millions and disrupting the livelihoods of billions

8New Nature Economy Report II – The Future Of Nature And Business
EXECUTIVE SUMMARY
approach. There is ample evidence that adopting green stimulus measures can generate even more effective economic and employment growth and build more resilient societies by aligning the global economy with planetary boundaries.
The World Economic Forum’s NNER series set out to highlight the materiality of nature loss for businesses, what transitions are needed to move towards a nature-positive economy and how businesses can be part of the solution paving the way for new opportunities. Now, more than ever, a dire need for leadership from all quarters is evident. This report provides a pragmatic agenda for business to contribute to the development of practical roadmaps that address the most important drivers of nature loss and build a nature-positive future. To successfully address this challenge will require tackling the indirect forces that underly the drivers of nature loss – such as global trade, production and consumption patterns, governance mechanisms and the values and behaviours of society – something business alone can seldom do. Even as lasting transformational change will often require enforceable and coherent regulatory and policy mechanisms and a shift in societal values, business leadership can help shape the agenda and move the goalpost of what is politically possible.
Fighting climate change is critical – but not enough – to halt biodiversity loss and safeguard nature.
The global assessment report from the Intergovernmental Science-Policy Platform on Biodiversity and Ecosystem Services (IPBES) highlighted five main drivers of biodiversity loss: changes in land and sea use; overexploitation of organisms; climate change; pollution; and invasive alien species. Climate change is currently responsible for between 11% and 16% of biodiversity loss. This share is expected only to increase, and it has the potential to trigger irreversible biome-scale ecosystem disruptions, making the decarbonization of the economy essential to limiting longer-term nature loss. Yet, as important and daunting as the decarbonization of the economy is, it is not enough if the other direct drivers of nature loss are not concurrently tackled. Businesses, through their operations and supply chains, directly impact nature. Whether through changes in land and sea use, overexploitation or pollution, their activities can have long-lasting harmful consequences for nature. These drivers of biodiversity loss need to be addressed urgently to stop nature loss, and these are ones this report mainly focuses on.
There is no future for business as usual – we are reaching irreversible tipping points for nature and climate, and over half of the global GDP, $44 trillion, is potentially threatened by nature loss.
Fighting climate change is essential but not enough to address the nature crisis – a fundamental transformation is needed across three socio-economic systems: food, land and ocean use; infrastructure and the built environment; and energy and extractives.
80% of threatened and near-threatened species are endangered by the three systems, which are responsible for the most significant business-related pressures to biodiversity; these are also the systems with the largest opportunity to lead in co-creating nature-positive pathways.
15 systemic transitions with annual business opportunities worth $10 trillion that could create 395 million jobs by 2030 have been identified that together can pave the way towards a people- and nature-positive development that will be resilient to future shocks.
Businesses can take practical actions to turn these opportunities into reality by working with governments and civil society to set the agenda, push the transitions forward and accelerate policy reforms.
$2.7 trillion per year through to 2030 will be needed to scale the transitions, including to deploy the technological innovation critical to 80% of the business opportunity value identified
Key findings at a glance

9New Nature Economy Report II – The Future Of Nature And Business
EXECUTIVE SUMMARY
FIGURE E1
Together, the threats emerging from the three systems endanger around 80% of the threatened or near-threatened species
Share of (near-) threatened species impacted*
* Consistent with methodology adopted by Maxwell et. al. (2016); “threatened” species include those that are critically endangered, vulnerable, and lower risk – conservation dependent. **Due to partial overlap between the species impacted by the three systems, the percentage of species impacted by all systems is smaller than the sum of the percentages of the species impacted by each system.
SOURCE: IUCN Red List of Threatened Species; AlphaBeta analysis
of all (near-) threatened species**
In sum, the three socio-economic systems
together with climate change impact
~79%
Food, land and ocean use
Infrastructure and the built environment
Energy and extractives
72%7 threats
29%6 threats
18%2 threats
FIGURE E2
15 transitions in the three socio-economic systems could deliver $10.1 trillion of annual business opportunities and 395 million jobs by 2030
Total business opportunities by system in 2030US$ billions*
Total jobs by system in 2030Millions
Food, land and ocean use
Infrastructure and the built environment
Energy andextractives
*Based on estimated savings or project market sizing in each area. These represent revenue opportunities that are incremental to business-as-usual scenarios. Where available, the range is estimated based on analysis of multiple sources. Rounded to nearest US$5 billion.
SOURCE: Literature review; Market research; Expert interviews; AlphaBeta analysis
3,565
191
3,015
117 87
3,530
Total
10,110
395

10New Nature Economy Report II – The Future Of Nature And Business
EXECUTIVE SUMMARY
Addressing the nature crisis requires a critical shift towards nature-positive models in three key socio-economic systems: food, land and ocean use; infrastructure and the built environment; and extractives and energy.
Analysing biodiversity threats with the higher granularity offered by their classification in the IUCN Red List, 15 non-climate threats to biodiversity emerge as the most important for business to engage with, based on three criteria: (1) the importance of the threat to biodiversity loss; (2) the role of business in causing the threat, and therefore the potential of business to address it; and (3) the potential of the threat to disrupt business activities. These 15 biodiversity threats all relate to three main socio-economic systems: the food, land and ocean use system; the infrastructure and the built environment system; and the extractives and energy system. Together, these threats endanger around 80% of the total threatened and near-threatened species identified by the IUCN Red List (Figure E1).
BOX E1
Quantifying the new business opportunities
The business opportunity figures and associated employment and investments presented in this report are estimates of the annual savings or the revenue upside generated by the major opportunities (those worth at least $15 billion in 2030) in 2030, expressed in 2019 US dollars and rounded to the nearest $5 billion. Employment figures are based on regional labour productivity rates, while investment estimates are based on opportunity-specific case studies.
These estimates depict the incremental size of the business opportunities in a nature-positive scenario compared to what could be achieved in a business-as-usual scenario. These figures are not an attempt to estimate the full value of the benefits provided by nature but instead focus on financial shifts in revenue or profit pools. As a result, carbon sequestration is priced only for those opportunities where it is positioned as a revenue source. To reflect the impact of the COVID-19 pandemic, consumer demand forecasts were revised to incorporate the impact of the crisis on GDP growth in 2020 and 2021 as forecasted by the International Monetary Fund.1
1. Prior to the COVID-19 pandemic, the International Monetary Fund (IMF) forecasted global growth of 3.3% in 2020 and 3% in 2021. It has now forecasted the global economy to shrink by 3% in 2020 and grow by 5.8% in 2021. The average global growth rates over the next two years are now 41% of the predicted growth rates that were forecasted previously. This adjustment is made to the growth rates of consumer demand–related opportunities (e.g. organic food demand, eco-tourism) for the next two years, and then it is assumed the pre-COVID estimates of growth return. Fourteen of the opportunities sized, largely in the food, land and ocean use system, are impacted by these adjustments and are discussed further in the Methodological Note. For further details, see IMF, April 2020, World Economic Outlook, April 2020: The Great Lockdown, https://www.imf.org/en/Publications/WEO/Issues/2020/04/14/weo-april-2020
Currently, these systems represent over a third of the global economy and provide up to two-thirds of all jobs. Transitioning these systems to nature-positive models is necessary both to stave off the rising risks associated with the loss of nature and to meet the growing demands of investors and other stakeholders for business to fulfil a positive role in society. But a nature-positive model can also unlock significant benefits.
Responding to the profound social and economic crisis looming in the wake of the COVID-19 pandemic requires a reset of how we live, produce and consume to achieve a resilient, carbon neutral, nature-positive economy and halt biodiversity loss by 2030. This reset needs both to decouple our well-being from resource consumption to reduce the amount of resources we need, thereby sparing ecosystems as much as possible, and to decouple resource extraction from negative impact on ecosystems by better sharing with nature what lands and ocean we use.
Benefiting from the extensive work of multiple international initiatives – including the Food and Land Use Coalition, the Business and Sustainable Development Commission, the EAT-Lancet Commission, and the International Resource Panel – and the long-standing efforts of international organizations, academic researchers, and think tanks, and backed by our analysis and a consultative process spanning academia, business, civil society and governments, this report puts forward 15 priority transitions across the three key socio-economic systems that can form the blueprint of a multistakeholder action agenda for nature-positive pathways.
Associated with those priority transitions, the report identifies several emerging opportunities to engage in nature-positive business models (Box E1). Some are innovative technology–driven business models already being pursued and attracting private capital – from alternative proteins to food waste–saving technologies. Others – such as land restoration and sustainable fisheries – are more nascent and are currently being pushed by impact-oriented investors, social enterprises and blended capital. Still others, including many nature-based solutions, are attracting considerable interest from large corporations but might require regulatory and policy development to scale up. Altogether, the opportunities identified in this report add up to $10.1 trillion in annual business value and could create 395 million jobs by 2030 (Figure E2) – which represents around one-fifth of the total projected increase in the global labour force between now and 2030. These jobs are also more likely than jobs in business-as-usual business models to be resilient and offer the opportunity for better livelihoods.

11New Nature Economy Report II – The Future Of Nature And Business
EXECUTIVE SUMMARY
Towards a nature-positive food, land and ocean use system
achieve science-based emission reduction targets. But to fully succeed, the transition needs the support of policy and regulation, which are especially effective in the form of spatial planning that identifies and protects critical ecosystems and ensures that fiscal incentives and subsidies stop encouraging ecosystem conversion but rather spur restoration.
Second, the food and land use system could significantly benefit from a fundamental shift towards productive and regenerative agriculture. Transforming agricultural landscapes and farming practices for both food and non-food agriculture through a combination of traditional farming techniques, advanced precision technologies, and bio-based inputs can increase biodiversity, enrichen soils, improve water management and enhance ecosystem services while improving yields. This transition requires greater understanding and adoption of the appropriate agronomic solutions, including re-alignment of agriculture subsidies, while navigating trade-offs between improving yields and strengthening biodiversity outcomes.
Similarly, if sustainably managed, our fisheries could be conducive to a healthy and productive ocean. To fulfil this potential will require managing wild fisheries sustainably by respecting and upholding biologically viable quotas and limiting fishing to specific zones. This also involves transitioning towards sustainable and healthy aquaculture in oceanic, wetland, and freshwater areas to reduce degradation in these critical ecosystems and replenish overexploited fish stocks. Impacts of other ocean industries, such as renewable energy, transportation and mineral extraction, also need to be considered.
Fourth, given the outsized impact of logging on biodiversity, a transition to sustainable management of forests is critical. Techniques such as reduced-impact logging, improved harvest planning and precision forestry can allow forests to flourish while meeting the world’s resource needs. However, a successful transition will rely on finding just and equitable solutions that address the land rights of indigenous peoples and local communities, who have demonstrated themselves to be the best stewards of forests.
These first four transitions need to happen in the context of a rapidly expanding global population that is demanding more resource-intensive foods. Based on current consumption trends, global food
The global food, land and ocean use system, including its full supply chains, represents around $10 trillion of GDP (12% of global GDP) and up to 40% of employment. The system provides the food and clothes that sustain humans in their daily lives and is crucial for the livelihoods of millions of people, particularly in low-income countries. The rise in both global population and a global consuming class with the purchasing power to demand more food and clothing per capita will require substantial growth in this system’s outputs if current production and consumption patterns are maintained. Yet, this system already places enormous strain on planetary boundaries, with the threats relating to it impacting around 72% of all threatened and near-threatened species. As a result, the system is coming under growing strain and scrutiny. It is increasingly at risk from a changing climate and is already delivering very unequal outcomes in food security, nutrition and health, such that the hidden costs of the food, ocean and land use system – an estimated $12 trillion – now exceed its contribution to global GDP. Calls for radically transforming food production processes, halving food loss and waste, and achieving significant dietary shifts were already rising. The onset of the COVID-19 pandemic has only increased the urgency of many of these issues, highlighting the environmental, economic and social strain embedded in the current food supply chains and farming models.
Six complementary socio-economic transitions can together place the food, land and ocean use system on a pathway to sustainable, nature-positive development. Together, the business opportunities associated with these six transitions could create almost $3.6 trillion of annual additional revenue or costs savings while creating 191 million new jobs by 2030.
First, the ever-expanding footprint of farming, fishing and ranching is unsustainable. Instead, human societies should rapidly transform their primary sectors to achieve ecosystem restoration and avoided land and ocean use expansion. To secure this transition, the first and immediate step is to stabilize and reduce the footprint of agriculture and fishing on ecosystems while concurrently restoring degraded ecosystems to return them to nature. Business action is very important for this transition – for example, through no-deforestation policies in commodity supply chains, high carbon stock and high-conservation value approaches by producers, or through the use of nature-based solutions to

12New Nature Economy Report II – The Future Of Nature And Business
EXECUTIVE SUMMARY
production would need to increase by between 50% and 98% by 2050 from 2005 levels. This increase would jeopardize the ambition for the food, land and ocean use system to both share with and spare nature. To overcome this challenge, a fifth transition towards planet-compatible consumption will be required, one that shifts away from the overconsumption of resource-intensive foods – something that also holds significant potential to improve health outcomes – and from wasteful fast fashion. This transition would address the significant amount of consumer waste generated in this system, especially by the wealthiest consumers.
Finally, such an ambitious transformation of how we produce and consume food, including seafood, and other agricultural and forestry products needs the support of transparent and sustainable supply chains. By integrating transparency, traceability and increased collaboration into supply chains, stakeholders can improve sustainable sourcing; eliminate illegality; reduce food and material loss; improve safety and quality; and ensure that consumers, regulators and investors are able to make informed decisions that, in turn, reinforce responsible production.
Towards a nature-positive infrastructure and built environment
Decisions made on infrastructure, including those that will be made as part of the stimulus packages for COVID-19 recovery, have long-lasting impacts and will play a crucial role in influencing the future of societies and their relationship with nature. Five complementary socio-economic transitions can together place the infrastructure and built environment system on a pathway to sustainable, nature-positive development. Together, the business opportunities associated with these five transitions could create over $3 trillion of additional annual revenues or cost savings and create 117 million jobs by 2030.
First, a compact built environment is essential to rein in the spread of cities and human settlements. This involves protecting critical ecosystems from conversion to human settlements and promoting compact development in both existing cities and new cities. The success of this transition requires policy innovation, such as spatial and land-use master planning and transit-oriented development, as well as shifting incentives away from suburban-style living. Designing strategically dense built areas creates large opportunities from savings in excess infrastructure or from revenue from higher-value land use models and optimized asset utilization.
Second, shifting towards nature-positive infrastructure design will be essential. Innovative planning, design and construction shows that engineered solutions that leverage nature for heating, cooling and lighting through elements such as streetscapes, roofs, walls and raingardens can boost natural ecosystem health, reduce
With an estimated 40% of global GDP currently originating from the built environment, this system is of crucial importance to the global economy. In recent decades, spending in this system has been critical to driving economic growth, alleviating poverty and improving living standards. Cities are often the engine of the modern economy, providing the density, interaction and networks that make societies more creative, productive, prosperous and healthy. However, the rapid expansion of the built environment – a 66% increase in the urban land area in the first 12 years of the century – has significantly impacted the surrounding ecosystems. The threats emerging from the infrastructure and the built environment system together impact 29% of the IUCN’s list of threatened and near-threatened species.
Under a business-as-usual scenario, the built environment will continue to expand rapidly. Every week until 2030, around 1.5 million people will be added to cities, and built areas will continue to grow. Demand for infrastructure investments is estimated at $6 trillion per year, with a projected financing gap of roughly half the required spending. Poorly planned and uncoordinated expansion of human settlements not only impacts biodiversity but is also economically inefficient. For instance, in low-density cities with high rates of car usage, providing utilities and public services costs up to 30% more than it does in high-density cities. Traffic congestion, which often results from poor land and mobility planning, lowers national GDP by as much as 5% due to negative impacts such as time loss, wasted fuel and air pollution.

13New Nature Economy Report II – The Future Of Nature And Business
EXECUTIVE SUMMARY
greenhouse gas (GHG) emissions, provide large cost savings, and promote people’s well-being. Critically, such principles also apply to legacy infrastructure, which can be retrofitted with nature- and climate-smart innovations that improve their overall footprint and efficiency.
Third, planet-compatible urban utilities are needed to manage and reduce airborne and waterborne pollution and the solid waste that human settlements leak into their surroundings. Smarter and cleaner utilities that provide cleaner air, safer water, more efficient sanitation, modern energy, and comprehensive waste and recycling services benefit both nature and people.
Fourth, complementing human-engineered solutions with restoring and protecting nature as infrastructure can be used to build resilience to
extreme weather events or provide essential services such as water supply and treatment. Protecting and restoring natural ecosystems such as floodplains, wetlands and forests often involves working with rural communities, including indigenous peoples who are guardians of large natural areas. Experience shows that the benefits and savings from protecting and restoring natural infrastructure can be substantial and are likely to rise in the face of mounting climate risks, while providing important climate mitigation benefits as well.
Finally, nature-positive connecting infrastructure needs to be used for the transport links between urban areas. Ecosystem impact assessments, biodiversity “offsets”, subterranean infrastructure or the use of eco-bridges and new forms of transportation that reduce the need for physical assets can enable long-range infrastructure projects.
Accounting for an estimated 23% of global GDP and 16% of employment, the extraction, production, manufacturing and generation of energy and materials is both a major contributor to global economic growth and a major threat to biodiversity. Its negative externalities – air pollution and carbon emissions – equate to $9 trillion annually or around 10.5% of global GDP.
Reversing the energy and extractives system’s negative impact involves both improving consumption efficiency to reduce the amount of resources that need to be extracted and improving how those resources are extracted to minimize their impact on ecosystems while shifting to more renewable energy. Four complementary socio-economic transitions can, together, place the energy and extractives system on a pathway towards a people- and nature-positive development. Together, the business opportunities associated with these four transitions could create additional annual revenue or costs savings in 2030 while creating 87 million new jobs.
First, rapidly scaling circular and resource-efficient models of production will reduce the amount of new resources needed to satisfy our consumption needs. These new models require rethinking production processes across the
economy; shifting research and development expenditure towards understanding how to reduce or recapture material waste; and encouraging behavioural changes among businesses and consumers to increase willingness to recycle, refurbish and rent rather than own.
Second, nature-positive metals and mineral extraction is required to reduce the impact of the extraction that is unavoidable in the mineral and metals sectors. This approach includes non-invasive exploration techniques, sustainable management of extractive sites, more-efficient extraction, and plans for extensive remediation of ecosystems and communities once extraction is complete. Applied within a rigorous mitigation hierarchy – avoidance, minimization, rehabilitation, offsetting and compensation – this transition can unlock substantial business opportunities ranging from resource recovery to water efficiencies, while also preventing destruction of critical remote ecosystems such as the deep sea.
Nature-positive extractive activities need the support of sustainable materials supply chains to succeed. A range of conservation initiatives, mineral governance frameworks, new technologies and corporate commitments can help to integrate
Towards a nature-positive extractives and energy system

14New Nature Economy Report II – The Future Of Nature And Business
EXECUTIVE SUMMARY
transparency and traceability into supply chains to help combat the threat of illegal and often environmentally degrading extractive activities. At the same time, the transition must champion the inclusion of currently informal activities that support millions of rural and indigenous livelihoods in sustainable supply chains.
Finally, a nature-positive energy transition away from fossil fuels and towards renewables
needs to be managed so that the necessary deep decarbonization of the energy sector does not happen at the expense of nature. This involves managing the design, siting and resource demand of renewable energy projects, capturing the substantial opportunity for protection and restoration of nature implicit in natural climate solutions, and carefully balancing the climate benefits and biodiversity implications of the development of bioenergy.
From opportunity to reality: Catalysing action for a nature-positive economy
Achieving these transitions cannot be done through business action alone. Success will require both policy and regulation from governments and shifts in habits and social norms from citizens.
The need for political will and supportive policies is particularly strong in the context of the unprecedented economic and social disruption triggered by the COVID-19 pandemic. Recovery packages in response to the crisis must not reinforce existing negative economic models, but rather support investments in alternative nature-positive pathways. In addition, a few cross-cutting policy shifts are particularly important to the successful adoption of the identified business transitions, from realigning incentives to developing integrated and actionable maps.
Yet the speed of change required, the future budget constraints facing governments that are now preparing to spend heavily in the recovery from the pandemic, and the reality of a fracturing of international cooperation and coordination all point to the limits of relying on governments as the sole leaders on this agenda. Businesses have the resources, and thus the responsibility, to lead in the areas where they can move ahead of policy and regulation – for example, through voluntary commitments – and to engage and advocate with government and other stakeholders to advance the needed policy reforms. They also can join or build alliances and collaboration platforms to co-create shared transition roadmaps for specific value chains or regions. These alliances can be used to accelerate the deployment of innovative financing models and technological innovation to catalyse change at the required scale.
Ultimately the role of business in these transitions will vary by sector and region, but there are practical common steps that every business can take. First, businesses should identify the transitions that are relevant to them and the role they can play in leading or supporting them. Some transitions, such as the implementation of circular and resource-efficient models for which nine sectors have a particularly important role, have high cross-sectoral relevance. Other transitions, such as shifting towards a healthy and productive ocean, will require strong collaboration across sectors that currently rarely interact (Figure E3).
Second, business should adopt and implement appropriate voluntary corporate policies and best practices regarding their impact on nature, and they should promote these policies and best practices among their suppliers, customers and other business partners. Although voluntary corporate action is often not enough to achieve transformative change, a critical mass of businesses adopting similar ambitious standards of environmental and social responsibility moves the goalpost of what is possible and desirable and changes the decision-making calculus for regulatory choices. Unfortunately, many businesses still lag on this measure – for example, 242 of the 500 companies most exposed to deforestation risk still have not made any public commitment to end deforestation. This inaction is irresponsible and increasingly at risk of bringing negative reactions from investors.
Third, businesses should explore potential public-private cooperation opportunities across sectors to create the critical mass of change agents required to tip markets and value chains towards nature-positive models. In some cases, these collaborations will bring together businesses and other actors from sectors that currently rarely interact. Examples include the Tropical Forest Alliance (TFA), a platform to eliminate tropical deforestation from the production of agricultural commodities, which is relevant to transitions on

Food, land and ocean use
Infrastructure and the built environment
Energy and extractives
Transition
Sectors Eco
syst
em re
stor
atio
n
and
avoi
ded
expa
nsio
n
Pro
duct
ive
and
rege
nera
tive
agric
ultu
re
Hea
lthy
and
pr
oduc
tive
ocea
n
Sus
tain
able
man
agem
ent
of fo
rest
s
Pla
net-
com
patib
le
cons
umpt
ion
Tran
spar
ent a
nd
sust
aina
ble
supp
ly c
hain
s
Den
sific
atio
n of
the
ur
ban
envi
ronm
ent
Nat
ure-
posi
tive
built
en
viro
nmen
t des
ign
Pla
net-
com
patib
le
urba
n ut
ilitie
s
Nat
ure
as in
frast
ruct
ure
Nat
ure-
posi
tive
conn
ectin
g in
frast
ruct
ure
Circ
ular
and
reso
urce
-ef
ficie
nt m
odel
s
Nat
ure-
posi
tive
met
als
an
d m
iner
als
extr
actio
n
Sus
tain
able
mat
eria
ls
supp
ly c
hain
s
Nat
ure-
posi
tive
en
ergy
tran
sitio
n
Advanced manufacturing
Aerospace
Agriculture, food & beverages
Automotive
Aviation, travel & tourism
Banking & investors
Chemicals & advanced materials
Electronics
Energy & utilities
Health & healthcare
IT & digital communications
Infrastructure & urban development
Insurance & asset management
Media, entertainment & information
Mining & metals
Oil & gas
Professional services
Retail, consumer goods & lifestyle
Supply chain & transportation
15New Nature Economy Report II – The Future Of Nature And Business
EXECUTIVE SUMMARY
1. Principal role implies that the sector is directly involved in components of the transition that will halt and reverse biodiversity loss
2. Enabling role implies that the sector can potentially support key activities in the transition
Principal1
Enabling2
Sector role in transition
FIGURE E3
A number of key sectors in the economy will be critical to engage in the business agenda across socio-economic systems
ecosystem restoration and avoided land and ocean use, productive and regenerative agriculture, and transparent and sustainable supply chains.
Fourth, once a portfolio of initiatives and partners has been developed, businesses need to determine the mix of enablers that would unlock success
– including new capital investment and Fourth Industrial Revolution technologies. Even the business opportunities that have already been identified can be captured only partly by reorienting existing processes. Many of these opportunities will require substantial new investments. We estimate that the total annual investment required through 2030 for
SOURCE: World Economic Forum; AlphaBeta analysis

16New Nature Economy Report II – The Future Of Nature And Business
EXECUTIVE SUMMARY
all opportunities identified across the three systems is around $2.7 trillion (Figure E4). Although significant, this investment is comparable to the recent stimulus package of $2.2 trillion announced by the United States in March 2020 in response to COVID-19. However, the nature of these investments might prove a greater challenge in raising capital. Investment needs are often located in emerging markets, where small and medium-sized enterprises typically lack the direct access to capital markets of larger firms and require smaller average investment size and novel payback models that can increase transaction costs and risks. These challenges are solvable but will require innovations in capital investment processes, such as blended finance, new supply chain models, and the development of shared service models.
The other part of the solution will come from technological innovation. Fourth Industrial Revolution technologies play an important role for over 80% of the business opportunities identified in this report and are thus fundamental to unlocking nearly $8.7 trillion in value. In the food, land and ocean use system, Fourth Industrial Revolution technologies can improve the resource efficiency of agricultural production, enhance the monitoring and management of large natural assets on land and in the oceans, and improve the monetization of the value of nature. Technology-enabled platforms that lead to improved asset optimization, and thus reduce the need for infrastructure and resources, bring benefits across both the infrastructure and built environment, and the energy
and extractive systems. Advanced geospatial analytics can improve both the planning of the built environment and efficiency in the extractive and energy sectors. Advanced biotechnologies hold promise to improve agricultural productivity, reduce pollution from fertilizers and pesticides, and deliver third-generation biofuels that do not compete with food for land. Many of these innovations rely on a combination of both public data and proprietary data. They will require the development of effective data governance mechanisms that support the necessary exchange of information and protect against misuse to unlock innovation that will support nature-positive business opportunities.
We are at a critical juncture for the future of human societies: we face an unprecedented global humanitarian and health crisis with the COVID-19 pandemic while the hour is late to stave off the worst of the climate and nature crises. A clear commitment to building back better will be needed from business, government and individuals, or what fragile pandemic recovery we achieve will both lack the resilience provided by nature, and face ever increasing climate risks. This report has set forth an articulated action agenda for business to tackle nature loss, prioritizing which biodiversity threats to engage on, identifying the key transitions needed to tackle them, and sizing the potential financial upside from concerted business action. It is now the time to take these insights and translate them into collective and transformative action.
FIGURE E4
Capital investment required to capture opportunities in the three systems is around $2.7 trillion annually
* Based on estimated investment requirements to capture the business opportunities linked to transitions in each system. Rounded to nearest $5 billion.
SOURCE: Literature review; Global Sustainable Investment Alliance; AlphaBeta analysis
2,710
Annualized investment costs (2020-30)$ trillion; 2019 values*
Food, land and ocean use
Infrastructure and the built environment
Energy and extractives
While this is a substantial capital
demand, it is comparable with the $2.2 trillion stimulus
package announced by just the US in March 2020 in response to
COVID-19
440
1,430
840
Total

Nature’s call to actionThree socio-economic systems have a major role to play in tackling biodiversity loss
CHAPTER I

18New Nature Economy Report II – The Future Of Nature And Business
Combating climate change is necessary but not sufficient to tackle biodiversity loss. Three socio-economic systems have the greatest responsibility to address the looming nature crisis and avoid its devastating social, health and economic costs. They also have the largest potential to make an impact in averting the crisis, and to benefit from doing so. These are food, land and ocean use; infrastructure and the built environment; and energy and extractives.

19New Nature Economy Report II – The Future Of Nature And Business
NATURE’S CALL TO ACTIONI
Nature is declining at an unprecedented and accelerating rate. Nearly 1 million species are at risk of extinction because of human activity, according to the 2019 Global Assessment Report of the Intergovernmental Panel of Biodiversity and Ecosystem Services (IPBES), its most comprehensive to date.1
Over the past year, the world has witnessed multiple natural calamities ranging from fires in the Amazon, California and Australia to record temperatures of 20.75°C in the Antarctic.2 Earth system scientists have warned that the Amazon rainforest, the world’s coral reefs and its boreal forests are all fast approaching the cusp of irreversible tipping points that could trigger rapid biome shifts with far-reaching effects on economy, society and life as we know it.3 And, crucially, the links between biodiversity losses and the rise of infectious diseases must not be ignored. The COVID-19 pandemic has shone a light on the domino effect that is triggered when one element in interconnected systems is destabilized. Altering nature without fully understanding the consequences can have devastating implications for humans. The number of new infectious diseases has quadrupled in the last 60 years.4 Natural habitats are being diminished, causing wild animals to live in closer quarters to one another and to humans.5 While the origin of the COVID-19 virus is yet to be established, 70% of emerging infectious diseases originate from wildlife.6
The first report of the World Economic Forum’s New Nature Economy Report (NNER) series, Nature Risk Rising, highlighted that $44 trillion of economic value generation – over half the world’s total GDP – is potentially at risk because of the dependence of business on nature and its services. 7 Biodiversity loss and ecosystem collapse ranked as one of the top five threats humanity will face in the next 10 years, according to the World Economic Forum’s 2020 Global Risks Report.8 The window for action is narrowing at an alarming rate, while the cost of inaction is increasing. In the Asia-Pacific region, for instance, the “natural” disasters in 2018 impacted 50 million people and cost the region $56.8 billion. These disasters were exacerbated by environmental damage as the coastal ecosystems that could have protected the region from flooding and other extreme weather events had previously been destroyed. Globally, pollinator populations have declined, putting at risk the production of global crops with an annual market value of between $235 billion and $577 billion – because these crops depend on animal pollination.9 These are but a few of the examples of how dependent human societies and economic activities are on nature and biodiversity. A business-as-usual route, which disregards this reality, is not a viable option.
At the time of writing, the breakout of the COVID-19 crisis in early 2020 is tragically impacting the lives of hundreds of thousands and disrupting the livelihoods of billions of people around the world. This humanitarian and health crisis is also a nature crisis, and apparent benefits to nature are superficial and temporary. Governments are redirecting funds away from conservation activities and ecotourism has come to a halt causing revenues of parks and nature reserves to dry up, while the rising rural poverty and reverse migration from urban areas is bringing additional pressure on wildlife and ecosystems.10 As the global focus turns from the health crisis to economic rebuilding and recovery, concerns for the health of the planet risk being side-lined.
This would be a mistake. COVID-19 is a stark reminder of how ignoring biophysical risks can have catastrophic health and economic impacts at the global scale. If recovery efforts do not address the looming planetary crises – climate change and nature loss – a critical window of opportunity to avoid their worst impact will be irreversibly lost. Decisions on how to deploy the post-COVID crisis stimulus packages will likely shape societies and economies for decades, making it imperative to “build back better” and not return to an unsustainable and dangerous business-as-usual approach. Ample evidence indicates that adopting green stimulus measures can generate even more effective economic and employment growth and build more resilient societies by aligning the global economy with planetary boundaries.
The World Economic Forum’s NNER series set out to highlight the materiality of nature loss for business, the transitions that are needed to move towards a nature-positive economy, and the ways business can be part of the solution by pursuing new business models and new opportunities. Now, more than ever, a dire need for leadership from all quarters is evident. This report provides a pragmatic agenda for business to step up and contribute to the development of concrete roadmaps that address the most important drivers of nature loss and build a nature-positive future. To successfully address this challenge will require tackling the indirect forces that underlie the drivers of nature loss – such as global trade, production and consumption patterns, and governance mechanisms and the values and behaviours of society – something business alone can seldom do. Even as lasting transformational change will often require enforceable and coherent regulatory and policy mechanisms and a shift in societal values, business leadership can help shape the agenda and move the goalpost of what is politically possible.
20New Nature Economy Report II – The Future Of Nature And Business
2,000
1,000
0
Low MediumRole of business in biodiversity threats2
Biodiversity impact3
Disruption risk1 Threats to biodiversity prioritized for business action (bold text)
High
4,500
VE
RY
HIG
HH
IGH
ME
DIU
MLO
W
12,000
Low Medium
Number of threatened/near-threatened species
High
9. Housing andurban areas
3. Livestock farmingand ranching
1. Annual and perennialnon-timber crops
2. Logging and wood harvesting
13. Commercial and industrial areas
14. Industrial and military
effluents
Work and other activities
15. Mining andquarrying
Shipping lanesMarine and freshwater aquaculture
Problematicspecies/
diseases ofunknown origin
Rubbish and solid waste
Airborne pollutants
Excess energy
Oil and gas drilling
Utility andservice lines
Renewable energy
Introduced genetic material
Flight paths
Wood and pulp plantations
Hunting and collectingterrestrial animals 11. Domestic
and urban waste water
7. Dams and watermanagement/use
5. Fire and fire suppression
4. Invasive non-native/alien species/diseases
Recreationalactivities
War, civil unrestand military
exercises
Earthqaukes/tsunamis
Volcanoes
Avalanches/landslides
Habitat shiftingand alteration
Droughts
Temperatureextremes
Other impacts of climate change
Storms andflooding
Gatheringterrestrial plants
Problematic nativespecies/diseases
Other ecosystemmodifications
Viral/prion-induceddiseases
Diseases ofunknown cause
12. Roads andrailroads
10. Tourism andrecreationareas
6. Agricultural andforestry effluents
7. Fishing and aquatic resources
[Threat name]
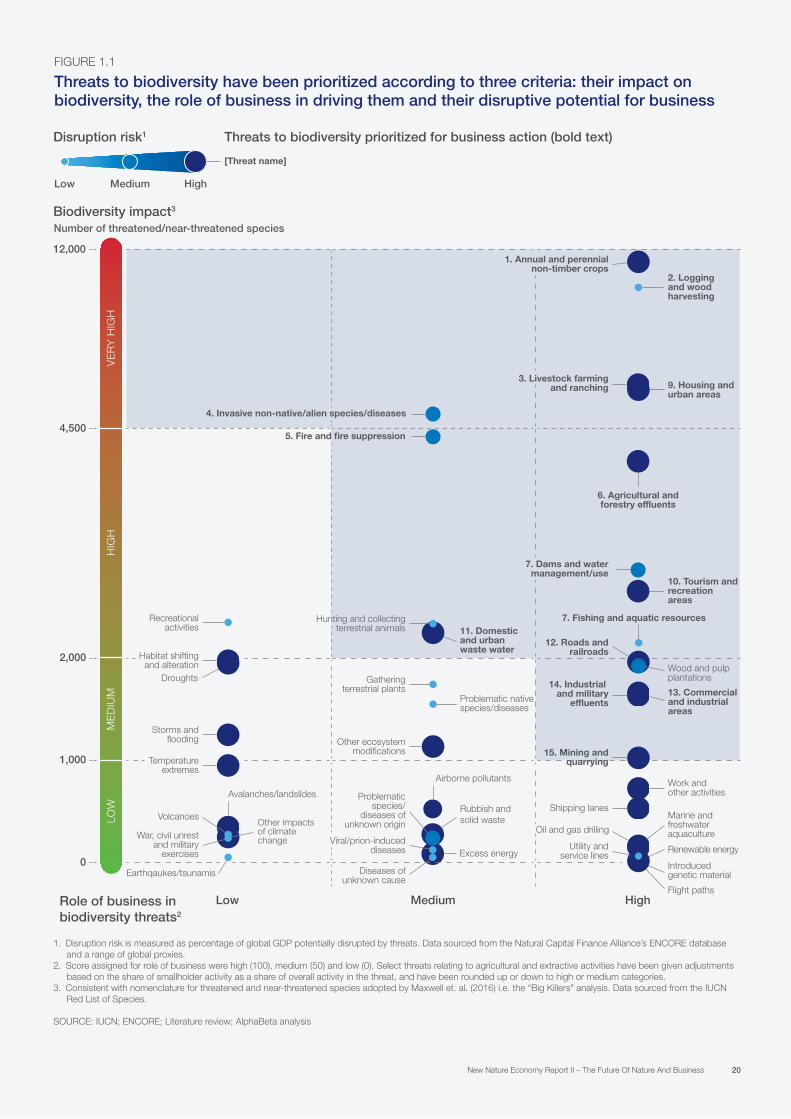
1. Disruption risk is measured as percentage of global GDP potentially disrupted by threats. Data sourced from the Natural Capital Finance Alliance’s ENCORE database and a range of global proxies.
2. Score assigned for role of business were high (100), medium (50) and low (0). Select threats relating to agricultural and extractive activities have been given adjustments based on the share of smallholder activity as a share of overall activity in the threat, and have been rounded up or down to high or medium categories.
3. Consistent with nomenclature for threatened and near-threatened species adopted by Maxwell et. al. (2016) i.e. the “Big Killers” analysis. Data sourced from the IUCN Red List of Species.
SOURCE: IUCN; ENCORE; Literature review; AlphaBeta analysis
FIGURE 1.1
Threats to biodiversity have been prioritized according to three criteria: their impact on biodiversity, the role of business in driving them and their disruptive potential for business
21New Nature Economy Report II – The Future Of Nature And Business
NATURE’S CALL TO ACTIONI
Fighting climate change is critical – but not enough – to halt biodiversity loss and safeguard nature.
The IPBES Global Assessment Report identifies five main drivers of biodiversity loss: changes in land and sea use; overexploitation of organisms; climate change; pollution; and invasive alien species.11 Climate change is currently responsible for between 11% and 16% of biodiversity loss. This share is expected only to increase, and it has the potential to trigger irreversible biome-scale ecosystem disruptions,12 making the decarbonization of the economy essential to limiting longer-term nature loss. Yet, as important and daunting as the decarbonization of the economy is, it is not enough if the other direct drivers of nature loss are not tackled concurrently. Businesses, through their operations and supply chains, directly impact nature. Whether through changes in land and sea use, overexploitation or pollution, their activities can have long-lasting harmful consequences for nature. These drivers of biodiversity loss need to be addressed urgently to stop nature loss, and these are ones this report mainly focuses on.
To identify the most pressing business-related threats to biodiversity, our research analysed the
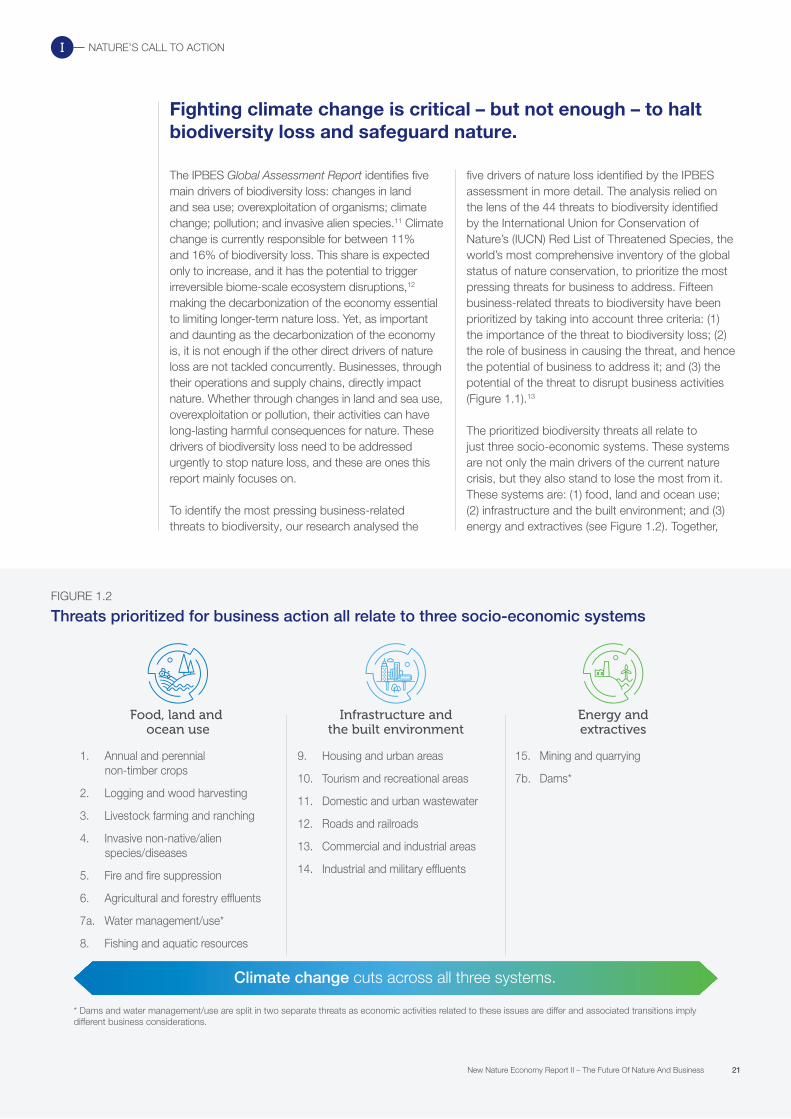
* Dams and water management/use are split in two separate threats as economic activities related to these issues are differ and associated transitions imply different business considerations.
Infrastructure andthe built environment
Food, land and ocean use
Energy andextractives
1. Annual and perennial non-timber crops
2. Logging and wood harvesting
3. Livestock farming and ranching
4. Invasive non-native/alien species/diseases
5. Fire and fire suppression
6. Agricultural and forestry effluents
7a. Water management/use*
8. Fishing and aquatic resources
9. Housing and urban areas
10. Tourism and recreational areas
11. Domestic and urban wastewater
12. Roads and railroads
13. Commercial and industrial areas
14. Industrial and military effluents
15. Mining and quarrying
7b. Dams*
FIGURE 1.2
Threats prioritized for business action all relate to three socio-economic systems
Climate change cuts across all three systems.
five drivers of nature loss identified by the IPBES assessment in more detail. The analysis relied on the lens of the 44 threats to biodiversity identified by the International Union for Conservation of Nature’s (IUCN) Red List of Threatened Species, the world’s most comprehensive inventory of the global status of nature conservation, to prioritize the most pressing threats for business to address. Fifteen business-related threats to biodiversity have been prioritized by taking into account three criteria: (1) the importance of the threat to biodiversity loss; (2) the role of business in causing the threat, and hence the potential of business to address it; and (3) the potential of the threat to disrupt business activities (Figure 1.1).13
The prioritized biodiversity threats all relate to just three socio-economic systems. These systems are not only the main drivers of the current nature crisis, but they also stand to lose the most from it. These systems are: (1) food, land and ocean use; (2) infrastructure and the built environment; and (3) energy and extractives (see Figure 1.2). Together,

22New Nature Economy Report II – The Future Of Nature And Business
NATURE’S CALL TO ACTIONI
they endanger around 80% of the total threatened and near-threatened species identified by the IUCN Red List.
Today these systems represent over a third of the global economy and provide up to two-thirds of jobs. As the trend for greater transparency and accountability demanded by consumers, regulators and investors continues to rise, and as nature-related risks start to materialize, costs are likely to rise for the businesses in these systems which have not yet begun to include nature at the core of their enterprise operations. Unless the structural roots of this crisis are addressed,
irreversible climate change, biodiversity loss and other environmental risks that harm the economy and human well-being will only worsen.14
Today’s economic models and supply chains are the product of the opportunities created by rapid globalization over the last three decades. They are typically designed for efficiency over resilience, which may make them vulnerable to extreme hazards.15 Designing future strategies and plans presents an opportunity to align economic models with our planetary boundaries and build more sustainable and inclusive economies and societies – a more resilient and prosperous world.
Over a third of crops are produced for and fed to livestock, and over a tenth are used for biofuels and cotton fibres.
Food, land and ocean use system
The global food, land and ocean use system not only generates around $10 trillion annually (12% of global GDP),16 as well as up to 40% of employment,17 but it also provides the food and clothes that sustain humans in their daily lives and is crucial for the livelihoods of millions of people, particularly in low-income countries. 18 Over the past century, this system has, at first sight, achieved remarkable success, increasing the availability of more and cheaper food and clothing. For example, since 1990, the number of undernourished people worldwide has decreased by 20%.19 But these successes have come at an ever-growing cost to nature and the ecosystem services and people that support it, with millions of smallholder farmers feeding the world population that can hardly feed their own family or satisfy their basic needs.20
Of all the three systems prioritized, the food, land and ocean use system places the greatest strain on planetary boundaries. Together, the seven threats that
relate to the activities and supply chains of this system (see Figure 1.2) impact around 72% of all threatened and near-threatened species, as classified by the IUCN Red List.21 At an estimated $12 trillion, the hidden costs of the food, ocean and land use system now exceed its contribution to global GDP.22
Agriculture and land use alone are responsible for around 30% of global greenhouse gas (GHG) emissions,23 over 70% of freshwater use and over 80% of tropical deforestation and habitat loss,24 and it is the largest producer of wastewater of all three systems.25 Over a third of crops are produced for and fed to livestock, and over a tenth are used for biofuels and cotton fibres.26 At the same time, 35% of food produced is either lost or wasted.27 How and what we consume – particularly resource-intensive, animal-based protein and clothing – has been increasingly raising alarms.28 The equivalent of one garbage truck of textiles is landfilled or burned every second, meaning $500 billion is lost every year as a result of discarded clothing.29 The impact of humans on the ocean is expanding, too. To cope with the decreased catch in their traditional fishing grounds, commercial fishing fleets are targeting new species and expanding to new areas, raising the total area fished from 60% to 90% of the world’s oceans. 30 As a result of industrial fishing, 93% of fish stocks today are fished at or beyond maximum sustainable levels.31
Driven by a global population projected to rise to over 10 billion people by 2050 (from 7.6 billion today) and an increase in the “consuming class” with the purchasing power to demand more food and clothing per capita (including food with a higher environmental footprint, such as meat), the world could require a doubling in agricultural production from 2005 levels in order to meet demand.32 Such a trajectory is unsustainable.

23New Nature Economy Report II – The Future Of Nature And Business
NATURE’S CALL TO ACTIONI
Infrastructure and the built environment systemCities are responsible for 75% of global GHG emissions, primarily through transportation and buildings.36 Continued expansion of cities could lead to the loss of around 2 million hectares of agricultural land every year.37 Urban and peri-urban infrastructure is often located in estuaries, coasts and floodplains, where fast and ill-planned expansion not only destroys biodiversity but also causes people to live with a lower quality of environment and life. Over 80% of the world’s wastewater is discharged, untreated, into biodiversity-rich freshwater, which is then used to irrigate cropland, and into coastal ecosystems.38 Across many countries in South Asia and Sub-Saharan Africa, between 80% and 90% of plastic waste is inadequately disposed of, leading to the pollution of rivers and oceans. Plastics pollution causes global externalities that amount to $139 billion annually, around a tenth of which arise from its adverse effects on marine biodiversity. 39
The infrastructure that connects built environments – such as roads, railroads, gas pipelines and sea bridges – can also disrupt or even destroy fragile ecosystems. Studies show that the population density of mammals and birds tends to be lower in the vicinity of such infrastructure – this effect reaches from a few hundred metres to 50 kilometres away.40 By some estimates, roadkill has surpassed hunting as the leading cause of vertebrate mortality on land.41
As the global population rapidly and increasingly moves to urban areas and global trade intensifies, if left unchecked the built environment’s contribution to nature loss will only grow. Today over half the world’s population lives in cities, and this share is expected to rise to 68%, or nearly 7 billion people, by 2050.42 The impact on biodiversity of long-range transport infrastructure in particular is expected to increase with the development of large multi-country infrastructure projects, such as the Belt and Road Initiative (BRI), which could fundamentally shape biodiversity outcomes over the coming decades. Up to $8 trillion has been committed to BRI projects through 2049, including roads, railroads, shipping lanes, airports, dams and gas pipelines spanning Eastern China through to the United Kingdom. The infrastructure of many of these BRI projects will cut across critical or fragile locations, such as Sumatra and the Arctic.43 Decisions made on infrastructure, including decisions that will be made as part of the stimulus packages for COVID-19 recovery, have long-lasting impacts and will have a crucial role to play in influencing the future of societies and their relationship with nature.
Over
80%of the world’s wastewater is discharged
untreated, into biodiversity-rich freshwater, which is then used to irrigate cropland, and into coastal ecosystems.
With an estimated 40% of global GDP currently originating from the built environment, this system is of crucial importance to the global economy.33 Global spending on construction alone is estimated to have exceeded $13 trillion in 2019, around 15% of global GDP, and contributed to around 7% of global employment.34 In recent decades, spending in this system has been critical to driving economic growth, alleviating poverty and improving living standards. Cities are the engine of the modern economy, providing the density, interaction and networks that make societies more creative, productive, prosperous and healthy. However, the rapid expansion of the built environment – a 66% increase in the first 12 years of the century35 – has significantly impacted the surrounding ecosystems. The threats emerging from the infrastructure and the built environment system together impact 29% of the IUCN’s list of threatened and near-threatened species.

24New Nature Economy Report II – The Future Of Nature And Business
NATURE’S CALL TO ACTIONI
Energy and extractives systemAn estimated 23% of global GDP and 16% of employment originate from the extraction, production, manufacturing and generation of energy and materials.44,45 The energy and extractives system has spurred global economic growth for the past two centuries. However, it has also created a significant burden for biodiversity and is responsible for threats that impact around 18% of species on the IUCN’s list.
Global resource extraction has tripled from 27 billion tonnes in 1970 to 92 billion tonnes in 201746 – but 840 million people still lack access to electricity.47 Meanwhile, material productivity, defined as GDP relative to material and energy inputs, has stagnated since the turn of the century, tying any increase in economic growth to an equivalent increase in resource extraction. At the same time, identified oil, gas, metal and mineral reserves are increasingly difficult to extract,48 while the world is getting more, not less wasteful, with 2020 circularity level estimated at 8.6%, down from 9.1% two years before.49 The system’s negative externalities now equate to $9 trillion annually, or around 10.5% of global GDP.50 Natural resource extraction and processing make up approximately 50% of the total GHG emissions and impact water stress and biodiversity, putting at risk the goals of the Paris Agreement and other Sustainable Development Goals.51 Mining utilizes less than 1% of global land area, but, because of its damaging and toxic extraction techniques,52 its negative impact on biodiversity, water and human health may be even larger than that of agriculture.53 Furthermore, commercial deep-sea mining is expected to become operational in the next decade, bringing new risks to the world’s oceans.54
Climate change is one of the most important challenges facing humanity. But nature and climate are deeply interlinked, and the way we manage decarbonization will determine the efficiency of the process and its impact on nature. Nature-
based solutions could provide 37% of the cost-effective CO2 mitigation needed through 2030 to have a chance to limit warming below 2°C.55 Model scenarios that limit warming to 1.5°C or 2°C typically rely on large amounts of “negative emissions”, such as those provided by Biomass Energy with Carbon Capture and Storage (BECCS). Up to 700 million hectares of land, representing almost half of present-day cropland area, could be needed to support enough bioenergy crops to deliver a scale of CO2e removal that would be consistent with a 2°C target.56 But recent studies have found that, in a majority of the areas where forests would be replaced, more carbon was stored by keeping the forests than by employing BECCS.57 Such technologies will therefore need to be carefully assessed, considering their costs as well as their benefits, along their full lifecycle.
Decisions taken today about where, how, and how much humans extract, process, transport and satisfy their material needs will have outsized human and environmental consequences for decades. Under business-as-usual projections, global energy demand will rise by 40% through 2050,58 and materials use will rise by 110% through 2060.59 These projections make the trade-off clear: to meet the needs of all people within the means of our planet, the energy and extractives system needs to be radically revisited.
Tackling the threats to biodiversity related to these three prioritized systems will take far more than a gradual shift in business processes. The transitions needed are fundamental. They require entire business, economic and consumption models to be transformed. As the global economy rebuilds after COVID-19, we are presented with a unique opportunity to re-examine previous assumptions and explore new thinking that would benefit both the people and the planet. The following chapters discuss what these transitions could look like in each of the three systems – and the economic, social and environmental benefits they could bring.
Global resource extraction has tripled from 27 billion tonnes in 1970 to 92 billion tonnes in 2017 – but 840 million people still lack access to electricity.

25New Nature Economy Report II – The Future Of Nature And Business
NATURE’S CALL TO ACTIONI
1 Intergovernmental Panel of Biodiversity and Ecosystem Services [IPBES], 2019, Global Assessment Report on Biodiversity and Ecosystem Services of the Intergovernmental Science-Policy Platform on Biodiversity and Ecosystem Services, https://www.ipbes.net/global-assessment-report-biodiversity-ecosystem-services
2 The Guardian, 2020, “Antarctic Temperature Rises above 20C for First Time on Record”, The Guardian, 13 February 2010. https://www.theguardian.com/world/2020/feb/13/antarctic-temperature-rises-above-20c-first-time-record
3 Lenton, T. M. and H. T. P. Williams, 2013, “On the Origin of Planetary-Scale Tipping Points”, Trends in Ecology & Evolution, 28, 380–382, doi:10.1016/j.tree.2013.06.001
4 Nii-Trebi, N. I., 2017, “Emerging and Neglected Infectious Diseases: Insights, Advances, and Challenges”, BioMed Research International, https://www.hindawi.com/journals/bmri/2017/5245021/
5 Hassell, J. M. et al., 2017, “Urbanization and Disease Emergence: Dynamics at the Wildlife-Livestock-Human Interface”, Trends in Ecology & Evolution, 32 (1), 55–67, https://doi.org/10.1016/j.tree.2016.09.012
6 Jones, K. E. et al., 2008, “Global Trends in Emerging Infectious Diseases”, Nature, 451, 990–3, https://www.ncbi.nlm.nih.gov/pubmed/18288193
7 World Economic Forum, 2020, Nature Risk Rising: Why the Crisis Engulfing Nature Matters for Business and the Economy, http://www3.weforum.org/docs/WEF_New_Nature_Economy_Report_2020.pdf
8 World Economic Forum, 2020, 2020 Global Risks Report, https://www.weforum.org/reports/the-global-risks-report-2020
9 IPBES, 2017, The Assessment Report on Pollinators, Pollination and Food Production, https://ipbes.net/assessment-reports/pollinators
10 Price, K., 2020, “Poaching, Deforestation Reportedly on the Rise Since COVID-19 Lockdowns”, Conservation International, 30 April 2020, https://www.conservation.org/blog/poaching-deforestation-reportedly-on-the-rise-since-covid-19-lockdowns
11 IPBES, 2019, Global Assessment Report, op. cit.
12 Lenton and Williams, 2013, “On the Origin of Planetary-Scale Tipping Points”, op. cit.
13 See the Methodological Note for further details on the methodology at https://www.alphabeta.com/our-research/methodology-note-new-nature-economy-report-on-the-future-of-nature-and-business/
14 Barbier, E., 2020, “A Green Post-COVID-19 Recovery”, in The United Nations Association – UK (2020), Climate 2020: The Path Ahead, https://www.climate2020.org.uk/wp-content/uploads/2020/04/054-056-C2020-Barbier.pdf
15 McKinsey Global Institute, 2020, Climate Risk and Response: Physical Hazards and Socio-economic Impacts, https://www.mckinsey.com/business-functions/sustainability/our-insights/climate-risk-and-response-physical-hazards-and-socio-economic-impacts
16 The Food and Land Use Coalition [FOLU], 2019, Growing Better: Ten Critical Transitions to Transform Food and Land Use, https://www.foodandlandusecoalition.org/wp-content/uploads/2019/09/FOLU-GrowingBetter-GlobalReport.pdf
17 UN International Labour Organisation [ILO], 2019, World Employment Social Outlook – Trends 2019, https://www.ilo.org/wcmsp5/groups/public/---dgreports/---dcomm/---publ/documents/publication/wcms_670542.pdf; and McKinsey & Company, 2015, “Pursuing the Global Opportunity in Food and Agribusinesses”, https://www.mckinsey.com/industries/chemicals/our-insights/pursuing-the-global-opportunity-in-food-and-agribusiness
18 This report builds on definitions developed by the Food and Land Use Coalition (FOLU) used to define the “food and land use system” – this includes the ways land and the ocean is used and food is produced, stored, packed, processed, traded, distributed, marketed, consumed, and disposed of. As such it includes food from aquatic ecosystems, both marine and freshwater, and both farmed and wild-caught, as well as agriculture for non-food purposes, such as fibre for textiles and crops for bioenergy, as these both compete with food for fertile land or are part of integrated agriculture systems. In this report we additionally include in the system all forests, while making explicit the role of the oceans, hence the term “food, land and ocean use system”. For further details, see FOLU, 2019, Growing Better, op. cit.
19 Roser, M. and H. Ritchie, 2020, “Hunger and Undernourishment”, OurWorldInData.org, https://ourworldindata.org/hunger-and-undernourishment
20 Rapsomanikis,G., 2015, The Economic Lives of Smallholder Farmers - An Analysis Based on Household Data from Nine Coun-tries. FAO. http://www.fao.org/3/a-i5251e.pdf
21 International Union for Conservation of Nature [IUCN], 2020, Red List – Advanced Search, https://www.iucnredlist.org/search
22 FOLU, 2019, Growing Better, op. cit.
23 IPCC, 2019, Climate Change and Land: An IPCC Special Report on Climate Change, Desertification, Land Degradation, Sustainable Land Management, Food Security, and Greenhouse Gas Fluxes In Terrestrial Ecosystems, https://www.ipcc.ch/srccl/
Endnotes

26New Nature Economy Report II – The Future Of Nature And Business
NATURE’S CALL TO ACTIONI
24 Global Environment Facility [GEF], 2019, Safeguarding the Global Commons: Seventh Replenishment of the Global Environment Facility, https://www.thegef.org/sites/default/files/publications/GEF_safeguarding_global_commons_May2019_CRA.pdf
25 Food and Agriculture Organization of the United Nations [FAO] and International Water Management Institute [IWMI], 2018, More People, More Food, Worse Water? A Global Review of Water Pollution from Agriculture, http://www.fao.org/3/CA0146EN/ca0146en.pdf
26 Cassidy, E. S. et al., 2013, “Redefining Agricultural Yields: From Tonnes to People Nourished per Hectare”, Environmental Research Letters, https://iopscience.iop.org/article/10.1088/1748-9326/8/3/034015/pdf; World Wildlife Fund [WWF], 2018, Cleaner, Green Cotton: Impacts and Better Management Practices, http://d2ouvy59p0dg6k.cloudfront.net/downloads/cotton_for_printing_long_report.pdf
27 World Resources Institute and United Nations Environment Programme [UNEP], 2013, Reducing Food Loss and Waste, https://www.wri.org/publication/reducing-food-loss-and-waste
28 Willet, W. et al., 2019, Food in the Anthropocene: The EAT-Lancet Commission on Healthy Diets from Sustainable Food Systems, https://eatforum.org/eat-lancet-commission/eat-lancet-commission-summary-report/
29 Ellen MacArthur Foundation, 2017, A New Textiles Economy: Redesigning Fashion’s Future, https://www.ellenmacarthurfoundation.org/publications/a-new-textiles-economy-redesigning-fashions-future
30 Tickler, D. et al., 2018, “Far from Home: Distance Patterns of Global Fishing Fleets”, Science Advances 4 (8), https://advances.sciencemag.org/content/4/8/eaar3279
31 IPBES, 2019, Summary for Policymakers of the Global Assessment Report on Biodiversity and Ecosystem Services of the Intergovernmental Science-Policy Platform on Biodiversity and Ecosystem Services, https://ipbes.net/sites/default/files/inline/files/ipbes_global_assessment_report_summary_for_policymakers.pdf
32 Valin, H. et al., 2014, “The Future of Food Demand: Understanding Differences in Global Economic Models”, Agricultural Economics, 45 (1, January 2014), 51–67, https://onlinelibrary.wiley.com/doi/abs/10.1111/agec.12089
33 Arcadis, 2016, Global Built Asset Performance Index 2016, https://www.arcadis.com/en/global/our-perspectives/global-built-asset-performance-index-2016/
34 Construction spending in nominal US$2019 based on a range of global estimates, including from IHS Economics, 2013, Global Construction Outlook: Executive Outlook, https://ihsmarkit.com/pdf/IHS_Global_Construction_ExecSummary_Feb2014_140852110913052132.pdf; employment statistics based on modelled estimates from the International Labour Organization [ILO], 2019, World Employment Social Outlook, https://www.ilo.org/wcmsp5/groups/public/---dgreports/---dcomm/---publ/documents/publication/wcms_670542.pdf
35 Chen, Z. et al., 2019. “Mapping Global Urban Areas from 2000 to 2012 Using Time-Series Nighttime Light Data and MODIS Products”, IEEE Journal of Selected Topics in Applied Earth Observations and Remote Sensing, 12 (4), 1143–53, April 2019, doi: 10.1109/JSTARS.2019.2900457
36 UNEP, 2020, Cities and Climate Change, https://www.unenvironment.org/explore-topics/resource-efficiency/what-we-do/cities/cities-and-climate-change
37 World Bank, 2015, The Dynamics of Global Urban Expansion, http://siteresources.worldbank.org/INTURBANDEVELOPMENT/Resources/dynamics_urban_expansion.pdf
38 UK Centre for Ecology & Hydrology, 2019, “Increased Biodiversity Linked to Improved Sewage Treatment”, https://www.ceh.ac.uk/news-and-media/news/increased-biodiversity-linked-improved-sewage-treatment
39 TruCost, 2016, Plastics and Sustainability: A Valuation of Environmental Benefits, Costs, and Opportunities for Continuous Improvement, https://plastics.americanchemistry.com/Plastics-and-Sustainability.pdf
40 Benítez-López, A. et al., 2010, “The Impacts of Roads and Other Infrastructure an Mammal and Bird Populations: A Meta-Analysis”, Biological Conservation, 143 (6), 1307–16, https://www.sciencedirect.com/science/article/abs/pii/S0006320710000480?via%3Dihub
41 Forman, R. T. T. and L. E. Alexander, 1998, “Roads and Their Major Ecological Effects”, Annual Review of Ecology and Systematics, 29 (1998), 207–31, https://www.edc.uri.edu/nrs/classes/nrs534/NRS_534_readings/FormanRoads.pdf
42 World Economic Forum, 2019, These Will Be the Most Important Cities by 2025, https://www.weforum.org/agenda/2019/10/cities-in-2035/
43 World Wildlife Fund [WWF] and HSBC, 2017, Greening the Belt and Road Initiative: WWF’s Recommendations for the Finance Sector, https://dspace.library.uu.nl/handle/1874/362894
44 GDP contribution derived from a range of sources, including market research and World Bank, 2019, World Development Indicators: Structure of Output, http://wdi.worldbank.org/table/4.2 and Business and Sustainable Development Commission [BSDC], 2017, Valuing the SDG Prize, http://s3.amazonaws.com/aws-bsdc/Valuing-the-SDG-Prize.pdf
45 Employment statistics were derived from a range of sources, including the International Labour Organization [ILO]. See ILO, 2019, World Employment Social Outlook, op. cit.; World Bank, 2019, World Development Indicators DataBank, “Labour force, total”, https://data.worldbank.org/indicator/SL.TLF.TOTL.IN; and Intergovernmental Forum on Mining, Minerals, Metals and Sustainable Development [IGF], 2018, Global Trends in Artisanal and Small-Scale Mining (ASM): A Review of Key Numbers and Issues, International Institute for Sustainable Development, https://www.iisd.org/sites/default/files/publications/igf-asm-global-trends.pdf

27New Nature Economy Report II – The Future Of Nature And Business
NATURE’S CALL TO ACTIONI
46 International Resources Panel, [IRP], 2019, Global Resources Outlook 2019: Natural Resources for the Future We Want, A Report of the International Resource Panel, Nairobi, Kenya: United Nations Environment Programme, https://www.resourcepanel.org/reports/global-resources-outlook
47 Sustainable Development Goals Knowledge Platform, 2019, “Progress of Goal 7 in 2019”, https://sustainabledevelopment.un.org/sdg7; and World Bank, 2019, “Access to electricity (% of population)”, World Development Indicators DataBank, accessed 1 April 2020, https://data.worldbank.org/indicator/EG.ELC.ACCS.ZS
48 “Reserves” are energy and materials identified in location and quantity, and they are therefore easy to factor into supply chains and rates of consumption, whereas “resources” cannot be quantified without long-term geological surveys.
49 The Circularity Gap Reporting Initiative, 2020: The Circularity Gap Report 2020, https://www.circularity-gap.world/2020
50 International Renewable Energy Agency [IRENA], 2018, Global Energy Transformation: A Roadmap to 2050, https://www.irena.org/-/media/Files/IRENA/Agency/Publication/2018/Apr/IRENA_Report_GET_2018.pdf
51 Ibid.
52 Cocks, R. and D. Lewis, 2019, “The Wildcat Goldminers Doomed by Their Toxic Trade”, a Special Reuters Report, Reuters, 24 July 2019, https://www.reuters.com/investigates/special-report/gold-africa-poison/
53 IPBES, 2019, Global Assessment Report, op. cit.
54 Washburn, T. W. et al., 2019. “Ecological Risk Assessment for Deep-Sea Mining”, Ocean and Coastal Management 176 (15 Jun e2019), 24–39, https://doi.org/10.1016/j.ocecoaman.2019.04.014
55 Griscom, B. W. et al., 2017, “Natural Climate Solutions”, PNAS 114 (44) 11645–50, https://doi.org/10.1073/pnas.1710465114
56 Harper, A. B. et al., 2018, “Land-Use Emissions Play a Critical Role in Land-Based Mitigation for Paris Climate Targets”, Nature Communications 9, article 2938, https://www.nature.com/articles/s41467-018-05340-z
57 Harper, A. B. et al., 2018, Land-Use Emissions”, op. cit.
58 IRENA, 2018, Global Energy Transformation, op. cit.
59 International Resources Panel, 2019, Global Resources Outlook 2019, op. cit.

Towards a nature-positive food, land and ocean use system
CHAPTER II
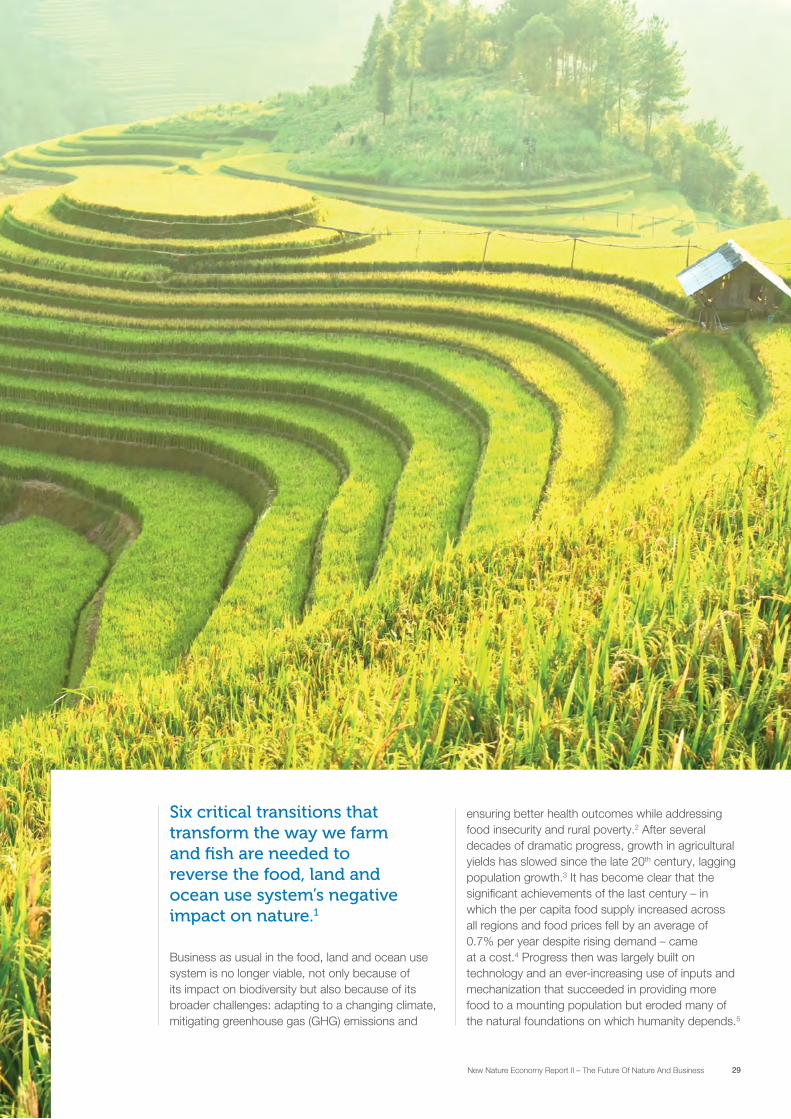
29New Nature Economy Report II – The Future Of Nature And Business
Six critical transitions that transform the way we farm and fish are needed to reverse the food, land and ocean use system’s negative impact on nature.1
Business as usual in the food, land and ocean use system is no longer viable, not only because of its impact on biodiversity but also because of its broader challenges: adapting to a changing climate, mitigating greenhouse gas (GHG) emissions and
ensuring better health outcomes while addressing food insecurity and rural poverty.2 After several decades of dramatic progress, growth in agricultural yields has slowed since the late 20th century, lagging population growth.3 It has become clear that the significant achievements of the last century – in which the per capita food supply increased across all regions and food prices fell by an average of 0.7% per year despite rising demand – came at a cost.4 Progress then was largely built on technology and an ever-increasing use of inputs and mechanization that succeeded in providing more food to a mounting population but eroded many of the natural foundations on which humanity depends.5

30New Nature Economy Report II – The Future Of Nature And Business
TOWARDS A NATURE POSITIVE FOOD, LAND AND OCEAN USE SYSTEMII
First, the ever-expanding footprint of farming, fishing and ranching we have now is unsustainable. Instead, human societies should rapidly transform their primary sectors to achieve ecosystem restoration and avoided land and ocean use expansion. Protecting critical ecosystems from any further conversion to farming and fishing, along with stabilizing and gradually reducing the size of agriculture’s and fishing’s footprint on ecosystems, will be critical for this transition to succeed. At the same time, restoring terrestrial and marine ecosystems that have been severely degraded and returning them to nature can unlock significant value for ecosystems and the economy. These actions, which aim to rebalance our relationship with nature, can also benefit indigenous peoples and local communities on the ground. Importantly, they should be taken in collaboration with these local communities, who are often the guardians of large natural areas.
Second, the food and land use system could significantly benefit from a fundamental shift towards productive and regenerative agriculture. Transforming agricultural landscapes and farming practices for both food and non-food agriculture through a combination of traditional climate-smart farming techniques, advanced precision technologies, and bio-based inputs can increase biodiversity, enrichen soils, improve water management and enhance ecosystem services while improving yields. Ultimately, allowing us to sustainably meet everyone’s needs on a smaller, more efficient agricultural land.
Similarly, if sustainably managed, our fisheries could be conducive to a healthy and productive ocean. To fulfil this potential will require actions to sustainably manage wild ocean fisheries by respecting and upholding fishing quotas based on scientific evidence and limiting fishing to specific zones. This also involves transitioning towards sustainable and healthy aquaculture in oceanic, wetland and freshwater areas to reduce degradation in these critical ecosystems and replenish overexploited fish stocks. Impacts of other ocean industries, such as renewable energy, transportation and mineral extraction, have been considered in other relevant transitions.
Fourth, given the outsized impact of logging on biodiversity, a transition to sustainable management of forests is critical. Techniques such as reduced-impact logging, improved harvest planning and precision forestry can allow forests to flourish while meeting the world’s resource needs. However, a successful transition will rely on finding just and equitable solutions that address the land rights of indigenous peoples and local communities, who have demonstrated themselves to be the best stewards of forests.
At an estimated $12 trillion, the hidden costs of the food, land and ocean use system now exceed its contribution to global GDP.6 According to the EAT-Lancet Commission, without radically transforming food production processes, halving food loss and waste and making significant dietary shifts, by 2050 we will not be able to feed the world’s growing population while operating within safe planetary boundaries.7
Drastically reversing the impact of the food, land and ocean system on nature means taking two main actions. We must increase the amount of land and water that is left undisturbed to allow the diversity of life to thrive – that is, we must “spare” large areas of land and water so that natural ecosystems are left intact. At the same time, we must ensure that working land and water is much more hospitable to life – that is, we must greatly improve the way we “share” space with nature. Achieving this two-fold objective requires implementing and scaling six systemic socio-economic transitions that together can put the food, land and ocean use system on a path consistent with planetary boundaries.8 These transitions are complementary. All are needed to achieve success at the global level, while their relative importance will depend on regional and national circumstances.
BOX 2.1
A sustainable economic recovery, in symbiosis with the planet – By Dr David Nabarro, Director, 4SD
The world is undergoing unprecedented change as a result of COVID-19. The pandemic has highlighted just how inter-related human and natural systems are. The vulnerability of the global economy in the face of the pandemic has exposed the fragility of our operating systems. The economy has rapidly entered a recession. Food systems and supply chains are creaking under the pressure of measures that have been taken to limit the transmission of the disease. The symbiosis essential to life on this planet is now evident. Nature is the foundation of our society and economies, and our greatest ally in fighting climate change.
As governments and businesses look to establish the ‘new normal’, it is important not to lose focus on other crises while dealing with this one. Even as we grapple with the shocks to our systems, this pandemic has demonstrated that humanity can mobilize strong political will and collective action in the face of a life-threatening crisis. The next-phase of rebuilding our economies must be done in ways compatible with our biodiversity and climate targets. A new approach that creates resilience for our agricultural, fishing and food systems is required and this must be supported by investments in transition for farmers, value-chains and consumers alike. Evidence suggests this can be done and will also be cost-effective in long-run.

31New Nature Economy Report II – The Future Of Nature And Business
TOWARDS A NATURE POSITIVE FOOD, LAND AND OCEAN USE SYSTEMII
These first four transitions need to be made in the context of a rapidly expanding global population that is demanding more resource-intensive foods and agricultural products. Nearly 10 billion people will inhabit the planet by 2050, the vast majority in cities. The middle class is growing fast, with a predicted 50% increase by 2030.9 Taken together, these trends imply that standards of living will improve for many – but they also mean that, based on current productivity levels and consumption trends, global food production will need to expand by between 50% and 98% by 2050 from 2005 levels.10 A larger, more urbanized middle class will also demand more textile products, in turn increasing demand for natural fibres. This would jeopardize the ambition for the food, land and ocean use system to both spare and share with nature. To overcome this challenge, a fifth transition towards planet-compatible consumption will be required. It is important that this transition happen simultaneously with the others: dietary consumption shifts towards nutritious, affordable and environmentally friendly products that minimize their negative impact on
nature, as well as reducing consumer waste in food and textiles, are areas where focused change can significantly reduce our indirect impact on nature.
Finally, such an ambitious transformation of how we produce and consume food, including seafood, and other agricultural and forestry products needs the support of transparent and sustainable supply chains. By integrating transparency, traceability and increased collaboration into supply chains, stakeholders can improve sustainable sourcing, eliminate illegality, reduce food and material loss, improve safety and quality, and ensure that consumers, regulators and investors are able to make informed decisions that, in turn, reinforce responsible production.
Successfully transitioning the food, land, and ocean use system to nature-positive development is challenging but it will help us to lead more resilient and healthier lives and have more choices in what we consume.
Ecosystem restoration and avoided land and ocean use expansion1
What is it?Protecting and restoring nature to prevent critical ecosystems, including biodiversity hotspots, from being converted for farming or fishing will be vital in building nature’s resilience to continued land and ocean use. The conservation and restoration of natural ecosystems is crucial to meet both biodiversity and climate goals: the conservation and restoration of land, especially of forests, peatlands and mangroves, could deliver a significant portion of the mitigation needed to hold warming to the Paris Agreement goal.11 It also brings a range of benefits that extend beyond the immediate biodiversity and climate benefits, such as greater resilience of human settlements to extreme weather events,12 as well as improved water security.13
To achieve this transition, the first and immediate step is to stabilize and reduce the footprint of agriculture and fishing on ecosystems while concurrently restoring the degraded landscapes to return them to nature. In doing so, smallholder farmers and indigenous peoples and local communities in particular will continue to be
invaluable partners in providing solutions to tackle climate change and biodiversity loss. Indigenous people, for instance, make up only 5% of the population, but by some estimates are vital stewards of 80% of the planet’s biodiversity.14 Engaging local communities will stimulate actions to preserve natural resources, grow food in sustainable ways and live in harmony with nature.15
For this transition to be successful, policy and regulation will play an important role in creating incentives that reflect the true cost to society of not making these changes. Reflecting the true cost of destroying critical ecosystems and making the business case for protecting and restoring land and ocean areas can make this happen. Presently, policy tools do not uniformly incentivize sustainability or price in environmental externalities. For instance, despite forests’ and agriculture’s vulnerability to and their role in addressing climate change, climate finance allocated to agriculture, forestry and other land use represented less than 3% of the amount mobilized globally in 2018.16 In addition to subsidy

32New Nature Economy Report II – The Future Of Nature And Business
TOWARDS A NATURE POSITIVE FOOD, LAND AND OCEAN USE SYSTEMII
BOX 2.2
A carbon tax to protect forests and fight climate change1
To tackle rampant levels of deforestation and combat climate change simultaneously, Costa Rica and Colombia have blazed a trail by rolling out a carbon tax. Implementation in these two countries faced little opposition because the tax was incorporated with other fiscal reforms and was used to fund nature conservation and, in the case of Colombia, the country’s peace process.
Since 1997, Costa Rica has collected a 3.5% tax on fossil fuels, generating $26.5 million per year. This amount is invested in the country’s National Forest Fund (FONAFIFO), which to date has spent the money on projects to protect 1 million hectares of mature forest and 71,000 hectares that are under reforestation. The fund has disbursed this money to landowners throughout the country, including to Indigenous peoples. The tax helped Costa Rica double its forest cover from 26% in 1983 to 52% in 2019 and become a leading example of moving from a deforestation-driven economy to a restoration one.
Colombia’s tax of $5 per tonne of emitted carbon has been levied on companies that produce or import fossil fuels since 2016. The levy yielded revenues of $148 million in 2017 and $91 million in 2018. These go to the Colombian Peace Fund, 30% of which is used to manage and conserve natural ecosystems and strengthen the country’s National System of Protected Areas. In addition, the fund is developing a web-based platform that provides official information on the state of the country’s natural resources. Companies can reduce their tax burdens by purchasing certified carbon credits directly from conservation and restoration projects in Colombia that adhere to internationally recognized standards.
If 12 other countries rolled out a tropical carbon tax like those of Costa Rica and Colombia, together they could raise a total of $1.8 billion each year to invest in natural-climate solutions.
1. Barbier, E. et al., 2020, “Adopt a Carbon Tax to Protect Tropical Forests”, Nature, 578, 213–16.
Where are we now and where do we need to get to?Forests are disappearing driven by commodity production and shifting agriculture.22 If present trends continue, by 2050 the world will have lost a further area of tropical forest almost the size of India,23 including rainforests that contain some of the world’s richest biodiversity.24 The ocean also faces similar challenges: to cope with the decreased catch in their traditional fishing grounds, commercial fishing companies are targeting new species and expanding their fishing to 90% of the world’s ocean, and in deeper depths.25 Such practices have severely degraded marine ecosystems, as shown
by the depleting world’s fish stocks and the falling levels of wild-catch.26
The UN Convention on Biological Diversity prescribed that at least 17% of land areas and 10% of marine areas must be protected through official mechanisms by 2020.27 These targets are short of being met for both land and oceans.28,29 Leading conservation experts have called for increasing protection to half of all natural ecosystems,30with 30% of the Earth’s land and ocean seen as a minimum near-term threshold through 2030.31 Areas
reform, viable natural climate solutions need appropriate incentive mechanisms; carbon pricing is one possible avenue. Although prices for voluntary offsets remain low, at around $3 per tonne, offsets based on nature grew 264% between 2016 and 2018.17 In addition, the introduction of domestic carbon taxes in tropical forest countries has been advocated as a way to reduce the use of oil, gas and coal and mobilize funds for nature-based solutions for adaptation and mitigation (see Box 2.2).18
Regulations alone cannot eliminate deforestation and overfishing, however. For most issues, including reporting and information sharing on sourcing,
subsidies, tariff policies and regulation enforcement, greater national and international collaboration and business advocacy will help.19 Data-driven technological solutions have the potential to inform and support producers and regulators. Spatial planning using satellite data and biodiversity assessments are critical to create “spatial biodiversity strategies” that inform nature- and climate-smart development.20 China’s Ecological Conservation Red Line (ECRL) is a key example of such a strategy, linking extensive maps of biodiversity, ecosystem services and existing land uses to its long-term strategic land-use framework for agriculture, among other applications.21

33New Nature Economy Report II – The Future Of Nature And Business
TOWARDS A NATURE POSITIVE FOOD, LAND AND OCEAN USE SYSTEMII
with greater existing agricultural, industrial and urban activity would be subject to lower protection targets, while more untouched landscapes need to be almost entirely protected.32 Such targets are being integrated into policy-making as well – for instance, experts indicate that China’s ECRL will end up protecting between 25% and 30% of the country’s natural areas.33 Similarly ambitious restoration targets have been put forward by the international community. The International Union for Conservation of Nature (IUCN) launched the Bonn Challenge in 2011 with the objective of restoring 350 million hectares of deforested and degraded land by 2030. To date the IUCN has received pledges from governments and other stakeholders covering over 170 million hectares.34 However, implementation of the pledges has lagged.35 In their Better Futures scenario, the Food and Land Use Coalition (FOLU) estimates that 450 million hectares of natural land and forests need to be restored by 2030 relative to 2010 levels.36 It is against this backdrop that initiatives – such as the 1t.org project37 – that support the conservation, restoration and growth of 1 trillion trees by 2030 have arisen. These initiatives aim to make a major contribution to the UN Decade on Ecosystem Restoration 2021–2030, led by the Food and Agriculture Organization of the United Nations (FAO) and the UN Environment
Programme (UNEP).38 There is also an urgent need to scale marine protection. Effective protection of high-priority marine habitats has been proven to conserve biodiversity, increase productivity and ecosystem resilience, and enhance fisheries and protect them from population collapse.39
This high level of ambition in restoration and protection is justified by the high potential rewards, both for biodiversity and climate outcomes. Halting deforestation and reversing forest degradation is “one of the most effective and robust options for climate change mitigation”, according to the IPCC.40 Other estimates indicate that switching production to higher-productivity land could reduce the need for agricultural land by 600 million hectares by 2050.41 Ocean-based carbon mitigation could reduce the current gap in the decarbonization levels required to remain in a 2.0°C scenario by up to 25%.42,43 Sufficient policy and business levers to help rebuild marine life by 2050 – including by creating no-take zones, harvesting wisely and restoring habitats – have already been identified. These bolster the services that the people rely on, from food to coastal protection to climate stability. But efforts to date are insufficient and too slow, with only 2.5% of the ocean being in fully implemented protected areas.44
2 Productive and regenerative agriculture
What is it?Productive and regenerative agriculture involves transforming agricultural landscapes and farming principles and practices to improve yields while enhancing the health of the surrounding natural ecosystem.45 Regenerative practices restore soil fertility, improve water flows, increase agrobiodiversity of landscapes and significantly reduce the use of synthetic fertilizers and pesticides, avoiding off- and on-site pollution. They reduce negative impacts on nature and increase positive ones by, for example, sequestering carbon in soils or integrating crops that are beneficial to pollinator populations. Importantly, this can be done while maintaining high levels of productivity – in some cases even increasing yields – and resilience.46
This transition requires greater understanding and adoption of the appropriate agronomic solutions to improve biodiversity in working landscapes. These
solutions include using biopesticides and microbial and organic fertilizers to reduce excess nitrogen and phosphorous in soils and reduce toxic run-off; rotating crops and reducing tillage to replenish soil nutrition; employing micro-irrigation to reduce water usage and run-off; integrating native non-crop vegetation (such as trees or shrubs) within cropland or pastureland to sequester carbon and reduce run-off; using biochar as a soil amendment; and restoring pollinator habitats, forest corridors and riparian ecosystems surrounding working lands.47 Incentives to promote such strategies are being developed. An emerging example of such an incentive is the provision of carbon credits to farmers that increase the amount of carbon sequestered in their working soils.48
In smallholder farms, the transition will first require improving training, capacity building and access

34New Nature Economy Report II – The Future Of Nature And Business
TOWARDS A NATURE POSITIVE FOOD, LAND AND OCEAN USE SYSTEMII
to financing, sustainable inputs, mechanization and markets. Large-scale farms will need to begin leveraging Fourth Industrial Revolution technologies such as big data and the Internet-of-Things in precision farming. Biotechnology innovation can play a role in areas such as gene editing, selective cropping and breeding – though, as with any novel technology, credible governance mechanisms will be needed to manage unintended consequences. Such technologies all have the potential to reduce input costs in addition to increasing yields – a critical incentive to increase adoption.49
Regenerative agriculture practices that benefit soil health and are tailored to local conditions have the potential to maintain or even increase yields, improve resistence to draught and supress diseases when compared to conventional sytems.50,51 But in some cases, this transition can raise difficult trade-offs between improving yields and strengthening biodiversity. For example, organic farming eliminates the use of chemicals and improves the health of soils, water systems, animals and humans – but it currently produces lower yields and requires more land to produce the same amount of food as conventional farming.52 More intensive livestock farming can
reduce future deforestation and per unit emissions, but it also increases absolute GHG emissions that result from scaling.53 While these trade-offs can be mitigated by pursuing a slower managed shift to regenerative practices supported by food buyers and agronomists, this transition can currently address the nature crisis only in combination with the other transitions explored in this system.
The success of this transition also depends on public policy structuring an appropriate set of economic incentives to support farmers with the upfront resources and skills needed to shift towards sustainable practices. Current incentives do not address these hurdles. For example, governments around the world have provided approximately $530 billion per year in public subsidies and market price support for farmers, but only 15% of these incentives support public goods and sustainable outcomes while the majority may spur the overuse of fertilisers and natural resources, among other perverse effects.54 Encouraging large-scale behavioural shifts requires understanding and identifying the right incentives, which could fund behaviour change costs while mitigating the costs of the transition and, potentially, ongoing economic costs as well.55
Where are we now and where do we need to get to?Over the last two decades, around 20% of the Earth’s vegetated surface has shown persistent declines in productivity, with 1.3 billion people trapped on degraded agricultural land.56 Around 10% to 15% more cropland will be needed by 2030 to meet projected food demand based on current diets and inefficiencies.57 The World Resources Institute (WRI) estimates that improvements to agricultural productivity could reduce around half
of the net expansion in agricultural land required by 2050 versus a business-as-usual scenario.58
Furthering the regenerative farming revolution is a key part of this transition. Some large companies are already heavily engaged in forms of regenerative agriculture, progressively reducing chemical inputs, using more crop rotation, building up soil health and making their production mix more biodiverse.59 This change in farming practice is taking root both in food production and in other areas of the agriculture sector such as fibre production. The key now is to massively scale and mainstream these practices through a range of measures, including awareness building, farmer peer-to-peer learning and training, agricultural extension services such as access to sustainable inputs and seed banks, off-take guarantees, investments in infrastructure such as water and nutrient recycling systems, and swift field testing and data sharing on regenerative practices. Simultaneously, success will be fuelled by rapid uptake of key technologies by a critical mass of key players in large commodity-producing countries.60 But technology scaling does not tell the whole story. A massive repurposing of subsidies and a fundamental redesign of incentive systems must also underlie the effort.

35New Nature Economy Report II – The Future Of Nature And Business
TOWARDS A NATURE POSITIVE FOOD, LAND AND OCEAN USE SYSTEMII
What is it?Maintaining a healthy and productive ocean requires globalized sustainable management of wild fisheries in ways that respect biologically viable fishing levels and restrict fishing zones, while also improving and scaling sustainable mariculture and aquaculture in water ecosystems to replenish overexploited fish stocks.
Such ambitious goals can be achieved only by using comprehensive area-based management approaches that combine protection – through marine protected areas (MPAs) and other conservation measures, especially in coastal areas and breeding grounds – with managed mixed-use areas for both conservation and production, along with more intensive commercial production areas.61 Such integrated management strategies for coastal and marine ecosystems should be developed and funded by the public sector in conjunction with the private sector. MPAs have been found to allow threatened fish stocks and entire marine ecosystems to rebuild and replenish (see Box 2.3).62 MPAs are not, though, a straightforward panacea.63 Without careful governance, planning and execution, MPA designations can amount to little more than “paper parks”. Research and collaboration are needed to develop pivotal solutions to end harmful subsidies for exploitative fishing practices, establish
3 Healthy and productive ocean
BOX 2.3
The business case for marine reserves1
The Mediterranean is the historically most overfished sea on the planet, and over three-quarters of its fisheries have collapsed. However, no-take marine reserves have proven effective in restoring marine biodiversity within their boundaries and improving surrounding local economies, through the enhancement of local fisheries, increased tourism and the restoration of fish production. The Medes Islands Marine Reserve in Spain, created in 1983, successfully recovered fish biomass by up to 500% when compared with nearby unprotected areas, and did so within a decade.
Despite the no-take area being very small (about 1 square kilometre), the biomass recovery stimulated the growth of a marine ecotourism industry that supports 200 direct jobs and brings in €12 million to the local economy. This recovery also led to a fish spillover outside of the no-take area, which benefited fishermen. By year eight, the total annual profit of the area, from fishing and tourism, was 13 times higher than it had been before the reserve was implemented. If designed properly, the profitability of marine reserves could bring sufficient revenue to pay for themselves; finance short-term losses for fishermen, who could receive a secure income from tourist access fees; and be between 4 and 12 times more profitable than the unprotected counterfactual.
1. Sala, E. et al., 2016, “Fish Banks: An Economic Model to Scale Marine Conservation”, Marine Policy, 73, 154–61, https://doi.org/10.1016/j.marpol.2016.07.032.
science-based quotas for wild catch fisheries, and promote sustainable aquaculture in non-critical ecosystems, which has the potential to significantly reduce the pressure on wild fish stocks.
Restoring coastal wetland ecosystems, as discussed under the ecosystem restoration and avoided land and ocean use expansion transition, typically involves working with the aquaculture industry, which stands to benefit enormously from restoration. For instance, coastal communities in Viet Nam saw their incomes rise between 200% and 800% from aquaculture products such as shells and oysters following the restoration of critical mangroves.64 Finally, a key push towards sustainable marine aquaculture should include expanding unfed mariculture – that is, the culture of species that do not depend on wild-caught fish for nutrition, such as bivalves and seaweed –65 and switching to multi-trophic practices.66 Such practices cultivate a variety of ocean-based nutrition such as finfish, shellfish and marine plants to replicate the food chain in natural ecosystems and diminish pressure on wild fisheries while reducing the amount of waste generated and the risk of algae bloom. Canada has successfully been using these techniques with positive results.67

36New Nature Economy Report II – The Future Of Nature And Business
TOWARDS A NATURE POSITIVE FOOD, LAND AND OCEAN USE SYSTEMII
Where are we now and where do we need to get to? Approximately 3 billion people rely on wild-caught or farmed seafood as their primary source of protein.68 The global share of protein obtained from wild fisheries and aquaculture could rise from 7% in 2018 to 11% in 2030.69 However, over 33% of fish stocks are already being fished at unsustainable levels. 70 FOLU estimates that wild catch volume could increase by 24% by 2030 if all fisheries were managed within maximum sustainable yields (compared with a projected 15% drop in wild catch volume if nothing is done).71 But this involves enforcing science-based quotas for wild catch and redoubling global conservation efforts. Done correctly, these measures have demonstrated the remarkable resilience of the seas.72
More and more fish are being produced through aquaculture: it represents almost half of global seafood production in 2016, up from a quarter in 2000.73 However, for ocean and freshwater
Sustainable management of forests4What is it?Given the outsized impact that logging has on biodiversity, a transition to the sustainable management of forests77 is critical both to address conservation needs and to improve the livelihoods of over 1.6 billion people that depend on forests − mostly lower-income households in Africa, Asia and Latin America.78 This transition combines three main components:
– Effective protection of critical forests. Forest wildlands, those forests least affected by human activity, have the highest conservation value for the ecosystem services they provide.79 But they are disappearing – and worldwide, logging is the leading cause.80 Governments, by protecting these areas to limit encroachment and fragmentation from logging and infrastructure, have a key role to play. Research shows that forest reduction within protected areas is three times lower than it is in non-protected areas.81 Governments also need to step up their recognition and securing of indigenous
aquaculture to truly offer a sustainable solution, it still needs to overcome some productivity and environmental limitations. These challenges include the need to improve disease management, limit antibiotic usage, favour native species harvesting, scale sustainable feeds that do not compete for land or wild-caught fish, and improve the condition of production sites to avoid pollution.74 Draining mangroves for aquaculture, for instance, generates significant carbon emissions. While there are large variances in this footprint depending on the production techniques used, one study found that – as a result of mangrove destruction – a kilogram of farmed shrimp was responsible for almost four times the GHG emissions as a kilogram of beef in addition to habitat destruction.75 A promising solution to many of these challenges is to expand seaweed or mollusc farming that provide food and biomaterials in a regenerative way – requiring no freshwater, land or fertilizer input and sequestering carbon while growing.76
peoples’ land tenure. In some Latin American countries, the average annual deforestation rates inside tenure-secure indigenous lands were found to be two to three times lower than in similar forests without secure tenure.82 Yet, out of the 50–65% of the world’s community land,83 governments recognize only 10% as legally belonging to indigenous and local communities.84 Setting critical forest wildlands aside can be stimulated by using appropriate geospatial maps, strict boundary enforcement and innovative models that leverage the value of products other than timber such as non-forest timber products (see Box 2.4), carbon sequestration and biodiversity to ensure their effective protection.
– Comprehensive sustainability in productive forests. The sustainable management of productive and secondary forests (those re-grown after a timber harvest) and plantations has the potential to reduce the environmental

37New Nature Economy Report II – The Future Of Nature And Business
II TOWARDS A NATURE POSITIVE FOOD, LAND AND OCEAN USE SYSTEM
damage related to logging.85 Benefits include optimizing the number of trees felled, minimizing the amount of damage and reducing carbon emissions. The main mechanisms that can unlock this potential include reduced-impact logging approaches such as improved felling techniques, forest assessment,86 voluntary certification schemes and participatory community forest management.87
BOX 2.4
Indigenous knowledge at the heart of sustainable forest management
The Ucuuba is an important tree species for the wetlands in the Amazon and is traditionally used as medicine by the Amazonian peoples. But its wood quality also makes it very attractive for the manufacture of veneer, plywood, packaging and other light wood products. Since 1992, this exploitation had brought it close to extinction.
To protect the threatened tree, Natura, a Brazilian manufacturer of beauty and personal care products, has started using the valuable seeds of the tree, which can be used in products to repair the skin as well as to treat rheumatism and arthritis.1 Natura makes sure that both the wood and the seeds of a tree are used. This increases the value generated by a single tree and reduces the number of trees needed. Production is carried out in partnership with local communities and promotes the sustainable exploitation of the Ucuuba, with training programs and trusted procurement teams that value the relationship with local communities and ethical biotrade. The sustainable exploitation of the Ucuuba means that, for example, only half of the fruits are collected, allowing the other half to regenerate and preserve the species.
As a result of such practices, partner communities multiply their incomes by three times as much as they would by the sale of wood alone. The Ucuuba tree has also been removed from the endangered species list, with over 1.8 million hectares under sustainable management. Finally, Natura can add value to its brand perception and gain consumer and regulator support, create more innovative products by incorporating traditional knowledge from local communities and avoid supply-chain bottlenecks by ensuring the valuable forest resources they rely on do not disappear.
1. For more information about Natura and its work with the Ucuuba tree, see https://www.naturabrasil.com/collections/ucuuba.
– Coordinated reforestation in degraded landscapes. Central elements to achieving effective reforestation include global collaboration, strong political will and the inclusive engagement of local stakeholders that, together, focus on site-specific considerations. “Future proofing” reforestation initiatives against the predicted impacts of climate change can help sustain the transition while requiring lower levels of investment.
REUTERS/THIERRY GOUEGNON

TOWARDS A NATURE POSITIVE FOOD, LAND AND OCEAN USE SYSTEMII
38New Nature Economy Report II – The Future Of Nature And Business
Planet-compatible consumption
What is it?While the transitions discussed earlier have dealt with where and how we farm, and fish, planet-compatible consumption deals with how much we need to farm, and fish. What and how we consume food, particularly resource-intensive animal-based protein, as well as other agricultural and forest products such as natural fibres, has a disproportionate impact on our ability to solve the current climate, humanitarian and nature crises.98 Shifting to planet-compatible
5consumption is essential to reducing the agri-food system’s impact on the planet. It also holds significant potential to improve health outcomes and food security worldwide.
Mainly, this will mean shifting away from overconsumption of resource-intensive animal protein and of throw-away models for fast fashion. In many regions, excessive consumption of
Where are we now and where do we need to get to? The world did not meet the UN Convention on Biological Diversity’s Aichi Biodiversity Target 5 on the loss, degradation and fragmentation of forests.88 Between 1990 and 2015, the world lost 290 million hectares of forest – about the size of Argentina. This loss was only partially offset by 110 million hectares of newly planted forests.89 Forestry accounted for 30% of annual global forest cover loss between 2001 and 2018.90 Wood harvesting for paper and lumber products is the primary forestry activity in the Northern hemisphere, while in tropical rainforests most logging is driven by high-end hardwoods, fuelwood and charcoal.91 Globally, over 2 billion people, mostly in developing countries, still rely on wood fuel for their primary energy.92 While the total forest area certified under sustainable forestry management increased five-fold between 2000
and 2015,93 it still falls short of global targets.94 For instance, for every commercial tree removed in the Amazon, 16–27 other trees are damaged and 600 square metres of canopy is opened.95
Forests are one of those critical ecosystems that have the potential to define the fate of the climate change, biodiversity and the Sustainable Development Goals (SDGs).96 Achieving global goals across these fronts will require effectively conserving and managing existing forests to halt deforestation and restore degraded forests while increasing afforestation and reforestation throughout the world. The Nature Conservancy estimates that potential carbon savings from cost-effective natural forest management and improved plantations could be 535 million tonnes annually by 2030.97

39New Nature Economy Report II – The Future Of Nature And Business
TOWARDS A NATURE POSITIVE FOOD, LAND AND OCEAN USE SYSTEMII
red meat has severely impacted environmental and health outcomes.99 Over the past few years, alternative protein products have grown exponentially in certain regions, with the intent of curbing the environmental impact of GHG emissions and of water and land use, among other environmental concerns. Plant-based substitutes can use up to 99% less water and 97% less land than beef, and they generate 96% less in GHG emissions.100 These benefits and trends also extend to plant-based dairy, which is currently the largest plant-based alternatives category. Plant-based milk now accounts for 14% of all sales value for retail milk in the United States and sales are growing.101
This shift, necessary for human and environmental health, must be managed with attention to its impact on the livelihoods of small ranchers and on the rural communities that currently depend on livestock and dairy for income, and with sensitivity to the health and nutrition of the most vulnerable women and children, particularly in the emerging markets.102
Where are we now and where do we need to get to?will use up a quarter of the world’s carbon budget and significant amounts of land and water.113
Scaling the use of appropriate public policy tools will be essential to the success of this transition.114 Subsidy reform in agriculture, as discussed earlier, can also help reflect the true environmental and societal health costs of food production in product prices. More comprehensive product labelling requirements can be instituted to encourage consumers to purchase more nutritious and less environmentally harmful foods. Public funding can be made available to encourage innovation in new food groups; many governments have already done this, for instance, in developing their alternative proteins industries. National health programmes and public procurement encouraging more consumption of healthy and diverse food categories, including fruits, vegetables, nuts and seeds, as well as moderating consumption by reducing portion sizes and through better packaging have proven promising in developed and developing countries alike.
In fashion and apparel, companies are increasingly building new and more circular models for their business. For instance, they have started to use high value, low impact raw materials such as organic cotton while also boosting innovation in garment recycling and upcycling. Their efforts are supported by industry coalitions, with encouraging results that need further scaling up. 115
Shifting over-consumption away from red meats implies increased consumption of a larger variety of fish, fruits and vegetables. Dietary diversification is viewed as an essential component of planet-compatible diets: 75% of the world’s food comes from just 12 plant and 5 animal species.103
What we wear is also increasingly coming into focus as a threat to the health of the environment. To address this challenge, solutions now seek to reduce the demand for natural fabric by designing clothes that last longer and are worn longer, can easily be rented or resold and recycled, and are produced without releasing toxins or pollution.104
In parallel, adopting planet-compatible consumption will require addressing consumer waste. Although some consumer waste is inevitable, most can be avoided by changing behaviours.105 Strategies for reducing food and textile waste could reduce food insecurity, reduce expenditures, and save large amounts of scarce resources.
Animal products currently provide only 18% of calories, while their production occupies over 80% of farmland and accounts for 58% of food-related GHG emissions and most deforestation.106 According to one study, consumers shifting to nation-specific recommended diets could reduce GHGs by 25%, eutrophication by 21% and land use by 17.6% in high-income countries.107 Shifting just 20% of global calorie consumption from meat to fish would save 60 to 80 million hectares of cropland,108 equivalent to two to three times the landmass of the United Kingdom.
Meanwhile, an estimated 440 million tonnes of food is wasted at the consumption stage annually – squandering resources such as water and needlessly emitting carbon.109 Consumers in rich nations waste up to 115 kilograms of food per capita a year on average, compared with just 6 to 11 kilograms per capita in Sub-Saharan Africa and South Asia.110 Tackling wastage across the supply chain could significantly improve the planet’s ability to feed the growing global population: a 30% reduction in food waste at the point of consumption in developed countries could save roughly 40 million hectares of cropland.111 Additionally, textile waste already generates $500 billion in annual economic losses.112 As long as clothing is seen as disposable, annual textile waste will rise. It is expected to reach 148 million tonnes by 2030, up from 91 million tonnes in 2017. If nothing changes, by 2050 the fashion industry

40New Nature Economy Report II – The Future Of Nature And Business
TOWARDS A NATURE POSITIVE FOOD, LAND AND OCEAN USE SYSTEMII
What are they?
BOX 2.5
TRASE: Leveraging trade and satellite data to support sustainability in supply chains
The TRASE platform seeks to transform our understanding of agricultural commodity supply chains.1 The platform aggregates publicly available data from agricultural supply chain companies to map the commodity flows between consumer and producer countries and associated land use change. It aims to cover over 70% of the total traded volume in major forest-risk commodities by 2021, including soy, beef, palm oil, timber, pulp and paper, coffee, cocoa and aquaculture. TRASE assesses a supply chain actor’s exposure to the reputational, legal, operational and other risks associated with deforestation. These risks are linked to the amount of deforestation that took place in the landscape where a forest-risk commodity was produced. This data is intended to support sourcing decisions by commodity traders, producer country governments and consumer country governments, as well as by investors, manufacturers, retailers, civil society organizations and consumer groups, to strengthen accountability across global supply chains.
1. TRASE, 2020, “What Is TRASE?”, https://trase.earth/about
Integrating greater transparency, traceability and collaboration into supply chains will improve their sustainability and legality by enabling consumers, regulators and producers to make informed decisions.
To improve supply chain transparency and sustainability, increased global, national and intra-value chain collaboration will be needed. Past experience has shown that isolated corporate commitments by individual companies have been relatively unsuccessful in generating sufficient momentum for sustainable sourcing.116 However, public-private partnerships in critical agricultural commodity-producing landscapes, such as by applying jurisdictional approaches, can create conducive conditions to support producers and sourcing companies alike in integrating sustainable practices into their supply chains.117 International public-private platforms such as the Tropical Forest Alliance (TFA) are proving successful in bringing together government, business and civil society in tackling tropical deforestation related to soft commodities.118
Industry stakeholders are already transforming their operational and business processes by incorporating new technologies and advanced analytics into all parts of the value chain, including sourcing, processing, reporting, and surveillance and control. Technological solutions could transform the management of
agricultural and forestry supply chains and fisheries. For example, authorities can now detect real-time or unreported fishing by looking at vessels’ speed and course profile.119 DNA fingerprinting and mapping are among the technologies that can be used to trace and verify the origins of timber products.120 Higher traceability in food value chains can accomplish a range of goals, including meeting consumer demand for food transparency; building capacity to identify, respond to and prevent food safety problems; supporting supply chain optimization and monitoring to reduce food loss; and validating sourcing claims to support legal, ethical, sustainability and accountability goals.121
Governments have important roles to play in ensuring the sustainability in supply chains. They can fund new infrastructure for supply chain logistics and cold storage, particularly in remote areas; introduce mandatory procurement reporting standards for the private sector and sustainable sourcing requirements for public procurement; establish global partnerships with key commodity-producing regions to develop sustainable trade standards; and exchange and publicly release trade data on sourcing for key commodities to build transparency and accountability (see Box 2.5 for an example).
6 Transparent and sustainable supply chains

41New Nature Economy Report II – The Future Of Nature And Business
TOWARDS A NATURE POSITIVE FOOD, LAND AND OCEAN USE SYSTEMII
Where are we now and where do we need to get to?Supply chains in the agriculture and seafood industry are complex, opaque, and lack international harmonization.122 The lack of clarity makes it easier for producers to operate illegally or unethically, frustrating consumers, investors and regulators, who are increasingly demanding more information about the environmental and social impact of the products they consume, invest in and regulate. As a result, deforestation continues unabated while 70% of all food loss and waste occurs even before the food reaches consumers.123 Most of this post-harvest loss occurs in developing countries, the result of poor storage facilities and inadequate transport infrastructure.124 These conditions not only constitute a wasteful use of scarce natural resources, but they
also reduce farmers’ income, remove valuable food from already food-insecure tables and create lost sales opportunities for traders. With the same problems in forestry supply chains, illegal forestry currently supplies between 10% and 15% of global timber – as high as 50% in some areas,125 making it the most lucrative natural resource crime globally. Illegal fishing also scores high – valued at between $10 billion and $32 billion annually, it is the third most profitable natural resource wrongdoing.126
Some trends in sustainable sourcing and better reporting are encouraging. Forest 500, a global project that assesses and reports on the supply chains of the 500 largest companies and investors in forest-risk supply chains, found that the number of companies making corporate commitments grew by 14% from 2014 to 2018.127 Commodity-specific sustainable sourcing arrangements, such as the Roundtables for Sustainable Palm Oil and Responsible Soy and the Rainforest Alliance certification scheme for cocoa, are also making progress. Sales of Marine Stewardship Council (MSC)-certified seafood reached 1 million tonnes for the first time in 2018, increasing to 15% of overall production from 10% in 2014.128 However, much progress still needs to be made. It is still unclear to what extent commitments have led to progress on the ground, since such certifications generally account for a small share of overall production and there are currently too many standards, which often are not aligned.129 Moreover, many large actors have yet to take significant steps – for instance, 40% of the companies on the Forest 500 list have no deforestation commitments at all.130
Progress is needed on multiple fronts, including coherent global sourcing requirements, improved traceability, centralized and open source databases and user-friendly certification schemes, including in emerging markets.131 The potential impact on biodiversity is large. For example, a more ambitious sustainable sourcing approach in soy and palm oil by European country signatories to the Amsterdam Declaration could save over 5.7 million hectares of forests by 2030 and provide up to 5% of the carbon abatement gap required by 2030.132,133 Progress is also needed on scaling jurisdictional approaches, as these have proven successful in bringing together government, global commodity-sourcing companies, local communities and small producers, and civil society in commodity-producing regions to improve sustainability in supply chains for key deforestation-risk commodities such as beef, soybean and palm oil (see Box 2.6). Past analysis reveals that 90% of top commodity-producing regions do not have active jurisdictional approaches in place. 134
BOX 2.6
Active jurisdictional approaches to combat tropical deforestation
It is increasingly clear that to address an issue as complex as tropical deforestation, collective action is needed at global, national and local levels. Jurisdictional approaches refer to the collective action needed in key production landscapes under the jurisdictional of a sub-national government (e.g. state or municipality). These approaches are emerging as a promising way to create synergies between the private sector’s work on sustainable sourcing, sub-national government efforts to regularise land use and balance economic, social and environmental needs, with local producers’ efforts to embrace regenerative and productive agriculture.1
Examples include the large agricultural state of Mato Grosso in Brazil which launched its “Produce, Conserve and Include” strategy in 2015. By building on existing policies and past successes to fight deforestation, the strategy aims to provide incentives to local farmers and governments for sustainable land use.2 If progress to date has been uneven, with 2020 targets for eliminating illegal deforestation not being met, there has been meaningful progress on increasing livestock productivity, sustainable forest management, and increasing access to rural credit for family farmers.3 In Sabah, Malaysia, the state government has committed to jurisdictional wide certification for sustainable palm oil sourcing according to the standards set by the Roundtable on Sustainable Palm Oil (RSPO).4
1. Tropical Forest Alliance (2019), A “commodity-first” approach to identifying landscapes for private sector engagement” Available at: https://www.tropicalforestalliance.org/assets/Uploads/TFA-Commodity-First-Landscapes-April-2019.pdf
2. Earth Innovation Institute [EII] Website. Available at: https://earthinnovation.org/2015/12/mato-grosso-produce-conserve-include-3/
3. PCI Monitoring Working Group (2019), Produce, Conserve and Include Strategy in Mato Grosso: Goals’ progress 2015/2016/2017/2018 Year 3. Available at: http://pcimonitor.org/
4. Roundtable on Sustainable Palm Oil [RSPO] (2017), “Impact update report”. Available at: https://rspo.org/toc/RSPO-Impact-Update-Report-2017_221117.pdf

42New Nature Economy Report II – The Future Of Nature And Business
TOWARDS A NATURE POSITIVE FOOD, LAND AND OCEAN USE SYSTEMII
Emerging business opportunities across these six transitions could create nearly $3.6 trillion worth of annual value and 191 million jobs by 2030
Business opportunities associated with these six transitions are gaining traction with leading stakeholders and sustainability-conscious consumers’ demand. These opportunities could create nearly $3.6 trillion in additional revenue and cost savings per year in 2030, together with over 191 million new jobs – 5% of the size of the global labour force (Figure 2.1).135 It should be noted that these estimates are based on existing business models and commercialized technologies. Additional opportunities are expected to arise as nascent technologies and new players emerge and markets develop. This section details the largest and most interesting business opportunities of those identified.136
1. Based on estimated savings or project market sizing in each area. These represent revenue opportunities that are incremental to business-as-usual scenarios. Where available, the range is estimated based on analysis of multiple sources. Rounded to nearest US$5 billion.
SOURCE: Food and Land Use Coalition (FOLU); Business and Sustainable Development Commission (BSDC); The Nature Conservancy (TNC); World Resources Institute (WRI); McKinsey Global Institute (MGI); Market research; Literature review; AlphaBeta analysis
FIGURE 2.1
The six transitions in this system could create almost $3.6 trillion of annual business opportunities and 191 million jobs by 2030
Ecosy
stem re
storat
ion
and
avoid
ed la
nd an
d
ocea
n use
expa
nsion
Total business opportunities by transition in 2030US$ billions1
Total jobs by transition in 2030Millions
Produ
ctive
and
regen
erativ
e agr
icultu
re
Health
y and
prod
uctiv
e oce
ans
Sustai
nable
man
agem
ent
of for
ests
Planet
compa
tible
cons
umpt
ion
Trans
paren
t
and
susta
inable
supp
ly ch
ains
191
Total
Total
450 1,140 170 230 1,060 515
11 62 14 16 70 18
3,565
The SDG goal of halving consumer food waste presents an annual opportunity of around $380 billion in 2030, given projected growth in food demand and waste.137 Technologies and business models that could reduce consumer food waste include packaging solutions such as BluWrap and ethylene-removal technology; food-sensing technologies to verify food safety and reduce avoidable waste; retrofitting dining facilities to nudge customers towards smaller portions and less waste; better tracking of waste within restaurants and food service; and promoting “secondary retailers” who can make edible products from still-usable produce (Box 2.7).138 Although annual returns on investment vary by

43New Nature Economy Report II – The Future Of Nature And Business
II TOWARDS A NATURE POSITIVE FOOD, LAND AND OCEAN USE SYSTEM
technology application and geography, research has shown that returns of up to 14 times the initial investment can be achieved.139
Achieving consistency in food labelling standards will be a critical enabler in communicating product shelf life to consumers and restaurants and reducing premature wastage. At present, challenges in harmonization are apparent both within and between countries. In the near term, this opportunity might also be affected by the COVID-19 pandemic due to shifting food demand and supply patterns. For instance, eating out options are being severely restricted by safe distancing measures while take-away and direct purchase by consumers might increase. Ultimately, these shifts will impact where and how much waste is generated.
BOX 2.7
Tackling consumer food waste using Fourth Industrial Revolution technologies
Food waste costs the hospitality industry over $100 billion annually. Commercial kitchens can waste up to 20% of food purchased — an amount often equivalent to their total net profits – in part because chefs lack the tools to manage waste. Winnow, a technology driven solution, uses artificial intelligence (AI) to automatically capture images of and analyse the food being thrown away, generating data that helps chefs to optimize their food production and purchase, reduce food waste and increase profits.1 Winnow has already helped kitchens in dozens of countries halve their food waste, thus reducing food costs by up to 8% and achieving up to a 10-fold return on investment in year one. By reducing the amount of food wasted, Winnow is also helping their clients reduce their carbon and land footprints.
1. Information about Winnow is available from https://www.winnowsolutions.com/company
Reducing food loss and waste in the food supply chain – from farm to retail – is a similarly large and critical opportunity that could generate annual cost savings of $365 billion by 2030. Basic technologies such as small metal silos and plastic crates, which are scarce in many developing countries, can have a major impact on storage and transportation. Pilots in Benin, Ghana, India and Rwanda suggest that relatively low-cost storage techniques and handling practices can reduce post-harvest food loss by more than 60% and raise smallholders’ incomes by more than 30%.140 More advanced technologies enabled by Fourth Industrial Revolution similarly hold immense potential to reduce food loss – for instance, the IBM Food Trust is pursuing blockchain-enabled supply chains with big agribusiness partners including Walmart, Tyson Foods, Nestle, and Unilever among others.141 Similar to the impact on the opportunity to reduce consumer food waste, this opportunity may also be affected by the COVID-19 pandemic. We might see a shift towards more localized supply of agricultural products in many countries to reduce their dependency on food import. This would have both positive and negative impacts on business opportunities and technology deployment in developed and developing countries.
Diversifying the basket of vegetables and fruits consumed would tackle the current health issues related to the underconsumption of vegetables, fruits, legumes and whole grains in all regions (which are as low as 30% of dietary reference intakes in Sub-Saharan Africa). A more diversified diet would also create significant upside opportunties, worth $310 billion annually by 2030.142

44New Nature Economy Report II – The Future Of Nature And Business
TOWARDS A NATURE POSITIVE FOOD, LAND AND OCEAN USE SYSTEMII
Ecotourism is among the largest business opportunities in the food, land and ocean use system, potentially creating an additional annual revenue opportunity of $290 billion by 2030.143 Ecotourism is the fastest-growing market in the tourism sector, valued at $300 billion in 2019, and had been forecast to grow at above 14% annually through at least 2026 before COVID-19 interrupted global travel.144 As a result of the pandemic,
BOX 2.8
Travelling for nature in Namibia
Namibia’s tourism industry directly generates roughly 3.5% of its GDP and indirectly contributes to over 10% of its GDP through other related activities, while supporting nearly 15% of the country’s workforce.1 Namibia is the first African country to add the protection of the environment to its constitution, and it is a leader in responsible tourism.2 It is doing so by making sure that ecotourism and activities involve, engage and benefit local communities through “communal conservancies”, making flourishing wildlife more lucrative than poaching. Today, roughly 44% of the country’s territory is designated as protected areas.3
The success of Namibia’s model is illustrated through the multiple ecotourism projects that are heralded as best practice examples for combining sustainable economic growth, ecological conservation and social development.4 Namibia now has the largest quotient in the world of free-roaming animals and it has restored populations of near-extinct animals such as the black rhino.5 This abundance, in turn, has attracted visitors who are looking for unique travel experiences.
1. Environment and Tourism Minister Pohamba Shifeta at the launch of the 5th edition of the Tourism Satellite Account (TSA), 2018, as reported by The Namibian, 2018, “Tourism Sector Largest-Earning Industry”, https://www.namibian.com.na/173740/archive-read/Tourism-sector-largest-earning-industry
2. WWF, no date, “Places – Namibia”, https://www.worldwildlife.org/places/namibia
3. NACSO, 2017, “Latest statistics on Conservation areas in Namibia 2017”, http://www.nacso.org.na/resources/conservancy-profile-data
4. State of Queensland, 2015, Best Practice Ecotourism Development Guidelines, https://www.ecotourism.org.au/assets/Resources-Hub-Ecotourism-Plans/Best-Practice-Ecotourism-Development-Guidelines-2015.pdf
5. Levine, B. P., 2019, “The Urgent Effort to Save Black Rhinos from Extinction”, CNN, https://edition.cnn.com/2019/07/30/opinions/protect-namibia-free-roaming-black-rhinos-levine/index.html
BOX 2.9
Precision agriculture improves crop yields in Indonesia
HARA, a smart-farming solution, helps Indonesian farmers to improve yields by providing data-driven insights into farm and field potential, input and supply management, and proactive mitigation of pests and disease. Developed by local data analytics firm Dattabot in partnership with cloud provider Predix and General Electric,1 HARA analyses a combination of historical data, manual feedback, input from sensors and satellite imagery. It has resulted in an average 60% improvement in crop yields, 50% reduction in farming inputs and 25% reduction in crop failure rates.
1. General Electric, Dattabot and GE Work to Secure the Future of Agriculture in Indonesia, https://www.ge.com/digital/sites/default/files/download_assets/Dattabot-GE-Predix-case-study.pdf
tourist arrivals are expected to fall by up to 78% year-on-year in 2020.145 At the time of writing, given the uncertainties around the persistence of COVID-19 as a global health threat, it is impossible to forecast how long this downturn will persist. Yet, as tourism becomes viable again, ecotourism could be a significant opportunity for responsible tourism (Box 2.8). This could boost livelihoods and protect and restore nature – especially in developing countries with undisturbed biodiversity-rich habitats, including Congo, Costa Rica, Kenya, Viet Nam, and countries in the Amazon.146 Governments could prioritize ecotourism recovery by putting into place policies such as “green zoning” – a proposed approach that could create a network of virus-free regions called “green zones” into which travel is encouraged and permitted without enhanced screening or quarantine measures.147
Technology in large-scale farms represents a large business opportunity that could yield up to $195 billion per year by 2030 when valuing land spared by increased productivity. This opportunity also has the potential to create over 4.3 million associated jobs. New precision-agriculture technologies could improve large-scale farm yields by 40% over the next 20 years (see Box 2.9).148 Such innovations include farm-management

45New Nature Economy Report II – The Future Of Nature And Business
TOWARDS A NATURE POSITIVE FOOD, LAND AND OCEAN USE SYSTEMII
software that leverage satellite imagery and big data analytics to improve planting and harvest cycles; and machinery that applies farming inputs more precisely, such as tractors fitted with GPS and multispectral sensors (for accurate application of nitrogen and other fertilizers), drone technology to sow seeds and apply pesticides, and advanced robotics.149,150 The McKinsey Global Institute estimates that the internal rate of return from investing in such technologies is greater than 10%.151
Sustainable forest management for timber, pulp and paper products could create $165 billion in additional annual revenue by 2030. Between 2000 and 2015, the total area certified under sustainable forestry management (SFM) increased from 12% of total forest area under management to 54%.152 If all timber and pulp and paper products for the top 100 pulp and paper companies alone came from SFM-certified forests by 2030, the business opportunity could amount to $165 billion.153 This prospect includes relatively nascent products such as high-value low-volume timber, as well as new end-applications such as timber buildings, which alone could be worth $45 billion per year by 2030.154 It also includes precision forestry
solutions, which are on the rise with geospatial mapping, fire detection, precision application of inputs, drone surveyance, fully mechanized harvesting and so on. Smallholder farmers will need to be trained and supported to embark on this journey, and demand-side interventions in international markets will be needed to boost the case for sustainable forestry products.
A circular economy in textiles could lower material costs, reduce exposure to price volatility, and create new growth opportunities such as fashion-as-a-service while reducing GHG emissions and the consumption of virgin materials (Box 2.10). Establishing circular models in fashion will require using more renewable inputs; transforming the way clothes are designed, sold, used, collected and reprocessed; and supporting the creation of reverse-logistics chains for second-hand or end-of-life clothes. Increasing the current rate of circularity of textile waste from 14% to just 30% could generate a savings worth $130 billion per year by 2030.155
The rise of bio-innovation – both plant and animal genetics technology – could be worth $125 billion per year by 2030. Advanced breeding and fertilization products and procedures are expanding crop yields and livestock supply and, hence, reducing the need for land and chemical inputs.156 Together, if adopted at scale, these technologies could increase crop yields by up to 650 million tonnes by 2030, while significantly boosting farmer’s incomes as well. For instance, herbicide-tolerant and insect-resistant Intacta soybeans in South America earned farmers
BOX 2.10
Teemill – Promoting the circular economy in textiles
Teemill is an online shopping platform that lets customers build and sell their own t-shirt designs through their marketplace, sending made-to-order t-shirts directly to purchasers and sharing profits with the designers.1 Products are made in real-time – only after they have been ordered, thus eliminating overproduction and, consequently, waste. Each product is designed to be delivered back to the company when worn out or unwanted – customers need only scan a QR code in the care label to initiate redelivery – allowing new products to be remade repeatedly from the recovered material. Customers even receive credits for new products.
In manufacturing, Teemill incorporates six key areas in its circular model: organic cotton, water, renewable energy, no surplus production, material flow and improved packaging. All their t-shirts are made exclusively from organic cotton sourced from India – the advantage of using a single material is that products can be recycled repeatedly. Cotton cultivation also generates valuable by-products, such as cotton seeds (used as livestock feed) and vegetable oils. Its manufacturing units in India and the United Kingdom are fully powered by renewable energy. Processed water at these units is recovered, cleaned and recirculated for reuse. Teemill also only uses rip- and splash-proof packaging made of reusable paper.
1. World Economic Forum, 2019, “These 11 Companies Are Leading the Way to a Circular Economy”, https://www.weforum.org/agenda/2019/02/companies-leading-way-to-circular-economy/
Increasing the current rate of circularity of textile waste from 14% to just 30% could generate a savings worth $130 billion by 2030.

TOWARDS A NATURE POSITIVE FOOD, LAND AND OCEAN USE SYSTEMII
46New Nature Economy Report II – The Future Of Nature And Business
(Box 2.11). The aquaculture industry is projected to almost double between 2015 and 2030, but in many ways it is relatively immature.158 Technological improvements – such as in automated feed dispensing, water quality monitoring, improved waste management systems, harvesting and packaging — alone constitute a $20 billion opportunity. High-value sustainable aquaculture could grow as communities in emerging markets such as China adopt more sustainable diets. The internal rate of return from investing in sustainable aquaculture is found to be greater than 10%.159
Natural climate solutions, including cost-effective reforestation and the avoidance of further conversion of terrestrial ecosystems for agriculture,160 could help abate up to 20% of total anthropogenic GHG emissions by 2030. Valuing this opportunity as the total cost of the relevant mitigation potential of natural climate solutions, which could be supplied by the private
Alternative proteins could capture 10% of the global meat market by 2030, up from less than 1% in 2017
an additional $3.88 for every $1 invested in the genetically modified seeds over conventional seeds, measured over a five-year period.157 The agricultural and livestock biotechnology market – including end-products as well as technologies for genetic testing of crops – was estimated to be worth roughly $50 billion in 2019 and could grow at 11% annually. However, these technologies require credible governance mechanisms to manage the risk of unintended consequences.
Another large, significant opportunity is sustainable aquaculture, which could create an incremental annual opportunity worth $115 billion by 2030

47New Nature Economy Report II – The Future Of Nature And Business
TOWARDS A NATURE POSITIVE FOOD, LAND AND OCEAN USE SYSTEMII
BOX 2.11
Regenerative ocean farming using vertical polycultures
Recent studies have shown that farming seaweeds and shellfish in less than 5% of US waters could absorb 10 million tonnes of nitrogen and 135 million tonnes of carbon – all with no fresh water or other inputs. If practiced in even 1% of the world’s ocean, this could create 50 million jobs and produce significant amounts of food and non-food innovative products. Non-food grade seaweed can be used as plastic substitute, helping to address the global plastic problem.
GreenWave is a non-profit organization that seeks to provide training, tools and support to a 10,000 regenerative ocean farmers over 10 years to catalyse the planting of almost 400,000 hectares and yield meaningful economic and climate impacts.1 To implement this effort, Greenwave deploys a Regenerative Reef model that includes the whole supply chain, from low-impact ocean farms to end-buyers. GreenWave’s vertical polyculture farming system grows a mix of seaweeds and shellfish that requires zero input, produces high yields over a small area, sequesters carbon and rebuilds reef ecosystems that are critical to healthy ocean.
1. Greenwave, 2020, “Our Model – Regenerative Ocean Farming”, https://www.greenwave.org/our-model
sector through carbon markets, could create an opportunity worth $85 billion by 2030.161 The potential benefits of such investment are significant. For instance, achieving the Bonn Challenge of restoring 46% of the world’s degraded forests could provide between $7 and $30 in economic benefits for each dollar spent in implementation costs.162 Further developing payment for ecosystem services – including climate change mitigation, watershed services and biodiversity conservation – will be essential for enabling the private sector to participate in a meaningful way. Although this opportunity relates to natural climate solution pathways outside of working landscapes, there is strong potential to deploy opportunities to sequester carbon through regenerative agriculture in working lands in tandem with such solutions.163
Experts expect the recent surge in demand for alternative proteins (i.e. plant-based or other non-animal-based proteins) to continue as consumer awareness grows, technologies mature and prices fall. Alternative proteins could capture 10% of the global meat market by 2030, up from less than 1% in 2017, to create a market value of $85 billion.164 Even when adjusting for expected demand shocks from COVID-19, this is expected to create an additional revenue opportunity worth $70 billion. Some seek to mimic beef, chicken and pork, using mainly plant protein – including extracts from soy and pea – as
the base ingredient. Others use microbes, fungi or insects, and some have even started using stem cells from animals, reproduced in laboratories.165 A range of start-ups in Asia are developing alternatives to seafood products that could reduce the pressure on fisheries and aquaculture.166
Sustainable inputs present a rapidly growing market. These include opportunities related to biopesticides and microbial and organic fertilizers, as well as more efficient ways to apply fertilizers and use cover cropping to replenish soil nutrition and avoid nitrogen-based effluents. These prospects could be worth $60 billion annually by 2030 and create 4.3 million associated jobs. The market for biopesticides and microbial and organic fertilizers could potentially grow at between 14% and 17% annually until 2025, boosted by favourable regulation and consumer pressure to reduce chemicals in food.167
Sustainable management of wild fisheries could lead to around $40 billion in annual savings by 2030 by reducing losses caused by overexploitation of wild fisheries. Such losses are estimated to come to around $83 billion today168 — for instance, from vessels needing to travel further to find fish: it takes five times the effort to catch the same amount of fish now as it did in 1950.169 Improved area targeting and harvest management can help fish stocks replenish over the long term and help reduce losses from overfishing. Demand is growing for sustainable fish production: in one global survey, 72% of consumers agreed that shoppers should consume only food from sustainable sources.170 A key solution to support this opportunity is to use tradeable fishing permits supported by new technologies in areas such as sensing, tracking, mapping and simulation. Meanwhile, precision fishing technologies – for example, those that allow fishers to optimize navigation routes and manage catch quality – could save large-scale fishing companies about $11 billion a year.171
Certified sustainable foods provide another key market opportunity for both producers and supply chain companies. Sustainability certifications are growing in importance to manage reputational and compliance risks for agricultural supply chain and fast-moving consumer goods companies.172 Governments are increasingly instituting sustainable sourcing regulations and green procurement rules.173 Despite relatively low volumes of produce that is certified as sustainable today, accelerated growth in this area could create an market opportunity worth $20 billion in 2030 over-and-above current expectations for just four commodities – soy, palm oil, coffee and cocoa.

48New Nature Economy Report II – The Future Of Nature And Business
TOWARDS A NATURE POSITIVE FOOD, LAND AND OCEAN USE SYSTEMII
1 This report builds on frameworks developed by the Food and Land Use Coalition (FOLU) to define the “food, ocean and land use system” – this includes the ways land and the ocean are used and food is produced, stored, packed, processed, traded, distributed, marketed, consumed and disposed of. As such it includes food from aquatic ecosystems, both marine and freshwater, and both farmed and wild-caught, as well as agriculture for non-food purposes, such as fibre for textiles and crops for bioenergy, as these both compete with food for fertile land or are part of integrated agriculture systems. In this report we additionally include in the system all forests, while making explicit the role of the oceans, hence the term “food, land and ocean use system”. For further details, see The Food and Land Use Coalition [FOLU], 2019, Growing Better: Ten Critical Transitions to Transform Food and Land Use, https://www.foodandlandusecoalition.org/wp-content/uploads/2019/09/FOLU-GrowingBetter-GlobalReport.pdf
2 The Food and Land Use Coalition highlighted 10 broad critical transitions that are needed to respond to the food system’s environment, socio-political, and economic challenges; see FOLU, 2019, Growing Better, op. cit.
3 Business & Sustainable Development Commission [BSDC], 2017, Better Business Better World, http://report.businesscommission.org/
4 Our World in Data, 2020, “The Visual History of Hunger and Food Provision”, https://forest500.org/sites/default/files/forest500_annualreport2019_final_0.pdf; and Roser, M. and H. Richie, 2020, “Food Supply”, https://ourworldindata.org/food-supply
5 McKinsey Global Institute, 2011, Resource Revolution: Meeting the World’s Energy, Materials, Food, and Water Needs, November 2011, https://www.mckinsey.com/business-functions/sustainability/our-insights/resource-revolution
6 FOLU, 2019, Growing Better, op. cit.; and van Nieuwkoop, M., 2019, “Do the Costs of the Global Food System Outweigh Its Benefits?” World Bank Blogs, https://blogs.worldbank.org/voices/do-costs-global-food-system-outweigh-its-monetary-value
7 Willett, W. et al., 2019, “Food in the Anthropocene: The EAT-Lancet Commission on Healthy Diets from Sustainable Food Systems”, The Lancet Commissions, 393 (10170), P447–92, https://www.thelancet.com/journals/lancet/article/PIIS0140-6736(18)31788-4/fulltext
8 These transitions have emerged following a thorough review of key past research as well as extensive engagement with communities of interest (e.g. EAT-Lancet, Business and Sustainable Development Commission, Food and Land Use Coalition, World Resources Institute, etc.), and experts from civil society, academia, and the private and public sector.
9 Kharas, H., 2017, “The Unprecedented Expansion of the Global Middle Class: An Update”, https://www.brookings.edu/wp-content/uploads/2017/02/global_20170228_global-middle-class.pdf
10 Valin, H. et al., 2014, “The Future of Food Demand: Understanding Differences in Global Economic Models”, Agricultural Economics, 45 (1), 51–67, https://onlinelibrary.wiley.com/doi/abs/10.1111/agec.12089
11 Griscom, B. W. et al./The Nature Conservancy [TNC], 2017, Natural Climate Solutions – Supporting Information Appendix, Proceedings of the National Academy of Sciences of the USA, https://www.pnas.org/content/114/44/11645
12 Arkema, K. et al., 2013, “Coastal Habitats Shield People and Property from Sea-Level Rise and Storms”, Nature Climate Change 3, 913–918, https://doi.org/10.1038/nclimate1944
13 Improved water security through natural water supply is discussed in further detail in Chapter 3 – Towards a nature-positive infrastructure and built environment system. See Abell, R. et al./The Nature Conservancy, 2017, Beyond the Source: The Environmental, Economic and Community Benefits of Source Water Protection, Arlington, VA: The Nature Conservancy, https://www.nature.org/en-us/what-we-do/our-insights/perspectives/a-natural-solution-to-water-security/
14 Sobrevila, C., 2008, The Role of Indigenous Peoples in Biodiversity Conservation, Washington, DC: World Bank, http://documents.worldbank.org/curated/en/995271468177530126/pdf/443000WP0BOX321onservation01PUBLIC1.pdf
15 Food and Agriculture Organization of the United Nations [FAO], 2017, “6 Ways Indigenous Peoples Are Helping the World Achieve #ZeroHunger”, http://www.fao.org/zhc/detail-events/en/c/1028010/
16 Buchner, B. et al., 2019, Global Landscape of Climate Finance 2019, Climate Policy Initiative, London, https://climatepolicyinitiative.org/publication/global-landscape-of-climate-finance-2019/
17 Forest Trends’ Ecosystem Marketplace, 2019, Financing Emission Reductions for the Future: State of Voluntary Carbon Markets 2019, Washington DC: Forest Trends.
18 Barbier, E. B. et al., 2020, “Adopt a Carbon Tax to Protect Tropical Forests”, Nature, 578, 213–16.
19 Intergovernmental Panel of Biodiversity and Ecosystem Services [IPBES], 2019, Global Assessment Report on Biodiversity and Ecosystem Services of the Intergovernmental Science-Policy Platform on Biodiversity and Ecosystem Service (Chapters 5 and 6), https://ipbes.net/global-assessment
20 Jung, M. et al., 2020, “Areas of Global Importance for Terrestrial Biodiversity, Carbon, and Water”, BioRxiv. https://doi.org/10.1101/2020.04.16.021444
21 Bai, Y. et al., 2018, “Developing China’s Ecological Redline Policy Using Ecosystem Services Assessments for Land Use Planning”, Nature Communications 9, article 3034, https://www.nature.com/articles/s41467-018-05306-1
22 Curtis, P. G. et al., 2018, “Classifying Drivers of Global Forest Loss”, Science, 361 (6407), 1108–11, https://science.sciencemag.org/content/361/6407/1108
Endnotes

49New Nature Economy Report II – The Future Of Nature And Business
TOWARDS A NATURE POSITIVE FOOD, LAND AND OCEAN USE SYSTEMII
23 Busch, J. and J. Engelmann, 2017, “Cost-Effectiveness of Reducing Emissions from Tropical Deforestation, 2016–2050”, Environmental Research Letters, 13 (1), 015001.
24 World Wildlife Fund [WWF], 2018, Living Forests Report, http://wwf.panda.org/our_work/forests/forest_publications_news_and_reports/living_forests_report/
25 Seabeds at depths of over 400 metres below the surface have commercial deep-sea trawling operations. See Tickler, D. et al., 2018, “Far from Home: Distance Patterns of Global Fishing fleets,” Science Advances, 4, (8), https://advances.sciencemag.org/content/4/8/eaar3279
26 Palomares, M. L. D. et al., 2018. A Preliminary Global Assessment of the Status of Exploited Marine Fish and Invertebrate Populations, A report prepared by the Sea Around Us for OCEANA, The University of British Columbia, Vancouver, https://s3-us-west-2.amazonaws.com/legacy.seaaroundus/researcher/dpauly/PDF/2018/Reports/OceanaFinalReport_V7a.pdf
27 UN Convention on Biological Diversity, 2018, Aichi Biodiversity Targets, https://www.cbd.int/sp/targets/
28 UNEP-WCMC, 2019, Global Statistics from the World Database on Protected Areas (WDPA), September 2019, https://www.unep-wcmc.org/resources-and-data/wdpa
29 Hoegh-Guldberg, O. et al., 2019, The Ocean as a Solution to Climate Change: Five Opportunities for Action, World Resources Institute, http://www.oceanpanel.org/climate
30 Wilson, E. O., 2016, Half-Earth: Our Planet’s Fight for Life, New York: Liveright Publishing Corporation.
31 Woodley, S. et al., 2019, “A Review of Evidence for Area-Based Conservation Targets for the Post-2020 Global Biodiversity Framework”, Parks, 25 (2 November), https://parksjournal.com/wp-content/uploads/2019/12/PARKS-25.2-Woodley-et-al-10.2305-IUCN.CH_.2019.PARKS-25-2SW2.en_.pdf
32 .Locke, H. et al., 2019, “Three Global Conditions for Biodiversity Conservation and Sustainable Use: An Implementation Framework”, National Science Review, 6 (6), 1080–82, https://doi.org/10.1093/nsr/nwz136
33 Gao, J., 2019, “How China Will Protect One-Quarter of Its Land”, Nature, 569 (457), https://www.nature.com/articles/d41586-019-01563-2
34 Dave, R. et al., 2019, Second Bonn Challenge Progress Report: Application of the Barometer in 2018, Gland, Switzerland: IUCN. xii + 80pp. and updated figures, https://www.bonnchallenge.org/
35 World Resources Institute, 2017, Roots of Prosperity: The Economics and Finance of Restoring Land, https://files.wri.org/s3fs-public/roots-of-prosperity_0.pdf
36 FOLU, 2019, Growing Better, op., cit.
37 1t.org, no date, “It.org – FAQ”, http://www3.weforum.org/docs/WEF_1t_org_FAQ.pdf
38 World Economic Forum, 2020, “One Trillion Trees - World Economic Forum Launches Plan to Help Nature and the Climate”, https://www.weforum.org/agenda/2020/01/one-trillion-trees-world-economic-forum-launches-plan-to-help-nature-and-the-climate/
39 Friends of Ocean Action, 2020, “The Business Case for Marine Protection”, http://www3.weforum.org/docs/WEF_Business_case_for_marine_protection.pdf
40 Smith, P. et al., 2019, “ Interlinkages Between Desertification, Land Degradation, Food Security and Greenhouse Gas Fluxes: Synergies, Trade-offs and Integrated Response Options”, in Climate Change and Land: An IPCC Special Report on Climate Change, Desertification, Land Degradation, Sustainable Land Management, Food Security, and Greenhouse Gas Fluxes In Terrestrial Ecosystems, https://www.ipcc.ch/site/assets/uploads/2019/08/2h.-Chapter-6_FINAL.pdf
41 The referenced paper projected increased yields in business-as-usual and sustainability scenarios based on empirical relationships between yields and growth in GDP per capita for regions defined by geography and climate. See Tallis, H. et al./The Nature Conservancy [TNC], 2018, An Attainable Global Vision for Conservation and Human Well-Being, https://www.nature.org/content/dam/tnc/nature/en/documents/TNC_AnAttainableGlobalVision_Frontiers.pdf
42 Hoegh-Guldberg et al., 2019, The Ocean as a Solution to Climate Change, op. cit.
43 Protected planet, no date, World Database on Protected Areas, www.protectedplanet.net
44 Duarte, C. M. et al., 2020, “Rebuilding Marine Life”, Nature, 580, 39–51, https://doi.org/10.1038/s41586-020-2146-7
45 FOLU, 2019, Growing Better, op. cit.
46 FOLU, 2019, Growing Better, op. cit.; and Terra Genesis International, 2020, “Regenerative Agriculture”, http://www.regenerativeagriculturedefinition.com/
47 Michigan State University, 2018, “Nature Can Reduce Pesticide Use, Environment Impact”, ScienceDaily, www.sciencedaily.com/releases/2018/03/180301103715.htm
48 AgriProve, 2020, “Soil Carbon Achieves Major Milestone: Creating New Income Streams for Queensland Farmers”, https://agriprove.io/our-news/soil-carbon-achieves-major-milestone-creating-new-income-streams-for-queensland-farmers
49 McKinsey Global Institute, 2011, Resource Revolution, op. cit.
50 Cong, W-F. et al., 2015, “Intercropping Enhances Soil Carbon and Nitrogen”, Global Change Biology, 21, 1715–26, https://doi.org/10.1111/gcb.12738
51 Gregory, M. et al., 2003, “Comparing Agroecosystems: Effects of Cropping and Tillage Patterns on Soil, Water, Energy Use and Productivity”, Renewable Agriculture and Food Systems, 20 (2), 81–90, https://doi.org/10.1079/RAF200493
52 Kirchman, H., 2019, “Why Organic Farming Is Not the Way Forward”, https://journals.sagepub.com/doi/abs/10.1177/0030727019831702

50New Nature Economy Report II – The Future Of Nature And Business
TOWARDS A NATURE POSITIVE FOOD, LAND AND OCEAN USE SYSTEMII
53 TNC, 2016, “Green Growth and Sustainable Cattle Intensification in Pará”, Environment, 9 June 2016, https://www.slideshare.net/CIFOR/green-growth-and-sustainable-cattle-intensification-in-par
54 Laborde, D. et al., 2020, “Modeling the Impacts of Agricultural Support Policies on Emissions from Agriculture”, Unpublished draft paper, International Food Policy Research Institute [IFPRI] and World Bank.
55 World Economic Forum, 2020, Incentivizing Food Systems Transformation, Geneva: World Economic Forum, http://www3.weforum.org/docs/WEF_Incentivizing_Food_Systems_Transformation.pdf
56 United Nations Convention to Combat Desertification, 2017, The Global Land Outlook, first edition, https://www.unccd.int/sites/default/files/documents/2017-09/GLO_Full_Report_low_res.pdf
57 McKinsey Global Institute, 2011, Resource Revolution, op. cit.
58 World Resources Institute, 2019, World Resources Report: Creating a Sustainable Food Future – A Menu of Solutions to Feed Nearly 10 Billion People by 2050, https://wrr-food.wri.org/
59 FOLU, 2019, Growing Better, op. cit.
60 Financial Times, 2019, “The Big Green Bang: How Renewable Energy Became Unstoppable”, Financial Times, https://www.ft.com/content/44ed7e90-3960-11e7-ac89-b01cc67cfeec
61 Marine protected areas (MPAs) are areas designated and effectively managed to protect marine ecosystems, processes, habitats and species, which can contribute to the restoration and replenishment of resources for social, economic and cultural enrichment. MPAs include marine reserves, fully protected marine areas, no-take zones, marine sanctuaries, ocean sanctuaries, marine parks, locally managed marine areas and so on. See Friends of Ocean Action, 2019, The Business Case for Marine Protection and Conservation, http://www3.weforum.org/docs/WEF_Business_case_for_marine_protection.pdf
62 Duarte et al., 2020, “Rebuilding Marine Life”, op. cit.
63 Barner, A. K. et al., 2015, “Solutions for Recovering and Sustaining the Bounty of the Ocean: Combining Fishery Reforms, Rights-Based Fisheries Management, and Marine Reserves”, Oceanography, 28 (2), 252–63, https://doi.org/10.5670/oceanog.2015.51
64 Browder, G. et al., 2019, Integrating Green and Gray: Creating Next Generation Infrastructure, World Bank Group and World Resources Institute, https://oppla.eu/sites/default/files/images/Putting%20Nature%20to%20Work.pdf
65 Costello, C. et al., 2019, The Future of Food from the Sea, Washington, DC: World Resources Institute, www.oceanpanel.org/future-food-sea
66 Buck, B. H. et al., 2018, “State of the Art and Challenges for Offshore Integrated Multi-Trophic Aquaculture (IMTA)”, Frontiers in Marine Science, 15 May 2018, https://doi.org/10.3389/fmars.2018.00165
67 Government of Canada, 2019, “Integrated Multi-Trophic Aquaculture”, https://www.dfo-mpo.gc.ca/aquaculture/sci-res/imta-amti/index-eng.htm
68 WWF, 2019, “Overview”, https://www.worldwildlife.org/industries/sustainable-seafood
69 Food Innovation Australia Limited, 2019, Protein Market: Size of the Prize Analysis for Australia, https://fial.com.au/Protein_Report_2019
70 FAO, 2018, 2018: State of the World Fisheries and Aquaculture, http://www.fao.org/state-of-fisheries-aquaculture
71 FOLU, 2019, Growing Better, op. cit.
72 Duarte et al., 2020, “Rebuilding Marine Life”, op. cit. 7
73 FAO, 2018, 2018: State of the World Fisheries and Aquaculture, op. cit.
74 World Bank, 2013, Fish to 2030: Prospects for Fisheries and Aquaculture, https://reliefweb.int/report/world/fish-2030-prospects-fisheries-and-aquaculture
75 Kauffman, J. B. et al., 2017, “The Jumbo Carbon Footprint of a Shrimp: Carbon Losses from Mangrove Deforestation”, Frontiers in Ecology and the Environment, 15 (4), 183–88, https://www.cifor.org/library/6431/
76 Costello, C. et al., 2019, The Future of Food from the Sea, op. cit.
77 Components of “Sustainable management of forests” have overlaps with forest ecosystem services/natural climate solutions (e.g. reforestation, avoided conversion etc.) that have been discussed in the transition on “Ecosystem restoration and avoided land and ocean use expansion”. These components will not be discussed in detail in this chapter. For a full list of transitions that are relevant to each of the 19 sectors of the economy, please refer to Chapter 5.
78 FAO, “Forests and Poverty Reduction”, http://www.fao.org/forestry/livelihoods/en/
79 Gibson, L. et al., 2011, “Primary Forests Are Irreplaceable for Sustaining Tropical Biodiversity”, Nature, 478, 378–81.
80 Nature, 2017, “Pristine Forests Are Shrinking Fast”, Nature, 541, 263, https://doi.org/10.1038/541263d
81 Potapov, P. et al., 2017. “The Last Frontiers of Wilderness: Tracking Loss of Intact Forest Landscapes from 2000 to 2013”, Science Advances, 3, 1, https://advances.sciencemag.org/content/3/1/e1600821
82 World Resources Institute, 2016, Climate Benefits, Tenure Costs: The Economic Case for Securing Indigenous Land Rights in the Amazon, Washington, DC: World Resources Institute, https://files.wri.org/s3fs-public/Climate_Benefits_Tenure_Costs.pdf
83 Idem.
84 RRI [Rights and Resources Initiative], 2012, What Rights? A Comparative Analysis of Developing Countries’ National Legislation on Community and Indigenous Peoples’ Forest Tenure Rights, Washington DC: RRI, http://www.rightsandresources.org/wp-content/exported-pdf/whatrightsnovember13final.pdf
85 Chaudhary, A. et al., 2016, “Impact of Forest Management on Species Richness: Global Meta-Analysis and Economic Trade-Offs”, Nature Scientific Reports, 6, article 23954, https://www.nature.com/articles/srep23954

51New Nature Economy Report II – The Future Of Nature And Business
TOWARDS A NATURE POSITIVE FOOD, LAND AND OCEAN USE SYSTEMII
86 Dykstra, D. P., no date, “Reduced Impact Logging: Concepts and Issues”, http://www.fao.org/3/ac805e/ac805e04.htm
87 Morrison-Métois, S. and H. Lundgren, 2016, “Forests and Sustainable Forest Management: Evaluation Evidence on Addressing Deforestation to Reduce CO2 Emissions”, Evaluation Insights, 11, https://www.oecd.org/dac/evaluation/Evaluation-Insights-Forests-Final.pdf
88 IPBES, 2019, Global Assessment Report on Biodiversity and Ecosystem Services of the Intergovernmental Science-Policy Platform on Biodiversity and Ecosystem Services, https://www.ipbes.net/global-assessment-report-biodiversity-ecosystem-services
89 IPBES, 2019, Global Assessment Report on Biodiversity and Ecosystem Services (Chapter 2.3), https://www.ipbes.net/global-assessment-report-biodiversity-ecosystem-services
90 The Sustainability Consortium, World Resources Institute, and the University of Maryland, “Tree Cover Loss by Driver”, accessed 20 May 2020 through Global Forest Watch, www.globalforestwatch.org
91 Curtis, P. G. et al., 2018, “Classifying Drivers of Global Forest Loss”, Science, 361 (6407), 1108–11, https://science.sciencemag.org/content/361/6407/1108
92 UN Sustainable Development Goals, 2017, “More Sustainably Managed Forests Would Help Meet Energy Needs of One-Third of World Population”, https://www.un.org/sustainabledevelopment/blog/2017/03/more-sustainably-managed-forests-would-help-meet-energy-needs-of-one-third-of-world-population/
93 Barbier, E. B. et al., 2018, “How to Pay for Saving Biodiversity”, Science, 360 (6388), 486–88, http://science.sciencemag.org/content/360/6388/486
94 IPBES, 2019, Global Assessment Report, op. cit.
95 Yale School of Forestry and Environment Studies, “Reduced Impact Logging in the Amazon”, https://globalforestatlas.yale.edu/amazon/forests-and-logging/reduced-impact-logging
96 Morrison-Métois and Lundgren, 2016, “Forests and Sustainable Forest Management”, op. cit.
97 Includes plantations for both agricultural and forest products. See Griscom et al./TNC, 2017, Natural Climate Solutions, op. cit.
98 FAO, 2017, The Future of Food and Agriculture – Trends and Challenges, http://www.fao.org/3/a-i6583e.pdf
99 Willett et al., 2019, “Food in the Anthropocene”, op cit.
100 King, T., 2019, “Meat Re-Imagined: The Global Emergence of Alternative Proteins – What Does It Mean for Australia?”, Food Australia, 71 (3 Jun/Aug 2019), https://search.informit.com.au/documentSummary;dn=623036364777020;res=IELHSS;type=pdf]]
101 The Good Food Institute, 2020, “Plant-Based Market Overview”, https://www.gfi.org/marketresearch
102 World Economic Forum, 2019, Meat: The Future Series – Options for the Livestock Sector in Developing and Emerging Economies to 2030 and Beyond, White Paper, https://www.weforum.org/whitepapers/meat-the-future-series-options-for-the-livestock-sector-in-developing-and-emerging-economies-to-2030-and-beyond
103 Data based on research by FAO. See the Alpha Food Labs Future Market, 2020, “Biodiversity – The Intersection of Taste and Sustainability”, http://thefuturemarket.com/biodiversity
104 Ellen MacArthur Foundation, 2017, A New Textiles Economy: Redesigning Fashion’s Future, https://www.ellenmacarthurfoundation.org/publications/a-new-textiles-economy-redesigning-fashions-future
105 FOLU, 2019, Growing Better: Ten Critical Transitions to Transform Food and Land Use, Critical Transition 6. Reducing Food Loss and Waste, https://www.foodandlandusecoalition.org/wp-content/uploads/2019/09/Critical-Transitions-6-Reducing-Food-Loss-and-Waste.pdf
106 Poore, J. and T. Nemecek, 2018, “Reducing Food’s Environmental Impacts through Producers and Consumers”, Science, 360 (6392), 987–92, https://josephpoore.com/Science%20360%206392%20987%20-%20Accepted%20Manuscript.pdf
107 Behrens, P. et al., 2017, “Environmental Impacts of Dietary Recommendations”, Proceedings of the National Academy of Sciences, 114 (51), 13412–17, https://www.pnas.org/content/114/51/13412
108 Size varies depending on the efficiency of feed conversion; production is assumed to come from aquaculture.
109 World Resources Institute, 2019, Reducing Food Loss and Waste: Setting a Global Action Agenda, https://wriorg.s3.amazonaws.com/s3fs-public/reducing-food-loss-waste-global-action-agenda_1.pdf
110 FAO, 2011, Global Food Losses and Food Waste: Extent, Causes and Prevention, http://www.fao.org/3/mb060e/mb060e.pdf
111 McKinsey Global Institute, 2011, Resource Revolution, op. cit.
112 Ellen MacArthur Foundation, 2017, A New Textiles Economy, op. cit.
113 Global Fashion Agenda and The Boston Consulting Group, 2017, Pulse of the Global Fashion Industry, https://globalfashionagenda.com/wp-content/uploads/2017/05/Pulse-of-the-Fashion-Industry_2017.pdf
114 As covered by Willett et al., 2019, “Food in the Anthropocene”, op. cit.; and IPBES, 2019, Global Assessment Report (Chapters 5 and 6), op. cit.
115 Global Fashion Agenda and The Boston Consulting Group, 2017, Pulse of the Global Fashion Industry, op. cit.
116 NYDF Assessment Partners, 2019, Protecting and Restoring Forests: A Story of Large Commitments yet Limited Progress: New York Declaration on Forests Five-Year Assessment Report, Climate Focus (coordinator and editor), https://www.climatefocus.com/sites/default/files/2019NYDFReport.pdf

52New Nature Economy Report II – The Future Of Nature And Business
TOWARDS A NATURE POSITIVE FOOD, LAND AND OCEAN USE SYSTEMII
117 Tropical Forest Alliance, 2019, A “Commodity-First” Approach to Identifying Landscapes for Private Sector Engagement, https://www.alphabeta.com/our-research/commodity-first-a-production-centred-approach-to-mobilising-private-sector-to-curb-deforestation/
118 Tropical Forest Alliance, 2018, “The State of the Supply Chain Movement: Progress on Corporate Commitments and Impact at the Forest Frontier”, in The Sprint to 2020: TFA 2020 Annual Report 2018, https://www.tropicalforestalliance.org/assets/Uploads/Sprint_to_2020_Annual-Report-2018.pdf
119 McKinsey & Company, 2019, Precision Fisheries: Navigating a Sea of Troubles with Advanced Analytics, https://www.mckinsey.com/industries/agriculture/our-insights/precision-fisheries-navigating-a-sea-of-troubles-with-advanced-analytics?cid=other-eml-alt-mip-mck&hlkid=40fafb2742e74bfbb0fd1b2245aa0a58&hctky=1-1541628&hdpid=a2f74055-8e57-4215-b5be-7fb872a1ecb4
120 World Resources Institute [WRI] and World Business Council on Sustainable Development [WBCSD], 2016, Sustainable Forest Products: Traceability – Where Do the Products Come From?, https://sustainableforestproducts.org/
121 World Economic Forum, 2019, Innovation with a Purpose: Improving Traceability in Food Value Chains through Technology Innovations, http://www3.weforum.org/docs/WEF_Traceability_in_food_value_chains_Digital.pdf
122 FOLU, 2019, Growing Better, op. cit.; and FishWise, 2018, Advancing Traceability in the Seafood Industry: Assessing Challenges and Opportunities, https://fishwise.org/traceability/advancing-traceability-in-the-seafood-industry-assessing-challenges-and-opportunities/
123 FOLU, 2019, Growing Better: Ten Critical Transitions to Transform Food and Land Use, Critical Transition 6, op. cit.
124 Business & Sustainable Development Commission, 2017, Better Business Better World Asia, http://s3.amazonaws.com/aws-bsdc/BSDC_asia_web.pdf
125 IPBES, 2019, Global Assessment Report, op. cit.
126 FAO, “Illegal, Unreported and Unregulated (IUU) Fishing”, http://www.fao.org/iuu-fishing/en/
127 Forest 500, 2018, Forest 500 Annual Report 2018: The Countdown to 2020, https://forest500.org/sites/default/files/related-documents/forest500_annualreport2018_0.pdf
128 Marine Stewardship Council [MSC], 2019, Working Together for Thriving Oceans – The MSC Annual Report 2018–19, https://www.msc.org/docs/default-source/default-document-library/about-the-msc/msc-annual-report-2018-2019.pdf?sfvrsn=e37c6f59_5
129 IDH, 2020, The Urgency of Action to Tackle Tropical Deforestation: Protecting Forests and Fostering Sustainable Agriculture, https://www.idhsustainabletrade.com/uploaded/2020/02/IDH_The-UoA-to-Tackle-Tropical-Deforestation_2020-web.pdf
130 Forest 500, 2020, Forest 500 Annual Report 2019: The Companies Getting It Wrong on Deforestation, https://forest500.org/sites/default/files/forest500_annualreport2019_final_0.pdf
131 IDH, 2020, The Urgency of Action to Tackle Tropical Deforestation, op. cit.
132 IDH, 2020, The Urgency of Action to Tackle Tropical Deforestation, op. cit.
133 UNEP, 2019, “UNEP: 1.5C Climate Target ‘Slipping Out of Reach’”, ClimateBrief, https://www.carbonbrief.org/unep-1-5c-climate-target-slipping-out-of-reach
134 Tropical Forest Alliance, 2019, A “Commodity-First” Approach”, op. cit.
135 ILOSTAT, 2020, “Labour force by sex and age – ILO modelled estimates, July 2019 (thousands) Annual”, accessed January 2020, https://www.ilo.org/shinyapps/bulkexplorer57/?lang=en&segment=indicator&id=EAP_2EAP_SEX_AGE_NB_A
136 For more details on other opportunities, please refer to the Methodology Note at https://www.alphabeta.com/our-research/methodology-note-new-nature-economy-report-on-the-future-of-nature-and-business/
137 Refer to the Methodology Note for methodology on estimating value of total food waste in 2030, https://www.alphabeta.com/our-research/methodology-note-new-nature-economy-report-on-the-future-of-nature-and-business/. See also FAO, 2012, World Agriculture: Towards 2030/2050, http://www.fao.org/3/a-ap106e.pdf
138 ReFED, 2016, A Roadmap to Reduce US Food Waste by 20%, https://www.refed.com/downloads/ReFED_Report_2016.pdf; and World Economic Forum, 2018, Innovation with a Purpose: The Role of Technology Innovation in Accelerating Food Systems Transformation, http://www3.weforum.org/docs/WEF_Innovation_with_a_Purpose_VF-reduced.pdf
139 WRAP, 2020, Quantification of Food Surplus, Waste and Related Materials in Supply Chain, http://www.wrap.org.uk/content/quantification-food-surplus-waste-and-related-materials-supply-chain
140 Kitinoja, L. and H. Y. AlHassan, 2012, “Identification of Appropriate Postharvest Technologies for Improving Market Access and Incomes for Small Horticultural Farmers in Sub-Saharan Africa and South Asia. Part 2: Postharvest Loss Assessments”, Acta horticulrurae, 934: 31–40, https://www.researchgate.net/publication/261759546_Identification_of_Appropriate_Postharvest_Technologies_for_Improving_Market_Access_and_Incomes_for_Small_Horticultural_Farmers_in_Sub-Saharan_Africa_and_South_Asia
141 IBM Blockchain, 2020, “IBM Food Trust: A New Era for the World’s Food Supply”, https://www.ibm.com/sg-en/blockchain/solutions/food-trust
142 Willett et al., 2019, “Food in the Anthropocene”, op. cit.
143 “Ecotourism” is defined as “responsible travel to natural areas that conserves the environment, sustains the well-being of the local people, and involves interpretation and education”. The International Ecotourism Society [TIES], 2020, “What Is Ecotourism?”, https://ecotourism.org/what-is-ecotourism/
144 Market Watch, 2020, “Ecotourism Market Size, Share 2020 Global Competitors Strategy, Industry Trends, Segments, Regional Analysis, Review, Key Players Profile, Statistics and Growth to 2026 Analysis”, https://www.marketwatch.com/press-release/ecotourism-market-size-

53New Nature Economy Report II – The Future Of Nature And Business
TOWARDS A NATURE POSITIVE FOOD, LAND AND OCEAN USE SYSTEMII
share-2020-global-competitors-strategy-industry-trends-segments-regional-analysis-review-key-players-profile-statistics-and-growth-to-2026-analysis-2020-01-27; and EBSCO Sustainability Watch, 2009, Ecotourism: A Look at the Fastest Growing Segment of the Travel and Tourism Industry, https://ebscosustainability.files.wordpress.com/2010/07/ecotourism.pdf
145 UN World Tourism Organization, 2020, UNTWO World Tourism Barometer May 2020: Special Focus on the Impact of COVID-19, https://webunwto.s3.eu-west-1.amazonaws.com/s3fs-public/2020-05/Barometer%20-%20May%202020%20-%20Short.pdf
146 White, K. Y., 2016, “Eco-Tourism: Better for the Planet, Better for You”, Eco-Business Special Report, https://www.eco-business.com/news/eco-tourism-better-for-the-planet-better-for-you/
147 Oliu-Barton, M. and B. Pradelski, 2020, “Green-Zone Travelling: A Pan-European Strategy to Save Tourism”, https://dobetter.esade.edu/en/green-zones-covid-19
148 McKinsey Global Institute, 2011, Resource Revolution, op. cit.
149 The Economist, 2016, Technology Quarterly: The Future of Agriculture, 2 June 2016, https://www.economist.com/technology-quarterly/2016-06-09/factory-fresh
150 FOLU, 2019, Growing Better, op cit.
151 McKinsey Global Institute, 2011, Resource Revolution, op. cit.
152 141 Barbier, E. B. et al., 2018, “How to Pay for Saving Biodiversity”, op. cit.
153 Consistent with data sources used by Barbier et al., 2017, op. cit., including PwC, 2016, Global Forest, Paper, and Packaging Industry Survey: 2016 Edition Survey of 2015 Results, https://www.pwc.com/gx/en/industries/assets/pwc-annual-fpp-industry-survey-2016-10.pdf
154 Business and Sustainable Development Commission [BSDC], 2017, Valuing the SDG Prize, http://s3.amazonaws.com/aws-bsdc/Valuing-the-SDG-Prize.pdf
155 Ellen MacArthur Foundation, 2017, A New Textiles Economy, op. cit.
156 World Economic Forum, 2018, Innovation with a Purpose: The Role of Technology Innovation in Accelerating Food Systems Transformation, op. cit.
157 Brookes, G. ,2018, “The Farm Level Economic and Environmental Contribution of Intacta Soybeans in South America: The First Five Years”, GM Crops & Food, 9 (3), 140–51, https://www.tandfonline.com/doi/full/10.1080/21645698.2018.1479560
158 World Bank, 2013, Fish to 2030, op. cit.
159 McKinsey Global Institute, 2011, Resource Revolution, op. cit.
160 UN-REDD Programme, 2016, About REDD+, https://www.un-redd.org/
161 This estimate is based only on carbon payments and does not include additional revenues from agroforestry and reduced impact logging. Please see the Methodology Note for more details on sizing at https://www.alphabeta.com/our-research/methodology-note-new-nature-economy-report-on-the-future-of-nature-and-business/. See also
Griscom et al./TNC, 2017, Natural Climate Solutions, op. cit. for more on mitigation potential of different NCS pathways considered.
162 Organisation for Economic Co-operation and Development [OECD], 2019, Biodiversity: Finance and the Economic and Business Case for Action, https://www.oecd.org/environment/resources/biodiversity/G7-report-Biodiversity-Finance-and-the-Economic-and-Business-Case-for-Action.pdf
163 The Forum’s Natural Climate Solutions Alliance aims to bring together researchers and champions in both forestry and agriculture to strengthen natural climate solutions in both working and wild, degraded or abandoned landscapes. See World Economic Forum, 2020, Natural Climate Solutions Alliance, https://www.weforum.org/natural-climate-solutions-alliance
164 Barclays, 2019, “I Can’t Believe It’s Not Meat”, https://eu16.salesforce.com/sfc/p/#1t000000wCuV/a/1t000000Xg33/q3Bm_z_oiIm8K7s4mnGLApU.WpmqvU6rEsBaiqGRob4
165 Bashio, Z. et al., 2019, “Alternative Proteins: The Race for Market Share Is On”, McKinsey & Company, https://www.mckinsey.com/industries/agriculture/our-insights/alternative-proteins-the-race-for-market-share-is-on; and Lagally, C. et al., 2017, Plant-Based Meat Mind Maps: An Exploration of Options, Ideas and Industry, The Good Food Institute, https://www.gfi.org/files/PBMap.pdf
166 Kateman, B., 2019, “Fish Replacement May Be the Next Big Wave in Alternative Protein Development”, Tech Crunch, 7 July 2019, https://techcrunch.com/2019/07/07/fish-replacement-may-be-the-next-big-wave-in-alternative-protein-development/
167 Global Industry Analysts, 2016, Biopesticides: A Global Strategic Business Report, https://www.strategyr.com/pressMCP-1573.asp
168 World Bank, 2017, “Giving Oceans a Break Could Generate $83 Billion in Additional Benefits for Fisheries”, Press Release, 14 February 2017, https://www.worldbank.org/en/news/press-release/2017/02/14/giving-oceans-a-break-could-generate-83-billion-in-additional-benefits-for-fisheries
169 Rousseau, Y. et al., 2019, “Evolution of Global Marine Fishing Fleets and the Response of Fished Resources”, Proceedings of the National Academy of Sciences of the United States of America, 116 (25), 12,238–43, https://www.pnas.org/content/116/25/12238
170 Kearns, M., 2016, “New Survey Sees Seafood Consumers Placing Sustainability before Price and Brand”, SeafoodSource, 13 July 2016, https://www.seafoodsource.com/news/foodservice-retail/new-survey-sees-seafood-consumers-placing-sustainability-before-price-and-brand
171 McKinsey & Company, 2019, Precision Fisheries, op. cit.
172 Eco-Business, 2018, “How Do Companies Benefit from Sustainable Palm Oil Certification?”, 9 November 2018, https://www.eco-business.com/news/how-do-companies-benefit-from-sustainable-palm-oil-certification/; and WWF, 2012, Profitability and Sustainability in Palm Oil Production: Analysis of Incremental Financial Costs and Benefits of RSPO Compliance, https://d2ouvy59p0dg6k.cloudfront.net/downloads/profitability_and_sustainability_in_palm_oil_production__update_.pdf
173 IDH, 2020, The Urgency of Action to Tackle Tropical Deforestation, op. cit.
Towards a nature-positive infrastructure and built environment system
CHAPTER III
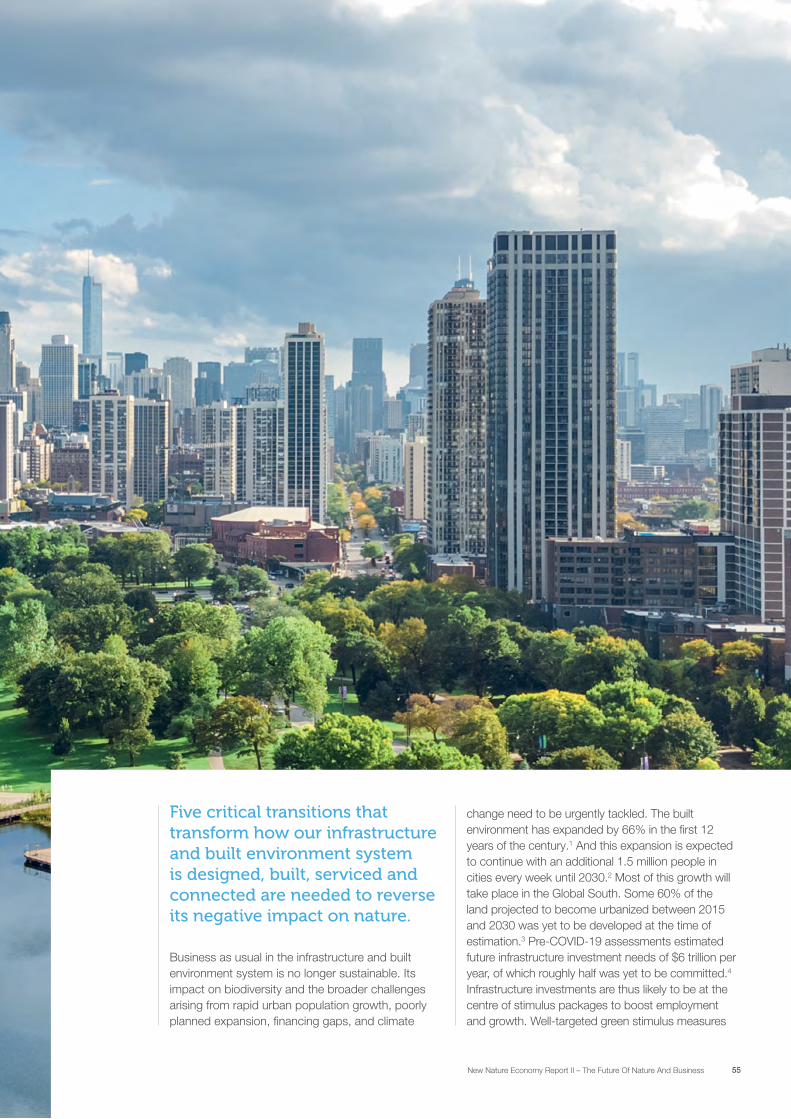
55New Nature Economy Report II – The Future Of Nature And Business
Five critical transitions that transform how our infrastructure and built environment system is designed, built, serviced and connected are needed to reverse its negative impact on nature.
Business as usual in the infrastructure and built environment system is no longer sustainable. Its impact on biodiversity and the broader challenges arising from rapid urban population growth, poorly planned expansion, financing gaps, and climate
change need to be urgently tackled. The built environment has expanded by 66% in the first 12 years of the century.1 And this expansion is expected to continue with an additional 1.5 million people in cities every week until 2030.2 Most of this growth will take place in the Global South. Some 60% of the land projected to become urbanized between 2015 and 2030 was yet to be developed at the time of estimation.3 Pre-COVID-19 assessments estimated future infrastructure investment needs of $6 trillion per year, of which roughly half was yet to be committed.4 Infrastructure investments are thus likely to be at the centre of stimulus packages to boost employment and growth. Well-targeted green stimulus measures
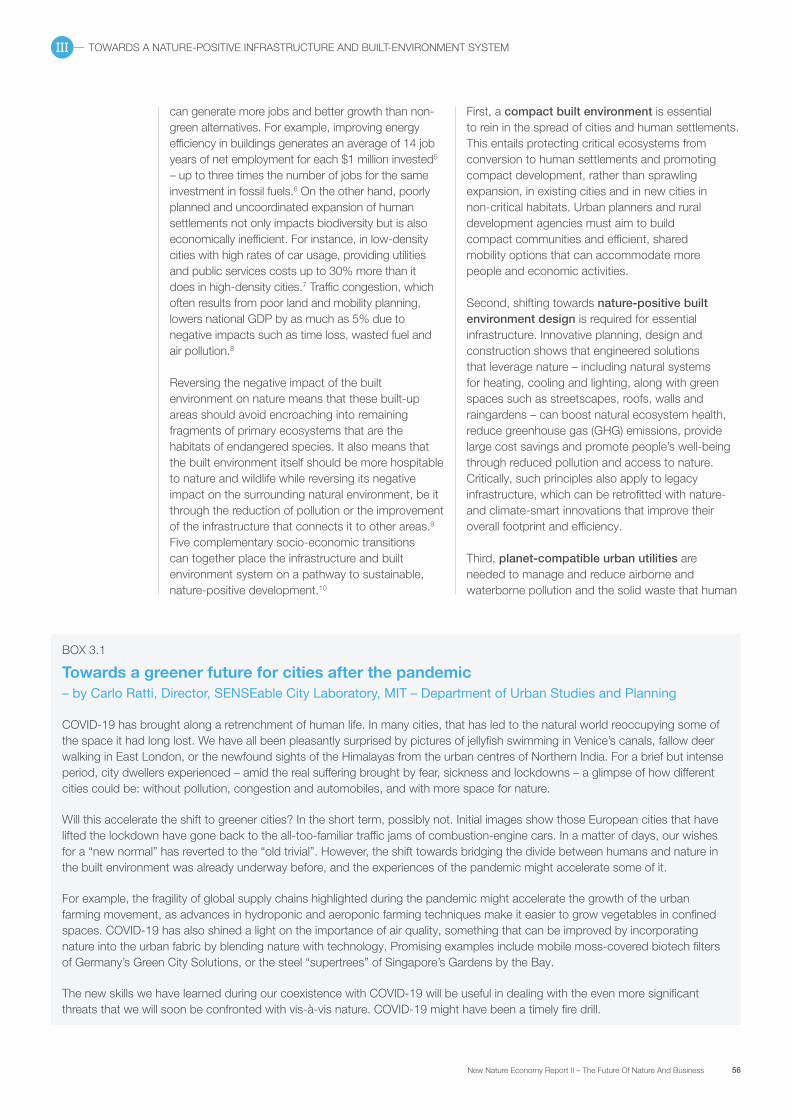
56New Nature Economy Report II – The Future Of Nature And Business
TOWARDS A NATURE-POSITIVE INFRASTRUCTURE AND BUILT-ENVIRONMENT SYSTEMIII
can generate more jobs and better growth than non-green alternatives. For example, improving energy efficiency in buildings generates an average of 14 job years of net employment for each $1 million invested5 – up to three times the number of jobs for the same investment in fossil fuels.6 On the other hand, poorly planned and uncoordinated expansion of human settlements not only impacts biodiversity but is also economically inefficient. For instance, in low-density cities with high rates of car usage, providing utilities and public services costs up to 30% more than it does in high-density cities.7 Traffic congestion, which often results from poor land and mobility planning, lowers national GDP by as much as 5% due to negative impacts such as time loss, wasted fuel and air pollution.8
Reversing the negative impact of the built environment on nature means that these built-up areas should avoid encroaching into remaining fragments of primary ecosystems that are the habitats of endangered species. It also means that the built environment itself should be more hospitable to nature and wildlife while reversing its negative impact on the surrounding natural environment, be it through the reduction of pollution or the improvement of the infrastructure that connects it to other areas.9 Five complementary socio-economic transitions can together place the infrastructure and built environment system on a pathway to sustainable, nature-positive development.10
First, a compact built environment is essential to rein in the spread of cities and human settlements. This entails protecting critical ecosystems from conversion to human settlements and promoting compact development, rather than sprawling expansion, in existing cities and in new cities in non-critical habitats. Urban planners and rural development agencies must aim to build compact communities and efficient, shared mobility options that can accommodate more people and economic activities.
Second, shifting towards nature-positive built environment design is required for essential infrastructure. Innovative planning, design and construction shows that engineered solutions that leverage nature – including natural systems for heating, cooling and lighting, along with green spaces such as streetscapes, roofs, walls and raingardens – can boost natural ecosystem health, reduce greenhouse gas (GHG) emissions, provide large cost savings and promote people’s well-being through reduced pollution and access to nature. Critically, such principles also apply to legacy infrastructure, which can be retrofitted with nature- and climate-smart innovations that improve their overall footprint and efficiency.
Third, planet-compatible urban utilities are needed to manage and reduce airborne and waterborne pollution and the solid waste that human
BOX 3.1
Towards a greener future for cities after the pandemic – by Carlo Ratti, Director, SENSEable City Laboratory, MIT – Department of Urban Studies and Planning
COVID-19 has brought along a retrenchment of human life. In many cities, that has led to the natural world reoccupying some of the space it had long lost. We have all been pleasantly surprised by pictures of jellyfish swimming in Venice’s canals, fallow deer walking in East London, or the newfound sights of the Himalayas from the urban centres of Northern India. For a brief but intense period, city dwellers experienced – amid the real suffering brought by fear, sickness and lockdowns – a glimpse of how different cities could be: without pollution, congestion and automobiles, and with more space for nature.
Will this accelerate the shift to greener cities? In the short term, possibly not. Initial images show those European cities that have lifted the lockdown have gone back to the all-too-familiar traffic jams of combustion-engine cars. In a matter of days, our wishes for a “new normal” has reverted to the “old trivial”. However, the shift towards bridging the divide between humans and nature in the built environment was already underway before, and the experiences of the pandemic might accelerate some of it.
For example, the fragility of global supply chains highlighted during the pandemic might accelerate the growth of the urban farming movement, as advances in hydroponic and aeroponic farming techniques make it easier to grow vegetables in confined spaces. COVID-19 has also shined a light on the importance of air quality, something that can be improved by incorporating nature into the urban fabric by blending nature with technology. Promising examples include mobile moss-covered biotech filters of Germany’s Green City Solutions, or the steel “supertrees” of Singapore’s Gardens by the Bay.
The new skills we have learned during our coexistence with COVID-19 will be useful in dealing with the even more significant threats that we will soon be confronted with vis-à-vis nature. COVID-19 might have been a timely fire drill.

57New Nature Economy Report II – The Future Of Nature And Business
TOWARDS A NATURE-POSITIVE INFRASTRUCTURE AND BUILT-ENVIRONMENT SYSTEMIII
settlements leak into their surroundings. Smarter and cleaner utilities that provide cleaner air, safer water, more efficient sanitation, modern energy, and comprehensive waste and recycling services benefit both nature and people.
Fourth, complementing human-engineered solutions with restoring and protecting nature as infrastructure can be used, for example, to build resilience to extreme weather events or provide essential services such as water supply and drainage. This often involves working with rural communities, including indigenous peoples who are guardians of large natural areas. The cost savings for municipalities could be substantial.
Finally, built spaces will need nature-positive connecting infrastructure such as green transport, subterranean infrastructure and eco-bridges. Ecosystem impact assessments, biodiversity offsets and new forms of transportation
that reduce the need for physical assets could enable infrastructure projects such as the Belt and Road Initiative (BRI) to enhance connectivity while minimizing habitat fragmentation.11
Only with an unprecedented shift in how our built environment is designed, built, constructed, serviced and connected will we able to sustain both nature and human standards of living (Box 3.1). The public sector has a prominent role to play in setting the rules that shape the development of the built environment, and, as such, success in this system is predicated on effective public policies. Yet successful public-private cooperation, extending from the planning and design process to implementation, is key to reducing public budget deficits; bringing innovative approaches in spatial planning and urban design; and ensuring greater efficiency, better cost, on-time delivery and budgetary certainty in the construction and management of urban services.12
1 Compact built environment
What is it?A compact built environment is one that strategically adapts land-use planning and design to accommodate more infrastructure and more people in a smaller area. High-density development spares land for agriculture and nature by optimizing infrastructure usage, reducing urban sprawl and establishing conservation management areas to protect nature that has been spared.
Strategic densification should apply to both existing cities and settlements, through the revitalization and infill of areas where space underutilization is high (see Box 3.2), and to new city developments around strategic nodes.13 Compact urbanization requires urban planners, infrastructure companies and public agencies to work together to strategically plan, design and develop dense built environments. These kind of developments incorporate functionally and socially mixed-use neighbourhoods, are centred around efficient and accessible mass transit systems, offer affordable housing, and carefully assess infrastructure needs before approving projects.14,15 In addition to conserving land, optimizing densities and reducing sprawl in strategic
nodes creates more liveable cities by providing jobs, services and amenities, including access to nature, nearer to homes; it also lowers the costs, time and pollution related to commuting.16 Such high-density nodes may also be useful in future responses to disease outbreaks. For instance, Singapore is exploring how to leverage its nodes to contain potential COVID-19 clusters by isolating specific neighbourhoods or regions that are able to cater to their residents’ needs rather than placing the entire city on lockdown.17
Securing political commitment for a sustainable built environment is crucial in providing predictability and direction to the infrastructure development master plans and in strengthening urban and territorial planning to best utilize the spatial dimension of the urban form. Success requires overhauling unhelpful legacy policies, including zoning requirements that mandate minimum lot sizes, parking requirements, and single land uses; building codes that stipulate low building heights; and government mortgage programmes that preferentially support single-family dwellings.18 Investment in public transport

58New Nature Economy Report II – The Future Of Nature And Business
TOWARDS A NATURE-POSITIVE INFRASTRUCTURE AND BUILT-ENVIRONMENT SYSTEMIII
and shared mobility reduce the need for land area devoted to parking, increasing housing affordability.19 Finally, density should not come at the cost of liveability and resilience. The conservation of high-
Where are we now and where do we need to get to?
BOX 3.2
Urban rehabilitation in Milan: Repurposing vacant land with nature-positive infrastructure
Large international exhibitions are important events that cities around the world clamour to hold. Large amounts of land are typically devoted to these momentary events, meaning their impact can be disproportionally large compared to their benefits if end-of-life repurposing is not considered in their design. The Milan World Expo 2015, which covered 100 hectares, successfully addressed this challenge thanks to the innovative collaboration between the Carlo Ratti Associati and Australian real estate group Lendlease, whereby the land was repurposed and transformed into Milan’s European Innovation Hub – a scientific hub and community-oriented neighbourhood focused on boosting economic growth and promoting social progress that will employ up to 1,000 scientists.1
The hub not only showcases compact densification but also highlights the power of nature-positive innovation. The building Palazzo Italia, for instance, incorporates a photocatalytic principle designed to capture air pollution, thereby reducing smog levels as well as reducing the speed of surface deterioration. Its exterior panels, layered with photovoltaic glass and concrete cladding, enable Palazzo Italia to meet its own energy needs.2
1. Carlo Ratti Associati, 2020, “Milan’s European Innovation Hub: Recycling the World Expo Site for the Sake of Science”, https://urbannext.net/milans-european-innovation-hub/
2. MIND [Milan Innovation District], 2020, “Masterplan”, https://www.mindmilano.it/en/masterplan/
Data indicates that average urban density is falling in all regions – and by as much as a third in East Asia and the Pacific.21 In other words, the space occupied by urban areas is growing faster than the urban population. Globally, 60% of all urban space is sparsely populated.22 In the United States, 15% of urban land is vacant.
Office and commercial space in cities is underutilized, creating significant opportunities to improve return on investments while reducing the need for land expansion. Around the world, an estimated 40 billion square metres of floor space – an area roughly equivalent to the size of Switzerland – is not used at full occupancy during office hours.23 In China, 22% of office space was reportedly vacant in mid-2019.24 The COVID-19 upheaval has prompted a surge in flexible and remote working and education models in many countries; greater application of such models could help reduce the need for private office spaces and optimize the use of school buildings in the future. Underutilization also applies to residential developments: in the
United Kingdom, for example, almost half of all owner-occupied homes have at least two spare bedrooms.25
Research shows that utilizing inner-city land that is currently vacant and promoting compact urban growth can reduce land use by as much as 75% in comparison with a sprawl scenario.26 In Europe, sharing models in cities could reduce urban sprawl by up to 30 million hectares by 2050 – an area equivalent to the size of Belgium.27 More-compact urban development yields a wide range of benefits, including productivity gains, reduced health impacts thanks to lower air pollution and fewer traffic accidents, and reduced upfront investments.28 It can save up to 50% of upfront capital expenditure on new infrastructure such as roads, sewers and water lines that would otherwise have to be developed,29 conserving $3 trillion between 2015 and 2030 globally.30 China alone could save an estimated $1.4 trillion in costs by using compact development – equivalent to around 20% of its GDP in 2019 terms.31
quality, accessible, connected and communal green space is essential for equitable and liveable built-up density, with a more temperate climate, cleaner air and higher resilience.20

59New Nature Economy Report II – The Future Of Nature And Business
TOWARDS A NATURE-POSITIVE INFRASTRUCTURE AND BUILT-ENVIRONMENT SYSTEMIII
What is it?A nature-positive built environment shares space with nature, putting whole ecosystems rather than humans alone at the centre of design. Nature-positive built environment design has three elements.32
2 Nature-positive built environment design
BOX 3.3
Green development for the built environment – An example from China
The Suzhou Industrial Park (SIP) was built in 1994 as a key milestone in the China-Singapore collaboration. Since then its GDP has increased nearly 260-fold, reaching over USD36 billion in 2018. The park today accommodates 25,000 companies of which 92 are Fortune 500 companies, and is home to 800,000 people.1
While SIP has always integrated some components of green development, since 2012 this has been at the core of its strategy. The park has 122 green development policies, including stipulations on optimizing and intensifying land use, the improvement of water and ecological protection, guided funds for efficient and green buildings and the construction of low carbon communities.2 As a result, 34% of the park’s GDP is generated by green industries. By combining public sector policies with market mechanisms, SIP has been able to tap into significant synergies. For instance, to maximize circular models, a central organic waste treatment plant aggregates and transforms the biological waste, sludge and reclaimed water from one set of industries to subsequently deliver organic fertilizer, biogas and biodiesel oil to another set of sectors.
Other highlights of the park’s green growth include the fact that 94% of industrial water is reused, 100% of new constructions are green buildings, energy is dominantly renewable and green spaces cover 45% of the city, offering protection to areas of great ecological functions and ecosystems diversity. In addition, SIP has created an online environmental monitoring facility that provides a platform for public transparency. The park also uses an innovative social management model that allows all residents and enterprises to democratically participate in the city’s development. And to boost continuous improvement, over 3% of the park’s GDP is directed into R&D and the thousands of research facilities the city boasts.
1. Zeng, D., Z., 2016, “Building a Competitive City through Innovation and Global Knowledge: The Case of Sino-Singapore Suzhou Industrial Park”. World Bank Group. http://documents.worldbank.org/curated/en/234971468196142758/pdf/WPS7570-REVISED-Building-competitive-cities-through-innovation-and-global-knowledge.pdf
2. Suzhou Administrative Park Committee, Think Tank of Ecological Civilization Research, Chinese Academy of Sciences, School of Environmental, Tsinghua University and Research Center for Eco-Environmental Sciences, Chinese Academy of Sciences, 2019, “Green Development of Suzhou Industrial Park – White Paper”.
The first element is to locate infrastructure so as to avoid, or at least to minimize, the destruction or fragmentation of primary ecosystems and of the habitats of endangered species.33 Since habitats, biodiversity, and ecosystem services are highly location specific, determining the least destructive placement requires effective spatial planning to identify areas for human development. Geospatially explicit national and regional land-use planning that integrates biodiversity and climate concerns is essential to ensure successful nature- and climate-smart development. China’s Ecological Conservation Red Line (ECRL) is a leading example of a legal and regulatory framework that includes maps of biodiversity, ecosystem services and existing land uses in long-term strategic land-use development planning.34
The second element of a nature-positive built environment is to design infrastructure systematically in ways that are energy and resource efficient, maximize biodiversity and ecosystem services, and build resilience to climate change.35 For instance, deciding on components as seemingly simple as roof design can increase energy production (e.g. through solar panels) and reduce flooding and the urban heat-island effect (e.g. through green roofs), while green façades can reduce air pollution by up to 20% and traffic noise by up to 10 decibels.36 Buildings can be designed to use sun, rain and wind to help with cooling, heating, light and ventilation. A range of supporting policy mechanisms design for better outcomes, including mandatory standards for buildings’ energy efficiency and circularity, procurement rules that call for the use of sustainable materials, and subsidies that promote green buildings.37 It is particularly critical for new infrastructure to be nature-positive, given that design decisions for existing infrastructure and their consequent impact on the environment are locked in for years to come. Most infrastructure lasts for 30 to 50 years; 90% of buildings currently in use in the European Union will still be in use in 2050.38
The third element of this new type of built environment is to include design elements that benefit both nature and humans. For instance, interstitial green spaces and eco-bridges can connect habitats of urban wildlife,39 while urban forests can reduce air temperatures and cut air conditioning costs by up to 40%.40 Greener cities are also cities that are better for people’s health and well-being, and for overall resilience.41

60New Nature Economy Report II – The Future Of Nature And Business
TOWARDS A NATURE-POSITIVE INFRASTRUCTURE AND BUILT-ENVIRONMENT SYSTEMIII
Where are we now and where do we need to get to? Recent innovations in building design codes enable new buildings to be net-positive in resource consumption – that is, they can produce more water and energy than they need to function by taking advantage of natural conditions, and then supplement these with active technical measures to maximize the efficiency of energy equipment and systems, while making full use of renewable energy to provide a comfortable indoor environment with minimal energy consumption.45 Initiatives concerning resource-efficient buildings such as Net Zero Energy Buildings are growing worldwide.46 But these efforts need to accelerate.
Humans have tended to settle in biodiversity hotspots because of the ready availability of food, water and shelter in these areas. All 34 biodiversity hotspots identified by Conservation International encompass large urban areas, including Brussels, Cape Town, Curitiba, Mexico City, New York City and Singapore.42
Buildings account for 30% of global energy consumption and 28% of energy-related carbon emissions.43 Simple building refurbishment can reduce energy consumption by up to 30%; more major overhauls can reduce it by up to 80%.44
What are they?Planet-compatible urban utilities aim to effectively manage air, water and solid waste pollution in urban areas. Scaling such utilities will go hand in hand with guaranteeing universal access to modern water and sanitation services, modern waste disposal and recycling services, and modern energy and electricity, hence improving health and social outcomes. Today, about two-thirds of the world’s population rely on sanitation that puts their own or their neighbours’ health at risk from waterborne diseases.47
Modern water and sanitation services include the reliable provision of safe drinking water and modern toilet and plumbing facilities for residential, commercial and industrial buildings.48 Lack of these services can contaminate water networks, which incurs large costs both for the environment and for human health. Municipal governments have a key role to play in ensuring proper planning and financing for water and sanitation services, and they work with private sector partners to build, operate and maintain the infrastructure.
Modern waste disposal and recycling services include efficient mechanisms for the collection, treatment and recycling or reuse of solid and liquid domestic and commercial waste.49 Policy development and regulatory oversight for solid waste collection by local governments is essential to such services, as is increasing the efficiency of collection
3 Planet-compatible urban utilities
through partnerships with private sector partners in environmental services and waste disposal.50
Modern energy and electricity involve replacing wood fuel, charcoal, kerosene and diesel with electricity or directly applying renewable energy for heating, cooling and cooking, whether generated centrally and distributed safely through the grid or generated on-site through renewables. Clean energy access initiatives typically target the urban poor and hard-to-reach rural communities and can offer huge economic and social benefits, notably for women and children, improve human health outcomes, and reduce environmental degradation.51 National and local governments should work together with electricity providers and energy solutions companies to systematically identify communities that could be best served by renewables and determine appropriate technologies for usage.
Innovation, including developing and deploying Fourth Industrial Revolution technologies, has the potential to substantially accelerate this transition. Fourth Industrial Revolution can offer smart sensors that can detect water leaks in real time, automate waste sorting that improves the efficiency of recycling, and run smart grids that help to predict and manage energy demand. Policy-makers should work with technology providers by adjusting their procurement guidelines and involve them early on in the process to integrate such solutions in utilities planning and reform.

TOWARDS A NATURE-POSITIVE INFRASTRUCTURE AND BUILT-ENVIRONMENT SYSTEMIII
61New Nature Economy Report II – The Future Of Nature And Business
Where are we now and where do we need to get to?As cities expand, improving the current state of and access to sanitation services and appropriate waste treatment will be critical to achieve the Sustainable Development Goals. This holds true across water, solid waste and electicity services.
Globally, in 2017, 785 million people lacked access to safe drinking water, and over 700 million people practiced open defecation.52 Over 80% of global wastewater is discharged untreated into biodiversity-rich freshwater and coastal areas, with 300 to 400 million tonnes of heavy metals, solvents, toxic sludge and other wastes dumped into the world’s waters each year.53 Municipal water systems are often inefficient, even in developed economies: leakage rates range from 5% in Germany to 25% in the United Kingdom.54
Solid waste generation is also increasing significantly. In 2016, the world’s cities produced over 2 billion tonnes of solid waste; rapid urbanization is expected to drive this up to 3.4 billion tonnes by 2050.55 Waste collection rates currently range widely – while high-income countries collect 96% of their waste, on average, this share drops to below 40% for low-income countries.56 Waste collection, however, is only part of the issue. How waste is managed, treated and disposed of also lags behind what is needed. Only 9%
of plastic ever made, for instance, has been recycled. The vast majority – 79% – is accumulating in landfills or has found its way into the natural environment, chiefly the ocean, as litter, threatening the health of both wildlife and humans.57 On this front, the United States, by recycling only 9% of its plastic trash, ranks behind both Europe (30%) and China (25%).58
An estimated 1.1 billion people have no access to electricity, and more than 2 billion still rely on wood fuel for cooking and heating.59 Providing universal access to modern energy by 2030 could require annual investments of over $40 billion.60 The International Finance Corporation (IFC) estimates that, globally, poor people spent around $37 billion in 2012 on low-quality energy solutions such as kerosene lamps, candles and wood fuel.61 Through innovative financing models,62 this spending could be reduced and redirected towards clean energy solutions, unlocking business opportunities in household devices such as solar lanterns and improved cookstoves; community-level solar, wind and biofuel installation; and grid-based electrification in unserved urban areas. These opportunities would provide not only substantial economic development benefits, particularly for women and the poor, but also important benefits for nature in reduced carbon emmissions and deforestation.63

62New Nature Economy Report II – The Future Of Nature And Business
TOWARDS A NATURE-POSITIVE INFRASTRUCTURE AND BUILT-ENVIRONMENT SYSTEMIII
What is it?Using nature as infrastructure involves incorporating existing or restored natural ecosystems64 – such as floodplains, wetlands and forests – into built-up area planning to provide benefits such as protection from extreme weather events, flood control and water filtration.65 This approach includes both the restoration and preservation of natural ecosystems – such as coastal reefs, floodplains, wetlands and forests – as well as the deployment of green-blue-grey infrastructure, which combines natural ecosystems with the selective use of conventional human-made engineering approaches.66
The regulating functions of natural ecosystems can reduce the need for human-engineered solutions to increase resilience in the built environment and provide services such as clean air, moderation of extreme climate events, and water purification.67 Reforestation of watersheds in peri-urban areas, for instance, would not only improve water security but could also reduce the risk of extinction for 5,408 species.68 Restoring and protecting these mangroves
brings substantial benefits for nature and the climate: cost-efficient restoration of degraded coastal wetlands, coupled with avoiding further degradation, could, by 2030, mitigate GHG emissions for about 0.5GtCO2e, equivalent to 7% of those of today’s transport sector.69
Supportive regulation and planning, along with sound evidence-based policies, are pivotal for the success of this transition.70 This requires a range of actions from awareness and capacity building among infrastructure planning and commissioning bodies to revising the technical specifications and cost-benefit analyses of infrastructure standards to include natural infrastructure solutions.71 Similar actions should be taken in private sector–led projects.72 Conservation grants and public finance can help overcome financing bottlenecks that slow or stop the development of resilient nature-based solutions in forest or coastal ecosystems, as can joint solutions with the private sector such as blended finance.73
4 Nature as infrastructure
Where are we now and where do we need to get to?Water security is a major issue around the world. Surface and groundwater are repeatedly polluted by agricultural and industrial effluents,74 while land-use changes linked to agriculture, mining and urbanization have degraded nearly half of the world’s urban source watersheds. Together, these issues are costing cities billions of dollars, as they need to fill in the gap left by the destruction of free natural ecosystem services with costly water filtration plants.75 The Nature Conservancy’s analysis of over 4,000 cities globally shows that four out of five could reduce sediment and nutrient pollution in their water supply by restoring and protecting their source watersheds. For an annual cost of $42 billion to $48 billion, this could improve water security for at least 1.4 billion people. Half of this can be achieved at a cost of less than $2 per person.
Projections of climate adaptation costs have increased in recent years, but these costs can be reduced by deploying natural infrastructure. The United Nations Environment Programme (UNEP) estimates that the annual costs of adaptation in developing countries could swell to up to $300 billion by 2030, and up to $500 billion by 2050 – higher than previous projections.76 The World Bank has estimated that up to 80% of these costs could be concentrated in major cities. The loss of coastal habitats, particularly biodiverse and carbon-rich mangrove forests, has significantly increased the risk from floods and hurricanes for around up to 300 million people living within coastal flood zones.77 Globally, over 29 million hectares of degraded coastal wetlands could be restored, potentially in conjunction with natural infrastructure solutions.78 The economic benefits of restoration could be significant – for instance, it is estimated that mangrove forests reduce annual flood damage to global coastal assets by over $82 billion.79
Mangrove forests reduce annual flood damage to global coastal assets by over $82 billion

63New Nature Economy Report II – The Future Of Nature And Business
TOWARDS A NATURE-POSITIVE INFRASTRUCTURE AND BUILT-ENVIRONMENT SYSTEMIII
What is it?Infrastructure connecting urban areas and other built environments – including roads, railroads, pipelines, ports and logistics hubs – need to be built in ways that minimize the disruption of habitats, reduce GHG emissions and enhance biodiversity outcomes. This transition involves a shift away from optimizing only for time and distance considerations to integrating positive biodiversity outcomes alongside affecting a positive impact on climate change. This shift needs to happen in planning, to avoid fragmentation of intact ecosystems; in design, for example, by including wildlife corridors in sensitive areas; and in construction. A particularly useful framework is the “mitigation hierarchy”, which sequentially recommends projects to avoid, minimize, rehabilitate, offset and compensate for impacts on biodiversity in all infrastructure deployment activities to successfully balance conservation needs with development priorities.80
The success of this transition will depend on the availability of sustainable infrastructure finance. The power of private capital could be leveraged by governments and infrastructure development agencies by investing in increasing the “bankability” of nature-positive infrastructure projects and investor familiarity
with them. Instruments range from guarantees by development banks and the use of sustainability criteria in procurement to the use of dedicated financial instruments such as green bonds.81 Investors also have the responsibility to carry out the necessary due diligence to ensure that they finance sustainable projects. For instance, 27 major financial insitutions have come together under the Green Investment Principles for the BRI to put together a helpful set of principles to help investors mainstream enhanced environmental, social and governance (ESG) investments in the BRI through objective evaluation criteria.82
New technologies can help reduce the impact of connecting infrastructure. Examples include railway electrification and vehicles powered by renewables, future fuels such as hydrogen fuel cells, and second-generation biofuels that do not compete with food crops for land. Autonomous vehicles and unmanned delivery drones could reduce demand for human-centric support infrastructure, such as wider roads to account for road safety concerns, fuel stations, rest-stops and so on. Additive manufacturing and 3D printing could reduce the need for transport altogether by moving production closer to end-users.
5 Nature-positive connecting infrastructure
Where are we now and where do we need to get to?Estimated demand for connecting infrastructure projects between 2015 and 2030 amounts to $1.8 trillion per year. This is around 30% of the overall infrastructure demand, although 40% of this investment has yet to be committed.83
Moreover, the extent to which planned investment will be executed in a nature-positive manner is unclear, but it is also unlikely to be high. Anecdotal evidence suggests that environmental impact assessments used in many of China’s BRI road and rail developments are being conducted within a limited timeframe and without accounting for a range of biodiversity impacts.84 Some projects are currently planned in extremely biodiverse areas: terrestrial corridors overlap with the habitats of 265 threatened species, including 81 that are endangered and 39 critically endangered.85 And spending of up to $8 trillion has already been projected through 2049 for projects, including roads, railroads, shipping lanes,
airports and gas pipelines spanning critical or fragile locations from Borneo to the Arctic.86
Sustainable infrastructure finance could address at least two-thirds of infrastructure needs and contribute to closing the infrastructure financing gap, which is concentrated in middle-income countries. Private institutional investors can play an important role. They currently finance between $300 and $400 billion of infrastructure per year, an amount that could reasonably increase by $1–1.5 trillion under the right circumstances. Increasing transparency of project pipelines and bankability of projects, reducing development and transaction costs, introducing innovating co-funding models with the public sector, and increasing transparency on applicable tax policies are the most important policy levers for governments to use to accelerate private institutional capital flows to sustainable infrastructure.87

64New Nature Economy Report II – The Future Of Nature And Business
TOWARDS A NATURE-POSITIVE INFRASTRUCTURE AND BUILT-ENVIRONMENT SYSTEMIII
Business opportunities associated with these five transitions are gaining traction with leading businesses and governments. While some are more mature and present clear investment cases, others demand significant political commitments to unlock their business potential. Yet, overall, they could create more than $3 trillion in additional annual revenues and savings by 2030, together with nearly 117 million new jobs – around 3% of the size of the global labour force.88 It should be noted that these estimates are based on existing commercialized technologies, and it is very likely that additional opportunities will arise as nascent technologies and new players emerge, and as markets develop. This section details some of the largest and potentially transformative business opportunities of those identified (Figure 3.1).
Governments have a critical role to play in raising and steering finance for sustainable urban infrastructure. Regulations in areas including urban master planning, zoning and mandatory building codes will be critical to unlocking the potential of compact cities and nature-positive infrastructure. Innovative financial instruments will be key to supporting other transitions, particularly those related to planet-compatible utilities and transportation infrastructure. These instruments will need to properly account for social and environmental impacts in cost-benefit assessments. Ongoing efforts to address the barriers to implementing these solutions must be scaled. As the global economy realigns, new job opportunities will be created that will require reskilling from labour in other sectors – including
Emerging business opportunities across these five transitions could create over $3 trillion worth of annual value and 117 million jobs by 2030
1. Based on estimated savings or project market sizing in each area. These represent revenue opportunities that are incremental to business-as-usual scenarios. Where available, the range is estimated based on analysis of multiple sources. Rounded to nearest $5 billion.
SOURCE: Business and Sustainable Development Commission (BSDC); The Nature Conservancy (TNC); New Climate Economy (NCE); McKinsey Global Institute (MGI); International Finance Corporation; UN Environment Programme; Market research; Literature review; AlphaBeta analysis
FIGURE 3.1
The five transitions in this system could create over $3 trillion of annual business opportunities and 117 million jobs by 2030
Compa
ct bu
ilt
envir
onmen
t
Total business opportunities by transition in 2030US$ billions1
Total jobs by transition in 2030Millions
Nature-
posit
ive
built
envir
onmen
t
Planet-
compa
tible
urba
n utili
ties
Nature
as
infras
tructu
re
Nature-
posit
ive
conn
ectin
g infr
astru
cture
Total
Total
3 38 42 4 29
665 935 670 160 585 3,015
117

TOWARDS A NATURE-POSITIVE INFRASTRUCTURE AND BUILT-ENVIRONMENT SYSTEMIII
65New Nature Economy Report II – The Future Of Nature And Business
transportation options enabled by Fourth Industrial Revolution technologies such as autonomous trucks.
The COVID-19 crisis will likely have a material impact on these opportunities, although it is still early to predict the magnitude of its effect, and in some cases even its direction. Announced stimulus packages present both risks and opportunities, as public funds might focus on heavily on infrastructure investment. However – in the urgency to boost employment and economic growth – the risk is high that nature will not receive enough attention. Social distancing measures and the experience of the lockdowns might weigh against the densification of cities and communities even after the pandemic subsides. Conversely, shared and multi-purpose infrastructure may be made even more attractive by the combination of the importance of savings in the face of reduced incomes and corporate revenues, and the accelerated adoption of remote and flexible working models.89 New businesses enabled by Fourth Industrial Revolution technologies, including autonomous trucks and drone delivery systems, may receive a boost as these reduce human contact and movement in supply chains. In the same way, opportunities to reduce reliance on the human maintenance of infrastructure, including remote monitoring of utility lines and natural infrastructure, may be encouraged. Where relevant, the impact of the pandemic on specific opportunities is discussed qualitatively in the following text.
Improving energy efficiency in buildings could help create an annual cost savings opportunity of $825 billion per year by 2030, through two main opportunities.90 First, heating and cooling performance can be improved by retrofitting systems in existing buildings and installing more efficient technology in new buildings.91 As an alternative to building-specific systems, district heating and cooling can improve efficiency up to 90% by linking electricity generation and heating.92 Second, more efficient lighting, appliances and electronics can reduce electricity demand. We estimate that more efficient lighting – including switching to LEDs and substituting natural light – could alone save annually over $650 billion in
energy costs by 2030. The McKinsey Global Institute estimates that the internal rate of return from investing in technologies to improve energy efficiency in buildings is greater than 10%.93
Repurposing land freed from parking for new commercial purposes could generate an annual global rental value of $310 billion in 2030. Many downtown areas around the world devote scarce and valuable land area to vehicles, including parking for cars that remain unused for over 95% of the day.94 These parking requirements could be reduced by up to 95% through a combination of encouraging shared mobility (e.g. public transport, car sharing and ride sharing) and rethinking policies such as minimum parking requirements and price controls on parking.95 Repurposing this land would create large commercial opportunities, in addition to reducing total overall land required for cities to be viable. Across 33 cities in Indonesia, for example, over 6,000 hectares of retail, office and on-street parking could be repurposed; this newly available land would have an annual rental value of $7.2 billion.96
Improving solid waste management could create an additional revenue opportunity of $305 billion in 2030 with higher collection and recycling.97 The global waste management market was estimated at $330 billion in 2017; this could more than double by 2030 with appropriate investments,98 primarily in South Asia, East Asia and the Pacific, and Sub-Saharan Africa.99 Growth will be driven by developing policy and regulatory oversight for solid waste collection by local governments and by increasing the efficiency of collection through partnerships with private sector partners.100 Waste collection must also be linked to a shift to more circular models of production that emphasize reduction, reuse and recycling of waste.101
Between 2015 and 2030, from two-thirds to all of the $730 billion annual infrastructure finance gap in the transport sector opportunity can be financed as sustainable transport infrastructure.102 Private institutional investors could potentially address around $290 billion of this annual gap.103

66New Nature Economy Report II – The Future Of Nature And Business
TOWARDS A NATURE-POSITIVE INFRASTRUCTURE AND BUILT-ENVIRONMENT SYSTEMIII
A range of innovations in finance can be used to channel this funding, including seed capital for more risky investments and sustainability-linked debt instruments such as green bonds and loans. We estimate that returns on investment in sustainable infrastructure for the private sector – even accounting for potential additional costs of compliance and procurement– could be between 2.5 and 3.5 times the initial investment.104
Nature-based solutions for water supply could save $140 billion per year in providing clean and safe drinking water for 1.4 billion people by 2030.105
Estimates suggest that cities could significantly save on both upfront capital expenditure and annual operating costs by investing in natural water supply rather than in human-engineered solutions such as treatment and desalination, making a strong case for nature-based solutions (Box 3.4).106 One in six cities could even see positive returns on their total project investment thanks to the savings they would generate in annual treatment costs alone. Innovative financing mechanisms such as water funds can enable water users – including consumers, businesses, utilities and local governments – to invest collectively in these ecosystem services.
The flexible office business model could create up to $140 billion in additional annual market opportunities by 2030, boosted by a double-digit growth that is significantly higher than the expected growth in other types of non-residential buildings,107 in addition to reducing infrastructure needs. Shared offices provide greater flexibility, reduce upfront costs for companies and foster new forms of collaboration and innovation between workers from different industries. Small businesses, for instance, can reduce their operational costs by up to 75% by opting for shared offices.108 Fully tapping into this opportunity entails a cultural shift towards higher tolerance for open and shared spaces. This opportunity could face headwinds in the immediate future, with the COVID-19 pandemic necessitating higher levels of home-based work.
Reducing municipal water leakage could save up to 120 billion cubic metres of water annually by 2030, creating cost savings opportunities worth up to $115 billion.109 Smart sensors are increasingly being deployed to reduce leakage by registering sudden drops in water pressure, which enables leaks to be located and engineers despatched quickly (Box 3.5). Returns on investments in water efficiency can be above 20%, but capital costs are high and some providers lack of awareness about the benefits of reducing leaks. The McKinsey Global Institute estimates that the internal rate of return from investing in such technologies is greater than 10%.110
BOX 3.5
Reducing water leakage in Singapore by using smart sensors
Singapore’s water leakage rate of 5% is significantly lower than that of many other major cities thanks to the WaterWiSe monitoring system.1 As of 2017, over 320 sensors were installed in Singapore’s potable water supply lines, measuring flow rate and water pressure and detecting noise from leaks.2 The system is a collaboration of Singapore’s Public Utilities Board and Visenti, a spinoff of the Singapore-MIT Alliance for Research and Technology (SMART).3
1. Visenti, 2014, WaterWiSe Technology – Case Study in Singapore, http://2014.visenti.com/
wp/wp-content/uploads/2014/04/WaterWiSe_Visenti.pdf
2. Channel News Asia, 2017, “More Sensors to Be Installed in Pipes to Reduce Water Loss”,
https://www.channelnewsasia.com/news/singapore/more-sensors-to-be-installed-in-pipes-to-
reduce-water-loss-9181986
3. Visenti, 2020, “Company Overview”, https://www.visenti.com/overview
BOX 3.4
The Greater Cape Town Water Fund – The business case for natural water supply
In 2018, Cape Town was just 90 days away from turning off its water taps. Two years later, the city has managed to avert one of the worst-ever drought-induced municipal water crises thanks to a host of water-saving initiatives and strict water restrictions. However, the risk of future shortages remains because demand for water continues to climb.1
To avoid future crises, the city has made over $500 million available in public funding. One of the main funding initiatives contributing to the restoration of priority watersheds is the Western Cape Water Supply System (WCWSS), the region’s water supply network, which is severely affected by alien plant invasions that reduce its water supply by around 150 million litres per day.
A coalition of partners led by the Nature Conservancy came together to evaluate the potential impact of restoring WCWSS watersheds on water security and to determine its cost competitiveness vis-à-vis human-engineered infrastructure. Results indicated that a single $25.5 million investment could generate enough water to meet a sixth of the city’s current annual needs within six years, an amount of water that could double within 30 years. Moreover, these water gains are achievable at one-tenth the cost of other options, including desalination, groundwater exploration and water reuse.
1. The Nature Conservancy, 2018, The Greater Cape Town Water Fund: Assessing the Return on Investment for Ecological Infrastructure Restoration – Business Case, https://www.nature.org/content/dam/tnc/nature/en/documents/GCTWF-Business-Case_2018-11-14_Web.pdf

67New Nature Economy Report II – The Future Of Nature And Business
TOWARDS A NATURE-POSITIVE INFRASTRUCTURE AND BUILT-ENVIRONMENT SYSTEMIII
Fourth Industrial Revolution-enabled logistics options include opportunities in areas such as drone logistics, transport and autonomous trucks. These opportunities could be worth up to $75 billion in 2030. Drone delivery is viewed as the future of e-commerce fulfilment, with tests being
BOX 3.6
Monetizing the insurance and carbon storage value of mangroves
Mangrove protection and restoration has an important role in protecting coastal communities and storing carbon. It also can bring significant benefits to the insurance industry by reducing flood damage to coastal properties and assets.1 But, so far, the benefits provided by mangroves are still underrecognized.
A new concept for incorporating mangroves’ risk reduction value into insurance products and creating new revenue streams for mangrove conservation has been developed by Conservation International (CI) and endorsed by the Climate Finance Lab. The concept is based on the creation of a Restoration Insurance Service Company (RISCO), a social enterprise that engages in mangrove conservation and restoration in partnership with local communities. RISCO selects sites where mangroves provide high flood reduction benefits and models that value. Insurance companies will pay an annual fee for these services, while organizations seeking to meet voluntary or regulatory climate mitigation targets will pay for blue carbon credits, generating complementary revenues for RISCO.
CI is launching a first pilot in the Philippines, one of the most vulnerable countries to climate change. It will target 4,000 hectares of mangroves for conservation and restoration, and it could generate more than $10 million in revenue while providing significant climate benefits. Replicating the model in the five countries best positioned to do this would scale the total revenues for mangrove protection by up to 20-fold.
1. Global Innovation Lab for Climate Finance, 2019, “Restoration Insurance Service Company (RISCO)”, https://www.climatefinancelab.org/project/coastal-risk-reduction/
BOX 3.7
Green roofs on bus stops in Utrecht
The Dutch city of Utrecht recently put green roofs on 316 bus stops protected by with sedum flowers and other native plants.1 They attract bees, absorb rainwater, capture pollutants, and help to regulate temperatures. Advertisements encourage people waiting for buses to consider green roofs for their own homes, with government subsidies available. In addition to green roofs, the bus stops also feature bamboo benches and LED lights to reduce material usage and energy consumption, while providing multi-modal transport options using electric vehicles.
1. World Economic Forum, 2019, “These Bus Stops Are a Sanctuary for Bees”, https://www.weforum.org/agenda/2019/07/bees-can-take-refuge-on the-these-bus-stop-green-roofs?utm_source=Facebook%20Videos&utm_medium=Facebook%20Videos&utm_campaign=Facebook%20Video%20Blogs
run by major companies including Amazon, DHL, JD.com, UPS and Walmart;111 drone delivery could grow by over 20% a year through 2030 (versus 5% growth in the overall logistics sector) with appropriate investments.112 Autonomous trucks could reduce fuel usage and inefficiencies such as traffic congestion and accidents in long-distance logistics; this opportunity has attracted so much interest that it could register over 40% annual growth over the coming decade through a combination of R&D, increased adoption and regulatory support.113 Autonomous trucking start-up TuSimple, for example, has trialled cargo delivery using self-driving trucks with UPS, and wider deployments are expected in the coming decade.114 Both technologies have the potential to lower congestion by managing peak demand, hence reducing the need for additional road space to manage increased traffic with infrastructure such as multiple lanes. More research and pilot testing are required to determine returns on investment when deployed at scale, but trials are promising. However, effective deployment at scale must manage potential trade-offs, which include the need for additional logistics hubs and new forms of infrastructure-nature conflict (e.g. drones and low-flying birds), in addition to managing the associated labour force transition.
Innovative technical solutions to building and financing green-grey infrastructure for climate resilience – including coastal protection, rainwater harvesting, river restoration for flood management, constructed and/or restored wetlands and horizontal levees115 – along with implementing digital technologies to better monitor the risks of extreme events. Estimates suggest that investments to conserve and restore coastal wetlands that reduce the risks of flooding could reduce losses that are paid out by the insurance industry by up to $20 billion annually (Box 3.6).116
Urban green roofs form a small segment of nature-positive infrastructure design but are significant for many reasons (Box 3.7). Green roofs can save on energy costs, mitigate flood risk, create habitats for urban wildlife, reduce air pollution and urban heat, and even produce food. Costs are falling because of a combination of innovation and government support: in Singapore, for example, costs fell from around $105 per square metre in 2016 to $70 per square metre in 2018,117 and the city’s 72 hectares of rooftop gardens and green walls are expected to triple by 2030.118 San Francisco now requires new buildings to have green roofs.119 The green roof market is expected to be worth $9 billion in 2020 and could grow at around 12% annually through 2030, creating an incremental annual opportunity of $15 billion.120

68New Nature Economy Report II – The Future Of Nature And Business
TOWARDS A NATURE-POSITIVE INFRASTRUCTURE AND BUILT-ENVIRONMENT SYSTEMIII
1 Chen, Z. et al., 2019, “Mapping Global Urban Areas From 2000 to 2012 Using Time-Series Nighttime Light Data and MODIS Products,” IEEE Journal of Selected Topics in Applied Earth Observations and Remote Sensing, 12 ( 4), 1143–53, April 2019, doi: 10.1109/JSTARS.2019.2900457
2 Analysis of UN World Population Prospects. See UN Department of Economic and Social Affairs [UNDESA], 2018, 2018 Revision of World Urbanization Prospects, https://population.un.org/wup/
3 Global Facility for Disaster Reduction and Recovery [GFDRR] and World Bank, 2015, Investing in Urban Resilience: Protecting and Promoting Development in a Changing World, https://www.gfdrr.org/en/investing-urban-resilience-protecting-and-promoting-development-changing-world
4 McKinsey Center for Business and Environment, 2016, Financing Change: How to Mobilize Private Sector Financing for Sustainable Infrastructure, https://newclimateeconomy.report/workingpapers/wp-content/uploads/sites/5/2016/04/Financing_change_How_to_mobilize_private-sector_financing_for_sustainable-_infrastructure.pdf
5 Gouldson, A. et al., 2018, “The Economic and Social Benefits of Low-Carbon Cities: A Systematic Review of the Evidence”, Coalition for Urban Transitions, London, and Centre for Climate Change Economics and Policy [CCCEP], https://newclimateeconomy.report/workingpapers/workingpaper/the-economic-and-social-benefits-of-low-carbon-cities-a-systematic-review-of-the-evidence/
6 IEA, 2015, Capturing the Multiple Benefits of Energy Efficiency, https://webstore.iea.org/capturing-the-multiple-benefits-of-energy-efficiency
7 Asian Development Bank [ADB], 2012, “Transport in Asia and the Pacific: 12 Things to Know”, ADB News, 14 March 2012, https://www.adb.org/features/12-things-know-2012-transport
8 The Global Commission on the Economy and Climate, 2014, Better Growth Better Climate: The New Climate Economy Report, https://sustainabledevelopment.un.org/content/documents/1595TheNewClimateEconomyReport.pdf
9 Locke, H et al., 2019, “Three Global Conditions for Biodiversity Conservation and Sustainable Use: An Implementation Framework”, National Science Review, 6 (6), 1080–82, https://doi.org/10.1093/nsr/nwz136
10 Analysis of UN World Population Prospects. See UN Department of Economic and Social Affairs [UNDESA], 2018, 2018 Revision of World Urbanization Prospects, https://population.un.org/wup/
11 World Wildlife Fund [WWF] and HSBC, 2017, Greening the Belt and Road Initiative: WWF’s Recommendations for the Finance Sector, https://www.sustainablefinance.hsbc.com/mobilising-finance/greening-the-belt-and-road-initiative
12 World Economic Forum, 2016, Harnessing Public-Private Cooperation to Deliver the New Urban Agenda, White Paper, https://www.weforum.org/whitepapers/harnessing-public-private-cooperation-to-deliver-the-new-urban-agenda
13 “Infill development” is the process of developing vacant or under-used parcels within existing urban areas that are already largely developed. Most communities have significant vacant land within city limits, which, for various reasons, has been passed over in the normal course of urbanization.
14 The Global Commission on the Economy and Climate, 2018, The 2018 Report of the Global Commission on the Economy and Climate: Unlocking the Inclusive Growth Story of the 21st Century, Section II: Cities, https://newclimateeconomy.report/2018/
15 CRCOG, 2016, “5. Transit Oriented Development”, Fact Sheet, Chapter 5 in Best Practices Manual, https://crcog.org/wp-content/uploads/2016/07/Ch05_FactSheet_TOD.pdf
16 International Resource Panel [IRP], 2019, The Weight of Cities: Resource Requirements of Future Urbanization, https://resourcepanel.org/reports/weight-cities
17 Straits Times, 2020, “Self-Sufficient ‘Bubbles’ and Other Strategies to Curb Future Outbreaks in Singapore”, The Straits Times, 24 June 2020, https://www.straitstimes.com/politics/self-sufficient-bubbles-and-other-strategies-to-curb-future-outbreaks
18 The Global Commission on the Economy and Climate, 2018, The 2018 Report of the Global Commission on the Economy and Climate, Section II: Cities, op. cit.
19 Rode, P. et al., 2017, “Integrating National Policies to Deliver Compact, Connected Cities: An Overview of Transport and Housing”, The New Climate Economy Working Paper, Coalition for Urban Transitions, London, https://newclimateeconomy.report/workingpapers/workingpaper/integrating-national-policies-to-deliver-compact-connected-cities-an-overview-of-transport-and-housing/
20 Wolch, J. R. et al., 2014, “Urban Green Space, Public Health, and Environmental Justice: The Challenge of Making Cities ‘Just Green Enough’ “, Landscape and Urban Planning 125 (May 2014), 234–44, https://www.sciencedirect.com/science/article/pii/S0169204614000310
21 The Global Commission on the Economy and Climate, 2018, The 2018 Report of the Global Commission on the Economy and Climate, Section II: Cities, op. cit.
22 Organisation for Economic Co-operation and Development [OECD], 2018, Rethinking Urban Sprawl: Moving Towards Sustainable Cities, https://www.oecd.org/publications/rethinking-urban-sprawl-9789264189881-en.htm
23 Business and Sustainable Development Commission [BSDC], 2017, Valuing the SDG Prize, http://s3.amazonaws.com/aws-bsdc/Valuing-the-SDG-Prize.pdf
Endnotes

69New Nature Economy Report II – The Future Of Nature And Business
TOWARDS A NATURE-POSITIVE INFRASTRUCTURE AND BUILT-ENVIRONMENT SYSTEMIII
24 South China Morning Post, 2019, “Why WeWork’s Collapse Could Be a Blessing in Disguise for China’s Co-Working Sector”, South China Morning Post, 12 November 2019, https://www.scmp.com/comment/opinion/article/3037157/why-weworks-collapse-could-be-blessing-disguise-chinas-co-working
25 Ellen MacArthur Foundation, 2019, Circular Economy in Cities – Urban Buildings System Summary, https://www.ellenmacarthurfoundation.org/assets/downloads/Buildings_All_Mar19.pdf
26 Montgomery, C., 2017, “Tackling the Crisis of Social Disconnection”, Happy City, Walkability Blog, 1 July 2017. https://thehappycity.com/crisis-of-social-disconnection/
27 Ellen MacArthur Foundation, 2015, Growth Within: A Circular Economy Vision for a Competitive Europe, https://www.ellenmacarthurfoundation.org/assets/downloads/publications/EllenMacArthurFoundation_Growth-Within_July15.pdf
28 The Global Commission on the Economy and Climate, 2018, The 2018 Report of the Global Commission on the Economy and Climate, Section II: Cities, op. cit.
29 Ellen MacArthur Foundation,2019, Circular Economy in Cities, op. cit.
30 This is a conservative estimate of potential cost savings, as it does not account for the saved operational and maintenance costs associated with new infrastructure not built. The Global Commission on the Economy and Climate, 2014, Better Growth Better Climate: The New Climate Economy Report, https://sustainabledevelopment.un.org/content/documents/1595TheNewClimateEconomyReport.pdf
31 The Global Commission on the Economy and Climate, 2018, The 2018 Report of the Global Commission on the Economy and Climate: Unlocking the Inclusive Growth Story of the 21st Century, Section III: Food and Land Use, https://newclimateeconomy.report/2018/
32 This transition primarily relates to “green infrastructure”– i.e. sustainable projects designed and built in urban areas requiring a more human-engineered solution rather than using natural solutions (natural infrastructure or green-grey infrastructure). Both green infrastructure and natural infrastructure come under the umbrella of “nature-based solutions”. See The Nature Conservancy [TNC], 2018, Strategies for Operationalizing Nature-Based Solutions in the Private Sector, https://www.nature.org/content/dam/tnc/nature/en/documents/NBSWhitePaper.pdf
33 Parris, K. M. et al., 2018, “The Seven Lamps of Planning for Biodiversity in the City”, Cities, 83 (December 2018), 44–53, https://www.sciencedirect.com/science/article/pii/S0264275117314245
34 Bai, Y. et al., 2018, “Developing China’s Ecological Redline Policy Using Ecosystem Services Assessments for Land Use Planning”, Nature Communications, 9, article 3034, https://www.nature.com/articles/s41467-018-05306-1
35 International Institute for Applied Systems Analysis [IIASA], 2012, Global Energy Assessment, https://iiasa.ac.at/web/home/research/Flagship-Projects/Global-Energy-Assessment/Home-GEA.en.html
36 The Global Commission on the Economy and Climate, 2018, The 2018 Report of the Global Commission on the Economy and Climate, Section II: Cities, op. cit.
37 US. Green Building Council, 2020, “What Is LEED”, https://www.usgbc.org/help/what-leed; American Society of Civil Engineers [ASCE], 2020, “ENVISION”, https://www.asce.org/envision/; and International Living Future Institute, 2020, “Living Building Challenge 4.0 – Basics”, https://living-future.org/lbc/basics4-0/
38 Ellen MacArthur Foundation, 2019, Circular Economy in Cities, op. cit.
39 For instance, the Eco-Link@BKE in Singapore has helped raise population levels of a number of species, including the critically endangered Sunda pangolin. See Mongabay, 2017, “How Effective Are Wildlife Corridors Like Singapore’s Eco-Link?” Mongabay Series, 26 July 2017, https://news.mongabay.com/2017/07/how-effective-are-wildlife-corridors-like-singapores-eco-link/
40 World Economic Forum, 2019, “The United Nations Wants to Grow Urban Forests in 30 Countries”, https://www.weforum.org/agenda/2019/09/un-plans-vast-urban-forests-fight-climate-change/
41 IBPES identifies 18 categories for nature’s contribution to people (NCP), including three “non-material NCPa” – learning and inspiration, physical and psychological experiences, and supporting identities. See Intergovernmental Panel on Biodiversity and Ecosystem Services [IPBES], 2019, Global Assessment Report on Biodiversity and Ecosystem Services of the Intergovernmental Science-Policy Platform on Biodiversity and Ecosystem Services (Chapter 1), https://ipbes.net/global-assessment
42 Stockholm Resilience Centre, 2012, “The Biodiverse City”, https://www.stockholmresilience.org/research/research-news/2012-06-08-the-biodiverse-city.html
43 Ellen MacArthur Foundation, 2019, Circular Economy in Cities, op. cit.
44 Ellen MacArthur Foundation, 2019, Circular Economy in Cities, op. cit.
45 LBC4.0 is one such building design code. It is an infrastructure programme created by the International Living Future Institute that promotes a voluntary building standards code. The code is composed of 20 imperatives (grouped into seven “petals”) to create nature-positive infrastructure. It can be applied to new buildings, existing buildings, interiors, and landscape and surrounding infrastructure. For more information, see International Living Future Institute, 2020, “Living Building Challenge 4.0 – Basics”, op. cit.
46 European Commission, 2019, “Zero-Energy Buildings: Does the Definition Influence their Design and Implementation?”, Build Up: The European Portal for Energy Efficiency in Buildings, https://www.buildup.eu/en/news/overview-zero-energy-buildings-does-definition-influence-their-design-and-implementation
47 World Health Organization [WHO] and UNICEF, 2017, Progress on Drinking Water, Sanitation and Hygiene: 2017 Update and SDB Baselines, https://apps.who.int/iris/bitstream/handle/10665/258617/9789241512893-eng.pdf;jsessionid=16A035A9BAAD3EFB6F3A7C456637CB83?sequence=1 https://apps.who.int/iris/bitstream/handle/10665/258617/9789241512893-eng.pdf;jsessionid=16A035A9BAAD3EFB6F3A7C456637CB83?sequence=1

70New Nature Economy Report II – The Future Of Nature And Business
TOWARDS A NATURE-POSITIVE INFRASTRUCTURE AND BUILT-ENVIRONMENT SYSTEMIII
48 Aligns with SDG Goal 6: “Ensure availability and sustainable management of water and sanitation for all”. See more at https://sustainabledevelopment.un.org/sdg6#targets
49 Aligns with SDG Goal 12: “Ensure sustainable consumption and production patterns”, Target 12.4 (achieving life cycle management of chemicals and wastes) and Target 12.5 (substantially reducing waste generation through prevention, reduction, recycling, and reuse). See more at https://sustainabledevelopment.un.org/sdg12#targets
50 World Bank, 2019, “What a Waste 2.0 – A Global Snapshot of Solid Waste Management to 2050”, https://datatopics.worldbank.org/what-a-waste/trends_in_solid_waste_management.html
51 Aligns with SDG Goal 7: “Ensure access to affordable, reliable, sustainable and modern energy for all”. See more at https://sustainabledevelopment.un.org/sdg7#targets
52 UN Sustainable Development Goals Knowledge Platform, 2020, “Sustainable Development Goal 6: Progress and Info (2019)”, https://sustainabledevelopment.un.org/sdg6
53 IPBES, 2019, Global Assessment Report on Biodiversity and Ecosystem Services of the Intergovernmental Science-Policy Platform on Biodiversity and Ecosystem Services, https://www.ipbes.net/global-assessment-report-biodiversity-ecosystem-services
54 BSDC, 2017, Valuing the SDG Prize, op. cit.
55 World Bank, 2019, “Solid Waste Management”, https://www.worldbank.org/en/topic/urbandevelopment/brief/solid-waste-management
56 World Bank, 2019, “What a Waste 2.0”, op. cit.
57 Geyer, R. et al., 2017, “Production, Use, and Fate of All Plastics Ever Made”, Science Advances, 3 (7), e1700782, DOI: 10.1126/sciadv.1700782
58 Idem.
59 International Renewable Energy Agency [IRENA], 2018, Global Energy Transformation: A Roadmap to 2050, https://www.irena.org/-/media/Files/IRENA/Agency/Publication/2018/Apr/IRENA_Report_GET_2018.pdf; and UN Department of Economic and Social Affairs [UNDESA], 2017, “More Sustainably Managed Forests Would Help Meet Energy Needs”, https://www.un.org/development/desa/en/news/nocat-uncategorized/forest-day-2017.html
60 International Institute for Applied Systems Analysis [IIASA], United Nations Industrial Development Organization [UNIDO] and Global Environment Facility [GEF], 2012, Access to Modern Energy: Assessment and Outlook for Developing and Emerging Regions, http://pure.iiasa.ac.at/id/eprint/10145/
61 International Finance Corporation [IFC], 2012, From Gap to Opportunity: Business Models for Scaling Up Energy Access, https://www.ifc.org/wps/wcm/connect/21ba1015-76b7-4daf-9385-3667701bb0cb/EnergyAccessReport.pdf?MOD=AJPERES&CVID=jt.Impw
62 Philips, J., 2018. “Seven Takeaways from the Energy Access Project Launch”, Duke University, https://nicholasinstitute.duke.edu/seven-takeaways-energy-access-project-launch
63 Griscom, B. et al., 2017, Natural Climate Solutions – Supporting Information Appendix, Proceedings of the National Academy of Sciences of the USA, https://www.pnas.org/content/114/44/11645
64 This transition primarily relates to “natural infrastructure”– i.e. projects designed to include existing or restored natural landscapes (with selected human-engineered solutions) as opposed to those that predominantly deploy human-engineered solutions (green infrastructure). Both green infrastructure and natural infrastructure come under the umbrella of “nature-based solutions”. See The Nature Conservancy [TNC], 2018, Strategies for Operationalizing Nature-Based Solutions, op. cit.
65 Natural climate solutions pathways have been discussed in Chapter 2 – Towards a nature-positive food, land and ocean use system under the transition ecosystem restoration and avoided land and ocean use expansion. These include aspects of forest and peatland restoration, and avoided forest, grassland and peatland conversion. A range of these opportunities are relevant for natural infrastructure; however, to avoid double-counting business benefits, these have been excluded from the discussion in this system. Coastal wetland restoration and avoided conversion, however, have been evaluated under this system. See Griscom et al./TNC, 2017, Natural Climate Solutions, op. cit.
66 Conservation International, 2019, “Building the Next Generation of Resilient Natural Infrastructure – Green-Gray Infrastructure”, https://static1.squarespace.com/static/5cc1fdca8d97406c0ed4880a/t/5dfa9b56f486e62e77a8e6ed/1576704857925/GGI-1Pager_190924.pdf
67 IBPES identifies 18 categories for nature’s contribution to people (NCP), including 10 “regulating NCP”. See IPBES, 2019, Global Assessment Report on Biodiversity and Ecosystem Services (Chapter 1), https://ipbes.net/global-assessment
68 Abell, R. et al./TNC, 2017, Beyond the Source: The Environmental, Economic and Community Benefits of Source Water Protection, Arlington, VA: The Nature Conservancy, https://www.nature.org/en-us/what-we-do/our-insights/perspectives/a-natural-solution-to-water-security/
69 Griscom et al., op. cit. The transport sector globally emits 7.0 GtCO2e of emissions annually. See Intergovernmental Panel on Climate Change [IPCC], 2018, “Transport”, in Climate Change 2014: Mitigation of Climate Change. Contribution of Working Group III to the Fifth Assessment Report of the Intergovernmental Panel on Climate Change, Cambridge, UK and New York: Cambridge University Press, https://www.ipcc.ch/site/assets/uploads/2018/02/ipcc_wg3_ar5_chapter8.pdf
70 Lee, S. Y. et al., 2019. “Better Restoration Policies Are Needed to Conserve Mangrove Ecosystems”, Nature Ecology & Evolution, 3, 870–72, https://doi.org/10.1038/s41559-019-0861-y
71 See e.g. European Commission, 2016, Supporting the Implementation of Green Infrastructure: Final Report, https://ec.europa.eu/environment/nature/ecosystems/docs/green_infrastructures/GI%20Final%20Report.pdf

71New Nature Economy Report II – The Future Of Nature And Business
TOWARDS A NATURE-POSITIVE INFRASTRUCTURE AND BUILT-ENVIRONMENT SYSTEMIII
72 Hawkins, N. C. and G. Prickett, 2014, “The Case for Green Infrastructure”, in Turbulence. A Corporate Perspective on Collaborating for Resilience, edited by R. Kuperes, pp. 87–100, Amsterdam University Press.
73 International Union for Conservation of Nature [IUCN], 2020, Blue Infrastructure Finance: A New Approach Integrating Nature-Based Solutions for Coastal Resilience, Gland, Switzerland: IUCN, https://bluenaturalcapital.org/wp2018/wp-content/uploads/2020/03/BIF-Towards-sustainable-blue-infrastructure-finance.pdf
74 Tremolet, S. et al., 2019, Investing in Nature for European Water Security. The Nature Conservancy, Ecological Institute, and ICLEI, https://www.ecologic.eu/17059
75 Abell, R. et al./TNC, 2017, Beyond the Source, op. cit.
76 United Nations Environment Programme [UNEP], 2018, The Adaptation Gap Report, https://wedocs.unep.org/bitstream/handle/20.500.11822/27117/AGR_2018_Summary.pdf?sequence=1&isAllowed=y
77 The Global Commission on the Economy and Climate, 2018, The 2018 Report of the Global Commission on the Economy and Climate, Section II: Cities, op cit.; and Sanderman, J. et al., 2018, “A Global Map of Mangrove Forest Soil Carbon at 30m Spatial Resolution”, Environmental Research Letters, 13 (5), https://iopscience.iop.org/article/10.1088/1748-9326/aabe1c/meta
78 Griscom et al./ TNC, 2017, Natural Climate Solutions, op. cit.
79 Beck, M. W. et al., 2018, The Global Value of Mangroves for Risk Reduction: Summary Report, The Nature Conservancy, Berlin, https://www.conservationgateway.org/ConservationPractices/Marine/crr/library/Documents/Global MangrovesRiskReductionSummaryReport10.7291/V9930RBC.pdf
80 Arlidge, W. N. S. et al., 2018, “A Global Mitigation Hierarchy for Nature Conservation”, BioScience, 68 (5), https://www.cbd.int/doc/strategic-plan/Post2020/postsbi/biodiversify2.pdf
81 McKinsey Center for Business and Environment, 2016, Financing Change, op. cit.
82 Green Belt and Road Initiative Center, 2019, “BRI Cooperation: Mainstreaming ESG investments”, https://green-bri.org/bri-cooperation-mainstreaming-esg-investments
83 McKinsey Center for Business and Environment, 2016, Financing Change, op. cit.
84 WWF and HSBC, 2017, Greening the Belt and Road Initiative, op. cit.
85 WWF and HSBC, 2017, Greening the Belt and Road Initiative, op. cit.
86 WWF and HSBC, 2017, Greening the Belt and Road Initiative, op. cit.
87 The McKinsey Center for Business and Environment assumes that all infrastructure demand could be considered for sustainable infrastructure finance. The Global Commission on the Economy and Climate, on the other hand, estimates that this demand is between two-thirds and three-quarters of all infrastructure demand through 2030. The Global Commission on the Economy and Climate, 2018, The 2018 Report of the Global Commission on the Economy and Climate, Section II: Cities, op. cit.
88 ILOSTAT, 2020, “Labour force by sex and age – ILO modelled estimates, July 2019 (thousands) Annual”, https://www.ilo.org/shinyapps/bulkexplorer57/?lang=en&segment=indicator&id=EAP_2EAP_SEX_AGE_NB_A
89 International Resources Panel [IRP], 2020, Building Resilient Societies after the COVID-19 Pandemic: Key Messages from the International Resources Panel, https://www.resourcepanel.org/sites/default/files/documents/document/media/building_resilient_societies_after_the_covid-19_pandemic_-_key_messages_from_the_irp_-_12_may_2020.pdf
90 McKinsey Global Institute, 2011, Resource Revolution: Meeting the World’s Energy, Materials, Food and Water Needs, November 2011, https://www.mckinsey.com/business-functions/sustainability/our-insights/resource-revolution
91 See UNEP, 2015, District Energy in Cities: Unlocking the Potential of Energy Efficiency and Renewable Energy, http://wedocs.unep.org/handle/20.500.11822/9317
92 District energy enables the use of low-grade waste heat from electricity generation or free cooling sources such as seawater. Investments in district energy may be more economical than further retrofits where buildings are already relatively efficient. District energy has not been separately sized as it is difficult to accurately estimate how it would substitute for building-level investments in energy efficiency. However, its potential contribution is significant.
93 McKinsey Global Institute, 2011, Resource Revolution, op. cit.
94 Heck S. and M. Rogers, 2014, Resource Revolution: How to Capture the Biggest Business Opportunity in a Century. Full report by the McKinsey Global Institute, https://www.mckinsey.com/~/media/McKinsey/Business%20Functions/Sustainability/Our%20Insights/Resource%20revolution/MGI_Resource_revolution_full_report.ashx
95 International Transport Forum, 2016, Shared Mobility: Innovation for Liveable Cities, OECD, https://www.itf-oecd.org/sites/default/files/docs/shared-mobility-liveable-cities.pdf
96 AlphaBeta, 2017, Rethinking Urban Mobility in Indonesia: The Role of Shared Mobility Services, https://www.alphabeta.com/wp-content/uploads/2018/08/fa-uberreport-indonesia_english.pdf
97 “Waste management” in this instance is the safe and efficient collection, transportation, and disposal or recycling of garbage and other solid waste products. It does not include the opportunity arising from the reuse of recovered materials.

72New Nature Economy Report II – The Future Of Nature And Business
TOWARDS A NATURE-POSITIVE INFRASTRUCTURE AND BUILT-ENVIRONMENT SYSTEMIII
98 Allied Market Research, 2019, Waste Management Market by Waste Type (Municipal Waste, Industrial Waste, and Hazardous Waste) and Service (Collection and Disposal): Global Opportunity Analysis and Industry Forecast, 2018–2025, https://www.alliedmarketresearch.com/waste-management-market
99 World Bank, 2019, “What a Waste 2.0”, op. cit.
100 World Bank, 2019, “What a Waste 2.0”, op. cit.
101 Circular models are discussed in further detail in Chapter 4.
102 McKinsey Center for Business and Environment, 2016, Financing Change, op. cit.
103 This assessment assumes that private investors could proportionately plug the transport gap at the same share of the overall infrastructure finance gap.
104 Global proxies are calculated using inputs from various sources, including McKinsey Center for Business and Environment, 2016, Financing Change, op. cit.; WWF and HSBC, 2017, Greening the Belt and Road Initiative, op. cit.; and Damodaran, A., 2020, Capital Expenditures by Sector (US), http://people.stern.nyu.edu/adamodar/New_Home_Page/datafile/capex.html
105 Based on estimates of cost savings in natural water supply projects. See the Methodological Note at https://www.alphabeta.com/our-research/methodology-note-new-nature-economy-report-on-the-future-of-nature-and-business/ for more details on sizing.
106 Abell, R. et al./The Nature Conservancy, 2017, Beyond the Source: The Environmental, Economic and Community Benefits of Source Water Protection, Arlington, VA: The Nature Conservancy, https://www.nature.org/en-us/what-we-do/our-insights/perspectives/a-natural-solution-to-water-security/
107 Zion Market Research, 2019, “Global Flexible Office Market Will Reach USD 111.68 Billion by 2027: Zion Market Research”, https://www.globenewswire.com/news-release/2019/09/24/1920019/0/en/Global-Flexible-Office-Market-Will-Reach-USD-111-68-Billion-By-2027-Zion-Market-Research.html
108 Ellen MacArthur Foundation, 2019, Circular Economy in Cities, op. cit.
109 Heck and Rogers, 2014, Resource Revolution, op. cit.
110 McKinsey Global Institute, 2011, Resource Revolution, op. cit.
111 Business Insider Intelligence, 2020, “Why Amazon, UPS and Even Domino’s Is Investing in Drone Delivery Services”, https://www.businessinsider.com/drone-delivery-services?IR=T
112 Markets and Markets, 2018, “Drone Logistics and Transportation Market by Solution (Warehousing, Shipping, Infrastructure, Software), Sector (Commercial, Military), Drone (Freight Drones, Passenger Drones, Ambulance Drones), and Region - Global Forecast to 2027”, https://www.marketsandmarkets.com/Market-Reports/drone-logistic-transportation-market-132496700.html?gclid=Cj0KCQjw6sHzBRCbARIsAF8FMpUCfdsoIH14D2gUWVsBOhGetxkBSJezteQG42XONg6sGMNZA6y4-5saAm1nEALw_wcB
113 Market size source from Allied Market Research, 2018, “Self-Driving Truck Market”, https://www.alliedmarketresearch.com/self-driving-truck-market; CAGR sourced from Markets and Markets, 2018, “Autonomous Truck Market by ADAS Feature (ACC, AEB, BSD, HP, IPA, LKA & TJA), Sensor (Camera, LiDAR, Radar, & Ultrasonic), Level of Automation (L1 to L5), Truck Class (Class 1 to Class 8), Propulsion, and Region - Global Forecast to 2030”, https://www.marketsandmarkets.com/Market-Reports/semi-autonomous-truck-market-224614273.html?gclid=Cj0KCQjwjcfzBRCHARIsAO-1_OqGEaW0JZwxeVRu5QMP_6XytJwkuxvhvd2odd2Dn0GEvsic4EPeuVoaAvaqEALw_wcB
114 The Verge, 2019, “UPS Has Been Quietly Delivering Cargo Using Self-Driving Trucks”, https://www.theverge.com/2019/8/15/20805994/ups-self-driving-trucks-autonomous-delivery-tusimple
115 TNC, 2018, Strategies for Operationalizing Nature-Based Solutions, op. cit; and Conservation International, 2019, “Building the Next Generation of Resilient Natural Infrastructure”, op. cit.
116 Estimates constructed using Hallegatte et al., 2013, which estimated average global flood losses in 2050 to be up to $52 billion, up from $6 billion in 2005. See Hallegatte, S. et al., 2013, “Future Flood Losses in Major Coastal Cities”, Nature Climate Change, 3, 802–06, https://www.nature.com/articles/nclimate1979
117 The Global Commission on the Economy and Climate, 2018, The 2018 Report of the Global Commission on the Economy and Climate, Section II: Cities, op. cit.
118 Ellen MacArthur Foundation, 2019, Circular Economy in Cities, op. cit.
119 Fast Company, 2019, “Green Roofs Can Make Cities Healthier and Happier. Why Aren’t They Everywhere?”. Fast Company, https://www.fastcompany.com/90413645/green-roofs-can-make-cities-healthier-and-happier-why-arent-they-everywhere
120 Grand View Research, 2020, Green Roof Market Size, Share & Trends Analysis Report By Type (Extensive, Intensive), By Application (Residential, Commercial, Industrial), By Region (North America, APAC, MEA), And Segment Forecasts, 2020–2027, https://www.grandviewresearch.com/industry-analysis/green-roof-market

Towards a nature-positive energy and extractives system
CHAPTER IV

74New Nature Economy Report II – The Future Of Nature And Business
Four critical transitions that transform how many resources we need and how we extract them and power our economy are needed to reverse the energy and extractives system’s negative impact on nature.
Curtailing the impact of the energy and extractives systems on the natural world requires a sharp change from its current path. Global resource extraction has tripled, from 27 billion tonnes in 1970
to 92 billion tonnes in 20171 – while 840 million people still lack access to electricity.2 “Material productivity”, defined as GDP relative to material and energy inputs, has stagnated since the turn of the century. The system’s negative externalities – air pollution and carbon emissions – equate to $9 trillion annually, or around 10.5% of global GDP.3 Identified oil, gas, metal and mineral reserves are increasingly difficult to extract.4
Reversing the energy and extractives system’s negative impact involves three main actions: improving our consumption efficiency to reduce the amount of resources we need to extract,

TOWARDS A NATURE-POSITIVE ENERGY AND EXTRACTIVES SYSTEM IV
New Nature Economy Report II – The Future Of Nature And Business 75
Nature-positive extractive activities need the support of sustainable materials supply chains to succeed. A range of conservation initiatives, mineral governance frameworks, new technologies and corporate commitments can help to integrate transparency and traceability into supply chains to help combat the threat of illegal and often environmentally degrading extractive activities. At the same time, the transition must champion the inclusion of currently informal activities that support millions of rural and indigenous livelihoods in sustainable supply chains.
Finally, a nature-positive energy transition away from fossil fuels and towards renewables needs to be managed so that the necessary deep decarbonization of the energy sector does not happen at the expense of nature. This involves managing the design, siting and resource demand of renewable energy projects, capturing the substantial opportunity for protection and restoration of nature implicit in natural climate solutions, and carefully balancing the climate benefits and biodiversity implications of the development of bioenergy.
Only with a radical reset of extraction, production and consumption processes can we decouple natural resource use and environmental impacts from economic progress and human well-being.7 Adopting resource-efficient and nature-positive strategies in the stimulus packages being deployed in response to the COVID-19 crisis can accelerate this shift, as recommended by the International Resource Panel, while contributing substantial cost and resource savings and improving societal resilience.8
improving how we extract those resources to minimize the impact on ecosystems, and shifting to more renewable energy. Four complementary socio-economic transitions can together place the energy and extractives system on a pathway towards sustainable development for nature and people.5
First, rapidly scaling circular and resource-efficient models for materials will reduce the amount of new resources required to satisfy our consumption needs. These models require rethinking production processes across the economy; shifting research and development expenditure towards understanding how to reduce or recapture material waste; and nurturing behavioural changes among businesses and consumers to increase willingness to recycle, refurbish and rent rather than own.
Second, nature-positive metals and mineral extraction is required to reduce the impact of the extraction that is unavoidable in the mineral and metals sectors. This approach includes non-invasive exploration techniques, sustainable management of extractive sites, more-efficient extraction, and plans for extensive remediation of ecosystems and communities once extraction is complete. Applied within a rigorous mitigation hierarchy – avoidance, minimization, rehabilitation, offsetting and compensation – this transition can unlock substantial business opportunities ranging from resource recovery to water efficiencies, while also preventing destruction of critical remote ecosystems such as the deep sea.6

76New Nature Economy Report II – The Future Of Nature And Business
TOWARDS A NATURE-POSITIVE ENERGY AND EXTRACTIVES SYSTEM IV
What are they?Circular and resource-efficient models are based on principles that break free from the current “take-make-waste” models. 9 They design out waste and pollution, keep products and materials in use for as long as possible and regenerate natural systems by returning valuable inputs to natural ecosystems.10 In doing so, these models are designed to generate tangible business and social benefits. They are critical to breaking the link between prosperity, the consumption of finite resources and environmental costs. Switching towards a circular economy, across all sectors, has the potential to almost halve carbon emissions and reduce consumption of primary materials by a third by 2030. 11
Most technical material flows are currently designed for linear manufacturing models. Approximately 80% of environmental impacts are determined at the design stage.12 Circular and efficient models therefore redesign the way products, services and systems are created to consider the full lifecycle assessment of materials from inception to use and disposal.
Circular production models vary widely, depending on the type of material used and the desired product features. Strategies that generate higher-value opportunities reduce the resource requirements of designs and keep products and materials in use for as long as possible.13 Such outcomes can be achieved by designing for repair, refurbishment and remanufacturing, or by creating new business models that easily facilitate sharing and reuse.14 From heavy manufacturing to construction, a host of businesses are already testing and benefiting from these models that generate new profit opportunities
and improve customer interactions. Generally, materials, such as gold, with higher input value can generate the most savings from material recovery. Ultimately, businesses are also exploring novel circular material choices that increase the economics and quality of recycling or allow materials to return to the environment.15
Public policies ranging from taxes and incentives to support for innovation and education can play a strong role in promoting circular models. Over 60 countries now have extended producer responsibility frameworks for packaging materials: by making producers responsible – either physically, financially, or both – for the costs and process of end-of-life treatment of their products, this policy tool can spur a range of circular initiatives and is making the financing of circular models easier.16 Municipal and city governments can encourage participation in circular economy models by investing in accessible and efficient end-of-life product collection programmes and infrastructure, and regulating how products can be disposed of in landfills. 17 Coordinated effort from governments and industries is needed to accelerate R&D, training the workforce on circularity models, and providing consumer education and enhanced awareness about materials recycling that are essential for behavioural shifts.18 International cooperation is necessary to harmonize standards, labels and trade policy in materials use, recovery and disposal, and to establish clear product labelling standards to encourage transparency for consumers. These efforts, when carried out in major trade blocs, can have significant spillover effects.19
1 Circular and resource-efficient models for materials
Where are we now and where do we need to get to?Despite much work, the world is getting less, not more circular. The circularity level of 2020 is estimated at 8.6%, down from 9.1% two years before.20 Rates of circularity vary widely by geography, sector and materials. For instance, only 14% of plastic packaging is collected for recycling, and after losses in the sorting and processing facilities are factored in, only a third of the material value ends up being retained. 21 This compares to global recycling rates of 20%
to 30% for building materials, 58% for paper, and 70% to 90% for iron and steel.22,23 Europe recycles 30% of its plastics, compared to 9% in the United States and 25% in China.24 Collection rates for vehicles at end-of-life exceed 70% in the European Union, but are as low as 15% for electronics and appliances.25 These inefficiencies lead to significant economic losses. Today, up to $120 billion of plastic packaging material value is lost to the economy annually.26

77New Nature Economy Report II – The Future Of Nature And Business
TOWARDS A NATURE-POSITIVE ENERGY AND EXTRACTIVES SYSTEM IV
The move to more circular models requires many more products to be reused, refurbished and redistributed in the future than today, and more components and materials to be remanufactured and ultimately recycled. The overall aim should be to achieve best-in-class circularity levels across materials, sectors and regions. Moving in this direction could lead to significant economic benefits, particularly for the industries that incur most of their costs upstream in the steps involved in extracting materials from the earth and converting them into a commercially usable form.27 For the sectors of medium-lived products, such as mobile phones and washing machines, this could create savings of up to $630 billion annually in the European Union alone.28 Adopting advanced construction technologies as well as reusing and recycling construction and demolition waste could reduce virgin material consumption in China’s cities by 71%, while decreasing the country’s landfill waste volume by 81% and dust pollution from construction by 11% by 2040.29
A circular economy system must be created that is robust to resource price cycles (Box 4.1). For example, the recent oil price collapse could see dramatic falls in the cost of virgin plastics, undermining efforts to boost the recycling of plastics. This will require strong long-term regulatory and financing mechanisms, such as the implementation of extended producer responsibility frameworks for end-of-life treatment and recycling of different materials, to sustainably shift the incentives of the industry towards reuse and refurbishment models and greater use of recycled materials.
BOX 4.1
Platform for Accelerating the Circular Economy – PACE
Closing the circularity gap requires leadership throughout the entire economy, including governments, business and civil society. Initiatives such as Platform for Accelerating the Circular Economy (PACE) aim to foster this scale of leadership.1 Launched in 2017, PACE convened a global leadership meeting committed to advancing circularity along global material value chains – from plastics, electronics, and batteries to cars and fashion/textiles. PACE is focused on delivering large-scale public-private pilot projects, catalysing leadership and investment and generating lessons to be learned.
To date, the platform has already launched 12 projects and commited $25 million in investments. One of the projects, for example, aims to transform Nigeria’s hazardous informal recycling sector into a formally legislated system that protects the environment while creating safe employment, through an innovative funding model that includes a small fee on the sale of electronics.2 So far, progress on circularity has been slow, but momentum has been picking up. Efforts range from strategies in multinational corporations to start-up companies disrupting incumbents and government policies in places such as China, EU, Italy and Sweden. PACE aims to provide a platform for these players to radically accelerate this momentum.
1. More information about PACE is available at https://pacecircular.org/about
2. World Economic Forum, 2019, Turning the Tide on E-Waste in Nigeria Protects the Environment and Creates Safer Jobs, www.weforum.org/our-impact/turning-the-tide-on-e-waste-in-nigeria
REUTERS/ARND WIEGMANN

78New Nature Economy Report II – The Future Of Nature And Business
TOWARDS A NATURE-POSITIVE ENERGY AND EXTRACTIVES SYSTEM IV
What is it?Nature-positive extractive processes have the potential to minimize destructive land management practices and enhance conservation efforts to offset biodiversity impacts that cannot be either avoided or mitigated. Achieving the transition to fully nature-positive extraction requires action not only from leading companies and small-scale operators but also from those who are today informal actors.
All activities along the lifecycle of extractive sites require a switch towards nature-positive practices. At the exploration stage, this means favouring non-invasive exploration that can protect critical ecosystems wherever possible. For instance, exploration using digital seismic technology in combination with strategic environmental assessments that incorporate science-based biodiversity metrics have shown strong potential to identify mineral reserves without any excavation.30 Regulations could mandate non-invasive exploration, particularly in critical ecosystems, while also designating and enforcing fully protected areas. With artisanal and small-scale miners (ASMs) having recently taken on a more prominent role in exploration, it will be critical to support them technically and financially in implementing strong environmental safeguards to minimize any potential damage.31
Once extraction sites have been identified, managing the site and surrounding areas efficiently can help minimize the impact from extraction on biodiversity. Appropriate regulatory frameworks should be developed to mandate and monitor environmental standards at extractive sites. A range of extractive techniques that are minimally destructive could be encouraged. Sustainable extraction techniques favour the use of non-harmful, non-chemical processes over highly toxic chemicals such as mercury, nitric acid or lead-based explosives, significantly reducing ecosystem impact both within and beyond the extraction site.32 Increased mechanization and new recovery technologies can also improve extraction efficiency in mineral extraction and processing, reducing water usage and greenhouse gas (GHG) emissions across the value chain of extractive activities.33 New technologies demonstrate the potential of reducing water usage in extractive activities by 75%.34 Ways to reduce water consumption include using Fourth
Industrial Revolution technologies such as 3D visualization and application into mines, reusing and recycling water used in the process, improving flows in tailings disposal, using forests for water retention, and reducing spraying on haul roads to control dust.35 Comprehensive land management practices supported by detailed spatial maps and biodiversity assessments of surrounding areas can minimize ecosystem disruption caused by supporting infrastructure such as roads and power lines. Partnerships between mining companies and relevant public sector agencies to jointly develop supporting infrastructure can substantially improve outcomes.36
Tailings management presents another critical area of concern. Tailings – a common by-product left after the valuable component from an ore has been extracted – are deposited and stored in dams. If tailing dams fail, they can release vast quantities of water and chemical sediment, with a catastrophic impact on downstream communities and the environment.37 The Brumadinho tailing dam disaster in Brazil in 2019, for example, killed nearly 300 people and had a disastrous impact on the environment, resulting in $107 million in collective moral damage penalties for the mining company responsible.38 To avoid such disasters, industry associations such as the Industry Council on Mining and Metals (ICMM) have developed a tailings storage facility governance framework.39 Ensuring widespread adoption of these best practice standards, including by junior mining companies, will be crucial to safeguarding lives and the environment.
Supporting ASMs and formalizing their activities where possible with knowledge, training and finance will be critical to ensuring that sustainable extractive practices are adopted widely.40 Business-as-usual practices have long created numerous health issues, including respiratory illnesses, kidney disfunction and neurological disorders in mining communities.41 Shifting to sustainable extraction and more human-friendly practices could address these health issues.
Once extraction sites have exhausted available reserves, post-extractive sites and communities must be systematically rehabilitated to achieve
2 Nature-positive metals and minerals extraction

79New Nature Economy Report II – The Future Of Nature And Business
TOWARDS A NATURE-POSITIVE ENERGY AND EXTRACTIVES SYSTEM IV
a fully nature-positive extractives lifecycle. Abandoned mines and wells, because of their safety and contamination issues, can threaten human and ecosystem health. These issues also curtail alternative land uses.42 Regulations can mandate rehabilitation in mine design and granting of concessions, demanding that companies develop closure and restoration plans and put adequate funds for restoration in escrow. For instance, Australia requires mines to be returned to “original” or similar conditions.43 A key part of rehabilitation is the inclusion of long-term plans for local economic prosperity, developed through closer engagement with local communities. Disputes among mining companies and local communities and governments are increasing the costs of developing and running mines as well as delaying or suspending projects around the world.44
Where environmental impact is hard to avoid, biodiversity offset activities, either on- or offsite, can play a key role. These strategies could be stimulated by setting a goal of no net loss (NNL), or net gain to biodiversity. By leveraging the UN Convention on Biological Diversity (CBD)’s mitigation hierarchy framework, which sequentially analyses all possible biodiversity losses and gains through steps to avoid, minimize, remediate and offset impacts on nature, industry players can guide their activities towards achieving their biodiversity goals.45 Given the interconnectedness in natural ecosystems, which go far beyond private concessions, successful mitigation will generally require public-private cooperation to integrate biodiversity initiatives beyond the boundaries of a single project. And this mitigation will be more successful where public sector policies are clear and show strong and stable committment to nature-positive outcomes.46
Where are we now and where do we need to get to?Mining utilizes under 1% of global land area, but its negative impact on biodiversity, water availability and quality, and human health may be larger than that of agriculture.47 Extraction affects native ecosystems, climate and human health in varied ways. Of all operational large-scale mines today, 44% are located in biodiversity-rich forests, and more are being developed.48 Their impact on the surrounding environment can stretch up to 50 kilometres away from the site itself. Nickel mining, for instance, has been responsible for up 10% of all deforestation in the Amazon between 2000 and 2015, because land was cleared for hydroelectric dams and service roads needed to access and operate the mines.49 Moreover, the contribution of a mine to economic growth can be disproportionate to its impact on biodiversity. Global resource price volatility may cause marginal mines in remote and cost-inefficient locations to be mothballed early in their lifecycle: the result is unnecessary environmental damage for limited economic value.50
The market penetration of sustainable or natural chemicals (e.g. borax) and non-chemical techniques of extraction (e.g. gravity concentration, magnetic concentration) is expected to remain low.51 Levers to increase the appeal of these products and processes could include regulatory requirements, such as banning the use of cyanide, sulphuric acid and mercury; subsidies to encourage R&D in sustainable mining chemicals; support programmes for ASMs; and commitments on the part of large mining companies to sustainable extraction methods and practices.
Mine restoration can also be significantly improved. In many countries, fewer than 25% of closed mines are properly restored.52 An estimated 50,000 abandoned mines exist in Australia alone.53 Given the large numbers of mines expected to close over the next decade, governments are increasingly concerned about the legacy of extraction and the liability for rehabilitation.
Demand for resources is projected to double by 2060 and is driving the intensification of the search for new mineral resources by global mining companies, and with it inevitable environmental pressures.54 Mineral development is encroaching into remote and often little disturbed locations, from mountain tops to beneath ice sheets.55 Decisions are about to be made on beginning commercial deep-sea mining for minerals such as cobalt, copper, nickel, manganese, lithium and gold. Seabed mining techniques are new and the extent and severity of the potential impacts on deep ocean ecosystems not yet fully understood, making it imperative for more scientific and industry attention now to inform decisions affecting this young industry. 56

80New Nature Economy Report II – The Future Of Nature And Business
TOWARDS A NATURE-POSITIVE ENERGY AND EXTRACTIVES SYSTEM IV
What are they?Sustainable supply chains inherently integrate transparency and traceability. Transparently sourced and traceable materials are key to tackling illegal extraction and curtailing the activities of suppliers that do not adhere to regulations, damage the environment and mistreat workers. Such supply chains require companies procuring materials to set appropriate targets for traceability, systematically track and support upstream activities, engage direct and indirect suppliers, and divulge collected information.57 Companies are under pressure from governments, consumers, non-governmental organizations and other stakeholders to be transparent about their supply chain activities. A failure to meet these demands can result in significant reputational, regulatory and business risks.58
Effective and comprehensive mining and mineral governance regulations that eliminate illegality from
supply chains and develop reliable and widely used certification schemes that promote sustainably extracted materials and metals will be essential to the success of this transition.59 New digital technologies – including RFID tags, blockchain, satellite monitoring and digital passports – can boost transparency in material flows and improve the cost-effectiveness of tracking and tracing materials across complex supply chains.60 In eliminating illegality, ASMs and informal actors who often lack the capacity to adhere to environmental and social regulations should be supported by regulators and more established companies. As companies increase their supply chain disclosure and engage informal suppliers in doing so, they can support smallholders to legalize their activity by helping them with capacity building and access to finance. Legalizing smallholder activity will be a core part of lifting an estimated 500 million people out of poverty by 2030.61
3 Sustainable materials supply chains
Where are we now and where do we need to get to?Illegal mining is the second most lucrative natural resource crime, after illegal timber extraction.62 Across a number of materials and industries, systematic information on the legality of upstream practices in supply chains is still unavailable. However, even with the limited data available, it is evident that meaningful progress on transparency and legality of supply chains has yet to be achieved. For instance, between 2016 and 2019, at least $50 million in illegally mined or refined gold bars were discovered in the supply chains of Swiss gold refineries alone.63
Many mining booms, particularly in rare-earth minerals, occur in biodiversity hotspots (such as New Caledonia or the eastern lowlands of the Democratic Republic of the Congo [DRC]).64 Africa is estimated to have 40% of global gold reserves and 60% of cobalt, including 50% of global cobalt in the DRC alone, and 90% of the world’s platinum.65 Bauxite, iron ore, copper, diamonds, tin and rare-earth materials are critical to the growth forecasts of many developing countries over the next 30 years. However, these resource-rich economies often have weak governance, pervasive corruption, and are at higher risk of conflict – all circumstances that increase the prevalence of illegal or unregulated mining with negative environmental and social impact.66
Against this background, the responsibility of leading companies to manage the institutional ambiguity, stimulate supply chain learning and build suppliers’ capabilities to meet environmental and social best practices becomes even more crucial.67 Currently, 40% of precious metals are extracted by ASMs. Efforts must be made to formalize the sector, possibly by providing loans from national banks and access to large-scale mining (LSM) markets with provisions for involving ASMs in following similar standards and principles.68 Many ASM activities occur at the margins of LSM concessions, facilitating engagement and monitoring.
The mining sector will play a critical role in the transition towards a low-carbon economy, particularly because innovations such as wind turbines, solar panels and batteries require significant mineral and metal inputs. Even with more circular and efficient models of production, significant growth in demand for materials such as aluminium, cobalt and lithium are expected. Responsible supply chain regulation and monitoring will be needed to support a decarbonization pathway that promotes the sustainable extraction of such materials where strategic reserves are found, avoiding the risk of fuelling social conflicts and exacerbating the nature crisis in the countries where strategic reserves are found.69

81New Nature Economy Report II – The Future Of Nature And Business
TOWARDS A NATURE-POSITIVE ENERGY AND EXTRACTIVES SYSTEM IV
What is it?Decarbonization of the economy is necessary and must accelerate. A nature-positive energy transition has the potential to further both global climate and nature goals.70 Given that energy infrastructure has a long lifespan – 35 to 80 years for fossil fuel plants – choices around new energy design and deployment will significantly impact the health of natural ecosystems for decades.71
This is particularly true for technology that uses biological feedstocks as its energy source. Modelling scenarios that limit warming to 1.5°C or 2°C typically rely on both the use of bioenergy and on large amounts of “negative emissions”, including those potentially generated by biomass energy with carbon capture and storage (BECCS).72 However, recent studies have found that if BECCS replaces forest ecosystems with crops, then forest-based mitigation could be more efficient for atmospheric CO2 removal than BECCS.73 This finding calls into question the extent to which BECCS can be deployed at the scale envisioned, although – depending on the feedstocks used and its integration with other land use management strategies – it might still have a role to play as a CO2 removal technology.74 At the
same time, low-energy demand scenarios have been developed that do not require BECCS to be deployed,75 at least for the next two decades, while limiting warming to 1.5 C°.76
On the other hand, nature-based solutions could be more important to decarbonization efforts than has been generally acknowledged in climate models. These solutions could provide up to 37% of cost-effective CO2
mitigation needed through 2030 to have a chance to remain in a 2°C scenario.77 For each energy solution to unleash its potential, full lifecycle assessments that consider broad environmental impacts in current roadmaps towards a low carbon future will therefore be essential to the success of this transition.
Decisions about the siting and design of renewable energy projects will also be vital to support the health of critical ecosystems (Box 4.1). If based on detailed environmental impact assessments, energy projects can stimulate conservation activities. For instance, depending on where offshore wind projects are sited, these can fragment ecosystems by blocking migratory paths for birds and fish. Alternatively, if combined with
4 Nature-positive energy transition
BOX 4.2.
Getting renewable energy projects’ siting right in India
India has set an ambitious target of reaching 175 GW of renewable energy by 2022, that is a little under half its installed capacity. However, renewable energy projects have large land footprints – typically three to 12 times that of coal-powered ones. Getting project siting right is essential. If the singular aim is to maximize energy production, more than 6 million hectares of forest and agricultural land could be disturbed to achieve India’s target.1 But if projects are developed on degraded lands, they could help meet decarbonization targets while avoiding land use conflicts. A study conducted by The Nature Conservancy (TNC) and the Center for Study of Science, Technology and Policy demonstrated that India has more than 10 times the low impact land needed to exceed its renewable energy goals.1
To enable decision-makers to make better choices on renewable energy deployment, TNC-India developed an innovative decision-support tool, SiteRight, which combines GIS maps and data from around 100 different databases.2 The tool identifies sites that have low socio-environmental values and high energy generation potential, hence avoiding the conflicts and delays that can arise from land use disputes. Private developers can use the interactive online map to identify new sites for wind and solar generation plants and validate existing ones. Financial institutions can leverage the tool to screen projects and reduce the risk exposure of their investments. State governments can also use the tool when allocating land parcels through public procurement. This would allow India to meet its sustainable development goals and businesses and investors to manage their risk exposure and costs associated with negatively impacting nature and people.
1. Kiesecker, J., et al. 2019, Renewable Energy and Land Use in India: A Vision to Facilitate Sustainable Development, Sustainability: 12, 281. doi:10.3390/su12010281
2. TNC India website: https://www.tncindia.in/siteright/

82New Nature Economy Report II – The Future Of Nature And Business
TOWARDS A NATURE-POSITIVE ENERGY AND EXTRACTIVES SYSTEM IV
conservation opportunities, such projects could have synergies with the protection of high biodiversity areas. For example, China’s Exclusive Economic Zone has areas of high potential for offshore wind that overlap with global priority areas for biodiversity conservation:78 combining the protection of this ocean area with environmentally friendly offshore wind installations could bring significant biodiversity benefits.
A low carbon future is also likely to spur demand for minerals and metals that are crucial inputs for renewable technologies. 79 These inputs could become green conflict materials that fuel social conflict and inequalities where reserves are found.80 Scaling new business models to manage these risks, including circular models in renewable projects supported by nature-positive extraction and sustainable supply chains, will thus be necessary.
A large potential opportunity from the collection, repair, resale and recycling of critical metals used in renewable energy could be available after 2030, once sufficient materials from the first wave of used materials recovered from older solar plants and wind farms built in the 2000s and early 2010s becomes available. For instance, materials used in solar photovoltaic (PV) cells that could be profitably recovered include silicone, plastic, copper, cobalt and lithium.81 In the short term, substituting rare earth materials with alternatives that are more environmentally sustainable and available may have the most impact. For instance, following the 2010 price peak in neodymium (a critical material in wind turbines and electric veichles), producers found ways to either need less neodymium or substitute it with another material altogether, including by developing and deploying rare-earth-free turbines.82,83
Where are we now and where do we need to get to?Urgent and immediate climate action is needed. To achieve climate targets, the International Energy Agency (IEA) forecasts that wind and solar must provide almost all new electricity generation capacity between now and 2040.84
The development and deployment of these technologies and projects is indispensable for meeting climate targets. But such large-scale deployment could present critical risks to the ecosystems in which projects are sited and those from which crucial materials needed to support the energy transition are extracted. For instance, research shows that dams can have extremely adverse impacts on river basins and ecosystems – only a third of the world’s rivers have maintained their natural flow.85 Yet, over 3,500 hydropower dams are currently being planned or built around the world, a number that could double by 2030.86 At the same time, a recent study estimates that global production of some metals will need to increase 12-fold by 2050 if all signatories of the Paris Agreement live up to their commitments for decarbonizing their economies.87 Research from the International Resource Panel shows that end-of-life recycling for specialty and rare-earth materials widely used in renewables is extremely low – below 1% in many cases – and needs to be scaled through circular product design and suitable legal frameworks.88
A successful energy transition therefore needs to include an explicit focus on its impact on nature, a focus that is made particularly urgent by the fiscal policy responses to the COVID-19 pandemic. There is a strong economic and employment case,
underpinned by the benefits of renewable energy over the fossil alternative,89 for stimulus packages to prioritize renewable energy investments and accelerate the energy transition. 90,91 At the time of writing, editorials in economic newspapers are calling for seizing the moment to promote a green economic recovery.92 Ensuring this is done with nature at the centre of the equation will be extremely important to capture all of its potential benefits.93
Business opportunities associated with these four transitions could create over $3.5 trillion in additional revenues and cost savings by 2030, together with over 87 million new jobs – 2.3% of the size of the forecasted global labour force.94 As with those business opportunties detailed in the previous chapters, some of these opportunities are more mature and present clear investment cases, while others demand significant political commitments to unlock the business potential. These estimates are based on existing commercialized technologies, and it is highly likely that additional opportunities will arise as nascent technologies and new players emerge and markets develop. This section details nine of the largest and potentially transformative business opportunities of those identified for the energy and extractives system.95

1. Based on estimated savings or project market sizing in each area. These represent revenue opportunities that are incremental to business-as-usual scenarios. Where available, the range is estimated based on analysis of multiple sources. Rounded to nearest $5 billion.
SOURCE: Business and Sustainable Development Commission (BSDC); The Nature Conservancy (TNC); New Climate Economy (NCE); McKinsey Global Institute (MGI); International Finance Corporation; UN Environment Programme; Market research; Literature review; AlphaBeta analysis
FIGURE 4.1
The four transitions in this system could create over $3.5 trillion of annual business opportunities 87 million jobs by 2030
Circula
r and
resou
rce ef
ficien
t
models
Total business opportunities by transition in 2030$ billions1
Total jobs by transition in 2030Millions
Nature-
posit
ive m
etals
& mine
rals e
xtrac
tion
Sustai
nable
meta
ls &
materia
ls su
pply
chain
s
Nature-
posit
ive
energ
y tran
sition
Total
Total
3,5302,310 520 30 670
8730 28 3 26
83New Nature Economy Report II – The Future Of Nature And Business
TOWARDS A NATURE-POSITIVE ENERGY AND EXTRACTIVES SYSTEM IV
Supportive regulations – such as those that encourage and support environmentally sound extractives project design, systematic rehabilitation of mining sites, and waste collection and reuse – will be significant in unlocking this potential at scale. Coordinated action to advance research and investment in the widespread commercialization of emerging technologies will also be needed. Innovations such as additive manufacturing, precision forestry, and blockchain in energy and mining supply chains can enable a nature-positive pathway by supporting both value creation and conservation goals. Ongoing efforts to unleash their potential must be scaled. As the world’s economy reorganizes, emerging new jobs will require the reskilling of the existing workforce. For instance, by some estimates, circular economy business models could create 3.4 million jobs in the European Union alone between 2014 and 2030.96
The pandemic is expected to impact these opportunities, though it is too early to know how much, or even in what direction. Goods and services in key sectors for circularity, such as automotive and electronics, will likely be negatively affected at least in the short term because of lower consumer incomes, which could affect sales through 2030. Conversely, given that recycled materials at scale can be more cost-effective than acquiring new materials, businesses in these sectors may pursue even more aggressively the cost savings to be had from circularity. Economic stimulus could also further encourage or even mandate improved materials efficiency and the nature-positive deployment of new energy projects. Where relevant, the impact on specific opportunities that follow has been discussed qualitatively.
Emerging business opportunities across these four transitions could create over $3.5 trillion worth of annual value and almost 87 million jobs by 2030

84New Nature Economy Report II – The Future Of Nature And Business
TOWARDS A NATURE-POSITIVE ENERGY AND EXTRACTIVES SYSTEM IV
Circular models in the automotive sector provide the largest business opportunity identified in this system (Box 4.3), potentially creating a cost savings of up to $870 billion per year by 2030. Opportunities exist to recover manufacturing costs in materials
BOX 4.3
Aluminium recycling
British multinational automaker Jaguar Land Rover Limited (JLR) first began its efforts at a closed-loop aluminium production model in 2013.1 Between 2013 and 2019, the company collected and reused around 300,000 tonnes of aluminium, incorporating repurposed parts into every model that the firm produced. This means that, of the 180,000 tonnes of aluminium used annually by JLR in its automobile production, approximately 30% can be recovered and recycled. Such initiatives have resulted in an overall drop of 46% of carbon emissions in JLR’s global vehicle production operations and the reduced the demand for virgin aluminium in JLR’s operations. The REALITY initiative is the next phase in JLR’s aluminium recycling programme, designed for the retirement of large fleets of vehicles. It centres around technology to harvest aluminium from old vehicles for use in alloys for new vehicles, significantly increasing the productivity of the recycling process.
1. Jaguar Land Rover, 2019, “From I-Pace to I-Pace: Jaguar Land Rover Gives Aluminium a Second Life”, https://www.jaguarlandrover.com/news/2019/04/i-pace-i-pace-jaguar-land-rover-gives-aluminium-second-life
BOX 4.4
Solar energy to restore degraded land in China
Elion, the first Chinese company to commit to 100% renewables in its operations by 2030, started as a salt chemical engineering business in the Kubuqi Desert of Inner Mongolia, China.1, 2 Frequent sandstorms caused serious damage to its production activities and increased its costs in its early years of operation. To combat desertification and sandstorms, Elion developed a comprehensive ecological restoration-based economic system that was enabled through an effective public-private partnership. Elion used its returns in the salt chemical industry to provide the initial capital for its ecosystem restoration activities, which eventually provided returns on the initial investment. The company took advantage of the abundant sunshine in the region to build one of China’s largest photovoltaic power stations with high-rise solar panels, maintained by remote real-time monitoring. It then supplemented this eco-industrial system with animal husbandry, ecotourism and medicinal plants by planting medicinal sand plants that restore the soil while providing Elion with an additional revenue stream.
The technology package has successfully restored nearly 650,000 hectares of desert land, thanks to the construction of sand-protecting barriers, afforestation and the closure of land for natural regeneration. This has allowed the desert to form an ecological microclimate, while obtaining good economic and social value.
1. Ethical Corp, 2018, “Chinese Companies Slow to Join RE 100”, http://www.ethicalcorp.com/chinese-companies-slow-join-re-100
2. UNEP [United Nations Environment Programme], 2017, Eco-restoration and Wealth Creation – Elion’s Kubuqi Business Model, http://wedocs.unep.org/bitstream/handle/20.500.11822/21773/Kubuqi_Ecorestoration_BusinessModel.pdf
including plastics, metals and alloys. The opportunity in the European Union alone, with the world’s highest vehicle collection rates, could reach $235 billion per year by 2030. A small number of components, such as transmission systems, are responsible for how long most vehicles can last. Closed-loop recycling – in which manufacturers can refurbish and reuse some parts, such as transmissions – retains more value and uses less energy than recycling parts into base materials. This closed-loop approach requires vehicles to be designed with remanufacturing in mind; it also requires capital investment in centralized refurbishment plants and stronger car sharing models and markets for refurbished vehicles – for example, through warranties. Some estimates suggest that vehicle models that include circular loops could be three times more profitable than traditional vehicles, providing the global automotive industry, which is undergoing severe disruptions, with a major profit pool.97
Expansion of renewables in generating power could create an annual opportunity worth up to $650 billion by 2030.98 Increasing the share of renewables in the power sector is a significant business opportunity that could generate internal rates of return for private sector participants of over 10%, according to the McKinsey Global Institute.99 The IEA forecasts that renewable power capacity could expand by 50% by 2024, led by solar PV100 – this is equivalent to the total installed power capacity of the United States today. Solar PV accounts for almost 60% of the expected growth (Box 4.4), while onshore wind represents 25%. Commercialized renewables had already become cost-competitive with traditional hydrocarbon sources before the COVID-19 price shock: solar energy without subsidies recently matched fossil fuel costs in over 30 countries and were projected to be cheaper than coal in China and India by 2021.101 Although

85New Nature Economy Report II – The Future Of Nature And Business
TOWARDS A NATURE-POSITIVE ENERGY AND EXTRACTIVES SYSTEM IV
the pandemic is expected to reduce global solar and energy storage installations in 2020 by 20% compared to past projections,102 a strong case is being made for stimulus packages to prioritize renewable energy investments because they provide returns of up to eight times the original investment, and renewable energy has the potential to generate millions of new jobs.103
Improving resource recovery in extraction can save up to $225 billion per year by 2030. Mining and oil and gas operations often do not fully utilize all the resources in one site before moving on to new areas, increasing damage to biodiversity. New technologies and more mechanization could enhance material recovery rates by up to 50%.104 There are also opportunities to extract value from waste. For example, high-value metals can be recovered from waste streams generated by extracting and processing alumina, nickel, gold, copper and zinc.105 The internal rate of return from investing in such technologies could be greater than 10%.106 In the long term, improving resource
recovery could save up to $215 billion just in coal, oil and gas, copper and iron ore – though short-term costs may increase until economies of scale are achieved. Appropriate regulations will help unlock this opportunity, particularly in developing countries. One positive example is the Kolwezi tailings project in the DRC, which aims to recover copper from the tailings of processed ore.
Increasing steel efficiency in end-use applications could generate annual cost savings of up to $210 billion by 2030 in reduced material usage and energy demand. Iron-steel production chains have the highest GHG emissions among metals, representing around a quarter of global industrial energy demand.107 Steel’s per-unit energy consumption is around 40% lower than it was in 1980, but further gains will require a focus on reducing usage – through reuse, recycling and using high-strength steel to make more lightweight products.108 Higher-strength steel can reduce the amount of steel needed in construction by up to 30%. By 2030, the cost savings opportunity also involves design optimization in the construction, machinery and automobile sectors, which together constitute 80% of global demand.109 Awareness of this opportunity needs to be increased, particularly in emerging markets.
Shared infrastructure in extractive operations could save companies up to $130 billion per year by 2030 – almost a tenth of infrastructure spending needed in resource-abundant countries in the 2020s.110 Sharing infrastructure such as power, railways and ports to support extractive sites in remote locations can significantly reduce ecosystem damage as well as lower initial investment and operational costs associated with the large infrastructure assets related to extraction. The public sector and leading businesses could foster these partnerships, which could extend beyond mining companies to include forestry and agriculture players.
Circular models for plastic packaging have the potential to create annual costs savings worth $70 billion by 2030. Over 95% of the economic value of plastic packaging is currently lost: just 14% of used plastic packaging is collected for recycling, which yields only 30% of its value. The plastic packaging economy is expected to double in value by 2030.111 Levers such as improving packaging design and harmonizing collection and sorting systems combined with high-quality recycling technology could potentially make plastic recycling cost-competitive compared to alternatives such as landfill, incineration and energy recovery.112 Recovering the amount currently lost to landfills and pollution will require a major change in consumer behaviour. Public policy and business initiatives will
BOX 4.5
Mine rehabilitation in Australia
Mining has long underpinned Australia’s economic growth. The scale of its mining projects often requires similarly extensive rehabilitation schemes to restore the environment that has been damaged by extractive activities. To ensure systematic mine rehabilitation, Australia’s regulations require mining companies to integrate rehabilitation plans into mine development in order to obtain mining permits.
Alcoa is one of Australia’s leading mining companies; its mines supplied almost half of the bauxite produced in Australia in 2011. This scale of operation has led to considerable deforestation since their mines opened in 1963. To restore the degraded land at their extractive sites, Alcoa follows defined methods to reduce topsoil degradation during their operations (making subsequent restoration easier) and implements a comprehensive reforestation scheme once its mining operations are done.1 The company partners with local nurseries for tree plantings and works closely with scientists for species monitoring. Alcoa’s reforestation programme has yielded positive results – for instance, it has successfully restored 100% of the plant species that were present in the Jarrah Forest before mining in the ecosystem began.
Other mining companies in Australia are also working on similar restoration projects. Given how recent the practice of mine rehabilitation is, there is still a gap in the evidence for the most effective restoration techniques, requiring business to work closely with scientific, conservation and local communities to identify the most suitable solutions for each use case.
1. Mining Technology, 2019, “Rehabilitating Australia’s Mines: Projects Leading the Way”, https://www.mining-technology.com/features/australian-mine-rehabilitation/

86New Nature Economy Report II – The Future Of Nature And Business
TOWARDS A NATURE-POSITIVE ENERGY AND EXTRACTIVES SYSTEM IV
need to cooperate to identify the most effective means to change recycling habits.
Fully rehabilitating mines and oil and gas wells to remove contaminants, and developing post-mining local economies, could create an annual market opportunity worth up to $70 billion by 2030 – 3.5 times the value of the market today (Box 4.5).113 Remediation activities are carried out by specialized businesses in partnership with mine operators. Given that only 20% to 25% of mines are rehabilitated, the
BOX 4.6
Blockchain in cobalt supply chains in the Democratic Republic of the Congo
The Democratic Republic of the Congo (DRC) holds half of the world’s reserves of cobalt – the main mineral component in lithium-ion batteries. But it is also a country that has historically faced civil war, geopolitical tension and the exploitation of mining communities. Committed to supporting human rights and environmental protection while infusing more transparency into global mineral supply chains, Ford Motor Company, Huayou Cobalt, IBM, LG Chem and RCS Global announced plans to use blockchain technology to trace and validate ethically sourced minerals. To address traceability concerns, they are piloting a blockchain project – overseen by responsible-sourcing experts – to ensure the cobalt in their supply chains has not been mined by children or used to fund violent conflict.1 Cobalt from Huayou’s mine in the DRC is placed in secure bags and traced to LG Chem’s cathode and battery plant in South Korea, before making its way to the Ford plant in the United States. This effort builds on similar projects by IBM, Walmart and Carrefour in food supply chains, and De Beers’ Diamond Blockchain Initiative. RCS Global posits that the platform could expand from commercial mining to include validated artisanal miners.2
1. Lewis, B., 2019, “Ford and IBM among Quartet in Congo Cobalt Blockchain Project”, Reuters, 16 January 2019, https://www.reuters.com/article/us-blockchain-congo-cobalt-electric/ford-and-ibm-among-quartet-in-congo-cobalt-blockchain-project-idUSKCN1PA0C8 ; and Lewis, B., 2018, “Blockchain to Track Congo’s Cobalt from Mine to Mobile”, Reuters, 2 February 2018, https://uk.reuters.com/article/uk-mining-blockchain-cobalt/blockchain-to-track-congos-cobalt-from-mine-to-mobile-idUKKBN1FM0YI
2. Information about RCS Global Group can be found at https://www.rcsglobal.com/.
and smart contracts.115 It has strong potential to improve transparency and traceability in energy and mining supply chains, but the market is nascent – investment in energy-related blockchain applications totalled just $324 million in 2017.116 Blockchain applications could grow rapidly over the coming decade, particularly in precious gems, diamonds, tin, tungsten and cobalt (Box 4.6). Economies of scale will enable companies to unlock significant cost savings from initial blockchain investments, eliminating the need for costly materials verification processes.117 Realizing the potential in this area, the World Economic Forum has created the Mining and Metals Blockchain Initiative with seven mining and metals companies committed to advancing the technology in their supply chains.118
Dams that disturb natural river flows and drainage patterns should be redesigned or phased out. Redesign could involve reducing reservoir size, using smaller instream turbines and leveraging digital technologies to improve the conversion of water flows to energy.119 Research shows that the redesign of dams and removal of suboptimal components does not need to compromise their power generation capacity, while it can significantly improve biodiversity outcomes.120 Up to $15 billion could be spent annually in dam redesign globally through 2030.121 This opportunity requires regulations to mandate the redesign of existing dams (plus stringent design regulations for new dams), community engagement and the addition of alternative renewable energy capacity if required.
Blockchain applications in energy and mining supply chains could generate an opportunity worth $30 billion in 2030
business opportunity is significant. Rehabilitation processes vary by region and socio-economic conditions, but they generally involve restoring topsoil, planting native species and restoring natural drainage patterns.114
Blockchain applications in energy and mining supply chains could generate an opportunity worth $30 billion in 2030. Blockchain can create a secure end-to-end audit trail for personnel entering and exiting a mine site, material origins, movement of commodities, financial transactions

87New Nature Economy Report II – The Future Of Nature And Business
TOWARDS A NATURE-POSITIVE ENERGY AND EXTRACTIVES SYSTEM IV
1 International Resources Panel [IRP], 2019, Global Resources Outlook 2019: Natural Resources for the Future We Want, A Report of the International Resource Panel, Nairobi, Kenya: United Nations Environment Programme, https://www.resourcepanel.org/reports/global-resources-outlook
2 Sustainable Development Goals Knowledge Platform, 2019, “Progress of Goal 7 in 2019”, https://sustainabledevelopment.un.org/sdg7; and World Bank, 2019, “Access to electricity (% of population), World Development Indicators DataBank, accessed 1 April 2020, https://data.worldbank.org/indicator/EG.ELC.ACCS.ZS
3 International Renewable Energy Agency [IRENA], 2018, Global Energy Transformation: A Roadmap to 2050, https://www.irena.org/-/media/Files/IRENA/Agency/Publication/2018/Apr/IRENA_Report_GET_2018.pdf
4 “Reserves” are energy and materials identified in location and quantity and are therefore easy to factor into supply chains and rates of consumption, whereas “resources” cannot be quantified without long-term geological surveys.
5 These transitions have emerged following a thorough review of key past research as well as extensive engagement with experts from civil society, academia, and the private and public sector.
6 Business and Biodiversity Offsets Programme [BBOP], 2012, Guidance Notes to the Standard on Biodiversity Offsets, Forest Trends, https://www.forest-trends.org/wp-content/uploads/imported/BBOP_Standard_Guidance_Notes_20_Mar_2012_Final_WEB.pdf
7 IRP, 2017, Assessing Global Resource Use: A Systems Approach to Resource Efficiency and Pollution Reduction, https://www.resourcepanel.org/reports/assessing-global-resource-use
8 IRP, 2020, Building Resilient Societies after the Covid-19 Pandemic, https://www.resourcepanel.org/reports/building-resilient-societies-after-covid-19-pandemic
9 This transition includes circular models related to fibre products such as textiles but does not include circular models to reduce food loss and waste, which have been addressed in Chapter 2 – Towards a nature-positive food, land and ocean use system. It also does not include benefits from sharing platforms in urban settings (e.g. ridesharing, office sharing), which have been addressed in Chapter 3 from the perspective of densifying the built environment.
10 Ellen MacArthur Foundation, 2020, “What Is the Circular Economy?”, https://www.ellenmacarthurfoundation.org/circular-economy/what-is-the-circular-economy
11 Ellen Macarthur Foundation, 2017, Delivering the Circular Economy: A Toolkit for Policymakers, https://www.ellenmacarthurfoundation.org/resources/apply/toolkit-for-policymakers
12 Ellen MacArthur Foundation, 2020, “What Is the Circular Economy?”, op. cit.
13 Ellen MacArthur Foundation, 2017, “Circular Consumer Electronics: An Initial Exploration”, https://www.ellenmacarthurfoundation.org/assets/downloads/Circular-Consumer-Electronics-2704.pdf
14 Ellen MacArthur Foundation, 2015, Growth Within: A Circular Economy Vision for a Competitive Europe, https://www.ellenmacarthurfoundation.org/assets/downloads/publications/EllenMacArthurFoundation_Growth-Within_July15.pdf
15 Idem.
16 This is based on AlphaBeta’s analysis of EPR packaging frameworks.
17 IRP, 2018, Redefining Value – The Manufacturing Revolution: Remanufacturing, Refurbishment, Repair and Direct Reuse in the Circular Economy, https://www.resourcepanel.org/reports/re-defining-value-manufacturing-revolution
18 Ellen MacArthur Foundation, 2019, City Governments and Their Role in Enabling a Circular Economy Transition, https://www.ellenmacarthurfoundation.org/assets/downloads/CE-in-Cities_Policy-Levers_Mar19.pdf
19 Kettunen, M. et al., 2019, EU Circular Economy and Trade: Improving Policy Coherence for Sustainable Development, Institute for European Environmental Policy [IEEP], https://circulareconomy.europa.eu/platform/en/knowledge/eu-circular-economy-and-trade-report
20 The Circularity Gap Reporting Initiative, 2020, The Circularity Gap Report 2020, https://www.circularity-gap.world/2020
21 World Economic Forum, Ellen MacArthur Foundation and McKinsey & Company, 2016, The New Plastics Economy — Rethinking the Future of Plastics, https://www.ellenmacarthurfoundation.org/assets/downloads/EllenMacArthurFoundation_TheNewPlasticsEconomy_Pages.pdf
22 World Economic Forum, Ellen MacArthur Foundation and McKinsey & Company, 2016, The New Plastics Economy, op. cit.
23 Ellen MacArthur Foundation, 2012, Towards the Circular Economy Vol. 1, https://www.ellenmacarthurfoundation.org/publications/towards-the-circular-economy-vol-1-an-economic-and-business-rationale-for-an-accelerated-transition
24 Geyer, R. et al., 2017, “Production, Use, and Fate of All Plastics Ever Made”, Science Advances, 3 (7), e1700782, DOI: 10.1126/sciadv.1700782 https://advances.sciencemag.org/content/3/7/e1700782
25 Ellen MacArthur Foundation, 2012, Towards the Circular Economy Vol. 1., op. cit.
26 World Economic Forum, Ellen MacArthur Foundation and McKinsey & Company, 2016, The New Plastics Economy, op. cit.
Endnotes

88New Nature Economy Report II – The Future Of Nature And Business
TOWARDS A NATURE-POSITIVE ENERGY AND EXTRACTIVES SYSTEM IV
27 Ellen MacArthur Foundation, 2012, Towards the Circular Economy Vol. 1., op. cit.
28 World Economic Forum, 2014. Towards the Circular Economy: Accelerating the Scale-Up across Global Supply Chains, http://www3.weforum.org/docs/WEF_ENV_TowardsCircularEconomy_Report_2014.pdf
29 Ellen MacArthur Foundation, 2018, The Circular Economy Opportunity for Urban and Industrial Innovation in China, https://www.ellenmacarthurfoundation.org/publications/chinareport
30 For example, UNEP-WCMC has conducted work on aligning biodiversity metrics for business to avoid duplication and ensure a common language in communication of impacts. For more information, see https://www.unep-wcmc.org/system/comfy/cms/files/files/000/001/556/original/20190614_AligningMeasuresFlyer_Communications_FINAL_210619.pdf
31 Organisation for Economic Co-operation and Development [OECD], 2019, Mining and Green Growth in the EECCA Region, https://www.oecd.org/environment/outreach/20190413_Mining%20and%20Green%20Growth%20Final.pdf
32 Cocks, R. and D. Lewis, 2019, “The Wildcat Goldminers Doomed by Their Toxic Trade”, a Special Reuters Report, Reuters, 24 July 2019, https://www.reuters.com/investigates/special-report/gold-africa-poison/
33 IRP, 2019, Global Resources Outlook 2019 – Natural Resources for the Future We Want, A Report of the International Resource Panel, Nairobi, Kenya: United Nations Environment Programme, https://wedocs.unep.org/bitstream/handle/20.500.11822/27517/GRO_2019.pdf?sequence=3&isAllowed=y
34 See Helmholtz-Zentrum Dresden-Rossendorf, 2020, “Reducing Water Consumption in Mining, Science Daily, https://www.sciencedaily.com/releases/2019/03/190328102647.htm
35 Anglo American has established this target for 2020. See Anglo American, 2017, “Defining Our Water Future”, https://www.angloamerican.com/futuresmart/our-world/environment/defining-our-water-future; Glencore, 2018, Water Report: 2018, https://www.glencore.com/dam:jcr/699d99b7-b055-4ebf-b931-e18f6e0baadf/2018-Water-Report.pdf; and Michaux, B. et al., 2019, “Water-Saving Strategies in the Mining Industry – The Potential of Mineral Processing Simulators as a Tool for Their Implementation”. Journal of Environmental Management, 2019, https://www.sciencedaily.com/releases/2019/03/190328102647.htm
36 Business and Sustainable Development Commission [BSDC], 2017, Valuing the SDG Prize, http://s3.amazonaws.com/aws-bsdc/Valuing-the-SDG-Prize.pdf
37 Roche, C. et al., eds., 2017. Mine Tailings Storage: Safety Is No Accident – A UNEP Rapid Response Assessment, Nairobi and Arendal: United Nations Environment Programme and GRID-Arendal.
38 The Guardian, 2019. “Brazilian Mining Company to Pay Out £86m for Disaster that Killed Almost 300 People”, The Guardian, 16 July 2019, https://www.theguardian.com/world/2019/jul/16/vale-brazil-mining-dam-collapse-brumadinho
39 For further information, see https://www.icmm.com/en-gb/environment/tailings
40 IRP, 2019, Global Resources Outlook 2019, op. cit.
41 Gibb, H. and K. G. O. Leary, 2014, “Mercury Exposure and Health Impacts among Individuals in the Artisanal and Small-Scale Gold Mining Community: A Comprehensive Review”, Environmental Health Perspectives, 122 (7), 1307864.
42 Carvalho, F., P., 2017, “Mining Industry and Sustainable Development: Time for Change”, Food and Energy Security, 6 (2), 61–77, https://doi.org/10.1002/fes3.109
43 Government of Australia, 2016, Mine Rehabilitation: Leading Practice Sustainable Development Program for the Mining Industry, https://www.industry.gov.au/sites/default/files/2019-04/lpsdp-mine-rehabilitation-handbook-english.pdf
44 Kellogg Innovation Network, 2014. Reinventing Mining: Creating Sustainable Value Introducing the Development Partner Framework, http://www.kinglobal.org/uploads/5/2/1/6/52161657/pb_kin_dpf_final_12_4_5mb.pdf
45 Arlidge, W. N. S. et al., 2018, “A Global Mitigation Hierarchy for Nature Conservation”, BioScience, 68 (5), https://www.cbd.int/doc/strategic-plan/Post2020/postsbi/biodiversify2.pdf
46 Bastida, E., 2002, “Integrating Sustainability into Legal Frameworks for Mining in Some Selected Latin American Countries”, Mining, Minerals and Sustainable Development, 120, 1–33.
47 Intergovernmental Panel of Biodiversity and Ecosystem Services [IPBES], 2019, Global Assessment Report on Biodiversity and Ecosystem Services of the Intergovernmental Science-Policy Platform on Biodiversity and Ecosystem Services, https://www.ipbes.net/global-assessment-report-biodiversity-ecosystem-services
48 World Bank, 2019, Forest-Smart Mining: Identifying Factors Associated with the Impacts of Large-Scale Mining on Forests, http://documents.worldbank.org/curated/en/104271560321150518/pdf/Forest-Smart-Mining-Identifying-Factors-Associated-with-the-Impacts-of-Large-Scale-Mining-on-Forests.pdf
49 Mongabay, 2017, “Mining Activity Causing Nearly 10% of Amazon Deforestation”, https://news.mongabay.com/2017/11/mining-activity-causing-nearly-10-percent-of-amazon-deforestation/
50 World Bank, 2019, Forest-Smart Mining, op. cit.
51 UN Environment Programme [UNEP], 2018, Illustrated Guide to Mercury Free Artisanal and Small Scale Gold Mining, https://indd.adobe.com/view/a9b3c39e-e7b7-412a-9d12-5cf47f484e56
52 BSDC, 2017, Valuing the SDG Prize, op. cit.
53 Mining Technology, 2015, “Managing Australia’s 50,000 Abandoned Mines”, Mining Technology, https://www.mining-technology.com/features/featuremanaging-australias-50000-abandoned-mines-4545378/

89New Nature Economy Report II – The Future Of Nature And Business
TOWARDS A NATURE-POSITIVE ENERGY AND EXTRACTIVES SYSTEM IV
54 IRP, 2019, Global Resources Outlook 2019, op. cit.
55 “Reserves” are energy and materials identified in location and quantity therefore easy to factor into supply chains and rates of consumption, whereas “resources” cannot be quantified without long-term geological surveys.
56 Washburn, T. W. et al., 2019, “Ecological Risk Assessment for Deep-Sea Mining”, Ocean and Coastal Management, 176, 24–3925, https://doi.org/10.1016/j.ocecoaman.2019.04.014
57 Bateman, A. and L. Bonanni, 2019, “What Supply Chain Transparency Really Means”, Harvard Business Review, https://hbr.org/2019/08/what-supply-chain-transparency-really-means
58 Kraft, T. et al., 2017, “Supply Chain Visibility and Social Responsibility: Investigating Consumers’ Behaviors and Motives”, Manufacturing & Service Operations Management, 20 (4), https://doi.org/10.1287/msom.2017.0685
59 Potential standards include the CERA Standard. See European Institute of Innovation and Technology, 2020, “About CERA”, https://www.cera-standard.org/about/our-mission
60 World Economic Forum, 2019, Harnessing the Fourth Industrial Revolution for the Circular Economy, White Paper, https://www.weforum.org/whitepapers/harnessing-the-fourth-industrial-revolution-for-the-circular-economy-consumer-electronics-and-plastics-packaging
61 BSDC, 2017, Valuing the SDG Prize, op. cit.
62 Pickerell, T., 2020, “Here’s How Transparent Global Fisheries Can Be a Reality”, https://www.weforum.org/agenda/2020/02/seafood-bait-to-plate-illegal-fishing-tuna/
63 Hobson, P., 2019, “Exclusive: Fake-Branded Bars Slip Dirty Gold into World Markets”, Reuters, https://www.reuters.com/article/us-gold-swiss-fakes-exclusive/exclusive-fake-branded-bars-slip-dirty-gold-into-world-markets-idUSKCN1VI0DD
64 Sonter, L. J. et al., 2018, “Mining and Biodiversity: Key Issues and Research Needs in Conservation Science”, Proceedings of the Royal Society B – Biological Sciences, https://royalsocietypublishing.org/doi/10.1098/rspb.2018.1926
65 IPBES, 2019, Global Assessment Report, op. cit.
66 Sonter et al., 2018, “Mining and Biodiversity”, op. cit.
67 Silvestre, B. S, 2015, “Sustainable Supply Chain Management in Emerging Economies: Environmental Turbulence, Institutional Voids and Sustainability Trajectories”, International Journal of Production Economics, 167 (September 2015), 156–69, https://doi.org/10.1016/j.ijpe.2015.05.025
68 World Bank Group, 2019, Forest-Smart Mining, op. cit.
69 Church, C. and A. Crawford, 2018, “Green Conflict Minerals: The Fuels of Conflict in the Transition to a Low-Carbon Economy”, International Institute for Sustainable Development [IISD], https://www.iisd.org/story/green-conflict-minerals/
70 Components of this transition have overlaps with forest ecosystem services/natural climate solutions (e.g. reforestation, avoided conversion, etc.) that have been discussed in Chapter 2 – Towards a nature-positive food, land and ocean use system under transition #1, ecosystem restoration and avoided land and ocean use expansion. These components will not be discussed in detail in this chapter. For a full list of transitions that are relevant to each of the 19 sectors of the economy, please refer to Chapter 5.
71 Union of Concerned Scientists, USA, 2018, “Average Life Expectancy of Select Infrastructure Types and Potential Climate-Related Vulnerabilities”, https://www.ucsusa.org/sites/default/files/attach/gw-smart-infrastructure-table-life-expectancy.pdf
72 Smith, P. et al., 2019, “Interlinkages between Desertification, Land Degradation, Food Security and Greenhouse Gas Fluxes: Synergies, Trade-offs and Integrated Response Options”, in Climate Change and Land: an IPCC Special Report on climate Change, Desertification, Land Degradation, Sustainable Land Management, Food Security, and Greenhouse Gas Fluxes in Terrestrial Ecosystems, Chapter 6, https://www.ipcc.ch/site/assets/uploads/sites/4/2019/11/09_Chapter-6.pdf
73 Harper, A. B. et al., 2018, “Land-Use Emissions Play a Critical Role in Land-Based Mitigation for Paris Climate Targets”, Nature Communications, 9, article 2938, https://www.nature.com/articles/s41467-018-05340-z
74 Brack, D. and R. King, 2020, “Net Zero and Beyond: What Role for Bioenergy with Carbon Capture and Storage?” Chatham House Research Paper, https://www.chathamhouse.org/publication/net-zero-and-beyond-what-role-bioenergy-carbon-capture-and-storage#
75 Grubler, A. et al., 2018, “A Low Energy Demand Scenario for Meeting the 1.5C Target and Sustainable Development Goals without Negative Emission Technologies”, Nature Energy, 3 (6), 515–27.
76 See Box 25 in The Food and Land Use Coalition [FOLU], 2019, Growing Better: Ten Critical Transitions to Transform Food and Land Use, https://www.foodandlandusecoalition.org/wp-content/uploads/2019/09/FOLU-GrowingBetter-GlobalReport.pdf
77 Griscom, B.W. et al./The Nature Conservancy [TNC], 2017, Natural Climate Solutions – Supporting Information Appendix. Proceedings of the National Academy of Sciences of the USA, https://www.pnas.org/content/114/44/11645
78 Friends of Ocean Action, 2020, Impact Report – The Business Case for Marine Protection and Conservation, http://www3.weforum.org/docs/WEF_Business_case_for_marine_protection.pdf
79 Institute for Sustainable Futures, University of Technology, Sydney, 2019, Responsible Minerals Sourcing for Renewable Energy, https://earthworks.org/publications/responsible-minerals-sourcing-for-renewable-energy/
80 Church, C. and A. Crawford, 2018, “Green Conflict Minerals: The Fuels of Conflict in the Transition to a Low-Carbon Economy”, International Institute for Sustainable Development, https://www.iisd.org/story/green-conflict-minerals/

90New Nature Economy Report II – The Future Of Nature And Business
TOWARDS A NATURE-POSITIVE ENERGY AND EXTRACTIVES SYSTEM IV
81 Kang, D. et al., 2015, “PV Module Recycling: Mining Australian Rooftops”, ANU Research Publications, conference paper, 2015 Asia-Pacific Solar Research Conference, https://openresearch-repository.anu.edu.au/handle/1885/154061
82 Sprecher, B, 2016, “When Materials Become Critical: Lessons from the 2010 Rare Earth Crisis”, Doctoral Thesis, Leiden University.
83 Smith, B. J. and Eggert, R. G., 2018, “Costs, Substitution, and Material Use: The Case of Rare Earth Magnets”, Environmental Science & Technology, 52, 3803–11.
84 International Energy Agency [IEA], 2019, World Energy Outlook 2019, https://iea.blob.core.windows.net/assets/1f6bf453-3317-4799-ae7b-9cc6429c81d8/English-WEO-2019-ES.pdf
85 Grill, G. et al., 2019, “Mapping the World’s Free-Flowing Rivers”, Ngture, 569, 215–21, https://www.nature.com/articles/s41586-019-1111-9
86 Based on data supplied by Christiane Zarfi and others from the University of Tubingen. See BBC, 2018, “Hydropower Dams: What’s Behind the Global Boom?” BBC News, 6 August 2018, https://www.bbc.com/news/world-45019893
87 Metabolic, Copper 8 and Leiden University, 2018, Metal Demand for Renewable Electricity Generation in the Netherlands: Navigating a Complex Supply Chain, https://www.copper8.com/wp-content/uploads/2018/12/Metal-Demand-for-renewable-electricity-generation-in-the-Netherlands.pdf
88 IRP, 2020, Building Resilient Societies after the COVID-19 pandemic: Key Messages from the International Resource Panel, https://www.resourcepanel.org/sites/default/files/documents/document/media/building_resilient_societies_after_the_covid-19_pandemic_-_key_messages_from_the_irp_-_12_may_2020.pdf
89 International renewable Energy Agency [IRENA], 2020, Global Renewables Outlook: Energy Transformation 2050, https://www.irena.org/publications/2020/Apr/Global-Renewables-Outlook-2020
90 Layke, J. and N. Hutchinson, 2020, “3 Reasons to Invest in Renewable Energy Now”, World Resources Institute Blog, 5 May 2020, https://www.wri.org/blog/2020/05/coronavirus-renewable-energy-stimulus-packages
91 Energy Transitions Commission, 2020, 7 Priorities to Help the Global Economy Recover, http://www.energy-transitions.org/sites/default/files/COVID-Recovery-Response.pdf
92 See, e.g. Financial Times Editorial Board, 15 May 2020: “The virus fight opens up a climate opportunity”, https://on.ft.com/3byeY9j ; and The Economist, 23–29 May 2020: “Countries should seize the moment to flatten the climate curve”, https://www.economist.com/leaders/2020/05/21/countries-should-seize-the-moment-to-flatten-the-climate-curve
93 Goldsmith, Lord Z. et al., 2020, “Letter: Nature conservation must be at the heart of any recovery”, The Financial Times, 20 May 2020, https://on.ft.com/2AKJArr
94 McKinsey Global Institute, 2012, The World at Work: Jobs, Pay and Skills for 3.5 Billion People, June 2012, https://www.mckinsey.com/~/media/McKinsey/Featured%20Insights/Employment%20and%20Growth/The%20world%20at%20work/MGI%20Global_labor_Full_Report_June_2012.ashx
95 For more details on other opportunities, please refer to the Methodological Note at https://www.alphabeta.com/our-research/methodology-note-new-nature-economy-report-on-the-future-of-nature-and-business/
96 The UK Waste & Resources Action Plan [WRAP], 2015, Economic Growth Potential of More Circular Economies, https://www.researchgate.net/publication/284187253_ECONOMIC_GROWTH_POTENTIAL_OF_MORE_CIRCULAR_ECONOMIES
97 Accenture, 2017, Automotive’s Latest Model: Redefining Competitiveness through the Circular Economy, https://eu-smartcities.eu/sites/default/files/2017-12/Accenture-POV-CE-Automotive.pdf
98 Applications in transport and building sectors have been addressed in Chapter 3 – Towards a nature-positive infrastructure and built environment system.
99 McKinsey Global Institute, 2011, Resource Revolution: Meeting the World’s Energy, Materials, Food, and Water Needs, November 2011, https://www.mckinsey.com/business-functions/sustainability/our-insights/resource-revolution
100 IEA, 2019, Renewables 2019: Market Analysis and Forecast from 2019 to 2024, https://www.iea.org/reports/renewables-2019
101 IEA, 2016, World Energy Outlook 2016, https://www.iea.org/media/publications/weo/WEO2016Chapter1.pdf
102 Energy Choice Coalition, 2020, “Wood MacKenzie, Industry Associations Report Coronavirus Impact on Energy Transition”, https://www.energychoicecoalition.org/blog/2020/4/17/wood-mackenzie-industry-associations-report-coronavirus-impact-on-energy-transition
103 Layke, J. and N. Hutchinson, 2020, “3 Reasons to Invest in Renewable Energy Now”, World Resources Institute Blog, op. cit.
104 McKinsey Global Institute, 2011, Resource Revolution, op. cit.
105 Richard Shaw et al. (2013), “Resource Recovery from Mine Waste”, in Waste as a Resource, https://pubs.rsc.org/en/content/chapter/9781849737883-00044/978-1-84973-788-3
106 McKinsey Global Institute, 2011, Resource Revolution, op. cit.
107 IRP, 2019, Global Resources Outlook 2019, op. cit.
108 IEA, 2015, World Energy Outlook 2015, https://eneken.ieej.or.jp/data/6508.pdf
109 McKinsey Global Institute, 2011, Resource Revolution, op. cit.
110 McKinsey Global Institute, 2013, Reverse the Curse: Maximizing the Potential of Resource-Driven Economies, https://www.mckinsey.com/industries/metals-and-mining/our-insights/reverse-the-curse-maximizing-the-potential-of-resource-driven-economies

91New Nature Economy Report II – The Future Of Nature And Business
TOWARDS A NATURE-POSITIVE ENERGY AND EXTRACTIVES SYSTEM IV
111 World Economic Forum, Ellen MacArthur Foundation and McKinsey & Company, 2016, The New Plastics Economy, op. cit.
112 World Economic Forum, Ellen MacArthur Foundation and McKinsey & Company, 2016, The New Plastics Economy, op. cit.
113 See the Methodological Note at https://www.alphabeta.com/our-research/methodology-note-new-nature-economy-report-on-the-future-of-nature-and-business/ for further details on sizing.
114 The International Aluminium Institute, 2018, “Aluminium for Future Generations – Rehabilitation”, http://bauxite.world-aluminium.org/mining/rehabilitation/
115 World Economic Forum, 2018, “4 Ways Blockchain Will Transform the Mining and Metals Industry”, https://www.weforum.org/agenda/2018/07/4-ways-blockchain-will-transform-the-mining-and-metals-industry/
116 Ledger Insights, 2019, “World Energy Council, PwC survey: Blockchain Immature”, Ledger Insights, https://www.ledgerinsights.com/world-energy-council-pwc-blockchain/
117 Brody, P., 2017, “How Blockchain Is Revolutionizing Supply Chain Management”, EY Digitalist, https://www.ey.com/Publication/vwLUAssets/ey-blockchain-and-the-supply-chain-three/$FILE/ey-blockchain-and-the-supply-chain-three.pdf
118 World Economic Forum, 2019, “Seven Mining, Metals Companies Partner on Responsible Sourcing with World Economic Forum”, Press Release, 25 October 2019, https://www.weforum.org/press/2019/10/seven-mining-metals-companies-partner-on-responsible-sourcing-with-world-economic-forum/
119 Mongabay, 2019, “The Hidden Costs of Hydro: We need to Reconsider World’s Dam Plans”, https://news.mongabay.com/2019/03/the-hidden-costs-of-hydro-we-need-to-reconsider-worlds-dam-plans/
120 Tickner, D. et al., 2020, “Bending the Curve of Global Freshwater Biodiversity Loss: An Emergency Recovery Plan”, BioScience, 70 (4), 330–42, https://academic.oup.com/bioscience/advance-article/doi/10.1093/biosci/biaa002/5732594
121 See the Methodological Note at https://www.alphabeta.com/our-research/methodology-note-new-nature-economy-report-on-the-future-of-nature-and-business/ for further details on sizing.
From opportunity to reality: Catalysing action for a nature-positive economy
CHAPTER V

93New Nature Economy Report II – The Future Of Nature And Business
Business has the opportunity to dramatically accelerate the transition to a nature-positive economy and collaborate on the advocacy, design and adoption of the policy reforms needed to protect, restore and sustainably manage nature.

94New Nature Economy Report II – The Future Of Nature And Business
FROM OPPORTUNITY TO REALITY: CATALYSING ACTION FOR A NATURE-POSITIVE ECONOMYV
Policy and regulations are key elements of a successful transition
Examples of progress on reforming environmentally harmful and inequitable subsidies are promising, however. Between 1986 and 2016, European Union Common Agricultural Policy reforms successfully reduced nitrogen oxide emissions from fertilizer use by 17%, while at the same time yields increased by 28%.8 Tailored public procurement that sends clear signals to markets can also help guide production and consumption activities. For example, the EU Green Public Procurement criteria for food and catering services are being revised and one proposal is to include sustainable sourcing requirements for palm oil.9 Ultimately, to make nature-positive models investable, explicitly pricing in and articulating environmental cost factors to penalize unsustainable practices – such as through carbon taxes, for example – will be a game changer.10 The current crisis, with the combination of particularly low oil prices and widespread government support to businesses through grants, loans and loan guarantees, provides a unique opportunity to push for incentive redesign in alignment with a cleaner, more resilient economy.
Developing integrated and actionable maps
Today’s climate and biodiversity strategies under the relevant international conventions – the Nationally Determined Contributions and Nationally Biodiversity Strategy Action Plans – do not contain actionable maps necessary to help governments translate political ambition into geospatially explicit policy objectives that can be implemented and monitored. Integrated global maps of biodiversity, carbon storage and other nature services are essential to support and harmonize decision-making on national, regional and global targets under the UN Convention on Biological Diversity (CBD).11 Geospatially explicit frameworks for national commitments make commitments more realistic and are indispensable to ensuring effective civil society and business engagement.12 Countries can learn from the experience of China’s Ecological Conservation Red Line initiative – a policy underpinned by a rigorous scientific approach to identify high-priority areas for biodiversity, ecosystem services and disaster risk reduction – that is currently being rolled out and will cover 25% to 28% of the country’s territory.13
A nature-positive, low-carbon resilient economy cannot be achieved by business action alone. Policy and regulatory change from governments and shifts in the habits and social norms of billions of individuals will be needed to shape the path forward. The Intergovernmental Panel on Biodiversity and Ecosystem Services (IPBES) Global Assessment Report has identified a number of options for policy-makers to support the conservation and restoration of nature.1 The need for political will and supportive policies is particularly strong in the context of the unprecedented economic and social disruption triggered by the COVID-19 pandemic.2
Business engagement in policy discussions is particularly important in the global response to the pandemic. Many countries have announced large stimulus packages to recover from the economic and humanitarian crises. These packages must not reinforce existing negative economic models, but rather support investments in alternative nature-positive pathways. Experts from Oxford University that assessed over 700 stimulus policies, surveyed 231 experts from 53 countries, and drew on lessons from the 2008 financial crisis have shown that green projects create more jobs, deliver higher short-term returns per dollar spent and lead to increased long-term cost savings compared to traditional fiscal stimulus.3 They argue that the climate emergency is likely to be even graver than the crisis created by COVID-19, just slower in materializing
While a detailed review of the policy changes needed to enable each transition is beyond the scope of this report, a few cross-cutting policy shifts are particularly important to the successful adoption of the identified business transitions.
Realigning incentives
Businesses should support government efforts to realign incentives and eliminate the ones that support wasteful activities. Too many fiscal policies currently make destroying nature cheaper than protecting it, with perverse subsidies dwarfing the amount of finance available for biodiversity and nature conservation.4 For instance, in 2019 government subsidies of more than $300 billion went to fossil fuel consumption globally,5 while only 15% of the $700 billion in agriculture subsidies is directly linked to public benefit,6 and roughly $20 billion a year of fishing subsidies are provided in forms that contribute to overcapacity of fishing fleets.7

FROM OPPORTUNITY TO REALITY: CATALYSING ACTION FOR A NATURE-POSITIVE ECONOMYV
New Nature Economy Report II – The Future Of Nature And Business 95
Business has both the opportunity and the responsibility to lead in co-creating the roadmaps to system transformation
Science is clear: not only halting but also reversing nature loss is extremely urgent. Policy changes, as highlighted above, are needed to put us on a people- and nature-positive pathway. However, without strong leadership from civil society and progressive businesses, policy processes at national and especially international level can be slow and unambitious. Moreover, governments’ budgets are likely to face constraints as resources are diverted towards solving the immediate humanitarian crisis of the COVID-19 pandemic. In this context, business can take practical actions to fill some of these gaps while governments reshape their policies, incentives and pricing. Businesses can lead by moving ahead of policy and regulation – for instance, through voluntary commitments – where feasible, and by engaging and advocating with government to accelerate necessary policy changes.14 Businesses also can join or build alliances and collaborative platforms to co-create shared transition roadmaps for specific
value chains or regions. These alliances can then be used to accelerate the deployment of innovative financial models and technological innovation – such as Fourth Industrial Revolution technologies – to catalyse change at the required scale.
Business can take advantage of the over $10 trillion in existing market opportunities associated with the 15 transitions to begin the transformative journey (as described in the previous chapters). Beyond these existing opportunities, more are expected to emerge as transition roadmaps are built and markets are transformed. Ultimately, businesses’ role in these transitions will vary by sector and region, determined through four practical steps:
First, businesses should identify the specific transitions that are relevant to them and the role they can play; second, businesses should adopt, implement and support the corporate policies that
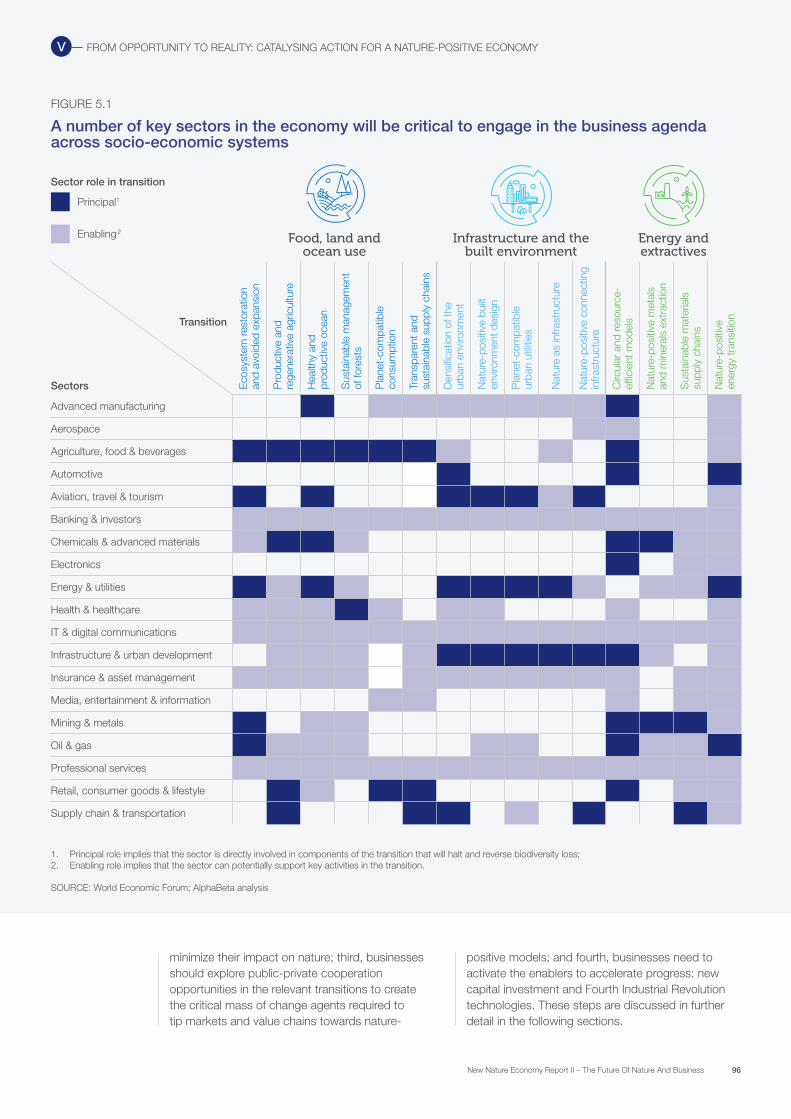
Food, land and ocean use
Infrastructure and the built environment
Energy and extractives
Transition
Sectors Eco
syst
em re
stor
atio
n
and
avoi
ded
expa
nsio
n
Pro
duct
ive
and
rege
nera
tive
agric
ultu
re
Hea
lthy
and
pr
oduc
tive
ocea
n
Sus
tain
able
man
agem
ent
of fo
rest
s
Pla
net-
com
patib
le
cons
umpt
ion
Tran
spar
ent a
nd
sust
aina
ble
supp
ly c
hain
s
Den
sific
atio
n of
the
ur
ban
envi
ronm
ent
Nat
ure-
posi
tive
built
en
viro
nmen
t des
ign
Pla
net-
com
patib
le
urba
n ut
ilitie
s
Nat
ure
as in
frast
ruct
ure
Nat
ure-
posi
tive
conn
ectin
g in
frast
ruct
ure
Circ
ular
and
reso
urce
-ef
ficie
nt m
odel
s
Nat
ure-
posi
tive
met
als
an
d m
iner
als
extr
actio
n
Sus
tain
able
mat
eria
ls
supp
ly c
hain
s
Nat
ure-
posi
tive
en
ergy
tran
sitio
n
Advanced manufacturing
Aerospace
Agriculture, food & beverages
Automotive
Aviation, travel & tourism
Banking & investors
Chemicals & advanced materials
Electronics
Energy & utilities
Health & healthcare
IT & digital communications
Infrastructure & urban development
Insurance & asset management
Media, entertainment & information
Mining & metals
Oil & gas
Professional services
Retail, consumer goods & lifestyle
Supply chain & transportation
96New Nature Economy Report II – The Future Of Nature And Business
FROM OPPORTUNITY TO REALITY: CATALYSING ACTION FOR A NATURE-POSITIVE ECONOMYV
FIGURE 5.1
A number of key sectors in the economy will be critical to engage in the business agenda across socio-economic systems
minimize their impact on nature; third, businesses should explore public-private cooperation opportunities in the relevant transitions to create the critical mass of change agents required to tip markets and value chains towards nature-
positive models; and fourth, businesses need to activate the enablers to accelerate progress: new capital investment and Fourth Industrial Revolution technologies. These steps are discussed in further detail in the following sections.
1. Principal role implies that the sector is directly involved in components of the transition that will halt and reverse biodiversity loss; 2. Enabling role implies that the sector can potentially support key activities in the transition.
SOURCE: World Economic Forum; AlphaBeta analysis
Principal1
Enabling2
Sector role in transition

97New Nature Economy Report II – The Future Of Nature And Business
FROM OPPORTUNITY TO REALITY: CATALYSING ACTION FOR A NATURE-POSITIVE ECONOMYV
institutional investors have started including nature-related disclosures in their assessments and are demanding more accountability on the environmental risks of business operations.17 A large movement is growing among global business leaders that aims to uphold “stakeholder capitalism”, whereby the purpose of business is broader than only providing return to shareholders, rather it is to serve society.18
Although corporate voluntary action is often not enough to achieve transformative change, a critical mass of businesses adopting ambitious standards of environmental and social responsibility moves the goalpost of what is possible and desirable. It changes the decision-making equation for policy-makers, as in the case of forest-risk commodities.19
Adopting best-in-class practices regarding nature is a critical responsibility for business
Businesses should first identify which transitions they can accelerate
Businesses can start by identifying in which of the 15 transitions their participation is crucial. Figure 5.1 identifies the key sectors that need to engage in each transition. Three important observations can be made from the figure. The first is that some transitions involve many different sectors. Scaling circular and resource-efficient models for materials, for instance, requires nine sectors to be highly involved. Second, some sectors have enabling roles across a significant number of transitions. Banking and investing, information technology (IT) and digital communications, professional services, and advanced manufacturing are near pervasive across all transitions. Third, a dialogue is needed across sectors that currently rarely
interact, especially on biodiversity issues. For instance, pursuing a healthy and productive ocean requires collaboration between agriculture, food and beverages, and the chemicals sector to help combat pollution in aquaculture systems and wild fisheries, as well as with the advanced manufacturing and the energy and utilities industries to manage the impact of renewable energy expansion in the ocean. And, the tourism sector can collaborate with primary industries such as agriculture, fishing and mining to promote ecotourism that will accelerate ecosystem restoration and avoided land and ocean use expansion as well as further the transition towards a healthy and productive ocean.
A focus on system-wide transformation cannot come at the expense of adopting best practices and ambitious corporate goals within supply chains. Unfortunately, many businesses are still lagging behind. For example, notwithstanding years of progressive work on the impact of international supply chain actors on tropical deforestation, 242 of the 500 companies most exposed to deforestation risk have still made no public commitment to end deforestation.15 As regulators, investors and consumers are beginning to demand more from businesses, behaving responsibly is no longer just a moral imperative. There is now a strong business case for more sustainable, nature-positive models, and it is becoming clear that the cost of inaction on nature and climate is too high to wait.16 Ratings agencies and
Joining or creating multistakeholder partnerships can tip markets and value chains towards nature-positive models
Businesses can benefit from multisector cooperation to create the critical mass of change agents needed to tip markets and value chains towards nature-positive models. The adoption of transformative practices and policies by a critical mass of market leaders needs the support of civil society and even leading governments in setting the norms and in monitoring outcomes. This is necessary for credibility and to gain broad acceptance. For example, the
Science Based Targets Initiative,20 an initiative to set greenhouse gas emission reduction targets for corporations based on the objectives of the Paris Agreement, aims to provide a set of common norms for companies. A similar effort by Science Based Targets Network is looking into setting targets for nature. Multi-stakeholder collaboration is similarly useful to the acceptance and governance of innovative financing models and new technology.

98New Nature Economy Report II – The Future Of Nature And Business
FROM OPPORTUNITY TO REALITY: CATALYSING ACTION FOR A NATURE-POSITIVE ECONOMYV
Businesses can leverage existing multistakeholder platforms relevant to the 15 transitions.21 For example, the Tropical Forest Alliance (TFA), a platform to eliminate tropical deforestation from the production of agricultural commodities, is relevant to transitions on ecosystem restoration and avoided land and ocean use, productive and regenerative agriculture, and transparent and sustainable supply chains. The Green Infrastructure Investment Coalition is a platform for investors, multilateral development banks and country advisers to coordinate funding
for sustainable infrastructure and contribute to transitions in the infrastructure and the built environment system.22
New multistakeholder partnerships could, in some cases, help to drive progress on transitions globally, regionally or for a specific value chain. The COVID Action Platform has demonstrated that public-private partnerships can be created quickly and effectively, achieving significant impact when there is sufficient motivation.23 Some opportunities for new platforms to address important challenges include:
The emerging market sustainable sourcing coalition
This partnership could support the transparent and sustainable supply chains transition in the food, land and ocean use system. Major emerging market importers (China and India) and major emerging market producer-consumers (Brazil and Indonesia) account for around 40% of global demand for four deforestation-linked commodities (soy, beef, palm oil and wood products). This share is set to increase further by 2025.24 Industry players in these countries could incentivize sustainable production by establishing joint commitments on sustainability. The Chinese Sustainable Meat Declaration is a promising
example. The concentrated number of industry players makes this approach particularly viable: for example, just 10 players in China are responsible for almost two-thirds of the country’s domestic soy sales.25 For such a shift to sustainable sourcing to happen, the largest players (e.g. the top 10 largest importers) in deforestation-linked commodities in key emerging markets (e.g. China, India) must come together to sign commitments. A specific roadmap could be developed that would tackle potential barriers, such as consumer education, ensuring the appropriate volume of supply and enhancing traceability.
The Twin Deltas initiative26
This partnership could support the nature-positive energy transition in the energy and extractives system. The world’s deltas are in crisis. Many river deltas are sinking, primarily because of excessive groundwater pumping and river sediment flow disruption from dams and other hydroelectric power
interventions. These disruptions to the ecosystem create major risks to local biodiversity and food supply, as deltas have highly fertile soil, dense vegetation and rich fish supplies. For example, agreements have been signed for 12 hydropower projects on the lower Mekong River; this river feeds into Viet Nam’s Mekong Delta, which supplies almost 20% of the world’s rice.27 A starting point could be two of the largest river delta systems in the world: the Ganges-Brahmaputra Delta that spans India and Bangladesh and the Mekong Delta in Viet Nam. International cooperation is essential as these deltas are supplied by rivers that cross many countries with conflicting economic interests (including new dams, fisheries, construction companies, water utilities etc). A partnership approach would require multistakeholder engagement to rethink issues such as hydroelectric power and clean water supply, comprehensive environment risk assessment approaches for downstream regions, and reducing the removal of sand for construction.

99New Nature Economy Report II – The Future Of Nature And Business
FROM OPPORTUNITY TO REALITY: CATALYSING ACTION FOR A NATURE-POSITIVE ECONOMYV
The emerging market circularity forum
The middleweight cities coalition
This coalition could support the transition on planet-compatible urban utilities in the infrastructure and the built environment system. Although many organizations are already active in this system (e.g. UN Habitat, C40 etc.), there is limited focus on rapidly growing “middleweight” cities (those with a population of 1–5 million), where urbanization is happening most quickly, particularly in Asia.28 These cities are challenged with securing financing for safe and modern water, sanitation, waste management and energy solutions to their burgeoning, and
increasingly wealthy, residents. This effort could initially focus on Southeast Asia, given the number of growing middleweight cities and the commitment by ASEAN Member States to sustainable urbanization.29 A key challenge is the lack of capacity to develop high-quality proposals for donors and investors. A starting point could be developing a coalition of cities, multilateral development banks, investors and private sector companies that can support proposal development and provide forums for connecting cities to funding and technology.
This partnership could support the circular and resource-efficient models of production transition in the energy and extractives system. The shift to circular systems encouraging the reduction, reuse and recycling of waste has good traction in Europe, particularly through the leadership of the Ellen MacArthur Foundation and the World Economic Forum’s Platform for Accelerating the Circular Economy (PACE), but other regions have limited exposure to circularity concepts. The challenge with a circular economy is that it requires stakeholder engagement across
the entire value chain, from design to recycling. Indonesia recently launched a multistakeholder effort to develop a national circular economy roadmap. A new forum could bring together policy-makers, private sector companies, investors and experts from different sectors in emerging markets to discuss lessons learned and how to scale up national approaches (e.g. developing regional offtake markets for recycled products through harmonized product standards). Private sector players could also use this forum to make commitments on circularity.

FIGURE 5.2
Capital investment required to capture opportunities in the three systems is around $2.7 trillion annually
* Based on estimated investment requirements to capture the business opportunities linked to transitions in each system. Rounded to nearest $5 billion.
SOURCE: Literature review; Global Sustainable Investment Alliance; AlphaBeta analysis
2,710
Annualized investment costs (2020-30)$ trillion; 2019 values*
Food, land and ocean use
Infrastructure and the built environment
Energy and extractives
While this is a substantial capital
demand, it is comparable with the $2.2 trillion stimulus
package announced by just the US in March 2020 in response to
COVID-19
440
1,430
840
Total
100New Nature Economy Report II – The Future Of Nature And Business
FROM OPPORTUNITY TO REALITY: CATALYSING ACTION FOR A NATURE-POSITIVE ECONOMYV
Besides mobilizing multistakeholder support, the transitions will require substantial financial capital. Even the identified business opportunities can be only partly captured by reorienting existing processes, meaning that a significant share will require new investment. We estimate that the total annual investment required for all 59 opportunities across the three systems is around $2.7 trillion through 2030 (Figure 5.2).30
Much of the needed capital is concentrated in a few business opportunities: 22% of the total estimated capital need is for improving building and energy efficiency, and another 50% is required by the next five largest investment opportunities. The largest capital needs are for:
– Improving building energy efficiency. Improving building energy efficiency accounts for over 40% of capital investment in the infrastructure and the built environment system. Investment is needed not only to improve the energy efficiency of the heating, cooling and lighting systems in new buildings, but also to retrofit existing buildings. Retrofitting investments
are particularly large: in most EU countries, half of residential stock was built before the first thermal regulations were introduced in 1970.31 Adopting higher energy efficiency standards is needed to accelerate this transition.32
– Shared infrastructure. Apart from investment in renewables, the largest need for investment in the energy and extractives system is in shared infrastructure. This represents an estimated $130 billion of annual investment, linked to the heavy capital requirements in supporting infrastructure (e.g. energy plants, roads, port facilities).
– Food waste. In the food, land and ocean use system, the largest investment is associated with reducing food waste in the value chain, potentially requiring $55 billion annually. A cold storage system to reduce food waste with a capacity of 30,000 tonnes could have an annualized cost of over $100 million in some geographies.33 To meet targets for the reduction of waste in food handling and storage, over 4,500 such systems could be required.34
Up to $2.7 trillion of annual investment is needed to capture the $10.1 trillion of annual business opportunties associated with the 15 transitions

101New Nature Economy Report II – The Future Of Nature And Business
FROM OPPORTUNITY TO REALITY: CATALYSING ACTION FOR A NATURE-POSITIVE ECONOMYV
The estimated $2.7 trillion annual investment required to support the 15 transitions by 2030 is comparable to the size of the stimulus measures announced in response to COVID-19 crisis, such as the $2.2 trillion measure announced by the United States in March 2020 or the $0.5 trillion in grants proposed for the European Union by the French and German governments in May 2020.
An additional challenge is that many opportunities are in emerging markets. Of the business opportunities identified in the food, land and ocean use system, over half are in Latin America, Africa, India, and low-income countries in the Asia-Pacific. However, in many emerging markets, it is difficult to find investors interested in investing in large- scale opportunities.35
Another challenge is that investments are needed by small and medium-sized enterprises (particularly in the food, land and ocean use system), which often lack direct access to capital markets. Moreover, smaller average investment sizes and novel revenue models may make investment more difficult. Some opportunities require Payment for Ecosystem Services schemes, where beneficiaries of ecosystem services make payments to ecosystem services stewards,36 such as landowners, in return for a guaranteed flow of services over-and-above what would be provided without payment. In many jurisdictions, these models are new, creating perceptions of higher risks and transaction costs.
These challenges are solvable but will require innovations in capital investment processes. Some new approaches are outlined below, but further evidence on their impact potential is needed:37
– Supply chain models. Contractual arrangements between supply chain actors can incentivize sustainability performance and lock in purchases of future sustainable produce. One example is the partnership between Walmart and HSBC, where Walmart’s global suppliers have access to improved financing rates tied to their sustainability performance measured against Walmart’s Sustainability Index Program and Project Gigaton.38 Another example is Fairtrade International’s Premium, which guarantees farmer organizations and communities harvesting cocoa largely in Côte D’Ivoire and Ghana $240 per tonne over the selling price for Fairtrade-certified cocoa.39 In the context of global supply chains disruptions due to COVID-19, there is an opportunity to reshape governments’ and major multinational firms’ support mechanisms for suppliers to
encourage sustainability. This would have multiple benefits: multinational firms would benefit from stronger supply chains and enhanced corporate reputation, suppliers would receive financial support and improve their resilience, and governments would strengthen their economy and make progress on sustainable development targets.
– Shared services. Sharing fixed assets (e.g. equipment, warehouses) reduces capital costs by transforming them into ongoing variable costs. An example is Hello Tractor’s tractor leasing model for smallholder farmers in Africa. The service aggregates smallholder farmers’ requests for tractor services to tractor owners, enabling the smallholder farmers to utilize fixed assets on a usage basis and save significant upfront capital investment, while providing enhanced security through remote asset tracking and virtual monitoring.40
– Blended finance. “Blended finance” is the strategic use of development finance and philanthropic funds to mobilize private capital flows to emerging markets in support of the Sustainable Development Goals.41 There are currently 74 pooled funds and facilities representing $25.4 billion in blended finance assets.42 Blended finance mechanisms can often leverage more financing than traditional development projects can. For instance, the Meloy Fund for Sustainable Community Fisheries is a blended fund that incentivizes the development and adoption of sustainable fisheries through debt and equity investments in Indonesia and the Philippines.43 Working in partnership with Fish Forever, a global fisheries management program, it creates monetizable assets for local fishermen that are accessible to private funding partners. Philanthropic partners provide payments if targets are met. The Seychelles launched the world’s first sovereign blue bond – a new instrument designed to support sustainable marine and fisheries projects.44 The bond seeks to raise $15 million from investors (three to begin with), and grants and loans will be managed by the Seychelles’ Conservation and Climate Adaptation Trust and the Development Bank of Seychelles. It is partially guaranteed by the World Bank and supported by the Global Environment Facility.
The COVID-19 crisis has placed a new importance on rebuilding economies. As of April 2020, a first wave of emergency fiscal stimulus packages has been announced in economies around the world
102New Nature Economy Report II – The Future Of Nature And Business
FROM OPPORTUNITY TO REALITY: CATALYSING ACTION FOR A NATURE-POSITIVE ECONOMYV
to support livelihoods in the face of the pandemic’s impact. An upcoming second wave of stimulus packages is expected to focus on restarting the global economy by investing in primary production, manufacturing, retail, hospitality and other impacted sectors. The question is whether this stimulus will be deployed in a manner that reinforces existing patterns of unsustainable production or will seek to build back better, taking into consideration
biodiversity concerns. This will create important strategic choices. For example, worldwide, 499 gigawatts (GW) of new coal power are planned or already under construction at a cost of $638 billion.45 However, new wind and solar power is already cheaper than 60% of currently operating coal plants. Making the right capital allocation choices can drive both growth and profitability, as well as nature-positive outcomes.
The technologies of the Fourth Industrial Revolution hold substantial promise of enabling nature-positive development. 4Fourth Industrial Revolution technologies will have an important role (either as a key driver or a supporting function) for over 80% of the business opportunities identified in 2030, representing nearly $8.7 trillion in value (Figure 5.3).
Fourth Industrial Revolution technologies have a range of applications across the three systems:
– Food, land and ocean use system. Until recently, the food and agriculture sectors have been slow to harness the power of Fourth Industrial Revolution technologies. For example, agriculture represents 10% of global GDP, but AgTech accounts for only 3.5% of global venture capital funds.46 However, this is changing. Since 2013, food and beverage start-ups have raised $9.5 billion across 2,100 deals globally and the number of investors has doubled.47 A range of technology applications are crucial to increase the production of more-sustainable food. Research by the World Economic Forum and McKinsey & Company identified 12 Fourth Industrial Revolution-related technologies with high potential to transform the sustainability of the food sector.48 One group of technologies aims to improve agricultural production efficiency, including through precision agriculture for water and input use optimization (taking account of soil quality) and microbiome technologies to enhance crop resilience. Other technologies can enhance the monitoring and management of large natural assets. For example, geospatial analytics can be used to monitor deforestation and fishing. In Indonesia, Global Fishing Watch – an alliance of SkyTruth, Oceana and Google Earth Outreach – is collaborating with the Ministry of Marine Affairs and Fisheries to better manage Indonesia’s fisheries. It uses GPS-equipped vessels, big data
Innovation for nature needs to be at the centre of the transformation
analysis, machine learning, cloud computing and visualization techniques to spot illegal fishing activities.49 Global Forest Watch uses satellites and algorithms to track tree cover loss in near real-time. Anyone with a mobile phone and internet connection can now check whether an area of forest as small as a soccer penalty box was cleared anywhere in the world since 2001. Other technologies are being used to monetize the value of biodiversity. New platforms are emerging to track and secure the value of ecosystem products and services. For example, the Amazon Bank of Codes aims to provide an open, global public good and digital platform that registers and maps genetic sequences of Amazonian biodiversity.50 By registering biological and biomimetic intellectual property (IP) assets on blockchain, this code bank will record the provenance, rights and obligations associated with nature’s assets. When value is assigned to assets, smart contracts could facilitate fair benefits sharing to the custodians of the asset and for its protection. Scaling these technologies will require a multistakeholder approach that includes government supporting infrastructure and policy, companies sharing data and intellectual property, and investors and donors providing growth capital.51
– Infrastructure and the built environment system. A range of Fourth Industrial Revolution technologies could enhance biodiversity outcomes in this system. For example, Fourth Industrial Revolution technologies can help reduce construction waste. Building material accounts for half of solid waste generated annually worldwide, with total construction waste globally expected to increase from 1.3 billion tonnes in 2012 to 2.2 billion tonnes in 2025.52 Technologies such as 3D printing and building information modelling can reduce this waste by 30% and 45%, respectively.53,54 Other technologies can be used to support planning processes. For example,

103New Nature Economy Report II – The Future Of Nature And Business
FROM OPPORTUNITY TO REALITY: CATALYSING ACTION FOR A NATURE-POSITIVE ECONOMYV
geospatial technologies can help optimize city planning and long-range infrastructure to minimize biodiversity impacts. “Virtual Singapore”, or Singapore’s digital twin, is a dynamic 3D city model that integrates data from government agencies, the internet, Internet of Things (IoT) devices and sensors to provide a virtual, authoritative platform for urban planning.55 Other Fourth Industrial Revolution technologies aim to reduce infrastructure needs by providing ways to share existing infrastructure better, including online platforms that support co-working.
– Energy and extractives system. Fourth Industrial Revolution technologies can enhance biodiversity outcomes in this system as well, and they can also help improve the efficiency of exploration and extraction to minimize inputs and damage to biodiversity. This includes using advanced analytics and cloud technologies to improve the accuracy of exploration (thus minimizing its impact on land). Other Fourth Industrial Revolution technologies focus on improving resource usage efficiency. IoT, for example, can be used to optimize energy efficiency from production
to consumption. Other technologies focus on enhancing the functionality and diversity of energy systems. Smart grids can enhance the penetration of renewables while maintaining grid stability. Second- and third-generation biofuels such as microalgal biomass are being developed with advanced genetic mapping and analytical tools.56
Most technologies, processes and assumptions underlying Fourth Industrial Revolution technologies rely on the use and flow of data. Increasing information availability and exchange between stakeholders is needed to fully realize Fourth Industrial Revolution potential. Public data together with proprietary data make a powerful combination, particularly when coupled with geospatial technologies. For instance, satellite data combined with public international databases on agricultural yields (e.g. from the Food and Agriculture Organization of the United Nations, or FAO) can be used to optimize crop yields. Similarly, publicly available geospatial and geo-seismic data on water availability and mining deposits can be used to determine priority areas for precision extraction techniques. Microsoft’s Planetary Computer platform is an ambitious example of the kind of approach
FIGURE 5.3
Fourth Industrial Revolution technologies are a key driver or enabler for 87% of all identified business opportunities in 2030
1. Key driver” implies that the opportunity rests entirely on the use of 4IR technologies (e.g. 3D printing, autonomous trucks).2. Enabler” implies that 4IR technologies can be used to pursue business opportunities (e.g. automated waste sorting). 3. Unrelated” implies that 4IR technologies have little-to-no role to play in the success of business opportunities (e.g. restoring degraded land).
SOURCE: AlphaBeta analysis
Total
Role of Industry 4.0 (Fourth Industrial Revolution) by business opportunities by socio-economic systemPercentage of total business opportunities in 20301
Food, land and ocean use
Infrastructure and the built environment
Energy and extractives
Key driver1 Enabler2 Unrelated3
209
9
7
14
6
13798
71
77
87

FROM OPPORTUNITY TO REALITY: CATALYSING ACTION FOR A NATURE-POSITIVE ECONOMYV
104New Nature Economy Report II – The Future Of Nature And Business
The development of data governance and sharing platforms related to biodiversity is far more limited, however, although there are some initiatives that could be scaled up. For example, the Aker group and the World Economic Forum announced in 2019 the establishment of the Centre for the Fourth Industrial Revolution Norway (C4IR Norway), dedicated to harnessing advances in technology to preserve oceans and improve the environmental footprint of ocean industries. 63 The centre’s objectives will include the development of governance frameworks to enable secured data sharing. Similar partnerships are needed in other areas of biodiversity, and there is the potential to incorporate them into existing initiatives such as the Centre for the Fourth Industrial Revolution Network, which has created or piloted almost 20 frameworks or governance protocols.64
We are at a critical juncture for the future of human societies. We are confronting an unprecedented global humanitarian and health crisis in the COVID-19 pandemic while the hour is late to stave off the worst of the climate and nature crisis. A clear commitment to building back better is needed from business, government and individuals, or what fragile pandemic recovery we achieve will lack the resilience provided by nature and we will face ever-increasing climate risks. This report has articulated an action agenda for business to tackle nature loss, prioritizing biodiversity threats, identifying the key transitions needed, and sizing the potential financial upside from taking up concerted business action on the opportunities in front of us. Now is the time to take these insights and implement collective and transformative action.
to data needed to tackle biodiversity loss.57 It aims to provide access to trillions of data points related to biodiversity, collected by people and machines, supported by machine learning tools that provide insights into critical questions from scientists, conservation organizations and businesses (e.g. on tree density, water availability, flood risks etc.). Another example is the Nature Map Earth initiative, which has developed new spatial data on the distribution of species, carbon stocks and clean water.58 This data was integrated using state-of-the-art, multi-criteria decision analysis tools to identify the greatest synergies for conservation and restoration efforts that promote nature-based solutions for climate change mitigation, biodiversity conservation and clean water.
However, effective data governance mechanisms to support the exchange of information and to protect against misuse are lacking.59 Cyberattacks and data fraud are among the top five risks posed to the global economy, with recent events pointing to the use of artificial intelligence to engineer more potent data breaches to critical infrastructure and private information.60 A growing erosion of trust in new technologies also disincentivizes data exchange altogether.61 It is critical to develop data governance mechanisms that protect against these risks and unlock innovation to support nature-positive business opportunities. These mechanisms could be in the form of an agreed-upon set of protocols that enable data to be shared while safeguarding individuals’ privacy and commercially sensitive information.
Private sector models for sharing data already exist with start-ups such as Data Republic, which provides a secure governance framework and technology platform to enable data exchange across sectors.62
105New Nature Economy Report II – The Future Of Nature And Business
FROM OPPORTUNITY TO REALITY: CATALYSING ACTION FOR A NATURE-POSITIVE ECONOMYV
1 Intergovernmental Panel on Biodiversity and Ecosystem Services [IPBES], 2019, Global Assessment Report on Biodiversity and Ecosystem Services of the Intergovernmental Science-Policy Platform on Biodiversity and Ecosystem Services, (Chapters 5 and 6), https://ipbes.net/global-assessment
2 International Resource Panel [IRP], 2020, Building Resilient Societies after the COVID-19 Pandemic: Key Messages from the International Resource Panel, https://www.resourcepanel.org/reports/building-resilient-societies-after-covid-19-pandemic
3 Hepburn, C. et al., 2020, “Will COVID-19 Fiscal Recovery Packages Accelerate or Retard Progress on Climate Change?”, Oxford Review of Economic Policy, 36 (S1), https://www.smithschool.ox.ac.uk/publications/wpapers/workingpaper20-02.pdf
4 HM Treasury, 2020, Interim Report of the independent Review on the Economics of Biodiversity led by Professor Sir Partha Dasgupta, https://www.gov.uk/government/publications/interim-report-the-dasgupta-review-independent-review-on-the-economics-of-biodiversity
5 International Energy Agency [IEA], 2020 “Low Fuel Prices Provide a Historic Opportunity to Phase Out Fossil Fuel Consumption Subsidies”, Paris: IEA, https://www.iea.org/articles/low-fuel-prices-provide-a-historic-opportunity-to-phase-out-fossil-fuel-consumption-subsidies
6 FOLU, 2019, Growing Better, op. cit.
7 World Bank, 2017, The Sunken Billions Revisited: Progress and Challenges in Global Marine Fisheries. Environment and Sustainable Development Series, Washington DC: World Bank.
8 Deppermann, A. et al., 2019, “Towards Sustainable Food and Land-Use Systems: Insights from Integrated Scenarios of the Global Biosphere Management Model (GLOBIOM)”, Laxenburg, Austria: IIASA, http://pure.iiasa.ac.at/id/eprint/16091/1/Deppermann%20et%20al%202019-FOLU-GR-IIASA-Supplementar-Paper_final.pdf
9 European Commission, 2018, “Palm Oil and Public Procurement”, GPP 2 (July 2018), http://ec.europa.eu/environment/gpp/pdf/news_alert/Issue_82_Article.pdf
10 FOLU, 2019, Growing Better, op. cit.
11 Cadena, M. et al., 2019, “Nature Is Counting on Us: Mapping Progress to Achieve the Convention on Biological Diversity”, Unpublished discussion paper, UNDP.
12 Locke, H. et al., 2019. “Three Global Conditions for Biodiversity Conservation and Sustainable Use: An Implementation Framework”, Proceedings of the National Science Council, 6, 10. https://doi.org/10.1093/nsr/nwz136
13 Gao, J., 2019, “How China Will Protect One-Quarter of Its Land”, Nature, 21 May 2019, https://www.nature.com/articles/d41586-019-01563-2
14 See e.g. Business for Nature, “Businesses Need Leaders to Act on Nature”, https://www.businessfornature.org/policy
15 Thomson, E. and S. Rogerson, 2020, Forest 500 Annual Report 2019 – The Companies Getting It Wrong on Deforestation, Oxford, UK: Global Canopy.
16 World Economic Forum, 2020, Nature Risk Rising: Why the Crisis Engulfing Nature Matters for Business and the Economy, https://www.weforum.org/reports/nature-risk-rising-why-the-crisis-engulfing-nature-matters-for-business-and-the-economy
17 Barbier, E. B. and J. C. Burgess, 2018, “Policies to Support Environmental Risk Management in Investment Decisions”, International Journal of Global Environmental Issues, 17 (2/3), 117–29.
18 Business Roundtable, 2019, “Business Roundtable Redefines the Purpose of a Corporation to Promote ‘An Economy That Serves All Americans’”, https://www.businessroundtable.org/business-roundtable-redefines-the-purpose-of-a-corporation-to-promote-an-economy-that-serves-all-americans; see also Fink, L., 2019, A Fundamental Reshaping of Finance, https://www.blackrock.com/us/financial-professionals/larry-fink-ceo-letter; and Schwab, K., 2019, Davos Manifesto 2020: The Universal Purpose of a Company in the Fourth Industrial Revolution, https://www.weforum.org/agenda/2019/12/davos-manifesto-2020-the-universal-purpose-of-a-company-in-the-fourth-industrial-revolution/
19 Tropical Forest Alliance [TFA], 2018, “The State of the Supply Chain Movement: Progress on Corporate Commitments and Impact at the Forest Frontier”, in The Sprint to 2020: TFA 2020 Annual Report 2018, https://www.tropicalforestalliance.org/assets/Uploads/Sprint_to_2020_Annual-Report-2018.pdf
20 For further details, see https://sciencebasedtargets.org/
21 Multistakeholder platforms bring together representatives from different interest groups and sections of society (e.g. business, government, civil society organizations, academia, consumers etc.) to discuss shared challenges, opportunities, policy actions and advocacy strategies.
22 GIIC was launched at COP 21. See Green Infrastructure Investment Coalition [GIIC], 2020, “What We Do”, http://www.giicoalition.org/what-we-do
23 For further details, see https://www.weforum.org/covid-action-platform
24 TFA, 2018, Emerging Market Consumers and Deforestation: Risks and Opportunities of Growing Demand for Soft Commodities in China and Beyond, World Economic Forum, https://www.tropicalforestalliance.org/assets/Uploads/47530_Emerging-markets_consumers_and_deforestation_report_2018.pdf
Endnotes

106New Nature Economy Report II – The Future Of Nature And Business
FROM OPPORTUNITY TO REALITY: CATALYSING ACTION FOR A NATURE-POSITIVE ECONOMYV
25 Tropical Forest Alliance, 2018, Emerging Market Consumers & Deforestation: Risks and Opportunities of Growing Demand for Soft Commodities In China & Beyond, World Economic Forum, https://www.tropicalforestalliance.org/assets/Uploads/47530_Emerging-markets_consumers_and_deforestation_report_2018.pdf
26 A “river delta” is a landform created by deposition of sediment that is carried by a river as the flow leaves its mouth and enters slower-moving or stagnant water. This occurs where a river enters an ocean, sea, estuary, lake, reservoir, or (more rarely) another river that cannot carry away the supplied sediment.
27 WWF International, no date, “Challenges in the Greater Mekong – Hydropower And Infrastructure Development”, http://greatermekong.panda.org/challenges_in_the_greater_mekong/infrastructure_development_in_the_greater_mekong/; and Smajgl, A. et al., 2015, “Responding to Rising Sea Levels in the Mekong Delta”, Nature Climate Change, 5, 167–74, https://www.nature.com/articles/nclimate2469
28 McKinsey Global Institute, 2011, Urban World: Mapping the Economic Power of Cities, https://www.mckinsey.com/featured-insights/urbanization/urban-world-mapping-the-economic-power-of-cities
29 ASEAN Secretariat, 2018, ASEAN Sustainable Urbanisation Strategy, https://asean.org/?static_post=asean-sustainable-urbanisation-strategy
30 This estimate excludes supporting investments not directly related to the business opportunities. For example, investment in green corridors in urban spaces may be crucial to support the development of sustainable cities but is not linked to a business opportunity.
31 European Commission, “Building Stock Characteristics”, https://ec.europa.eu/energy/eu-buildings-factsheets-topics-tree/building-stock-characteristics_en
32 IEA, 2019, Tracking Buildings 2019: Tracking Report, https://www.iea.org/reports/tracking-buildings
33 McKinsey Global Institute, 2011, Resource Revolution: Meeting the World’s Energy, Materials, Food, and Water Needs, November 2011, https://www.mckinsey.com/business-functions/sustainability/our-insights/resource-revolution
34 Not indicative of actual investment required associated with this business opportunity.
35 Boynton, P., 2019, “Sub-Saharan Africa’s Struggle to Attract Impact Investment”, Financial Times, https://www.ft.com/content/18752b94-c8d1-11e9-a1f4-3669401ba76f
36 UK Department for Environment and Rural Affairs, 2019, Payments for Ecosystem Services: A Best Practice Guide, https://www.cbd.int/financial/pes/unitedkingdom-bestpractice.pdf
37 For discussion of the evidence gap, see for example Caio, C., 2019, “The Impact of Blended Finance: What We Don’t Know and How to Fix It”, Development Initiatives Blog, 11 October 2019, https://devinit.org/blog/blog-blended-finance-impact/
38 HSBC, 2020, “HSBC and Walmart Partner to Drive Sustainability of Businesses”, HSBC, https://www.business.hsbc.com/sustainability/hsbc-and-walmart-partner-to-drive-sustainability-of-businesses
39 Meyers, A., 2018, “Fairtrade to Increase its Minimum Price for Cocoa and Farmers’ Premium Payments”, Confectionery News, 3 December 2018, https://www.confectionerynews.com/Article/2018/12/03/Fairtrade-to-increase-its-Minimum-Price-for-cocoa-and-farmers-Premium-payments
40 See https://www.hellotractor.com/about-us/
41 World Economic Forum, no date, Blended Finance Vol. 1: A Primer for Development Finance and Philanthropic Funders, http://www3.weforum.org/docs/WEF_Blended_Finance_How_To_Guide.pdf
42 Organisation for Economic Co-opeartion and Development [OECD] and World Economic Forum, 2016, Insights from Blended Finance Investment Vehicles and Facilities, http://www3.weforum.org/docs/WEF_Blended_Finance_Insights_Investments_Vehicles_Facilities_report_2016.pdf
43 The Meloy Fund, 2019, “About the Fund”, https://www.meloyfund.com/about
44 World Bank, 2018, “Seychelles Launches World’s First Sovereign Blue Bond”, https://www.worldbank.org/en/news/press-release/2018/10/29/seychelles-launches-worlds-first-sovereign-blue-bond
45 Carbon Tracker, 2020, “Coal Developers Risk $600 Billion as Renewables Outcompete Worldwide”, https://carbontracker.org/coal-developers-risk-600-billion-as-renewables-outcompete-worldwide/
46 Business & Sustainable Development Commission, 2017, Better Business Better World, http://report.businesscommission.org/
47 Watrous, M., 2018, “Venture Capital Investing in Food Accelerating”, Food Business News, 7 July 2018, https://www.foodbusinessnews.net/articles/12060-venture-capital-investing-in-food-accelerating
48 World Economic Forum, 2018, Innovation with a Purpose: The Role of Technology Innovation in Accelerating Food Systems Transformation, http://www3.weforum.org/docs/WEF_Innovation_with_a_Purpose_VF-reduced.pdf
49 AlphaBeta, 2017, The Economic Impact of Geospatial Services, https://www.alphabeta.com/wp-content/uploads/2017/09/GeoSpatial-Report_Sept-2017.pdf
50 More information is available at https://earthbankofcodes.worldsecuresystems.com/
51 World Economic Forum, 2018, Innovation with a Purpose, op. cit.
52 Transparency Market Research, Construction Waste Market - Global Industry Analysis, Size, Share, Growth, Trends, and Forecast 2017 – 2025, https://www.transparencymarketresearch.com/construction-waste-market.html

107New Nature Economy Report II – The Future Of Nature And Business
FROM OPPORTUNITY TO REALITY: CATALYSING ACTION FOR A NATURE-POSITIVE ECONOMYV
53 Ghaffar, S. H. et al., 2018, ”Additive Manufacturing Technology and Its Implementation in Construction as an Eco-Innovative Solution”, Automation in Construction, 93 (September 2018), 1–11, https://www.sciencedirect.com/science/article/pii/S0926580517309731
54 McKinsey & Company, 2019, Modular Construction: From Projects to Products, https://www.mckinsey.com/industries/capital-projects-and-infrastructure/our-insights/modular-construction-from-projects-to-products
55 Narain, A., 2018, “Geospatial Initiatives Lay Foundation for Singapore’s Smart Nation”, Geospatial World, 13 July 2018, https://www.geospatialworld.net/blogs/singapores-smart-nation/
56 Li-Beisson, Y. and G. Peltier, 2013, “Third-Generation Biofuels: Current and Future Research on Microalgal Lipid Technology” OCL, 20 (6), D606, https://www.researchgate.net/publication/273754072_Third-generation_biofuels_current_and_future_research_on_microalgal_lipid_technology
57 Further information about Microsoft’s Planetary Computer is available at Smith, B., 2020, “A Health Society Requires a Healthy Planet”, Official Microsoft Blog, 15 April 2020, https://blogs.microsoft.com/blog/2020/04/15/a-healthy-society-requires-a-healthy-planet/
58 Further information on the Nature Map Earth initiative, a joint development by the International Institute for Applied Systems Analysis [IIASA], the UN Sustainable Development Solutions Network (SDSN), and the UN Environment World Conservation Monitoring Center [UNEP-WCMC], is available at https://naturemap.earth/assets/files/Nature%20Map%20Earth_summary%20&%20FAQs.pdf
59 “Data governance” is the process of managing the availability, usability, integrity and security of data, based on internal data standards and policies that also control data usage. SearchDataManagement, 2018, “Definition: What Is Data Governance and Why Does It Matter?”, https://searchdatamanagement.techtarget.com/definition/data-governance
60 World Economic Forum, 2019, The Global Risks Report 2019 – 14th Edition, http://www3.weforum.org/docs/WEF_Global_Risks_Report_2019.pdf
61 World Economic Forum, 2020, “To Protect Trust in the 4IR, We Need to Become Experts in Distrust”, https://www.weforum.org/agenda/2020/02/trust-is-the-lubricant-of-the-4ir/
62 Data Republic, 2020, “About Us”, https://www.datarepublic.com/company/about-us
63 World Economic Forum, 2019, “World Economic Forum and Aker Group Announce Technology Centre for Ocean and Environment”, Press Release, 24 September 2019. https://www.weforum.org/press/2019/09/world-economic-forum-and-aker-group-announce-technology-centre-for-ocean-and-environment/
64 World Economic Forum, 2020, “More than 20 Governance Protocols Created or Piloted to Accelerate Impact in the Fourth Industrial Revolution”, Press Release, 24 January 2020, https://www.weforum.org/press/2020/01/up-to-20-governance-protocols-created-or-piloted-to-accelerate-impact-in-the-fourth-industrial-revolution/

108New Nature Economy Report II – The Future Of Nature And Business
The World Economic Forum would like to thank the Gordon and Betty Moore Foundation, MAVA Foundation and the Government of Canada. The Forum would also like to acknowledge the valuable contributions of the following people in the development of this document:
Acknowledgements
World Economic ForumAkanksha Khatri Head of Nature Action Agenda
Marco Albani Senior External Adviser, New Nature Economy
Alexia SemovProject Specialist, New Nature Economy Report
Editing and DesignJanet HillHead of Editing
Floris LandiDesign Lead
AlphaBetaFraser ThompsonFounder and Managing Director
Shivin KohliConsultant
Global Future Council on Biodiversity Chair: Carlos Manuel Rodriguez Echandi, Ministry of Environment and Energy of Costa RicaMembers: Carlos Afonso Nobre, Director, Research, Brazilian Academy of Sciences; Dimitri de Boer, Chief Representative, China, Client Earth; Edward Barbier, University Distinguished Professor, Department of Economics, Colorado State University; Seema Arora, Deputy-Director General, Confederation of Indian Industry (CII); Jamie Cross, Vice-President Partner Marketing, Conservation International (CI), USA; Sebastian Troëng, Executive Vice-President, Global Conservation, Conservation International (CI), USA; Per Fredrik Ilsaas Pharo, Director, International Climate and Forest Initiative, Government of Norway; Robert Watson, Chair of the Fourth IPBES Plenary, Intergovernmental Panel on Biodiversity Ecosystem Services (IPBES); Helen Crowley, Fellow and Senior Advisor, Resilient Supply Chains; Cameron Hepburn, Director and Professor of Environmental Economics, Smith School of Enterprise and the Environment (SSEE), UK; Guido Schmidt-Traub, Executive Director, UN Sustainable Development Solutions Network; Aoife Bennett, Extraordinary Research Scholar, Universidad Nacional Intercultural de la Amazonía, Peru; Diane Banino Holdorf, Managing Director, Food and Nature, World Business Council for Sustainable Development (WBCSD); Corli Pretorius, Deputy Director, World Conservation Monitoring Centre, United Nations Environment Programme (UNEP); Fang Li, Chief Representative, China, World Resources Institute (WRI); Li Lin, Director, Global Policy and Advocacy, WWF International
Nature Action Agenda Steering CommitteeM. Sanjayan, Chief Executive Director, Conservation International (CI); Seema Arora, Deputy Director General, Confederation of Indian Industry (CII); Nigel Topping, High-Level Climate Action Champion for the United Kingdom, COP26; Aileen Lee, Chief Programme Officer for Environmental Conservation, Gordon and Betty Moore Foundation; Paul Polman, Co-Founder, IMAGINE; Diane Banino Holdorf, Managing Director, Food and Nature, World Business Council for Sustainable Development (WBCSD); Andrew Steer, President and Chief Executive Officer, World Resources Institute (WRI), Marco Lambertini, Director General, WWF International
ContactFor questions about the New Nature Economy series of publications, contact: Akanksha Khatri ([email protected]) and Alexia Semov ([email protected])

109New Nature Economy Report II – The Future Of Nature And Business
Experts consultedThanks also go to the many, leading academic, industry, NGO and government agency experts who provided invaluable perspectives
Alan Knight, Corporate Responsibility – General Manager, ArcelorMittal
Annik Dollacker, Head of Biodiversity and Ecosystem Services in Regulatory Policy, Bayer AG
Eva Zabey, Executive Director, Business for Nature
Kingsmill Bond, Energy Strategist, Carbon Tracker Initiative
Taryn Barclay, Senior Director, Strategic Partnerships and Stakeholder Relations, Cargill
Jia Kejing, Director, Research Professor, Chinese Academy of Land Survey and Planning of China, Ministry of Natural Resources
Liu Jingru, Research Professor, Research Centre of Ecological and Environmental Sciences, Chinese Academy of Sciences
Li Junsheng, Director Research Professor, Institute of Ecology, Chinese Academy of Environment Sciences, Ministry of Ecology and Environment
Yi Wang, Vice President, Institutes of Science and Development, Chinese Academy of Sciences and Member of Standing Committee of National People’s Congress of China
Ouyang Zhiyun, Director General, Research Professor, Research Centre of Ecological and Environmental Sciences, Chinese Academy of Sciences
Robert Adams, Director, City Design and Projects, City of Melbourne
Robin Abell, Freshwater Lead, Conservation International
Emily Corwin, Green-Gray Infrastructure Fellow, Conservation International
Bronson Griscom, Senior Director, Natural Climate Solutions, Conservation International
Emily Pidgeon, Senior Director of Strategic Marine Initiatives, Conservation International
Alice Durand-Reville, Corporate Public Affairs and International Partnerships Director, Danone
Alex Pfaff, Professor in the Sanford School of Public Policy, Duke University
Zou Ji, President, Energy Foundation Beijing Office
Miguel Lisazo, Scientific Officer, European Commission
Nikos Zampoukas, Water Resources Unit, Joint Research Centre, European Commission
Zheng Sixian, Programme Officer, Forestry and Grassland Administration, China
Zhou Yiqi, Senior Manager, Partner Relations and Cooperation, GiZ China
Randall Krantz, Senior Project Adviser on Decarbonizing Shipping, Global Maritime Forum
Tejashree Joshi, Associate General Manager (Environment and Sustainability), Godrej and Boyce Manufacturing Co.
Eduardo Brondizio, Distinguished Professor, Anthropology, Indiana University Bloomington
Lauren Ashbrook, Manager, Corporate Development, Indigo Ag
Aidan Davy, Chief Operating Officer, International Council for Mining and Metals
Gerard Bos, Director, Business and Biodiversity Programme, International Union for Conservation of Nature
Harvey Locke, Chair, Beyond the Aichi Targets Task Force, International Union for Conservation of Nature – World Commission on Protected Areas
Radhika Murti, Director, Global Ecosystem Management Programme, International Union for Conservation of Nature
Sunita Purushottam, Head of Sustainability, Mahindra Lifespace Developers Ltd.
Melissa Pinfield, Senior Fellow, Meridian Institute
Yao Lin, Associate Professor, Chinese Academy of Natural Resources Economics, Ministry of Natural Resources, China
Zhang Xinan, President and Research Professor, Chinese Academy of Natural Resources Economics, Ministry of Natural Resources, China
Marcelo Bicalho Behar, Vice-President, Sustainability and Group Affairs, Natura & Co
Yang Fuqiang, Senior Adviser on Climate and Energy, China Program, Natural Resources Defense Council
Florence Jeantet, Managing Director, One Planet Business for Biodiversity
Hazem Galal, Global Leader, Cities and Local Government, PwC
Theresa Ott, Chief Adviser, Environment, Rio Tinto
Erin Billman, Executive Director, Science-Based Targets Network Council
Basile van Havre, Co-Chair, Open Ended Working Group on Post-2020 Global Biodiversity Framework, Secretariat of the Convention on Biological Diversity

110New Nature Economy Report II – The Future Of Nature And Business
Elizabeth Mrema, Acting Executive Secretary, Secretariat of the Convention on Biological Diversity
Gotz Martin, Head of Sustainability Implementation, Sinarmas Agribusiness and Food
Zhang Li, Secretary General, SEE Foundation
Scarlett Benson, Programme Manager, Food and Land Use Coalition, SYSTEMIQ
Jeremy Oppenheim, Founder and Managing Partner, SYSTEMIQ
Anna Stanley, Project Lead, Natural Capital and Biodiversity, SYSTEMIQ
Pankaj Satija, Chief Regulatory Affairs, Tata Steel
Robin Sidsworth, Corporate Counsel, Teck Resources
Edward Pollard, Technical Director, The Biodiversity Consultancy
Helen Temple, Chief Executive Officer, The Biodiversity Consultancy
Andrew Deutz, Director of Global Policy, Institutions and Conservation Finance, The Nature Conservancy
Michael Doane, Global Managing Director for Sustainable Food and Water, The Nature Conservancy
Bruce McKenney, Director for Strategic Initiatives, Energy and Infrastructure, The Nature Conservancy
Heather Tallis, Global Managing Director and Lead Scientist for Strategy Innovation, The Nature Conservancy
Dr. Nan ZENG, Conservation Science Specialist, The Nature Conservancy
Francis Meri Sabino Ogwal, National Focal Point, National Environment Management Authority, Uganda Government
Jonathan Hughes, Chief Executive Officer, UN Environment Programme – World Conservation Monitoring Centre
Matt Jones, Head of Programme, Business and Biodiversity, UN Environment Programme – World Conservation Monitoring Centre
Jonty Knox, Senior Programme Officer, Business and Biodiversity, UN Environment Programme – World Conservation Monitoring Centre
Katie Leach, Senior Programme Officer, Business and Biodiversity, UN Environment Programme – World Conservation Monitoring Centre
Manuel Barange, Director, Fisheries and Aquaculture Policy and Resources Division, UN Food and Agricultural Organisation
Georgina Mace, Professor of Biodiversity and Ecosystems, University College London
Michael Beck, Research Professor, institute of Marine Sciences, University of California Santa Cruz
Roberto Schaeffer, Researcher, Energy Planning Programme, Universidade Federal do Rio de Janeiro
Lisa Schulte-Moore, Professor, Natural Resource Ecology and Management, University of Iowa
Stephen Polasky, Regents Professor and Fesler-Lampert Professor of Ecological/Environmental Economics, University of Minnesota
Justin Adams, Executive Director, Tropical Forest Alliance and co-director Nature-Based solutions, World Economic Forum
Saswati Bora, Head of Food Systems Innovation, World Economic Forum
Emily Farnworth, Head of Climate Change, World Economic Forum
Antonia Gawel, Head, Circular Economy and Innovation, Member of the Executive Committee, World Economic Forum
Kimberly Nicole Pope, Project and Community Lead, Nature Action Agenda, World Economic Forum
Nicole Schwab, Co-director Nature-Based Solutions, World Economic Forum
Lisa Sweet, Head of Business Strategy and Engagement, Centre for Public Goods, World Economic Forum
Kristian Teleki, Director, Friends of Ocean Action, World Economic Forum; Director, Sustainable Ocean Initiative, World Resources Institute
Chunquan Zhu, Head of Nature Initiatives & Tropical Forest Alliance, China, World Economic Forum
Fang Li, Chief Representative, Beijing Representative Office, World Resources Institute China
Fu Xiaotian, Associate, Water/Sustainable Cities, World Resources Institute China
Min Yuan, Research Associate, Energy, World Resources Institute, China
Gavin Edwards, Global Coordinator, New Deal for Nature & People 2020, WWF International
Karen Ellis, Director of Sustainable Economy, WWF UK
Toby Roxburgh, Head of Sustainable Economic Policy, WWF UK
Anu Paasiaro, Director, Global Initiatives, Strategy and Business Development, Yara International

World Economic Forum91-93 route de la CapiteCH-1223 Cologny/GenevaSwitzerland
Tel.: +41 (0)22 869 1212Fax: +41 (0)22 786 2744
The World Economic Forum, committed to improving the state of the world, is the International Organization for Public-Private Cooperation. The Forum engages the foremost political, business and other leaders of society to shape global, regional and industry agendas.