Embed Size (px)
Citation preview

NEW MARKETS TAX CREDIT (NMTC) PROGRAM EVALUATION
FINAL REPORT
Martin D. Abravanel Nancy M. Pindus
Brett Theodos Kassie Bertumen
Rachel Brash Zach McDade
Prepared for
U.S. Department of the Treasury Community Development Financial Institutions (CDFI) Fund
APRIL 2013

New Markets Tax Credit (NMTC)
Program Evaluation
Final Report
Martin D. Abravanel Nancy M. Pindus
Brett Theodos Kassie Bertumen
Rachel Brash Zach McDade
With the assistance of:
Randy Rosso Tim Triplett
Ashley Williams Doug Wissoker
The Urban Institute Metropolitan Housing and Communities Policy Center
2100 M Street, NW Washington, DC 20037
Prepared for: U.S. Department of the Treasury
Community Development Financial Institutions (CDFI) Fund 1801 L Street, NW
6th Floor Washington, DC 20036
April 2013
Contract No. GS-23F-8198H, Task Order TPD-CDF-07-K-00016
UI Project No. 07112-031-00

ACKNOWLEDGMENTS This report would not have been possible without the voluntary cooperation and
participation of representatives of many Community Development Entities (CDEs), Qualified Active Low-Income Businesses (QALICBs), investor entities, local community and economic development agencies, and other organizations that responded to surveys or were interviewed as part of the program evaluation. The authors also thank the following staff of the Community Development Financial Institutions Fund (CDFI) of the U.S. Department of the Treasury for their guidance and thoughtful input throughout the project: Jim Greer, Greg Bischak, and Oscar Gonzales; as well as Joe Valenti, formerly of the CDFI Fund. Likewise, consultants John Caskey, Robinson Hollister, Michael Rich, Julia Sass Rubin, Ken Temkin, and Sean Zielenbach provided valuable and insightful advice at many points during the evaluation, and offered important comments on an initial draft of this report. Finally, the authors are indebted to Dr. Bohne Silber, president and CEO of Silber & Associates, for her superb support in conducting the online surveys that are a significant part of this report.
The nonpartisan Urban Institute publishes studies, reports, and books on timely topics worthy of public consideration. The views expressed are those of the authors and should not be attributed to the Urban
Institute, its trustees, or its funders, including the funder of this study, the Community Development Financial Institutions (CDFI) Fund, U.S. Department of the Treasury.

NEW MARKETS TAX CREDIT (NMTC) PROGRAM EVALUATION
i
CONTENTS Acknowledgments _____________________________________________________ iii
Contents ______________________________________________________________ i
Abstract _____________________________________________________________ iv
Executive Summary _____________________________________________________ v
Section I: Background ___________________________________________________ 1
1. Introduction _________________________________________________________ 2
A Brief Overview of the NMTC Program ________________________________________ 2
Evaluation Purpose _________________________________________________________ 2
Evaluation Approach ________________________________________________________ 3
Underlying Concepts ________________________________________________________ 4
Key Research Questions _____________________________________________________ 4
2. NMTC Program Objectives, Status, And Operations __________________________ 8
Core Objective _____________________________________________________________ 8
Theoretical Basis ___________________________________________________________ 9
Ancillary Objectives ________________________________________________________ 10
Program Status and Evolution _______________________________________________ 11
How the NMTC Program Works ______________________________________________ 14
3. Methodology and Data Sources _________________________________________ 22
Background and Preparatory Research _______________________________________ 22
Administrative and Secondary Data __________________________________________ 23
Primary Data Collection _____________________________________________________ 24
Statistical and Analytical Considerations ______________________________________ 29
Limitations and Constraints _________________________________________________ 31
Section II: Project Initiation and Financing ___________________________________ 33
Introduction to Section II ________________________________________________ 34
4. Project Attributes ____________________________________________________ 35
Project Types _____________________________________________________________ 35
Program Targeting _________________________________________________________ 36

NEW MARKETS TAX CREDIT (NMTC) PROGRAM EVALUATION
ii
Assessment Considerations _________________________________________________ 38
Evidence _________________________________________________________________ 39
Summary _________________________________________________________________ 49
5. Project Progression and Participant Attributes ______________________________ 50
Project Progression ________________________________________________________ 52
Roles and Characteristics of Project Participants _______________________________ 60
Summary _________________________________________________________________ 69
6. NMTC Project Financing ______________________________________________ 72
Total Project Size __________________________________________________________ 74
Types of Investments Involved, and Their Rates and Terms ______________________ 76
Leveraging Other Financing Sources _________________________________________ 80
Fees and Deal Costs _______________________________________________________ 84
Credit Pricing Considerations _______________________________________________ 86
Summary _________________________________________________________________ 88
7. The Role of NMTCs in Bringing Projects to Fruition _________________________ 89
Rationale for Considering the Need for Public Support __________________________ 89
Assessment Considerations _________________________________________________ 90
Project Examples __________________________________________________________ 94
Evidence Regarding the Role of NMTCs _______________________________________ 96
Project Attributes and the Need for NMTCs to Bring Projects to Fruition ____________ 97
Summary ________________________________________________________________ 103
Section III: Project Outputs and Outcomes _________________________________ 105
Introduction to Section III _______________________________________________ 106
8. Jobs Outcomes ____________________________________________________ 109
Interest in Jobs Production as an Outcome ___________________________________ 109
Conceptual and Measurement Issues ________________________________________ 110
Data Collection for NMTC Jobs _____________________________________________ 113
The Costs of Producing Jobs _______________________________________________ 114
Evidence ________________________________________________________________ 115
Summary ________________________________________________________________ 122
9. Construction and Rehabilitation Outputs and Outcomes _____________________ 123

NEW MARKETS TAX CREDIT (NMTC) PROGRAM EVALUATION
iii
Expectations Regarding Real Estate Outputs and Outcomes ____________________ 123
Output and Outcome Metrics _______________________________________________ 124
Assessment Considerations ________________________________________________ 125
Evidence ________________________________________________________________ 126
Summary ________________________________________________________________ 132
10. Other Project Outcomes _____________________________________________ 134
Creation of Amenities, Services, and Facilities ________________________________ 134
Support for Small Businesses and Nonprofit Organizations _____________________ 142
Enhancement of Local Tax Bases ___________________________________________ 146
11. Area-wide Outcomes _______________________________________________ 151
Expectations Regarding Area-wide Outcomes _________________________________ 151
Assessment Considerations ________________________________________________ 152
Potential for Area-wide Outcomes ___________________________________________ 153
Achievement of Area-wide Outcomes ________________________________________ 155
Summary ________________________________________________________________ 159
Section IV: Evaluation Synthesis _________________________________________ 160
Introduction to Section IV _______________________________________________ 161
12. Project Outcome and Output Patterns __________________________________ 162
13. Conclusion And Research Implications _________________________________ 169
Administrative Data _______________________________________________________ 169
Research Needs __________________________________________________________ 170
References __________________________________________________________ 172
List of Acronyms ______________________________________________________ 179

NEW MARKETS TAX CREDIT (NMTC) PROGRAM EVALUATION
iv
ABSTRACT The New Markets Tax Credit (NMTC) program encourages new or increased investment in low-income areas by permitting institutions or individuals to receive federal income tax credits for making equity investments in specialized financial institutions known as Community Development Entities (CDEs). CDEs, in turn, make debt or equity investments in primarily nonresidential operating businesses and real estate projects carried out by new or existing for-profit or nonprofit entities, referred to as Qualified Active Low-Income Community Businesses (QALICBs). The program was authorized by the Community Renewal Tax Relief Act of 2000 (Public Law 106-554) and is jointly administered by the U.S. Department of the Treasury’s Community Development Financial Institutions (CDFI) Fund and the Internal Revenue Service (IRS).
The CDFI Fund contracted with the Urban Institute to conduct this first formal evaluation of the NMTC program. Intended to be national and program-wide in scope, it focuses on program design, execution, outputs, and ou tcomes. The objectives are to provide policymakers with information needed to assess the program’s performance; give program administrators and participants useful information for improving the program; and inform and educate the general public with respect to what the NMTC program is, how it works, and what it accomplishes. Information collection was limited to projects that were initiated as of December 2007.
In its early years, the NMTC program operated as intended—encouraging investments in low-income areas for a di verse range of community and ec onomic development projects, with varying results. The most prevalent results were provision of advantageous financing, real estate development in low-income areas, additions to local tax bases, and j ob creation or retention. NMTC projects also added t o or expanded community amenities, services, and facilities and supported small businesses and organizations. And, as would be expected with a new program and financing tool intended to encourage investment in low-income communities, projects varied with respect to the kinds of outputs and ou tcomes with which they were associated, the need for a public subsidy, and project viability.

NEW MARKETS TAX CREDIT (NMTC) PROGRAM EVALUATION
EXECUTIVE SUMMARY The federal government’s New Markets Tax Credit (NMTC) program encourages new or
increased investment in low-income areas by permitting institutions or individuals to receive federal income tax credits for making equity investments in specialized financial institutions known as Community Development Entities (CDEs). CDEs, in turn, make debt or equity investments in primarily nonresidential operating businesses and real estate projects carried out by new or existing for-profit or nonprofit entities—referred to as Qualified Active Low-Income Community Businesses (QALICBs). The program was authorized by the Community Renewal Tax Relief Act of 2000 (Public Law 106-554) and is jointly administered by the U.S. Department of the Treasury’s Community Development Financial Institutions (CDFI) Fund and the Internal Revenue Service (IRS).
It is important to understand that the NMTC program . . .
… is a public-private partnership.
The federal government, through the IRS, promulgates regulations for the program and, through the CDFI Fund, certifies CDEs, competitively allocates tax credits to them, and monitors their activities. CDEs, which are private entities, select projects/QALICBs in
which to invest, locate potential investors, work with QALICBs to structure their investments so they are consistent with the federal tax code and IRS program regulations, and report back to the CDFI Fund on their investments. The program is sufficiently complex that CDEs and QALICBs generally require the support of highly specialized legal and accounting resources to pull together projects.
… was designed to be flexible.
Recognizing that local needs vary, the NMTC program is flexible with respect to the nature of the projects in which investments are made. The projects can range widely to include commercial, industrial, retail, manufacturing, or mixed uses, as well as community
facilities such as those providing cultural enrichment (like museums), child care, health care, or educational services. Projects can be in metropolitan or nonmetropolitan areas as long as the census tracts in which they are sited meet the program’s definition of low income.
… has invested in many projects.
Between 2002 and 2010, the CDFI Fund made 664 awards to 350 CDEs, allocating $12.9 billion in tax credits in nine separate allocation rounds. These allocations are typically described by the CDFI Fund not in terms of tax credits, but as “allocation authority”
that over the same time frame totaled $33 billion.1 Through the end of the federal government’s fiscal year 2010, the latest point for which administrative data on NMTC projects are available,
1 “Allocation authority” or “tax credit authority” refers to the amount of investment on which investors can claim a federal income tax credit of 39 percent. Other federal tax credits, such as Low Income Housing Tax Credits (LIHTCs), are typically described in terms of the amount of tax credits provided. To avoid confusion, this report presents both figures, with the tax credit amount notable for being the potential cost of the program borne by the federal government.
v

NEW MARKETS TAX CREDIT (NMTC) PROGRAM EVALUATION
vi
3,060 projects had received NMTC investments. For these projects, a total of $2.2 billion in tax credits had been claimed by investors as of 2009, with the remaining credits eligible to be claimed in future years.
PROGRAM EVALUATION
The CDFI Fund contracted with the Urban Institute to conduct this first formal evaluation of the NMTC program. Intended to be national and program-wide in scope, it focuses on program design, execution, outputs, and outcomes for both accountability and program improvement purposes. The objectives are to provide policymakers with information needed to assess the program’s performance; give program administrators and participants useful information for improving the program; and inform and educate the general public with respect to what the NMTC program is, how it works, and what it accomplishes.
DATA SOURCES
The evaluation sought to identify and report on actual project outputs and outcomes as distinct from NMTC program participants’ intentions, objectives, or projections when initiating projects. Information collection was limited to samples drawn from the universe of 2,031 projects that had commenced early in the program’s history—those that used tax credits from the first four of nine allocation rounds (2002 through 2006) and that had been initiated as of December 2007. The emphasis on early-year projects was to allow sufficient time for them to have been completed and for actual outputs and outcomes to have become apparent. Existing administrative and secondary data relevant to the program were used, and extensive amounts of new data were collected through the following means:
Project Interviews
In-depth telephone interviews were conducted with representatives of CDEs, QALICBs, investors, and/or other key parties to NMTC projects. A random sample of 80 early-year projects was drawn, and interviews were obtained for 70 of them—a project-level response rate of 88 percent. The interviews were used to obtain detailed information about each project from multiple perspectives. Projects were the units of analysis.
QALICB Survey
An online survey was conducted with representatives of a separate random sample of 318 QALICBs that participated in early-year projects. A total of 176 questionnaires were completed—a response rate of 55 percent. Again, projects were the units of analysis.
Local Officials Survey
An online survey was conducted of a random sample of 380 community and economic development specialists based in localities in which at least one NMTC project had been initiated, from any allocation round between 2002 and 2007. A total of 309 questionnaires were completed—a response rate of 81 percent.

NEW MARKETS TAX CREDIT (NMTC) PROGRAM EVALUATION
vii
KEY FINDINGS
In its early years, the NMTC program operated as intended—encouraging investments in low-income areas for a diverse range of community- and economic-development projects associated with varying results. The most prevalent results were provision of advantageous financing, real estate development in low-income areas, additions to local tax bases, and job creation or retention. NMTC projects also added to or expanded community amenities, services, and facilities and supported small businesses and organizations. All but one of the seventy projects included in the telephone interview sample had been completed at the time of the interviews. Most were still operating as initially planned under their original ownership, but five had ceased operations.
As is generally the case with programs operating within dynamic community- and economic-development contexts, some outcomes are especially difficult to measure and assess, and some cannot be attributed directly or solely to the NMTC program. And, as would be expected with a then-new program and financing tool intended to encourage investment in low-income communities, NMTC projects varied with respect to the kinds of outputs and outcomes with which they were associated, the need for a public subsidy, and project viability.
Project Types
The NMTC program supports a wide range of project types, each of which reasonably can be expected to result in particular kinds of outputs and outcomes. For analytic purposes, therefore, projects were placed into categories according to their focus of activity: office, retail, mixed use, hotel, social services,
educational, arts/cultural, manufacturing/industrial, agricultural/forestry, brownfields, health facility or equipment, and housing. Although no one project type predominated among early-year projects, the most prevalent were office, retail, manufacturing/industrial, and mixed-use.
Given the relatively small size of the evaluation’s project sample, project types were condensed into five clusters, as follows:
Share of Projects
Project-Type Clusters (%) Office (15%), retail (14%), mixed use (12%), and hotel (5%)
Social services (8%), educational (8%), and arts/cultural (6%)
Manufacturing/industrial (13%), agricultural/forestry (4%), and brownfields (1%)
Health facility or equipment
Housing
46
22
18
9
5 TOTAL 100
Project Location & Targeting
NMTC projects are targeted toward low-income areas that are distressed. Distress is operationally defined in terms of census tract poverty levels or median incomes. Because CDEs have the discretion to choose where to direct their investments, the CDFI Fund has provided encouragement, through its application

NEW MARKETS TAX CREDIT (NMTC) PROGRAM EVALUATION
viii
process for tax credit allocations, to invest in tracts with higher levels of distress than minimally required.
• Early-year NMTC projects were dispersed across more than 1,000 census tracts. The great majority (71 percent) of such tracts contained one NMTC project, 17 percent contained two projects, 5 percent contained three projects, and the remaining 7 percent contained four or more projects.
• Overall, 83 percent of projects were located in metropolitan areas and 17 percent were located in nonmetropolitan areas, with the proportion of metropolitan-area projects increasing over time during the early years.2
• About four out of every ten NMTC projects were located in areas with a poverty rate
of more than 30 percent—that is, areas the CDFI Fund defines as having “higher distress.” However, eligible census tracts receiving NMTC investments roughly resembled eligible tracts without projects in poverty rates, median family incomes, and unemployment rates.
Project Initiation
As with many community and economic development projects, the initiation of those financed with NMTCs in different localities reflected market conditions, community structures and assets, and existing professional and personal networks. While project trajectories and the roles of key players varied by project, location,
and timing (among other considerations), three types of initiation scenarios were apparent: those in which there were preexisting relationships between CDEs and QALICBs; those in which QALICBs were referred to CDEs; and those in which QALICBs approached CDEs directly without any prior relationship or referral. Participants associated with the remaining projects reported varying other scenarios or did not know the circumstances of project initiation.
• Previous working relationships between QALICBs and CDEs existed in one-quarter of early-year projects. In most such cases, the previous relationships had not involved the NMTC program.
• Just under one-third of early-year NMTC projects involved referrals. The most frequently reported sources of referrals were local governments, other CDEs, and local banks. In some cases, QALICBs approached banks for funding and were then referred to CDEs when the banks recognized that the QALICBs were eligible for NMTC financing because they were located in low-income census tracts. Federal agencies, investors, community groups, and donors or board members of nonprofit organizations also referred QALICBs to CDEs.
• Just over one-third of early-year NMTC project QALICBs approached CDEs directly, with no prior relationship or referral. This usually occurred in cases where a community bank was also a CDE that had a NMTC allocation.
2 The time period covered by this evaluation precedes legislative changes that increased the NMTC program’s focus on nonmetropolitan-area investment.

NEW MARKETS TAX CREDIT (NMTC) PROGRAM EVALUATION
ix
Site Selection NMTCs rarely influenced the choice of project location. For the majority of early-year projects, QALICBs had selected their sites before seeking financing. And, in some cases, site selection was not an issue because NMTC financing was used for business
expansion or working capital, with no plans to rehabilitate or develop property.
Even where QALICBs built or renovated property, most did not consider alternative sites. The reasons varied: some QALICBs were developing previously purchased properties; adjacent properties were developed to expand at existing locations; sites were selected for rehabilitation by local jurisdictions (with developers solicited through requests for proposals); and buildings or sites had been donated to nonprofit QALICBs or sold to QALICBs for nominal amounts.
With respect to the status and condition of sites before projects were started, most were either vacant lots or land, or empty or underused buildings. Where existing buildings were involved, about 60 percent were in some state of disrepair.
Participant Attributes
Key participants in NMTC projects include (1) CDEs, (2) QALICBs, (3) investors and (4) community and local government stakeholders. Important attributes of these participants are noted below.
1. CDEs. For-profit nonfinancial institutions were awarded the highest share of NMTCs, followed by CDFIs, community banks and other mission-driven lending institutions, and for-profit financial institutions. Nonprofit nonfinancial institutions and government/quasi-government CDEs were awarded fewer and smaller NMTC allocations. These variations likely reflected differences in allocation requests as well as the capacities of the different types of CDEs—including the ability to attract investment dollars, initiate multiple projects, and undertake the typical sizes of projects (all factors that can affect a CDE’s ability to deploy credits within the required time frame). Many CDEs that received allocations applied for subsequent allocations. By 2006, half of those that were awarded allocations had also received previous allocations.
2. QALICBs. For about 60 percent of early-year projects, QALICBs were for-profit corporations; and for almost 40 percent of projects, QALICBs were nonprofit organizations. QALICBs were tribal or other government organizations in about 2 percent of the projects. QALICBs in the combined sample of projects3 ranged in size, as measured by annual gross revenues or operating budgets at the start of their NMTC projects, from zero for new start-ups to $7 billion for a large for-profit parent entity in the natural resources business. The median size was $740,000. Almost one-third of QALICBs were small (less than $500,000), and fewer than 10 percent were very large (more than $25 million).
3. Investors. Early-year projects involved a wide variety of investor types, including: large international banks or other regulated financial institutions, public entities, CDFIs, regional or community banks or other similar sized financial institutions, QALICBs, real estate developers or investment companies, venture funds, other types of corporate investors, and others (including individual investors).
3 Included are the evaluation’s telephone interviews with project participants and online survey of QALICBs.

NEW MARKETS TAX CREDIT (NMTC) PROGRAM EVALUATION
• The highest proportion of investors consisted of large international banks or otherregulated financial institutions—a group that also accounted for the largest amount oftotal financing provided to NMTC projects.
• The largest amount of financing per project was provided by other types of corporate investors, such as large retail companies that used NMTCs to build, expand, or rehabilitate stores in their chains that were located in low-income communities.
Although all of the projects sampled for the evaluation involved NMTCs, not all of the investors in those projects claimed tax credits: 63 percent of the investors made NMTC-eligible investments—including all venture funds, most CDFIs, and most banks and regulated financial institutions. Some investors had other incentives for investing in NMTC projects, such as favorable loan-to-value ratios when debt was combined with investor equity. Banks can also claim Community Reinvestment Act (CRA) compliance credits. Investors claimed CRA credits for 76 percent of projects, and 21 percent of investors indicated that CRA credit was a substantial factor in their investment decision.
4. Community and local government stakeholders. Aside from the fact that localgovernments are responsible for zoning, issuing building and occupancy permits, and the like, the NMTC program does not necessarily involve local or community agencies as program participants. Community involvement and emphasis on producing community benefits was uneven across early-year NMTC projects. There was extensive community-level involvement in some instances and barely any in others. Information derived from the telephone interview sample indicated the following:
• Local public agencies were involved with fewer than half of the early-year projectsbefore financing was arranged (excluding issuance of permits, etc.); in the remainderof cases, there was apparently no such involvement.
• In somewhat more than half of the projects, discussions were held with publicdevelopment agencies, community development corporations (CDCs), or othercommunity stakeholders at some point during project development. Early-stagepublic agency involvement in projects increased the likelihood of subsequentdiscussions with public or community entities.
Some local governments or agencies are also certified as CDEs and, therefore, directly involved in NMTC projects. Most, however, are not and work primarily with other community and economic development programs—such as those administered by the U.S. Department of Housing and Urban Development or the Economic Development Administration; this provides a basis for understanding the following findings derived from the online survey of community and economic development specialists:
• Although 72 percent of local community and economic development specialists werefamiliar with the NMTC program, only 26 percent claimed to be very familiar with it.
• While the national sample of local community and economic development specialistswas exclusively drawn from places where at least one NMTC project had beeninitiated, only 45 percent of such specialists were aware of any NMTC project withintheir jurisdictions. This likely reflects not only the existence of multiple community
x

NEW MARKETS TAX CREDIT (NMTC) PROGRAM EVALUATION
xi
and economic development programs but also variations in practitioner specialization.
• Among community and economic development specialists who were aware of local NMTC projects, 62 percent reported that their organizations or other such organizations had “definitely” been involved with them; an additional 13 percent reported “probably” having been involved. Where there was involvement, half of the specialists claimed that it was extensive. Involvement included encouraging and/or facilitating projects or activities, bringing together key parties, providing direct financial support, providing other types of support, providing referrals to other agencies or organizations or offices, helping to initiate or design one or more projects, and engaging in eminent domain or condemnation proceedings.
Project Financing
Information gathered about project financing pertains to total project size, types of investments and their performance, leveraging of other financing sources,4 and fees and deal costs. The findings are as follows:
• According to CDFI Fund administrative data, the median size of early-year projects was $3.7 million.
• Nearly two-thirds of funds provided through the NMTC structure were term loans.5 Of the funds provided outside the NMTC structure, 37 percent took the form of term loans, and nearly half were equity investments.
• The median loan interest rate was 5.8 percent, and a majority of the loans provided
under the NMTC program had a term of seven years. • CDEs used NMTC financing to provide better rates or terms to just over 90 percent
of projects/QALICBs. Most prevalent were lower-than-standard origination fees, below-market interest rates, and longer-than-standard periods of interest-only payments.
• Perhaps as a sign of the recently weakened macro-economy, more than one project
in six had its loan restructured, 8 percent had been delinquent, 6 percent went into default, and just over 2 percent were foreclosed upon.
• Based on telephone interview data provided by project participants, three-quarters of
CDEs charged fees and 22 percent charged no fees.6 Front-end fees were the most common; they represented, on average, 2.4 percent of a project’s total cost.
4 When public/program funds are used to attract private financing, the latter is generally regarded to have been leveraged by the former. 5 “NMTC structure” refers to the project financing for which investors are eligible to claim a tax credit. See chapter 2 of the report for a more complete explanation. 6 Information was unavailable for the remainder of projects.

NEW MARKETS TAX CREDIT (NMTC) PROGRAM EVALUATION
xii
Especially for a program such as NMTCs that involves a public-private partnership, a key program evaluation issue is the extent to which program funds leveraged private financing. The evaluation considered program leveraging from several vantage points.
• Based on project-by-project calculations, NMTC structure financing was worth 82 percent of total project financing for the median project.
• Tax credits represented 36 percent of total project costs for the median project. • Public funds provided 39 percent of total projects costs for the median project.7
Role of NMTCs in Bringing Projects to Fruition
While there are no explicit statutory or regulatory provisions prohibiting the use of NMTC investments in projects for which other financing is available, several program procedures and requirements (relating to competitive tax credit allocations, mandatory allocation
agreements, use of distress criteria, and a system of CDE reporting to the CDFI Fund) suggest programmatic encouragement of use of NMTCs in projects that would not otherwise move forward. Indeed, the logic behind the program’s statutory objective to increase capital investment in low-income areas is that tax credits are necessary to attract private investors. Consequently, an important program evaluation question involves the extent to which NMTCs were necessary to bring projects to fruition or, alternatively, substituted for other available financing.
Practitioners and researchers consider the substitution issue exceptionally difficult to address for both conceptual and empirical reasons. Nonetheless, a systematic review of a range of objective and subjective evidence regarding individual projects obtained for the evaluation from QALICBs, CDEs, investors, and other stakeholders has provided sensible indications as to whether they needed NMTCs. The information reviewed included project descriptions and histories, local market conditions, availability of alternate financing, whether QALICBs had applied for and/or received approval for conventional financing before NMTC investments, rationales for not applying for or not accepting offers of conventional financing, and rationales for using NMTCs.
Taking into account considerations of project timing and location,8 the review resulted in
each sampled project being categorized as either likely not to have come to fruition without NMTCs; to have come to fruition without NMTCs but at a later date or at a different location; or to have come to fruition without NMTCs at about the same time and/or in about the same location. A residual category, “inconclusive,” consisted of projects for which relevant information
7 When summing across all projects, financing provided through the NMTC structure represented 53 percent of total project costs, NMTCs represented 22 percent of total costs, and public funds were 23 percent of total project costs. 8 Another possible consideration is whether project scale (or scope) would have been seriously affected had NMTCs not been used. This was taken into account in the review of projects involving the telephone interview sample, but not the online QALICB survey sample because of data limitations. In fact, for the former, project scale did not prove to be a substantial factor with respect to the role of NMTCs in bringing projects to fruition.

NEW MARKETS TAX CREDIT (NMTC) PROGRAM EVALUATION
xiii
was simply not available, insufficient, or too inconsistent to permit any of the above designations.
• Based on the evidentiary review, it can reasonably be concluded that between three and 4 of every 10 early-year projects would likely not have proceeded without NMTCs; about 1 of every 10 projects would likely have proceeded without NMTCs, but probably in a different location or on a delayed schedule. About 2 of every 10 projects did not show convincing evidence of needing NMTCs to come to fruition. Information was inconclusive for about 3 of every 10 projects.
• Only three of several project attributes that might be expected to explain variations in
need for NMTCs did so: year of allocation; prior relationships between CDEs and QALICBs; and whether projects involved real estate development. Among early year projects, those based on later allocation rounds were more likely than those based on prior rounds to need NMTCs. CDEs and QALICBs having relationships with each other that preceded their NMTC projects were more likely than those without such relationships to need NMTCs. And projects involving construction or rehabilitation of properties were more likely than those involving non-real estate (i.e., business) purposes to need NMTCs.
• Considered individually, other attributes—such as differences in project types, CDE
types, QALICB types, whether projects utilized a CDE’s first allocation of tax credits, or the extent of area distress—do not help to explain variations in the need for NMTCs. This may reflect program diversity, as projects combine different financing structures, participant types, and situations in somewhat unique ways.9
There are no especially compelling industry benchmarks against which to assess these findings.10 It would be unrealistic, however, to expect all projects in a program such as NMTCs to satisfy a stringent “but-for” test. The timing and unique circumstances surrounding the financing and implementation of some projects may present situations in which real-time decisions by QALICBs, CDEs, or investors are made without substitution considerations in mind. And, from a program development perspective, agencies must balance the risk of using a subsidy or an excessive subsidy when not needed against the risk of hampering desired outcomes by promulgating overly cumbersome or rigid but-for rules.
Jobs Outcomes
The evaluation sought information on the actual job creation and retention experiences of NMTC projects. Created jobs were defined as permanent positions that would not have existed without NMTC investments; retained jobs were those that would have been lost without such investments. Preexisting jobs that
other were not considered to be new or were simply moved by a QALICB from one location to an
9 A larger sample would be needed to allow examination of the interactions of these factors as they might affect a project’s need for NMTCs. 10 See Martin D. Abravanel, Nancy M. Pindus and Brett Theodos, Evaluating Community and Economic Development Programs: A Literature Review to Inform Evaluation of the New Markets Tax Credit Program, Washington, DC: The Urban Institute, 2010 (http://www.urban.org/publications/412271.html).

NEW MARKETS TAX CREDIT (NMTC) PROGRAM EVALUATION
retained. Also calculated were NMTC investment costs per job generated—defined as the ratio of all NMTCs eligible to be claimed for a project to the number of permanent jobs created and retained11—for a subsample of 149 projects for which both jobs and project cost data were available.
• Extrapolating from the project samples for which data were gathered to the universe of 2,031 early-year projects, it is estimated that the NMTC program created or retained 135,970 permanent jobs and 151,304 construction jobs.
• A small proportion of the projects accounted for one-third of all jobs created or retained. The largest jobs producers by project-type cluster were retail, mixed use, office, and hotels; the second largest cluster consisted of manufacturing/industrial, agricultural, forestry, and brownfields projects. The largest jobs-producing projects in the evaluation samples (over 500 jobs each) included two newly constructed shopping centers on the East Coast, a mixed-use project in the Midwest, and a food processing center in the South.
• For-profit CDEs were responsible for creating and retaining more jobs than nonprofit CDEs. Similarly, for-profit QALICBs accounted for about two-thirds of all the jobs created or retained during the early years of the NMTC program.
• Not surprisingly, large projects (as measured by total project costs) created and retained more jobs than smaller ones. More than half of all jobs created or retained were attributed to projects with a total cost of $15 million and above.
• Jobs created or retained and attributable to the NMTC program were not
concentrated at any particular job level. Some (such as large retail) projects created or retained primarily entry-level jobs, while others (such as a scientific research center) created or retained primarily management-level or professional-level jobs. Most projects included a mix of job levels, with a higher share in the entry- and midlevel ranges.
• Based on projects for which participants reported information on the characteristics
of individuals who were newly hired or retained as a result of NMTC support, 27 percent of all created or retained permanent jobs went to minorities and 36 percent went to neighborhood residents.
• NMTC investments per job generated for early-year projects are estimated to have
been between $32,658 and $79,265, averaging $53,162.12
11 Creation or retention costs do not include, and are not synonymous with, the salaries paid to new or retained employees. 12 There are currently no universally accepted benchmarks against which to compare these findings. However, the findings are useful as benchmarks for subsequent evaluations of the NMTC program—that is, for considering whether the program becomes more cost efficient over time with respect to job production. In using this measure to evaluate the NMTC program as a whole, it should be noted that the program encourages and allows for a variety of project emphases and results, thereby affording a somewhat tenuous basis for cross-program cost comparisons with single- purpose programs intended to create jobs. The same logic applies to the cost per square foot measures for construction/rehabilitation outcomes, presented in the next section.
xiv

NEW MARKETS TAX CREDIT (NMTC) PROGRAM EVALUATION
xv
Construction/Rehabilitation Outputs and Outcomes
The evaluation tallied the square footage of real property brought to communities by early-year NMTC projects involving real estate. Projects were labeled “real estate” if they supported the construction or rehabilitation of residential or commercial properties (or both), including
those that were not sponsored by real estate developers, but instead, such entities as charter school organizations, social services agencies, professional services firms, or others that built or rehabilitated at least a single building for their own use. Also measured was the cost per unit (square foot) of real estate that was produced.
• The majority of early-year NMTC investments entailed commercial real estate development. About two-thirds of projects, accounting for about three-quarters of all project costs, consisted of construction or rehabilitation of commercial or residential real estate.
• Among real estate projects, a small portion was intended exclusively or partially as
residential space, while the great majority consisted of commercial development. Among residential projects, more than one-third of the total units constructed or rehabilitated were set aside for low-income residents.13
• Early-year commercial properties, on average, added between 50,000 and 100,000 square feet of usable space to the communities in which they were located.
• Construction and renovation projects also helped to beautify their surrounding areas; some incorporated green building features. Almost all real estate projects resulted in major improvements to property appearance, the streetscape, or façade. About 1 in 10 early-year real estate projects (including office buildings, housing, mixed-use, and retail properties) was LEED14 certified.
• The total project (public plus private) cost per square foot of property developed (i.e., built or rehabilitated) in early-year NMTC projects was between $158 and $322—averaging $227. Since the NMTC program leverages other public, and especially private, capital, however, NMTC contributed only a fraction toward the total investment costs of building or rehabilitating real estate. Therefore, the NMTC investment cost per square foot of real estate developed was between $28 and $62, averaging $43—or 19 percent of total per-square-foot costs.
Other Project Outcomes
While job and real estate production tend to be among the most commonly measured outputs and outcomes of community and economic development programs, the broad mandate of NMTCs suggests that the following outcomes are also very relevant: (1) creation of amenities,
13 Program rules permit financing an NMTC project that consists of 100 percent residential units for sale; if units are for rent, however, revenues from the units can represent no more than 80 percent of project revenues—meaning that the projects must be mixed use of some sort. 14 Leadership in Energy and Environmental Design.

NEW MARKETS TAX CREDIT (NMTC) PROGRAM EVALUATION
services, and facilities; (2) support for small businesses and organizations; and (3) enhancement of local tax bases.
1. Amenities, services, and facilities (“amenities”). NMTC projects may add to or expand community amenities such as by increasing access to retail services, building human capital, enhancing quality of life, or improving access to public infrastructure. These outcomes, which community residents can consume, engage in, or enjoy, are grouped as follows:
• Retail amenities. This category contained the highest share of reported amenities, with shopping centers, restaurants and laundry facilities constituting the largest proportion—at 42 percent. Other retail amenities consisted of banking or financial services, grocery stores, and hotels. Most projects with a retail amenity were provided by for-profit QALICBs and CDEs.
• Human capital amenities. Health care facilities were the most frequently reported human capital amenity, at 23 percent. Sampled projects ranged from large-scale hospitals with more than 100 beds to small-scale neighborhood health clinics. Other human capital amenities involved employment training centers, child care centers, elementary or secondary schools, and postsecondary education facilities or opportunities. Nonprofit QALICBs were more likely than for-profit ones to provide human capital amenities. Nonprofit CDEs were also more likely than for-profit and government CDEs to finance projects with human capital amenities.
• Quality-of-life amenities. Parks, open spaces, playgrounds, and recreation or community centers were the most frequently reported quality-of-life amenities, at 21 percent. Arts and cultural institutions or museums were the second most frequently reported, followed by public libraries. Nonprofit QALICBs were more likely than others to sponsor projects with quality-of-life amenities.
• Infrastructure amenities. Parking lots or garages were the most frequently reported infrastructure amenity, at 19 percent of projects, while public transportation and environmental cleanups were less common. For-profit QALICBs were more likely than others to sponsor projects with infrastructure amenities.
2. Support for small businesses and organizations. NMTCs have been used to support start-up enterprises as well as expansions of existing for-profit and nonprofit entities.
• Investing in start-up enterprises. Serving the capital needs of start-up enterprises has not been the primary focus of the NMTC program. And compared with other federal programs, early-year NMTC investments in start-up entities were modest. Nevertheless, for-profit firms and nonprofit firms represented a noteworthy part of the program. Just over 10 percent of early-year NMTC projects financed the start-up of a small for-profit or nonprofit entity. The NMTC program facilitated investments worth an estimated $1.4 billion in start-up entities from 2003 to 2007.15 Nearly two-thirds of NMTC-supported start-ups were organized as for-profit firms, with the remainder organized as nonprofit organizations.
15 This amount includes all financing sources.
xvi

NEW MARKETS TAX CREDIT (NMTC) PROGRAM EVALUATION
xvii
• Expanding existing for-profit and nonprofit entities. Early-year NMTC projects sought financing for business expansion more frequently than for business creation. Nearly half of all QALICB participants had hoped to expand their enterprises as a result of NMTC financing. Given the national recession that covered a portion of the relevant time period, it is noteworthy that many were able to do so. In all, 76 percent of projects realized growth in their annual revenues or operating budgets of more than 5 percent between project initiation and 2011, when data for the evaluation were collected.
3. Enhancement of local tax bases. New tax revenues generated by NMTC projects include sales, payroll, and income taxes paid by individuals employed as a result of the projects, as well as corporate and property taxes paid by investment recipients as a result of property value appreciation or businesses improvements. Such project outcomes, which enhance a locality’s tax base, are consistent with the NMTC program’s objective of supporting the development of low-income communities.
• Eighty percent of all early-year projects reportedly contributed to some form of
increased city or county tax revenues from QALICBs, their tenants, or their employees.
• Increased payroll taxes were the most common tax outcome, with participants from more than 70 percent of projects reporting an increase in payroll tax payments as a result of their projects.
• Participants in two-thirds of early-year projects reported increases in property taxes. Also, in more than half of the cases, QALICBs reportedly paid more sales taxes, and one-third paid more corporate taxes. Roughly 1 in 10 projects paid additional other taxes—including city employment taxes, school taxes, and/or hospitality taxes.
• For-profit businesses were much more likely than nonprofit organizations to pay
additional property, sales, and corporate taxes. The most common additional tax paid by nonprofits and government or quasi-government QALICBs related to expanding their number of employees.
Area-wide Outcomes
The likelihood of spillover from project sites to surrounding areas resulting in neighborhood- or community-level change depends on factors such as project characteristics, scale, or visibility. More than one-third of early-year NMTC projects were undertaken in conjunction with, or integrated into, larger-scale development
initiatives within their communities, according to project stakeholders. The stakeholders also indicated that a majority of the projects had high visibility within their communities. Taking into account the design, scale, or other attributes of each project, as well as the reported intentions of CDEs and QALICBs, approximately 36 percent of projects included in the telephone interview sample were considered to have had some area-wide spillover effects. The following results were reported:

NEW MARKETS TAX CREDIT (NMTC) PROGRAM EVALUATION
xviii
• Based on comparisons of stakeholders’ before-project and after-project assessments of the areas in which their projects were located, there appears to have been positive change in almost 7 of every 10 cases. In most instances, the change was thought to have been relatively small (i.e., one point on a five-point scale).
• For almost 3 of every 10 projects, no surrounding area changes were reported following project completion. While, in a few instances, neighborhood businesses were displaced or noise levels increased during project development, very little negative change was noted in surrounding areas.
• Stakeholders involved in one-third or more of early-year projects reported strong
evidence that surrounding areas had experienced new business creation, improved property appearance, and/or increased local tax revenues as a result of NMTCs. Additional changes identified by a small number of stakeholders included improved neighborhood safety, reduced crime, increased community pride and morale, or sustained improvement in inter-organizational relationships.
Project Outcome Patterns
On a project-by-project basis, consideration was given to which, if any, of the following potential outputs or outcomes were associated with each early-year project: increased employment; developed real estate; improved environment; reduced neighborhood distress; increased community
amenities, services, or facilities; new or expanded businesses; attraction of new investors; or provision of advantageous financing. Almost all early-year projects were associated with at least one such output or outcome, and most were associated with more than one. The average project was associated with four such results.
• The most prevalent result consisted of provision of advantageous financing. The vast majority of QALICBs either could not otherwise have obtained financing or, by comparison with other available financing, received better rates and terms in conjunction with NMTCs.
• The second most prevalent result involved real estate development” 84 percent of projects constructed or rehabilitated either residential or commercial properties in low-income areas.16
• The third most prevalent result consisted of additions to the local tax base: 77
percent of projects were associated with increased payroll, property, sales, corporate, or other taxes, to the benefit of the local community.
• The fourth most prevalent result involved employment: 71 percent of projects created
or retained at least one new permanent job. Using a different employment metric, 60
16 This figure differs from findings noted in the section titled “Construction/Rehabilitation Outputs and Outcomes,” above, because the latter includes data collected through the combination of telephone interviews with project participants and the online QALICB survey, while the former includes only data collected through telephone interviews.

NEW MARKETS TAX CREDIT (NMTC) PROGRAM EVALUATION
xix
percent of projects experienced an increase in employment levels of more than 33 percent, compared with pre-NMTC levels, due to jobs created or retained as a result of their respective NMTC projects.
Certain types of projects were more or less likely than others to have been associated with particular outputs or outcomes:
• Office, retail, mixed-use, and hotel projects were somewhat more likely to develop real estate than other project types.
• Manufacturing/industrial, agricultural/forestry, and brownfields cleanup projects were somewhat more likely than others to contribute to environmental improvement and less likely to result in an above-average increase in employment; development of real estate; or contribution to increased amenities, services, or facilities.
• Projects involving education, arts/culture, or social services were more likely than others to be associated with increased community amenities, services, or facilities, as well as reduced community distress, and less likely to provide increased local taxes.
• Although the number of projects in the sample is small, health facility and equipment projects were somewhat more likely than others to be associated with an above-average increase in employment and less likely to be associated with reduced neighborhood distress or to have received advantageous financing.
Future Research Needs
Given that this is the first formal evaluation of the NMTC program, there is still much to be learned about it. Potentially, therefore, the present effort is only the initial contribution to a larger research plan, yet to be implemented. In that context, the evaluation’s findings and limitations can help to guide future efforts.
To obtain a broad programmatic assessment for the initial evaluation, one trade-off made was to focus on outputs and outcomes for a relatively large number of projects, randomly selected to represent the full range of the program, rather than to conduct more intensive data collection and analyses for a smaller number. A second decision was to focus on early-year projects to ensure that sufficient time had elapsed for results to become apparent. However, the NMTC program has continued to evolve, market circumstances have changed, projects have matured, and new allocations and investments have been made—suggesting many areas in need of additional research. Among others, it would be useful to have the following:
• More detailed studies in localities or neighborhoods that have concentrations of NMTC projects and/or are part of larger redevelopment initiatives—taking advantage of on-site data collection as well as local market and investment data regarding interest rates, rates of return, and property values—to assess the nature and extent to which the projects have affected or transformed low-income communities.
• Studies that contribute to the development of industry benchmarks by project types—such as office buildings, shopping centers, or hotels.

NEW MARKETS TAX CREDIT (NMTC) PROGRAM EVALUATION
• More detailed studies of jobs to refine and improve measures—including distinguishing between those that are merely moved from one location to another and those that are retained or newly created; developing and using indicators of job quality; and documenting employment of community residents. There is no generally accepted operational standard of job quality—an issue that has challenged researchers for years,17 and measurement, benchmarking, and attribution present conceptual questions that can benefit from further research.
• Longer-term trend analyses over the full NMTC period since 2002 to better understand project evolution—especially with respect to targeting and substitution.
• Studies of area-wide and community outcomes to better define these outcomes and understand who benefits from community amenities, facilities, and services.
• Follow-up studies of longer-term project outcomes; capacity-building effects; and the role, extent, and consequences of community involvement in NMTC projects.
• Follow-up studies of the sustainability of NMTC investments—considering questions such as: What happens to NMTC projects’ subsidized financing after the seven-year credit-claiming period? Does the subsidy end or do QALICBs obtain other subsidies (either through NMTCs or other programs)? How do QALICBs fare with conventional rates and terms? Do initial outcomes decrease or grow?
Noting that research to-date has not produced definitive results about the effectiveness of community and economic development tax expenditures (like NMTCs, Empowerment Zone tax incentives, or Historic Tax Credits), the GAO recently recommended that there be more crosscutting assessments involving multiple federal agencies and programs to help identify the data needed to evaluate tax expenditures’ effects on community and economic development.18 While more definitive cross-agency and -program assessment is certainly desirable, it is equally important to carry on with research that focuses on individual programs—that is, their design, implementation, and monitoring. Continued analyses of administrative data as well as pursuit of additional research questions by using a range of data sources and analytic methods are needed to inform program management and policy—with the objective of enhancing the effectiveness and relevance of initiatives like the NMTC program.
17 See Andrew Isserman, Socio-Economic Review of Appalachia: The Evolving Appalachian Economy, Report to the Appalachian Regional Commission, 1996. 18 See Community Development: Limited Information on the Use and Effectiveness of Tax Expenditures Could Be Mitigated through Congressional Attention (GAO-12-262), Washington, DC: Government Accountability Office, 2012.
xx

NEW MARKETS TAX CREDIT (NMTC) PROGRAM EVALUATION
1
SECTION I:
BACKGROUND

NEW MARKETS TAX CREDIT (NMTC) PROGRAM EVALUATION
2
1. INTRODUCTION Authorized by the Community Renewal Tax Relief Act of 2000,19 the federal
government’s New Markets Tax Credit (NMTC) program encourages new or increased investment in primarily nonresidential operating businesses and real estate projects located in low-income communities (LICs). It is jointly administered by the U.S. Department of the Treasury’s Community Development Financial Institutions (CDFI) Fund and the Internal Revenue Service (IRS).
A Brief Overview of the NMTC Program20
The NMTC program seeks to attract investment capital to LICs by permitting individual and corporate taxpayers to receive credits against their federal income taxes in exchange for making equity investments in specialized financial institutions known as Community Development Entities (CDEs).21 CDEs are certified by the CDFI Fund to act as financial intermediaries that direct capital from investors to businesses or nonprofit organizations—both, of which are referred to as Qualified Active Low-Income Community Business (QALICBs).
Federal tax credits are competitively allocated to CDEs by the CDFI Fund; CDEs, in turn, select projects in which to invest. Projects can range widely to include those that are commercial, industrial, retail, manufacturing, or mixed-use, as well as those that provide community facilities for purposes such as child care, health care, or education (like charter schools). Projects can be located in either metropolitan or nonmetropolitan census tracts as long as they meet the program’s definition of low income.
Evaluation Purpose
In 2007, the CDFI Fund contracted with the Urban Institute to undertake a multiyear evaluation of the NMTC program. The objective was to help satisfy the Office of Management and Budget’s (OMB’s) requirements pursuant to the Government Performance and Results Act22 that federal agencies undertake independent evaluations of program performance for
19 Public Law (PL) 106-554, incorporated as section 45D of the Internal Revenue Code. 20 The NMTC program is described in more detail in chapter 2. 21 CDEs must (a) have a primary mission of serving or providing investment capital for low-income communities or low-income persons, (b) maintain accountability to residents of low-income communities through their representation on any governing board or advisory board, and (c) have been certified as a CDE by the CDFI Fund. Both for-profit and nonprofit CDEs may apply to the CDFI Fund for an allocation of NMTCs, but only a for-profit CDE is permitted to provide the NMTCs to its investors. Thus, if a nonprofit CDE receives an allocation of NMTCs, it must suballocate its allocation to one or more for-profit subsidiary CDEs. 22 PL 103-62.
NEW MARKETS TAX CREDIT (NMTC) PROGRAM EVALUATION
3
accountability and program improvement purposes. Up to that point, no such evaluation had been done of the NMTC program. While CDEs routinely submit standardized data to the CDFI Fund for compliance monitoring purposes, such data provide limited information on individual project activities, outputs, or outcomes. Although a professional association that represents and supports CDEs surveys its members and disseminates information on successful NMTC-financed projects, these surveys do not provide a comprehensive picture or independent evaluation of the program.
To assess the extent to which the NMTC program is accomplishing its objectives, the evaluation focused on the program as a whole and not just on specific projects or project types.23 It covered a range of issues, such as those related to program design, execution, and project outputs and outcomes—especially the latter. The intention was to provide policymakers with information needed to assess the program’s performance; give program administrators and participants information useful for improving the program; and inform and educate the general public as to what the program is, how it works, and what it accomplishes.
Evaluation Approach24
The approach to, and issues addressed by, this evaluation derive from the broader literature focused on community and economic development program evaluations (Abravanel, Pindus, and Theodos 2010). In its most basic form, an evaluation seeks to learn whether a program is doing what was intended (i.e., whether it is working). Drawing such conclusions about a community and economic development program poses several challenges. For one thing, communities are extremely complex systems consisting of many interrelated structures and activities that, along with external factors, influence the very conditions a program like NMTC seeks to affect. For another, individual program investments are sometimes small in size relative to the neighborhoods or areas in which they take place, contributing to the impracticality of measuring impacts (such as on poverty levels or property values) across a sample of diverse projects in multiple locations.
In addition to generic challenges inherent in evaluating community and economic development programs, the NMTC program presents complexities related to both its broad mandate with respect to project activity types and its delegation of project selection to a large number of intermediary CDEs. Consequently, participating CDEs and QALICBs have used NMTCs for diverse purposes and sought a wide range of results. Some, for example, intended primarily to create jobs, whereas others intended to expand educational opportunities or provide
23 As described in chapter 2, these objectives derive from the NMTC statute, the statement of congressional intent included in the Internal Revenue Code, Section 45 D, and interviews with selected NMTC program stakeholders—including those who had been involved in the original planning and design of the program. The evaluation is not intended or designed to assess participants’ statutory or regulatory compliance with Section 45 D. 24 The evaluation methodology is detailed in chapter 3.

NEW MARKETS TAX CREDIT (NMTC) PROGRAM EVALUATION
4
catalysts for transforming entire areas. Program performance measurement must take into account this diversity so that projects or project types can be evaluated against their intended purposes and desired outcomes. The evaluation design took into account the particular challenges of evaluating the NMTC program, by considering the strengths and limitations of alternate data sources, methodologies, and analytic techniques, and by attempting to balance rigor with recognition and sensitivity to these challenges.
Underlying Concepts
In addition to NMTC projects varying with respect to their purposes, scale, and desired outputs and outcomes, they can also vary in terms of output and outcome timing. Some may occur and be measurable immediately after financial transactions are closed; some may occur and be measurable shortly after a project is completed; and some may occur and be measurable only later, or even much later. Exhibit 1 presents a simplified generic “logic model” that incorporates the timing of outputs and outcomes.
A logic model is a diagram depicting the logical relationships among indicators of preexisting conditions, program interventions, program outputs, and program outcomes; it shows the steps that lead from preprogram conditions to program actions and, then, to desired results. For the NMTC program, the model begins with external community conditions and “inputs” (tax credits) that are expected to result in “outputs” (such as square footage of real estate produced), “intermediate outcomes” (such as creating jobs), and “end outcomes” (such as a stronger, sustained local economy). While, ultimately, it is important to attempt to measure both intermediate and end outcomes, some end outcomes may occur too far into the future with respect to when an evaluation is conducted.25
Exhibit 1: Logic Model for New Markets Tax Credit Program Evaluation
OUTPUTS
INPUTS
Tax Credit Investments
INTERMEDIATE AND
END OUTCOMES
EXTERNAL/ PREEXISTING
Community Factors
Key Research Questions
Multiple program evaluation questions are addressed in subsequent chapters of this report. They are briefly presented below.
25 This evaluation addresses key project and program-level outputs and outcomes, including intermediate as well as end outcomes achieved in the relatively short term (i.e., between project completion and the time of data collection).
NEW MARKETS TAX CREDIT (NMTC) PROGRAM EVALUATION
5
What types of community and economic development projects did the NMTC program support, and where were they located? The report looks at the NMTC program from its inception through tax credit allocations awarded to CDEs up to and including 2006 (i.e., allocation rounds 1 through 4),26 and considers only projects that had been initiated as of December 2007.27 Given that the program continued to support project investments after that date, these are referred to as “early-year” projects in the report. Emphasis on early-year projects was to allow sufficient time for them to have been completed and, therefore, for the evaluation to be able to report on actual project outputs and outcomes as distinct from program participants’ intentions, objectives, or projections at project initiation. Using both existing administrative data and newly collected quantitative and qualitative data, a broad range of issues are addressed and analyzed by CDE type, project type, year of allocation, and other key characteristics. Examples of issues addressed include investment targeting (e.g., by geographic area or level of distress), characteristics (e.g., industry, size, tenure) of businesses or organizations receiving investments, and disposition of projects from initiation to completion. The report presents a typology of projects based on project activities and objectives.
How does the NMTC investment process work? The report describes the key participants in the NMTC program, the types of investments made, and the process by which investments were structured in order to understand how the program works to encourage capital investment in LICs. It considers whether investors who had not previously invested in community and economic development projects were attracted to LICs as a result of NMTCs, and whether additional investment in communities occurred that were either leveraged or stimulated by NMTC investments. This latter issue is addressed primarily in the short term because the connection between NMTC investment and other investments is more difficult to establish over a longer time period.
What role did NMTCs play in project financing? Although the CDFI Fund formally certifies CDEs and competitively allocates NMTCs to a portion of them, it does not select or review individual projects or become involved in project underwriting. Only CDEs are responsible for determining which investments are made, assessing a project’s need for
26 NMTC allocations are awarded competitively through an application process. Each cycle of applications and awards is referred to as an “allocation round” or “round.” As of May 2012, there had been nine allocation rounds. 27 It should be noted that not all of the credits that were allocated in rounds 1 through 4, especially those from rounds 3 and 4, had been used to initiate projects by December 2007. CDEs receiving NMTC allocations have up to five years for corporate or individual investors to make equity investments in exchange for tax credits. Substantially all of the cash received by CDEs in exchange for the credits must be invested in a QALICB within a year of receipt.

NEW MARKETS TAX CREDIT (NMTC) PROGRAM EVALUATION
6
NMTCs, and projecting likely outputs and outcomes.28 Such decentralized decision making suggests opportunity for variation not only with respect to outputs and outcomes but also with respect to the role played by NMTCs in project financing. Each selected project, for example, can be characterized with respect to the degree to which it depended on NMTCs to move forward. With respect to credit dependency, an important question is whether projects were eligible for conventional (nonsubsidized) financing and if such financing was available. Other questions involving the role of NMTCs in project financing are the extent to which they attracted/leveraged private investment and/or afforded financial benefits (such as favorable rates and terms).
What were the project-level results (outputs and outcomes) of NMTC investments? While the CDFI Fund asks CDEs to estimate or report on several possible project results (such as the number of permanent jobs to be created or retained, or the number of housing units to be developed or rehabilitated), it does not specify the particular outputs or outcomes required of any project. This is consistent with the NMTC program’s objective of attracting private capital to LICs through support of a range of project types that allow for a range of results. For purposes of the evaluation, projects were clustered into the following types: office, retail, mixed-use, and hotel projects; manufacturing/industrial, agricultural/forestry, and brownfields projects; social services, arts/cultural and educational projects; health facility and equipment projects; and housing projects. For each type, the following kinds of results were examined: job generation, real estate development, provision of additional or enhanced services and amenities, business creation or expansion, and tax revenue generation. The underlying assumption was that different types of projects would likely have particular kinds of results. The evaluation also examined results by other project attributes, such as size, the type of CDE and QALICB involved, and the allocation year from which the investment was made.
Did NMTCs result in area-wide outcomes? Achievement of broad, area-wide outcomes may not be possible until well after a particular project is completed and, possibly, only in conjunction with other activities and projects in the same area. And, whether such outcomes are achievable at all depends, in part, on investment size relative to the physical size and complexity of the places in which they are made. The presumptions for this evaluation were
28 However, CDEs are constrained by IRS regulations and their Allocation Agreements with the CDFI Fund. An Allocation Agreement outlines the terms and conditions of an NMTC allocation, which may include, but is not limited to the following: “(i) The amount of the awarded NMTC Allocation; (ii) the approved uses of the awarded NMTC Allocation (i.e., loans to or equity investments in Qualified Active Low-Income Businesses or loans to or equity investments in other CDEs); (iii) the approved service area(s) in which the proceeds of Qualified Equity Investments (QEIs) (any equity investment in, or long-term debt security issued by a quality community development entity) may be used, including the dollar amount of Qualified Low-Income Community Investments (QLICIs) (any capital or equity investment in, or loan to, any QALICB) that must be invested in Nonmetropolitan counties; (iv) the time period by which the applicant may obtain QEIs from investors; (v) reporting requirements for all applicants receiving NMTC Allocations; and (vi) a requirement to maintain certification as a CDE throughout the term of the Allocation Agreement.” See http://www. cdfifund.gov/ docs/nmtc/2011/2011_NMTC_NOAA.pdf

NEW MARKETS TAX CREDIT (NMTC) PROGRAM EVALUATION
7
that (a) traditional outcome measures (such as level of employment, rates of earnings, student test scores, school dropout rates, or crime rates) were not always the primary results intended for NMTC projects; (b) such results, even if they ultimately occurred, were not easily detectable in the short term; and (c) certain outcome measures not often used (such as institutional change or organizational capacity) may be of interest with respect to some NMTC projects. The evaluation, therefore, took a broad view of potential area-wide outcome measures, relying mostly on qualitative information provided by key informants and project stakeholders.
These questions are addressed in the remaining chapters of this report, which is divided into four sections: I, background; II, project initiation and financing; III, project outputs and outcomes; and IV, evaluation synthesis.
• Section I provides background for the evaluation. It consists of the present introductorychapter as well as chapter 2, which contains more information about the NMTC programand how it works, and chapter 3, which describes the study methodology. From thatpoint on, the report moves through the elements of the logic model depicted above, andaddress the key research questions noted above.
• Section II covers project initiation and financing and considers how the NMTCinvestment process works and the role of NMTCs in bringing projects to fruition. Itconsists of chapter 4, which describes project types and locations; chapter 5, whichdescribes project progression and participant attributes; chapter 6, which describesfinancial attributes of projects; and chapter 7, which examines the extent to whichNMTCs are needed.
• Section III focuses on project results (i.e., outputs and outcomes) and includes chapter8 on job generation, chapter 9 on construction and rehabilitation, chapter 10 on otherproject outcomes, and chapter 11 on area-wide outcomes.
• Section IV provides a program synthesis from a cross-project perspective; it consists ofchapter 12 on project outcome and output patterns and chapter 13 on researchimplications.

NEW MARKETS TAX CREDIT (NMTC) PROGRAM EVALUATION
8
2. NMTC PROGRAM OBJECTIVES, STATUS, AND OPERATIONS
This chapter describes the NMTC program in terms of its core objective, theoretical basis, ancillary objectives, status and evolution, and how it works (including its allocation and investment process). Such background is important for understanding not only the evaluation findings detailed in subsequent chapters but also the challenges and limitations inherent in evaluating a program as complex and diverse as NMTC.
Core Objective
Implemented through section 45D of the Internal Revenue Code (IRC),29 the NMTC program is a federal government initiative intended to attract private investment capital to low-income (and economically distressed) communities30 that otherwise would lack financing for community or economic development purposes.31 As an incentive, those choosing to invest in such communities receive a cumulative reduction in their federal income taxes worth 39 percent of the total Qualified Equity Investment (QEI) amount, applied over a seven-year period. As previously discussed, the program allows considerable flexibility with respect to the types of community and economic development projects in which investments can be made.
NMTCs are a relatively recent complement to the tradition of federal government
29 Although the federal government budget includes items associated with the administration of the NMTC program, the tax credits themselves are not factored into the budget. 30 The NMTC program’s enacting legislation, PL 106-554, 113 Stat. 2763, defines LICs for the purpose of the NMTC program as (1) any population or census tract if (a) the poverty rate for that tract is at least 20 percent, or (b) in the case of a tract not located within a metropolitan area, the median family income for the tract does not exceed 80 percent of statewide median family income, or in the case of a tract located within a metropolitan area, the median family income for the tract does not exceed 80 percent of the greater of statewide median family income or the metropolitan area median family income; (2) certain “Targeted Areas” as areas specifically designated by the Secretary as an LIC if (a) the boundary of such area is continuous; (b) the area would satisfy the requirements listed in (1) above if it were a census tract; and (c) inadequate access to investment capital exists in such area. As part of the American Jobs Creation Act of 2004 (PL 108-357,118 Stat. 1418), the “targeted areas” provision was repealed and IRC section 45D(e)(2) was amended to provide that targeted populations may be treated as LICs. A “targeted population” means individuals, including an Indian tribe, who are low-income persons or otherwise lack adequate access to loans or equity investments. 31 Neither the NMTC program’s authorizing legislation nor its rules use or define the term “community and economic development program” per se. A generally accepted definition is that community and economic development programs aim to improve resident social and economic well-being and quality of life, revitalize and sustain neighborhood and community assets, and promote community viability by, among other means, upgrading the environs; engaging in activities intended to attract, retain, or expand industrial, commercial, or service enterprises in a location; encouraging growth; creating or retaining jobs; supporting the tax base; and encouraging citizen empowerment and participation.

NEW MARKETS TAX CREDIT (NMTC) PROGRAM EVALUATION
9
initiatives supporting community and economic development through grants, loans, loan guarantees, or other means (Abravanel, Pindus, and Theodos 2010). However, it is challenging to determine which of these initiatives are most similar to NMTCs in terms of objectives, funding mechanisms, or activities. During conversations between Urban Institute researchers and several dozen prominent NMTC stakeholders at the early stage of the evaluation, some compared NMTCs to the Low Income Housing Tax Credit (LIHTC) program because both involve use of tax credits for investors—although, unlike NMTCs, LIHTCs are strictly for the construction and rehabilitation of rental housing. Others compared NMTCs to the earlier U.S. Department of Housing and Urban Development’s (HUD’s) Urban Development Action Grant (UDAG) or current Section 108 Loan Guarantee programs because they support diverse types of community and economic development projects similar to those supported by NMTCs. However, unlike NMTCs, UDAGs were federal agency grants to local governments, and Section 108 consists of loan guarantees for local governments that are secured by future Community Development Block Grant (CDBG) entitlement funds. Yet other stakeholders compared NMTCs to the federal Empowerment Zone/Enterprise Communities (EZ/EC) program because it used various tax benefits to stimulate community and economic development. But, unlike NMTCs, EZ/ECs required preparation of comprehensive community-based strategic plans and involved awards of federal grants.32
As is apparent, the NMTC program is in some ways similar to, but in significant ways different from other community and economic development programs. This will become clearer in the remainder of this chapter and report.
Theoretical Basis
While funding mechanisms and approaches vary by program, the underlying premise of community and economic development initiatives, like NMTCs, is that they are needed due to market failurewhere market forces have not resulted in an optimum allocation of resources to certain kinds of places. Indeed, a lack of access to patient (i.e., long-term), reasonably priced capital has seriously hindered the community and economic development prospects of such places despite the fact that many of them contain valuable assets and viable opportunities.
• With respect to distressed urban areas, researchers have documented a range of reasons for disinvestment (Abravanel, Pindus, and Theodos 2010). These include gaps in information available to investors about markets; relatively higher risks resulting from elevated security costs, greater tax burdens, greater costs of land
32 CDEs are required to outline their business strategies in their Allocation Application, although they usually do not include the level of detail that was included in EZ/EC plans. All federally designated EZs officially expired on December 31, 2011.

NEW MARKETS TAX CREDIT (NMTC) PROGRAM EVALUATION
10
assembly, and higher actual or perceived rates of crime; past discriminatory commercial, personal, mortgage, and small business lending practices; and population loss due to outmigration.
• With respect to distressed rural areas, researchers have identified multiple
reasons why they may be disadvantaged with respect to access to capital—somewhat different reasons from those cited for urban areas. These include fewer banks to compete for borrowers; predominately small and locally owned banks that often employ conservative lending practices; limited investment opportunities; insufficient population density to support investments; small deal sizes; lack of supporting infrastructure; lack of understanding about how equity works for venture capital investments; and lack of information available to lenders, since the costs of gathering information are high in rural areas and the existence of multiple, different, and small markets means that lenders can less readily value investments (Abravanel, Pindus, and Theodos 2010).
In recognition of the above, the NMTC program aims to improve market dynamics in distressed metropolitan and nonmetropolitan33 communities by addressing issues such as information gaps, neighborhood externalities resulting in higher real (or perceived) risk, and capital access barriers.
Ancillary Objectives
While the core NMTC program objective of encouraging private capital investment in LICs is clear in the program’s statutory authority and legislative history, there are ancillary program objectives that can either be extrapolated from the core objective or that follow logically from the program’s rules, operations, or basic principles. For example:
• Because NMTCs are intended to encourage investments in LICs, it is logical to assume that an ancillary objective is to benefit the inhabitants of such communities, directly or indirectly.
• Some observers reason that there are “two related but distinct goals that are nearly always implied if not explicitly stated in the formulation of an economic development program. One is that the benefits of the investment should flow to people with greater need for the resulting jobs and income. A second is that short-term public stimulus should leverage a long-lasting or multiplying gain in economic welfare for the area and its people” (Redburn et al. 1984, 119–120).
33 Although the community and economic development literature often refers specifically to “urban” and “rural” areas, the Tax Relief and Health Care Reform Act of 2006, PL 109-432, specifically distinguishes between “metropolitan” and “nonmetropolitan” areas.

NEW MARKETS TAX CREDIT (NMTC) PROGRAM EVALUATION
11
• A corollary of the NMTC program objective of encouraging capital investment in LICs is the notion that public subsidy should be necessary to make this happen. The logic is that if private financing were available without the subsidy, the use of scarce public resources would be unnecessary and wasteful. A logical ancillary program objective, therefore, is to use NMTCs only when they are needed to bring projects to fruition.
Based on the above, it is reasonable to conclude that, beyond the core NMTC program objective of directing capital investment to LICs, ancillary objectives are to target benefits to communities with the greatest need, provide benefits to certain types of people as well as places, encourage benefits that are sustained and preferably enhanced over time, and ensure that NMTCs are used where they are needed for capital investment to occur.
Program Status and Evolution
Between 2002 and 2011, the CDFI Fund made 664 awards to 350 CDEs, allocating $12.9 billion in tax credits.34 These allocations are typically described by the CDFI Fund not in terms of dollar value of tax credits but as dollar value of “allocation authority,” which, over the same time frame, totaled $33 billion.35 The amount of allocation authority represents the amount of QEIs that CDEs are able to raise by offering NMTCs as incentives.
Through the end of the federal government’s 2010 fiscal year,36 3,060 projects had received NMTCs (see table 2.1). For these projects, investors had claimed a total of $2.2 billion in tax credits as of 2009, with the remaining credits eligible to be claimed in future years. The total amount invested in these projects between 2002 and 2010, including NMTCs and all other funding sources, was more than $44 billion.
Since its initiation, the NMTC program has experienced regulatory changes and extensions that authorized additional allocation authority. The Community Renewal Tax Relief Act provided $5.9 billion in NMTCs ($15 billion in allocation authority) between 2000 and 2007. The Gulf Opportunity Zone Act (GO Zone) of 2005 (PL 109-135) provided an additional $390 million in NMTCs ($1 billion in allocation authority) for CDEs working in communities affected by Hurricane Katrina in 2005 (U.S. Government Accountability Office [GAO] 2010). In 2009, the
34 CDFI Fund, http://www.cdfifund.gov/docs/nmtc/2012/NMTCQEIReport-May2012.pdf. The $12.9 billion figure is calculated by multiplying 39 percent (the available tax credit) by each allocation year’s “allocation authority.” 35 While the NMTC program is often described in terms of “allocation authority,” other federal tax credits, such as LIHTC, are typically described in terms of the amount of tax credits provided. To avoid confusion, this study presents both figures, with the tax credit amounts notable for being the potential cost of the program borne by the federal government. As described in this chapter, the “allocation authority” amount does not correspond to total investment in NMTC projects, as QALICBs can access other private or public funds, against which NMTCs are not claimed. 36 This is latest date for which data on NMTC projects were available at the time the report was prepared.

NEW MARKETS TAX CREDIT (NMTC) PROGRAM EVALUATION
12
American Recovery and Reinvestment Act (PL 111-5) added $1.2 billion in tax credits ($3 billion in NMTC allocation authority). The latest extension was contained in the American Taxpayer Relief Act of 2012,37 which continued the program through 2012 and 2013 and provided $3.5 billion in tax credit allocation authority for each of those years.
Regulatory changes have resulted in some refinements to the NMTC program over time. It operated under temporary IRS regulations until the end of 2004. The Tax Relief and Health Care Act of 200638 added an NMTC requirement that nonmetropolitan counties receive a proportional QEI allocation.
37 PL 112-240, H.R. 8, 126 Stat. 2313 was enacted on January 1, 2013, and signed into law on January 2, 2013. 38 PL 109-432.

NEW MARKETS TAX CREDIT (NMTC) PROGRAM EVALUATION
13
Table 2.1: NMTC Program Characteristics, by Year of Allocation
Implementation of the NMTC program has evolved over time in response to regulatory changes, the experiences of the CDFI Fund and the IRS in administering the program and monitoring compliance, and the expanded capacity and sophistication of CDEs and their partners over time. For example,
Year
Dollar Value of NMTC
Allocation Authority to
CDEs (in $ millions)
Dollar Value of Tax Credits Allocated to
CDEs (in $ millions)
Dollar Value of Tax Credits Claimeda by
Investors (through 2009) (in $ millions)
Number of Projectsb Financedc (through
2010)
Total Dollar Amount
Invested in Projects
(NMTCs Plus Other
Sources)d
(through 2010) (in $ millions)
2002 2,486 969 0 0 0 2003 0 0 4 14 191 2004 3,494 1,363 65 174 1,482 2005e 1,965 766 172 358 3,628 2006 4,100 1,599 199 480 7,103 2007 3,893 1,518 331 594 8,702 2008 4,965 1,936 603 494 6,610 2009f 5,000 1,950 814 475 8,023 2010 3,475 1,355 * 471 8,721 2011 3,623 1,413 * * * Total 33,000** 12,870** 2,188 3,060 44,460c Sources: --Statistics of Income (SOI) Individual Income Tax Return Samples for 2003 to 2009. --SOI Corporate Income Tax Returns Samples for 2003 to 2009. --CDFI Fund QEI Report (http://www.cdfifund.gov/docs/nmtc/2012/NMTCQEIReport-May2012.pdf). --Community Investment Impact System Public Data File, released November 22, 2011. Notes: * Information not yet available. ** Annual figures are rounded, and as a result the sum of the annual figures may deviate slightly from the total figure presented.
a Tax credits are not solely claimed in the year they are allocated. Tax credits are claimed over a seven- year period: 5 percent of the total NMTC structure investment amount in Years 1–3 and 6 percent in Years 4–7. b Methodological considerations related to defining a project are discussed in chapter 3.
c The amount of NMTC financing by CDEs for a given round does not necessarily occur in the year of allocation. d The difference between the amount of credits allocated to CDEs by the CDFI Fund and the level of investment by CDEs in projects results from (a) CDEs having up to five years to issue their allocated tax credits in exchange for QEIs, and (b) the fact that after receiving a QEI, CDEs having up to 12 months to invest substantially all of the proceeds in projects. e The Total Allocation for Round 5 includes $9 million of NMTC allocation authority that was reclaimed by the CDFI Fund from two prior Round 1 allocatees and subsequently reallocated in Round 5. f The Total Allocation for Round 9 includes $123 million of NMTC allocation authority that was rescinded surrendered to the CDFI Fund from prior Rounds and subsequently reallocated in Round 9.

NEW MARKETS TAX CREDIT (NMTC) PROGRAM EVALUATION
14
• At the CDFI Fund, the application process for tax credit allocations has been used to further direct CDEs toward investments in more distressed communities (Bershadker et al. 2008) and to ensure diversity in award recipients—with a goal of matching the proportion of awards to the proportion of qualified applicants that primarily serve nonmetropolitan areas (GAO 2010). Also, the NMTC “industry” (including CDEs, banks and other investors, developers, and advisers, such as lawyers, accountants, and community development consultants) has actively worked to expand opportunities, attract and educate partners, and advocate for the program.
• Related to these efforts, policy diffusion has occurred at the state level, with 14 states having enacted their own NMTC programs and an additional 5 states having introduced legislation to establish a state NMTC program.39
How the NMTC Program Works
This section identifies the key parties involved in the NMTC program and describes both the process by which the CDFI Fund allocates tax credits to CDEs and the NMTC investment process that subsequently transpires.
Key parties. The NMTC program is initiated when the CDFI Fund awards tax credit allocation authority to CDEs on a competitive basis. Allocation authority is the amount of investment for which investors can claim a federal income tax credit of 39 percent. The rules governing the credit are contained in the IRC, and the IRS is responsible for monitoring compliance with the IRC. In return for tax credits, investors supply CDEs with capital that is used to make debt or equity investments in recipient entities (QALICBs) located in qualified LICs. Such investments, then, involve at least three types of entities: CDEs, investors, and QALICB recipients.40 These three key parties, as well as the IRS, are described below:
• CDEs. These are domestic corporations or partnerships that serve as intermediary vehicles for the provision of loans or investments to QALICBs, or financial counseling—called Qualified Low-Income Community Investments (QLICIs).41 To become certified as a CDE, an organization must submit an application to the CDFI Fund that demonstrates it is certified as a legal entity at the time of application, has a primary mission of serving LICs, and maintains accountability to residents of LICs though their representation on any governing board of, or any advisory board to, the entity. CDFIs and Specialized Small Business investment Companies are automatically able to become CDEs by registering with the CDFI Fund.
39 http://www.novoco.com/new_markets/nmtc/state_nmtc_programs.php. Accessed June 4, 2012. 40 A more detailed discussion of the attributes and roles of the key parties is found in chapter 5. 41 QLICIs are the investments in QALICBs, located in low-income census tracts (LICs).

NEW MARKETS TAX CREDIT (NMTC) PROGRAM EVALUATION
15
• Investors. These primarily corporate entities, but sometimes individuals, may or may not
be affiliated with CDEs. They are eligible for federal tax credits in return for making QEIs in CDEs that remain for seven years. Tax credits received by investors can be claimed over the seven-year period—5 percent of the investment for each of the first three years and 6 percent of the investment for the remaining four years.42 NMTCs are nonrefundable, meaning that taxpayers do not receive payments for credits that exceed their total tax liability.
• QALICB recipients. NMTC investment recipients can be for-profit or nonprofit. They carry out projects using CDE investments and, often, capital from other sources as well. As previously discussed, there is considerable flexibility as to the types of projects QALICBs can undertake—including those involving constructing or rehabilitating real estate and those financing business operations. The real estate can involve commercial, industrial, retail, manufacturing, or mixed uses and include development or rehabilitation of for-sale housing units or community facilities used for such purposes as child care, health services, museums, or charter schools.43
The IRS. Section 45D of the IRC permits individual and corporate taxpayers to receive credits against their federal income taxes for qualified investments. The IRS specifies the regulations governing the NMTC program and is responsible for monitoring compliance with Section 45D. An important compliance issue involves what are termed “recapture events”—where (a) investors are no longer able to claim tax credits and (b) those who originally made equity investments and subsequent holders of the investments are required to increase their income tax liability by the amount of the credits previously claimed plus interest for each resultant underpayment of taxes. Three events trigger a recapture event: a CDE ceases to be certified; a CDE does not satisfy the substantially all requirement to invest substantially all of the cash received from an investor during the seven-year period; or a CDE redeems the investment.
The NMTC allocation process. The CDFI Fund’s process for making NMTC awards takes place in phases. Initially, CDEs submit application packages in which they respond to questions about their track record of investment activities, dollar amount of allocated tax credits requested, and plans for use of tax credits. The applications are reviewed and scored by external reviewers. CDEs that meet or exceed an overall scoring threshold and a threshold in each of four application sections (business strategy, community outcomes, management capacity, and capitalization strategy) advance to the next phase. That phase involves
42 If they elect to do so, investors can carry the credit forward for 20 years or back for 1 year. 43 NMTCs cannot be used to support rental properties that derive 80 percent or more of their income from residential dwelling units; however, this restriction does not apply to for-sale housing. In addition, certain types of businesses are ineligible to receive investments, including golf courses, race tracks, gambling facilities, and stores principally selling alcoholic beverages.

NEW MARKETS TAX CREDIT (NMTC) PROGRAM EVALUATION
16
determination, by CDFI Fund officials, of which CDEs will receive allocations and how much each will receive. The determination is based on final ranking scores.
In recommending allocation amounts, CDFI Fund staff members have historically been instructed to consider the amount of equity investment each CDE can expect to raise in two years, the amount of NMTC investment in LICs that can be deployed within three years,44 the quality of the financial products being offered, and the projected impact on LICs or persons. Not all of the CDEs that satisfy the minimum application score thresholds receive allocations. Because the process is competitive and NMTC allocations have been in high demand throughout the program’s history, the allocation amounts requested through 2011 were seven times greater than the amounts available.
The NMTC investment process. CDEs that receive NMTC allocations have up to five years to find corporate or individual investors to make equity investments in exchange for the tax credits. Substantially all of the cash CDEs receive in exchange for the tax credits must be invested in a QALICB within a year of receipt and used for residential, commercial or industrial projects or other types of investments (such as purchasing loans from other CDEs).
The NMTC application process favors CDEs that will offer preferential rates and terms to QALICBs and make deals in qualifying areas that are more highly distressed—although they are given a high degree of flexibility with respect to how to meet these requirements. For example, they may choose to offer lower-than-standard origination fees; accept nontraditional collateral; allow a lower-than-standard debt service coverage ratio; provide more equity financing or flexible debt financing (e.g., equity products, equity equivalent terms, debt with equity-like features, subordinated debt); assess lower (i.e., below-market) interest rates; allow longer-than-standard amortization schedules; or permit lower-than-standard loan loss reserves. CDEs generally use both public subsidy (not only through the NMTC program but, sometimes, other federal, state, or local programs as well) and private sector investment dollars to package investment deals in LICs. These are often very complex arrangements and consist of either nonleveraged (direct or pooled) or leveraged investment structures.
In both direct and tiered (including leveraged) investment structures, equity investors in a CDE are able to claim the NMTC on their tax returns and, after leaving the equity investment in the CDE for the seven years during which they are eligible to claim the credits, they can redeem their original stake in the CDE (GAO 2007b).45 Note that figures 2.1 to 2.3, below, depict only the NMTC financing provided to QALICBs, although each of the structures may include non-
44 The “raise in two, deploy in three” guidance will no longer be in place beginning with the 2012 allocation round. 45 While the tax credit–facilitated funds must remain with the QALICB for seven years, unless repaid, investors can dispose of a holding by selling their share to another investor. Such a sale is not a recapture event.

NEW MARKETS TAX CREDIT (NMTC) PROGRAM EVALUATION
17
NMTC sources as well. In such cases, non-NMTC sources are frequently understood by the QALICB and investors to be part of the same “project” financing.46
• A direct nonleveraged investment involves a single investor making a QEI in a CDE that reinvests the money in a QALICB (figure 2.1).
• A pooled (or tiered) nonleveraged investment is similar to a direct investment, except that multiple investors provide investment capital to a pass-through entity that combines funds from several sources and then makes a QEI in a CDE (figure 2.2). The pass-through entity is often managed by the CDE.
• In a leveraged investment structure (figure 2.3), investors form a pass-through entity (such as a limited liability company taxable as a partnership) that obtains a loan from a bank (referred to as the leveraged lender) in order to make a larger QEI. After combining their equity with the capital from the loan, the partnership then makes a QEI in a CDE that, in turn, makes a QLICI in a QALICB. Thus, there are two classes of investors: debt investors (who are interested in an interest rate return) and equity investors (who receive their return on the capital).
46 A bank loan is one source of leverage debt. CDEs also package together concessionary financing from any number of sources (HUD 108 loans, CDBG monies, state and local loans, grants attracted by the QALICB, etc.) and use it collectively as leverage “debt” into the investment partnership. That serves to lower the interest rate on the senior loan and make a number of community facility and other projects more economically feasible.
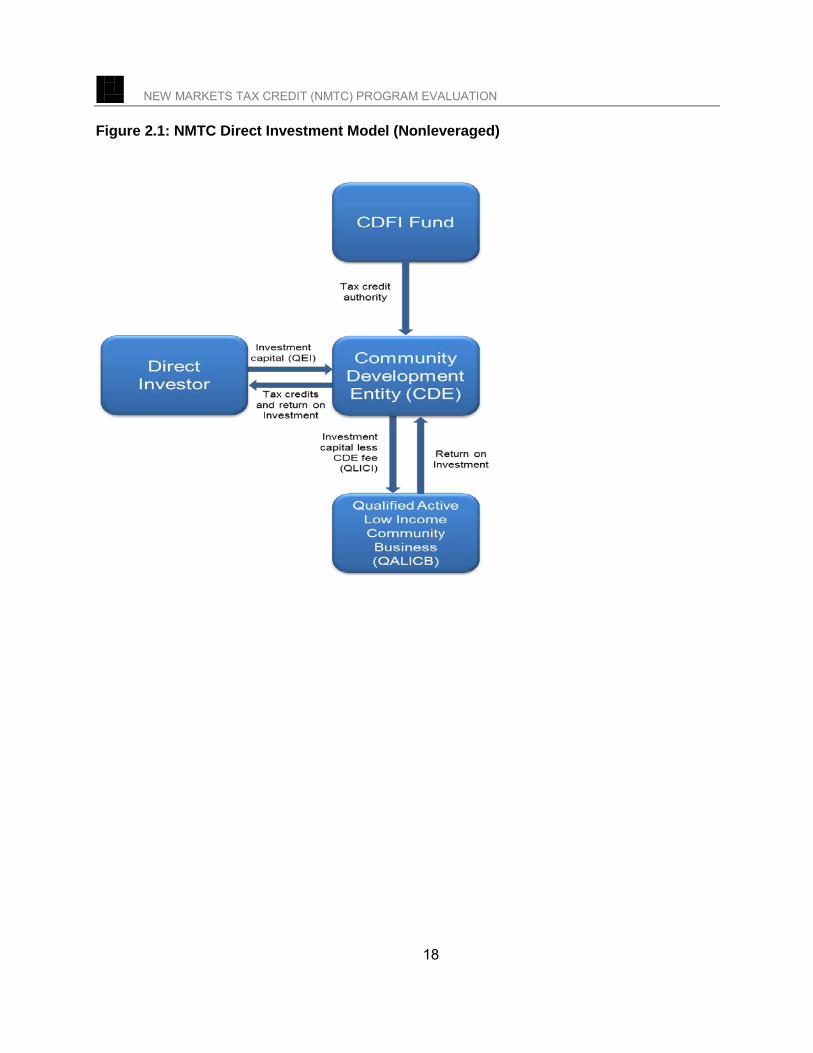
NEW MARKETS TAX CREDIT (NMTC) PROGRAM EVALUATION
18
Figure 2.1: NMTC Direct Investment Model (Nonleveraged)

NEW MARKETS TAX CREDIT (NMTC) PROGRAM EVALUATION
19
Figure 2.2: NMTC Pooled Investment Model (Nonleveraged)

NEW MARKETS TAX CREDIT (NMTC) PROGRAM EVALUATION
20
Figure 2.3: NMTC Leveraged Investment Model

NEW MARKETS TAX CREDIT (NMTC) PROGRAM EVALUATION
21
Leveraged investment structures are attractive to investors because they are able to claim tax credits on 39 percent of the combined equity and debt investment, not just the equity investment, as is the case in the nonleveraged structures. From the perspective of debt lenders who do not receive the tax credits, this investment structure may be attractive because the loan-to-value ratio47 is more favorable than it would have been if the debt were not being combined with the investor’s equity. The more favorable ratio may compensate the leveraged lender for assuming a greater degree of risk. Although the leveraged model has the potential to attract more investors, larger investments, and higher-risk projects, the deals can become quite complex and involve multiple layers of investors. This complexity also can make it more challenging to understand the sequence of securing funding sources and to calculate the total project costs, amounts of subsidy, and fees for program evaluation purposes.
47 The loan-to-value ratio expresses the amount of a loan as a percentage of the total appraised value.
NEW MARKETS TAX CREDIT (NMTC) PROGRAM EVALUATION
22
3. METHODOLOGY AND DATA SOURCES To learn about the intent and implementation of the NMTC program and document its
key features and outcomes, the evaluation sought to identify the roles of various participants, consider the financing arrangements that constituted project “deals,” determine whether and how the program increased investment in LICs, and, most important, examine the results of NMTC projects. For these purposes, a range of background and preparatory activities were undertaken, CDFI Fund administrative records and community attributes data were obtained and analyzed, and new primary data were collected and analyzed. The objective was to use multiple sources of information, where appropriate, and offer the strongest evidence available in light of the budget available for the evaluation.
This chapter presents the basic design of the evaluation, describes the various data-collection and analysis efforts that were used, and acknowledges the evaluation’s basic limitations and constraints.
Background and Preparatory Research
For designing the evaluation, it was essential to understand not only the NMTC program’s legislative and administrative history and its mandate, but also its context (i.e., its similarity to, or difference from, other past and present government programs intended to improve the development and economic viability of LICs). Initial activities for this purpose consisted of an extensive review of relevant community and economic development, performance measurement, and tax credit literature, and discussions with key NMTC stakeholders.48
Literature that was reviewed covered the NMTC program as well as community and economic development programs more generally. The focus was on how such programs have been evaluated and what the evaluations concluded. The review resulted in a report titled Evaluating Community and Economic Development Programs (Abravanel, Pindus, and Theodos 2010).
Early on,49 the evaluation team held a series of informal telephone and in-person discussions with 25 NMTC program stakeholders, including those who had been involved in the original planning and design of the program; congressional and GAO staff; program administrators; and prominent practitioners, advocates, and researchers. Stakeholders were selected to allow for a broad range of perspectives. They were identified through the
48 Although IRS regulations were consulted as part of this evaluation, interviews were not conducted with any IRS staff. 49 Discussions took place in two waves, initially during September 2006 and, later, between March and May 2008.
NEW MARKETS TAX CREDIT (NMTC) PROGRAM EVALUATION
23
suggestions of CDFI Fund staff, project consultants, and the discussants themselves. The following topics were addressed in these discussions: initial planning for, and design of, the NMTC program; interests and perceptions of members of Congress; program implementation and advocacy; program advantages and disadvantages; program evaluation emphases, issues, and challenges; and recommendations regarding the sample of projects to be used in an evaluation conducted at this stage of the program’s history.
Administrative and Secondary Data
Two kinds of existing data were collected for purposes of the evaluation: CDFI Fund program administrative data and secondary data on community attributes.
CDFI Fund administrative data. The CDFI Fund’s Community Investment Impact System (CIIS) administrative data set50 was used for sampling purposes and to generate project profiles for use in relation to primary data collection. Project profiles consisted of information on locations, CDE participants, financing (i.e., sources and amounts, lien position, amortization type, loan status, loan terms), jobs created or retained (i.e., at initiation, at reporting, projections), and real estate developed (i.e., projected square footage of real estate, number of housing units, asking rents, and capacity of community facilities).51 A second source of administrative data—on CDFI Fund CDE applicants and allocations—was merged with CIIS data to provide information on CDE characteristics, such as type of organization, parent entity, and for-profit or nonprofit structure.
Secondary data on community attributes. Selected secondary data sources complemented both CDFI Fund administrative records and primary data collection. The secondary sources were used to produce evidence concerning the program’s primary objective of attracting capital to low-income, economically distressed communities to further their community and economic development.
The U.S. Census Bureau’s American Community Survey (ACS) was relied on for information on the attributes of census tracts in which NMTC projects were located. The ACS is the most comprehensive and up-to-date source for this information.52 Although a different source, the 2000 Decennial Census, had been used by CDEs and the CDFI Fund to establish project eligibility for NMTCs, such data were collected before the years in which projects
50 This is a web-based data collection system that CDEs use to submit Transaction Level Reports and Institutional Level Reports to the CDFI Fund. 51 In subsequent years, the CDFI Fund has improved the way it classifies projects in the CIIS data system. These improvements have minimized the potential for representing the same project multiple times in CIIS records—for example, when two CDEs both contribute NMTCs to a deal, and therefore both report project attributes in the CIIS data system. For additional detail about how the CDFI Fund defines a project in CIIS, see http://www.cdfifund.gov/ciis/2012/FY%202012%20Allocatee%20TLR%20Data%20Point%20Guidance.pdf 52 Census tract–level data from five-year aggregate estimates were used for the years 2005 to 2009.

NEW MARKETS TAX CREDIT (NMTC) PROGRAM EVALUATION
24
sampled by the evaluation had actually been initiated. Accordingly, ACS data were more appropriate for describing tract attributes in the initiation years and immediately thereafter.53 The ACS covers the following domains, which are relevant for understanding communities with NMTC investments: income, poverty, and employment.
Additional data used in the evaluation were from the Home Mortgage Disclosure Act Loan Application Register and Aggregate Report. This dataset contains the universe of home mortgage originations (including type and condition of loans), aggregated by geography.
Primary Data Collection
The evaluation team sought to identify and report on actual project outputs and outcomes, as distinct from NMTC program participants’ intentions, objectives, or projections when they undertook NMTC projects. This required collecting new information beyond what was available through administrative records. It also required limiting the information collection to projects that had been initiated early in the NMTC program’s history to allow sufficient time for them to have been completed and for actual outputs and outcomes to have become apparent.
In brief, new data were collected using the following methods:
• Semistructured telephone interviews were conducted with persons representingCDEs, QALICBs, investors, and/or other key parties associated with a random sample of8054 of 2,031 early-year NMTC projects (i.e., those initiated during the program’s firstfour allocation rounds, 2002 through 2006).
• An online, predominantly closed-ended survey was conducted of representatives ofa separate random sample of 380 QALICBs that participated in the 2,031early-yearNMTC projects.
• An additional online, predominantly closed-ended survey was conducted of aseparate sample of 380 community and economic development officials located incommunities in which at least one NMTC project had been initiated during any allocationround beginning in 2002 and ending in 2007.
53 Undoubtedly there may be differences in the extent of poverty or median family incomes between the 2000 Census and the five-year aggregate estimate used for the 2005–2009 ACS. Furthermore, it is possible that the NMTC projects themselves may have contributed to some of those changes. Given the size of projects relative to the size of the neighborhoods or areas in which they take place and the time frame needed to effect change in indicators, such as income and poverty, the research team believed the changes attributed to NMTC were likely to be small and, therefore, made the decision to use more recent data. 54 The numbers given in this list represent original sample sizes, not numbers of respondents. The latter are provided in the text below.

NEW MARKETS TAX CREDIT (NMTC) PROGRAM EVALUATION
25
CIIS administrative data were used as the basis for sampling projects for the telephone interviews and online QALICB survey, and for identifying communities in which there had been NMTC projects for the community and economic development officials’ survey. However, the units for CIIS records that were available at the time the samples were drawn consisted of financial transactions, not projects.55 For the NMTC program, transactions are distinct loans and investments in a CDE’s NMTC-funded portion of its portfolio. These transactions had to be grouped together in a logical fashion that represented their purposes and locations in order to evaluate their outcomes. Hence, a group of transactions was considered to be a “project” when they met the following conditions: the loans were made to, or the investments were in, a QALICB for which NMTCs were claimed by a lender or equity investor; the NMTC loans or investments occurred in the same location; and, if there was more than one NMTC loan or investment, the respective QALICBs or CDEs had to consider them to be part of a single project with respect to the activities financed, their purposes, and expected outcomes.56 Once a list of projects had been established based on this process, they became the units of analysis for purposes of sampling, data collection, and analysis.
A critical feature of the evaluation’s primary data collection components was the use of random sampling. Within the sampling strata (described below), each project had an equal and known probability of selection. This distinguishes the evaluation from other efforts to document or highlight NMTC program activities and from results that are based on purposive samples.
Each of the primary data collection efforts is discussed in detail below.
Telephone interviews with parties to NMTC projects. A sample of 80 projects was randomly drawn from the universe of all NMTC projects initiated during allocation years 1 through 4, based on CIIS data transactions that had been initiated through December 2007.57 The sample was stratified by allocation round, distinguishing among round 1 (allocation year 2002), round 2 (allocation year 2003/4), and rounds 3 and 4 (allocation years 2005–2006). Within each stratum, projects were randomly selected such that each project had an equal probability of selection; however, a smaller-than-proportionate number of projects was selected from rounds 1 and 2 and a larger-than-proportionate number was selected from rounds 3 and 4.58 The rationale for disproportionate sampling by allocation round was that both CDFI Fund and some external observers raised the possibility that rounds 1 and 2 projects might be somewhat atypical of how the program had evolved since then and, therefore, unrepresentative
55 The CDFI Fund has since developed an approach to consolidate and aggregate transactions into a single project, and continues to refine its data system. 56 This information was gathered through communications with the respective QALICBs and CDEs. 57 “Projects” whose purpose was capitalization of other CDEs were excluded from the universe for sample-selection purposes. 58 This is discussed further in the section titled Statistical and Analytical Considerations, below.

NEW MARKETS TAX CREDIT (NMTC) PROGRAM EVALUATION
26
of the program as a whole.59 When the sample was analyzed as a whole, the data were weighted to account for the disproportionate selection by stratum.
In addition to stratification by round, projects were selected within three other strata: metropolitan and nonmetropolitan, business purpose (categorized into real estate, business, and mixed purpose), and CDE parent type (categorized into nonprofit and for-profit). Sampling across these strata was in proportion to projects’ representation within the universe. For example, if 20 percent of projects were located in nonmetropolitan areas, proportional sampling by location ensured that 20 percent of the sampled projects were in nonmetropolitan areas. Sampling within these strata ensured that projects selected were in proportion to their prevalence in the universe, which might otherwise not be the case for any particular simple random sample.
For each project in the sample, a range of stakeholders was interviewed by telephone. They included the respective CDEs, QALICBs, investors, and, possibly, another community or project stakeholder; the latter might include an attorney, accountant, local official, representative of a community group, or others with a stake in or knowledge of the sampled project. Interviews were guided by semi-structured, topical protocols that contained closed-ended questions, open-ended questions, and strategic probes. This approach allowed for both flexibility and “drilling down,” where appropriate, in order to capture important details about projects and establish the evidentiary basis for summary responses.
Prospective respondents were informed that the Urban Institute and the CDFI Fund were interested in understanding and articulating the benefits that the NMTC program may bring to LICs and that their projects had been randomly selected for inclusion in the evaluation.60 In
59 This was because some early-round CDEs may have invested in projects that were already in the pipeline when the NMTC program began and also because both round 1 and 2 CDEs, according to the CDFI Fund, had entered into allocation agreements that had fewer conditions than those that were applied in later rounds. For example, there were initially fewer requirements to invest in highly distressed communities and no prohibitions against refinancing of real estate. Also, at the time samples were drawn, many fewer round 3 and 4 projects had been initiated than round 1 and 2 projects, such that simple random sampling would have resulted in a relatively small proportion of the former. Oversampling of round 3 and 4 projects ensured a sufficient number of such projects in the sample to allow for testing the hypothesis that the earliest projects were somehow different from later ones. If analysis revealed that this was the case, the evaluation team would be in a position to assess separately that portion of projects reflecting the program’s evolution. If it turned out not to be the case, the full complement of early-year projects could be assessed without distortion by weighting the sample to compensate for the disproportionate selection of earliest and later round projects—allowing for generalization to the full program. 60 Prospective respondents were informed that participation was voluntary and that the interview was neither a regulatory review nor an audit of their project but, rather, a source of additional information to assist in better understanding the NMTC program. It was explained that, as is customary for program evaluations, the information provided would be combined with information received from all other respondents and that the Urban Institute would not cite or report responses in any way that would identify individual respondents, organizations, or projects.

NEW MARKETS TAX CREDIT (NMTC) PROGRAM EVALUATION
27
introducing the series of interviews, respondents were provided reference information from the CIIS, such as the amount and date of the loan/investment, to ensure that the project that was sampled was, indeed, the focus of the interview.61
Telephone interviews were initiated in early April 2011, continued for nine months, and were completed in December 2011. Interviews were obtained for 70 projects—a project-level response rate of 87.5 percent. The number of interviews per project ranged from one to five, with an average of two. There were no statistically significant differences with respect to project features (as identified in the CIIS) between sampled projects where interviews were conducted and those where they were not. For reporting purposes, the telephone interview projects were weighted to account for differential probabilities of selection by round-related strata but not adjusted for nonresponse.
Interviews with CDEs and QALICBs each took approximately 90 minutes and covered the following topics: background information about the CDE/QALICB, how projects were initiated and implemented, sources of financing, the role that NMTCs played in the financing package, and project outcomes. The latter included, but were not limited to, direct outcomes, such as real estate, employment, taxes, and community amenities, services and facilities; and indirect outcomes, such as area-wide effects. Because some information requested of CDEs and QALICBs required checking existing reports or records (e.g., project financing sources, types and amounts of financing, QALICB revenue/budget information, QALICB employment, and QALICB real estate development outcomes), a brief online information sheet was sent to interviewees for completion in advance of the interviews. Information reported to the CDFI Fund, online information sheets, and additional online background research on projects were all used to tailor each telephone discussion to the particulars of the respective projects.
Interviews with investors took approximately 30 minutes each and covered background information about the investors; the investment decision and process; the roles NMTCs played in the financing packages; project outcomes; and whether, after the financing phase, the investors were familiar with the projects.
Interviews with other stakeholders also took approximately 30 minutes each. They captured information about community context, project background, project initiation and implementation, the role that NMTCs played in the financing package, and project outcomes. These interviews provided perspectives about the projects from parties other than the principal CDEs, QALICBs, and investors.
Each of the interviews concluded with the solicitation of general comments, which allowed respondents to address their experience(s) with the NMTC program or make recommendations for program improvement.
61 This was necessary because many CDEs, and sometimes QALICBs, had been involved in more than one NMTC project.
NEW MARKETS TAX CREDIT (NMTC) PROGRAM EVALUATION
28
Online survey of QALICBs. A second primary data collection effort involved an online survey of QALICBs. It was designed to complement the telephone interviews and examine the characteristics and outcomes of a larger number of projects than could be included in the telephone interview sample. It was administered to a random, equal probability sample of 380 QALICBs. Each was associated with an NMTC project that was supported from allocation rounds 1 through 4 that had reported at least one financial transaction through the end of 2007. The sample excluded the 80 QALICBs sampled for telephone interview purposes. Because the CDFI Fund does not maintain QALICB contact information, it was necessary to obtain this information from the respective CDEs. This process resulted in obtaining contact information for 345 of the 380 sampled QALICBs.62 Additional information obtained about sampled projects required further exclusions, resulting in a final sample frame of 318 QALICBs.63
The online survey of QALICBs was launched in October 2011 and remained open for two and a half months, closing in late December 2011. A total of 176 surveys were completed—a response rate of 55 percent. Nearly 80 percent of respondents completed the survey in its entirety; the remaining 20 percent stopped at some point before the end of the survey. Using CDFI Fund administrative data, survey respondents were systematically compared with survey nonrespondents, and no statistically significant differences were observed. Because all projects in allocation rounds 1 through 4 had an equal probability of selection, there was no need to weight the QALICB sample for analytic purposes.
The survey averaged approximately 30 minutes to complete and consisted primarily of closed-ended questions relating to background information about the QALICBs, how projects were initiated and implemented, sources of financing, the role NMTCs played in the financing package, and project outcomes. The outcomes included, but were not limited to, direct outcomes (such as real estate, employment, taxes, and community amenities, services, and facilities) and indirect area-wide outcomes (such as changes in neighborhood level of distress, the project’s visibility in the community, and spillover effects). Where possible, the survey
62 Not all CDEs provided contact information: 22 CDEs decided not to share QALICB contact information, either because they considered it to be proprietary or for other reasons; 12 CDEs did not return numerous telephone calls and/or respond to multiple e-mails; and one CDE reported that it had lost its QALICB contact information. 63 Among the 345 QALICBs for which contact information was available, 16 could not be surveyed because they were either in foreclosure or involved in a workout arrangement (five projects), had distinct project identifiers in the CIIS but turned out to be duplicates of other sampled projects (eight projects), or had been included in pretest interviews (three projects). Also, when direct contact was made with QALICBs, 10 were determined to be ineligible for the survey. The reasons included the fact that some of them with unique project identifiers turned out to be related investments, whereas others had never consummated an NMTC investment. Finally, one project was dropped from the survey sample because it was included in both the online survey of QALICBs and the telephone interviews, as it appeared twice in the CIIS data system.

NEW MARKETS TAX CREDIT (NMTC) PROGRAM EVALUATION
29
questions were identical or comparable to the closed-ended questions asked during the telephone interviews, which allowed for combining the two samples for some analytic purposes. The survey also contained a short open-ended section that allowed respondents to provide additional, individualized comments about their experiences with the NMTC program.
Online survey of local community and economic development officials. A third primary data collection component involved an online survey of local community and economic development officials. It was designed primarily to understand how the NMTC program fit into local community and economic development planning, and the extent to which local officials were aware of NMTC projects and/or were involved in initiating or shaping them. A simple random sample of 380 communities was drawn from the 617 communities (i.e., cities or counties) in which at least one NMTC project had been initiated as of the end of 2007. Various sources were consulted to identify a community or economic development official in each such community for purposes of completing the online survey. The survey was launched in March 2011, remained open for four months, and closed in July 2011. A total of 309 surveys were completed—a response rate of 81 percent.
The introduction to the survey and survey instrument did not focus on any particular NMTC project within the community but, instead, dealt with generic issues related to community and economic development activities and programs and the NMTC program. In fact, however, no specific reference was made in the introduction to the survey to the NMTC program per se, as the survey was not designed to assess the program or specific NMTC projects. The survey took approximately 30 minutes to complete and consisted primarily of closed-ended questions relating to the types of federal, state, and local programs and funding sources used by the respective localities for community and economic development purposes; awareness of the NMTC program; and whether NMTC project investments had been consistent with local community and economic development strategic plans. The survey also contained a short open-ended section allowing respondents to include any additional comments about their experiences, if any, with the NMTC program.
Statistical and Analytical Considerations
As mentioned above, the interview sample required weighting for analytic purposes. This is discussed briefly below. Also included in this section is a discussion of the circumstances under which telephone interview data and QALICB online survey data are either reported separately or combined in this report, and a note on sampling error.
Sample weights. Because the telephone interview sample was drawn from the CIIS universe of transactions/projects in four strata (based on allocation round), and because the strata were sampled in a fashion that was disproportionate to the universe of projects, it is important to recall two distinct issues—one involving sampling procedures and the other involving analysis. With respect to sampling, more projects than were proportional to the universe were sampled from rounds 3 and 4 to ensure that there would be a sufficient number of projects from these rounds in the sample for round-by-round analyses. This decision resulted

NEW MARKETS TAX CREDIT (NMTC) PROGRAM EVALUATION
30
in a sample of projects that disproportionately represented the various rounds. Therefore, for analytical purposes, sampling weights were calculated and used to adjust the total sample so as to ensure that it appropriately represented the universe of round 1–4 projects.
Additionally, as with any sample, its relatively smaller size versus that of the universe meant that each sampled project represented multiple projects in the universe. For analytic purposes, therefore, sample estimates to the full CIIS universe of round 1–4 projects also relied on population weights. This adjustment allowed the sampled projects to be scaled to represent appropriately the number of projects in the universe that each stood for. Different population weights were used when the telephone and online survey data were combined for analytic purposes as opposed to when they were analyzed separately (see below).
Sample combination. Where the same or very similar questions were included in both the QALICB survey and telephone interviews, responses were first considered separately to compare the results. Data from the two sources were ultimately combined for reporting purposes when the following criteria were met: (1) differences in responses between the two sources were not statistically significant,64 and (2) the mode of data collection was considered not to have affected respondents’ understanding of the questions or their responses. Therefore, in some of the analyses presented in this report, responses from the two sources are combined to result in a larger and more robust sample. In other instances, however, the two samples are either presented separately or only the source that is most appropriate is presented.
Sampling error. No sample perfectly mirrors the population from which it is selected, meaning that estimation of program-level effects based on sample statistics necessarily include some degree of error.
• Given a 95 percent confidence interval and a respondent sample size of 70 for thetelephone interviews, estimated proportions close to 50 percent will have margins oferror of plus or minus approximately 12 percentage points. Estimated proportions closerto 90 percent or 10 percent will have confidence intervals of plus or minus approximately7 percentage points.
• Given a 95 percent confidence interval and a respondent sample size of 178 for theQALICB survey,65 estimated proportions close to 50 percent will have margins of error ofplus or minus approximately 5 percentage points; estimated proportions closer to 90percent or 10 percent will have confidence intervals of plus or minus approximately 3percentage points.
64 At the .05 level. 65 Some online survey questions had item response rates that are lower than 178; this occurred whenever some, but not all, respondents answered questions because of skip patterns or other reasons. The same applies to the telephone interviews. Lower item response rates increase the confidence interval proportionate to the square root of the difference in sample size.
NEW MARKETS TAX CREDIT (NMTC) PROGRAM EVALUATION
31
• When the QALICB survey responses are combined with those of the telephone interview sample, the resulting sample reduces the QALICB confidence intervals, above, by approximately plus or minus one-half of one percentage point.66
Limitations and Constraints
It is important to view this evaluation in context. This is the first comprehensive evaluation of the NMTC program and, as such, should be considered only the beginning of an ongoing process of performance measurement and evaluation. Before beginning the evaluation, the evaluation team prepared an extensive evaluation plan for the CDFI Fund that included a core evaluation and several optional enhancements. The evaluation presented in this report executes only the core part of that plan, with some restrictions, such as a reduction in the recommended size of the telephone interview sample of projects for budgetary reasons. In reading this report and interpreting the findings, therefore, it is important to consider several limitations pertaining to project time period, data collection modes, response rates, and evaluation objectives.
As previously discussed, the data collected and findings reported in this document pertain to early-year NMTC projects—those supported by allocations awarded in rounds one through four and initiated before December 2007. This report does not provide evidence as to whether these projects differ from later-year projects, and there is no empirical basis for speculating about the likelihood or nature of any such differences.
In terms of data collection mode, the evaluation did not include on-site work. There is some disadvantage in not having visited a project or met in person with stakeholders, which would have allowed for direct observation of the physical site and facility, the possibility of review of documents, such as financial protocols or employment rosters, and the identification of a network of other interested or affected parties. Another limitation that applies to both the telephone interview and online survey methods is respondent recall. To the extent that a data collection method relies on respondent recall, the accuracy of the information provided about how projects were initiated and evolved could have been compromised by time (including staff turnover) or hindsight.
Although response rates were good for all data collection activities and subsequent analysis revealed no systemic nonresponse bias, the following data collection challenges may have affected responses: the difficulty in clearly identifying projects when drawing a sample from CIIS records; CDE, investor, or QALICB concerns about confidentiality; and the complexity of some NMTC financial arrangements. For example, some respondents involved in multiple
66 There is a trade-off between precision and confidence levels. For smaller ranges, one must accept a lower degree of confidence that the interval contains the true population value. Further, sampling for the QALICB online survey and telephone interviews required use of statistical weights to account for sampling design (e.g., stratification). Design effects should yield estimated proportions closer to those of the population but also increase the confidence intervals.

NEW MARKETS TAX CREDIT (NMTC) PROGRAM EVALUATION
32
projects were unsure which project they were being asked to report about; some CDE respondents were unclear about whether to answer certain questions from the perspective of their parent entity or their own organizations; and some QALICB respondents seemed unaware that NMTCs were part of their financing package. Telephone interviews offered greater opportunity to clarify these issues with respondents than did the QALICB survey. However, a number of QALICBs survey respondents did contact the evaluation team with questions, in order to resolve such issues.
Finally, the evaluation does not include a counterfactual analysis, which would have required either an experimental or quasi-experimental design to estimate what outputs and outcomes would have occurred without NMTCs to prove that the tax credits caused the results. To do this, NMTC communities or neighborhoods could have been compared with similar communities or neighborhoods that (a) did not contain NMTC projects but had comparable projects financed without NMTCs, or (b) had no such projects. The process of designing such evaluations involves, first, selecting the outcomes of interest and specifying hypotheses. The next steps involve identifying appropriate data sources for comparison purposes, selecting the comparison sample(s), obtaining comparison data, and identifying key variables to control for in the statistical analysis.
The design of this evaluation allowed for identifying outputs and outcomes of interest and specifying hypotheses, but not drawing causal inferences. The latter might be more feasible if the evaluation had focused on a smaller number of locations, purposively selected because they had concentrations of NMTC projects. However, there are trade-offs between taking a program-wide perspective and conducting intensive analyses of a small number of sites. In designing this initial evaluation, the choice was made to use random selection and include a larger number of projects to get the broadest and most objective assessment of the full NMTC program. Although this is a reasonable and appropriate first step, it does not allow for impact assessment. That should certainly be an objective for subsequent research.

NEW MARKETS TAX CREDIT (NMTC) PROGRAM EVALUATION
33
SECTION II:
PROJECT INITIATION AND FINANCING

NEW MARKETS TAX CREDIT (NMTC) PROGRAM EVALUATION
34
INTRODUCTION TO SECTION II The chapters in this section describe the implementation of NMTC projects, illustrating
how the investment process works, the characteristics of participants in the process, investment and investment structure types, and the role of NMTCs such as with respect to leveraging other resources or bringing projects to fruition. The information is necessary to understand how the program encourages capital investment in LICs, and the extent to which NMTCs have attracted investment in such places. Information on project type, project initiation, and project evolution contributes to understanding the investment process, and also provides the context for measuring and assessing outputs and outcomes—the focus of section III. As will become apparent, the role NMTCs can vary depending on the unique circumstances and timing of each project.
Chapter 4 describes project types and locations and presents a typology of projects that is used for analytic purposes throughout the remainder of the report. Chapter 5 describes project progression and participant attributes, and chapter 6 describes financial attributes of projects. Chapter 7 addresses the role of NMTCs in bringing projects to fruition.

NEW MARKETS TAX CREDIT (NMTC) PROGRAM EVALUATION
35
4. PROJECT ATTRIBUTESEarly-year NMTC projects varied with respect to a large number of factors: the
proportion of project funding supported by NMTCs; whether NMTC support took the form of a loan, an equity investment, or a combination of both; project size; whether the project involved construction or rehabilitation of buildings or, instead, business operations; the rates of poverty or unemployment of project locations; and whether the project was part of a larger economic or community development initiative. Indeed, the NMTC program supported extremely diverse types of investments.
Project Types
The evaluation considered whether different types of NMTC projects were associated with different categories of anticipated, and observed, outputs and outcomes—in recognition of the possibility that some project types can reasonably be expected to produce certain results but not others. The intent was to be sensitive to the possibility of a range of potential program outputs and outcomes and to consider the extent to which any given output or outcome is likely to be associated with a particular focus of NMTC project activities.
Relative to other project characteristics, such as location or CDE type, project type is more likely to be associated with different kinds of outputs and outcomes. Location, CDE type, or other project characteristics might be of interest for general descriptive purposes but are not as likely to be associated with certain outputs or outcomes.
Projects are grouped by their focus of activity so that, for each activity type, it is possible to consider the likelihood of particular outputs/outcomes related to employment, housing, community amenities, and tax revenues. The projects were placed into 1 of 12 project types: office, retail, mixed-use, hotel, manufacturing/industrial, agricultural/forestry, brownfields, social services, education, arts and culture, health facility or equipment, and housing. Projects were defined as mixed-use if they included more than one focus; for example, if they had a housing component and a retail component. However, if one component accounted for more than 90 percent of the total space, the project was assigned to that dominant project type.
For analytic purposes, the 12 types were grouped into five clusters:
1. Office, retail, mixed-use, and hotel projects.2. Manufacturing/industrial, agricultural/forestry, and brownfields projects.3. Social services, arts/cultural and educational projects.4. Health facility and equipment projects.5. Housing projects.

NEW MARKETS TAX CREDIT (NMTC) PROGRAM EVALUATION
36
A separate category for business operations is not included in this typology; rather, the project types may include both projects that involved the construction or rehabilitation of commercial or residential property and projects that supported business operations (including equipment purchases).
Program Targeting
Continuing public policy debate concerns whether community and economic development programs should be directed primarily to particular types of places or to particular types of people. The federal government has applied both approaches, and there are advocates and arguments favoring each.
Some economic and community development programs provide grants or tax credits directly or indirectly to individuals—regardless of where they reside, invest, or own businesses. Relevant examples of programs not primarily targeted to particular places include Small Business Administration (SBA)-guaranteed loans or equity investments and Historic Tax Credits (HTCs).67 Other programs target explicit locations and often involve funding to institutions or intermediaries. Among federal programs requiring, encouraging, or emphasizing spatial (place-based) targeting are the Community Development Block Grant, the Section 108 program, EZ/EC/Renewal Communities68—and NMTCs.
The NMTC program employs geographic targeting that focuses on low-income census tracts, which, for the most part, are defined by poverty rate or median family income. When the program was enacted in 2000, a geographic area that was considered low income met at least one of the following criteria:
• A census tract with a poverty rate of at least 20 percent (a census tract typically contains between 1,500 and 2,000 people);
• For metropolitan tracts, a median family income not exceeding 80 percent of the greater of statewide median family income or metropolitan median family income; or
• For nonmetropolitan tracts, a median family income for the tract not exceeding 80 percent of statewide median family income.
The enacting legislation for NMTCs also permitted certain other places to be designated as “targeted areas” if they did not meet the above requirements.69 In part, in response to a
67 HTCs are also known as Historic Rehabilitation Tax Credits or Rehabilitation Tax Credits. 68 All federally designated EZs officially expired on December 31, 2011. 69 The NMTC program’s enacting legislation, PL 106-554, 113 Stat. 2763 defines LICs, for the purpose of the NMTC program, as (1) any population or census tract if (a) the poverty rate for that tract is at least 20 percent, or (b) in the case of a tract not located within a metropolitan area, the median family income for

NEW MARKETS TAX CREDIT (NMTC) PROGRAM EVALUATION
37
concern that nonmetropolitan areas were disadvantaged by the targeting definitions, the “targeted area” designation was removed in 2004 and replaced with three new qualifying categories: high out-migration rural county census tracts; low-population/EZ census tracts; and targeted populations. These new categories admitted communities in rural areas or census tracts with low-income residents who might otherwise not qualify as eligible for NMTCs under the three criteria listed above.70
Approximately 38 percent of all census tracts in the United States qualify to receive NMTC investments.71 Because CDEs have the discretion to choose where to direct their investments and because some of them might chose to minimize their risk, it is theoretically possible for CDEs to support projects in areas close to the poverty or median-income thresholds as opposed to those that have higher levels of distress. In part to address this possibility, the CDFI Fund, through its application process, has encouraged CDEs to invest in tracts with higher levels of distress than minimally required—meaning higher levels of poverty or lower median family incomes than basic program eligibility requirements call for. Census tracts qualify as areas of higher distress if, among other criteria, they have poverty rates of greater than 30 percent, median family incomes not exceeding 60 percent of statewide median family incomes (or, for metropolitan tracts, not exceeding 60 percent of metropolitan-area median family incomes), or an unemployment rate that is at least 1.5 times the national average.72 In a CDFI
the tract does not exceed 80 percent of statewide median family income, or in the case of a tract located within a metropolitan area, the median family income for the tract does not exceed 80 percent of the greater of statewide median family income or the metropolitan area median family income; (2) certain “Targeted Areas” as areas specifically designated by the secretary as an LIC if (a) the boundary of such area is continuous; (b) the area would satisfy the requirements listed in (1) above if it were a census tract; and (c) inadequate access to investment capital exists in such area. (Source: NMTC Q&A Document: Low-Income Communities and Targeted Populations) 70 The American Jobs Creation Act of 2004 (PL 108-357, 118 Stat. 1418) amended the definitions of LICs. It removed the secretary’s authority to designate targeted areas and created three new categories of LICs: (1) High Out-Migration Rural County Census Tracts: a population census tract within a county, which, during the 20-year period ending with the year in which the most recent census was conducted, has a net out-migration of inhabitants from the county of at least 10 percent of the population of the county at the beginning of such period, if the median family income for the census tract does not exceed 85 percent of statewide median family income; (2) Low-Population/EZ Census Tracts: a population census tract with a population of less than 2,000 if the tract is within an EZ, and is contiguous to one or more LICs (not including other LICs in this category); and (3) Targeted Populations: certain individuals, or an identifiable group of individuals, including an Indian tribe, who (a) are low-income persons, or (b) otherwise lack adequate access to loans or equity investments. (Source: NMTC Q&A Document: Low-Income Communities and Targeted Populations) 71 This calculation is based on CDFI Fund eligibility definitions from the 2000 Decennial Census. On May 1, 2012, the CDFI Fund released updated eligibility data based on the 2006–2010 American Community Survey applied to the 2012 census tracts. 72 “Higher distress” criteria have varied over time. As of 2012, the CDFI Fund’s NMTC Allocation Agreement Template at http://www.cdfifund.gov/ docs/nmtc/2011/2011NMTC AllocationAgreement.pdf considered areas to be highly distressed if they were characterized by at least one of the following items

NEW MARKETS TAX CREDIT (NMTC) PROGRAM EVALUATION
38
Fund analysis of NMTC activity between 2003 and 2010, Greer, Gonzalez, and Valenti (2011) found that 40 percent of the loans were made in areas with a tract median family income of less than 50 percent of area median family income (which would more than qualify as an “area of higher distress”). Another 40 percent of NMTC-supported loans and investments were made in census tracts with a median family income that was between 50 and 75 percent of the area median family income.
Assessment Considerations
Evaluation of programs like NMTCs that target distressed areas requires assessment of community-wide impacts, such as business creation, real estate development, or improved quality of life for residents. While available evidence allows evaluation of some of these criteria,
1 to 5 for each QLICI, or by at least two of the following items 4 to 18: (1) Census tracts with poverty rates higher than 30 percent; (2) Census tracts that (a) if located within a nonmetropolitan area, have a median family income that does not exceed 60 percent of statewide median family income; or (b) if located in a metropolitan area, have a median family income that does not exceed 60 percent of the greater of the greater of statewide median income or the metropolitan area median family income; (3) Census tracts with unemployment rates at least 1.5 times the national average; (4) Census tracts that are located in counties not contained within a metropolitan statistical area, as defined in OMB Bulletin 99-04 with respect to the 2000 census data; (5) Projects serving “Targeted Populations” to the extent that (a) such projects are 60 percent owned by low-income persons, (b) at least 60 percent of employees are low-income persons, (c) at least 60 percent of customers are low-income persons; (6) Census tracts with one of the following: (a) poverty rates greater than 25 percent or (b) if located in a nonmetropolitan area, median family income does not exceed 70 percent of the statewide median family income, or if located within a metropolitan area, median family income that does not exceed 70 percent of the greater of the statewide median family income or the metropolitan area median family income; or (c) unemployment rates at least 1.25 times the national average; (7) Federally designated EZs, ECs, or Renewal Communities; (8) SBA-designated Historically Underutilized Business Zones (HUBZones), to the extent that the QLICIs will support businesses that obtain HUB Zone certification from the SBA; (9) Brownfield sites as defined under 42 U.S.C. 9601; (10) Areas encompassed by a Housing Opportunities for People Everywhere (HOPE VI) redevelopment plan; (11) Federally designated as Native American or Alaska Native areas, Hawaiian Homelands, or redevelopment areas by the appropriate Tribal or other authority; (12) Areas designated as distressed by the Appalachian Regional Commission or Delta Regional Authority; (13) Colonias areas as designated by HUD; (14) Federally designated medically underserved areas, to the extent that QLICI activities will support health-related services; (15) State of local tax-increment financing districts, enterprise zone programs, and other similar state/local programs targeted toward particularly economically distressed communities; (16) Counties for which the Federal Emergency Management Agency has (a) issued a “major disaster declaration” and (b) made a determination that such County is eligible for both “individual and public assistance,” provided that the initial project investment was made within 24 months of the disaster declaration; or (17) Businesses certified by the Department of Commerce as eligible for assistance under the Trade Adjustment for Firms Program; or (18) A Food Desert, which must be either (a) a census tract determined to be a Food Desert by the U.S. Department of Agriculture (USDA), as identified in USDA’s Food Desert Locator Tool, or (b) a census tract that qualifies as an LIC and has been identified as having low access to a supermarket or grocery store through a methodology that has been adopted for use by another governmental or philanthropic healthy food initiative, to the extent QLICI activities will increase access to healthy food.

NEW MARKETS TAX CREDIT (NMTC) PROGRAM EVALUATION
39
other significant factors are generally too difficult to measure across multiple locations. For example, data limitations exclude consideration of issues such as crime levels, community cohesion, and resident social capital.
Evidence
Project types and sizes. No one project type predominated among early-year projects (see table 4.1). The most common type consisted of office space (at 15 percent of all projects), followed closely by mixed-use and retail projects. Mixed-use projects were defined as those with a combination of uses with none of the uses exceeding 90 percent of the total space. These projects might have a mix of commercial and housing components or might have various commercial uses. Retail projects varied by size and nature of activity: 34 percent were large malls, 27 percent were smaller shopping centers or large department stores, 17 percent were restaurants, 11 percent were small independent retail projects, and the remainder consisted of retail projects of an unspecified nature. Only agriculture/forestry and brownfields projects represented less than 5 percent of all projects. Note that, although housing accounted for a small share (5 percent) of the projects, it accounted for a large share of total project dollars (37 percent) because several of the largest NMTC projects were housing projects. These high-cost projects had minor commercial components, but because housing accounted for more than 90 percent of the total space, the projects were categorized as housing.

NEW MARKETS TAX CREDIT (NMTC) PROGRAM EVALUATION
40
Table 4.1: Distribution of Sampled Projects, by Project Type
Project Type Clusters
Share of Projects
(%)
Share of Total Project Dollars
(%) Office, retail, mixed-use, and hotel 46 34 Office 15 10 Retail 14 8 Mixed-use 12 11 Hotel 5 5 Social services, arts/cultural, and educational 22 14 Social services 8 4 Educational 8 4 Arts/cultural 6 6 Manufacturing/industrial, agricultural/forestry, and brownfields 18 13
Manufacturing/industrial 13 2 Agricultural/forestry 4 11 Brownfields 1 0 Health facility or equipment 9 3 Housing 5 37 Total 100 101** Number of projects 244* 244* Source: Urban Institute telephone interviews with project stakeholders and online survey of QALICBs. *Unweighted. Of the 247 projects included in the combined sample, 3 could not be categorized by project type and are not included in this analysis. **The total does not equal 100 percent due to rounding.
Project locations. Early-year NMTC projects were dispersed across a large number of
census tracts. Of the total of 66,186 tracts throughout the country,73 1,243 contained one or more early-year NMTC projects. The great majority of tracts where NMTC projects were located (71 percent) were home to one NMTC project; another 17 percent contained two projects; 5 percent contained three projects; and the remaining 7 percent contained four or more projects.
The first five years of the NMTC program saw a growing proportion of projects located in metropolitan, as opposed to nonmetropolitan areas, as shown in table 4.2. Overall, 83 percent of projects were in metropolitan areas and 17 percent were in nonmetropolitan areas. The share of project NMTC dollars remained relatively constant over the early years of the program, with about 90 percent going to projects in metropolitan areas.
73 This is based on the 2000 Decennial Census.

NEW MARKETS TAX CREDIT (NMTC) PROGRAM EVALUATION
41
The Tax Relief and Health Care Act of 2006 included an amendment of the NMTC program statute that encouraged greater investment in nonmetropolitan areas. First implemented in the 2008 NMTC Allocation Application round, the CDFI Fund promulgated the new nonmetropolitan requirements by altering the application review process to ensure that a proportional number of tax credits be allocated to CDEs that serve nonmetropolitan areas and at least 20 percent of all QLICIs be made in nonmetropolitan counties.
Table 4.2: Distribution of NMTC Projects by Metropolitan/Nonmetropolitan Location and Allocation Year
Allocation Year
Share of Projects Share of NMTC Investment
Amount
Metropolitan (%)
Nonmetropolitan (%)
Metropolitan (%)
Nonmetropolitan (%)
Year 1 (2002) 76 24 91 9 Year 2 (2003/04) 83 17 89 11 Year 3 (2005) 90 10 92 8 Year 4 (2006) 91 9 91 9 All projects 83 17 91 9 Number of projects 1,679 352 1,679 352 Source: CIIS 2007 population data. Note: The data in this table reflect the universe of NMTC projects reported in CIIS data as of December 2007.
The share of early-year projects in metropolitan areas is greater than the proportion of
eligible metropolitan census tracts. Of tracts that received NMTCs, 83 percent were in metropolitan areas; of tracts that were eligible for NMTCs but received no allocation, 77 percent were in metropolitan areas.74 Investment amounts were more concentrated in metropolitan areas than were the numbers of projects: 91 percent of NMTCs during the early-year period went to metropolitan areas. A recent report by the GAO (2012a) observed that the legislative and administrative changes related to the Tax Relief and Health Care Act of 2006 directed a higher share of investment to nonmetropolitan communities than in the early years of the NMTC program.75 Of 25,216 NMTC investment-eligible census tracts nationwide,76 5 percent (1,243) received at least one NMTC investment in the first four rounds of the program. The median tract
74 This difference is statistically significant at the .01 level. The above calculations may differ somewhat depending on the years for which metropolitan/nonmetropolitan locations are defined. This analysis relies on OMB’s 2005 definitions. 75 The 2012 GAO report also noted that the NMTC program was meeting its proportionality goals. 76 This figure is based on CDFI Fund eligibility defined using the 2000 Decennial Census.

NEW MARKETS TAX CREDIT (NMTC) PROGRAM EVALUATION
42
received $615,000 in NMTC funding (39 percent of the total investment amount) and $3.3 million in total investment related to the program.
“Penetration rates,” as measured by the share of eligible census tracts receiving NMTC investments, varied somewhat by census region, as follows:
• The South had the lowest penetration rate, with just 3.9 percent of eligible tracts receiving an investment (see table 4.3); however, it received the highest amount of NMTC capital of all the regions ($968 million, which was $275 million greater than the next highest region). Indeed, the South received more than twice as many total investment dollars as any other region. This may be explained in part by the fact that the 2005 GO Zone legislation provided an additional $390 million in NMTCs ($1 billion in allocation authority) for CDEs working in communities affected by Hurricane Katrina (GAO 2010).
• The West had the highest share of eligible tracts receiving an investment, at 6.8 percent; NMTC and total investment were worth $687 million and $5.6 billion, respectively.
• The Midwest received the lowest share of NMTCs and total investment ($587 million
and $6.0 billion). • The Northeast received $693 million in NMTC investments and $6.6 billion in total
investment.

NEW MARKETS TAX CREDIT (NMTC) PROGRAM EVALUATION
43
Table 4.3: Share of NMTC-Eligible Tracts Receiving NMTC Investment, by Region
Region
Tracts Received
NMTC Investment
Tracts Qualified for NMTC
Investment
Total NMTC Investments
(in $ millions)*
Total Project
Investments (in $
millions)
Percent of Eligible Tracts
Receiving NMTC
Investment Northeast 221 4,744 693 6,615 4.7 Midwest 306 5,976 587 6,010 5.1 South 356 9,129 968 13,858 3.9 West 358 5,280 687 5,568 6.8 Total 1,241 25,129 2,934 32,051 4.9
Source: CIIS 2007 population data. Note: The data in this table reflect the universe of NMTC projects reported in CIIS data as of December 2007. Two tracts that received NMTC investment in Puerto Rico are not included in these regional tabulations; in addition, 87 tracts in Puerto Rico and other U.S. territories that qualified for NMTC investment are not included in these regional tabulations. *39 percent of the total NMTC structure investment amount.
There was more variation in census tract penetration and investment levels by state. One in four eligible tracts received an NMTC investment in Alaska (the highest rate), whereas fewer than 1 in 100 did so in Connecticut (the lowest rate). The median state had a tract penetration rate of just over 5 percent, receiving $37 million in NMTC investment and $300 million total investment. Table 4.4 documents early NMTC financing for each state. Financing amounts also varied across metropolitan areas and cities.

NEW MARKETS TAX CREDIT (NMTC) PROGRAM EVALUATION
44
Table 4.4: Measures of NMTC Investment, by State—through December 2007
State
Number of Tracts
Received NMTC
Investment
Number of Tracts
Qualified for NMTC
Investment
Total NMTC Investment Dollars (in $
millions)
Total Project Investment Dollars (in $
millions)
Number of
Projects
Share of Eligible Tracts
Receiving Investment
(%) AK 11 44 10 64 24 25 AL 4 430 21 83 5 1 AR 12 216 7 56 19 6 AZ 34 451 72 492 42 8 CA 174 2,884 299 2,857 244 6 CO 37 426 57 209 49 9 CT 3 265 25 164 8 1 DC 19 128 36 589 26 15 DE 2 64 9 38 4 3 FL 24 1,090 37 425 29 2 GA 11 804 49 282 16 1 HI 1 96 0.1 0.3 1 1 IA 10 167 20 108 13 6 ID 9 71 8 32 18 13 IL 41 1,249 41 481 58 3 IN 14 441 34 154 21 3 KS 2 258 6 28 3 1 KY 35 454 91 1,460 87 8 LA 56 562 177 2,203 82 10 MA 65 459 97 824 111 14 MD 23 469 109 5,330 40 5 ME 9 89 68 1022 17 10 MI 21 988 40 459 28 2 MN 40 498 78 1,022 74 8 MO 21 585 100 984 68 4 MS 16 294 29 231 27 5 MT 1 94 0 1 2 1 NC 20 560 110 722 41 4 ND 2 60 4 16 2 3 NE 3 165 9 82 4 2 NH 5 81 11 34 5 6 NJ 28 710 75 530 46 4 NM 2 210 7 58 3 1 NV 1 127 0.2 1 1 1 NY 68 1,931 295 2,962 98 4 OH 93 1,076 140 1,398 164 9 OK 30 389 73 590 51 8
OR 34 248 84 732 58 14
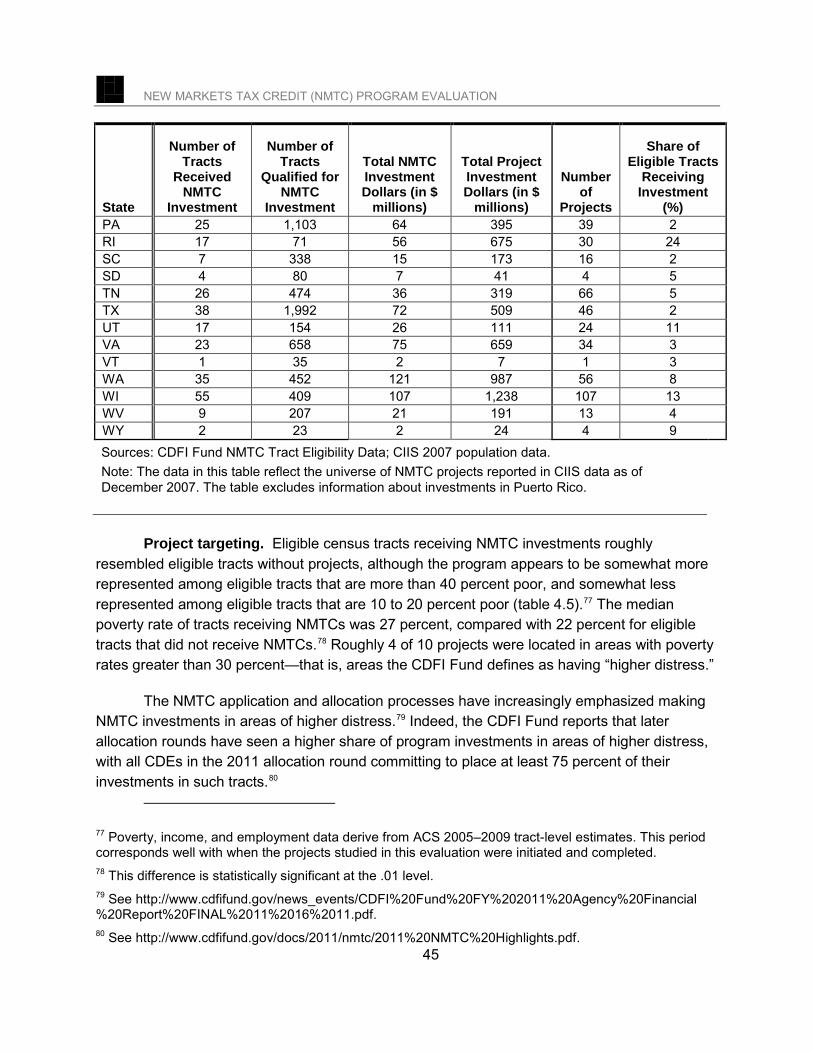
NEW MARKETS TAX CREDIT (NMTC) PROGRAM EVALUATION
45
State
Number of Tracts
Received NMTC
Investment
Number of Tracts
Qualified for NMTC
Investment
Total NMTC Investment Dollars (in $
millions)
Total Project Investment Dollars (in $
millions)
Number of
Projects
Share of Eligible Tracts
Receiving Investment
(%) PA 25 1,103 64 395 39 2 RI 17 71 56 675 30 24 SC 7 338 15 173 16 2 SD 4 80 7 41 4 5 TN 26 474 36 319 66 5 TX 38 1,992 72 509 46 2 UT 17 154 26 111 24 11 VA 23 658 75 659 34 3 VT 1 35 2 7 1 3 WA 35 452 121 987 56 8 WI 55 409 107 1,238 107 13 WV 9 207 21 191 13 4 WY 2 23 2 24 4 9 Sources: CDFI Fund NMTC Tract Eligibility Data; CIIS 2007 population data. Note: The data in this table reflect the universe of NMTC projects reported in CIIS data as of December 2007. The table excludes information about investments in Puerto Rico.
Project targeting. Eligible census tracts receiving NMTC investments roughly
resembled eligible tracts without projects, although the program appears to be somewhat more represented among eligible tracts that are more than 40 percent poor, and somewhat less represented among eligible tracts that are 10 to 20 percent poor (table 4.5).77 The median poverty rate of tracts receiving NMTCs was 27 percent, compared with 22 percent for eligible tracts that did not receive NMTCs.78 Roughly 4 of 10 projects were located in areas with poverty rates greater than 30 percent—that is, areas the CDFI Fund defines as having “higher distress.”
The NMTC application and allocation processes have increasingly emphasized making NMTC investments in areas of higher distress.79 Indeed, the CDFI Fund reports that later allocation rounds have seen a higher share of program investments in areas of higher distress, with all CDEs in the 2011 allocation round committing to place at least 75 percent of their investments in such tracts.80
77 Poverty, income, and employment data derive from ACS 2005–2009 tract-level estimates. This period corresponds well with when the projects studied in this evaluation were initiated and completed. 78 This difference is statistically significant at the .01 level. 79 See http://www.cdfifund.gov/news_events/CDFI%20Fund%20FY%202011%20Agency%20Financial %20Report%20FINAL%2011%2016%2011.pdf. 80 See http://www.cdfifund.gov/docs/2011/nmtc/2011%20NMTC%20Highlights.pdf.

NEW MARKETS TAX CREDIT (NMTC) PROGRAM EVALUATION
46
Somewhat surprisingly, as shown in table 4.5, a high share of projects (33 percent) has gone to relatively better off communities (i.e., those with less than 20 percent poverty). These tracts would not qualify under the 20 percent poverty threshold for program eligibility, but qualified for the program under the median family income threshold or under the “targeted area” designation. One-tenth of projects went to communities that were less than 10 percent poor—areas well below the national poverty rate.81 The distribution of NMTC investment dollars by poverty level was similar to the distribution of projects.
Median household income data (table 4.6) are similar to the poverty rate data discussed above: Census tracts that received NMTC allocations had a slightly lower median household income ($32,496) than eligible tracts that received no NMTC allocation ($34,281).82 Additionally, the majority of projects and investment dollars went to communities composed of households with relatively low incomes. Seventy-two percent of all projects and 71 percent of all NMTC dollars went to tracts with households that had median incomes lower than $40,000. Tracts with median incomes lower than $20,000 received 19 percent of all projects and 25 percent of investment dollars. Conversely, 10 percent of projects and 11 percent of investment dollars went to tracts with median family incomes above $50,000 (i.e., above the national median family income).
81 Community attributes, such as income and poverty, are based on the ACS five-year aggregate estimates for 2005 to 2009. Poverty levels or median family incomes may differ from that reported in the 2000 Census. See discussion in chapter 3, Methodology and Data Sources. 82 The difference is statistically significant at the .01 level.

NEW MARKETS TAX CREDIT (NMTC) PROGRAM EVALUATION
47
Table 4.5: Distribution of NMTC Projects, by Census Tract Poverty Rate
Census Tract Poverty Rate
Share of Projects
(%)
Share of NMTC
Investment Amount
(%)
Share of Tracts That
Received NMTCs
(%)
Share of Eligible Tracts That Did Not
Receive NMTCs (%)
0 to <10 percent 9 9 8 10 10 to <20 percent 24 20 25 33 20 to<30 percent 28 27 30 28 30 to<40 percent 19 20 20 16 40 percent and greater 20 24 18 13 Total 100 100 100 100 Number of projects 2,031 2,031 2,031 24,025 Sources: CIIS 2007 population data and ACS 2005–2009 tract-level data. Note: The data in this table reflect the universe of NMTC projects reported in CIIS data as of December 2007.
Table 4.6: Distribution of NMTC Projects, by Census Tract Median Household Income
Census Tract Median Family Income
Share of Projects
(%)
Share of NMTC
Investment Amount
(%)
Share of Tracts That
Received NMTCs
(%)
Share of Eligible Tracts
That Did Not Receive NMTCs
(%) $100,000 and over 0 1 0 0 $75,000 to <$100,000 1 2 1 1 $50,000 to <$75,000 9 9 10 9 $40,000 to <$50,000 18 18 18 20 $30,000 to <$40,000 26 25 29 36 $20,000 to <$30,000 27 21 27 25 $10,000 to <$20,000 15 19 13 8 Less than $10,000 4 6 2 2 Total 100 101* 100 101* Number of projects 2,031 2,031 2,031 24,025 Sources: CIIS 2007 population data and ACS 2005–2009 tract-level data. Notes: The data in this table reflect the universe of NMTC projects reported in CIIS data as of December 2007. * Totals do not equal 100 percent due to rounding.

NEW MARKETS TAX CREDIT (NMTC) PROGRAM EVALUATION
48
While not a statutory eligibility criterion, unemployment rates for tracts are a valuable metric for understanding their economic context. Unemployment levels were slightly higher in tracts where NMTC projects were located than in eligible tracts that did not receive NMTCs: Tracts with NMTC projects had a median unemployment rate of 10.0 percent compared with 9.4 percent for eligible tracts that did not receive NMTCs.83 Nearly one-fourth of projects and 28 percent of investment dollars went to relatively low unemployment communities, where the unemployment rate was less than 6 percent.
As with poverty levels, there was only limited targeting to areas of high unemployment (see table 4.7). Tracts that received NMTCs had slightly higher levels of severe unemployment than eligible tracts that did not receive NMTCs: one in four tracts receiving NMTCs had an unemployment rate of higher than 15 percent, compared with one in five eligible tracts that did not receive NMTCs. In general, tracts with higher unemployment rates had higher penetration rates, although the variation is small.
Table 4.7: Distribution of NMTC Projects, by Census Tract Unemployment Rate
Census Tract Unemployment Rate
Share of Projects
(%)
Share of NMTC
Investment Amount
(%)
Share of Tracts That Received NMTCs
(%)
Share of Eligible
Tracts That Did Not Receive NMTCs
(%) 0% to <6% 24 28 21 23 6% to <8% 14 13 15 16 8% to<10% 12 14 13 16 10% to<15% 27 24 25 25 15% to20% 12 10 13 11 Greater than 20% 11 11 12 9 Total 100 100 99* 100 Number of projects 2,031 2,031 2,031 24,025 Sources: CIIS 2007 population data and ACS 2005–2009 tract-level data. Note: The data in this table reflect the universe of NMTC projects reported in CIIS data as of December 2007. * The total does do not equal 100 percent due to rounding.
83 This difference is statistically significant at the .01 level.

NEW MARKETS TAX CREDIT (NMTC) PROGRAM EVALUATION
49
Summary
This chapter considered types of NMTC projects by purpose or primary activity, a typology that will be applied in subsequent chapters for analysis of project outcomes. Project locations were described with respect to state and region, metropolitan/nonmetropolitan setting, and level of distress. No one project type predominated among early-year projects, but the most common types were office space, mixed-use, and retail projects. Early-year NMTC projects were dispersed across the country but disproportionately located in metropolitan areas. Penetration rates varied widely by state. Using the ACS five-year aggregate estimate for 2005 to 2009, about 4 of 10 projects were in areas with a poverty rate of greater than 30 percent (which the CDFI Fund would define as having “higher distress”). That being the case, eligible census tracts receiving NMTC investments roughly resembled eligible tracts without projects with respect to poverty rate, median family income, and unemployment—suggesting that early-year NMTC projects were not especially targeted to higher-distress neighborhoods.

NEW MARKETS TAX CREDIT (NMTC) PROGRAM EVALUATION
50
5. PROJECT PROGRESSIONAND PARTICIPANT ATTRIBUTES
Community and economic development programs have been designed with different approaches to encourage investment in low-income areas. Some have emphasized public investment, others private investment, and yet others a combination of the two. Some have involved grants, others loans or loan guarantees, and yet others tax credits. Regardless, the intellectual basis for these programs is the recognition that certain urban and rural areas are undercapitalized for reasons relating to high real or perceived investment risk, and the notion that provision of either capital or incentives to increase access to capital is an appropriate antidote. In the case of the NMTC program, the approach is to use public resources as an inducement to encourage private investment, with the recognition that investment purposes and results will vary from place to place.
Like other relatively flexible community or economic development initiatives that support diverse types of projects, the financial needs, underwriting decisions, timing, and partners associated with each NMTC project are somewhat unique. To understand what the program produces, it is important to learn how different projects come to fruition, who participates in them, and whether projects succeed in executing their intentions. This chapter contributes to this knowledge by describing project initiation and implementation variations, the characteristics of key project participants, and project disposition results.
Given the pivotal role that capital plays in developing LICs and the varying designs of community and economic development programs, a fundamental question is whether and by how much a program increases investment in underinvested or disinvested communities. Accurately measuring local investment levels and attributing them to a particular community or economic development effort is challenging. Direct outcome measures that comprehensively capture public and private debt and equity financing generally do not exist at a small enough geographic level to link to a specific community or economic development activity. And, correspondingly, relatively few community and economic development projects achieve sufficient scale in a given neighborhood or community to be able to produce a demonstrable effect in that area’s capital flows.
For the NMTC program, several investment outputs and intermediate outcomes can be measured. The first and most basic metric is the total level of direct investment occurring as a result of the program. This calculation is relatively straightforward in the case of a grant-funded program but somewhat more difficult for a tax credit program where it is necessary to know not just the amount of taxes forgone but also the actual investment amounts for all of the projects funded. The CDFI Fund’s data systems track, among other things, allocated credits, information about CDEs, and NMTC-related investments in LICs.

NEW MARKETS TAX CREDIT (NMTC) PROGRAM EVALUATION
51
Community and economic development programs may encourage further investment in disadvantaged communities either by attracting additional investment from existing sources or attracting new investors. In addition to measuring the level of investment resulting from such programs, therefore, it is important to consider the sources of investments in a locality. Which types of institutions or individuals are represented? And, are new investors (e.g., those not previously investing in community or economic development finance) attracted to it because of the program? In a review of the NMTC program, the GAO (2007b) measured these effects by surveying investors who claimed that, as a result of the program, they increased their investment in LICs. And, a research paper, Gurley-Calvez et al. (2009), used individual and corporate income tax data from 1997 to 2004 to observe that a portion of NMTC investment by individual investors was “new” investment financed by a decrease in their consumption. However, it is important to note that no more than 5 percent of investments in NMTC projects were attributed to individual (as opposed to corporate) investors, and there was no change in corporate investment levels in response to NMTC.
This chapter describes how the various parties to a project come together and how projects proceed through the development stage to ultimately benefit the community.

NEW MARKETS TAX CREDIT (NMTC) PROGRAM EVALUATION
52
Project Progression
The different ways that project deals are initiated may have a bearing on how investors are attracted to them as well as the roles played by various other participants. Likewise, once a project is initiated, variations in the ways they are implemented may affect expectations regarding, and the realization of, project outputs and outcomes. As such, it is useful to sketch out a picture of some of the key factors that bring projects to fruition and carry them through implementation. This section provides details and qualitative descriptions of project development that took place during the early years of the NMTC program.
Based especially on telephone interviews with those involved in originating and carrying out early-year projects, it is clear that no one formula or sequence of steps applied to every project. Deal development and evolution often followed from a combination of factors that included circumstances, partner capabilities, timing, and location.
Project initiation scenarios. The relationships that brought together CDEs, investors, and QALICBs to develop particular projects varied. Initiation information is available for 87 percent of the 70 projects in the telephone sample. Three generic types of initiation scenarios emerge: those where there were preexisting relationships between CDEs and QALICBs; those where QALICBs were referred to CDEs; and those where
Project Initiation: City Involvement*
There were some instances in which city governments were active players in initiating projects, identifying properties, bringing partners together, or providing financial incentives. For example:
A midwestern city that owned a vacanthistoric building wanted to redevelop thesite as part of a larger revitalization effortand issued a request for proposals fromdevelopers. This brought togetherinvestors, developers, and two CDEs toinitiate the project, which developedground-floor retail space and apartmentson the upper floors.
A northwestern city redevelopmentagency targeted a particular neighborhoodin its strategic plan for revitalization, andidentified several buildings as prime sitesfor rehabilitation. One such building hadrecently been purchased to be renovatedfor office space. The redevelopmentagency brought this project to theattention of a CDE and worked with it toobtain funding partners. Theredevelopment agency also informed thebuilding owner about the availability of taxincrement financing.
*See “Community and local government stakeholders”later in this chapter for additional information on this subject.

NEW MARKETS TAX CREDIT (NMTC) PROGRAM EVALUATION
53
QALICBs approached CDEs directly without any having any prior relationship or a referral. The text boxes in this chapter illustrate some of the variety of contacts and arrangements that facilitated early-year NMTC projects. 84
Previous working relationships between QALICBs and CDEs existed in one-fourth of early-year projects. In most such cases, that relationship had not involved the NMTC program. For example, one QALICB had previously worked with a CDE, a large financial institution, on earlier phases of a large renovation. In another instance, a QALICB developer had worked with a CDE on other projects not related to the NMTC program. In several cases, QALICBs had developed a previous relationship with banks that were parents of CDEs. And, in one case, the prior relationship involved a QALICB and an investor, not a CDE.
Just under one-third of early-year NMTC projects involved referrals, which encompassed a range of possibilities. The most frequently reported sources of referrals were city or local governments, other CDEs, or local banks. In several cases, QALICBs approached local banks for funding, and some of them, in turn, referred the QALICBs to CDEs on the basis of their eligibility for NMTC financing (involving the locations of proposed projects). Referring entities included federal agencies, investors, community groups, and donors or board members of nonprofit organizations. For example, QALICBs that had approached the USDA’s Rural Development Administration or the SBA for funding were sometimes referred to CDEs when it appeared their projects qualified for NMTC support.
Project Initiation: One CDE Referred Another CDE
In a northeastern city, four CDEs helped to finance multiple phases of a historic renovation. Two of them had financed (with NMTCs) an earlier stage of the project, and one of the two took the lead in structuring the financial package for the next phase. When project costs went up and approached the lead CDE’s threshold amount of NMTCs for any given project, it reached out to two other CDEs to join the deal. One of them had supported NMTC projects before, while the other had just received its first NMTC allocation. The lead CDE guided the new CDE through the process to close its first NMTC-funded project.
Just over one-third of early-year NMTC projects approached CDEs directly, with no prior relationship or referral.85 This usually occurred in cases in which a community bank was also a CDE that had an NMTC allocation.
84 These narratives are intended as illustrative examples; they are not necessarily representative of the distribution of project scenarios encountered in the evaluation. 85 Remaining projects involved varying other scenarios or interviewees did not know the circumstances of project initiation.

NEW MARKETS TAX CREDIT (NMTC) PROGRAM EVALUATION
54
Project Initiation: QALICB Approached CDE Directly Without Any Prior Relationship or Referral
In the Northeast, a growing manufacturing business sought conventional financing from its local bank to purchase space that adjoined its current business. The bank representative noticed that the property was located in an NMTC-eligible census tract and, because the bank was also a CDE, the representative informed the business owner about the NMTC program.
Project implementation scenarios. Telephone interviews provided an opportunity to delve into a number of factors associated with project implementation, including site selection, changes that had occurred as projects moved forward, and project status as of the time of the evaluation interviews.86 For the majority of projects, QALICBs had their sites selected prior to seeking financing. In some of these cases, site selection was not an issue at all because NMTC financing was used for business expansion or working capital, with no plans to rehabilitate or develop properties. In most cases where QALICBs built or renovated, they had not considered alternative sites; therefore, NMTCs did not influence the choice of location. Before projects were started, most sites were empty or underused buildings, usually in disrepair, and a fair number involved vacant land.
Among the reasons alternative sites were not considered by the projects in the telephone interview sample were the following:
• In the case of a nonprofit organization and a grocery store, vacant land adjacent to thecurrent location had been purchased previously, with future expansion in mind.
• In at least three projects, a city had issued requests for proposals to rehabilitatespecific buildings.
• In four cases, buildings/sites had been donated to nonprofit QALICBs or sold toQALICBs for a nominal amount.
Some QALICBs considered alternate sites but made choices on factors unrelated to NMTC qualification. For example, a QALICB in the South was strategic about its industrial plant site-selection process. Along with its partner, it set up site-selection criteria, looked at four possible sites, and scored each based on the criteria. Ultimately, they selected a site that was next to a port, because the business exported its goods internationally.
86 Interviews were conducted between April and December 2011.

NEW MARKETS TAX CREDIT (NMTC) PROGRAM EVALUATION
55
Site Selection: Building Donated to QALICB
In a Midwestern town, a QALICB did not have to search for sites because a nonprofit organization donated its building to the project. The nonprofit organization was holding meetings in a building it owned that also included an operating restaurant and bar. The nonprofit wanted the building to be used for a greater purpose, and the museum planned by the QALICB fulfilled that objective. The building was situated on a main street and at the edge of a commercial area. At the time the QALICB acquired the building, it was in good repair. The QALICB remodeled the building into a museum that included a small gift shop and café.
Project Initiation: Investor Brought Together QALICB and CDE
In the Midwest, a father and son learned about the potential shutting down or sale of a large, successful manufacturing plant. They reached out to their local bank for a loan to purchase the business. A loan officer noticed the business was situated in an NMTC-eligible census tract and contacted a CDE that was doing work in the area. The CDE eventually reached out to the pair, offering a loan in the amount they had requested.
For 2 (of 70) projects in the telephone interview sample, NMTCs did influence the choice of location. One was a GO Zone project. The developer (QALICB) was very much committed to rebuilding in the area after the devastation of Hurricane Katrina but could not “make the numbers work” without NMTCs. In this instance, the QALICB specifically selected a site in an NMTC-qualified census tract. The second project was a business that was located in a city and needed to expand and update its space. Staying in the city was more costly because the building required renovation, so the QALICB was considering moving the business to a wealthier suburb. NMTC financing enabled the QALICB to renovate the existing building, avoiding job loss for low-income employees who would have had difficulty commuting to a suburban location.
Once projects were initiated, the majority of QALICBs and/or CDEs reported no changes in project scope or features as deals matured. Less than one-fifth of projects reported such changes, including that project scope became larger or smaller and that partners were added or removed. In one case, when a partner entity that was going to be a tenant sold out its share, the rent structure changed entirely. Another project that was originally intended to be condominium units was changed to a hotel because the QALICB could not amass sufficient sales commitments for the condominiums.
Project disposition scenarios. With respect to the status of the sample of telephone interview projects initiated during the early years of the NMTC program, several trajectories were possible. They could have been planned but never started, started but not completed, or

NEW MARKETS TAX CREDIT (NMTC) PROGRAM EVALUATION
56
completed. And, completed projects could have been operating as planned with the same owner, sold but still operating in the same location, operating but no longer with the same purpose as planned, or closed. Exhibit 5.1 shows the status of the sample at the time the interviews were conducted between April and December 2011:
• All but one of the 70 projects had been completed.
• Sixty of them (86 percent) were still operating as originally planned and under thesame ownership.
• Three had been sold but continued to operate in the same location.
• Two had repaid their NMTC-supported investments before seven years, with therepaid NMTCs redeployed.87
• Five (7 percent) had closed (ceased operations)—four of which had been fullycompleted and one of which had been only partially completed.
Examples of the large majority of projects (i.e., those that were still operating as planned under the same owner) appear throughout this report. The text boxes in this section illustrate the much less common project disposition scenarios, to aid in understanding how these more negative outcomes can come about. Since none of the projects had reached the end of the seven-year period during which NMTC investments remain in a project, this evaluation cannot address the longer-term sustainability prospects for the 90 percent of projects still operating with NMTC investment subsidies—either with the same or new owners.
87 These are shown in exhibit 5.1 as “Left original NMTC purpose” because the investment was no longer being used as initially planned.

NEW MARKETS TAX CREDIT (NMTC) PROGRAM EVALUATION
57
Exhibit 5.1: Disposition of Projects in Telephone Interview Sample
Project initiated
70 projects (100%)
Not completed Completed
1 project 69 projects (3%) (97%)
Business Business Left original Sold – Still NMTC serves the operating – closed closed purpose same same
location owner 1 project 4 projects 2 projects 3 projects 60 projects
(1%) (6%) (3%) (4%) (86%)
Source: Interviews conducted by the Urban Institute between April and December 2011.

NEW MARKETS TAX CREDIT (NMTC) PROGRAM EVALUATION
58
Project Disposition: Ownership Change
An NMTC QALICB developer in the South had to declare bankruptcy. The lending bank considered foreclosing, but the CDE helped to get a new developer for the property. However, there were still problems with the second developer, so the bank foreclosed. At that point, the CDE converted its investment to equity so the business could remain in operation. The property was sold yet again and is still in operation under its third owner. The new owner does not have any NMTC-subsidized financing, but the business continues to operate in the same location in an LIC.
Project Disposition: QALICB Repaid Loan Prior to Seven-Year Period
and CDE Redeployed NMTCs In the dow ntown of a midwestern city, a QALICB used its NMTC financing to redevelop several floors of a historic building with retail and office space. Two years after the renovations were completed; the local government requested that the building be converted to another use that was inconsistent with the CDE’s types of projects. The building was part of the local government’s broader redevelopment plan for the area. The QALICB decided to pay off its
NMTC loan early and bring in other uses for the building. The CDE redeployed the NMTCs to another project several months later.
Project Disposition: Not Completed; Business Closed
A nonprofit organization in the West that operates programs for persons with disabilities purchased a food business that employed several of its program participants. The nonprofit viewed this purchase as a “win-win” that could generate cash for the nonprofit and continue to serve as a career opportunity for its clients. The nonprofit received NMTC funds to expand the food business’s facilities and purchase equipment, but the project was never completed because the business lost several distribution contracts and began losing money. The nonprofit attempted to find another buyer for the business that could keep it open but was unable to do so; the business was closed. Unable to repay the funds it had borrowed with revenues generated by the business, the nonprofit was forced to sell most of the properties where it operated programs, lay off staff, and draw down existing assets. Now that the debts are repaid, the financial picture has stabilized for the nonprofit, although it will operate at a much lower capacity for the foreseeable future.

NEW MARKETS TAX CREDIT (NMTC) PROGRAM EVALUATION
59
Project Disposition: Project Completed; Business Closed
NMTCs coupled with federal and state historic tax credits supported the rehabilitation of a historic department store in the distressed downtown area of a southern city. When the renovation was completed, the building opened as a restaurant and entertainment complex. The tenant businesses created about 140 permanent jobs, and the complex stayed open for almost three years before faltering during the economic downturn. The building is now empty and owned by the bank that provided a non-NMTC loan. The jobs have been lost, and a loan made by the city for the project continues to be unpaid. The beautiful and fully renovated building remains, however, but given the dearth of investment in the area, it may be difficult to find a new owner (or tenants).
Project monitoring scenarios. CDEs are expected to keep track of and document project outcomes in order to report to the CDFI Fund, but may also monitor projects for other independent business purposes, such as complying with a community benefits agreement88 or highlighting project accomplishments in promotional materials. Of the 70 projects in the telephone interview sample, most required regular financial reports from the QALICB—either annually, quarterly, or monthly. Some CDEs also monitored progress with respect to accomplishing projects’ goals as well as CDEs’ objectives/missions. Monitoring activities varied and included, in different instances, semiannual site visits, annual interviews with the QALICB about how business was going, or brief surveys sent by CDEs to QALICBs and to QALICB employees at closing. Some CDEs received semiannual reports from their QALICBs, which, in turn, obtained information from tenants regarding the numbers and types of jobs that were in place, the amount of space rented, services provided, and the number of people being served.
In a few cases, CDEs had called or met with their QALICBs or project sponsors about project plans and/or had required QALICBs to sign agreements at closing that included specific outcome objectives that were then tracked annually. For just over half of early round projects, CDEs had tracked additional outcomes beyond those required in CIIS. Examples of additional outcomes included jobs information (e.g., tenant jobs, quality of jobs, health benefits, education level, low-income employees, commuting radiuses, wage levels, quality of jobs, number of jobs and whether they are part-time or full-time, employee job satisfaction); community improvements, crime reduction, community impacts, anecdotal information on spin-off development; asset management information; greenhouse gases offset, renewable energy, green components; loan performance; changes in leasing; and annual sales. One CDE with a renewable energy focus had developed customized reporting for each project, inquiring how much energy was being generated as well as job quality. Another CDE also reported tailoring additional outcomes tracked to project particulars. For one project, the QALICB and CDE kept track of local hiring practices, noise levels, and use of space by community businesses.
88 Community benefits agreements are described later in this chapter.

NEW MARKETS TAX CREDIT (NMTC) PROGRAM EVALUATION
60
Roles and Characteristics of Project Participants—CDEs, QALICBs, Investors, and Community and Local Government Stakeholders
The information presented above offers a glimpse at the somewhat unique and diverse circumstances that surrounded early-year NMTC projects as they were initiated, implemented, and monitored. The characteristics and roles of project stakeholders were also diverse, as will be shown in this section. CDFI Fund administrative data are used in conjunction with data from the telephone interview sample of project participants, the online survey of QALICBs, and the online survey of local community and economic development officials to portray the attributes and involvement of CDEs, QALICBs, investors, and community stakeholders associated with projects initiated from allocation rounds one through four prior to December 2007.
CDEs. Participating CDEs varied with respect to organization type, size of allocation, and the roles they played with respect to particular projects.
The CDFI Fund’s administrative data regarding applicants for NMTC allocations categorized successful applicants by type of parent entity and award history. The data presented in this section are based on applicant data through 2006 (allocation round 4), consistent with the sample of projects selected for this evaluation.
Information on minority ownership or control was not collected for Round 1 and Round 2 applicants, and is missing in the applicant data for more than half of the CDEs. Of those that reported this information, only three CDEs indicated minority ownership or control.
CDFIs, community development banks, and other mission-driven lending organizations constituted the largest share of CDEs receiving allocations through 2006, followed by for-profit nonfinancial institutions. These two categories of CDEs each accounted for just under one-third of all allocations (see table 5.1).

NEW MARKETS TAX CREDIT (NMTC) PROGRAM EVALUATION
61
Table 5.1: NMTC Allocations, by CDE Type, 2002–2006
Parent Entity Type Number of
CDEs Number of Allocations
Percent of Allocations
CDFIs, community development banks, other mission-driven lending 39 75 32
For-profit nonfinancial institution 27 77 33 For-profit financial institution 24 41 17 Nonprofit, nonfinancial institution 14 25 11 Government, quasi-government 10 18 8 All CDEs 114 236 101* Source: CDFI Fund applicant data, 2002–2006. *The total does not equal 100 percent to rounding.
For-profit nonfinancial institutions were awarded the highest value of NMTCs, followed by CDFIs, community banks and other mission-driven lending institutions, and for-profit financial institutions; nonprofit nonfinancial institutions and government/quasi-government CDEs were awarded much smaller NMTC allocations (see table 5.2). This variation likely reflected differences in allocation requests as well as the capacities of the different types of CDEs (including their ability to attract investment dollars, initiate multiple projects, and the typical size of the projects they undertook—all factors that can affect the ability to deploy credits within the required time frame).
Table 5.2: Size of NMTC Allocations, by CDE Parent Entity Type, 2002–2006
Parent Entity Type
Dollar Value of NMTC
Allocation Authority to CDEs
(in $ millions)
Dollar Value of
Tax Credits
Allocated to CDEs
(in $ millions)
Percent of
Awarded Credits
Median Dollar
Value of Tax
Credits Allocated to CDEs
(in $ millions)
Median Dollar
Value of NMTC
Allocation Authority to CDEs (in $ millions)
CDFIs, community development banks, other mission-driven lending
2,867
1,118
24
14
35
For-profit nonfinancial institution 4,687 1,828 39 20 51 For-profit financial institution 2,610 1,018 22 28 73 Nonprofit, nonfinancial institution 899 351 7 8 21 Government, quasi-government 1,026 400 8 17 44 All CDEs 12,089 4,715 100 18 46 Source: CDFI Fund applicant data, 2002–2006.

NEW MARKETS TAX CREDIT (NMTC) PROGRAM EVALUATION
62
Many CDEs that received allocations applied for subsequent allocations. By 2006, half of those awarded allocations had received previous allocations (table 5.3).
Table 5.3: NMTC Award Allocation History, by Allocation Year
Allocation Year
Total Number of Awardees
Number of First-time Awardees
Percent First-time Awardees
2002 66 66 100 2003 63 54 86 2005 40 15 38 2006 62 31 50 Source: CDFI Fund applicant data, 2002–2006.
Underwriting activities provide a good example of how the role of the CDEs varied, depending on organizational factors as well as project investors and partners. Underwriting is the process investors use to evaluate loan and investment applications. According to CDE interviewees, projects were underwritten using standard practices that included review of income statements, balance sheets, and pro forma projections. Underwriters took into account applicants’ cash flows, credit histories, operating histories, collateral, character, equity contributions, and qualifying NMTC credits. CDE as well as investor underwriters claimed to have used all of the above information to determine if applicants were acceptable credit risks.
For projects in which institutional investors were distinct from CDEs or their controlling entities, and in which outside institutional investors claimed the tax credits, projects were generally evaluated by both the controlling entity or institutional investors (often banks or other financial institutions), using their respective standards, and by CDEs. Ultimately, investors had to be comfortable with a project. In cases in which CDEs were self-financed subsidiaries of controlling entities that claimed the tax credits (such as a community bank), projects tended to be underwritten only once—by CDE staff. However, they were underwritten according to the controlling entity’s procedures to ensure that, with the NMTC subsidy, the project was an acceptable risk. Depending on the CDEs’ relationships to the controlling entities, a loan review committee or some similar entity may have been involved as well.
CDEs also varied with respect to how they used their fees or profits from NMTC projects. Some established revolving loan funds to support small businesses, and others reprogrammed profits to other mission-driven projects that might not necessary have qualified for NMTCs. One example of this was a CDE that “structured NMTC deals to make sure not all the benefit stays there” and used the profits from these deals to fund an initiative that purchased foreclosed homes, rehabilitated them, and then sold them to low-income families. For other CDEs, notably

NEW MARKETS TAX CREDIT (NMTC) PROGRAM EVALUATION
63
for-profit banking and nonbanking firms, fees from NMTC deals became part of general company profits.89
QALICBs. The attributes of QALICBs (such as organization structure, type, and purpose of investment) provide another view of the diversity of participants and projects supported by NMTCs. Combined data from the QALICB survey and telephone interviews90 show that almost 60 percent of early-year QALICBs were for-profit corporations and almost 40 percent were nonprofit organizations. Tribal and other government organizations each made up about 1 percent of QALICBs through 2007 (see table 5.4).
Table 5.4: Number and Percent of QALICB Entity Type—2002–2007
Entity Type Number of QALICBs*
Percent of QALICBs**
For-profit 150 59 Nonprofit 91 39 Government or quasi-government 3 1 Tribal government or agency 2 1 Total 246 100
Source: Urban Institute telephone interviews with project stakeholders and online survey of QALICBs. *Unweighted. **Weighted.
QALICBs ranged in size, as measured by annual gross revenues or operating budgets as of the start of their NMTC projects, from zero (for new start-ups) to $7 billion for a large for-profit parent entity in the natural resources business.91 The median size was $740,000. Almost one-third of QALICBs were small, under $500,000 (table 5.5), and fewer than 10 percent were very large (over $25 million).
Based on CIIS data through 2007, 13 percent of QALICBs were minority owned or controlled and 10 percent were women owned or controlled. The results reported by QALICBs in the telephone interview sample are very similar—13 percent reported being minority owned or controlled, and 9 percent reported being women owned or controlled.
89 This is based on data from CDEs in the telephone interview sample. 90 In this instance, combined online survey data and telephone interview data are used because the CIIS dataset contained a large number of missing values for the voluntary fields pertaining to QALICB characteristics. For example, 21 percent (n = 434) of the of entity type was missing. 91 This is based on data from the telephone interview sample with project stakeholders and the online survey of QALICBs.

NEW MARKETS TAX CREDIT (NMTC) PROGRAM EVALUATION
64
Table 5.5: Number and Percent of QALICBs, by Size (2002–2007) QALICB Size, Based on Initial Annual Gross Revenue or Operating Budget
Number of QALICBs*
Percent of QALICBs**
$0 37 16 $1–500,000 74 32 $500,000–1,000,000 13 6 $1,000,001–5,000,000 45 19 $5,000,001–25,000,000 41 19 Greater than $25,000,000 20 8 Total 230 100
Source: Telephone interviews with project stakeholders and online survey of QALICBs. Note: Values were missing for 16 projects. *Unweighted.**Weighted.
Telephone interviews provided additional information about QALICB characteristics. A QALICB was a related entity to a CDE prior to project initiation in only one of the 70 projects. For almost 66 percent of QALICBs, the sampled project was their first that utilized NMTCs. Conversely, one-third of QALICBs had participated in other NMTC projects, possibly reflecting that a number of QALICBS are real estate developers with multiple projects.
Investors. The telephone interview sample92 provides some information on the attributes of investors that goes beyond what is routinely collected by the CDFI Fund.93 Early-year NMTC projects involved a wide variety of investor types, with the highest proportion being large international banks or other regulated financial institutions (see table 5.6). Investors in this category also accounted for the largest amount of total financing provided to NMTC projects. Other types of corporate investors provided the largest amount of financing per project—based on median figures. These investors included large corporations, such as retail companies that used NMTCs to build, expand, or rehabilitate stores in their chains that were located in LICs.
92 Investors were interviewed for 39 of the 70 projects. 93 The CDFI Fund’s Allocation Tracking System includes limited data on investors.

NEW MARKETS TAX CREDIT (NMTC) PROGRAM EVALUATION
65
Table 5.6: Project Financing by Types of Investors in NMTC-Supported Projects
Investor Type Number of
Organizations Percent of
Organizations*
Total Financing Provided
(in $ millions)
Median Financing Amount
(in $ millions)
Percent of All Project Financing*
Large international bank or other regulated financial institution
50 30 285,656 1,650 36
Public entity 33 20 78,619 750 13 CDFI 23 14 58,703 3,757 13 Regional or community bank or other similar-sized financial institution
17 10 103,181 3,212 11
QALICB 16 10 29,836 430 4 Real estate developer or investment company 5 3 13,119 3,064 11
Venture fund 3 2 6,618 6,500 2 Other type of corporate investor 2 1 10,001 10,950 8
Other 18 11 73,245 3,000 2 All Types 167 101** 658,978 1,686 100
Source: Urban Institute telephone interviews with project stakeholders. *Weighted; totals may not add to 100 percent due to rounding. **The total does not equal 100 percent due to rounding.
Although all of the projects in the telephone interview sample involved NMTCs, investors provided financing to NMTC projects both through the NMTC structure and outside of it. That is, tax credits were able to be claimed on some project financing (the QLICI) while, for some projects, other funds were also provided to the QALICB separate from the NMTC structure (e.g., as conventional debt or grant funding).94 Certain types of investors were more or less likely to provide financing in the NMTC structure (table 5.7). CDFIs and venture funds were especially likely to provide funds within the NMTC structure. Corporations were less likely to do so, and QALICBs and public entities predominantly provided capital outside the NMTC structure. Sixty-three percent of all investments were made within the NTMC structure (table 5.7).
Some investors, particularly banks, had incentives for investing in NMTC projects—such as Community Reinvestment Act (CRA) compliance credits or more favorable loan-to-value (LTV) ratios when debt was combined with investor equity. Investors95 claimed CRA credits for 76 percent of projects, and 21 percent of investors indicated that CRA credit was a substantial factor in their investment decision. Sixty-nine percent of investors maintained they would not
94 See chapters 2 and 6 for a discussion of the investment and financing process. 95 Only banks are subject to CRA regulation.

NEW MARKETS TAX CREDIT (NMTC) PROGRAM EVALUATION
66
have made their investments were it not for NMTCs while 28 percent indicated they would still have made their investments without NMTCs—but likely on different terms or with a different project scope.96
Table 5.7: Share of Investments within NMTC Structure, by Investor Type
Investor Type
Investment within NMTC Structure
Total (%)*
Yes (%)
No (%)
Large international bank or other regulated financial institution 84 16 100 Public entity 24 76 100 CDFI 91 9 100 Regional or community bank or other similar-sized financial institution 88 13 101 QALICB 13 87 100 Real estate developer or investment company 60 40 100 Venture fund 100 0 100 Other type of corporate investor 0 100 100 Other 67 33 100 All Types 63 37 100 Source: Urban Institute telephone interviews with project stakeholders. *Weighted; totals may not add to 100 percent due to rounding.
Community and local government stakeholders. This section considers the basis for community and local government participation in the NMTC program, and provides some evidence regarding the roles of such participants in NMTC projects. Consideration of this issue is appropriate given the premise of the NMTC program that private investors and intermediaries are better positioned than federal government agencies to bring new or increased investments to LICs and ensure they are congruent with local market needs and preferences.
The NMTC program involves the federal government in certifying CDEs and allocating NMTCs to them, and requires CDEs to engage private investors and decide where and in what QALICBs to invest and for what purposes. It does not does not provide a formal role for local governments aside from the fact that they are responsible for zoning, issuing building and occupancy permits, and the like.97 The program does, however, indirectly incorporate community perspectives by requiring that at least 20 percent of CDEs’ governing or advisory
96 Three percent of respondents said they did not know. 97 Local governments or public agencies, however, can become certified as CDEs and then apply for NMTC allocations, along with other types of entities.

NEW MARKETS TAX CREDIT (NMTC) PROGRAM EVALUATION
67
boards be representative of the LICs within their service areas. Indeed, the program’s interest in promoting community benefits has received increasing attention over the years through the application process for NMTC allocations. Today, when applying for NMTC allocations, CDEs must specify how feedback from the community works within the organization, and how community feedback affects the actions of governing boards. To score favorably, applicants for NMTC allocations need to demonstrate the ability to meaningfully engage community stakeholders around planned NMTC investments. This was not necessarily the case, however, for early-year allocations or projects.
It is beyond the scope of this evaluation to assess the effects of governing or advisory board representation on CDEs’ project selections or outcomes. The evaluation does, however, provide a preliminary indication of the roles that community and government institutions played in early-year projects. The data suggest that, from a process perspective, community involvement and emphasis on producing community benefits was uneven. No single model of community participation emerges from the evidence. Indeed, the primary observation derived from a review of early-year NMTC projects is that there was extensive community-level involvement in some instances and barely any in others.
Based on information derived from the telephone interview sample, local public agencies were involved in one way or another (excluding issuance of permits, etc.) with fewer than half (47 percent)98 of early-year projects prior to the time financing was arranged; in the remainder of cases there was apparently no such involvement. And, in somewhat more than half (55 percent)99 of the projects, discussions were held with public development agencies, community development corporations, or other community stakeholders at some point during project development; in the remainder of cases, no such discussions took place. The evidence suggests that early-stage public agency involvement in projects increased the likelihood of subsequent discussions with public or community entities.
Some local governments or community and economic development agencies are also CDEs and, therefore, are directly involved in NMTC projects. Most, however, are not and work primarily with other programs, like those administered by HUD or the Economic Development Administration of the U.S. Department of Commerce. The result is that 72 percent of local community and economic development specialists across the country were familiar with the NMTC program, although only 26 percent of them claimed to be “very” familiar with it.100 Moreover, despite the fact that the national sample of local community and economic development specialists was exclusively drawn from places where at least one NMTC project
98 n = 51. 99 n = 63. 100 Data from the survey of local community and economic development specialists are not restricted to early-year NMTC projects.

NEW MARKETS TAX CREDIT (NMTC) PROGRAM EVALUATION
68
had been initiated, only 45 percent of such specialists were aware of any NMTC project within their jurisdiction.
Among local community and economic development specialists who were aware of local NMTC projects, 62 percent reported that their organizations or others had “definitely” been involved with them; an additional 13 percent reported “probably” having been involved. Where there was involvement, half of the specialists claimed that it was extensive. Involvement included encouraging and/or facilitating projects or activities (86 percent), bringing together key parties (77 percent), providing direct financial support (75 percent), providing other types of support (67 percent), providing referrals to other agencies or organizations or offices (51 percent), helping to initiate or design one or more projects (48 percent), and engaging in eminent domain or condemnation proceedings (7 percent).
Apart from whether government or community agencies were directly involved in NMTC projects, another indicator of connection between communities and projects is whether the latter were consistent (aligned) with local community and economic development strategic plans. Not all communities have such plans, but most do—prepared by local governments either alone or in conjunction with independent entities or private groups. On this score, 86 percent of community and economic development specialists who were aware of NMTC projects in their locales judged them to have been consistent with local plans—62 percent indicating the projects were “very consistent” and 24 percent indicating they were “somewhat consistent.”101
A final indication of community involvement in NMTC projects is the use of agreements between QALICBs and others with respect to ensuring that projects provide community benefits. These agreements can take various forms, as described in the text box at the end of this chapter. Based on telephone interview data, only a small proportion of early-year projects involved agreements regarding community benefits. They are as follows:
• As a condition for issuing construction permits, one city agency required a QALICB developer to undertake an extensive cleanup of the land abutting the riverfront location of the construction so as to provide a broader community benefit.
• In another community, a formal Community Benefits Agreement (CBA) was
negotiated between an NMTC developer and a community group. Because the project had evoked strong neighborhood opposition, the CBA provided for a range of specified benefits to community residents and businesses in return for support of the development.
101 Ten percent of community and economic development specialists were not able to determine if NMTC projects were consistent with strategic plans, 2 percent considered them to be somewhat inconsistent, and 1 percent responded “it depends.”

NEW MARKETS TAX CREDIT (NMTC) PROGRAM EVALUATION
69
• A CDE investing in two NMTC projects formally required each QALICB to provide identified community benefits as a condition for NMTC financing: A QALICB social service provider agreed to establish explicit targets and expectations with respect to expanding its service treatment capacity, serving low-income persons, and creating new jobs and training; and a QALICB developer rehabilitating an historic building agreed to special terms related to employment and salaries to benefit community residents.
Although the telephone interview data extrapolated to the universe of early NMTC
projects suggest there were few formal CBAs, there is also indication that CBA practice is more widespread than either what occurred in early-year NMTC projects or with respect to NMTC projects per se. When local community and economic development specialists were asked if they were aware of any CBA that had been negotiated in their communities over the past five years (not necessarily in conjunction with a NMTC project), 11 percent responded in the affirmative, with 69 percent of them indicating the existence of more than one such agreement.102
Whether there is now a higher proportion of NMTC projects involving CBAs than in the early years of the program, and whether community impacts agreements between QALICBs and CDEs (that are not technically CBAs) have different results than do CBAs (that are negotiated between developers and community groups) is not known. Likewise, evidence regarding the alignment between NMTC projects and community interests, as well as the roles and impacts of community participation in NMTC projects, is preliminary and mixed at this time. While the NMTC program has strengthened its allocation application requirements over the years to enhance the role of community participation, additional data are needed as to the results of such efforts.
Summary
NMTC projects, like other community and economic development projects, reflect market conditions, community structures and assets, and professional and personal networks. Project trajectories and the roles of key players vary by project, location, and timing, among other considerations. In this chapter, multiple data sources were used to document the range of scenarios and participants in NMTC projects.
All but one of the 70 projects in the telephone interview sample were completed, and most were still operating as initially planned under their original ownership. Five projects had ceased operations.
102 Of 257 community and economic development specialists responding to the question of whether they were aware of any CBAs that had been negotiated in their communities within the past five years, 29 responded “yes,” 174 responded “no,” and 54 responded “don’t know.” Of the 29 responding “yes,” 8 said there was one such agreement, 20 said that there were “several,” and one responded “don’t know.”

NEW MARKETS TAX CREDIT (NMTC) PROGRAM EVALUATION
70
Evidence regarding the alignment between NMTC projects and community interests, as well as the roles and impacts of community participation in NMTC projects, is preliminary and mixed at this time. Local public agencies were involved in one way or another (excluding issuance of permits, etc.) with fewer than half of early-year projects prior to the time financing was arranged; in the remainder of cases, there was apparently no such involvement. Only a small proportion of early-year projects had formal agreements between QALICBs and others with respect to ensuring that projects provide community benefits. While the NMTC program has strengthened its allocation application requirements over the years to enhance the role of community participation, additional data are needed as to the results of such efforts.
The following chapter provides further detail on variations with respect to one very important aspect of project initiation and implementation—project financing.

NEW MARKETS TAX CREDIT (NMTC) PROGRAM EVALUATION
71
Agreements to Encourage Community Benefits
Some development projects undertaken with government support include agreements to ensure the provision of community benefits. These sometimes take the form of formal CBAs, which are negotiated between community groups and developers (or government agencies) and require delivery of specified benefits to those affected by the development. Not called CBAs, but often similar in result, are requirements for provision of community benefits by developers in exchange for local permitting or other regulatory approvals. And, in the NMTC program, some CDEs require QALICBs to agree to certain requirements or targets related to community benefits as a condition for their investments. Although not involving community groups per se, CDEs often refer to such agreements as CBAs. Several CDE officials interviewed prior to this evaluation suggested an increasing emphasis over the years on the assurance of community benefits from NMTC projects.
Of the sample of 70 early-year projects in the telephone interview sample, four included either a CBA or similar agreements. Each such arrangement was unique, as follows:
When initially proposed, a retail mall project with multiple anchor tenants evoked strong neighborhood opposition because of anticipated adverse effects on existing local businesses and excessive noise and traffic. In response, a CBA was negotiated between the QALICB and a community group that included local construction hiring targets, retail hiring practices involving community residents, the availability of retail space for local businesses, noise monitoring, noise and pollution attenuation, the provision of community space, and support for provision of community services.
As a condition for issuing construction permits to renovate abandoned warehouses along
the banks of an industrial river and turn them into commercial office space, the permitting agency required the QALICB developer to undertake an extensive cleanup of the land abutting the riverfront. This involved eliminating destructive nonnative flora and fauna, repopulating the area with native species, constructing storm water retention structure, and building a pedestrian walkway.
As a condition for receiving NMTC financing, a CDE required a nonprofit social service
provider QALICB to enter into a benefits agreement that established targets and expectations with respect to expanding treatment capacity, serving low-income persons, and creating new jobs and training for low-income persons. The agreement required the QALICB to complete an annual community benefits report documenting progress toward achieving such outcomes.
The same CDE as above required a different QALICB, which was rehabilitating a historic
building to serve as the company’s office space and provide a small amount of retail space, to enter into an agreement that focused on increasing employment and salaries over a three- to five-year period. The agreement required completion of an annual report documenting progress toward achieving these outcomes.

NEW MARKETS TAX CREDIT (NMTC) PROGRAM EVALUATION
72
6. NMTC PROJECT FINANCINGAs previously noted, the purpose of the NMTC program is to encourage the movement
of investment capital to LICs. This chapter presents information pertaining to a selected set of program outputs—financing made available to QALICBs—and examines the nature of that financing by exploring four conceptually distinct but related topics: total project size, types of investments and their performance, leveraging other financing sources, and fees and deal costs. Conceptual and methodological issues are introduced first, followed by evaluation findings.
Total project size. As NMTC funds are frequently combined with other sources, it is important to understand not just the size of financing within the NMTC structure but also total project size. Project size is an informative output measure, aiding in understanding the scope and purpose of NMTC projects, and their ability to achieve certain outcomes. For example, it is worth investigating whether larger projects, all else equal, have a greater or lesser impact on job creation and community change, or are more or less likely to have required public subsidy. Subsequent chapters use project size as one dimension to understand the outputs and outcomes associated with the NMTC program. The data informing estimates of total project size are available from the CIIS for early-year projects.
Types of investments, their rates and terms, and loan performance. A key output measure for understanding the NMTC program is the extent to which CDEs provided QALICBs subsidized capital. Below-market interest rates, extended loan repayment terms, and higher LTV ratios were some ways that CDEs passed on a portion of the public subsidy—generated through the sale of tax credits to investors—to QALICBs. An important intermediate project outcome, then, is the extent to which QALICBs have been able to remain current on their loan payments. Or, alternatively, what share of QALICB loans needed to be restructured, became delinquent, or went into default or foreclosure?
Before exploring the share of projects receiving subsidized rates and terms, this chapter presents information on the types of financing facilitated through the NMTC program, including what share of projects received term loans, revolving lines of credit, or equity investments. Information describing the types, rates, and terms of financing is derived from CIIS data on all early-year projects. Information about loan performance is from the combined samples of telephone interviews with project participants and online survey of QALICBs.
Leveraging other financing sources. An important program effectiveness issue is the extent to which NMTCs leveraged additional investment—that is, where NMTCs attracted or stimulated other financing sources in a single project (GAO 2007b) or, more broadly, where multiple sources of funds (including federal, state, local, philanthropic, and private) were combined (Quercia, Rohe, and Levy 2000). Financing provided within the NMTC structure is
NEW MARKETS TAX CREDIT (NMTC) PROGRAM EVALUATION
73
leveraged by definition, as the credits represent only 39 percent of that investment. But projects also include financing outside the NMTC structure. Of course, NMTCs may or may not be the critical component necessary for a deal to come together.
Leveraging can be a useful tool for financing community and economic investments, attracting investors, spreading risk, promoting partnerships, and building organizational capacity. Investment structures that combine equity resources with debt can attract investors who are unable to make pure equity investments (Armistead 2005b; Seidman 2007). In the NMTC program, tax credits provide not only necessary additional funding but also funding at a lower-than-market rate for that level of risk (Lindquist 2006). As a result, leveraging is generally viewed positively by both government officials and private investors, and leverage measures are often included in performance assessments (GAO 2008).103
Beginning with the Carter administration, federal economic development policy increasingly emphasized a strategy of investing small amounts of public money to leverage larger amounts of private money (Redburn et al. 1984). Some programs, like HOPE VI, LIHTC, and CDBG, do not have statutory or regulatory leveraging requirements, although leveraging does occur in them. Other programs have such requirements; for example, in the HOME Investment Partnerships program, states and communities must provide a match of at least 25 percent of the federal funding. Similarly, the earlier UDAG program included the projected ratio of total private investment dollars to total public dollars among the selection criteria in awarding grants (Redburn et al. 1984).
The NMTC program does not prohibit or encourage the combining of federal tax credits with other financing sources (apart, of course, from the private funds provided through NMTC-structured financing).104 Since its inception, however, the program has in some instances been used in conjunction with other federal tax credits. For example, many commercial real estate projects have twinned historic tax credits with NMTCs to attract investors (Armistead 2005b). These federal credits may be additive, such as when federal HTCs are combined with NMTCs.
Fees and deal costs. Administrative costs have been a long-standing matter of concern for the NMTC program. The program is complex. Those using it in its early years had to spend
103 However, see Redburn and colleagues (1984) for the arguments that highly leveraged deals may be inefficient if they are required to respond to many different application and reporting processes, and that too high a leverage ratio may suggest that the project would likely have proceeded without a need for program funds. 104 An exception is the LIHTC program. NMTCs cannot be used in conjunction with LIHTCs for the same project, although there are examples of the LIHTC and NMTC programs being combined into a “development.” For example, a multistory building rehabilitation was divided by floor into separate legal entities, with LIHTCs supporting development of one floor and NMTCs another.

NEW MARKETS TAX CREDIT (NMTC) PROGRAM EVALUATION
74
substantial amounts of money to apply for and win allocations, set up the infrastructure to make investments and monitor compliance, and create appropriate structures at the transaction level—all of which required highly specialized consulting assistance. Structures involving leverage or the combination of HTCs and NMTCs were especially complicated, often necessitating the use of sophisticated and expensive legal and accounting services. Early on, some analysts anticipated that administrative costs would diminish over time as the program aged and practitioners became more familiar with IRS regulations and CDFI Fund rules relating to application and evaluation—as happened with the LIHTC program. Armistead (2005b), for instance, anticipated that practitioners would be able to capitalize on their initial learning investments, thereby making the program seem less complicated. But, others have continued to see the program’s complexity and related administrative costs as an area of concern (GAO 2010), and the NMTC industry has continued to request modifications to existing program regulations and features.105
Total Project Size
Early-year NMTC projects ranged greatly in size—from small, straightforward investments to large, complicated arrangements. CIIS data on all such projects reveal that the smallest, in terms of total project costs (including financing provided through the NMTC structure and financing provided outside the NMTC structure), was $8,000 and the largest was $1.8 billion. The median project size was $3.7 million; the mean project was $15.8 million.106 Based on data from the combined samples of telephone interviews with project stakeholders and online survey of QALICBs, table 6.1 displays the total project size distribution of NMTC projects (as of 2007).
105 For a list of industry comments, see http://www.cdfifund.gov/news_events/CDFI-2012-09-CDFI-Fund-Releases-Public-Comments-Submitted-New-Markets-Tax-Credit-Program.asp. 106 The difference in these two figures reflects the influence of a small number of very large projects.

NEW MARKETS TAX CREDIT (NMTC) PROGRAM EVALUATION
75
Table 6.1: Distribution of Projects, by Total Project Size
Total Project Size
Share of All Projects
(%) $0–$499,999 32 $500,000–$999,999 2 $1 million–< $5 million 10 $5 million–< $10 million 17 $10 million–< $20 million 17 Greater than $20 million 22 Total 100 Number 247 Source: Urban Institute telephone interviews project stakeholders and online QALICB survey. Note: Total project size includes financing provided through the NMTC structure and financing provided outside the NMTC structure.
As expected, sizes varied considerably across different project types.107 Again using information collected from the combined samples of telephone interviews with project stakeholders and online QALICB survey, the largest class of projects—retail, mixed-use, offices, and hotels—had the largest median total project cost (at $16.9 million) (table 6.2). Health facility or equipment projects ($11.8 million) and social services, arts and culture, or education projects ($10.6 million) were somewhat smaller, at the median. Manufacturing, industrial, agricultural, forestry, and brownfields projects were smaller still, at the median ($10.0 million). The median size for housing projects was $8.6 million. (Housing, however, represented 37 percent of total project costs for all projects in the combined samples because of a few very large projects.)
107 Project-type information is available only for the online QALICB survey and telephone interview projects, as project-type classification is not directly available from CIIS for all early-year NMTC projects.

NEW MARKETS TAX CREDIT (NMTC) PROGRAM EVALUATION
76
Table 6.2: Distribution of Projects, by Project Type
Project Type
Median Total Project Cost (in $ millions)
Share of All Projects
(%)
Share of Total Project Dollars
(%) Office, retail, mixed-use, and hotel 16.9 46 34 Social services, arts/culture, education 11.8 22 14 Manufacturing/industrial, agricultural/forestry, brownfields 10.0 18 13
Health facility or equipment 10.6 9 3 Housing 8.6 5 37 Total 12.8 100 101** Number of projects 244* 244* 244* Source: Urban Institute telephone interviews with project stakeholders and online QALICB survey. * Unweighted; of the 247 projects included in the combed samples, three could not be categorized by project type and are, therefore, not included in this analysis. ** The total does not equal 100 percent due to rounding.
Types of Investments Involved, and Their Rates and Terms
Investment types. A mix of financing types was provided to QALICBs. Looking first at the NMTC structure financing (i.e., financing for which investors received the 39 percent tax credits), nearly two-thirds of funds lent to or invested in QALICBs were term loans. Ten percent of all funds furnished through the NMTC structure involved debt financing with equity-like features, and another 12 percent consisted of equity investments (table 6.3).
Financing provided to projects outside the NMTC structure took different forms: term loans represented just 37 percent of dollars provided to QALICBs, whereas equity investments, which may be acquired through a put/call option, represented nearly half of all funds lent or invested. Revolving lines of credit were a small share of the project financing, both in the NMTC structure and outside it. (table 6.3)
Overall, these findings conform to the perceptions of the CDE and investor stakeholders interviewed during the course of the evaluation; they generally observed that debt financing was easier to provide than equity financing under the NMTC program.108
108 The CDFI Fund attempted to encourage more equity investments by making administrative changes to the “related party” test in 2010. See question 33 in the document found at the following Web address: http://www.cdfifund.gov/docs/nmtc/ 2010/2010-AppQA-Final.pdf.
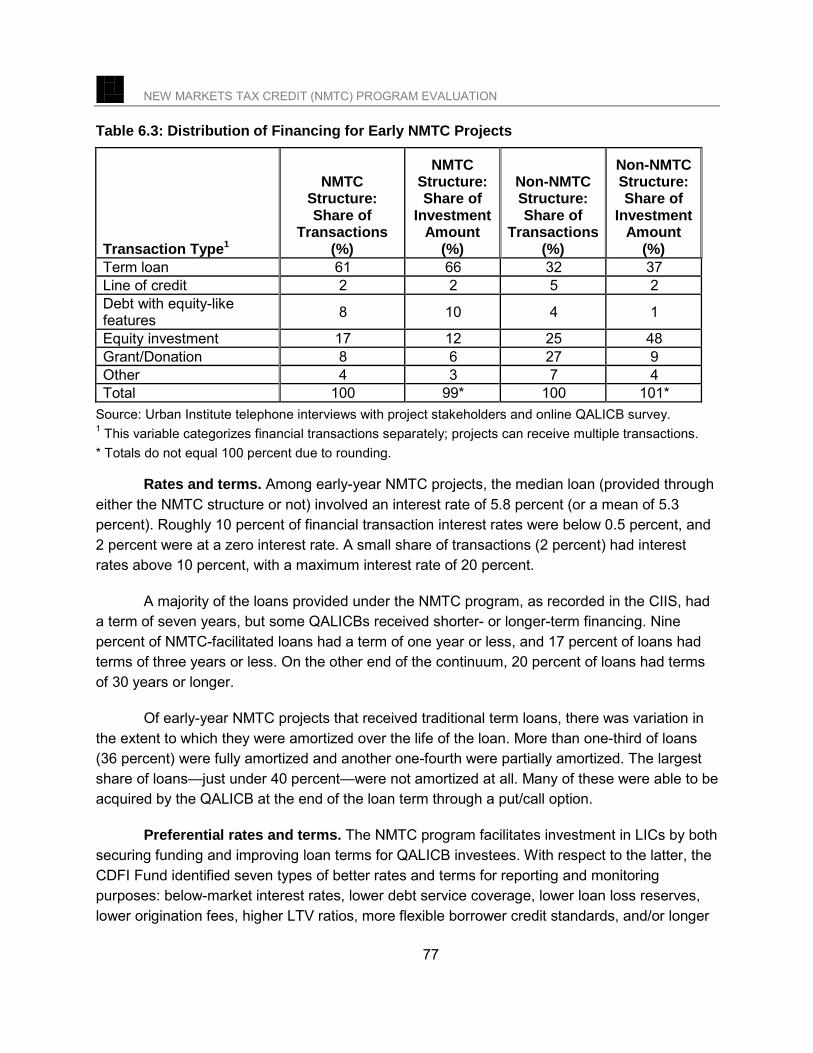
NEW MARKETS TAX CREDIT (NMTC) PROGRAM EVALUATION
77
Table 6.3: Distribution of Financing for Early NMTC Projects
Transaction Type1
NMTC Structure: Share of
Transactions (%)
NMTC Structure: Share of
Investment Amount
(%)
Non-NMTC Structure: Share of
Transactions (%)
Non-NMTC Structure: Share of
Investment Amount
(%) Term loan 61 66 32 37 Line of credit 2 2 5 2 Debt with equity-like features 8 10 4 1
Equity investment 17 12 25 48 Grant/Donation 8 6 27 9 Other 4 3 7 4 Total 100 99* 100 101*
Source: Urban Institute telephone interviews with project stakeholders and online QALICB survey. 1 This variable categorizes financial transactions separately; projects can receive multiple transactions. * Totals do not equal 100 percent due to rounding.
Rates and terms. Among early-year NMTC projects, the median loan (provided through either the NMTC structure or not) involved an interest rate of 5.8 percent (or a mean of 5.3 percent). Roughly 10 percent of financial transaction interest rates were below 0.5 percent, and 2 percent were at a zero interest rate. A small share of transactions (2 percent) had interest rates above 10 percent, with a maximum interest rate of 20 percent.
A majority of the loans provided under the NMTC program, as recorded in the CIIS, had a term of seven years, but some QALICBs received shorter- or longer-term financing. Nine percent of NMTC-facilitated loans had a term of one year or less, and 17 percent of loans had terms of three years or less. On the other end of the continuum, 20 percent of loans had terms of 30 years or longer.
Of early-year NMTC projects that received traditional term loans, there was variation in the extent to which they were amortized over the life of the loan. More than one-third of loans (36 percent) were fully amortized and another one-fourth were partially amortized. The largest share of loans—just under 40 percent—were not amortized at all. Many of these were able to be acquired by the QALICB at the end of the loan term through a put/call option.
Preferential rates and terms. The NMTC program facilitates investment in LICs by both securing funding and improving loan terms for QALICB investees. With respect to the latter, the CDFI Fund identified seven types of better rates and terms for reporting and monitoring purposes: below-market interest rates, lower debt service coverage, lower loan loss reserves, lower origination fees, higher LTV ratios, more flexible borrower credit standards, and/or longer

NEW MARKETS TAX CREDIT (NMTC) PROGRAM EVALUATION
78
interest-only repayment periods. CDEs are required to record which of these, if any, they offer to borrowers.
While not required to do so by statute, the CDE representatives interviewed for this evaluation indicated they generally offered better-than-standard rates and terms to QALICBs as part of their NMTC financing. And, according to CIIS data, more than 9 in 10 early-year projects received at least one preferential financing term (see table 6.4).109
Lenders typically require that the debt service coverage ratio (which is calculated by dividing an applicant business’s net operating income by annual debt service, including the requested financing) meets a certain target—often 1.20. CDE representatives interviewed for the evaluation reported they offered a lower-than-standard debt service coverage ratio through NMTC financing to 28 percent of projects. In addition, although most lenders do not make loans for projects with an LTV ratio greater than 80 percent, CDE lenders reported they accepted a higher LTV ratio than standard for 39 percent of the early-year NMTC projects in which they invested. Of the remaining types of better rates and terms, 26 percent of projects had lower loan loss reserves than lenders would customarily require. The smaller share of projects receiving these accommodations suggests that CDEs are not changing qualification standards so much as ensuring that QALICBs have sufficient funding to meet existing standards.
With respect to credit standards, roughly one-third of loans or investments provided to projects were more flexible when using NMTCs than would typically have been provided. More common were concessions on interest rates and terms. For example, more than half of projects received lower-than-standard origination fees, nearly 50 percent received a below-market interest rate, and roughly the same share of QALICBs was able to make interest-only payments for a longer-than-standard period.
109 See http://www.cdfifund.gov/docs/nmtc/2007/2007NMTCAllocationApplication.pdf and http://www.cdfifund.gov/docs/2011/nmtc/2011%20NMTC%20Highlights.pdf for a discussion of how the CDFI Fund asks applicants for NMTC allocations to commit that up to 100 percent of QLICIs will be provided in the form of equity, equity-equivalent financing, debt with interest rates at least 50 percent below-market rates, or debt that is otherwise flexible or provides nontraditional rates and terms.

NEW MARKETS TAX CREDIT (NMTC) PROGRAM EVALUATION
79
Table 6.4: NMTC Projects Receiving Preferential Rates and Terms
Preferential Rates and Terms
Project Receipt of Preferential Rates
and Terms Total (%)
Yes (%)
No (%)
Lower-than-standard origination fees 54 46 100 Below-market interest rate 49 51 100 Longer-than-standard period of interest-only payments 47 53 100 Higher-than-standard LTV ratio 39 61 100 More flexible credit standards 35 65 100 Debt service coverage less than standard 28 72 100 Loan loss reserve less than standard 25 75 100 Any better rate and term 91 9 100
Source: CIIS 2007 population data. *N = 2,031.
Combined telephone interview and online QALICB survey data tell a similar story to that reported in the CIIS: the vast majority of early-year NMTC projects received better rates and terms.110 Most indicators of preferential terms benefited slightly more than half of projects, with the exception of debt service coverage and loan loss reserves, which benefited only about one in three projects. Again, 91 percent of sampled projects received at least one preferential rate or term.
Loan performance. CDEs and investors routinely monitor the performance of NMTC loans. Because complete information on loan performance is not available in the CDFI Fund’s CIIS, the evaluation collected loan performance data via telephone interviews with project stakeholders and the online QALICB survey.
Perhaps as a sign of a weak macroeconomy for some of the period covered by the evaluation, more than one in six projects (17 percent) whose principals were interviewed by telephone or responded to the online survey had sufficient difficulty repaying their loans that they had to be restructured. QALICBs associated with 8 percent of projects reported they had been delinquent on their NMTC loan, and 6 percent reported their NMTC loan had gone into default. Just over 2 percent of QALICBs reported the lender had foreclosed on their loan.111
110 As explained in the following chapter, better rates and terms are considered to be a distinct project attribute, similar to project outcomes. As such, better rates and terms are not incorporated in the assessment of the need for NMTCs to bring a project to fruition. 111 It is possible that poor loan performance may be underestimated to the extent that QALICBs not responding to the online survey were more likely to have experienced financial difficulties.

NEW MARKETS TAX CREDIT (NMTC) PROGRAM EVALUATION
80
Leveraging Other Financing Sources
When public/program funds are used to attract private financing, the latter is generally regarded to have been leveraged by the former.112 Especially for a program involving public-private partnership, a key program evaluation issue is the extent to which program funds leveraged private financing.
There are several vantage points from which to examine program leveraging. The differences in how the approaches are constructed are subtle but meaningful. Three different divisions of project and program funding are considered below: (a) NMTC structure vs. non-NMTC structure; (b) NMTC credits vs. non-NMTC credits; and (c) public vs. private. For each division, it is possible to calculate two different leverage measures, both of which are used in the program evaluation literature (GAO 2008; Walker et al. 2002).
• The share of funding. This is calculated as the percentage of total financing that wasborn by a specific program or funding source—i.e., the value of, say, NMTC credits(numerator) is divided by the value of NMTC credits added to the value of all other (i.e.non-NMTC credit) financing (denominator).
• The ratio of funding. This is calculated as the ratio of public or program funds to privateor non-program funds and reported as follows: for every dollar of public/program fundsinvested, a certain dollar amount of private funds were contributed.
Adding further complication is the fact that each measure, described above, can becalculated in two different ways:
• On a project-by-project basis. This involves calculating, for each project, the share orratio of total financing represented by, say, NMTCs and, then, averaging (mean ormedian) the shares or ratios across all projects.
• Summing across all projects. This involves summing the total amount ofpublic/program financing across all projects and the total amount of all financing acrossall projects and, then, calculating an overall percentage or ratio.
While the project-by-project and program sum approaches could, in theory, producesimilar results, in reality they diverge considerably when evaluating NMTC projects. The reason for this divergence is that there is a wide range of project sizes (measured in terms of amount of funding/financing)—from very large projects where total (NMTC and non-NMTC) financing is in
112 The concept of leverage does not necessarily imply that public/program funds cause or induce private funds to be contributed. With respect to the NMTC program, however, that possibility was considered in chapter 5.

NEW MARKETS TAX CREDIT (NMTC) PROGRAM EVALUATION
81
the tens of billions of dollars) to much smaller ones. The few very large projects included in the samples drawn for the evaluation have, as would be expected, relatively small shares of NMTC financing. This has a major effect on the extent of overall program leverage. Consequently, this report emphasizes project-by-project figures (and, in particular, the median statistic) as the best measure for understanding leverage with respect to typical NMTC projects. Since, however, a program-wide approach is a reasonable perspective, those figures are also presented.
In sum, a comprehensive analysis of leverage under the NMTC program includes 18 different metrics: three statistics (sum, mean, and median) for two different measures (share of the total and ratio of funding) for three different funding scenarios (NMTC structure vs. non-NMTC structure, NMTCs vs. non-NMTCs, and public vs. private). A summary chart is presented below to aid the reader, highlighting the median project-by-project figures.
Beyond measurement issues is the question of interpretation. Most observers appear to consider projects or programs that produce higher amounts of leveraging to be desirable—i.e., a good use of public resources. Yet it is not clear how different measures of the extent of leveraging should be used for comparing projects or programs to one another. This is because they partly reflect different project development circumstances (such as location or availability of potential investors (GAO 2007a), as well as different program designs and objectives (Redburn et al. 1984). Cross-project or -program comparisons should be done very carefully, therefore, to account for such differences.
NMTC structure vs. non-NMTC structure financing. As noted above, NMTC projects include financing provided within the NMTC structure (i.e. funding upon which tax credits are claimed) as well financing provided outside the NMTC structure. A key question, consequently, is what proportion of all funds was provided to QALICBs through the NMTC structure.
For the combined telephone interview and online QALICB survey samples of early-year NMTC projects, 82 percent of total project funds were loaned or invested through the NMTC structure—for the median project when calculated on a project-by-project basis (see Table 6.5). There were a few projects with very large amounts of financing outside the NMTC structure, however. So, for the average project, just 68 percent of total project funding was conveyed through the NMTC structure. The alternative way to calculate a comparable statistic is to sum total project costs and NMTC structure financing amounts across all the sampled projects and, then, calculate the share. Using this approach, the NMTC structure represented 53 percent of total project costs. For 6 percent of projects, no funds outside the NMTC structure were added (i.e., the cost to the federal government in foregone tax revenue is then 39 percent of the total project financing).
Beyond the proportion of all financing represented by the NMTC structure, there is the ratio of NMTC structure financing to non-NMTC structure financing. Again, using the combined samples, the ratio of NMTC structure to non-NMTC structure financing for the median project

NEW MARKETS TAX CREDIT (NMTC) PROGRAM EVALUATION
82
(calculated on a project-by-project basis) was $1.00:$0.11—meaning that for the median project, for every dollar invested through the NMTC structure, 11 cents was invested outside that structure. Turning to the average project, the ratio was $1:00:$0.71. After summing NMTC structure and non-NMTC structure dollars for all projects, the ratio was $1.00:$0.90.113
NMTC credits vs. non-tax credit financing. In the combined sample of telephone interview and online QALICB survey projects, the amount of NMTCs invested ranged from $39,000 to $71 million. (These funds represented 39 percent of the financing provided within the NTMC structure.) From the NMTC program’s inception through December 2007, the total amount of NMTCs invested, as estimated by the principals of these projects, was $5 billion, and the total cost of all NMTC-related projects was more than $22.4 billion. Thus, the NMTCs could be said to represent 22 percent ($5 billion divided by $22.4 billion) of all project costs. When determining this figure on a project-by-project basis, a somewhat different picture emerges. For individual projects, the NMTCs accounted for between 5 percent and 39 percent of total project costs. For the median project, NMTCs represented 36 percent of total project funding and, for the average project, 31 percent of total project funding (see table 6.5).
Using the combined samples to calculate these figures as a ratio, each dollar of NMTCs invested in early-year projects was combined, at the median, with $2.03 in other (i.e. non-tax credit) project costs (see table 6.5). The ratio of NMTCs to other (non-tax credit) financing for the average project (calculated on a project-by-project basis) was $1.00:$3.34. After summing NMTCs and other non-tax credit financing across all projects, the ratio was one dollar of tax credits to $3.55 in other financing.
Public vs. private funds. Other federal programs, states, and localities also contributed public funds to NMTC projects. The most common federal sources included HTCs, HUD Section 108 loan guarantees, and CDBG funds. States and localities frequently contributed grants of preferred capital programs, concessions, tax abatements, and property donations. Based on just the telephone interview sample data,114 for every public dollar invested in early-year NMTC projects, a summation of data from all projects indicated that $3.36 private dollars were invested. When calculated on a project-by-project basis, the median project had a ratio of one dollar in public funds to $1.56 in private funds. Similarly, the average project had a ratio of one dollar in public funds to $2.62 in private funds. Or, framed alternately, public funds represented 10 percent of total funds when summing across all projects and 35 percent at the mean, and 39 percent at the median when calculating on a project-by-project basis.
113 NMTC structure was calculated by summing the value of all of a project’s investments that were related to the NMTC program. Similarly, non-NMTC structure was calculated by summing all of a project’s investments that were not in that structure. 114 Online QALICB survey data were not available for this metric.

NEW MARKETS TAX CREDIT (NMTC) PROGRAM EVALUATION
83
Table 6.5: NMTC Leverage Measures Leverage Measure
NMTC Structure vs. Non-NMTC Structure*
NMTCs vs. Non-NMTCs Public vs. Private
Percentage of total (%) Median 82 36 39** Mean 68 31 35** Sum 53 22 23**
Ratio of funding Median $1.00 NMTC structure:
$0.11 non-NMTC structure:
$1.00 NMTCs: $2.03 non-NMTCs:
$1.00 public: $1.56 private
Mean $1.00 NMTC: $0.71 non-NMTC structure
$1.00 NMTCs:$3.34 non-NMTCs
$1.00 public: $2.62 private
Sum $1.00 NMTC structure: $0.90 non-NMTC
structure
$1.00 NMTCs:$3.55 non-NMTCs
$1.00 public: $3.36 private
* Source: Urban Institute telephone interviews with project stakeholders and online survey of QALICBs. ** Source: Urban Institute telephone interviews with project stakeholders.
Leveraged deals. As discussed in chapter 2, NMTC financing can combine debt and equity investments in one bundled transaction in which the equity partner receives credit on the combined value of the equity and debt financing. These are called leveraged deals, a term that is often confused with program leveraging as discussed above. However, it is distinct. Leveraged structures are attractive because they can reduce risk and increase profit for an investor (GAO 2007a).
Of the 63 early-year telephone interview projects for which there are sufficient data, 43 percent were leveraged deals and 57 percent were not. The text boxes below illustrate examples of non-leveraged and leveraged projects.
Example of Financing for a Non-leveraged NMTC Project
One non-leveraged NMTC deal went to support the purchase of a property and construction of office space for a health care facility in the South. The QALICB received a NMTC-financed loan, with a reduced interest rate and no origination or asset management fees. The loan was amortized over a term of 240 months. Apart from the CDE, which also claimed the tax credits, there were no other investors in the deal. The loan was worth about $850,000, and the CDE received credits worth 39 percent of that loan amount. In addition, the CDE earned a return from the repayment of the debt financing.

NEW MARKETS TAX CREDIT (NMTC) PROGRAM EVALUATION
84
Example of Public Sources as NMTC Leverage
Most leveraged NMTC transactions involve NMTC equity investors that claim tax credits on the amount of the equity investment and the amount of a conventional loan made to the QALICB (after these funds are combined in a special-purpose entity). However, in some cases, the deal involved the leveraging of other local, state, or federal grant or tax credit funds, not the leveraging of another loan. For example, the renovation of a historic downtown building was financed using an NMTC equity investment of approximately $525,000 and state and federal historic preservation tax credits totaling about $2.5 million. The total financing in the NMTC structure was then $3,025,000. The NMTC investor, a large national bank, claimed NMTCs on the amount of its equity investment as well as on the state and federal historic tax credits, which the QALICB received because of the historic nature of the building being renovated. Due to the structure of the transaction, the equity investor claimed NMTCs worth roughly $1.2 million, or 39 percent of the total NMTC financing. The bank paid $0.45 per dollar of tax credit, which is the ratio of $525,000 over $1.2 million. The NMTC financing was also combined with a conventional loan that did not involve NMTCs, owner equity, and a loan from the city where the building was located. The total project size was roughly $9 million.
Fees and Deal Costs
The CDFI Fund has taken several steps to gain greater understanding of the transaction costs, fees, and compensation costs of the NMTC program. One way to understand these costs is to determine what share of the QEI (the investment capital CDEs receive from the NMTC investors) is deployed as a QLICI (the investment in the QALICB). NMTC program applicant data and CIIS data indicate that a large portion of all QEI dollars were invested as QLICIs. The mean and median share invested as QLICIs across awardees were both 97 percent. Or, put differently, CDEs retained an average of 3 percent of QEIs as fees, profits, or to cover administrative costs. The largest difference between QLICIs and QEIs was 88 percent. Nineteen percent of awardees invested 100 percent of their QEI dollars.115
Some costs, of course, may not be reflected as the difference between the QEI and QLICI but, rather, may be directly paid by a QALICB after receiving a QLICI. Fees paid for financing include front-end or origination fees at closing, asset management and ongoing fees over the seven-year period, or back-end fees. Based on telephone interview data collected for the evaluation, 75 percent of projects were charged fees by CDEs, 22 percent were charged no fees, and respondents didn’t know for 3 percent of projects.
115 The CDFI Fund has attempted to incentivize CDEs to retain a smaller portion of the QEI by including that metric in the NMTC application and allocation agreement. See http://www.cdfifund.gov/docs/2011/ nmtc/2011%20NMTC%20Highlights.pdf for the finding that in 2011, all allocates agreed to commit that at least 95 percent of the QEI would be invested in QLICIs.

NEW MARKETS TAX CREDIT (NMTC) PROGRAM EVALUATION
85
• Front-end fees were the most ubiquitous and highest fees. They were, on average,2.4 percent of a project’s total cost; the median front-end fee was 2.1 percent of theproject, while the highest was 8 percent.
• Asset-management fees were considerably smaller: the average was just 0.7percent of a project; the median was 0.5 percent annually.
• Back-end fees averaged 2.3 percent of project costs; the median was 1.9 percent.
Example of a Deal with Fees That Were “Too High” Two historic buildings—one a former hotel and the other a former shopping center—sat vacant in a city for approximately five years. The city acquired the buildings and solicited proposals for a redevelopment plan, awarding the property to a developer who proposed a mixed-use, multiphased project. The first phase, which was capitalized with NMTCs, included the development of more than 100 residential units and roughly 30,000 square feet of commercial space. The second phase, which was also capitalized with NMTCs but from two different CDEs, included more than 50 residential rental units and about 50,000 square feet in commercial space.
The QALICB was able to obtain various sources of funding for the second phase of the project, but had to pay substantial fees to the CDEs. The financing package included two NMTC sources, state Historic Tax Credits, a Section 108 loan, a loan from a nonprofit organization, and developer equity. The QALICB had to pay 8 percent of the financing in up-front fees, an additional 2 percent in asset management fees annually, and back-end fees as well. The QALICB described the fees as “too high.”

NEW MARKETS TAX CREDIT (NMTC) PROGRAM EVALUATION
86
Example of a Deal with Minimal Administrative Costs A nonprofit service provider seeking financing to build an organization headquarters was able to obtain NMTC-supported financing as well as in-kind pro bono services of the lawyers and accountants needed to put the deal together. It raised funds for the building from individual and corporate donors, but was short of its goal.
A board member knew someone who was familiar with the NMTC program who, in turn, knew a mission-driven CDE in the community and asked the CDE for advice. At the time, the CDE had only a small remaining NMTC allocation—too small for most of the projects it was considering for NMTC investment. Moreover, the allocation needed to be used before an impending deadline. The proposed project was small, needed to fill a gap in financing, and the CDE was familiar with the organization’s work.
This provided the motivation for the CDE to contact other potential investors and agree to waive any fees to the organization. To keep costs low, the CDE also encouraged the investor, lawyers, and accountants involved not to charge any fees. Given the fact that the project was small and the organization provided a service to a vulnerable population in the community, all of the parties agreed to help. The QALICB, CDE, and investor all described this as a “‘win-win’” situation.
During telephone interviews, multiple QALICBs raised concerns about the complexity inherent in assembling a deal involving NMTC financing; complaints focused on the significant administrative (especially legal and accounting) costs associated with NMTC financing. It was not always possible, however, for QALICBs to provide definitive information about their specific outlays for these services.
Credit Pricing Considerations
In tax credit programs (including, but not limited to, the NMTC program), the federal government forgoes revenues, which intermediaries or developers sell to investors. The price paid for the tax credits is then clearly linked with the results a program is able to achieve: the pricing determines the level of funds made available for loans and investments. Therefore, the prices paid for these credits constitute a critical programmatic output, and can be considered a measure of efficiency (tax revenues foregone per dollar of investment provided). At first glance, it might be expected that each dollar of tax credits would be priced at one dollar of investment, but, for several reasons, that is not always the case. The reasons broadly fall into two categories: program design and market forces.
Variations in program design affect the pricing of credits, as these impinge on investor transaction and reporting costs, the risks of recapture, the manner in which investments are defined, and tax code regulations. There are trade-offs in that certain program design regulations may decrease the price investors are willing to pay for credits, yet are necessary to
NEW MARKETS TAX CREDIT (NMTC) PROGRAM EVALUATION
87
accomplish other program objectives—such as targeting projects to needy persons or places, or preventing over subsidization. Any community or economic development project done with or without a subsidy requires developers and others to incur costs. Such costs include the specialized legal and tax support and compliance-monitoring activities that are necessary to undertake projects. There is also the cost of applying for an allocation.
A number of other statutory and regulatory considerations may affect the pricing efficiency of tax credits. To ensure that borrowers receive patient capital, the NMTC IRS regulations require a seven-year forbearance period when investors in CDEs relinquish the rights to foreclose on any investments (although, of course, CDEs can foreclose on investments they make in QALICBs). A major factor is that NMTCs are taken over seven years, so they are discounted based on the time value of money. Claiming credits over seven years rather than, for example, on making an investment, increases investors’ “risk of recapture” of their investments should the project fall out of compliance. For example, CDEs must invest “substantially all” of the funds they receive for the tax credits or they and their investors face the risk of having investments entirely recaptured. As a result of recapture risk, investors will be less willing to pay for credits, resulting in lower prices. Other program design features matter as well. The regulations governing community and economic development programs determine what constitutes an investment and, therefore, what share of it is eligible to be returned to investors. And taxing mechanisms affect pricing: in the NMTC program, investors are taxed capital gains at the end of the period, which decreases the value of the credits to them.
Finally, various market forces affect the pricing of tax credits in community and economic development programs. Demand for the credits is influenced by the type of individuals and institutions eligible for and incentivized to purchase them; the extent to which these institutions are profitable and hold tax liabilities and are therefore interested in purchasing credits; the potential, but unrealized, development of syndication and a secondary market for the credits; and the risk of interest rate changes over the life of these investments.
Early in the history of the NMTC program, Armistead (2005b) reported that the perceived present value of the NMTC credit to investors was recognized as roughly 70 to 80 percent of the amount of credits. GAO (2010) later found that, before the economic downturn in 2008, NMTC investors paid about 75 to 80 cents per dollar in tax credits. By 2010, with the economic downturn, CDEs reported paying just 65 to 70 cents per dollar in tax credits, and some as little as 50 cents. Of 70 early-year NMTC projects included in the telephone interview sample, 19 provided information on credit pricing, and this information was similar to previous estimates. (Seventeen projects had a CDE that was also an investor, in which case credits were not priced.) NMTC investors paid a median of 73 cents per dollar of tax credits received, and the cost per credit ranged from a low of 51 cents to a high of 90 cents per dollar of NMTCs received.

NEW MARKETS TAX CREDIT (NMTC) PROGRAM EVALUATION
88
Summary
The median total project size of sampled early-year NMTC projects was $3.7 million. Nearly two-thirds of funds provided through the NMTC structure were term loans. Of the funds provided outside the NMTC structure, 37 percent took the form of term loans and nearly half were equity investments, which may be acquired through a put/call option. The median loan had an interest rate of 5.8 percent, and a majority of the loans provided under the NMTC program had a term of seven years. CDEs used NMTC financing to provide better rates or terms to 91 percent of QALICBs. Most prevalent were lower-than-standard origination fees, below-market interest rates, and longer-than-standard periods of interest-only payments. Perhaps as a sign of a weak macroeconomy, more than one project in six (17 percent) had their loan restructured, 8 percent of projects had been delinquent, 6 percent went into default, and just over 2 percent were foreclosed on.
Based on project-by-project calculations, NMTC structure financing was worth 82 percent of total project financing for the median project. Turning specifically to the tax credits, they were 36 percent of total project costs for the median project. Public funds were 39 percent of the median project’s total costs. When summing across all projects, financing provided through the NMTC structure represented 53 percent of total project costs, NMTCs represented 22 percent of total costs, and public funds were 23 percent of total project costs.
Three-quarters of CDEs charged fees; 22 percent charged no fees. Front-end fees were the most common; they were, on average, 2.4 percent of a project’s total costs.

NEW MARKETS TAX CREDIT (NMTC) PROGRAM EVALUATION
89
7. THE ROLE OF NMTCs IN BRINGINGPROJECTS TO FRUITION
Conceivably one of the most important but also most challenging program evaluation issues involving community and economic development projects is the extent to which public support is needed to bring them to fruition. While there are no explicit statutory or regulatory provisions prohibiting the use of NMTC investments in projects for which other financing is available, several program procedures and requirements, noted below, suggest programmatic encouragement of use of NMTCs in projects that would not otherwise move forward. This chapter provides evidence pertaining to this issue for NMTC projects, preceded by brief consideration of the rationale for examining it and the considerable conceptual and methodological complexities entailed in doing so.
Rationale for Considering the Need for Public Support
Policymakers as well as budget analysts concerned about prudent allocation of public resources often want to know, for any particular program, if public funds are necessary to achieve its desired purposes or, to the contrary, if such funds are substituting for nonpublic-sector resources. Related questions are whether (a) one program’s or level of government’s funds are substituting for another’s or (b) the amount of public support provided is in excess of what is needed to make projects feasible. The logic is that, “When public funds are merely substituted for private funds in this fashion, no real public benefits have been created and public resources have been wasted” (Redburn et al. 1984, 126). In several instances, although not for NMTCs, this concern has resulted in legislative or regulatory prohibitions of one sort or another on public funds substitution or on subsidization in excess of what is needed to accomplish public purposes (Abravanel, Pindus, and Theodos 2010, 2011). From an evaluation perspective, a program that provides unnecessary public support does not deserve credit (or at least full credit) for whatever outcomes its projects are associated with, since they could have resulted without the program’s support.
An alternative perspective also applies to public-sector programs designed to encourage private-sector investment. Its argument is that because it can be extremely difficult to determine or ensure that public support does not substitute for private financing, statutory or regulatory efforts to do so add program complexity and reduce program flexibility, consequently dissuading private-sector interest—which is completely contrary to what is intended (Reischauer 1980). Therefore, to attempt to engage the private sector in neglected and overlooked distressed markets, NMTC planners envisioned a flexible program emphasizing the role of nonfederal government actors and allowing for a range of possible project types, depending on local
NEW MARKETS TAX CREDIT (NMTC) PROGRAM EVALUATION
90
needs.116 In this spirit, then, the NMTC program has no legislative or regulatory requirements that explicitly pertain to substitution. The authorizing statute and program rules provide considerable flexibility regarding investment types, scope, purposes, desired impacts, and the role of NMTCs.
In sum, there is obviously a tension between encouraging community and economic development in LICs and preventing scarce public resources from being consumed unnecessarily. The NMTC program attempts to balance these interests by having
on the one hand, no statutory or regulatory prohibitions against substitution and nofederal agency role in underwriting or selecting projects, as these functions aredelegated to CDEs and their investors who have responsibility for assessing, amongother things, the need for NMTCs;117
but, on the other hand, certain program procedures and requirements (likecompetitive tax credit allocations, mandatory allocation agreements, use of distresscriteria, and a system of CDE reporting to the CDFI Fund) may be construed asencouraging projects that would not otherwise be likely to proceed in some formwithout NMTCs (Armistead 2005a).
Assessment Considerations
Empirical inquiry regarding the extent to which NMTC projects need public support requires both conceptual and methodological grounding. Several such considerations are discussed below.
From an assessment perspective, a particularly challenging feature of NMTC projects is that many of them involve NMTCs as only one part of a complex financing package. As shown previously, projects range from those that are entirely funded by NMTCs to those that receive only a small fraction of their financing from NMTCs. The reality of assembling multiple sources of financing, sometimes under very tight time constraints where opportunities may be fleeting, means that in some instances pursuit of alternative financing options is not especially feasible. The challenge is to be able to parse out the need for NMTCs as opposed to other sources of financing to bring projects to fruition.
116 This is based on Urban Institute telephone discussions with a range of NMTC program stakeholders, including those involved in the original planning and design of the program, congressional and GAO staff, and others, held in 2006 and 2008. 117 It is noteworthy, however, that some CDEs explicitly require a “but for” analysis before supporting projects with their NMTC allocations. The proportion of CDEs doing so is not known, although it appears to be small.
NEW MARKETS TAX CREDIT (NMTC) PROGRAM EVALUATION
91
An additional consideration for assessing whether a project needed NMTCs in order to come to fruition is what constituted a “project.” In some instances, an NMTC project is the total project (i.e., where NMTCs constitute the full financing), whereas in others, the NMTC portion is part of a larger “project.” In the latter instance, it is important to consider whether the entire project would not have proceeded absent NMTCs or just whether the NMTC portion would not have proceeded. Beyond that, it is useful to go further and ask if the project would have proceeded absent NMTCs but at a later time or in a different location.118 Such considerations provide a more nuanced and realistic understanding of project development, and allow for at least three categories of projects: those where no substitution occurred, those where partial substitution occurred, and those where full substitution occurred.119
• No substitution is where an NMTC project would not have come to fruition (even ata later date or in a different location) without NMTC financing (i.e., where NMTCswere needed).
• Partial substitution is where an NMTC project that could have come to fruitionwithout NMTC financing but at a later (delayed) date or in a different (in theory, lessdesirable, from a program-objective perspective) location.
• Full substitution is where an NMTC investment substituted completely for otherpossible funds that could have been used to produce a project, at about the sametime and/or in about the same location.
As will be discussed below, evidence is an important issue in establishing whether projects could have come to fruition without NMTCs. Since there will be some instances in which evidence is not (or not readily) available, is insufficient, or is conflicting, such projects would be classified as “inconclusive” with respect to substitution.
Full or partial substitution involves primarily a financing calculation but some observers also recognize that program investments may contribute to project feasibility for psychological reasons. The notion is that potential participants otherwise interested in investing in a project might be more disposed to engage if they knew a community or economic development program was also making an investment in it (Shalala 1980). In essence, private investors may
118 For the telephone interview sample of 70 NMTC projects, scale was another factor considered when assessing the need for NMTCs. For this sample, however, scale was not a determining factor, whereas time and location were. 119 There is also the concept of duplication or excessive subsidy, where more program investment (either from a single public program or in combination with other public programs) is provided than is needed for a project to come to fruition.

NEW MARKETS TAX CREDIT (NMTC) PROGRAM EVALUATION
92
be willing to fully finance a project but unwilling to be “the first money in”; in such an instance, NMTCs could play such a role despite not being needed to fill a financing gap.
Given the above formulation, the concept of substitution120 should be considered distinct from other attributes or outcomes of NMTC projects, such as whether QALICBs obtain better rates and terms as a result of NMTCs or whether projects have good outcomes.121 Indeed, it can be argued that these other attributes or outcomes are diminished in terms of program accomplishment to the extent that NMTCs fully or partially substitute for other funding sources. When a QALICB that could have obtained sufficient private financing takes NMTCs instead, at better rates and terms, the QALICB may benefit but it is not clear the taxpayer does.
From a methodological perspective, determining whether NMTCs are necessary for bringing projects to fruition is particularly challenging. It is the equivalent of doing an impact evaluation in that it requires establishing what would have occurred in the absence of the credits (Abravanel, Pindus, and Theodos 2011). Inasmuch as any rigorous effort to evaluate impacts ideally requires some type of experimental or quasi-experimental design that incorporates pre- and post-measurement and comparison of treatment and control groups, completing a thorough substitution evaluation is extremely difficult when it comes to community and economic development projects.122 Project diversity must also be taken into account, including the fact that no standard metric (such as being denied other financing) applies to all projects.
Apart from design considerations, the kinds of information needed to assess whether NMTCs are necessary includes evidence regarding local market conditions, project investment history and risk, development costs, rates of return on investments, alternative financing sources and availability, and financing gaps.123 The evaluation sought out this kind of
120 NMTCs represent subsidies to investors to incentivize them to make investments in QALICBs at, preferably, better rates and terms. Substitution occurs to the extent that the incentive is not needed, either for those investors or others, to make the investments. 121 Better rates and terms, addressed in chapter 6, are considered to be a distinct project attribute, similar to project outcomes. 122 An alternative approach involving naturally occurring experiments compares pairs of projects that are similar in all respects (such as their type, attributes, location, timing, and scale) except for receipt or nonreceipt of program subsidies. The presumption is that if comparable projects not receiving a subsidy are initiated and completed, those receiving a subsidy did not need it. The challenge is in finding comparable pairs. For many types of community and economic development projects, it is not always possible to identify appropriate comparables. And, it may not be possible to obtain financial and other information about comparable projects that are not recipients of a program subsidy, as such information is often proprietary. 123 Knowing whether a project would have proceeded absent NMTCs is not simply a post hoc program evaluation challenge; it may also be a practical challenge to those involved in attempting to initiate a project. When financing packages are being assembled for some projects, even the principals may not know with any certainty what is likely to happen if NMTCs are not available. In some instances, the timing
NEW MARKETS TAX CREDIT (NMTC) PROGRAM EVALUATION
93
information to the extent possible through the online survey of QALICBs and telephone interviews with program participants. Both sources have their limitations but, as would be expected, less evidence is available from the online survey than from the telephone interviews.
• For the online survey, answers to two questions about the availability of alternate funding were examined. The questions addressed whether or not other funding was available and, if so, how it would have affected the timing or location of the project. Based on these data, projects were initially placed into one of four categories: “no substitution,” “partial substitution,” “full substitution,” or “inconclusive.” For all cases except those initially categorized as inconclusive, the answers to additional questions addressing the necessity of NMTC financing were examined (such as whether the QALICB had applied for conventional financing for the project prior to obtaining NTMC financing, why it had or had not applied, and why the project might not have qualified for private financing). If QALICBs provided information in their answers to those secondary questions that conflicted with answers that had been used to place projects into the initial categories, the project designations were changed—usually to “inconclusive.”
• For the telephone interviews, project-by-project evidence and testimonials were
sought as to the necessity of NMTC financing. In addition to examining the kinds of information listed above, participants were also asked directly about the role of NMTCs and whether they were needed for their projects to come to fruition. In this instance, not only were QALICBs queried but so were CDEs and investors, each bringing a distinct perspective to the issue. The information obtained about each project was presented to the research team by the lead interviewer; this was then reviewed by the full research team. The lead interviewer presents systematically the range of evidence that had been collected; the members of the research team queried the presenter and pressed for additional information, clarification, detail, or explanation—where appropriate. Based on the information and discussion, the team arrived at a consensus with respect to whether each project should be classified as either “no substitution,” “partial substitution,” “full substitution,” or “inconclusive.” Every effort was made to be thorough and consistent. Although the nature and quality of evidence varied across projects, in a reasonably large number of cases the information turned out to be reinforcing rather than contradictory.
Analytic constraints involved the fact that there was no opportunity for independent review of project pro formas, related documents, or certain secondary data sources; also, in some instances, information gathered either by telephone or online was dependent on the recall capacity of project participants.
and circumstances associated with such projects make it infeasible to explore alternate sources of financing, especially in complex transactions involving multiple investments where each may be contingent on the others.

NEW MARKETS TAX CREDIT (NMTC) PROGRAM EVALUATION
94
In sum, the process used to consider whether NMTCs were needed to bring projects to fruition was designed to be as empirical, deliberate, and systematic as possible under the circumstances.
Project Examples
Before examining the distribution of early-year projects with respect to the role played by NMTCs, it is useful to present abbreviated examples of those that met the criteria for each of the substitution categories noted above.
No substitution. The following are examples of projects that were categorized as not likely to have come to fruition without having NMTC financing:
• A small personal-service business that was leasing space received financing to acquireand renovate a property so it could move to another location a short distance away. Theowner wanted to move because the immediately surrounding area had become moreindustrial and undesirable. As a result, in its existing location, the business was losingmoney and would have closed. The owner did not qualify for conventional financingbecause of business losses. Loans supported by NMTCs were provided through a CDEwhose parent entity is a community bank.
• A social services nonprofit agency had been raising funds through a capital campaign toexpand its facility. The campaign was short of its goal when fund-raising stalled, likelybecause of the recession. NMTC financing filled the funding gap and enabled theagency to close out its capital campaign and proceed with the project.
• Another social services nonprofit agency in a large city used an NMTC-supported loan topurchase and rehabilitate a prominent historic building in a high-poverty neighborhood.The agency relocated its offices to the building, which had been standing vacant fordecades. Debt service on a conventional loan for the project would have beenprohibitively high for the social service agency, and the project would not have occurredwithout the subsidized loan.
• City government officials had tried for seven years to attract a full-scale grocery store toa low-income neighborhood with a high proportion of transit-dependent seniors. NMTCfinancing covered the full construction cost of a shopping center on the site of a formerlyvacant one, which conventional financing would not have done, and it allowed thedeveloper to offer below-market rent and thereby attract a discount grocery chain.
Partial substitution. The following projects were categorized as having qualified forconventional private financing or, possibly, other government-supported financing to bring them to fruition; however, taking advantage of those sources would have delayed the projects or resulted in changed locations:

NEW MARKETS TAX CREDIT (NMTC) PROGRAM EVALUATION
95
• An NMTC loan allowed a data and technology business to remain in a low-income neighborhood where many of its employees lived. The firm was outgrowing its current space and had received approval for private financing to move to a suburban location where office space was less expensive. Doing so, however, would likely have involved replacing many of its then current low-income, transit-dependent employees. With an NMTC-supported loan, the company was able to purchase and renovate a building in its existing neighborhood.
• A growing café and food supplier had a time-limited opportunity to expand into an adjacent space; it had only 30 days to put together its financing package. The QALICB approached a local bank that had previously provided financing to the company. Although the company might have been able to qualify for a loan for a larger space elsewhere in the neighborhood outside of the 30-day time frame, the NMTC-supported loan allowed it to meet the deadline and remain in its current location.
Full substitution. The following projects were categorized as qualifying for, and having access to, conventional private financing or possibly other government-supported financing to bring them to fruition:
• NMTCs supported a loan to a QALICB to fund the expansion of a successful and well-regarded business in a community. The QALICB was a long-standing and reliable customer of the CDE’s parent entity, a bank. The bank would have provided conventional financing, but, given its NMTC allocation and the fact that the business was in a qualifying census tract, it used NMTCs to provide better rates and terms to its valuable customer. The better rates and terms were advantageous to the QALICB but unnecessary for the project to move forward as planned.
• An NMTC-supported loan was used to rehabilitate an office building that would become the new headquarters of the QALICB. The CDE, a national bank that was also the NMTC investor, was one of the QALICB’s routine lenders. The QALICB could have qualified for a conventional loan with the CDE but used an NMTC-supported loan because the building was located in a qualifying census tract.
• A CDFI provided an NMTC-supported loan to a nonprofit organization to purchase a building it had been leasing from a private owner. The building was a cornerstone of a recent community-wide redevelopment. Had the owner sold the building to someone other than the QALICB in a conventional transaction, the QALICB was at no risk of losing its space because of stipulations that were part of the earlier community redevelopment. While the QALICB provided services and amenities that were considered central to the neighborhood's vitality, NMTCs were not needed to keep the QALICB in place.

NEW MARKETS TAX CREDIT (NMTC) PROGRAM EVALUATION
96
• A QALICB used an NMTC-supported loan to construct an office building on a vacant lotin an industrial park. The site was chosen before the QALICB received NMTC supportand was in an area where private capital for office construction was not difficult to obtain.The QALICB pursued NMTC support at the suggestion of a local bank, which providedpartial additional funding for the project. The NMTC portion of the financing could havebeen replaced by a loan from that bank or another bank.
Inconclusive. The following projects were categorized as inconclusive becauseevidence regarding their need for NMTCs was incomplete, or conflicting information could not be reconciled:
• A museum used an NMTC-supported loan to refinance an existing line of credit with thesame bank that served as the CDE. The museum, which had been built without NMTCinvolvement, needed funds to cover an operating shortfall due to a slowdown incontributions. A CDE official was uncertain as to what would have happened if themuseum had not received the NMTC-supported loan (which had better rates and termsthan the existing lines of credit), and the QALICB was unable to provide additionalinformation.
• A small business received an NMTC-supported loan for working capital and to purchaseequipment in the first year of the NMTC program. The QALICB could not provideinformation on the project due to staff turnover since the time the project was initiated;the CDE was unable to provide sufficient information to determine the need for theNMTC subsidy. Organization records and institutional memory could not provide a clearpicture of the availability of alternate financing at the time of the loan.
Evidence Regarding the Role of NMTCs
Considering, initially, only projects involved in the online survey of QALICBs, the distribution with respect to the substitution issue is as follows: 31 percent showed evidence that they required NMTC support to go forward, 11 percent showed evidence they could have proceeded without NMTCs but only at a different location or with significant delay, and 19 percent showed evidence that they might have proceeded at the same location and without delay absent NMTCs (see column 1 of table 7.1). For 39 percent of projects, however, there was not sufficient evidence from the online survey to make a determination one way or the other regarding the role of NMTCs.
Because semi-structured telephone interviews allowed for gathering more information and more detailed information than an online survey, and for hearing from multiple types of participants associated with each project, results for the telephone interviews add to the understanding of the role of NMTCs. As shown in column 2 of table 7.1, which is based on only the telephone interviews, 51 percent of projects showed evidence of requiring NMTC support to

NEW MARKETS TAX CREDIT (NMTC) PROGRAM EVALUATION
97
go forward, 10 percent showed evidence they could have proceeded without NMTCs but only at a different location or with significant delay, and 24 percent showed evidence they might have proceeded at the same location and without delay absent NMTCs. By comparison with the online survey, a smaller proportion (14 percent) of projects could not be categorized because of lack of evidence (i.e., are shown as “inconclusive”).
In sum, while data collection methods and analytic approaches differed to some degree, it is reasonable to conclude that between three and four of every 10 early-year NMTC projects would likely not have proceeded without NMTCs, about one in 10 might have proceeded without NMTCs but probably in a different location or on a delayed schedule, roughly two of every 10 did not show evidence of needing NMTCs in order to come to fruition, and three of every 10 could not be categorized for lack or inconsistency of evidence.
Table 7.1: Need for NMTCs in Bringing Projects to Fruition, by Data Collection Method
Need for NMTCs in Bringing Projects to Fruition
Data Collection Method
Online Survey (%)
Telephone Interviews
(%)
Combined Survey and Interviews
(%) No substitution 31 51 37 Partial substitution 11 10 11 Full substitution 19 24 21 Inconclusive 39 14 31 Total 100 99* 100 Number of projects** 154 70 224 Source: Urban Institute telephone interviews with project stakeholders and online survey of QALICBs. *The total does not equal 100 percent due to rounding.**Unweighted.
Project Attributes and the Need for NMTCs to Bring Projects to Fruition
What accounts for differences in the role played by NMTCs from project to project? It is important to attempt to explain why some projects needed NMTCs to come to fruition while others did not.
There are several possible explanations, including variations with respect to the following project attributes:
• Project type• Allocation year from which investments were made• Whether or not the CDE’s allocation was its first NMTC award• CDE type• QALICB type• Metropolitan versus nonmetropolitan location• Regional location

NEW MARKETS TAX CREDIT (NMTC) PROGRAM EVALUATION
98
• Project size • Project purpose (whether or not the project involved construction or rehabilitation
of property) • The relationship between CDEs and QALICBs • Whether project financing was provided with “better rates and terms”
Examination reveals statistically significant differences for only three of the above attributes: the allocation year from which investments were made, whether or not the project involved the building/rehabilitation of real estate, and whether or not a CDE and QALICB had a relationship that preceded their involvement in a NMTC project. Although some other project attributes, listed above, might be hypothesized to result in differences in the role played by NMTCs, it may be that the program in its early years either had not matured sufficiently for such differences to emerge or that, given the idiosyncratic nature of the projects, no particular attribute dominated.
Allocation year. More projects needed NMTCs in order to go forward in allocation years 3 and 4 than in years 1 and 2: The percentage of projects needing an NMTC subsidy to move forward was 33 percent in the first allocation year versus 51 percent in the fourth year, but there was not a steady trend in either direction over the four years (table 7.2). Similarly, the share of projects that might have proceeded at the same location and without delay absent NMTCs (i.e., full substitution) varied each year, with a higher percentage of full substitution projects in years 1 and 4 compared with years 2 and 3.
Table 7.2: Need for NMTCs in Bringing Projects to Fruition, by Allocation Year
Need for NMTCs in Bringing Projects to Fruition
Allocation Year* Year 1
(%) Year 2
(%) Year 3
(%) Year 4
(%) No substitution 33 27 40 51 Partial substitution 10 11 17 6 Full substitution 30 19 11 23 Inconclusive 28 43 32 21 Total 101** 100 100 101** Number of projects*** 61 63 47 53
Sources: Telephone interviews with project stakeholders and online survey of QALICBs. * Significant at the .05 level. **Totals do not sum to 100 due to rounding. ***Unweighted.
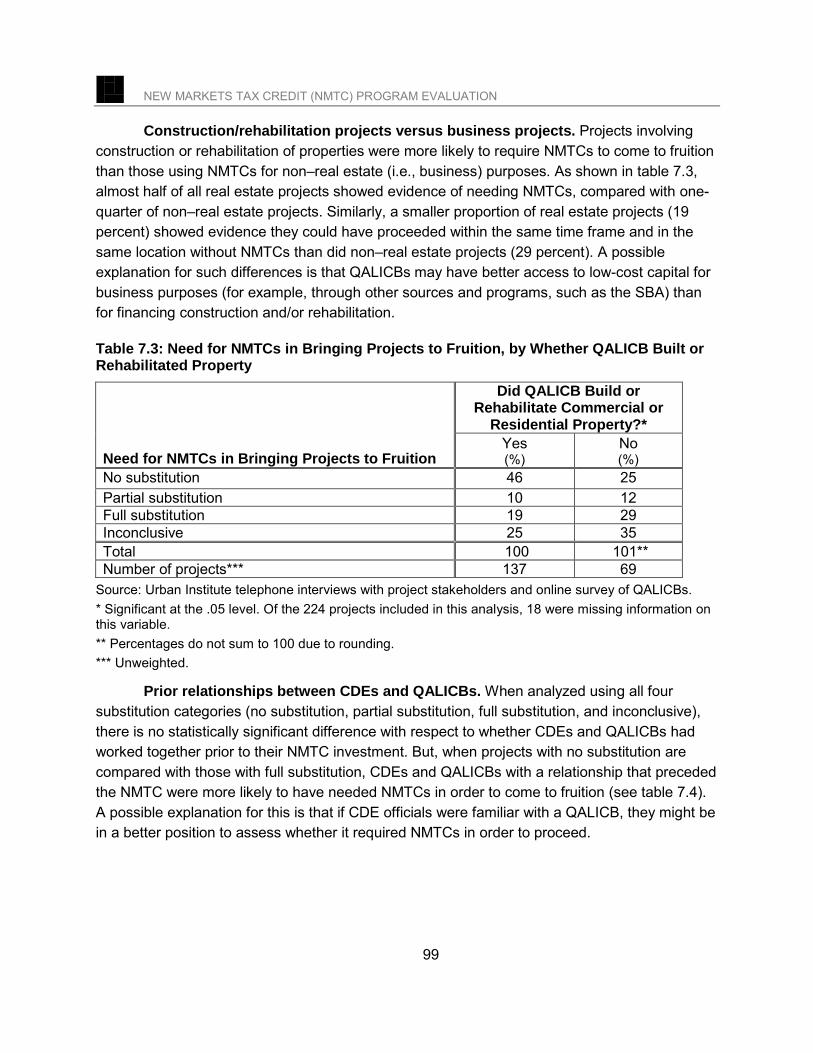
NEW MARKETS TAX CREDIT (NMTC) PROGRAM EVALUATION
99
Construction/rehabilitation projects versus business projects. Projects involving construction or rehabilitation of properties were more likely to require NMTCs to come to fruition than those using NMTCs for non–real estate (i.e., business) purposes. As shown in table 7.3, almost half of all real estate projects showed evidence of needing NMTCs, compared with one-quarter of non–real estate projects. Similarly, a smaller proportion of real estate projects (19 percent) showed evidence they could have proceeded within the same time frame and in the same location without NMTCs than did non–real estate projects (29 percent). A possible explanation for such differences is that QALICBs may have better access to low-cost capital for business purposes (for example, through other sources and programs, such as the SBA) than for financing construction and/or rehabilitation.
Table 7.3: Need for NMTCs in Bringing Projects to Fruition, by Whether QALICB Built or Rehabilitated Property
Need for NMTCs in Bringing Projects to Fruition
Did QALICB Build or Rehabilitate Commercial or
Residential Property?* Yes (%)
No (%)
No substitution 46 25 Partial substitution 10 12 Full substitution 19 29 Inconclusive 25 35 Total 100 101** Number of projects*** 137 69
Source: Urban Institute telephone interviews with project stakeholders and online survey of QALICBs. * Significant at the .05 level. Of the 224 projects included in this analysis, 18 were missing information on this variable. ** Percentages do not sum to 100 due to rounding. *** Unweighted.
Prior relationships between CDEs and QALICBs. When analyzed using all four substitution categories (no substitution, partial substitution, full substitution, and inconclusive), there is no statistically significant difference with respect to whether CDEs and QALICBs had worked together prior to their NMTC investment. But, when projects with no substitution are compared with those with full substitution, CDEs and QALICBs with a relationship that preceded the NMTC were more likely to have needed NMTCs in order to come to fruition (see table 7.4). A possible explanation for this is that if CDE officials were familiar with a QALICB, they might be in a better position to assess whether it required NMTCs in order to proceed.

NEW MARKETS TAX CREDIT (NMTC) PROGRAM EVALUATION
100
Table 7.4: Need for NMTCs in Bringing Projects to Fruition, by Relationship between CDEs and QALICBs—Comparing “No Substitution” with “Full Substitution”
Need for NMTCs in Bringing Projects to Fruition
Did CDE and QALICB Have a Relationship Prior to the NMTC Project?*
Yes (%)
No (%)
No substitution 80 60 Full substitution 20 40 Total 100 100 Number of projects** 34 82
Source: Urban Institute telephone interviews with project stakeholders and online survey of QALICBs. * Significant at the .05 level. Of the 130 projects included in this analysis, 14 were missing information on this variable. ** Unweighted.
Attributes not related to the need for NMTCs. As previously indicated, there were no statistically significant differences between other project attributes and the need for NMTCs. Such attributes include poverty rate, project type, CDE type, QALICB type, project size, and whether the award was a CDE’s first allocation. Tables 7.5 through 7.10 show the data for these project attributes.
Table 7.5: Need for NMTCs in Bringing Projects to Fruition, by Poverty Level
Need for NMTCs in Bringing Projects to Fruition Mean Poverty Rate
(%)* No substitution 29 Partial substitution 31 Full substitution 27 Inconclusive 26 All projects 28 Number of projects** 221
Source: Urban Institute telephone interviews with project stakeholders and online survey of QALICBs. * Not significant at the .05 level. Of the 224 projects included in this analysis, 3 were missing information on this variable. ** Unweighted.

NEW MARKETS TAX CREDIT (NMTC) PROGRAM EVALUATION
101
Table 7.6: Need for NMTCs in Bringing Projects to Fruition, by Project Type
Need for NMTCs in Bringing Projects to Fruition
Project Type*
Retail, Mixed- use, Office,
Hotel (%)
Manufacturing/ Industrial,
Agricultural/ Forestry,
Brownfields (%)
Social Services,
Arts/Culture, Education
(%)
Health Facility or Equipment
(%) Housing
(%) No substitution 44 36 31 26 33 Partial substitution 12 5 14 5 22 Full substitution 22 23 16 37 11 Inconclusive 21 36 39 32 33 Total 99** 100 100 100% 99** Number of projects*** 99 39 49 19 9
Source: Urban Institute telephone interviews with project stakeholders and online survey of QALICBs. * Not significant at the .05 level. Of the 224 projects included in this analysis, 9 were missing information on this variable. ** Totals do not sum to 100 due to rounding. *** Unweighted.
Table 7.7: Need for NMTCs in Bringing Projects to Fruition, by CDE Type
Need for NMTCs in Bringing Projects to Fruition
CDE Type*
For-profit (%)
Nonprofit (%)
Government, Quasi-government
(%) No substitution 38 35 38 Partial substitution 11 10 13 Full substitution 17 29 0 Inconclusive 34 26 50 Total 100 100 101*** Number of projects** 134 82 8
Source: Urban Institute telephone interviews with project stakeholders and online survey of QALICBs. * Not significant at the .05 level. ** Unweighted. *** Totals do not sum to 100 due to rounding.

NEW MARKETS TAX CREDIT (NMTC) PROGRAM EVALUATION
102
Table 7.8: Need for NMTCs in Bringing Projects to Fruition, by QALICB Type
Need for NMTCs in Bringing Projects to Fruition
QALICB Type*
For-profit (%)
Nonprofit (%)
Government/ Quasi-
government (%)
Tribal Government/
Agency (%)
No substitution 30 31 33 0 Partial substitution 13 10 0 0 Full substitution 17 24 0 0 Inconclusive 39 35 67 100 Total 99** 100 100 100 Number of projects*** 89 62 3 1
Source: Urban Institute telephone interviews with project stakeholders and online survey of QALICBs. * Not significant at the .05 level. Of the 224 projects included in this analysis, 69 were missing information on this variable. ** The total does not sum to 100 due to rounding. *** Unweighted. Table 7.9: Need for NMTCs in Bringing Projects to Fruition, by Project Size
Need for NMTCs in Bringing Projects to Fruition
Total Project Cost* Less than $1
million (%)
$1 million to $4.99 million
(%)
$5 million to $14.99 million
(%)
More than $15 million
(%) No substitution 53 25 44 41 Partial substitution 0 18 6 11 Full substitution 24 27 15 23 Inconclusive 24 29 35 26 Total 101** 99** 100 101** Number of projects*** 17 51 72 66
Source: Urban Institute telephone interviews with project stakeholders and online survey of QALICBs. * Not significant at the .05 level. Of the 224 projects included in this analysis, 18 were missing information on this variable. ** Totals do not sum to 100 due to rounding. *** Unweighted.

NEW MARKETS TAX CREDIT (NMTC) PROGRAM EVALUATION
103
Table 7.10: Need for NMTCs in Bringing Projects to Fruition, by Whether or Not Allocation Was CDE’s First Award
Was This the CDE’s First NMTC Allocation?*
Yes No Need for NMTCs in Bringing Projects to Fruition (%) (%) No substitution 83 17 Partial substitution 75 25 Full substitution 79 21 Inconclusive 73 27 Total 78 22 Number of projects** 175 49
Source: Urban Institute telephone interviews with project stakeholders and online survey of QALICBs. * Not significant at the .05 level. ** Unweighted.
Summary
Although the NMTC program has no statutory or regulatory prohibition against substitution, it has program procedures and requirements that can be interpreted as encouraging projects that would not otherwise have proceeded without NMTCs. From a program evaluation perspective, however, determining whether NMTCs are necessary for bringing projects to fruition presents a challenge, requiring establishment of what would have occurred in the absence of the credits.
Data collected via the online survey of QALICBs and telephone interviews with a range of project participants were used to consider this counterfactual. While data collection methods and analytic approaches have limitations and produced somewhat different results, it can reasonably be concluded from the analysis that between three and four of every 10 projects would likely not have proceeded without NMTCs, and about one of every 10 might have proceeded without the credits but probably in a different location or on a delayed schedule. About two of every 10 early NMTC projects did not show evidence of needing NMTCs in order to come to fruition, and there was insufficient information to make any such a determination for the remaining one-third of the projects.
Three project attributes showed statistically significant differences among substitution categories: allocation year, project purpose (real estate vs. business), and preexisting relationships between CDEs and QALICBs. Although other project attributes (such as project type, CDE type, or QALICB type) might be hypothesized to result in differences with respect to whether NMTCs were necessary to bring projects to fruition, such differences are not apparent for early-year projects.

NEW MARKETS TAX CREDIT (NMTC) PROGRAM EVALUATION
104
There are no especially compelling industry benchmarks against which to assess these findings (Abravanel, Pindus, and Theodos 2010). It would, however, be unrealistic to expect all projects in a program such as NMTCs to satisfy a stringent “but-for” test. The timing and unique circumstances surrounding the financing and implementation of some projects may present situations in which real-time decisions by businesses, CDEs, and investors are made without substitution considerations in mind. And, from a program development perspective, agencies must balance the risk of using a subsidy or an excessive subsidy when not needed against the risk of hampering desired outcomes by promulgating overly cumbersome or rigid rules.
The above caveats notwithstanding, the empirical and systematic project-by-project review of substitution reported in this chapter provides a reasonable starting point for considering whether additional programmatic efforts might further encourage use of public subsidies in situations where they are necessary to achieving program objectives. It also serves as a benchmark for subsequent substitution evaluation of later-year NMTC projects.

NEW MARKETS TAX CREDIT (NMTC) PROGRAM EVALUATION
105
SECTION III:
PROJECT OUTPUTS AND OUTCOMES

NEW MARKETS TAX CREDIT (NMTC) PROGRAM EVALUATION
106
INTRODUCTION TO SECTION III This section presents findings pertaining to NMTC project- and community-level outputs
and outcomes, including job generation, real estate development, services and amenities enhancement, business creation, tax generation, and area-wide changes.
Early in the NMTC program’s development, the CDFI Fund sought to quantify project outputs and outcomes through its reporting system, CIIS. The Fund required CDEs to report data on outputs and outcomes projected at project initiation for each project, as well as to provide annual updates over the course of NMTC investments. Among other items, CDEs were asked to report on the number of jobs created, capacity of community facilities, and square feet of real estate developed or rehabilitated (Bershadker et al. 2008). Reporting of project outputs and outcomes has evolved and expanded over time. For example, the most recent version of CIIS added new “actual jobs” as a required reporting field when annual updates are made to “projected jobs” estimates.124
CIIS administrative data provide a constructive starting point in understanding program outputs and outcomes. They are especially useful because of their accessibility and standardization. As such, they allow for straightforward summaries and individual reporting of a broad array of project characteristics. There are limitations to these data, however, including limited information about project context, nuance, and development; the role of NMTCs in project financing; outcomes for tenant businesses of QALICBs; and outcomes of the financing for QALICBs or surrounding neighborhoods.
NMTC industry initiatives have also attempted to enhance the quality and depth of
reporting on project accomplishments. Within the NMTC industry (which includes CDFIs, CDEs, banks, other investors, and other stakeholder entities that participate in NMTC transactions), some members use regional input-output models125 to estimate the impacts of economic development investments. And, some CDEs and investors had also tracked actual (as opposed to model-estimated) outputs and outcomes before this was required for CIIS reporting, although definitions and level of detail varied. The NMTC industry has been moving toward standardization of assumptions for projecting results as well as encouraging and facilitating more robust data collection to measure them.126
124 Changes were made to CIIS for FY 2012; revised reporting instructions and requirements are found in CIIS 10.0. http://www.cdfifund.gov/ciis/2012/FY%202012%20TLR%20Entry_Upload%20Instructions.pdf. 125 Input-output analysis involves the use of multipliers based on a model of a regional economy (a number of which are available) to estimate the impacts of inputs such as dollars invested. Such analyses do not use actual job or earnings data to calculate outcomes, but rely on estimated interindustry and interregional structural relationships in the economic model to estimate impacts. 126 A Community Impact Working Group (CIWG), created in 2010, is made up of CDEs that span a range of sizes, business strategies, products, and geographic foci. One objective for CIWG is the development

NEW MARKETS TAX CREDIT (NMTC) PROGRAM EVALUATION
107
Enumerating outputs and outcomes is also the approach used in this evaluation and presented in the following chapters. Consistent with concepts articulated in the program evaluation literature, this report distinguishes between outcomes and impacts (Abravanel, Pindus, and Theodos 2010).
• Outcomes consist of events and conditions that follow from an intervention, whereas impacts are events and conditions that have been directly caused by it. Identifying and measuring outcomes helps to determine whether a program’s objectives are being achieved; it is the initial stage of a summative evaluation.
• Impact assessment goes further, seeking proof that a program is, in fact, having a measurable effect on the problems to which it responds. An impact assessment must establish what would have happened in the absence of a program (i.e., provide a “counterfactual”) to ensure that the intervention, as opposed to other factors, caused particular outcomes to occur. Indeed, some serious academic and government researchers question the inherent feasibility of rigorously determining impacts of diverse community and economic development investments, such as those supported by the NMTC program, on a program-scale basis (GAO 2002; Hollister 2007; Immergluck 2008; Rubin and Stankiewicz 2005).
The evaluation was not designed to determine impacts and does not document causality. Instead, assessment of program activities, enumeration of project outputs and outcomes, consideration of the costs of producing outcomes, and aggregation of project outcomes are reasonable evaluation objectives for assessing NMTC program results at this stage of its evolution.
Each chapter in this section begins with a framing discussion, which provides context pertaining to how and why particular outputs or outcomes are relevant to measuring the success of community and economic development programs in general, and the NMTC program in particular. Subsequently, evidence related to each output or outcome is analyzed by project type or purpose as well as by project size and other relevant characteristics.
The chapters are organized by output or outcome types for ease of presentation. The types are consistent with categories in the CDFI Fund’s reporting system through 2007, the period applicable to the projects included in the evaluation. However, the purposes and
of “best practices” or guidelines for outcome measurement, both prefunding and post funding. For this purpose, the CIWG identified five project categories for analysis: business, commercial real estate, community facilities, housing, and mixed-use properties. In implementing best practices for outcome measurement, the CWIG suggests that CDEs or other reporting entities review individual projects to determine which specific benchmarks apply in each case.

NEW MARKETS TAX CREDIT (NMTC) PROGRAM EVALUATION
108
activities of NMTC projects do not always lend themselves to such compartmentalization, since many projects have broader purposes and are likely to produce outputs and outcomes in more than one category. For example, a project involving development of a commercial real estate property (an output) may have had as its purpose the provision of space for a grocery store to create shopping services for neighborhood residents (an outcome). The diversity of projects and potential results are important considerations in evaluating the NMTC program as a whole, and are best understood by reviewing the full range of outputs and outcomes reported in this section. Focusing on any single output or outcome would be inconsistent with the program’s mandate and practice.

NEW MARKETS TAX CREDIT (NMTC) PROGRAM EVALUATION
109
8. JOBS OUTCOMES Job creation or retention is an important outcome for many community and economic
development programs—including the NMTC program. Significant as it is, however, job creation or retention is not an absolute litmus test outcome for NMTCs. This is because there is no consensus among program stakeholders as to how new or increased investment capital can best be used to help improve conditions in diverse LICs. Job creation or retention is certainly one such means, but when the program began in 2002, it was one of many outcomes of interest, including improved services, increased tax bases, support for local entrepreneurship, spillover effects to other businesses through the value chain, and safer or cleaner environments.
Following a discussion of conceptual and measurement issues associated with jobs outcomes, this chapter considers the evidence with respect to (a) jobs production, (b) the quality of jobs produced, and (c) the costs of producing jobs.
Interest in Jobs Production as an Outcome
Given that the NMTC program has a multiplicity of possible outputs and outcomes, the CDFI Fund does not appear to value one type over another. For example, no preference is given to jobs outcomes in the scoring of applications for tax credit allocations. That notwithstanding, it is clear that job creation and retention is of considerable programmatic interest.
• On the allocation application forms that CDEs submit to the CDFI Fund, for example, three (out of 10) questions on community and economic development outcomes address the number and quality of jobs a CDE intends its projects to create or preserve.
• Job outcomes are also of primary interest for Congress. According to several well-placed NMTC program stakeholders, representatives and senators appreciate hearing about NMTC projects happening in their communities and, when program advocates provide such information, they tend to highlight employment as a primary outcome. This, the stakeholders maintain, is because jobs numbers generally resonate more vividly than the idea of, say, the restoration of blighted buildings.
Such highlighting of jobs has raised concern among some stakeholders that projects not intended to be high jobs producers might be disadvantaged by the NMTC selection process. For example, in public comments regarding the NMTC program solicited by the CDFI Fund in late 2011 and early 2012, the National Urban League contrasted a charter school (a low producer of both construction and permanent jobs) to a hotel project (a high producer of such jobs). The organization argued that the school project had other societal benefits and should not be considered less valuable simply because it did not produce as many jobs as the hotel.

NEW MARKETS TAX CREDIT (NMTC) PROGRAM EVALUATION
110
The bottom line is that jobs outcomes are an important measure of project results, but they need to be taken in context and should not be the sole metric of a project’s (or the program’s) success.
Conceptual and Measurement Issues
In good part due to the dynamic nature of labor markets, estimating how many new or retained jobs result from a government policy or program, such as NMTCs, is a most challenging undertaking. Three complicating questions must be answered when assessing jobs production:
• Would the jobs have been created or retained in the absence of NMTC investments?
• Are ostensibly created or retained jobs, in fact, simply moved from one location toanother?
• For any project, but especially those with many tenant businesses, how reliable orcomplete is the employment information to which CDEs and QALICBs have access?
Despite serious challenges in conceptualizing and measuring the job creation and retention effects of public sector programs, many policymakers, program evaluators, and program participants have attempted to make such assessments. These have focused on programs ranging from those implemented under the New Deal to more recent public-private sector initiatives such as UDAG in the late 1970s and early 1980s, to the most recent economic stimulus package—the American Recovery and Reinvestment Act of 2009. Methodologies for assessing employment effects have varied considerably and, likewise, assessments have varied with respect to their rigor and quality.
HUD, for example, systematically evaluated the job production results of UDAG, examining its new permanent employment and job retention outcomes as well as its jobs benefits to low- and moderate-income persons. Based on extensive site visits and document reviews, HUD’s program evaluators counted new permanent jobs only if there was evidence they would not have existed in the absence of a UDAG project. Likewise, they counted retained jobs only if there was evidence they stayed in a community because of UDAG funding; if they were simply moved from one part of a community to another, they were not counted as retained.
The effort to count jobs attributable to the American Recovery and Reinvestment Act is instructive as an example of a program that did not have the luxury of site visits by program evaluators. While the Act was intended to stimulate the national economy, it quickly came to be framed as a jobs bill and the debate surrounding its effectiveness increasingly focused on job creation and retention issues. In the first six months following the law’s enactment, considerable confusion arose as to what to count as a job created or retained. The original language asked recipients of stimulus funds to make a subjective judgment regarding whether a given job would have existed in the absence of the Act, which led to inconsistent data reporting. In response to confusion among federal agencies and stimulus recipients about what should be counted as a

NEW MARKETS TAX CREDIT (NMTC) PROGRAM EVALUATION
111
job created or retained, the administration did away with using subjective assessments when it issued follow-up guidelines. The latter defined a job created or retained as “a new position created and filled, or an existing unfilled position that is filled, that is funded by the Recovery Act” (OMB 2009). A job retained was defined as “an existing position that is now funded by the Recovery Act.”
Aside from measurement and data collection challenges associated with estimating the job production outcomes of NMTCs, there are other factors to consider in measuring and evaluating jobs outcomes. These include the nature and scope of the project, the quality of jobs produced, and the beneficiaries of the newly created or retained jobs.
Project nature and scope. Some NMTC projects, by their very nature and scope, are more likely to be higher jobs producers than others. Obviously, for example, larger projects might be expected to produce more jobs than smaller projects. But, also, a particular project might have many community benefits but not be a large jobs producer, while another might produce a large number of jobs but have few community benefits (see the text boxes on the next page for examples). In its third congressionally mandated report on the NMTC program, the GAO noted that job creation and retention can be difficult to quantify, and that the relevance of such measures may vary for different types of projects (GAO 2010).

NEW MARKETS TAX CREDIT (NMTC) PROGRAM EVALUATION
112
An Example of Where Mainly Counting Jobs Misses the Story
A nonprofit school serving children whose families were homeless had been in place for more than 15 years. Operating out of leased space, the school frequently had to change locations. Consequently, school officials launched a capital campaign to raise funds to build a permanent school building. While the campaign raised substantial funding, there was still a shortfall. That shortfall was ultimately filled by an NMTC loan. It was used to purchase land and build a school building. The school staffing did not change. There was no employment expansion, although some temporary construction jobs were generated. The key project output was a permanent home for the school, contributing to the outcomes of stability, continuity, and a better work and learning environment than had previously been the case.
An Example of a High Jobs-Producing NMTC Project
An NMTC-supported loan was used to construct a new 175,000-square-foot shopping center in the distressed urban center of a large metropolitan area in the Southeast. The participating CDE strongly favored retail projects for their capacity to spur further commercial development and their jobs-producing potential. The project supported 365 construction jobs, and about 800 permanent jobs were created to staff the shopping plaza’s multiple tenants that included restaurants, a wholesale grocery store, and other retail stores. About half of the permanent new jobs were at the entry level, about one-third were at the middle level, and the remainder consisted of management positions. Half of the new jobs went to residents of the project’s neighborhood, about one-fifth went to minorities, and one-fifth went to persons with little education or who were otherwise hard to employ.
Quality of jobs. To the extent a program is targeted to LICs, those assessing job productions may also wish to address the issue of job quality (Felsenstein and Persky 1999). Indicators of quality include wage levels, opportunities for advancement, job skills or training provided, and benefits. Benefits can be measured by the percentage of employees offered health insurance, a pension plan, a savings plan, sick leave, tuition assistance, or vacation time. An additional indicator related to employment benefits is the percentage of equity ownership by low-income area residents (Community Development Venture Capital Alliance 2006). Other wealth-building benefits include whether jobs provide stock options, employee stock ownership, profit sharing, or bonuses. With respect to job quality, Seidman (2007) proposes that recipients of NMTC funds should also consider how to improve traditionally low-wage jobs that often accompany the introduction of community services (such as grocery stores and credit unions) to neighborhoods.
Jobs beneficiaries. Another issue relevant to a program intending to benefit LICs is whether newly created or preserved jobs do, indeed, benefit such communities. Depending on the particular program goals that applied, a number of program evaluations have focused on the proportion of created jobs that were filled by local residents rather than outsiders, or that

NEW MARKETS TAX CREDIT (NMTC) PROGRAM EVALUATION
113
targeted certain groups, such as low-income or minority residents. As Bartik (2002) points out, evaluations should go beyond measuring increases in local business growth to also measure the benefits for the public, including increased earnings of the unemployed and underemployed. In his discussion of evaluation efforts of CDFI intervention outcomes, Immergluck (2008) notes that it is difficult to target employment at the neighborhood level due to the geographic scale of labor markets. This difficulty arises from the fact that the benefits associated with employment may not directly transfer to neighborhood residents.
Data Collection for NMTC Jobs
More data for evaluating jobs outcomes were collected for this evaluation than was available to Recovery Act administrators. Even so, the NMTC evaluation generated less data than would have been the case had site visits (comparable to those conducted for the UDAG evaluation, mentioned above) been undertaken. For the NMTC evaluation, telephone interviews with a sample of project participants and the online survey of QALICBs provided information with which to estimate the number of jobs created and retained that are attributable to the NMTC program, as well as information on the level of jobs created/retained, the types of recipients, jobs benefits, and the cost of creating the jobs.127
Information for the evaluation was collected using definitions that are consistent with CDFI Fund CIIS guidance to CDEs, which specify that jobs be reported as full-time equivalents (FTEs)—defined as a work week of 35 hours or more. Hours for part-time employees are combined in calculating FTEs. The evaluation separates permanent full-time job equivalents from construction jobs that may be associated with projects.
CDEs also report through the CIIS on projected outcomes, including estimates of new hires that a QALICB or its tenants expect to be able to make as a result of NMTC financing. CDEs may base their estimates on state or local wage data and projected wage and salary expenditures, on economic impact modeling systems, or on developers’ “rules of thumb” regarding job creation by type of business and square footage developed. Economic impact models may include projections for direct and indirect jobs. Thus, it is very important to clarify how job outcomes are measured, and the evaluation’s telephone interviews inquired about the approaches each CDE used.
Telephone interviews with project participants also provide insight into the measurement difficulties and information gaps inherent in an analysis of job creation and job characteristics. For example, information regarding tenant businesses’ employment numbers tended to be very
127 The online survey of QALICBs and the telephone interviews with project stakeholders inquired as to the number of employees at the time of project initiation and at the end of the most recent reporting period, new positions that were created as a direct result of the NMTC loan and/investment activity, and the number of employees retained who might otherwise have been let go had the NMTC loan and/investment activity not taken place. The results reported in this chapter are based on the online survey as well as the telephone interviews.

NEW MARKETS TAX CREDIT (NMTC) PROGRAM EVALUATION
114
limited. While some CDEs routinely request information on tenant business employment from QALICBs, at least for the early-year projects covered by the evaluation, such information was not collected by all CDEs or maintained by all QALICBs.128 Additional information on employment benefits or job levels at tenant businesses was even less likely to be available.
Factors such as ownership changes, the stage of project completion, and limited information on employee characteristics are important considerations in interpreting jobs data. For some projects that experienced changes in ownership, for example, data on initial employment and changes over time were not available. For projects that were in early stages of operation, such as a newly opened hotel or a shopping center still in the process of leasing up, the numbers reported by project participants likely underestimated the final number of jobs to be created. And in a few cases, projects created jobs that were later lost when businesses failed or downsized.
The Costs of Producing Jobs
The NMTC investment costs of creating or retaining jobs involve such expenses as land acquisition, construction, other infrastructure, rent, equipment purchase, and materials and, notably, do not involve salary costs, such as wages and benefits paid to employees. In measuring the costs of job production, distinctions need to be made among total costs, total public costs, and program costs.
• Total job generation costs include NMTC costs plus costs incurred by developers, CDEs, QALICBs, investors, and other private and public entities that provide financial support to projects.
• Total public job generation costs are a subset of total costs; they consist of costs borne by taxpayers as a result of the NMTC program plus other federal, state, or local programs.
• NMTC job generation costs are yet a subset of total public costs; they consist of costs borne by the federal treasury resulting from the NMTC program.
On a project-by-project basis, these measures will differ based on the fraction of total project costs covered by the NMTC program and by the fraction of costs supported by public funding of all types.129
128 Information on tenant business employment was required by the CDFI Fund beginning with CIIS 9.0. 129 Because job creation was part of the justification for the NMTC program, it is appropriate for an evaluation of the program to consider the NMTC subsidy cost per job generated, the third measure listed above. However, because the program cannot be held accountable for the costs to private investors or to

NEW MARKETS TAX CREDIT (NMTC) PROGRAM EVALUATION
115
Evidence
The remainder of this chapter provides information on the number of jobs created or retained by the NMTC program in its early years, the share of jobs across project types, and the average increase in employment numbers—among other important findings. It also provides information on the quality of jobs created or retained by NMTC projects and the jobs’ beneficiaries, as measured by job level, availability of benefits, and the proportion of jobs filled by neighborhood residents, minorities, and hard-to-employ individuals. Finally, it contains information on the NMTC investment per job generated.
The data presented in this chapter are based on jobs attributed to the NMTC program as reported on a project-by-project basis by CDEs and QALICBs in interviews and surveys conducted for this evaluation in 2011.
Number of permanent jobs created or retained. Among the 247 projects in the combined telephone interview and online QALICB survey samples, 163 reported information on jobs; of those, 91 percent reported that the NMTC program was responsible for creating or retaining at least one permanent position that would not have existed, or saving at least one job that would have been lost (see table 8.1). These counts do not include jobs that were moved from one location to another, even from a low-poverty to a high-poverty neighborhood130 but, rather, jobs that would not have been created or would have been eliminated in the absence of NMTC financing. For projects where new or retained jobs could be attributed to the program, the number of positions ranged from 1 to 1,200.
other public entities, this chapter does not present data on the total cost per job generated or total public costs per job generated. 130 The online QALICB survey did not gather information about jobs that were moved from one location to another. Telephone interviews with project participants, however, did address this point. Where participants were able to report this information, jobs were moved from a low-poverty neighborhood to a high-poverty neighborhood in 12 percent of projects. Although the increase in employment was a benefit to the community, these relocated jobs were not included in the number of jobs created or retained and attributable to the program. In 27 percent of projects, the poverty level of the area from which the jobs were moved was not known, and in another 5 percent of projects, jobs were moved from one high-poverty neighborhood to another. In the remainder of the projects, jobs were not relocated.

NEW MARKETS TAX CREDIT (NMTC) PROGRAM EVALUATION
116
Table 8.1: Share of Early NMTC Projects with Permanent Jobs Attributable to the NMTC Program Did Projects Create and/or Retain New Permanent Positions?
Share of Projects (%)
Yes 91 No 9 Total 100 Number 163* Source: Urban Institute telephone interviews with project stakeholders and online survey of QALICBs. * Unweighted.
A handful of NMTC projects created or retained an outsized number of jobs. Three percent of projects in the combined interview and online QALICB samples produced more than 500 jobs each, and these accounted for one-third of all of the jobs created or retained. The projects included two newly constructed shopping centers on the East Coast, a mixed-used project in the Midwest, and a food-processing center in the South.
About half of the projects (49 percent) created or retained from 1 to 25 permanent jobs, as shown in table 8.2. Another 29 percent created or retained from 26 to 100 jobs, 6 percent created or retained from 101 to 250 jobs, and the remaining 7 percent produced more than 250 jobs. The average (median) early-year NMTC project produced or saved 20 jobs. Adjusting for sampling error, this average can be used to extrapolate to the universe of all early-year projects. Doing so indicates that all early-year projects131 created or retained an estimated 135,970 permanent positions,132 with a 95 percent confidence interval that ranges from 87,279 jobs to 184,662 jobs (see table 8.3).
131 This includes projects receiving tax credit allocations from 2002 to 2006 and initiated prior to December 2007. 132 This estimate assumes that projects with missing jobs data, in fact, created jobs in proportion to projects that did report on this measure. There is no statistically significant difference between projects with and without job information with respect to key observable metrics.

NEW MARKETS TAX CREDIT (NMTC) PROGRAM EVALUATION
117
Table 8.2: Distribution of Projects by Number of Permanent Jobs Created or Retained Number of Newly Created or Retained Positions Directly
Attributable to the NMTC Program
Share of Projects
(%) 0 8 1–10 30 11–25 19 26–100 29 101–250 6 251–500 4 501–1200 3 Total 99* Number of projects 163** Source: Urban Institute telephone interviews with project stakeholders and online survey of QALICBs. * The total does not sum to 100 due to rounding. ** Unweighted.
Table 8.3: Number of Jobs Directly Attributable to the NMTC Program
Permanent Newly Created or Retained Positions Directly
Attributable to the NMTC Program, 2002–2007*
Median number of jobs per project 20 Total jobs estimated for all early-year projects 135,970* 95 percent confidence interval 87,279 to 184,662
Source: Urban Institute telephone interviews with project stakeholders and online survey of QALIDBs. *This estimate is based on 163 projects receiving NMTC allocations from 2002–2006 allocations and initiated before December 2007; it assumes that projects with missing jobs data created jobs in proportion to those projects that did report on this indicator.
There are statistically significant differences regarding the number of jobs created or
saved by type of CDE (table 8.4). Projects in which CDEs were for-profit entities saved or retained 25 jobs per project at the median, for an estimated total of 81,908 jobs among early-year projects (or 60 percent of all jobs created or retained). Projects in which the CDE was a nonprofit entity accounted for 38 percent of the jobs produced or saved. Projects whose CDE investors were government agencies accounted for a much smaller share.

NEW MARKETS TAX CREDIT (NMTC) PROGRAM EVALUATION
118
Table 8.4: Number of Permanent Jobs Directly Attributable to the NMTC Program, by CDE Type
CDE Type**
Newly Created and Retained Permanent Jobs*
Number of Projects
Median per Project
Total Number of Jobs,
Years 1 to 4
Share of All Jobs Created or Retained, Years 1 to 4
(%) For-profit 93 25 81,908 60 Nonprofit 65 13 52,188 38 Government/quasi-governmental agency 5 12 1,874 1
All projects 163 20 135,970 99*** Source: Urban Institute telephone interviews with project stakeholders and online survey of QALICBs. * Estimates based on 163 projects receiving NMTC allocations in 2002–2006 and initiated before December 2007. ** Differences in medians, totals, and shares were statistically significant at the .05 level. *** Totals may not add to 100 percent due to rounding.
Unlike CDE type, job creation and retention did not appear to be related to QALICB type. As shown in table 8.5, for-profit QALICBs created or preserved a higher median number of jobs per project than did nonprofit QALICBs, but this difference was not statistically significant.
Table 8.5: Number of Permanent Jobs Directly Attributable to the NMTC Program, by QALICB Type
QALICB Type**
Newly Created and Retained Permanent Jobs*
Number of Projects
Median per Project
Total Number of Jobs,
Years 1 to 4
Share of All Jobs Created or Retained, Years 1 to 4
(%) For-profit 97 25 95,530 70 Nonprofit 63 15 39,154 29 Government/quasi-governmental agency 2 43 1,072 1 Tribal government or agency 1 9 214 <1 All projects 163 20 135,970 100 Source: Urban Institute telephone interviews with project stakeholders and online survey of QALICBs. * Estimates based on 163 projects receiving NMTC allocations in 2002–2006 and initiated before December 2007, excluding projects that reported no jobs. ** Differences in medians, totals, and shares were not statistically significant at the .05 or .10 level.
Overall, differences in the median number of jobs created or retained by project type are not statically significant (table 8.6). Of course, given that some project types were much more prevalent than others, the more common project types contribute more jobs to the total program estimates of created and retained jobs.

NEW MARKETS TAX CREDIT (NMTC) PROGRAM EVALUATION
119
Table 8.6: Number of Permanent Jobs Directly Attributable to the NMTC Program, by Project Type
Project Type**
Newly Created and Retained Permanent Jobs*
Number of Projects
Median per Project
Total Number of Jobs,
Years 1 to 4
Share of All Jobs Created or Retained, Years 1 to 4
(%) Office, retail, mixed-use, and hotel 75 25 92,306 68 Manufacturing/industrial, agricultural/forestry, brownfields
29 30 21,010 15
Social services, arts/culture, education 38 15 12,342 9 Health facility or equipment 16 15 9,516 7 Housing 5 3 795 1 All projects 163 20 135,970 100 Source: Urban Institute telephone interviews with project stakeholders and online survey of QALICBs. * Estimates based on 163 projects receiving NMTC allocations in 2002–2006 and initiated before December 2007. ** Differences in medians, totals, and shares were not statistically significant at the .05 or .10 level.
Project size is related to the mean number of jobs created or retained—not surprisingly, larger projects created more jobs than smaller ones.133 Projects with a total project cost of $15 million or more accounted for an estimated 46 percent of all jobs created or retained among early-year projects, with 28 newly created or retained jobs per project at the median (table 8.7). As expected, smaller projects produced or retained fewer jobs per project than larger ones. Projects from $1 to $5 million produced or retained 10 jobs per project at the median, while projects below $1 million produced or retained 5 jobs per project at the median.
133 This difference is statistically significant at the .10 level.

NEW MARKETS TAX CREDIT (NMTC) PROGRAM EVALUATION
120
Table 8.7: Number of Jobs Directly Attributable to the NMTC Program, by Project Size
Project Size**
Newly Created and Retained Jobs*
Number of Projects
Median per Project
Total Number of Jobs,
Years 1 to 4
Share of All Jobs Created or Retained, Years 1 to 4
(%) $15 million and over 51 28 59,533 46 $5 million to $14.99 million 49 31 52,591 41 $1 million to $4.99 million 35 10 15,577 12 $0 to $.99 million 14 5 1,559 1 All projects 149 21 129,259 100 Source: Urban Institute telephone interviews with project stakeholders and online survey of QALICBs. * Estimates based on 149 projects for which there are total project size data, and receiving NMTC allocations in 2002–2006 and initiated before December 2007. ** Differences in medians, totals, and shares were statistically significant at the .10 level.
Quality and beneficiaries of jobs. Jobs created or retained and attributable to the NMTC program were not concentrated at any particular job level. Some projects (such as large retail complexes) created or retained primarily entry-level jobs while others (such as a scientific research center) created or retained primarily management-level or professional-level jobs. Most projects included a mix of job levels, with a higher share in the entry and mid-level ranges.
Based on projects where participants were able to report on the characteristics of individuals who were newly hired or retained as a result of NMTC support, 27 percent of all created or retained permanent jobs went to minorities. Project participants were also asked to report on what share of jobs was filled by neighborhood residents. Among reporting projects, 36 percent of all created or retained permanent jobs went to such residents. Sixteen percent of permanent jobs were filled by individuals with low levels of education or who were considered to be hard to employ.
Only about half of projects whose participants reported employment information also provided information on job benefits. Those who did report on benefits overwhelmingly indicated that employees received health insurance, paid sick leave, and/or pensions or matched savings plans.
Construction positions. In addition to permanent jobs saved or retained, the NMTC program can be credited with supporting about 151,304 construction jobs134 in its early years—with a median of 40 construction jobs supported per project, as shown in table 8.8. The evaluation did not include an attempt to determine whether or not construction jobs would have existed without the NMTC program; although CDEs and QALICBs could provide actual or
134 As with permanent jobs, this estimate assumes that projects with missing jobs data created jobs in proportion to those projects that did report on this measure. We find no statistical differences between projects with and without job information on key observable metrics.
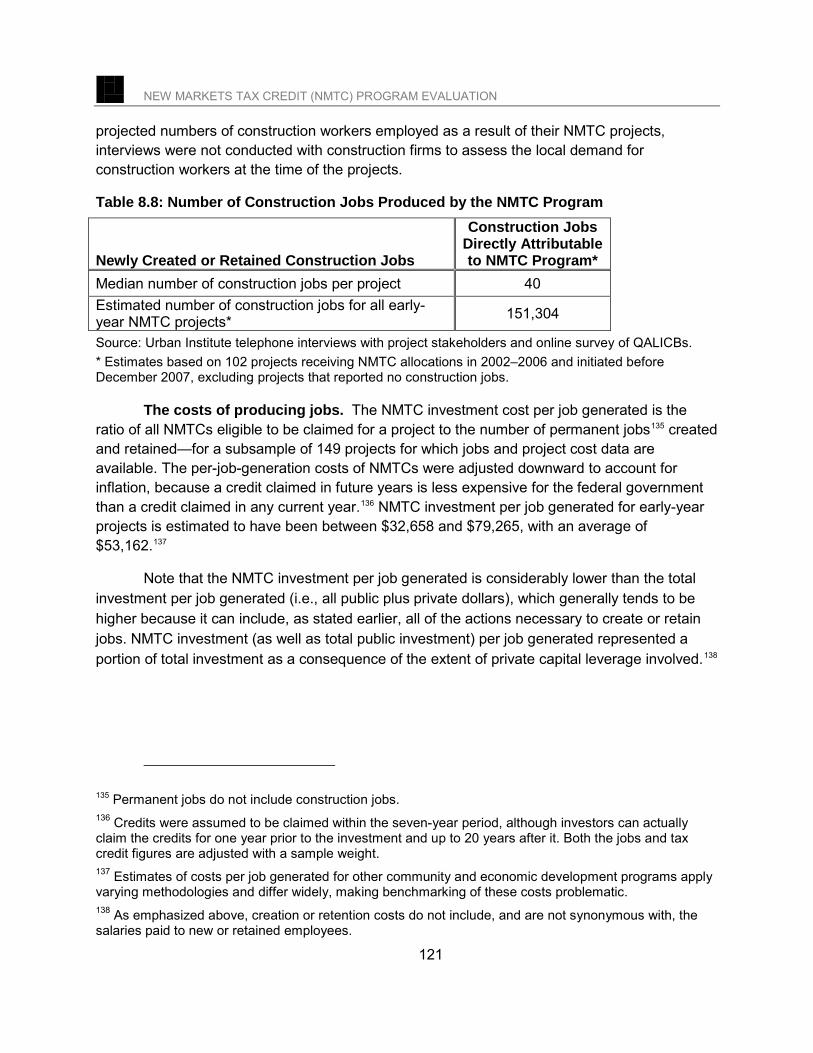
NEW MARKETS TAX CREDIT (NMTC) PROGRAM EVALUATION
121
projected numbers of construction workers employed as a result of their NMTC projects, interviews were not conducted with construction firms to assess the local demand for construction workers at the time of the projects.
Table 8.8: Number of Construction Jobs Produced by the NMTC Program
Newly Created or Retained Construction Jobs
Construction Jobs Directly Attributable to NMTC Program*
Median number of construction jobs per project 40 Estimated number of construction jobs for all early-year NMTC projects* 151,304
Source: Urban Institute telephone interviews with project stakeholders and online survey of QALICBs. * Estimates based on 102 projects receiving NMTC allocations in 2002–2006 and initiated before December 2007, excluding projects that reported no construction jobs. The costs of producing jobs. The NMTC investment cost per job generated is the ratio of all NMTCs eligible to be claimed for a project to the number of permanent jobs135 created and retained—for a subsample of 149 projects for which jobs and project cost data are available. The per-job-generation costs of NMTCs were adjusted downward to account for inflation, because a credit claimed in future years is less expensive for the federal government than a credit claimed in any current year.136 NMTC investment per job generated for early-year projects is estimated to have been between $32,658 and $79,265, with an average of $53,162.137
Note that the NMTC investment per job generated is considerably lower than the total investment per job generated (i.e., all public plus private dollars), which generally tends to be higher because it can include, as stated earlier, all of the actions necessary to create or retain jobs. NMTC investment (as well as total public investment) per job generated represented a portion of total investment as a consequence of the extent of private capital leverage involved.138
135 Permanent jobs do not include construction jobs. 136 Credits were assumed to be claimed within the seven-year period, although investors can actually claim the credits for one year prior to the investment and up to 20 years after it. Both the jobs and tax credit figures are adjusted with a sample weight. 137 Estimates of costs per job generated for other community and economic development programs apply varying methodologies and differ widely, making benchmarking of these costs problematic. 138 As emphasized above, creation or retention costs do not include, and are not synonymous with, the salaries paid to new or retained employees.

NEW MARKETS TAX CREDIT (NMTC) PROGRAM EVALUATION
122
Summary
The findings presented in this chapter, which are based on consistent definitions of job creation and retention, offer new information on the job creation and retention experiences of NMTC projects. Two-thirds of projects in the evaluation samples reported data on jobs, a very good response rate, since CDEs involved in early-year projects were not explicitly required to collect such data. Extrapolating from the project samples to the universe of early projects, it is estimated that early-year projects created or retained 135,970 permanent jobs and 151,304 construction jobs.
Although most project participants who reported information about jobs indicated that NMTCs were responsible for retaining or creating at least one permanent position, a small proportion of the projects accounted for one-third of all jobs created or retained. The biggest jobs producers by project type were retail, mixed-use, office, and hotels; the second highest jobs-producing project types were manufacturing/industrial, agricultural/forestry, and brownfields. For-profit CDEs were responsible for creating and retaining more jobs than nonprofit CDEs, and large projects (as measured by total project costs) created and retained more jobs than smaller ones. Almost half of all jobs created or retained were attributed to projects with a total cost of $15 million and above.
NMTC investments per job generated for early-year projects were estimated to have been between $32,658 and $79,265, with an average of $53,162. This cost indicator for early-year projects is not intended as a measure of total program performance but as an indicator of what is likely to be a benchmark for subsequent evaluations of the NMTC program, that is, for future consideration of whether the program evolves to become more cost efficient with respect to output or outcome production over time.

NEW MARKETS TAX CREDIT (NMTC) PROGRAM EVALUATION
123
9. CONSTRUCTION AND REHABILITATION OUTPUTS AND OUTCOMES
As noted throughout this report, the NMTC program supports many types of community and economic development projects including office buildings, retail businesses, manufacturing facilities, agricultural businesses, schools, hotels, shopping centers, health clinics, and cultural institutions—among others. In some instances, program investments in NMTC projects provide capital to accomplish various business purposes; in others, they provide commercial or residential construction and/or rehabilitation financing.139
In addition to considering community and economic development program results to consist of the benefits of different types of projects, there is also interest in measuring the magnitude of development production outputs—beginning with a basic accounting of the number of square feet of real estate developed. Beyond that, attention is often paid to construction and rehabilitation outcomes, such as building aesthetics and features, local tax base enhancements, neighborhood effects, or adjoining property value appreciation. This chapter also presents evidence about the average cost required to produce one square foot of real estate.
Expectations Regarding Real Estate Outputs and Outcomes
The NMTC program was designed to stimulate the flow of capital to economically disadvantaged markets and, thereby, demonstrate that they offered profit-making opportunities. Capital investments could include either real estate development projects or business or venture capital lending projects. Although not fully anticipated by planners at the initiation of the program, investors early on began to show greater interest in the former over the latter types of investments. The reasons for this included market and program design features. For one thing, CDEs and investors typically view real estate loans as less risky than small business loans, in large part because of differences in the value of collateral. Investors base decisions, in part, on expected financial returns, with real estate investments often perceived to be safer, more secure, and more familiar. Further, given the sizable transaction costs reported by participants in NMTC deals, larger deals are typically more profitable than smaller ones, and real estate investments tend to be larger than other kinds of investment (Lambie-Hanson 2008).
139 IRS regulations permit financing a project that is 100 percent residential if units are for sale; if the units are for rent, however, revenues from the units can represent no more than 80 percent of project revenues, meaning that the projects must be mixed-use of some sort.

NEW MARKETS TAX CREDIT (NMTC) PROGRAM EVALUATION
124
As for program design features, real estate projects are less likely to fall out of compliance with NMTC program income tax regulations, such as those requiring that investments remain in a qualifying census tract for the seven-year compliance period: real estate projects cannot move out of a qualifying tract. Because real estate has a longer life as an asset, real estate projects are typically financed over longer time periods, making it less likely that fund will be redeployed during the compliance period. NMTCs can also be packaged with a number of other tax incentives that make the investments more attractive (GAO 2007a; Seidman 2007). Real estate projects, in particular, may be eligible for historic preservation tax incentives and brownfields mitigation incentives, which cannot be applied to non–real estate projects, such as investments in working capital (Lambie-Hanson 2008).
Output and Outcome Metrics
Program evaluators often use separate metrics to assess commercial and residential real estate. A simple measure of programmatic effort with respect to nonresidential real estate involves commercial property square footage. Reporting by CDEs to the CDFI Fund regarding NMTC project outputs includes the square footage of real estate developed or rehabilitated (Bershadker et al. 2008). However, more detailed outcome measures describing the types or purposes of buildings constructed have been used in some studies of community and economic development programs, including the percentage of nonresidential versus residential construction and the percentage of new construction versus rehabilitation of existing stock. For example, given that HTCs have been available for both housing and nonresidential projects, Listokin, Listokin, and Lahr (1998) tracked the types of projects using HTCs and found that about half of them were exclusively housing and another 20 to 30 percent were in a mixed-use/other category. The remainder consisted of commercial/office renovations.
In addition to enumerating the number of units of housing or square feet of space constructed or rehabilitated, program evaluators have sometimes considered the benefits that real estate development brings to a distressed LIC. Evaluators of HUD’s UDAG program (HUD 1982), for example, considered who benefited from housing developments supported by UDAG; they considered whether the development was located in deteriorated or transitional neighborhoods and whether it was targeted to (or priced for) low- or moderate-income households. Rubin (2006b) explains that some CDFIs report on the number of units designated as affordable to low-income households (i.e., with rents capped at 30 percent of their incomes, which can be no greater than 80 percent of area median incomes), but notes that these figures tend to be projections rather than actual numbers. Relatively few CDFIs track the incomes or other characteristics of ultimate tenants.
Property values are often used as a proxy for measuring the neighborhood effects of community and economic development investments. A number of studies, for instance, have shown that housing investment can have a significant, positive impact on property values near investment sites (Galster, Tatian, and Accordino 2006). Measuring such effects for NMTC projects is especially challenging due to their varied settings and the small sizes of many

NEW MARKETS TAX CREDIT (NMTC) PROGRAM EVALUATION
125
individual program investments relative to the neighborhoods or areas in which they are sited. Furthermore, because changes in property values represent a longer-term outcome, unlikely to change substantially over the project periods reviewed in the present evaluation, this outcome is not addressed.
Another set of metrics to consider deal with cost-per-unit considerations. Measures that follow logically from this evaluation’s emphasis on project results consist of the costs per unit of each of the categories of outputs or outcomes presented above—considered one by one. Such costs conceivably could be compared with similar costs associated with other community and economic development programs, but it would be inappropriate to evaluate the cost efficiency of the collective NMTC program against the per-unit costs of any single output or outcome category. A program like NMTC, which encourages and allows for a variety of project emphases and results, affords a tenuous basis for cross-program efficiency comparisons based on a single output or outcome. In addition to the cost-per-job analysis in chapter 8, this chapter considers cost per unit of real estate production.
Assessment Considerations
The primary real estate output reported below is the amount of residential or commercial space newly constructed or rehabilitated as a result of NMTC financing. The analysis quantifies the amount of real property that early NMTC projects have brought to communities. Projects are categorized as “real estate” if they supported the construction or rehabilitation of residential or commercial properties (or both).140 Some projects consisting of rehabilitated or newly built properties were sponsored by QALICBs that were not primarily real estate developers but, instead, charter school organizations, social service agencies, professional services firms, and others that built or rehabilitated a single building for their own use. Such projects have been included in the following analysis as real estate projects.
The outputs and outcomes reviewed below consist of the following: the presence of a real estate component in NMTC projects, uses of the space (i.e., for residential or commercial purposes, or both), square footage, number of housing units (for residential projects), the extent of any improvements in property appearance or the streetscape, and “green” attributes, such as Leadership in Energy and Environmental Design (LEED) certifications. These outcomes are not exhaustive and are best understood in the context of a project’s purpose and setting (see the text box).
140 This definition differs from the CDFI Fund’s categorization of a real estate projects. The CIIS categorizes QALICBs as real estate businesses if the investee/borrower is a real estate developer whose primary purpose is the development of real estate for others and as non–real estate if the investee/borrower is an operating business or nonprofit organization with an objective other than real estate development.

NEW MARKETS TAX CREDIT (NMTC) PROGRAM EVALUATION
126
Real Estate Projects That Do More Than Add Renovated Space
Standard metrics for measuring real estate outputs (like size) and outcomes (like attractiveness) do not always capture the full effects of some construction and rehabilitation projects, as illustrated in these examples:
A real estate developer had previously purchased a vacant old mill building in the Northeast. NMTC financing was used to rehabilitate the building. Space was leased to two tenants—a professional firm and a nonprofit organization that served vulnerable clients. The developer was able to offer the nonprofit tenant a favorable rent. Independently, the professional firm received employment tax credits for hiring individuals who resided in the community. Thus, the project brought economic activity to a highly distressed area, housed a nonprofit, and brought new life to the building.
A historic building in the Northwest was purchased and rehabilitated by a real
estate developer for the purpose of expanding and relocating his business. The building was quite beautiful but in need of extensive upgrades. On completion, it was occupied by the real estate firm and one retail tenant. The project combined historic preservation and green building standards (LEED certified at the silver level) and is a very visible example of revitalization in the neighborhood. In addition, it not only retained jobs in the city but also expanded employment.
Evidence
A large share of NMTC activity involves the construction or rehabilitation of real estate. QALICBs engaged in real estate activities include traditional real estate developers who build or rehabilitate properties for other entities, but also nonprofit organizations and for-profit businesses that use NMTC-supported loans to build or rehabilitate properties for their own purposes. A small portion of early NMTC real estate projects were intended exclusively or partially as residential space, while the great majority of such projects involved commercial development for retail, office, manufacturing, industrial, health, human services, educational, community services, or cultural purposes.141
Real estate versus non–real estate projects. Slightly more than two-thirds of early-year projects (and 79 percent of project dollars) involved real estate development.142 Approximately 58 percent of QALICBs used some portion of their NMTC-supported loan or
141 One project entailed only a brownfields cleanup. It was included as a real estate development because it made improvements to the parcel of land, although it has not yet resulted in a completed building. 142 These figures are based on the combined results of the telephone interviews with project participants and online survey of QALICBs; the findings did not differ, at the 95 percent confidence level, between the two data sources.

NEW MARKETS TAX CREDIT (NMTC) PROGRAM EVALUATION
127
investment to build or rehabilitate primarily commercial space (see table 9.1).143 Six percent of QALICBs used their NMTC investments to build or rehabilitate primarily residential units. Another 4 percent built or rehabilitated a combination of commercial and residential space,144 and 31 percent did not engage in real estate development. Projects that did not include a real estate component were business-related loans and investments made for working capital and equipment purposes.
Table 9.1: Type of Real Estate Development, by Share of Projects and Share of Total Project Dollars
Type of Development Share of Projects
(%)
Share of Total Project Dollars
(%) Commercial 58 41 Combination of commercial and housing 4 3 Housing 6 35 No real estate component 31 21 Total 99* 100 Number of projects 218** 218
Source: Urban Institute telephone interviews with project participants and online survey of QALICBs. * Totals do not sum to 100 percent due to rounding. ** Of the 247 projects included in the combined sample, 29 are not included in this analysis because it was not possible to determine whether the project was real estate or non–real estate.
With respect to different types of CDEs, those that were for profit, or had for-profit parent entities, were more likely to invest in real estate projects than those established or controlled by nonprofit organizations; the difference is statistically significant (see table 9.2). These findings are consistent with those reported by the GAO (2010) using CDFI Fund CIIS definitions of what constitutes a real estate project.
143 The same categorization that is used in the section of chapter 4 on project type is employed here. Projects were categorized as “housing” if more than 90 percent of their total space was used for that purpose. The outsized share of project dollars in the housing category is due to a few outsized projects in the sample that were more than 90 percent housing. 144 The category “combination of commercial and housing” differs from the “mixed-use” category that appears in chapter 4 in the discussion of project type. In chapter 4, projects were classified as mixed-use if they had a mix of uses that included commercial only or a combination of housing and commercial and if no one component represented more than 90 percent of the project’s total space. If a project contained a mix of commercial uses only, it would be classified as “mixed-use” in table 4.1 but as “commercial” in table 9.1.

NEW MARKETS TAX CREDIT (NMTC) PROGRAM EVALUATION
128
Table 9.2: NMTC Real Estate Projects, by CDE Type
CDE Type
Did the Project Involve Building or Rehabilitating Commercial or
Residential Space?** Yes (%)
No (%)
Total (%)
Number of Projects*
All nonprofits 61 39 100 57 All for-profits 70 30 100 125 Governmental or quasi-governmental 66 3 100 28
Source: Urban Institute telephone interviews with project participants and online survey of QALICBs. * Unweighted. ** The differences are statistically significant at the .10 level.
Decisions to invest in real estate projects did not differ by distress level of the communities in which the projects were located. For example, roughly the same percentage of real estate projects were located in CDFI Fund–defined areas of higher distress (i.e., with poverty levels greater than 30 percent) as were non–real estate projects. Real estate projects were far more likely to be found in metropolitan than nonmetropolitan areas: 89 percent of projects involving newly constructed or rehabilitated properties were located in the former, compared to 11 percent in the latter. An explanation for this finding may be the limited investment opportunities and small deal sizes in rural areas, as well as the difficulties of assembling large debt or equity financing in rural areas (Barkley et al. 2001). Another possible explanation is that certain types of real estate developments (e.g., mixed-use, hotel, and retail) require a certain population density to be feasible. Decisions to invest in real estate as opposed to other purposes did not vary over the period covered by the evaluationthere were no statistically significant differences in the proportion of real estate projects among the first four years of NMTC program allocations.
Tenant businesses. Of the total number of real estate and non–real estate projects comprising the combined samples of telephone interviews with project participants and online QALICB survey, 41 percent included at least one tenant business. While it was most common for real estate projects to have tenant businesses (e.g., where a QALICB constructed a shopping mall in which many tenants leased space), some non–real estate projects also involved tenant businesses. An example is a QALICB that purchased a manufacturing business and, in the process, acquired its existing building and a handful of preexisting tenants. For the evaluation project sample as a whole, the largest number of tenant businesses in any project was 125, but the median number was three. The most common types of tenant businesses were professional, scientific, and technical entities (17 percent); grocery stores (14 percent); and restaurants (11 percent). Real estate businesses without tenant businesses included forestry and manufacturing businesses, a museum, and a storage facility, among others.
Square footage and number of units developed. Real estate projects that involved a commercial component ranged from small medical offices to large shopping malls. The smallest project, an office building in the Midwest, was 2,600 square feet; the largest, a medical facility in

NEW MARKETS TAX CREDIT (NMTC) PROGRAM EVALUATION
129
the South, was 1.1 million square feet. The median size of commercial projects was 37,333 square feet. Examples of median-sized projects include a performing arts theater on the West Coast and a mixed-use building containing a dental facility, health clinic, and grocery store in the Northeast. The mean size of commercial projects was about 85,558 square feet. Projects near these averages include an 85,000-square-foot social services facility and an 82,000-square-foot office building.
The 106 sampled NMTC projects that contained commercial space developed a total of 9.6 million square feet of real estate. Extrapolating to the universe of early-year projects, it is estimated that NMTC program investments resulted in the development of 72 million square feet of commercial real estate.
As shown in table 9.3, more than half of commercial projects contained less than 50,000 square feet, and a very small share contained more than 500,000 square feet. The modal project was between 10,000 and 50,000 square feet. The asking rents for commercial real estate projects were overwhelmingly market rate, with 15 percent of commercial projects reporting below-market rates.
Table 9.3: Distribution of Commercial Square Footage, by Project
Number of Projects*
Share of Projects
(%)
Share of Total Project
Dollars (%)
< 10,000 square feet 16 17 1 10,000–50,000 square feet 44 42 12 50,001–100,000 square feet 18 16 8 100,001–500,000 square feet 24 22 62 >500,000 square feet 4 4 16 Total 106 101** 99**
Source: Urban Institute telephone interviews with project participants and online survey of QALICBs. * Unweighted. ** Percentages do not sum to 100 due to rounding.
Only a small share of early-year NMTC projects (8 percent) included housing units, either as part of a mixed-use development or as a solely residential property.145 IRS regulations permit financing a project that is 100 percent residential if units are for sale; if the units are for rent, however, revenues from the units can represent no more than 80 percent of project revenues—meaning that the projects must be mixed-use of some sort.
145 Another federal tax credit program exists specifically to provide support to housing projects. See Low-Income Housing Tax Credit in the Internal Revenue Code, Section 42, http://www.gpo.gov/fdsys/pkg/USCODE-2010-title26/pdf/USCODE-2010-title26-subtitleA-chap1-subchapA-partIV-subpartD-sec42.pdf.

NEW MARKETS TAX CREDIT (NMTC) PROGRAM EVALUATION
130
Projects with a residential component ranged in size from 6 to 215 residential units. At the median, residential projects contained 59 units. In all, the projects included in the evaluation constructed or rehabilitated a total of 1,000 residential units. Extrapolating to the universe of early-year projects, it is estimated that NMTC program investments developed 8,160 residential units.
Of all residential units developed with NMTC financing, 36 percent were set aside for low-income households.146 Just over half of all residential projects set aside at least some units for low-income households, with the share varying. For example, one mixed-use rehabilitation project, which included rental apartments above a commercial ground floor, set aside five of its 59 units (or 8 percent), while another solely residential project set aside 167 of its 215 units (or 78 percent) for low-income occupancy.
Many participants in real estate projects did not provide information about the number of vacant units or vacancy rates but, where they did, vacancy rates appeared to be low. Of the 56 percent of projects that reported commercial vacancies, vacancy rates ranged from zero to 100 percent, with a median of 10 percent. Of the 83 percent of project participants reporting housing vacancies, vacancy rates ranged from zero to 33 percent, with a median of zero percent, because most respondents reported no vacancies.
Improvements to exterior and streetscape appearance. QALICB participants involved in rehabilitating solely commercial, solely residential, or a combination of commercial and residential properties were asked to assess the extent and quality of improvement in the exterior appearance, streetscape, or façade of the property. Based on these reports, about 81 percent of projects resulted in major improvements to property appearance, the streetscape, or the façade (table 9.4). Another 8 percent of projects reportedly resulted in minor improvements in appearance. Projects contributed to the vitality of communities by improving the appearance of buildings, making the area more attractive, and increasing foot traffic. Stakeholders from the telephone sample reported such activities as cleaning the exterior façade, replacing windows, adding signage, and preserving architectural features as part of their projects. A CDE from the telephone sample advised, “Don’t underestimate the benefits of removing blight.”
One such example involved a large industrial complex in the commercial hub of a large midwestern city’s suburb. The complex had become dilapidated and sat mostly vacant for more than a decade. NMTC-supported financing was used to rehabilitate the hulking structures and turn them into a 630,000-square-foot office complex. Instead of razing the existing buildings and developing the complex with new construction, the building’s brick exteriors and frame were preserved and restored. In recognition of the site’s history, equipment from the former plant was incorporated into architectural features in the renovated buildings.
146 In Allocation Round 5, the CDFI Fund added a question to the NMTC Allocation Application, which asked if applicants would commit at least 20 percent of units financed to be affordable. This is also a condition of Allocation Agreements.
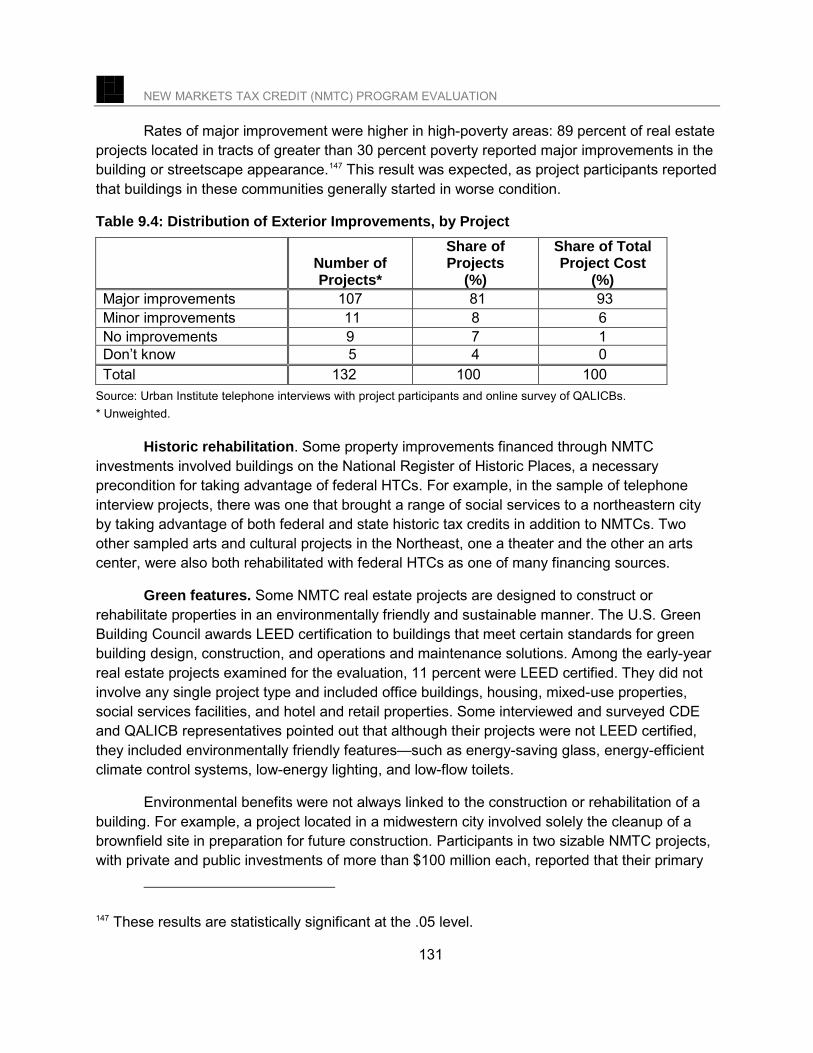
NEW MARKETS TAX CREDIT (NMTC) PROGRAM EVALUATION
131
Rates of major improvement were higher in high-poverty areas: 89 percent of real estate projects located in tracts of greater than 30 percent poverty reported major improvements in the building or streetscape appearance.147 This result was expected, as project participants reported that buildings in these communities generally started in worse condition.
Table 9.4: Distribution of Exterior Improvements, by Project
Number of Projects*
Share of Projects
(%)
Share of Total Project Cost
(%) Major improvements 107 81 93 Minor improvements 11 8 6 No improvements 9 7 1 Don’t know 5 4 0 Total 132 100 100
Source: Urban Institute telephone interviews with project participants and online survey of QALICBs. * Unweighted.
Historic rehabilitation. Some property improvements financed through NMTC investments involved buildings on the National Register of Historic Places, a necessary precondition for taking advantage of federal HTCs. For example, in the sample of telephone interview projects, there was one that brought a range of social services to a northeastern city by taking advantage of both federal and state historic tax credits in addition to NMTCs. Two other sampled arts and cultural projects in the Northeast, one a theater and the other an arts center, were also both rehabilitated with federal HTCs as one of many financing sources.
Green features. Some NMTC real estate projects are designed to construct or rehabilitate properties in an environmentally friendly and sustainable manner. The U.S. Green Building Council awards LEED certification to buildings that meet certain standards for green building design, construction, and operations and maintenance solutions. Among the early-year real estate projects examined for the evaluation, 11 percent were LEED certified. They did not involve any single project type and included office buildings, housing, mixed-use properties, social services facilities, and hotel and retail properties. Some interviewed and surveyed CDE and QALICB representatives pointed out that although their projects were not LEED certified, they included environmentally friendly features—such as energy-saving glass, energy-efficient climate control systems, low-energy lighting, and low-flow toilets.
Environmental benefits were not always linked to the construction or rehabilitation of a building. For example, a project located in a midwestern city involved solely the cleanup of a brownfield site in preparation for future construction. Participants in two sizable NMTC projects, with private and public investments of more than $100 million each, reported that their primary
147 These results are statistically significant at the .05 level.

NEW MARKETS TAX CREDIT (NMTC) PROGRAM EVALUATION
132
benefit was sustainable forestry. They cited NMTC financing as important in lowering the debt burden for QALICBs, which allowed these businesses the flexibility to harvest trees more slowly, that is, in a sustainable manner.
Cost per square foot. There are several ways to consider cost per square foot measures. The first is simply the cost per square foot of all real estate developed. The total project (public plus private) cost per square foot of property developed (i.e., built or rehabilitated) in early-year NMTC projects was between $158 and $322—with an average of $227. As with job generation, the NMTC program contributes only a fraction toward the total investment cost of building or rehabilitating real estate because of the leverage of other public, and especially private, capital.
NMTC investment costs (that is, the NMTCs specifically, not the broader NTMC structure) per square foot of real estate developed were between $28 and $62, with an average of $43—or 19 percent of total per-square-foot costs. When projects that were considered “full substitution” (i.e., that did not demonstrate they needed NMTCs) are excluded from the results side of the equation but included in the cost side, the NMTC cost per square foot increases to between $33 and $78, with an average of $50—or 22 percent of total per-square-foot costs.
Finally, total public investment costs per square foot of real estate developed for early-year projects were between $28 and $112, with an average of $60—or 26 percent of total per-square-foot costs. When projects that were considered “full substitution” are excluded from the results side of the equation but included in the investment cost side, the public investment cost per square foot increases to between $32 and $121, with an average of $65—or 29 percent of total per-square-foot costs.
Again, the difference between the NMTC cost investment per unit and the total cost investment per unit is in part because the NMTCs frequently leverage other funding sources.
Summary
The majority of early-year NMTC investments consisted of commercial real estate development: about two-thirds involved construction or rehabilitation of commercial or residential real estate, and about three-quarters involved projects with a real estate component. The remaining projects supported loans and investments used for business purposes.148 Among the real estate projects, a small portion was intended exclusively or partially as residential space, while the great majority consisted of commercial development. For-profit CDEs were more likely than nonprofit CDEs to invest in real estate projects. Among the residential projects, more than one-third of the total units constructed were set aside for low-income residents.
148 Over time, the investment pattern of CDEs has shifted its allocations to balance real estate and non–real estate projects. See the CDFI Fund’s Agency Financial Report for FY 2011: http://www.cdfifund.gov/news_events/CDFI%20Fund%20FY%202011%20Agency%20Financial%20Report%20FINAL%2011%2016%2011.pdf.

NEW MARKETS TAX CREDIT (NMTC) PROGRAM EVALUATION
133
Commercial properties, on average, added between 50,000 and 100,000 square feet of usable space to the communities in which they were located. Construction and renovation projects also helped to beautify their surrounding areas, and some incorporated green building features. Not surprisingly, almost all real estate projects resulted in major improvements to property appearance, the streetscape, or façade. About one in 10 early-year real estate projects (including office buildings, housing, mixed-use, and retail properties) was LEED certified.

NEW MARKETS TAX CREDIT (NMTC) PROGRAM EVALUATION
134
10. OTHER PROJECT OUTCOMES This chapter focuses the outcomes of NMTC projects beyond the job production and real estate development results addressed in chapters 8 and 9. While the latter tend to be among the more commonly measured outputs and outcomes of community and economic development programs, the broad mandate of NMTCs to stimulate new or increased investment in LICs suggests that results involving creation of services and amenities, support for small businesses and organizations, and enhancement of local tax bases are also very relevant. Each of these is considered, in turn.
Creation of Amenities, Services, and Facilities
In addition to other outcomes, NMTC projects may add to or expand community amenities, services, and facilities, such as by increasing access to retail services, building human capital, enhancing quality of life, or improving access to public infrastructure. These are outcomes that community residents can consume, engage in, or enjoy. They are provided by a variety of entities, both nonprofit and for profit.
Community amenities, services, and facilities play a central role in many community and economic development programs. Some initiatives, for example, promote investment in amenities in order to stimulate growth, attract new businesses, and increase investment. Others, particularly comprehensive community initiatives that emerged during the late 1980s and early 1990s, took a broader approach by seeking to promote positive change in disadvantaged neighborhoods through holistic efforts to address physical, social, and economic conditions149 (Fulbright-Anderson 2006).
Any given project can produce a single amenity, service, or facility or multiple amenities, services, or facilities as part of its plan. In some cases, these may be the primary focus of the project while, in others, they may be a modest addition to other intended results. Community amenities, services, and facilities outcomes are distinguished from area-wide outcomes (e.g., improved property values in the surrounding neighborhood) in that the former are directly financed with NMTCs while the latter are not. Chapter 11 considers area-wide outcomes of NMTC projects.
Defining community amenities, services, and facilities. Because there is a broad array of potential community amenities, services, and facilities (hereafter, “amenities”) that NMTC projects may produce, the analysis presented in this section groups them in terms of
149 These efforts tended to be funded by national or community philanthropic foundations.

NEW MARKETS TAX CREDIT (NMTC) PROGRAM EVALUATION
135
retail amenities, human capital amenities, quality-of-life amenities, and public infrastructure amenities.150
• Retail amenities include grocery stores, shopping malls, banking or financial services or products, restaurants, laundry facilities, gas stations, and hotels. LICs often lack access to full-service groceries and other retail amenities. This affects residents’ access to a broader selection of products and lower prices, which are not provided by smaller groceries and convenience stores (Kaufman et al. 1997). Barriers to banking services also exist. Barr (2004) claims that access to bank accounts and other banking services as well as financial education is critical to success in the modern economy, and some community and economic development programs have been directed toward providing such services.
• Human capital amenities include health care facilities, child care centers, elementary or secondary schools, postsecondary education facilities or opportunities, and employment training centers. Access to good-quality health care and other related human services, such as child care and educational institutions, is a challenge for LICs but important to building and maintaining human capital. Public charter schools have been an active area for community and economic development because they may offer a way to increase access to quality education, but face obstacles to obtaining financing for their facilities. Eberts, Erickcek, and Kleinhenz (2006) found that a skilled workforce is the primary driver of economic growth. The Council on Competitiveness (2005) supports this conclusion, reporting that most studies of corporate location decisions have shown skilled labor to be an important asset, and that firms tend to expand in regions in which they can find a core workforce with specialized skills related to their industry. Regions must consider not only the quality of local education, but also the retention of local graduates and the ability to attract talent from other regions.
• Quality-of-life amenities affect the location of talent and are an important factor in economic development (Eberts, Erickcek, and Kleinhenz 2006; Florida, Mellander, and Stolarick 2007). Those considered in this evaluation include public libraries; arts and cultural institutions or museums; and parks, open space, playgrounds, and recreation and community centers. There is an emerging effort to measure access to arts and culture, parks, and outdoor recreation. Jackson, Kabwasa-Green, and Herranz (2006) focus on “cultural vitality,” which they define as evidence of creating, disseminating, validating, and supporting arts and culture as a dimension of everyday life in communities. Metrics of “cultural vitality” include the presence of opportunities for
150 In contrast to project type, as presented in chapter 4 and incorporated in much of the analysis presented in this report, this grouping allows for consideration of amenities produced by all projects regardless of whether the amenity outcome was the project’s primary purpose.

NEW MARKETS TAX CREDIT (NMTC) PROGRAM EVALUATION
136
cultural participation, cultural participation in its multiple dimensions, and support systems for cultural participation.
• Infrastructure amenities considered in this evaluation include parking lots or garages, public transportation, such as bus or rail systems, and brownfields cleanups. Eberts (1990) found that public infrastructure (such as roads, streets, bridges, water treatment and distribution systems, waterways, airports, and mass transit) can enhance community and economic development by offering a locational advantage to businesses, by either increasing productivity or reducing factor costs.
Assessment considerations. Community amenities outcomes were identified through both telephone interviews with project participants and the online survey of QALICBs. Interview and survey respondents were read/shown a list of amenities, services, and facilities and asked to indicate whether their project had created, expanded, or improved the quality of any of them as of the time of the interview.151 Respondents also had the opportunity to discuss other types of amenities, services, or facilities beyond the list provided.152
Evidence. It is important to consider project context when assessing amenities outcomesincluding the purpose of any particular project. Projects in which the QALICB intended to produce amenities, services, or facilities were reviewed with respect to whether they provided what they intended, as well as whether they provided any additional amenities, services, or facilities.153
Project intent was addressed for the 70 projects in the telephone interview sample. Of these, 58 percent primarily intended to produce at least one community amenity, service, or facility, and all of them did so.154 In addition, 40 percent produced one or more additional amenities, services, or facilities. Of the 42 percent of projects for which QALICBs did not intend
151 Hotel and brownfields cleanups options were not offered as specific responses in the interview guides used for the telephone interview or in the online survey; they were identified through responses to open-ended questions and interview discussions. 152 In the survey, respondents used a free form to describe other types of outcomes. It was very rare that respondents offered additional outcomes, and in all cases where additional outcomes were listed, they could be categorized under one of the listed types. 153 For the telephone interview sample, the evaluation team had the ability to probe for project purpose—whether the construction or improvement of a certain amenity, service, or facility was the project’s primary focus—and for community need—whether the specific outcome was fulfilling an identified community need. This level of detail was not available for the online QALICB survey. 154 Ninety-six percent of these projects have amenities and facilities that presently exist. Two of these projects ended up closing down; however, their benefits to the community existed for some period of time (a full-scale grocery store served its community for about a year and a retail shopping center with a host of stores and services served the community for almost three years).

NEW MARKETS TAX CREDIT (NMTC) PROGRAM EVALUATION
137
to create, expand, or improve amenities, services, or facilities, 37 percent in fact provided them as ancillary benefits of their projects.
Information on amenities produced was collected during both the telephone interviews and the online QALICB survey. Of the 191 QALICBs that reported on amenities, services, and facilities, approximately 86 percent reported having produced at least one such amenity. Table 10.1 presents the share of projects that produced the following types of amenities: shopping centers, restaurants, laundry facilities, and gas stations constituted the largest share of outcomes, with 42 percent of all projects reporting this type of amenity; health facilities constituted the second largest share, at 23 percent; parks and open space constituted the next largest share, at 21 percent; and parking lots and arts and cultural institutions constituted the next largest share, at 19 percent.

NEW MARKETS TAX CREDIT (NMTC) PROGRAM EVALUATION
138
Table 10.1: Number and Share of Projects, by Types of Amenities
Amenity, Service, or Facility
Composite Share of Projects Creating or Expanding Existing
Capacity or Improving Quality of Amenity, Service, or
Facility
(%)
Retail, food, and accommodation services or facilities
Shopping centers, restaurants, laundry facilities, gas stations 42 Banking or financial services 12 Grocery stores 11 Hotels 4
Human capital amenities Health facilities 23 Employment training centers 13 Child care centers 11 Elementary or secondary schools 11 Postsecondary education facilities or opportunities 9
Quality-of-life amenities Parks, open spaces, playgrounds, and recreation or community centers
21
Arts and cultural institutions or museums 19 Public libraries 5
Public infrastructure Parking lots or garages 19 Public transportation (bus or rail) 7 Environmental cleanup 2
Total 209*
Number of projects 191
Source: Telephone interviews with project stakeholders and online survey of QALICBs. * The total sums to greater than 100 percent because some projects created and expanded the existing capacity or improved the quality of more than one amenity, service, or facility.
As shown in table 10.2, of the QALICBs that reported on amenities, 42 percent produced one amenity outcome and 46 percent two or more amenity outcomes. About 12 percent responded that the project did not produce any of the outcomes that were listed. These tended to be office construction or rehabilitation projects, business purchases, or manufacturing or industrial investments. On average, projects that produced community amenities, services, or facilities reported two such outcomes per project.

NEW MARKETS TAX CREDIT (NMTC) PROGRAM EVALUATION
139
Table 10.2: Number and Share of Projects, by Number of Outcomes*
Number of Outcomes
Number of Projects**
Share of Projects (%)
0 27 12 1 74 42 2 or more 90 46 Total 191 100
Source: Telephone interviews with project stakeholders and online survey of QALICBs. N = 191 *The number of outcomes ranged from 0 to 15. ** Unweighted.
Retail, food, and accommodation services or facilities. Distribution of amenities reported within the category of retail, food, and commendation services or facilities was as follows: Shopping centers, restaurants, laundry facilities, and gas stations were the most frequently reported (42 percent); banking or financial services were the second most frequently reported (12 percent); grocery stores were the third most frequently reported (11 percent); and hotels were the fourth most frequently reported (4 percent) (table 10.1).
From the telephone sample, a further breakdown of the shopping category is available. Among the 70 projects in the sample, there were 14 restaurants, 13 shopping centers, and 1 laundry facility.155 For example, in a West Coast city, a QALICB used its NMTC allocation to renovate an old shopping center, which had various retail stores, a full-scale grocer, and a number of restaurants. Another project, located in a historic district in a southern city, developed a hotel that included a restaurant. In a small urban area in the Midwest, a QALICB developer worked with the city government to redevelop an abandoned industrial site for a commercial corridor with space for five tenants, including a coffee shop, sandwich shop, and a large electronics retailer.
A number of QALICBs responded to a community’s need for full-scale grocery stores. In one instance, such a project was developed in a high-poverty neighborhood in a southeastern city with a large senior population. Many of the seniors did not drive and had to travel by bus or taxi for groceries. The city had unsuccessfully sought to attract a grocery store for seven years until an NMTC-supported loan enabled it to develop a new shopping center on the site of a formerly vacant one. It was able to attract a full-scale discount grocery store as an anchor tenant, in addition to a pharmacy, credit union, and clothing store. Another project expanded an existing grocery store in a low-income community in the Midwest, including a full-service deli, bakery, catering service with delivery, and an in-store restaurant.
155 None of the telephone interview projects involved adding or enhancing gas stations.

NEW MARKETS TAX CREDIT (NMTC) PROGRAM EVALUATION
140
About three-quarters of all projects with a retail amenity were provided by for-profit QALICBs, whereas a little more than one-quarter were provided by nonprofit QALICBs.156 A similar pattern emerges with CDE sponsorship: 69 percent of projects with a retail amenity were provided by for-profit CDEs, while the remainders were provided by nonprofit CDEs.157
Human capital amenities. Among five subtypes of human capital amenities, health care facilities were the most frequently reported (23 percent). Projects ranged from large-scale hospitals with more than 100 beds to small-scale neighborhood health clinics. The remaining subtypes involved employment training centers (13 percent), child care centers (11 percent), elementary or secondary schools (11 percent), and postsecondary education facilities or opportunities (9 percent) (table 10.1).
Some projects provided multiple human capital amenities. For example, a community facility in the downtown area of a northeastern city housed two nonprofit organizations that, together, offered a variety of services to the community, such as postsecondary education, employment training, a computer laboratory, classrooms, and child care facilities. The space also included classes in the arts, music, and dance; an auditorium; office space; and conference rooms. In another project, located in a southern city, a QALICB expanded an existing charter elementary and middle school to include a new high school. The project also provided a public library that the community could access. A third example is in a northwestern city, where a QALICB built a social service facility that included a drug treatment program with inpatient care, an emergency medical clinic, and a community meeting room. It also provided meal services to the poor.
With respect to need, three projects in the telephone sample provided access to health services and, in one case, to both health and dental services to communities that did not previously have access to such services. One example involved a dialysis center for community residents to receive routine treatment. Prior to the project, residents in the small town had to travel 40 miles for dialysis services. Another NMTC project brought a large-scale hospital into a community that did not have access to one previously. In a third case, stakeholders described the difficulty of receiving health and dental services because they were inaccessible prior to the project. With the support of the NMTC financing, a combined health and dental clinic was able to locate and expand its facility and to extend its services to the underserved community.
Nonprofit QALICBs were more likely than for-profit QALICBs to provide human capital amenities. About 68 percent of projects with human capital amenities were nonprofit QALICBs, while 32 percent were for-profit QALICBs.158 Nonprofit CDEs were also more likely than for-profit and government CDEs to finance projects with human capital amenities: 51 percent of such
156 This difference is statistically significant at the .01 level. 157 This difference is statistically significant at the .05 level. 158 The differences are significant at the .01 level.

NEW MARKETS TAX CREDIT (NMTC) PROGRAM EVALUATION
141
projects were financed by nonprofit CDEs, compared with 43 percent by for-profit CDEs, and 6 percent by government CDEs.159
Quality-of-life amenities. Distribution across three subtypes of quality-of-life amenities was as follows: parks, open spaces, playgrounds, and recreation or community centers were the most frequently reported amenity (21 percent); arts and cultural institutions or museums were the second most frequently reported amenity (19 percent); and public libraries were the third most frequently reported amenity (5 percent).
Projects ranged from teen centers to community meeting rooms to neighborhood playgrounds. Arts and cultural institutions ranged from local museums to large-scale theaters and from artist lofts and studios to neighborhood music and dance classes.
Nonprofit QALICBs were more likely to sponsor projects with quality-of-life amenities at 63 percent, whereas for-profit QALICBs represent 37 percent. With respect to CDEs, there was an equal split between for-profit CDEs and nonprofit CDEs at 48 percent. Government CDEs represented a modest share at 4 percent. Differences were not statistically significant.
Infrastructure amenities. Among the three types of infrastructure projects, parking lots or garages were the most frequently reported amenity at 19 percent, while public transportation and environmental cleanups were less common, at 7 percent and 2 percent, respectively.
Projects that involved creating parking lots or garages were often shopping centers, office buildings, mixed-use developments, or hotels. This was consistent across the samples of telephone interview projects and online QALICB survey projects. Environmental cleanups were reported as outcomes either when cleanup was the primary focus of the project or when it was a predevelopment component of the project. For example, one QALICB used its NMTC loan to purchase equipment for its oil-spill cleanup business. An example of an environmental cleanup as one component of a project’s predevelopment phase was a QALICB that used the NMTC financing to clean up a site in a northeastern city for a major revitalization of a historic warehouse that included a host of restaurants, parks and open space, and a parking lot.
For-profit QALICBs were more likely than nonprofit or government agency QALICBs to support infrastructure projects: 72 percent of infrastructure projects were from for-profit QALICBs, while 28 percent were from nonprofit QALICBs.160 A similar pattern persists with CDEs: 61 percent of infrastructure projects were from for-profit CDEs, while 39 percent were from nonprofit CDEs.161
159 The differences are significant at the .01 level. 160 The differences are not statistically significant. 161 The differences are not statistically significant.

NEW MARKETS TAX CREDIT (NMTC) PROGRAM EVALUATION
142
Support for Small Businesses and Nonprofit Organizations
Small for-profit businesses as well as nonprofit organizations are unquestionably important job generators. In addition to employment, however, small businesses are important sources of wealth for entrepreneurs and their families.
While small for-profit and nonprofit entities are located in communities of all economic standing, such entities in distressed communities face higher barriers when it comes to accessing financing and, consequently, have more difficulty becoming established or expanding. For example, analyses of entrepreneurship and small business development suggest that because of limited access to capital, some communities are severely limited with respect to business formation (Aldrich and Carter 2004; Aldrich, Carter, and Ruef 2004).
Understanding capital gaps. As discussed in chapter 6, several factors lead to a lack of capital in distressed areas. For one, researchers have documented a gap in information available to investors about such markets (Lang and Nakamura 1993). The costs of gathering such information are thought to be especially high in rural areas, which lack necessary investment infrastructure (Markley 2001; USDA 1997), or in urban areas where a large share of economic activity is informal (Losby et al. 2002; Schneider and Enste 2000).
Regulatory and industry changes also contribute to insufficient access to capital. With banking deregulation in 1980, banks were freed to compete for customers, leading to decreased service in distressed communities as they sought to attract clients in wealthier areas. The financial products that private financial institutions offered in poor communities often did not meet the capital needs of small firms. While individuals may have been able to access personal loans from alternate financial sector entities, such as payday lenders and pawnshops (Barr 2004, 2007; Fellowes and Mabanta 2008), distressed areas suffered from a lack of investment in local businesses. Many business lending institutions’ investment decisions are tied to suburban models for economic development and designed for homogeneous demographics (Porter 1995). Additionally, impoverished urban communities face lower levels of business investment due to the high costs of land assembly and higher actual or perceived rates of crime.
Discrimination in lending is an additional factor affecting small business creation or expansion, as many LICs have a high representation of ethnic and racial minorities. Contemporary disinvestment in poor urban communities has direct roots in earlier discriminatory commercial, personal, mortgage, and small business lending practices. Studies examining several different credit products have documented higher pricing or decreased access for minorities, especially if located in predominately minority communities. For example, using commercial building permit data to examine commercial investment during the 1980s, Immergluck (1999) found that changes in the racial and ethnic composition of neighborhoods played a significant role in investment flows. Likewise, several studies have empirically documented discrimination in the small business lending market (Bates 1997; Blanchflower, Levine, and Zimmerman 2003; Cavalluzzo and Cavalluzzo 1998; Cavalluzzo and Wolken 2002; Coleman 2002).

NEW MARKETS TAX CREDIT (NMTC) PROGRAM EVALUATION
143
Finally, the market dynamics of LICs may discourage investment. New firms often have few available investment exits—points where equity investors are able to sell stakes in a company (Carlson and Chakrabarti 2007). In rural areas, investment sizes reflect the fact that businesses and supporting customer bases are generally smaller; smaller deals result in higher costs of underwriting and assembly for investors. With a limited deal flow, investors must support higher costs per investment (Barkley et al. 2001).
Expectations regarding business start-up and expansion investments in the NMTC program. Given that small entities, especially those located in distressed communities, often face capital gaps, policymakers have long been interested in using policy interventions to provide support for start-up and expansion of such establishments. They have chiefly emphasized the capital needs of for-profit firms, given their perceived value as job creators, although some nonprofit entities (such as charter schools) have recently garnered attention for the difficulty they face in attracting private investment (Donovan 2008; Kivell 2008).
Despite the inclusion of small business investments as an important element of the rhetoric surrounding the passage of the NMTC program (Roberts 2005; Rubin and Stankiewicz 2003, 2005), program planners did not expect it to be a significant source of start-up capital—largely because of program complexity.162 Working with a complicated program requires hiring specialists and, therefore, results in high project transaction costs. It is both more difficult and more expensive to invest in smaller deals. Alternatively, program planners expected that NMTCs would actively support the expansion of existing for-profit and nonprofit enterprises. Given difficulties accessing capital in distressed communities, it was hoped the program would play an active role in providing financing for expanding entities.
Important questions, then, concern what the NMTC program has been accomplishing with respect to small entities. How many start-up enterprises have been supported? How many entities have sought to expand? What has been the nature of these entities? And how have they fared in a challenged macroeconomy?
Investing in start-up enterprises. As anticipated, the primary focus of the NMTC program has not been to serve the capital needs of start-up enterprises. Compared with other federal programs, early-year NMTC investments in small entities were modest.163 Nevertheless, for-profit and nonprofit firms represented a noteworthy part of the program: 10.2 percent of early NMTC projects financed the start-up of a for-profit or nonprofit entity. The NMTC program
162 This is based on Urban Institute telephone discussions with a range of NMTC program stakeholders, including those involved in the original planning and design of the program, congressional and GAO staff, and others, held in 2006 and 2008. 163 For example, the SBA guaranteed more than 60,000 7(a) and 504 loans worth more than $30 billion in fiscal year 2011 alone.

NEW MARKETS TAX CREDIT (NMTC) PROGRAM EVALUATION
144
facilitated investments worth an estimated $1.378 billion in start-up entities from 2003 to 2007.164 Early-year NMTC project financing did not go to support small business incubators. Most projects financed the creation of a sole business or nonprofit entity.
NMTC-financed start-ups were predominantly for-profit entities. Nearly two-thirds of NMTC-supported start-ups were organized as for-profit firms (64.7 percent), with the remainder organized as nonprofit organizations. For comparison, a somewhat lower share of non–start-up investments, 59.7 percent, went to for-profit QALICBs.
As smaller enterprises typically have fewer capital needs than larger ones, it is not surprising that the size of financing provided to start-up entities was smaller than for other NMTC deals, although not all small businesses that received financing are start-ups. Smaller deal sizes meant that while roughly 10.0 percent of NMTC projects provided capital to start-up entities, these projects represented just 5.8 percent of dollars invested through the program. The median size of the project financing was $5,883,000, less than other NMTC-financed projects (median of $6,960,000).
All of the start-up projects received debt financing. Although there is a widely recognized need for equity financing for small businesses (Rubin 2006a; Temkin and Theodos 2008), none of the early-year projects provided venture capital.165 Loans were typically originated for a term equivalent to the NMTC program’s seven-year compliance period, with the expectation that they would be paid off or refinanced with market-rate debt after that period. In all cases, CDEs provided start-ups with loans at below-market interest rates.
The types of start-ups receiving NMTC financing varied widely. For instance, among for-profit entities, the evaluation samples included a steakhouse restaurant, a small grocery store in a rural area, a small medical clinic in a rural area, and two manufacturing facilities. It also included nonprofit entities, such as a small charter school. In all cases, the purpose of the financing was to purchase and/or rehabilitate real estate and, in one case, to also purchase equipment.
There are no clear patterns with respect to support for start-ups either by year of project initiation or allocation year. Similarly, there are no differences in the occurrence of start-up lending by CDE type. Regions of higher distress did not attract relatively more or fewer such investments, nor are there differences by region of the country. However, there are some striking differences when looking at metropolitan versus nonmetropolitan areas. Of metropolitan projects, just 5.7 percent resulted in a business start-up. However, nearly a quarter of nonmetropolitan projects (23.5 percent) financed a start-up business.
164 This is based on projects supported by NMTC allocations from rounds one through four that had been initiated prior to December 2007. This figure corresponds to $168 million in NMTCs for sampled projects. 165 As discussed in chapter 6, many projects were structured as leveraged deals, where QALICBs received financing that was a combination of repayable debt and forgivable debt or equity.

NEW MARKETS TAX CREDIT (NMTC) PROGRAM EVALUATION
145
Using NMTCs to Finance Start-up Businesses
While widely considered a “big project” program, NMTC financing was used to support the creation of several small businesses. Two projects illustrate the successes and challenges of small business investments, even when backed by public subsidies.
The first, a full-scale grocery store in a rural southern community, was opened by a father and daughter who saw a need for better grocery options. The father and daughter received a total of three NMTC loans in order to get their business up and running. They used the first NMTC loan to purchase and rehabilitate the building, but after making repairs, they realized they were in need of more financing. They went back to the same CDE for a second NMTC loan, which they used to purchase fixtures, furniture, and equipment. Finally, to get the business up and running, they asked the CDE for a third NMTC loan, which was later used for operating expenses. The store was in business for a year, but struggled, and soon went into foreclosure and closed.
A second start-up has been exceptionally successful. The QALICB, a materials
recycling plant in a small southern town, financed its project with NMTCs, private capital sources, a state CDBG loan, and a state environmental quality grant. The town also donated the land on which the business operates and provided funding for road improvements. The CDE provided the QALICB with an initial NMTC loan for planning and construction and later provided subsequent NMTC loans for product development and testing and operating expenses. Employment at the firm has grown from 3 to 23 employees, and it is now shipping its products internationally.
Finally, it is well known that investing in start-up businesses can be risky: start-up businesses fail at rates many times higher than established businesses, and lenders consider loans to such entities to be more likely to become delinquent than other types of financing. Notably, however, of early-year NMTC investments in start-up small businesses, just 3.4 percent had failed as of 2011. And revenue and employment growth for the remaining small business start-ups appears strong. More than 78 percent of start-up projects experienced revenue growth of greater than 5 percent by 2011, comparable to the share of non–start-up projects (76 percent). For the median start-up QALICB, revenues increased by $700,000. Further, these entities hired employees at a higher rate per dollar invested. Start-up businesses generated 9.1 percent of all new jobs created by the program, although they account for only 5.8 percent of project dollars.166
Expansion of existing for-profit and nonprofit entities. For early-year NMTC projects, the financing objective was more often business expansion than business creation. Nearly half of all QALICB participants (46 percent) hoped to expand their enterprise as a result of NMTC financing. Given the national recession, it is noteworthy that many were able to do so.
166 Start-ups accounted for 10 percent of all projects.

NEW MARKETS TAX CREDIT (NMTC) PROGRAM EVALUATION
146
In all, 76 percent of telephone interview and online QALICB survey projects saw a growth in their annual revenue or operating budget of more than 5 percent between the date of project initiation and 2011. Of these projects, the median QALICB grew by $2 million. Seven percent of QALICBs remained static in their revenue or operating budget, while 17 percent of projects shrank by more than 5 percent. Of projects that shrank, the median decline in size was $1.4 million. In every instance but one, QALICBs expanded through natural growth, not through acquisition. In one case, a wood products manufacturer used the NMTC program to purchase an existing design business company to expand its in-house capabilities.
The projects that grew appear to be different from either status quo or contracting projects in a few key ways. A larger share of health facilities and equipment QALICBs expanded (84 percent) than did enterprises in other industries. Interestingly, nonprofit QALICBs were more likely to expand (72 percent) than were for-profit QALICBs (64 percent). No differences emerged in the geographic location of expanding, contracting, or static QALICBs. There were no differences by allocation year. There were no differences in the type or amount of financing provided to these different groups of QALICBs, nor by type of CDE.
Enhancement of Local Tax Bases
New tax revenues generated by community and economic development projects include sales, payroll, and income taxes paid by individuals employed as a result of the projects, as well as corporate and property taxes paid by investment recipients as a result of property value appreciation and business improvements. Such project outcomes, which enhance a locality’s tax base, are consistent with the NMTC program’s objectives to support the economic development of LICs.
Expectations regarding tax revenue outcomes. Whether it is appropriate to include increases in a locality’s tax revenues as an outcome measure against which community and economic development programs should be assessed is contested in the literature. Hollister (2007), for example, is of the opinion that increased tax revenues should not count as benefits at all, since “[i]f this were the government’s goal, it might find that investing in a golf course in a large urban area offers far better returns.” (p. 287). He suggests that tax revenues generated should be counted only if they are used to benefit an intended community or target population, such as low- and moderate-income households in the qualifying area. And he notes that tax revenues from corporate and property taxes will only be net increases to the degree that there is no displacement of other corporate and property taxes. An additional critique holds that most economic development investments, even when successfully completed as intended, are not large enough to result in material increases in community tax bases.
Notwithstanding these concerns, there is a history of program evaluators seeking to measure the tax benefits to localities of community and economic development programs. The justification for including tax revenues as a performance measure is that, where sizable, improvements in the local tax base could help to alleviate community distress—a desired end outcome of most such programs. HUD’s evaluation of UDAG (1982) considered property and

NEW MARKETS TAX CREDIT (NMTC) PROGRAM EVALUATION
147
nonproperty taxes generated by UDAG grants based on the rationale that this was consistent with UDAG’s mandate to alleviate urban distress. Bradshaw (2002) also included tax revenues in his assessment of the contribution of small business loan guarantees to economic development. Finally, tracking tax outcomes of the NMTC program is supported by NMTC practitioners: Voluntary guidelines developed by an industry group active in the NMTC program, the Community Impact Working Group, include accounting for tax revenues to better understand the benefits of NMTC projects.
Assessment considerations. Measuring tax revenue increases resulting from NMTC investments is difficult. While project participants interviewed and surveyed for this evaluation all indicated that they maintained records of their tax payments, requesting such information and conducting detailed analyses of tax payments and abatements (for both QALICBs and their tenants over time) would have imposed an excessive burden on them. Therefore, such detailed accounting for each project in the study sample was not feasible. However, project participants were asked the basic question of whether any additional tax revenues had been generated as a result of their NMTC projects. When queried in more detail during telephone interviews, project participants indicated that their answers were based on general knowledge about the growth in income, employment, or both for the businesses or organizations benefiting from the NMTC investments.
New taxes paid by NMTC projects. Table 10.3 shows that 80 percent of all early NMTC projects reportedly contributed to some form of increased city or county tax revenues from QALICBs, their tenants, or their employees.167 Increased payroll taxes appear to be the most common tax outcome, with participants from more than 70 percent of projects reporting an increase in payroll taxes paid as a result of their projects. Participants in two-thirds of the projects reported increases in property taxes. In addition to contributing to the local tax base, just over 60 percent reported increases in individual income taxes.168 In more than half of projects, QALICBs reportedly also paid more sales taxes, and one-third paid more corporate taxes. Roughly 1 in 10 projects paid additional other taxes—including city employment taxes, school taxes, and/or hospitality taxes.
Not all QALICBs were equally likely to pay additional taxes. As might be expected, tax burdens varied, with certain types of recipients, CDEs, and types, sizes, and locations of projects more likely to pay local taxes as a result of the NMTC project. Table 10.4 presents the share of projects of various categories that paid any additional tax to the local city or county. The largest projects, those totaling more than $15 million, stand out as especially likely to pay
167 This reflects the combined results from both the telephone interviews with project participants and the online survey of QALICBs. 168 While most income tax payment increase likely involved federal taxes, some (albeit small) amount may have involved state or municipal income taxes where they applied and, therefore, contributed to the “local” tax base.

NEW MARKETS TAX CREDIT (NMTC) PROGRAM EVALUATION
148
taxes—93 percent of them paid at least one form of additional tax. Most for-profit businesses paid additional taxes (86 percent) but, interestingly, 70 percent of nonprofit QALICBs and 61 percent of government or quasi-government QALICBs also reported paying additional local taxes as a result of the NMTC project. The types of taxes paid by these entities varied. For-profit businesses were much more likely to pay additional property, sales, and corporate taxes than were nonprofit organizations. The most common additional tax paid for nonprofits and government or quasi-government QALICBs related to expanding their number of employees.

NEW MARKETS TAX CREDIT (NMTC) PROGRAM EVALUATION
149
Table 10.3: Additional Taxes Paid to City or County, by Type of Tax
Type of Tax
Were Additional Taxes Paid as a Result of the NMTC Project?
Total
(%)
Number of Projects*
Yes
(%)
No
(%)
Any tax 80 20 100 173 Payroll tax 72 28 100 156 Property tax 67 33 100 164 Individual income tax 62 38 100 157 Sales tax 52 48 100 158 Corporate tax 34 66 100 152 Other taxes 11 89 100 112 Source: Urban Institute telephone interviews with project participants and online survey of QALICBs. * Unweighted.
Some interesting other differences in taxes paid emerged from the interviews and online survey. All of the housing projects paid additional taxes, as did 91 percent of retail, mixed-use, office, and hotel projects. Three out of four projects in the manufacturing/industrial, agricultural/forestry, or brownfields and in the health facility or equipment categories paid additional taxes. Social services, arts/culture, and education projects were the least likely to pay additional taxes (64 percent).
Finally, there are emergent findings of differential taxation rates by geography. Projects in the South and Midwest were more likely to pay additional taxes than projects in the Northeast and West. Some of the regional taxation disparities reflect differences in the representation of project types by region. But, in addition, project participants report that this may be the case because NMTC projects in these areas were more likely to have tax abatements or other credits that diminished tax liabilities.

NEW MARKETS TAX CREDIT (NMTC) PROGRAM EVALUATION
150
Table 10.4: Additional Local Taxes Paid by NMTC Projects, by CDE, QALICB, and Project Type
CDE, QALICB, and Project Type
Any Type of Additional Taxes Paid as a Result of the NMTC Project?
Total (%)
Number of
Projects* Yes (%)
No (%)
Total project size** $0–<$1,000,000 76 24 100 13 $1,000,000–<$5,000,000 76 24 100 38 $5,000,000–<$15,000,000 74 26 100 56 $15,000,000+ 93 7 100 55
QALICB type** For-profit 86 14 100 102 Nonprofit 70 30 100 65 Government or quasi-government 61 39 100 3 Tribal or government agency 100 0 100 2
Project type** Office, retail, mixed-use, and hotel 91 9 100 70 Manufacturing/industrial, agricultural/forestry, brownfields
75 25 100 32
Social services, arts/culture, education 64 36 100 44 Health facility or equipment 74 26 100 15 Housing 100 0 100 8
CDE type** Nonprofit nonfinancial institution 91 9 100 15 For-profit nonfinancial institution 88 12 100 44 For-profit financial institution 79 21 100 54 CDFI, community development (CD) banks, and other mission-driven lenders
74 26 100 53
Government/quasi-government 34 66 100 5 Region**
Northeast 66 34 100 23 Midwest 88 12 100 47 South 90 10 100 47 West 65 35 100 21
Source: Urban Institute telephone interviews with project participants and online survey of QALICBs. * Unweighted. ** The differences are statistically significant at the .05 level.

NEW MARKETS TAX CREDIT (NMTC) PROGRAM EVALUATION
151
11. AREA-WIDE OUTCOMES Some community and economic development investments are designed and expected
to produce area-wide (i.e., neighborhood- or community-level) effects that are not directly funded by the program. The likelihood of spillover from project sites to surrounding areas depends on factors such as project characteristics, scale, or visibility. This chapter, which provides evidence regarding area-wide outcomes related to NMTC projects, begins with brief reflections on the programmatic basis for, as well as some issues associated with, assessing these types of outcomes.
Expectations Regarding Area-wide Outcomes
Place-based programs like those referred to as “comprehensive community initiatives” tend to be wide-ranging in scope and often involve social and economic as well as physical development strategies (Kubisch et al. 2010). Desired outcomes may include, for example, improvement in the economic status or quality of life of community residents, enhancement of institutional capacity on the part of community organizations or institutions, or stimulation of additional area-wide investments over and above those accompanying project investments. Such programs may have explicit area-wide goals, such as alleviating poverty, increasing children’s educational attainment, improving family well-being, or promoting community renewal. Achievement of these outcomes is likely to require long-term development of individual and organizational capacities and establishment of interconnections among individuals and organizations (Auspos and Kubisch 2004).
In contrast to comprehensive community initiatives, the NMTC program has no explicit neighborhood- or community-level legislative objectives. Its core purpose is to stimulate new or increased investment capital in businesses and real estate projects located in LICs. In one sense, then, there is no formal basis for anticipating area-wide outcomes from NMTC projects. In another sense, however, an expectation of area-wide improvement (or even transformation) is not entirely unfounded, given some of the rhetoric used to promote the program’s enactment (Roberts 2005; Rubin and Stankiewicz 2003, 2005) and the program’s core requirement that investments be made in LICs—evoking place-based outcome prospects. If new or additional investment has been realized, two important questions remain. Has a program stimulated additional investment in LICs above and beyond program-linked financing (i.e., has it produced indirect and/or contingent outcomes or leveraged other public or private financing)? And, if investment patterns have produced greater capital flows to LICs, how has the program contributed to making this pattern sustainable? Definitive answers to these questions require in-depth longitudinal studies of projects that are beyond this scope of this evaluation. But to begin to address these questions, the chapter presents findings about project intent, potential for achieving area-wide outcomes, and project participants’ perceptions of area-wide program accomplishments.

NEW MARKETS TAX CREDIT (NMTC) PROGRAM EVALUATION
152
Assessment Considerations
Inquiry regarding the extent to which NMTC projects are associated with area-wide outcomes should consider variations in the projects’ purposes, scale, and timing.
• Project purposes. It is useful to acknowledge the diversity and range of NMTC project purposes and consider the extent to which QALICBs and CDEs intend to achieve area-wide outcomes with their investments. A reasonable expectation is that projects not intending to have such outcomes are less likely than others to produce them (Zielenbach 2003, 2004).
• Project scale. NMTC projects range in size from small to large (measured either in dollar or physical terms) and are located in geographical areas that also range in size from small to large (measured either in population or spatial terms). Whether area-wide outcomes are likely depends, in part, on project-to-area ratios as well as other attributes, such as project type or spatial density (Galster et al. 2004a, 2004b, 2006; Hollister 2007). A reasonable expectation is that area-wide outcomes are less likely to be observed for projects without sufficient critical mass relative to the areas in which they are located.
• Outcome timing. Whether intended or not, at what point in time can area-wide outcomes be expected to occur following project investments? Some might occur in the short term but many would be anticipated only over a longer period of time—possibly many years after projects are completed (Hollister and Hill 1995). The problem is that when area-wide outcomes occur well after project completion and/or following other projects or changes that have taken place in the same area, it may be extremely difficult to demonstrate any connection between such outcomes and the initial investment.
Although NMTC projects sampled for the evaluation had been completed when data were collected, there had not been enough time in the aftermath to be able to discern area-wide outcomes using objective indicators, such as changing property values, business activity, or household income. Moreover, the projects varied widely in terms of types, sizes, and configurations of the areas in which they might be expected to have had an impact. Some QALICBs, for example, considered such areas to consist of an entire community or county, others an entire central business district, and yet others a relatively constrained square-block area adjacent to their sites. This also complicates cross-project analyses that rely on objective indicators. At this time, therefore, interview evidence is relied on to speak to the nature of, and extent to which, early NMTC projects furthered area-wide economic and community-development outcomes.

NEW MARKETS TAX CREDIT (NMTC) PROGRAM EVALUATION
153
Potential for Area-wide Outcomes
Certain kinds of investments (such as those used to establish small businesses) may have limited potential for spillover into the surrounding area, while others (such as those used to develop major shopping malls) may have greater potential. Given the diversity of NMTC projects, therefore, an initial question is the extent to which a specific project might be expected to produce area-wide outcomes. Indications of potential include the proportion of projects (a) considered part of broader development efforts, (b) regarded as highly visible within their communities, and (c) intended to accomplish some amount of area-wide improvementbased on information gathered from the telephone interview project sample.
• Projects that were part of broader development efforts. More than one-third (36 percent) of early projects were undertaken in conjunction with, or integrated into, larger-scale development initiatives within their communities, according to project stakeholders (see the text box on the next page).
• Projects with high community visibility. A majority of projects had high visibility within their communities, according to project participants. Asked to use a scale ranging from one (low visibility) to five (high visibility), 61 percent selected five, 36 percent selected intermediary points (two to four), and only 3 percent selected one.
• Projects intended to accomplish area-wide improvement. Taking into account a variety of information about the design, scale, or other attributes of each project, as well as the reported intentions of CDEs and QALICBs, approximately 36 percent of projects in the telephone interview sample were expected to have area-wide spillover effects. This varied by project type, however, with office, retail, mixed-use, and hotel projects having more such potential than others (see table 11.1). Also, projects with government-entity CDEs had somewhat more spillover potential than others (although based on a very small number of projects), followed by projects with CDEs that were mission-driven lending institutions (including from CDFIs and community development banks) and for-profit nonfinancial institutions (see table 11.2).

NEW MARKETS TAX CREDIT (NMTC) PROGRAM EVALUATION
154
NMTCs as Part of Broader Development Initiatives
Some projects were part of broader initiatives aimed at concentrating a number of projects in a designated area to spur revitalization. Such efforts met with varying degrees of success. Even for successful initiatives, however, it is often difficult to attribute area-wide outcomes to any single project or investment. The difficulty is in knowing if a project was a catalyst or, in fact, benefited from other (earlier) investments, or if other projects (or subsidies) were primarily responsible for any area-wide outcomes.
Two NMTC projects in a Northwestern city are in the same neighborhood, which had been targeted by the city’s redevelopment agency. The neighborhood is a mix of commercial and nonprofit establishments, with many very old buildings in need of upgrading. One project (the rehabilitation of a historic building for office space) met the agency’s objective of adding more daytime office workers to the neighborhood. A second project enabled the expansion of a long-standing social service provider in the neighborhood. This project addressed the space needs of the provider but was also sensitive to the surrounding community, such as by providing an attractive exterior and sufficient indoor waiting space for clients. Stakeholders indicated that the distress level of the neighborhood had improved, but that this was likely the result of several projects, including others that did not use NMTCs, such as building projects to accommodate other nonprofit service providers and a Saturday market.
Another project in a small urban area in the Midwest was the first component of a master
development plan for the entrance to the community and its downtown commercial corridor. The city government owned land that was a brownfields site and contracted with the QALICB, a developer, to undertake the project. The site was developed into space for multiple retail tenants. The next development phase was to include additional retail construction, residential units, and an office building. A third phase was to include a hotel, as well as a conference and visitors’ center/museum. After the first phase was completed, the next phase was delayed due to debates with the community about the location. Even so, stakeholders reported dramatic improvement in the area’s distress level because it had become an active commercial area. More recently, the second and third phases of the development were completed.
Table 11.1: Intention to Accomplish Area-wide Improvement, by Project Type
Projects Intended to Accomplish Area-wide Improvement
Project Types*
Office, Retail, Mixed- use, Hotel (%)
Housing (%)*
Education, Arts/Culture,
Social Services
(%)*
Manufacturing/ Industrial,
Agriculture/ Forestry,
Brownfields Cleanup
(%)*
Health Facility/
Equipment (%)*
Yes 62 50 32 — 7 No 38 50 68 100 93 Total 100 100 100 100 100 Number of projects** 33 2 13 12 4
Source: Urban Institute telephone interviews with project participants. * Weighted percentages. ** Unweighted.

NEW MARKETS TAX CREDIT (NMTC) PROGRAM EVALUATION
155
Table 11.2: Intention to Accomplish Area-wide Improvement, by CDE/Parent Type
Projects Intended to Accomplish Area-wide Improvement
CDE/Parent Types*
All Projects
(%)
Nonprofit,
Nonfinancial
Institution (%)
CDFIs, Community Development Banks,
Other Mission-Driven
Lending (%)
For-Profit Nonfinancial
Institution (%)
For-Profit Financial Institution
(%)
Government, Quasi-
Government (%)
Yes 25 41 36 24 50 36 No 75 59 64 76 50 64 Total 100 100 100 100 100 100 Number of projects** 4 21 18 17 4 64
Source: Urban Institute telephone interviews with project participants. *Weighted percentages **Unweighted.
Achievement of Area-wide Outcomes
Given that some NMTC projects had more potential for producing area-wide outcomes than others, what proportion reportedly achieved such outcomes and what were those outcomes?
QALICB and CDE project participants were asked to use a five-point scale to rate the distress levels of the neighborhoods and surrounding areas in which their projects were sited. Ratings were requested for two points in time—a retrospective assessment of conditions immediately prior to the initial investment and a current assessment as of the time of the interview. Prior to initial investments, 72 percent of project sites were considered to be quite distressed—either a four or a five on a scale where five represented the most distressed (i.e., dilapidated or rundown) areas; most of these (63 percent) were judged to be a four. As of the time of the interviews, however, only 18 percent of the sites were considered to be in either the four or five category, with a plurality of sites (46 percent) considered to be a three.
When stakeholders’ before-and-after assessments are compared, for almost 3 of every 10 projects, no surrounding-area changes were reported following project completion. For the overwhelming majority of the remainder, however, positive change was observed (table 11.3). In most cases (46 percent), the change was thought to be relatively small (i.e., one point on the five-point scale), but change was considered to be more substantial for 23 percent of the projects. While in a few instances, neighborhood businesses were displaced or noise levels increased following project development, very little negative change was noted in surrounding areas.

NEW MARKETS TAX CREDIT (NMTC) PROGRAM EVALUATION
156
Table 11.3: Change in the Distress Level of Projects’ Immediate Neighborhoods/Surrounding Areas Since Project Initiation Surrounding Area Change Index
Percent of Projects*
Positive 3 points 5 2 points 18 1 point 46
No change 29 Negative 1 point 2 Total 100 Number of projects** 56
Source: Urban Institute telephone interviews with project participants. *Weighted percentages. ** Unweighted.
Project participants were also asked to identify various kinds of postproject changes that had occurred in surrounding areas and the extent to which they were the result of NMTC investments. Table 11.4 lists the reported changes, arrayed in terms of the frequency with which participants believed there was strong evidence they resulted from the NMTC investments.169
Those involved in one-third or more of early-year projects reported there was “strong evidence” that surrounding areas had experienced new business creation, improved property appearance, and/or increased local tax revenues as a result of NMTCs. There was also strong evidence that other types of area-wide changes had resulted from NMTCs, although less frequently. Additional changes that are not displayed in table 11.4, but were identified by a small number of participants, were improved neighborhood safety, reduced crime, increased community pride and morale, or sustained improvement in interorganizational relationships resulting from NMTC projects.
Individual projects might have more than one type of positive area-wide outcome attributable to NMTC investments. Considering only those projects whose participants reported
169 Telephone interview respondents were given a list of possible area-wide outcomes and asked, “Did any of the following occur in the surrounding area after the project was completed?” Those responding “yes” to any of the items were subsequently asked, “For each outcome you identified, please indicate the extent to which the following outcomes in the surrounding area were the result of the New Markets Tax Credit loan/investment.” Possible responses were “strong evidence of a positive effect of the NMTC [loan/investment],” “possible, but not strong evidence,” “no evidence,” or “don’t know.” Similar questions were asked of QALICB respondents to the online survey. However, data from the latter are not combined with those from the telephone interview sample because a significantly higher percentage of online respondents answered “don’t know” compared with telephone interview respondents, undoubtedly a result of probing that was possible only for the telephone interviews.

NEW MARKETS TAX CREDIT (NMTC) PROGRAM EVALUATION
157
having strong evidence of such outcomes resulting from NMTCs, more than one-half of projects (53 percent) had one or more positive spillover effects, while a sizable minority (47 percent) had none.
Viewing this finding in the context of projects’ potential for having spillover effects, those that intended to improve their surrounding areas or that were part of broader development efforts were twice as likely as others to have such impacts (table 11.5).
• Eighty percent of participants who undertook projects with the idea they would help to improve surrounding areas, neighborhoods, or communities reported strong evidence that NMTCs had, in fact, resulted in positive area-wide outcomes; this compares with 37 percent of others.
• Seventy-eight percent of participants whose projects were part of broader local economic or community development efforts reported strong evidence that NMTCs had, in fact, resulted in positive area-wide outcomes; this compared with 39 percent of others.

NEW MARKETS TAX CREDIT (NMTC) PROGRAM EVALUATION
158
Table 11.4: Area-wide Changes Reported as a Result of NMTC Projects, by Type of Change and Strength of Evidence*
Type of Change That Occurred in the Surrounding Area Following Project Completion
Occurred as a Result of the NMTC Project
Total (%)***
Number of
Projects**
Yes
No (%)
Don’t know (%)
Strong evidence
(%)
Possible evidence
(%)
No evidence/
don’t know about
evidence (%)
New businesses created 36 15 8 38 4 101 62 Improved property appearance 35 22 4 28 11 100 62
Increased local tax revenues 35 21 4 32 8 100 61 Improved infrastructure 31 5 8 49 7 100 62 Increased local government capacity to support economic development
26 10 4 49 12 101 62
Expanded businesses 24 17 7 44 8 100 62 Improved/expanded amenities/ community facilities
22 8 2 57 11 100 62
Improved/stabilized property values 20 16 4 46 14 100 62
Improved/expanded human/social services 16 12 1 60 11 100 61
Green development 6 14 4 59 17 100 61
Source: Urban Institute telephone interviews with project participants. * Weighted percentages. ** Unweighted. *** Percentages do not sum to 100 due to rounding. .

NEW MARKETS TAX CREDIT (NMTC) PROGRAM EVALUATION
159
Table 11.5: Relationship between Project Potential for Area-wide Outcomes and Strong Evidence Such Outcomes Resulted from NMTCs
Strong Evidence of One or More Area-wide Outcome(s) Resulting from NMTC Projects
Indicators of Project Potential for Having Area-wide Outcomes*
Projects Were Intended to Accomplish Area-wide
Improvement****
Projects Were Part of Broader
Economic/Community Development Efforts*****
Yes (%)
No (%)
Yes (%)
No (%)
Yes 80 37 78 39 Other** 20 63 22 61 Total 100 100 100 100 Number of projects*** 23 39 22 39
Source: Urban Institute telephone interviews with project participants. * Weighted percentages ** Includes “possible evidence” and “no evidence” that NMTCs resulted in area-wide outcomes, as well as “no indication there were area-wide outcomes.” *** Unweighted. **** Statistically significant, two-tailed Fisher’s exact test; p = .0016. *****Statistically significant, two-tailed Fisher’s exact test; p = .0301.
Summary
Slightly more than one-third of early-year NMTC projects were undertaken in conjunction with, or integrated into, larger-scale development initiatives in their communities, and slightly more than one-third were expected by their CDE and/or QALICB participants to have had the potential for positive area-wide spillover effects. This chapter examined the extent to which there were positive externalities resulting from early-year projects that might enhance the developmental prospects of LICs over the longer run.
Project participants reported that while there were no area-wide changes resulting from almost 3 of every 10 projects, the overwhelming majority of the remainder experienced positive area-wide changes. The change was considered to have been relatively small in most cases but, in almost one-fourth of the cases it was considered to have been substantial. Projects whose participants intended surrounding-area improvement or that were part of broader development efforts were twice as likely as others to be judged as having experienced positive area-wide outcomes.

NEW MARKETS TAX CREDIT (NMTC) PROGRAM EVALUATION
160
SECTION IV:
EVALUATION SYNTHESIS

NEW MARKETS TAX CREDIT (NMTC) PROGRAM EVALUATION
161
INTRODUCTION TO SECTION IV Building on data previously presented, the final chapters of this report take a more
integrated view across outcomes and projects, considering the NMTC program as a whole. Chapter 12 provides an accounting of the outcome patterns of NMTC projects and chapter 13 discusses implications regarding data needs and future research.

NEW MARKETS TAX CREDIT (NMTC) PROGRAM EVALUATION
162
12. PROJECT OUTCOME AND OUTPUT PATTERNS
It is widely recognized, and an underlying premise of the NMTC program, that different LICs have different community and economic development needs. The fact that the program was designed to be flexible with respect to the types of projects it supports is an acknowledgment of this variety. Indeed, previous chapters have shown that NMTC projects produced different kinds of outputs and outcomes. Some involved job creation, for example, while others involved expanded community amenities or support for start-up enterprises.
Unanswered to this point is the question of whether each early-year NMTC project produced at least some beneficial result. For instance, if a particular project did not contribute to expanding the local tax base or produce jobs, did it otherwise help to make the environment cleaner, reduce neighborhood distress, or accomplish something else of value, such as property construction or rehabilitation, provision of advantageous financing, or attraction of new investors? Asked another way, what proportion of projects, if any, failed to provide any such result?
Likewise unanswered in the previous chapters is the question of which types of projects, relative to one another, are more (or less) likely to be associated with which outputs or outcomes. The community and economic development literature contains some hypotheses as well as some evidence regarding the types of projects that can reasonably be expected to result in particular outputs or outcomes (Abravanel, Pindus, and Theodos 2010). This evaluation provides an opportunity to empirically connect specific project types to specific results.
The above questions are easier asked than answered, for several reasons. For one, the number of different potential project outputs or outcomes is recognizably larger than could be accounted for in this evaluation. While the evaluation focused on basic outputs and outcomes that stakeholders generally associate with the NMTC program, there are likely to be somewhat less frequent or less tangible outcomes (such as community cultural enhancement) that have not been included. Moreover, some outcomes are more difficult than others to measure (such as whether a new charter school improves student morale). An equally challenging measurement issue is that of defining an appropriate threshold for determining whether a project can be classified as having achieved a particular result. For example, what absolute number of jobs or proportionate increase in employment would have to be observed to be able to conclude that a project contributed meaningfully to the employment profile of a community? Finally, from a practical evaluation perspective, assessing output and outcome patterns is best done with the sample of NMTC projects used for telephone interviews with project participants, since it contains more in-depth information than the online QALICB survey. A limitation is that

NEW MARKETS TAX CREDIT (NMTC) PROGRAM EVALUATION
163
the former is relatively small for purposes of disaggregation by project type, resulting in a small-numbers problem170 when comparing project types.
Ultimate resolution of the above challenges is beyond the scope of this report and, frankly, unwarranted at this stage of the NMTC program’s development. What is useful now is to produce an initial, even if more suggestive than definitive, summary accounting of the outcome patterns of NMTC projects, permitting a formative assessment of the program’s accomplishments during its early years.
Output and outcome patterns. Evidence presented in this section speaks to the question of which outputs and outcomes occurred most frequently across early-year NMTC projects and whether each project resulted in at least one desired output or outcome, as discussed in sections II and III. These results consist of increasing employment; developing real estate; improving the environment; reducing neighborhood distress; increasing amenities, services, or facilities; starting up or supporting businesses; attracting new investors; and providing advantageous financing. Definitions of what constitutes achievement of these results, for purposes of the pattern analysis below, are shown in table 12.1.
170 There is considerable potential for random error when dealing with small numbers; also, with respect to small numbers, small numerical changes can result in large percentage changes.

NEW MARKETS TAX CREDIT (NMTC) PROGRAM EVALUATION
164
Table 12.1: Definitions of Basic Outputs and Outcomes for Project Pattern Analysis Outputs and Outcomes Definition
Obtained advantageous financing
Either NMTCs were the only financing available or, compared to other available financing, NMTCs offered more favorable rates and terms, including interest rates at origination, standard origination fees, the interest-only payment period, the LTV ratio, the amortization period, the flexibility of borrower credit standards, nontraditional forms of collateral, debt service coverage, or loan loss reserves.
Attracted new investors to LICs Project investor(s) were new to investing in low-income areas.
Increased employment
One or more jobs created or retained
The number of created or retained new permanent jobs produced by the project is equal to or greater than one.
Above-average increase in employment
The project resulted in an increase in employment levels of more than 33 percent, compared with pre-NMTC levels, due to jobs created or retained as result of the respective NMTC projects.
Developed real estate The project involved the construction or rehabilitation of some amount of commercial and/or residential space.
Improved the environment The project was LEED certified or included brownfields or other environmental cleanup as a component.
Increased amenities, services, or facilities
At least one community amenity, service, or facility was created or expanded by the project.
Started up or supported businesses
The project involved either the start-up of a business or increases in business annual gross revenues or operating budgets of greater than 5 percent.
Provided increased local taxes Project participants reported that the project resulted in increased payroll, property, sales, corporate, or other taxes for the local community.
Reduced neighborhood distress Project participants noted a positive change of at least one point on a five-point neighborhood distress scale between pre-and post-project time periods.
Table 12.2 displays the percentages of early-year NMTC projects that met the definitions for having produced each basic output or outcome.171 The most prevalent result consisted of provision of advantageous financing: The vast majority of QALICBs (93 percent) either could not otherwise have obtained financing or, compared with other available financing, received better rates and terms in conjunction with NMTCs. The second most prevalent result involved real estate development: 84 percent of projects constructed or rehabilitated either residential or
171 Note that the percentages presented in this chapter may differ from those in sections II and III because the latter included data collected through the combination of telephone interviews with project participants and the online survey of QALICBs, while the percentages in this chapter include data collected only through the telephone interviews.

NEW MARKETS TAX CREDIT (NMTC) PROGRAM EVALUATION
165
commercial properties in LICs. The third most prevalent result consisted of additions to the local tax base: 77 percent of projects increased payroll, property, sales, corporate, or other taxes to the benefit of the local community. The fourth most prevalent result involved employment: 71 percent of projects created or retained at least one new permanent job. Using a different employment metric, 60 percent of projects saw an increase in their employment levels of more than 33 percent compared with pre-NMTC levels, due to jobs created or retained as result of their respective NMTC projects.
Except for environmental cleanup and attracting new investors to low-income areas, a majority of projects was associated with each of the outputs and outcomes listed in table 12.2.
Table 12.2: Percent of Early-Year NMTC Projects Associated with Basic Outputs and Outcomes, Based on the Telephone Interview Sample
Outputs and Outcomes Percent of Projects
Number of Projects on
Which Percentage
Is Based Obtained advantageous financing 93 70 Developed real estate 84 64 Provided increased local taxes 77 56 Increased employment
One or more jobs created or retained 71 63 Above-average increase in employment 60 60
Reduced neighborhood distress 68 56 Increased amenities, services, or facilities 64 70 Started up or supported businesses 53 64 Improved the environment 10 70 Attracted new investors to LICs 9 56 Source: Urban Institute telephone interviews with project participants.
These observations allow for assessing whether certain types of projects were more or less likely than others to have produced particular outputs or outcomes. In this respect, table 12.3 shows the percentages of project types associated with each result. As mentioned above, the small number of health facility/equipment and, especially, housing projects in the telephone interview sample limit the ability to compare these types with others.
The shaded cells in table 12.3 identify types of projects that are less likely (lighter gray) or more likely (black) than others to have resulted in particular outcomes or outputs.172 For example, comparing across the rows in the table:
172 Shading is not provided for housing projects because there are only two of them in the telephone interview sample.

NEW MARKETS TAX CREDIT (NMTC) PROGRAM EVALUATION
166
• Office, retail, mixed-use, and hotel projects were somewhat more likely to have developed real estate than other project types.
• Manufacturing/industrial, agricultural/forestry, and brownfields cleanup projects were somewhat more likely than others to have contributed to environmental improvement, and less likely to have resulted in an above-average increase in employment; developed real estate; or contributed to increased amenities, services, or facilities.
• Projects involving education, arts/culture, or social services were more likely than others to have resulted in increased community amenities, services, or facilities and to have reduced community distress, and less likely to provide increased local taxes.
• Taking into account the small numbers caveat noted above, health facility and equipment projects were somewhat more likely than others to have resulted in an above-average increase in employment and less likely to have reduced neighborhood distress or received advantageous financing. These patterns are consistent with expectations for a program like NMTCs, which
supports varying project types intended to meet divergent LIC needs. The patterns confirm the utility of assessing project outputs and outcomes by reference to project types.

NEW MARKETS TAX CREDIT (NMTC) PROGRAM EVALUATION
167
Table 12.3: Percent of Projects Associated with Each Outcome or Output from the Telephone Interview Sample, by Project Type
Outputs and Outcomes
Project Type
Office, Retail, Mixed-use,
Hotel
Manufacturing/ Industrial,
Agricultural/Forestry,
Brownfields Cleanup
Education, Arts/Culture, Social Services Housing
Health Facility/
Equipment
Yes (%) N
Yes (%) N
Yes
(%) N
Yes (%) N
Yes (%) N
Obtained advantageous financing* 92 36 100 14 10
0 13 100 2 60 5
Developed real estate* 100 33 42 12 85 13 100 2 75 4 Provided Increased local taxes* 73 27 73 11 54 13 100 2 67 3
Increased employment
≥ 1 job created or retained* 69 32 67 12 75 12 100 2 80 5
Above-average increase in employment**
62 29 42 12 67 12 50 2 80 5
Reduced neighborhood distress* 65 31 67 9 83 12 100 1 33 3 Increased amenities, services, or facilities* 64 36 36 14 92 13 50 2 80 5
Started up or supported businesses 53 32 42 12 69 13 -- 2 60 5
Improved the environment* 8 36 21 14 8 13 -- 2 -- 5 Attracted new investors 11 28 -- 11 -- 12 50 2 33 3 Source: Urban Institute telephone interviews with project participants. Note: Shading identifies types of projects that are more likely (black) or less likely (gray) than others to result in each output or outcome; N = number of projects. * Significant at the .01 level. ** Significant at the .10 level.
Following from the above analysis, there is obviously interest in the project-by-project pattern of results: What proportion of early-year projects produced at least one or more outcomes or outputs, and what proportion produced none?
Among the 70 projects for which telephone interviews with participants were completed, information for 3 of them is insufficient to allow assessment across the full spectrum of outputs and outcomes. For the remaining 67, 8 produced one outcome listed in table 12.1 and the rest produced more than one outcome. Indeed, the average project produced four outcomes, with 16 of them resulting in all seven outcomes.
Only two projects (3 percent of the sample) did not show any positive outcomes, although even they were associated with a positive output, and better rates and terms. One of these had been built without NMTCs and did produce positive outcomes. Later, the QALICB

NEW MARKETS TAX CREDIT (NMTC) PROGRAM EVALUATION
168
used NMTCs essentially to alter the project’s financial structure, which had no effect on the center’s operations, scale, or impacts on the community.173 In the second case, a business and equipment were purchased using NMTCs, but the business failed.174 These examples illustrate the relatively unique circumstances that can explain why a project would not yield any of the outputs or outcomes addressed in this the evaluation. Overall, however, NMTC projects produced multiple results that varied by project type.
173 For this project, prior to NMTC investment, a community provided tax increment financing to fund a performing arts center. When developed, the center attracted small businesses to the area, as well as new residents and additional community investment. The financial restructuring using NMTCs had no effect on the benefits that had derived from the previous financing. 174 A service-providing nonprofit organization purchased a business and equipment that was intended to generate income for the organization and provide employment opportunities for several of its clients. Shortly thereafter, the business lost several contracts and significant amounts of money, so it had to be closed. Without anticipated income from the business, the organization was unable to repay the borrowed funds and had to sell most of its other properties where it administrated programs, lay off staff, and draw down existing assets.

NEW MARKETS TAX CREDIT (NMTC) PROGRAM EVALUATION
169
13. CONCLUSION AND RESEARCH IMPLICATIONS
This program evaluation report provides a comprehensive view of the implementation and accomplishments of the NMTC program from its inception through 2007, based largely on information gathered about randomly selected projects that were initiated from allocation rounds 1 through 4. In its early years, the program operated as intended—encouraging investments in distressed areas for a diverse range of community and economic development projects, and producing outputs and outcomes as documented in this report.
As is generally the case with community and economic development programs, some outcomes are particularly difficult to measure and assess, and some cannot always be attributed directly or solely to the NMTC program. And, as would be expected with a new program and financing tool intended to encourage investment in communities perceived to be at higher risk, projects varied with respect to the need for subsidy, project viability, and outcomes produced. Implications of the evaluation follow from the information gathered and reported in the preceding chapters, and focus on future research needs. Research suggestions involve (a) use of administrative data and enhancements to those data and (b) the need for new data collection specifically for research and evaluation purposes.
Administrative Data
The CDFI Fund operates four data collection systems to administer and monitor the NMTC program. The CIIS collects data annually from CDEs about selected outputs and outcomes associated with projects receiving NMTC financing. The CIIS continues to be the primary source of uniform data about the NMTC program and is used by the CDFI Fund for program monitoring and management purposes as well as for accountability reporting. It is an ambitious undertaking for both the CDFI Fund and CDEs, and the need for improved accuracy and detail must be balanced against the cost and burden of reporting requirements. The CDFI Fund has modified the CIIS over time, responding to issues raised by CDEs and to limitations identified by CDFI Fund staff, GAO, stakeholders, and researchers.
Several shortcomings in the CIIS posed limitations for this program evaluation, including inconsistent project activity tracking when more than one CDE was involved in a single project and/or there was more than one NMTC investment by a CDE in a single project; limited reporting on jobs, tenants, and tenant jobs; and inability to identify and track business start-ups and closures. CIIS 10.0, which will be used for fiscal year 2012 reporting, addresses a number of these issues, such as reporting of projects that are financed by multiple CDEs and reporting of actual jobs to update prior year project jobs estimates. Other data elements, such as more detail on tenants and tenant jobs, which would contribute to a more complete picture of jobs outcomes, may not be practical additions to the CIIS.
With any new data element or reporting refinement considered, there are choices to be made—is the additional cost/burden justified based on the need for the information? And, is

NEW MARKETS TAX CREDIT (NMTC) PROGRAM EVALUATION
170
annual administrative reporting the best way to address the data need, or can sampling or periodic targeted research studies accomplish the purpose more efficiently? Future research using the CIIS data will determine whether the latest changes have addressed earlier shortcomings, and if additional studies will be able to address issues that are beyond the scope of the administrative data systems.
Research Needs
There is still much to be learned about the NMTC program. This evaluation represents part of what hopefully is a larger research plan, yet to be implemented; its findings and limitations can guide future efforts.
To obtain a broad programmatic assessment, one trade-off made in the current evaluation was to focus on outputs and outcomes for a relatively large number of NMTC projects rather than to conduct more intensive data collection and analysis for a small number of projects. A second decision was to focus on early-year projects to ensure that sufficient time had elapsed for results to have become apparent. The NMTC program has continued to evolve, market circumstances have changed, projects have matured, and new allocations and investments have been made, suggesting many areas in need of additional research. Therefore, there is a need for the following:
• More detailed studies in localities that have a concentration of NMTC projects and/or are part of larger redevelopment initiatives—using on-site data collection as well as local market and investment data regarding interest rates, rates of return, and property values;
• Studies that develop industry benchmarks by project types, such as office buildings, shopping centers, or hotels.
• More detailed studies of jobs to refine and improve measures, including distinguishing between those that are merely moved from one location to another and those that are retained or newly created, developing and using indicators of job quality, and documenting employment of community residents. There is no operational, generally accepted standard of a quality job—an issue that has challenged researchers for years (Isserman 1996), and measurement, benchmarking, and attribution present conceptual questions that can benefit from further research.
• Longer-term trend analyses over the full NMTC period since 2002, to understand better project evolution—especially with respect to targeting and substitution.
• An expanded substitution assessment that includes in-depth reviews of selected projects, business plans, and pro formas, and possibly empanels independent, third-party experts to review the evidence.
• Studies of area-wide and community outcomes to better define them and understand who benefits from community amenities, facilities, and services.

NEW MARKETS TAX CREDIT (NMTC) PROGRAM EVALUATION
171
• Follow-up studies of longer-term project outcomes, as well as other issues, including capacity-building effects (such as whether the knowledge and experience gained through NMTC investments helps to close the information gap and encourages unsubsidized investment in markets targeted by the NMTC program), and the role, extent, and consequences of community involvement in NMTC projects.
• Follow-up studies of the sustainability of NMTC investments, considering questions such as the following: What happens to NMTC projects’ subsidized financing after the seven-year credit-claiming period? Does the subsidy end or do QALICBs obtain other subsidies (either through NMTCs or other programs)? How do QALICBs fare with conventional rates and terms? Do initial outcomes decrease or grow?
Noting that research to-date has not produced definitive results about the effectiveness of community and economic development tax expenditures like the NMTC, EZ tax incentives, or HTCs, the GAO recently recommended crosscutting assessments involving multiple federal agencies and programs to help identify the data needed to evaluate tax expenditures’ effects on community and economic development (GAO 2012b). While more definitive answers are certainly desirable, it is equally important to continue research that focuses on program design, implementation, and monitoring issues. Continued analysis of administrative data, as well as pursuit of additional research questions using a range of data sources and analytic methods, should inform program management and policy—thereby enhancing the effectiveness and relevance of the NMTC program.

NEW MARKETS TAX CREDIT (NMTC) PROGRAM EVALUATION
172
REFERENCES Abravanel, Martin D., Nancy M. Pindus, and Brett Theodos. 2010. Evaluating
Community and Economic Development Programs: A Literature Review to Inform Evaluation of the New Markets Tax Credit Program. Washington, DC: The Urban Institute. http://www.urban.org/publications/412271.html
Abravanel, Martin D., Nancy M. Pindus, and Brett Theodos. 2011. “What Makes for a Smart Community or Economic Development Subsidy? A Program Evaluation Perspective.” In Smart Subsidy for Community Development, edited by Anna Steiger, David Black, and Kirsten Moy, editors(104–121). Boston: The Federal Reserve Bank of Boston and The Aspen Institute.
Aldrich, Howard E., and Nancy M. Carter. 2004. “Social Networks.” In Handbook of Entrepreneurial Dynamics: The Process of Business Creation, edited by Kelly G. Shaver, William B. Gartner, and Nancy M. Carter (324–335). Thousand Oaks, CA: Sage Publications.
Aldrich, Howard E., Nancy M. Carter, and Martin Ruef. 2004. “Teams.” In Handbook of Entrepreneurial Dynamics: The Process of Business Creation, edited by Kelly G. Shaver, William B. Gartner, and Nancy M. Carter (299–310). Thousand Oaks, CA: Sage Publications.
Armistead, P. Jefferson. 2005a. “Community Perspective: Is the NMTC Making a Difference in LICs?” Federal Reserve Bank of San Francisco Community Development Investment Review 1(1): 13–20.
Armistead, P. Jefferson. 2005b. New Markets Tax Credits: Issues and Opportunities. Brooklyn, NY: Pratt Center.
Auspos, Patricia, and Anne C. Kubisch. 2004. Building Knowledge about Community Change: Moving Beyond Evaluations. Washington, DC: The Aspen Institute.
Barkley, David L., Deborah M. Markely, David Freshwater, Julia Sass Rubin, and Ron Shaffer. 2001. Establishing Nontraditional Venture Capital Institutions: Lessons Learned. Columbia, MO: Rural Policy Research Institute.
Barr, Michael S. 2004. “Banking the Poor.” Yale Journal on Regulation 21: 121–237.
Barr, Michael S. 2007. “Financial Services for Low- and Moderate-Income Households.” Paper presented at National Poverty Center Conference on Access, Assets, and Poverty. October 11-12. Washington, DC.
Bartik, Timothy J. 2002. “Evaluating the Impacts of Local Economic Development Policies on Local Economic Outcomes: What Has Been Done and What is Doable.” Paper

NEW MARKETS TAX CREDIT (NMTC) PROGRAM EVALUATION
173
presented at the OECD-European Commission Conference Evaluating Local Economic and Employment Development, Vienna, Austria, Nov. 20.
Bates, Timothy. 1997. “Unequal Access: Financial Institution Lending to Black- and White-Owned Small Business Start-ups.” Journal of Urban Affairs 19(4): 487–495.
Bershadker, Andrew, James Greer, Supapol Siris, and Michael Bzdil. 2008. Promoting Investment in Distressed Communities: The New Markets Tax Credit Program. Washington, DC: CDFI Fund, U.S. Department of the Treasury.
Blanchflower, David G., Phillip B. Levine, and David J. Zimmerman. 2003. "Discrimination in the Small-Business Credit Market." The Review of Economics and Statistics 85(4): 930-943.
Bradshaw, Ted K. 2002. “The Contribution of Small Business Loan Guarantees to Economic Development.” Economic Development Quarterly 16(4): 360–369.
Carlson, Carole, and Prabal Chakrabartu. 2007.”Venture Capital in New England Secondary Cities.” Federal Reserve Bank of Boston: New England Community Developments 1: 1–8.
Cavalluzzo, Ken S., and Linda C. Cavalluzzo. 1998. “Market Structure and Discrimination: The Case of Small Businesses.” Journal of Money, Credit and Banking 30(4): 771–792.
Cavalluzzo, Ken, and John Wolken. 2002. Small Business Loan Turndowns, Personal Wealth and Discrimination. FEDS Working Paper No. 2002-35. Washington, D.C.: Federal Reserve Board.
Coleman, Susan. 2002. “The Borrowing Experience of Black and Hispanic-Owned Small Firms: Evidence from the 1998 Survey of Small Business Finances.” Academy of Entrepreneurship Journal 8(1): 1–20.
Community Development Venture Capital Alliance. 2006. The New Markets Venture Capital Program: Providing Equity Capital and Expertise to Entrepreneurs in Low-Income Urban and Rural Communities. New York: Community Development Venture Capital Alliance.
Council on Competitiveness. 2005. Measuring Regional Innovation. Washington, D.C.: Council on Competitiveness.
Donovan, Annie. 2008. “CDFIs ‘Make the Market’ for Charter School Facilities Financing.” In Reengineering Community Development for the 21st Century, edited by Donna Fabiani and Terry F. Buss (47–59). Armonk, NY: M.E. Sharpe, Inc.

NEW MARKETS TAX CREDIT (NMTC) PROGRAM EVALUATION
174
Eberts, Randall W. 1990. “Public Infrastructure and Regional Economic Development.” Cleveland Organizational Review (1).
Eberts, Randall, George Erickcek, and Jack Kleinhenz. 2006. Dashboard Indicators for the Northeast Ohio Economy. Working Paper. Cleveland, OH: Federal Reserve Bank of Cleveland.
Fellowes, Matt, and Mia Mabanta. 2008, January. Banking on Wealth: America’s New Retail Banking Infrastructure and Its Wealth-Building Potential. Metropolitan Policy Program Policy Brief. Washington, DC: The Brookings Institution.
Felsenstein, Daniel, and Joseph Persky. 1999. “When Is a Cost Really a Benefit? Local Welfare Effects and Employment Creation in the Evaluation of Economic Development Programs.” Economic Development Quarterly 13(1): 46–54.
Florida, Richard, Charlotta Mellander, and Kevin Stolarick. 2007. “Inside the Black Box of Regional Development: Human Capital, the Creative Class and Tolerance.” http://www.creativeclass.org/rfcgdb/articles/Inside_the_Black_Box_of_Regional_Development.pdf.
Fulbright-Anderson, Karen. 2006. “Community Change: Implications for Complex Community Initiatives.” In Community Change: Theories, Practice, and Evidence, edited by Karen Fulbright-Anderson and Patricia Auspos (9–17). Washington, DC: The Aspen Institute.
Galster, George, Peter Tatian, and John Accordino. 2006. “Targeting Investments for Neighborhood Revitalization.” Journal of the American Planning Association 72(4): 457–474.
Galster, George, Kenneth Temkin, Chris Walker, and Noah Sawyer. 2004a. “Measuring the Impacts of Community Development Initiatives: A New Applications of the Adjusted Interrupted Time-Series Method.” Evaluation Review 28(6): 502–538.
Galster, George, Christopher Walker, Christopher Hayes, Patrick Boxall, and Jennifer Johnson. 2004b. “Measuring the Impact of Community Development Block Grant Spending on Urban Neighborhoods.” Housing Policy Debate 15(4): 903–934.
Greer, James, Oscar R. Gonzales, and Joseph J. Valenti. 2011. “Community Economic Development in Distressed Communities.” Presentation for the National Community Investment Banking Conference. Community Development Financial Institutions Fund, U.S. Department of the Treasury. Chicago, Il. November 2.
Gurley-Calvez, Tami, Thomas J. Gilbert, Katherine Harper, Donald J. Marples, and Kevin Daly. 2009. “Do Tax Incentives Affect Investment? An Analysis of the New Markets Tax Credit.” Public Finance Review 37(2009): 371.

NEW MARKETS TAX CREDIT (NMTC) PROGRAM EVALUATION
175
Hollister, Robinson G. 2007. “Measuring the Impact of Community Development Financial Institutions’ Activities.” In Financing LICs: Models, Obstacles, and Future Directions, edited by Julia Sass Rubin (265–310). New York: Russell Sage Foundation.
Hollister, Robinson G., and Jennifer Hill. 1995. Problems in the Evaluation of Community-Wide Initiatives. New York: Russell Sage Foundation.
Immergluck, Daniel. 1999. “Neighborhoods, Race, and Capital: The Effects of Residential Change on Commercial Investment Patterns.” Urban Affairs Review 34(3): 397–411.
Immergluck, Daniel. 2008. “Research Design Issues for Measuring CDFI Performance and Impact.” In Reengineering Community Development for the 21st Century, edited by Donna Fabiani and Terry Buss (76–93). Armonk, NY: M.E. Sharpe, Inc.
Isserman, Andrew.1996. Socio-Economic Review of Appalachia: The Evolving Appalachian Economy. Report to the Appalachian Regional Commission. Washington, DC: Appalachian Regional Commission.
Jackson, Maria-Rosario, Florence Kabwasa-Green, and Joaquin Herranz. 2006. Cultural Vitality in Communities: Interpretation and Indicators. Washington, DC: The Urban Institute.
Kaufman, Phillip R., James M. MacDonald, Steve M. Lutz, and David M. Smallwood. 1997. Do the Poor Pay More for Food? Item Selection and Price Differences Affect Low-Income Household Food Costs. Washington, DC: U.S. Department of Agriculture.
Kivell, Jonathan. 2008. Paying for School: An Overview of Charter School Finance. Working paper. San Francisco, CA: Federal Reserve Bank of San Francisco.
Kubisch, Anne, Patricia Auspos, Prudence Brown, and Tom Dewar. 2010. Voices from the Field III: Lessons and Challenges from Two Decades of Community Change Efforts. Washington, DC: Aspen Institute.
Lambie-Hanson, Lauren. 2008. Addressing the Prevalence of Real Estate Investments in the New Markets Tax Credit Program. Working Paper 2008-04. San Francisco, CA: Federal Reserve Bank of San Francisco Community Development Investment Center.
Lang, William W., and Leonard I. Nakamura. 1993. “A Model of Redlining.” Journal of Urban Economics 33(2): 223–234.
Lindquist, Scott A. 2006. “Calculating the Value of the New Markets Tax Credit.” Novogradac & Company LLP, NMTC Monthly Report V(X). 1-4.

NEW MARKETS TAX CREDIT (NMTC) PROGRAM EVALUATION
176
Listokin, David, Barabara Listokin, and Michael Lahr. 1998. “The Contributions of Historic Preservation to Housing and Economic Development.” Housing Policy Debate 9(3): 431-478.
Losby, Jan L., Elaine L. Edgecomb, John F. Else, Vivian Kao, Marcia E. Kingslow, and Erika T. Malm. 2002. Informal Economy Literature Review. Washington, DC: The Aspen Institute.
Markley, Deborah. 2001. “Financing the New Rural Economy.” Proceedings-Rural Conferences Sep(2001): 69-80.
Office of Management and Budget. 2009. Updated Guidance on the American Recovery and Reinvestment Act—Data Quality, Non-reporting Recipients, and Reporting Job Estimates. Washington, DC: Office of Management and Budget.
Porter, Michael. 1995. “The Competitive Advantage of the Inner-City.” Harvard Business Review 73(3): 55–71.
Quercia, Roberto G., William M. Rohe, and Diane K. Levy. 2000. “A New Look at Creative Finance.” Housing Policy Debate 11(4): 943–972.
Redburn, F. Stevens, Steve Godwin, Kathleen Peroff, and David Sears. 1984. “Federal Economic Development Investments.” In Productivity and Public Policy, edited by Mark Holzer and Stuart Nagel 115-144. Beverly Hills, CA: Sage.
Reischauer, Robert. 1980. “The Value of the Subsidy.” In The Urban Development Action Grant Program: Papers and Conference Proceedings on Its First Two Years of Operation, edited by Richard P. Nathan and Jerry A. Webman. Princeton, NJ: Princeton Urban and Regional Research Center, Princeton University.
Roberts, Benson. 2005. “The Political History of and Prospects for Reauthorizing the New Markets Program.” San Francisco Federal Reserve Review 1(1): 21–32.
Rubin, Julia Sass. 2006a. “Financing Rural Innovation with Community Development Venture Capital: Models, Options and Obstacles.” Federal Reserve Bank of San Francisco Community Development Investment Review 2(3): 15–27.
Rubin, Julia Sass. 2006b. What Do We Know? Research on Outcomes and Impacts in the CDFI Field. White paper. Chicago, IL: The John D. and Catherine T. MacArthur Foundation.
Rubin, Julia Sass and Gregory Stankiewicz. 2003. Evaluating the Impact of Federal Community Economic Development Policies on their Targeted Populations: The Case of the New Markets Initiatives of 2000. Presented at the Federal Reserve System Biennial Research Conference on Sustainable Community Development, Washington, DC, March.

NEW MARKETS TAX CREDIT (NMTC) PROGRAM EVALUATION
177
Rubin, Julia Sass, and Gregory Stankiewicz. 2005. “The New Markets Tax Credit Program: A Midcourse Assessment.” San Francisco Federal Reserve Review 1(1): 1–11.
Schneider, Friedrich, and Dominik H. Enste. 2000. “Shadow Economies: Size, Causes, and Consequences.” Journal of Economic Literature 38(1): 77–114.
Seidman, Ellen. 2007. The New Markets Tax Credit: A Valuable Tool for Economic Development. New York: Living Cities.
Shalala, Donna. 1980. “Research Needs of the UDAG Program.” In The Urban Development Action Grant Program: Papers and Conference Proceedings on Its First Two Years of Operation, edited by Richard P. Nathan and Jerry A. Webman Princeton, NJ: Princeton Urban and Regional Research Center, Princeton University.
Temkin, Kenneth, and Brett Theodos. 2008. The Debenture Small Business Investment Company Program: A Comparative Analysis of Investment Patterns with Private Venture Capital Equity. Washington, DC: The Urban Institute.
U.S. Department of Agriculture. Economic Research Service (USDA ERS). 1997. Credit in Rural America. Agricultural Economic Report No.749. Washington, DC: USDA ERS.
U.S. Department of Housing and Urban Development, Division of Policy Studies. 1982. An Impact Evaluation of the Urban Development Action Grant Program. Washington, DC: Government Printing Office.
U.S. Department of the Treasury. 2008. “NMTC Q&A Document: Low-Income Communities and Targeted Populations.” http://www.novoco.com/new_markets/resource_files/regulations/target_pop_q&a_100308.pdf
U.S. Government Accountability Office. 2002. New Markets Tax Credit: Status of Implementation and Issues Related to GAO’s Mandated Reports. GAO-03-223R. Washington, DC: Government Accountability Office.
———. 2007a. Leveraging Federal Funds for Housing, Community, and Economic Development. GAO-07-768R. Washington, DC: Government Accountability Office.
———. 2007b. New Markets Tax Credit Appears to Increase Investment by Investors in LICs, but Opportunities Exist to Better Monitor Compliance. GAO-07-296. Washington, DC: Government Accountability Office.
———. 2008. HUD and Treasury Programs: More Information on Leverage Measures’ Accuracy and Linkage to Program Goals Is Needed in Assessing Performance. GAO-08-136. Washington, DC: Government Accountability Office.

NEW MARKETS TAX CREDIT (NMTC) PROGRAM EVALUATION
178
———. 2010. New Markets Tax Credit: The Credit Helps Fund a Variety of Projects in LICs, but Could be Simplified. GAO-10-334. Washington, DC: Government Accountability Office.
———. 2012a. Community Development Financial Institutions and New Markets Tax Credit Programs in Metropolitan and Nonmetropolitan Areas. GAO-12-547. Washington, DC: Government Accountability Office.
______. 2012b. Community Development: Limited Information on the Use and Effectiveness of Tax Expenditures Could Be Mitigated through Congressional Attention. GAO-12-262. Washington, DC: Government Accountability Office.
Walker, Christopher, Martin Abravanel, Patrick Boxall, Roger Kormendi, Kenneth Temkin, and Marsha Tonkovich. 2002. Public Sector Loans to Private-Sector Businesses: An Assessment of HUD-Supported Local Economic Development Lending Activities. Washington, DC: U.S. Department of Housing and Urban Development.
Zielenbach, Sean. 2003. “Catalyzing Community Development: HOPE VI and Neighborhood Revitalization.” Journal of Affordable Housing and Community Development Law 13(1): 40–80.
Zielenbach, Sean. 2004. “Measuring the Impact of Community Development.” Communities and Banking 15(3): 3–9.

NEW MARKETS TAX CREDIT (NMTC) PROGRAM EVALUATION
179
LIST OF ACRONYMS CBA Community Benefit Agreement
CDBG Community Development Block Grant
CDE Community Development Entity
CDFI Community Development Financial Institution
CRA Community Reinvestment Act
EZ/EC Enterprise Zone/Enterprise Community
FTE Full-time equivalent
GAO U.S. Government Accountability Office
HTC Historic Tax Credit (also known as Historic Rehabilitation Tax Credits [HRTC] or Rehabilitation Tax Credits [RTC])
HUD U.S. Department of Housing and Urban Development
IRC Internal Revenue Code
LEED Leadership in Energy and Environmental Design
LIC LICs
LIHTC Low Income Housing Tax Credit
LTV loan-to-value (ratio)
NMTC New Markets Tax Credit
QALICB Qualified Active Low Income Businesses
QEI Qualified Equity Investment
QLICI Qualified Low-Income Community Investment
SBA U.S. Small Business Administration
UDAG Urban Development Action Grant
USDA U.S. Department of Agriculture