Embed Size (px)
Citation preview

Prepared by:New Jersey Department of Labor & Workforce Development
Office of Research & InformationBureau of Labor Market Information
Winter 2017 - 2018
New Jersey’s
Life Sciences Industry Cluster

THE GOAL OF THIS REPORT IS TO GET AN “IDEA” OF WHAT LIFE SCIENCES MEANS TO NEW JERSEY
Identify the types of industries and establishments that make up the life sciences
industry cluster based on a standard industry classification system.
Describe any similarities and differences among its components with regard to
such variables as employment, wage, occupation type, education, and demographic characteristics.
Examine any present distinctions within the cluster and its components that give
New Jersey a competitive advantage compared to neighboring states, regions or the nation, or show areas where New Jersey could improve to add to the state’s economy.
Analyze the current state of the life sciences industry cluster and provide an
outlook for employment into the future.

LIFE SCIENCES INDUSTRY CLUSTER: OVERVIEW

NEW JERSEY LIFE SCIENCES INDUSTRY CLUSTERMAJOR INDUSTRY COMPONENTS
New Jersey’s Life Sciences employment in 2016 was identified within three primary components:pharmaceuticals (40.8%), biotechnology-R&D (38.5%) and medical device manufacturing (20.7%). Thebreakdown of the major segments are:
Pharmaceuticals• Pharmaceutical and medicine manufacturing• Soap, cleaning compound, and toiletry
manufacturing• Druggists' goods merchant wholesalers
Biotechnology (R&D)• Scientific research and development services• Medical and diagnostic laboratories
Medical Devices• Electronic instrument manufacturing• Medical equipment and supplies manufacturing
Establishments that are primarily engaged in manufacturing or
distribution of drug related products.
Establishments primarily engaged in manufacturing medical equipment
and supplies.
Consists of services related establishments primarily engaged in
scientific research, development, analytic and/or diagnostics.
Source: NJ Department of Labor & Workforce
Development, Quarterly Census of Employment and
Wages, 2016 Annual Averages
Prepared by: New Jersey Department of Labor and
Workforce Development, January 2018

NEW JERSEY LIFE SCIENCES INDUSTRY CLUSTERMAJOR NEW JERSEY EMPLOYERS
Pharmaceuticals Medical DevicesBiotechnology (R&D)
• Bayer HealthCare Pharmaceutical
• Bristol-Myers Squibb Co.• Daiichi Sankyo• Ethicon, Inc.• Glaxosmithkline• Johnson & Johnson• Merck & Co. Inc.• Novartis Pharmaceuticals• Pfizer, Inc.• Sanofi, U.S.• Teva Pharmaceuticals • West-Ward
Pharmaceuticals
• Abbott Laboratories• Becton Dickinson & Co.• C. R. Bard, Inc.• Honeywell International,
Inc.• Integra Life Sciences• Micro Corporation• Ortho McNeil Pharma• Oticon, Inc.• Roche Molecular
Systems, Inc.• Safilo USA, Inc.• Sivantos, Inc.• Stryker Orthopedics
• Celerion, Inc.• Chugai Pharma USA• Community Medical
Center• Collagen Matrix, Inc.• Covance, Inc.• Immunomedics, Inc.• Lab Corp• PAREXEL International• Progenitor Cell Therapy• PTC Therapeutics, Inc.• Quest Diagnostics• Raritan Bay Medical• Sandoz, Inc.
Some of New Jersey’s well-known employers in this cluster include:
Source: 2016 InfoUSA
Prepared by: New Jersey Department of Labor and
Workforce Development, January 2018

NEW JERSEY LIFE SCIENCES INDUSTRY CLUSTEROVERALL STATE IMPACT
Source: NJ Department of Labor & Workforce Development,
Quarterly Census of Employment and Wages, 2011 - 2016
Annual Averages
Prepared by: New Jersey Department of Labor and
Workforce Development, January 2018
The Life Sciences Cluster has an enormous impact on providing high quality jobs and adding significant value to the State’s economic activities. Recent New Jersey highlights included:
• Employment Total: averaged 117,260 or 3.5 percent of all private sector workers in the state for 2016. Nationally, the proportion was just 1.9 percent.
• Well-paying Jobs: Paid over $16.5 billion in 2016 annual payrolls; 7.8 percent of the state’s total wages.
• Establishments total: over 3,200 in 2016. Over a five year period (2011-2016) – even with numerous industry related reorganizations – New Jersey’s drug & pharmaceutical component still grew (by +10.5%).

NEW JERSEY LIFE SCIENCES INDUSTRY CLUSTERALL PRIVATE SECTOR VS. INDUSTRY CLUSTER EMPLOYMENT
75
80
85
90
95
100
105
2006 2007 2008 2009 2010 2011 2012 2013 2014 2015 2016
Emp
loym
en
t In
dex
Ye
ar 2
00
6 =
10
0%
Year
Life Sciences Total NJ Private Employment
Gray area denotes U.S. economic recession as defined by the National Bureau of Economic Research (NBER)
Source: NJ Department of Labor & Workforce
Development, Quarterly Census of Employment and
Wages, 2006 - 2016 Annual Averages
Prepared by: New Jersey Department of Labor and
Workforce Development, January 2018
• After increasing slightly from 2006 to 2007 (+0.54%), the NJ life sciences industry experienced a steady decline from 2007 to 2013 (-13.7%), flattened out from 2013 to 2014 (+0.1%), increased from 2014 to 2016 (+1.58%), and is currently below the 2006 employment level (-11.2%).
• Total statewide private sector employment has led life sciences employment from 2010 to 2016 and is currently above the 2006 employment level by 1.3 percent.

NEW JERSEY LIFE SCIENCES INDUSTRY CLUSTEREMPLOYMENT SIZE, GROWTH, SALARY & LOCATION QUOTIENT
-10,000
-8,000
-6,000
-4,000
-2,000
0
2,000
4,000
6,000
8,000
$0 $50,000 $100,000 $150,000 $200,000 $250,000 $300,000
Emp
loym
en
t G
row
th 2
01
1 -
20
16
Annual Average Wage 2016
Source: NJ Department of Labor & Workforce
Development, Quarterly Census of Employment and
Wages, 2011-2016 Annual Averages
Prepared by: New Jersey Department of Labor and
Workforce Development, January 2018
The above bubble graph has four elements: 1. Total 2016 employment - represented by the size of the bubble.2. 2011-2016 employment growth- shown on the Y-axis, or vertical position.3. 2016 annual average wages - shown on the X-axis, or horizontal position.4. Location quotient - indicated by the color of the bubble. The location quotient compares the concentration of the industry subsectors in the state to those of the nation. Industries with a location quotient above 1 are known as “basic industries” which (in theory) export a good or service from the state and in return, bring in wealth.
Druggists’ Goods Merchant Wholesalers
Pharmaceutical Preparation Mfg.
R&D in Biotechnology
Medical Laboratories
Dental Laboratories
Medicinal & Botanical Mfg.

LIFE SCIENCES INDUSTRY CLUSTER: EMPLOYMENT ANALYSIS

NEW JERSEY LIFE SCIENCES INDUSTRY CLUSTER5-YEAR EMPLOYMENT TREND
• With an average of 117,260 workers employed in this NJ cluster in 2016, the employment over the 5-year period experienced a decline of 3.6 percent.
• The pharmaceutical component experienced the largest total percent loss over the 5-year period (-8.3%).
Source: NJ Department of Labor & Workforce
Development, Quarterly Census of Employment and
Wages, 2011 - 2016 Annual Averages
Prepared by: New Jersey Department of Labor and
Workforce Development, January 2018
52,130 49,910 50,020 51,800 47,850 47,820
43,41041,800 40,780 39,710 44,690 45,120
26,12024,840 24,250 23,670 24,160 24,320
121,660116,550 115,050 115,180 116,700 117,260
20,000
40,000
60,000
80,000
100,000
120,000
140,000
2011 2012 2013 2014 2015 2016
An
nu
al A
vera
ge E
mp
loym
ent
Year
Employment Trend2011 - 2016
Pharmaceuticals Biotechnology Medical Device Industry Cluster
NEW JERSEY LIFE SCIENCES INDUSTRY CLUSTERSUB-SECTOR EMPLOYMENT
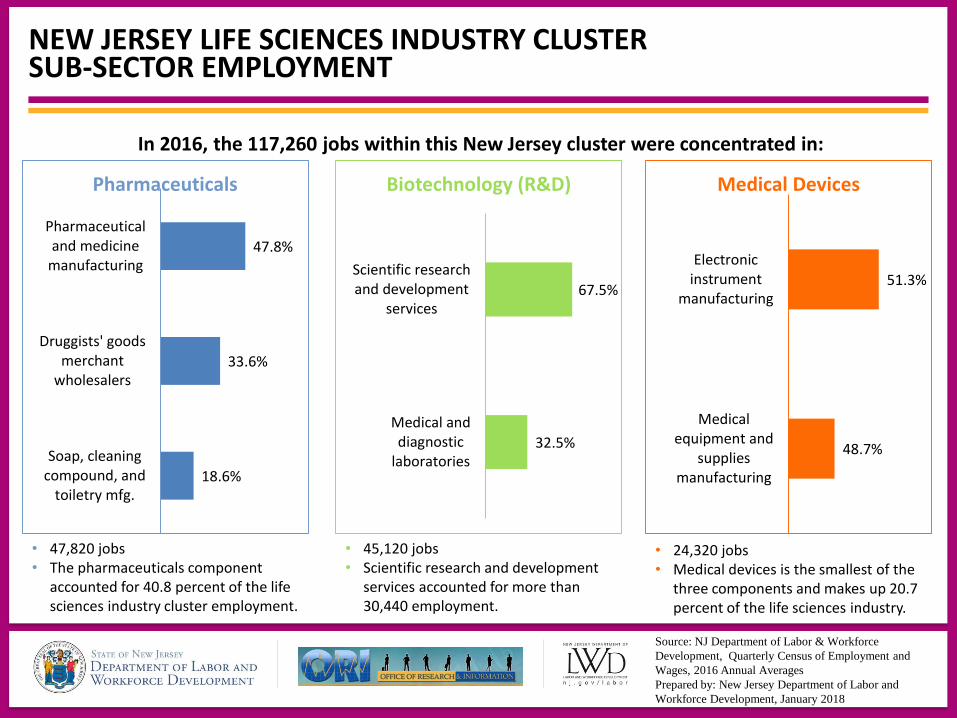
In 2016, the 117,260 jobs within this New Jersey cluster were concentrated in:
• 47,820 jobs• The pharmaceuticals component
accounted for 40.8 percent of the life sciences industry cluster employment.
• 45,120 jobs• Scientific research and development
services accounted for more than 30,440 employment.
• 24,320 jobs • Medical devices is the smallest of the
three components and makes up 20.7 percent of the life sciences industry.
Source: NJ Department of Labor & Workforce
Development, Quarterly Census of Employment and
Wages, 2016 Annual Averages
Prepared by: New Jersey Department of Labor and
Workforce Development, January 2018
18.6%
33.6%
47.8%
Soap, cleaningcompound, and
toiletry mfg.
Druggists' goodsmerchant
wholesalers
Pharmaceuticaland medicine
manufacturing
Pharmaceuticals
32.5%
67.5%
Medical anddiagnostic
laboratories
Scientific researchand development
services
Biotechnology (R&D)
48.7%
51.3%
Medicalequipment and
suppliesmanufacturing
Electronicinstrument
manufacturing
Medical Devices

NEW JERSEY LIFE SCIENCES INDUSTRY CLUSTERPHARMACEUTICALS INDUSTRY TOP EMPLOYMENT, 2016
1,110
6,440
15,790
16,050
0 5,000 10,000 15,000 20,000
Soap and Other Detergent Manufacturing
Toilet Preparation Manufacturing
Pharmaceutical Preparation Manufacturing
Druggists' Goods Merchant Wholesalers
2016 Employment
Pharmaceuticals Industry
Source: NJ Department of Labor & Workforce
Development, Quarterly Census of Employment and
Wages, 2011 - 2016 Annual Averages
Prepared by: New Jersey Department of Labor and
Workforce Development, January 2018
• Made up 40.8 percent of the life sciences industry cluster’s employment in 2016.
• Pharmaceutical & medicine manufacturing (-31.1%) and soap, cleaning compound, and toiletry manufacturing (-2.2%) both experienced a decline from 2011 to 2016 while druggists’ goods merchant wholesalers experienced significant growth (+23.2%).
Due to disclosure issues, medicinal and botanical mfg., surface active agent mfg., other biological product mfg., in-vitro diagnostic substance mfg., and polish and sanitation good manufacturing are not included in the chart above.

NEW JERSEY LIFE SCIENCES INDUSTRY CLUSTERBIOTECHNOLOGY INDUSTRY TOP EMPLOYMENT, 2016
1,310
3,330
11,360
14,070
15,060
0 4,000 8,000 12,000 16,000
Social Science/Humanities Research
Diagnostic Imaging Centers
Medical Laboratories
Research & Development in Biotechnology
R & D in Physical, Engineering & Life Sciences
2016 Employment
Biotechnology
Source: NJ Department of Labor & Workforce
Development, Quarterly Census of Employment and
Wages, 2011 - 2016 Annual Averages
Prepared by: New Jersey Department of Labor and
Workforce Development, January 2018
• Accounted for 38.5 percent of life sciences industry cluster’s employment in 2016.
• Scientific R&D industry service sectors declined (-0.8%) over the 5-year period from 2011 to 2016.
• Medical and diagnostic laboratories experienced significant growth over the same period (+15.3%).

NEW JERSEY LIFE SCIENCES INDUSTRY CLUSTERMEDICAL DEVICES INDUSTRY TOP EMPLOYMENT, 2016
70
70
250
750
890
960
1,320
1,900
2,540
6,870
0 2,000 4,000 6,000 8,000
Fluid Meters and Counting Devices
Irradiation Apparatus Manufacturing
Automatic Environmental Control Mfg
Analytical Laboratory Instruments
Industrial Process Variable Instruments
Dental Laboratories
Electricity & Signal Testing Instrument Mfg
Electromedical Apparatus Mfg
Surgical and Medical Instrument Mfg
Surgical Appliance and Supplies Mfg
2016 Employment
Medical Devices
Source: NJ Department of Labor & Workforce
Development, Quarterly Census of Employment and
Wages, 2011 - 2016 Annual Averages
Prepared by: New Jersey Department of Labor and
Workforce Development, January 2018
• Accounted for 20.7 percent of the life sciences industry cluster’s employment in 2016.
• Electronic instrument manufacturing slightly grew (+0.8%) over the 5-year period from 2011 to 2016 while medical equipment & supplies manufacturing declined (-3.6%) during the same period.Due to disclosure issues, search, detection & navigation instruments, other measuring
& controlling devices, dental equipment & supplies mfg., and ophthalmic goods mfg. are not included in the chart above.

LIFE SCIENCES INDUSTRY CLUSTER: ESTABLISHMENT ANALYSIS
NEW JERSEY LIFE SCIENCES INDUSTRY CLUSTER5-YEAR ESTABLISHMENT TREND
Source: NJ Department of Labor & Workforce
Development, Quarterly Census of Employment and
Wages, 2011 - 2016 Annual Averages
Prepared by: New Jersey Department of Labor and
Workforce Development, January 2018
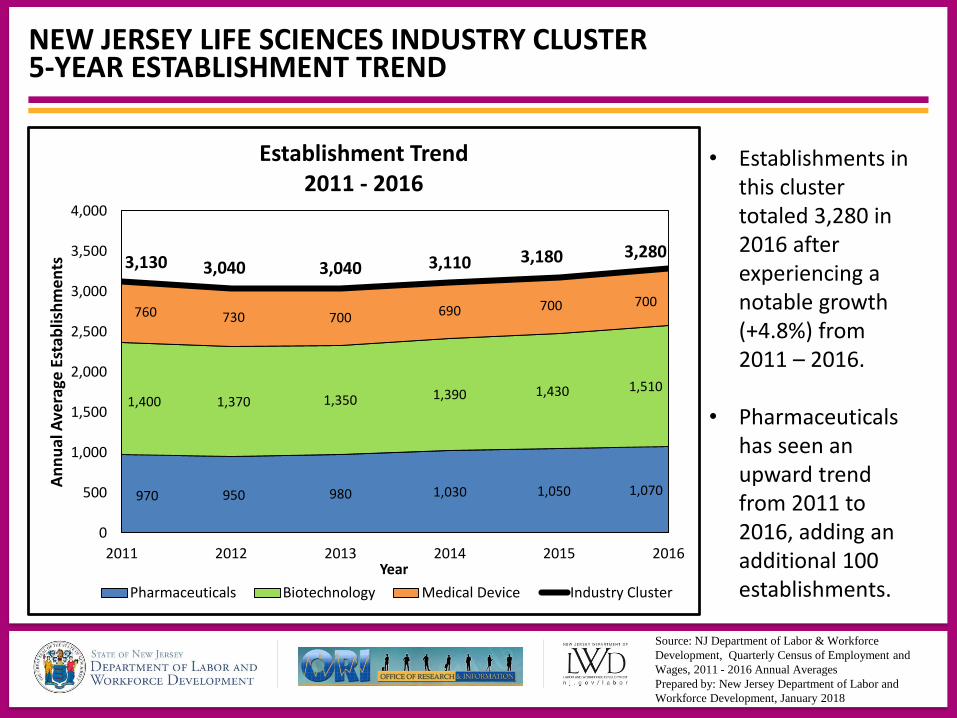
970 950 980 1,030 1,050 1,070
1,400 1,370 1,350 1,390 1,430 1,510
760 730 700 690 700 700
3,130 3,040 3,040 3,110 3,180 3,280
0
500
1,000
1,500
2,000
2,500
3,000
3,500
4,000
2011 2012 2013 2014 2015 2016
An
nu
al A
vera
ge E
stab
lish
me
nts
Year
Establishment Trend2011 - 2016
Pharmaceuticals Biotechnology Medical Device Industry Cluster
• Establishments in this cluster totaled 3,280 in 2016 after experiencing a notable growth (+4.8%) from 2011 – 2016.
• Pharmaceuticals has seen an upward trend from 2011 to 2016, adding an additional 100 establishments.

NEW JERSEY LIFE SCIENCES INDUSTRY CLUSTERSUB-SECTOR ESTABLISHMENTS
• 1,070 establishments• The pharmaceutical component
accounts for 1/3 of all life sciences industry establishments.
• 1,510 establishments• R&D related sub-sectors accounted
for 46.0% of all life sciences establishments.
• 700 establishments • The medical devices component has
the least establishments of all three life sciences industry components.
16.3%
24.9%
58.8%
Soap, CleaningCompound, &Toiletry Mfg.
Pharmaceutical &Medicine Mfg.
Druggists' GoodsMerchant
Wholesalers
Pharmaceuticals
47.3%
52.7%
Medical anddiagnostic
laboratories
Scientific researchand development
services
Biotechnology (R&D)
44.7%
55.3%
Electronicinstrument
manufacturing
Medicalequipment and
suppliesmanufacturing
Medical Devices
In 2016, New Jersey had 3,280 establishments in this cluster engaged in:
Source: NJ Department of Labor & Workforce
Development, Quarterly Census of Employment and
Wages, 2016 Annual Averages
Prepared by: New Jersey Department of Labor and
Workforce Development, January 2018

NEW JERSEY LIFE SCIENCES INDUSTRY CLUSTERPHARMACEUTICALS INDUSTRY TOP ESTABLISHMENTS, 2016
• Accounted for 32.6 percent of the life sciences industry cluster’s establishments in 2016.
• Establishments in the soap, cleaning compound, and toiletry manufacturing industries (-19.0%) declined from 2011 to 2016, while pharmaceutical & medicine manufacturing (+10.7%) and druggists’ goods merchant wholesalers (+21.6%) realized growth.
30
110
200
630
0 200 400 600 800
Soap And Other Detergent Mfg.
Toilet Preparation Mfg.
Pharmaceutical Preparation Mfg.
Druggists' Goods Merchant Wholesalers
2016 Establishments
Pharmaceuticals Industry
Source: NJ Department of Labor & Workforce
Development, Quarterly Census of Employment and
Wages, 2011 - 2016 Annual Averages
Prepared by: New Jersey Department of Labor and
Workforce Development, January 2018
Due to disclosure issues, medicinal and botanical mfg., surface active agent mfg., other biological product mfg., in-vitro diagnostic substance mfg., and polish and sanitation good manufacturing are not included in the chart above.

NEW JERSEY LIFE SCIENCES INDUSTRY CLUSTERBIOTECHNOLOGY INDUSTRY TOP ESTABLISHMENTS, 2016
• Made up 46.0 percent of all establishments in the life sciences industry cluster in 2016 with 1,510 establishments.
• Scientific R&D industry service sectors (+10.5%) and medical diagnostic laboratories (+5.6%) both experienced growth from 2011 to 2016.
90
220
330
380
490
0 200 400 600
Social Science/Humanities Research
Diagnostic Imaging Centers
Research & Development In Biotechnology
R & D In Physical, Engineering & Life Sciences
Medical Laboratories
2016 Establishments
Biotechnology (R&D)
Source: NJ Department of Labor & Workforce
Development, Quarterly Census of Employment and
Wages, 2011 - 2016 Annual Averages
Prepared by: New Jersey Department of Labor and
Workforce Development, January 2018

NEW JERSEY LIFE SCIENCES INDUSTRY CLUSTERMEDICAL DEVICES INDUSTRY TOP ESTABLISHMENTS, 2016
• Represented 21.4 percent of the life sciences industry cluster’s establishments in 2016 (700).
• Electronic instrument manufacturing (-8.0%) and medical equipment and supplies manufacturing (-12.2%) both declined from 2011 to 2016.
10
10
20
30
40
50
60
90
100
160
0 20 40 60 80 100 120 140 160 180
Fluid Meters and Counting Devices
Irradiation Apparatus Mfg
Automatic Environmental Control Mfg
Analytical Laboratory Instruments
Electricity & Signal Testing Instrument Mfg
Electromedical Apparatus Mfg
Industrial Process Variable Instruments
Surgical and Medical Instrument Mfg
Surgical Appliance and Supplies Mfg
Dental Laboratories
2016 Establishments
Medical Devices
Source: NJ Department of Labor & Workforce
Development, Quarterly Census of Employment and
Wages, 2011 - 2016 Annual Averages
Prepared by: New Jersey Department of Labor and
Workforce Development, January 2018
Due to disclosure issues, search, detection & navigation instruments, other measuring & controlling devices, dental equipment & supplies mfg., and ophthalmic goods mfg. are not included in the chart above.

LIFE SCIENCES INDUSTRY CLUSTER: ANNUAL AVERAGE WAGE ANALYSIS

NEW JERSEY LIFE SCIENCES INDUSTRY CLUSTERALL PRIVATE SECTOR VS. LIFE SCIENCES ANNUAL AVERAGE WAGE
$9
9,0
70
$1
04
,31
0
$1
07
,55
0
$1
11
,48
0
$1
14
,76
0
$1
19
,43
0
$1
26
,79
0
$1
30
,41
0
$1
37
,29
0
$1
44
,41
0
$1
40
,77
0
$5
1,3
80
$5
3,5
90
$5
4,9
30
$5
4,5
40
$5
5,7
40
$5
6,8
90
$5
8,0
90
$5
9,0
30
$6
0,1
50
$6
1,9
80
$6
2,4
20
$0
$20,000
$40,000
$60,000
$80,000
$100,000
$120,000
$140,000
$160,000
2006 2007 2008 2009 2010 2011 2012 2013 2014 2015 2016
An
nu
al A
vera
ge W
age
Year
Life Sciences All Industries
Source: NJ Department of Labor & Workforce
Development, Quarterly Census of Employment and
Wages, 2006 - 2016 Annual Averages
Prepared by: New Jersey Department of Labor and
Workforce Development, January 2018
• Wages in the life sciences cluster have averaged 211.8% of the statewide annual average wage since 2006.
• Annual average wages for the cluster have risen +42.1% over the ten year period from 2006 to 2016.

NEW JERSEY LIFE SCIENCES INDUSTRY CLUSTER5-YEAR AVERAGE ANNUAL WAGES TREND
• This cluster’s average annual wage was $140,770 in 2016, which was 125.5 percent higher than the state’s total private sector’s average annual wage of $62,420.
• All three of this cluster’s components had 2016 wages that were significantly higher than the state’s total average annual wage.
Source: NJ Department of Labor & Workforce
Development, Quarterly Census of Employment and
Wages, 2011 - 2016 Annual Averages
Prepared by: New Jersey Department of Labor and
Workforce Development, January 2018
$1
45
,46
0
$8
1,6
50
$1
47
,06
0
$1
36
,52
0
$6
6,6
80
$9
2,2
30
$9
7,1
90
$5
6,8
90
$1
53
,80
0
$9
2,8
30
$1
68
,73
0
$1
91
,68
0
$6
7,1
90
$1
01
,76
0
$1
15
,31
0
$6
2,4
20
$0
$50,000
$100,000
$150,000
$200,000
An
nu
al A
vera
ge W
age
Industry Sectors
2011
2016

NEW JERSEY LIFE SCIENCES INDUSTRY CLUSTERPHARMACEUTICALS INDUSTRY TOP ANNUAL AVERAGE WAGE, 2016
$56,970
$90,120
$156,410
$168,730
$0 $50,000 $100,000 $150,000 $200,000
Soap & Other Detergent Mfg.
Toilet Preparation Mfg.
Pharmaceutical Preparation Mfg.
Druggists' Goods Merchant Wholesalers
2016 Annual Average Wage
Pharmaceuticals Industry • Annual average wages increased $12,721 (or +9.4%), from $134,720 in 2011 to $147,440 in 2016.
• Increases in the industry sectors ranged from soap, cleaning, compound, toiletry and pharmaceutical manufacturing (+8.1%) to druggists’ goods merchants wholesalers (+14.7%) in annual average wages from 2011 to 2016
Source: NJ Department of Labor & Workforce
Development, Quarterly Census of Employment and
Wages, 2011 - 2016 Annual Averages
Prepared by: New Jersey Department of Labor and
Workforce Development, January 2018
Due to disclosure issues, medicinal and botanical mfg., surface active agent mfg., other biological product mfg., in-vitro diagnostic substance mfg., and polish and sanitation good manufacturing are not included in the chart above.

NEW JERSEY LIFE SCIENCES INDUSTRY CLUSTERBIOTECHNOLOGY INDUSTRY TOP ANNUAL AVERAGE WAGE, 2016
$66,420
$69,830
$91,850
$168,050
$226,270
$0 $100,000 $200,000 $300,000
Medical Laboratories
Diagnostic Imaging Centers
Social Science/Humanities Research
R & D In Physical, Engineering & Life Sciences
Research & Development In Biotechnology
2016 Annual Average Wage
Biotechnology (R&D) • Annual average wages were $151,165 in 2016, up +30.3 percent from $116,031 in 2011.
• The industry sectors experienced increases ranged from medical & diagnostic laboratories (+0.8%) to scientific R&D services (+40.4) over the same 5-year period.
Source: NJ Department of Labor & Workforce
Development, Quarterly Census of Employment and
Wages, 2011 - 2016 Annual Averages
Prepared by: New Jersey Department of Labor and
Workforce Development, January 2018

NEW JERSEY LIFE SCIENCES INDUSTRY CLUSTERMEDICAL DEVICES INDUSTRY TOP ANNUAL AVERAGE WAGE, 2016
$55,300
$65,070
$71,940
$80,740
$86,490
$92,610
$92,960
$94,640
$125,850
$146,630
$0 $40,000 $80,000 $120,000 $160,000
Dental Laboratories
Fluid Meters and Counting Devices
Automatic Environmental Control Mfg.
Industrial Process Variable Instruments
Irradiation Apparatus Mfg.
Electromedical Apparatus Mfg.
Electricity & Signal Testing Instrument Mfg.
Analytical Laboratory Instruments
Surgical Appliance and Supplies Mfg.
Surgical and Medical Instrument Mfg.
2016 Annual Average Wage
Medical Devices • Annual average wages were $112,722 in 2016, up +16.2% from $97,026 in 2011.
• Growth for the industry sectors ranged from +10.9% (electronic instrument manufacturing) to +18.6% (medical equipment and supplies manufacturing) over the 5-year period.
Source: NJ Department of Labor & Workforce
Development, Quarterly Census of Employment and
Wages, 2011 - 2016 Annual Averages
Prepared by: New Jersey Department of Labor and
Workforce Development, January 2018
Due to disclosure issues, search, detection & navigation instruments, other measuring & controlling devices, dental equipment & supplies mfg., and ophthalmic goods mfg. are not included in the chart above.

LIFE SCIENCES INDUSTRY CLUSTER: REGIONAL AND COUNTY ANALYSIS

NEW JERSEY LIFE SCIENCES INDUSTRY CLUSTEREMPLOYMENT BY COUNTY, 2016 ANNUAL AVERAGES
Source: NJ Department of Labor & Workforce
Development, Quarterly Census of Employment and
Wages, 2016 Annual Averages
Prepared by: New Jersey Department of Labor and
Workforce Development, January 2018
16,850
14,960
13,360
11,580
10,390
5,970
4,720 4,080
3,140
1,670 1,360 1,180 970 790 320 260 190 130 120 0
2,000
4,000
6,000
8,000
10,000
12,000
14,000
16,000
18,000
An
nu
al A
vera
ge E
mp
loym
ent
County
• In 2016, more than one-third of Bergen County’s employment was found in medical and diagnostic laboratories (5,720).
• 18.3 percent of the employment found in Morris County was in the druggists’ goods merchant wholesalers industry (2,740).
Due to disclosure issues, Essex and Middlesex Counties are not included in the chart above.
NEW JERSEY LIFE SCIENCES INDUSTRY CLUSTERLIFE SCIENCES ANNUAL AVERAGE WAGE BY REGION 5-YEAR TREND
$129,540
$135,920
$144,440
$152,860
$158,340
$150,910
$107,330
$121,340
$114,300$118,990
$126,400$129,820
$85,720 $83,900$86,980
$89,770$94,250 $93,690
$80,000
$90,000
$100,000
$110,000
$120,000
$130,000
$140,000
$150,000
$160,000
$170,000
2011 2012 2013 2014 2015 2016
An
nu
al A
vera
ge W
age
Year
Life Sciences Annual Average Wage Trend
Northern Region Central Region Southern Region
Source: NJ Department of Labor & Workforce
Development, Quarterly Census of Employment and
Wages, 2011-2016 Annual Averages
Prepared by: New Jersey Department of Labor and
Workforce Development, January 2018
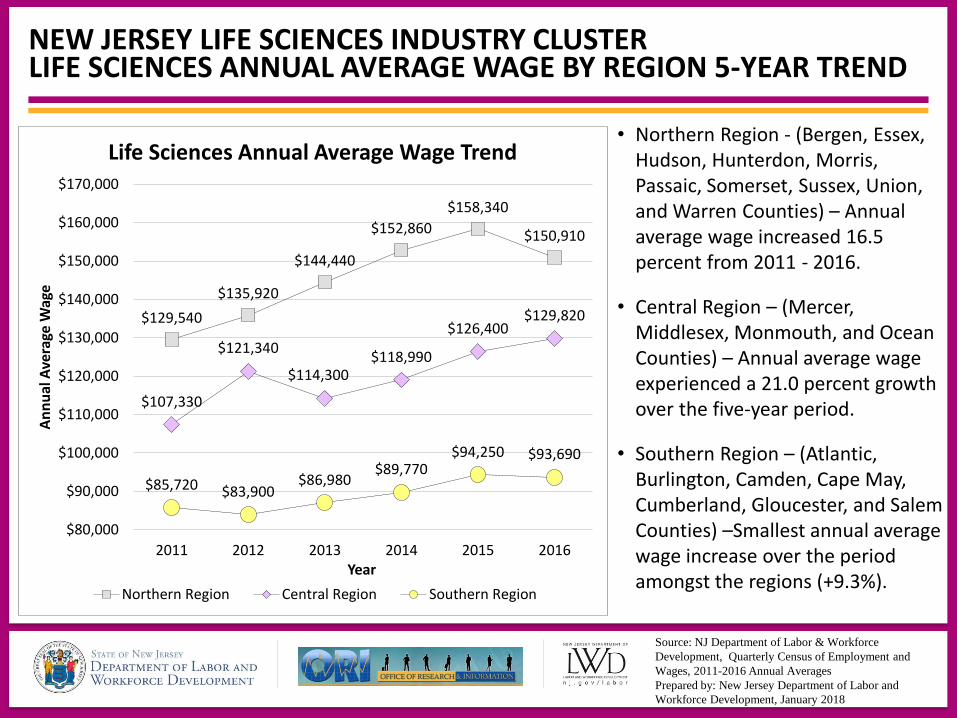
• Northern Region - (Bergen, Essex, Hudson, Hunterdon, Morris, Passaic, Somerset, Sussex, Union, and Warren Counties) – Annual average wage increased 16.5 percent from 2011 - 2016.
• Central Region – (Mercer, Middlesex, Monmouth, and Ocean Counties) – Annual average wage experienced a 21.0 percent growth over the five-year period.
• Southern Region – (Atlantic, Burlington, Camden, Cape May, Cumberland, Gloucester, and Salem Counties) –Smallest annual average wage increase over the period amongst the regions (+9.3%).

NEW JERSEY LIFE SCIENCES INDUSTRY CLUSTERCOUNTIES IN THE NORTHERN REGION
Source: NJ Department of Labor & Workforce
Development, Quarterly Census of Employment and
Wages, 2016 Annual Averages
Prepared by: New Jersey Department of Labor and
Workforce Development, January 2018
The highlighted region to the left consists of Essex, Passaic, Morris, Somerset, Union, Hudson, and Bergen Counties.
• Establishments – A majority of the Life Science industry related establishments can be found along major highways in NJ within a close proximity to New York, NY.
• Employment – Represent more than half of the life sciences employment in New Jersey in 2016.
• Average Wage – The average wage for these counties in life sciences related industries is comparatively above the statewide total average in this cluster ($151,290 vs. $140,770).
Due to disclosure issues, Essex County life sciences employment is not included in the map to the left.

NEW JERSEY LIFE SCIENCES INDUSTRY CLUSTERCOUNTIES IN THE CENTRAL REGION
Source: NJ Department of Labor & Workforce
Development, Quarterly Census of Employment and
Wages, 2016 Annual Averages
Prepared by: New Jersey Department of Labor and
Workforce Development, January 2018
The highlighted region to the left consists of Mercer, Middlesex, Monmouth, and Ocean Counties.
• Establishments - These counties account for more than a quarter of all establishments in the life sciences industry cluster in New Jersey.
• Employment – Employment for these five counties makes up nearly one third of employment in the life sciences industry cluster.
• Average Wage – The average wage for these counties in life sciences related industries is relatively below the statewide total average in this cluster ($129,820 vs. $140,770).
Due to disclosure issues, Middlesex County life sciences employment is not included in the map to the left.

NEW JERSEY LIFE SCIENCES INDUSTRY CLUSTERCOUNTIES IN THE SOUTHERN REGION
Source: NJ Department of Labor & Workforce
Development, Quarterly Census of Employment and
Wages, 2016 Annual Averages
Prepared by: New Jersey Department of Labor and
Workforce Development, January 2018
The highlighted region to the left consists of Burlington, Camden, and Gloucester Counties.
• Establishments – Having a close proximity to Philadelphia, PA these three counties account for eight percent of all life sciences industry establishments in New Jersey.
• Employment – The three counties have slightly more than 9,040 employment.
• Average Wage – The average wage for these counties in life sciences related industries is below the statewide total average in this cluster ($96,490 vs. $140,770). These counties also account for 5.0 percent of total life sciences annual average wages paid in 2016.

LIFE SCIENCES INDUSTRY CLUSTER: OCCUPATIONAL ANALYSIS

NEW JERSEY LIFE SCIENCES INDUSTRY CLUSTERTOP OCCUPATIONAL GROUPS, 2016
Occupational Title2016
Employment
2016 Average Salary
All Life Sciences Occupations 116,580 $81,210
Production 20,640 $41,570
Life, Physical, and Social Science 15,340 $100,430
Office and Administrative Support 14,930 $45,000
Management 13,450 $171,960
Business and Financial Operations 8,820 $86,440
Healthcare Practitioners and Technical 7,830 $68,210
Architecture and Engineering 7,730 $101,910
Computer and Mathematical 6,700 $105,420
Sales and Related 6,390 $92,110
Transportation and Material Moving 4,990 $33,210
Healthcare Support 4,770 $38,500
Installation, Maintenance, and Repair 2,360 $57,720
Source: NJ Department of Labor & Workforce
Development, Occupational Employment Statistics,
May 2016
Prepared by: New Jersey Department of Labor and
Workforce Development, January 2018
Production17.8%
Life, Physical, and Social
Science 13.2%
Office and Administrative
Support 12.9%
Management 11.6%
Business and Financial
Operations 7.6%
Healthcare Practitioners and Technical
6.7%
Architecture and
Engineering 6.7%
Computer and Mathematical
5.8%
Sales and Related
5.5%
Other12.4%
Life Sciences Industry Cluster
Note: Due to disclosure issues, of the total 116,580 jobs identified, only 99.7% could be used for this occupational analysis.

NEW JERSEY LIFE SCIENCES INDUSTRY CLUSTERINDUSTRY CLUSTER TOP 20 OCCUPATIONS BY EMPLOYMENT, 2016
New Jersey Life Sciences Cluster's Top 20 Occupations
NAICS and Occupational Title2016
EmploymentEducation
19-2031 Chemists 4,400 Bachelor's degree
51-9111 Packaging and Filling Machine Operators and Tenders 3,540 High school diploma or equivalent
31-9097 Phlebotomists 2,700 Postsecondary non-degree award
41-4012 Sales Representatives, Wholesale and Manufacturing, Except Technical and Scientific Products 2,360 High school diploma or equivalent
11-9121 Natural Sciences Managers 2,330 Bachelor's degree
19-1021 Biochemists and Biophysicists 2,290 Doctoral or professional degree
19-4031 Chemical Technicians 2,190 Associate's degree
51-9061 Inspectors, Testers, Sorters, Samplers, and Weighers 2,080 High school diploma or equivalent
53-7064 Packers and Packagers, Hand 1,800 No formal educational credential
11-1021 General and Operations Managers 1,770 Bachelor's degree
29-2011 Medical and Clinical Laboratory Technologists 1,770 Bachelor's degree
43-4051 Customer Service Representatives 1,760 High school diploma or equivalent
51-1011 First-Line Supervisors of Production and Operating Workers 1,660 High school diploma or equivalent
51-9011 Chemical Equipment Operators and Tenders 1,660 High school diploma or equivalent
51-9023 Mixing and Blending Machine Setters, Operators, and Tenders 1,580 High school diploma or equivalent
53-7062 Laborers and Freight, Stock, and Material Movers, Hand 1,470 No formal educational credential
51-2022 Electrical and Electronic Equipment Assemblers 1,320 High school diploma or equivalent
43-4171 Receptionists and Information Clerks 1,290 High school diploma or equivalent
43-6014 Secretaries and Administrative Assistants, Except Legal, Medical 1,220 High school diploma or equivalent
43-9061 Office Clerks, General 1,220 High school diploma or equivalent
Source: NJ Department of Labor & Workforce
Development, Occupational Employment Statistics,
May 2016
Prepared by: New Jersey Department of Labor and
Workforce Development, January 2018

NEW JERSEY LIFE SCIENCES INDUSTRY CLUSTERPHARMACEUTICAL COMPONENT, 2016
Production24.5%
Office and Administrative
Support13.5%
Life, Physical, and Social Science
12.0%
Management11.9%
Sales and Related9.1%
Business and Financial Operations
8.4%
Transportation and Material Moving
6.8%Healthcare
Practitioners and Technical
4.2%
Other9.6%
An occupational analysis of 47,150 jobs revealed that five major occupational groups in this component accounted for nearly three-fourths (71%) of the employment.
Sales and related and transportation and material occupational groups are in the top seven components for the pharmaceuticals sub sector and not for the total industry cluster.
Note: Due to disclosure issues, of the total 47,430 jobs identified, only 47,150 could be used for this occupational analysis.
Source: NJ Department of Labor & Workforce
Development, Occupational Employment Statistics,
May 2016
Prepared by: New Jersey Department of Labor and
Workforce Development, January 2018

NEW JERSEY LIFE SCIENCES INDUSTRY CLUSTERPHARMACEUTICAL’S MAJOR OCCUPATIONAL GROUPS, 2016
• In all three industry groups, office & administrative support workers account for a significant portion of the employment.
• A majority of occupations in pharmaceutical and medicine manufacturing and soap, cleaning compound, and toilet preparation manufacturing are production related while occupations in drugs & druggists sundries merchant wholesalers are sales and related occupations.
Production37%
Life, Physical, and Social Science
19%
Management12%
Office and Administrative
Support8%
Business and Financial Operations
8%
Other16%
Pharmaceutical & Medicine Manufacturing
Production36%
Office and Administrative
Support16%
Transportation
and Material Moving
16%
Management7%
Installation, Maintenance, and
Repair7%
Other18%
Soap, Cleaning Compound, & Toilet Preparation
Manufacturing
Sales and Related
22%
Office and Administrative
Support20%
Management14%
Healthcare
Practitioners and Technical
12%
Business and Financial
Operations11%
Other21%
Drugs & Druggists' Sundries Merchant Wholesalers
Source: NJ Department of Labor & Workforce
Development, Occupational Employment Statistics,
May 2016
Prepared by: New Jersey Department of Labor and
Workforce Development, January 2018

NEW JERSEY LIFE SCIENCES INDUSTRY CLUSTERTOP PHARMACEUTICAL OCCUPATIONS, 2016
Source: NJ Department of Labor & Workforce
Development, Occupational Employment Statistics,
May 2016
Prepared by: New Jersey Department of Labor and
Workforce Development, January 2018
3,2
50
2,7
70
2,0
40
1,6
10
1,5
50
1,4
80
1,1
80
$0
$20,000
$40,000
$60,000
$80,000
$100,000
$120,000
0
500
1,000
1,500
2,000
2,500
3,000
3,500
Packaging andFilling MachineOperators and
Tenders
Chemists SalesRepresentatives,Wholesale andManufacturing,
Except Technicaland Scientific
Products
ChemicalEquipment
Operators andTenders
Mixing andBlending
Machine Setters,Operators, and
Tenders
Inspectors,Testers, Sorters,Samplers, and
Weighers
Laborers andFreight, Stock,and Material
Movers, Hand
Ave
rage SalaryEm
plo
yme
nt
Occupation
Employment Average Salary

NEW JERSEY LIFE SCIENCES INDUSTRY CLUSTERBIOTECHNOLOGY (R&D) COMPONENT, 2016
Life, Physical, and Social Science
20.9%
Management12.8%
Healthcare Practitioners and
Technical12.7%
Office and Administrative
Support12.2%
Healthcare Support10.5%
Computer and Mathematical
9.4%
Business and Financial Operations
6.6%Architecture and Engineering
5.1%
Other9.8%
An occupational analysis of 45,310 jobs revealed that five major occupational groups in this component accounted for more than two-thirds (69.1%) of the employment.
Life, physical, and social science occupations employed the most in this component with more than 9,490 jobs, and accounted for more than one-fifth of the component.
Note: Due to disclosure issues, of the total 45,390 jobs identified, only 45,310 could be used for this occupational analysis.
Source: NJ Department of Labor & Workforce
Development, Occupational Employment Statistics,
May 2016
Prepared by: New Jersey Department of Labor and
Workforce Development, January 2018

NEW JERSEY LIFE SCIENCES INDUSTRY CLUSTERBIOTECHNOLOGY (R&D) MAJOR OCCUPATIONAL GROUPS, 2016
Life, Physical, and Social
Science31%
Management17%
Computer and Mathematical
13%
Business and Financial Operations
9%
Architecture and Engineering
8%
Office and Administrative
Support7%
Other15%
Scientific Research & Development Services
Healthcare Practitioners and
Technical34%
Healthcare Support
31%
Office and Administrative
Support23%
Other12%
Medical and Diagnostic Laboratories
• Biotech’s occupational groups show that these industry groups utilize a significant portion of professional, scientific, and technical workers with in-depth skills and knowledge related to science and healthcare.
• Nearly 90% of occupations found in the medical and diagnostic laboratories can be found in three major occupational groups: office and administrative support, healthcare support, and healthcare practitioners and technical.
Source: NJ Department of Labor & Workforce
Development, Occupational Employment Statistics,
May 2016
Prepared by: New Jersey Department of Labor and
Workforce Development, January 2018

NEW JERSEY LIFE SCIENCES INDUSTRY CLUSTERTOP BIOTECHNOLOGY (R&D) OCCUPATIONS, 2016
Source: NJ Department of Labor & Workforce
Development, Occupational Employment Statistics,
May 2016
Prepared by: New Jersey Department of Labor and
Workforce Development, January 2018
2,7
00
1,7
70
1,6
00
1,4
70
1,4
70
1,1
70
1,1
60
-$10,000
$40,000
$90,000
$140,000
$190,000
$240,000
0
500
1,000
1,500
2,000
2,500
3,000
Phlebotomists Medical andClinical
LaboratoryTechnologists
Chemists ChemicalTechnicians
Natural SciencesManagers
Medical andClinical
LaboratoryTechnicians
Biochemists andBiophysicists
Ave
rage SalaryEm
plo
yme
nt
Occupation
Employment Average Salary
NEW JERSEY LIFE SCIENCES INDUSTRY CLUSTERMEDICAL DEVICE COMPONENT, 2016
Production34.1%
Architecture and Engineering
19.1%Office and
Administrative12.7%
Management8.6%
Business and Financial Operations
7.9%
Transportation and Material Moving
5.4%
Other12.3%
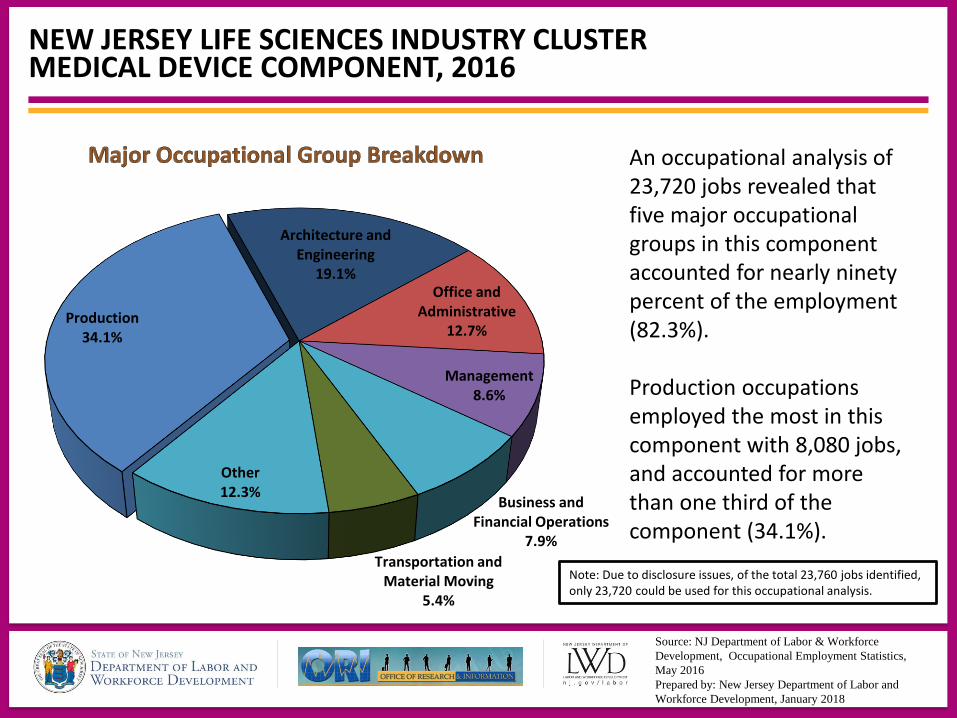
An occupational analysis of 23,720 jobs revealed that five major occupational groups in this component accounted for nearly ninety percent of the employment (82.3%).
Production occupations employed the most in this component with 8,080 jobs, and accounted for more than one third of the component (34.1%).
Note: Due to disclosure issues, of the total 23,760 jobs identified, only 23,720 could be used for this occupational analysis.
Source: NJ Department of Labor & Workforce
Development, Occupational Employment Statistics,
May 2016
Prepared by: New Jersey Department of Labor and
Workforce Development, January 2018

NEW JERSEY LIFE SCIENCES INDUSTRY CLUSTERMEDICAL DEVICES MAJOR OCCUPATIONAL GROUPS, 2016
Architecture and Engineering
30%Production
25%
Office and Administrative Support
11%
Business and Financial Operations
10%
Management9%
Computer and Mathematical
6% Other9%
Navigational, Measuring, Electromedical, & Control Instruments Manufacturing
Production44%
Office and Administrative Support
15%
Transportation and Material Moving
10%
Management9%
Architecture and Engineering
7%
Other15%
Medical Equipment and Supplies Manufacturing
• While the percentages differ, the top four occupational groups reveal that these two industry groups both have a need for many of the same type of workers.
• Occupations found in the medical devices component are production and architecture and engineering based, but other occupational family groups that make up a significant percentage are office and administrative support, and business and financial operations.
Source: NJ Department of Labor & Workforce
Development, Occupational Employment Statistics,
May 2016
Prepared by: New Jersey Department of Labor and
Workforce Development, January 2018

NEW JERSEY LIFE SCIENCES INDUSTRY CLUSTERTOP MEDICAL DEVICE OCCUPATIONS, 2016
Source: NJ Department of Labor & Workforce
Development, Occupational Employment Statistics,
May 2016
Prepared by: New Jersey Department of Labor and
Workforce Development, January 2018
1,3
20
68
0
67
0
66
0
64
0
61
0
60
0
$0
$10,000
$20,000
$30,000
$40,000
$50,000
$60,000
0
200
400
600
800
1,000
1,200
1,400
Electrical andElectronic Equipment
Assemblers
ElectromechanicalEquipmentAssemblers
Packers andPackagers, Hand
Dental LaboratoryTechnicians
Medical ApplianceTechnicians
Computer-ControlledMachine Tool
Operators, Metal andPlastic
Inspectors, Testers,Sorters, Samplers,
and Weighers
Ave
rage SalaryEm
plo
yme
nt
Occupation
Employment Average Salary

LIFE SCIENCES INDUSTRY CLUSTER: 2015 DEMOGRAPHIC OVERVIEW

NEW JERSEY LIFE SCIENCES INDUSTRY CLUSTEREDUCATION CHARACTERISTICS
High School or less
18.3%
Some college/ Associates
degree19.6%
Bachelor's degree33.6%
Master's/ Professional
degree22.5%
Doctoral degree5.9%
Educational Breakdown• It is often mentioned that
life sciences related employers require a well-educated and highly skilled workforce to meet the high level and technical demands of many of the occupations they need to fill.
• Nearly two-thirds of New Jersey’s workforce employed in this cluster hold at least a Bachelor’s degree, many holding even more advanced degrees.
Source: U.S. Census Bureau, 2016 American
Community Survey
Prepared by: New Jersey Department of Labor and
Workforce Development, January 2018

NEW JERSEY LIFE SCIENCES INDUSTRY CLUSTERNJ RESIDENTS IN LIFE SCIENCES INDUSTRY CLUSTER WORKFORCE
Male53%
Female47%
All Industries
White66%
Black11%
Asian17%
Other6%
Life Sciences
White69%
Black13%
Asian10%
Other8%
All Industries
Non-Hispanic
87%
Hispanic13%
Life Sciences
Non-Hispanic
80%
Hispanic20%
All Industries
Females outnumber males by 2.6 % in this clusterMale49%
Female51%
Life Sciences
The life sciences workforce has a greater proportion of NJ residents who are Asian (16.8%)
The life sciences workforce has fewer Hispanics than average
Source: U.S. Census Bureau, 2016 American
Community Survey
Prepared by: New Jersey Department of Labor and
Workforce Development, January 2018

NEW JERSEY LIFE SCIENCES INDUSTRY CLUSTERLIFE SCIENCES INDUSTRY CLUSTER VS. TOTAL NONFARM
-30
.0%
-20
.0%
-10
.0%
0.0
%
10
.0%
20
.0%
30
.0%
65 & over
55-64
45-54
35-44
25-34
Less than 25
Age Breakdown of Workers in Life Sciences and All Industries
New Jersey, 2016
Life Sciences
All Industries
• The workforce of the life sciences industry is older than average with 54.2 percent aged 45 and up compared to only 47 percent overall.
• The largest disparity among age cohorts occurs in the 45-54 year old age group, where 30 percent of the life sciences industry cluster is found.
• 4.2 percent of the current NJ resident life sciences workforce is aged 65 and older.
Source: U.S. Census Bureau, 2016 American
Community Survey
Prepared by: New Jersey Department of Labor and
Workforce Development, January 2018
NEW JERSEY LIFE SCIENCES INDUSTRY CLUSTERNJ RESIDENTS PERSONAL EARNINGS
14
.5%
19
.5%
15
.4%
13
.1%
19
.5%
7.9
%
10
.1%
32
.6%
23
.8%
17
.1%
9.7
%
9.8
%
3.1
%
4.0
%
0.0%
5.0%
10.0%
15.0%
20.0%
25.0%
30.0%
35.0%
Tota
l Pe
rce
nt
of
Wo
rke
rs
Personal Earnings in New Jersey, 2016
Life Sciences All Industries
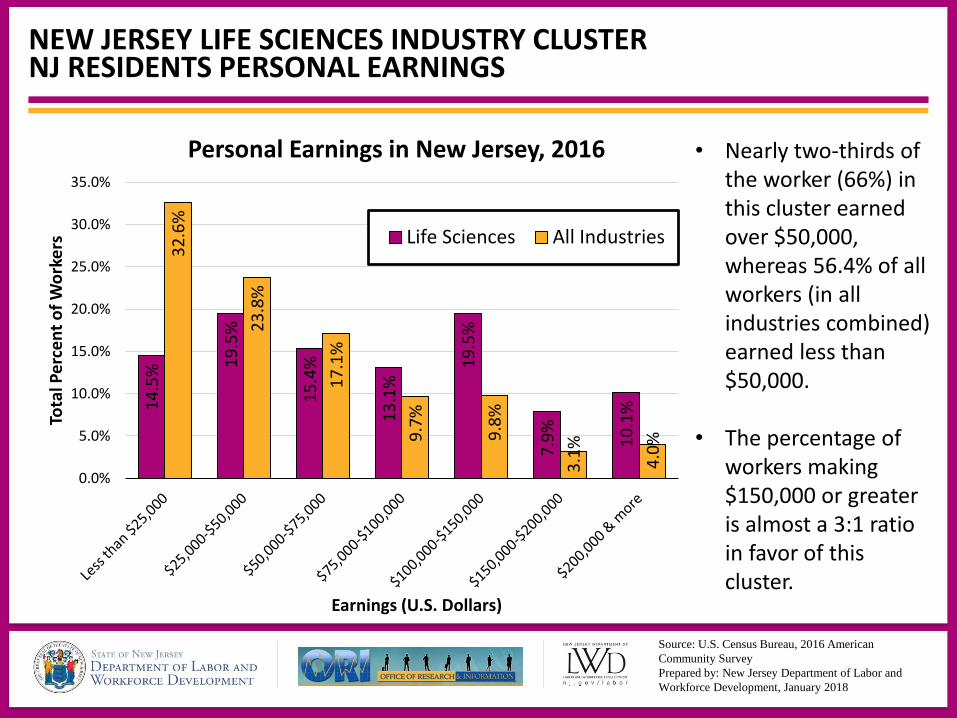
• Nearly two-thirds of the worker (66%) in this cluster earned over $50,000, whereas 56.4% of all workers (in all industries combined) earned less than $50,000.
• The percentage of workers making $150,000 or greater is almost a 3:1 ratio in favor of this cluster.
Source: U.S. Census Bureau, 2016 American
Community Survey
Prepared by: New Jersey Department of Labor and
Workforce Development, January 2018
Earnings (U.S. Dollars)

LIFE SCIENCES INDUSTRY CLUSTER: TOP OCCUPATIONS OUTLOOK
NEW JERSEY LIFE SCIENCES INDUSTRY CLUSTERTOP LIFE SCIENCES OCCUPATIONS OUTLOOK ACROSS ALL INDUSTRIES
Occupational Title
Employment Average Annual
Actual ProjectedChange 2014 -
2024Job Openings
2014 2024 Number Percent Total Growth Replacement
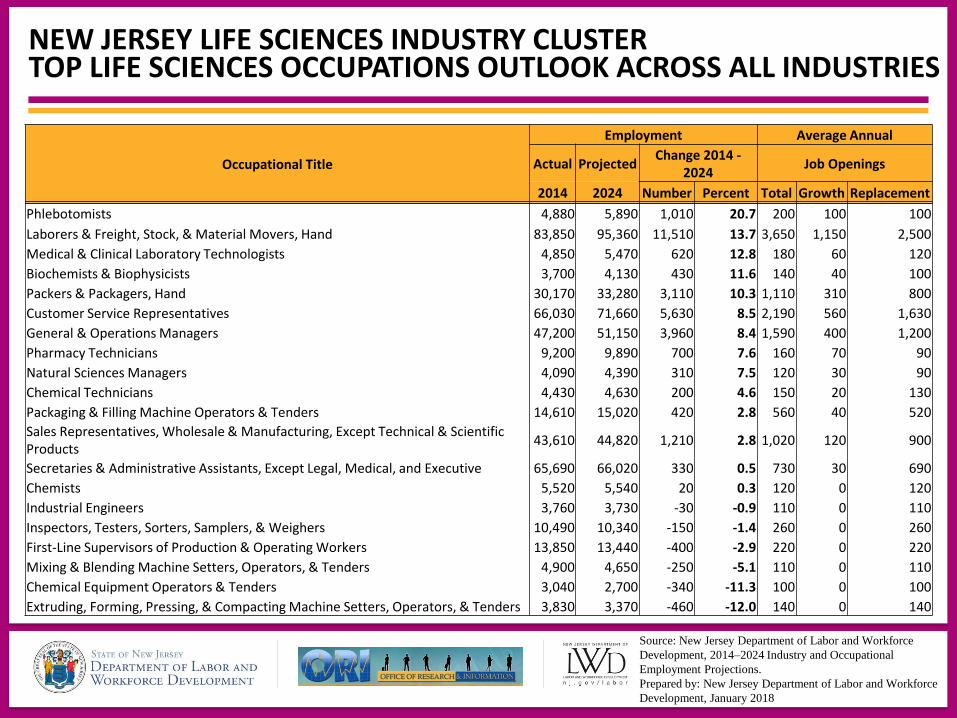
Phlebotomists 4,880 5,890 1,010 20.7 200 100 100
Laborers & Freight, Stock, & Material Movers, Hand 83,850 95,360 11,510 13.7 3,650 1,150 2,500
Medical & Clinical Laboratory Technologists 4,850 5,470 620 12.8 180 60 120
Biochemists & Biophysicists 3,700 4,130 430 11.6 140 40 100
Packers & Packagers, Hand 30,170 33,280 3,110 10.3 1,110 310 800
Customer Service Representatives 66,030 71,660 5,630 8.5 2,190 560 1,630
General & Operations Managers 47,200 51,150 3,960 8.4 1,590 400 1,200
Pharmacy Technicians 9,200 9,890 700 7.6 160 70 90
Natural Sciences Managers 4,090 4,390 310 7.5 120 30 90
Chemical Technicians 4,430 4,630 200 4.6 150 20 130
Packaging & Filling Machine Operators & Tenders 14,610 15,020 420 2.8 560 40 520
Sales Representatives, Wholesale & Manufacturing, Except Technical & Scientific Products
43,610 44,820 1,210 2.8 1,020 120 900
Secretaries & Administrative Assistants, Except Legal, Medical, and Executive 65,690 66,020 330 0.5 730 30 690
Chemists 5,520 5,540 20 0.3 120 0 120
Industrial Engineers 3,760 3,730 -30 -0.9 110 0 110
Inspectors, Testers, Sorters, Samplers, & Weighers 10,490 10,340 -150 -1.4 260 0 260
First-Line Supervisors of Production & Operating Workers 13,850 13,440 -400 -2.9 220 0 220
Mixing & Blending Machine Setters, Operators, & Tenders 4,900 4,650 -250 -5.1 110 0 110
Chemical Equipment Operators & Tenders 3,040 2,700 -340 -11.3 100 0 100
Extruding, Forming, Pressing, & Compacting Machine Setters, Operators, & Tenders 3,830 3,370 -460 -12.0 140 0 140
Source: New Jersey Department of Labor and Workforce
Development, 2014–2024 Industry and Occupational
Employment Projections.
Prepared by: New Jersey Department of Labor and Workforce
Development, January 2018

NEW JERSEY LIFE SCIENCES INDUSTRY CLUSTERPROJECTED ANNUAL AVERAGE OPENINGS FOR TOP OCCUPATIONS
0
40
30
120
310
400
560
1150
260
520
690
900
800
1200
1630
2500
0 500 1000 1500 2000 2500 3000 3500 4000
Inspectors, Testers, Sorters, Samplers, & Weighers
Packaging & Filling Machine Operators & Tenders
Secretaries & Administrative Assistants, Except Legal,Medical, & Executive
Sales Representatives, Wholesale & Manufacturing,Except Technical & Scientific Products
Packers & Packagers, Hand
General & Operations Managers
Customer Service Representatives
Laborers & Freight, Stock, & Material Movers, Hand
2014-2024 Projected Annual Average Job Openings
Growth Replacement
3,650
2,190
1,590
1,110
1,020
730
560
260
Source: New Jersey Department of Labor and Workforce
Development, 2014–2024 Industry and Occupational
Employment Projections.
Prepared by: New Jersey Department of Labor and Workforce
Development, January 2018

NEW JERSEY LIFE SCIENCES INDUSTRY CLUSTERCOPYRIGHT STATEMENT
This workforce product was funded by a grant awarded by the U.S. Department of Labor’s Employment and Training Administration. The product was created by the recipient and does not necessarily reflect the official position of the U.S. Department of Labor. The Department of Labor makes no guarantees, warranties, or assurances of any kind, express or implied, with respect to such information, including any information on linked sites and including, but not limited to, accuracy of the information or its completeness, timeliness, usefulness, adequacy, continued availability, or ownership. This product is copyrighted by the institution that created it. Internal use by an organization and/or personal use by an individual for non-commercial purposes is permissible. All other uses require the prior authorization of the copyright owner.

NEW JERSEY LIFE SCIENCES INDUSTRY CLUSTERCONTACT INFORMATION
New Jersey Department of Labor & Workforce Development
http://lwd.dol.state.nj.us/
P.O. Box 057
Trenton, NJ 08625-0057
Office of Research and Information
http://lwd.dol.state.nj.us/labor/lpa/LMI_index.html
Alex Ancianis– Labor Market Analyst
Tel: (609)984-9683
Email: [email protected]