Embed Size (px)
Citation preview

New Jersey StatewideFREIGHT PLAN


Table of CONTENTS
Any opinions, findings, and conclusions or recommendations expressed in this publication are those of the Author(s) and do not necessarily reflect the view of the Federal Highway Administration.

New Jersey Statewide FREIGHT PLAN
Page left blank intentionally.

Table of CONTENTS
i
Acknowledgements The New Jersey Department of Transportation’s Division of Multimodal Services thanks the many organizations and individuals for their time and contribution in making this document possible.
New Jersey Department of Transportation Nicole Minutoli Paul Truban Genevieve Clifton Himanshu Patel Andrew Ludasi New Jersey Freight Advisory Committee Calvin Edghill, FHWA Keith Skilton, FHWA Anne Strauss-Wieder, NJTPA Jakub Rowinski, NJTPA Ted Dahlburg, DVRPC Mike Ruane, DVRPC Bill Schiavi, SJTPO David Heller, SJTPO Steve Brown, PANYNJ Victoria Farr, PANYNJ Stephanie Molden, PANYNJ Alan Kearns, NJ TRANSIT Steve Mazur, SJTA Rodney Oglesby, CSX Rick Crawford, Norfolk Southern Michael Fesen, Norfolk Southern Jocelyn Hill, Conrail Adam Baginski, Conrail Kelvin MacKavanagh, New Jersey Short Line Railroad Association Brian Hare, Pennsylvania Department of Transportation David Rosenberg, New York State Department of Transportation Consultant Team Jennifer Grenier, WSP Stephen Chiaramonte, WSP Alan Meyers, WSP Carlos Bastida, WSP Joseph Bryan, WSP Sebastian Guerrero, WSP Debbie Hartman, WSP Ruchi Shrivastava, WSP Reed Sibley, WSP Scudder Smith, WSP Scott Parker, Jacobs Engineering Jayne Yost, Jacobs Engineering Christopher Lamm, Cambridge Systematics Dejan Besenski, New Jersey Institute of Technology

New Jersey Statewide FREIGHT PLAN
ii
Page left blank intentionally.

Table of CONTENTS
iii
Table of Contents 1 - Introduction ............................................................................................................................ 1
Plan Background .................................................................................................................................... 1
Federal Legislation ............................................................................................................................. 2
Freight and the New Jersey Economy ................................................................................................ 2
New Jersey Freight Advisory Committee ............................................................................................... 3
Current New Jersey Freight Initiatives and Agencies .............................................................................. 6
New Jersey State Agencies ................................................................................................................ 7
Regional Partners ................................................................................................................................ 8
Previous New Jersey Freight Plans and Studies ............................................................................... 13
NJDOT Freight Planning Initiatives .................................................................................................. 14
Regional Initiatives ............................................................................................................................ 14
2 - Goals & Objectives .............................................................................................................. 17
3 - Freight Activity, Industries, Trends ....................................................................................... 21
New Jersey’s Freight Flows .................................................................................................................. 21
Current Tonnage and Value by Direction ......................................................................................... 22
New Jersey Freight Trading Partners ............................................................................................... 23
Summary of Trade Types .................................................................................................................. 26
New Jersey Top Commodities ......................................................................................................... 27
Value Analysis ................................................................................................................................... 30
Modes Utilized for Key Commodities ............................................................................................... 32
International Modes .......................................................................................................................... 40
Modal and Commodity Forecasts to the Year 2045 ......................................................................... 46
New Jersey’s Industries and Freight Movement .................................................................................. 50
Supply Chains and Industry Clusters .................................................................................................... 55
Durable and Non-Durable Consumer Goods ................................................................................... 57
Construction Materials ...................................................................................................................... 71
Energy and Chemicals ...................................................................................................................... 74
Distribution Traffic ............................................................................................................................ 82
Waste ................................................................................................................................................ 85
Freight Activity and Industries - Summary ............................................................................................ 88

New Jersey Statewide FREIGHT PLAN
iv
4 - Freight Network Performance .............................................................................................. 89
Highway ................................................................................................................................................ 89
Approved National Highway Freight Network (NHFN) .................................................................... 89
Proposed Additions to NHFN .......................................................................................................... 90
New Jersey Highway Freight Network (NJ Access Network) ........................................................... 90
Highway Performance ....................................................................................................................... 94
Oversize/Overweight Vehicles ........................................................................................................ 107
Truck Parking .................................................................................................................................. 110
Maritime ............................................................................................................................................. 115
Northern New Jersey ...................................................................................................................... 118
Southern New Jersey ...................................................................................................................... 123
Philadelphia Region Ports ............................................................................................................... 125
Rail ...................................................................................................................................................... 126
Existing Freight Rail Network and Context ..................................................................................... 126
Existing Operating Context ............................................................................................................ 130
Rail Performance: Obstacles to Efficient and Modern Freight Rail Service in New Jersey ............. 132
Existing Rail Constraints .................................................................................................................. 137
Project Descriptions by Group ........................................................................................................ 141
Air ....................................................................................................................................................... 146
Newark Liberty International Airport .............................................................................................. 146
Other New Jersey Airports ............................................................................................................. 150
5 - Innovative Technologies and Strategies ............................................................................ 151
Funding and Financing Program Trends ............................................................................................ 151
Emerging Trends ................................................................................................................................ 152
Connected and Automated/Autonomous Vehicles ........................................................................ 152
Truck Platoons ................................................................................................................................ 154
Intelligent Transportation Systems ................................................................................................. 156
Intermodal Rail Developments ....................................................................................................... 157
Warehouse Location and Automation ............................................................................................ 159
Retail Home Delivery ...................................................................................................................... 161
Supply Chain Sourcing ................................................................................................................... 165
3D Printing ...................................................................................................................................... 168

Table of CONTENTS
v
6 - Priority Projects .................................................................................................................. 171
Highway Priority Projects .................................................................................................................... 171
Project List Development ............................................................................................................... 172
Highway Project Prioritization ......................................................................................................... 173
Rail Priority Projects ............................................................................................................................ 188
Evaluation Methodology ................................................................................................................ 188
Prioritization .................................................................................................................................... 189
Planning Projects to be Advanced ..................................................................................................... 194
I-295 Freight Interchanges .............................................................................................................. 194
NJ 55 at NJ 47 Interchange ............................................................................................................ 194
FRIO Concept Development – HX Draw Bridge ............................................................................ 195
North-South Rail Connector ........................................................................................................... 195
Other Regional Initiatives ................................................................................................................... 196
Freight Advisory Committee (FAC) ................................................................................................. 196
Truck Parking Investments .............................................................................................................. 196
Freight Incorporation into Capital Program NJDOT ...................................................................... 196
Municipal/County Outreach ........................................................................................................... 197
Moving New Jersey Forward .............................................................................................................. 197
7 - Investment Plan .................................................................................................................. 199
New Jersey Statewide Transportation Improvement Program .............................................................. 199
Federal Transportation Funding ......................................................................................................... 201
TIGER Grants .................................................................................................................................. 202
National Highway Performance Program (NHPP) ........................................................................... 203
National Highway Freight Program (NHFP) .................................................................................... 204
Surface Transportation Program (STP)/ Surface Transportation Block Grant Program (STBG) ....... 208
Congestion Mitigation and Air Quality Improvement Program (CMAQ) ........................................ 209
Highway Safety Improvement Program (HSIP) ............................................................................... 210
Railway Highway Crossings Program .............................................................................................. 210
State Funding ..................................................................................................................................... 210
Transportation Trust Fund .............................................................................................................. 210
Local Aid ............................................................................................................................................. 212
Other Sources .................................................................................................................................... 212
New Jersey Statewide FREIGHT PLAN
vi
Use of Funds ....................................................................................................................................... 213
Use of Funds - DVRPC .................................................................................................................... 213
Use of Funds - NJTPA ..................................................................................................................... 216
Use of Funds - SJTPO ..................................................................................................................... 218
Use of Funds – Statewide ............................................................................................................... 218
Appendices Appendix A – Outreach Materials
Appendix B – CUFC/CRFC Corridors
Appendix C – Highway Problem Areas
Appendix D – BTS Port Profiles
Appendix E – STIP Projects Identified as Problem Areas/Bottlenecks
Appendix F – Funding for STIP Projects
Appendix G – Study and Development Projects

Table of CONTENTS
vii
List of Figures Figure 1: New Jersey Freight Advisory Committee ............................................................................................................. 4 Figure 2: Share of Tons and Value by State-to-State Direction ........................................................................................ 23 Figure 3: Origin States for Inbound Tons ............................................................................................................................ 24 Figure 4: Origin States for Inbound Value ........................................................................................................................... 24 Figure 5: Destination States for Outbound Tons ............................................................................................................... 25 Figure 6: Destination States for Outbound Value .............................................................................................................. 25 Figure 7: Trade Partner Regions for Imports and Exports via New Jersey Gateways ..................................................... 26 Figure 8: Tons and Shares by Commodity .......................................................................................................................... 27 Figure 9: Tons by Commodity and Direction ...................................................................................................................... 28 Figure 10: Tons by Commodity and Trade Type ................................................................................................................ 28 Figure 11: Tons by Commodity and State-to-State Mode ................................................................................................ 29 Figure 12: Value by Commodity and Direction .................................................................................................................. 30 Figure 13: Value by Commodity and Trade Type ............................................................................................................... 31 Figure 14: Value by Commodity and State-to-State Mode ............................................................................................... 32 Figure 15: Share of Tons and Value by State-to-State Mode ............................................................................................ 33 Figure 16: Leading Tonnage Commodities, State-to-State Truck .................................................................................... 34 Figure 17: Origin (left) and Destination (right) States for NJ Truck Tons ......................................................................... 34 Figure 18: Leading Tonnage Commodities, State-to-State Rail ....................................................................................... 35 Figure 19: Origin (left) and Destination (right) States for NJ Rail Tons ............................................................................ 35 Figure 20: Leading Tonnage Commodities, State-to-State Water ................................................................................... 36 Figure 21: Origin (left) and Destination (right) States for NJ Water Tons ........................................................................ 36 Figure 22: Leading Tonnage Commodities, State-to-State Air ........................................................................................ 37 Figure 23: Origin (left) and Destination (right) States for NJ Air Tons .............................................................................. 37 Figure 24: Leading Tonnage Commodities, State-to-State Multiple Modes .................................................................. 38 Figure 25: Origin (left) and Destination (right) States for NJ Multiple Modes Tons ....................................................... 38 Figure 26: Leading Tonnage Commodities, State-to-State Pipeline ............................................................................... 39 Figure 27: Origin (left) and Destination (right) States for NJ Pipeline Tons ..................................................................... 39 Figure 28: Leading Import Commodities by Tons and International Mode .................................................................... 41 Figure 29: Leading Import Commodities by Value and International Mode ................................................................... 41 Figure 30: Leading Export Commodities by Tons and International Mode .................................................................... 42 Figure 31: Leading Export Commodities by Value and International Mode ................................................................... 43 Figure 32: New Jersey Freight Nonfarm Employment by County, Q1 2017 .................................................................... 53 Figure 33: Durable and Nondurable Consumer Goods Supply Chain ............................................................................. 57 Figure 34: Business Establishments (Machinery, Electronics, and Transportation Equipment Sectors), 2012 ........................ 58 Figure 35: Business Establishments (Furniture and Fixtures Sector), 2012 ...................................................................... 59 Figure 36: Annual Truck Ton Flows of Machinery, Electronics, and Transportation Equipment, 2007 and 2035 .................... 61 Figure 37: Annual Truck Ton Flows of Furniture and Fixtures, 2007 and 2035 ................................................................ 62 Figure 38: Business Establishments (Food-related Sectors), 2012 .................................................................................... 64 Figure 39: Business Establishments (Textiles and Apparel Sectors), 2012 ....................................................................... 65 Figure 40: Business Establishments (Paper and Printed Materials Sectors), 2012 ........................................................... 66 Figure 41: Annual Truck Ton Flows of Food Commodities, 2007 and 2035 .................................................................... 68 Figure 42: Annual Truck Ton Flows of Textiles and Apparel, 2007 and 2035 .................................................................. 69 Figure 43: Annual Truck Ton Flows of Paper and Printed Materials, 2007 and 2035 ...................................................... 70 Figure 44: Construction Materials Supply Chain ................................................................................................................ 71 Figure 45: Business Establishments (Construction Materials Sectors), 2012 .................................................................... 72 Figure 46: Annual Truck Ton Flows of Construction Materials, 2007 and 2035 ............................................................... 73 Figure 47: Energy and Chemicals Supply Chain ................................................................................................................. 74 Figure 48: Business Establishments (Energy Sector), 2012 ................................................................................................ 75 Figure 49: Business Establishments (Chemicals Sector), 2012 .......................................................................................... 76 Figure 50: Business Establishments (Pharmaceuticals Sector), 2012 ................................................................................ 77 Figure 51: Annual Truck Ton Flows of Energy Products, 2007 and 2035 .......................................................................... 79 Figure 52: Annual Truck Ton Flows of Chemicals, 2007 and 2035 .................................................................................... 80 Figure 53: Annual Truck Ton Flows of Pharmaceuticals, 2007 and 2035 .......................................................................... 81

New Jersey Statewide FREIGHT PLAN
viii
Figure 54: Distribution Traffic Supply Chain ....................................................................................................................... 82 Figure 55: Business Establishments (Distribution Sectors), 2012 ...................................................................................... 83 Figure 56: Annual Truck Ton Flows of Distribution Traffic, 2007 and 2035 ...................................................................... 84 Figure 57: Waste Supply Chain ............................................................................................................................................ 85 Figure 58: Business Establishments (Waste Sectors), 2012 ................................................................................................ 86 Figure 59: Annual Truck Ton Flows of Waste, 2007 and 2035 ........................................................................................... 87 Figure 60: Existing and Proposed Highway Freight Network ........................................................................................... 91 Figure 61: Identified CUFC/CRFC Candidate Locations ................................................................................................... 93 Figure 62: Planning Truck Travel Time Index – Interstates (AM Peak Period) ................................................................. 96 Figure 63: Planning Truck Travel Time Index – Non-Interstates (AM Peak Period) ......................................................... 97 Figure 64: Average Truck Travel Speeds –Interstates (AM Peak Period) ......................................................................... 99 Figure 65: Average Truck Travel Speeds –Non-Interstates (AM Peak Period) .............................................................. 100 Figure 66: Truck Crash Density (2006 – 2015) – Interstates .............................................................................................. 101 Figure 67: Truck Crash Density (2006 – 2015)– Non-Interstates ...................................................................................... 102 Figure 68: Highway Problem Areas/Bottlenecks – DVRPC Region ................................................................................. 103 Figure 69: Highway Problem Areas/Bottlenecks – NJTPA Region ................................................................................. 104 Figure 70: Highway Problem Areas/Bottlenecks – NJTPA Region (Northeast Region) ................................................ 105 Figure 71: Highway Problem Areas/Bottlenecks – SJTPO Region ................................................................................. 106 Figure 72: Overweight Permits (2014-2016) with Identified Problem Areas/Bottlenecks ............................................. 109 Figure 73: Truck Parking Areas in New Jersey .................................................................................................................. 112 Figure 74: New Jersey’s Marine Freight Network ............................................................................................................ 117 Figure 75: Port of New York and New Jersey Terminals .................................................................................................. 120 Figure 76: Harbor Deepening at the Port of New York and New Jersey ....................................................................... 121 Figure 77: Port of New York and New Jersey Rail Connections ..................................................................................... 122 Figure 78: New Jersey’s Rail Network ................................................................................................................................ 127 Figure 79: New Jersey Population (1900-2030) ................................................................................................................. 131 Figure 80: Air Cargo and Mail Trends at EWR .................................................................................................................. 147 Figure 81: OTTO Budweiser Driverless Delivery .............................................................................................................. 152 Figure 82: Top Ten Trucking Issues and Autonomous Truck Benefits ........................................................................... 153 Figure 83: Government Impediments to Autonomous Truck Deployment ................................................................... 154 Figure 84: Volvo Truck Platoon ........................................................................................................................................... 155 Figure 85: Major US Rail Intermodal Terminals ................................................................................................................ 158 Figure 86: Domestic Intermodal Growth Outstrips International ................................................................................... 158 Figure 87: Proliferation of Distribution Centers ................................................................................................................ 160 Figure 88: Products Purchased for Delivery in Past 12 Months ....................................................................................... 162 Figure 89: Natural Gas Surpasses Coal for Electricity Generation.................................................................................. 167 Figure 90: Natural Gas-Derived Feedstocks in Manufacturing ....................................................................................... 167 Figure 91: Product Suitability for 3D Printing ....................................................................................................................... 168 Figure 92: Priority Highway Locations – DVRPC Region .................................................................................................. 175 Figure 93: Priority Highway Locations – NJTPA Region .................................................................................................. 178 Figure 94: Priority Highway Locations – NJTPA Region (Northeast Area) ..................................................................... 179 Figure 95: Priority Highway Locations – SJTPO Region ................................................................................................... 186 Figure 96: Rail Priority Projects ........................................................................................................................................... 190 Figure 97: FY 2016 NJ Transportation Capital Program .................................................................................................. 200 Figure 98: Current NHFP-Funded Projects ....................................................................................................................... 206 Figure 99: Transportation Trust Fund Financing .............................................................................................................. 211 Figure 100: DVRPC Funding Sources ................................................................................................................................. 214 Figure 101: NJTPA Funding Sources ................................................................................................................................. 216

Table of CONTENTS
ix
List of Tables Table 1: Comparison to National Goals .......................................................................................................... 19 Table 2: Tons and Value by State-to-State Direction ..................................................................................... 22 Table 3: Tons and Value by Trade Type .......................................................................................................... 26 Table 4: Tons and Value by State-to-State Mode ........................................................................................... 33 Table 5:: Import Tons and Value by International Mode ............................................................................... 40 Table 6: Export Tons and Value by International Mode ................................................................................. 42 Table 7:: New Jersey vs. National Totals: Trade Type .................................................................................... 43 Table 8:: New Jersey vs. National Totals: Modal Utilization .......................................................................... 44 Table 9:: New Jersey vs. National Totals: Commodities (Ranked by Share of Value) .................................. 45 Table 10:: Forecast Tons by Direction ............................................................................................................. 47 Table 11:: Forecast Tons by Trade Type ......................................................................................................... 47 Table 12:: Forecast Tons by State-to-State Mode .......................................................................................... 47 Table 13:: Forecast Tons by Commodity Group ............................................................................................. 48 Table 14: Forecast Value by Commodity Group ............................................................................................. 49 Table 15: New Jersey Freight Industry GDP and Growth .............................................................................. 51 Table 16: New Jersey Freight Industry GDP and Growth Shares .................................................................. 52 Table 17: New Jersey Industry Sectors Linked to Commodity Groups ......................................................... 55 Table 18: Targeted Problem Areas (Greater than 5,000 Overweight Permits Issued, 2014-2016) ............ 107 Table 19: Northern New Jersey Ports’ Waterborne Imports in 2015 ........................................................... 118 Table 20: Northern New Jersey Ports’ Waterborne Exports in 2015 ........................................................... 119 Table 21: Southern New Jersey Ports’ Waterborne Exports in 2015 ........................................................... 123 Table 22: Philadelphia Area Ports’ Waterborne Imports in 2015 ................................................................. 125 Table 23: Philadelphia Area Ports’ Waterborne Exports in 2015 ................................................................. 125 Table 24: Railroad Miles, Ownership, and Trackage Rights in New Jersey ................................................ 128 Table 25: Summary of Freight Operators and Mileage in New Jersey ....................................................... 128 Table 26: Freight Service Operating on NJ TRANSIT-owned Lines ............................................................ 130 Table 27: Rail Constraint Matrix ..................................................................................................................... 138 Table 28: Air Cargo and Mail Trends at EWR ............................................................................................... 146 Table 29: Air Cargo by Origin and Carrier – Destined to EWR ................................................................... 148 Table 30: Air Cargo by Destination and Carrier – Originating at EWR ....................................................... 149 Table 31: Air Cargo by Origin/Destination and Carrier – ACY .................................................................... 150 Table 32: Highway Project Areas, By County and MPO ............................................................................... 173 Table 33: Priority Scoring Matrix .................................................................................................................... 174 Table 34: DVRPC 1st Tier Priority Locations .................................................................................................. 176 Table 35: DVRPC 2nd Tier Priority Locations ................................................................................................ 176 Table 36: DVRPC 3rd Tier Priority Locations ................................................................................................. 177 Table 37: NJTPA 1st Tier Priority Locations .................................................................................................. 180 Table 38: NJTPA 2nd Tier Priority Locations ................................................................................................. 182 Table 39: NJTPA 3rd Tier Priority Locations .................................................................................................. 184 Table 40: SJTPO 1st Tier Priority Locations ................................................................................................... 187 Table 41: SJTPO 2nd Tier Priority Locations ................................................................................................. 187 Table 42: SJTPO 3rd Tier Priority Locations .................................................................................................. 187 Table 43: Rail Project Scoring Matrix ............................................................................................................. 189 Table 44: Rail Constraints – Project Prioritization – 1st Tier ......................................................................... 191

New Jersey Statewide FREIGHT PLAN
x
Table 45: Rail Constraints – Project Prioritization – 2nd Tier ....................................................................... 192 Table 46: Rail Constraints – Project Prioritization – 3rd Tier ........................................................................ 193 Table 47: Identified Planning Projects ........................................................................................................... 194 Table 48: NHFP Apportionments for New Jersey and Fiscally Constrained Projects………………………208 Table 49: Local Aid Distribution (FY 2017-2024) ........................................................................................... 212 Table 50: DVRPC Funding Sources ................................................................................................................ 214 Table 51: STIP Projects along Freight Project Areas, DVRPC ...................................................................... 215 Table 52: NJTPA Funding Sources ................................................................................................................ 216 Table 53: STIP Projects along Freight Project Areas, NJTPA ...................................................................... 217 Table 54: SJTPO Funding Sources ................................................................................................................. 218 Table 55: STIP Projects along Freight Project Areas, SJTPO ....................................................................... 218

Table of CONTENTS
xi
List of Acronyms and Abbreviations AAR - Association of American Railroads AASHTO - American Association of State Highway and Transportation Officials ACY - Atlantic City Airport ADA - Americans with Disabilities Act ADHS - Appalachian Development Highway System AIAG - Agency and Industry Advisory Group AMH - America's Marine Highway AT - Autonomous Truck ATRI - American Transportation Research Institute BEAs - Business Economic Areas BTS - Bureau of Transportation Statistics CAGR - Compound Annual Growth Rate ConnDOT - Connecticut Department of Transportation CFS - Commodity Flow Survey CMAQ - Congestion Mitigation and Air Quality Improvement Program CMS - Congestion Management System CRFC - Critical Rural Freight Corridor CUFC - Critical Urban Freight Corridor DC - Distribution Center DRBA - Delaware River and Bay Authority DRJTBC - Delaware River Joint Toll Bridge Commission DRPA - Delaware River Port Authority DVRPC - Delaware Valley Regional Planning Commission EB/WB - Eastbound/Westbound ECMHI - East Coast Marine Highway Initiative ECMHIAA - East Coast Marine Highway Initiative Awarding Authority EIS - Environmental Impact Statement ELD - Electronic Logging Devices FAC - Freight Advisory Committee FAF - Freight Analysis Framework FAST Act - Fixing America's Surface Transportation Act FASTLANE - Fostering Advancements in Shipping and Transportation for the Long-term Achievement of National Efficiencies FHWA - Federal Highway Administration FIP - Freight Investment Plan FMCSA - Federal Motor Carrier Safety Administration FMS - Freight Management System FQ - Freight Quotient FRA - Federal Railroad Administration FRIO - Freight Rail Industrial Opportunity FTA - Federal Transit Administration FY - Fiscal Year G-MAP - Goods Movement Action Program GDP - Gross Domestic Product GIS – Geographic Information System GPS - Global Positioning System HBP - Highway Bridge Program HOS - Hours of Service HSIP - Highway Safety Improvement Program IANA - Intermodal Association of North America ICTF - Intermodal Container Transfer Facility INFRA - Infrastructure for Rebuilding America
New Jersey Statewide FREIGHT PLAN
xii
ITE - Institute of Transportation Engineers ITS - Intelligent Transportation System LRTP - Long Range Transportation Plan LTL - Less-Than-Truckload LVPC - Lehigh Valley Planning Commission MAP - Metropolitan Area Planning Forum MAP-21 - Moving Ahead for Progress in the 21st Century Act MAPONY/NJ - Maritime Association of the Port of New York and New Jersey MARAD - U.S. Maritime Administration MDOT - Maryland Department of Transportation MDTA - Maryland Transportation Authority MPO - Metropolitan Planning Organization NAAQS - National Ambient Air Quality Standards NAICS – North American Industry Classification System NAIOP - National Association for Industrial and Office Parks NB/SB - Northbound/Southbound NEC - North East Corridor NEPA - National Environmental Policy Act NHFN - National Highway Freight Network NHFP - National Highway Freight Program NHPP - National Highway Performance Program NHS - National Highway System NJCL - North Jersey Coast Line NJDEP - New Jersey Department of Environmental Protection NJDOT - New Jersey Department of Transportation NJMTA - New Jersey Motor Truck Association NJTA - New Jersey Turnpike Authority NJTPA - North Jersey Transportation Planning Authority NMFN - National Multimodal Freight Network NPMRDS - National Performance Management Research Data Set NYMTC - New York Metropolitan Transportation Council NYNJR - New York New Jersey Rail LLC NYS&W - New York, Susquehanna, and Western Railway NYSDOT - New York State Department of Transportation OMR – NJDOT Office of Maritime Resources OS - Oversize OW - Overweight P3 - Public-Private Partnerships PABs - Private-Activity Bonds PANYNJ - Port Authority of New York and New Jersey PATCO - Port Authority Transit Corporation PATH - Port Authority Trans-Hudson PennDOT - Pennsylvania Department of Transportation PFN - Primary Freight Network PHFS - Primary Highway Freight System PICGIP - Pennsylvania Intermodal Cargo Growth Incentive Program PONYNJ - The Port of New York and New Jersey PPFSP - Port Performance Freight Statistics Program PRIIA legislation - Passenger Rail Investment and Improvement Act of 2008 PTC - Positive Train Control QCEW - Quarterly Census of Employment and Workforce RFAP - Rail Freight Assistance Program SAFETEA-LU - Safe, Accountable, Flexible, Efficient, Transportation Equity Act- A legacy for Users

Table of CONTENTS
xiii
SCTG - Standard Classification of Transported Goods SDF - State Dedicated Highway and Bridge Trust Fund SDRP - State Development and Redevelopment Plan SEP-15 Program - Special Experimental Project number 15 SEPTA - Southern Pennsylvania Transportation Authority SF - Square Feet SIC – Standard Industrial Classification SJPC - South Jersey Port Corporation SJTA - South Jersey Transportation Authority SJTPO - South Jersey Transportation Planning Organization SMS - Safety Management System SOGR - State of Good Repair STBG - Surface Transportation Block Grant Program STIP - Statewide Transportation Improvement Program STP - Surface Transportation Program TCAM - Transportation Clean Air Measures TIFIA - Transportation Infrastructure Finance and Innovation Act TIGER - Transportation Investment Generating Economic Recovery Grants TIP - Transportation Improvement Program TMA - Transportation Management Area TTF - Transportation Trust Fund TTFA - Transportation Trust Fund Authority TTN - Trenton-Mercer Airport TTTI - Truck Travel Time Index UPS - United Parcel Service USACE - U.S. Army Corps of Engineers USDOT - U.S. Department of Transportation USEIA - U.S. Energy Information Administration USPS - United States Postal Service VDOT - Virginia Department of Transportation WILMAPCO - Wilmington Area Planning Council

New Jersey Statewide FREIGHT PLAN
xiv
Page left blank intentionally.

Chapter 1: INTRODUCTION
1
INTRODUCTION Over the last decade, freight issues, needs, and trends have evolved at all levels of the industry, from local to global perspectives. Shifts in the policy, legislative, and regulatory
context (locally and nationally) have impacted transportation investment and freight logistics strategies. Developments in innovative technologies and programs have led to new industries, tools and opportunities to move freight more efficiently and economically. Growth in different sectors of the economy has led to changes in consumer demand that impact goods movement patterns. New transportation and freight facilities, including the raising of the Bayonne Bridge roadway to accommodate larger container ships, have and will continue to affect freight delivery choices and operations. This Plan presents a comprehensive framework to address these challenges and opportunities, improve New Jersey’s freight transportation system, and strengthen the State’s economic competitiveness.
This Plan provides an update to the State’s first freight plan completed in 2007. The 2007 Plan provided a broad overview of the critical role that freight plays in the state’s economy, as well as a summary of each freight mode and the linkages between them. This update continues that discussion while also leveraging opportunities afforded by new Federal legislation, including the development of a fiscally constrained freight investment plan.
Plan Background This Plan is structured to meet the requirements of the Fixing America’s Surface Transportation (FAST) Act and, as applicable, MAP-21. It is multimodal in nature and includes the diverse components of New Jersey’s massive freight system: highways; rail lines; intermodal facilities; air cargo transportation; and marine highways and waterways. The Plan also considers distribution and warehouse facilities, which are critical elements of the supply chain and have a significant national presence in New Jersey. The analyses and recommendations pertaining to the multimodal freight system in New Jersey align with the National Multimodal Freight Network (NMFN) as outlined in the FAST Act.
This Plan provides the New Jersey Department of Transportation (NJDOT) with updated information and data to address current and near term state of good repair improvements as well as a plan for mid-term needs and efficient long-term system growth. While the 2007 Freight Plan provided a framework of New Jersey’s intertwined freight transportation network, this Plan provides a well-defined blueprint for NJDOT investment, identifying discrete projects that immediately address critical freight system improvements.
It provides a fiscally constrained Freight Investment Plan (FIP) that identifies and prioritizes freight-related transportation projects. Through its compliance with the FAST Act, the Plan opens New Jersey to new freight-specific federal funding opportunities and enhances its ability to acquire competitive grant resources.
In linking with Federal policy guidance, this Plan:
Documents the existing multimodal freight transportation system in New Jersey including facilities, service levels and commodity flows (Chapters 3 and 4)

New Jersey Statewide FREIGHT PLAN
2
Identifies significant trends in regional, statewide, national and international freight transportation and the implications for New Jersey (Chapter 3)
Identifies existing and emerging shipper and carrier issues, needs, concerns and policies as related to key industries in New Jersey (Chapter 3)
Identifies freight bottlenecks (problem areas) that hinder access to local, regional, state, national and international markets (Chapter 4)
Identifies current and near term safety issues across the multimodal freight transportation system (Chapter 4)
Considers the incorporation of Intelligent Transportation Systems (ITS) and other emerging relevant technologies into the safe and efficient movement of freight (Chapter 5)
Considers the incorporation of freight truck parking into the safe and efficient movement of freight. (Chapters 4 and 6)
Recommends an approach for fully incorporating freight movement considerations into transportation planning as well as all phases of project development (Chapter 6)
Federal Legislation The FAST Act of 2015 is a five-year, $305 billion transportation bill that provides funding for the nation’s transportation planning and infrastructure investments. The FAST Act includes several provisions specifically geared to improving the performance of the NHFN and supporting investment in freight-related surface transportation projects. At the national level, this includes the development of a National Multimodal Freight Policy, National Freight Strategic Plan, and designation of the National Multimodal Freight Network (NMFN). On the funding side, it also includes $6.3 billion in formula funding for freight projects on the NHFN and a $4.5 billion discretionary, freight-focused grant program for states, metropolitan planning organizations (MPOs), local governments, and other entities.
Freight and the New Jersey Economy The freight transportation system is a fundamental underpinning of New Jersey’s economy. It connects raw materials to industry, goods to markets, and people to jobs. The State’s transportation network delivers goods to the doorstep of its residents from local airports and marine ports, suppliers and distribution centers from within New Jersey and around the country, and west coast marine terminals. It serves the needs of local deliveries, regional goods movement, and national and international trade. New Jersey is an enormous market with millions of consumers, and its geographic location uniquely positions the State as a critical link in the national freight network. New Jersey’s highways, rail lines, airports and marine ports provide direct access to the major metropolitan markets of New York City and Philadelphia, and are a gateway to global markets, linking North American markets to the rest of the world.
In 2013, freight in New Jersey directly supported 260,000 jobs (1 in 15 jobs statewide) and generated $8.5 billion in gross personal income. In addition, the freight industry indirectly supports millions of jobs in other sectors of the economy, including: more than 400,000 jobs in retail and wholesale, 300,000 jobs in transportation, 185,000 jobs in manufacturing, and more than 100,000 jobs in construction. Collectively, these industries alone account

Chapter 1: INTRODUCTION
3
for approximately 25% of all employment in New Jersey. “Freight-Dependent” industries represent over 28% of New Jersey’s total GDP.1
Freight transportation, logistics and distribution operations together represent the largest employment source in New Jersey. With over 1 billion square feet of industrial property, the US east coast’s largest port (Port Newark-Elizabeth Marine Terminal), the nation’s 11th largest cargo airport (Newark Liberty International Airport) and extensive roadway and rail systems, freight moves New Jersey’s economy.
Each year, over 500 million tons of freight moves into, out of, within, and through New Jersey by truck, train, plane, pipeline, and/or ship. Each mode, and the interconnections between modes, are critical to maintaining an efficient freight transportation system.
Recurring congestion, aging and outmoded infrastructure, and the need to adapt legacy infrastructure for 21st century freight needs impact transportation system reliability, travel times, and the ability to make on-time deliveries. Ultimately this increases the cost of freight movement across all modes, resulting in reduced efficiency and competiveness, lost time, and higher consumer costs. Rising congestion-related costs are an issue impacting supply chains nationwide, and are particularly problematic in New Jersey. In 2015, congestion cost New Jersey’s trucking industry approximately $3 billion dollars, making it the fifth most impacted state in the nation. Viewed in terms of cost per mile of the National Highway System, New Jersey ranked second at nearly $500,000 per mile (the District of Columbia ranks first at nearly $1.2 million per mile). Small changes in congestion and delay can propagate across the supply chain, creating large impacts on a firm or industry. For example, a five-minute delay for each United Parcel Service (UPS) vehicle, every day, costs the company approximately $105 million in additional operating costs.2
The economic impact of inefficiencies and deficiencies in the freight transportation system underscore the need for targeted infrastructure investments, which are vital to retaining New Jersey’s economic competitiveness and supporting jobs and industries across the State.
New Jersey Freight Advisory Committee NJDOT convened the New Jersey Freight Advisory Committee (FAC) to help guide the development of a comprehensive and integrated Statewide Freight Plan. The FAC members reflect the diverse range of stakeholders that own, operate, plan, maintain, and conduct business utilizing New Jersey’s freight infrastructure. Its members include many of the organizations summarized in the below section and include both the public and private sectors. The FAC also includes partners from several neighboring states and multi-state organizations, facilitating the integration of insights, issues, and initiatives from other jurisdictions and a more unified, regional approach to the planning process. Organizations participating in the FAC are illustrated in Figure 1 and summarized below.
The FAC formally met six times during the Freight Plan effort to provide invaluable input to the Plan development, representing the numerous interests that function in New Jersey’s goods movement industry. Meeting slide decks are included in Appendix A.
In addition to the formal FAC meetings, several other forums were used to provide outreach to interested stakeholders. Formal presentations were made to NJTPA’s Freight Initiatives Committee and DVRPC’s Goods Movement Task Force. Further, the project team conducted a webinar in June 2017 that provided
1 Analysis of US Department of Commerce data 2 American Transportation Research Institute, Cost of Congestion to the Trucking Industry: 2017 Update, May 2017

New Jersey Statewide FREIGHT PLAN
4
county and municipal officials with a summary of project efforts and planned outcomes. Finally, the MPOs coordinated with their member counties and municipalities to gain input on key freight needs and issues as well as seek input on projects and priorities within their respective regions.
Figure 1: New Jersey Freight Advisory Committee
Members of the Freight Advisory Committee
Core Freight Stakeholders Federal Highway Administration (FHWA): provides guidance and direction to State DOTs that are
planning, developing, and maintaining State Freight Plans, and oversees coordination of state-efforts with national policy. Additionally, the FHWA helps prioritize funding for multimodal transportation capital investments.
New Jersey Department of Transportation (NJDOT): public transportation agency with jurisdiction over freight-related infrastructure and activity throughout the State; one of the three Goods-Movement Action Program (G-MAP) founding partner-agencies, along with New York State Department of Transportation and the Port Authority of New York and New Jersey. A more in depth explanation of G-MAP is provided on page 19.
Port Authority of New York and New Jersey (PANYNJ): bi-state authority that owns, builds, operates and maintains key transportation infrastructure critical to the New York/ New Jersey region’s trade and transportation network; it is one of the three G-MAP founding partner-agencies.

Chapter 1: INTRODUCTION
5
Metropolitan Planning Organizations Delaware Valley Regional Planning Commission (DVRPC): the MPO for the greater Philadelphia
region, covering counties in both New Jersey and Pennsylvania; is active in freight planning studies and guiding freight planning efforts across the region
North Jersey Transportation Planning Authority (NJTPA): the MPO for northern New Jersey; has produced freight-related planning studies, modeling tools, and activity profiles in support of freight development in the State
South Jersey Transportation Planning Organization (SJTPO): the MPO for southern portion of the State; it oversees transportation planning initiatives in Atlantic, Cape May, Cumberland, and Salem Counties
Bridge and Toll Commissions Delaware River Joint Toll Bridge Commission (DRJTBC): a bi-state public agency, which operates
and maintains 20 bridges over the Delaware River between Pennsylvania and New Jersey Delaware River Port Authority (DRPA): a bi-state agency overseeing transportation linkages
between New Jersey and Pennsylvania, including four bridges over the Delaware River near Philadelphia, ferry services, and the PATCO passenger rail service.
New Jersey Turnpike Authority: an autonomous agency operates and maintains the New Jersey Turnpike and the Garden State Parkway, including bridge structures on the two roadways
South Jersey Transportation Authority (SJTA): a public entity that oversees operation and maintenance of key transportation infrastructure in southern New Jersey, including the Atlantic City Expressway and Atlantic City International Airport
Rail Industry Conrail: a private rail operator, Conrail primarily functions as a switching and terminal railroad,
operating in northern and southern New Jersey and Philadelphia, owned by CSX and Norfolk Southern
CSX: a Class I railroad, which, along with Norfolk Southern, comprise all east-west freight railroad traffic east of the Mississippi River, as well as north-south freight railroad traffic along the I-95 corridor.
New York, Susquehanna, and Western Railway (NYS&W): private rail operator whose rail line covers portions of New Jersey, New York, and Pennsylvania; distributes bulk supplies and materials for customers throughout the three states.
New Jersey Short Line Railroad Association: comprised of railroads serving the State of New Jersey, with the purpose of addressing issues facing short line railroads through collective efforts and cooperation
NJ TRANSIT: a state agency, NJ TRANSIT provides the majority of rail passenger service in the State, as well as bus services. It coordinates with the NJDOT to oversee freight service operated over its rail lines
Norfolk Southern: a Class I railroad, which, along with CSX, comprise all east-west freight railroad traffic east of the Mississippi River, as well as north-south connections to the southeastern United States
Maritime Industry New York Shipping Association: represents terminal operators, ocean carriers, stevedores, and
marine related businesses operating in the Port of New York and New Jersey.

New Jersey Statewide FREIGHT PLAN
6
NY/NJ Foreign Freight Forwarders/Brokers: represents ocean transportation intermediaries; provides input and facilitates discussion on policy and regulatory decision-making that impacts international trade
South Jersey Port Corporation: operates marine shipping terminals in the South Jersey Port District Tug & Barge Committee - Port of NY/NJ: includes tug boat operators and harbor carriers who
are corporate members of the Maritime Association of the Port of New York and New Jersey (MAPONY/NJ), with the goal of promoting and representing their interests in local issues relevant to the tug and barge industry in the Port of NY/NJ area
Trucking Industry Association of Bi-State Motor Carriers: represents trucking industry owners and operators,
dedicated to serving the needs of its members in intermodal transportation, especially at the Port of New York-New Jersey
New Jersey Motor Truck Association (NJMTA): represents the trucking community in New Jersey, with the purpose of promoting sound economical and efficient service by motor carrier transportation and fostering and supporting beneficial regulations affecting the motor industry
Freight Industry National Association for Industrial and Office Parks (NAIOP): represents developers, owners, and
related professionals in office, industrial and mixed-use real estate, who advocate for and contribute to infrastructure improvements that support commercial and industrial development. Efforts support economic and job growth in the State, and promotion of the State’s port regions
Partner Agencies New York State Department of Transportation (NYSDOT): oversees transportation operations in
New York State; one of the three G-MAP agencies Pennsylvania Department of Transportation (PennDOT): oversees transportation operations and
provides regulatory oversight for freight-related transportation and infrastructure across Pennsylvania
Current New Jersey Freight Initiatives and Agencies New Jersey has been proactive in freight planning initiatives, both within the state and in collaboration with regional partners. This requires coordination across intra-state agencies at all levels of government, as well as coordination with other jurisdictions. The following sections highlight the multitude of entities involved in freight planning and infrastructure in New Jersey, as well as recent and on-going freight planning activities. This diverse and long list of agencies and players in the goods movement illustrates one of the challenges to moving freight within New Jersey. Given the complex nature of many of these agencies, communication and coordination are key. The FAC, detailed above, is intended to continue to meet following the development of this plan to continue to foster open discussions about the needs and interests of New Jersey’s freight partners as well as coordinate the advancement of the freight initiatives contained in this Plan and of those from previous or ongoing studies that benefit the State.

Chapter 1: INTRODUCTION
7
New Jersey State Agencies A host of state agencies and authorities within New Jersey have jurisdiction over freight-related infrastructure and/or perform planning, operational, or regulatory activities that impact goods movement. Key state agencies and their responsibilities, as related to freight, are summarized below.
NJDOT The NJDOT is responsible for coordinating transportation activity for any State entities, State-created public authorities, as well as other public agencies with transportation responsibilities within New Jersey.
Freight planning activity encompasses all modes of freight distribution, including highway, rail, ports and air:
Highway: The NJDOT is responsible for enforcing safety initiatives and regulations, as applicable to the trucking industry. The Division of Multimodal Services oversees enforcement of oversize and overweight vehicles. Standards and procedures for truck operations are outlined in administrative code (N.J.A.C. 16:32).
Rail: The NJDOT has authority to plan, design, construct, equip, operate, improve and maintain – either directly or through contract with public or private entities – any rail facility intended to carry freight within the State or between New Jersey and other states. The Railroad Engineering and Safety Unit is responsible for reviews and programs that involve changes and improvements to any public rail crossings within the State, which are designed in compliance with Federal Railroad Administration (FRA) guidelines. The Bureau of Freight Services coordinates freight rail planning activities within the context of multi-modal freight and the participation of the private rail carriers. The Placarded Rail Car Safety Inspection Program works with the FRA to promote safe transportation of hazardous materials by rail, in compliance with federal regulations.
Ports: The Office of Maritime Resources (OMR) promotes coordination and cooperation between federal, state, regional and non-governmental entities. OMR provides planning and policy guidance regarding maritime issues to the Commissioner, Governor, and the Legislature, and is directly involved in the safety and facilitation of Harbor operations.
Air: Through the Bureau of Aeronautics, the NJDOT oversees airport facilities in the state, which include: public use airports, restricted use facilities, airstrips, heliports and balloon ports. Department responsibilities include promoting aviation safety, providing aviation grant information, and explaining regulations.
With regard to funding, the NJDOT prepares the Long Range Transportation Plan, the annual Capital Programming Documents, and the Capital Investment and Asset Management Strategies. The NJDOT’s Multimodal Services Division administers the New Jersey Rail Freight Assistance Program, which provides grants annually for rail improvements, primarily for short line railroads.
New Jersey Transit Corporation (NJ TRANSIT) NJ TRANSIT is a governmental agency which provides the majority of passenger rail and bus service within the State. It owns approximately 544 track miles. Commuter rail services are provided within New Jersey and to New York City and Philadelphia. Service within Rockland and Orange Counties, in New York state, is provided under contract to Metro-North Railroad. While NJ TRANSIT does not carry freight, it has agreements with several railroads allowing freight service to be operated over its lines. NJ TRANSIT also operates passenger service on freight rail-owned lines, notably Conrail Shared Asset’s Lehigh Line (Raritan Valley Line). NJ TRANSIT also leases a portion of the Norfolk Southern’s Washington Secondary Line.
New Jersey Statewide FREIGHT PLAN
8
NJ TRANSIT coordinates with NJDOT on numerous rail-related functions – such as safety; operations on assets shared between freight operations and passenger operations; funding, finance and capital programming.
In conjunction with NJDOT, NJ TRANSIT oversees the unified Transit Capital Program, funded by the NJ Transportation Trust Fund (TTF). NJ TRANSIT pays approximately $100 million a year to Amtrak for repair and infrastructure improvements, as mandated by the Passenger Rail Investment and Improvement Act (PRIIA) legislation of 2008.
New Jersey Department of Environmental Protection (NJDEP) The NJDEP plays a regulatory role in the freight industry by dictating standards for heavy trucks, locomotives, and marine vessels in order to meet emissions standards for criteria pollutants under the Clean Air Act. The NJDEP helps ensure compliance with the National Environmental Policy Act (NEPA), which stipulates that federal agencies must complete an analysis of environmental impacts for any project/action that includes federal funding or permitting.
New Jersey Turnpike Authority (NJTA) The Authority was created by legislation in 1949. It is governed by an eight-person Board of Commissioners, which are appointed by the Governor of New Jersey. The Authority is responsible for maintaining the New Jersey Turnpike and the Garden State Parkway (following the consolidation of the NJTA and New Jersey Highway Authority) to ensure safe and efficient movement of people and goods. Additionally, the Authority is accountable for inspection and maintenance of more than 1,000 bridge structures on the Turnpike and Parkway. Funding is secured through toll collections along the NJTA’s roadways.
South Jersey Transportation Authority (SJTA) The SJTA was established by the legislature in 1991 in order to manage transportation services for six counties – Atlantic, Camden, Cape May, Cumberland, Gloucester, and Salem – as well as the Atlantic City Expressway, Atlantic City International Airport terminal, and parking facilities in Atlantic City.
South Jersey Port Corporation (SJPC) This state-created corporation was formed in 1968 to operate marine shipping terminals in the South Jersey Port District, which includes: Burlington, Camden, Gloucester, Salem, Cumberland, Mercer and Cape May. It reports through the Department of Treasury to the Governor of New Jersey.
The SJPC oversees five marine shipping terminals, located in Camden, Paulsboro, and Salem, which provide access to the entire eastern seaboard via the Delaware River. This includes the following facilities: Joseph A. Balzano Marine Terminal, Broadway Marine Terminal, Broadway Terminal Pier 5, Paulsboro Marine Terminal, and Foreign Trade Zone Number 142 (Port of Salem/Millville Airport).
Regional Partners In addition to New Jersey agencies and authorities, New Jersey coordinates and collaborates with a variety of other organizations at all jurisdictional levels, ranging from federal agencies to inter-state authorities, metropolitan planning organizations, and local governments. The roles of these organizations, as they pertain to freight planning and operations in New Jersey, are summarized below.

Chapter 1: INTRODUCTION
9
Federal Government U.S. Department of Transportation (USDOT) The USDOT, specifically the Office of Freight Management and Operations, works in conjunction with other FHWA offices, state DOTs and MPOs to coordinate freight planning efforts. Agency responsibilities vary from policy and regulatory roles, to funding for capital projects.
The FAST Act has helped place an emphasis on surface transportation improvements and provides a dedicated source of federal funding for freight projects. The FAST Act created two new funding programs – the National Highway Freight Program and the Nationally Significant Freight and Highway Projects Program – which are the first programs solely dedicated to freight projects. The FAST Act outlines a National Multimodal Freight Policy, which established a National Highway Freight Program (NHFP), providing funding to be invested in freight projects on the National Highway Freight Network.
Federal Highway Administration (FHWA) The FHWA plays a vital role in ensuring that the USDOTs responsibilities are met, as outlined by FAST Act products and programs. The agency’s responsibilities include: providing guidance and direction to State DOTs planning, construction and maintenance of State Freight Plans; providing local planning and technical assistance; and helping prioritize funding for multimodal transportation capital investments.
Federal Railroad Administration (FRA) The FRA was created by the Department of Transportation Act in 1966, and its principal responsibility consists of ensuring safety in the nation’s rail infrastructure and operations. The FRA plays a regulatory role by developing rail safety policy, employing inspectors who help verify compliance with safety policies and standards, and overseeing railroad incident investigation.
Multi-State Organizations Burlington County Bridge Commission This bi-state commission was created by Burlington County’s Board of Chosen Freeholders through resolution in 1948. It is tasked with maintaining 8 bridges, including two crossings of the Delaware River: Tacony-Palmyra Bridge (NJ 73) and Burlington-Bristol Bridge (NJ 413).
Delaware River and Bay Authority (DRBA) The DRBA was created in 1962 and is managed by twelve commissioners – six from New Jersey and six from Delaware. The authority is tasked with overseeing transportation links between the two states. The DRBA operates the Delaware Memorial Bridge (I-295/U.S. 40), the Cape May-Lewes Ferry (U.S. 9), the Forts Ferry Crossing, the Salem County Business Center and two regional airports in New Jersey (Cape May Airport, Millville Airport).
Delaware River Joint Toll Bridge Commission (DRJTBC) The DRJTBC is a bi-state public agency, established in 1934 by legislation enacted by Pennsylvania and New Jersey. The DRJTBC has jurisdiction over a 140-mile segment of the Delaware River, from the Philadelphia/Bucks County, PA boundary northward to the New Jersey/New York state line. The Commission operates under a compact authorized by Congress, which empowers the Commission to administer, operate and maintain twenty bridges (7 toll and 13 non-toll) between the two states. This includes the following bridges that support freight traffic:3
Trenton-Morrisville Toll Bridge (U.S. 1) 3 Additional DRJTBC facilities not listed have weight, vertical clearance, or road deck width restrictions that limit or restrict circulation for most freight vehicles.

New Jersey Statewide FREIGHT PLAN
10
Scudder Falls Bridge (I-95) New Hope-Lambertville Toll (U.S. 202) Uhlerstown-Frenchtown (NJ 12) Upper Black Eddy-Milford Bridge Interstate 78 Toll Bridge (I-78) Easton-Phillipsburg Toll Bridge (U.S. 22) Portland-Columbia Toll Bridge (NJ 94) Delaware Water Gap Toll Bridge (I-80) Milford-Montague Toll Bridge. (U.S. 206)
Delaware River Port Authority (DRPA) The DRPA is a regional bi-state transportation agency New Jersey and Pennsylvania) that oversees operations of four bridges that cross the Delaware River between the two states in the Philadelphia metropolitan area:
Commodore Barry Bridge (U.S. 322/CR 536) Walt Whitman Bridge (I-76) Ben Franklin Bridge (I-676/U.S. 30) Betsy Ross Bridge (NJ 90)
Through the Port Authority Transit Corporation (PATCO), the DRPA also operates a transit line connecting Camden County, New Jersey and Center City Philadelphia. The DRPA is headed by a 16-member Board of Commissioners, eight from each state, each appointed by their respective governors. The authority is funded by tolls and operates without tax support.
The Port Authority of New York and New Jersey (PANYNJ) The Port Authority of New York & New Jersey was created in 1921 by a compact between the states of New York and New Jersey that was approved by the US Congress. The PANYNJ owns and operates a substantial amount of the NJ/NY region’s trade and transportation infrastructure network. The Port Authority is authorized to plan, develop, and operate facilities of transportation, economic development and world trade that help promote commerce in the Port District. This includes the following facilities in New Jersey:
Aviation: Newark Liberty International Airport, Teterboro Airport, Atlantic City International Airport4 Port of New York & New Jersey: Port Jersey-Port Authority Marine Terminal, Elizabeth-Port
Authority Marine Terminal, Port Newark ExpressRail: Intermodal rail system serving PANYNJ marine terminals. Port Authority Trans-Hudson (PATH) rail transit system: Journal Square Transportation Center Tunnels & Bridges: Bayonne Bridge (NJ 440), Goethals Bridge (I-278), George Washington
Bridge (I-95, U.S. 1/9, U.S. 46), Holland Tunnel (I-78, NJ 139), Lincoln Tunnel (NJ 495), Outerbridge Crossing (NJ 440)
Bus Terminals: Journal Square Transportation Center Real Estate & Development: Industrial Park at Elizabeth, The South Waterfront at Hoboken
The PANYNJ also maintains a 100% ownership stake in New York New Jersey Rail, LLC, which operates cross harbor rail car float service between Jersey City and Brooklyn.
4 PANYNJ has an agreement with SJTA to provide management services at Atlantic City International Airport.

Chapter 1: INTRODUCTION
11
Metropolitan Planning Organizations (MPOs) – New Jersey North Jersey Transportation Planning Authority (NJTPA) The NJTPA is a federally authorized MPO that oversees transportation improvement projects in the 13-county northern New Jersey region (Bergen, Hudson, Monmouth, Ocean, Somerset, Union, Essex, Hunterdon, Middlesex, Morris, Passaic, Sussex, and Warren). It provides support for freight planning projects on a regional level. Freight planning activity at the NJTPA is guided by the Freight Initiatives Committee, which holds meetings that serve as a forum for discussion of regional freight matters.
The NJTPA has developed extensive resources meant to provide guidance and to aid in freight planning efforts. The Authority has produced freight planning studies, developed freight modeling tools, has an on-line Freight Activity Locator tool, key commodity profiles, and compiled freight activity profiles by county. The agency is undertaking a Pilot Freight Concept Development Program effort that will lead to a process for advancing regional and local freight initiatives identified through planning studies. Through the Transportation Clean Air Measures (TCAM) Program, NJTPA works with partner agencies to develop transportation projects that will reduce harmful emissions and benefit air quality. Examples of freight projects funded through this program include drayage truck replacements at Port Newark-Elizabeth, diesel locomotive retrofits and new cargo handling equipment. The agency is also undertaking the Freight Rail Industrial Opportunity (FRIO) Corridors Program effort which addresses rail lines identified by industry as needing, but not currently having national rail freight standards in terms of loaded railcar weight and dimensions. NJTPA is additionally a member of the Council on Port Performance and routinely visits freight facilities as part of its subregional outreach program.
South Jersey Transportation Planning Organization (SJTPO) The SJTPO is the Metropolitan Planning Organization that covers Atlantic, Cape May, Cumberland and Salem Counties in southern New Jersey. It provides support and helps coordinate transportation efforts across southern portions of the State. In 2017, SJTPO is initiating a study to look at freight/rail intermodal linkages to the Port of Salem.
Delaware Valley River Planning Commission (DVRPC) DVRPC is a regional planning agency covering the greater Philadelphia metropolitan region. It provides coordinated regional planning guidance across nine counties in Pennsylvania and New Jersey, including Mercer, Burlington, Camden, and Gloucester Counties. DVRPC carries out extensive services and has produced numerous studies and resources intended to guide freight planning efforts. This includes the Long-Range Vision for Freight, a plan meant to facilitate the flow of freight, accommodate for future growth, and minimize adverse impacts on local communities and the environment. NJDOT collaborates and provides input to DVRPC studies, such as their Long-Range Vision for Freight (2010).
DVRPC’s freight advisory committee, the Delaware Valley Goods Movement Task Force, is co-chaired by PennDOT and DVRPC. This task-force is a joint public-private sector collaboration which allows the local freight community to participate in formulating regional policies, plans, and programs.
Metropolitan Planning Organizations (MPOs) – Neighboring States Lehigh Valley Planning Commission (LVPC) Located in Pennsylvania, the LVPC was formed by Lehigh and Northampton counties in 1961 to serve these counties, and the 62 municipalities in the Lehigh Valley, by organizing growth, development and redevelopment.
The Commission’s freight advisory committee was created to collaborate and determine ways to develop an efficient regional freight system and maximize the region’s goods movement capability. The advisory

New Jersey Statewide FREIGHT PLAN
12
committee meets on a quarterly basis and shares information and technology between public and private entities, to promote intermodal connectivity.
Wilmington Area Planning Council (WILMAPCO) WILMAPCO is the regional transportation planning agency for New Castle County, Delaware and Cecil County, Maryland. The WILMAPCO region generates and experiences a significant amount of freight movement, with 72 million tons of freight passing through each year. WILMAPCO’s Freight and Goods Movement technical advisory committee is tasked with overseeing freight planning efforts. The committee produces studies and disseminates information regarding freight activity in the region, to help guide freight development across the region.
New York Metropolitan Transportation Council (NYMTC) NYMTC is composed of county executives from the 10 counties the Council represents (the 5 boroughs of New York City plus Putnam, Westchester, Rockland, Suffolk, and Nassau Counties), and the heads of the New York City Department of City Planning, the New York City and New York State Departments of Transportation, the Metropolitan Transportation Authority (MTA), the PANYNJ, as well as other federal and regional transportation and environmental officials. It is the Metropolitan Planning Organization for New York City, Long Island and the lower Hudson Valley. It provides a forum for collaboration, to support freight planning projects on a regional level (NY-NJ-CT metropolitan region).
Neighboring State Agencies New York State Department of Transportation (NYSDOT) NYSDOT is responsible for coordinating development and operation of transportation facilities and services throughout the state of New York. With regards to freight-related activity, NYSDOT: administers a public safety program for railroads and motor carriers in intrastate commerce; directs regulation of freight carriers; and oversees matters relating to safe operation of bus, commuter railroads and subway systems, which are publicly funded through the Public Transportation Safety Board.
NYSDOT works with the Governor and Legislature to develop state transportation policies, including capital investment priorities. The FHWA provides a significant portion of funding for the NYSDOTs highway capital program. The NYSDOT has authority to select projects on the National Highway System and the National Highway Freight Program that are funded by the National Highway Performance Program. It also has authority to select projects for the State Dedicated Highway and Bridge Trust Fund (SDF) program, which provides funding for any State highway and the non-federal share of FHWA funded projects. Additionally, the NYSDOT has authority to provide funding through the Passenger and Freight Rail Assistance Program.
Pennsylvania Department of Transportation (PennDOT) PennDOT oversees numerous programs and policies affecting all transportation modes within Pennsylvania. It provides support for intermodal freight movement by providing planning, funding, and regulatory oversight for freight-related transportation and infrastructure. There are several institutions under the Department of Transportation which oversee these responsibilities. The Bureau of Maintenance and Operations houses the Central Permitting Office which handles permitting for over size and overweight vehicles. The Bureau of Rail Freight, Ports, and Waterways oversees maintenance of freight infrastructure and service, and assists with the integration of rail freight and other transportation modes.
PennDOT has a rail freight and ports program, which provides technical assistance and administers allocation of state funds. PennDOT is responsible for planning and carrying out several grant assistance

Chapter 1: INTRODUCTION
13
programs: the Rail Freight Assistance Program, the Rail Transportation Assistance Program, and the Pennsylvania Intermodal Cargo Growth Incentive Program (PICGIP). The intent of this funding is to preserve essential rail freight and ports, and to stimulate economic development through the generation of expanded freight and port service.
Local Governments Given that the state of New Jersey is a “home rule” state and that land use is governed by each of its 565 local municipalities, coordination is vital on a local level in the context of freight movement. This coordination extends further to each of New Jersey’s 21 counties. Understanding the public’s view of freight is a crucial element to understanding the challenges that complicate integration of freight related land development and improvements in accessibility and operational efficiency on the road rail, and waterway networks.
Previous New Jersey Freight Plans and Studies This New Jersey State Freight Plan is the fifth in a series of state-level freight planning efforts led by NJDOT over the past ten years. This plan builds upon these previous efforts, seeking to provide an updated snapshot of current conditions and integrate earlier recommendations and findings, as appropriate.
New Jersey Comprehensive Statewide Freight Plan (2007) This statewide plan was completed with the objective of evaluating the state’s freight network as per SAFETEA-LU requirements from a physical, operational, and economic perspective. It examined all modes of freight transportation in the state with the goal to identify, evaluate, and propose recommendations to address system and modal constraints from a systems perspective.
Southern New Jersey Freight Transportation and Economic Development Assessment (2010) This document, in conjunction with the Statewide Freight Plan and Freight Plan Phase II, was part of a coordinated effort to ensure a multimodal action plan for the state by creating a roadmap for future transportation investments and their impact on the freight industry in New Jersey. The report provides an assessment of freight transport, logistics, resource extraction, and industrial activity in the South Jersey region. The purpose of the study was to examine and prioritize transportation needs to support the maintenance, improvement, and expansion of key freight, logistics, and industrial clusters across South Jersey, in ways that complement regional facilities in Philadelphia and northern New Jersey.
New Jersey Statewide Freight Plan Phase II: Priority Highway Freight Corridors (2012) This plan was supplemental to the New Jersey Comprehensive Statewide Freight Plan. The focus in this report was specifically aimed at examining priority freight highway corridors within the state. This report examined the top six priority freight corridors, initially identified in the 2007 Plan. The goal of this report was to provide the NJDOT with an implementation plan aimed at prioritizing investments in improvements that target key areas impacting the freight industry.
New Jersey Statewide Freight Rail Strategic Plan (2014) The Freight Rail Strategic Plan was a coordinated effort, developed with input from public agencies and rail organizations from the private sector. The Plan evaluates the state of the existing freight system, planned infrastructure improvements, and discusses anticipated future demand. Based on this evaluation, a series of prioritized actions are proposed with the goal of ensuring that the state’s freight rail system can perform optimally and efficiently. The report does not provide policy recommendations or specific actions; it provides recommendations that are meant to serve as guidelines for future efforts in freight rail system planning.

New Jersey Statewide FREIGHT PLAN
14
New Jersey State Rail Plan (2015) The State Rail Plan provided a detailed summary and vision for New Jersey’s diverse rail network, including freight rail and passenger service. The plan profiled New Jersey’s freight rail network, defining how, where, and what goods move by rail within, into, out of, and through New Jersey. This included a detailed review of key trends, including the movement of oil by train and secondary impacts on New Jersey’s Intermodal and Marine terminals. The State Rail Plan resulted in the development of a series of investment projects for rail service, capacity, and interlockings.
NJDOT Freight Planning Initiatives NJDOT’s Office of Freight Planning and Services, located within the Division of Multimodal Services, is involved in several ongoing initiatives that collectively aim to improve infrastructure conditions for the goods movement industry in New Jersey.
Freight Management System NJDOT is currently developing a statewide Freight Management System (FMS) tool that will allow the state to more easily quantify the importance of an existing project or roadway segment related to the goods movement industry. This will allow NJDOT to accurately develop a “Freight Score” for projects that will provide internal staff with a detailed understanding of why and how a project is critical for freight.
Freight Performance Measures This effort is linked to the FMS tool and provides NJDOT with the data necessary to quantify two key elements that measure highway performance: Truck Travel Time Reliability and Mileage Uncongested. These measures are detailed later within the highway performance section of this document.
Truck Monitoring Program NJDOT advanced a statewide truck monitoring program in 2007 to investigate the impact of the (then) new 102” Large Truck Network regulations on the statewide highway network. This effort continues today, including ongoing monitoring of numerous datasets and annual summaries of the resultant analysis of those datasets.
Regional Initiatives Access to national and global markets is a critical advantage and vital to New Jersey’s economic competiveness. To enhance regional connectivity and efficient goods movement across the State’s borders, New Jersey has also worked collaboratively with regional partners on several freight planning initiatives. Many of these initiatives, including those that are recommended to be advanced based on this Plan, are detailed in Chapter 6.
Goods Movement Action Program (G-MAP) G-MAP is a collaborative program that recognizes the need for more efficient and sustainable freight transportation to maintain the region's national importance as a freight hub and to serve local communities and businesses. G-MAP is a joint initiative of the PANYNJ, NJDOT, and NYSDOT. Collectively, these three agencies and their partners share the greatest accountability for managing freight mobility in the region. G-MAP aims to create a 21st century goods movement network serving the metropolitan region and linking it with domestic and global markets
G-MAP outlines a vision to support and enhance the New York-New Jersey Metropolitan Region’s position as a global center through strategic goods movement initiatives. Recognizing the unique bi-state complexities of the metropolitan area, the G-MAP provides a shared framework across jurisdictional

Chapter 1: INTRODUCTION
15
borders from which public and private partners can cooperatively address local, regional, and national goods movement challenges in the region. The long-term comprehensive program identifies a multimodal Regional Core Freight Network and includes ten Action Packages that address targeted infrastructure improvements, policy and management tools to improve freight network operations, and funding strategies to leverage resources among regional stakeholders.
I-95 Corridor Coalition The New Jersey Department of Transportation is a member of the I-95 Corridor Coalition. Established in 1993, the Coalition provides a forum for state, local, and regional transportation agencies and organizations from Maine to Florida to work together to improve transportation mobility, safety, efficiency, and system performance. While its initial focus was on highways, the Coalition evolved to encompass all modes and linkages between modes. Coalition members facilitate more efficient network operations through regional incident management planning, coordination, and communication and improved information management across jurisdictions and modes.
The Coalition’s Intermodal Movement of Freight and Passengers Committee actively supports states in addressing transportation issues that impact long-distance travel and span multiple jurisdictions, including freight. New Jersey has been engaged in several of the Coalition’s freight studies, including I-95 Corridor Rail Studies, the M-95 Marine Highway Corridor, and truck parking.
East Coast Marine Highway Initiative (ECMHI) New Jersey has collaborated with the Ports of New Bedford, Baltimore, and Canaveral; the I-95 Corridor Coalition; and the U.S. Maritime Administration (MARAD) to form the East Coast Marine Highway Initiative Awarding Authority (ECMHIAA). The ECMHIAA is working together to craft strategies that make the Marine 95 (M-95) corridor an economically competitive, reliable, and environmentally responsible alternative to inland transportation options along the eastern seaboard, which are prone to congestion issues, capacity constraints, and aging infrastructure. The M-95 itself is a part of the USDOT’s broader America’s Marine Highway (AMH) Program to promote marine highway services as an integral part of a multimodal freight network.
The ECHMIAA developed the ECHMHI Study in 2013 to jointly assess opportunities for marine highway services along the east coast, with particular emphasis on the viability and benefits of the New Jersey Marine Highway Platform and the AMH I-95 Corridor Service Project (focusing on the ports of New Bedford, Baltimore, and Canaveral).
Cross Harbor Freight The PANYNJ has been working with New Jersey, New York, regional, and federal partners to improve the movement of freight across New York Harbor. Regional freight transportation is largely dependent on trucks, due to limited freight rail connections across New York Harbor. The only two existing freight rail connections across the Hudson River are the Alfred H. Smith Memorial Bridge, just south of Albany and New York and New York New Jersey Rail, LLC’s car float between Jersey City and Brooklyn. The PANYNJ and FHWA completed the Tier I Environmental Impact Statement (EIS) in January 2016, which included a high-level analysis of ten potential waterborne and rail tunnel alternatives to improve multimodal freight access. The Record of Decision identified two Preferred Alternatives - the Enhanced Railcar Float Alternative and the Rail Tunnel Alternative. Both are subject to a comprehensive analysis in Tier II of the study.

New Jersey Statewide FREIGHT PLAN
16
Metropolitan Area Planning (MAP) Forum As a result of recommendations by the Federal Transit Administration (FTA) and FHWA, that the five Metropolitan Planning Organizations (MPOs) of the Greater New York Metropolitan Transportation Management Area (TMA) formalize the manner in which they coordinate on the development of transportation planning documents, as well as how they coordinate to meet the attainment of the National Ambient Air Quality Standards (NAAQS), the MPOs collaborated to craft a Memorandum of Understanding which addressed those recommendations. Regional freight initiatives are one of the key items undertaken by the MAP Forum.

Chapter 2: GOALS & OBJECTIVES
17
GOALS & OBJECTIVES The New Jersey Statewide Freight Plan seeks to achieve the goals and objectives defined below. These goals provide a framework for developing strategies and actions to advance the Plan. The goals were developed in consultation with the FAC to ensure that
they reflect the needs and priorities of freight stakeholders statewide. Recent state and regional freight plans, studies, and initiatives, as well as the New Jersey Long Range Plan – Transportation Choices 2030, were reviewed to ensure concurrence and continuity across existing plans and policies.
Improve Safety and Security Ensure the protection of people, cargo, and infrastructure
Strengthen Economic Competitiveness Support existing and emerging freight-dependent businesses, maintain and enhance the State’s economic competitiveness and productivity, and retain and generate New Jersey jobs by providing freight shippers and receivers with a cost-effective, reliable multimodal freight transportation system for moving goods to, from, within, and through the State
Improve Reliability and Efficiency Improve the efficiency and reliability of goods movement across and between all modes of the freight transportation system
Enhance System Resiliency Improve system flexibility and the ability of the freight transportation system to withstand and recover from natural disasters and other service interruptions, as well as the more gradual impacts of sea-level rise and climate change
Maintain and Renew Infrastructure Prioritize maintenance actions and strategic investments to ensure the freight transportation system is in a state of good repair and facilitates efficient multimodal goods movement and connectivity to and from national and international markets

New Jersey Statewide FREIGHT PLAN
18
Support Environmental Stewardship, Local Communities, and Quality of Life Promote freight as a good neighbor, encourage environmentally friendly and sustainable practices that support a high quality of life in New Jersey’s local communities, and operate a freight transportation system that preserves New Jersey’s natural, historic, and cultural resources
Leverage Innovative Technologies and Practices Utilize emerging, innovative technologies, practices, and programs as strategies to enhance New Jersey’s economic competitiveness, improve system efficiency and reliability, reduce costs, and respond to freight industry trends
Facilitate Interagency Coordination and Governance Ensure two-way communication between NJDOT and local partners and foster cooperation, coordination, and partnerships among state, regional and local government agencies, private sector partners, and other stakeholders to promote effective investment in and operation and management of the freight transportation system
The goals of the New Jersey Statewide Freight Plan are consistent with the National Freight Plan goals defined in the MAP-21 National Freight Policy. Overlap with the national plan will ensure state-level strategies and actions are developed within this Plan that support and contribute to achieving national goals. Table 1 illustrates how the National Freight Plan goals are addressed within this Plan.

Chapter 2: GOALS & OBJECTIVES
19
Table 1: Comparison to National Goals
National Goals New Jersey Freight Plan Goal How This Plan Addresses New Jersey’s Goal
Improve the contribution of the freight transportation system to economic efficiency, productivity, and competitiveness
Strengthen Economic Competitiveness
Identification of critical industries for New Jersey and linkages to the existing freight transportation network. (Chapter 3)
Reduce congestion on the freight transportation system Improve Reliability and Efficiency
Analysis of freight bottlenecks through using existing state and national freight datasets (Chapter 4)
Improve the state of good repair of the freight transportation system Maintain and Renew Infrastructure
Review of existing bridge and pavement projects; linkages to identified freight bottlenecks and problem areas. (Chapters 4, 6, 7)
Improve the safety, security, and resilience of the freight transportation system
Improve Safety and Security, Enhance System Resiliency
Advancement of ITS Technologies (Chapter 5) and Regional Initiatives (Chapter 6)
Use advanced technology, performance management, innovation, competition, and accountability in operating and maintaining the freight transportation system
Leverage Innovative Technologies and Practices
Discussion of emerging trends and funding mechanisms. (Chapter 5)
Reduce adverse environmental and community impacts of the freight transportation system
Support Environmental Stewardship, Local Communities, and Quality of Life
Inclusive outreach through Freight Advisory Committee and their subregions/ constituencies (Chapter 1)

New Jersey Statewide FREIGHT PLAN
20
Page left blank intentionally.

Chapter 3: FREIGHT ACTIVITY, INDUSTRIES, TRENDS
21
FREIGHT ACTIVITY, INDUSTRIES, TRENDS
This chapter of the Plan addresses critical freight trends, needs and issues by examining national datasets and information. The purpose is to develop a comprehensive picture of how New Jersey’s freight activity fits within the national context – what it consumes and produces, what transportation modes it relies on, how its critical industries are using the transportation system, how current conditions are forecast to change, and how key national and global factors will affect the state’s near-term and long-term freight future.
New Jersey’s Freight Flows To develop an overall picture of New Jersey freight tonnage and value, the consultant team utilized the Federal Highway Administration’s Freight Analysis Framework (FAF) version 4.
FAF is based on year 2012 Commodity Flow Surveys performed by the US Census department. Survey responses were aggregated for purposes of confidentiality, then modeled and processed to reflect other information available to USDOT; and finally reported out for public use in the form of a large database.
It is important to keep in mind that FAF represents the results of a freight model – it is not an actual comprehensive survey or empirical accounting of commodity flows, and it has known limitations and deficiencies. One should not expect FAF to provide decimal-point accuracy. However, it does represent the best available comprehensive approximation of multimodal freight flows, and it can be extremely useful for telling “big picture” stories.
FAF provides estimates of ffreight tonnage (usually reported as thousands of tons, or KTons) and ffreight value (usually reported as millions of dollars, or M$), with the ability to distinguish the following:
Commodity type. FAF reports the tonnage and value for 42 different commodity groups, representing “2-digit” level groups from the Standard Classification of Transported Goods (SCTG).5
Direction. Directional flows are not specified in the database itself, but can be easily determined since the origins and destinations of all flows are specified.
Trade type components (Domestic, Export, Import) Transportation modes. FAF data distinguishes between domestic modes and international
modes. International modes are the specific modes that connect to other countries. However, international moves often have a domestic component – for example, freight can move from New Jersey to New York City by truck, then by air to a foreign country. The state-to-state movement of international freight is counted and assigned to corresponding domestic modes, along with state-to-state tonnage and value that is not associated with international trade (e.g. domestic trade).
5 2-digit level groups represent the major industry group classification. SCTG two-digit codes were specifically designed to be comparable with the two-digit levels of the Standard Industrial Classification (SIC) and the North American Industry Classification System (NAICS).

New Jersey Statewide FREIGHT PLAN
22
Analysis years. FAF has a base year of 2012, with annual projections currently through 2015 and five-year projections through 2045, based on forecasts provided to FHWA by IHS Global Insight Inc.
Geographic coverage. FAF is available at two levels of aggregation: 50 states, or 132 analysis zones representing major US Business Economic Areas (BEAs). For this statewide Freight Plan, the statewide level of aggregation is used.
Current Tonnage and Value by Direction New Jersey’s freight transportation system handled more than 511 million tons of freight worth nearly one trillion dollars in 2015.6 As shown in Table 2 and Figure 2 around 29% of tons and 33% of value was inbound; around 27% of tons and 43% of value was outbound; and around 44% of tons and 23% of value was internal.
Table 2: Tons and Value by State-to-State Direction
Source: WSP analysis of FAF-4.
Overall, the state is projected to add 269 million tons between 2015 and 2045, representing a 1.4% Compound Annual Growth Rate (CAGR). The added tonnage will be evenly divided between inbound, outbound, and internal flows. Nearly half the tonnage will be associated with international trade, which is forecast to increase much more rapidly than domestic trade. Trucking is projected to add the most tonnage, but will grow at the regional average CAGR. Multiple modes and air cargo are projected to grow much faster than the regional average CAGR, while rail and water are also expected to grow at above-average rates. Pipeline traffic is expected to grow more slowly than the average rate.
6 Federal Highway Administration, Freight Analysis Framework, Version 4 (FAF-4)
State to State Flows Tons 2015 (M) Value 2015 ($M) Tons 2045 (M) Tons Added (M)
Tonnage CAGR
Inound 224.71 228,597$ 317.35 92.63 1.2%Internal 136.98 424,756$ 229.65 92.67 1.7%
Outbound 150.07 326,019$ 233.96 83.89 1.5%Total 511.76 979,372$ 780.96 269.19 1.4%
The FAF forecast is commodity driven – it looks at national and global changes in
demand and product sourcing, and estimates changes in production and consumption by
region. Importantly, FAF does not attempt to modify modal shares – if 20% of a certain commodity-trade lane is handled by rail
today, that share is projected to continue. The FAF forecasts are generally policy-neutral, and reflect one possible future,
absent direct or concerted action to grow certain industries, or to encourage the use of certain modes through transportation system
investments or other means.

Chapter 3: FREIGHT ACTIVITY, INDUSTRIES, TRENDS
23
Figure 2: Share of Tons and Value by State-to-State Direction
Source: WSP analysis of FAF-4.
New Jersey Freight Trading Partners Based on tonnage, inbound flows (Figure 3) to New Jersey primarily originate in in two states – Pennsylvania (almost 52%) and New York (almost 11%) -- with no other state having exceeding 3%. Based on value, the leading origin states for inbound flows (Figure 4) are also Pennsylvania (22%) and New York (18%), but other states – California, Texas, Florida, Illinois, Ohio, and North Carolina – are also significant partners. This data also indicates that while tonnage coming from Pennsylvania is substantial, it is predominantly of lower value (per ton) than goods coming from New York, California, or Texas.

New Jersey Statewide FREIGHT PLAN
24
Figure 3: Origin States for Inbound Tons
Source: WSP analysis of FAF-4.
Figure 4: Origin States for Inbound Value
Source: WSP analysis of FAF-4.
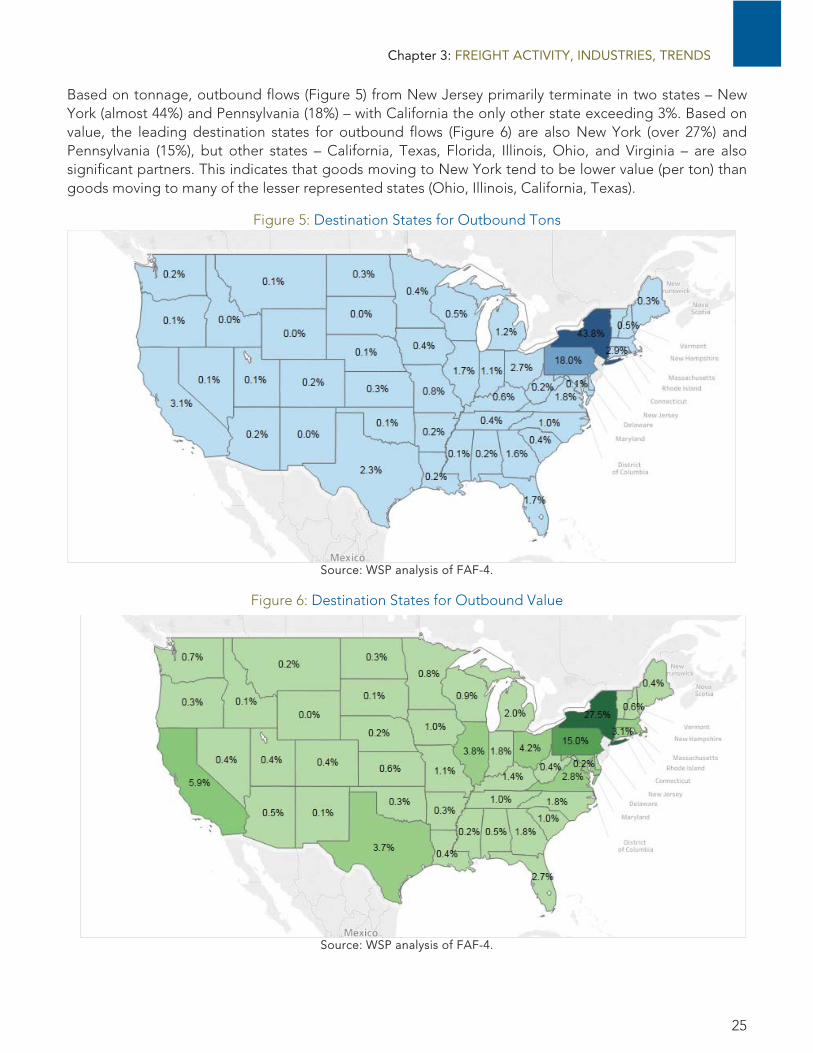
Chapter 3: FREIGHT ACTIVITY, INDUSTRIES, TRENDS
25
Based on tonnage, outbound flows (Figure 5) from New Jersey primarily terminate in two states – New York (almost 44%) and Pennsylvania (18%) – with California the only other state exceeding 3%. Based on value, the leading destination states for outbound flows (Figure 6) are also New York (over 27%) and Pennsylvania (15%), but other states – California, Texas, Florida, Illinois, Ohio, and Virginia – are also significant partners. This indicates that goods moving to New York tend to be lower value (per ton) than goods moving to many of the lesser represented states (Ohio, Illinois, California, Texas).
Figure 5: Destination States for Outbound Tons
Source: WSP analysis of FAF-4.
Figure 6: Destination States for Outbound Value
Source: WSP analysis of FAF-4.

New Jersey Statewide FREIGHT PLAN
26
Summary of Trade Types Table 3 illustrates that of New Jersey’s 512 million total tons and 979 billion in total value:
Over 419 million tons (81.9% of total) and nearly 704 billion dollars in value (72.0% of total) is associated with purely domestic freight movement.
Over 92 million tons (18.1%) and over 275 billion dollars (28.0%) in value are associated with international trade. Imports represent 14.8% of total tons and 22.8% of value, while exports represent 3.4% of tonnage and 5.3% of value.
An annual tonnage increase of 1.4% is anticipated through 2045. This growth is more heavily focused on international (import/export) trade.
Table 3: Tons and Value by Trade Type
Source: WSP analysis of FAF-4.
Figure 7 illustrates New Jersey’s key global import and export trade partners. For imports, New Jersey’s leading trade partners are Europe, Canada, Eastern Asia, Southwest and Central Asia, and Rest of Americas (by tonnage), and Europe and Eastern Asia (by value). For exports, New Jersey’s leading trade partners are Europe, Canada, and Rest of Americas (by tonnage), and Europe and Southwest and Central Asia (by value).
Figure 7: Trade Partner Regions for Imports and Exports via New Jersey Gateways
Source: WSP analysis of FAF-4.
Trade TypeTons 2015
(M)Value 2015
($M)Domestic 419.31 703,847$
Import 75.57 223,570$ Export 16.88 51,954$
Total 511.76 979,371$

Chapter 3: FREIGHT ACTIVITY, INDUSTRIES, TRENDS
27
New Jersey Top Commodities Tonnage Analysis Figure 8 provides a summary of New Jersey’s leading commodities by tonnage, including:
Coal and Petroleum Products (over 65 million tons representing 16.6% of tonnage) Gravel and Crushed Stone (over 55 million tons representing 13.9% of tonnage) Diesel and Related Fuel Oils (over 50 million tons representing 12.9% of tonnage) Gasoline and Related Fuels (over 35 million tons representing 9.6% of tonnage) Non-Metallic Mineral Products (over 35 million tons representing 9.4% of tonnage) Other Prepared Foodstuffs (over 35 million tons representing 8.9% of tonnage)
Figure 8: Tons and Shares by Commodity
Source: WSP analysis of FAF-4.
Together, these six commodity groups account for more than 70% of New Jersey’s freight tonnage. Other important groups include: wood products; waste and scrap (this includes post-consumer paper, metal and plastic products with sale value, and excludes municipal waste); crude petroleum; mixed freight (mostly in containers and truck vans); natural sands; basic chemicals; and agricultural products.
Many of these commodities are highly directional, as Figure 9 illustrates. Commodities where at least 40% of tonnage is moved inbound to the region include: coal and petroleum products; crude petroleum; mixed freight; and basic chemicals. Commodities where 40% of tonnage is moved outbound from the region include: other prepared foodstuffs; wood products; natural sands; and agricultural products. Commodities where 40% of tonnage is moved internally within the region include: gravel and crushed stone; diesel and related fuel oils, gasoline and related fuels, non-metallic mineral products, waste and scrap, crude petroleum, and natural sands. In some cases, the internal moves are commodities produced within the region; in other cases, they represent re-handled goods, or the products of value-added processing of inbound goods.

New Jersey Statewide FREIGHT PLAN
28
Figure 9: Tons by Commodity and Direction
Source: WSP analysis of FAF-4.
Figure 10 details tonnage shares by trade type. Among the leading tonnage commodities, the highest import shares are for crude petroleum, gasoline and related fuels, other prepared foodstuffs, diesel and related fuel oils, nonmetallic mineral products, basic chemicals, and agricultural products. The highest export shares are for waste and scrap, diesel and related fuel oils, and other prepared foodstuffs.
Figure 10: Tons by Commodity and Trade Type
Source: WSP analysis of FAF-4.

Chapter 3: FREIGHT ACTIVITY, INDUSTRIES, TRENDS
29
Each of the leading tonnage commodities are served by more than one transportation mode, but most show strong affinities for a single mode, as Figure 11 illustrates.
Truck-oriented commodities include: gravel and crushed stone; gasoline and related fuels; non-metallic mineral products; other prepared foodstuffs; wood products; waste and scrap; mixed freight; natural sands; basic chemicals; and agricultural products.
Pipelines handle the majority of other coal and petroleum products (including liquid natural gas), a leading share of diesel and related fuel oils, and a small share of gasoline and related fuel oils.
Rail does not have a dominant share of any commodity but supports the movement of other coal and petroleum products, diesel and related fuel oils, gasoline and related fuel oils, nonmetallic mineral products, other prepared foodstuffs, wood products, waste and scrap, crude petroleum, and basic chemicals
Similarly, water does not have a dominant share of any commodity but supports the movement of diesel and related fuel oils, gasoline and related fuels, crude petroleum, waste and scrap, and natural sands.
For crude petroleum, the majority of tonnage has no domestic mode. This is associated with international product that arrives via tankers to refineries, and leaves the refineries in a value-added form (as gasoline or other petroleum products).
Multiple modes – which is generally associated with higher-value and intermodal shipments – is a less significant means of transporting the high-tonnage commodities.
Figure 11: Tons by Commodity and State-to-State Mode
Source: WSP analysis of FAF-4.

New Jersey Statewide FREIGHT PLAN
30
Value Analysis The story of commodity value is very different than the story of commodity tonnage. By value, New Jersey’s leading commodities are:
Electronic Equipment (over 80 billion dollars representing 8.2% of value) Vehicles and Parts (over 70 billion dollars representing 7.7% of value) Pharmaceutical Products (over 70 billion dollars representing 7.6% of value) Mixed Freight (almost 70 billion dollars representing 7.0% of value) Textiles and Leather (over 60 billion dollars representing 6.5% of value) Misc. Manufactured Products (over 50 billion dollars representing 5.5% of value) Other Chemical Products (over 50 billion dollars representing 5.2% of value) Other Prepared Foodstuffs (over 40 billion dollars representing 4.7% of value) Machinery (over 40 billion dollars representing 4.4% of value)
Together, these nine commodity groups account for more than half of New Jersey’s freight value. Other important groups include: diesel and related fuel oils; plastics and rubber; gasoline and related fuels; basic chemicals; precision instruments; and many others.
Figure 12: Value by Commodity and Direction
Source: WSP analysis of FAF-4.
Unlike the leading tonnage commodities, where much of the freight is moving internally within New Jersey, Figure 12 illustrates that the leading value commodities are mostly moving into and out of New Jersey. Inbound movements primarily serve the region’s producers and consumers, while outbound movements reflect New Jersey production and gateway trade that serves the rest of the country.
Outbound value in many leading commodities is higher than inbound value. This is true for: electronic equipment; vehicles and parts; pharmaceutical products; textiles and leather; miscellaneous manufactured products; other prepared foodstuffs; machinery; and plastics/rubber.
The two commodity groups where inbound value exceeds outbound value are mixed freight (primarily containerized and truck/van goods serving New Jersey consumers and industries) and basic chemicals.

Chapter 3: FREIGHT ACTIVITY, INDUSTRIES, TRENDS
31
The two commodity groups that show high levels of internal movement are diesel and related fuel oils and gasoline and related fuels, which are also high-tonnage commodities that move within the region between refining/distribution facilities and end users. All other commodity groups show some internal movements, primarily related to consolidation and distribution movements through warehouses and other storage and processing facilities.
Figure 13 illustrates that most of the leading value commodities show significant import shares (between 12% and 40%). The largest import shares are for: textile and leather; machinery; chemicals; and vehicles and parts. (Interestingly, mixed freight has a very small import share; this is because mixed freight largely consists of goods that have been through warehouse/distribution centers, after they have been received through ports or from other states, at which time they become domestic freight within FAF.) On the export side, shares do not exceed 10% for any commodity; the leading export group is chemical products.
Figure 13: Value by Commodity and Trade Type
Source: WSP analysis of FAF-4.
Each of the leading value commodities show a strong dependency on trucking. Figure 14 confirms that trucking is the most important mode for high-value goods. However, all commodities are also served by other modes to varying degrees.
While multiple modes are less important for high-tonnage commodities, it is extremely important for high-value commodities, such as: electronics; manufactured products; textiles and leather; machinery; and vehicles and parts.
Air cargo – which handles a very small share of tonnage – handles a significant amount of value in electronics, pharmaceuticals, chemicals, machinery, and manufactured products.
Rail and water are used by many commodities, but not for large shares of value. Most of the contributions of rail and water are likely reflected in the “multiple modes” category. The exception is diesel and related fuel oils, where water is strongly represented as a single mode.
Pipeline is not a major contributor except for diesel and related fuel oils and gasoline and related fuels, which are also high-tonnage commodities.

New Jersey Statewide FREIGHT PLAN
32
Figure 14: Value by Commodity and State-to-State Mode
Source: WSP analysis of FAF-4.
Modes Utilized for Key Commodities FAF reports transportation modes in two ways: as ‘domestic’ modes, which are more properly understood as ‘state-to-state’ modes because they handle the collection and distribution of import and export freight; and as ‘international’ modes, which are the modes of entering or leaving the US. The discussion below addresses state-to-state modes first, and then addresses international modes.
Overview of State-to-State Modes New Jersey is served by a full range of modal options for state-to-state freight transportation. Key findings include:
Trucking handles 365 million tons (74% of total) and 684 billion in value (71% of total) Pipeline handles 77 million tons (16% of total) and 35 billion in value (4% of total) Rail handles 23 million tons (5% of total) and 27 billion in value (3% of total) Water handles 16 million tons (3% of total) and 21 billion in value (2% of total) Multiple modes handle 15 million tons (3% of total) and 178 billion in value (19% of total) Air handles less than 1 million tons (less than 0.05 % of total) but has nearly 22 billion in value (2%
of total) “None” represents 17 million tons of freight moving internationally which is not associated with a
domestic mode – primarily crude oil arriving at refineries, and leaving as refined products. While all modes are anticipated to see an annual growth in tonnage moved through 2045, the
heaviest growth is anticipated in Air and Rail, as well as anticipated growth in the “unknown” mode.
Profiles of state-to-state tonnage by mode are presented in Table 4 and Figure 15. Profiles based on value would look considerably different; however, modal tonnage is the most important metric for considering the physical effects on, and utilization of, New Jersey’s freight transportation infrastructure.

Chapter 3: FREIGHT ACTIVITY, INDUSTRIES, TRENDS
33
Table 4: Tons and Value by State-to-State Mode
Source: WSP analysis of FAF-4.
Figure 15: Share of Tons and Value by State-to-State Mode
Source: WSP analysis of FAF-4.
Mode (State to State)
Tons 2015 (M)
Value 2015 ($M)
Value Per Ton 2015
Tons 2045 (M)
Tons Added (M) Tonnage CAGR
Truck 364.59 683,593$ 1,875$ 553.58 188.99 1.4%Pipeline 76.66 35,424$ 462$ 100.48 23.82 0.9%
Rail 15.16 26,523$ 1,750$ 38.01 22.85 3.1%None 22.53 11,255$ 500$ 37.37 14.84 1.7%
Water 15.95 21,018$ 1,318$ 28.38 12.43 1.9%Multiple 16.57 178,419$ 10,768$ 22.18 5.61 1.0%
Air 0.22 21,883$ 99,468$ 0.63 0.41 3.6%Unknown 0.09 1,257$ 13,967$ 0.33 0.24 4.5%
Total 511.77 979,372$ 1,914$ 780.96 269.19 1.4%

New Jersey Statewide FREIGHT PLAN
34
Commodities Moving by Truck The leading truck commodities by tonnage and direction are shown in Figure 16. While trucking into and out of New Jersey is substantial, the largest share of truck tonnage is moving internally within the state, between New Jersey origins and destinations. As Figure 17 illustrates, outside of New Jersey, the leading origin and destination states are – by a wide margin -- Pennsylvania and New York.
Figure 16: Leading Tonnage Commodities, State-to-State Truck
Source: WSP analysis of FAF-4.
Figure 17: Origin (left) and Destination (right) States for NJ Truck Tons
Source: WSP analysis of FAF-4.

Chapter 3: FREIGHT ACTIVITY, INDUSTRIES, TRENDS
35
Commodities Moving by Rail The leading rail commodities by tonnage and direction are shown in Figure 18. The dominant flows are clearly inbound, except for coal and petroleum products and diesel and related fuel oils (primarily outbound with substantial internal volumes) and other prepared foodstuffs (substantial internal volumes). Unlike trucking, which is heavily focused on the New Jersey-New York-Pennsylvania market, rail tonnage is traded with all parts of the US (Figure 19), and is especially heavy with Wyoming, Iowa, California, and Texas, all of which are important for fuels, chemicals, and food products. Note that rail goods may also be included in Multiple Modes.
Figure 18: Leading Tonnage Commodities, State-to-State Rail
Source: WSP analysis of FAF-4.
Figure 19: Origin (left) and Destination (right) States for NJ Rail Tons
Source: WSP analysis of FAF-4.

New Jersey Statewide FREIGHT PLAN
36
Commodities Moving by Water The leading water commodities by tonnage and direction are shown in Figure 20. The dominant commodity group is diesel and related fuel oils, largely moving internally within New Jersey, but with significant outbound traffic (largely to New York City). Crude petroleum is an important inbound commodity, while other bulk materials – gasoline, minerals, sands, etc. – are primarily in the outbound direction. Besides internal traffic, water tonnage is primarily traded with New York and Pennsylvania, but also reaches ports on the east coast, gulf coast, inland rivers, and Great Lakes, as Figure 21 illustrates. Note that water goods may also be included in Multiple Modes.
It should be noted that other datasets available to the project team suggest higher waterborne tonnages for the State of New Jersey.7 Considering these differences, we recommend the use of FAF waterborne data for purposes of overall system-level assessment, while encouraging reference to other data sources (Corps, Census Trade, and Port-level statistics) for more detailed modal system and facility planning.
Figure 20: Leading Tonnage Commodities, State-to-State Water
Source: WSP analysis of FAF-4.
Figure 21: Origin (left) and Destination (right) States for NJ Water Tons
Source: WSP analysis of FAF-4.
7 For 2014, the US Army Corps of Engineers reports New Jersey domestic mode tonnage as: 11.8m tons inbound; 34.1m tons outbound; and 7.5m tons intrastate. The specific reasons for the lower numbers in FAF are not known, but three contributing factors may be at work. First, FAF is almost certainly reporting some waterborne tonnage in the Multiple Modes category. Second, because FAF is based on the Commodity Flow Survey (CFS), and because much of New Jersey’s domestic waterborne freight is in a few commodity types (refined fuels, etc.), it is possible that the CFS did not fully sample freight shippers responsible for these commodities, or that the CFS suppressed some data due to sample size or confidentiality issues. Third, it is possible that the Corps may be over-reporting New Jersey domestic tonnage to some degree. Unfortunately, there is no third data source for domestic waterborne tonnage by state to serve as an additional check. However, for New Jersey international waterborne tonnage, we can observe that the Corps reports 93.8m short tons (2014), while US Census Trade Database reports around 65.5m short tons (2015) – a significant difference.

Chapter 3: FREIGHT ACTIVITY, INDUSTRIES, TRENDS
37
Commodities Moving by Air The leading air commodities by tonnage and direction are shown in Figure 22. The leading commodities – electronics, vehicles and parts, textiles, machinery, etc. – tend to be high-value, and are moving in both inbound and outbound directions, with no internal movements within New Jersey. As shown in Figure 23, air cargo tonnage is traded with a wide range of states – California, Texas, Florida, Illinois, Ohio, Maine, Georgia, Kentucky, Tennessee, New York, and others. Note that some air cargo may also be included in Multiple Modes.
Figure 22: Leading Tonnage Commodities, State-to-State Air
Source: WSP analysis of FAF-4.
Figure 23: Origin (left) and Destination (right) States for NJ Air Tons
Source: WSP analysis of FAF-4.

New Jersey Statewide FREIGHT PLAN
38
Commodities Utilizing Multiple Modes The leading multiple modes commodities by tonnage and direction are shown in Figure 24. The list includes bulk commodities – gravel and crushed stone, nonmetallic mineral products, etc. – that are probably moving via rail-truck and water-truck modes. The list also includes higher-value goods that are probably moving via intermodal containers. Multiple modes traffic moves both inbound and outbound, and, as shown in Figure 25, is traded with California, Maryland, New York, and many other states throughout the US.
Figure 24: Leading Tonnage Commodities, State-to-State Multiple Modes
Source: WSP analysis of FAF-4.
Figure 25: Origin (left) and Destination (right) States for NJ Multiple Modes Tons
Source: WSP analysis of FAF-4.

Chapter 3: FREIGHT ACTIVITY, INDUSTRIES, TRENDS
39
Commodities Moving by Pipeline The leading pipeline commodities by tonnage and direction are shown in Figure 26. The list consists of three groups: coal and petroleum products (including Liquefied Natural Gas), largely moving inbound; diesel and related fuel oils, moving entirely within New Jersey; and gasoline and related fuels moving inbound. Figure 27 illustrates that inbound pipeline tonnage primarily originates from Pennsylvania; outbound pipeline tonnage terminates in New York.
Figure 26: Leading Tonnage Commodities, State-to-State Pipeline
Source: WSP analysis of FAF-4.
Figure 27: Origin (left) and Destination (right) States for NJ Pipeline Tons
Source: WSP analysis of FAF-4.

New Jersey Statewide FREIGHT PLAN
40
International Modes As previously noted, FAF reports transportation modes in two ways: as ‘domestic’ modes, and as ‘international’ modes, which are the modes of entering or leaving the US. FAF also links international flows and modes with their corresponding state-to-state modes. New Jersey’s international trade is accommodated by ports and airports in New Jersey, as well as ports, airports, and surface trade (truck, rail, and pipeline) border crossings in other states. Conversely, other states move freight through New Jersey’s ports and airports. Both types of movements are reflected in the FAF tabulation of New Jersey’s international tonnage and value.
Imports FAF reports that New Jersey imports over 75 million tons worth over 223 billion dollars in value. Table 5 illustrates that the largest share of import tonnage is associated with waterborne trade. (Additionally, remember that FAF may be undercounting water tonnage, so the actual figure may be even higher). Water is also the leading import mode for value. However, air is also a very significant mode for import value, especially given the ratio of value to tonnage, representing a value per ton almost 50 times that of waterborne cargo. Trucking (primarily representing cross-border trade with Canada) is also a significant mode for import value.
Table 5: Import Tons and Value by International Mode
Source: WSP analysis of FAF-4.
The leading import commodity groups based on tonnage are shown in Figure 28. As expected, water is the dominant mode for each commodity.
(Int'l Inbound)Tons 2015
(M)Value 2015
($M)Value Per Ton
2015Water 71.36 179,100$ 2,510$
Air 0.27 33,705$ 124,833$ Truck 2.25 7,484$ 3,326$
Rail 1.21 1,234$ 1,020$ Multiple 0.07 714$ 10,200$ Pipeline 0.33 183$ 555$
Unknown 0.07 1,149$ 16,414$ Total 75.56 223,569$ 2,959$

Chapter 3: FREIGHT ACTIVITY, INDUSTRIES, TRENDS
41
Figure 28: Leading Import Commodities by Tons and International Mode
Source: WSP analysis of FAF-4.
The leading import commodity groups based on value are shown in Figure 29. There is much more diversity in the use of import modes – air cargo is shown to move a significant share of value for textiles, electronics, machinery, chemicals, manufactured products, and pharmaceuticals. Trucking also has meaningful volumes for electronic equipment.
Figure 29: Leading Import Commodities by Value and International Mode
Source: WSP analysis of FAF-4.

New Jersey Statewide FREIGHT PLAN
42
Exports FAF reports that New Jersey exports nearly 17 million tons worth nearly 52 billion dollars in value. Table 6 confirms that the largest share of export tonnage is associated with waterborne trade, but export trade via trucking is also significant. Water is the leading export mode for value, but air is not far behind, and trucking is also very significant.
The leading export commodity groups based on tonnage are shown in Figure 30. Water is the dominant mode for the two leading commodities – diesel and related fuel oils and waste and scrap – but trucking has a strong share of many groups.
Table 6: Export Tons and Value by International Mode
Source: WSP analysis of FAF-4.
Figure 30: Leading Export Commodities by Tons and International Mode
Source: WSP analysis of FAF-4.
(Int'l Outbound)
Tons 2015 (M)
Value 2015 ($M)
Value Per Ton 2015
Water 13.43 26,373$ 1,964$ Air 0.17 17,129$ 100,759$
Truck 2.98 7,630$ 2,560$ Rail 0.28 685$ 2,446$
Unknown 0.02 108$ 5,400$ Multiple 0.01 28$ 2,800$
Total 16.89 51,953$ 3,076$

Chapter 3: FREIGHT ACTIVITY, INDUSTRIES, TRENDS
43
The leading export commodity groups based on value are shown in Figure 31. Water is the leading mode for many commodities, but air and trucking are well represented among many different commodity groups.
Figure 31: Leading Export Commodities by Value and International Mode
Source: WSP analysis of FAF-4. Benchmarking of Commodity Flow Data Comparing New Jersey’s freight tonnage and value with US totals is a means of illustrating the particular strengths of New Jersey’s freight activity, as well as its importance to the nation as a whole. In the tables below, New Jersey’s trade tonnage and value, modal tonnage and value, and commodity tonnage and value are compared with national totals. National totals were calculated in the same manner as New Jersey totals, as the sum of tonnage inbound to any state, outbound from any state, and internal to each state. In each table, New Jersey’s percent of the national total is reported, along with a calculated “Freight Quotient” (FQ)8. As one of 50 states, New Jersey’s “fair share” of national tonnage and value is 2 percent; the Freight Quotient is New Jersey’s actual percentage share divided by 2%. A Freight Quotient of 1.0 means New Jersey is capturing its fair share; a Freight Quotient of 2.0 means it is capturing twice its fair share.
Table 7: New Jersey vs. National Totals: Trade Type
Source: WSP analysis of FAF-4.
8 This is calculated in a similar fashion to a Location Quotient, which quantifies the concentration of a specific industry in a given geography.
Tons 2015 (M) Value 2015 ($M) Tons 2015 (M) Value 2015 ($M)Domestic 1.9% 3.1% 1.0 1.6
Import 5.3% 6.0% 2.6 3.0Export 1.3% 2.0% 0.7 1.0
Total 2.1% 3.4% 1.1 1.7
Share of Nat'l Total "Freight Quotient" (FQ)

New Jersey Statewide FREIGHT PLAN
44
Overall, as shown in Table 7, New Jersey is handling 1.1 times its fair share of freight tonnage and 2.7 times its fair share of freight value. It is extremely strong for imports, with an FQ of 2.6 for tonnage and 3.0 for value. It is weaker for exports, but still near the national average (FQ of 0.7 for tonnage and FQ of 1.0 for value).
Looking at modes, as shown in Table 8, compared to national averages, New Jersey’s freight movement is more concentrated in trucking (FQ of 1.3 for tonnage and 1.8 for value) and Multiple Modes and Mail (FQ of 1.0 for tonnage and 2.2 for value). Water is below the national average for tonnage (FQ of 0.8) but higher than average for value (FQ of 1.6). Air is used at roughly the national average, while pipeline is slightly below the national average. Rail is an interesting case – its FQ for tonnage is a relatively low 0.4, but its FQ for value is 0.9, indicating that New Jersey is using rail to move less higher-weight freight and more higher-value freight than the nation as a whole.
Table 8: New Jersey vs. National Totals: Modal Utilization
Source: WSP analysis of FAF-4.
Looking at commodities, we see that New Jersey is extremely strong in a wide range of commodity groups. As Table 9 illustrates, it has Freight Quotients for value of 3.0 or more in: other chemical products; monumental or building stone; textiles and leather; pharmaceutical products; alcoholic beverages; nonmetallic mineral products; basic chemicals; meat, poultry, fish and seafood; printed products; other prepared foodstuffs; furniture, lighting and signage; miscellaneous manufactured products; milled grain and bakery products; and diesel and related fuels.
Tons 2015 Value 2015 Tons 2015 Value 2015Truck 2.6% 3.6% 1.3 1.8
Rail 0.7% 1.9% 0.4 0.9Water 1.6% 3.1% 0.8 1.6
Air (inc. Truck-Air) 2.2% 1.8% 1.1 0.9Multiple Modes and Mail 2.0% 4.3% 1.0 2.2
Pipeline 1.5% 1.7% 0.7 0.8Total 2.1% 3.4% 1.1 1.7
Share of Nat'l Total "Freight Quotient" (FQ)

Chapter 3: FREIGHT ACTIVITY, INDUSTRIES, TRENDS
45
Table 9: New Jersey vs. National Totals: Commodities (Ranked by Share of Value)
Source: WSP analysis of FAF-4.
Tons 2015 Value 2015 Tons 2015 Value 201523 Other Chemical Products 3.4% 7.2% 1.7 3.6
10 Monumental or Building Stone 3.9% 6.7% 2.0 3.330 Textiles and Leather 7.1% 5.8% 3.6 2.9
21 Pharmaceutical Products 6.4% 5.1% 3.2 2.620 Basic Chemicals 3.8% 5.0% 1.9 2.529 Printed Products 2.9% 4.8% 1.5 2.4
05 Meat, Poultry, Fish, Seafood 2.4% 4.5% 1.2 2.231 Non-Metallic Mineral Products 3.8% 4.4% 1.9 2.2
40 Miscellaneous Manufactured Products 3.9% 4.4% 2.0 2.206 Milled Grain and Bakery Products 3.6% 4.3% 1.8 2.2
07 Other Prepared Foodstuffs 4.3% 4.3% 2.1 2.108 Alcoholic Beverages 3.0% 4.2% 1.5 2.1
38 Precision Instruments 3.2% 4.2% 1.6 2.139 Furniture, Lighting, Signage 4.4% 4.1% 2.2 2.1
41 Waste and Scrap 2.5% 3.9% 1.2 1.914 Metallic Ores and Concentrates 0.1% 3.7% 0.1 1.8
36 Vehicles and Parts 3.1% 3.6% 1.6 1.824 Plastics and Rubber 1.5% 3.4% 0.7 1.7
28 Paper or Paperboard Articles 2.5% 3.3% 1.2 1.635 Electronic Equipment 2.9% 3.2% 1.5 1.6
42 Mixed Freight 2.9% 3.1% 1.5 1.613 Other Non-Metallic Minerals 2.5% 3.1% 1.3 1.6
03 Agricultural Products 2.8% 3.0% 1.4 1.518 Diesel and Related Fuel Oils 2.5% 3.0% 1.3 1.5
33 Articles of Base Metal 2.5% 2.9% 1.2 1.527 Pulp, Newsprint, Paper, and Paperboard 2.9% 2.9% 1.4 1.4
26 Wood Products 3.3% 2.9% 1.7 1.411 Natural Sands 2.5% 2.8% 1.3 1.4
34 Machinery 2.2% 2.6% 1.1 1.332 Base Metals and Shapes 2.8% 2.4% 1.4 1.2
17 Gasoline and Related Fuels 2.6% 2.4% 1.3 1.219 Other Coal and Petroleum Products 1.6% 2.3% 0.8 1.1
12 Gravel and Crushed Stone 0.8% 2.0% 0.4 1.009 Tobacco Products 1.5% 2.0% 0.8 1.0
37 Other Transportation Equipment 1.5% 1.5% 0.8 0.816 Crude Petroleum 1.4% 1.5% 0.7 0.804 Animal Products 0.3% 1.1% 0.1 0.6
22 Fertilizers 0.3% 0.5% 0.1 0.202 Cereal Grains 0.3% 0.5% 0.1 0.2
25 Logs and Rough Wood 0.1% 0.4% 0.1 0.201 Animals and Fish (live) 0.2% 0.4% 0.1 0.2
15 Coal 0.2% 0.1% 0.1 0.0Total 2.1% 3.4% 1.1 1.7
Share of Nat'l Total "Freight Quotient" (FQ)
New Jersey Statewide FREIGHT PLAN
46
Modal and Commodity Forecasts to the Year 2045 Overall, the state is projected to add 269 million tons between 2015 and 2045, representing a 1.4% CAGR. The added tonnage will be evenly divided between inbound, outbound, and internal flows, as illustrated in Table 10. Table 11 details that nearly half the tonnage will be associated with international trade, which is forecast to increase much more rapidly than domestic trade. Table 12 illustrates that trucking is projected to add the most tonnage, but will grow at the regional average CAGR. Multiple modes and air cargo are projected to grow much faster than the regional average CAGR, while rail and water are also expected to grow at above-average rates. Pipeline traffic is expected to grow more slowly than the average rate. From a commodity perspective, Table 13 confirms that there is likely to be a substantial re-shuffling among the tonnage leaders by the year 2045. Other coal and petroleum products remains the leading tonnage commodity, but grows at only 0.6% per year. Diesel and related fuel oils grows at 1.1% to become a close second, and Other prepared foodstuffs grows strongly at 2.3% to climb into third position. Gravel and crushed stone, currently ranked second, drops to fourth, while Non-metallic mineral products climbs to fifth. Almost all significant commodities see at least some growth, except for gasoline and related fuels, which shows a significant decline, presumably due to the substitution of other fuels.
Table 14 summarizes commodity value; the forecast calls for very strong and dramatic growth, $979 billion to over $2 trillion in value, representing a compound annual growth rate of 2.5%. This is far stronger than the tonnage growth rate, and reflects the fact that high-value commodities are expected to grow faster than low-value commodities. The leading value commodities in 2045 are forecast to include: electronic equipment; pharmaceutical products; miscellaneous manufactured products; machinery; other chemical products; textiles and leather; mixed freight; vehicles and parts; precision instruments; and other prepared foodstuffs.

Chapter 3: FREIGHT ACTIVITY, INDUSTRIES, TRENDS
47
Table 10: Forecast Tons by Direction
Source: WSP analysis of FAF-4.
Table 11: Forecast Tons by Trade Type
Source: WSP analysis of FAF-4.
Table 12: Forecast Tons by State-to-State Mode
Source: WSP analysis of FAF-4.
State-to-State Flows
Tons 2015 (M)
Tons 2045 (M)
Tons Added (M)
Tonnage CAGR
Inbound 150.07 233.96 83.89 1.5%Internal 224.71 317.35 92.64 1.2%
Outbound 136.98 229.65 92.67 1.7%Total 511.76 780.96 269.2 1.4%
Trade TypeTons 2015
(M)Tons 2045
(M)Tons Added
(M)Tonnage
CAGRDomestic 419.31 563.41 144.1 1.0%
Import 75.57 169.87 94.3 2.7%Export 16.88 47.68 30.8 3.5%
Total 511.76 780.96 269.2 1.4%
Mode (State to State)
Tons 2015 (M)
Tons Added (M) Tonnage CAGR
Truck 364.59 188.99 1.4%Pipeline 76.66 23.82 0.9%
Rail 15.16 22.85 3.1%None 22.53 14.84 1.7%
Water 15.95 12.43 1.9%Multiple 16.57 5.61 1.0%
Air 0.22 0.41 3.6%Unknown 0.09 0.24 4.5%
Total 511.77 269.19 1.4%
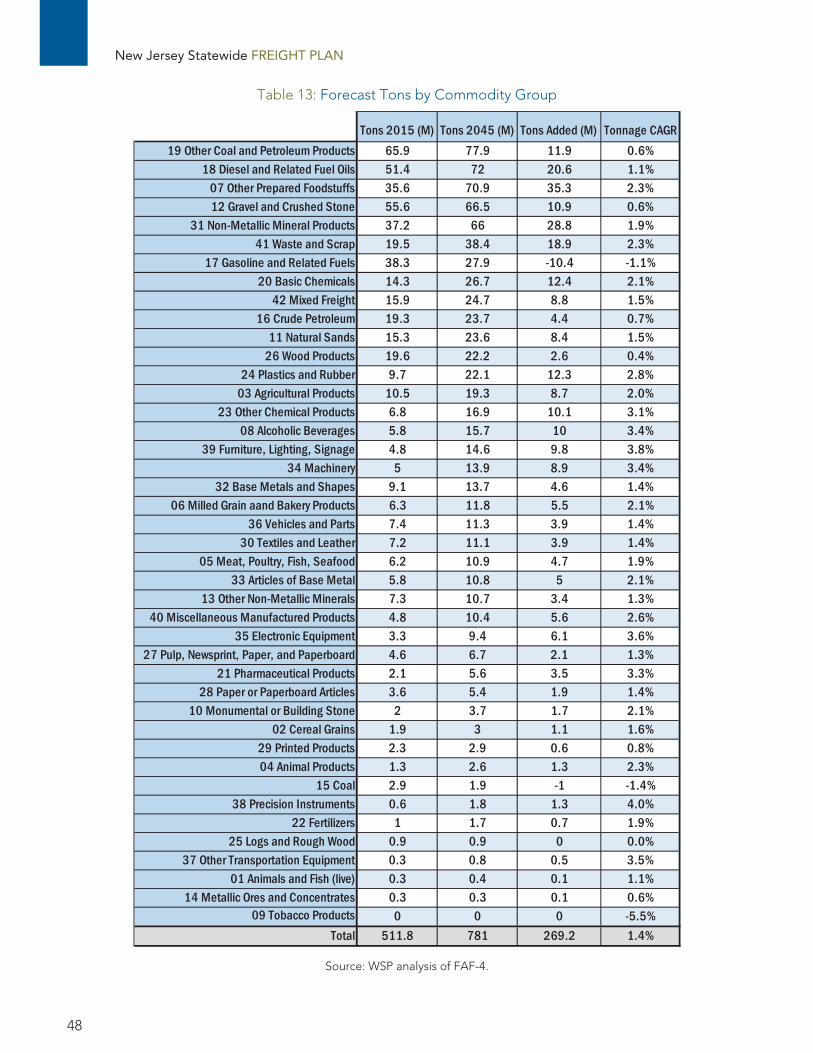
New Jersey Statewide FREIGHT PLAN
48
Table 13: Forecast Tons by Commodity Group
Source: WSP analysis of FAF-4.
Tons 2015 (M) Tons 2045 (M) Tons Added (M) Tonnage CAGR19 Other Coal and Petroleum Products 65.9 77.9 11.9 0.6%
18 Diesel and Related Fuel Oils 51.4 72 20.6 1.1%07 Other Prepared Foodstuffs 35.6 70.9 35.3 2.3%12 Gravel and Crushed Stone 55.6 66.5 10.9 0.6%
31 Non-Metallic Mineral Products 37.2 66 28.8 1.9%41 Waste and Scrap 19.5 38.4 18.9 2.3%
17 Gasoline and Related Fuels 38.3 27.9 -10.4 -1.1%20 Basic Chemicals 14.3 26.7 12.4 2.1%
42 Mixed Freight 15.9 24.7 8.8 1.5%16 Crude Petroleum 19.3 23.7 4.4 0.7%
11 Natural Sands 15.3 23.6 8.4 1.5%26 Wood Products 19.6 22.2 2.6 0.4%
24 Plastics and Rubber 9.7 22.1 12.3 2.8%03 Agricultural Products 10.5 19.3 8.7 2.0%
23 Other Chemical Products 6.8 16.9 10.1 3.1%08 Alcoholic Beverages 5.8 15.7 10 3.4%
39 Furniture, Lighting, Signage 4.8 14.6 9.8 3.8%34 Machinery 5 13.9 8.9 3.4%
32 Base Metals and Shapes 9.1 13.7 4.6 1.4%06 Milled Grain aand Bakery Products 6.3 11.8 5.5 2.1%
36 Vehicles and Parts 7.4 11.3 3.9 1.4%30 Textiles and Leather 7.2 11.1 3.9 1.4%
05 Meat, Poultry, Fish, Seafood 6.2 10.9 4.7 1.9%33 Articles of Base Metal 5.8 10.8 5 2.1%
13 Other Non-Metallic Minerals 7.3 10.7 3.4 1.3%40 Miscellaneous Manufactured Products 4.8 10.4 5.6 2.6%
35 Electronic Equipment 3.3 9.4 6.1 3.6%27 Pulp, Newsprint, Paper, and Paperboard 4.6 6.7 2.1 1.3%
21 Pharmaceutical Products 2.1 5.6 3.5 3.3%28 Paper or Paperboard Articles 3.6 5.4 1.9 1.4%
10 Monumental or Building Stone 2 3.7 1.7 2.1%02 Cereal Grains 1.9 3 1.1 1.6%
29 Printed Products 2.3 2.9 0.6 0.8%04 Animal Products 1.3 2.6 1.3 2.3%
15 Coal 2.9 1.9 -1 -1.4%38 Precision Instruments 0.6 1.8 1.3 4.0%
22 Fertilizers 1 1.7 0.7 1.9%25 Logs and Rough Wood 0.9 0.9 0 0.0%
37 Other Transportation Equipment 0.3 0.8 0.5 3.5%01 Animals and Fish (live) 0.3 0.4 0.1 1.1%
14 Metallic Ores and Concentrates 0.3 0.3 0.1 0.6%09 Tobacco Products 0 0 0 -5.5%
Total 511.8 781 269.2 1.4%

Chapter 3: FREIGHT ACTIVITY, INDUSTRIES, TRENDS
49
Table 14: Forecast Value by Commodity Group
Source: WSP analysis of FAF-4.
Value 2015 ($M)
Value 2045 ($M) Value Added Value CAGR
35 Electronic Equipment 80,660$ 220,718$ 140,058$ 3.4%21 Pharmaceutical Products 74,039$ 205,783$ 131,744$ 3.5%
40 Miscellaneous Manufactured Products 54,158$ 129,932$ 75,774$ 3.0%34 Machinery 43,530$ 125,315$ 81,785$ 3.6%
23 Other Chemical Products 51,366$ 121,231$ 69,865$ 2.9%30 Textiles and Leather 63,365$ 118,752$ 55,387$ 2.1%
42 Mixed Freight 68,692$ 115,823$ 47,130$ 1.8%36 Vehicles and Parts 75,894$ 113,119$ 37,225$ 1.3%
38 Precision Instruments 29,660$ 102,471$ 72,812$ 4.2%07 Other Prepared Foodstuffs 45,657$ 98,116$ 52,459$ 2.6%
24 Plastics and Rubber 35,823$ 80,172$ 44,349$ 2.7%20 Basic Chemicals 33,196$ 76,479$ 43,282$ 2.8%
39 Furniture, Lighting, Signage 23,211$ 60,539$ 37,327$ 3.2%18 Diesel and Related Fuel Oils 38,311$ 53,359$ 15,048$ 1.1%
05 Meat, Poultry, Fish, Seafood 24,515$ 44,323$ 19,808$ 2.0%33 Articles of Base Metal 20,575$ 39,273$ 18,698$ 2.2%
31 Non-Metallic Mineral Products 17,571$ 38,359$ 20,789$ 2.6%08 Alcoholic Beverages 12,606$ 37,848$ 25,243$ 3.7%
19 Other Coal and Petroleum Products 28,490$ 33,281$ 4,791$ 0.5%03 Agricultural Products 17,737$ 33,141$ 15,404$ 2.1%
32 Base Metals and Shapes 19,664$ 30,496$ 10,832$ 1.5%37 Other Transportation Equipment 9,979$ 28,608$ 18,628$ 3.6%
17 Gasoline and Related Fuels 35,078$ 23,967$ (11,111)$ -1.3%06 Milled Grain aand Bakery Products 11,377$ 21,028$ 9,651$ 2.1%
41 Waste and Scrap 6,782$ 18,013$ 11,231$ 3.3%16 Crude Petroleum 12,999$ 16,013$ 3,014$ 0.7%29 Printed Products 11,566$ 15,578$ 4,012$ 1.0%
26 Wood Products 8,453$ 11,235$ 2,781$ 1.0%28 Paper or Paperboard Articles 6,620$ 10,508$ 3,888$ 1.6%
27 Pulp, Newsprint, Paper, and Paperboard 4,984$ 7,250$ 2,266$ 1.3%04 Animal Products 2,519$ 4,779$ 2,261$ 2.2%
02 Cereal Grains 1,551$ 3,122$ 1,571$ 2.4%14 Metallic Ores and Concentrates 2,166$ 2,408$ 241$ 0.4%10 Monumental or Building Stone 1,294$ 1,875$ 581$ 1.2%
13 Other Non-Metallic Minerals 1,021$ 1,804$ 784$ 1.9%22 Fertilizers 761$ 1,286$ 525$ 1.8%
01 Animals and Fish (live) 811$ 1,134$ 323$ 1.1%12 Gravel and Crushed Stone 528$ 634$ 106$ 0.6%
11 Natural Sands 343$ 529$ 186$ 1.5%09 Tobacco Products 1,666$ 269$ (1,397)$ -5.9%
25 Logs and Rough Wood 83$ 167$ 84$ 2.4%15 Coal 68$ 67$ (1)$ 0.0%
Total 979,371$ 2,048,805$ 1,069,433$ 2.5%

New Jersey Statewide FREIGHT PLAN
50
New Jersey’s Industries and Freight Movement New Jersey ranks 11th among US states in civilian labor force, and 8th among US states in Gross Domestic Product (GDP), having produced more than $581 billion in goods and services in 2016. As Table 15 shows, New Jersey’s top industry sectors by GDP include real estate and leasing, government, professional and technical services, and manufacturing.
About 28% of the state’s economy is represented by sectors that are directly engaged in the production and handling of freight. These sectors include manufacturing, wholesale trade, retail trade, construction, transportation and warehousing, utilities, agriculture, and mining.
Other sectors depend upon safe and efficient freight transportation as well. For instance, professional services firms rely upon consistent and regular delivery of office supplies, and generate outbound flows of waste. Health care facilities require regular supply of pharmaceuticals, medical supplies, and food. All sectors of New Jersey’s economy generate freight demand, and safe and efficient freight transportation, therefore, is vital to the sustenance and growth of all sectors of New Jersey’s economy.
As shown in Table 15 and Table 16, GDP in New Jersey’s freight industries is heavily concentrated in wholesale and retail trade; these represent nearly 40% of all freight-related GDP. Chemical products manufacturing and construction each represent nearly 11% of freight related GDP. Utilities represents nearly 6% of freight-related GDP. Food services represents just over 4% of freight-related GDP, while food production (farms, fishing, and food products manufacturing) represents a combined 2.4%. These represent the largest components of New Jersey’s freight GDP.
Between 2007 and 2014 – from the onset of the “great recession” to recovery – more than 50% of the growth in New Jersey’s freight GDP came from wholesale and retail trade. During this period, freight GDP grew by nearly 17 billion dollars. Other major contributors to growth were utilities, food services and production, construction, and air transportation. Chemical manufacturing and most other manufacturing has been generally flat or showing slight declines since 2007. However, freight jobs were lost during this period, meaning that growth in GDP was largely driven by increased productivity.
According to James Hughes, Dean of the Bloustein School at Rutgers University, “New Jersey lost 240,700 private sector jobs during the great recession, but it has since regained close to 300,000 jobs.” Dean Hughes continues: “The economic areas that will drive New Jersey’s employment growth in 2017 are led by the trade, transportation and utilities sector. New Jersey is the third largest warehouse-fulfillment-distribution center in the nation. The state’s unique geographic position and the continuing growth of e-commerce and omnichannel retailing underpin the continuing strength of this sector.”9
9 “2017 Economic Forecasts,” New Jersey Business Magazine, 2 January 2017: https://njbmagazine.com/monthly_articles/2017-economic-forecasts

Chapter 3: FREIGHT ACTIVITY, INDUSTRIES, TRENDS
51
Table 15: New Jersey Freight Industry GDP and Growth
Source: WSP analysis of US Bureau of Economic Analysis data

New Jersey Statewide FREIGHT PLAN
52
Table 16: New Jersey Freight Industry GDP and Growth Shares
Source: WSP analysis of US Bureau of Economic Analysis data

Chapter 3: FREIGHT ACTIVITY, INDUSTRIES, TRENDS
53
Looking at the first quarter of 2017, freight-related jobs are broadly dispersed among New Jersey’s counties, as illustrated in Figure 32, and different types of industries tend to cluster in different counties.
Figure 32: New Jersey Freight Nonfarm Employment by County, Q1 2017
Source: WSP analysis of Quarterly Census of Employment and Workforce (QCEW) data

New Jersey Statewide FREIGHT PLAN
54
In the spring of 2017, the New Jersey Department of Labor and Workforce Development published a series of detailed reports on New Jersey’s industry clusters, looking at current workforce sizes and locations, as well as future growth projections.10 Looking to the future, emerging trends are likely to change the balance of industry sectors throughout the state:
Warehousing and distribution center development supporting traditional retail, e-commerce, and wholesale trade is expected to continue to grow in New Jersey’s traditional warehousing hubs and in emerging clusters. Areas around New Jersey Turnpike Interchanges 10, 8A, 7A, and 6 currently have and will likely continue to host millions of square feet of new warehousing and distribution center space. In northern parts of the state, (Interchange 12 of the Turnpike, and parts of Union, Essex, and Hudson counties) proximity to urban New Jersey and New York populations is fueling demand for e-commerce distribution centers capable of fulfilling same-day orders and refrigerated storage and distribution facilities for high-value food products. The technology and productivity of these emerging distribution facilities require a workforce that is skilled and trained, more so than in previous generations. This need presents an opportunity for freight and workforce development and education stakeholders to work together to position New Jersey’s workforce to take advantage of growth opportunities in this sector.
Advanced manufacturing is cited in many local economic development plans as an emerging sector or potential opportunity. Business establishments in this sector also require skilled and well-trained employees. While advanced manufacturing has seen job losses over the last decade, gains in food-related manufacturing are expected, while other industries will see flat growth or modest declines.
Agriculture remains an important industry, particularly in southern counties such as Cumberland, Salem, and Atlantic. Opportunities to improve the movement of goods to market could be found in improved rail access or developing produce distribution facilities near Atlantic City International Airport.
Tourism, health care, education, and professional services are sectors that local economic development professionals in many parts of the state expect to grow in the future. Business establishments in these sectors require regular delivery of food products, construction materials, and petroleum products for fuel or heating. They also generate outbound shipments of waste.
10 See http://lwd.state.nj.us/labor/lpa/pub/empecon/empeconomy_index.html for details

Chapter 3: FREIGHT ACTIVITY, INDUSTRIES, TRENDS
55
Supply Chains and Industry Clusters The specific transportation challenges and needs of New Jersey’s key legacy and emerging industry sectors are different from one another. The New Jersey Statewide Freight Plan accounts for these unique features and challenges by analyzing the supply chains of commodities used and produced by New Jersey industries.
Table 17 shows the relationships between New Jersey’s economic sectors and bundled groups of freight commodities, indicating commodities produced or consumed by each industry sector. Traditional “freight-generating” industry sectors, such as manufacturing, wholesale trade, agriculture, and mining, produce materials or goods that are distributed to consumers and to business establishments in other industry sectors.
Table 17: New Jersey Industry Sectors Linked to Commodity Groups
Industry Sectors
Commodity Flows by Group
Dura
ble &
Non
dura
ble
Cons
umer
Goo
ds
Cons
truct
ion M
ater
ials
Ener
gy an
d Ch
emica
ls
Dist
ribut
ion T
raffi
c
Was
te
Real Estate and Rental and Leasing Government Professional, Scientific, and Technical Services Manufacturing Wholesale Trade Health Care and Social Assistance Finance and Insurance Retail Trade Information Construction Administrative and Waste Management Services Transportation and Warehousing Management of Companies and Enterprises Accommodation and Food Services Other Services, Except Government Utilities Educational Services Arts, Entertainment, and Recreation Agriculture, Forestry, Fishing, and Hunting Mining

New Jersey Statewide FREIGHT PLAN
56
Industry sectors that are generally not considered among “freight-generating” sectors, also are reliant upon a regular supply of certain goods, and generate outbound shipments of waste. Real estate, for example, is an industry dependent upon continuing construction or rehabilitation of residential or commercial properties to replenish the supply of saleable or leasable real estate. The movement of construction materials, therefore, is critical to the prosperity of the real estate industry. Professional services, information, finance and insurance, and other sectors employing highly-skilled professionals in office environments make up a large share of the state’s employment and GDP. Although these sectors are not directly engaged in trades that generate freight, these sectors require office space to be constructed and leased, they consume energy products to control the climate in those office spaces, and they generate outbound shipments of waste.
The following profiles illustrate the supply chains of the industry sectors noted above, in composite. While each business establishment in New Jersey uniquely sources materials and distributes products, the profiles are intended to illustrate, generally, how industries throughout the State receive and send raw materials and products, and the demands on New Jersey’s multimodal freight transportation system.
In general, most supply chains include activities in one or more of the following five stages:
1. Raw materials extraction and production, including mining, logging, agricultural production, fishing and hunting, etc.;
2. Manufacturing of finished products; 3. Distribution of products to consumer markets; 4. Consumer sales via retail stores, e-commerce, or direct-to-consumer sales; and 5. Waste recycling or disposal.
The supply chain descriptions for durable and non-durable consumer goods, construction materials, and energy and chemicals focus on steps one and two, and the transportation of goods to step three. The distribution supply chain describes flows of goods through step three to step four. The waste supply chain describes the final step, moving waste from consumers to recycling or disposal sites.
Raw Materials Extraction/ Production
Manufacturing DistributionConsumer
(direct or via retailer)
Waste Recycling/
Disposal

Chapter 3: FREIGHT ACTIVITY, INDUSTRIES, TRENDS
57
Durable and Non-Durable Consumer Goods Durable and non-durable consumer goods are goods produced for household or business consumption. They include durable goods, such as furniture and machinery, and non-durable goods, such as food and apparel.
Figure 33 shows the general supply chain steps and links for durable and nondurable goods. The supply chain begins with the extraction of raw materials used to make the goods. In the case of machinery, for example, these materials could include metals, and in the case of food, these materials could include agriculture products. Raw materials are transported by a variety of modes to manufacturing facilities, where finished goods are produced and/or assembled. From there, goods are moved to wholesale and/or retail distribution centers, where the goods are prepared for delivery to stores or directly to consumers. Some commodities, including custom-order products, are transported directly from manufacturers to consumer, bypassing wholesale and retail establishments.
Figure 33: Durable and Nondurable Consumer Goods Supply Chain
Durable consumer goods are products that are used in homes and business establishments that have a relatively long lifespan. Durable goods commodities include furniture and fixtures, machinery, transportation equipment, and electronics. In 2015, approximately 17 million tons of durable goods moved to and/or from establishments in New Jersey.
Industry sectors that produce, handle, and/or distribute durable goods include furniture and home goods manufacturing, furniture and home goods retailers, transportation equipment manufacturing, machinery manufacturing, automotive and transportation equipment sales, machinery and equipment rental and leasing. Figure 34 and Figure 35 show the locations of business establishments11 of these types in New Jersey. Clusters exist in the urban areas spanning southern Bergen and Passaic counties, Essex, Union, and northern Middlesex counties, and in northern Camden County.
11 Business Establishment Data was primarily generated using Torto Wheaton Research and augmented in South Jersey using information provided by SJTPO.

New Jersey Statewide FREIGHT PLAN
58
Figure 34: Business Establishments (Machinery, Electronics, and Transportation Equipment Sectors), 2012

Chapter 3: FREIGHT ACTIVITY, INDUSTRIES, TRENDS
59
Figure 35: Business Establishments (Furniture and Fixtures Sector), 2012

New Jersey Statewide FREIGHT PLAN
60
Figure 36 and Figure 37 show the flows of truck trips carrying machinery, electronics, and transportation equipment and of furniture and fixtures on the highway network. For both commodity groups, the Interstate 95/295/New Jersey Turnpike corridor, Interstate 78, and Interstate 80 are the highest-volume corridors. More than 3.5 million tons of machinery, electronics, and transportation goods and over 500,000 tons of furniture and fixtures goods traveled on portions of these corridors in 2007, and more than 7 million tons of machinery, electronics, and transportation equipment could be transported on portions of Interstate 78 by 2035. The New Jersey Turnpike in the vicinity of the Port could see the greatest increase in furniture volume by 2035.
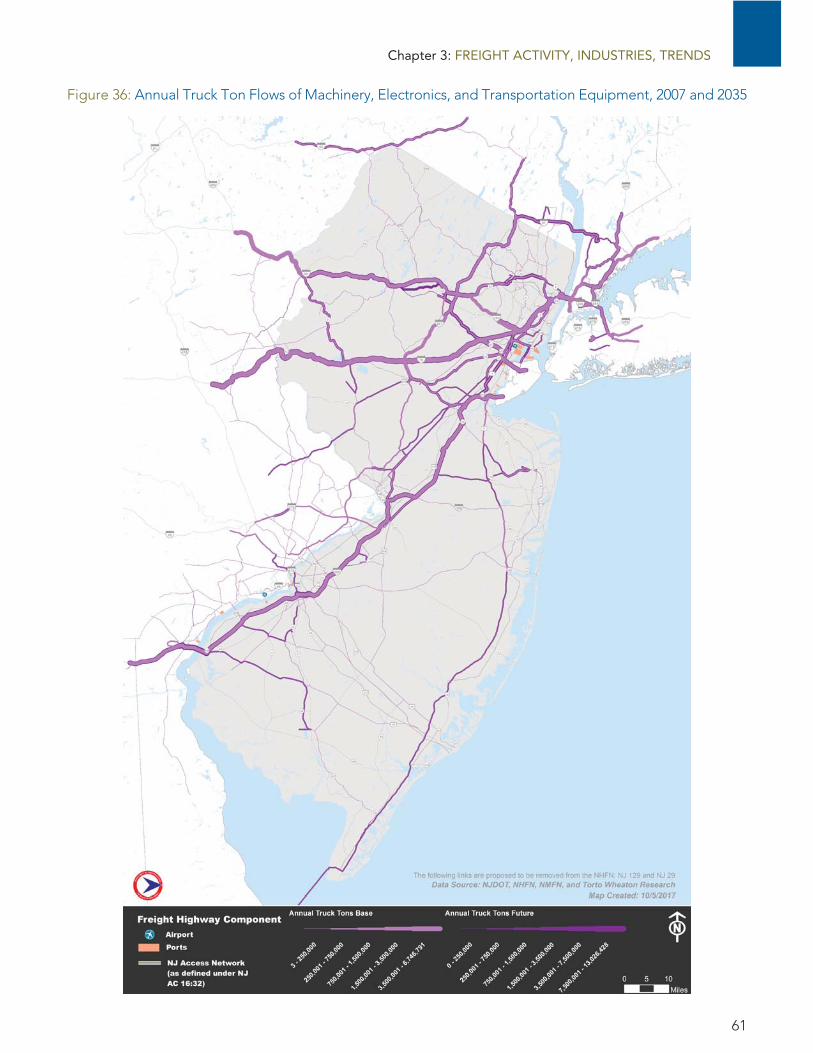
Chapter 3: FREIGHT ACTIVITY, INDUSTRIES, TRENDS
61
Figure 36: Annual Truck Ton Flows of Machinery, Electronics, and Transportation Equipment, 2007 and 2035

New Jersey Statewide FREIGHT PLAN
62
Figure 37: Annual Truck Ton Flows of Furniture and Fixtures, 2007 and 2035
Chapter 3: FREIGHT ACTIVITY, INDUSTRIES, TRENDS
63
Nondurable consumer goods include commodities such as agriculture and food products, textiles and apparel, and paper or printed materials. Approximately 65 million tons of nondurable consumer goods moved into, out of, or within New Jersey in 2015. By 2045, the volume of goods in this commodity group is expected to grow 50% to 98 million tons. Industry sectors producing or distributing these goods include agriculture, food/beverage manufacturing, food/beverage retail, restaurants and hospitality venues, textiles and apparel manufacturing, fabric or rug mills, clothing wholesale and retail trades, book wholesale and retail trades, printing, labeling and shipping, and office supply. Business establishments in these sectors, shown in Figure 38, Figure 39, and Figure 40, are clustered primarily in and around the major population centers throughout the state.

New Jersey Statewide FREIGHT PLAN
64
Figure 38: Business Establishments (Food-related Sectors), 2012
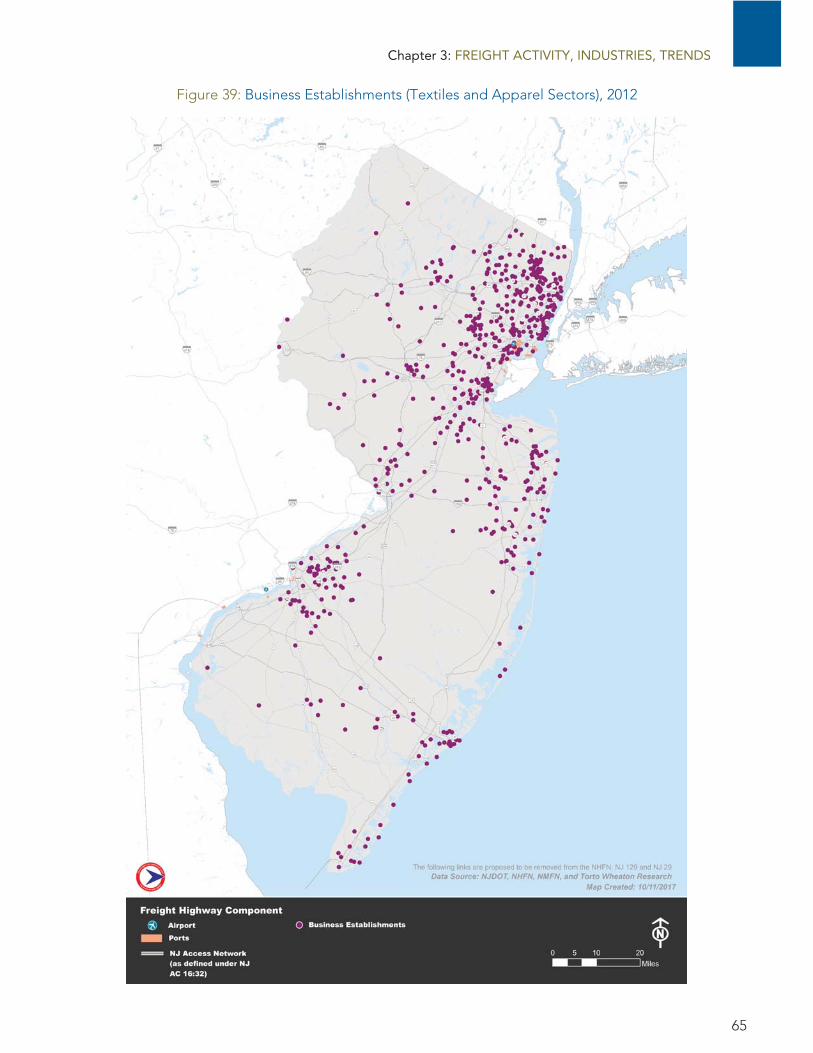
Chapter 3: FREIGHT ACTIVITY, INDUSTRIES, TRENDS
65
Figure 39: Business Establishments (Textiles and Apparel Sectors), 2012

New Jersey Statewide FREIGHT PLAN
66
Figure 40: Business Establishments (Paper and Printed Materials Sectors), 2012

Chapter 3: FREIGHT ACTIVITY, INDUSTRIES, TRENDS
67
In 2007, Interstate 78 in Hunterdon County and Interstate 95 in Bergen County carried more than 10 million tons of food. By 2035, volumes on these corridors could increase to over 15 million tons. Textiles and apparel are heavily-reliant upon Interstate 78, where more than 1.5 million tons were transported in 2007. Volumes there and on the New Jersey Turnpike between Exit 10 and the George Washington Bridge could grow by more than 45 percent by 2035. Paper and printed materials volumes are greatest along Interstates 80, 78, and 295. As shown in Figure 41, Figure 42, and Figure 43, growth in truck tonnage is expected to be greatest on non-interstate highways, including Route 202, Route 9, Route 24, and Route 22.
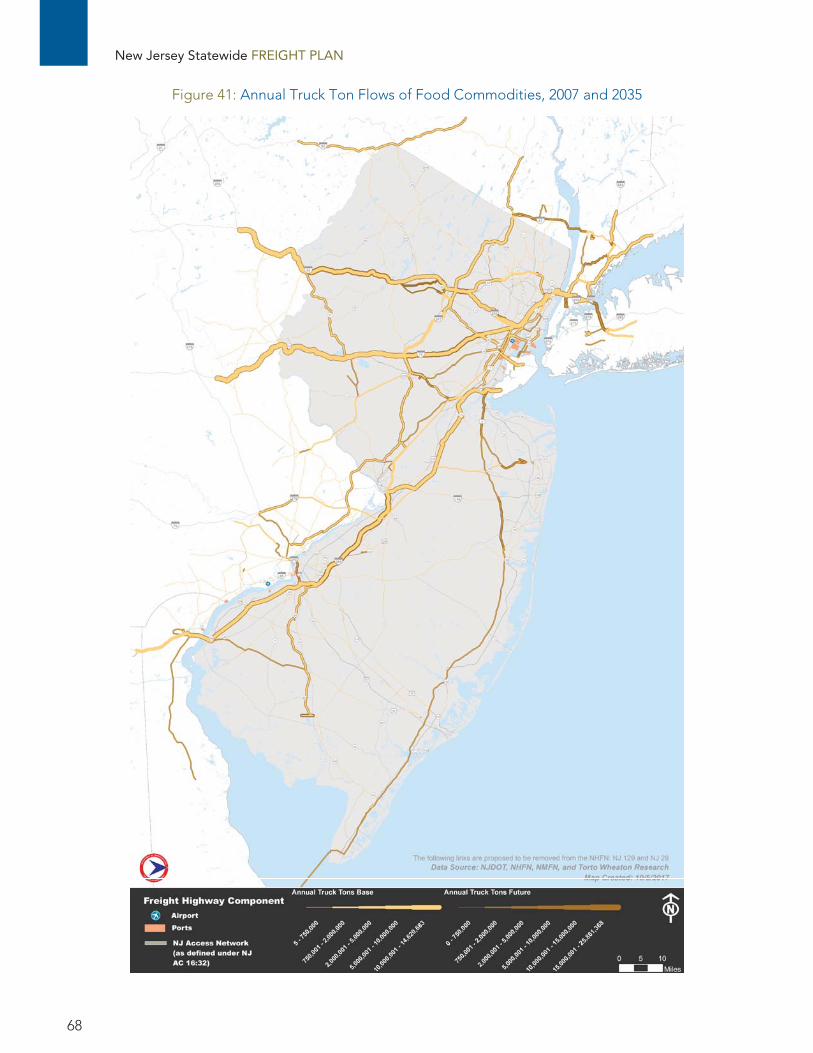
New Jersey Statewide FREIGHT PLAN
68
Figure 41: Annual Truck Ton Flows of Food Commodities, 2007 and 2035

Chapter 3: FREIGHT ACTIVITY, INDUSTRIES, TRENDS
69
Figure 42: Annual Truck Ton Flows of Textiles and Apparel, 2007 and 2035

New Jersey Statewide FREIGHT PLAN
70
Figure 43: Annual Truck Ton Flows of Paper and Printed Materials, 2007 and 2035

Chapter 3: FREIGHT ACTIVITY, INDUSTRIES, TRENDS
71
Construction Materials Construction materials include stone, concrete, glass, lumber, and metal products used to construct buildings and other infrastructure.
Figure 44 shows the general supply chain steps and links for construction materials. The supply chain begins with the extraction of raw materials. Some grades of sand, soils, and stone are not manufactured and are sent to job sites or to consumer markets directly from the point of extraction. For goods that are manufactured, such as dimensional lumber products, stone products, etc., the raw materials are transported to manufacturing facilities. Manufactured goods are transported either directly to job sites, to consumer markets, or through distribution channels before ultimately reaching the job sites and consumer markets.
Figure 44: Construction Materials Supply Chain
Industry sectors that produce, handle, and/or distribute construction materials include mining; concrete, glass, iron or steel, or lumber production; building and home construction; construction contractors; and hardware and construction materials wholesalers and retailers. Figure 45 shows the locations of business establishments of these types in the New Jersey. Clusters exist in the urbanized northeast, southern New Jersey suburbs near Philadelphia, and portions of Monmouth and northern Ocean counties.
About 132 million tons of construction materials moved into, out of, or within New Jersey in 2015, and more than 181 million tons (37 percent growth) are expected by 2045. More than 98 percent of construction materials moving to or from New Jersey establishments travel by truck. As shown in Figure 46, these flows appear in the greatest volume on the highway network along Interstate 80, portions of the New Jersey Turnpike, Interstate 295, and Route 202.

New Jersey Statewide FREIGHT PLAN
72
Figure 45: Business Establishments (Construction Materials Sectors), 2012

Chapter 3: FREIGHT ACTIVITY, INDUSTRIES, TRENDS
73
Figure 46: Annual Truck Ton Flows of Construction Materials, 2007 and 2035

New Jersey Statewide FREIGHT PLAN
74
Energy and Chemicals Energy and chemicals include coal, crude petroleum, refined petroleum products, industrial chemicals, agricultural chemicals, and pharmaceuticals.
Figure 47 shows the supply chain for goods in this commodity group. Raw materials used to create energy and chemical products include coal, crude petroleum, natural gas, minerals, salts, and water. These materials are mined or extracted and transported by rail, water, pipeline, or truck to facilities that manufacture energy, petroleum, or chemical products. These products are transported directly to institutional, commercial, or private consumers directly, or may be moved through distribution centers or held in storage facilities before advancing to consumers.
Figure 47: Energy and Chemicals Supply Chain
Industry sectors that produce, handle, or distribute and sell products in this group include mining, drilling, petroleum refineries, petrochemical manufacturing, pharmaceutical manufacturing, chemical manufacturing, natural gas or petroleum distribution, chemical sales and distribution, and health care. Business establishments in these industry sectors are illustrated in Figure 48, Figure 49, and Figure 50 below.

Chapter 3: FREIGHT ACTIVITY, INDUSTRIES, TRENDS
75
Figure 48: Business Establishments (Energy Sector), 2012

New Jersey Statewide FREIGHT PLAN
76
Figure 49: Business Establishments (Chemicals Sector), 2012

Chapter 3: FREIGHT ACTIVITY, INDUSTRIES, TRENDS
77
Figure 50: Business Establishments (Pharmaceuticals Sector), 2012

New Jersey Statewide FREIGHT PLAN
78
About 136 million tons of freight in this commodity group moved to and/or from business establishments in New Jersey in 2015, and about 190 million tons are expected in 2045 (40 percent growth). About 49 percent of goods in this group move by water, consisting mostly of energy products, and 44 percent move by truck. Figure 51 shows the truck tonnage of goods in this group on New Jersey’s highway network. For energy products, Interstate 80, and Interstate 95 in the vicinity of the George Washington Bridge carry the greatest volume of product, up to 10 million tons annually. The New Jersey Turnpike and I-295 corridor carry the greatest volume of chemicals, up to 10 million tons on some segments. As shown in Figure 51, Figure 52, and Figure 53, Interstates 78, 80, 287, the New Jersey Turnpike, and portions of NJ Route 31 carry the greatest volumes of pharmaceuticals.

Chapter 3: FREIGHT ACTIVITY, INDUSTRIES, TRENDS
79
Figure 51: Annual Truck Ton Flows of Energy Products, 2007 and 2035

New Jersey Statewide FREIGHT PLAN
80
Figure 52: Annual Truck Ton Flows of Chemicals, 2007 and 2035

Chapter 3: FREIGHT ACTIVITY, INDUSTRIES, TRENDS
81
Figure 53: Annual Truck Ton Flows of Pharmaceuticals, 2007 and 2035

New Jersey Statewide FREIGHT PLAN
82
Distribution Traffic Distribution traffic consists of a broad mix of commodities, parcels, and mail, which are transported through warehouses, distribution centers, and fulfillment centers en-route to retail establishments or directly to consumers. This group also includes drayage from ports or intermodal rail terminals to warehouses, distribution, and fulfillment centers.
Figure 54 shows the progression of distribution traffic through the supply chain. Goods produced in manufacturing facilities domestically or overseas are transported to distribution centers owned by a wholesaler, who distributes to retailers, or to a retailer’s distribution center. The wholesaler distribution center sends shipments to retail distribution centers, or directly to retail stores or consumers. The retailer’s distribution centers or fulfillment centers send shipments to retail stores or fulfills e-commerce orders shipped directly to consumers.
Figure 54: Distribution Traffic Supply Chain
Industry sectors that handle distribution traffic include wholesale trade, retail trade, freight transportation services, cargo handling, and couriers and delivery. Figure 55 shows the distribution of business establishments in these sectors across the state of New Jersey. Establishments are clustered in the state’s most densely-populated urban and suburban areas.
About 101 million tons of distribution traffic freight moved in, out, or within New Jersey in 2015. This volume is expected to grow 54 percent to 156 million tons by 2045. Distribution traffic moves almost exclusively by truck. Figure 56 shows the truck tonnage of distribution traffic moved on New Jersey highways in 2007 and 2035. This illustrates that the New Jersey Turnpike (north of Exit 10) and Interstate 78 west of Interstate 287 are the highest-volume corridors, carrying more than 25 million tons in 2007.

Chapter 3: FREIGHT ACTIVITY, INDUSTRIES, TRENDS
83
Figure 55: Business Establishments (Distribution Sectors), 2012

New Jersey Statewide FREIGHT PLAN
84
Figure 56: Annual Truck Ton Flows of Distribution Traffic, 2007 and 2035

Chapter 3: FREIGHT ACTIVITY, INDUSTRIES, TRENDS
85
Waste Waste includes waste and scrap materials and municipal solid waste.
Figure 57 shows the progression of waste, beginning at the point of pickup from residential and commercial sources. Waste collection vehicles bring waste to local transfer stations, where the waste is consolidated into larger truckloads for transport to resource recovery facilities, where waste is separated into various recycling streams, waste-to-energy streams, or set aside for disposal in a landfill. In some areas, resource recovery occurs at local transfer stations. Waste that is to be recycled or converted to energy is transported to facilities where those activities occur. Waste disposed at landfills are transported to landfills in New Jersey or in other states.
Figure 57: Waste Supply Chain
Industry sectors handling waste include waste collection and hauling, transfer stations, materials recovery, recycling, waste-to-energy conversion, and solid waste landfills. Figure 58 shows the distribution of these business types throughout the State of New Jersey. Though present in most urban and suburban areas of the state, larger clusters of these facilities are located in eastern Essex and northern Camden counties.
About 26 million tons of waste moved in, out, or within New Jersey in 2015. This volume is expected to grow 55% to 40 million tons by 2045. Waste in New Jersey moves mostly by truck, though 20%, consisting largely of waste and scrap metal, move by barge. Figure 59 shows the truck tonnage of waste moved on New Jersey highways in 2007 and 2035. Interstate 78 carries the greatest volume of waste among highway corridors in New Jersey. About 6 million tons were moved on Interstate 78 in 2007.
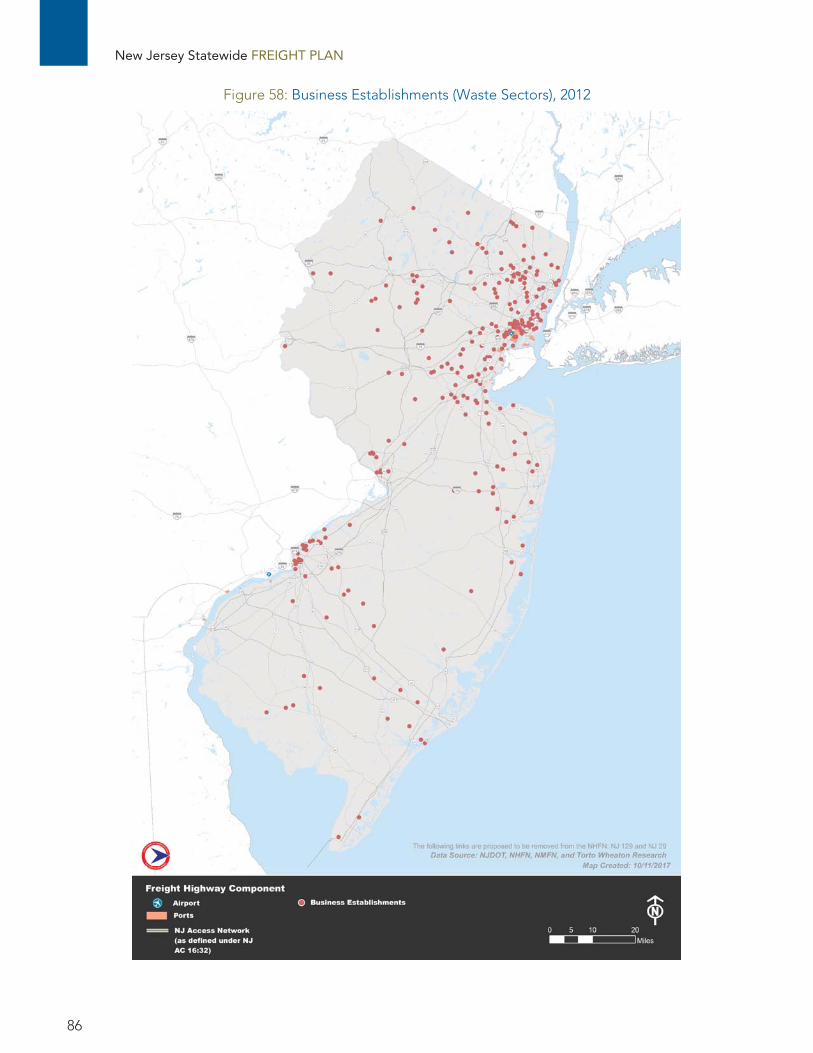
New Jersey Statewide FREIGHT PLAN
86
Figure 58: Business Establishments (Waste Sectors), 2012

Chapter 3: FREIGHT ACTIVITY, INDUSTRIES, TRENDS
87
Figure 59: Annual Truck Ton Flows of Waste, 2007 and 2035

New Jersey Statewide FREIGHT PLAN
88
Freight Activity and Industries - Summary Based on the analysis of FAF data, New Jersey’s freight transportation system handled more than 511 million tons of freight worth over $979 bbillion in 2015. Of this, more than half of the tonnage and nearly 80% of the value was either inbound or outbound, with the remainder moving within New Jersey. Over 419 million tons (81.9% of total) and nearly $704 billion in value (72% of total) is associated with purely domestic freight movement; international imports comprise the bulk of the remainder: 14.8% of total tons and 22.8% of value, while international exports represent 3.4% of tonnage and 5.3% of value.
New Jersey’s leading commodities include a wide range of produced and consumed goods, typical for a highly-populated state with a diversified economy and significant international trade. Leading tonnage commodity groups include are primarily natural materials (Coal, Gravel, Fuels, and Non-Metallic Mineral Products) as well as Prepared Foodstuffs. Leading value commodity groups primarily include consumer goods (Electronic Equipment, Vehicles and Parts; Textiles and Leather) as well as Pharmaceutical Products and Mixed Freight.
The supply chain analysis confirms that trucks are the predominant mode for moving freight in New Jersey. While New Jersey is served by a full range of modal options, trucking is the dominant mode, serving nearly 75% of all tonnage. The state’s Interstate highways carry the greatest volumes of goods across all commodity groups, with several key state and local highways making key connections to major intermodal terminals, distribution centers, and clusters of business establishments producing or consuming goods. Bottlenecks along these routes caused by congestion, both recurring and non-recurring, impact the ability of New Jersey’s businesses to operate at their highest efficiency. The analyses presented in Chapter 4 outline the challenges the goods movement industry faces on many of New Jersey’s highways.
The analysis suggests that maintaining safe, efficient, and reliable operation of New Jersey’s key freight highway corridors in the face of projected growth in freight demand is essential to supporting the state’s legacy industry sectors and future economic development initiatives. Ensuring that New Jersey can achieve statewide, regional, and local economic development goals, therefore, will depend upon relieving these bottlenecks, and upon identifying and advancing initiatives that could shift a portion of the projected growth in freight volumes from truck to rail or water modes. Identifying potential opportunities to improve rail corridors or maritime nodes will ultimately have a net positive benefit to New Jersey’s freight economy.

Chapter 4: FREIGHT NETWORK PERFORMANCE
89
FREIGHT NETWORK PERFORMANCE
This chapter provides an assessment of New Jersey’s complex and intertwined freight transportation infrastructure. The inventory of the state’s major transportation assets includes New Jersey’s highways, railroads, and maritime and aviation nodes. This chapter also includes an analysis of network performance, primarily focusing on highway congestion, reliability, and safety, as well as issues specific to the rail and maritime industries. The performance of each of these networks is critical to the state’s goods movement industry serving not only New Jersey, but regional, national, and global markets as well.
Highway The highway freight network is crucial to New Jersey’s economy. As discussed in Chapter 3, over 70% of goods in New Jersey move by truck via the highway freight network. The New Jersey Statewide Freight Plan Phase II: Priority Highway Freight Corridors (2012) examined the primary highway freight corridors within New Jersey (I-78, I-80, I-95/New Jersey Turnpike, I-287, I-295, and NJ Route 17) in detail. This Plan assesses the broader highway freight network, encompassing key freight-related interstate, U.S., state, county, and local roadways throughout New Jersey.
The highway freight network evaluated in this Plan consists of the approved National Highway Freight Network, the proposed additions/deletions to that network, the New Jersey Highway Freight Network (NJ Access Network), and the proposed Critical Urban/Critical Rural Freight Corridors (CUFC/CRFC) as discussed below and illustrated in Figure 60.
Approved National Highway Freight Network (NHFN) Pursuant to the FAST Act, the NHFN has been established by the FHWA in collaboration with states and MPOs to strategically direct Federal resources and policies towards improved performance of highway-freight transportation. The NHFN includes the Primary Highway Freight System (PHFS) and non-PHFS Interstates. The initial designation of the PHFS was defined as the highway-only primary freight network (PFN) identified under MAP-21, a 41,518-mile network nationwide. The non-PHFS Interstates portion of the NHFN includes the entirety of the interstate highway system not already identified as a part of the PHFS.
Within New Jersey, the initial NHFN covers approximately 433 miles of roadway, including:
Interstate 76 Interstate 78 Interstate 80 Interstate 95 Interstate 195 Interstate 276* Interstate 278
Interstate 280 Interstate 287 Interstate 295 Interstate 676 U.S. Route 1 (Essex
County)
Essex County Route 577 (connector)

New Jersey Statewide FREIGHT PLAN
90
Note that the initial NHFN included a reference to Interstate 276 in New Jersey, referring to the Pearl Harbor Memorial Extension between the Pennsylvania Turnpike and New Jersey Turnpike (Interchange 6). Within New Jersey, this segment is designated as Interstate 95.
Proposed Additions to NHFN The NJDOT, MPOs, and PANYNJ identified additional key roadway segments that are proposed for inclusion in the NHFN. These roadways are crucial to national highway-freight movement, providing inter-state connections that are heavily utilized for goods movement and linking the currently designated NHFN to major port facilities impacting national freight activity. The proposed additions total approximately 155 miles, with major elements including:
New Jersey Turnpike (southern segment), designated as NJ Route 700 (approximately 50 miles from Interchange 1 at Interstate 295 to Interchange 6 - Pennsylvania Turnpike connection)
NJ Route 17 and NJ Route 3 corridors (approximately 27 miles across northeastern New Jersey, linking New York State to New Jersey port facilities)
NJ Route 440 (approximately 10 miles, providing connections to New York City from the west and north)
Roadways that provide vital connections from the currently designated NHFN to major New Jersey port facilities, including:
o U.S. Route 1&9 o U.S. Route 1&9 Truck o NJ Route 81 o Doremus Avenue o Port Street o Port Jersey Boulevard o North Avenue
New Jersey Highway Freight Network (NJ Access Network) In addition to the NHFN and key highways that support goods movement at the national scale, this Plan also identified and evaluated key roadways that primarily support goods movement within New Jersey and the surrounding region. The statewide highway freight network is based on the NJ Access Network (defined under NJ AC 16:32) and review and input from the FAC. It includes approximately 2,010 miles of NJ, U.S., county and local routes that traverse the New Jersey. The State’s highway freight network is an underpinning of the State’s economy, providing important truck routes that link industries and businesses with suppliers, raw materials, and consumers in the State, as well as connections to the NHFN.
Critical Urban/Critical Rural Freight Corridors (CUFC/CRFC) As part of the development of the NHFN, states and MPOs are responsible for designating CUFCs and CRFCs in accordance with FAST Act. Per FAST Act guidance, New Jersey may designate up to 150 miles of public roadways as CRFC and up to 75 miles as CUFC for roadways that are not already part of the NHFN. These roadways are identified as important freight corridors that provide linkages between key nodes (e.g., port facilities, warehousing and distribution centers, industrial centers). Designation of CUFC and CRFC roadways also increases the State’s NHFP mileage, allowing expanded use of NHFP formula funding and Infrastructure for Rebuilding America (INFRA) Grant Program funds for eligible projects.

Chapter 4: FREIGHT NETWORK PERFORMANCE
91
Figure 60: Existing and Proposed Highway Freight Network

New Jersey Statewide FREIGHT PLAN
92
As part of this Plan, NJDOT and FAC members have worked to identify candidate CUFCs and CRFCs for designation within the NHFN. With the vast majority of the State’s roadway network classified as urban, particularly near key freight-related nodes, there will be many more candidate CUFCs than CRFCs in New Jersey.
Given that the initial list of CUFCs exceeds the maximum eligible mileage allowed by the FHWA (75 miles), the project team worked with our FAC and MPO partners to truncate the list to fall within the maximum allowable mileage. The list of proposed CUFCs and CRFCs for New Jersey in 2017 is detailed in Figure 61, while a more detailed list of these corridors is included in Appendix B. This list will be submitted to FHWA for approval and incorporation into the NHFN. This plan will be updated once the CUFC and CRFCs are approved by FHWA.
Given that the initial list of CUFC-eligible projects exceeds the maximum eligible mileage allowed by the FHWA (75 miles), the project team worked with our FAC and MPO partners to truncate the list to fall within the maximum allowable mileage. The list of proposed CUFCs for New Jersey in 2017 is detailed in Figure 61, while a more detailed list of these corridors is included in Appendix B. It is important to note that the remaining priority projects that are not CUFC-eligible should still be considered as priority projects as detailed further in Chapter 6.
It is important to note that while these locations have been identified as CRFC- or CUFC-eligible, they have not yet been codified. This plan will be updated once these corridors have been confirmed.

Chapter 4: FREIGHT NETWORK PERFORMANCE
93
Figure 61: Identified CUFC/CRFC Candidate Locations

New Jersey Statewide FREIGHT PLAN
94
Highway Performance Highway performance was reviewed using three key measures:
Planning Truck Travel Time Index: A measure that represents reliability – the amount of total time a traveler should allow to ensure on-time arrival for the average trip.
Average Truck Travel Speed: A measure that represents congestion – the average truck travel speed for a given highway link.
Highway Truck Crash data: A review of 10 years (2006-2015) crash data for trucks provided a heat map indicating locations where truck crashes were most prevalent.
The data used to identify the priority corridors/locations on the freight highway network was the National Performance Management Research Data Set (NPMRDS). This is a data product developed by the FHWA that reports travel times on the National Highway System at five-minute intervals. Travel times are reported for both passenger traffic and truck traffic. Truck travel time records come from an analysis of trucks that had been instrumented with GPS recorders by the American Trucking Association.
This review included an analysis of approximately 75,000 records to review all-day conditions, as well as morning peak (6a – 10a) and evening peak (3p – 7p) conditions. For the purpose of this analysis, the morning peak period was chosen, given that it is (generally) the most congested timeframe on New Jersey’s roadways and also the time period in which truck traffic is heaviest.
The two variables calculated from NPMRDS were: 24-hour Truck Travel Time Index (TTTI) and 24-hour Average Truck Travel Speed. The Travel Time Index captures how bad conditions can get on occasion relative to typical conditions. It is calculated as the ratio of the worst-case travel time (95th percentile travel time) to the median travel time. TTTI correlates more strongly with the frequency of severe non-recurring congestion, which in turn imposes a different set of costs and risks on supply-chains. Missing scheduled delivery windows could lead to production line stoppages or missed intermodal transfers, among other negative outcomes.
Conversely, the Average Truck Travel Speed variable describes how bad travel conditions are on average. While the TTTI variable focuses on characterizing non-recurring congestion, the Average Truck Speed variable focuses on describing recurring congestion. Low travel speeds on average translate directly into additional costs in the form of driver wages, vehicle operations, and fuel combustion. Additionally, the longer that it takes on average to deliver goods the larger the fleet size required to make those deliveries will be, imposing additional costs to trucking companies. The consideration of both TTTI and speeds is critical in our analysis to provide a comprehensive overview of freight performance issues. When linked together, locations exhibiting a high TTTI and low Truck Travel Speed reflect the most challenging bottlenecks for highway freight in New Jersey.
The Average Truck Speed and TTTI variables were calculated using an application that was developed to consistently analyze travel time records from NPMRDS throughout the state. The data for New Jersey contained 83.5 million truck travel time records from 2/2016 to 2/2017. In order to report accurate results, the TTTI metric was only calculated for roads with more than 1,000 travel time records. Having a large number of records to calculate this metric is important because the TTTI depends on infrequent travel time variations. Only weekday data was analyzed to prevent conflating different traffic patterns between weekdays and weekends.
Crash data was provided for the most recent ten-year period available (2006-2015) by NJDOT and is reflective of the dataset used by NJDOT in the development of their Freight Management System tool.

Chapter 4: FREIGHT NETWORK PERFORMANCE
95
Truck Travel Time Index Travel Time Index is a ratio that represents peak period travel time versus the expected travel time under free flow conditions. For example, a travel time index value of 2.0 indicates a 30-minute trip under free flow conditions would take 60 minutes during a given peak period.
Average TTTI in New Jersey were examined by analyzing the statewide highway network during the entire day, as well as morning and evening peak periods using NPMRDS speed data. This analysis was performed separately for the Interstate Highway network and Non-Interstate Highway network, given the difference in operating conditions for each. The resultant analysis is illustrated in Figure 62, indicative of a network that performs generally well, with nearly 70 percent of roadways operating with a travel time index below 1.5 during the worst performing period (morning peak period), indicating those roadways that provide reliable travel times.
For non-Interstates, illustrated in Figure 63, the average travel speeds are substantially lower, with only 13% of roadway mileage operating with a reliable travel time (TTTI < 1.5), and nearly one-third of non-interstate links operating with a travel time index greater than 5.0. This indicates the last-mile bottlenecks facing truck traffic in trying to get to the (in most cases) more reliable Interstate highways.
While 70% of New Jersey’s Interstate system roadways operate at an
acceptable truck travel time index, the State’s non-Interstate roadways
experience substantially inconsistent travel times, with one-third operating
with a TTTI greater than 5.0.
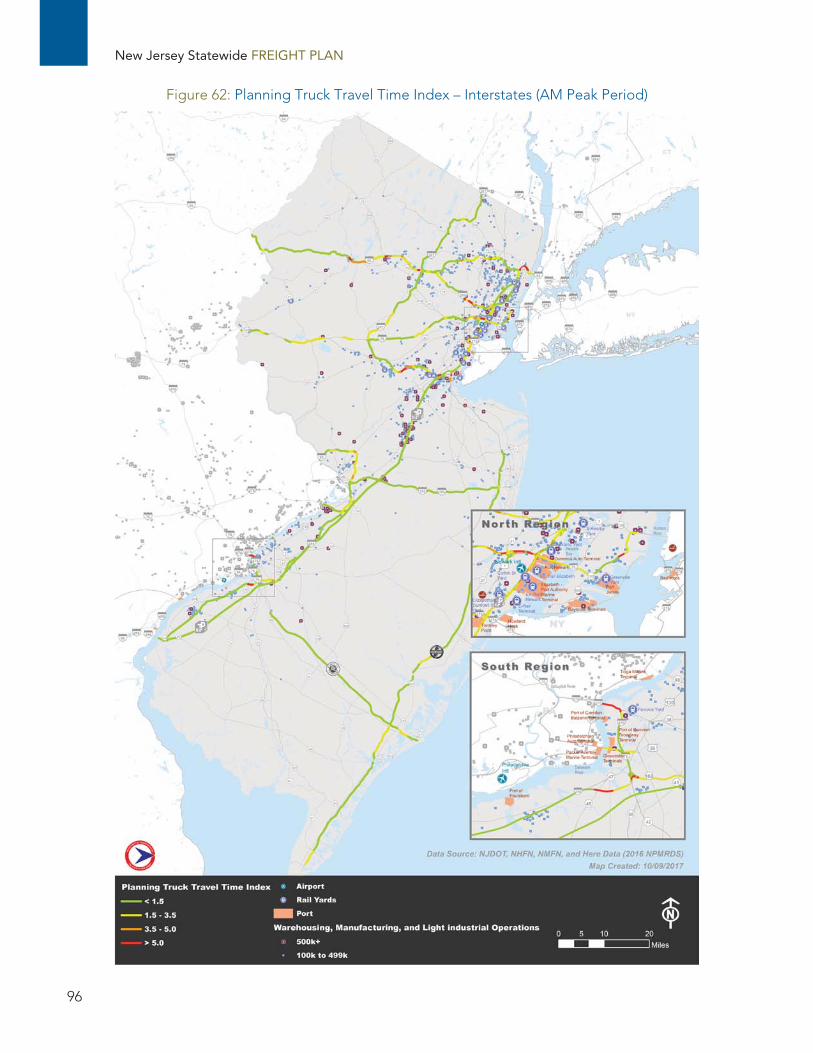
New Jersey Statewide FREIGHT PLAN
96
Figure 62: Planning Truck Travel Time Index – Interstates (AM Peak Period)

Chapter 4: FREIGHT NETWORK PERFORMANCE
97
Figure 63: Planning Truck Travel Time Index – Non-Interstates (AM Peak Period)

New Jersey Statewide FREIGHT PLAN
98
Truck Travel Speed Average truck travel speeds in New Jersey were examined by analyzing the statewide highway network during the entire day, as well as morning and evening peak periods using NPMRDS speed data, mentioned above. This analysis was performed separately for the Interstate Highway network and Non-Interstate Highway network, given the difference in expected travel speed for each. The resultant analysis is illustrated in Figure 64, indicative of a network that performs generally well, with nearly 80 percent of roadways operating at uncongested speeds during the worst performing period (evening peak period). This results in an average truck travel speed above 55 miles per hour (mph) indicating uncongested conditions.
For non-Interstates, illustrated in Figure 65, the average travel speeds are substantially lower, with only 12.7% of roadway mileage operating at a travel speed above 45mph and an average truck travel speed of less than 35mph. Lower travel speeds on non-interstates are indicative of different operating conditions, including traffic signals and an increased number of access points. As with the TTTI analysis, this indicates the prevalence of last-mile bottlenecks facing truck traffic in trying to get to the (in most cases) less congested Interstate highways.
Truck Crash Data A review of truck crash data was performed for the most recent 10-year period (2006-2015) throughout the state. Given the substantial dataset involved, the project team developed a heat map illustrating the corridors and locations where truck crash occurrence was most prevalent.
As with the other measures, the project team reviewed crash conditions for the Interstate and non-Interstate network, given generally differing levels of crash occurrence on each network. Figure 66 and Figure 67 illustrate the most heavily represented crash clusters for Interstate and non-interstate highways respectively, including the following locations (note that these locations are NOT ranked, but simply are reflective of the highest truck crash clusters in the state):
Interstate: o I-95/NJ Turnpike – Interchange 13 (I-278/NJ 439/U.S. 1&9) o I-95/NJ Turnpike – Interchange 14 (I-78/US 1&9/U.S. 22) o I-95/NJ Turnpike – Interchange 17 (NJ 3/NJ 495) o I-95/NJ Turnpike – Approaching George Washington Bridge
Non-Interstate: o U.S. 1&9T – West of Tonnele Circle o North Avenue – U.S. 1&9 to NJ 81 o Trumbull Street – U.S. 1&9 to Division Street o NJ 17 at NJ 4 o NJ 17 at Interstate 80 o U.S. 1/9 south of I-278 (currently being addressed by STIP Project 95023) o NJ 32 at CR 535 o U.S. 1 at CR 571 (Penns Neck) o Flemington Circle o Somerville Circle

Chapter 4: FREIGHT NETWORK PERFORMANCE
99
Figure 64: Average Truck Travel Speeds –Interstates (AM Peak Period)

New Jersey Statewide FREIGHT PLAN
100
Figure 65: Average Truck Travel Speeds –Non-Interstates (AM Peak Period)

Chapter 4: FREIGHT NETWORK PERFORMANCE
101
Figure 66: Truck Crash Density (2006 – 2015) – Interstates
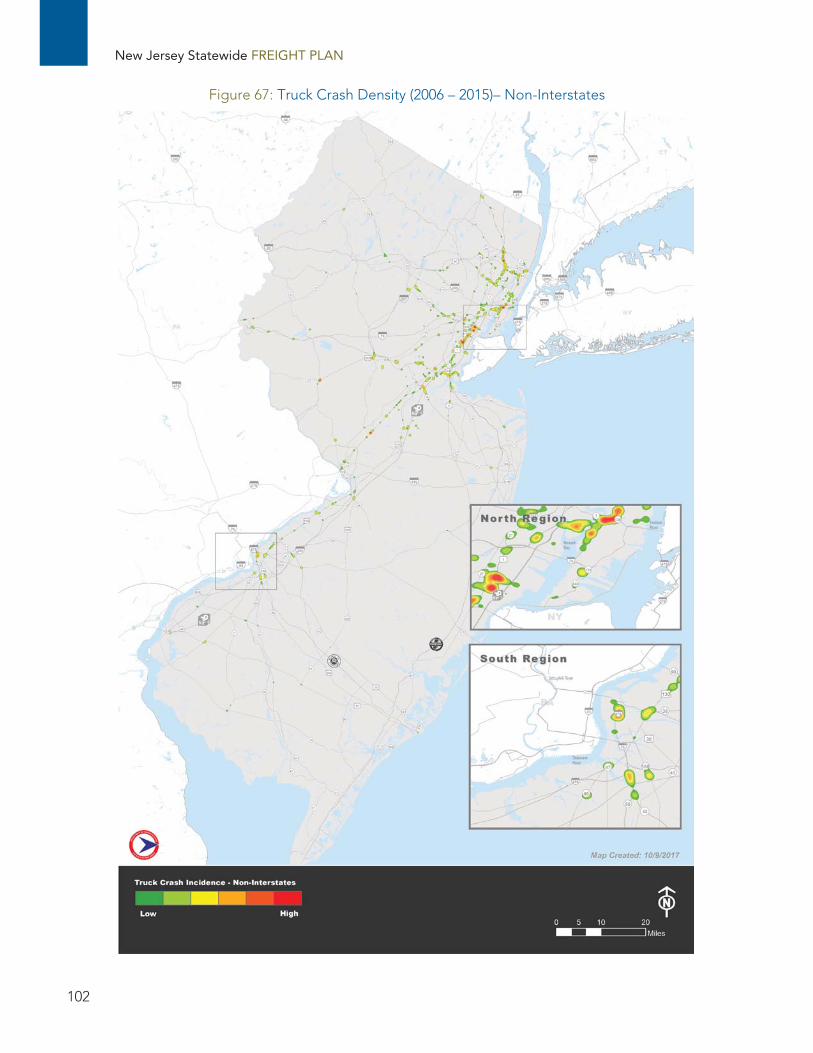
New Jersey Statewide FREIGHT PLAN
102
Figure 67: Truck Crash Density (2006 – 2015)– Non-Interstates

Chapter 4: FREIGHT NETWORK PERFORMANCE
103
Highway Performance Review The results of the highway performance analysis were used to identify key problem areas where multiple measures (High Truck Travel Time Index and Crash Hotspot or Low Truck Travel Speed and Crash Hotspot) overlap. These problem areas create congestion bottlenecks that impede efficient goods movement. These locations are reflected by MPO in Figure 68 through Figure 71. More details for each identified location (identified by number in each of the following figures) are provided in Appendix C. Further discussion of the key highway problem areas and prioritization methodology follows in Chapter 6.
Figure 68: Highway Problem Areas/Bottlenecks – DVRPC Region

New Jersey Statewide FREIGHT PLAN
104
Figure 69: Highway Problem Areas/Bottlenecks – NJTPA Region

Chapter 4: FREIGHT NETWORK PERFORMANCE
105
Figure 70: Highway Problem Areas/Bottlenecks – NJTPA Region (Northeast Region)

New Jersey Statewide FREIGHT PLAN
106
Figure 71: Highway Problem Areas/Bottlenecks – SJTPO Region

Chapter 4: FREIGHT NETWORK PERFORMANCE
107
Oversize/Overweight Vehicles The specific needs of oversize (OS) and overweight (OW) vehicles on New Jersey’s highways is an important consideration when identifying locations for targeted freight-specific improvements. NJDOT tracks the presence of overweight vehicles via their permitting process.12 Using the most recent three years of overweight permit data (2014-2016), the project team identified routes where overweight vehicle movements are most prevalent. Figure 72 illustrates the routes where more than 500 overweight (OW) permits were issued for that three-year period. This data was cross-referenced with the problem areas (and subsequent STIP-funded projects) detailed in Chapter 6. These projects should be given additional consideration for improvements specific to the needs of overweight vehicles, including increased stress on bridges and pavement or geometric needs related to oversize vehicles. In order to prioritize those locations where the number of overweight permits is highest, the list of targeted projects on corridors where more than 5,000 overweight permits were issued between 2014 and 2016 is detailed in Table 18.
Table 18: Targeted Problem Areas (Greater than 5,000 Overweight Permits Issued, 2014-2016)
Map ID Route County Municipality Start End Length
OW Permits
2 I-95 Burlington Bordentown Twp Ramps - Int 7 Ramps - Int 7 0.0 15313*
74 I-78 Essex/Hudson Multiple I-95 (Int 14) NJ 139 (Int 14C) 8.0 15313
3 I-295 Burlington Bordentown Twp US 130 (Int 57) US 130 (Int 57) 0.4 15034
4 NJ 413 Burlington Burlington City Broad Street US 130 0.4 150345 US 130 Burlington Burlington City Uhler Ave CR 670 1.1 13369
76 I-95 Essex Newark City 1&9T (Int 15E) 1&9T (Int 15E) 1.0 130889 I-295 Burlington Mansfield Twp CR 656 (Int 52) CR 656 (Int 52) 0.3 13054
51 US 46 Bergen Multiple CR 503 Main St 0.9 13054
55 I-95 Western Spur Bergen Multiple Int 16W Int 18W 3.0 13048
71 I-80 Passaic Wayne Twp CR 613 NJ 23 1.2 1304813 US 130 Burlington Multiple CR 625 CR 625 0.2 1040069 NJ 17 Bergen Rutherford Borough NJ 3 NJ 3 0.7 1040015 NJ 168 Camden Bellmawr Borough NJ Turnpike I-295 0.8 9947
17 CR 551 Camden Brooklawn Borough US 130 Town Center Drive 0.1 9902
64 NJ 4 Bergen Paramus Borough GSP CR 61 0.6 990281 I-78 Essex Newark City Int 56 Int 58 4.5 9902
19 I-676 Camden Camden City I-76 Ben Franklin Bridge 4.8 9284
21 I-676 Camden Camden City Vic of Atlantic Avenue
Vic of Atlantic Avenue 0.6 8888
109 US 1/9 Union Rahway City North Ave NJ 81 0.4 8888102 CR 501 Hudson Jersey City Newark Avenue NJ 139 0.3 8740
23 I-295 Camden Multiple NJ 42/I-76/I-676 US 30 4.5 8407
12 While NJDOT tracks oversize and overweight vehicle permits, the focus of this analysis is wholly on overweight vehicles, given the direct correlation between heavy loads and impacts to pavement.

New Jersey Statewide FREIGHT PLAN
108
Map ID Route County Municipality Start End Length
OW Permits
24 NJ 38 Camden Pennsauken Twp US 130 Browning Road 0.4 8407
25 US 30/US 130 Camden Pennsauken Twp Vic of NJ 38 Vic of NJ 38 0.3 8407
84 CR 510 Essex Newark City Broad Street NJ 21 0.3 836827 US 130 Camden Pennsauken Twp CR 615 NJ 90 0.1 798737 US 1 Mercer Trenton City NJ 29 CR 622 2.4 7614
144 CR 529 Middlesex Multiple Seeley Ave CR 665 0.9 761430 NJ 47 Gloucester Multiple River Dr. US 130 0.3 7579
31 NJ 45 Gloucester Woodbury City CR 644 Chestnut Street 0.3 7579
32 US 130 Gloucester/ Camden Multiple CR 710 CR 551 0.4 7501
33 CR 539 Mercer East Windsor Twp CR 630 I-95/NJTPK 0.5 722834 NJ 31 Mercer Hopewell Twp Denow Rd. Search Rd 1.0 722835 CR 546 Mercer Hopewell Twp Reed Rd. CR 652 1.1 670686 Doremus Ave. Essex Newark City Wilson Avenue Raymond Blvd 1.4 6246
28 I-295 Gloucester Logan Twp US 130 (Int 13) US 130 (Int 13) 0.5 6205
38 CR 571 Mercer West Windsor Twp Fairview Ln Tiger Lane 0.5 6205
39 I-95 Western Spur Bergen East Rutherford
Borough NJ 3 (Int 16W) NJ 3 (Int 16W) 0.5 6205
40 NJ 4 Bergen Fort Lee Borough Approaching I-95 I-95 0.5 597241 US 1/9 Bergen Fort Lee Borough Howard Ave Lancaster Ave 0.1 5866
100 US 1/9 Hudson Jersey City James Road I-95 0.2 586643 NJ 17 Bergen Lodi Borough I-80 EB I-80 EB 0.5 5845
44 I-80 Bergen Lodi Borough NJ 17 (Int 64/64A)
NJ 17 (Int 64/64A) 0.5 5800
45 NJ 17 Bergen Mahwah Twp Stag Hill Rd US 202 0.3 574146 NJ 17 Bergen Mahwah Twp CR 100 US 202 0.4 574147 NJ 17 Bergen Mahwah Twp CR 85 CR 85 0.5 567248 I-95 Bergen Multiple W Spur Split GWB 6.1 545249 NJ 17 Bergen Multiple CR 36 CR 44 4.3 545210 NJ 73 Burlington Mount Laurel Twp NJ Turnpike I-295 0.7 5446
141 I-95 Middlesex East Brunswick City Ramps - Int 7 Ramps - Int 7 0.0 5446*53 NJ 17 Bergen Multiple CR 62 Century Rd. 1.7 5387
57 NJ 17 Bergen Multiple CR 56 (Essex Street)
Vic. Of Garden State Plaza 2.3 5366
56 I-95 Western Spur Bergen Multiple Hackensack
River I-95 1.3 5147
67 NJ 93 Bergen Ridgefield Borough US 1/9 Industrial Ave 0.2 514754 NJ 17 Bergen Multiple CR 40 I-80 1.6 511058 I-80 Bergen Multiple Int with NJ 17 Int with NJ 17 1.5 511059 NJ 17 Bergen Multiple CR 32 CR S32 0.4 5105

Chapter 4: FREIGHT NETWORK PERFORMANCE
109
Figure 72: Overweight Permits (2014-2016) with Identified Problem Areas/Bottlenecks

New Jersey Statewide FREIGHT PLAN
110
Truck Parking In addition to the performance of New Jersey’s highways, access to and the availability of secure truck parking is important to the state’s goods movement industry. Truck parking is a concern throughout the United States, most notably that there is not enough of it to meet the demand. Truck parking has been a major issue for motor carriers and commercial drivers for decades, but the issue is now reaching a critical juncture. The lack of longer-term, overnight parking is especially severe. This section outlines national and state trends and details potential solutions aimed at improving this challenging issue.
The first FHWA effort to address truck parking issues was through their Truck Parking Facilities Pilot Program established in the 2005 SAFETEA-LU Section 1305 legislation. SAFETEA-LU authorized $25M for, at the time, a new pilot program to address the shortage of long-term parking for commercial motor vehicles on the National Highway System (NHS) Network, including awards made to 15 projects across the country. In 2011, FHWA solicited and received applications for 12 Discretionary Programs including the Truck Parking Facilities Program, which funded 23 projects. Prior to passing the FAST Act into law in 2015, Congress addressed truck parking shortages with the Jason’s Law Study, which confirmed that there is still a lack of available secure truck parking spaces and that truck parking continues to be a major issue across the United States.
In August 2015, the FHWA released the results of a nationwide truck parking study as mandated by the federal government. The study concluded that nearly 30 states have truck parking shortages in public rest areas and 15 states have truck parking shortages in private truck stops. From the 300,000 truck parking spaces identified in the FHWA survey, more than 90% are located at private truck stops, but nearly 80% of private truck stop facilities had fewer than 100 truck parking spaces. The FAST Act, passed in 2015, allocated $305 billion over five years for highway and public transit projects. The development of truck parking facilities is an eligible activity for funding, but states tend to prioritize the allocation of funds to help improve debilitated infrastructure.
The continuous increase in truck traffic and the restrictions on driver hours of service (HOS) is increasing a demand for truck parking facilities throughout the country, and particularly in densely populated areas. In addition, Federal Motor Carrier Safety Administration (FMCSA) will mandate the use of ELDs (Electronic Logging Devices) for all drivers by December 2017. HOS regulations mandate that drivers have 14-hours to complete their haul. If the driver violates the HOS because parking is not available, the ELD will track the movement and potentially a driver can incur fines or possible termination.
Commercial drivers wanting to comply with the FMCA’s HOS regulations will potentially have to park illegally on freeway shoulders when legal parking is not available. According to the American Transportation Research Institute (ATRI), about 63% of drivers are spending 15 minutes or more looking for parking between 4:00 pm to 11:59 pm. The same report states that 7:00 pm to 11:59 pm is the peak time when drivers are forced to use unauthorized parking.13
Truck Parking Initiatives in the Northeast FHWA’s Jason’s Law Truck Parking Survey identified states in the Northeastern United States as ones that have the most significant shortage in truck parking. States such as Pennsylvania, New York, Virginia, Maryland, and Connecticut reported a lack of available truck parking spaces. Virginia DOT (VDOT) conducted a truck parking study in 2014 to address truck parking challenges statewide. The primary purpose of this study was to identify the frequency of trucks parking on ramps near interchanges, rest
13 American Transportation Research Institute, “Managing Critical Truck Parking Case Study — Real World Insights from Truck Parking Diaries,” December 2016.

Chapter 4: FREIGHT NETWORK PERFORMANCE
111
stops, and welcome centers and to determine where truck parking is needed. One of the recommendations was for Virginia to partner with private industry and local governments to improve truck parking capacity. Since 2007, PennDOT has conducted several studies to investigate truck parking challenges and trends and to develop options for parking providers, drivers, and decision makers. The study recommended addressing truck parking by establishing public-private partnerships, policy, planning, and technology. Maryland DOT (MDOT) conducted several studies over the last decade at locations where commercial motor vehicles most frequently parked illegally on shoulders and ramps on Maryland highways. The Maryland Truck Parking Partnership Study recommended to advance pilot projects with public and private partnerships, incorporate truck parking improvements, and develop performance monitoring. New York (NYSDOT) conducted The Truck Route Management and Community Impact Reduction Study that highlighted how truck traffic affects their communities, quality of life, and daily operations. Connecticut DOT (ConnDOT) conducted a study in 2008 that inventoried public rest areas around the country and developed an analytical model to predict the demand for truck parking spaces along interstate highways.
Truck Parking Initiatives in New Jersey Like those states identified above, New Jersey is in dire need for truck parking. Based on the Jason’s Law Study, New Jersey is one of the eighteen14 states that reported the most severe parking shortages. NJDOT, in collaboration with sister transportation agencies, initiated a five-year truck monitoring program in 2007 to evaluate the impacts of new 102” Large Truck Network regulations (N.J.A.C. 16:32) proposed by the state in November 2006 and effective on January 22, 2008. The truck monitoring program encompasses the statewide collection of truck volume, origin-destination (O-D) patterns, crash statistics, subsequent analysis of data, and the production of quarterly and yearly reports.
In 2008, the NJTPA conducted a study to determine the sufficiency of available truck parking in the region and identified solutions to provide additional parking facilities to meet demand. This included an analysis of existing truck parking options, detailed in Figure 73. The study made several recommendations including policy and institutional, planning and finance, partnering, and recommended new or expanded sites. The study also identified sites with potential for expansion or new development, including the proposed layouts for these developments. In 2011, the DVRPC’s Regional Truck Parking Study estimated parking demand in its region and showed a current regional shortfall of 247 spaces that will grow to a shortage of 466 spaces by 2035. The I-95 Coalition initiated a pilot program called the Truck Parking Availability System that is designed to advise over-the-road truck drivers on the real-time availability of truck parking spaces along the I-95 corridor. This study identified that of the 34 regional truck parking facilities identified in the NJTPA region, 28 are estimated to operate above capacity. In 2015, the PANYNJ completed the Northeast Newark Regional Truck Study, which analyzed truck traffic patterns within the Ironbound District in Newark and the surrounding Industrial District. The study documented truck traffic associated with PANYNJ’s New Jersey Marine Terminal Facilities. It was observed that within Newark’s Industrial District, a total of 2,136 trucks were parked curbside and 91 were double parked during the duration of the study. As a result of the study, Newark may consider new parking regulations and additional police enforcement in the impacted areas. In addition, the study documented truck traffic associated with PANYNJ’s Port Newark/Elizabeth Port Authority Marine Terminal facilities. The study concluded, an estimated 5.1% of all trucks that entered or exited the Ironbound on the day of the study were associated with the port.
14 States with the highest truck parking shortages are New Jersey, Pennsylvania, New York, Virginia, Maryland, South Carolina, Connecticut, Massachusetts, Tennessee, Kentucky, Illinois, Iowa, Minnesota, Wisconsin, California, Washington and Oregon

New Jersey Statewide FREIGHT PLAN
112
Figure 73: Truck Parking Areas in New Jersey
Chapter 4: FREIGHT NETWORK PERFORMANCE
113
Funding Truck Parking Improvements States are challenged to meet the growing demand for truck parking spaces. Major challenges include fiscal concerns, land availability, and public perception. The electronic log device mandate that will go into effect in December of 2017 might even place an additional spotlight on the truck parking issue since drivers must balance compliance with existing parking regulations against the importance of delivering their cargo on time. Thus, finding appropriate funding sources and feasible locations to implement the expansion of existing truck parking facilities or construction of new parking areas will become more critical than the already dire situation.
Truck parking projects as described under Section 1401 of MAP-21 may be an eligible activity under the following formula programs:
Surface Transportation Block Grant Program (STBG) The National Highway Performance Program (NHPP) The Highway Safety Improvement Program (HSIP) Congestion Mitigation and Air Quality Improvement Program (CMAQ) National Highway Freight Program (NHFP)
Several grant opportunities are available to States for truck parking projects:
Infrastructure for Rebuilding America (INFRA) Grants Transportation Investment Generating Economic Recovery (TIGER) Grants
Public Private Partnership (P3) For several transportation agencies, public-private partnerships (P3s) have offered an opportunity to obtain and leverage new financing sources. Public entities and private developers are creating new mechanisms to build, operate, and maintain transportation facilities. FHWA encourages the consideration of P3s in the development of transportation improvements. The FHWA’s Center for Innovative Finance Support provides information and expertise in the use of different P3 approaches and assistance in using tools including:
the Special Experimental Project (SEP-15) program, private activity bonds (PABs), and the Transportation Infrastructure Finance and Innovation Act (TIFIA) Federal credit program to
facilitate P3 projects.
Although State DOTs have vigorous policies and processes for completing projects through traditional procurement, P3 project procurement requires DOT’s to add additional specialized skills that range from expertise in risk management to private financing, and concession contracting. Under P3, the private sector may also participate in the design, finance, operations, and maintenance. Several benefits from this program include:
Access to private capital, Some of the costs that State transportation agencies incur is reduced, Project delivery is accelerated, Project risk is shifted to a private entity, and More efficient management is established.
Potential limitations may include increased administrative costs and the time required to develop, analyze, procure, and monitor projects.

New Jersey Statewide FREIGHT PLAN
114
P3 projects may not necessarily provide States with new revenue streams. Also, the existing legislative policy framework does not allow the development of new commercial facilities on Interstate highway rights-of-way. Existing service plazas that have been developed and were in service before 1960 are exempt from these Federal restrictions.
Public Private Partnership Initiatives Several state DOTs utilized P3 principles to evaluate and classify potential P3 concepts for improving service and utilization of Rest Areas, Service Plazas, Park-and-Ride, or Weigh Station facilities.
In 2011 Utah DOT commenced the I-15 Truck Parking Project. This included establishing a public-private partnership for five service stations and the award of a grant to build 24 additional truck parking spaces for the Lunt Park Rest Area in Southern Utah (including parking for longer combination vehicles). The partnership saved Utah DOT over $80,000 per rest area per year in cleaning services and saved taxpayers from funding additional new buildings.
The Maryland Transportation Authority (MDTA) established a partnership and secured a $56 million investment from Areas USA and their partner SUNOCO to manage travel plazas. The lease provides the state with a partner that will be responsible for maintaining and operating the facility.
In 2013, Arizona DOT contracted the maintenance and operations of 14 rest areas to Infrastructure Corporation of America.
New York Thruway Authority formed a contract with Marriott Corporation (HMS Host) and McDonald’s Corporation (McDonald’s) to operate 16 and 11 plazas along the New York State Thruway (I-90 and I-87), respectively.
Vermont Agency of Transportation partnered with a private entity where maintenance and construction were paid by a private party for a 24-hour rest area and service center along Interstate 89. Under the contract, the Vermont Agency of Transportation only installed and maintains signs for the facility on I-89. In 2011 VDOT established a three-year agreement with a private company to provide sponsorship, advertising, and vending services across all 43 of VDOT’s safety rest areas.
Iowa DOT engaged in a single P3 project where the private developer is responsible for operations and maintenance of the rest area, with Iowa DOT sharing the cost.
In 2013, PennDOT established the Public and Private Partnerships office. The Public and Private Partnerships for Transportation Act, signed into law by the Governor in 2012, allows PennDOT and other transportation authorities and commissions to partner with private companies to deliver, maintain and finance transportation-related projects. Two freight related projects were approved. The Truck Permitting and Routing System which is complete and a Smart Truck Parking project that is still under evaluation.
Massachusetts DOT conducted a Service Plaza/Rest Area P3 Suitability Study in 2014 to evaluate and classify rest areas, service plazas and weigh station facilities as potential locations for P3. The study selected 16 locations for public-private partnership.
California DOT is utilizing public-private-academic collaboration to aid truckers in finding safe, legal, and available parking through ITS technology along the I-5 and I-710 Freight Corridors.
Advancing Truck Parking Improvements in New Jersey NJDOT recognizes the importance of the truck parking shortage and its potential to contribute to both increased congestion and reduced safety. The Freight Advisory Committee, including NJDOT/MPO management, freight transportation stakeholders, industry and business leaders (at large), and statewide or local elected officials is a viable approach to address the concerns of the state and the trucking industry. This group can serve as a forum and place for raising issues and concerns specific to truck parking, identifying problems and needs, and proposing and discussing solutions. The P3 program and successful

Chapter 4: FREIGHT NETWORK PERFORMANCE
115
initiatives by other state DOTs provides a platform for NJDOT to explore opportunities for expanding truck parking capacity and local economic development through dual-use facilities and the provision of parking at truck-oriented developments.
Maritime New Jersey’s geographic boundaries are largely defined by waterways -- the Delaware River and Delaware Bay to the West and South; and the Atlantic Ocean, Raritan Bay, Arthur Kill, and Hudson River to the East.
Ports along these waterways connect New Jersey to other parts of the US and to world regions via waterborne trade:
Spanning Newark Bay and the Hudson, the Port of New York and New Jersey is the largest major US East Coast port gateway to the rest of the world.
Ports on the Delaware River in Southern New Jersey and Pennsylvania serve New Jersey as well as Pennsylvania and other states.
Two of the State’s ports (as well as the Port of Philadelphia) rank in the top 25 US ports measured by total tonnage, container volumes (TEUs) or dry bulk tonnage:15
Port of New York and New Jersey Port of Camden-Gloucester, NJ Port of Philadelphia
Additionally, the Port of Salem has an advantageous location in South Jersey where, given improved linkages via highway and rail, it can increase its role in New Jersey’s maritime network.
New Jersey’s maritime bookend ports are a gateway for international trade, connecting New Jersey and the US to markets worldwide. The maritime freight network is critical for international trade, as detailed in Chapter 3. Domestically, New Jersey’s waterways support primarily a large recreational, charter and commercial fishing industry, but a relatively small share of New Jersey’s goods movement in terms of tonnage and value. The Inter-Coastal Waterway (ICW) and the Atlantic near-shore maritime traffic lane provide an opportunity to help address landside congestion issues, reduce greenhouse gas emissions, and lower landside infrastructure maintenance costs.
The marine freight network detailed in this Plan consists of the approved National Marine Freight Network, proposed additions to that network, key NJ marine highways, bridges that can impact waterborne freight and marine ports as described below and, illustrated in Figure 74:
Approved National Marine Freight Network The National Marine Freight Network includes two marine highways that serve New Jersey ports – the M-87 and M-95 Marine Highway Corridors. The M-95, paralleling Interstate 95, runs along the entire eastern seaboard, connecting ports from Portland, ME, to Miami, FL. The M-87 serves the New York-New Jersey metropolitan area. It connects with the M-95 at New York City and runs up the Hudson River to Albany, NY, parallel to Interstate 87.
15 Port Performance Freight Statistics Program (PPFSP) Annual Report to Congress, USDOT Bureau of Transportation Statistics, January 2017

New Jersey Statewide FREIGHT PLAN
116
Proposed Additions to NMFN Through the study process and input from the FAC, this Plan identified additional key marine highways for inclusion in the NMFN. They enable cross-harbor waterborne freight movement, connecting the region’s ports and alleviating demand on the region’s congested highway freight network.
The proposed additions include:
NYNJ Rail Float, connecting freight railroad in Jersey City, NJ, to freight railroad in Brooklyn, NY and the East of Hudson (EOH) market
Red Hook Barge Terminal, barge service connecting the Red Hook Terminal to the Port of Newark
Port Newark Container Terminal, barge service connecting the Red Hook Terminal to Port Newark
Global Container Terminal NY-NJ, connecting Global Container Terminals on New York Bay
Key New Jersey Marine Highways In addition to the NMFN and marine highways that support waterborne goods movement at the national scale, other marine highways primarily support goods movement within New Jersey and the surrounding region. Based on input from the FAC, the Delaware River Main Channel was identified as an additional New Jersey Marine Highway, serving the entire South Region and ports in both New Jersey and Pennsylvania.
Bridges Bridge structures pose potential barriers to waterborne freight movement due to vertical clearance issues. Figure 74 illustrates the location of bridge crossings of shipping channels, as well as their vertical clearance and channel depth, to identify existing constraints and impediments within the marine highway network.
Marine Ports New Jersey’s marine ports are intermodal hubs, with access to rail and highway connections and in close proximity to warehousing, manufacturing, and light industrial operations. The port facilities are predominantly located in two areas:
North Region: along Newark Bay and the Hudson River / New York Bay, including the Port of New York and New Jersey facilities
South Region: along the Delaware River, including the Port of Camden terminals and Port of Paulsboro, as well as ports in the Philadelphia region, which also serve the New Jersey market
Profiles of these three ports from the Bureau of Transportation Statistics (BTS) annual report are included in Appendix D. In addition, the Port of Paulsboro, NJ was the 30th largest US port in terms of total tonnage in 2015.16
16 Association of American Railroads

Chapter 4: FREIGHT NETWORK PERFORMANCE
117
Figure 74: New Jersey’s Marine Freight Network

New Jersey Statewide FREIGHT PLAN
118
Sections which follow describe freight flows, port facilities, and factors affecting port development for:
Northern New Jersey Southern New Jersey/Philadelphia Marine Highways potentially serving New Jersey
Northern New Jersey The Port of New York and New Jersey (PONYNJ) is one of the largest concentrations of containerized and non-containerized marine freight in the world. The PONYNJ includes facilities in both New Jersey and New York. On the New Jersey side, it consists of public marine terminals (which are owned by the PANYNJ and leased to private terminal operators for the handling of containers, automobiles, and other cargo) and a diverse array of private terminals (which handle the majority of PONYNJ tonnage in the form of crude and refined petroleum, industrial chemicals, construction materials, and other bulk materials).
International Freight Flows Ports in Northern New Jersey (the New Jersey portion of the New York Combined Statistical Area) accounted for 54.8 million tons of US waterborne imports and 8.1 million tons of US exports in 2015 according to FHWA Freight Analysis Framework (FAF) estimates.
Table 19: Northern New Jersey Ports’ Waterborne Imports in 2015
Thousands of Tons Total N. NJPorts
S. NJ Ports
OtherState
N. NJ Ports
S. NJ Ports
OtherState
Crude petroleum 9,871 9,798 0 73 99% 0% 1% Gasoline 8,147 6,937 69.2 1,141 85% 1% 14% Fuel oils 6,258 4,129 473.0 1,656 66% 8% 26%
Petroleum Products 24,276 20,863 542 2,870 86% 2% 12% Other foodstuffs 4,383 2,387 101.3 1,894 54% 2% 43%
Nonmetallic minerals 2,952 1,345 10.9 1,596 46% 0% 54% Nonmetal min. prods. 2,753 1,411 104.1 1,237 51% 4% 45%
Plastics/rubber 2,123 615 29.3 1,479 29% 1% 70% Basic chemicals 1,881 733 71.9 1,076 39% 4% 57% Textiles/leather 1,837 436 50.9 1,350 24% 3% 74%
Alcoholic beverages 1,613 622 27.8 964 39% 2% 60% Machinery 1,431 233 10.2 1,188 16% 1% 83%
Motorized vehicles 1,316 591 22.6 703 45% 2% 53% Furniture 1,238 309 107.8 821 25% 9% 66%
Articles-base metal 1,120 207 18.6 894 19% 2% 80% Other ag prods. 966 278 33.7 654 29% 3% 68%
Other 6,955 2,020 118 4,818 29% 2% 69% All Other Commodities 30,567 11,186 707 18,674 37% 2% 61%
Grand Total 54,843 32,049 1,249 21,545 58% 2% 39% Source: FHWA Freight Analysis Framework 4.1

Chapter 4: FREIGHT NETWORK PERFORMANCE
119
These volumes are significant in terms of freight moved within New Jersey and through New Jersey to and from regions outside of the state. Large portions of these import and export volumes are destined to, or originate in, New Jersey as shown in Table 19 and Table 20. Of total import tonnage, over 60% went to New Jersey destinations in 2015 while 39% were destined for other states. However, the destination shares are much different for energy-related commodities, which are more NJ-focused (88%), than is the case for all other imports (39%).
The top three volume imports measured by tonnage were crude petroleum, gasoline and fuel oils which together accounted for 44% of northern New Jersey 2015 import tonnage. These products were predominantly destined to New Jersey locations (88% of northern New Jersey ports total for these commodities). For all other commodities, 61% of commodity tonnage went to out of state destinations.
Tons exported through Northern New Jersey ports are much smaller than imports, totaling 8.2 million tons in 2015, or one-seventh the import tonnage. Exports are heavily concentrated in just two commodity groups, fuel oils and waste/scrap, which together represented 65% of total export tons. These two commodities largely originated in New Jersey, 100% of fuels oils and 85% of waste/scrap.
For other commodities, a large 82% majority of exported tons originate outside New Jersey.
Table 20: Northern New Jersey Ports’ Waterborne Exports in 2015
Thousands of Tons Total N. NJ Ports
S. NJ Ports
0therState
N. NJ Ports S. NJ Ports
0therState
Fuel oils 2,800 2,766 32 2 99% 1% 0% Waste/scrap 2,548 1,657 519 372 65% 20% 15% Cereal grains 539 18 0 520 3% 0% 97%
Coal 507 0 0 507 0% 0% 100% Motorized vehicles 303 126 0 177 41% 0% 58%
Other foodstuffs 184 63 4 117 34% 2% 64% Basic chemicals 133 77 1 56 58% 1% 42%
Animal feed 119 2 0 118 2% 0% 98% Milled grain prods. 104 6 0 98 5% 0% 94%
Other ag prods. 102 49 9 43 48% 9% 42% Others 844 155 3 686 18% 0% 81%
All Other Commodities 2,835 495 18 2,322 17% 1% 82% Grand Total 8,184 4,918 569 2,696 60% 7% 33%
Source: FHWA Freight Analysis Framework 4.1
Domestic Freight Flows According to the BTS annual report the Port of New York and New Jersey’s domestic tonnage was much smaller than international, 37% of the 2015 total (see Appendix D).
For Northern New Jersey ports, total domestic inbound tonnage by water in 2015 was almost entirely comprised of crude oil, nearly 600 thousand tons, compared to about 10 million tons of imported crude oil, according to FAF data.
Outbound domestic tonnage was almost entirely natural sands, at about 700 thousand tons in 2015.

New Jersey Statewide FREIGHT PLAN
120
Port Facilities and Services There are four major container terminals in New Jersey -- Port Newark Container Terminal, Maher Terminal, APM and GCT Bayonne, and two in New York – GCT New York and Red Hook Container Terminal as shown in Figure 75.
Figure 75: Port of New York and New Jersey Terminals
Source: Port Authority of New York and New Jersey
Container services are handled at the terminals shown in Figure 75 with the great majority of volume occurring at the four New Jersey-based container terminals.
Bulk and breakbulk cargos are largely handled at Elizabeth-Port Authority Marine Terminal/Port Newark terminals, along with a variety of private terminals along the Kill Van Kull, Arthur Kill, the Passaic and Hackensack Rivers and northern Newark Bay.
The PONYNJ is one of the largest in the US for automobile imports and exports. Autos are loaded and unloaded at the Port Jersey-Port Authority Marine Terminal in Jersey City (just north of Global Container Terminal) and at the northern portion of Port Newark. Autos can undergo value-added processing at three dock-side facilities: FAPS Inc. (a 120-acre terminal at Port Newark with the capacity to handle a half million vehicles per year; Toyota Motor Logistics Center at Port Newark; and BMW at Port Jersey.
Port Connectivity How cargo gets to and from port terminals by inland modes is in many ways as important as landside operations inside terminals including handling and storing cargos and moving freight across docks to and from ships. There are three critical aspects of port connectivity:
Waterway Rail Trucking (including freight moving between ports and airports, e.g. Newark Airport)
Waterways and Big Ship Capabilities For the past decade, PANYNJ, in cooperation with Federal and state agencies, has been developing its capabilities to handle the bigger ships introduced by shipping companies to reduce per unit transportations costs and that can now transit the Panama Canal. The expansion of the Panama Canal

Chapter 4: FREIGHT NETWORK PERFORMANCE
121
enables passage of much larger ships through a new set of locks and deeper channels. The size of container ships able to move through the Canal has nearly tripled, from 5,000 twenty-foot equivalent units (TEUs) capacity to over 13,000 TEUs.
These efforts have included 1) deepening some regional channels to 50 feet and 2) raising the deck of the Bayonne Bridge which inhibits passage of large ships into Newark Bay. Each of these is discussed briefly below.
Port Channels In September 2016, the USACE and PANYNJ announced the completion of the decades-long NY/NJ Harbor Deepening Project. The completion of this deepening project will allow passage of deep draft container and other ships to reach all major Port terminals (Figure 76). The United States Army Corps of Engineers (USACE) continues to address other navigation issues related to the handling of larger container and liquid bulk vessels, including the depth and dimensions of anchorages, turning basins, and bends in navigation channels.
Figure 76: Harbor Deepening at the Port of New York and New Jersey
Source: Port Authority of New York and New Jersey
Bayonne Bridge The other impediment to large ships being able to use the Port has been the height of the Bayonne Bridge between Staten Island and Bayonne, crossing the Kill Van Kull. The deck of the bridge has been raised from 151-feet to 215 feet above mean high water, matching the height of the Verrazano-Narrows Bridge under which container ships also pass to reach Port Newark/Elizabeth and Howland Hook/GCT New York

New Jersey Statewide FREIGHT PLAN
122
The 215-foot navigational clearance is complete as of June 2017 and completion of the entire bridge structure is projected for mid-2019.
Rail Figure 77 illustrates the substantial number and diversity of rail connections to the Port of New York and New Jersey, The Port’s ExpressRail system provides near-dock rail connections to the national rail network via the CSX and Norfolk Southern railroads. Three current ExpressRail terminals serve the container terminals in Elizabeth and Newark, N.J. and the GCT-New York terminal on Staten Island. Usage of the ExpressRail system has grown from about 300,000 container lifts in 2005 to over 540,000 in 2016.
Figure 77: Port of New York and New Jersey Rail Connections
Source: Port of New York and New Jersey
In September 2017, the first 14,000 TEU container ship passed under the newly raised
Bayonne Bridge.
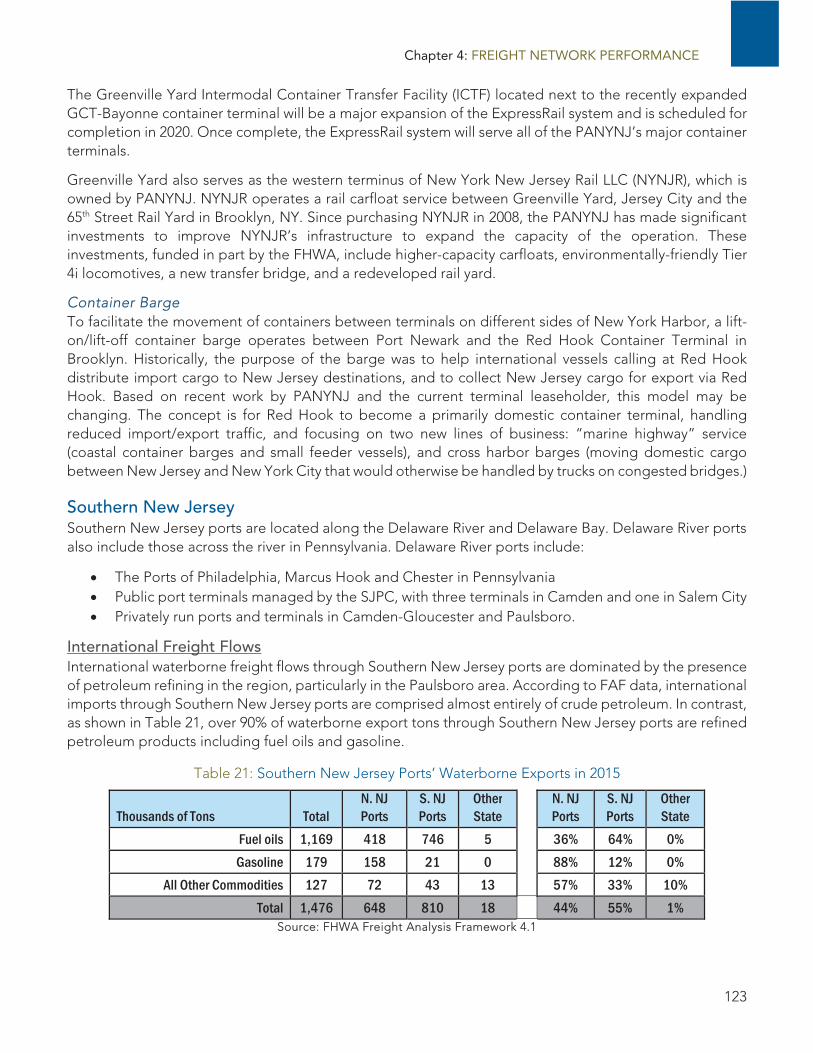
Chapter 4: FREIGHT NETWORK PERFORMANCE
123
The Greenville Yard Intermodal Container Transfer Facility (ICTF) located next to the recently expanded GCT-Bayonne container terminal will be a major expansion of the ExpressRail system and is scheduled for completion in 2020. Once complete, the ExpressRail system will serve all of the PANYNJ’s major container terminals.
Greenville Yard also serves as the western terminus of New York New Jersey Rail LLC (NYNJR), which is owned by PANYNJ. NYNJR operates a rail carfloat service between Greenville Yard, Jersey City and the 65th Street Rail Yard in Brooklyn, NY. Since purchasing NYNJR in 2008, the PANYNJ has made significant investments to improve NYNJR’s infrastructure to expand the capacity of the operation. These investments, funded in part by the FHWA, include higher-capacity carfloats, environmentally-friendly Tier 4i locomotives, a new transfer bridge, and a redeveloped rail yard.
Container Barge To facilitate the movement of containers between terminals on different sides of New York Harbor, a lift-on/lift-off container barge operates between Port Newark and the Red Hook Container Terminal in Brooklyn. Historically, the purpose of the barge was to help international vessels calling at Red Hook distribute import cargo to New Jersey destinations, and to collect New Jersey cargo for export via Red Hook. Based on recent work by PANYNJ and the current terminal leaseholder, this model may be changing. The concept is for Red Hook to become a primarily domestic container terminal, handling reduced import/export traffic, and focusing on two new lines of business: “marine highway” service (coastal container barges and small feeder vessels), and cross harbor barges (moving domestic cargo between New Jersey and New York City that would otherwise be handled by trucks on congested bridges.)
Southern New Jersey Southern New Jersey ports are located along the Delaware River and Delaware Bay. Delaware River ports also include those across the river in Pennsylvania. Delaware River ports include:
The Ports of Philadelphia, Marcus Hook and Chester in Pennsylvania Public port terminals managed by the SJPC, with three terminals in Camden and one in Salem City Privately run ports and terminals in Camden-Gloucester and Paulsboro.
International Freight Flows International waterborne freight flows through Southern New Jersey ports are dominated by the presence of petroleum refining in the region, particularly in the Paulsboro area. According to FAF data, international imports through Southern New Jersey ports are comprised almost entirely of crude petroleum. In contrast, as shown in Table 21, over 90% of waterborne export tons through Southern New Jersey ports are refined petroleum products including fuel oils and gasoline.
Table 21: Southern New Jersey Ports’ Waterborne Exports in 2015
Thousands of Tons Total N. NJ Ports
S. NJ Ports
OtherState
N. NJ Ports
S. NJ Ports
OtherState
Fuel oils 1,169 418 746 5 36% 64% 0% Gasoline 179 158 21 0 88% 12% 0%
All Other Commodities 127 72 43 13 57% 33% 10% Total 1,476 648 810 18 44% 55% 1%
Source: FHWA Freight Analysis Framework 4.1

New Jersey Statewide FREIGHT PLAN
124
Domestic Freight Flows As is the case for Northern New Jersey ports, domestic tonnage through Southern New Jersey ports is much smaller than international volumes. According to the BTS annual report the Port of Camden-Gloucester (the Army’ Corps of Engineers’ definition) domestic tonnage was 2 million tons compared to 5 million foreign tons in 2015 (see Appendix D). Army Corps’ data also shows that Paulsboro’s 2015 domestic tonnage of 8 million tons was less than the 13 million tons of foreign cargo.
Fuel oils represent the largest commodity for inbound as well as and outbound waterborne domestic tonnage for Southern New Jersey.
Port Facilities and Services The SJPC owns and operates the Balzano (Beckett Street) and Broadway Marine Terminals in the Port of Camden and the Salem Marine Terminal at the Port of Salem. At the Port of Paulsboro, a new terminal, the Paulsboro Marine Terminal, began operations in March 2017.
Camden The Port of Camden's Balzano Terminal handles breakbulk and bulk cargoes including include steel and wood products, cocoa beans, project cargoes, iron ore, scrap metal, and containers. The Broadway Terminal handles bulk and breakbulk cargoes including petroleum coke, furnace slag, wood and steel products, dolomite, minerals, fresh fruit, and cocoa beans.
Gloucester The Gloucester Marine Terminal in Gloucester City, operated by Holt Logistics/Gloucester Terminals LLC handles perishables, forest products, heavy-lift and project cargoes, steel, as well as containers. Holt Logistics also operates the Packer Avenue Terminal in Philadelphia.
Paulsboro The SJPC Paulsboro Marine Terminal, located across the Delaware River from the Philadelphia International Airport, is the first major marine terminal developed on the river in over 50 years. Originally a liquid bulk tank farm, the new terminal began operation in March 2017. The terminal includes 200 acres, on-dock rail access to Class I railroads, an 850-foot berth and a limited access roadway to Interstate-295. The terminal is operated by Holt Logistics, LLC. In addition to the SJPC Paulsboro Marine Terminal, the Port of Paulsboro has a number of privately owned facilities, operated by companies largely involved in crude oil and petroleum products. These companies include Sunoco (jet fuel), the PBF Energy refinery (gasoline, heating oil and jet fuel), and AXEON Specialty Products refinery (asphalt and related products).
Port of Salem The Port of Salem is located on the Salem River in Salem County. It is part of Foreign Trade Zone #142, and is owned and operated by the South Jersey Port Corporation. It generally handles smaller barge and container ships. In Summer 2017, SJTPO initiated a planning study to review intermodal and rail opportunities linking to the Port of Salem.
Middle Thorofare Bridge The Middle Thorofare Bridge has been identified previously as an impediment to the fisheries industry operating in South Jersey. While the structure itself is structurally deficient (load posted for 15 tons) and functionally obsolete, additional concerns for the goods movement industry are associated with waterborne clearances. The low vertical clearance (26 feet) requires a substantial number of daily openings (20-40 per day), while the narrow channel width (50 feet between existing abutments) results in frequent vessel strikes.

Chapter 4: FREIGHT NETWORK PERFORMANCE
125
Philadelphia Region Ports Philadelphia region ports, principally the Port of Philadelphia, also serve New Jersey. Nearly a quarter of Philadelphia region ports’ imports are destined to New Jersey locations, as illustrated in Table 22. The largest volume commodity group by weight with a New Jersey destination is crude oil going to Southern New Jersey locations. The Port of Philadelphia is a major importer of refrigerated goods, and other agricultural products (e.g. produce) is the second largest import product group with a majority of volume headed to Southern New Jersey. From the Philadelphia region, fuel oils are the third largest import commodity transported to New Jersey, with most product going to Northern New Jersey. According to FAF data the smaller 61 thousand tons of fuel oils transported from the Philadelphia region to Southern New Jersey is transported by rail while the larger 726 thousand tons was moved half by truck and half by water.
Table 22: Philadelphia Area Ports’ Waterborne Imports in 2015
Thousands of Tons Total N. NJ Ports
S. NJ Ports
OtherState
N. NJ Ports
S. NJ Ports
OtherState
Crude petroleum 4,715 0 993 3,722 0% 21% 79% Base metals 3,528 216 49 3,263 6% 1% 92%
Other ag prods. 2,526 292 616 1,618 12% 24% 64% Nonmetallic minerals 1,672 159 31 1,482 10% 2% 89%
Other foodstuffs 978 179 72 728 18% 7% 74% Fuel oils 817 726 61 30 89% 7% 4%
Newsprint/paper 678 1 0 677 0% 0% 100% Meat/seafood 496 135 172 190 27% 35% 38%
Fertilizers 437 2 0 434 1% 0% 99% Gasoline 407 123 268 17 30% 66% 4%
All Other Commodities 2,443 222 233 1,987 9% 10% 81% Total 18,698 2,056 2,495 14,147 11% 13% 76%
Source: FHWA Freight Analysis Framework 4.1
As shown in Table 23, Philadelphia area ports’ exports of 4.5 million tons are about one quarter the volume of imports. The top export is fuel oils, which comprised over half of area ports’ total export tons in 2015. The next two top exports are waste/scrap and crude petroleum.
About 20% of Philadelphia area ports’ export tons originate in New Jersey. Waste/scrap from Southern New Jersey is the dominant commodity followed by fuel oil from Northern New Jersey. Most of Philadelphia regional ports’ domestic freight is comprised of energy related goods.
Table 23: Philadelphia Area Ports’ Waterborne Exports in 2015
Thousands of Tons Total N. NJ Ports
S. NJ Ports
OtherState
N. NJ Ports
S. NJ Ports
OtherState
Fuel oils 2,501 311 58 2,133 12% 2% 85% Waste/scrap 908 30 396 483 3% 44% 53%
Crude petroleum 246 0 0 246 0% 0% 100% All Other Commodities 855 89 33 734 10% 4% 86%
Total 4,511 429 486 3,596 10% 11% 80% Source: FHWA Freight Analysis Framework 4.1

New Jersey Statewide FREIGHT PLAN
126
Rail
Existing Freight Rail Network and Context
Freight Rail Operators Seventeen freight railroads operate within New Jersey including two Class I Railroads - Norfolk Southern (NS), CSX Transportation (CSXT); one Class II Regional Railroad - the New York, Susquehanna, and Western Railway; eight Class II and III Local Railroads, and six Switching and Terminal Railroads.17 Portions of the track mileage operated by freight railroads are owned by freight railroads and portions are owned by passenger railroads. Regardless of ownership, many sections of track are shared with passenger operations operated by Amtrak, NJ TRANSIT, and the Southeastern Pennsylvania Transportation Authority (SEPTA). Port Authority Trans-Hudson (PATH) and PATCO also provide passenger service, but their systems do not connect with the freight system.) There are currently 1,132 freight rail employees in the state, a substantial reduction from over 1,700 in 2003 as reported in the 2007 New Jersey Freight Plan. Figure 78 displays the New Jersey rail network.
Due to the shared-use circumstance in New Jersey, it is important to understand the difference between “track miles owned and operated” and “trackage rights.” Freight railroads own and control portions of the rail network in New Jersey, and over these portions of the network, they set operating policies and are responsible for dispatching and maintenance of the tracks, signals, and associated infrastructure. Trackage rights are operating agreements between a railroad operator and a railroad owner, similar to a rental agreement. A railroad with trackage rights has the right to operate over tracks owned by another. The other is responsible for maintenance, policy, and dispatching. A freight railroad owner can have trackage rights over another freight railroad’s tracks as well as passenger rail tracks, and vice versa. Table 24 summarizes freight rail tracks owned and operated and trackage rights, and includes passenger service (Amtrak and NJ TRANSIT).
Table 25 confirms the generalizations presented earlier: freight rail is interdependent within its own sector and with the passenger railroads. The freight railroads themselves own a total of 984 miles of the total 1,587 track miles representing New Jersey’s heavy rail network (light rail and subway systems are not included), or about 62% of the rail network. The trackage rights of the Class I freight railroads represents approximately 8.5 times the freight rail miles owned. That is, Class I freight operators operate not only over their own tracks, but other freight rail tracks and the passenger lines owned by NJ TRANSIT and Amtrak.
Table 24 summarizes the rail miles operated (owned and trackage rights) by the freight rail operators in New Jersey.
17Association of American Railroads, New Jersey Statistics for 2016.

Chapter 4: FREIGHT NETWORK PERFORMANCE
127
Figure 78: New Jersey’s Rail Network

New Jersey Statewide FREIGHT PLAN
128
Table 24: Railroad Miles, Ownership, and Trackage Rights in New Jersey
Railroad Type Number of Operators
Track MilesOwned & Operated
Trackage Rights (includes owned miles)
Class I 2 186 1,573 Regional (Class II) 1 91 91
Local (Class III) 8 194 194 Switching and Terminal 6 513 515
Total Track Miles Owned by Freight Operators 984 --Total Track Miles Owned by NJ TRANSIT and
Amtrak 603 --
Total Track Miles Owned, Passenger and Freight Combined 1,587
Total Track Miles Operated by Freight Operators 2,373
Table 25: Summary of Freight Operators and Mileage in New Jersey18
Class/Type Railroad Name Miles
Operated
Class I and Canadian CSX Transportation 642 Norfolk Southern Corporation 931
Class II and Class III (Regional) New York, Susquehanna and Western Railway 91
Class II and Class III (Local)
Belvidere and Delaware River Railway Company 19 Morristown and Erie Railway, Inc. 42 New Jersey Rail Carrier, LLC 2 NJ Seashore Line 13 New York and Greenwood Lake Railway 2 SMS Rail Service, Inc. 13 Southern Railroad Company of New Jersey 53 Winchester and Western Railroad 50
Switching and Terminal Railroads
Black River and Western Railroad 17 Conrail, Inc. 469 East Jersey Railroad and Terminal Company 10 Hainesport Industrial Railroad 1 Hainesport Secondary, LLC 1 New York New Jersey Rail, LLC 3 Raritan Central Railway, LLC 17
18 Association of American Railroads, New Jersey Statistics for 2016
Chapter 4: FREIGHT NETWORK PERFORMANCE
129
Passenger Rail Network Much of the challenge of improving the efficiency of freight rail is rooted in the constrained rights-of-way shared with passenger rail service. As described above, finding new land to acquire for right-of-way for new alignments in New Jersey is very difficult on account of the densely developed landscape. Coordinating freight and passenger service puts in conflict the needs of the traveling public and economic stability and development. To fully appreciate the complexity of this issue, it is useful to understand the operating parameters of the passenger rail services that share the tracks with freight.
Amtrak In 2015, the last year of Amtrak data available for New Jersey, Amtrak operated approximately 110 trains a day in New Jersey, including the Acela Express, Northeast Regional, and Keystone Trains. Amtrak also operates several long-distance trains that service New Jersey including the Crescent (from New York, through New Jersey to New Orleans), the Cardinal (from New York, through New Jersey to Chicago), the Silver Service/Palmetto (from New York, through New Jersey to Savannah and then Miami), the Carolinian/Piedmont (from New York, through New Jersey to Charlotte), the Pennsylvanian (from New York, through New Jersey to Pittsburgh), and the Vermonter (from Washington D.C., through New Jersey to St. Albans, Vermont). Amtrak stations in New Jersey experienced over 1.6 million boardings and alightings in 2015 over 640,000 of which occurred at the Newark station – the busiest in New Jersey and the 13th busiest in the National Amtrak system. Amtrak owns the Northeast Corridor track (approximately 58 miles in New Jersey), on which it operates its trains. The Northeast Corridor between Philadelphia and New York is used for freight rail service as well, operated by Conrail, who serves as a switching and terminal agent for Norfolk Southern and CSX.
New Jersey Transit19 NJ TRANSIT provides regional passenger rail services on 12 commuter lines throughout New Jersey that connect to New York and Philadelphia. In 2016, NJT operated an average of 704 daily revenue trains20 during weekdays and an average of about 380 trains on the weekends. There were more than 90 million unlinked21 passenger trips in FY 2016.
The northern routes on the Main and Bergen County Lines and Pascack Valley Line serve Hudson and Bergen counties. The Montclair-Boonton and Morristown Lines serve the counties of Essex Morris, and Warren with the Gladstone Branch serving Union and Somerset counties to the west and south of Newark. The Raritan Valley Line serves Union, Middlesex, Somerset and Hunterdon counties to the southwest. The Northeast Corridor Line, North Jersey Coast Line, River Line, and Atlantic City Line service points south and west of New York City, with destinations of Trenton, Philadelphia, and Atlantic City. The North Jersey Coast Line serves passengers in Middlesex, Monmouth, and Ocean counties. The Northeast Corridor Line serves Hudson, Essex, Union, Middlesex, and Mercer counties from Newark to Trenton. The River Line continues from Trenton south to Camden and the Atlantic City Line runs from Philadelphia in the State of Pennsylvania to Atlantic City in the southern part of the state through Camden and Atlantic counties. Freight service operates over several lines owned by NJ TRANSIT, as summarized in Table 26.
19 2016, NJ TRANSIT. NJ TRANSIT Facts at a Glance, Fiscal Year 2016 20 Trains carrying paying passengers 21 Unlinked passenger trips refer to passengers who board public transit vehicles, even if the boarding is the result of a transfer from another vehicle.

New Jersey Statewide FREIGHT PLAN
130
Table 26: Freight Service Operating on NJ TRANSIT-owned Lines
Line Name From MP To MP Miles Pascack Valley Line 7.70 19.57 11.87
Atlantic City Line 27.14 56.09 28.95 Bergen County line 3.09 18.75 15.69
N. Jersey Coast Ln (No.) 0.00 6.70 6.7 N. Jersey Coast Ln (So.) 0.40 16.07 15.67 Northeast Corridor Line 13.51 57.66 44.15
N. Jersey Coast Ln (Mid) 20.18 22.01 1.83 RiverLine 35.70 66.80 31.1
Morristown Line 1.00 57.02 56.02 Morristown & Erie RR 14.00 23.00 9
Montclair-Boonton Line 11.70 34.00 22.3 Main Line (ST W) 69.60 87.83 18.23
Main Line 2.00 76.66 74.66
Southeastern Pennsylvania Transportation Authority (SEPTA) SEPTA operates commuter rail trains in New Jersey, Pennsylvania and Delaware, making 746 trips per day throughout their system.22 Most of this activity is concentrated in Pennsylvania with New Jersey stations in Trenton and West Trenton and Delaware stations in and around Newark and Wilmington. The former of these trains operate on Amtrak’s Northeast Corridor tracks, which also serve rail freight.
Existing Operating Context The following sections provide details on the existing operating context as it affects freight rail service in New Jersey.
Rail Demand The primary driver of freight demand across all modes, including rail, is economic growth. Economic growth, coupled with population growth and the expansion or improvement of rail freight generating facilities (such as ports, intermodal yards, coal-fired power plants, chemical manufacturing facilities, etc.) and modal competitiveness contribute to increases in freight rail flows. The following sections highlight future demographic, economic, and supply chain management trends that impact rail freight in New Jersey.
Demographic and Economic Trends The state of New Jersey is the most urbanized state in the United States and the only state where each county is designated as urbanized by the US Census Bureau. New Jersey also has the highest population density of any state. The population of New Jersey has increased every decade since its establishment. New Jersey is a key producer of raw materials (minerals and agricultural commodities among others), as well as waste materials and recyclables. It is also home to a large array of warehouse and distribution facilities that serve industries, businesses, and residents both in-state and in the greater New York City and Philadelphia markets.
22 SEPTA Operating Facts, FY 2015

Chapter 4: FREIGHT NETWORK PERFORMANCE
131
Population Like many states in the Northeast, historical population growth rates in New Jersey generally outpaced the national average until the 1970s and have lagged behind ever since. Between 1970 and 2000, New Jersey’s population grew about 14 percent while the population of the entire United States increased nearly 35 percent. According to the US Census, the population of New Jersey is expected to increase another 3-5 percent by 2030. Population growth is an important driver of both freight demand and passenger traffic on the state’s roadways and rail facilities. Figure 79 shows historical and projected population of New Jersey between 1900 and 2030.
Figure 79: New Jersey Population (millions, 1900-2030)
Source: US Census Bureau. Note: 2020 and 2030 projections are from 2000 Census data.
Employment New Jersey has long been an important contributor to the overall US economy. Although employment in the manufacturing sector continues to decline, the rate of decline is slowing (71,000 manufacturing jobs lost between 2007 and 2017 compared to over 100,000 jobs lost in the sector between 2000 and 2006) the state remains a robust manufacturing hub with over 243,000 manufacturing jobs in 201723. The economic recession that saw job loss peak between 2009 and 2015 is reversing. In 2007, New Jersey reported 4.07 million non-farm jobs; in 2011, this number declined to 3.84 million in 2011, but has been increasing every year since. 2017 was the first year in the last decade where first quarter job growth exceeded that of 2007. While the economy is still considered volatile, the long-term outlook is positive, and forecasters anticipate continued growth.
23 Bureau of Labor Statistics, 2000-2017

New Jersey Statewide FREIGHT PLAN
132
Income New Jersey is historically among the states with the highest median household incomes (second in 2009). High incomes are correlated with increased consumption of goods, from food to energy, thereby increasing demand for freight across all modes, including rail, resulting in increasing congestion.
Congestion on the Transportation Network As described above, population, economic, and income growth all drive increased freight demand and contribute to congestion on New Jersey’s transportation system. With limited resources to build new capacity, it becomes especially important to select the most beneficial infrastructure projects to fund and effectively manage the existing multimodal transportation infrastructure to accommodate freight growth. Analysis of the FAF-4 data24 indicates that overall freight demand (all modes) will likely grow by about 52% between 2015 and 2045 with rail freight demand expected to grow by about 150% during the same period.
Freight Volume Trends The freight rail system, initially developed in the 1830s, expanded rapidly in the 1800s and early 1900s with system mileage reaching its peak of about 380,000 miles of track25 in the 1920s. As a result of improvements and expansion of highway infrastructure, increased competition from the trucking industry, increased regulation, and due in part to the passage of the Staggers Rail Act in 1980, the railroad industry has consolidated and divested itself of lines that were unable to generate enough revenues to cover operating and maintenance costs. The end result is that the core rail network today has been reduced to about 172,000 miles.
With a more stable sustainable rail network and operational framework in place, rail freight volumes have continued to grow, driven by advances in freight rail productivity including double-stack cars and more powerful locomotives pulling longer trains. The result of these trends is that rail market share, as a proportion of intercity ton-miles in the United States, has stabilized following a long decline where rail lost over 40 percent of its market share. Rail freight volumes increased substantially during the 2000s due in part to rising global trade combined with freight railroad expansion into new markets such as intermodal trade. Intermodal rail traffic has quadrupled over the last 25 years and increased by about a third during the past decade.26 Domestic economic growth and geologic finds leading to domestic energy production during the same period led to increases in consumption commodities such as domestic crude oil (which largely replaced coal as the freight rail energy commodity) and bulk food products.
Rail Performance: Obstacles to Efficient and Modern Freight Rail Service in New Jersey The networked nature of rail transportation in the context of the history, development patterns, and influences discussed previously presents an inter-related complex of issues challenging the improvement of the freight rail network in New Jersey. To understand the issues more fully, NJDOT consulted with passenger and freight rail operators and regional planning organizations to identify specific needs relative to freight rail efficiency and reliability.
The stakeholders, including NJ TRANSIT, Conrail, Norfolk-Southern, CSX, New Jersey’s shortline railroads, NJTPA, DVRPC, NJDOT, NJ County planning personnel, and the PANYNJ, identified specific locations within New Jersey and adjacent states where freight rail service was compromised in the existing condition, as well as locations where service would be insufficient when known and/or anticipated growth and economic development initiatives were realized.
24 A summary of the analysis of FAF-4 data is included in Chapter 3 of this Plan. 25 American Association of State Highway and Transportation Officials (AASHTO), Freight Rail Bottom Line Report, 2003 26 American Association of Railroads

Chapter 4: FREIGHT NETWORK PERFORMANCE
133
The decision to look across the borders of New Jersey into New York and Pennsylvania was somewhat controversial. New Jersey’s FAST Act allocation is intended for use within the borders of New Jersey, just as Pennsylvania’s allocation is intended for Pennsylvania. The reality of freight rail transport, however, is that fixing an impediment on one side of the Delaware or Hudson River does little for network mobility if the corresponding issues are not resolved on the other side. For example, improving vertical clearance issues in Camden, New Jersey, does little to improve the movement of freight into and out of New Jersey if the routes taken across the river restrict Plate F rail cars in Philadelphia. As a result, NJDOT, together with their FHWA partners, determined to include interstate issues because not doing so would be unrealistic. Furthermore, the FAST Act and its grant programs support regional problem-solving. Identifying these interstate issues in the freight plan facilitates their application for competitive grants, which may leverage local matches from multiple public and private partners.
Overall, the stakeholders identified more than 70 constraints throughout New Jersey and connecting to the New Jersey freight rail network. Analysis of these constraints identified four major themes common to the challenges of maintaining efficient and reliable freight rail transportation in New Jersey: state of good repair/safety, clearance and structural capacity, congestion and system capacity, and operational procedures. These constraints and the challenges involved in resolving the issues are discussed in the following sections.
State of Good Repair/Safety The Issue State of Good Repair is the foundational issue for the FAST Act— repair, replace, or otherwise improve our existing infrastructure and by that improve system efficiency. For rail projects, state of good repair (SOGR) applies to tracks, bridges, and grade crossings. System capacity and policy issues, discussed below, are related directly to SOGR. Worn track components present a derailment risk that increases as train speed increases; slower speeds address this risk but reduce the throughput of freight trains and create network congestion. Because repeated traffic with 286k cars can shorten the life of some rail components, expansion of the track available for these cars must be considered in an informed manner, with proper engineering studies and funding available for keeping the infrastructure in a continued SOGR.
Grade crossings present an interface between trains, roadway traffic, and pedestrians. Due to the non-train cross-traffic, grade crossing components have shorter useful lives than running tracks, requiring more frequent maintenance. Grade crossing protection is also a critical safety need—some grade crossings are not protected by gates that prevent cars and pedestrians from entering the crossing as a train approaches. In some older industrial areas of the state, such as the Town of Dover in Morris County, historic
The “Hole in the Wall” Bridge in Phillipsburg, NJ. South Main Street in Phillipsburg is a
main thoroughfare serving an older, historic mining community developed on steeply sloping topography. Raising South Main
Street would create geometric issues at the intersections of cross-streets and intersecting driveways, which is complicated because of
the rolling landscape.

New Jersey Statewide FREIGHT PLAN
134
development patterns are such that active railroad tracks bisect the downtown at grade. In circumstances such as these, grade crossings are spaced equal to the street grid, which slows train traffic substantially and presents multiple opportunities for accidents.
Strategies for Resolution SOGR issues associated with wear and degradation of rail infrastructure may be solved through policy, such as trackage rights fees, and increased funding to SOGR programs administered by NJDOT, such as the Rail Freight Assistance Program (RFAP), which provides funding for projects on the freight railways. NJDOT’s most recent funding bill has already recognized this need to enhance the capacity of the RFAP program and increased the RFAP total budget to $25M from $8M in previous years. It is important to note that RFAP does not provide funding for SOGR improvements for freight rail on tracks owned by NJ TRANSIT. This situation has been identified as an obstacle in meeting some of the needs expressed by freight rail operators.
Grade crossing improvements that involve infrastructure upgrade or replacement can be addressed through RFAP and federal programs that attend to the interaction between freight rail and federal aid roadways. Other grade-crossing issues require more intensive engineering solutions, including physical grade separation, or, in the case of the Dover example, complete realignment of the tracks to move them away from sources of conflict and improve operational capacity and efficiency.
Clearance and Structural Capacity Issues Clearance and structural capacity refers to the structural conditions of the freight rail system. Clearance can be either horizontal or vertical; substandard conditions of either can prohibit the passage of Plate F rail cars. Clearance can also refer to undergrade bridges that are posted for limited clearance for trucks. Vehicle strikes of rail bridges can result in structural damage to the bridge, affect rail service, and necessitate costly emergency repairs. Low clearance undergrade bridges also affect the freight roadway network, particularly in older urban industrial areas where the railroads were grade-separated before modern tractor-trailers were placed in service. Cities like Camden and Newark face this issue.
Structural capacity refers to the structural loading limit of undergrade bridges. Bridges that were not designed for 286K service, or have deteriorated over time due to wear and exposure, present a constraint that affects the efficiency of modern freight rail service. Structural capacity is a function of force, which is weight and speed. Consequently, when a bridge is not “rated for 286K” it means that the bridge does not have the load capacity to support operation of 286K cars. In certain cases depending on the bridge, trains with 286k cars may pass over the bridge if the cars are sufficiently spaced apart in the consist and train speed is reduced; however, moving slower than the posted speed of the rail line reduces locomotive efficiency, contributes air quality criteria pollutants, and adversely affects freight rail scheduling, particularly in the context of passenger rail demand on shared use tracks.
Strategies for Resolution The resolution of clearance and capacity constraints involves capital investment through physical alteration of the substandard infrastructure, and of the two, alleviating undergrade freight rail bridge constraints can be less involved than overhead bridge improvements. Undergrade bridge improvements, which can raise bridges to resolve truck strikes and strengthen bridges to rate for 286K service, typically impact freight rail operations with only minor and temporary impacts to roadways. As most undergrade bridge improvements are in line with (parallel to) the existing tracks, railroad owners often avoid the need for the acquisition of additional right-of-way to complete the improvement.

Chapter 4: FREIGHT NETWORK PERFORMANCE
135
Overhead clearance constraints are often complicated by jurisdictional matters and right-of-way needs, as the overhead bridge carries a surface roadway under the control of a public agency, and the railroad runs perpendicular to the road. This means that widening a crossing (horizontal clearance) often requires the acquisition of right-of-way from other parties, and raising surface roadways to achieve the necessary vertical clearance can create a cascading set of engineering challenges related to intersections of other roadways and driveways. Neither the railroads nor the local jurisdictions, particularly smaller municipalities and rural counties, have the budget to accommodate drastic changes in the roadway network.
Undercutting the railroad presents other engineering obstacles related to the structural integrity of adjacent uses and railroad grade. In Philadelphia, the Delair freight rail branch passes under the city streets as it nears the Delaware River. The Delair Branch is the one freight rail connection between southern New Jersey (South Jersey) and points west, and is therefore critical to the freight economy in South Jersey. The Delair Movable Bridge was recently improved through a TIGER grant to accommodate 286K rail cars and Plate F. The Delair Branch in Philadelphia, however, was not. Improving vertical clearance would either require raising the bridges and the connecting street grid in Philadelphia, or under-cutting the Delair Branch. Undercutting would seem the more practical option; unfortunately, the Delair Branch parallels Amtrak’s Northeast Corridor. Undercutting the Delair Branch to accommodate modern freight rail cars has the potential to undermine the Northeast Corridor, and in the very least, it is anticipated that the construction effort would present service issues for Amtrak’s busiest passenger corridor that also serves SEPTA. As a result, the improvement of the Delair Branch is a good example of a clearance/capacity issue that is multi-jurisdictional in several ways: two states, three transportation providers, two MPOs. Resolving the issue is possible, but not without cooperation, collaboration, and substantial capital investment.
Congestion and System Capacity Issues Similar to highway travel efficiency, railroads suffer from circumstances wherein there are more trains seeking to travel the rail corridor than the corridor can accommodate at a specific point in time. Unlike roadway vehicles, trains typically do not have the option of detouring to local routes to avoid delays and congestion on major thoroughfares.
Freight rail congestion is the result of several factors; some specific to freight rail infrastructure while others build upon and compound issues discussed previously. The most obvious are those circumstances where freight rail service is confined to a single track serving bi-directional rail traffic. This circumstance affects many of the freight rail lines serving the Port Newark/Elizabeth Marine Terminal and the Port of Paulsboro. Single tracks without passing sidings require trains to queue up, and then alternate between inbound and outbound trips. An incident on these single tracks effectively stops freight rail movement because alternate routes are not available, and constructing entirely new running track alignments is impractical in terms of the cost of right-of-way acquisition in the densely-developed New York metropolitan area, which includes older urban centers of Newark, Paterson, Elizabeth, and Hackensack. Related to single-track limitations are the lack of direct connections between rail lines that allow for continuous forward movement into and out of port and yard facilities and the lack of controlled passing sidings in busy freight corridors, such as the National Docks Secondary.
System capacity also takes the form of reliability. New Jersey’s rail infrastructure crosses multiple rivers that support maritime commerce. Moveable bridges accommodate rail traffic and maritime traffic; however, many of the moveable bridges have or are reaching the end of their useful life and are prone to malfunction. A moveable bridge stuck in the open position delays the movement of rail traffic, which reduces system capacity and creates congestion.
New Jersey Statewide FREIGHT PLAN
136
Congestion is as much an operational issue as an infrastructure issue, and in that, it is the next step in the accumulation of adverse circumstances impacting the efficiency and reliability of freight rail transport. As demand for freight goods grow and intermodal facilities are developed, there will be more trains and longer trains traveling New Jersey’s rail network. The investment in the Newark-Elizabeth Seaport Complex, which is undergoing expansion and renovation to accommodate post-Panamax ships, requires freight rail support to move an increasing quantity of goods from the ports to inland distribution facilities. Economic development initiatives at the regional and local levels also seek to invest more capital in redeveloping or reinvigorating existing rail-served industrial complexes to restore manufacturing jobs to the economy. All of these freight deliveries require access to the freight network.
Existing structural capacity constraints, discussed above, impacts the efficient transportation of goods. Although shortline and switching railroads can and often run short trains (small consists), regional service, which works on economies of scale to remain competitive with trucking, pulls consists of 50 cars or more on average. When fully loaded, a 286K rail car (Plate F) can carry 11 tons more than a 263K rail car. A 50-car train pulling 286K cars carries the equivalent load of a 55-car consist of 263K cars. On heavily-traveled corridors, particularly those that share the tracks with passenger rail, such as the Lehigh Line, operationally, every additional rail car adds time to the operating schedule, reducing the number of windows available for rail freight deliveries. Consequently, limiting the weight of rail cars limits the overall number of freight deliveries, which ripples throughout the freight-dependent economy
Strategies for Resolution Capital investment in additional rail infrastructure would alleviate many of the congestion issues. In many industrial areas and in the vicinity of ports and yards, rail operators and public transportation agencies own right-of-way that can be developed with additional siding tracks and connections without displacing businesses and residential uses. In some areas, such as the port region of South Jersey, the existing right-of-way was previously double-tracked, but in the intervening years when rail freight demand declined, one track was removed to reduce maintenance costs. Replacing that track requires capital investment in track materials, not right-of-way, and is a relatively simple solution that can result in network-wide mobility, efficiency, and reliability improvements.
There are, however, system-related caveats for increasing capacity. Increasing freight rail capacity can require more involved environmental analysis and may necessitate other network improvements to better harmonize increased freight rail activity with existing adjacent uses. Consideration for the potential impact of additional freight traffic through at-grade crossings in residential and central business districts would need careful analysis, and mitigation, if required, could add substantially to the project budget. In these instances, where a congestion management solution would increase freight rail traffic, coordination with regional planning agencies, local jurisdictions, and the freight rail operators would be imperative to address secondary and cumulative impacts.
Operational Procedures Issues Operation of 286K freight rail over passenger tracks creates conflict with Amtrak and NJ TRANSIT’s missions and fiscal resources; however, much of New Jersey’s freight rail service relies on trackage rights over NJ TRANSIT and Amtrak rails. As a general rule, NJ TRANSIT’s system can only accommodate 263K freight cars due to the existing conditions of the rail infrastructure, specifically structures.
The heaviest passenger rail car used by Amtrak weighs about 85 tons, or about 60% as much as a 286K freight rail car. Passenger train consists are also typically less than 15 cars in length, as the platforms at most passenger rail stations on the Northeast Corridor can accommodate an 11-car consist. NJ TRANSIT and SEPTA operate

Chapter 4: FREIGHT NETWORK PERFORMANCE
137
similarly, as both services also use the Northeast Corridor (NEC). Consequently, not counting the locomotives, one typical 286K freight train weighs 5,800 tons more than the heaviest passenger rail train.
The passage of rail vehicles over the tracks wears the infrastructure. As friction increases with the weight of an object, heavy freight trains cause more wear to railroad infrastructure than significantly lighter passenger rail trains. Wear affects the stability of the rail steel, particularly along curves, wears down ties, and causes structural stress on undergrade bridges. These infrastructure elements need to be maintained in a state of good repair to Federal Railroad Administration and Federal Transit Administration standards for passenger safety and transit service reliability.
The operation of freight train service in passenger train territory may also generate public perception concerns. Despite the low likelihood of a freight-passenger incident, public perception can have a negative impact and lead to general opposition of new rail-served industrial redevelopment efforts.
The 286K standard was a relatively recent development, and occurred well after transit agencies like NJ TRANSIT had been created to assume responsibility for commuter rail operations of the former freight railroads. The rail infrastructure in these territories was designed to meet the operational needs of the rail equipment then in use, which in many cases is insufficient for 286K operation. In some instances, achieving this newer standard requires physical retrofit of existing infrastructure.
Funding for passenger rail service at the state and national level is heavily subsidized already because it is seen as a social good and important service that provides transportation alternatives to congested highway travel and access to jobs for workers who do not possess personal means of transportation. Upgrades that satisfy freight rail needs but exceed passenger rail needs are difficult for passenger rail operators to substantiate in this fiscal climate, leaving a gap in infrastructure improvement that, if filled, could ultimately improve overall rail network operations.
Strategies for Resolution Increased trackage rights fees may off-set some of the additional cost of maintenance, but that alone will not fund the capital improvements required to improve the infrastructure to handle continuous 286k traffic. Coordination and dialogue amongst the stakeholders, including the freight service providers and intermodal facility operators, is required to identify solutions that will address these long-term needs.
Existing Rail Constraints Table 27 summarizes the freight rail issues presented during the coordination meetings held in the preparation of this statewide freight rail plan. The issues, or “Constraints,” are identified as the rail owner refers to the issue, and each constraint is associated with one of the four issues described above. The constraints are keyed to a map that follows the matrix, illustrating the general location of the constraint in the context of the statewide rail network.
To reflect the networked nature of freight rail infrastructure and recognize the relationships between specific constraints, the 74 constraints were grouped either by function or geography. For example, if one rail line has several bridges with insufficient clearance for Plate F cars, the separately named bridges would be grouped together. If another improvement sought to increase capacity on a running track by adding a second track, but the access to the running track was constrained by a bridge that did not provide clearance for Plate F, the bridge and the running track expansion would be grouped together.
In Chapter 6, the individual projects are evaluated in terms of their potential value to the overall functionality of the freight rail network in New Jersey. The evaluation was based upon an assessment of

New Jersey Statewide FREIGHT PLAN
138
the relative improvement or support the project would be expected to yield under the following thirteen (13) individual criteria:
1. Maintain state of good repair 2. Preserve out of service and at-risk rail rights of way 3. Protect critical corridors and connections to the national network 4. Enhance intermodal connectivity 5. Improve quality of life 6. Enhance connectivity between Class I, regional and shortline railroads 7. Ensure adequate yard capacity 8. Maintain and expand funding programs and opportunities 9. Maintain or expand system redundancy 10. Reduce congestion and enhance operational efficiency 11. Maintain or enhance economic development opportunities 12. Support retention, attraction and growth in rail-served industries within New Jersey 13. Expand public education and support
Not all projects within a group may be of equal urgency, but the grouping approach will enable NJDOT to identify which supporting projects may be beneficial in achieving the greatest benefit from the improvement of the critical need project.
Table 27: Rail Constraint Matrix
Project Listing Name of Constraint Line Name Grouping
1 286k Request Atlantic City Line 286K2 286k Request Main Line 286K3 286k Request Raritan Valley Line 286K4 286k Request Bergen County Line BERCO 2865 HX Draw Bridge 286k Bergen County Line BERCO 2866 Belden Brick Crossing Bergen County Line BERCO 286
7 Capacity Constraints CP Green to Linden Ave Second Track National Docks Secondary DOCKS
8 Capacity Constraints with increase Port Volume - Greenville Yard Redevelopment Greenville Yard GREENVILLE
9 No Northward Connection Between National Docks and Greenville Yard
National Docks Secondary, Greenville Yard to Upper Bay GREENVILLE
10
Capacity Constraints - Support Tracks Required (up to 4 between Upper Bay & CP Arden) to pass trains from increased Greenville Yard traffic
Oak Island Yard GREENVILLE
11 DB Draw Bridge (inactive but maintained) Boonton Line INDIVIDUAL
12 Harrison Industrial Track Harrison I.T. INDIVIDUAL
13 Rahway River Bridge Garden State Secondary (formerly Chemical Coast) INDIVIDUAL
14 Limited Capacity on River Line CSX River Line INDIVIDUAL
15 Limited Capacity on West Trenton Line West Trenton Line INDIVIDUAL

Chapter 4: FREIGHT NETWORK PERFORMANCE
139
Project Listing Name of Constraint Line Name Grouping
16 Croxton Yard Nave-Croxton R.T. INDIVIDUAL17 Landsdown Wye Lehigh Line INDIVIDUAL 18 Bridge Ballast (LE57.1 and 57.17) Lehigh Line INDIVIDUAL
19 Crash Beam at LE 36.4 Bridge Lehigh Line INDIVIDUAL
20 Capacity Constraints on Lehigh Line between CP Aldene and NK Lehigh Line LEHIGH
21 Capacity Constraints Lehigh Line (CP Aldene to Manville) Lehigh Line LEHIGH
22 Capacity Constraints through Musconetcong Tunnel Lehigh Line LEHIGH
23 Capacity Constraints Lehigh Line (Manville to Phillipsburg) Lehigh Line LEHIGH
24 286k Request Whippany Line MORRISCO 28625 Grand Avenue Bridge Morristown Line MORRISCO 28626 Cattle Pass Bridge Morristown Line MORRISCO 28627 Drain Bridge Morristown Line MORRISCO 28628 Shippenport Road Bridge Morristown Line MORRISCO 28629 Bridge over Mill Brook Morristown Line MORRISCO 28630 Bridge over Franklin Road Morristown Line MORRISCO 28631 East Hanover Avenue Bridge Morristown Line MORRISCO 28632 South Main Street Bridge Washington Secondary MORRISCO 28633 Engine Track Ramp Extension Nave-Croxton R.T. NAVE34 Limited Track Storage Nave-Croxton R.T. NAVE
35 286k Limitations on NEC Northeast Corridor NEC IMPROVEMENTS
36 Capacity and Operation Constraints on the Mid-Line Loop near North Brunswick, NJ Northeast Corridor NEC
IMPROVEMENTS
37 Capacity Constraint on NEC - Sawtooth Bridge Northeast Corridor NEC IMPROVEMENTS
38 State of Good Repair from Trenton to NYC Northeast Corridor NEC IMPROVEMENTS
39 Vertical Clearance on NEC Northeast Corridor NEC IMPROVEMENTS
40 286k Request North Jersey Coast Line NJCL 28641 Raritan Bay Drawbridge (River Draw) North Jersey Coast Line NJCL 286
42 NJTPA Rail Freight Capacity and Needs Assessment at Grade Crossings Multiple NJTPA
CROSSINGS 43 Oak Island Yard Capacity Constraints Oak Island Yard OAK
44 Waverly Loop Capacity Constraints- Double Track Connection Oak Island Yard OAK
45 West Belt Parkway Crossing Totowa Spur OTHER CROSSINGS
46 Crooks Avenue Crossing Passaic Spur OTHER CROSSINGS

New Jersey Statewide FREIGHT PLAN
140
Project Listing Name of Constraint Line Name Grouping
47 Bunge Oil Crossing Harrison I.T. OTHER CROSSINGS
48 Bunge Oil Lead Harrison I.T. OTHER CROSSINGS
49 Highfield Lane Crossing Newark I.T. OTHER CROSSINGS
50 Point-No-Point Moveable Bridge (CP Kearny Interlocking) Passaic & Harsimus Line P&H
51 Capacity Constraints at Marion Junction, Single Tracks on P&H and National Docks
Passaic & Harsimus Line/Northern Branch P&H
52 Harsimus Branch Lift Bridge (Hack Bridge) Passaic & Harsimus Line P&H
53 Vertical Clearance Restrictions on Delair Bridge Delair Branch PA-NJ-1
54 Vertical Clearance at G Street (19'10") Delair Branch PA-NJ-155 Vertical Clearance at Front Street (20'2") Delair Branch PA-NJ-156 Vertical Clearance at 2nd Street (18'8") Delair Branch PA-NJ-157 Vertical Clearance at 5th Street (19'3") Delair Branch PA-NJ-158 Vertical Clearance at Margie Street (18'10") Delair Branch PA-NJ-159 Vertical Clearance at Ridge Avenue (18'11") Delair Branch PA-NJ-1
60 Vertical Clearance at Cecil B. Moore Avenue (18'0") Delair Branch PA-NJ-1
61 Upper Hack Lift Bridge Main Line PORT BRIDGE62 Lower Hack Lift Bridge Morristown Line PORT BRIDGE63 Upper Bay Bridge (Lehigh Valley Drawbridge) National Docks Secondary PORT BRIDGE64 Arthur Kill Lift Bridge Staten Island Railroad PORT BRIDGE65 E-Rail WJ PORT SUPP66 Positive Train Control Network PTC
67 Vertical Clearance Issues in Perth Amboy Garden State Secondary (formerly Chemical Coast) RARITAN
68 Single-Track Constraints, Lack of Connection to the Raritan Industrial Track
Garden State Secondary (formerly Chemical Coast) RARITAN
69 286k Access to Middlesex County Northeast Corridor RARITAN70 286k Restrictions & Needed repairs Salem Running Track SJPC71 Paulsboro Wye to Port Connection Vineland Secondary SJPC
72 North-South Connectivity None- North-South connection needed SJPC
73 Rail Crossing at Route 601 CSX Trenton Line TRENTON74 Capacity Constraints, Single track Limitations CSX Trenton Line TRENTON
Project Descriptions by Group The following narratives describe the freight rail projects listed above in terms of their functional or geographic group. As discussed previously, the purpose of the grouping is to assist NJDOT in long-range planning for freight rail investment and guide the refinement of discretionary local grant criteria. While each identified project has independent utility, the objective of grouping the projects is to recognize the relationships between freight rail constraints and the maximum return on investment by funding projects that achieve more transportation benefits together than if funded separately, years apart.
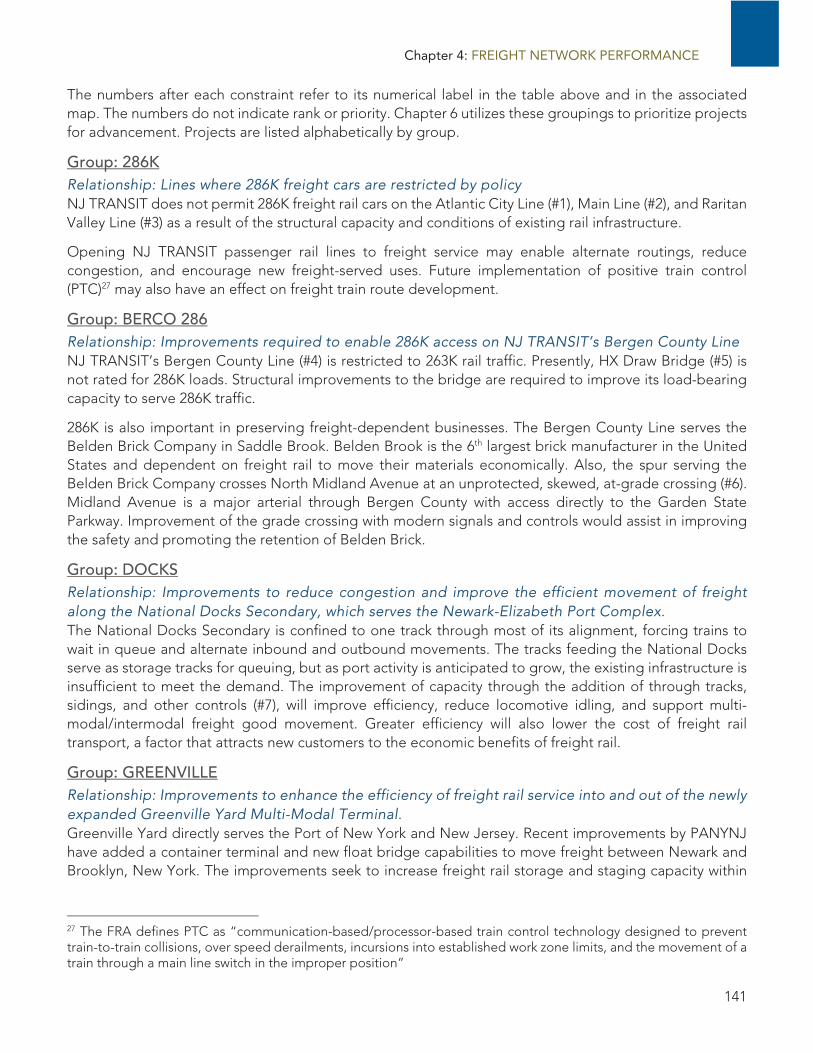
Chapter 4: FREIGHT NETWORK PERFORMANCE
141
The numbers after each constraint refer to its numerical label in the table above and in the associated map. The numbers do not indicate rank or priority. Chapter 6 utilizes these groupings to prioritize projects for advancement. Projects are listed alphabetically by group.
Group: 286K Relationship: Lines where 286K freight cars are restricted by policy NJ TRANSIT does not permit 286K freight rail cars on the Atlantic City Line (#1), Main Line (#2), and Raritan Valley Line (#3) as a result of the structural capacity and conditions of existing rail infrastructure.
Opening NJ TRANSIT passenger rail lines to freight service may enable alternate routings, reduce congestion, and encourage new freight-served uses. Future implementation of positive train control (PTC)27 may also have an effect on freight train route development.
Group: BERCO 286 Relationship: Improvements required to enable 286K access on NJ TRANSIT’s Bergen County Line NJ TRANSIT’s Bergen County Line (#4) is restricted to 263K rail traffic. Presently, HX Draw Bridge (#5) is not rated for 286K loads. Structural improvements to the bridge are required to improve its load-bearing capacity to serve 286K traffic.
286K is also important in preserving freight-dependent businesses. The Bergen County Line serves the Belden Brick Company in Saddle Brook. Belden Brook is the 6th largest brick manufacturer in the United States and dependent on freight rail to move their materials economically. Also, the spur serving the Belden Brick Company crosses North Midland Avenue at an unprotected, skewed, at-grade crossing (#6). Midland Avenue is a major arterial through Bergen County with access directly to the Garden State Parkway. Improvement of the grade crossing with modern signals and controls would assist in improving the safety and promoting the retention of Belden Brick.
Group: DOCKS Relationship: Improvements to reduce congestion and improve the efficient movement of freight along the National Docks Secondary, which serves the Newark-Elizabeth Port Complex. The National Docks Secondary is confined to one track through most of its alignment, forcing trains to wait in queue and alternate inbound and outbound movements. The tracks feeding the National Docks serve as storage tracks for queuing, but as port activity is anticipated to grow, the existing infrastructure is insufficient to meet the demand. The improvement of capacity through the addition of through tracks, sidings, and other controls (#7), will improve efficiency, reduce locomotive idling, and support multi-modal/intermodal freight good movement. Greater efficiency will also lower the cost of freight rail transport, a factor that attracts new customers to the economic benefits of freight rail.
Group: GREENVILLE Relationship: Improvements to enhance the efficiency of freight rail service into and out of the newly expanded Greenville Yard Multi-Modal Terminal. Greenville Yard directly serves the Port of New York and New Jersey. Recent improvements by PANYNJ have added a container terminal and new float bridge capabilities to move freight between Newark and Brooklyn, New York. The improvements seek to increase freight rail storage and staging capacity within
27 The FRA defines PTC as “communication-based/processor-based train control technology designed to prevent train-to-train collisions, over speed derailments, incursions into established work zone limits, and the movement of a train through a main line switch in the improper position”

New Jersey Statewide FREIGHT PLAN
142
the yard (#8 and #10) as well as between the yard and the greater freight rail distribution network via the National Docks Secondary (#9).
Group: INDIVIDUAL Relationship: These needed improvements are identified as constraints but are not part of a functional group of projects. They are unrelated to each other as well as to other needs and constraints. Projects in the INDIVIDUAL group include state of good repair/safety projects (#17, #18, #19) and some isolated capacity enhancement projects (#11-#15), including improvements to Croxton Yard (#16.)
Group: LEHIGH Relationship: Improvements needed to increase capacity on the Lehigh Line. The Lehigh Line is the primary east-west freight route connecting the Northern New Jersey ports with the freight rail network in Pennsylvania. The Lehigh Line is heavily traveled by both passenger and freight rail and is a mobility choke-point as a result. The constraints listed in the table speak to the need to add additional tracks on the Lehigh and separate freight and passenger service (#20, #21, #23) and eliminate a vertical clearance constraint that restricts the passage of Plate F cars (#22).
Group: MORRISCO 286 Relationship: Improvements that will clear the entire Morristown Line/Washington Secondary for 286K access. The Morristown Line/Washington Secondary connects Morris County with the Delaware River crossings in Warren County, providing access to the western freight rail network. The line is historic and passes through older industrial mining towns between Phillipsburg and East Hanover. Much of the alignment is grade separated, which is positive for surface transportation; however, many of the crossings and bridges cannot accommodate Plate F vehicles or 286K rail cars (#24 through #32). There are no alternate routes aside from the Lehigh Line, which is overburdened in the present condition (see above, Group: LEHIGH). Improved clearance and 286K access along the Morristown Line/Washington Secondary needs to occur sequentially, either starting from the east or west, to provide a continuous run of industry standard clearance and 286K capacity. The improvements would also support the attraction of businesses and economic growth while helping in the retention of existing freight rail customers.
Group: NAVE Relationship: Capacity constraints on tracks serving Croxton Yard. Constraints #33 and #34 affect the movement of trains into and out of Croxton Yard by limiting storage capacity outside of the yard and reducing operational efficiency.
Group: NEC IMPROVEMENTS Relationship: Freight rail needs that, if met, could optimize freight movement on the Northeast Corridor and reduce rail traffic congestion and conflicts between passenger and freight service. Policy restricts 286K access along the NEC (#35). The NEC is the heaviest traveled rail corridor in the United States, providing both freight and passenger rail access from Boston to Washington, D.C. In New Jersey, the NEC begins in Trenton and ends at Penn Station in Manhattan. The corridor presently experiences a high level of congestion that may be improved through capacity and operational improvements in Middlesex County at the Midline Loop (#36). As with much of the NEC corridor, the New Jersey section require improvements to maintain SOGR (#38) and will require more frequent maintenance and investment if 286K cars are permitted on the corridor, including the upgrade of some crossings (#37). Vertical clearance constraints, typically related to catenary wires (#39), also limit Plate F access.

Chapter 4: FREIGHT NETWORK PERFORMANCE
143
Group: NJCL 286 Relationship: Improvements required to allow 286K access on NJ TRANSIT’s North Jersey Coast Line (NJCL). Similar to the other NJ TRANSIT lines discussed previously, NJ TRANSIT limits weight on this segment of the North Jersey Coast Line to 267,000 lb cars based on engineering review suggesting overstress conditions for cars exceeding this weight. NJ TRANSIT will replace the Raritan River Draw Bridge under the Hurricane Sandy Competitive Resilience Program; it is included in the priority projects in the event that additional funding is needed.
Group: NJTPA CROSSINGS Relationship: Grade crossing improvement needs identified previously by NJTPA. The NJTPA identified several grade crossing improvement needs in the NJTPA Rail Freight Capacity and Needs Assessment to Year 2040. This report was prepared in cooperation with the freight operators in New Jersey and state transportation agencies. The list of grade crossing improvements included in the NJTPA report is included in this report by reference (#42). The NJTPA report is a living document that may be updated to reflect new needs and completed projects.
Group: OAK Relationship: Needs associated with the efficient movement of freight into and out of Oak Island Yard. Oak Island Yard is located at the intersection of several critical freight rail lines, including the Lehigh Line, the Passaic and Harsimus Line, and the Garden State Secondary (formerly the Chemical Coast Line). It also connects to the National Docks Secondary via an intermediate connection. Oak Island serves the Port Elizabeth complex and includes classification areas and maintenance buildings. Growth in freight rail activity at the ports will require enhancements to the capacity and operational efficiency of the yard (#43) and improved connections to the local freight rail network (#44.)
Group: OTHER CROSSINGS Relationship: Railroad at-grade crossings identified by Norfolk Southern as in need of improvement to ensure reliability, safety, and ease of access to existing freight rail customers. The needs are individually independent. Needs #45 through #49 are grade crossings located in urbanized areas of Hudson and Passaic Counties.
Oak Island Yard is located in the Ironbound District in Newark. Numerous key rail lines
converge at the yard. Its proximity to the Port Newark-Elizabeth Marine Terminal and Newark Liberty International Airport make it one of the
most important rail nodes in the state.
Photo: © 2004 David Sailors

New Jersey Statewide FREIGHT PLAN
144
Group: P&H Relationship: The Passaic and Harsimus (P&H) Line connects the Lehigh to the National Docks Secondary and is presently one track. The needs, when addressed, would together reduce congestion and improve the operational efficiency of the port-serving yards and transload facilities as well as reduce pressure on the National Docks Secondary. The needs identified for the P&H involve the improvement of Point-No-Point Bridge, a moveable bridge more than 100 years old providing service across the Passaic River between Newark and Kearny (#50) and installation of additional tracks to increase through capacity and improve operational efficiency (#51.) The Harsimus Lift Bridge (Hack Bridge) needs improvement, as well, to rate for 286K rail cars and improve its reliability for both rail traffic and maritime transport (#52).
Group: PA-NJ-1 Relationship: These needs address constraints challenging the movement of freight between Southern New Jersey and the Philadelphia region of Pennsylvania and points west. Constraints #53 through #60 are vertical clearance issues constraining the movement of double-stacked and Plate F rail cars across the Delaware River via the Delair Bridge into Pennsylvania. Through Philadelphia, the city street grid is elevated over the freight rail lines. The vertically constrained bridges are in close proximity to each other along the Delair Branch; consequently, the benefits of improvement would only be realized if all of the vertical constraints were improved simultaneously or close thereto. The improvement is challenged in terms of its engineering solutions, as well. Raising the bridges impacts the street network; undercutting to lower the tracks can destabilize the NEC, which runs alongside the Delair Branch. Cooperation with Amtrak, SEPTA, and both the states of New Jersey and Pennsylvania would be required to achieve these improvements.
Group: PORT BRIDGE Relationship: The bridges included in this group do not share a direct relationship to one another but instead share a common purpose in connecting the port facilities to the freight rail distribution network. The bridge improvement needs listed as constraints #61 to #64 are all aging moveable bridges. As freight rail traffic is expected to increase between the ports and the landside freight network, the reliability of these moveable bridges will be essential to the operational efficiency of both the freight rail and maritime transportation systems.
Group: PORT SUPP Relationship: None. This is a single project that will improve the operational efficiency and capacity of the E-rail port facilities serving the Ports of Newark and Elizabeth. Improvements include more efficient connections, intermodal accommodations, and improved security.
Group: PTC Relationship: None. Positive Train Control (PTC) is required for all rail transportation, both passenger and freight that will improve the safe operation of rail traffic. Implementing PTC in New Jersey is complicated due to widespread shared use of the existing rail infrastructure.

Chapter 4: FREIGHT NETWORK PERFORMANCE
145
Group: RARITAN Relationship: The needs in this group seek to improve access to an existing maritime-served industrial complex in Middlesex County. The Raritan Center industrial complex in Middlesex County is located along the navigable Raritan River. The owners of the facility are seeking to expand its manufacturing and warehousing capability, but to remain competitive, the site requires 286K access (#69), the elimination of a vertical clearance issue (#67), and improved track alignment and capacity (#68.)
Group: SJPC Relationship: These needs would improve freight rail access and efficiency in serving the Ports of Paulsboro and Camden. The Port of Paulsboro was the recipient of a 2011 TIGER Grant that funded on-dock rail improvements and the construction of modern facilities. Maximizing the use of the Port improvements would require 286K upgrade of the Salem Running Track (#70) and the construction of a new rail connection to the Port of Paulsboro that would allow continuous forward movement for northbound trains into the Port and southbound trains out of the Port (#71). Southern New Jersey’s manufacturing sector has traditionally been located south of the Port of Paulsboro. Direct freight rail connection between northern and southern New Jersey is also needed (#72). Presently, no direct, 286K capable option exists to facilitate freight movement between the southern NJ ports and northern customers without moving first west into Pennsylvania, which is not efficient. Not only does such western movement add time and cost to transportation, as described previously, the western routes into the Philadelphia region are encumbered by clearance constraints.
Group: TRENTON Relationship: Projects identified by NJTPA in their Rail Freight Capacity and Needs Assessment report, serving Somerset and Mercer County. The CSX Trenton Line provides freight rail access to Somerset and Mercer County’s industrial sectors. The needs identified would improve the safety of the line (#73) and increase its capacity (#74.)

New Jersey Statewide FREIGHT PLAN
146
Air Air cargo serves a critical role in New Jersey’s supply chain. Since air freight tends to be the highest unit cost to move cargo, commodities that move by air generally are time sensitive, light in weight and high in value. These types of goods include perishable shipments (such as fresh fish and flowers), pharmaceuticals, documents and packages, electronics, high-end apparel and jewelry, or artwork. Just-in-time shipments of parts needed to keep assembly lines and offices functioning, where inventory costs may be higher than the cost to ship may also move by air.
In its simplest form, air cargo is comprised of freight and mail. Airmail in the United States is contracted out by the US Postal Service and travels in the belly of commercial passenger aircraft and on freighters operated by contractors. Air freight refers to all cargo other than mail. Air cargo carriers can be divided into several categories: Passenger airlines, traditional all-cargo carriers, and service oriented integrated/express all-cargo carriers.
Newark Liberty International Airport New Jersey’s air cargo market is dominated by Newark Liberty International Airport, which historically has ranked as one of the top 10 airports in the United States for air cargo. In 2016, Newark ranked 11th in the United States and 37th in the world for total cargo (freight and mail) handling over 700,000 tons of cargo.28 However, while EWR’s overall cargo tonnage has shown growth since 2013, its global rank, detailed in Table 28 has declined.
Table 28: Air Cargo and Mail Trends at EWR29
Year Air
Cargo (tons)
Air Mail (tons)* US Rank Global
Rank
2005 957,603 90,169 9 21 2006 979,271 95,658 9 22 2007 953,556 109,062 9 22 2008 869,448 108,565 9 22 2009 758,152 97,441 9 23 2010 860,845 82,479 9 23 2011 811,989 84,603 9 25 2012 741,277 79,393 9 27 2013 662,422 54,677 9 33 2014 666,841 36,366 10 37 2015 704,687 49,029 10 38 2016 746,770 45,798 11 37
*-These totals do not include U.S. Mail carried by FedEx (these are included in Air Cargo Tonnage)
28 Airports Council International – North America, 2015 Airport Traffic Report 29 PANYNJ Annual Airport Traffic Statistics, https://www.panynj.gov/airports/traffic-statistics.html

Chapter 4: FREIGHT NETWORK PERFORMANCE
147
Figure 80: Air Cargo and Mail Trends at EWR
Newark’s total air cargo tonnage shows a decline during the past decade, which follows air cargo trends at similar facilities, including JFK, Dallas-Fort Worth, and Atlanta. However, Newark has experienced growth in air cargo tonnage in recent years, as shown in Figure 80, maintaining its national and global presence in the market. EWR has a close relationship with JFK and the freight forwarding community, resulting in significant movement of air cargo between the two airports. There is a need to improve logistical capabilities between the airports.
In 2016, Newark served numerous domestic and international markets via passenger and freighter service. Table 29 indicates the top origin markets (where EWR was the destination) for freight and mail, as well as the top carriers for freight and mail. Similarly, in Table 30, the top destination markets and carriers (where EWR was the origin) for freight and mail. These indicate the importance that integrator markets (Memphis, Louisville, Anchorage, and Indianapolis) play in Newark’s operations.
0
200,000
400,000
600,000
800,000
1,000,000
1,200,000
2005 2006 2007 2008 2009 2010 2011 2012 2013 2014 2015 2016
Air Cargo (tons) Air Mail (tons)
Newark Liberty International Airport is the fifth largest hub for FedEx within the United States
and is their largest hub on the East Coast
Photo: Flickr (user: LunchboxLarry)

New Jersey Statewide FREIGHT PLAN
148
Table 29: Air Cargo by Origin and Carrier – Destined to EWR
Origin Freight (tons) Origin Mail (tons)
Memphis, TN 72,103 Louisville, KY 2,993 Louisville, KY 54,452 London - Heathrow, UK 2,221 Indianapolis, IN 25,352 Los Angeles, CA 1,982 London - Heathrow, UK 19,331 Houston - George Bush, TX 1,755 Paris - Charles de Gaulle, FR 17,777 San Francisco, CA 1,709 Cologne - Bonn, GER 14,407 Dallas-Fort Worth, TX 1,523 Oakland, CA 13,142 Munich, GER 960 Tel Aviv - Ben Gurion, ISR 11,040 Frankfurt - am Main, GER 915 Los Angeles, CA 9,793 Chicago - O'Hare, IL 727 Cincinnati-Northern Kentucky 9,480 Miami, FL 603
Carrier Freight (tons) Carrier Mail (tons)
Federal Express Corporation 177,478 United Air Lines Inc. 16,492 United Air Lines Inc. 88,095 United Parcel Service 4,308 United Parcel Service 74,028 American Airlines Inc. 603 Scandinavian Airlines Sys. 17,357 Delta Air Lines Inc. 294 Lufthansa German Airlines 15,593 Alaska Airlines Inc. 69 ABX Air Inc 9,387 Federal Express Corporation 36 British Airways Plc 7,717
Swiss International Airlines 4,988Virgin Atlantic Airways 4,739Delta Air Lines Inc. 3,479
Source: 2016 Bureau of Transportation Statistics T-100 Data

Chapter 4: FREIGHT NETWORK PERFORMANCE
149
Table 30: Air Cargo by Destination and Carrier – Originating at EWR
Destination Freight (tons) Destination Mail (tons)Memphis, TN 82,474 Louisville, KY 4,105Louisville, KY 43,716 Los Angeles, CA 2,557Indianapolis, IN 32,277 San Francisco, CA 2,010Los Angeles, CA 18,091 Houston - George Bush, TX 1,435London - Heathrow, UK 11,257 London - Heathrow, UK 1,387Fort Lauderdale, FL 8,684 Denver, CO 1,190London - Stansted, UK 8,434 Dallas-Fort Worth, TX 1,145Tel Aviv - Ben Gurion, ISR 7,368 Tampa, FL 992 Boston - Logan, MA 6,823 Phoenix, AZ 934 Anchorage, AK 6,818 Chicago - O'Hare, IL 784
Carrier Freight (tons) Carrier Mail (tons)Federal Express Corporation 180,782 United Air Lines Inc. 19,460United Parcel Service 72,312 United Parcel Service 5,396United Air Lines Inc. 46,311 American Airlines Inc. 1,154Scandinavian Airlines Sys. 7,651 Delta Air Lines Inc. 204 ABX Air Inc 6,688 Alaska Airlines Inc. 136 Virgin Atlantic Airways 5,275 Federal Express Corporation 22 Lufthansa German Airlines 3,125
Cargojet Airways Ltd. 2,834British Airways Plc 2,826El Al Israel Airlines Ltd. 2,061
Source: 2016 Bureau of Transportation Statistics T-100 Data
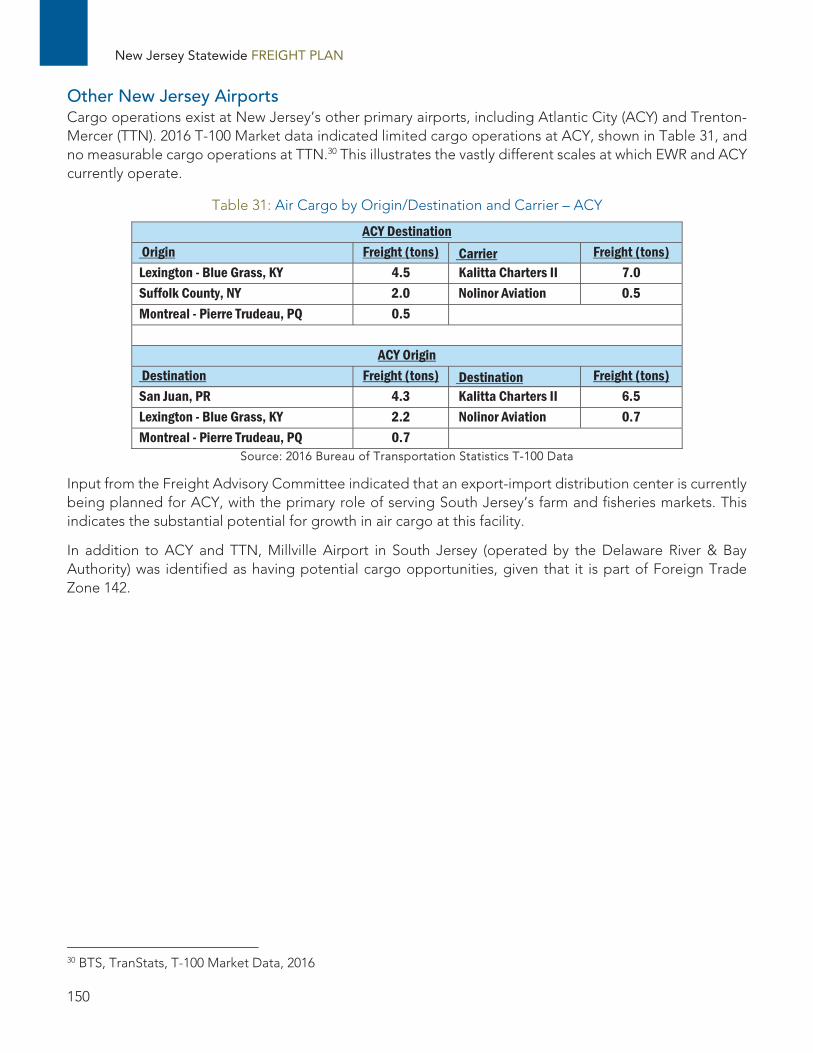
New Jersey Statewide FREIGHT PLAN
150
Other New Jersey Airports Cargo operations exist at New Jersey’s other primary airports, including Atlantic City (ACY) and Trenton-Mercer (TTN). 2016 T-100 Market data indicated limited cargo operations at ACY, shown in Table 31, and no measurable cargo operations at TTN.30 This illustrates the vastly different scales at which EWR and ACY currently operate.
Table 31: Air Cargo by Origin/Destination and Carrier – ACY
ACY Destination Origin Freight (tons) Carrier Freight (tons)Lexington - Blue Grass, KY 4.5 Kalitta Charters II 7.0 Suffolk County, NY 2.0 Nolinor Aviation 0.5 Montreal - Pierre Trudeau, PQ 0.5
ACY Origin Destination Freight (tons) Destination Freight (tons)San Juan, PR 4.3 Kalitta Charters II 6.5 Lexington - Blue Grass, KY 2.2 Nolinor Aviation 0.7 Montreal - Pierre Trudeau, PQ 0.7
Source: 2016 Bureau of Transportation Statistics T-100 Data
Input from the Freight Advisory Committee indicated that an export-import distribution center is currently being planned for ACY, with the primary role of serving South Jersey’s farm and fisheries markets. This indicates the substantial potential for growth in air cargo at this facility.
In addition to ACY and TTN, Millville Airport in South Jersey (operated by the Delaware River & Bay Authority) was identified as having potential cargo opportunities, given that it is part of Foreign Trade Zone 142.
30 BTS, TranStats, T-100 Market Data, 2016

Chapter 5: INNOVATEIVE TECHNOLOGIES AND STRATEGIES
151
INNOVATIVE TECHNOLOGIES AND
STRATEGIES This chapter reviews major freight trends affecting and shaping New Jersey’s multimodal freight system. It covers how the state can consider incorporating technological advances and market changes. Implications for New Jersey are presented, including how they may impact commodity or industry-specific freight flows presented earlier in this plan.
Funding and Financing Program Trends NJDOT funding currently comes from three primary sources:
Motor fuel taxes Motor vehicle registrations Federal grants and formula funds
Financing occurs through bond proceeds currently, although innovative financing mechanisms such as Public-Private Partnerships (P3s) are being explored with increasing regularity, particularly since New Jersey passed P3 enabling legislation in 2015.
Each of the funding sources have seen revenue increases in the current decade, most notably fuel taxes and federal funds. New Jersey raised its tax on gasoline by 23 cents at the end of 2016, and on diesel fuel by 8 cents in two stages, the second taking effect in mid-2017. At least as important, a 2016 ballot initiative established a requirement that all gas tax revenue go into the transportation trust fund, and this applied to the existing taxes as well as to the increase. Increased gas tax revenues are projected to add another $1.4 billion to the state’s Transportation Trust Fund.31 As a state with substantial volumes of pass-through freight traffic and corollary costs, diesel tax and New Jersey Turnpike toll revenues from all users are important for the maintenance and performance of the state highway freight system.
The New Jersey apportionment under the National Highway Freight Program is $158.6 million over the five years of the Act, and ties the use of these “freight formula” funds to the National Highway Freight Network (described elsewhere in this plan). The Nationally Significant Freight and Highway Projects discretionary grant program – now branded as the Infrastructure for Rebuilding America (INFRA) program – provides $4.5 billion nationwide, $500 million of which is available for intermodal projects including rail- and port-related initiatives. The minimum size for most New Jersey projects seeking grant money is $100 million, although there is a 10 percent set-aside for small projects. Grant criteria under the INFRA program
31 “The 23-cent N.J. gas tax hike plan: 9 facts you need to know,” Samantha Marcus, NJ.com: http://www.nj.com/politics/index.ssf/2016/06/the_23-cent_gas_tax_plan_9_facts_you_need_to_know.html

New Jersey Statewide FREIGHT PLAN
152
emphasize leveraging of federal funds with state, local and private contributions, making New Jersey’s recent steps in P3 legislation and transportation funding timely and competitively advantageous.
Emerging Trends
Connected and Automated/Autonomous Vehicles In October 2016 in Colorado Springs, CO, the first automated freight delivery was completed by the self-driving truck company OTTO, carrying a 120-mile shipment of Budweiser beer for Anheuser-Busch InBev.32 This is remarkable not only as a transportation milestone, but for the degree of automation: the beverages rolled off the production line onto the truck and continued from the plant to the delivery point with little or no direct involvement of labor. Effectively, this made the delivery process an extension of the manufacturing process – and OTTO in fact is marketing itself as a “self-driving solution for lean factories”.33
Figure 81: OTTO Budweiser Driverless Delivery
Source: USA Today, (10/16)
This kind of capability redefines the production function for shippers and for freight carriers. ATRI, an arm of the American Trucking Association, reports that an OTTO retrofit can be obtained for trucks now on the road for $30,00034 – not a small number, but not a prohibitive one when compared to approximately $130,000 for a new Class 8 truck. ATRI also identifies a graduated series of automated upgrades that can be added to a truck for $13,000-$23,000 – and fleets already employ technology to assist and manage driver performance. In other words, it does not require a radical reinvestment in new vehicles for the trucking industry to move into automated operations. Considering that a shortage of qualified drivers has troubled the trucking industry for many years, there is ample motivation for carriers to explore it - as there is motivation for non-traditional companies to enter the industry. OTTO itself was previously acquired by the ride-hailing corporation Uber, while on the passenger side, General Motors has invested in the Uber 32 “Self-Driving Truck’s First Mission: A 120-Mile Beer Run”, New York Times, 10/25/16. 33 www.ottomotors.com, accessed 2/24/17 34 “Identifying Autonomous Vehicle Technology Impacts on the Trucking Industry”, American Transportation Research Institute, November 2016.
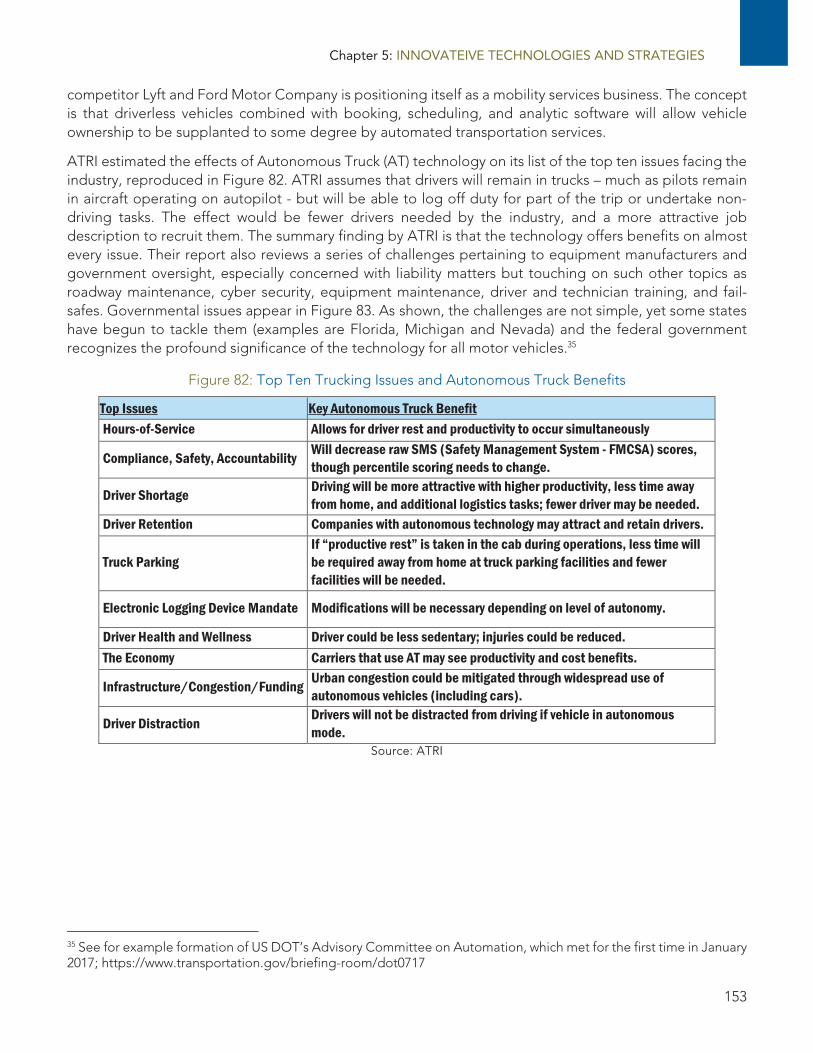
Chapter 5: INNOVATEIVE TECHNOLOGIES AND STRATEGIES
153
competitor Lyft and Ford Motor Company is positioning itself as a mobility services business. The concept is that driverless vehicles combined with booking, scheduling, and analytic software will allow vehicle ownership to be supplanted to some degree by automated transportation services.
ATRI estimated the effects of Autonomous Truck (AT) technology on its list of the top ten issues facing the industry, reproduced in Figure 82. ATRI assumes that drivers will remain in trucks – much as pilots remain in aircraft operating on autopilot - but will be able to log off duty for part of the trip or undertake non-driving tasks. The effect would be fewer drivers needed by the industry, and a more attractive job description to recruit them. The summary finding by ATRI is that the technology offers benefits on almost every issue. Their report also reviews a series of challenges pertaining to equipment manufacturers and government oversight, especially concerned with liability matters but touching on such other topics as roadway maintenance, cyber security, equipment maintenance, driver and technician training, and fail-safes. Governmental issues appear in Figure 83. As shown, the challenges are not simple, yet some states have begun to tackle them (examples are Florida, Michigan and Nevada) and the federal government recognizes the profound significance of the technology for all motor vehicles.35
Figure 82: Top Ten Trucking Issues and Autonomous Truck Benefits
Top Issues Key Autonomous Truck Benefit Hours-of-Service Allows for driver rest and productivity to occur simultaneously
Compliance, Safety, Accountability Will decrease raw SMS (Safety Management System - FMCSA) scores, though percentile scoring needs to change.
Driver Shortage Driving will be more attractive with higher productivity, less time away from home, and additional logistics tasks; fewer driver may be needed.
Driver Retention Companies with autonomous technology may attract and retain drivers.
Truck Parking If “productive rest” is taken in the cab during operations, less time will be required away from home at truck parking facilities and fewer facilities will be needed.
Electronic Logging Device Mandate Modifications will be necessary depending on level of autonomy.
Driver Health and Wellness Driver could be less sedentary; injuries could be reduced. The Economy Carriers that use AT may see productivity and cost benefits.
Infrastructure/Congestion/Funding Urban congestion could be mitigated through widespread use of autonomous vehicles (including cars).
Driver Distraction Drivers will not be distracted from driving if vehicle in autonomous mode.
Source: ATRI
35 See for example formation of US DOT’s Advisory Committee on Automation, which met for the first time in January 2017; https://www.transportation.gov/briefing-room/dot0717

New Jersey Statewide FREIGHT PLAN
154
Figure 83: Government Impediments to Autonomous Truck Deployment
Autonomous Truck Issue Government Impediment Solution Autonomous Truck Operational Environment
AT operations require high-quality roadways. Deficient infrastructure, such as potholes and poor lane markings can impede autonomous technology.
Increase infrastructure funding to improve and maintain infrastructure.
Liability for AT-Involved Accidents
Liability across a variety of state laws has not been addressed.
Legal system will, over time, set legal precedent. State liability laws related to vehicle crashes will likely change significantly.
State and Federal Trucking Regulations
State law and the Federal Motor Carrier Safety Regulations (FMCSRs) do not sufficiently address the autonomous environment. Many rules within the FMCSRs currently conflict with or do not address autonomous trucks. For the trucking industry, federal leadership and possibly federal preemption is critical in providing a seamless national transportation system that benefits from autonomous technology
Major overhaul of state laws pertaining to commercial vehicles as well as the FMCSRs.
Traffic Laws
Following too close is a moving violation. The congestion mitigation aspect of autonomous vehicle technology requires close vehicle proximity during movement. For truck platooning, close proximity is also required to realize fuel savings.
Changes in state law will be required.
Source: ATRI
Truck Platoons Truck platoons are an aspect of connected and automated/autonomous truck technology that is apt to be especially meaningful in New Jersey on major through routes such as various combinations of I-80, I-95 and the New Jersey Turnpike, or in potential shuttle operations connected to marine ports. Platoons consist of two or more trucks traveling closely behind one another, using automated sensors and controls to maintain short headway distances between vehicles, which in turn allows the vehicles behind the lead truck to reduce fuel consumption by air drafting. Fuel savings vary according to position in the line: the first truck faces wind resistance and saves nothing, while the trucks drafting behind it can improve their mileage per gallon. Estimates of fuel savings differ: the Texas A&M Transportation Institute quotes savings of 5-20 percent 36 and a European manufacturer claims an average fuel savings of 10 percent.37 Coupled with the potential for drivers to switch to autonomous “autopilot” mode (especially in the trailing vehicles, although the lead vehicle could do the same), significant cost savings become available in fuel and labor, which are the two largest components in trucking costs. Live demonstrations of truck platoons have been conducted in the US and Europe,38 including a successful 2016 European Union “challenge” that saw half a dozen truck manufacturers run platoons over separate public roadways through five countries – thus testing the regulatory as well as the operational concept.39 Truck platoons clearly are viable and thus safer,
36 “Autonomous Truck Platooning a Game Changer for Fuel Efficiency, Safety”, Texas A&M Today, 2/26/16. 37 “New NXP Technology Allows Tighter Truck Platooning”, Forbes, 11/7/16. 38 “Truck Platooning, Past, Present and Future”, TruckingInfo.com, April 2016 39 “European Truck Platooning Challenge 2016”, Dutch Ministry of Infrastructure and the Environment, available at https://www.eutruckplatooning.com/home/default.aspx

Chapter 5: INNOVATEIVE TECHNOLOGIES AND STRATEGIES
155
truck manufacturers are pushing them, and the cost savings to shippers and carriers appear attractive and even compelling. New Jersey should expect lobbying from industry to enable testing and introduction.
The use of truck platoons could be concerning to railroads; although they are not long combination vehicles, their cost profile particularly in driverless mode may divert rail traffic to highways.
Figure 84: Volvo Truck Platoon
Source: Dutch Ministry of Infrastructure & the Environment
Implications The implications of automated vehicle technology for New Jersey are varied and uncertain. The safety benefits when a driver is present could be substantial, and would accrue from the interaction with technology-enabled automobiles as well as from enabled trucks. Advancements in safety could reduce community concerns about truck traffic and would be especially helpful in the context of home deliveries. However, without a driver actively behind the wheel, the public perception is apt to be different and risk-averse - even if the safety profile is equally strong. Public acceptance of reduced-driver operation could take a long time and is likely to lag behind and depend on the acceptance of driverless automobiles. As to shipper acceptance, the majority expect automated trucks to acquire an important role in their supply chain operations during the next decade. According to a 2017 survey,40 one-third foresee this happening within five years, and almost 60% foresee it within ten years.
Among the other implications are these:
40 Tompkins International national survey for the Triangle Regional Freight Plan, Capitol Area MPO, Durham-Chapel Hill-Cary MPO, and North Carolina DOT, February 2017. Results for platooning were generally “wait and see” with some experimentation.

New Jersey Statewide FREIGHT PLAN
156
The legal and commercial liability frameworks to support autonomous operations have still to be developed, and various interests (e.g., safety, labor, railroads) may oppose them.
New Jersey is a regional rail center supporting retail distribution, manufacturing and foreign trade. Traffic diversions from rail to highway could be costly for road capacity and maintenance. Truck platoons are apt to pose the greatest diversion risk because, as multi-vehicle configurations, they approximate small trains.
If truck platoons are evaluated in New Jersey, designated lanes for their operation may be a necessary feature for real or perceived safety reasons. These lanes could become de facto dedicated lanes if automobiles prefer to avoid them, at least in the early stages of acclimatization. However, given the existence of dedicated truck lanes on the New Jersey Turnpike, the state already has an available incubator to test this type of use. Pavement would need investment to withstand wear from traffic since the technology depends on good quality highways. Coordination of strategy with neighboring states will be valuable, both for policy on the acceptability of platooning and for the conditions for operation.
Trucks and automobiles are likely to graduate through degrees of automation (as indeed is happening now), and automated operations are likely to coexist with traditional ones for years.
The safety concerns and the higher operating costs in congested urban settings like metropolitan New York and Philadelphia make them probable candidates – and even tests – for automation in local and last mile freight carriage, including drayage for port and rail intermodal terminals. The region inside I-287 seems an especially likely location. Appropriately equipped trucks with drivers behind the wheel are going to be safer than conventional trucks. Costs will be lower as the driver must be actively engaged for less time. One way this may evolve is with initially strict requirements for driver attendance that loosen as experience and public acceptance of the technology grow.
The Budweiser test in which autonomous delivery appeared as an extension of the production line is provocative. It suggests that automation could be sought in every function of the supply chain and delivery process, ultimately affecting building designs and access as well as roadway infrastructure and operations.
Intelligent Transportation Systems Intelligent Transportation Systems (ITS) have been a valuable tool for public operations management and performance and safety improvement for many years, but the steady advance in technology for viewing, sensing, tracking, communicating and signaling is making integrated, multifaceted systems possible. This will have new importance as connected and automated vehicles arrive on roadways, and as systems in vehicles and on infrastructure increasingly interact. However, integrated ITS is in deployment now will become more common and more capable.
A case in point is a currently under construction installation in southern New Jersey at the interchange of I-295, I-76 and NJ 42. This site is across the Delaware River from Philadelphia. I-76 is a principal corridor through the city and reaches New Jersey on the Walt Whitman Bridge, one of the primary two river crossings into Center City Philadelphia. I-95 skirts the river on the Pennsylvania side, reaches the Philadelphia industrial districts and port facilities, and connects to I-76. In addition, the New Jersey Turnpike runs close to this interchange can be reached over a major surface artery (NJ 168). This combination of factors and facilities makes the intersection an important location for freight service in the region, affecting the New Jersey and Pennsylvania portions of the metropolitan area and the major north-south highways of I-95 and the Turnpike.
There are four main ITS components in this deployment:

Chapter 5: INNOVATEIVE TECHNOLOGIES AND STRATEGIES
157
Dynamic Message Signs to provide information, direction and warning to drivers; Travel time systems (Transmit and Bluetooth) for real-time electronic tracking of vehicles; Closed circuit TV camera controllers for real-time video feeds; and, Integration of the Ethernet-based fiber optic and wireless systems into the NJDOT Traffic
Operations Center South and its existing ITS device operating systems.
The combined effect from a freight perspective is that the Operations Center can observe traffic flow, receive quantified information on the volume and quality of flow, and communicate issues and routing advice to truck drivers to support the quality and safety of their travel.
Intermodal Rail Developments Intermodal traffic (containers and trailers on flatcars) has been a growth market for freight railroads for many years. It set traffic records in 2015 with 17.5 million units in North America and 13.7 million units in the US, and it accounted for nearly a quarter of US Class I railroad revenue, their single largest revenue source.41 New Jersey is a key intermodal center for the Northeast because of its access to marine ports and immense metropolitan populations, and the state has multiple intermodal facilities (as shown in Figure 85 below).
Prior to the Great Recession, international business had been the engine of intermodal traffic growth, but since that point, domestic traffic has grown much faster, as portrayed in Figure 86. While both international and domestic businesses reached peaks in 2015 and both fell off somewhat in 2016, international volumes were only a bit ahead of their previous peak in 2006, whereas domestic businesses set records year after year and surpassed international activity in 2016.42
41 “Rail Intermodal Keeps America Moving”, Association of American Railroads (AAR), May 2016. The North American figure comes from the Intermodal Association of North America (IANA). 42 These figures are somewhat misleading in that “domestic” numbers include transloading of 40’ international containers into 53’ domestic containers, yet the underlying direction of change is accurate, as major domestic motor carriers such as J.B. Hunt have become the top intermodal customers for railroads.

New Jersey Statewide FREIGHT PLAN
158
Figure 85: Major US Rail Intermodal Terminals
Source: AAR
Figure 86: Domestic Intermodal Growth Outstrips International
Source: IANA

Chapter 5: INNOVATEIVE TECHNOLOGIES AND STRATEGIES
159
A good part of domestic intermodal growth has come on shorter haul lanes in the east, where the eastern railroads have enjoyed less direct benefit from Asian trade and have shorter distances between metropolitan areas. The eastern market now has seen the introduction of a new intermodal operating model by CSX, which created a hub facility in Ohio, whereas the industry had functioned previously only in point-to-point lanes. This innovation was made possible by wide-span cranes that cross multiple tracks, enabling containers to be transferred between railcars in a rapid and largely automated process. This allows trainload volumes to be assembled for markets that otherwise could not fill a train, and it puts more lanes into service - just like airline hubs keep aircraft full and permit service to smaller cities. CSX now believes it can compete at distances over 550 miles (the approximate maximum distance a single truck driver can travel in one work shift), where the former threshold for rail to compete was approximately 750 miles. The railroad has announced a second hub in North Carolina43 and continues to develop its services, as other railways watch to gauge its success.
Implications Intermodal rail traffic should continue to grow. Class I railroads must find new business to replace declining coal traffic (discussed below), and adoption of hubs on the CSX model offers one way to do this. The major risks to this outlook stem from automated trucks, especially in platoon formation (described above), and possible shifts in international trade (discussed below).
Among the ramifications for New Jersey are these:
Intermodal capacity will face continuing pressure from growth. One facet of the wide-span crane technology is that it raises terminal throughput without requiring additional acreage, so introduction of these cranes is desirable whether railroads adopt a hub model or not. They are also an environmentally cleaner technology, running on electricity instead of the diesel that fuels traditional equipment.
If the intermodal hub model takes hold, it opens more traffic lanes and more opportunities for highway-to-rail diversion. Among the effects could be more rail capture of import cargo destined to other parts of the country, and of distribution traffic inbound to New Jersey distribution centers.
Warehouse Location and Automation The number of Distribution Centers (DCs) utilized by US supply chains has tripled in the past four years, from an average of six per company to an average of eighteen, according to data collected by the Tompkins International Supply Chain Consortium.44 This trend can be seen in Figure 87 below. The Tompkins Consortium is a benchmarking organization of Fortune 500-type companies, approximately half
43 “CSX Talks Timeline for Rocky Mount Hub”, Triangle Business Journal, 12/27/16. 44 Tompkins International citations here and below are taken from public presentations of the Triangle Regional Freight Plan, Capitol Area MPO, Durham-Chapel Hill-Cary MPO, and North Carolina DOT, December 2015.
CSX intermodal operations in North Baltimore, Ohio. (Photo: CSX)

New Jersey Statewide FREIGHT PLAN
160
of them retailers and half manufacturers. Tompkins reports that growth in DCs has been pronounced in both sectors, although it is strongest among retailers. The reason for this dramatic increase in facilities is the rising importance of faster time to market, which requires that the staging points for goods be placed closer to the points of consumption. The average size of DCs has gone down in parallel, partly because inventory is divided up and some of the added facilities are simple cross-docks, but also because warehouse automation has made it possible to reduce the physical footprint of DCs by two-thirds with no sacrifice in throughput.45 This implies that automated facilities can have three times the freight generation per square foot of traditional DCs. A recent Institute of Transportation Engineers (ITE) study46 commissioned to review trip generation rates for these types of facilities indicated that existing data is not sufficient for municipalities, counties, or state agencies to fully understand potential traffic impacts. Further data collection by ITE for future trip generation manuals will likely provide a better understanding of how warehouse automation will impact local and regional traffic flows.
Figure 87: Proliferation of Distribution Centers
Source: Tompkins International
Sixty percent of Tompkins Consortium members report increased use of warehouse automation in the past three years and eighty percent expect increases in the next three years. While automation can mean a number of things, a key feature is the replacement of forklifts by robotic systems, which enable the aisles between storage racks to be narrower, and the racks to reach up higher. The effect is greater density of stored product both horizontally and vertically. Ceiling heights in new warehouses can be in the range of 40 to 50 feet, whereas 30 feet was considered high just a few years ago; and the ceiling in one new DC in the Atlanta region reaches 80 feet.47 The implications are that sites which were not viable for distribution can become viable, because the acreage and cost of land required is smaller, and that facilities designed for more labor-intensive warehouse operations gradually may become obsolete. Research from Tompkins now indicates48 that regional DCs starting at 100,000 square feet (SF) will be automated facilities in the next few years. A 100,000 SF DC generally requires a land parcel of just 8 acres, indicating an opportunity and a need for redevelopment of existing warehouse building stock.
45 Direct experience of a major retailer, reported in “Logistics and Supply Chain Asset Study”, Michigan Economic Development Corporation, March 2015 46 “High-Cube Warehouse Vehicle Trip-Generation Analysis,” http://library.ite.org/pub/a3e6679a-e3a8-bf38-7f29-2961becdd498 47 Reported in “Atlanta Regional Freight Mobility Plan Update, Final Report”, Atlanta Regional Commission, May 2016; other citations in this sentence derive from the same source. 48 Tompkins International national survey for the Triangle Regional Freight Plan, Capitol Area MPO, Durham-Chapel Hill-Cary MPO, and North Carolina DOT, February 2017.

Chapter 5: INNOVATEIVE TECHNOLOGIES AND STRATEGIES
161
Implications Distribution in New Jersey and adjoining locations in eastern Pennsylvania has been a principal freight activity for decades, and the cost of real estate has favored locations further away from consuming points. The current proliferation of warehousing will not reverse this, but it can mean that the need for and the viability of satellite facilities closer to metropolitan areas will grow. In addition, the reduction in warehouse footprints enabled by automation can mean less demand for enormous DCs on large land parcels in relatively rural exurbs, and more demand for modern facilities on smaller plots of urban land.
All of this affects land use plans, the disposition of brownfields, the importance of redevelopment, and the significance of performance on the routes that connect facilities to industrial and consumer markets. Indeed, because faster time to market is the purpose of DC proliferation, the corollary is that slow and unreliable performance on transportation networks demands a greater number of distribution facilities to compensate, which adds to cost. The net effect is that New Jersey should expect:
Continued national and regional distribution from New Jersey and eastern Pennsylvania, with traffic carrying bound for satellite facilities that restage to end-markets;
Local distribution from more local and relatively smaller facilities; Higher shipping volume per acre, because of greater storage density; Less “freight sprawl” and more concentration of facilities toward urban cores; Continued emphasis on speed and reliability on the freight network, because of its effect on the
requisite number and location of distribution facilities; and, Redevelopment of older properties to meet contemporary requirements, and taking advantage
of lower acreage requirements.
Retail Home Delivery A major reason for the emphasis on time to market is the growth in consumer home delivery. One hundred percent of Tompkins Consortium members – retailers and manufacturers alike – expect direct to consumer sales to increase in the next three years. In the ten years from 2004 to 2014 (the latest data fully available) the US Census Retail Trade Survey reports that electronic commerce rose from 2.1 percent of total retail trade to 6.4 percent, climbing at a compound annual growth rate of 17 percent compared to 2.7 percent for traditional retail. This trend underlies fierce competition between electronic and store-front retailers, and has given rise to so-called omni-channel retail, which denotes the attempt to merge in-store with on-line shopping. A department store customer can view merchandise from their smart phone, know which stores have it in stock, examine it in the store, buy it, bring it home or have it delivered, order a different style from another store or DC, pick it up or send it home – or handle the entire transaction from home on their smart phone. This has two advantages: inventory management for the retailer and convenience and choice for the customer.
The CEO of Macy’s describes omni-channel as “inventory optimization through technology. Inventory visibility across all stores and channels is the key enabler”49 – in other words, knowing where everything is in real time so the customer can access it. Having the right merchandise in the right stores according to local tastes is a key objective for retailers, but inventory costs money. A great advantage to on-line retail is that very large and diverse inventory can be maintained in a central location (or in vendor warehouses), pooling the goods to satisfy the spectrum of local demand. The store-front retailer strives to compete with this by maintaining a custom blend of fast-moving goods in each store, making a greater range of choices available on-line and visible from mobile devices while shopping, and including in the accessible inventory
49 “Omni-Channel Logistics”, DHL Customer Solutions & Innovation, Deutsche Post DHL Group, 2015

New Jersey Statewide FREIGHT PLAN
162
merchandise from every store as well as from warehouses. This gives the customer as much selection as possible, gets the most utilization from every form of inventory, and manages delivery costs by satisfying demand from the closest location with stock. Even, so, delivery costs are under pressure because of the competition for convenience. A principal benefit of in-store shopping is the ability to examine merchandise and carry it home. Electronic retailers contend with this through purchase return policies and especially through aggressive home delivery services combining high speed and low cost. Using this model, a consumer wishing to purchase a sweater can order the same sweater in six different colors, have them quickly shipped to their home, select one to keep, and quickly ship back the other five, often at no cost to the consumer.
Figure 88: Products Purchased for Delivery in Past 12 Months
Source: AlixPartners Consumer Survey
Amazon offers Prime members in much of New Jersey same-day and even two-hour delivery (subject to minimum order quantities). The Prime program itself costs $99 a year for membership and brings free 2-day shipping throughout the country virtually for everything. A Walmart program without a membership fee offers free 2-day delivery subject to minimum order quantities, and free pick-up at stores for any size order. The purpose of these programs is to expand the range of products consumers purchase on-line by making the decision easy and cheap. The consequence is that the delivery company FedEx reports50 that home deliveries now include such every-day and bulky household items as pet food and paper products. This is borne out in a 2016 consumer survey by AlixPartners (findings displayed below in Figure 88), which shows meaningful growth in on-line purchases for essentially every product type, and indicates that a wide variety of household needs can be met by e-commerce.
Underlying these marketing strategies are logistics strategies. The more volume an on-line retailer like Amazon is able to command in the light density lanes into residential areas, the lower its cost and the less
50 FedEx citations here and below are from interviews reported in the “Atlanta Regional Freight Mobility Plan Update”, Atlanta Regional Commission, May 2016

Chapter 5: INNOVATEIVE TECHNOLOGIES AND STRATEGIES
163
room there is for competitors. A light density lane is a transportation origin-destination pair with a relatively low concentration of revenue traffic; this makes it expensive to serve because a truck may make one or two paid deliveries on a given day instead of ten to twenty. However, because the traffic volume is limited, it is easier for a carrier to capture most of it, and the carrier that does becomes the most efficient competitor. The same logic applies to rapid delivery: only a few competitors can attract the volume to afford it, and the speed is designed to approximate the convenience and immediacy of in-store purchases. Moreover, consumer research demonstrates that the demand for next day and same day delivery service rises along with the frequency of on-line purchases, suggesting that growth in one facilitates growth in the other.51
Store-front retailers in turn are obliged to match the fast delivery service for customers who prefer it. For both electronic and store-front merchants, the goods must be positioned to fulfill the time commitment, requiring facilities – DCs, stores and other staging points – close enough to accomplish this. Half the respondents in a recent supply chain survey expect the need to have facilities within same day truck delivery range of customers will increase.52 While consolidation of next day and same day deliveries can be achieved through the networks of such major package carriers as UPS, FedEx, and the United States Postal Service (USPS), smaller time windows reduce the opportunity for it. In addition, traffic, access, and parking conditions affect the ability to meet time commitments and thus influence the number of staging points required. The 2017 acquisition by Amazon of the Whole Foods grocery chain should be understood in the light of all this: groceries are frequent purchases and probably the highest volume of goods entering residences. Capturing this traffic for home delivery builds density. Even if consumers make most purchases in stores, some will move to e-commerce when delivery is free and fast – and grocery outlets provide a large number of properties potentially useful for staging.
Implications This complex and evolving set of factors has a number of implications for New Jersey.
Truck deliveries into residential communities will continue to climb, will carry a greater range of goods, will replace some passenger trips to stores, and will occur in urban, suburban, and rural settings. FedEx notes that home deliveries seem to favor higher income districts, which could be due to the relative affordability of $99 Amazon memberships (and a reason Amazon chose the higher-end grocer Whole Foods). The Walmart no-membership-fee program can be interpreted as a competitive response reflecting the company’s traditional strength in lower income and rural regions. The variety of inventory that can be offered on-line greatly exceeds what can be made available by stores in lower population areas, suggesting that a rural omni-channel strategy affords leverage for Walmart because it can amplify the product selection behind its local outlets.
Truck deliveries will emanate from a greater variety of locations: carrier terminals and stores as well as new local staging points. Land use policies and zoning will intersect with this. Moreover, retailers report an increase in the frequency of inbound delivery to stores53 , necessitated by customer pick-up of on-line orders (and presumably resulting in a reduction in payloads on the trucks). The multiplication of truck trips is apt to occur at other points along the supply chain as well, because of the need to meet time service commitments.
51 Walker Sands Future of Retail Study, quoted in “Will the Sharing Economy Disrupt Transportation and Logistics”, presentation by Richard Metzler of uShip, Stifel, Nicolaus & Co., 6/29/16 52 From the 2/17 Tompkins International national survey for the Triangle Regional Freight Plan, ibid., which included retailers and manufacturers; retailers would need to be within same day range of consumers, and manufacturers within same day range of retailers and other customers. 53 “State of the Retail Supply Chain – Outlook for 2016”, Stifel Transportation Research, January 4, 2016

New Jersey Statewide FREIGHT PLAN
164
Delivery vehicles mainly should remain trucks because they are best able to produce volume economies, although bicycles, motorized tricycles, and ride-hailing automobiles (such as Uber, Lyft and taxicabs) are being tried in urban areas. Package vehicles (as used by UPS, FedEx and USPS) are the workhorse, but Less-Than-Truckload (LTL) carriers (using 28’ trailers and larger trucks) also report increasing home deliveries. As volumes grow across the variety of product types noted above, the carrying capacity as well as the number of delivery vehicles required becomes an issue. A case in point is that of drones, whose capacity generally is a shipment of about five pounds54: this can be productive for rural areas and suburban (and commercial) deliveries with infrequent and dispersed demand, but as traffic builds up and shipment types proliferate, they become less well suited. Considering that the goal of free shipping combined with fast delivery is to cause the volumes and variety to rise, the low capacity methods may prove to be niche or transitional services, with trucks in various configurations continuing to handle the baseload. The underlying consideration is an efficient production function: what size and speed of vehicle is best adapted to the shipment size and delivery density. There is also the question of service commitments. A retailer promising two-hour delivery expects reliable performance and accountability from its transportation partners. Ride-hailing services tend to view their drivers as independent agents with limited accountability back to the company – and perhaps lacking the assumed professionalism and safety training that accompanies a commercial driver’s license.
While service commitments for rural home delivery allow more time in the schedules, trucks will have greater need to travel on roads outside the township retail districts and to navigate them in all weather. In urban areas, traffic congestion, residential building access, and parking will come under continual pressure because of their direct effect on delivery speed and cost. Although numerous techniques (e.g., drop boxes, drop-off centers, drive-through pick-up at stores) are seeing trial, the deciding formulas are likely to be those that make consumer convenience cost-effective and not the other way around. This is because the benefit of convenience is precisely what companies like Amazon are trying to capture with rapid direct-to-door delivery. Therefore, solutions that dilute convenience should be viewed as having limited appeal and probably limited longevity.
Delivery delays and their causes will be more visible to New Jersey residents. This could lead to a higher incidence of complaints, but could also make the challenges of freight delivery more tangible and meaningful to citizens. The belief that “freight doesn’t vote” may diminish as residents experience their household supplies failing to arrive when needed and learn the reasons first-hand.
Concern for the safety and environmental qualities of delivery trucks should go up. Adoption of different and new technology is apt to accelerate: natural gas and hybrid electric trucks, and especially the set of safety advances associated with connected and automated/autonomous vehicles. The ability for drivers to see and vehicles to sense activity and obstacles all around them promises substantial reductions in incidents and accidents, and makes trucks far more neighborhood-friendly.
If Amazon succeeds in capturing majority shares of traffic, it may move its volume from package carriers to in-house fleets, potentially raising the cost of service for competitors who remain with package carriers. This would shift the originating points for home deliveries. Amazon already has leased up to forty air cargo aircraft to operate from Cincinnati, OH55 and connect to its fulfillment centers on high volume lanes, including flights to the distribution district of eastern Pennsylvania.
54 Dr. Michael Lierow, Oliver Wyman, “Digital Turmoil: Digitalization of the Logistics Value Chain”, Stifel, Nicolaus & Co., 10/12/16 55 “Amazon Plans Worldwide Cargo Hub, 2700 Jobs at CVG”, Cincinnati Enquirer, 1/31/17.

Chapter 5: INNOVATEIVE TECHNOLOGIES AND STRATEGIES
165
A crucial consideration for planning in this environment is that practices are currently being invented and therefore, the ultimately successful models for consumer distribution are necessarily uncertain.
Supply Chain Sourcing Sourcing relates to where retailers obtain products for sale, where manufacturers obtain materials and components, and relatedly, where manufacturers locate the production that supplies the retailers. The long advancing off-shoring trend shuttered 40% of large US factories in the 2000s,56 even though US manufacturing output was almost 40% higher in 2011 than in 2001, and has grown since.57 To simplify a complex picture, offshoring could be explained by low wage rates in Asia, particularly China, paired with low transportation costs from favorable fuel prices and larger ships. The growth in US manufacturing output can be explained by higher productivity enabled by automation and information technology as well as lower labor components for some of the production that stayed in the US.
However, Chinese wages began to rise in the mid-2000s, and fuel prices also climbed, leading to a belief that off-shoring might retract, notably in seven industry groups where the cost differential seemed promising:58
Computers & Electronics Machinery Transportation Goods Fabricated Metal Products Appliances & Electrical Equipment Furniture Plastics & Rubber Products
This was the near-shoring or re-shoring phenomenon. (The term “re-shoring” means the return of manufacturing from Asia to US shores, and is contrasted to off-shoring; “near-shoring” means manufacturing returning from Asia to nearby, non-US locations, specifically but not exclusively Mexico). Supporting the phenomenon was the increasing importance of time to market, which contributed to the expectation that production would return to the US, or no longer leave. Nevertheless, more recent research from A.T. Kearney indicates that re-shoring has not materialized, apart from a blip in 2011.59 The reasons given are that production has moved elsewhere in Asia (e.g., Vietnam), Chinese wages moderated under weaker economic conditions and fuel prices fell. The A.T. Kearney report does cite scores of instances where re-shoring occurred in the same industries cited above, with time, cost, and quality factors motivating the shift, but the key message is that there has not been a sea change.
Even so, other survey research conducted at the same time as the A.T. Kearney report found 31% of North American manufacturers considered near-shoring a possible opportunity for their company, with the US and Mexico about equally attractive.60 This number was down from 49% two years before, yet is not inconsequential, leading the researchers to conclude that near-shoring remained viable if not a business priority.
In light of the A.T. Kearney findings, the key question ought to have been not whether near-shoring was a possibility, but to what degree. US production clearly does have advantages in time to market and benefits
56 “The Future of Chicago Manufacturing? Fewer People Doing More”, Chicago Tribune, 9/19/15, quoting from a White House press release of July 2015 57 US GDP by Industry, issued by Bureau of Economic Analysis, US Department of Census, extracted 2/17. 58 The Boston Consulting Group, “U.S. Manufacturing Nears the Tipping Point”, March 2012. 59 “U.S. Re-Shoring: Over Before It Began?, A.T. Kearney, 12/15 60 “Nearshoring Gaining Popularity in Western Europe While N. American Activity Slows”, AlixPartners, reported by Stifel Nicolaus & Company, 9/9/15

New Jersey Statewide FREIGHT PLAN
166
from automation (e.g. robotics, optics, artificial intelligence, 3D printing). McKinsey & Company61 finds that 60% of the time spent in manufacturing processes is susceptible to automation – which is not good news for jobs, but could be for where factories locate. On the retail side, the top four US importers measured by container volume are all major retail chains and have been for years, with Walmart the largest.62 Walmart started an “Investing in American Jobs” initiative in 2013, with the goal of purchasing $250 billion in products made, grown, or sourced in the US by 2023, and has held annual conferences with vendors to implement it.63 The significance of this is shaded by the fact that the company posts global revenues in the range of $500 billion annually, yet the dollar goal certainly is meaningful.
Natural Gas: A set of developments in the energy sector is also applicable. The rise of effective hydraulic fracturing and horizontal drilling techniques in the 2000s made new development of domestic petroleum resources economically viable, notably for sources of natural gas. Abundant supplies of low-cost natural gas then precipitated a marked shift in the fuels used for electricity generation away from coal and toward natural gas, to the extent that natural gas now has supplanted coal as the nation’s primary fuel for electric power (as shown in Figure 89). Pennsylvania has become a significant producer of natural gas from the Marcellus shale play, creating a low-cost regional source for power generation and for chemical feedstocks.
The chemical industry in New Jersey stands to benefit substantially from this, because less expensive raw materials make it more competitive. Figure 90 shows the very broad array of products using chemical feedstocks as manufacturing inputs, ranging from everyday household items such as plastic bags, diapers, and beverage bottles, to construction materials, automotive products, and adhesives. A great many markets thus are available to New Jersey chemical producers able to sell their output with a cost advantage, which is promising news for the state economy and for its ability to attract manufacturers of the downstream goods.
Implications The foregoing considerations paint a mixed picture. There are two aspects to consider: one for production and the other for trade. Manufacturing industries are more likely to be retained, especially those that can profit from domestic energy and petrochemical supply, but manufacturing may not enjoy a resurgence. Moreover, the factory automation that helps protect domestic production also supports fewer jobs per unit of output. The result perhaps is some stability for the manufacturing sector, the goods it ships and the materials it receives, but with fewer employees to convey a multiplier effect to other areas of the economy.
61 “A Future That Works: Automation, Employment and Productivity”, McKinsey & Company, 1/17. 62 Top US Importers 2015, Journal of Commerce, reported by Apex Group. 63 “Walmart Hosts Entrepreneurs at Fourth US Manufacturing Summit”, Joplin Globe, 7/2/16.
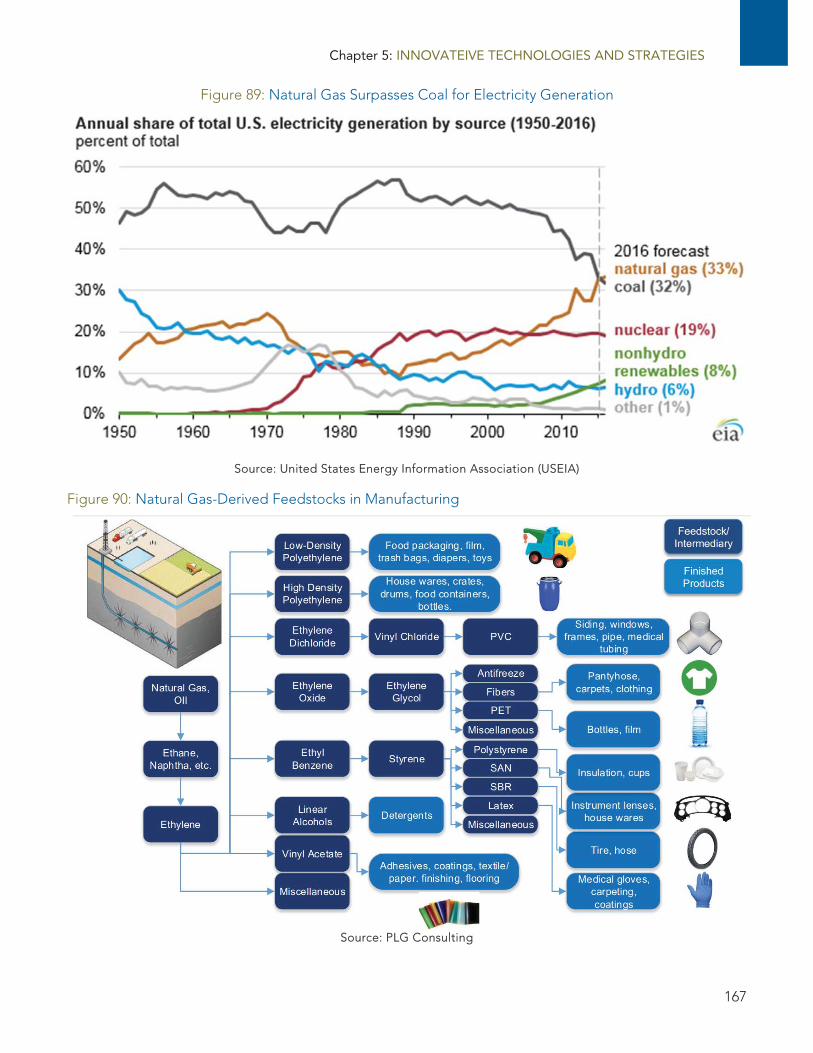
Chapter 5: INNOVATEIVE TECHNOLOGIES AND STRATEGIES
167
Figure 89: Natural Gas Surpasses Coal for Electricity Generation
Source: United States Energy Information Association (USEIA)
Figure 90: Natural Gas-Derived Feedstocks in Manufacturing
Source: PLG Consulting

New Jersey Statewide FREIGHT PLAN
168
This provides a backdrop to the uncertainty surrounding US trade policy in 2017. The new US administration apparently is unenthusiastic about free trade agreements and is keen to protect American jobs. This could lead manufacturers to put or keep plants in the US and lead retailers to buy from them. However, foreign governments are likely to respond in unknown ways, and disagreements in one area can spill over into others. As a result, the outlook for supply chain sourcing is speculative. The way it plays out matters for freight planning, first because it affects New Jersey’s economic geography – where goods will be shipped from and to, and in what quantities – and second because freight-based investments that may be motivated by economic development could be influenced by the market prospects for the businesses involved. In addition, the freight forecasts discussed elsewhere in this freight plan are subject to the same uncertainty. The outcomes could be positive or negative and will vary with circumstances. For example, consumers will continue to need household supplies and as such domestic producers could benefit - yet, if consumer prices rise because of costlier sourcing the level of demand may suffer. Manufacturers or growers exporting goods could face tariff penalties in some countries and not others, altering where they ship and the ports and gateways they need to reach. Drops in overseas trade would hurt the rail intermodal business, and traffic losses could reduce the volume economies at ports. The possibilities are many. The most useful conclusion may be that New Jersey planners must observe developments closely, as their partners in industry will, and forums such as New Jersey’s Freight Advisory Committee become important ways to share understanding, so that opportunities and threats can be recognized and investments can be made with an appropriate recognition of risk.
3D Printing 3D printing (or “additive manufacturing”) is not a new technology, but its appearance in new applications with advanced materials is bringing it more deeply into manufacturing processes and supply chains. The technology replaces traditional fabrication in factories with production from specialized printing devices operating in three dimensions, using a variety of materials, and able to be located almost anywhere. Its principal transportation effect is to substitute local production for longer distance transportation from plants and DCs. Currently, 3D printing is best suited to “low volume, moderate valued products that require high customization on short lead times”,64 as illustrated in Figure 91. These factors apply not only to finished products, but also to product components, and they can correlate with dispersed demand. The top markets today are in consumer electronics, automotive, and medical devices.65 A new market is developing in food products, particularly in the manufacturing process for foods like pasta, and for specialties like confectionary.66
64 Quotation and chart taken from “How 3D Printing Could Disrupt Your Supply Chain”, authored by GRA Supply Chain Pty Ltd, reported in Industry Week, October 30, 2015 65 “3D Printing: The Next Revolution in Industrial Manufacturing”, United Parcel Service/Consumer Technology Association, May 2016, available at: https://www.ups.com/media/en/3D_Printing_executive_summary.pdf 66 “From Pixels to Plate, Food Has Become 3D Printing’s Delicious New Frontier”, Digital Trends, April 19, 2017.
High Moderate Low
Demand Volumes
Customization Requirements
Responsiveness Requirements
Product Cost
Product Range
Highly SuitableModerately Suitable
Not Suitable
Figure 91: Product Suitability for 3D Printing
Source: GRA Supply Chain Pty Ltd

Chapter 5: INNOVATEIVE TECHNOLOGIES AND STRATEGIES
169
A key consideration is the reduction or elimination of inventories required in small amounts that need positioning in many locations. While replacement parts are a prime example of goods that fit the profile, and are an early application of the technology, manufacturing components in general are being evaluated by industry for possible 3D fabrication – recognizing that the process in some ways represents the ultimate in just-in-time production.
Facilitating this development is a new joint venture67 launched in May 2016. The venture has three partners: UPS, which is a third party logistics provider (3PL) as well as the world’s largest freight carrier; SAP, a leading producer of enterprise software for supply chain management; and Fast Radius, a maker of machine parts using 3D printers. A network of printers has been established at over sixty UPS Store locations nationwide as well as a factory at the UPS global air hub in Louisville, KY. There are no sites yet in New Jersey, but three are nearby in New York City and Allentown, PA. The partners describe the venture as “distributed on-demand manufacturing” and it can be regarded as an integrated supply chain solution: companies on the SAP system can connect to and optimize their use of the network, schedule production at an appropriate location, and receive next day UPS delivery from the Louisville hub or a store location in their region. Both SAP and UPS have large numbers of users, rendering the venture a platform for many of the nation’s supply chains to acquire experience with 3D applications and a catalyst for growth and development.
Implications The near-term consequences of 3D printing in New Jersey will be new regional truck flows of manufactured product from UPS locations to the north and west of the state, replacing truck flows from other locations, and initially moving in small volumes. Printers are not proprietary to UPS and can be expected to be installed elsewhere in the region, supporting various forms of low volume production. Longer term, 3D printing substitutes local traffic for interregional traffic, but it also can stimulate new kinds of manufacturing activity with lower capital costs and viability in more and different locations – potentially a boon for production In New Jersey and other regions. UPS currently estimates 5-10 percent of manufacturing capacity68 could move to a 3D platform, although penetration will vary by industry based on the considerations outlined above.
67 “UPS to Launch On-Demand 3D Printing Manufacturing Network”, UPS Press Room, May 18, 2016 68 The 5 percent factor is of global manufacturing capacity and is quoted in “3D Printing: The Next Revolution in Industrial Manufacturing”, ibid.; however, the study’s UPS author Derrick Johnson quoted 9-10 percent as an upward bound at a presentation to the Transportation Research Board, 2/10/17.

New Jersey Statewide FREIGHT PLAN
170
Page left blank intentionally.

Chapter 6: PRIORITY PROJECTS
171
PRIORITY PROJECTS The NJDOT has identified a range of projects that will maintain economic competitiveness and continue to serve New Jersey’s businesses and residents by allowing efficient movement of goods. This chapter details the priority projects identified as being most critical to freight mobility throughout the state. These projects include existing
project areas identified through previous studies, freight-related projects identified in the Statewide Transportation Improvement Program (STIP), key locations highlighted by FAC members and their constituencies, and, for highways, locations identified through the performance analysis detailed earlier in this plan. These priority projects serve as a pool of projects for future investments, including those already funded as well as those identified in the Investment Plan which follows this chapter.
Priority projects include those that simply remediate existing infrastructure (pavement, bridge), ITS projects that leverage advancing technologies, or capital improvements that expand roadway or rail capacity, leading to increased efficiencies along the network. When implemented, it is expected that these improvements will positively impact New Jersey’s goods movement industries by reducing delays due caused by recurring and non-recurring congestion. This increased efficiency will serve multiple goals: Increased efficiency and productivity, renewed infrastructure components, reduced environmental impacts (through reduced congestion) and overall improved operating conditions that will continue to keep New Jersey among the most significant states in terms of freight throughput.
Highway Priority Projects Previously Identified Projects NJDOT and its partner agencies continue to analyze and identify critical goods movement issues on an ongoing basis. Previously identified projects from the following plans have been included in this plan as still in need of advancement.
New Jersey Comprehensive Statewide Freight Plan (2007) Southern New Jersey Freight Transportation and Economic Development Assessment (2010) New Jersey Statewide Freight Plan Phase II: Priority Highway Freight Corridors (2012) Goods Movement Action Program (G-MAP)
Statewide Transportation Improvement Program (STIP) The STIP is a compilation of each MPO Transportation Improvement Program (TIP), which includes a list of projects where federal or state funding sources have been identified. The FY 2016-2025 STIP was reviewed to identify projects where a specific freight use or concern was identified in the project description.
Freight Advisory Committee FAC Input As part of the outreach program, FAC members were invited to identify targeted locations that had not yet been identified through previous studies nor through the performance analysis. This also included a

New Jersey Statewide FREIGHT PLAN
172
confirmation that locations identified by ATRI are included as well.69 Each MPO also contacted their subregions for input on key freight problem areas to be addressed.
Highway Performance Analysis Using the highway performance data for TTTI and Truck Travel Speed (as detailed in the Highway Network Chapter), as well as truck crash data, the project team identified locations and corridors that exhibited a high Truck Travel Time Index (greater than 3.5) or low average Truck Travel Speed (less than 50 mph for non-interstates; less than 60 mph for Interstates) and a high truck crash rate (based on the truck crash cluster density analysis).
Once the two variables above (TTTI and Truck Travel Speed) were calculated for the NHS in New Jersey, the following methodology was used to identify links with a high TTTI.
Using GIS, links within the highway network with 24-hour truck TTTI greater than 3.5 were screened. This screening was done both for Interstate and Non-Interstate links in each direction.
The screening process led to the identification of corridors/locations with high TTTI. GIS links were combined after the screening process to create single segment corridors/locations with high TTTIs.
For each segment corridor/location, where data was provided for each direction, the highest TTTI value (NB/SB or EB/WB) was selected and assigned to the corridor/location as the segment TTTI.
The following steps were used to identify low Average Truck Travel Speed locations.
Using GIS, the interstate links with Average Truck Travel Speed less than 60 mph and non-interstate links less than 50 mph were screened. This screening was done for both directions of interstates and non-Interstates.
The screening process led to the identification of corridors/locations with low Average Truck Travel Speeds. GIS links were combined after the screening process to create single segment corridors/locations with low speeds.
For each segment corridor/location, where data was provided for each direction, the lowest speed value (NB/SB or EB/WB) was selected and assigned to the corridor/location as the segment travel speed value.
After the corridor/location identification process was completed using TTTI and Average Truck Travel Speed, other variables were introduced in the analysis including crash density analysis and truck count data from the NJ Congestion Management System (CMS), to identify the final highway priority projects list. This is the most complete dataset for truck traffic counts freely available to the project team and was used as a final differentiator in the highway project prioritization.
Project List Development Using the four sources detailed above, 282 project areas (totaling 360 miles) were identified. These locations are illustrated in a series of maps (Figure 92 through Figure 95). A complete list of projects is included in Appendix C. Project areas are distributed throughout the state, representing every MPO and County, as detailed in Table 32.
69 This includes I-95 at NJ Route 4 in Fort Lee (Ranked #4 nationally) and I-76 at I-676 in Camden (Ranked #97 nationally) per the ATRI 2017 Top 100 Truck Bottleneck List: http://atri-online.org/2017/01/17/2017-top-100-truck-bottleneck-list/

Chapter 6: PRIORITY PROJECTS
173
Table 32: Highway Project Areas, By County and MPO
County Project Areas County
Project Areas
Bergen 34 Mercer 9 Middlesex 34 Salem 8 Hudson 32 Hunterdon 7 Union 30 Cumberland 6 Essex 21 Gloucester 6 Camden 20 Warren 6 Burlington 17 Atlantic 4 Morris 17 Ocean 2 Monmouth 14 Sussex 2 Passaic 13 Cape May 1 Somerset 13
Total Projects DVRPC 52 NJTPA 212 SJTPO 19
Highway Project Prioritization Each project area identified was assigned a score for four factors, as detailed in Table 33:
Average Truck Travel Speed Truck Travel Time Index Truck Traffic Count Truck Crash Cluster
Based on the total weighted score of these categories, each project was categorized into one of three groups:
First Tier (top one-third) Second Tier (middle one-third) Third Tier (bottom one-third)
It is important to note that the projects are not ranked. The categorization into tiers provides the ability to separate projects that have the potential for the most impact (for each MPO and statewide) from those that may have important, but more discrete, impacts. This categorization was ultimately used to develop the Investment Plan, detailed in Chapter 7.

New Jersey Statewide FREIGHT PLAN
174
Table 33: Priority Scoring Matrix
Truck Travel Speed (NPMRDS) Truck Count (CMS) Non-Interstate Interstate Non-Interstate Interstate
0-25 mph 3 0-40 mph 3 > 200 3 >500 3 25-35 mph 2 40-50 mph 2 50-200 2 100-500 2 35 -50 mph 1 50-60 mph 1 < 50 1 <100 1
50+ mph 0 60+ mph 0 Not Available 0 Not Available 0
Truck Travel Time (NPMRDS) Truck Crash (Cluster Analysis - NJDOT) Non-Interstate Interstate Non-Interstate Interstate > 7.0 3 > 7.0 3 High 3 High 3
5.0 - 7.0 2 5.0 - 7.0 2 Moderate 2 Moderate 2 3.5 - 5.0 1 3.5 - 5.0 1 Low 1 Low 1
< 3.5 0 < 3.5 0 No Cluster 0 No Cluster 0
The project areas are displayed graphically for each MPO in Figure 92 through Figure 95 and Table 34 through Table 42, while a more detailed list of locations is included in Appendix C. Within each table on the following pages, the project areas are sorted by county, then by route.

Chapter 6: PRIORITY PROJECTS
175
Figure 92: Priority Highway Locations – DVRPC Region

New Jersey Statewide FREIGHT PLAN
176
Table 34: DVRPC 1st Tier Priority Locations
Unique ID Route County Municipality. Start End Length 2 I-95 Burlington Bordentown Twp Ramps - Int 7 Ramps - Int 7 04 NJ 413 Burlington Burlington City Broad Street US 130 0.35
10 NJ 73 Burlington Mount Laurel Twp NJ Turnpike I-295 0.681 US 130 Burlington Bordentown Twp I-295 US 206 0.9
8 US 130 Burlington Florence Twp MP 50.06 NJ Tpk (PA connector) 0.19
12 US 206 Burlington Multiple NJ 68 NJ Turnpike 0.414 I-295 Camden Bellmawr Borough NJ 42 NJ 168 1.619 I-676 Camden Camden City I-76 Ben Franklin Br 4.7522 I-76 Camden Multiple I-295 MP 0.8 0.815 NJ 168 Camden Bellmawr Borough NJ Turnpike I-295 0.8224 NJ 38 Camden Pennsauken Twp US 130 Browning Road 0.4
25 US 30/ US 130 Camden Pennsauken Twp Vic of NJ 38 Vic of NJ 38 0.3
31 NJ 45 Gloucester Woodbury City CR 644 Chestnut Street 0.338 CR 571 Mercer West Windsor Twp Fairview Ln Tiger Lane 0.5436 I-95 Mercer Robbinsville Twp Vic of Int 7A Vic of Int 7A 0.5
306 NJ 31 Mercer Multiple I-95 Delaware Ave 2.86
307 US 1 Mercer Multiple Franklin Corner Road Union Road 8.02
Total Mileage 23.41
Table 35: DVRPC 2nd Tier Priority Locations
Unique ID Route County Municipality. Start End Length 5 US 130 Burlington Burlington City Uhler Ave CR 670 1.14
309 US 130 Burlington Florence Twp CR 659 CR 659 0.1308 US 130 Burlington Florence Twp CR 656 CR 656 0.1310 US 130 Burlington Florence Twp John Galt Way John Galt Way 0.1311 US 130 Burlington Burlington Twp Dulty Lane Dulty Lane 0.1312 US 130 Burlington Burlington City Jones Street Jones Street 0.1
18 Atlantic Avenue Camden Camden City I-676 Int I-676 Int 0.07
17 CR 551 Camden Brooklawn Borough US 130 Town Center Drive 0.15303 CR 603 Camden Camden City Mechanic St CR 551 0.6223 I-295 Camden Multiple NJ 42/I-76/I-676 US 30 4.516 NJ 42 Camden Bellmawr Borough MP 13.82 I-295 0.4626 US 130 Camden Pennsauken Twp CR 616 CR 616 0.0727 US 130 Camden Pennsauken Twp CR 615 NJ 90 0.1
313 NJ 44 Gloucester Greenwich Twp Reapapock Creek Wert Ave 3.330 NJ 47 Gloucester Multiple River Dr. US 130 0.3
32 US 130 Gloucester/ Camden Multiple CR 710 CR 551 0.37
35 CR 546 Mercer Hopewell Twp Reed Rd. CR 652 1.1334 NJ 31 Mercer Hopewell Twp Denow Rd. Search Rd 0.96
Total Mileage 13.67

Chapter 6: PRIORITY PROJECTS
177
Table 36: DVRPC 3rd Tier Priority Locations
Unique ID Route County Municipality. Start End Length 11 I-295 Burlington Mount Laurel Twp NJ 38 (Int 40) NJ 38 (Int 40) 0.53 I-295 Burlington Bordentown Twp US 130 (Int 57) US 130 (Int 57) 0.49 I-295 Burlington Mansfield Twp CR 656 (Int 52) CR 656 (Int 52) 0.3
314 NJ 130 Burlington Multiple CR 625 CR 625 0.113 US 130 Burlington Multiple CR 625 CR 625 0.2
302 2nd Street Camden Camden City CR 603 Clinton St 0.78300 CR 601 Camden Camden City Centennial Dr NJ 130 1.97301 Harrison Ave Camden Camden City CR 601 36th St. 0.77
21 I-676 Camden Camden City Vic of Atlantic Avenue
Vic of Atlantic Avenue 0.6
304 Morgan Blvd Camden Camden City I 676 NJ 168 0.8820 River Road Camden Camden City 028 I-295 Gloucester Logan Twp US 130 (Int 13) US 130 (Int 13) 0.529 I-295 Gloucester Logan Twp CR 620 (Int 10) CR 620 (Int 10) 0.333 CR 539 Mercer East Windsor Twp CR 630 I-95/NJTPK 0.48
305 CR 622 Mercer Multiple US 1 Artic Parkway 1.0137 US 1 Mercer Trenton City NJ 29 CR 622 2.4
Total Mileage 11.19

New Jersey Statewide FREIGHT PLAN
178
Figure 93: Priority Highway Locations – NJTPA Region

Chapter 6: PRIORITY PROJECTS
179
Figure 94: Priority Highway Locations – NJTPA Region (Northeast Area)

New Jersey Statewide FREIGHT PLAN
180
Table 37: NJTPA 1st Tier Priority Locations
Unique ID Route County Municipality. Start End Length 58 I-80 Bergen Multiple Int with NJ 17 Int with NJ 17 1.548 I-95 Bergen Multiple W Spur Split GWB 6.1
55 I-95 W Spur Bergen Multiple Int 16W Int 18W 3
56 I-95 W Spur Bergen Multiple Hackensack River I-95 1.3
49 NJ 17 Bergen Multiple CR 36 CR 44 4.2643 NJ 17 Bergen Lodi Borough I-80 EB I-80 EB 0.553 NJ 17 Bergen Multiple CR 62 Century Rd. 1.74
42 NJ 17 Bergen Hasbrouck Heights Borough US 46 US 46 0.5
54 NJ 17 Bergen Multiple CR 40 I-80 1.6
57 NJ 17 Bergen Multiple CR 56 (Essex Street)
Vic. Of Garden State Plaza 2.3
59 NJ 17 Bergen Multiple CR 32 CR S32 0.4140 NJ 4 Bergen Fort Lee Borough Approaching I-95 I-95 0.49
66 US 1/9 Bergen Ridgefield Borough MP 49.3 MP 50.1 0.8
41 US 1/9 Bergen Fort Lee Borough Howard Ave Lancaster Ave 0.150 US 46 Bergen Multiple Rail US 1/9 0.5751 US 46 Bergen Multiple CR 503 Main St 0.977 I-78 Essex Newark City NJ 27 NJTPK 490 I-78 Essex Newark I-95 (Int 14) NJ 440 (Int 14A) 3.591 I-95 Essex Newark City Int 14 MP 65 776 I-95 Essex Newark City 1&9T (Int 15E) 1&9T (Int 15E) 179 NJ 21 Essex Newark City Emmett Street South Street 0.31
74 I-78 Essex/ Hudson Multiple I-95 (Int 14) NJ 139 (Int 14C) 8
75 I-95 Essex/ Hudson Multiple I-78 (Int 14) I-78 (Int 14) 2
89 US 1/9 Essex/ Hudson Multiple NJ 93 US 46 0.73
111 I-78 Hudson Multiple I-78 (Int 14) Newark Bay Bridge 1104 I-78 Hudson Jersey City Vic of Int 14A Vic of Int 14A 1115 I-95 Hudson Secaucus Town CR 653 NJ 3 1.897 NJ 139 Hudson Jersey City US 1/9 Summit Ave 0.47
112 NJ 3 Hudson Multiple I-95 NJ 495 0.898 NJ 440 Hudson Jersey City Culver Ave US 1/9T 0.6295 NJ 440 Hudson Bayonne City I-78 (Int 14) Bayonne Bridge 4.5
113 NJ 495 Hudson Multiple US 1 Summit Ave 0.43114 NJ 495 Hudson North Bergen US 1&9T Lincoln Tunnel Helix 1110 NJ 7 Hudson Multiple US 1/9 Fish House Rd 0.73101 NJ 7 Hudson Jersey City Wittpenn Bridge Wittpenn Bridge 0.4235 US 1/9 Hudson Multiple US 1&9T I-495 5.3100 US 1/9 Hudson Jersey City James Road I-95 0.2226 US 1/9T Hudson Multiple Doremus Ave US 1&9 3.8599 US 1/9T Hudson Jersey City Hackensack River Duncan Avenue 0.89
123 US 202 Hunterdon Multiple NJ 31 CR 650 0.47

Chapter 6: PRIORITY PROJECTS
181
Unique ID Route County Municipality. Start End Length
130 I-287 Middlesex Edison Twp US 1 (Int 1) US 1 (Int 1) 0.7131 I-287 Middlesex Edison Twp I-95 MP 1.5 1.5
151 I-287 Middlesex South Plainfield Borough Durham Ave (Int 4) Washington Avenue 1.8
142 NJ 18 Middlesex Multiple NJ Turnpike Paulus Blvd 1.34
148 NJ 32 Middlesex South Brunswick Twp US 130 I-95 1.18
153 NJ 440 Middlesex Woodbridge Twp CR 656 (Int 52) US 9 0.79175 I-287 Morris Hanover Twp MP 39.1 NJ 10 0.45
184 I-80 Morris Parsippany-Troy Hills Twp US 202 MP 42.9 0.5
181 I-80 Morris Multiple CR 513 I-280 8.9182 I-80 Morris Multiple US 46 CR 621 19.4
185 I-80 Morris Parsippany-Troy Hills Twp I-287 (Int 43) I-287 (Int 43) 0.5
180 NJ 24 Morris Multiple I-287 Appr. I-287 1.2190 I-95 Multiple Multiple I-287 GWB 35.8
214 I-287 Somerset Multiple Raritan River Bridge Raritan River Bridge 0.65
212 NJ 28 Somerset Multiple Approaching Somerville Cir Middough St. 0.66
213 US 202/ 206 Somerset Multiple CR 567 US 22 Int 1.3
227 CR 514 Union Linden City Rail CR 615 0.29232 I-78 Union Multiple Vic Int 49 Vic Int 49 0.9233 I-78 Union Multiple NJ 24 Winans Avenue 5.2231 I-95 Union Multiple Int 13 Int 13A 3.6239 NJ 24 Union Springfield Twp CR 527 I-78 0.82
218 North Ave Union Elizabeth City NJTPK (I-95) US 1&9 0
109 US 1/9 Union Rahway City North Ave NJ 81 0.4378 US 1/9 Union Linden City Vic of I-278 Vic of I-278 0.7
219 US 1/9 Union Elizabeth City Avenue C Sylvan St. 0.1250 US 22 Warren Pohatcong Twp CR 638 I-78 0.87
Total Mileage 165.65

New Jersey Statewide FREIGHT PLAN
182
Table 38: NJTPA 2nd Tier Priority Locations
Unique ID Route County Municipality. Start End Length39 I-95 W Spur Bergen East Rutherford Borough NJ 3 (Int 16W) NJ 3 (Int 16W) 0.560 NJ 17 Bergen Multiple Sears Dist Ctr Sears Dist Ctr 065 NJ 17 Bergen Paramus Borough CR 61 CR 80 446 NJ 17 Bergen Mahwah Twp CR 100 US 202 0.4161 NJ 17 Bergen Multiple Garland Way Pierrepont Ave 1.0269 NJ 17 Bergen Rutherford Borough NJ 3 NJ 3 0.764 NJ 4 Bergen Paramus Borough GSP CR 61 0.6467 NJ 93 Bergen Ridgefield Borough US 1/9 Industrial Ave 0.263 NJ 93 Bergen Palisades Park Borough Linden Ave. Homestead Ave 0.3668 US 1/9 Bergen Ridgefield Borough International Way NJ 21 0.3684 CR 510 Essex Newark City Broad Street NJ 21 0.3173 I-280 Essex Multiple MLK Blvd MP 15.4 1.481 I-78 Essex Newark City Int 56 Int 58 4.582 I-78 Essex Newark City US 1/9 (Int 57) US 1/9 (Int 57) 183 NJ 21 Essex Newark City Lafayette Street Cherry Street 0.3880 US 1/9 Essex Newark City I-278 (Int) I-278 (Int) 0.292 I-78 Essex/Hudson Multiple York St Grove St 1.493 I-95 Essex/Hudson Multiple Passaic River Passaic River 0.4
102 CR 501 Hudson Jersey City Newark Avenue NJ 139 0.26117 CR 501 Hudson Union City 28th Street 32nd Street 0.2896 CR 508 Hudson Harrison Town I-280 7th Street 0.53
105 CR 659 Hudson Kearny Town US 1/9T (Int) US 1/9T (Int) 0.1106 I-95 W Spur Hudson Kearny Town I-280 (Int 15W) I-280 (Int 15W) 0.5118 NJ 495 Hudson Weehawken Twp Helix Helix 0.5116 NJ 495 Ramp Hudson Secaucus Town NJ 495 NJ Turnpike 0
119 NJ 3 Hudson/ Bergen Multiple Hackensack River Hackensack River 0.4
120 NJ 173 Hunterdon Bloomsbury Borough Main Street I-78 0.26124 NJ 173 Hunterdon Union Twp Stoltz Rd I-78 3.6
125 I-78 Hunterdon/ Somerset Multiple CR 523 I-287 7.6
135 CR 514 Middlesex Edison Twp CR 667 College Dr 0.44129 CR 527 Middlesex East Brunswick City Approaching NJ 18 NJ 18 0.08136 CR 529 Middlesex Edison Twp CR 514 Prospect Ave 0.51149 CR 535 Middlesex South Brunswick Twp Vic NJ 32 Vic NJ 32 0.67128 I-95 Middlesex Monroe Twp Ramps - Int 9 Ramps - Int 9 0132 I-95 Middlesex Edison Twp Ramps - Int 8A Ramps - Int 8A 0133 I-95 Middlesex Edison Twp NJ 440 (Int 10) NJ 440 (Int 10) 0.5141 I-95 Middlesex East Brunswick City Ramps - Int 7 Ramps - Int 7 0147 NJ 35 Middlesex South Amboy City App US 9 US 9 0.16134 NJ 440 Middlesex Edison Twp I-95 CR 514 0.45155 US 1 Middlesex Woodbridge Twp CR 604 US 9 0.19143 US 9 Middlesex Multiple Orchard Street Raritan Street 0.89146 US 9 Middlesex South Amboy City NJ 35 (Int) NJ 35 (Int) 0.5154 US 9 Middlesex Woodbridge Twp Edison Bridge CR 616 0.86171 CR 547 Monmouth Wall Twp MP 20.0 NJ 33 0.79170 NJ 33 Monmouth Wall Twp NJ 34 Campus Pkwy 0.29
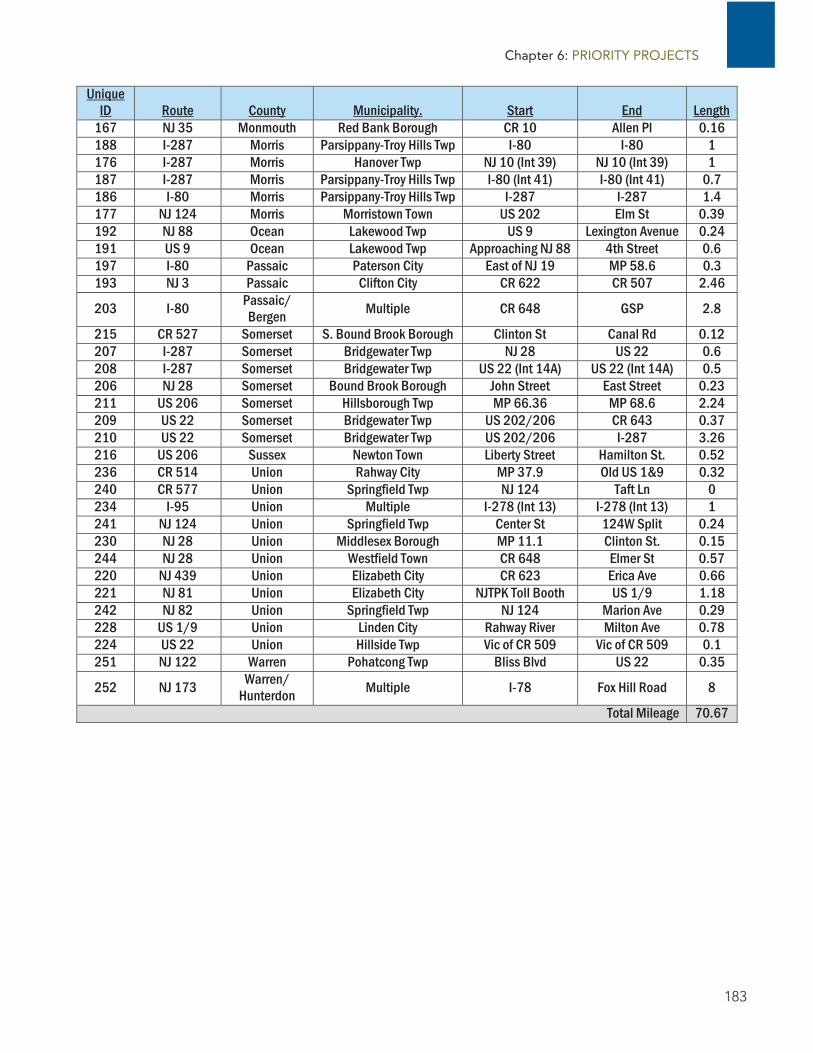
Chapter 6: PRIORITY PROJECTS
183
Unique ID Route County Municipality. Start End Length
167 NJ 35 Monmouth Red Bank Borough CR 10 Allen Pl 0.16188 I-287 Morris Parsippany-Troy Hills Twp I-80 I-80 1176 I-287 Morris Hanover Twp NJ 10 (Int 39) NJ 10 (Int 39) 1187 I-287 Morris Parsippany-Troy Hills Twp I-80 (Int 41) I-80 (Int 41) 0.7186 I-80 Morris Parsippany-Troy Hills Twp I-287 I-287 1.4177 NJ 124 Morris Morristown Town US 202 Elm St 0.39192 NJ 88 Ocean Lakewood Twp US 9 Lexington Avenue 0.24191 US 9 Ocean Lakewood Twp Approaching NJ 88 4th Street 0.6197 I-80 Passaic Paterson City East of NJ 19 MP 58.6 0.3193 NJ 3 Passaic Clifton City CR 622 CR 507 2.46
203 I-80 Passaic/ Bergen Multiple CR 648 GSP 2.8
215 CR 527 Somerset S. Bound Brook Borough Clinton St Canal Rd 0.12207 I-287 Somerset Bridgewater Twp NJ 28 US 22 0.6208 I-287 Somerset Bridgewater Twp US 22 (Int 14A) US 22 (Int 14A) 0.5206 NJ 28 Somerset Bound Brook Borough John Street East Street 0.23211 US 206 Somerset Hillsborough Twp MP 66.36 MP 68.6 2.24209 US 22 Somerset Bridgewater Twp US 202/206 CR 643 0.37210 US 22 Somerset Bridgewater Twp US 202/206 I-287 3.26216 US 206 Sussex Newton Town Liberty Street Hamilton St. 0.52236 CR 514 Union Rahway City MP 37.9 Old US 1&9 0.32240 CR 577 Union Springfield Twp NJ 124 Taft Ln 0234 I-95 Union Multiple I-278 (Int 13) I-278 (Int 13) 1241 NJ 124 Union Springfield Twp Center St 124W Split 0.24230 NJ 28 Union Middlesex Borough MP 11.1 Clinton St. 0.15244 NJ 28 Union Westfield Town CR 648 Elmer St 0.57220 NJ 439 Union Elizabeth City CR 623 Erica Ave 0.66221 NJ 81 Union Elizabeth City NJTPK Toll Booth US 1/9 1.18242 NJ 82 Union Springfield Twp NJ 124 Marion Ave 0.29228 US 1/9 Union Linden City Rahway River Milton Ave 0.78224 US 22 Union Hillside Twp Vic of CR 509 Vic of CR 509 0.1251 NJ 122 Warren Pohatcong Twp Bliss Blvd US 22 0.35
252 NJ 173 Warren/ Hunterdon Multiple I-78 Fox Hill Road 8
Total Mileage 70.67

New Jersey Statewide FREIGHT PLAN
184
Table 39: NJTPA 3rd Tier Priority Locations
Unique ID Route County Municipality. Start End Length44 I-80 Bergen Lodi Borough NJ 17 (Int 64/64A) NJ 17 (Int 64/64A) 0.562 NJ 17 Bergen Multiple NJ 120 Broad Street 0.1545 NJ 17 Bergen Mahwah Twp Stag Hill Rd US 202 0.347 NJ 17 Bergen Mahwah Twp CR 85 CR 85 0.570 NJ 4 Bergen Teaneck Borough Windsor Road Palisade Avenue 0.1588 Delancy St. Essex Newark City I-95 US 1/9 1
85 Doremus Avenue Essex Newark City Port Street Wilson Avenue 1.1
86 Doremus Avenue Essex Newark City Wilson Avenue Raymond Blvd 1.4
87 Doremus Avenue Essex Newark City US 1/9T (Int) US 1/9T (Int) 0.4
318 N/A Essex/Hudson Multiple New Passaic River Crossing
New Passaic River Crossing 0
94 US 46 Essex/Passaic Multiple CR 613 NJ 23 1108 CR 659 Hudson Kearny Town Pennsylvania Ave Pennsylvania Ave 0103 I-78 Hudson Jersey City NJ 440 (Int 14A) NJ 440 (Int 14A) 1107 NJ 7 Hudson Kearny Town Drainage Project MP 3.6 1.9122 CR 519 Hunterdon Holland Twp CR 631 MP 16.6 1.7
121 I-78 Hunterdon Bloomsbury Borough NJ 173 (Int 7) NJ 173 (Int 7) 0
140 CR 501 Middlesex Metuchen Borough App NJ 27 NJ 27 0.14
137 CR 514 Middlesex Edison Twp US 1 Park Way 0.62144 CR 529 Middlesex Multiple Seeley Ave CR 665 0.85
152 I-287 Middlesex South Plainfield Borough Durham Ave (Int 4) Durham Ave (Int 4) 0.5
138 I-287 Middlesex Edison Twp NJ 27 (Int 2) NJ 27 (Int 2) 0.5
126 I-95 Middlesex Carteret Borough CR 602 (Int 12 -Tremley Pt Conn)
CR 602 (Int 12 -Tremley Pt Conn) 1
157 I-95 Middlesex Woodbridge Twp Edison/ Cleveland Svc Areas
Edison/ Cleveland SvcAreas 0.4
139 NJ 27 Middlesex Metuchen Borough Rose St CR 501 0.44
145 NJ 440 Middlesex Perth Amboy City NJ 35 CR 653 0.27156 US 1 Middlesex Woodbridge Twp CR 650 Woodbridge Ave 0.38127 US 130 Middlesex Cranbury Twp App. CR 535 CR 535 0.49
150 US 130 Middlesex South Brunswick Twp Vic NJ 32 Vic NJ 32 0.5
158 US 9 Middlesex Woodbridge Twp CR 604 US 1 0.32
317 N/A Middlesex/Union Multiple Tremley Point Connector
Tremley Point Connector 0
164 CR 28 Monmouth Multiple Monmouth County Line CR 524 0.79
168 CR 10 Monmouth Red Bank Borough NJ 35 Maple St. 0.07
163 CR 524 Monmouth Multiple Entering Monmouth County
CR 539 SPUR (Sharon Station Rd) 4.12

Chapter 6: PRIORITY PROJECTS
185
Unique ID Route County Municipality. Start End Length
159 CR 524 Monmouth Farmingdale Borough Entering Farmingdale Farmingdale
municipal limit 0.91
165 CR 526 Monmouth Multiple Entering Monmouth County
CR 539 SPUR (Sharon Station Rd) 2.66
166 CR 539 Monmouth Multiple Entering Allentown Vicinity of County Boundary 7.69
169 CR 539 SPUR Monmouth Upper Freehold
Twp CR 539 CR524 2.3
160 CR 547 Monmouth Farmingdale Borough Entering Farmingdale Farmingdale
municipal limit 0.27
161 NJ 33 Monmouth Howell Twp NJ 34 NJ 34 0.2172 NJ 34 Monmouth Wall Twp Approaching NJ 33 NJ 33 0.12162 NJ 34 Monmouth Howell Twp NJ 33 NJ 33 0.24174 CR 510W Morris Morristown Town CR 510 I-287 0.4
179 I-80 Morris Mt Arlington Borough CR 615 (Int 30) CR 615 (Int 30) 0.5
183 I-80 Morris Multiple NJ 15 (Int 34) NJ 15 (Int 34) 2.3189 I-80 Morris Rockaway Twp CR 513 (Int 37) CR 513 (Int 37) 0.5173 NJ 24 Morris Chatham Borough Vic of CR 649 Vic of CR 649 0.1178 US 202 Morris Morristown Town NJ 124 CR 510 0.1199 Fair Lawn Ave Passaic Paterson City NJ 20 County Line 0.05200 I-80 Passaic Totowa Borough NJ 62 (Int 55) NJ 62 (Int 55) 0.5198 I-80 Passaic Paterson City NJ 20 (Int 60) NJ 20 (Int 60) 0.571 I-80 Passaic Wayne Twp CR 613 NJ 23 1.2
201 I-80 Passaic Wayne Twp NJ 23 (Int 53) NJ 23 (Int 53) 0.5196 I-80 Passaic Multiple Passaic River Passaic River 0.1194 NJ 21 Passaic Clifton City Approaching NJ 3 NJ 3 0.2195 NJ 3 Passaic Clifton City US 46 (int) US 46 (Int) 0.5202 US 46 Passaic Wayne Twp NJ 23/I-80 NJ 23/I-80 0.5205 I-287 Somerset Bedminster Twp I-78 (Int 21) I-78 (Int 21) 0.7204 I-78 Somerset Bedminster Twp I-287 (Int 29) I-287 (Int 29) 1217 NJ 94 Sussex Newton Town Division Street US 206 0.15243 509 Spur Union Springfield Twp Owaissa Ave NJ 124 0.18245 CR 509 Union Westfield Town CR 613 CR 613 0.06246 CR 613 Union Westfield Town MP 1.45 NJ 28 0.35229 CR 615 Union Linden City US 1&9 NJ 27 1.37238 CR 617 Union Roselle Pk Twp CR 610 NJ 28 0.172 I-78 Union Hillside Twp MP 53.8 Winans Avenue 0.52
223 NJ 27 Union Elizabeth City App NJ 439 NJ 439 0.07237 NJ 27 Union Rahway City CR 35 Grove St 0.41222 NJ 439 Union Elizabeth City CR 612 Wyoming St 0.45247 I-78 Warren Franklin Twp CR 632 (Int 6) CR 632 (Int 6) 0248 I-80 Warren Knowlton Twp NJ 94/US 46 (Int 4) NJ 94/US 46 (Int 4) 1249 I-80 Warren Multiple I-78 (Int 21) US 202/206 (Int 22) 1.5
Total Mileage 52.69
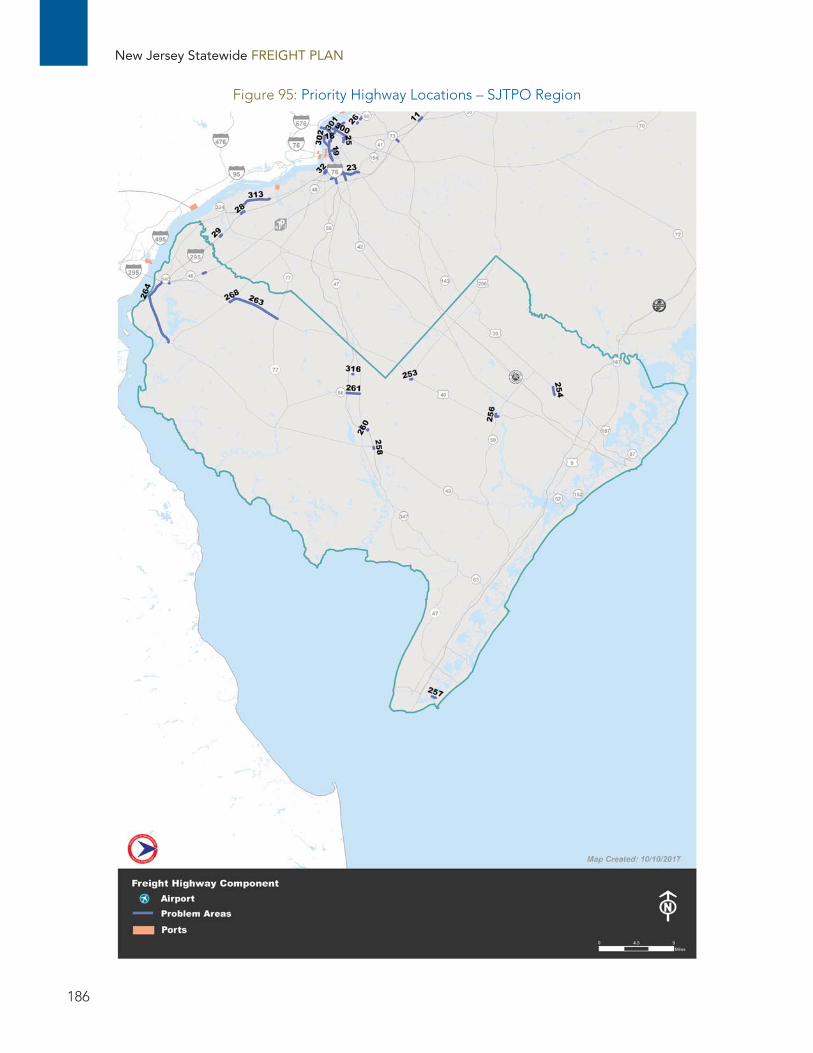
New Jersey Statewide FREIGHT PLAN
186
Figure 95: Priority Highway Locations – SJTPO Region

Chapter 6: PRIORITY PROJECTS
187
Table 40: SJTPO 1st Tier Priority Locations
Unique ID Route County Municipality. Start End Length263 US 40 Salem Multiple CR 616 NJ 77 6.5267 US 40 Salem Woodstown Borough Int. Improvement Project MP 10.8 0.3268 US 40 Salem Woodstown Borough Creek Wilson Avenue 0.48269 NJ 45 Salem Woodstown Borough US 40 CR 636 0.22262 NJ 140 Salem Carneys Point Twp US 130 US 40 0.99
Total Mileage 8.49
Table 41: SJTPO 2nd Tier Priority Locations
Unique ID Route County Municipality. Start End Length
255 US 40 Atlantic Hamilton Twp Cantillon Blvd 19th Street 0.31254 CR 563 Atlantic Galloway Twp Country Club Drive US 30 0.96315 NJ 56 Cumberland Vineland City Mill Road Mill Road 0.2260 CR 555 Cumberland Vineland City NJ 55 CR 655 0.1265 NJ 700 (NJT) Salem Oldmans Twp Barton/Fenwick S.P. Barton/ Fenwick S.P. 0.4264 NJ 49 Salem Multiple I-295 Front Street 8.5
Total Mileage 10.47
Table 42: SJTPO 3rd Tier Priority Locations
Unique ID Route County Municipality. Start End Length
256 CR 616 (Mill St) Atlantic Hamilton Twp CR 559 US 40/NJ 50 0.36253 CR 619 Atlantic Buena Vista Twp CR 655 US 40/CR 557 0.23257 CR 621 Cape May Lower Twp Middle Thorofare Br Middle Thorofare Br 0.5316 CR 674 Cumberland Vineland City Mill Road Mill Road 0.1258 NJ 55 Cumberland Millville City NJ 49 (Int 24) NJ 49 (Int 24) 0.2259 NJ 55 Cumberland Millville City NJ 47 (Int 27) NJ 47 (Int 27) 0.2261 NJ 56 Cumberland Vineland City NJ 55 NJ 47 1.53266 I-295 Salem Oldmans Twp CR 643 (Int 7) CR 643 (Int 7) 0.5
Total Mileage 3.62

New Jersey Statewide FREIGHT PLAN
188
Rail Priority Projects
Evaluation Methodology
Basis of Evaluation Criteria The New Jersey Statewide Freight Rail Strategic Plan (Freight Rail Plan) developed a set of criteria for evaluating the criticality of identified freight rail improvements for the purposes of prioritizing funding. The criteria arose as a result of the work of the Agency and Industry Advisory Group (AIAG) established to serve as a technical review board for the Freight Rail Plan. The AIAG, as its name implies, was comprised of representatives from New Jersey’s transportation and planning agencies, freight rail operators, and freight rail related industries. Each of these three groups brought a different perspective to the needs of freight rail, ranging from trackage rights and passenger-freight interaction, to capacity, congestion, and economic development opportunities sought or lost.
The needs of freight rail and its interaction with the transportation and land use development patterns of New Jersey have no substantially changed since the adoption of the Freight Rail Plan by the NJ State Legislature and its publication in 2014. Many of the criteria align directly with the goals and objects of the FAST Act, such as enhancing multi-modal connectivity and reducing congestion. As a result, the criteria set forth in the Freight Rail Plan are used to organize the freight rail needs listed previously.
Criteria The AIAG’s priorities and concerns translated to 13 specific items against which a freight rail need was ranked:
Maintain state of good repair Preserve out of service and at-risk rail rights of way Protect critical corridors and connections to the national network Enhance intermodal connectivity Improve quality of life Enhance connectivity between Class I, regional and short line railroads Ensure adequate yard capacity Maintain and expand funding programs and opportunities Maintain or expand system redundancy Reduce congestion and enhance operational efficiency Maintain or enhance economic development opportunities Support retention, attraction and growth of rail-served industries within New Jersey Expand public education and support
Evaluation Process Each of the freight rail needs were considered qualitatively against the criteria in terms of the degree to which the project supported the criteria. The weighting was relative:
Detrimental: negative Not Applicable: zero Moderately Supportive: positive Highly supportive: positive, greater than “moderately supporting”

Chapter 6: PRIORITY PROJECTS
189
For example, adding capacity to Greenville Yard would directly and significantly support intermodal connectivity, moderately improve quality of life through secondary effects of improved efficiency, but would not preserve out-of-service and at-risk rail rights-of-way as Greenville Yard is an active facility.
Each project was scored using a matrix illustrated in Table 43.
Table 43: Rail Project Scoring Matrix
Objective
SAMPLE PROJECT Highly
Supportive Moderately Supportive
Not Applicable Detrimental
Maintain state of good repair Y Preserve out of service and at-risk rail rights of way Y
Protect critical corridors and connections to the national network Y
Enhance intermodal connectivity Y Improve quality of life Y Enhance connectivity between Class I, regional and short line railroads Y
Ensure adequate yard capacity Y Maintain and expand funding programs and opportunities Y
Maintain or expand system redundancy Y Reduce congestion and enhance operational efficiency Y
Maintain or enhance economic development opportunities Y
Support retention, attraction and growth rail-served industries within New Jersey Y
Expand public education and support Y
Prioritization Table 44, Table 45, and Table 46 list the projects identified in the earlier Freight Rail Performance section by tier. These projects are also illustrated in Figure 96. Note that although projects were grouped functionally or geographically, each project was evaluated separately. This approach enabled the evaluation to identify keystone or anchor projects or needs within each group.
The scoring methodology resulted in a gradient, incremental range of scores with a maximum of 20 and a low of 3. Projects scoring from 15 to 20 are considered Tier 1 projects. These projects typically were anticipated to result in region-wide improvements in freight rail mobility and/or efficiency and have wide-ranging economic benefits supporting many industries and sectors of the economy. These projects include enhancements on the Lehigh Line, a major freight/passenger rail bottleneck connecting the northern New Jersey ports to the national freight rail network, and improvements to the 286K capacity of the Main Line and HX Bridge, which carry more than several thousand carloads annually.

New Jersey Statewide FREIGHT PLAN
190
Figure 96: Rail Priority Projects
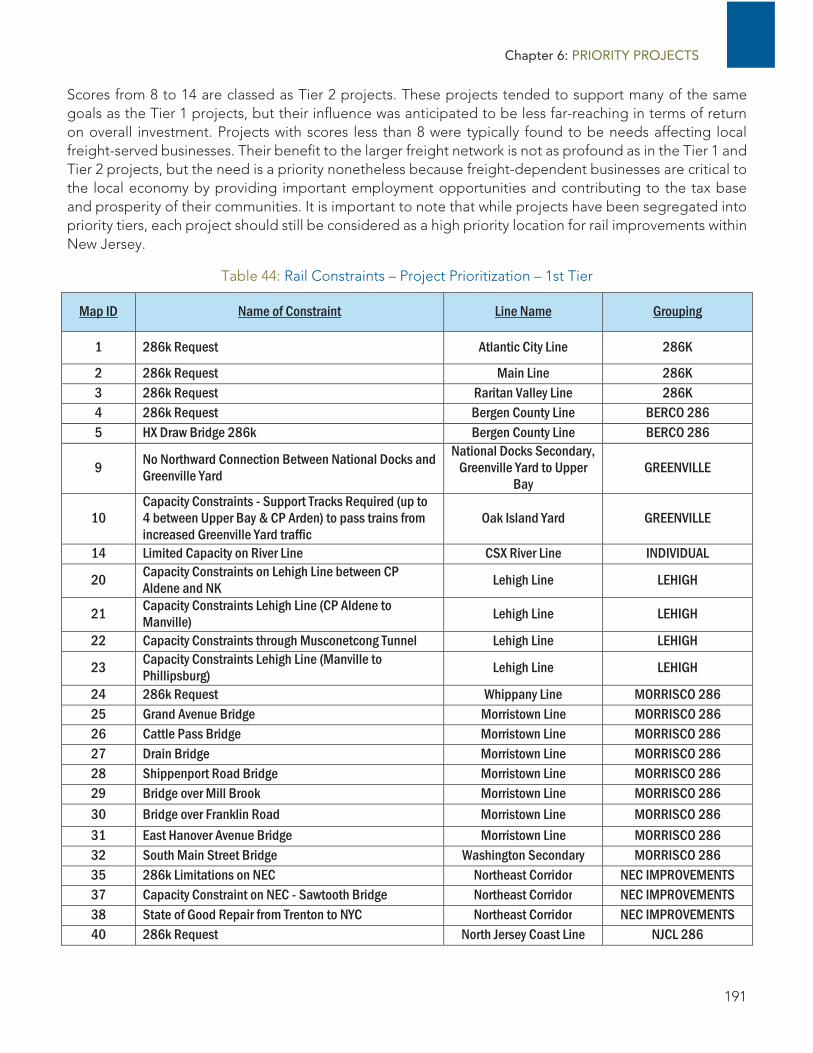
Chapter 6: PRIORITY PROJECTS
191
Scores from 8 to 14 are classed as Tier 2 projects. These projects tended to support many of the same goals as the Tier 1 projects, but their influence was anticipated to be less far-reaching in terms of return on overall investment. Projects with scores less than 8 were typically found to be needs affecting local freight-served businesses. Their benefit to the larger freight network is not as profound as in the Tier 1 and Tier 2 projects, but the need is a priority nonetheless because freight-dependent businesses are critical to the local economy by providing important employment opportunities and contributing to the tax base and prosperity of their communities. It is important to note that while projects have been segregated into priority tiers, each project should still be considered as a high priority location for rail improvements within New Jersey.
Table 44: Rail Constraints – Project Prioritization – 1st Tier
Map ID Name of Constraint Line Name Grouping
1 286k Request Atlantic City Line 286K
2 286k Request Main Line 286K3 286k Request Raritan Valley Line 286K4 286k Request Bergen County Line BERCO 2865 HX Draw Bridge 286k Bergen County Line BERCO 286
9 No Northward Connection Between National Docks and Greenville Yard
National Docks Secondary, Greenville Yard to Upper
Bay GREENVILLE
10 Capacity Constraints - Support Tracks Required (up to 4 between Upper Bay & CP Arden) to pass trains from increased Greenville Yard traffic
Oak Island Yard GREENVILLE
14 Limited Capacity on River Line CSX River Line INDIVIDUAL
20 Capacity Constraints on Lehigh Line between CP Aldene and NK Lehigh Line LEHIGH
21 Capacity Constraints Lehigh Line (CP Aldene to Manville) Lehigh Line LEHIGH
22 Capacity Constraints through Musconetcong Tunnel Lehigh Line LEHIGH
23 Capacity Constraints Lehigh Line (Manville to Phillipsburg) Lehigh Line LEHIGH
24 286k Request Whippany Line MORRISCO 28625 Grand Avenue Bridge Morristown Line MORRISCO 28626 Cattle Pass Bridge Morristown Line MORRISCO 28627 Drain Bridge Morristown Line MORRISCO 28628 Shippenport Road Bridge Morristown Line MORRISCO 28629 Bridge over Mill Brook Morristown Line MORRISCO 28630 Bridge over Franklin Road Morristown Line MORRISCO 286 31 East Hanover Avenue Bridge Morristown Line MORRISCO 28632 South Main Street Bridge Washington Secondary MORRISCO 28635 286k Limitations on NEC Northeast Corridor NEC IMPROVEMENTS37 Capacity Constraint on NEC - Sawtooth Bridge Northeast Corridor NEC IMPROVEMENTS38 State of Good Repair from Trenton to NYC Northeast Corridor NEC IMPROVEMENTS40 286k Request North Jersey Coast Line NJCL 286

New Jersey Statewide FREIGHT PLAN
192
Map ID Name of Constraint Line Name Grouping
44 Waverly Loop Capacity Constraints - Double Track Connection Oak Island Yard OAK
50 Point-No-Point Movable Bridge (CP Kearny Interlocking) Passaic & Harsimus Line P&H
51 Capacity Constraints at Marion Junction, Single Tracks on P&H and National Docks
Passaic & Harsimus Line/Northern Branch P&H
53 Vertical Clearance Restrictions on Delair Bridge Delair Branch PA-NJ-170 286k Restrictions & Needed repairs Salem Running Track SJPC
Table 45: Rail Constraints – Project Prioritization – 2nd Tier
Project Listing Name of Constraint Line Name Grouping
7 Capacity Constraints CP Green to Linden Ave Second Track National Docks Secondary DOCKS
8 Capacity Constraints with increased Port Volume -Greenville Yard Redevelopment Greenville Yard GREENVILLE
13 Rahway River Bridge Garden State Secondary (formerly Chemical Coast) INDIVIDUAL
15 Limited Capacity on West Trenton Line West Trenton Line INDIVIDUAL
36 Capacity and Operation Constraints on the Mid-Line Loop near North Brunswick, NJ Northeast Corridor NEC IMPROVEMENTS
39 Vertical Clearance on NEC Northeast Corridor NEC IMPROVEMENTS
42 NJTPA Rail Freight Capacity and Needs Assessment at Grade Crossings Multiple NJTPA CROSSINGS
43 Oak Island Yard Capacity Constraints Oak Island Yard OAK 52 Harsimus Branch Lift Bridge (Hack Bridge) Passaic & Harsimus Line P&H54 Vertical Clearance at G Street (19'10") Delair Branch PA-NJ-155 Vertical Clearance at Front Street (20'2") Delair Branch PA-NJ-156 Vertical Clearance at 2nd Street (18'8") Delair Branch PA-NJ-157 Vertical Clearance at 5th Street (19'3") Delair Branch PA-NJ-158 Vertical Clearance at Margie Street (18'10") Delair Branch PA-NJ-159 Vertical Clearance at Ridge Avenue (18'11") Delair Branch PA-NJ-1
60 Vertical Clearance at Cecil B. Moore Avenue (18'0") Delair Branch PA-NJ-1
61 Upper Hack Lift Bridge Main Line PORT BRIDGE62 Lower Hack Lift Bridge Morristown Line PORT BRIDGE63 Upper Bay Bridge (Lehigh Valley Drawbridge) National Docks Secondary PORT BRIDGE 64 Arthur Kill Lift Bridge Staten Island Railroad PORT BRIDGE65 E-Rail WJ PORT SUPP
68 Single-Track Constraints, Lack of Connection to the Raritan Industrial Track
Garden State Secondary (formerly Chemical Coast) RARITAN
69 286k Access to Middlesex County Northeast Corridor RARITAN71 Paulsboro Wye to Port Connection Vineland Secondary SJPC72 North Jersey & South Jersey Connection SJPC74 Capacity Constraints, Single Track Limitations CSX Trenton Line TRENTON

Chapter 6: PRIORITY PROJECTS
193
Table 46: Rail Constraints – Project Prioritization – 3rd Tier
Project Listing Name of Constraint Line Name Grouping
6 Belden Brick Crossing Bergen County Line BERCO 286
11 DB Draw Bridge (inactive but maintained) Boonton Line INDIVIDUAL12 Harrison Industrial Track Harrison I.T. INDIVIDUAL16 Croxton Yard Nave-Croxton R.T. INDIVIDUAL17 Landsdown Wye Lehigh Line INDIVIDUAL18 Bridge Ballast (LE57.1 and 57.17) Lehigh Line INDIVIDUAL19 Crash Beam at LE 36.4 Bridge Lehigh Line INDIVIDUAL33 Engine Track Ramp Extension Nave-Croxton R.T. NAVE34 Limited Track Storage Nave-Croxton R.T. NAVE41 Raritan Bay Drawbridge (River Draw) North Jersey Coast Line NJCL 28645 West Belt Parkway Crossing Totowa Spur OTHER CROSSINGS46 Crooks Avenue Crossing Passaic Spur OTHER CROSSINGS47 Bunge Oil Crossing Harrison I.T. OTHER CROSSINGS48 Bunge Oil Lead Harrison I.T. OTHER CROSSINGS49 Highfield Lane Crossing Newark I.T. OTHER CROSSINGS66 Positive Train Control Network PTC
67 Vertical Clearance Issues in Perth Amboy Garden State Secondary (formerly Chemical Coast) RARITAN
73 Rail Crossing at Route 601 CSX Trenton Line TRENTON

New Jersey Statewide FREIGHT PLAN
194
Planning Projects to be Advanced While infrastructure investments are detailed within the Investment Plan (Chapter 7), the project team, in collaboration with the FAC, identified several problem areas that are worthy of advancement as planning projects. These projects will be eligible for funding under FAST Act guidelines, but cannot be included within the Investment Plan until they have been included within an appropriate TIP. For each study identified below, the appropriate lead agency (MPO) is included. Each lead MPO is responsible for amending their respective TIP in coordination with NJDOT Capital Programming to initiate the process to shift future year NHFP dollars to fund these planning studies.
These initial projects are intended as pilot efforts aimed at developing a strategy to identify and implement solutions for the problem areas identified earlier in this chapter. A concept development study to evaluate in detail the underlying causes to the problem areas and identify and evaluate alternatives is recommended for each project. While some of the problem areas have funded projects on the STIP (as detailed in Chapter 7), many of these locations lack a focused effort to study in detail the underlying causes of these problem areas. Each of the initial proposed planning projects is outlined in Table 47 and detailed individually below.
Table 47: Identified Planning Projects
Project Responsible
MPO County Municipality I-295 Freight Interchanges DVRPC Gloucester,
Burlington Logan Twp, Mount Laurel Twp, Mansfield Twp, Bordentown Twp
HX Draw (FRIO Concept Dev.) NJTPA Hudson, Bergen East Rutherford Borough, Secaucus Town
NJ 55 at NJ 47 Interchange SJTPO Cumberland Vineland City, Millville City
North-South Rail Connector NJTPA Multiple Multiple
I-295 Freight Interchanges A series of interchanges along I-295 were identified as problem areas having safety, operational, or congestion concerns. These interchanges also reflect bottleneck areas where reliability (Truck Travel Time) issues are evident. DVRPC identified these locations that have specific individual issues, but collectively serve a critical highway link in the region. Therefore this planning study will review conditions and identify potential solutions (focused on the needs of the freight industry) at the following interchanges:
Interchange 10 – Gloucester CR 620: Proximity to Pureland Industrial Complex Interchange 13 – US Route 130: Link to US Route 322/Commodore Barry Bridge Interchange 40 – NJ Route 38: Substantial retail generators and review of missing moves Interchange 52 – Burlington CR 656: Connection to NJ Turnpike connector to Pennsylvania Interchange 57 – US Route 130
NJ 55 at NJ 47 Interchange This interchange was previously identified as having specific safety concerns through NJDOT’s Safe Corridors program as well as the Millville Transportation Improvement Study completed by SJTPO in 2013. This area is the primary retail activity node for South Jersey and provides links to numerous small and medium warehousing facilities located in Millville and Vineland. SJTPO identified this interchange as the most critical bottleneck in

Chapter 6: PRIORITY PROJECTS
195
its 2016 Probe Data Analytics (VPP Suite) bottleneck analysis. Ultimately this planning project will aim to address ramp, capacity, and operational deficiencies, each of which impacts the movement of heavy vehicles through this critical junction.
FRIO Concept Development – HX Draw Bridge Several key rail corridors in the NJTPA region that serve industrial users cannot currently accommodate the adopted national standard freight rail car defined by its dimensions (Plate "F" which is 17 feet high and 10.5 feet wide) and its loaded weight 286,000 (286K) pounds. When cars cannot be filled to their maximum capacity and/or greater number of smaller rail cars must be used, the rail movement is not as cost efficient for the shippers or their receivers. Fewer railcars translate into shorter, fewer trains with less fuel consumption and commensurate improved air quality. Industrial sites without rail access that can accommodate the current national standard cars are at a significant disadvantage. Crucial concentrations of industrial properties primarily in northern and central New Jersey exist along these restricted rail lines. The State risks losing existing businesses as well as a reduced capacity to attract new businesses if the rail lines that serve them cannot accommodate the most economical rail equipment and encounters diminished ability to attract new rail-served businesses.
The NJTPA FRIO Corridors Program builds on the previous work to identify these restriction locations along the key corridors region wide. The economic development potential associated with addressing these restrictions are also being quantified. The restriction locations will be prioritized and advanced through the concept development phase towards construction. One of the initially identified projects to be advanced through the FRIO effort is the HX Draw Bridge/Passaic County corridor serving a number of key customers in the County. This structure currently serves thousands of carloads annually, and includes multiple businesses that New Jersey risks losing if targeted improvements are not advanced.
North-South Rail Connector As described in the NJDOT’s Southern New Jersey Freight and Logistics Industry Context and Economic Growth Visioning Plan, as well as in the Strategic Freight Rail Plan, efficient and effective transportation connections and critical in helping South Jersey reach its potential. One of the primary improvements identified in both plan included the creation of north/south rail connectivity to attract new carload and intermodal rail freight service to South Jersey.
Currently, rail freight connectivity is severely limited between the northern and southern portions of the state. The main option to do so remains moving trains via the Delair Bridge into Pennsylvania and then back into New Jersey. While a physically viable route, the lack of an efficient connection limits movements and options, such as the movement of sand and silica from the region to customers in the northern portion of the state and the potential development of rail shuttle service between the northern port complex and distribution centers in the supply chain Corridor.
This planning study would investigate opportunities to better connect New Jersey’s freight generators in North and South Jersey by rail, including the investigation of potential corridors and economic development opportunities along any potential corridor.

New Jersey Statewide FREIGHT PLAN
196
Other Regional Initiatives Overall, NJDOT should review and continue its commitment to the regional freight initiatives identified in Chapter 1, including G-MAP, Cross Harbor Freight, the I-95 Corridor Coalition, and East Coast Marine Highway Initiative. Additionally, several focused opportunities are identified below, each of which is wholly focused on improving conditions for the goods movement industry.
Freight Advisory Committee (FAC) The FAC, including NJDOT/MPO management, freight transportation stakeholders, industry and business leaders (at large), and statewide or local elected officials, is a viable approach to address freight transportation concerns in the state. This group can serve as a forum and place for raising issues and concerns specific to Federal Grants that benefit the region, priority highway and rail projects, 286k issues, local land use awareness and improved planning, truck parking, identifying problems and needs, and proposing and discussing solutions. While the FAC was convened specifically to assist in the preparation of this Plan, continuing to hold scheduled quarterly FAC meetings is recommended. This will allow the State’s key freight planners and practitioners to continue to formally work together to improve transportation and infrastructure conditions for the goods movement industry in New Jersey.
Truck Parking Investments As noted in Chapter 4, NJDOT recognizes the importance of the truck parking shortage and its potential to contribute to both increased congestion and reduced safety. One topic for the continued action of the FAC should include the advancement of truck parking shortage improvements. The P3 program and successful initiatives by other state DOTs provides a platform for NJDOT to explore opportunities for expanding truck parking capacity and local economic development through dual-use facilities and the provision of parking at truck-oriented developments.
Specifically, the NJDOT will advance a Pilot Truck Parking Improvement in Springfield Township. The former rest areas located on I-295 in Springfield Township (MP 49.5 – 49.8) were closed following budget cuts in the early 2000s. The proximity of this location to growing clusters of distribution areas in Burlington County makes it a worthwhile candidate for improvements that would retrofit existing facilities to help close the gap between existing truck parking availability and truck parking demand. As detailed above, numerous state DOTs have successfully used P3 funding schemes to advance truck parking/service area improvements. NJDOT should initiate the process to reactivate these facilities by seeking appropriate partners to fund the necessary improvements. The department has actively partnered with private businesses to advance safety programs throughout the state, including the Safety Service Patrol funded by State Farm and the recent partnership with GEICO to dedicate 14 rest areas throughout New Jersey as “Safe Phone Zones.” While these partnerships have not resulted in physical improvements, and the scale of these partnerships are substantially smaller than the funding that would be required to improve the Springfield Township facilities, they indicate a willingness of NJDOT to actively partner with private sector agencies to improve conditions for drivers in New Jersey.
Freight Incorporation into Capital Program NJDOT The development of the Freight Management System (currently under development as discussed in Chapter 1) is critical to advancing freight-specific concerns into NJDOT’s capital programming process. This allows for projects to be quantitatively measured with respect to freight in the same fashion that projects are currently measured for pavement, drainage, or bridge sufficiency.
Chapter 6: PRIORITY PROJECTS
197
In order to further advance the needs and concerns of the goods movement industry, NJDOT’s capital programming process should also include freight-specific subject matter experts (SMEs) that can provide substantive review during the Concept Development and Preliminary Engineering phases.
Municipal/County Outreach Freight transportation has the potential to positively or negatively affect a community’s economic development goals. New Jersey is the most densely populated state in the United States and, as such, land use is an increasingly complex issue facing the freight industry. Due to these constraints, there is a higher probability of conflict over freight facility locations, as well as for potentially adverse interactions between trucks and passenger vehicles on the roadways.
There are several measures that could be taken to address this conflict. The public sector needs to send a strong and coherent message to New Jersey’s residents regarding the value of the freight system. For example, freight activity has the potential for positive impacts, such as generating local jobs and promoting economic activity. Further, retail home delivery trends have increased the connection between consumers and the reliance on one- and two-day delivery windows. Previously the public has received mixed messages about the value of freight, due to different agencies being responsible for different elements of the freight system and thus, different priorities and constituencies to accommodate. It will be necessary to provide easily accessible information to answer questions or concerns the public may have about freight activity. Additionally, better coordination among all involved parties is vital to the development of the freight network, to help minimize potential conflict between local community interests and freight development. Improved coordination could be enforced by updating the State Development and Redevelopment Plan (SDRP), to increase freight specific goals and address freight at a more in depth level. Coordination across the local and regional level is imperative in the operation and development of the freight network.
Moving New Jersey Forward This Plan outlines the diverse and intertwined environment in which New Jersey’s freight industries move goods, create jobs, and generate activity on the state’s highways, railroads, and ports. The infrastructure that the freight industry relies on to efficiently move goods is one of New Jersey’s greatest assets; keeping it in a state of good repair and making investments into future needs is critical to maintaining that geographic advantage.
The investment plan in Chapter 7 lays out the substantial amount of allocated funding aimed at improving New Jersey’s freight network. However, it only begins to address the many needs outlined in Chapter 6. Further investment targeted at these corridors is essential. To make this happen, the State’s freight community, primarily represented by the FAC, must continue to work collectively to advocate for their constituents, focusing on the singular goal of keeping freight moving in New Jersey.

New Jersey Statewide FREIGHT PLAN
198
Page left blank intentionally.

Chapter 7: INVESTMENT PLAN
199
INVESTMENT PLAN To carry out the vision and goals outlined throughout this plan, a firm investment strategy is needed to facilitate the Department’s desire to provide a quality transportation system using available funds. Updates or revisions to the State Freight Plan will be conducted as and when required to accommodate additional projects and programs, but at a minimum
of once every five years to meet federal requirements and ensure a monitored approach to Plan implementation. Each year the state outlines projects and programs that are intended to rebuild the state’s bridges and roads, improve transit services, reduce congestion, and improve safety.
While Chapter 6 outlines the plan’s targeted problem areas for the goods movement industry, the following highlights State and Federal funding sources that fiscally constrain the implementation of improvements to those locations.
New Jersey Statewide Transportation Improvement Program In compliance with Federal legislation, New Jersey creates a 10-year STIP to guide transportation investments for the State, which must be updated every 4 years at a minimum. Additionally, it is used to approve the expenditure of federal funds for transportation projects by the FHWA and FTA as per federal regulations. The STIP is then used as a guide by agencies such as NJDOT, NJ TRANSIT, and other implementing agencies in NJ. It includes statewide projects and programs, and incorporates the regional Transportation Improvement Programs (TIPs) developed by the three MPOs in the State. Federal laws require that the STIP be fiscally constrained for the first four years. It lists the priority projects planned for the first four years, and a list of priority projects to be funded over the next six years. As such, funding that is listed through 2020 is within the fiscally constrained plan and apportioned; funding listed beyond those years are subject to change when the next STIP is released. While the STIP illustrates the numerous projects that the state has advanced within these priority locations identified in Chapter 6, the STIP projects do not necessary address specific freight concerns. Further, while there are 65 identified priority freight locations that align with projects currently on the STIP, the remainder of the freight problem areas represent the additional necessary investment needed to maintain or improve New Jersey’s freight network.
The STIP is developed collaboratively between NJDOT, NJ TRANSIT, and the three MPOs. Each of these agencies independently analyzes the TIP presented by each MPO and assigns a priority ranking based on how each project would advance regional and statewide objectives. NJDOT and NJ TRANSIT develop revenue projections for each MPO based on available federal and state funds, and then, in consultation with the three MPOs negotiate a list of deliverable transportation projects that best meet the statewide and regional priorities within the fiscally constrained program.
In New Jersey, transportation funding comes from the following sources:
Federal funding – FHWA and FTA State funding – Transportation Trust Fund (TTF) Other
The Capital Program for each year represents the annual component of the STIP. The funding sources for FY 2016 are shown in Figure 97. Federal funds make up $2.357 billion, with $799.2 million allotted to NJDOT, and

New Jersey Statewide FREIGHT PLAN
200
$1.558 billion allotted to NJ TRANSIT. State funds total $1.60 billion, with NJDOT receiving $1.096 billion ($743.5 million from TTF, $353.0 million from PANYNJ) and NJ TRANSIT receiving $503.5 million from TTF funding.
Figure 97: FY 2016 NJ Transportation Capital Program
Source: http://www.state.nj.us/transportation/capital/tcp16/
(1) Reflects projects not under NJDOT lead, but are included because federal financing may assist PANYNJ’s I-278 Goethals Bridge ($720M) and NJ 440 Bayonne Bridge ($230M) projects.
(2) Reflects projects with NJDOT lead for NJDOT facilities that are receiving a significant level of funding from the PANYNJ
For the purposes of the Investment Plan, the STIP was reviewed and freight-related projects were identified. Each project was categorized according to its funding code, as described in the sections below. For each funding source, a table was created to summarize the total funding for projects within that source. Later in the chapter, the projects are also listed by MPO. The following sections provide an overview of available funding sources. Appendix F lists freight-related projects in the STIP.70 Appendix G lists projects that are in Study and Development and may be prioritized when future funding allocations are developed. Study and development is work that is done to develop a project in response to a transportation problem, typically work completed in concept development includes developing a preferred alternative, securing community support for the alternative, securing approval of environmental agencies for the alternative, and developing a specific scope of work for the project. Study and development projects are not funded
70 For projects included in both the 2016-2025 STIP and 2018-2027 Draft STIP, where funding amounts differed, 2016-2025 STIP funding amounts were used for years 2016-2017 and 2018-2027 STIP funding amounts were used for years 2018 and beyond.

Chapter 7: INVESTMENT PLAN
201
as individual projects in the STIP, rather they are funded by program line items such as Project Development or Preliminary Engineering. An exception is made for projects with special funding categories such as High Priority Projects.
Federal Transportation Funding The FHWA and FTA expect states to maintain facilities on the designated federal aid system, including those under jurisdiction of NJDOT, NJ TRANSIT, counties, certain municipalities, and authorities, and provide funding for that purpose. In FY 2016, federal funds made up about 37% of New Jersey’s total transportation funding. The most recent federal legislation (the FAST Act), provides funding for highway, highway and motor vehicle safety, public transportation, ferry, motor carrier safety, hazardous materials safety, rail, and research, technology, and statistics programs. For the first time, this Act provides a dedicated source of federal dollars for freight projects. These funds are intended to support critical transportation projects and ease congestion and facilitate freight movement on interstates and major roads that are part of the NHFN.
NJDOT is permitted under Section 120(j) of Title 23 to use toll-financed investments for state matching funds on federal-aid projects. This provision dates back to ISTEA and has since been modified by TEA-21 and SAFETEA-LU. It permits the non-federal share of a project's cost to be met through a "soft match" of toll credits. This soft match means that no project costs are incorporated into the project as part of the non-Federal share. Rather, the use of toll credits meets the matching requirements required under law, and increases the Federal cash outlay up to 100% of project costs. The funding amounts quantified within this chapter should be considered 100% of the federal share. In the cases where NJDOT is a pass-through entity to a non-governmental agency, that non-federal agency would be responsible for the non-federal share and the soft match is not utilized. This is the case for the projects programmed to use NHFP-Rail funds where the Other funding source would represent the match required by the non-federal agency.
Despite dedicated funding, there are still challenges in meeting the growing multimodal and freight needs in the State. The STIP is fiscally constrained for the first four years, and the State’s infrastructure is getting older and more congested. Needs continue to exceed funding/revenues; therefore, there is a growing backlog of necessary but unfunded projects.
FASTLANE Grants/INFRA Grants The FAST Act established the Fostering Advancements in Shipping and Transportation for the Long-term Achievement of National Efficiencies (FASTLANE) program, rebranded as INFRA, which is a grant program of $4.5 billion over 5 years to provide monetary assistance to nationally or regionally significant highway, rail, port, and intermodal freight and highway projects that have goals to:
improve the safety, efficiency, and reliability of the movement of freight and people; generate national or regional economic benefits and an increase in global economic
competitiveness of the U.S; reduce highway congestion and bottlenecks; improve connectivity between modes of freight transportation; enhance the resiliency of critical highway infrastructure and help protect the environment; improve roadways vital to national energy security; and address the impact of population growth on the movement of people and freight.
New Jersey Statewide FREIGHT PLAN
202
Eligible projects for application to these grants include those that are:
A highway freight project on the National Highway Freight Network; A highway or bridge project on the National Highway System, including:
o A project to add capacity to the Interstate System to improve mobility; or o A project in a national scenic area;
A freight project that is: o A freight intermodal or freight rail project; or o A project within the boundaries of a public or private freight rail, water (including ports),
or intermodal facility and that is a surface transportation infrastructure project necessary to facilitate direct intermodal interchange, transfer, or access into or out of the facility,
o provided that the project will make a significant improvement to freight movements on the National Highway Freight Network, that the Federal share of non-highway portions of the project funds only elements of the project that provide public benefits, and that the total of Federal FASTLANE grants for non-highway portions of these projects does not exceed $500 million for fiscal years 2016 through 2020; or
A railway-highway grade crossing or grade separation project.
Under this grant program, PANYNJ has been awarded $10M for the Cross Harbor Freight Program, which will implement intermodal rail improvements to help optimize the PANYNJ’s railcar float system.
TIGER Grants Currently in its 8th round, the Transportation Investment Generating Economic Recovery, or TIGER Discretionary Grant program, allows the USDOT to award monies to road, rail, transit and port projects that have national significance.
Eligible projects for TIGER Discretionary Grants are capital projects that include, but are not limited to:
Highway, bridge, or other road projects eligible under title 23, United States Code; Public transportation projects eligible under chapter 53 of title 49, United States Code; Passenger and freight rail transportation projects; Port infrastructure investments (including inland port infrastructure and land ports of entry); and Intermodal projects.
Recent TIGER grants in New Jersey are detailed below.
South Jersey Port Rail Improvements Applicant: South Jersey Port Corporation, (an agency of the State of New Jersey) Mode: MARAD Grant Amount: $18,500,000 Round: TIGER 2011
The Delair Bridge, linking the rail networks of Pennsylvania and New Jersey, is the major connection to national markets and will be repaired to accommodate the transport of industry-standard 286,000 lb. rail cars and enhance freight movement throughout the northeast region. In addition, the rail network from the Delair Bridge to the Port of Salem, including the ports of Paulsboro and Camden, must be significantly upgraded to accommodate the anticipated demand in rail/port traffic.

Chapter 7: INVESTMENT PLAN
203
Port Newark Container Terminal Access Improvement and Expansion Project Applicant: County of Essex, New Jersey Mode: MARAD Grant Amount: $14,800,000 Round: TIGER 2014
The Port Newark Container Terminal Access Improvement and Expansion Project will demolish an outdated warehouses and gate facilities and construct a new paved container storage area and new gate facilities.
South Hudson Intermodal Facility Applicant: City of Bayonne, NJ Mode: MARAD Grant Amount: $11,400,000 Round: TIGER 2012
TIGER funds will expand the capacity of the largest port on the East Coast by building a new intermodal facility. New capacity is needed to accommodate larger, Post Panamax vessels that will be too big to sail under the Bayonne Bridge, limiting the port’s effectiveness. The improvements funded by this grant will allow for direct transfer of export and import containers from the terminal on the ocean side of the Bayonne Bridge to the national rail network. The Port Authority of New York and New Jersey is matching these funds with over $100 million to the creation of the facility. When completed, the South Hudson Intermodal Facility will be capable of handling 250,000 containers per year.
Meadowlands Adaptive Signal System Applicant: New Jersey Meadowlands Commission (NJMC) Mode: FHWA Grant Amount: $10,008,056 Round: TIGER 2010
Description: This will improve traffic flow in one of the most heavily used corridors in the Nation by modernizing and coordinating signals along the corridor, improving transit times for nearly 120,000 annual rides on NJ transit, local, and private buses which travel through the area. Traffic signals at 128 intersections will use algorithmic intelligence to achieve the maximum roadway capacity, improve operating efficiency, and avoid unnecessary roadway widening.
National Highway Performance Program (NHPP) Established under MAP-21, FAST Act continues the NHPP to support the improvement of the condition and performance of the National Highway System, to contribute to the construction of new facilities on the NHS, and to ensure that federal funds are used to support progress toward performance targets established by NJ asset management plan for the NHS. Eligible projects include:
Construction, reconstruction, resurfacing, restoration, rehabilitation, preservation, or operational improvements of NHS segments.
Construction, replacement (including replacement with fill material), rehabilitation, preservation, and protection (including scour countermeasures, seismic retrofits, impact protection measures, security countermeasures, and protection against extreme events) of NHS bridges and tunnels.
Bridge and tunnel inspection and evaluation on the NHS and inspection and evaluation of other NHS highway infrastructure assets.
Training of bridge and tunnel inspectors.

New Jersey Statewide FREIGHT PLAN
204
Construction, rehabilitation, or replacement of existing ferry boats and facilities, including approaches that connect road segments of the NHS.
Construction, reconstruction, resurfacing, restoration, rehabilitation, and preservation of, and operational improvements for, a Federal-aid highway not on the NHS, and construction of a transit project eligible for assistance under chapter 53 of title 49, if the project is in the same corridor and in proximity to a fully access-controlled NHS route, if the improvement is more cost-effective (as determined by a benefit-cost analysis) than an NHS improvement, and will reduce delays or produce travel time savings on the NHS route and improve regional traffic flow.
Bicycle transportation and pedestrian walkways. Highway safety improvements on the NHS. Capital and operating costs for traffic and traveler information, monitoring, management, and
control facilities and programs. Development and implementation of a State Asset Management Plan for the NHS including data
collection, maintenance and integration, software costs, and equipment costs. Infrastructure-based ITS capital improvements. Environmental restoration and pollution abatement. Control of noxious weeds and establishment of native species. Environmental mitigation related to NHPP projects. Construction of publicly owned intracity or intercity bus terminals servicing the NHS Installation of vehicle-to-infrastructure communication equipment; Reconstruction, resurfacing, restoration, rehabilitation, or preservation of a bridge on a non-NHS
Federal-aid highway (if Interstate and NHS Bridge Condition provision requirements are satisfied); A project to reduce the risk of failure of critical NHS infrastructure (defined to mean a facility, the
incapacity or failure of which would have a debilitating impact in certain specified areas); and At a State's request, the USDOT may use the State's Surface Transportation Block Grant (STBG)
funding to pay the subsidy and administrative costs for Transportation Infrastructure Finance and Innovation Act (TIFIA) credit assistance for an eligible NHPP project or group of projects.
Freight-related funding in the STIP from NHPP, in millions, by year is listed below:
2016 2017 2018 2019 2020 2021 2022-2027 TOTALNHPP $ 109.39 $ 79.61 $ 184.34 $ 189.95 $ 229.49 $ 253.85 $ 701.93 $ 1,458.56
National Highway Freight Program (NHFP) To improve efficient movement of freight on the NHFN, FAST Act established a new National Highway Freight program with the goals of:
investing in infrastructure and operational improvements that strengthen economic competitiveness, reduce congestion, reduce the cost of freight transportation, improve reliability, or increase productivity;
improving the safety, security, efficiency, and resiliency of freight transportation in rural/urban areas; improving the state of good repair of the NHFN; using innovation and advanced technology to improve NHFN safety, efficiency, and reliability; improving the efficiency and productivity of the NHFN; improving State flexibility to support multi-State corridor planning and address highway freight
connectivity; and reducing the environmental impacts of freight movement on the NHFN.

Chapter 7: INVESTMENT PLAN
205
Eligibility criteria requires that a project contribute to the efficient movement of freight and be identified in the state’s freight investment plan. States may use up to 10% of NHFP funding each year for public or private freight rail, water facilities (including ports), and/or intermodal facilities. In FY 2016 NJ was granted $31.3M through the NHFP. Eligible project types include:
Development phase activities, including planning, feasibility analysis, revenue forecasting, environmental review, preliminary engineering and design work, and other preconstruction activities.
Construction, reconstruction, rehabilitation, acquisition of real property (including land relating to the project and improvements to land), construction contingencies, acquisition of equipment, and operational improvements directly relating to improving system performance.
Intelligent transportation systems and other technology to improve the flow of freight, including intelligent freight transportation systems.
Efforts to reduce the environmental impacts of freight movement. Environmental and community mitigation for freight movement. Railway-highway grade separation. Geometric improvements to interchanges and ramps. Truck-only lanes. Climbing and runaway truck lanes. Adding or widening of shoulders. Truck parking facilities eligible for funding under section 1401 (Jason’s Law) of MAP-21. Real-time traffic, truck parking, roadway condition, and multimodal transportation information
systems. Electronic screening and credentialing systems for vehicles, including weigh-in-motion truck
inspection technologies. Traffic signal optimization, including synchronized and adaptive signals. Work zone management and information systems. Highway ramp metering. Electronic cargo and border security technologies that improve truck freight movement. Intelligent transportation systems that would increase truck freight efficiencies inside the
boundaries of intermodal facilities. Additional road capacity to address highway freight bottlenecks. Physical separation of passenger vehicles from commercial motor freight. Enhancement of the resiliency of critical highway infrastructure, including highway infrastructure
that supports national energy security, to improve the flow of freight. A highway or bridge project, other than a project described above, to improve the flow of freight
on the NHFN. Any other surface transportation project to improve the flow of freight into and out of an eligible
intermodal freight facility. Diesel retrofit or alternative fuel projects under the CMAQ Program for class 8 vehicles. Conducting analyses and data collection related to the NHFP, developing and updating freight
performance targets to carry out section 167 of title 23, and reporting to the Administrator to comply with the freight performance target under section 150 of title 23.

New Jersey Statewide FREIGHT PLAN
206
Figure 98: Current NHFP-Funded Projects

Chapter 7: INVESTMENT PLAN
207
There are currently three projects that are funded through the NHFP, as illustrated in Figure 98:
Highway o Route 295/42/I-76, Direct Connection - Relieves existing bottleneck at interchange by
providing direct connections between multiple highways. Also includes ITS and safety investments in addition to improvements to relieve congestion at existing bottleneck
Rail o Penns Grove Secondary Siding Installation – Construction of new railroad siding track to
facilitate movement into and out of the recently improved Port of Paulsboro and reduce idling and occupation of the Penns Grove mainline during port entry/exit maneuvers. For this project, federal funding contributes $1.56M, with a match of $0.389M from Conrail.
o Replacement of Bridge 3.08 in Conrail Passaic and Harsimus (P&H) line – Replaces two-track, riveted steel through girder bridge with floorbeams and stringers that is nearing end of its useful life. Removes superstructure and replaces it with new ballasted deck girder bridge. For this project, federal funding contributes $1.25M, with a match of $0.75M from Conrail.
Freight-related funding in the STIP from NHFP, in millions, by year is below:
2016 2017 2018 2019 2020 2021 2022-2027 TOTALNHFP $ 28.37 $ 25.97 $ 29.47 $ 33.99 $ 37.76 $ 39.63 $ 159.89 $ 355.09
Table 48 further explains the apportionment and programming of NHFP funds. In 2016 and 2017, no rail projects were authorized, so all NHFP funding was allocated to the Route 295/42/I-76, Direct Connect Contract 3 project. While the Penns Grove Secondary Siding Installation was originally programmed for 2017, it was not authorized until 2018. The Replacement of Bridge 3.08 in Conrail Passaic and Harsimus (P&H) line project is also programmed for 2018 and the remaining NHFP funds is programmed to Direct Connect project in 2018 which ensures that the plan remains fiscally constrained.
Future NHFP funding is currently allocated to the National Highway Freight Program from FY 2024-2027. As per the draft 2018 STIP, NHFP-HWY funds from 2023 to 2027 are currently programmed for the I-295/NJ 38 interchange as a placeholder and subject to change following the next update to the Plan.
The STIP is currently in DRAFT form and is expected to be approved on or before January 1, 2018. The above changes will not require MPO board approvals or amendments to the STIP. As future off-system rail projects are advanced for authorization (up to 10% of annual apportionment), they must be listed individually in an updated State Freight Plan.

New Jersey Statewide FREIGHT PLAN
208
Table 48: NHFP Apportionments for New Jersey and Fiscally Constrained Projects
NHFP Funding 2016 2017 2018 2019 2020 TotalApportionment $28,373,779 $25,970,823 $29,465,508 $33,988,112 $37,764,569 $155,562,791Obligated $28,373,779 $25,970,823 1,554,924 $55,899,526To Be Obligated $27,910,584 $33,988,112 $37,764,569 $99,663,265Carry Over $0 $0 $0
NHFP Projects (program code) 2016 2017 2018 2019 2020 TotalRoute 295/42/I-76, Direct Connection, Contract 3 (Z460) $28,373,779 $25,970,823 $26,660,584 $33,988,112 $114,993,298
Route 295/42/I-76, Direct Connection, Contract 4 (Z460) $37,764,569 $ 37,764,569
Penns Grove Secondary Siding Installation (Z470) $ 1,554,924 $ 1,554,924
Replacement of Bridge 3.08 in Conrail Passaic and Harsimus (P&H) line (Z470) $1,250,000 $ 1,250,000
Annual Totals $28,373,779 $25,970,823 $29,465,508 $33,988,112 $37,764,569Fast Act Total $155,562,791
* FY-16 through FY-18 (Apportionments shown based on FMISW10A Report) ** FY-19 & FY-20 (Advance Apportionments shown based on NHFP Federal Formula Guidance
Surface Transportation Program (STP)/ Surface Transportation Block Grant Program (STBG) The FAST Act converted STP to the STBG program which continues to provide funding to be used by the state or local municipalities to improve highways, bridges, tunnels, bicycle and pedestrian infrastructure and transit capital projects on the federal aid system. Eligibility for this program is highly flexible, including:
Construction, reconstruction, rehabilitation, resurfacing, restoration, preservation, or operational improvements for highways, including designated routes of the Appalachian Development Highway System (ADHS) and local access roads under 40 USC 14501.
Replacement, rehabilitation, preservation, protection, and anti-icing/deicing for bridges and tunnels on any public road, including construction or reconstruction necessary to accommodate other modes.
Construction of new bridges and tunnels on a Federal-aid highway. Inspection and evaluation of bridges, tunnels and other highway assets as well as training for
bridge and tunnel inspectors. Capital costs for transit projects eligible for assistance under chapter 53 of title 49, including
vehicles and facilities used to provide intercity passenger bus service. Carpool projects, fringe and corridor parking facilities and programs, including electric and
natural gas vehicle charging infrastructure, bicycle transportation and pedestrian walkways, and ADA sidewalk modification.
Highway and transit safety infrastructure improvements and programs, installation of safety barriers and nets on bridges, hazard eliminations, mitigation of hazards caused by wildlife, railway-highway grade crossings.
Highway and transit research, development, technology transfer. Capital and operating costs for traffic monitoring, management and control facilities and
programs, including advanced truck stop electrification. Surface transportation planning.

Chapter 7: INVESTMENT PLAN
209
Transportation alternatives --newly defined, includes most transportation enhancement eligibilities. [See separate “Transportation Alternatives” fact sheet]
Transportation control measures. Development and establishment of management systems. Environmental mitigation efforts (as under National Highway Performance Program). Intersections with high accident rates or levels of congestion. Infrastructure-based ITS capital improvements. Environmental restoration and pollution abatement. Control of noxious weeds and establishment of native species. Congestion pricing projects and strategies, including electric toll collection and travel demand
management strategies and programs. Recreational trails projects. Construction of ferry boats and terminals. Border infrastructure projects. Truck parking facilities. Development and implementation of State asset management plan for the NHS, and similar
activities related to the development and implementation of a performance based management program for other public roads.
Surface transportation infrastructure modifications within port terminal boundaries, only if necessary to facilitate direct intermodal interchange, transfer, and access into and out of the port.
Construction and operational improvements for a minor collector in the same corridor and in proximity to an NHS route if the improvement is more cost-effective (as determined by a benefit-cost analysis) than an NHS improvement and will enhance NHS level of service and regional traffic flow.
Two eligibilities formerly covered by the repealed Highway Bridge Program (HBP)— o Construction of a bridge that replaces a low water crossing of any length, a bridge that
was destroyed prior to January 1, 1965, a ferry that was in existence on January 1, 1984, or any road bridge rendered obsolete by a USACE flood control or channelization project and not rebuilt with USACE funds.
o Actions to preserve or reduce the impact of a project on the historic integrity of a historic bridge under specified conditions.
A State may use STBG funds to create and operate a State office to help design, implement, and oversee P3 eligible to receive Federal highway or transit funding, and to pay a stipend to unsuccessful P3 bidders in certain circumstances; and
At a State’s request, the USDOT may use the State’s STBG funding to pay the subsidy and administrative costs for TIFIA credit assistance for an eligible STBG project or group of projects.
Freight-related funding in the STIP from STP, in millions, by year is below:
2016 2017 2018 2019 2020 2021 2022-2027 TOTALSTP $ - $ 3.30 $ - $ - $ 11.65 $ 21.65 $ 14.94 $ 51.54
Although STP funding is widely used by the State for transportation projects, there are no current freight related projects programmed for 2016, 2018 or 2019 using STP funding.

New Jersey Statewide FREIGHT PLAN
210
Congestion Mitigation and Air Quality Improvement Program (CMAQ) CMAQ programs continue in the FAST Act to help meet requirements of the Clean Air Act. This program is used to reduce congestion and thereby improve air quality. Eligible projects include:
those likely to contribute to the attainment or maintenance of a national ambient air quality standard, with a high level of effectiveness in reducing air pollution
verified technologies for non-road vehicles and non-road engines that are used in port-related freight operations located in ozone, PM10, or PM2.5 nonattainment or maintenance areas
installation of vehicle-to-infrastructure communications equipment. electric vehicle and natural gas vehicle infrastructure projects to reduce fine particulate matter emissions in a PM2.5 nonattainment or maintenance area,
including: o diesel retrofits; o installation of diesel emission control technology on nonroad diesel equipment or on-road
diesel equipment that is operated on a highway construction projects; and o the most cost-effective projects to reduce emissions from port-related landside nonroad or
on- road equipment that is operated within the boundaries of the area.
Although CMAQ funding is widely used by the state for transportation projects, there are no current freight related projects programmed for 2016-2020 using CMAQ funding. Freight-related funding in the STIP from CMAQ, in millions, by year is below:
2016 2017 2018 2019 2020 2021 2022-2027 TOTALCMAQ $ 3.000 $ 27.900 $ 30.900
Highway Safety Improvement Program (HSIP) The goal of funding through HSIP is to achieve a significant reduction in traffic-related fatalities and injuries. There are many types of eligibility, but of significance to freight movement is the inclusion of projects for Truck parking facilities eligible for funding under section 1401 of the MAP–21. Currently, no projects in the STIP are funded by this program.
Railway Highway Crossings Program This program provides funds for safety improvements to reduce the number of fatalities, injuries, and crashes at public railway-highway grade crossings. It continues all prior program eligibilities, and now includes the relocation of highways to eliminate railway-highway grade crossings and projects at railway-highway grade crossings to eliminate hazards posed by blocked crossings due to idling trains. Currently, no projects in the STIP are funded by this program.
State Funding
Transportation Trust Fund State funding for transportation projects in New Jersey is derived from the state’s TTF. In FY 2016, TTF funds cover about 25% of transportation funding for the State. The original TTF was passed into law in 1984 and dedicates 2.5 cents per gallon of the motor fuel tax to transportation purposes. Several amendments occurred over the years, with the most recent in 2016 dedicating ALL revenue from motor fuels and petroleum products to transportation uses. The 2016 legislation included authorization of a TTF

Chapter 7: INVESTMENT PLAN
211
capital program of $16 billion over 8 years, a minimum appropriation of $25 million per FY for freight rail projects, and $28 million per year for the newly created Local Freight Impact Fund.
Constitutionally dedicated revenues include the Motor Fuels Tax, the Petroleum Products Gross Receipts Tax, and a portion of the Sales and Use Tax. According to the Transportation Trust Fund Authority (TTFA), as of 2016 legislation the revenue is received from the following sources:
Previously existing Motor Fuel Tax of 10.5 cents per gallon Petroleum Products, Gross Receipt Tax imposed on highway fuel of an additional 23 cents per
gallon Existing Petroleum Products Gross Receipts Tax imposed on gasoline, blended fuel that contains
gasoline, liquefied petroleum gas and aviation fuel of 4 cents per gallon. As of November 1, 2016, the total tax paid (from the bullets above) by the motorists at the pump
is 37.5 cents per gallon.
Statutorily dedicated revenues include "Good Driver" vehicle registration surcharge fees, heavy truck registration fees, and contractual contributions by the highway toll road authorities. However, unlike the constitutional dedication of revenues, the statutory dedication is not required by the Legislature. In any given year, the Legislature can choose to appropriate all, part, or none of the statutorily dedicated revenues.
Once the TTFA receives appropriations from the Legislature, it must first spend on current year debt service, then the remainder is left for transportation capital improvement projects. This is referred to as the pay-as-you-go" portion of the Transportation Trust Fund Program and may be supplemented with toll revenues authorized in the annual Appropriations Act. The flow of money is shown in Figure 99.
Freight-related funding in the STIP from TTF, in millions, by year is below:
2016 2017 2018 2019 2020 2021 2022-2027 TOTALSTATE $ 11.40 $ 10.05 $ 69.90 $ 60.70 $ 54.05 $ 61.17 $ 352.90 $ 620.17

New Jersey Statewide FREIGHT PLAN
212
Figure 99: Transportation Trust Fund Financing
Source: New Jersey Transportation Trust Fund Authority
Local Aid The TTF also provides $400 million annually to local governments for the funding of road, bridge and other transportation projects. For FY 2017-2024 the distribution is illustrated in Table 49.
Table 49: Local Aid Distribution (FY 2017-2024)
Fund Amount Municipal Aid $150 millionCounty Aid $150 millionLocal Bridges Fund $44 millionLocal Freight Impact Fund $28 millionLocal Aid Infrastructure Fund $7.5 millionTransportation Infrastructure Bank Fund $20.5 million
Municipal Aid includes road improvement projects such as resurfacing, rehabilitation or reconstruction and signalization. Projects involving bridge improvements, pedestrian safety improvements and bikeway improvements are also eligible to receive funds under Municipal Aid.

Chapter 7: INVESTMENT PLAN
213
County Aid cover roads and bridges under county jurisdiction. Public transportation and other transportation projects are also included.
The Local Bridges Fund provides funding for improvement on county bridges. Currently, the state focuses on preventive maintenance, rehabilitation and selective replacement of bridges.
The newly created Local Freight Impact Funds assists counties and municipalities with the impacts associated with the freight industry’s use of infrastructure. NJDOT will be taking applications from counties and municipalities to select projects for this fund. This program began receiving applications for FY 2018 in July 2017, and an applicant may submit up to two applications per fiscal year.71
Local Aid Infrastructure helps fund emergency and regional needs throughout the state at the county or municipal level.
The Transportation Infrastructure Bank Fund is used to provide financial assistance to public or private entities for the planning, acquisition, engineering, construction, reconstruction, repair, and rehabilitation of a transportation project or for any other purpose permitted under the federal program.
Other Sources Other funding is provided from other sources, including but not limited to, bi-state and autonomous authorities, private entities, and local governments.
Use of Funds New Jersey uses Federal and State funds for asset management, by pairing available funding to investment needs associated with maintaining those assets to a desired condition. The relative proportion of funding needed for various asset categories will vary from one year’s STIP to another. The project type categories that have been used to fund the freight portions of the STIP include:
Infrastructure Preservation – this may be classified as either road, bridge, or multimodal assets. Road preservation types include highway resurfacing, rehabilitation, or reconstruction. Bridge preservation includes rehabilitation and replacement, deck rehabilitation/replacement, or culverts.
Mobility and Congestion Relief – these are aimed at relieving congestion through highway operational improvements, major widenings, removing bottlenecks, and missing link projects.
Safety Management – these include projects that address safety as it relates to vehicle conflicts, weaving, acceleration/deceleration lanes, and intersection improvements, including those for bicycle and pedestrian users.
The sections below identify STIP projects (within each MPO region) located along the problem areas/bottlenecks identified in Chapter 6 of this plan. Identified STIP projects have been categorized into one of eight project types, based on the project description included within the STIP. Project types include:
71 The application for the Local Freight Impact Fund program is located here: https://njsagelegacy.intelligrants.com/Login.aspx?APPTHEME=NJSAGE

New Jersey Statewide FREIGHT PLAN
214
Bottleneck: Projects aimed at relieving congestion at decision points (ramp, signal, lane drop/add)
Bridge: State of good repair maintenance for structures, including but not limited to deck or superstructure replacement.
Capacity: Congestion-focused projects that increase roadway throughput through lane addition or bypass construction.
Drainage: Projects that address existing drainage/flooding concerns. ITS: Projects that are wholly focused on traffic operation and safety improvements through the
use of technology, including adaptive traffic control systems or real-time traffic monitoring and signage.
Operations: Projects aimed at improving geometric deficiencies, including substandard acceleration/deceleration lanes, tight turn radii, narrow cartway widths, or climbing lanes.
Pavement: State of good repair maintenance for roadways focused on resurfacing projects. Safety: Projects aimed at counteracting existing safety concerns at high crash locations.
Use of Funds - DVRPC Through the year 2027, DVRPC is expected to receive $976M in funding from various sources as shown in Table 50 and Figure 100.
Table 50: DVRPC Funding Sources
Source Amount ($M)NHFP-HWY $ 352.28NHFP-RAIL $ 1.56FHWA-HIGH PRIORITY $ 4.00 STATE $ 89.42 STP $ 24.94 CMAQ $ 30.90 OTHER $ 30.44NHPP $ 467.11 TOTAL (in millions) $ 976.19

Chapter 7: INVESTMENT PLAN
215
Figure 100: DVRPC Funding Sources
Table 51 includes a brief listing of the STIP projects receiving these funds. More detail on funding levels for each project can be found in Appendix F, and detailed project descriptions in Appendix E.
NHPP, 46.7%
NHFP-HWY, 35.2%
NHFP-RAIL, 0.2%
FHWA-HIGH PRIORITY, 0.4%
STATE, 8.9%
STP, 2.5%CMAQ, 3.1% OTHER, 3.0%

New Jersey Statewide FREIGHT PLAN
216
Table 51: STIP Projects along Freight Project Areas, DVRPC
County DBNUM Map ID Route Project name Project Type
Burlington 12415 8 US 130 Route 130, Charleston Road/Cooper Street (CR 630) to Crafts Creek Pavement
Burlington 12346A 1 US 130 Route 130, CR 545 (Farnsworth Avenue) Safety
Burlington 191A 11 I-295/NJ 38 Route 295/38 Missing Moves (Mount Laurel) Operations
Camden 11326A 22 I-76 Route 76, Bridges over Route 130 BridgeCamden 355D 14, 23 I-295 Route 295/42/I-76, Direct Connection, Contract 3 BottleneckCamden 355E 14, 23 I-295 Route 295/42/I-76, Direct Connection, Contract 4 ITS
Camden 14322 19 I-676 Route 676, Bridges over North Branch of Newton Creek Bridge
Camden 19 I-676 Ben Franklin Bridge Deck Resurfacing Pavement Camden 19 I-676 Ben Franklin Bridge Moveable Barrier Bridge Camden 19 I-676 Ben Franklin Bridge Masonry Rehabilitation Bridge
Camden 19 I-676 Ben Franklin Bridge Tower Expansion Joint Rehabilitation Bridge
Camden 11326 19, 22 I-76/I-676 Route 76/676 Bridge Deck Replacements Bridge
Camden D0902 20 River Rd River Road Improvements, Cramer Hill Operations Camden 11326A 22 I-76 Route 76, Bridges over Route 130 BridgeCamden, Gloucester 355A 16 NJ 42 Route 295/42, Missing Moves, Bellmawr Operations
Camden, Gloucester 14426 32 US 130 Route 130, Bridge over Big Timber Creek Bridge
Gloucester 14348 31 NJ 45 Route 45, Bridge over Woodbury Creek BridgeGloucester 12305 30 NJ 47 Route 47, Grove St. to Route 130, Pavement PavementGloucester 17378 rail Penns Grove Secondary Siding Installation RailGloucester, Camden 11371 30 NJ 47 Route 47, Bridge over Big Timber Creek Bridge
Gloucester, Salem 14363 269 NJ 45 Route 45, Main Street (CR672) to Chestnut Street PavementMercer 12406 307 US 1 Route 1, CR 533 (Quakerbridge Road) to Ridge Road PavementMercer 17419 307 US 1 Route 1, Alexander Road to Mapleton Road Bottleneck
Mercer 01330A 307 US 1 Route 1, Southbound, Nassau Park Boulevard to Quaker Bridge Mall Overpass Safety
Mercer 08355 306 NJ 31 Route 31, Bridge over CSX Railroad BridgeMercer 12401 34, 306 NJ 31 Route 31, Bull Run Road to Branch of Stoney Brook Pavement

Chapter 7: INVESTMENT PLAN
217
Use of Funds - NJTPA Through the year 2027, NJTPA is expected to receive $2.7B in funding from various sources as shown in Table 52 and Figure 101. The large amount of OTHER funding is attributable to $1B from other federal funds for the Route 440, Bayonne Bridge Navigational Clearance Project.
Table 52: NJTPA Funding Sources
Figure 101: NJTPA Funding Sources
Table 53 details a brief listing of the STIP projects receiving these funds. More detail on funding levels for each project can be found in Appendix F, and detailed project descriptions in Appendix E.
Source Amount ($M)NHPP $ 1,270.43NHFP-RAIL $ 1.25 STATE $ 272.75 STP $ 26.60 OTHER $ 1,082.75 TOTAL (in millions) $ 2,653.78

New Jersey Statewide FREIGHT PLAN
218
Table 53: STIP Projects along Freight Project Areas, NJTPA
County Map ID DBNUM Route Project name Project TypeBergen 65 11357 17 Route 17, Sprout Brook, Culvert Replacement Bridge
Bergen 49, 57 14319 17 Route 17, Bridges over NYS&W RR & RR Spur & Central Avenue (CR 44) Bridge
Bergen 51 12428 46 Route 46, Bergen Boulevard to Route 124 (Bergen Turnpike) Pavement
Bergen 70 065C 4 Route 4, Bridge over Palisade Avenue, Windsor Road and CSX Railroad Bridge
Bergen 40, 64, 70 12431B 4 Route 4, Tunbridge Road to Route 9W Pavement
Bergen, Passaic 40, 64, 70 12431 4 Route 4, Route 20 to Route 1&9 Pavement
Essex 79, 83 99381 21 Route 21, Newark Needs Analysis, Murray Street to
Edison Place Capacity
Essex N1709 rail Replacement of Bridge 3.08 in Conrail Passaic and Harsimus (P&H) line Rail
Essex 39, 106
I-95 Interchange 15W/ 16W Improvements Operations
Hudson 112 12386 3 Route 3 & Route 495 Interchange BridgeHudson 107 93186 7 Route 7, Kearny, Drainage Improvements Drainage
Hudson 95 N1301 440 Route 440, Bayonne Bridge Navigational Clearance Project Bridge
Hudson 113 06373 495 Route 495, Route 1&9/ Paterson Plank Road Bridge Bridge
Hudson 108 97005B 659 Portway, Fish House Road/Pennsylvania Avenue, CR 659 Pavement
Hunterdon 252 11353 173 Route 173, Musconetcong River, Culvert Replacement Bridge
Middlesex 143, 146 079A 9 Route 9/35, Main Street Interchange BottleneckMiddlesex 139 12434 27 Route 27, Bridge Street (CR 669) to Frederic Street Pavement
Middlesex 214 9169R 287 Route 287, River Road (CR 622), Interchange Improvements Operations
Middlesex 134, 145,
153 14355 440 Route 440 ,CR514 (Woodbridge Avenue) to Kreil Avenue Pavement
Middlesex, Somerset 214 9169Q 287 Route 287, Interchange 10 Ramp Improvements Operations
Middlesex, Union 237 10316A 27 Route 27 ADA Ramps, Evergreen St to Elizabeth River Safety
Monmouth 167 12308 35 Route 35, North of Lincoln Dr to Navesink River Bridge Pavement
Morris 183 93139 80 Route 80, Route 15 Interchange Bottleneck
Ocean 191 11418 9 Route 9, Indian Head Road to Central Ave/Hurley Ave, Pavement Pavement
Passaic 195 059B 3 Route 3, Route 46, Valley Road and Notch/Rifle Camp Road Interchange, Contract B Capacity
Passaic 202 06366C 46 Route 46, Route 23 (Pompton Avenue) to Route 20, ITS ITS
Passaic 71, 196, 200, 201 11341 80 Route 80 EB, Fairfield Road (CR 679) to Route 19 Pavement
Passaic 196 17316 80 Route 80, Bridge over Passaic River, Riverview Drive & Mc Bride Avenue Bridge

Chapter 7: INVESTMENT PLAN
219
County Map ID DBNUM Route Project name Project Type
Passaic, Bergen 44, 196,
198 11415 80 Route 80 WB, McBride Avenue (CR 639) to Polify Road (CR 55) Pavement
Passaic, Essex 71, 201 9233B6 80 Route 23, Route 80 and Route 46 Interchange CapacitySomerset 210 14356 22 Route 22, Commons Way to Route 287 Pavement
Somerset 211 779 206 Route 206 Bypass, Mountain View Road to Old Somerville Road (Sections 14A & 15A) Contract B Capacity
Somerset 211 780A 206 Route 206, Valley Road to Brown Avenue CapacitySomerset 211 780B 206 Route 206, Doctors Way to Valley Road Capacity
Somerset 205 04389 287 Route 287/78, I-287/202/206 Interchange Improvements Bottleneck
Sussex 216 10333 206 Route 206, South of Paterson Ave. to South of Pine Rd Pavement
Union 224 658C 22 Route 22, Bloy Street to Liberty Avenue BridgeUnion 219 12311 1/9 Route 1&9, Avenue C to Sylvan Street SafetyUnion 78 95023 1/9 Route 1&9, Interchange at Route I�278 CapacityUnion, Essex 223 15371 27 Route 27, Dehart Place to Route 21 PavementWarren 252 09320 173 Route 173, Bridge over Pohatcong Creek BridgeMercer, Middlesex 127 11309 130 Route 130, Westfield Ave. to Main Street Pavement
Use of Funds - SJTPO Through the year 2027, SJTPO is expected to receive $11M in funding from just one source as shown in Table 54.
Table 54: SJTPO Funding Sources
Table 55 details a brief listing of the STIP projects receiving these funds. More detail on funding levels for each project can be found in Appendix F, and detailed project descriptions in Appendix E.
Table 55: STIP Projects along Freight Project Areas, SJTPO
County Map ID DBNUM Route Project name Project Type
Cumberland 258 11343A 55 Route 55, SB Schooner Landing Road to Sherman Avenue Pavement
Salem 263, 268, 267 04308 40 Route 40, Woodstown Intersection Improvements Safety
Use of Funds – Statewide
Statewide In the draft STIP, the National Freight (DBNUM X34) and New Jersey Rail Freight Assistance (DBNUM X34A) Programs are allocated nearly $300M in total over the next 10 years statewide. $250M of these funds come from the TTF annual $25M allocation for freight rail projects. Going forward, the New Jersey Rail Freight Assistance Program is proposed to be renamed to cover the off-system rail projects, as placing
Source Amount ($M)NHPP $ 11.03 TOTAL (in millions) $ 11.03

New Jersey Statewide FREIGHT PLAN
220
them in DBNUM X34A resulted in duplication of funding. During the Draft STIP revision, the 2018 NHFP funds allocated to DBNUM X34A will be moved to the individual off-system rail projects, and state funds will be moved to avoid duplication.