Embed Size (px)
Citation preview

Medicare Advantage: A Provider-Sponsored Insurance Opportunity
May 18, 2018
New Jersey Hospital Association

Agenda
I. Introduction to ECGII. Medicare Advantage (MA): an Overview
III. The US and New Jersey MA MarketsIV. Why Consider an MA Plan? V. Obtaining a CMS MA Contract
VI. The MA Funding ProcessVII. Key Factors in Success
VIII. Summary
10100.010\454486(pptx)-E2 DD 5-18-18

2
I. Introduction to ECG
0100.010\454486(pptx)-E2 DD 5-18-18

I. Introduction to ECGThe Presenter and Representative Clients
0100.010\454486(pptx)-E2 DD 5-18-18
Rich TrembowiczAssociate Principal
Insurance Services Lead
Representative Clients
Awarded 2018 Best in KLAS Overall Healthcare Management Consulting Firm
3
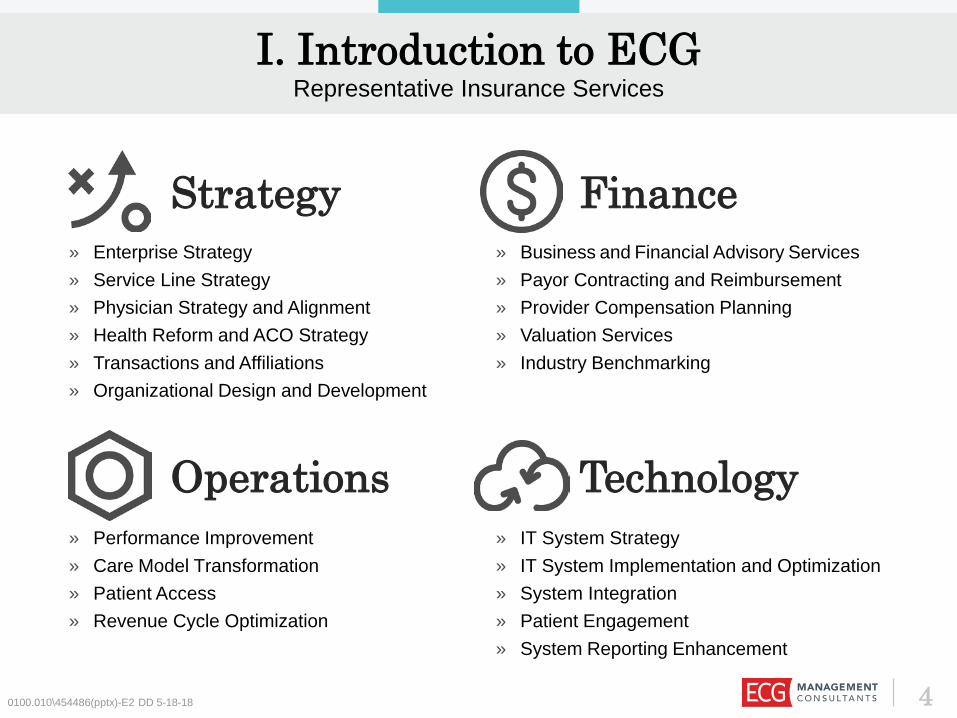
I. Introduction to ECGRepresentative Insurance Services
0100.010\454486(pptx)-E2 DD 5-18-18 4
Strategy
Operations
Finance
Technology
» Enterprise Strategy» Service Line Strategy» Physician Strategy and Alignment» Health Reform and ACO Strategy» Transactions and Affiliations» Organizational Design and Development
» Business and Financial Advisory Services» Payor Contracting and Reimbursement» Provider Compensation Planning» Valuation Services» Industry Benchmarking
» Performance Improvement» Care Model Transformation» Patient Access» Revenue Cycle Optimization
» IT System Strategy» IT System Implementation and Optimization» System Integration» Patient Engagement» System Reporting Enhancement

5
II. MA: An Overview
0100.010\454486(pptx)-E2 DD 5-18-18

II. MA: An OverviewProgram History and Milestones
CMS has more than a 35-year history of managing private health plan coverage of Medicare beneficiaries as an alternative to original Medicare.
Program Year Description Medicare Coordinated Care Plans
1982 TEFRA enabled HMOs to contract with CMS to offer Medicare coverage.
Medicare+Choice (M+C) 1997 BBA expanded the organizations that could contract with CMS to offer Medicare coverage.
M+C: Risk Adjustment 2000 Risk adjustment phase-in started for M+C plans, with a phase-in schedule for dual demonstrations.
Medicare Part D 2003 MMA introduced the stand-alone prescription drug benefit (or integrated with Medicare Part C).
Medicare Part C and Employer Group Waiver Plans (EGWPs)
2003 M+C was renamed MA (Part C) and EGWPs were introduced to enable employers to transition retirees to this form of plan.
Medicare Part C 2010 ACA introduced the MLR (85%) and instituted programs to narrow the cost difference between Part C and Parts A and B benefits.
0100.010\454486(pptx)-E2 DD 5-18-18 6

II. MA: An OverviewPlan Designs
CMS recognizes a number of plan designs, each of which is subject to a separate contract and may have a different payment methodology.
Plan Types Description CCP: HMO/HMO POS Plan1
A plan with covered services, other than ED services, available only from a closed network of providers
CCP: PPO and RPPO Plan1
A plan where a member can obtain services (1) in network, or (2) out of network at a higher cost (“R” is multistate)
CCP: Special Needs Plan (SNP)1
A plan that serves: (1) institutionalized members, (2) dual-eligible members, or (3) members with designated chronic conditions (HIV, diabetes, CHF, ESRD, dementia)
EGWP A plan offered by an employer to its Medicare-eligible retireesPrivate Fee-for-Service (FFS) Plan
A plan that sets FFS payment rates and establishes a provider network that agrees to accept the rates (nonparticipating providers can elect to treat members)
Section 1876 Cost Plan (no longer available as a new plan)
A plan where a member can obtain services from an in-network provider, which is paid at reasonable cost, or any Medicare participating provider (paid Medicare FFS)
1 A CCP must offer at least one plan with an integrated Part D drug benefit throughout its service area in the state.
0100.010\454486(pptx)-E2 DD 5-18-18 7

III. The US and New Jersey MA Markets
0100.010\454486(pptx)-E2 DD 5-18-18 8

III. The US and New Jersey MA Markets MA-Penetrated Markets
The US MA penetration rate is 34.2%, while the New Jersey penetration rate is 22.4% for April 2018.
There are opportunities to expand the MA market across New Jersey.
Source: http://cms.gov.
0100.010\454486(pptx)-E2 DD 5-18-18 9
56.5%
43.7%
42.9%
42.8%
37.9% 33.6%
37.0%
18.6%
16.4%
14.2%
20.1%
17.7%17.8%
31.0%
31.3%
35.1%
35.5%
3.7%
36.0%
19.1%
32.7%
23.1%
34.3%
17.9% 38.0% 35.9%
26.7%
33.2%37.2%
29.8%
24.9% 28.5%
18.9%31.1%
40.3%11.6%
40.8% 22.4%
34.5%
40.1% 39.0%39.3%
23.0%
12.2%
30.3%
41.5%
ALASKA37.9%
HAWAII44.9%
13.9%
27.8%
18.9%
15.7% 16.3%30.7%
31.7%
27.8%
17.3%
22.1%
18.0%
29.0%17.5%
23.0%
23.0%21.6%
21.5%
15.4%
18.2%
21.9%
13.9%
Penetration Rate 13.9% 22.14% 31.7%Penetration Rate 1.1% 28.5% 56.5%

III. The US and New Jersey MA MarketsThe Penetrated Market Trend
MA continues to capture an increasing share of the available Medicare-eligible market.
Many project MA growing to 40%–45% of Medicare eligibles by 2027.
0100.010\454486(pptx)-E2 DD 5-18-18 10
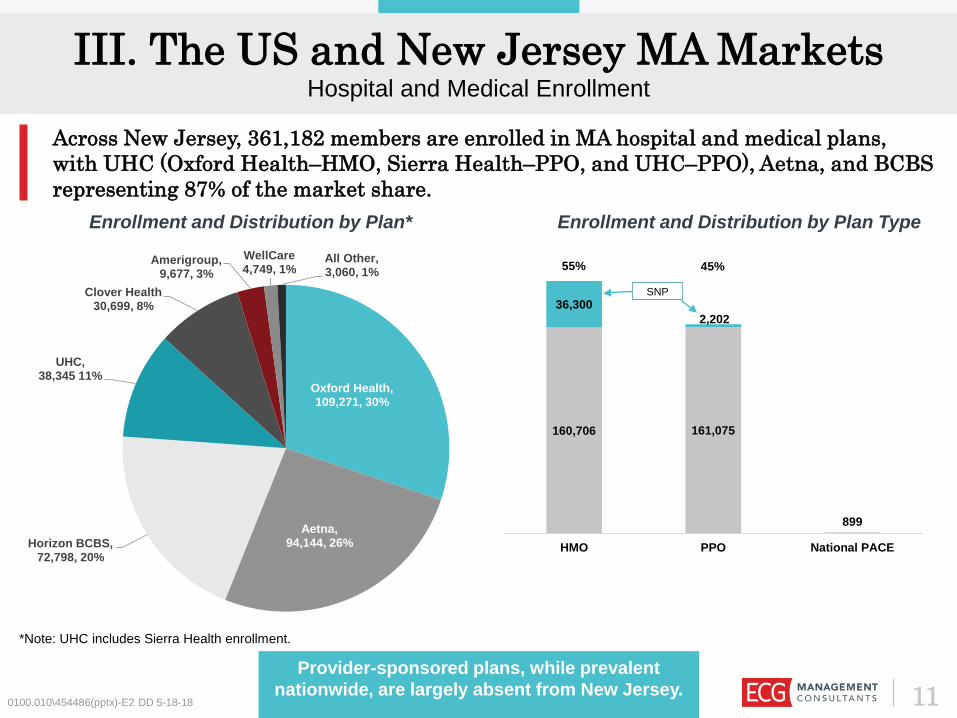
III. The US and New Jersey MA MarketsHospital and Medical Enrollment
Across New Jersey, 361,182 members are enrolled in MA hospital and medical plans, with UHC (Oxford Health–HMO, Sierra Health–PPO, and UHC–PPO), Aetna, and BCBS representing 87% of the market share.
Provider-sponsored plans, while prevalent nationwide, are largely absent from New Jersey.
*Note: UHC includes Sierra Health enrollment.
Enrollment and Distribution by Plan Type
160,706 161,075
899
36,3002,202
HMO PPO National PACE
SNP
55% 45%
0100.010\454486(pptx)-E2 DD 5-18-18 11
Enrollment and Distribution by Plan*
Oxford Health,109,271, 30%
Aetna,94,144, 26%Horizon BCBS,
72,798, 20%
UHC,38,345 11%
Clover Health30,699, 8%
Amerigroup,9,677, 3%
WellCare4,749, 1%
All Other,3,060, 1%
IV. Why Consider an MA Plan?
0100.010\454486(pptx)-E2 DD 5-18-18 12
0100.010\454486(pptx)-E2 DD 5-18-18
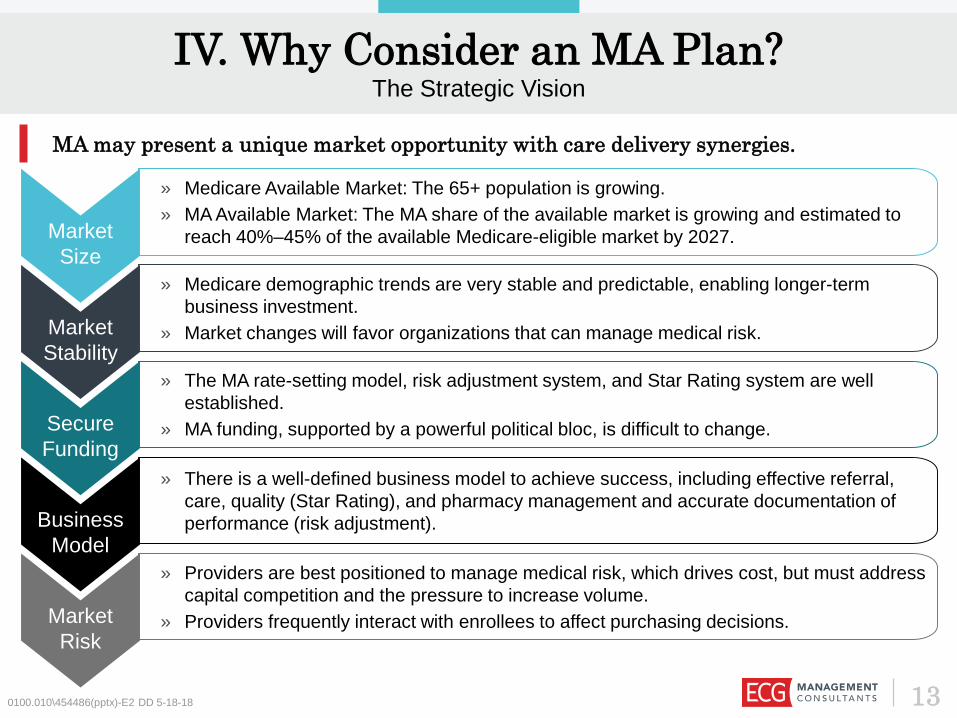
Market Size
» Medicare Available Market: The 65+ population is growing. » MA Available Market: The MA share of the available market is growing and estimated to
reach 40%–45% of the available Medicare-eligible market by 2027.
Market Stability
» Medicare demographic trends are very stable and predictable, enabling longer-term business investment.
» Market changes will favor organizations that can manage medical risk.
Secure Funding
» The MA rate-setting model, risk adjustment system, and Star Rating system are well established.
» MA funding, supported by a powerful political bloc, is difficult to change.
Business Model
» There is a well-defined business model to achieve success, including effective referral, care, quality (Star Rating), and pharmacy management and accurate documentation of performance (risk adjustment).
MA may present a unique market opportunity with care delivery synergies.
IV. Why Consider an MA Plan?The Strategic Vision
Market Risk
» Providers are best positioned to manage medical risk, which drives cost, but must address capital competition and the pressure to increase volume.
» Providers frequently interact with enrollees to affect purchasing decisions.
13
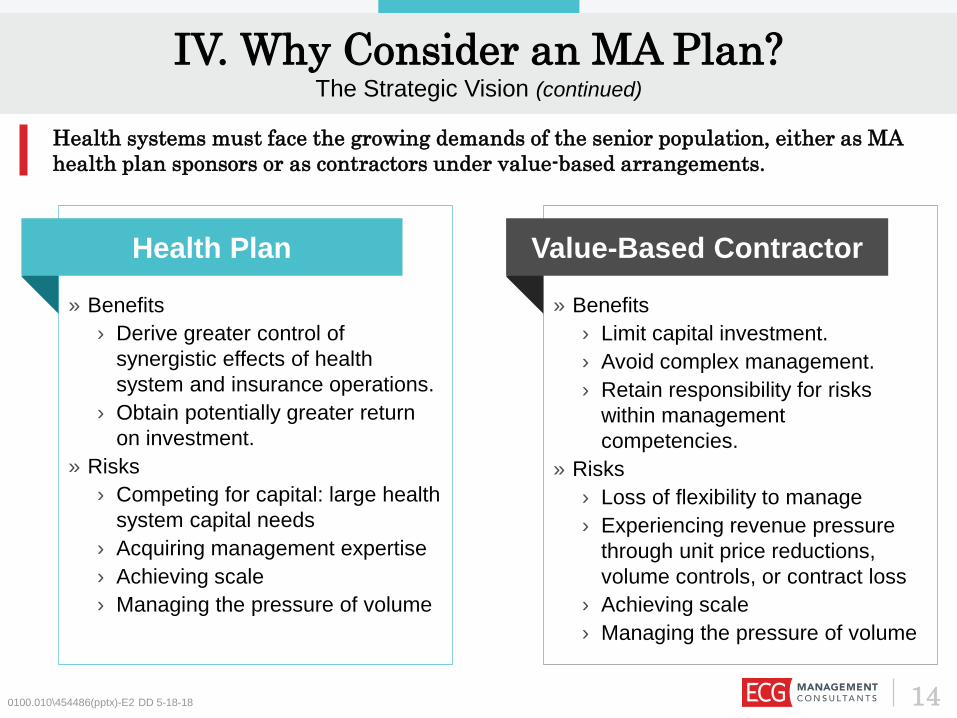
IV. Why Consider an MA Plan?The Strategic Vision (continued)
0100.010\454486(pptx)-E2 DD 5-18-18
» Benefits› Derive greater control of
synergistic effects of health system and insurance operations.
› Obtain potentially greater return on investment.
» Risks› Competing for capital: large health
system capital needs› Acquiring management expertise › Achieving scale› Managing the pressure of volume
Health Plan
» Benefits› Limit capital investment.› Avoid complex management.› Retain responsibility for risks
within management competencies.
» Risks› Loss of flexibility to manage › Experiencing revenue pressure
through unit price reductions, volume controls, or contract loss
› Achieving scale› Managing the pressure of volume
Value-Based Contractor
Health systems must face the growing demands of the senior population, either as MA health plan sponsors or as contractors under value-based arrangements.
14

IV. Why Consider an MA Plan?The Strategic Vision (continued)
Successful health system–health plan sponsors must continually challenge performance in care delivery and health insurance businesses, especially concerning reduction of low-value volume.
Successful plans continually build on the synergies of achieving efficiencies in care delivery, which reduce premiums and attract more members (i.e., volume).
Health System
Health Plan
» Gain unit price efficiencies.
» Eliminate low-value volume.
» Issue competitive premium, high-value plans.
» Develop market-valued plans with member engagement features.
» Develop systems to manage units of service and members.
» Use actionable information and tools to manage referrals, care, and quality day to day.
» Market and sell to increase members.
» Convert data to actionable information.
» Provide scalable processes and tools to support provider care management (CM).
0100.010\454486(pptx)-E2 DD 5-18-18 15

V. Obtaining a CMS MA Contract
0100.010\454486(pptx)-E2 DD 5-18-18 16

V. Obtaining a CMS MA ContractKey Approximate Dates and Milestones for the 2020 MA Application
2 3Date ActivityNovember 15, 2018 (approximate)
Submit Notice of Intent to Apply to CMS to ensure access to Health Plan Management System (HPMS) by the date applications are released.
First Friday in December 2019 CMS User ID form is due to CMS.
January 10, 2019 Final applications are posted by CMS.
January 26, 2019 NOIA form must be submitted to CMS.
February 14, 2019 Completed applications are due to CMS (including service area and partial county).
April 2019 Plan Creation module, Plan Benefit Package (PBP), and Bid Pricing Tool (BPT) are available on HPMS.
May 3, 2019 (approximate) PBP/BPT Upload Module is available on HPMS.
May 13, 2019 CY 2019 Formulary Submission Module is released.
June 3, 2019 (approximate) Bids are due to CMS.
Late August 2019 CMS completes review and approval of bid data.
September 2019 CMS executes MA and MA-PD contracts with organizations whose bids are approved and that otherwise meet CMS requirements.
Mid-October 2019 Annual Coordinated Election Period begins for CY 2019 plans.
Medicare has a well-defined process and milestones to obtain a CMS MA contract.
0100.010\454486(pptx)-E2 DD 5-18-18 17

V. Obtaining a CMS MA ContractKey Elements of the MA Application
CorporateOrganization Management
Licensure
Reporting
QualityStar Rating
UM/CMQIP
Appeals
FinanceSolvency
Bid PricingEligibilityPayment
Plan Benefits
Service AreaFormulary
Claims ProcessingTPL/Fraud
AccessMarketing
Provider Contracts
andNetwork
AdequacySNPsMedicaid Contract
0100.010\454486(pptx)-E2 DD 5-18-18 18
Operations
Compliance
The MA plan sponsor must demonstrate wide-ranging operational
competencies to secure an MA contract.
VI. The MA Funding Process
0100.010\454486(pptx)-E2 DD 5-18-18 19

VI. The MA Funding ProcessMA Plan Development Will Require $35 Million–$60 Million of Start-Up Capital
0100.010\454486(pptx)-E2 DD 5-18-18
Capital Medical Risk Scale
» A new plan requires $35 million–$60 million in capital, depending on the size of the service area and number of products launched.
» Minimize capital requirements by taking advantage of the synergies of the health insurance and care delivery businesses.
» With 85%–87% of premium devoted to medical cost, there is no substitute for effective medical cost management.
» A comprehensive program requires:› Risk stratification.› Referral management.› Utilization management
(UM).› CM.› Value-based incentives.
» An MA plan achieves actuarial credibility as to its medical budget with 15,000 members.
» Fast member growth can reduce working capital requirements.
» One option to achieve fast scale is to develop partnerships with other providers to quickly gain market share.
Successful plans have sufficient capital to support launch, demonstrate ability to manage medical risk before seeking growth, and have a clear growth plan.
Launch Perform Grow
20

VI. The MA Funding ProcessSubstantial Funding Is Entering the Market, but There Is Considerable Risk
0100.010\454486(pptx)-E2 DD 5-18-18
Founded by the Bush family (athenahealth), Devoted Health recently closed a $62 million round of funding. The focus is on a caring approach, technological simplification, and high-
performing providers. Plans launch in 2019.
Clover integrates technology into all aspects of care and targets a low price point, with $0-premium plans, $0-copay PCP visits, and $0 generic drugs. Clover has approximately
30,000 members in New Jersey and is expanding to Georgia, Pennsylvania, and Texas. It has raised $425 million.
21
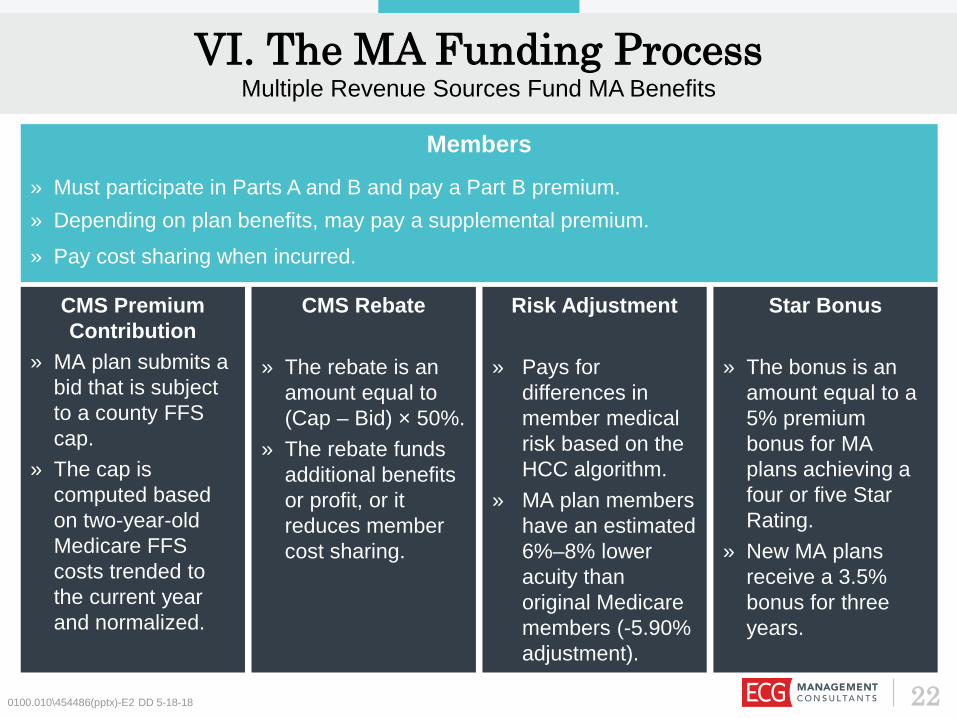
CMS Premium Contribution
» MA plan submits a bid that is subject to a county FFS cap.
» The cap is computed based on two-year-old Medicare FFS costs trended to the current year and normalized.
CMS Rebate
» The rebate is an amount equal to (Cap – Bid) × 50%.
» The rebate funds additional benefits or profit, or it reduces member cost sharing.
Risk Adjustment
» Pays for differences in member medical risk based on the HCC algorithm.
» MA plan members have an estimated 6%–8% lower acuity than original Medicare members (-5.90% adjustment).
Star Bonus
» The bonus is an amount equal to a 5% premium bonus for MA plans achieving a four or five Star Rating.
» New MA plans receive a 3.5% bonus for three years.
VI. The MA Funding ProcessMultiple Revenue Sources Fund MA Benefits
0100.010\454486(pptx)-E2 DD 5-18-18
Members» Must participate in Parts A and B and pay a Part B premium.» Depending on plan benefits, may pay a supplemental premium.» Pay cost sharing when incurred.
22

VII. Key Factors in Success
0100.010\454486(pptx)-E2 DD 5-18-18 23

VII. Key Factors in SuccessRecruit an Experienced Management Team
240100.010\454486(pptx)-E2 DD 5-18-18
Be prepared to respond quickly to challenges. There will be many choices and decisions; time is not an ally.
A seasoned board that challenges leadership to excel is invaluable. Recruit board members with insurance experience.
Medicare is very complex and subjectto constant tinkering. The team must be adept at staying abreast of changes and adjusting strategy.
“We’re in healthcare . . . How hard can it be?”
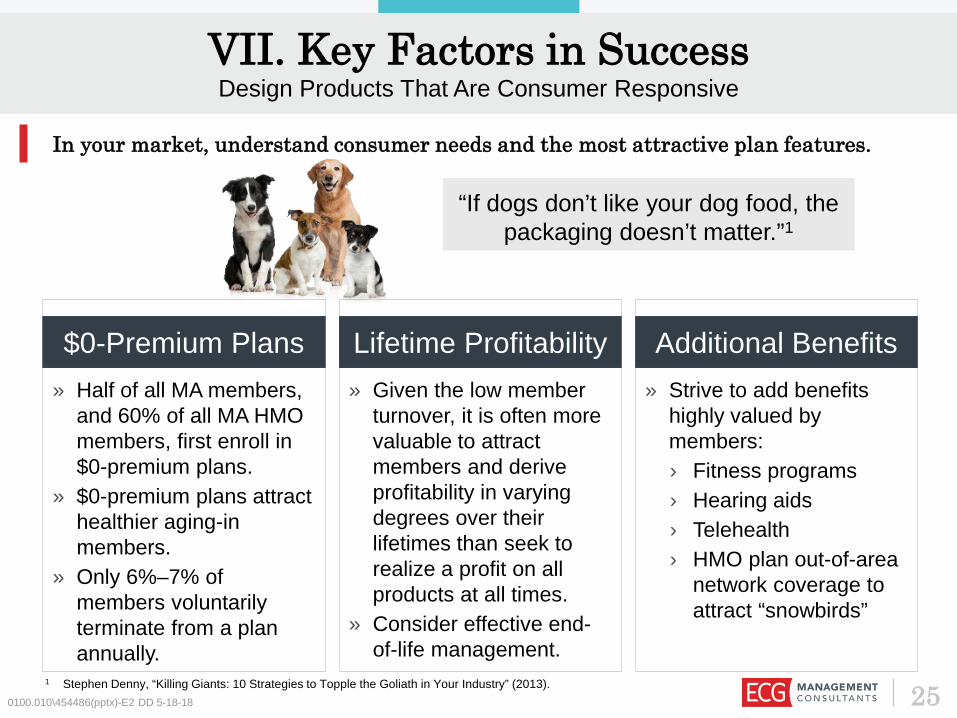
» Given the low member turnover, it is often more valuable to attract members and derive profitability in varying degrees over their lifetimes than seek to realize a profit on all products at all times.
» Consider effective end-of-life management.
» Strive to add benefits highly valued by members:› Fitness programs› Hearing aids› Telehealth› HMO plan out-of-area
network coverage to attract “snowbirds”
VII. Key Factors in SuccessDesign Products That Are Consumer Responsive
0100.010\454486(pptx)-E2 DD 5-18-18
» Half of all MA members, and 60% of all MA HMO members, first enroll in $0-premium plans.
» $0-premium plans attract healthier aging-in members.
» Only 6%–7% of members voluntarily terminate from a plan annually.
$0-Premium Plans Lifetime Profitability Additional Benefits
In your market, understand consumer needs and the most attractive plan features.
“If dogs don’t like your dog food, the packaging doesn’t matter.”1
1 Stephen Denny, “Killing Giants: 10 Strategies to Topple the Goliath in Your Industry” (2013). 25
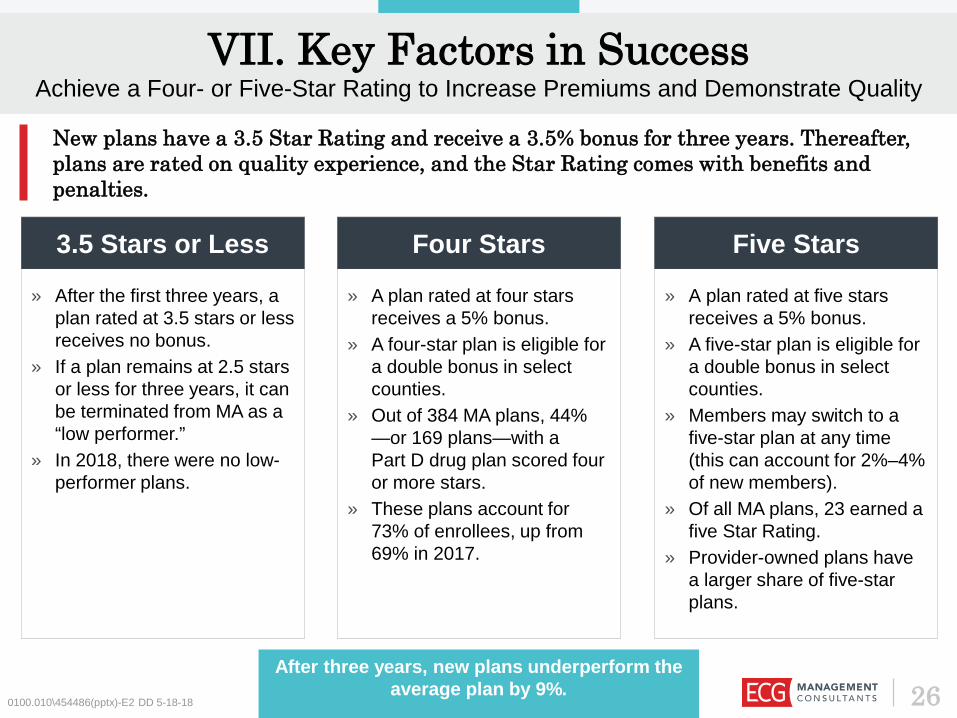
» A plan rated at four stars receives a 5% bonus.
» A four-star plan is eligible for a double bonus in select counties.
» Out of 384 MA plans, 44% —or 169 plans—with a Part D drug plan scored four or more stars.
» These plans account for 73% of enrollees, up from 69% in 2017.
» A plan rated at five stars receives a 5% bonus.
» A five-star plan is eligible for a double bonus in select counties.
» Members may switch to a five-star plan at any time (this can account for 2%–4% of new members).
» Of all MA plans, 23 earned a five Star Rating.
» Provider-owned plans have a larger share of five-star plans.
0100.010\454486(pptx)-E2 DD 5-18-18
» After the first three years, a plan rated at 3.5 stars or less receives no bonus.
» If a plan remains at 2.5 stars or less for three years, it can be terminated from MA as a “low performer.”
» In 2018, there were no low-performer plans.
3.5 Stars or Less Four Stars Five Stars
VII. Key Factors in SuccessAchieve a Four- or Five-Star Rating to Increase Premiums and Demonstrate Quality
New plans have a 3.5 Star Rating and receive a 3.5% bonus for three years. Thereafter, plans are rated on quality experience, and the Star Rating comes with benefits and penalties.
26After three years, new plans underperform the
average plan by 9%.

0100.010\454486(pptx)-E2 DD 5-18-18
Chronic Disease Management Staying Healthy
Plan Customer Service
Member Complaints and
QIP
Member Plan
Experience
The Five Domains for
Part C Medical Plans
» Medication review» Pain review» Functional review» Osteoporosis» Diabetes–eye exam» Diabetes–kidney» Diabetes–A1c» Arthritis» Bladder control» Risk of falling» Plan all-cause
readmission
» Breast cancer screening» Colorectal cancer
screening» Flu vaccine» Improved physical health» Improved mental health» Monitoring activity» Adult BMI
» Time to appeal decisions
» Reviewing appeal decisions
» Call center–interpreter and TTY
» Getting care» Fast appointments» Customer service» Health plan quality» Health plan care
coordination
» Complaints» Leaving the plan» Beneficiary access » Quality improvement plan
VII. Key Factors in SuccessThere Are Separate Star Ratings for Medical and Drug Plans
Part C medical services are evaluated across five domains.
27

Member Experience» Drug plan rating» Getting needed drugs
Title» MPF pricing accuracy» Medication adherence–diabetes» Medication adherence–hypertension» Medication adherence–cholesterol» MTM completion rate
Plan Customer Service» Call center–interpreter and TTY» Appeals auto-forward» Appeals upheld
0100.010\454486(pptx)-E2 DD 5-18-18
Member Complaints» Member plan complaints» Leaving the plan» Member access» Quality improvement plan
Drug Safety and Pricing Accuracy
Member Complaints
and Plan Performance
Member Experience with Plan
Plan Customer
Service
The Four Domains for Part D
Drug Plans
VII. Key Factors in SuccessThere Are Separate Star Ratings For Medical and Drug Plans (continued)
Part D drug services are evaluated across four domains.
28

0100.010\454486(pptx)-E2 DD 5-18-18
CMS is in the middle of a risk adjustment methodology transition, shifting to a system that reprices claims under Medicare FFS rules and eliminates multiple HCC counts.
Plans must be prepared to track the performance of every member to understand the differences in risk scores resulting from
RAPS and EDS.
EDS-RAPS Risk Score Difference: PY 2016–December 2016
Plan type 20th 40th 50th 60th 80thAll plans -7.2% -4.8% -4.0% -3.4% -2.6%
SNPs -8.4% -6.6% -5.1% -4.7% -3.1%
General enrollment -6.8% -4.2% -3.8% -3.2% -2.5%
Source: Milliman.com.
Plan type 20th 40th 50th 60th 80thAll plans -6.2% -3.3% -2.5% -2.0% -0.8%
SNPs -5.6% -2.5% -2.2% -1.8% -0.6%
General enrollment -6.6% -5.6% -5.2% -3.2% -1.7%
12% of members have higher RAPS risk scores.
9% of members have higher RAPS risk scores.
EDS-RAPS Risk Score Difference: PY 2017–December 2017
VII. Key Factors in SuccessRisk Adjustment: Understand the RAPS to EDS Transition
29

VII. Key Factors in SuccessRisk Adjustment: More Factors Affecting Patient Care
CMS analysis indicated that dual-eligible plans require finer segmentation to allow a more accurate calculation of predicted costs and improve payment accuracy.
2014 Model 2017 Revised ModelTwo full-risk segments:» Institutional» Community
Seven full-risk segments:» Institutional» Community: Full benefit dual aged» Community: Full benefit dual disabled» Community: Partial benefit dual aged» Community: Partial benefit dual disabled» Community: Non-dual aged» Community: Non-dual disabled
Dual status for full-risk beneficiaries identified in base year
Dual status for full-risk beneficiaries identified in payment year
79 HCCs Same HCCs as 2014 model
The adjustments shift more funding into the D-SNP population, with funding amounts better
aligned to member cost.0100.010\454486(pptx)-E2 DD 5-18-18 30

310100.010\454486(pptx)-E2 DD 5-18-18
VII. Key Factors in SuccessPharmacy Manages Chronic Conditions but Can Lead to Conflicts
Pharmacy helps reduce cost through effective management of chronic conditions and medical cost avoidance due to medication-condition conflicts. As complex patients transition to poly-pharmacy, it is essential to manage medical drug spend.
» Promote early diagnosis of chronic conditions.
» Adopt medication adherence strategies.
» Deliver POC analytics.
Chronic Management and
Adherence
» As medical conditions progress, manage poly-pharmacy.
» Use MTM to avoid conflicts.
Medication-Condition Conflict
and MTM » There is an explosion of new biologic drugs in the hospital setting.
» Manage site of service.
Medical Drug Spend
Many seniors start with chronic conditions that increase in complexity.
With complex conditions requiring greater hospital use, manage medical drug spend.

320100.010\454486(pptx)-E2 DD 5-18-18
Clinical
FinancialProvidersInsurers
Members
» Must be engaged in order to manage care and wisely use services.
» Are motivated by financial incentives or physician relationships to change behaviors.
Providers
» Develop CINs of high-performing providers; shared savings full risk.
» Align provider incentive distribution to encourage performance.
Insurance Services» Insurers support data collection and
conversion of data to actionable information in near real time (BI/analytics).
» Insurers provide UM and CM planning and oversight.
Insurers
» Embrace value-based payment principles in provider contracts: quality and surplus bonuses.
» Design products to encourage member care participation, adherence, and in-network services use.
» Provide PHM support but limited day-to-day CM.
Payor Policy» Payors adopt funding policies
that reward value-based care.» Payor-insurer contracts
incorporate value-based principles.
Payors
» Pay the majority of health coverage costs.
» Establish business rules that affect insurers, providers, and members.
Payors Members
Care Delivery» Providers depend on payors/insurers for actionable
information and to orchestrate CM.» Providers execute day-to-day CM and clinical coordination
through referral management.» Providers are rewarded for quality and value-based care.
VII. Key Factors in SuccessAdopt Provider Contracts That Align Clinical and Financial Interests

» Define the network of high-performing providers by medical condition or procedure.
» Manage referrals to the least-expensive qualified caregiver in an appropriate setting.
» Continuously assess and reward performance (financial incentives, gold carding).
» Drive care efficiency in every setting:› Weekend/evening
discharges› Complete discharge plan› Engaged family members
» Postdischarge care has high cost variability: know your network and create clear expectations.
0100.010\454486(pptx)-E2 DD 5-18-18
» Identify services with high risk of low value:› High-cost imaging› Inpatient services where
outpatient alternatives are available
› Repeat diagnostics» Reward high performers
through waivers.
Prior Authorization Referral Management Concurrent Review
Value-based care is provided by the least-expensive qualified caregiver in the lowest-cost setting appropriate to the patient’s medical condition. Day to day, the lowest-cost qualified caregiver is the patient.
VII. Key Factors in SuccessEffective UM Promotes a High-Value Culture
33

» Use historical data and HRAs to identify the highest risks and most impactable cases.» Engage members and PCPs to commence CM.
Risk Stratification
VII. Key Factors in SuccessCM Delivers Superior Outcomes with an Exceptional Member Experience
340100.010\454486(pptx)-E2 DD 5-18-18
» Have dedicated staff manage high-cost cases.» Develop a limited set of diagnosis-specific care models.» Understand provider readiness for VBAs and CM.» Consider CM stipends to support provider CM.
High-Cost Case
Management
» Identify impactable cases.» Manage transitions effectively.» Expand transition to home, and engage family members where possible (low-cost qualified
caregivers).
Transitions of Care
» Develop the plan for data collection: what data is important?» Convert data into actionable information, and inject it into the physician workflow to manage
care in real time: prescriptions, gaps in care, missing diagnoses (risk adjustment).» Measure and report performance with peer comparisons to change patterns.
Provide Actionable Information
For young plans, CM should focus on high-cost and impactable cases and effective transitions of care.

Summary
350100.010\454486(pptx)-E2 DD 5-18-18
“Insurance is an easy business. You collect a premium, pay claims, and have a profit . . . There a just a million ways to
screw it up.”
Secure experienced leadership that will foster collaboration across the insurance and care delivery businesses.
Develop a high-value culture that constructively challenges everything you do and rewards performance.
Use capital wisely.
Measure, assess, and learn every day. Don’t be afraid to admit that something isn’t working, and nimbly pivot to
new solutions.

0100.010\454486(pptx)-E2 DD 5-18-18
Questions & Discussion
36
Contact ECGRich Trembowicz Alan Tannous100 Cambridge Street 3030 Clarendon BoulevardSuite 2001 Suite 600Boston, MA 02114 Arlington, VA 22201P: 617.227.0100 P: 703-522-8450E: [email protected] E: [email protected]
0100.010\454486(pptx)-E2 DD 5-18-18 37