Embed Size (px)
Citation preview

New insight into Acyclovir Renal Handling
and Nephrotoxicity
by
Patrina Francia Gunness
A thesis submitted in conformity with the requirements
for the degree of Doctor of Philosophy
Graduate Department of Pharmaceutical Sciences
University of Toronto
© Copyright by Patrina Francia Gunness 2011

ii
New insight into Acyclovir Renal Handling and Nephrotoxicity
Patrina Francia Gunness
Doctor of Philosophy
Graduate Department of Pharmaceutical Sciences
University of Toronto
2011
Abstract
Drug – induced nephrotoxicity is a serious adverse reaction that can have deleterious effects on
a patient’s health and well-being. Acyclovir is an example of such an agent that causes the
aforesaid effects. The drug induces severe nephrotoxicity in patients. The etiology of acyclovir
– induced nephrotoxicity has not been fully elucidated. The overall objective of this thesis is to
gain new insight into the pathogenesis of acyclovir – induced nephrotoxicity.
Cytotoxicity studies showed that acyclovir induced human renal proximal tubular (HK-2) cell
death, in vitro, and that the degree of this toxicity was significantly reduced by co-exposure to 4-
methylpyrazole. The results suggest that acyclovir induces direct insult to human renal
proximal tubular cells and the toxicity may be caused by the parent drug’s noxious acyclovir
aldehyde metabolite.
Transepithelial transport studies illustrated that acyclovir does not inhibit the transport of
creatinine across porcine renal proximal tubular (LLC-PK1) or HK-2 cell monolayers. The
results suggest that acyclovir does not inhibit the tubular secretion of creatinine in vitro, and
possibly, in vivo, as well. Therefore, the abrupt, pronounced and transient elevations in the
levels of plasma creatinine observed in patients may be solely and genuinely due to reduced

iii
GFR as a result of acyclovir – induced nephrotoxicity, and not to a tubular interaction between
creatinine and acyclovir.
Employing human embryonic kidney cells (HEK293) containing the full-length human ABCG2
gene encoding the wildtype ABCG2 amino acid sequence; cell accumulation studies showed
that in the presence of the human breast cancer resistance protein (BCRP) inhibitor,
fumitremorgin C (FTC), there was significant intracellular accumulation of acyclovir. The
results suggest that acyclovir is a substrate for the efflux transporter and bears several potential
implications with respect to the renal transport mechanisms and pathogenesis of the direct
tubular damage induced by the drug.
Synthesizing all the data, the results contribute to a better understanding of the pathogenesis of
acyclovir – induced nephrotoxicity. Moreover, the research highlights the need for future
studies that will aid in further elucidation of the underlying cell and molecular mechanism(s) of
this toxicity and potential therapies for prevention of the direct renal tubular injury induced by
the drug.

iv
Acknowledgements
I would like to express my sincerest gratitude to several individuals who have provided their
endless support and guidance to me during my Ph.D. studies.
First, I would like to express my deepest gratitude to my supervisor, Dr. Gideon Koren. I would
like to thank you always taking the time to share your knowledge with me and for providing me
with support, advice, guidance and patience during my graduate studies and the preparation of
this thesis. I consider myself very fortunate to have had you as my Ph.D. mentor. You have
instilled in me, invaluable lessons in academia and scientific research, which I will continue to
use as I move forward in my career. Thank you.
I would also like to thank Dr. Katarina Aleksa for her continuous support, guidance and
encouragement. Thank you for always taking the time to offer your knowledge and advice. It
was tremendously appreciated.
Finally, I would like to thank my advisory committee members, Drs. Shinya Ito, Cecil Pace-
Asciak and Anna Taddio for their advice and guidance throughout my studies. Thank you.

v
Table of Contents
Table of contents.................................................................................................................v
List of Publications..............................................................................................................xiii
List of Abbreviations...........................................................................................................xiv
List of Tables.......................................................................................................................xix
List of Figures......................................................................................................................xx
Chapter 1: General Introduction......................................................................................1
1.1 Acyclovir – induced nephrotoxicity in children: new insight into
its mechanism of toxicity, interaction with creatinine and tubular
transport........................................................................................................1
1.2 Acyclovir......................................................................................................1
1.2.1 Acyclovir use...................................................................................1
1.2.2 Acyclovir: mechanism of action......................................................2
1.2.3 Acyclovir metabolism and excretion................................................3
1.2.4 Acyclovir – induced nephrotoxicity.................................................5
1.2.5 Mechanism(s) of acyclovir – induced nephrotoxicity......................5
1.2.5a Acyclovir – induced crystalluria...........................................5
1.2.5b Acyclovir – induced direct renal tubular cell injury.............6
1.2.6 Acyclovir aldehyde: its potential role in direct renal tubular
Injury.................................................................................................6
1.3 Acyclovir and creatinine: interaction during tubular secretion?...................7
1.3.1 Creatinine..........................................................................................7
1.3.2 Renal tubular secretion of creatinine: opportunity for
interaction with other drugs and subsequent consequences............7
1.4 Role of the human breast cancer resistance protein (BCRP) in

vi
the transport of acyclovir: potential implications in tubular
transport and nephrotoxicity...................................................................9
1.4.1 BCRP...........................................................................................9
1.4.2 Acyclovir as a potential substrate of human BCRP:
renal tubular transport and toxicological significance.................10
1.5 References................................................................................................11
Chapter 2: Hypotheses and Objective..........................................................................16
2.1 Hypotheses...............................................................................................16
2.2 Objectives.................................................................................................17
Chapter 3: Comparison of the novel HK-2 human renal proximal tubular
cell line with the standard LLC-PK1 cell line in studying
drug-induced nephrotoxicity.......................................................................18
3.1 Abstract......................................................................................................19
3.2 Introduction...............................................................................................19
3.3 Materials and methods...............................................................................23
3.3.1 Chemicals.......................................................................................23
3.3.2 HK-2 cells......................................................................................24
3.3.2a Culturing conditions of HK-2 cells for ifosfamide
Experiments........................................................................24
3.3.2b Culturing conditions of HK-2 cells for acyclovir
Experiments........................................................................25
3.3.3 LLC-PK1 cells................................................................................25
3.3.3a Culturing conditions of LLC-PK1 cells for
ifosfamide experiments.......................................................25

vii
3.3.3b Culturing conditions of LLC-PK1 cells for
acyclovir experiments......................................................25
3.3.4 Experimental methods used to determine whether HK-2
cells are an appropriate model to study ifosfamide
– induced nephrotoxicity..............................................................26
3.3.4a Determination of CYP enzyme mRNA expression
in HK-2 cells by RT-PCR................................................26
3.3.4b Determination of CYP enzyme protein expression
in HK-2 cells by Western blotting....................................27
3.3.4c Determination of renal proximal tubule metabolism
of ifosfamide in HK-2 cells by LC-MS.............................27
3.3.4d Determination of GSH levels in HK-2 and LLC-PK
Cells..................................................................................29
3.3.5 Experimental method used to determine whether HK-2
cells are an appropriate model to study acyclovir –
induced nephrotoxicity..................................................................31
3.3.5a Determination of cytotoxicity in HK-2 and
LLC-PK1 cells...................................................................31
3.3.6 Statistical analyses.........................................................................31
3.4 Results.......................................................................................................32
3.4.1 CYP mRNA and protein expression in HK-2 cells........................32
3.4.2 Renal proximal tubular metabolism of ifsofamide by HK-2
and LLC-PK1 cells.........................................................................34

viii
3.4.3 Depletion of GSH and GSSG in HK-2 and LLC-PK1
cells...........................................................................................34
3.4.4 Acyclovir – induced cytotoxicity in LLC-PK1 and
HK-2 cells.................................................................................36
3.5 Discussion.............................................................................................37
3.6 Acknowledgements..............................................................................40
3.7 Statement of significance......................................................................40
3.8 References.............................................................................................41
Chapter 4: Acyclovir – induced nephrotoxicity; the role of the acyclovir
aldehyde metabolite.................................................................................44
4.1 Abstract................................................................................................45
4.2 Introduction..........................................................................................45
4.3 Materials and methods..........................................................................48
4.3.1 Cell culture................................................................................48
4.3.2 Protein expression and enzymes activities of class I ADH
and ALDH2 isozymes in HK-2 cells.........................................49
4.3.2a Cytosol and mitochondria protein fraction for
western blot assays.........................................................50
4.3.3 Western blot assays....................................................................51
4.3.3a ADH protein expression.................................................51
4.3.3b ALDH2 protein expression.............................................52
4.3.4 Enzymes activities assays............................................................52
4.3.4a Whole cell lysate for enzymes activities assays..............52
4.3.4b ADH and ALDH enzymes activities assays....................53
4.3.5 Cell viability................................................................................54

ix
4.3.5a Co-exposure to 4-methylpyrazole...................................55
4.3.6 Determination of aldehyde production.......................................55
4.3.7 Comparison of the ADH protein expression between
HK-2 cells and human kidney tissue..........................................56
4.3.8 Statistical analyses......................................................................57
4.4 Results.....................................................................................................57
4.4.1 Class I ADH and ALDH2 protein expression.............................57
4.4.2 ADH and ALDH enzyme activity...............................................60
4.4.3 The effect of 4-methylpyrazole on HK-2 cell viability...............63
4.4.4 Aldehyde production in HK-2 cells exposed to acyclovir..........65
4.4.5 Comparison of the ADH protein expression level between
HK-2 cells and human kidney....................................................66
4.5 Discussion................................................................................................67
4.6 Statement of significance.........................................................................73
4.7 Acknowledgements.................................................................................73
4.8 References...............................................................................................74
4.9 Additional experiments not published.....................................................79
4.9.1 The effect of CMMG on cell viability.........................................79
4.9.2 Materials and methods.................................................................79
4.9.2a Exposure to CMMG.........................................................79
4.9.2b Statistical analyses............................................................79
4.9.3 Results......................................................................................... 79
Chapter 5: The effect of acyclovir on the tubular secretion of creatinine
in vitro.........................................................................................................81
5.0 Abstract...................................................................................................82
5.1 Introduction.............................................................................................82

x
5.2 Materials and methods...............................................................................87
5.2.1 Cell culture.....................................................................................87
5.2.2 Transepithelial transport studies....................................................87
5.2.2a Tetraethylammonium (TEA) transport across cell
monolayers.........................................................................89
5.2.2b Acyclovir transport across cell monolayers.......................89
5.2.2c The effect of acyclovir on creatinine transport
across cell monolayers........................................................89
5.2.3 Statistical analyses..........................................................................90
5.3 Results........................................................................................................90
5.3.1 TEA transport across LLC-PK1 and HK-2 cell
monolayers......................................................................................90
5.3.2 Acyclovir transport across LLC-PK1 and HK-2 cell
monolayers.......................................................................................93
5.3.3 The effect of acyclovir on creatinine transport across
LLC-PK1and HK-2 cell monolayers..............................................96
5.4 Discussion....................................................................................................99
5.5 Acknowledgements....................................................................................103
5.6 Statement of significance............................................................................103
5.7 References..................................................................................................104
5.8 Additional experiments not published........................................................108
5.8.1 The paracellular flux (basolateral-to-apical) of
D-[1-3H(N)] mannitol......................................................................108
5.8.2 Materials and methods.....................................................................108
5.8.3 Results.............................................................................................108
Chapter 6: Acyclovir is a substrate for the human breast cancer resistance
protein (BCRP/ABCG2): implications for renal tubular transport

xi
and acyclovir – induced nephrotoxicity..................................................115
6.1 Abstract..................................................................................................116
6.2 Introduction............................................................................................116
6.3 Materials and methods...........................................................................118
6.3.1 Cell culture.................................................................................118
6.3.2 Determination of protein expression of human BCRP
in overexpressing HEK293 cells................................................119
6.3.3 Whole cell lysate for western blot assays...................................119
6.3.3a Mock or overexpressing HEK293 cells..........................119
6.3.3b Human placenta tissue....................................................120
6.3.4 Western blot assay......................................................................120
6.3.5 Hoescht 33342 dye efflux assay.................................................121
6.3.6 Cell accumulation assay.............................................................121
6.3.7 Statistical analyses......................................................................122
6.4 Results....................................................................................................123
6.4.1 The protein expression of human BCRP in
overexpressing HEK293 cells.....................................................123
6.4.2 The functionality of BCRP in overexpressing HEK293
cells..............................................................................................124
6.4.3 Intracellular accumulation of [8-14
C] acyclovir...........................125
6.5 Discussion................................................................................................126
6.6 Statement of significance.........................................................................128
6.7 References...............................................................................................129

xii
6.8 Additional experiments not published......................................................133
6.8.1 The effect of acyclovir on HEK293 cell viability.........................133
6.8.2 Materials and methods..................................................................133
6.8.2a Cytotoxicity assay.............................................................133
6.8.2a Statistical analyses.............................................................133
6.8.3 Results...........................................................................................134
Chapter 7: Summary of research findings....................................................................135
7.1 Summary of research findings and their significance................................135
7.1.1 To investigate whether acyclovir – induced nephrotoxicity
is due to, in part, direct insult to renal tubular cells........................135
7.1.2 To determine whether acyclovir aldehyde plays a role in
the direct renal tubular injury induced by acyclovir.......................136
7.1.3 To determine whether acyclovir inhibits the renal tubular
secretion of creatinine.....................................................................136
7.1.4 To determine whether acyclovir is a substrate for human
BCRP..............................................................................................138
7.2 References...................................................................................................139
Chapter 8: General Discussion and Conclusions............................................................141
8.1 Acyclovir and direct renal tubular injury.....................................................141
8.2 Acyclovir-creatinine tubular interaction......................................................145
8.3 Renal tubular transport of acyclovir.............................................................146
8.4 Limitations and future directions.................................................................147
8.5 Conclusions..................................................................................................150
8.6 References....................................................................................................152

xiii
List of Publications
Gunness, P., Aleksa, K., Kosuge, K., Ito, S., and Koren, G. 2010. Comparison of the novel HK-
2 human renal proximal tubular cell line with the standard LLC-PK1 cell line in studying drug-
induced nephrotoxicity. Can J Physiol Pharmacol 88: 448-455. This article was originally
published by NRC Research Press.
Gunness, P., Aleksa, K., and Koren, G. 2010. The effect of acyclovir on the tubular secretion of
creatinine in vitro. J Transl Med 8: 139-149. This article was originally published by BioMed
Central.
Gunness, P., Aleksa, K., and Koren, G. 2011. Acyclovir is a substrate for the human breast
cancer resistance protein (BCRP/ABCG2): implications for renal tubular transport and acyclovir
– induced nephrotoxicity. Can J Physiol Pharmacol. [In press]. This article will be originally
published by NRC Research Press.
Gunness, P., Aleksa, K., Bend, J., and Koren, G. 2011. Acyclovir – induced nephrotoxicity: the
role of the acyclovir aldehyde metabolite. Transl Res. [In press]. This article will be originally
published by Elsevier.

xiv
List of Abbreviations
x g - times gravitational force
α-MEM - alpha modified minimum essential medium
◦C - degrees celsius
% - percent
µg – microgram
µL - microlitre
µm - micron
µg/mL - microgram per millilitre
ABCG - adenosine triphosphate (ATP) binding cassette transporter
ADH - alcohol dehydrogenase
ALDH - aldehyde dehydrogenase
ALDH2 - aldehyde dehydrogenase 2
ANOVA - analysis of variance
ATCC - American type culture collection
BCRP - human breast cancer resistance protein
Bcrp1 - murine breast cancer resistance protein
BSO - L-buthionine sulfoximine
CaCl2 - calcium chloride
cDNA - copy DNA
CE - collision energy
CIHR - Canadian Institutes of Health Research
cm2 - square centimetre
CMMG - 9-carboxymethoxymethylguanine

xv
CO2 - carbon dioxide
CYP - cytochrome P450 enzyme
DCEIF - dechloroethylifosfamide
DMEM/F12 - Dulbecco's modified Eagle's minimum essential medium/Ham's F-12
DMEM - Dulbecco's modified Eagle's minimum essential medium
DNA - deoxyribonucleic acid
DNTB - dithiobis-2-nitrobenzoic acid
dNTP - deoxyribonucleotide triphosphate
DP - declustering potential
DPM - disintegrations per minutes
ECL - enhanced chemiluminescence reagent
EDTA - ethylenediaminetetraacetic acid
EMEM - Eagles’s minimum essential medium
FBS - fetal bovine serum
FTC - fumitremorgin C
GFR - glomerular filtration rate
GR - glutathione reductase
GSH - glutathione
GSSG - glutathione disulfide
HEK293 - human embryonic kidney cell line
HEPES - 4-(2-hydroxyethyl)-1-piperazineethanesulfonic acid
HK-2 - human renal proximal tubular cells
hOCT1 - human organic cation transporter 1
hOCT2 - human organic cation transporter 2
HPLC - high performance liquid chromatography
xvi
hr - hour
hrs - hours
HSD - honestly significant difference
IgG - HRP - immunoglobulin G – horseradish peroxidase
KCl - potassium chloride
kD – kilo dalton
kV - kilo volts
L - litre
LC-MS - Liquid chromatography – mass spectrometry
LC-MS/MS - liquid chromatography tandem mass spectrometry
LLC-PK1 - porcine renal proximal tubular cells
M2VP - 1-methyl-2-vinylpyridinium trifluoromethanesulfonate
MgCl2 - magnesium chloride
mg/kg - milligram per kilogram
mg/mL - milligram per millilitre
mg/L – milligram per litre
min - minute
mins - minutes
mL - millilitre
mL/min - millilitre per minute
mm - millimetre
mmol/L – millimole per litre
MRM - multiple reactions monitored
mRNA - messenger RNA
M.W. - molecular weight

xvii
m/z - mass-to-charge ratio
NAD+
- nicotinamide adenine dinucleotide
NADH - reduced form of nicotinamide adenine dinucleotide
NADPH - nicotinamide adenine dinucleotide phosphate-oxidase
NCBI - National centre for Biotechnology information
NIH - National Institutes of Health
nmol/L – nanomole per litre
ng - nanogram
ng/mL - nanogram per millilitre
nm - nanometre
NP- 40 - nonyl phenoxypolyethoxylethanol
NaCl - sodium chloride
O2 - oxygen
OAT - organic anion transporter
OCT - organic cation transporter
PBS - phosphate buffer saline
PBST - PBS with Tween® 20 detergent
PMSF - phenylmethylsulfonyl fluoride
pOCT1 - porcine organic cation transporter 1
pOCT2 - porcine organic cation transporter 2
PVDF - polyvinylidene difluoride
RNA - ribonucleic acid
RT-PCR - reverse transcription polymerase chain reaction
SDS-PAGE - sodium dodecyl sulfate – polyacrylamide gel electrophoresis
SD – standard deviation
xviii
SE - standard error
secs - seconds
SFM - serum free medium
TEA - tetraethylammonium
Tris-HCL - tris(hydroxymethyl)aminomethane hydrochloride
USA - United States of America
v/v - volume per volume
w/v - weight per volume
xix
List of Tables
Table 1. Summary of some important pharmacokinetic parameters
of acyclovir in children [1 – 17 years]..........................................................2
Table 2. HK-2 versus LLC-PK1 as a model for ifosfamide – induced
nephrotoxicity................................................................................................36
Table 3. Cases of elevated plasma creatinine levels in children who
received intravenous acyclovir......................................................................86

xx
List of Figures
Figure 1. Structural formula of acyclovir..............................................................1
Figure 2. Schematic diagram illustrating the mechanism of action
of acyclovir..............................................................................................3
Figure 3. Metabolism of acyclovir in humans........................................................4
Figure 4. Total Ribonucleic acid (RNA) was isolated from human
renal proximal tubular (HK-2) cells
and reverse transcribed...........................................................................32
Figure 5. Western blot of human renal proximal tubular (HK-2)
cells for cytochrome P450 (CYP) enzymes............................................33
Figure 6. Metabolism of ifosfamide by human renal proximal tubular
(HK-2) cells............................................................................................34
Figure 7. Glutathione (GSH) depletion in human (HK-2) and porcine
(LLC-PK1) renal proximal tubular cells.................................................35
Figure 8. Acyclovir – induced cytotoxicity in human (HK-2) and
porcine (LLC-PK1) renal proximal tubular cells...................................37
Figure 9A. The alcohol dehydrogenase (ADH) protein expression in
Human renal proximal tubular (HK-2) cell.............................................58

xxi
Figure 9B. The aldehyde dehydrogenase (ALDH) protein expression
in human renal proximal tubular (HK-2) cells.....................................58
Figure 10A. The alcohol dehydrogenase (ADH) protein expression in
human kidney........................................................................................59
Figure 10B. The aldehyde dehydrogenase (ALDH) protein expression in
human kidney........................................................................................59
Figure 11A. The alcohol dehydrogenase (ADH) enzyme activity in
human renal proximal tubular (HK-2) cells...........................................61
Figure 11B. The aldehyde dehydrogenase enzyme activity in human
renal proximal tubular (HK-2) cells.......................................................61
Figure 12A. The alcohol dehydrogenase (ADH) enzyme activity in
human kidney.........................................................................................62
Figure 12B. The aldehyde dehydrogenase enzyme activity in human
kidney.....................................................................................................62
Figure 13. The effect of 4-methylpyrazole on human renal proximal
tubular (HK-2) cell viability...................................................................64
Figure 14. Aldehyde production in human renal proximal tubular
(HK-2) cells exposed to acyclovir...........................................................65

xxii
Figure 15. Comparison of the alcohol dehydrogenase (ADH) protein
expression level between the immortalized human renal
proximal tubular (HK-2) cell line and human kidney...........................66
Figure 16. The effect of 9-carboxymethoxymethylguanine (CMMG) on
human renal proximal tubular (HK-2 cell) viability..............................80
Figure 17. Tetraethylammonium (TEA) transport across porcine renal
proximal tubular cell (LLC-PK1) monolayers.......................................91
Figure 18. Tetraethylammonium (TEA) transport across human renal
proximal tubular cell (HK-2) monolayers..............................................92
Figure 19. Acyclovir transport across porcine renal proximal tubular
cell (LLC-PK1) monolayers...................................................................94
Figure 20. Acyclovir transport across human renal proximal tubular
cell (HK-2)monolayers...........................................................................95
Figure 21. The effect of acyclovir on creatinine transport across
porcine renal proximal tubular cell (LLC-PK1) monolayers.................97
Figure 22. The effect of acyclovir on creatinine transport across
human renal proximal tubular cell (HK-2) monolayers.........................98
Figure 23. The paracellular flux of mannitol across porcine renal

xxiii
proximal tubular cell (LLC-PK1) monolayers that were used
for determining the transepithelial transport of
tetraethylammonium (TEA) across the cell
monolayers............................................................................................109
Figure 24. The paracellular flux of mannitol across human renal proximal
tubular cell (HK-2) monolayers that were used for determining
the transepithelial transport of tetraethylammonium (TEA) across
the cell monolayers................................................................................110
Figure 25. The paracellular flux of mannitol across porcine renal
proximal tubular cell (LLC-PK1) monolayers that were
used for determining the transepithelial transport of
acyclovir across the cell monolayers.......................................................111
Figure 26. The paracellular flux of mannitol across human renal proximal
tubular cell (HK-2) monolayers that were used for
determining the transepithelial transport of acyclovir
across the cell monolayers.......................................................................112
Figure 27. The paracellular flux of mannitol across porcine renal
proximal tubular cell (LLC-PK1) monolayers that were
used to determine acyclovir inhibits the tubular
transport of creatinine..............................................................................113
Figure 28. The paracellular flux of mannitol across human renal
proximal tubular cell (HK-2) monolayers that were used to

xxiv
determine acyclovir inhibits the tubular
transport of creatinine.........................................................................114
Figure 29. The protein expression of human breast cancer resistance
protein (BCRP) in the overexpressing human embryonic
kidney (HEK293) cells.........................................................................123
Figure 30. The functionality of the human BCRP in overexpressing
human embryonic kidney (HEK293) cells............................................124
Figure 31. Intracellular accumulation of [8-14
C] acyclovir.....................................125
Figure 32. The effect of acyclovir on human embryonic kidney
(HEK293) cell viability..........................................................................134

1
Chapter 1
General introduction
1.1 Acyclovir – induced nephrotoxicity in children: new insight into its mechanism of
toxicity, interaction with creatinine and tubular transport.
Drug – induced nephrotoxicity is a serious adverse reaction observed in clinical practice that can
limit the use of effective therapeutic agents (Izzedine et al. 2005; Patzer 2008) and can have
detrimental effects on a patient’s overall health and well-being. Acyclovir is an example of such
an agent. The overall objective of this thesis is to gain new insight into the nephrotoxicity of an
old, yet widely used antiviral agent. The following chapters will reveal findings from novel
studies that examined the mechanism of its direct tubular injury, its interaction with creatinine
and its tubular transport.
1.2 Acyclovir
1.2.1 Acyclovir use
Figure 1. Structural formula of acyclovir (M.W. 225.2)
For over 25 years, acyclovir [9-(2-hydroxyethoxymethyl)guanine] has been routinely used to
treat several types of viral infections in children (Elion 1983; Richards et al. 1983; Wagstaff et
al. 1994). Acyclovir is most effective against herpes mediated viruses, including the herpes
2
simplex virus (types I and II) and the varicella zoster virus (Elion 1983). Acyclovir can be
administered topically, orally or intravenously (Richards et al. 1983). This thesis examines the
adverse renal effects of acyclovir that has been administered via the intravenous route to
children. Acyclovir is typically administered [via slow infusion] over a period of 1 hour, every
8 hours for 5 to 10 days (Bryson 1984).
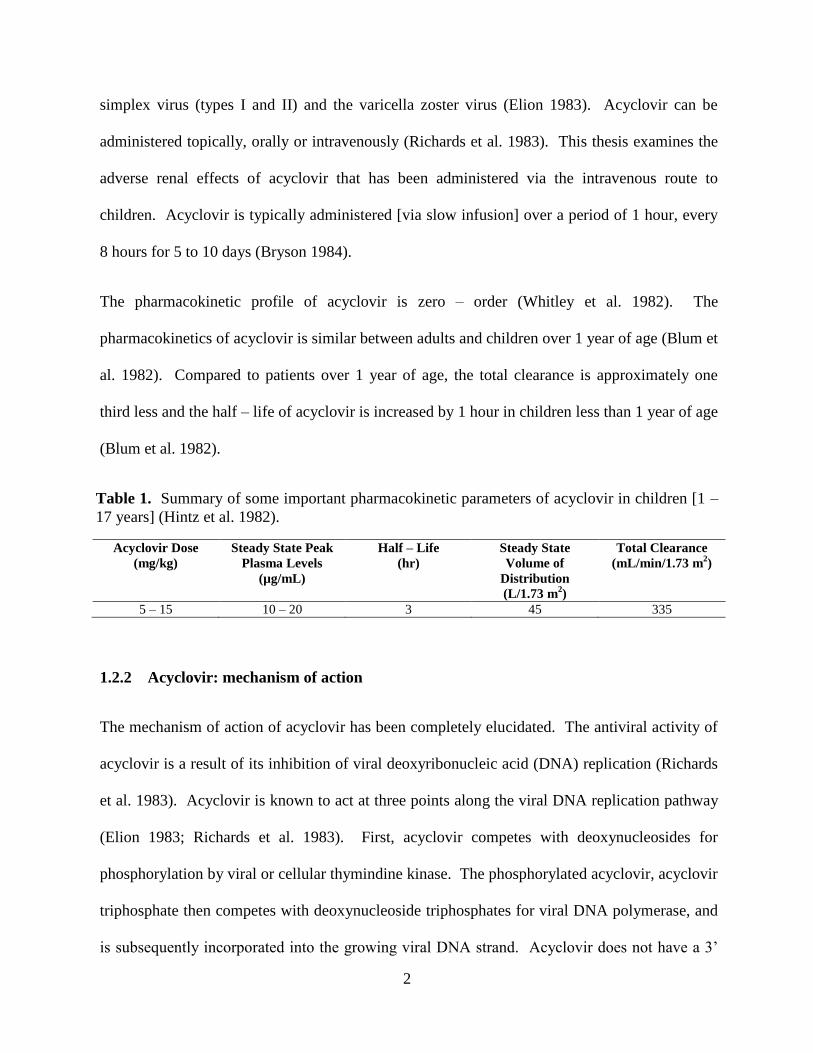
The pharmacokinetic profile of acyclovir is zero – order (Whitley et al. 1982). The
pharmacokinetics of acyclovir is similar between adults and children over 1 year of age (Blum et
al. 1982). Compared to patients over 1 year of age, the total clearance is approximately one
third less and the half – life of acyclovir is increased by 1 hour in children less than 1 year of age
(Blum et al. 1982).
Table 1. Summary of some important pharmacokinetic parameters of acyclovir in children [1 –
17 years] (Hintz et al. 1982).
Acyclovir Dose
(mg/kg)
Steady State Peak
Plasma Levels
(µg/mL)
Half – Life
(hr)
Steady State
Volume of
Distribution
(L/1.73 m2)
Total Clearance
(mL/min/1.73 m2)
5 – 15 10 – 20 3 45 335
1.2.2 Acyclovir: mechanism of action
The mechanism of action of acyclovir has been completely elucidated. The antiviral activity of
acyclovir is a result of its inhibition of viral deoxyribonucleic acid (DNA) replication (Richards
et al. 1983). Acyclovir is known to act at three points along the viral DNA replication pathway
(Elion 1983; Richards et al. 1983). First, acyclovir competes with deoxynucleosides for
phosphorylation by viral or cellular thymindine kinase. The phosphorylated acyclovir, acyclovir
triphosphate then competes with deoxynucleoside triphosphates for viral DNA polymerase, and
is subsequently incorporated into the growing viral DNA strand. Acyclovir does not have a 3’

3
hydroxyl group that is required for DNA elongation, and therefore, incorporation of acyclovir
triphosphate into the DNA strand results in DNA chain termination (Elion 1983; Richards et al.
1983).
Figure 2. Schematic diagram illustrating the mechanism of action of acyclovir (Richards et al.
1983).
1.2.3 Acyclovir metabolism and excretion
Acyclovir does not require biotransformation to an active metabolite for its antiviral activity or
for its excretion (de Miranda et al. 1982). Intravenously administered acyclovir undergoes
minimal metabolism in humans (de Miranda et al. 1982). For example, for a given dose of
acyclovir, approximately 62 – 91 % is eliminated unchanged in the urine (de Miranda et al.
1982). The major metabolite of acyclovir is 9-carboxymethoxymethylguanine (CMMG), while

4
its minor metabolite is 8-hydroxy-9-(2-hydroxyethoxymethyl)guanine (de Miranda et al. 1982).
An estimated 8 – 14 % and less than 0.2 % of a given dose of acyclovir is eliminated as the
CMMG and 8-hydroxy-9-(2-hydroxyethoxymethyl)guanine metabolites, respectively, in the
kidney (de Miranda et al. 1982). Acyclovir is excreted to a minor extent in feces (< 2 %) and
expired air (< 0.1 %) (de Miranda et al. 1982).
Figure 3. Metabolism of acyclovir in humans (de Miranda et al. 1982; Helldén et al. 2006).
5
1.2.4 Acyclovir – induced nephrotoxicity
Acyclovir is widely regarded as a safe antiviral agent (Bryson 1984; Keeney et al. 1982).
Generally, the drug is well tolerated, with only minor irritation at the site of injection (Bryson
1984; Keeney et al. 1982). However, severe nephrotoxicity which often leads to acute renal
failure has been observed in patients (Ahmad et al. 1994; Bianchetti et al. 1991; Brigden et al.
1982; Chou et al. 2008; Genc et al. 2010; Keeney et al. 1982; Vachvanichsanong et al. 1995;
Vomiero et al. 2002). Acyclovir – induced renal failure occurs in approximately 12 to 48 % of
cases (Bean and Aeppli 1985; Keeney et al. 1982). Acyclovir – induced nephrotoxicity is
typically evidenced by acute renal failure, elevated plasma creatinine levels or the occurrence of
abnormal urine sediments (Ahmad et al. 1994; Bianchetti et al. 1991; Brigden et al. 1982; Chou
et al. 2008; Keeney et al. 1982; Vachvanichsanong et al. 1995; Vomiero et al. 2002).
1.2.5 Mechanism(s) of acyclovir – induced nephrotoxicity
1.2.5a Acyclovir – induced crystalluria
Acyclovir – induced nephrotoxicity is believed to be secondary to crystalluria which leads to
obstructive nephropathy (Bianchetti et al. 1991; Lyon et al. 2002; Mason 2008; Peterslund et al.
1998; Sawyer et al. 1988). Typically, crystalluria develops within 24 – 48 hours of the initiation
of acyclovir therapy (Izzedine et al. 2005). Polarizing microscopy shows that acyclovir forms
birefringent needle-shaped crystals in the urine (Genc et al. 2010; Lyon et al. 2002; Mason
2008; Sawyer et al. 1988). Strategies including avoidance of rapid bolus intravenous injection,
sufficient hydration and dose adjustments are often recommended for the prevention of
acyclovir – induced crystalluria (Brigden et al. 1982; Sawyer et al. 1988).

6
1.2.5b Acyclovir – induced direct renal tubular cell injury
Clinical evidence of nephrotoxicity in the absence of crystalluria (Ahmad et al. 1994; Vomiero
et al. 2002) suggests that acyclovir may also induce direct insult to renal tubular cells. For
example, renal biopsies show that acyclovir administration is associated with the occurrence of
various degenerative changes in tubular epithelial cells including bulging (Vomiero et al. 2002),
flattened and vacuolated epithelial cells (Ahmad et al. 1994; Vomiero et al. 2002).
Additionally, dilated tubular lumens, the presence of casts in the tubular lumen (Vomiero et al.
2002), loss of proximal-distal tubular differentiation and epithelial cell mitoses, which have
been suggested to be the result of acute tubular necrosis, have been reported in patients (Ahmad
et al. 1994). Studies have not investigated whether acyclovir induces direct insult to renal
tubular epithelial cells.
1.2.6 Acyclovir aldehyde: its potential role in direct renal tubular injury
Acyclovir is metabolized by alcohol dehydrogenase to produce an aldehyde metabolite, acyclovir
aldehyde, which is subsequently metabolized by aldehyde dehydrogenase to form the CMMG
metabolite (Figure 3). Aldehydes are reactive chemicals that are frequently produced
endogenously as intermediate drug metabolites (O’Brien et al. 2005). The findings from
numerous studies suggest that aldehyde metabolites mediate the toxicities [i.e. hepatotoxicity,
neurotoxicity, bladder toxicity, nephrotoxicity] that are associated with their parent drugs
(O’Brien et al. 2005). For example, the bladder toxicity that is associated with the
chemotherapeutic drug, cyclophosphamide is believed to be caused by its aldehyde metabolite,
acrolein (Ramu et al. 1995). Similarly, the chloroacetaldehyde metabolite of ifosfamide
(Walker et al. 1994) has been shown to cause the nephrotoxicity that occurs during

7
administration of the chemotherapeutic agent (Dubourg et al. 2001). While, studies suggest that
the atropaldehyde metabolite may be responsible for the hepatotoxicity and aplastic anemia that
is associated with its parent antiepileptic drug, felbamate (Kapetanovic et al. 2002). Therefore, it
is possible that the acyclovir aldehyde metabolite may cause the direct renal tubular injury that is
associated with the parent antiviral agent; this hypothesis has never been tested.
1.3 Acyclovir and creatinine: interaction during tubular secretion?
1.3.1 Creatinine
Creatinine is an endogenous compound that is produced non-enzymatically from creatine in
skeletal muscle (Toto 1995). Once produced in the skeletal muscle, creatinine is transported into
the blood and then excreted in the kidney (Toto 1995). Creatinine is freely filtered by the
glomerulus and it is not re-absorbed to a significant extent (Toto 1995). Thus, plasma creatinine
is a widely used measure of renal function in clinical practice (Levey et al. 1988; Narayanan and
Appleton 1980; Perrone et al. 1992; Toto 1995). Plasma creatinine levels are used to calculate
the Glomerular Filtration Rate (GFR) (Levey et al. 1988; Narayanan and Appleton 1980; Perrone
et al. 1992; Toto 1995). The GFR is a measure of the amount of fluid that filters into the
Bowman’s capsule per unit time (Silverthorn 1988). Plasma creatinine concentration is inversely
related to GFR (Levey et al. 1988; Narayanan and Appleton 1980; Perrone et al. 1992; Toto
1995). Therefore, increased plasma creatinine concentrations indicate impaired renal function
(Levey et al. 1988; Narayanan and Appleton 1980; Perrone et al. 1992; Toto 1995).

8
1.3.2 Renal tubular secretion of creatinine: opportunity for interaction with other drugs
and subsequent consequences
In addition to filtration, approximately 10 – 20 % of the body load of creatinine is secreted into
the kidney (Toto 1995). Creatinine is secreted into the tubule lumen via active transporter
systems (Arendshorst and Selkurt 1970; Berglund et al. 1975; Burgess et al. 1982; Burry and
Dieppe 1976; Dubb et al. 1978; Dutt et al. 1981; Eisner et al. 2010; Kastrup et al. 1985; Myre et
al. 1987; Okuda et al. 2006; Opravil et al. 1993; Tschuppert et al. 2007; Urakami et al. 2004).
The renal tubular transport mechanisms of creatinine have not been fully elucidated; however,
both acid and base active secreting mechanisms appear to play a role in its transport.
The active renal secretion of creatinine creates the opportunity for other drugs that may share
similar transport mechanisms with the compound; to compete with it for tubular secretion. The
competition between creatinine and other agents for renal tubular transport results in the
inhibition of the secretion of creatinine and a subsequent elevation in plasma creatinine levels
that are not due to decreased GFR or renal function. Examples of some non-nephrotoxic drugs
that inhibit the renal tubular secretion of creatinine and subsequently induce transient,
pronounced elevations in plasma creatinine levels that are unreflective of impaired renal function
include cimetidine (Blackwood et al. 1976; Burgess et al. 1982; Dubb et al. 1978; Dutt et al.
1981; Haggie et al. 1976), dronedarone (Tschuppert et al. 2007), pyrimethamine (Opravil et al.
1993), salicylates (Burry and Dieppe 1976) and trimethoprim (Berglund et al. 1975; Kastrup et
al. 1985; Myre et al. 1987).
A review of the literature shows that similar to the aforementioned non-nephrotoxic drugs;
marked, transient elevations (up to 9 fold above baseline levels in some cases) in plasma

9
creatinine levels have been observed within 24 – 48 hrs of initiation of acyclovir therapy in
patients (Bianchetti et al. 1991; Brigden et al. 1982; Chou et al. 2008; Keeney et al. 1982;
Vachvanichsanong et al. 1995; Vomiero et al. 2002). The pronounced increases in plasma
creatinine levels are often unaccompanied by signs of overt nephrotoxicity (please refer to Table
3, Chapter 5, for a summary of the acyclovir cases).
Studies reveal that like the non-nephrotoxic drugs, acyclovir may share similar renal organic
cation and anion transporter systems with creatinine (Takeda et al. 2002). Therefore it is
plausible the acyclovir inhibits the tubular secretion of creatinine. It is imperative to determine
whether acyclovir inhibits the secretion of creatinine because if this is the case, then in addition
to creatinine, other biological markers of renal function, such as inulin, should always be used to
assess renal function in patients during the course of acyclovir therapy. Research has not
elucidated whether acyclovir inhibits the renal tubular secretion of creatinine. In this thesis, the
inhibition of creatinine secretion by acyclovir via the organic cation transporter (OCT) system
was examined.
1.4 Role of the human breast cancer resistance protein (BCRP) in the transport of
acyclovir: potential implications in tubular transport and nephrotoxicity
1.4.1 BCRP
The BCRP is the second member of the subfamily G of the human adenosnine triphosphate
(ATP) – binding cassette (ABC) transporter superfamily (Dean et al. 2001; Mau and Unadkat
2005; Robey et al. 2009). The efflux transporter (Doyle et al. 1998; Rocchi et al. 2000) is
responsible for the transport of both endogenous (i.e. 17β-estradiol) (Chen et al. 2003) and
exogenous substrates (i.e. mitoxantrone, daunorubicin) (Doyle et al. 1998; Ozvegy et al. 2001).

10
The protein is widely expressed in human tissues (Allikmets et al. 1998; Doyle et al. 1998;
Maliepaard et al. 2001) including the placenta, gastrointestinal tract, breast, liver and kidney.
1.4.2 Acyclovir as a potential substrate of human BCRP: renal tubular transport and
toxicological significance
Jonker and colleagues have shown that in mice with the wildtype Abcg2 gene, which codes for
Bcrp1 protein (murine ortholog of human ABCG2 gene, which codes for the BCRP protein),
there was a significantly higher accumulation (approximately 5 fold) of acyclovir in breast milk,
compared to mice with the non-functional Abcg2-/-
gene. The results suggest that acyclovir is a
substrate for murine Bcrp1 and hence, the antiviral agent may also be a substrate for human
BCRP (Jonker et al. 2005), however, this hypothesis have never been directly tested.
It is important to determine whether acyclovir is a substrate for human BCRP because this may
aid in the better understanding of the pathogenesis of the direct renal tubular injury induced by
the drug. The efflux transporter is localized in the apical membrane of renal tubular cells (Huls
et al. 2008), and hence, may play a significant role in the efflux of acyclovir from tubular cells.
Therefore, factors, such as genetic polymorphisms (Sparreboom et al. 2004; Cusatis et al. 2006;
Zhang et al. 2006; Yu et al. 2006; Yamasaki et al. 2008; Pollex et al. 2010) that affect functional
expression of BCRP may result in the reduced or abolished renal tubular expression of the efflux
transporter. Reduced or abolished expression of the transporter can result in the reduced cellular
efflux and increased intracellular concentration of acyclovir and subsequent detrimental
nephrotoxic consequences, such as direct tubular injury.

11
1.5 References
Ahmad, T., Simmonds, M., McIver, A.G., and McGraw, M.E. 1994. Reversible renal failure in
renal transplant patients receiving oral acyclovir prophylaxis. Pediatr Nephrol 8: 489-491.
Allikmets, R., Schriml, L.M., Hutchinson, A., Romano-Spica, V., and Dean, M. 1998. A human
placenta-specific ATP-binding cassette gene (ABCP) on chromosome 4q22 that is involved in
multidrug resistance. Cancer Res 58: 5337-5339.
Arendshorst, W.J., and Selkurt, E.E. 1970. Renal tubular mechanisms for creatinine secretion in
the guinea pig. Am J Physiol 218: 1661-1670.
Bean, B., and Aeppli, D. 1985. Adverse effects of high-dose intravenous acyclovir in ambulatory
patients with acute herpes zoster. J Infect Dis 151: 362-365.
Berglund, F., Killander, J., and Pompeius, R. 1975. Effect of trimethoprim-sulfamethoxazole on
the renal excretion of creatinine in man. J Urol 114: 802-808.
Bianchetti, M.G., Roduit, C., and Oetliker, O.H. 1991. Acyclovir-induced renal failure: course
and risk factors. Pediatr Nephrol 5: 238-239.
Blackwood, W.S., Maudgal, D.P., Pickard, R.G., Lawrence, D., and Northfield, T.C. 1976.
Cimetidine in duodenal ulcer. Controlled trial. Lancet 2: 174-176.
Blum, M.R., Liao, S.H., and de Miranda, P. 1982. Overview of acyclovir pharmacokinetic
disposition in adults and children. Am J Med 73: 186-192.
Brigden, D., Rosling, A.E., and Woods, N.C. 1982. Renal function after acyclovir intravenous
injection. Am J Med 73: 182-185.
Bryson, Y.J. 1984. The use of acyclovir in children. Pediatr Infect Dis 3: 345-348.
Burgess, E., Blair, A., Krichman, K., and Cutler, R.E. 1982. Inhibition of renal creatinine
secretion by cimetidine in humans. Ren Physiol 5: 27-30.
Burry, H.C., and Dieppe, P.A. 1976. Apparent reduction of endogenous creatinine clearance by
salicylate treatment. Br Med J 2: 16-17.
Chen, Z.S., Robey, R.W., Belinsky, M.G., Shchaveleva, I., Ren, X.Q., Sugimoto, Y., Ross, D.D.,
Bates, S.E., and Kruh, G.D. 2003. Transport of methotrexate, methotrexate polyglutamates, and
17beta-estradiol 17-(beta-D-glucuronide) by ABCG2: effects of acquired mutations at R482 on
methotrexate transport. Cancer Res 63: 4048-4054.
Chou, J.W., Yong, C., and Wootton, S.H. 2008. Case 2: Rash, fever and headache....first, do no
harm. Paediatr Child Health 13: 49-52.

12
de Miranda, P., Good, S.S., Krasny, H.C., Connor, J.D., Laskin, O.L., and Lietman, P.S. 1982.
Metabolic fate of radioactive acyclovir in humans. Am J Med 73: 215-220.
Doyle, L.A., Yang, W., Abruzzo, L.V., Krogmann, T., Gao, Y., Rishi, A.K., and Ross, D.D.
1998. A multidrug resistance transporter from human MCF-7 breast cancer cells. Proc Natl Acad
Sci U S A 95: 15665-15670.
Dubb, J.W., Stote, R.M., Familiar, R.G., Lee, K., and Alexander, F. 1978. Effect of cimetidine
on renal function in normal man. Clin Pharmacol Ther 24: 76-83.
Dubourg, L., Michoudet, C., Cochat, P., and Baverel, G. 2001. Human kidney tubules detoxify
chloroacetaldehyde, a presumed nephrotoxic metabolite of ifosfamide. J Am Soc Nephrol 12:
1615-1623.
Dutt, M.K., Moody, P., and Northfield, T.C. 1981. Effect of cimetidine on renal function in man.
Br J Clin Pharmacol 12: 47-50.
Eisner, C., Faulhaber-Walter, R., Wang, Y., Leelahavanichkul, A., Yuen, P.S., Mizel, D., Star,
R.A., Briggs, J.P., Levine, M., and Schnermann, J. 2010. Major contribution of tubular secretion
to creatinine clearance in mice. Kidney Int 77: 519-526.
Elion, G.B. 1983. The biochemistry and mechanism of action of acyclovir. J Antimicrob
Chemother 12: 9-17.
Genc, G., Ozkaya, O., Acikgoz, Y., Yapici, O., Bek, K., Gulnar Sensoy, S., and Ozyurek, E.
2010. Acute renal failure with acyclovir treatment in a child with leukemia. Drug Chem Toxicol
33: 217-219.
Haggie, S.J., Fermont, D.C., and Wyllie, J.H. 1976. Treatment of duodenal ulcer with cimetidine.
Lancet 1: 983-984.
Hellden, A., Lycke, J., Vander, T., Svensson, J.O., Odar-Cederlof, I., and Stahle, L. 2006. The
aciclovir metabolite CMMG is detectable in the CSF of subjects with neuropsychiatric symptoms
during aciclovir and valaciclovir treatment. J Antimicrob Chemother 57: 945-949.
Hintz, M., Connor, J.D., Spector, S.A., Blum, M.R., Keeney, R.E., and Yeager, A.S. 1982.
Neonatal acyclovir pharmacokinetics in patients with herpes virus infections. Am J Med 73: 210-
214.
Huls, M., Brown, C.D., Windass, A.S., Sayer, R., van den Heuvel, J.J., Heemskerk, S., Russel,
F.G., and Masereeuw, R. 2008. The breast cancer resistance protein transporter ABCG2 is
expressed in the human kidney proximal tubule apical membrane. Kidney Int 73: 220-225.
Izzedine, H., Launay-Vacher, V., and Deray, G. 2005. Antiviral drug-induced nephrotoxicity.
Am J Kidney Dis 45: 804-817.
13
Jonker, J.W., Merino, G., Musters, S., van Herwaarden, A.E., Bolscher, E., Wagenaar, E.,
Mesman, E., Dale, T.C., and Schinkel, A.H. 2005. The breast cancer resistance protein BCRP
(ABCG2) concentrates drugs and carcinogenic xenotoxins into milk. Nat Med 11: 127-129.
Kapetanovic, I.M., Torchin, C.D., Strong, J.M., Yonekawa, W.D., Lu, C., Li, A.P., Dieckhaus,
C.M., Santos, W.L., Macdonald, T.L., Sofia, R.D., and Kupferberg, H.J. 2002. Reactivity of
atropaldehyde, a felbamate metabolite in human liver tissue in vitro. Chem Biol Interact 142:
119-134.
Kastrup, J., Petersen, P., Bartram, R., and Hansen, J.M. 1985. The effect of trimethoprim on
serum creatinine. Br J Urol 57: 265-268.
Keeney, R.E., Kirk, L.E., and Bridgen, D. 1982. Acyclovir tolerance in humans. Am J Med 73:
176-181.
Levey, A.S., Perrone, R.D., and Madias, N.E. 1988. Serum creatinine and renal function. Annu
Rev Med 39: 465-490.
Lyon, A.W., Mansoor, A., and Trotter, M.J. 2002. Urinary gems: acyclovir crystalluria. Arch
Pathol Lab Med 126: 753-754.
Maliepaard, M., Scheffer, G.L., Faneyte, I.F., van Gastelen, M.A., Pijnenborg, A.C., Schinkel,
A.H., van De Vijver, M.J., Scheper, R.J., and Schellens, J.H. 2001. Subcellular localization and
distribution of the breast cancer resistance protein transporter in normal human tissues. Cancer
Res 61: 3458-3464.
Mason, W.J., and Nickols, H.H. 2008. Crystalluria from acyclovir use. N Engl J Med 358: e14.
Myre, S.A., McCann, J., First, M.R., and Cluxton, R.J., Jr. 1987. Effect of trimethoprim on
serum creatinine in healthy and chronic renal failure volunteers. Ther Drug Monit 9: 161-165.
Narayanan, S., and Appleton, H.D. 1980. Creatinine: a review. Clin Chem 26: 1119-1126.
O'Brien, P.J., Siraki, A.G., and Shangari, N. 2005. Aldehyde sources, metabolism, molecular
toxicity mechanisms, and possible effects on human health. Crit Rev Toxicol 35: 609-662.
Okuda, M., Kimura, N., and Inui, K. 2006. Interactions of fluoroquinolone antibacterials, DX-
619 and levofloxacin, with creatinine transport by renal organic cation transporter hOCT2. Drug
Metab Pharmacokinet 21: 432-436.
Opravil, M., Keusch, G., and Luthy, R. 1993. Pyrimethamine inhibits renal secretion of
creatinine. Antimicrob Agents Chemother 37: 1056-1060.
Patzer, L. 2008. Nephrotoxicity as a cause of acute kidney injury in children. Pediatric
Nephrology 23: 2159-2173.

14
Perrone, R.D., Madias, N.E., and Levey, A.S. 1992. Serum creatinine as an index of renal
function: new insights into old concepts. Clin Chem 38: 1933-1953.
Peterslund, N.A., Larsen, M.L., and Mygind, H. 1988. Acyclovir crystalluria. Scand J Infect Dis
20: 225-228.
Ramu, K., Fraiser, L.H., Mamiya, B., Ahmed, T., and Kehrer, J.P. 1995. Acrolein mercapturates:
synthesis, characterization, and assessment of their role in the bladder toxicity of
cyclophosphamide. Chem Res Toxicol 8: 515-524.
Richards, D.M., Carmine, A.A., Brogden, R.N., Heel, R.C., Speight, T.M., and Avery, G.S.
1983. Acyclovir. A review of its pharmacodynamic properties and therapeutic efficacy. Drugs
26: 378-438.
Sawyer, M.H., Webb, D.E., Balow, J.E., and Straus, S.E. 1988. Acyclovir-induced renal failure.
Clinical course and histology. Am J Med 84: 1067-1071.
Silverthorn, D.U. 1998. The Kidneys. In Human Physiology An Integrated approach. Edited by
Brake, D.R.. Prentice Hall., Upper Saddle River, New Jersey. pp. 518-542.
Takeda, M., Khamdang, S., Narikawa, S., Kimura, H., Kobayashi, Y., Yamamoto, T., Cha, S.H.,
Sekine, T., and Endou, H. 2002. Human organic anion transporters and human organic cation
transporters mediate renal antiviral transport. J Pharmacol Exp Ther 300: 918-924.
Toto, R.D. 1995. Conventional measurement of renal function utilizing serum creatinine,
creatinine clearance, inulin and para-aminohippuric acid clearance. Curr Opin Nephrol
Hypertens 4: 505-509.
Tschuppert, Y., Buclin, T., Rothuizen, L.E., Decosterd, L.A., Galleyrand, J., Gaud, C., and
Biollaz, J. 2007. Effect of dronedarone on renal function in healthy subjects. Br J Clin Pharmacol
64: 785-791.
Urakami, Y., Kimura, N., Okuda, M., and Inui, K. 2004. Creatinine transport by basolateral
organic cation transporter hOCT2 in the human kidney. Pharm Res 21: 976-981.
Vachvanichsanong, P., Patamasucon, P., Malagon, M., and Moore, E.S. 1995. Acute renal failure
in a child associated with acyclovir. Pediatr Nephrol 9: 346-347.
Vomiero, G., Carpenter, B., Robb, I., and Filler, G. 2002. Combination of ceftriaxone and
acyclovir - an underestimated nephrotoxic potential? Pediatr Nephrol 17: 633-637.
Wagstaff, A.J., Faulds, D., and Goa, K.L. 1994. Aciclovir. A reappraisal of its antiviral activity,
pharmacokinetic properties and therapeutic efficacy. Drugs 47: 153-205.
Walker, D., Flinois, J.P., Monkman, S.C., Beloc, C., Boddy, A.V., Cholerton, S., Daly, A.K.,
Lind, M.J., Pearson, A.D., Beaune, P.H., and Jeffrey, R.I. 1994. Identification of the major

15
human hepatic cytochrome P450 involved in activation and N-dechloroethylation of ifosfamide.
Biochem Pharmacol 47: 1157-1163.
Whitley, R.J., Blum, M.R., Barton, N., and de Miranda, P. 1982. Pharmacokinetics of acyclovir
in humans following intravenous administration. A model for the development of parenteral
antivirals. Am J Med 73: 165-171.

16
Chapter 2
Hypotheses and Objective
2.1 Hypotheses
The preceding chapter highlights that there are several important knowledge gaps in the study of
the nephrotoxicity that is induced by the widely used antiviral agent, acyclovir. To summarize;
to date, research has not investigated whether: (1) acyclovir induces direct insult to renal tubular
cells, (2) the acyclovir aldehyde metabolite plays a role in the pathogenesis of this
nephrotoxicity, (3) whether the antiviral agent inhibits the tubular secretion of the biological
marker of renal function, creatinine and (4) whether acyclovir is a substrate for the human BCRP
efflux transporter which is expressed in the human kidney and therefore, may have important
toxicological consequences in the pathogenesis of its direct renal tubular injury.
Therefore, the following hypotheses were derived for this thesis:
(I) Acyclovir – induced nephrotoxicity is due to, in part, direct insult to renal tubular
cells.
(II) Acyclovir aldehyde plays a role in the direct renal tubular injury induced by
acyclovir.
(III) Acyclovir inhibits the renal tubular secretion of creatinine.
(IV) Acyclovir is a substrate for human BCRP.

17
2.2 Objectives
The objectives of this thesis were:
(I) To determine whether acyclovir – induced nephrotoxicity is due to, in part, direct
insult to renal tubular cells.
(II) To determine whether acyclovir aldehyde plays a role in the direct renal tubular
injury induced by acyclovir.
(III) To determine whether acyclovir inhibits the renal tubular secretion of creatinine.
(IV) To determine whether acyclovir is a substrate for human BCRP.

18
Chapter 3
Comparison of the novel HK-2 human renal proximal tubular cell
line with the standard LLC-PK1 cell line in studying drug-induced
nephrotoxicity
Patrina Gunness,a,b
Katarina Aleksa,a Kazuhiro Kosuge,
a Shinya Ito,
a,b Gideon Koren
a,b
aDivision of clinical Pharmacology and Toxicology, The Hospital for Sick Children, 555
University Avenue, Toronto, ON, M5G 1X8, Canada
bGraduate Department of Pharmaceutical Sciences, Leslie Dan Faculty of Pharmacy, University
of Toronto, ON, M5S 3M2, Canada
This article has been published: Gunness, P., Aleksa, K., Kosuge, K., Ito, S., and Koren, G.
2010. Comparison of the novel HK-2 human renal proximal tubular cell line with the standard
LLC-PK1 cell line in studying drug-induced nephrotoxicity. Can J Physiol Pharmacol 88: 448-
455. This article was originally published by NRC Research Press.
[PG performed the acyclovir experiments and prepared the manuscript for submission; KA and
KK performed the ifosfamide experiments]

19
3.1 Abstract
Established cell lines are widely used as in vitro models in toxicology studies. The choice of an
appropriate cell line is critical when performing studies to elucidate drug-induced toxicity in
humans. The porcine renal proximal tubular cell line (LLC-PK1) is routinely used to study the
nephrotoxic effects of drugs in humans. However, there are significant interspecies differences in
drug pharmacokinetics and pharmacodynamics. The objective of this study was to determine
whether the human renal proximal tubular cell line (HK-2) is an acceptable model to use when
performing in vitro toxicity studies to predict effects in humans. We examined 2 nephrotoxic
agents, ifosfamide and acyclovir that exhibit different clinical nephrotoxic patterns. HK-2 cells
metabolized IFO to its nephrotoxic metabolite, chloroacetaldehyde. Acyclovir induced a
concentration-dependent decrease in HK-2 cell viability, suggesting that acyclovir may induce
direct insult to renal proximal tubular cells. The results support clinical pathology data in humans
and suggest that HK-2 cells are a suitable model to use in in vitro toxicity studies to determine
drug-induced nephrotoxicity in humans.
3.2 Introduction
Over the past 25 yrs, in vitro models have become widely used in toxicology studies, with
established cell lines being the most common models for in vitro toxicity studies (Zucco et al.
2004). The choice of the appropriate cell line may be critical when performing in vitro studies to
elucidate the mechanisms of drug-induced toxicity in humans. The porcine renal proximal
tubular cell line LLC-PK1 is routinely used to study drug-induced nephrotoxicity.
LLC-PK1 cells, derived from the kidney of a juvenile male Hampshire pig, retain morphological
and biochemical characteristics similar to those of human renal proximal tubular cells (Perantoni

20
and Berman 1979). However, there are significant interspecies differences in drug disposition
(Riddick 1998; Eaton and Klaassen 2001). Therefore, caution must be taken when extrapolating
results from LLC-PK1 cells to humans. Conceptually, the use of a cell line derived from the
human kidney would be a more appropriate model to use for in vitro toxicity studies.
The human renal proximal tubular cell line HK-2 was derived from the healthy kidney of an
adult male (Ryan et al. 1994). Similar to LLC-PK1 cells, the HK-2 cell line has retained
morphological and biochemical characteristics consistent with those of human renal proximal
tubular cells (Ryan et al. 1994). To validate HK-2 cells as a nephrotoxic model and compare it
with LLC-PK1 cells, we used 2 nephrotoxic drugs with substantial serious effects in children.
Ifosfamide is an alkylating agent that is used in the treatment of various pediatric tumors,
including Wilms' tumor, rhabdomyosarcoma, neuroblastoma, bone sarcomas, and soft tissue
sarcomas (Sladek 1988; Carli et al. 2003). However, ifosfamide induces nephrotoxicity in
approximately 30 % of treated children (Skinner et al. 1996). Ifosfamide – induced
nephrotoxicity is characterized by renal glomerular and tubular damage (Skinner et al. 1996;
Loebstein and Koren 1998; Skinner 2003). Severe cases of ifosfamide – induced nephrotoxicity
are characterized by the Fanconi syndrome (Aleksa et al. 2005a; Rossi et al. 1999), in which
phosphate, glucose, amino acids, and low molecular weight proteins are lost from the renal
tubules (Rossi et al. 1999; Skinner 2003).
Ifosfamide is a prodrug that is metabolized in vivo to the alkylating ifosfamide mustard (Brade et
al. 1985) by various cytochrome P450 (CYP) enzymes (CYP 3A4, CYP 3A5, CYP 3A7, and
CYP 2B6) (Chang et al. 1993; Walker et al. 1994; Chen et al. 2005; McCune et al. 2005). The
metabolism of ifosfamide results in production of the nephrotoxic metabolite chloroacetaldehyde
21
(Aleksa et al. 2005a), and therefore cell lines that are used to study ifosfamide nephrotoxicity
must possess the enzymes necessary for metabolizing the drug to chloroacetaldehyde.
Additionally, ifosfamide is administered clinically as a racemic mixture of its R and S
enantiomers (Roy et al. 1999). Therefore, cell lines employed in in vitro ifosfamide
nephrotoxicity studies should ideally be able to metabolize both enantiomers of ifosfamide.
Aleksa et al. (2005a) reported that LLC-PK1 cells are a suitable model for studying ifosfamide
nephrotoxicity. However, interspecies differences in drug disposition exist, and hence the results
obtained from ifosfamide nephrotoxicity studies that employ LLC-PK1 cells may not provide a
suitable prediction of events that could occur in humans.
Acyclovir (9-(2-hydroxyethoxymethyl) guanine) is an antiviral drug that is used in the treatment
of several types of viral infections in children, including herpes simplex virus types 1 and 2 and
varicella-zoster virus (Elion 1983; Richards et al. 1983; Wagstaff et al. 1994). There is minimal
toxicity observed with use of acyclovir, and local irritation at the site of injection is observed in
some patients (Keeney et al. 1982). However, nephrotoxicity and, in some cases, serious acute
renal failure have been reported in children and adults (Brigden et al. 1982; Peterslund et al.
1988; Sawyer et al. 1988; Becker et al. 1993; Ahmad et al. 1994; Vachvanichsanong et al. 1995).
Acyclovir is generally thought to induce nephrotoxicity via crystalluria, which leads to
obstructive nephropathy (Brigden et al. 1982; Sawyer et al. 1988; Lyon et al. 2002; Mason and
Nickols 2008). Adequate hydration, avoidance of rapid intravenous doses, and dose adjustments
are recommended preventative strategies for acyclovir-induced nephrotoxicity (Brigden et al.
1982; Sawyer et al. 1988). However, a recent study by Schreiber et al. (2008) found that
adequate hydration did not prevent nephrotoxicity in some children who received acyclovir

22
therapy. Additionally, there have been several reports of acyclovir-induced nephrotoxicity with
biopsy evidence of tubular damage in the absence of crystal formation (Becker et al. 1993;
Ahmad et al. 1994; Vomiero et al. 2002). These reports suggest that acyclovir induces direct
insult to renal tubular cells. Results from in vitro toxicity studies using an appropriate cell line
might enable us to determine whether acyclovir induces direct renal tubular damage and the
mechanisms by which this occurs in humans. Ideally, the in vitro studies should use a cell line,
such as HK-2, that has been derived from human kidney. Given that interspecies variation would
be absent, HK-2 should be the more appropriate model, compared with nonhuman-derived cell
lines, with which to predict acyclovir nephrotoxicity in humans.
In children, ifosfamide and acyclovir are first-line treatments for cancer and viral infections,
respectively. However, in some children, the use of ifosfamide or acyclovir results in severe
nephrotoxicity, which adversely affects the overall health of children. Therefore, elucidating the
mechanisms of this drug – induced nephrotoxicity will aid in the design of safer drug therapy for
children.
Currently, owing to interspecies differences in drug pharmacology and toxicology, the use of
LLC-PK1 cells in in vitro nephrotoxicity studies limits the extrapolation of results to humans.
The results from studies using a cell line derived from human kidney, such as the HK-2 cell line,
would be more applicable to humans. Therefore, we hypothesized that the HK-2 cell line is an
acceptable in vitro model to use in nephrotoxicity studies. The objective of this study was to
determine whether the HK-2 cell line is an acceptable cell culture model to use in in vitro studies
that are aimed at elucidating the etiology of drug-induced nephrotoxicity in humans.
23
3.3 Materials and methods
To determine the appropriateness of HK-2 cells as a model to study ifosfamide – induced
nephrotoxicity, the following experiments were conducted: (i) Reverse Transcription-Polymerase
Chain Reaction (RT-PCR) and western blots were performed to determine messenger RNA
(mRNA) and protein expression of CYP3A and CYP2B in HK-2 cells, (ii) high performance
liquid chromatography-mass spectrometry (LC-MS) was performed to determine the renal
proximal tubular metabolism of ifosfamide in HK-2 cells, and (iii) a standard glutathione (GSH)
colorimetric assay was used to determine depletion of GSH levels in HK-2 cells after exposure to
the GSH-depleting agent L-buthionine sulfoximine (BSO).
To determine whether HK-2 cells are an appropriate model to study acyclovir-induced
nephrotoxicity, HK-2 cells were exposed to a range of acyclovir concentrations [0 – 2000 µg/mL
(0 – 8.89 mmol/L)] for 24 hrs, and cytotoxicity was measured by alamarBlue™
assay.
3.3.1 Chemicals
Racemic ifosfamide (50/50 (R/S)-ifosfamide) and individual enantiomers of 2-
dechloroethylifosfamide [(R)-2-DCEIF, (S)-2-DCEIF] and 3-dechloroethylifosfamide [(R)-3-
DCEIF, (S)-3-DCEIF] were purchased from Niomech, Germany. Deuterated racemic 2-DCEIF
(d2-2-DCEIF) (50/50 R/S) and 3-DCEIF (d4-3-DCEIF) (50/50 R/S) were kindly provided by Dr.
Susan Ludeman of Duke University (USA). Individual ifosfamide enantiomers [(S)-ifosfamide
and (R)-ifosfamide] were kindly provided by Mr. Ben Skeed (Chiroscience, England) Acyclovir
sodium solution (Zovirax®) was purchased from the Hospital for Sick Children pharmacy
(Toronto, Ontario, Canada).
24
For western blotting, rabbit anti-human polyclonal peptide antibody to CYP 2B6, rabbit anti-
human polyclonal antibody to CYP 3A5, and rabbit anti-human polyclonal antibody to CYP
3A4 were all purchased from BD Biosciences (Mississauga, Ontario, Canada). Donkey anti-
rabbit immunoglobulin G – horseradish peroxidise (IgG-HRP) was purchased from Amersham
Bioscience (Baie d’Urfe, Québec, Canada). Fluorometric alamarBlue reagent was purchased
from Invitrogen Canada Inc. (Burlington, Canada. Glutathione colorimetric assay kits, GT-10,
were purchased from Oxford Biomedical Research (Rochester Hills, Michigan, USA).
3.3.2 HK-2 cells
HK-2 cells were purchased from the American Type Culture Collection (ATCC) (Manassas,
Virginia, USA). The ifosfamide and acyclovir experiments were conducted by different
laboratory personnel and at different times. Therefore, the HK-2 cells were cultured differently
for ifofamide and acyclovir experiments as outlined in the following sections. All experiments
were conducted on cells that were grown to 80 – 85 % confluence.
3.3.2a Culturing conditions of HK-2 cells for ifosfamide experiments
The cells were maintained according to the recommendations provided by Detrisac et al. 1984.
The cells were cultured in Dulbecco's modified Eagle's minimum essential medium/Ham's F-12
(DMEM/F12) supplemented with 10 % (v/v) fetal bovine serum (FBS) (Gibco, Burlington,
Ontario, Canada) with 2 µmol/L L-glutamine, 20 mmol/L Hepes buffer (Gibco), 10 mg/L inulin,
5.5 mg/L transferrin, 6.7 µg/L sodium selenite, 100 Units/mL penicillin, and 100 µg of
streptomycin. Cells were maintained at 37◦C in a sterile, humidified atmosphere of 5 % CO2 and
95% O2.

25
3.3.2b Culturing conditions of HK-2 cells for acyclovir experiments
The cells were maintained according to ATCC guidelines. Briefly, cells were cultured in
keratinocyte serum-free medium (SFM) supplemented with 5 ng/mL human recombinant
epidermal growth factor and 0.05 mg/mL bovine pituitary extract (Invitrogen Canada Inc.). Cells
were maintained at 37◦C in a sterile, humidified atmosphere of 5 % CO2 and 95 % O2.
3.3.3 LLC-PK1 cells
The LLC-PK1 cell line was purchased from ATCC. The cells were maintained according to
ATCC guidelines. All experiments were conducted on cells that were grown to 80 – 85 %
confluence.
3.3.3a Culturing conditions of LLC-PK1 cells for ifosfamide experiments
The cells were cultured in DMEM supplemented with 2 mmol/L L-glutamine, 100 Units/mL
penicillin, 100 µg streptomycin (Invitrogen Canada Inc.), and 10 % (v/v) FBS (Gibco). Cells
were maintained at 37◦C in a sterile, humidified atmosphere of 5 % CO2 and 95 % O2.
3.3.3b Culturing conditions of LLC-PK1 cells for acyclovir experiments
The cells were cultured in HyClone MEM alpha modified (α-MEM, Fisher Scientific, Ottawa,
Ontario, Canada), supplemented with 2 mmol/L L-glutamine, 100 Units/mL penicillin, 100 µg of
streptomycin (Invitrogen Canada Inc.), and 10 % (v/v) FBS (Invitrogen Canada Inc.). Cells were
maintained at 37◦C in a sterile, humidified atmosphere of 5 % CO2 and 95 % O2.

26
3.3.4 Experimental methods used to determine whether HK-2 cells are an appropriate
model to study ifosfamide – induced nephrotoxicity
3.3.4a Determination of CYP enzyme mRNA expression in HK-2 cells by RT-PCR
Total RNA was extracted from HK-2 cells by using an RNeasy kit (Qiagen, Toronto, Ontario,
Canada) and subsequently reverse transcribed after previous digestion of possible contaminating
genomic DNA. The reverse transcription reaction was performed with 10 µg of total RNA.
Previously published primers were chosen for PCR amplifications of CYP 3A4 [forward primer
5'-GCAAAGAGCAACACAGAGCTG-3'; reverse primer 5'-GTGATAGCCAGCACAGGCTG-
3'] (Xu et al. 2005), CYP 3A5 [forward primer 5'-GAAGAAAAGTCGCCTCAAC-3'; reverse
primer 5'-AAGAAGTCCTTGCGTGTGTCTA-3'] (Jover et al. 2001), and β-actin [forward
primer 5'-CTACAATGAGCTGCGTGTGG-3'; reverse primer 5'-
TAGCTCTTCTCCAGGGAGGA-3'] (Giannone et al. 1998). Specific primers were designed for
CYP3A7 [foward primer 5’-CCTCTGCCTTTTTTGGGAAATGC-3’; reverse primer 5'-
GAGCTTTGTGGGTCTCAGAG-3']. A 2 µmol/L reverse transcriptase product was used for
PCR amplification in a 20 µmol/L reaction. The annealing temperature was 61◦C for CYP 3A4,
CYP 3A5, CYP 3A7, and β-actin. The PCR reactions were optimized to ensure that PCR
products for each gene were obtained in the linear range of the reaction. Results were quantified
on a 1.5 % agarose gel and digitalized by Fluorchem (Innotech USA Inc., Tarrytown, New York,
USA).
Each PCR reaction consisted of 5 µmol/L of Expand High Fidelity buffer without magnesium
chloride (MgCl2) (Roche, Mississauga, Ontario, Canada), 0.2 mmol/L each deoxyribonucleotide
triphosphate (dNTP), 2.5 mmol/L MgCl2, 3 µmol/L of copy DNA (cDNA), 300 ng of each
27
primer, 3.5 Units of Expand High Fidelity enzyme (Roche), and water to a final volume of 50
mL. The amplification conditions were as follows: an initial denaturation at 95◦C for 5 mins
followed by 35 cycles at 95◦C for 30 secs, 54
◦C for 30 secs, and 72
◦C for 40 secs, with a final
elongation step of 72◦C for 10 mins. The experiment was not replicated.
3.3.4b Determination of CYP enzyme protein expression in HK-2 cells by Western blotting
The protein expression of CYP3A and CYP2B was detected in HK-2 cells by subjecting samples
(30 µg total protein was loaded in each lane) to one-dimensional sodium dodecyl sulfate –
polyacrylamide gel electrophoresis (SDS PAGE) on 10 % gels. CYP 3A4 and CYP 2B6
supersomes (BD Biosciences) were used to confirm the presence of these proteins. Proteins were
transferred to a hydrophobic polyvinylidene difluoride (PVDF) membrane (Amersham).
Nonspecific sites were blocked with 5 % (w/v) low-fat milk in phosphate-buffered saline (PBS)
solution overnight at 4◦C, and proteins were incubated with polyclonal antibodies (anti-CYP 3A5
or anti-CYP 3A4 (1:500) or anti-CYP 2B6 (1:500)). Membranes were then incubated with
donkey anti-rabbit IgG horseradish peroxidase-linked secondary antibody at a dilution of 1:8000
and developed with the Amersham enhanced chemiluminescence (ECL) detection cocktail. The
ECL-detected blots were exposed to radiographic film (Hyperfilm ECL, Amersham) and
developed with a Kodak developer. The experiment was performed in replicates of 3.
3.3.4c Determination of renal proximal tubule metabolism of ifosfamide in HK-2 cells by
LC-MS
The HK-2 or LLC-PK1 cells were seeded and allowed to rest for 24 hrs after which they were
incubated with media containing (R)-ifosfamide or (S)-IF (0, 1, 10, 100, and 1000 µmol/L) for
28
96 hrs. Cell culture media were pooled, and on the final day of the experiment the cells were
solubilized with 100 µmol/L of 0.1 % (w/v) SDS containing 1 mmol/L EDTA to assess
metabolite production. The samples were flash-frozen in liquid nitrogen and stored at -80◦C so
that they could be analyzed in batches. On the day of the experiment, 50 ng of d6-2-DCEIF and
50 ng of d4-3-DCEIF (internal standards) were added, and the samples were vortexed for 30 secs.
Five mL of methylene chloride was added, and the samples were vortexed for 1 min and then
centrifuged at 2095 x g for 10 mins at 4◦C. Once the aqueous layer was removed, the organic
layer was dried under nitrogen. Samples were reconstituted with 30 µmol/L of ethyl acetate. A 1
µmol/L sample was analyzed for (R)-IF, (S)-IF, (R)-2-DCEIF, (S)-2-DCEIF, (R)-3-DCEIF, and
(S)-3-DCEIF by using LC-MS. The experiment was replicated 3 times. Results are presented as
means ± SD of 3 independent experiments.
LC-MS conditions
An 1100 series high performance liquid chromatography (HPLC) (Agilent Technologies,
Mississauga, Ontario, Canada) equipped with an 1100 series binary pump was used for analysis.
Analytes were separated with a Chiral-AGP column (150 mm x 4.0 mm; 5 µm) (Chrom Tech,
Madison, Wisconsin, USA) by using (i) 10 mmol/L ammonium acetate in water (pH 7) and (ii)
30 mmol/L ammonium acetate in water (pH 4). Samples were introduced into the
chromatographic system with an Agilent 1100 series autosampler. Analysis was carried out
under ambient temperatures.
Mass spectrometric detection was performed on an LC-MS/MS API4000 triple-quadrupole
(Applied Biosystems, MDS Sciex, Foster City, California, USA) equipped with an API turbo ion
spray ionization source. The mass spectrometer was operated in positive ion mode, and the

29
analytes were quantified by using multiple reactions monitored (MRM). The transitions
monitored were m/z 199.1 to 92.1 (approximately 50 – 60 % separation) for (R)- and (S)-2-
DCEIF, m/z 199.1 to 78.1 for (R)- and (S)-3-DCEIF, m/z 205.2 to 96.2 (approximately 50 – 60
% separation) for (R)- and (S)-d6-2-DCEIF, and m/z 203.2 to 77.9 for (R)- and (S)-d4-3-DCEIF.
Although (R) and (S)-isofamide were not routinely monitored, their transitions were m/z 261.1 to
154. The declustering potential (DP), collision energy (CE), and other parameters for all the
analytes as well as the internal standard were optimized individually. The ion spray voltage was
set at 5.5 kV, and the source temperature was maintained at 500◦C. Data acquisition was
performed with MDS Sciex Analyst software (version 1.4). Calibration and analytical standard
curves were constructed by using the peak area ratios of analyte to internal standard. Test
samples and quality control samples were then interpolated from the calibration curve to obtain
the concentrations of the respective analytes.
3.3.4d Determination of GSH levels in HK-2 and LLC-PK cells
To determine GSH levels in HK-2 and LLC-PK1 cells before and after treatment with ifosfamide
with or without BSO, 1E+06 cells were plated per well in a 12-well plate. After 24 hrs, the cells
were treated with various concentrations of ifosfamide (1 – 1000 µmol/L) and (or) 250 µmol/L
BSO. Twenty-four hours after the last treatment, cells were washed with 500 µL of ice-cold PBS
(pH 7.4), after which 200 µL of 0.05 % trypsin was added. After 1 min of incubation, the cells
were washed with 500 µL of ice-cold PBS, collected, and then centrifuged at 3300 x g for 10
mins at 4◦C. A 100 µL aliquot of PBS was added to the pellet, and the sample was vortexed to
form a suspension. Fifty µL aliquots of the suspension were used for the glutathione disulfide
30
(GSSG) and GSH assay. The GSSG and GSH levels were determined with a modification of the
GT-30 GSSG/GSH colorimetric assay kit.
A 10 µL aliquot of 1-methyl-2-vinylpyridinium trifluoromethanesulfonate (M2VP) scavenger
from the GT-30 kit was added to the 50 µL cellular suspension. The sample was mixed and then
incubated for 10 mins at room temperature, after which 50 µL of ice-cold 5 % metaphosphoric
acid was added and the sample vortexed for 20 secs and then centrifuged at 1000 x g for 10 mins
at 4◦C. A 50 µL sample was transferred to a 96-well plate. A 50 µL aliquot of chromogen (5,5'-
dithiobis-2-nitrobenzoic acid (DNTB) in sodium phosphate (NaPO4) with
ethylenediaminetetraacetic acid (EDTA) and ethanol) from the GT-30 kit were added to each
sample. Absorbance was measured at 412 nm. The GSSG was quantified by using a standard
curve with a concentration range of 0.05 – 1.5 µmol/L.
For the GSH assay, 50 µL of ice-cold 5 % metaphosphoric acid was added to a 50 µL cellular
suspension. The sample was vortexed for 20 secs and then centrifuged at 1000 x g for 10 mins at
4◦C. A 50 µL sample was transferred to a 96-well plate. A 50 µL aliquot of chromogen (DNTB
in NaPO4 with EDTA and ethanol), 50 µL of enzyme (GR in NaPO4 with EDTA), and 50 µL of
NADPH from the GT-30 kit were added to each sample. Absorbance was measured at 412 nm.
GSH was quantified by using a standard curve with a concentration range of 0.1 – 3 µmol/L. The
experiment was performed in replicates of 3. Results are presented as means ± SD of 3
independent experiments.

31
3.3.5 Experimental method used to determine whether HK-2 cells are an appropriate
model to study acyclovir – induced nephrotoxicity
3.3.5a Determination of cytotoxicity in HK-2 and LLC-PK1 cells
Cells were seeded 2.5E+05 cells per well in 12-well plates (VWR International, Mississauga,
Ontario, Canada). Cells were exposed to a range of acyclovir concentrations (0 – 2000 µg/mL) in
complete growth media for 24 hrs. The acyclovir concentrations correspond to concentrations of
the drug that can be encountered by renal proximal tubular cells (Hintz et al. 1982).
Cytotoxicity was measured at the end of the 24 hrs exposure to acyclovir. The alamarBlue™
(10% (v/v) final concentration) was added to cell cultures 2.5 hrs before the end of the
incubation period with acyclovir. After incubation, cytotoxicity was assessed by measuring
fluorescence on a BioTek® Synergy HT microplate fluorometer (Fisher Scientific) at excitation
and emission wavelengths of 540 and 590 nm, respectively. The experiment was performed in
replicates of 3. Results are presented as means ± standard error (SE) of 3 independent
experiments.
3.3.6 Statistical analyses
Statistical analyses of the results obtained from the ifosfamide experiments were performed with
SigmaStat 3.1 software. Statistically significant differences between the control and treatment
groups were determined by unpaired Student's t tests. Differences were considered significant if
p<0.05.

32
Statistical analyses of the results obtained from the acyclovir experiments were performed with
SPSS 14.0 for Windows. Statistically significant differences between the control and treatment
groups were determined by one way Analysis of Variance (ANOVA) followed by 2-sided
Dunnett's post hoc tests. Differences were considered significant if p<0.05.
3.4 Results
3.4.1 CYP mRNA and protein expression in HK-2 cells
Figure 4 illustrates that HK-2 cells possess CYP 3A4 and CYP 3A7 mRNA. The RNA identity
was confirmed by sequencing and comparison with the BLAST database. Immunoblot analyses
identified a single band of CYP 3A4 at 50 kDa (Figure 5). CYP 3A5 and CYP 2B6 were not
detected. The CYP 3A4, CYP 3A5, and CYP 2B6 supersomes were used as positive controls.
Figure 4. Total ribonucleic acid (RNA) was isolated from human renal proximal tubular (HK-2)
cells and reverse transcribed. The copy DNA (cDNA) was probed for the presence/absence of
cytochrome P450 (CYP) enzymes with the primers described in the Materials and methods.
Lane 1 – CYP 3A4; Lane 2 – CYP 3A7; Lane 3 – CYP 3A5; Lane 4 – β-actin; Lane 5 – CYP
3A4 primer; Lane 6 – CYP 3A7 primer; Lane 7 – CYP 3A5 primer. The CYP mRNA
expression presented is from 1 experiment.

33
Figure 5. Western blot of human renal proximal tubular (HK-2) cells for cytochrome P450
(CYP) enzymes. Total protein from HK-2 cells and pure CYP 2B6 and CYP 3A4 and 3A5
supersomes were separated on a 10 % sodium dodecyl sulfate – polyacrylamide gel
electrophoresis (SDS-PAGE) and subsequently immunoblotted with CYP 3A4, 3A5 and 2B6
antibodies. The CYP 3A4 protein was present in the cells and had the expected molecular
weight of 49 kDa. The CYP 3A4 antibody did not cross react with the CYP 3A5 supersomes,
CYP 2B6, CYP 3A4 and CYP 3A5 supersomes (positive controls) are shown in the first lane for
each CYP (lanes 1, 4 and 7). The HK-2 total protein is shown in the other two lanes (lanes 2 and
3 for CYP3A4, lanes 5 and 6 for CYP 3A5 and lanes 8 and 9 for CYP 2B6). The western blot
presented is representative of 3 independent experiments.
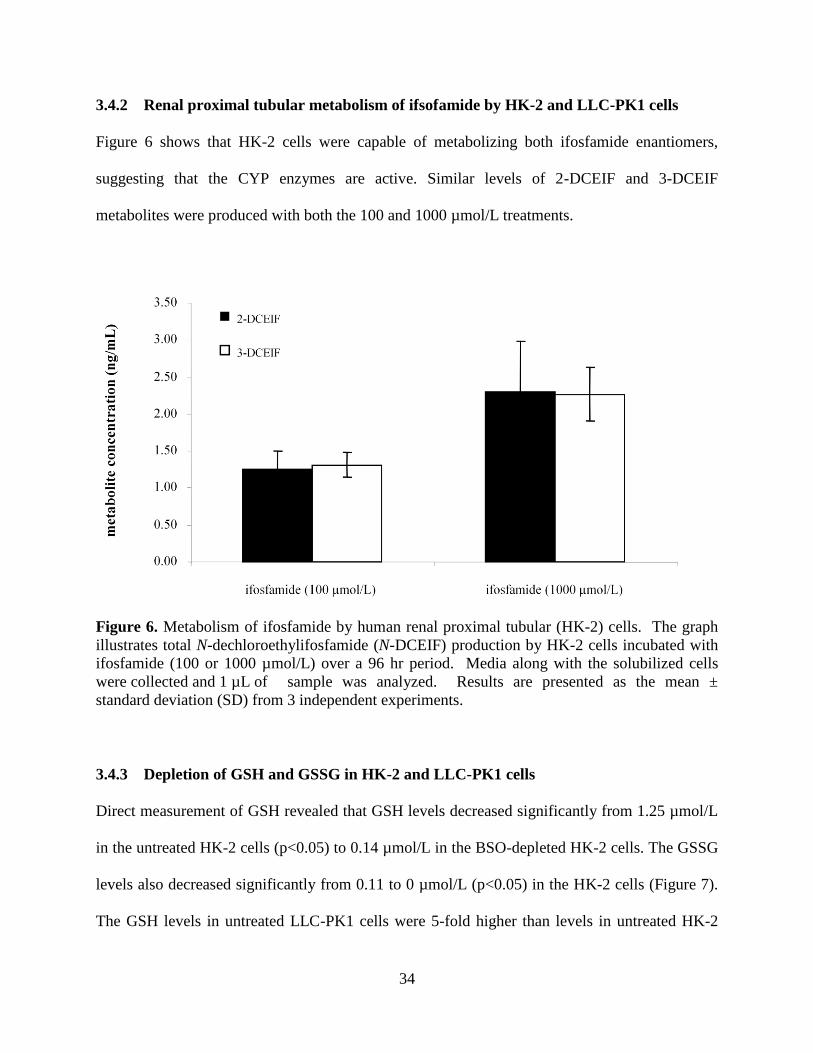
34
3.4.2 Renal proximal tubular metabolism of ifsofamide by HK-2 and LLC-PK1 cells
Figure 6 shows that HK-2 cells were capable of metabolizing both ifosfamide enantiomers,
suggesting that the CYP enzymes are active. Similar levels of 2-DCEIF and 3-DCEIF
metabolites were produced with both the 100 and 1000 µmol/L treatments.
Figure 6. Metabolism of ifosfamide by human renal proximal tubular (HK-2) cells. The graph
illustrates total N-dechloroethylifosfamide (N-DCEIF) production by HK-2 cells incubated with
ifosfamide (100 or 1000 µmol/L) over a 96 hr period. Media along with the solubilized cells
were collected and 1 µL of sample was analyzed. Results are presented as the mean ±
standard deviation (SD) from 3 independent experiments.
3.4.3 Depletion of GSH and GSSG in HK-2 and LLC-PK1 cells
Direct measurement of GSH revealed that GSH levels decreased significantly from 1.25 µmol/L
in the untreated HK-2 cells (p<0.05) to 0.14 µmol/L in the BSO-depleted HK-2 cells. The GSSG
levels also decreased significantly from 0.11 to 0 µmol/L (p<0.05) in the HK-2 cells (Figure 7).
The GSH levels in untreated LLC-PK1 cells were 5-fold higher than levels in untreated HK-2

35
cells. The GSH levels decreased significantly in LLC-PK1 cells (from 5.68 to 0.76 µmol/L, p<
0.05), as did the GSSG levels (1.14 to 0 µmol/L, p<0.05).
Figure 7. Glutathione (GSH) depletion in human (HK-2) and porcine (LLC-PK1) renal proximal
tubular cells. The GSH and glutathione disulfide (GSSG) levels were determined using a
colorimetric method described in the Materials and methods section. The GSH and GSSG levels
were significantly decreased in both HK-2 and LLC-PK1 cells treated with 250 µmol/L L-
buthionine sulfoximine (BSO) for 24 hrs. Results are means ± standard deviation (SD) of 3
independent experiments. Statistically significant (p<0.05) differences from untreated HK-2
control are denoted by the symbol *. Statistically significant (p<0.05) differences from untreated
LLC-PK1 control are denoted by the symbol †.
-1
0
1
2
3
4
5
6
7
HK-2 control HK-2 BSO depletion LLC-PK1 control LLC-PK1 BSO
depletion
con
cen
tra
tio
n (
µm
ol/
L)
GSH
GSSG
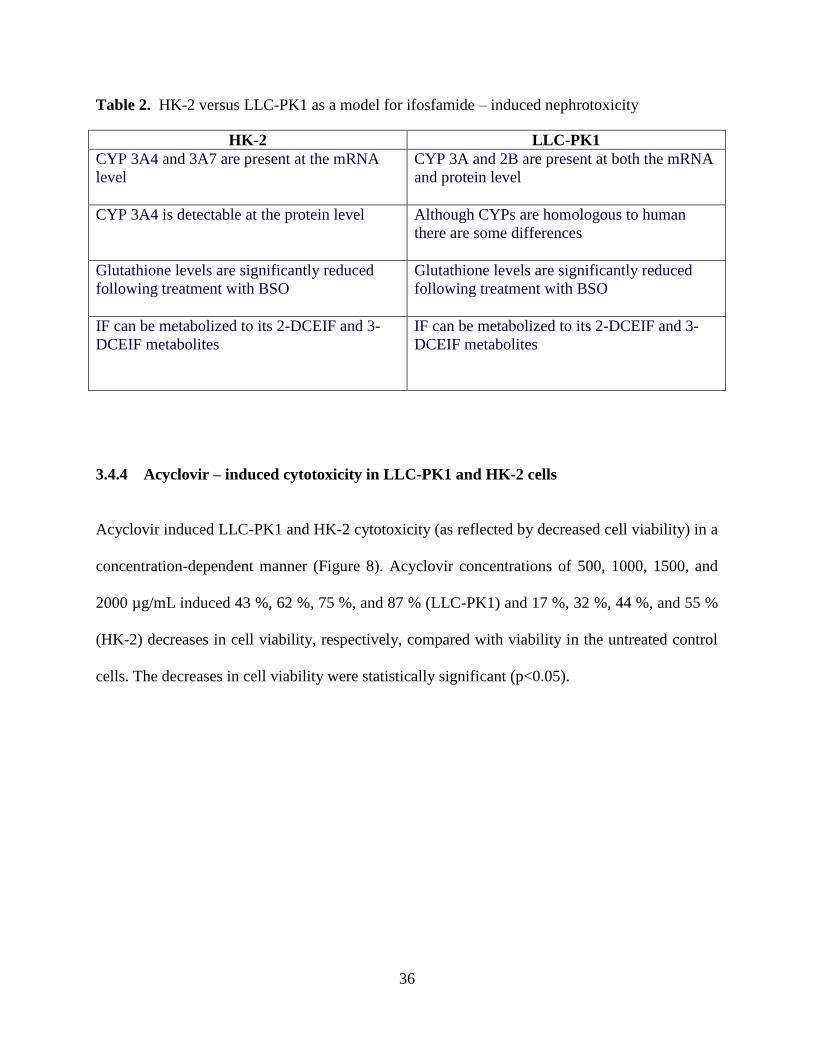
36
Table 2. HK-2 versus LLC-PK1 as a model for ifosfamide – induced nephrotoxicity
HK-2 LLC-PK1
CYP 3A4 and 3A7 are present at the mRNA
level
CYP 3A and 2B are present at both the mRNA
and protein level
CYP 3A4 is detectable at the protein level
Although CYPs are homologous to human
there are some differences
Glutathione levels are significantly reduced
following treatment with BSO
Glutathione levels are significantly reduced
following treatment with BSO
IF can be metabolized to its 2-DCEIF and 3-
DCEIF metabolites
IF can be metabolized to its 2-DCEIF and 3-
DCEIF metabolites
3.4.4 Acyclovir – induced cytotoxicity in LLC-PK1 and HK-2 cells
Acyclovir induced LLC-PK1 and HK-2 cytotoxicity (as reflected by decreased cell viability) in a
concentration-dependent manner (Figure 8). Acyclovir concentrations of 500, 1000, 1500, and
2000 µg/mL induced 43 %, 62 %, 75 %, and 87 % (LLC-PK1) and 17 %, 32 %, 44 %, and 55 %
(HK-2) decreases in cell viability, respectively, compared with viability in the untreated control
cells. The decreases in cell viability were statistically significant (p<0.05).

37
Figure 8. Acyclovir – induced cytotoxicity in human (HK-2) and porcine (LLC-PK1) renal
proximal tubular cells. Cells were exposed to acyclovir in complete growth media for 24 hrs.
Cytotoxicity (measured as a function of cell viability) was measured using the fluorometric
alamarBlue™
assay. Cell viability is expressed as a percent (%) of the fluorescence of untreated
cell cultures. Results are presented as the mean ± standard error (SE) of 3 independent
experiments. Statistically significant (p<0.05) differences between untreated control and treated
groups are denoted by the symbol *.
3.5 Discussion
Ifosfamide and acyclovir are 2 essential therapeutic agents used to treat children with various
types of cancers and viral infections, respectively. Unfortunately, the use of ifosfamide or
acyclovir induces severe nephrotoxicity in some children (Brigden et al. 1982; Peterslund et al.
1988; Sawyer et al. 1988; Becker et al. 1993; Vachvanichsanong et al. 1995; Skinner 2003;
Ahmad et al. 1994; Skinner et al. 1996; Loebstein and Koren 1998; Rossi et al. 1999).
Nephrotoxicity can adversely affect a child's overall health and well-being, and it is therefore
*
*
*
*
*
*
*
*
0
20
40
60
80
100
120
0 500 1000 1500 2000
cell
via
bil
ity
(%
co
ntr
ol)
[acyclovir] (µg/mL)
HK-2 cells
LLC-PK1 cells

38
imperative to investigate the mechanisms of drug-induced nephrotoxicity to aid in the design of
safer drug therapies for children.
A major issue in elucidating the toxicological mechanisms of drugs on organ function is in
identifying an experimental model that approximates the human situation. Over the past few
decades, the porcine renal proximal tubular cell line LLC-PK1 has been extensively used for this
purpose. While the similarities between human and porcine physiology, pharmacology, and renal
function have been widely acknowledged, it would be preferable to attempt to identify a human
cell line that can more accurately reflect conditions in humans. The HK-2 cell line has emerged
as such an alternative. Yet, to date, little effort has been made to compare it with standard
experimental cell lines.
The results of this study employing 2 nephrotoxic drugs, ifosfamide and acyclovir, show that the
human-derived renal proximal tubular cell line HK-2 may be a suitable model for studying drug-
induced nephrotoxicity in humans. The RT-PCR, Western blot, and LC-MS analyses revealed
that similar to the human kidney, HK-2 cells express CYP 3A4 mRNA and protein (Figures 4
and 5). Additionally, RT-PCR analyses show that HK-2 cells express CYP 3A7 mRNA (Figure
4). Compared with mRNA expression of CYP 3A4, which of CYP 3A7 is lower in HK-2 cells.
The lower expression of CYP 3A7 in HK-2 cells may be due to the fact that in humans the
expression of CYP 3A7 is reduced shortly after birth (de Wildt et al. 1999). Although CYP 3A5
and CYP 2B6 enzymes are expressed in the kidney (Aleksa et al. 2005b), their expression was
not detected in the HK-2 cells. The lack of detection of CYP 3A5 (mRNA and protein) and CYP
2B6 (protein) expression in HK-2 cells may be due to reduced or absent expression of the
enzymes in the cell line. Aleksa et al. (2005a) found that LLC-PK1 cells were capable of the

39
stereoselective metabolism of ifosfamide. In this present study, we observed that HK-2 cells
were also able to metabolize both ifosfamide enantiomers (Figure 6). Furthermore, results from
the study revealed that, similar to the effects of BSO in LLC-PK1 cells, BSO was able to
efficiently reduce GSH and GSSG levels in HK-2 cells (Figure 7).
Similarly, the results of our cytotoxicity studies revealed that HK-2 cells are an appropriate
model for studying acyclovir – induced nephrotoxicity. Acyclovir induced a concentration-
dependent decrease in LLC-PK1 and HK-2 cell viability (Figure 8). However, in contrast to HK-
2 cells, greater decreases in viability were observed in LLC-PK1 cells. The differences observed
in acyclovir-induced toxicity between LLC-PK1 and HK-2 cells could be attributed to
interspecies differences in drug handling, and they highlight the caution that must be exercised
when nonhuman-derived cell lines are used to predict human responses to drugs and chemicals.
Our finding of acyclovir-induced toxicity in HK-2 and LLC-PK1 cells is the first experimental
evidence to suggest that acyclovir may cause direct insult to renal proximal tubular cells, and
hence it supports clinical pathology data of severe renal damage without evidence of crystalluria
in patients on acyclovir therapy (Becker et al. 1993; Ahmad et al. 1994; Vomiero et al. 2002).
Taken together, the findings from this study indicate that although both LLC-PK1 and HK-2
cells may be reasonable models for in vitro nephrotoxicity studies, the existence of interspecies
differences in drug pharmacology and toxicology may make HK-2 cells the more acceptable cell
culture model to use in in vitro studies aimed at elucidating the nephrotoxicity of drugs in
humans. However, this current working hypothesis remains to be further tested with other
nephrotoxic drugs.

40
3.6 Acknowledgements
The research was funded by a grant from the Canadian Institutes of Health Research (CIHR).
3.7 Statement of significance
To the best of our knowledge, this study is the first to provide in vitro experimental evidence
which supports clinical evidence that acyclovir induces direct insult to renal tubular cells.
Furthermore, the results illustrate that the human renal proximal tubular cell line, HK-2 cells are
an appropriate in vitro model to study drug – induced nephrotoxicity without the need for
concern regarding the interspecies differences that exists in the pharmacological and
toxicological disposition of drugs.

41
3.8 References
Ahmad, T., Simmonds, M., McIver, A.G., and McGraw, M.E. 1994. Reversible renal failure in
renal transplant patients receiving oral acyclovir prophylaxis. Pediatr. Nephrol. 8: 489-491.
Aleksa, K., Halachmi, N., Ito, S., and Koren, G. 2005a. A tubule cell model for ifosfamide
nephrotoxicity. Can. J. Physiol. Pharmacol. 83: 499-508.
Aleksa, K., Matsell, D., Krausz, K., Gelboin, H., Ito, S., and Koren, G. 2005b. Cytochrome P450
3A and 2B6 in the developing kidney: implications for ifosfamide nephrotoxicity. Pediatr.
Nephrol. 20: 872-885.
Becker, B.N., Fall, P., Hall, C., Milam, D., Leonard, J., Glick, A., and Schulman, G. 1993.
Rapidly progressive acute renal failure due to acyclovir: case report and review of the literature.
Am. J. Kidney Dis. 22: 611-615.
Brade, W.P., Herdrich, K., and Varini, M. 1985. Ifosfamide: pharmacology, safety and
therapeutic potential. Cancer Treat. Rev. 12: 1-47.
Brigden, D., Rosling, A.E., and Woods, N.C. 1982. Renal function after acyclovir intravenous
injection. Am. J. Med. 73: 182-185.
Carli, M., Passone, E., Perilongo, G., and Bisogno, G. 2003. Ifosfamide in pediatric solid tumors.
Oncology, 65: 99-104.
Chang, T.K.H., Weber, G.F., Crespi, C.L., and Waxman, D.J. 1993. Differential activation of
cyclophosphamide and ifosphamide by cytochromes P-450 2B and 3A in human liver
microsomes. Cancer Res. 53: 5629-5637.
Chen, C.S., Jounaidi, Y., and Waxman, D.J. 2005. Enantioselective metabolism and cytotoxicity
of R-ifosfamide and S-ifosfamide by tumor cell-expressed cytochromes P450. Drug Metab.
Dispos. 33: 1261-1267.
de Wildt, S.N., Kearns, G.L., Leeder, J.S., and van den Anker, J.N. 1999. Cytochrome P450 3A:
ontogeny and drug disposition. Clin. Pharmacokinet. 37: 485-505.
Detrisac, C.J., Sens, M.A., Garvin, A.J., Spicer, S.S., and Sens, D.A. 1984. Tissue culture of
human kidney epithelial cells of proximal tubule origin. Kidney Int. 25: 383-390.
Eaton, D.L., and Klaassen, C.D. 2001. Principles of toxicology. In Casarett and Doull's
toxicology: the basic science of poisons. Edited by Klaassen, C.D. McGraw-Hill Companies Inc.,
New York. pp. 11-34.
Elion, G.B. 1983. The biochemistry and mechanism of action of acyclovir. J. Antimicrob.
Chemother. 12: 9-17.

42
Giannone, J.V., Li, W., Probst, M., and Okey, A.B. 1998. Prolonged depletion of AH receptor
without alteration of receptor mRNA levels after treatment of cells in culture with 2,3,7,8-
tetrachlorodibenzo-p-dioxin. Biochem. Pharmacol. 55: 489-497.
Hintz, M., Connor, J.D., Spector, S.A., Blum, M.R., Keeney, R.E., and Yeager, A.S. 1982.
Neonatal acyclovir pharmacokinetics in patients with herpes virus infections. Am. J. Med. 73:
210-214.
Jover, R., Bort, R., Gomez-Lechon, M.J., and Castell, J.V. 2001. Cytochrome P450 regulation by
hepatocyte nuclear factor 4 in human hepatocytes: a study using adenovirus-mediated antisense
targeting. Hepatology, 33: 668-675.
Keeney, R.E., Kirk, L.E., and Bridgen, D. 1982. Acyclovir tolerance in humans. Am. J. Med. 73:
176-181.
Loebstein, R., and Koren, G. 1998. Ifosfamide-induced nephrotoxicity in children: critical
review of predictive risk factors. Pediatrics, 101: E8.
Lyon, A.W., Mansoor, A., and Trotter, M.J. 2002. Urinary gems: acyclovir crystalluria. Arch.
Pathol. Lab. Med. 126: 753-754.
Mason, W.J., and Nickols, H.H. 2008. Images in clinical medicine. Crystalluria from acyclovir
use. N. Engl. J. Med. 358: e14.
McCune, J.S., Risler, L.J., Phillips, B.R., Thummel, K.E., Blough, D., and Shen, D.D. 2005.
Contribution of CYP3A5 to hepatic and renal ifosfamide N-dechloroethylation. Drug Metab.
Dispos. 33: 1074-1081.
Perantoni, A., and Berman, J.J. 1979. Properties of Wilms' tumor line (TuWi) and pig kidney
line (LLC-PK1) typical of normal kidney tubular epithelium. In Vitro. 15: 446-454.
Peterslund, N.A., Larsen, M.L., and Mygind, H. 1988. Acyclovir crystalluria. Scand. J. Infect.
Dis. 20: 225-228.
Richards, D.M., Carmine, A.A., Brogden, R.N., Heel, R.C., Speight, T.M., and Avery, G.S.
1983. Acyclovir: a review of its pharmacodynamic properties and therapeutic efficacy. Drugs.
26: 378-438.
Riddick, D.S. 1998. Drug biotransformation. In Principles of Medical Pharmacology. Edited by
Kalant, H., and Roschlau, W.H.E. Oxford University Press, New York. pp. 38-54.
Rossi, R., Pleyer, J., Schafers, P., Kuhn, N., Kleta, R., Deufel, T., and Jurgens, H. 1999.
Development of ifosfamide-induced nephrotoxicity: prospective follow-up in 75 patients. Med.
Pediatr. Oncol. 32: 177-182.

43
Roy, P., Tretyakov, O., Wright, J., and Waxman, D.J. 1999. Stereoselective metabolism of
ifosfamide by human P-450s 3A4 and 2B6. Favorable metabolic properties of R-enantiomer.
Drug Me tab. Dispos. 27: 1309-1318.
Ryan, M.J., Johnson, G., Kirk, J., Fuerstenberg, S.M., Zager, R.A., and Torok-Storb, B. 1994.
HK-2: an immortalized proximal tubule epithelial cell line from normal adult human kidney.
Kidney Int. 45: 48-57.
Sawyer, M.H., Webb, D.E., Balow, J.E., and Straus, S.E. 1988. Acyclovir-induced renal failure.
Clinical course and histology. Am. J. Med. 84: 1067-1071.
Schreiber, R., Wolpin, J., and Koren, G. 2008. Determinants of aciclovir-induced nephrotoxicity
in children. Paediatr. Drugs. 10: 135-139.
Skinner, R. 2003. Chronic ifosfamide nephrotoxicity in children. Med. Pediatr. Oncol. 41: 190-
197.
Skinner, R., Pearson, A.D., English, M.W., Price, L., Wyllie, R.A., Coulthard, M.G., and Craft,
A.W. 1996. Risk factors for ifosfamide nephrotoxicity in children. Lancet. 348: 578-580.
Sladek, N.E. 1988. Metabolism of oxazaphosphorines. Pharmacol. Ther. 37: 301-355.
Vachvanichsanong, P., Patamasucon, P., Malagon, M., and Moore, E.S. 1995. Acute renal failure
in a child associated with acyclovir. Pediatr. Nephrol. 9(3): 346-347.
Vomiero, G., Carpenter, B., Robb, I., and Filler, G. 2002. Combination of ceftriaxone and
acyclovir--an underestimated nephrotoxic potential? Pediatr. Nephrol. 17: 633-637.
Wagstaff, A.J., Faulds, D., and Goa, K.L. 1994. Aciclovir: a reappraisal of its antiviral activity,
pharmacokinetic properties and therapeutic efficacy. Drugs, 47: 153-205.
Walker, D., Flinois, J.P., Monkman, S.C., Beloc, C., Boddy, A.V., Cholerton, S., et al. 1994.
Identification of the major human hepatic cytochrome P450 involved in activation and N-
dechloroethylation of ifosfamide. Biochem. Pharmacol. 47: 1157-1163.
Xu, H., Rajesan, R., Harper, P., Kim, R.B., Lonnerdal, B., Yang, M., et al. 2005. Induction of
cytochrome P450 1A by cow milk-based formula: a comparative study between human milk and
formula. Br. J. Pharmacol. 146: 296-305.
Zucco, F., De Angelis, I., Testai, E., and Stammati, A. 2004. Toxicology investigations with cell
culture systems: 20 years after. Toxicol. In Vitro, 18: 153-163.

44
Chapter 4
Acyclovir – induced nephrotoxicity: the role of the acyclovir
aldehyde metabolite
Patrina Gunness,a,b
Katarina Aleksa,a,c
John Bend,d Gideon Koren
a,b
aDivision of clinical Pharmacology and Toxicology, The Hospital for Sick Children, 555
University Avenue, Toronto, ON, M5G 1X8, Canada
bGraduate Department of Pharmaceutical Sciences, Leslie Dan Faculty of Pharmacy, University
of Toronto, ON, M5S 3M2, Canada
cSchool of Pharmacy, University of Waterloo, 200 University Avenue West, Waterloo, Ontario,
N2L 3G1, Canada
dDepartment of Pathology, Schulich School of Medicine and Dentistry, DSB4044, The
University of Western Ontario, London, Ontario, N6A 3K7, Canada
This article has been accepted for publication: Gunness, P., Aleksa, K., Bend, J., and Koren,
G. 2011. Acyclovir – induced nephrotoxicity; the role of the acyclovir aldehyde metabolite.
Transl Res. [In press]. This article will be originally published by Elsevier.
[PG performed all experiments and prepared the manuscript for submission]

45
4.1 Abstract
For decades, acyclovir – induced nephrotoxicity, was believed to be secondary to crystalluria.
Clinical evidence of nephrotoxicity in the absence of crystalluria suggests that acyclovir induces
direct insult to renal tubular cells. We postulated that acyclovir is metabolized by ADH enzyme
to acyclovir aldehyde, which is further metabolized by the ALDH2 enzyme to CMMG. We
hypothesized that acyclovir aldehyde plays a role in acyclovir – induced nephrotoxicity. The
HK-2 cells were used as our in vitro model. Western blot and enzymes activities assays were
performed to determine whether the HK-2 cells express ADH and ALDH2 isozymes,
respectively. Cytotoxicity (measured as a function of cell viability) assays were conducted to
determine; (1) whether the acyclovir aldehyde plays a role in acyclovir – induced nephrotoxicity
and (2) whether CMMG induces cell death. A colorimetric assay was performed to determine
whether acyclovir was metabolized to an aldehyde, in vitro. Our results illustrated that: (A) HK-
2 cells express ADH and ALDH2 isozymes, (B) 4-methylpyrazole rendered significant
protection against cell death, (C) CMMG does not induce cell death and (D) acyclovir was
metabolized to an aldehyde in tubular cells. These data indicate that acyclovir aldehyde is
produced in HK-2 cells and that inhibition of its production by 4-methylpyrazole offers
significant protection from cell death, in vitro; suggesting that acyclovir aldehyde may cause the
direct renal tubular insult associated with acyclovir.
4.2 Introduction
Acyclovir, an acyclic nucleoside (Brigden and Whiteman 1985; Elion 1983) is commonly used
for the treatment of viral infections (Bianchetti et al. 1991; Brigden et al. 1982; Fletcher et al.
1989; Hintz et al. 1982; Keeney et al. 1982; Vachvanisanong et al. 1995). The herpes simplex
and varicella zoster viruses are among the viruses which acyclovir is used clinically (Biachetti et

46
al. 1991; Brigden et al. 1982; Hintz et al. 1982). Acyclovir is generally well tolerated (Keeney et
al. 1982), however, severe nephrotoxicity has been shown to occur in some children (Ahmad et
al. 1994; Genc et al. 2010; Schreiber et al. 2008).
It has been widely believed that acyclovir – induced nephrotoxicity is caused by crystalluria
(Genc et al. 2010; Lyon et al. 2002; Mason et al. 2008; Peterslund et al. 1998; Potter and Krill
1986; Sawyer et al. 1988). However, clinical evidence of nephrotoxicity in the absence of
crystal formation (Ahmad et al. 1994; Vomiero et al. 2002) has suggested that acyclovir may
induce direct insult to renal tubular cells. For example, renal biopsies have demonstrated that
acyclovir exposure was associated with flattened, vacuolated (Ahmad et al. 1994; Vomiero et al.
2002), bulging epithelial cells (Vomiero et al. 2002) and no evidence of crystals. Recently, we
provided the first experimental evidence that acyclovir can induce direct damage to renal tubular
cells (Gunness et al. 2010).
Biotransformation of acyclovir to an active metabolite is not required for its anti-viral activity or
for its excretion (Elion 1983). In humans, acyclovir undergoes minimal metabolism, such that a
given intravenous dose of acyclovir is eliminated mainly unchanged (62 – 91%) in the urine (de
Miranda et al. 1982a). The predominant and pharmacologically inactive (de Miranda et al.
1982a) metabolite of acyclovir is CMMG, while 8-hydroxy-9-(2-hydroxyethoxymethyl)guanine
is considered the minor metabolite (de Miranda et al. 1982a). High performance liquid
chromatography analyses of urine show that in humans, the CMMG metabolite accounts for
approximately 9 to 14 %, and the 8-hydroxy-9-(2-hydroxyethoxymethyl)guanine metabolite
accounts for less than 0.2 % of a given dose of acyclovir, respectively.
47
The present study focuses on the metabolic pathway of acyclovir to CMMG. It has been
postulated that acyclovir is metabolized by the ADH enzyme to acyclovir aldehyde, and
acyclovir aldehyde is subsequently metabolized by the ALDH enzyme to CMMG (de Miranda
and Burnette 1994; de Miranda and Good 1982; de Miranda and Good 1992).
Aldehydes are reactive, toxic chemicals that are often produced endogenously as intermediate
drug metabolites and have been suggested to mediate several drugs – induced toxicities,
including hepatotoxicity and nephrotoxicity (O’Brien et al. 2005). For example, the
chloroacetaldehyde metabolite of ifosfamide, produced from the oxidation of the
chemotherapeutic agent (Walker et al. 1994) has been shown to cause nephrotoxicity (Dubourg
et al. 2001). We set up to investigate whether the acyclovir aldehyde metabolite may be the
source of the direct renal tubular damage associated with the use of acyclovir. This hypothesis
has not been previously investigated.
In addition to the kidney’s well-defined physiological functions, including the regulation of
osmolarity, maintenance of electrolyte balance, synthesis of hormones and removal of waste
substances (Silverthorn 1998), the kidney is also actively involved in drug metabolism (Anders
1980; Lohr et al. 1998). For instance, Aleksa and colleagues illustrated that ifosfamide is
metabolized in human and porcine kidneys, in vitro (Aleksa et al. 2006). While, Diamond and
Quebbemann showed that in vivo, in chickens, p-nitrophenol is renally metabolized to its sulfate
and glucuronide metabolites (Diamond and Quebbemann 1981). It was previously elaborated
that some of the body load of acyclovir is metabolized by the ADH and ALDH enzymes (de
Miranda and Burnette 1994; de Miranda and Good 1982; de Miranda and Good 1992). The
human kidney expresses both ADH and ALDH enzymes (Engeland and Maret 1993; Harada et

48
al. 1980; Nishimura and Naito 2006). Therefore, the renal proximal tubular cells may have the
machinery to locally metabolize acyclovir to its aldehyde metabolite.
Several ADH (Engeland and Maret 1993) and ALDH (Harada et al. 1980) isozymes exists in
humans. Currently, it is unknown which ADH and ALDH isozyme(s) may be involved in the
metabolism of acyclovir in humans. In our studies, we focused on the human class I ADH
enzymes because they are referred to as prototypical ADHs (Estonius et al. 1996) and they are
highly expressed in the human kidney (Engeland and Maret 1993). With respect to the ALDH
enzyme, we postulated that the ALDH2 enzyme may be specifically involved in the metabolism
of acyclovir. The ALDH2 enzyme is highly expressed in the human kidney (Harada et al. 1980)
and moreover, studies have illustrated that polymorphism of the ALDH2 enzyme prolonged the
elimination half life of acyclovir in humans (Hara et al. 2008). The results from the study by
Hara and colleagues (Hara et al. 2008) are the first to provide evidence for the potential role of
ALDH2 in the metabolism of acyclovir.
The objectives of this study were to examine whether acyclovir – induced nephrotoxicity is
secondary to tubular production of acyclovir aldehyde.
4.3 Materials and methods
4.3.1 Cell culture
The HK-2 cell line was employed as our in vitro model. The cells were maintained according to
ATCC guidelines. Briefly, cells were cultured in Keratinocyte-SFM supplemented with 5 ng/mL
human recombinant epidermal growth factor 1-53 and 0.05 mg/mL bovine pituitary extract.
Cells were maintained at 37°C in a sterile, humidified atmosphere of 5 % CO2 and 95 % O2. All
experiments were conducted on cell monolayers that were approximately 80 – 85 % confluent.

49
4.3.2 Protein expression and enzymes activities of class I ADH and ALDH2 isozymes in
HK-2 cells
The protein expression and activities of class I ADH and ALDH2 isozymes in HK-2 cells have
not been previously investigated. The determination of the presence of class I ADH and ALDH2
functional isozymes in HK-2 cells was imperative to our study because the cells were used as our
model to determine whether acyclovir aldehyde; which is produced via the oxidation of acyclovir
by the ADH enzyme, and further metabolized by the ALDH enzyme to CMMG, is the source of
the direct renal tubular insult associated with acyclovir.
Qualitative western blot analyses were conducted to determine whether the HK-2 cells expressed
the class I ADH and ALDH2 isozymes. The enzymes activities assays were conducted to
determine whether HK-2 cells expressed functional class I ADH and ALDH2 isozymes.
Western blots analyses were conducted in duplicates. Enzymes activities assays were conducted
in triplicates. Total protein for all assays was quantified using the Bradford reagent (Sigma-
Aldrich Canada Ltd., Oakville, Ontario, Canada). The absorbance was measured at 595 nm
using a BioTek® Synergy HT microplate reader (Fisher Scientific). The lysate from human liver
tissue obtained from a deceased adult male was used as a positive control for western blot assays.
Human liver is known to express high levels of class I ADH (Engeland and Maret 1993) and
ALDH2 isozymes (Harada et al. 1980).
In order to extrapolate the biological significance of the results obtained from HK-2 cells to the
human kidney, the lysate from the human kidney of a deceased adult male was used to determine
functional protein expression of the class I ADH and ALDH2 enzymes. The human liver and
kidney tissues were obtained from the Co-operative Human Tissue network, University of

50
Pennsylvania Medical Center, USA. The ADH protein expression in the human kidney was
compared to the level of expression in the HK-2 cells.
4.3.2a Cytosol and mitochondria protein fraction for western blot assays
HK-2 cells
The media from HK-2 cell monolayers was removed and the cells were washed (2X) with ice-
cold PBS solution. Cell monolayers were scraped in a modified lysis buffer ([50 mmol/L
tris(hydroxymethyl)aminomethane hydrochloride (Tris-HCL, pH7.4), 1 % (v/v) nonyl
phenoxypolyethoxylethanol (NP-40), 0.25 % (w/v) sodium deoxycholate, 150 mmol/L sodium
chloride (NaCl), 1 mmol/L EDTA, 1 mmol/L phenylmethylsulfonyl fluoride (PMSF), 1 µg/mL
aprotonin, 1 µg/mL leupeptin, 1 µg/mL pepstatin] (Millipore 2007). The cell homogenate was
centrifuged at 600 x g for 20 mins at 4◦C. The pellet was discarded and the supernatant was
centrifuged at 100 000 x g for 2 hrs at 4◦C. The supernatant (cytosol fraction) was stored at -
80◦C until analyses.
To obtain the mitochondria fraction from HK-2 cells, cell monolayers were scraped in the
modified lysis buffer as described above. The cell homogenate was centrifuged at 600 x g for 20
mins at 4◦C. The pellet was discarded and the supernatant was centrifuged at 15 000 x g for 10
mins at 4◦C. The supernatant was discarded and the pellet was re-suspended in lysis buffer. The
homogenate was briefly sonicated and subsequently centrifuged at 15 000 x g for 5 mins at 4◦C.
The supernatant (mitochondria fraction) was stored at -80◦C until analyses.
51
Human liver and kidney tissue
The isolation of the mitochondrial and cytosolic fractions from human liver and kidney tissue
was performed using identical isolation procedures. Human liver or kidney tissues (2 grams)
were washed twice with ice-cold PBS. The tissues were homogenized using a polytron
homogenizer (Brinkmann Instruments Canada, Mississauga, Ontario, Canada). The tissues were
homogenized in the modified lysis buffer described above for HK-2 cells. The homogenates
were centrifuged at 600 x g for 20 mins at 4◦C. The pellets were discarded and the supernatants
were centrifuged at 15 000 x g for 10 mins at 4◦C. The pellets (Fraction A; containing
mitochondria protein) and supernatants (Fraction B; containing cytosol protein) were processed
as follows. Fraction A was re-suspended in lysis buffer and fraction B was transferred to a clean
centrifuge tube. Fraction A was briefly sonicated and subsequently centrifuged at 15 000 x g for
5 mins at 4◦C. The pellets were discarded and the resultant supernatants (mitochondria fraction)
were stored at -80◦C until analyses. Fraction B was centrifuged at 100 000 x g for 2 hrs at 4
◦C.
The pellets were discarded and the resultant supernatants (cytosol fraction) were stored at -80◦C
until analyses.
4.3.3 Western blot assays
4.3.3a ADH protein expression
For electrophoresis samples, total cytosol protein was mixed with 2X Laemmli buffer (Laemmli
1970). Total human liver (1 µg), kidney (10 µg) or HK-2 (30 µg) cytosol protein were resolved
on a 12 % SDS-PAGE. Resolved proteins were transferred unto Hybond™
- P PVDF
membranes (GE Healthcare Canada Inc., Mississauga, Ontario, Canada) at 100 V for 1 hr in
transfer buffer ([25 mmol/L Tris, 192 mmol/L glycine, 20 % (v/v) methanol, pH 8.3] (Towbin et

52
al. 1979). Blots were blocked in 5 % (w/v) skim milk overnight at 4◦C. Blots were then washed
in 5 % milk and subsequently incubated with rabbit polyclonal ADH antibody (sc-22750, Santa
Cruz Biotechnology, Inc., Santa Cruz, California, USA) in 5 % skim milk overnight at 4◦C. The
primary antibody was diluted 1:500 for use. Following the incubation, the primary antibody was
removed and blots were washed in 5 % skim milk. Blots were subsequently incubated with
donkey anti-rabbit IgG-HRP antibody (sc-2313, Santa Cruz Biotechnology, Inc.) in 5 % skim
milk for 2 hrs at room temperature. The secondary antibody was diluted 1:5000 for use. The
secondary antibody was removed and the blots were washed sequentially in 5 % skim milk, PBS
with Tween® 20 detergent (PBST) and PBS solutions. Blots were developed using Western
Lightning® Plus – ECL (PerkinElmer, Woodbridge, Ontario, Canada). Blots were exposed to
Kodak™
BioMax Light Film (PerkinElmer).
4.3.3b ALDH2 protein expression
For ALDH2 protein expression, western blot analyses were performed as described above.
Total human liver (30 µg), kidney (40 µg) or HK-2 (100 µg) mitochondria protein were resolved
on a 12 % SDS-PAGE. The primary antibody used was goat polyclonal ALDH2 antibody (sc-
48838, Santa Cruz Biotechnology, Inc.). The primary ALDH2 antibody was diluted 1:200 for
use. The secondary antibody used was donkey anti-goat IgG-HRP (sc-2354, Santa Cruz
Biotechnology, Inc.). The secondary antibody was diluted 1:5000 for use.
4.3.4 Enzymes activities assays
4.3.4a Whole cell lysate for enzymes activities assays
The HK-2, as well as human kidney whole cell lysates were used for enzymes activities assays.

53
HK-2 cells
Briefly, the media from HK-2 cell monolayers was removed and the cells were washed twice
with ice-cold PBS. Cell monolayers were scraped in a modified lysis buffer ([50 mmol/L Tris-
HCL (pH7.4), 1 % (v/v) NP-40, 150 mmol/L NaCl] (Millipore 2007). The cell homogenate was
centrifuged at 600 x g for 20 mins at 4◦C. The pellet was discarded and the resultant supernatant
(whole cell lysate) was stored at -80◦C until analyses.
Human kidney
Human kidney tissue (2 grams) was washed twice with ice-cold PBS. The tissue was
homogenized using a polytron homogenizer (Brinkmann Instruments Canada). The tissue was
homogenized in the modified lysis buffer and subsequently processed as outlined above for the
HK-2 cells.
4.3.4b ADH and ALDH enzymes activities assays
The enzymes activities assays were performed as previously described (Clemens et al. 1995),
with modification. The ADH and ALDH enzymes use nicotinamide adenine dinucleotide
(NAD+) as a co-factor, such that during enzymatic activity, NAD
+ is reduced to NADH (Pawan
1972). The NADH molecule absorbs lights at 340 nm (Walker 1992). The optical density at 340
nm can be measured using a spectrophotometer (Walker 1992).
ADH enzyme activity
Briefly, 200 µg of total protein was added to 0.5 mol/L Tris-HCL (pH 7.4), 3 mmol/L NAD+ in
the presence or absence of 10 mmol/L ethanol. The reaction components were incubated at 37◦C
for 10 mins prior to addition of ethanol to the mixture. The final reaction volume was 2 mL.

54
The reaction mixture was incubated for 4 hrs, and then the optical density at 340 nm was
measured using BioTek®
Synergy HT microplate reader (Fisher Scientific).
ALDH enzyme activity
The ALDH enzyme activity assays were as described above for the determination of ADH
enzyme activity. One mM propionaldehyde was used as the substrate for ALDH2.
4.3.5 Cell viability
Cytotoxicity (measured as a function of cell viability) assays were performed to determine
whether the acyclovir aldehyde may be the source of the direct renal tubular injury associated
with the use of the parent drug. As previously described, acyclovir is metabolized to acyclovir
aldehyde by the ADH enzyme and acyclovir aldehyde is subsequently metabolized by the ALDH
enzyme to CMMG (de Miranda and Burnette 1994; de Miranda and Good 1982; de Miranda and
Good 1992). Therefore, if acyclovir aldehyde is the source of tubular damage; inhibition of the
ADH enzyme by 4-methylpyrazole should alleviate toxicity. We used 4-methylpyrazole to
inhibit the class I ADH isozymes. The 4-methylpyrazole inhibitor has been used in in vitro
studies to inhibit the ADH enzymes (Gyamfi and Wan 2006). Furthermore, and as reviewed by
Crabb et al., compared to other classes of ADH enzymes, class I ADH isozymes are highly
sensitive to pyrazoles inhibition (Crabb et al. 2004). Importantly, 4-methyplyrazole has been
shown to inhibit the metabolism of acyclovir to CMMG (de Miranda and Good 1982).
Cell viability assays were performed in 12-well plates. Cell viability was assessed using the
fluorescent alamarBlue® assay. Briefly, 2.5 hrs prior to the end of the 24 hour incubation period,
alamarBlue® reagent was added to each well. The final concentration of alamarBlue
® reagent in
each well was 10 % (v/v). Cell viability was measured using BioTek®
Synergy HT microplate
55
reader at excitation and emission wavelengths of 540 and 590 nm, respectively. Cell viability
assays were performed in replicates of 9.
4.3.5a Co-exposure to 4-methylpyrazole
Cells were seeded (1.25E+05 cells/well) in 12-well plates. Exposure to 4-methylpyrazole
(Sigma-Aldrich Canada Ltd.) was performed similar to the regimen outlined by Gyamfi and Wan
(Gyamfi and Wan 2006). Initially, cell monolayers were incubated with 4-methylpyrazole (500
µmol/L) for 1 hr. Following the incubation period, the media was removed, and cell monolayers
were incubated with acyclovir (0 – 2000 µg/mL) in the presence or absence of 4-methylpyrazole
for 24 hrs. The concentrations of acyclovir used in our study are compatible to the
concentrations of the anti-viral drug encountered by the human kidney (Hintz et al. 1982). Cell
viability was assessed at the end of the 24 hr incubation period as described above.
4.3.6 Determination of aldehyde production
In order to determine if an aldehyde was produced in tubular cells exposed to acyclovir, a
colorimetric aldehyde detection assay was performed using the Purpald® reagent (Sigma-Aldrich
Canada Ltd.). The Purpald® reagent reacts with aldehydes to form colorless adducts, which
must be oxidized to form chromogens (Quesenberry and Lee 1996). The chromogens absorb
light at 550 nm (Quesenberry and Lee 1996). The absorbance at 550 nm can be measured using
a spectrophotometer (Quesenberry and Lee 1996).
The assay was performed similar to the methods described by Quesenberry and Lee
(Quesenberry and Lee 1996). Briefly, cells were seeded (2.5E+05 cells/dish) in petri dishes
(VWR International). At the desired confluence, cell monolayers were incubated with acyclovir
(0 or 2000 µg/mL) for 3 hrs. At the end of the incubation period, cell monolayers were washed

56
(2X) with ice-cold PBS. The cell monolayers were then scraped in ice-cold PBS and briefly
sonicated. The homogenate was centrifuged at 15 000 x g for 5 mins at 4◦C. The pellet was
discarded and the supernatant was processed as follows. One mL of 33 mmol/L Purpald®
reagent (Sigma-Aldrich Canada Ltd.) was added to 1 mL of the supernatant. The mixture was
incubated at room temperature for 2 hrs. One mL of 34 mmol/L sodium periodate (Sigma-
Aldrich Canada Ltd.) was subsequently added and the mixture was incubated at room
temperature for an additional 2 hrs. The optical density was subsequently measured at 550 nm
using a Shimadzu UV160U spectrophotometer (Mandel Scientific Co. Ltd., Guelph, Ontario,
Canada). The assay was not conducted in replicates.
4.3.7 Comparison of the ADH protein expression between HK-2 cells and human kidney
tissue
In order to compare the ADH protein expression between HK-2 cells and the human kidney
tissue, it was necessary to quantify ADH protein expression obtained from the western blots
analyses. Protein expression was quantified using the Image Processing and Analysis in Java
(ImageJ) software. Since, different amounts of total cytosol protein from HK-2 (30 µg) and
human kidney (10 µg) were resolved on separate SDS-PAGE analyses, it was assumed that total
amounts of protein that was resolved was linear to the intensity of the protein band.
Additionally, the expression was not normalized to a housekeeping gene because protein
expression between two different biological matrices, an immortalized cell line and human
tissue, were compared. The integrated densities of the ADH protein bands obtained from the
ImageJ analyses of western blots were used to compare the protein expression between HK-2
cells and human kidney. Since, 3X more total protein from the HK-2 cell cytosol was used in

57
SDS-PAGE analyses, compared to human kidney; the integrated density obtained from human
kidney was multiplied by 3 before being compared to that of HK-2. The quantification was
performed using the 2 western blots that were each obtained from analyses of ADH protein
expression in HK-2 and human kidney.
4.3.8 Statistical analyses
Statistical analyses of the data were performed using IBM® SPSS
® Statistics version 19 software.
The data obtained from the ADH and ALDH enzymes activities assays were analyzed using
paired t-tests. One way ANOVA followed by Tukey’s honestly significant difference (HSD)
post hoc tests were conducted to test the statistical significance of the data obtained from cell
viability assays that were performed to determine whether acyclovir aldehyde plays a role in
acyclovir – induced nephrotoxicity. The ANOVA followed by Dunnett’s post hoc tests were
conducted to assess the statistical significance of the data from cell viability assays that were
conducted to determine whether CMMG induced HK-2 cell death.
4.4 Results
4.4.1 Class I ADH and ALDH2 protein expression
Figures 9A and 9B illustrate class I ADH and ALDH2 protein expression in HK-2 cells,
respectively. The ADH (Figure 9A) and ALDH2 (Figure 9B) proteins are expressed at low
levels in HK-2 cells. Figures 10A and 10B confirm the protein expression of the class I ADH
and ALDH2 enzymes in human kidney, respectively. The proteins are expressed at moderate
levels in human kidney.

58
A.
B.
Figure 9. The (A) alcohol dehydrogenase (ADH) and (B) aldehyde dehydrogenase (ALDH)
protein expression in human renal proximal tubular (HK-2) cells. Western blot analyses were
performed to determine whether HK-2 cells express class I ADH and ALDH2 isozymes. Total
cytosol [liver:1 µg, HK-2 cells: 30 µg] or mitochondrial [liver:30 µg, HK-2 cells: 100 µg]
protein were resolved on a 12 % sodium dodecyl sulfate – polyacrylamide gel electrophoresis
(SDS-PAGE) for analyses if ADH or ALDH protein expression, respectively. The ADH blots
were incubated with rabbit polyclonal ADH antibody (sc-22750) diluted 1:500 in 5 % (w/v) skim
milk. The secondary antibody used was donkey anti-rabbit immunoglobulin G – horseradish
peroxidase (IgG-HRP) antibody (sc-2313) diluted 1:5000 in 5 % skim milk. The ALDH blots
were incubated with goat polyclonal ALDH2 antibody (sc-48838) diluted 1:200 in 5 % skim
milk. The secondary antibody used was donkey anti-goat immunoglobulin G – horseradish
peroxidase (IgG-HRP) antibody (sc-2354) diluted 1:5000 in 5 % skim milk. Western blot
analyses were performed in duplicates. The blots illustrated are representative blots.

59
A.
B.
Figure 10. The (A) alcohol dehydrogenase (ADH) and (B) aldehyde dehydrogenase (ALDH)
protein expression in human kidney. Western blot analyses were performed to determine
whether human kidney expresses class I ADH and ALDH2 isozymes. Total cytosol [liver:1 µg,
kidney: 10 µg] or mitochondrial [liver:30 µg, kidney: 40 µg] protein were resolved on a 12 %
sodium dodecyl sulfate – polyacrylamide gel electrophoresis (SDS-PAGE) for analyses if ADH
or ALDH protein expression, respectively. The ADH blots were incubated with rabbit
polyclonal ADH antibody (sc-22750) diluted 1:500 in 5 % (w/v) skim milk. The secondary
antibody used was donkey anti-rabbit immunoglobulin G – horseradish peroxidase (IgG-HRP)
antibody (sc-2313) diluted 1:5000 in 5 % skim milk. The ALDH blots were incubated with goat
polyclonal ALDH2 antibody (sc-48838) diluted 1:200 in 5 % skim milk. The secondary
antibody used was donkey anti-goat immunoglobulin G – horseradish peroxidase (IgG-HRP)
antibody (sc-2354) diluted 1:5000 in 5 % skim milk. Western blot analyses were performed in
duplicates. The blots illustrated are representative blots.

60
4.4.2 ADH and ALDH enzyme activity
Figures 11A and 11B illustrate ADH and ALDH enzyme activities in HK-2 cells, respectively.
Figure 11A shows that in the presence of the ADH substrate, ethanol, there was a significant
(p<0.05) increase in the optical density at 340 nm. Similarly, in the presence of the ALDH
substrate, propionaldehyde, there was a significant (p<0.05) increase in the optical density at 340
nm (Figure 11B).
The ADH and ALDH enzymes activities in human kidney are illustrated in Figures 12A and
12B, respectively. In the presence of the ADH substrate, ethanol, there appeared to be an
increase in the optical density at 340 nm (Figure 12A). Similarly, Figure 12B shows that in the
presence of the ALDH substrate, propionaldehyde, there appeared to be an increase in the optical
density at 340 nm.
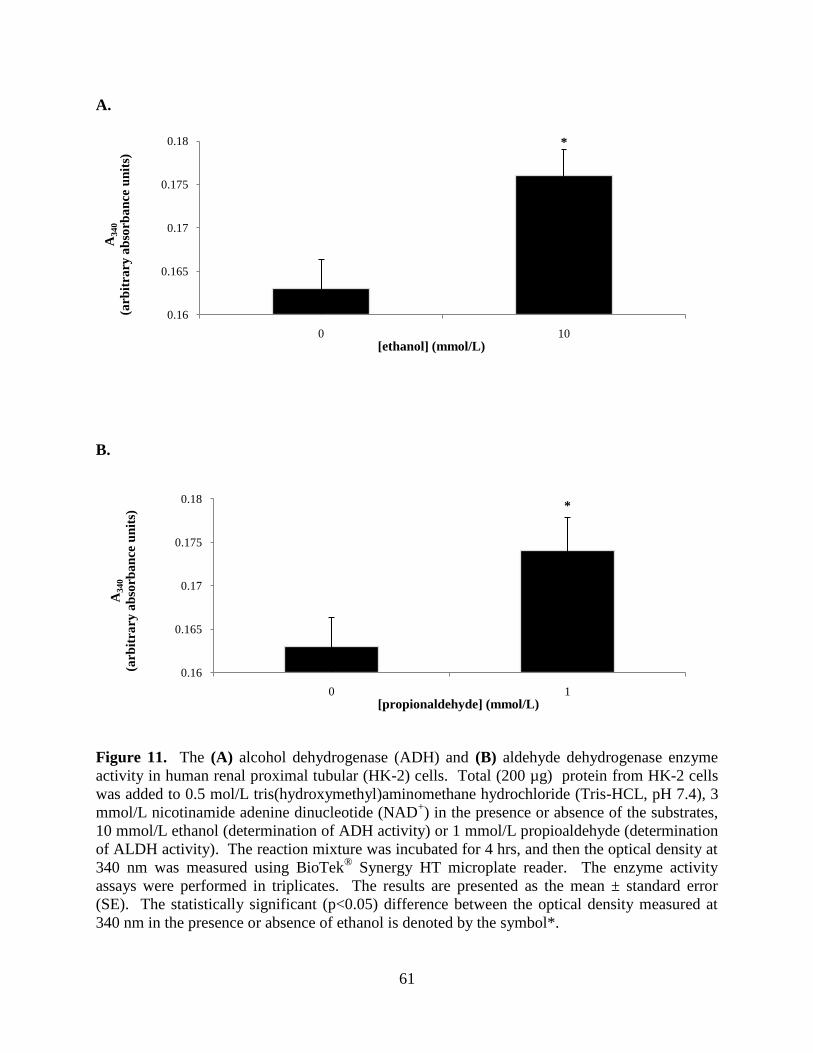
61
A.
B.
Figure 11. The (A) alcohol dehydrogenase (ADH) and (B) aldehyde dehydrogenase enzyme
activity in human renal proximal tubular (HK-2) cells. Total (200 µg) protein from HK-2 cells
was added to 0.5 mol/L tris(hydroxymethyl)aminomethane hydrochloride (Tris-HCL, pH 7.4), 3
mmol/L nicotinamide adenine dinucleotide (NAD+) in the presence or absence of the substrates,
10 mmol/L ethanol (determination of ADH activity) or 1 mmol/L propioaldehyde (determination
of ALDH activity). The reaction mixture was incubated for 4 hrs, and then the optical density at
340 nm was measured using BioTek® Synergy HT microplate reader. The enzyme activity
assays were performed in triplicates. The results are presented as the mean ± standard error
(SE). The statistically significant (p<0.05) difference between the optical density measured at
340 nm in the presence or absence of ethanol is denoted by the symbol*.
*
0.16
0.165
0.17
0.175
0.18
0 10
A340
(arb
itra
ry a
bso
rba
nce
un
its)
[ethanol] (mmol/L)
*
0.16
0.165
0.17
0.175
0.18
0 1
A340
(arb
itra
ry a
bso
rba
nce
un
its)
[propionaldehyde] (mmol/L)

62
A.
B.
Figure 12. The (A) alcohol dehydrogenase (ADH) and (B) aldehyde dehydrogenase enzyme
activity in human kidney. Total (200 µg) protein from human kidney tissue was added to 0.5
mol/L tris(hydroxymethyl)aminomethane hydrochloride (Tris-HCL, pH 7.4), 3 mmol/L
nicotinamide adenine dinucleotide (NAD+) in the presence or absence of the substrates, 10
mmol/L ethanol (determination of ADH activity) or 1 mmol/L propioaldehyde (determination of
ALDH activity). The reaction mixture was incubated for 4 hrs, and then the optical density at
340 nm was measured using BioTek® Synergy HT microplate reader. The enzyme activity
assays were performed in triplicates. The results are presented as the mean ± standard error
(SE).
*
0.16
0.18
0.2
0.22
0.24
0.26
0.28
0.3
0 10
A340
(arb
itra
ry a
bso
rba
nce
un
its)
[ethanol] (mmol/L)
*
0.16
0.17
0.18
0.19
0.2
0.21
0.22
0.23
0 1
A340
(arb
itra
ry a
bso
rba
nce
un
its)
[propionaldehyde] (mmol/L)

63
4.4.3 The effect of 4-methylpyrazole on HK-2 cell viability
Figure 13 illustrates the effect of 4-methylpyrazole on HK-2 cell viability. Compared to
untreated control, acyclovir (500 – 2000 µg/mL) induced significant (p<0.05) concentration –
dependent decreases (17, 30, 40 and 49 %) in HK- 2 cell viability, respectively. Compared to
untreated control, significant (p<0.05) concentration – dependent decreases (15, 26, 38 and 47
%) in the viability of HK-2 cells were also observed following co-exposure to acyclovir and 4-
methylpyrazole, respectively.
The magnitude of the decreases in the viability of HK-2 cells co-exposed to acyclovir and 4-
methylpyrazole was less, compared to cells that were exposed to acyclovir. The differences
between the magnitude of the decrease in HK-2 cell viability exposed to acyclovir and HK-2
cells co-exposed to acyclovir and 4-methylpyrazole was significant (p<0.05) for all respective
acyclovir concentrations.

64
Figure 13. The effect of 4-methylpyrazole on human renal proximal tubular (HK-2) cell
viability. Cells were seeded (1.25E+05 cells/well) in 12-well plates. Initially, cell monolayers
were incubated with 4-methylpyrazole (500 µmol/L) for 1 hr. Following the incubation period,
the media was removed, and cell monolayers were incubated with acyclovir (0 – 2000 µg/mL) in
the presence or absence of 4-methylpyrazole for 24 hrs. Cell viability assays was assessed at the
end of the 24 hr incubation period. Cell viability was assessed using the fluorescent alamarBlue®
assay. The fluorescence was measured using a BioTek® Synergy HT microplate reader at
excitation and emission wavelengths of 540 and 590 nm, respectively. Cell viability assays were
performed in replicates of 9. The cell viability results are expressed as a percentage of the
fluorescence of untreated control cell monolayers and presented as the mean ± standard error
(SE). Statistically significant (p<0.05) differences between the fluorescence from untreated
control cell monolayers and cell monolayers exposed to acyclovir are denoted by the symbol*.
Statistically significant (p<0.05) differences between the fluorescence from cell monolayers
exposed to acyclovir and cell monolayers co-exposed to acyclovir and 4-methylpyrazole are
denoted by the symbol#.

65
4.4.4 Aldehyde production in HK-2 cells exposed to acyclovir
Figure 14 illustrates aldehyde production in HK-2 cells exposed to acyclovir (0, 2000 µg/mL).
Compared to untreated control, there appeared to be an increase in absorbance at 550 nm, in the
lysate of HK-2 cells that were exposed to acyclovir (2000 µg/mL).
Figure 14. Aldehyde production in human renal proximal tubular (HK-2) cells exposed to
acyclovir. Briefly, cell were seeded (2.50E+05 cells/dish) in petri dishes. Cell monolayers
were incubated with acyclovir (0 or 2000 µg/mL) for 3 hrs. Aldehyde production in cells was
determined using the Purpald® reagent. The absorbance was measured at 550 nm using a
Shimadzu UV160U spectrophotometer. The assay was not conducted in replicates.
0.000
0.001
0.002
0.003
0.004
0.005
0.006
0.007
0.008
0.009
0 2000
intr
ace
llu
lar
ald
ehy
de
pro
du
ctio
n
(arb
itra
ry a
bso
rba
nce
un
its,
A550)
[acyclovir] (µg/mL)
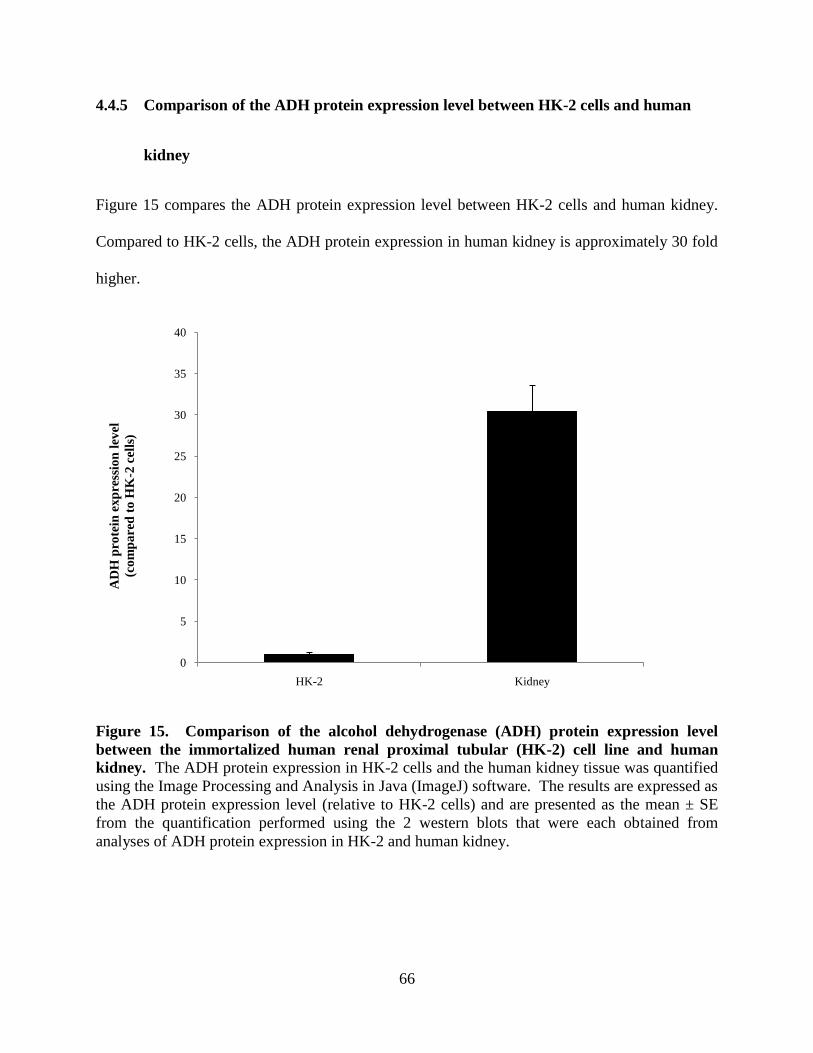
66
4.4.5 Comparison of the ADH protein expression level between HK-2 cells and human
kidney
Figure 15 compares the ADH protein expression level between HK-2 cells and human kidney.
Compared to HK-2 cells, the ADH protein expression in human kidney is approximately 30 fold
higher.
Figure 15. Comparison of the alcohol dehydrogenase (ADH) protein expression level
between the immortalized human renal proximal tubular (HK-2) cell line and human
kidney. The ADH protein expression in HK-2 cells and the human kidney tissue was quantified
using the Image Processing and Analysis in Java (ImageJ) software. The results are expressed as
the ADH protein expression level (relative to HK-2 cells) and are presented as the mean ± SE
from the quantification performed using the 2 western blots that were each obtained from
analyses of ADH protein expression in HK-2 and human kidney.
0
5
10
15
20
25
30
35
40
HK-2 Kidney
AD
H p
rote
in e
xp
ress
ion
lev
el
(co
mp
are
d t
o H
K-2
cell
s)

67
4.5 Discussion
The HK-2 cells were used as the in vitro model in our studies. These cells express functional
class I ADH (Figures 9A and 11A) and ALDH2 (Figures 9B and 11B) isozymes. Therefore, the
HK-2 cells possess the enzymatic machinery to locally produce acyclovir aldehyde and
subsequently metabolize it to CMMG.
The HK-2 cells are derived from the normal kidney of an adult male and have functional and
biochemical characteristics of well-differentiated renal proximal tubular cells (Ryan et al. 1994).
Furthermore, the use of HK-2 cells in our study eliminated the concern of inter-species
differences that exist in the pharmacological and toxicological disposition of acyclovir (de
Miranda et al. 1982a; 1982b). While, the predominant location of acyclovir – induced tubular
injury, along the nephron, is presently unknown; it is highly probable that the direct renal tubular
injury induced by acyclovir occurs mainly in the proximal tubule segment of the nephron. The
proximal tubule segment of the nephron is considered to be the predominant site of toxicant –
induced renal damage due to its leaky epithelium and active transport systems that results in the
accumulation of xenobiotics and local toxicity to the epithelial cells (Schnellmann 2001).
Additionally, compared to other segments of the nephron, the renal proximal tubular cells are
known to express increased levels of drug biotransformation enzymes that may result in the
production of increased concentrations of reactive metabolites (Schnellmann 2001). The HK-2
cells are of proximal tubular origin and therefore the use of the cells to study acyclovir – induced
nephrotoxicity allows for a better elucidation of the direct tubular damage induced by acyclovir,
in vitro, and possibly in vivo, as well. However, marked differences exist between in vitro and in
vivo systems (Davila et al. 1998), and thus, caution should be exercised during the extrapolation
of in vitro results to in vivo systems.

68
A critical element in our results is that 4-methylpyrazole rendered significant protection from
acyclovir – induced cell death (Figure 13). These results suggest that the acyclovir aldehyde
metabolite may play a role in the direct renal tubular injury associated with the parent drug, as
prevention of its modulation decreases toxicity. These results are the first to provide
experimental evidence which suggest that the acyclovir aldehyde may directly be involved in the
pathogenesis of the direct toxicity. Furthermore, our results suggest that acyclovir was oxidized
by the ADH enzyme to produce an aldehyde metabolite in HK-2 cells, in vitro, and in turn
provide further support for the appropriate use of the HK-2 cells in our study.
Based on the results presented in Figure 13, it can be argued that CMMG, and not the acyclovir
aldehyde may induce cell death. The figure illustrated that the magnitude of cell death was
significantly greater in cells exposed to acyclovir, compared to cells co-exposed to acyclovir and
4-methylprazole. In the absence of 4-methylpyrazole, acyclovir was likely oxidized to acyclovir
aldehyde, which was further metabolized to CMMG. It has been postulated that CMMG is
responsible for acyclovir – induced neurotoxicity (Hellden et al. 2003; 2006). However,
presently there is no biologically plausible evidence to support the hypothesis (Hellden et al.
2003; 2006). Therefore, we tested the effect of CMMG on HK-2 cell viability to determine if the
metabolite induces cell death. Cell monolayers were exposed to increasing concentrations (0 –
23.9 µg/mL) of CMMG for the same duration of time that they were exposed to acyclovir. Our
results illustrate that CMMG does not induce HK-2 cell death (data not shown).
Figure 15 illustrates that compared to untreated control; there was increased absorbance at 550
nm in the lysate obtained from the cell monolayer that was exposed to acyclovir (2000 µg/mL).
The results suggest that an aldehyde may have been produced in the cells exposed to acyclovir,
69
and hence, provide additional proof for the oxidation of acyclovir to acyclovir aldehyde via the
action of the ADH enzyme in human renal proximal tubular HK-2 cells.
Synthesizing all these data, the results of our study suggest that acyclovir aldehyde may be the
source of the direct renal tubular injury associated with the use of acyclovir. Intermediate
aldehyde metabolites have been suggested to play a leading role in several drugs – induced
toxicities, including aplastic anemia, urotoxicity, hepatoxicity, neurotoxicity and nephrotoxicity
(O’Brien et al. 2005). For example, acrolein, the aldehyde metabolite of the chemotherapeutic
agent, cyclophosphamide, is believed to be responsible for cyclophosphamide – induced
urotoxicity (Ramu et al. 1995). Similarly, it has been suggested that atropaldehyde, the aldehyde
metabolite of the antiepileptic agent, felbamate, mediates the parent drug – induced aplastic
anemia and hepatotoxicity (Kapetanovic et al. 2002). Biologically plausible mechanisms of
acyclovir aldehyde – induced cytotoxicity may include lipid peroxidation (Shaw and Jayatilleke
1987), depletion or inhibition of detoxifying compounds or enzymes (i.e. glutathione, ALDH)
(Kapetanovic et al. 2002; Shangari and O’Brien 2004), formation of reactive oxygen species
(O’Brien et al. 2005; Shaw and Jayatilleke 1987), mitochondrial damage (Shangari and O’Brien
2004), the formation of protein (Maggs and Park 1988) and deoxyribonucleic acid (DNA)
adducts (Wang et al. 2002).
The site(s) of acyclovir metabolism to CMMG has not been studied. To the best of our
knowledge, the acyclovir aldehyde metabolite has not been measured in any human biological
specimens, including plasma and urine. In this study, we hypothesized that the acyclovir
aldehyde may play a role in the direct renal tubular injury induced by acyclovir. Aldehydes are
unstable, highly reactive electrophilic compounds (O’Brien et al. 2005) and therefore in order for
acyclovir aldehyde to induce damage to renal proximal tubular cells, the metabolite must be

70
produced locally in the cells at a concentration that is sufficient to cause toxicity. Our results
suggest that human renal proximal tubular cells have the capacity to locally metabolize acyclovir
to its aldehyde metabolite. However, the concentrations of acyclovir aldehyde encountered by
human renal proximal tubular cell in vitro or in vivo are not known. Future studies using the
immortalized HK-2 cell line or primary human renal proximal tubular cell cultures could be
performed to determine those data. However, regardless of the analytical method used to
quantify the amount of acyclovir aldehyde that is produced in tubular cells, it will be necessary
to produce a standard curve using the pure acyclovir aldehyde compound. Presently, to the best
of our knowledge, the acyclovir aldehyde compound is not commercially available, and the
process of synthesizing it is close to impossible because the process is time consuming, tedious,
costly and the stability of the aldehyde is unknown and/or not guaranteed. However, in our
study, if acyclovir aldehyde was the cause of HK-2 cell death, then sufficient amounts were
formed to induce substantial cell death, which was partially, yet significantly alleviated
following co-exposure to 4-methylpyrazole.
In the HK-2 cells, the effect of 4-methylpyrazole on HK-2 cell viability was small. The small
magnitude of the effect was likely due to the inherent low protein expression of the ADH
enzyme in HK-2 cells, leading to limited metabolism of acyclovir to acyclovir aldehyde and
hence, inhibition by 4-methylpyrazole. Future studies can be conducted using cells that
overexpress human ADH in order to determine whether co-exposure to 4-methylpyrazole renders
a greater magnitude of protection from acyclovir – induced cytotoxicity. The results may
provide further evidence to support the hypothesis that the acyclovir aldehyde may play a role in
direct cytotoxicity.
71
In order to extrapolate the biological significance of our cell results to humans, we performed
western blot analyses and enzyme activity assays on a sample of human kidney tissue. The
human kidney is known to express both class I ADH (Engeland and Maret 1993; Nishimura and
Naito 2006) and ALDH2 (Harada et al. 1980) enzymes. Our results (Figures 10 and 12) confirm
the functional protein expression of the enzymes in the human kidney. Comparison of the ADH
protein expression between HK-2 cells and human kidney revealed that the protein expression of
the enzyme may be at least 30 fold higher in human kidney (Figure 15). Therefore, it is very
likely that inhibition of the ADH enzyme by 4-methylpyrazole would have a substantially more
pronounced effect in human renal proximal tubular cells, in vivo.
There may be other potential explanations for the small measured effect of 4-methylpyrazole on
HK-2 cell viability. For instance, it is plausible that the small effect may have been due to the
noxious effect(s) of the acyclovir aldehyde metabolite on ADH expression and/or activity.
Aldehydes are known to reduce the activity of enzymes (O’Brien et al. 2005), specifically its
detoxifying enzyme, aldehyde dehydrogenase (Doorn et al. 2006; Kapetanovic et al. 2002). The
effect(s) of aldehydes on the expression or activity of alcohol dehydrogenase enzymes is not
known. However, it is probable that formation of aldehyde can affect ADH functional
expression either through direct or indirect mechanisms of toxicity (Gregus and Klaassen 1998).
Second, it is likely that the enzyme was only partially inhibited by 4-methylpyrazole. Finally, it
can be speculated that the small effect may have been also due to the possibility that the parent
drug; acyclovir may also play a role in the direct toxicity. As previously elaborated, acyclovir
undergoes minimal metabolism via the ADH and ALDH pathway,5 therefore, it is possible that
the ADH enzyme has a weak affinity for the parent drug, and if this is the case then in addition,
to its aldehyde metabolite, the parent drug may also play an active role and may even be the
72
more predominant offending nephrotoxic. Biologically plausible mechanism(s) of the parent
drug’s toxicity is not known. Acyclovir’s primary mechanism of pharmacological action
involves inhibition of viral DNA replication (Elion 1983).
In addition to illustrating that locally produced acyclovir aldehyde may be the source of
acyclovir – induced nephrotoxicity, the results of our studies may also provide a potential
mechanism for the variation in the incidence of acyclovir – induced nephrotoxicity. Several
factors, including age (Meier and Seitz 2008), gender (Chrostek et al. 2003), tissue type (Brown
et al. 1996; Engeland and Maret 1993; Nishimura and Naito 2006) and more importantly, genetic
polymorphisms (Bosron and Li 1986; Mizoi et al. 1994; Mulligan et al. 2003; Stickel and
Osterreicher 2006) are well known to affect the functional expression of enzymes, including the
ADH and ALDH enzymes. Altered functional expression of ADH or ALDH enzymes affects the
disposition of substrates that are metabolized by the enzymes and may subsequently contribute to
the inter-individual variation in the occurrence of certain drug – induced toxicities.
Unlike their effect on nephrotoxicity, the effect of genetic polymorphisms of the ADH or ALDH
enzymes on hepatotoxicity has been well documented. For instance, ethanol – induced
hepatotoxicity is largely attributed to locally produced, acetaldehyde (Matsuzaki and Seiber
1977), from the oxidation of ethanol by ADH, which is subsequently metabolized by the ALDH
enzyme to acetate (Zakhari 2006). Genetic polymorphisms of the ADH or ALDH enzymes
resulting in increased production or reduced catabolism of acetaldehyde may increase the risk of
occurrence of hepatotoxicity in patients, respectively (Crabb et al. 2004). It is conceivable that
genetic polymorphisms of ADH and ALDH enzymes may alter the kidney disposition of
acyclovir and increase the risk of nephrotoxicity in some individuals.

73
In conclusion, the novel evidence presented in this study suggests that the acyclovir aldehyde
may cause direct renal tubular injury. There is need for several future studies including the
determination of the cellular and molecular mechanism(s) of acyclovir aldehyde – induced
toxicity and the specific ADH and ALDH isozymes that are responsible for the metabolism of
acyclovir and its aldehyde metabolite, respectively, and the affinity of the enzymes for the
respective substrates. Such studies will aid in a better understanding of the pathogenesis of the
direct renal tubular injury induced by acyclovir and may lead to potential therapy for these
serious adverse effects.
4.6 Statement of significance
The results from the study suggest that locally produced acyclovir aldehyde may play a role in
the direct renal tubular injury associated with the use of its parent drug, and hence offers the first
insight into the potential underlying mechanism(s) of this drug – induced nephrotoxicity.
4.7 Acknowledgements
The authors declare that they have no conflicts of interest.
All authors have read the journal’s policy on disclosure of potential conflicts of interest.
We would like to thank GlaxoSmithKline (Raleigh, NC) for providing us with the CCMG
chemical compound for this research study.
The study was supported by the grant from CIHR.
74
4.8 References
Ahmad, T., Simmonds, M., McIver, A.G., and McGraw, M.E. 1994. Reversible renal failure in
renal transplant patients receiving oral acyclovir prophylaxis. Pediatr Nephrol 8: 489-491.
Aleksa, K., Ito, S., and Koren, G. 2006. Enantioselective metabolism of ifosfamide by the
kidney. Chirality 18: 398-405.
Anders, M.W. 1980. Metabolism of drugs by the kidney. Kidney Int 18: 636-647.
Bianchetti, M.G., Roduit, C., and Oetliker, O.H. 1991. Acyclovir-induced renal failure: course
and risk factors. Pediatr Nephrol 5: 238-239.
Bosron, W.F., and Li, T.K. 1986. Genetic polymorphism of human liver alcohol and aldehyde
dehydrogenases, and their relationship to alcohol metabolism and alcoholism. Hepatology 6:
502-510.
Brigden, D., Rosling, A.E., and Woods, N.C. 1982. Renal function after acyclovir intravenous
injection. Am J Med 73: 182-185.
Brigden, D., and Whiteman, P. 1985. The clinical pharmacology of acyclovir and its prodrugs.
Scand J Infect Dis Suppl 47: 33-39.
Brown, C.J., Zhang, L., and Edenberg, H.J. 1996. Gene expression in a young multigene family:
tissue-specific differences in the expression of the human alcohol dehydrogenase genes ADH1,
ADH2, and ADH3. DNA Cell Biol 15: 187-196.
Chrostek, L., Jelski, W., Szmitkowski, M., and Puchalski, Z. 2003. Gender-related differences in
hepatic activity of alcohol dehydrogenase isoenzymes and aldehyde dehydrogenase in humans. J
Clin Lab Anal 17: 93-96.
Clemens, D.L., Halgard, C.M., Miles, R.R., Sorrell, M.F., and Tuma, D.J. 1995. Establishment
of a recombinant hepatic cell line stably expressing alcohol dehydrogenase. Arch Biochem
Biophys 321: 311-318.
Crabb, D.W., Matsumoto, M., Chang, D., and You, M. 2004. Overview of the role of alcohol
dehydrogenase and aldehyde dehydrogenase and their variants in the genesis of alcohol-related
pathology. Proc Nutr Soc 63: 49-63.
Davila, J.C., Rodriguez, R.J., Melchert, R.B., and Acosta, D., Jr. 1998. Predictive value of in
vitro model systems in toxicology. Annu Rev Pharmacol Toxicol 38: 63-96.
de Miranda, P., and Burnette, T.C. 1994. Metabolic fate and pharmacokinetics of the acyclovir
prodrug valaciclovir in cynomolgus monkeys. Drug Metab Dispos 22; 55-59.

75
de Miranda, P., and Good, S.S. 1982. Biotransformation of acyclovir to 9-
carboxymethoxymethylguanine. Federation Proceedings 41: 1733.
de Miranda, P., and Good, S.S. 1992. Species differences in the metabolism and disposition of
antiviral nucleoside analogues. 1. Acyclovir. Antivir Chem Chemother 3: 1-8.
de Miranda, P., Good, S.S., Krasny, H.C., Connor, J.D., Laskin, O.L., and Lietman, P.S. 1982a.
Metabolic fate of radioactive acyclovir in humans. Am J Med 73: 215-220.
de Miranda, P., Krasny, H.C., Page, D.A., and Elion, G.B. 1982b. Species differences in the
disposition of acyclovir. Am J Med 73: 31-35.
Diamond, G.L., and Quebbemann, A.J. 1981. In vivo quantification of renal sulfate and
glucuronide conjugation in the chicken. Drug Metab Dispos 9: 402-409.
Doorn, J.A., Hurley, T.D., and Petersen, D.R. 2006. Inhibition of human mitochondrial aldehyde
dehydrogenase by 4-hydroxynon-2-enal and 4-oxonon-2-enal. Chem Res Toxicol 19: 102-110.
Dubourg, L., Michoudet, C., Cochat, P., and Baverel, G. 2001. Human kidney tubules detoxify
chloroacetaldehyde, a presumed nephrotoxic metabolite of ifosfamide. J Am Soc Nephrol 12:
1615-1623.
Elion, G.B. 1983. The biochemistry and mechanism of action of acyclovir. J Antimicrob
Chemother 12 Suppl B: 9-17.
Engeland, K., and Maret, W. 1993. Extrahepatic, differential expression of four classes of human
alcohol dehydrogenase. Biochem Biophys Res Commun 193: 47-53.
Estonius, M., Svensson, S., and Hoog, J.O. 1996. Alcohol dehydrogenase in human tissues:
localisation of transcripts coding for five classes of the enzyme. FEBS Lett 397: 338-342.
Fletcher, C.V., Englund, J.A., Bean, B., Chinnock, B., Brundage, D.M., and Balfour, H.H., Jr.
1989. Continuous infusion of high-dose acyclovir for serious herpesvirus infections. Antimicrob
Agents Chemother 33: 1375-1378.
Genc, G., Ozkaya, O., Acikgoz, Y., Yapici, O., Bek, K., Gulnar Sensoy, S., and Ozyurek, E.
2010. Acute renal failure with acyclovir treatment in a child with leukemia. Drug Chem Toxicol
33; 217-219.
Gregus Z. and Klaassen, C.D. 2001. Mechanisms of Toxicity. In Casarett and Doull's Toxicology
The Basic Science of Poisons. Edited by Klaassen, C.D. The Mc-Graw Hill Companies Inc.,
New York. pp 35-81.
Gunness, P., Aleksa, K., Kosuge, K., Ito, S., and Koren, G. 2010. Comparison of the novel HK-2
human renal proximal tubular cell line with the standard LLC-PK1 cell line in studying drug-
induced nephrotoxicity. Can J Physiol Pharmacol 88: 448-455.
76
Gyamfi, M.A., and Wan, Y.J. 2006. The effect of ethanol, ethanol metabolizing enzyme
inhibitors, and Vitamin E on regulating glutathione, glutathione S-transferase, and S-
adenosylmethionine in mouse primary hepatocyte. Hepatol Res 35: 53-61.
Hara, K., Suyama, K., Itoh, H., and Nagashima, S. 2008. Influence of ALDH2 genetic
polymorphisms on aciclovir pharmacokinetics following oral administration of valaciclovir in
Japanese end-stage renal disease patients. Drug Metab Pharmacokinet 23: 306-312.
Harada, S., Agarwal, D.P., and Goedde, H.W. 1980. Electrophoretic and biochemical studies of
human aldehyde dehydrogenase isozymes in various tissues. Life Sci 26: 1773-1780.
Hellden, A., Lycke, J., Vander, T., Svensson, J.O., Odar-Cederlof, I., and Stahle, L. 2006. The
aciclovir metabolite CMMG is detectable in the CSF of subjects with neuropsychiatric symptoms
during aciclovir and valaciclovir treatment. J Antimicrob Chemother 57; 945-949.
Hellden, A., Odar-Cederlof, I., Diener, P., Barkholt, L., Medin, C., Svensson, J.O., Sawe, J., and
Stahle, L. 2003. High serum concentrations of the acyclovir main metabolite 9-
carboxymethoxymethylguanine in renal failure patients with acyclovir-related neuropsychiatric
side effects: an observational study. Nephrol Dial Transplant 18: 1135-1141.
Hintz, M., Connor, J.D., Spector, S.A., Blum, M.R., Keeney, R.E., and Yeager, A.S. 1982.
Neonatal acyclovir pharmacokinetics in patients with herpes virus infections. Am J Med 73: 210-
214.
Kapetanovic, I.M., Torchin, C.D., Strong, J.M., Yonekawa, W.D., Lu, C., Li, A.P., Dieckhaus,
C.M., Santos, W.L., Macdonald, T.L., Sofia, R.D., and Kupferberg, H.J. 2002. Reactivity of
atropaldehyde, a felbamate metabolite in human liver tissue in vitro. Chem Biol Interact 142:
119-134.
Keeney, R.E., Kirk, L.E., and Bridgen, D. 1982. Acyclovir tolerance in humans. Am J Med 73:
176-181.
Laemmli, U.K. 1970. Cleavage of structural proteins during the assembly of the head of
bacteriophage T4. Nature 227; 680-685.
Lohr, J.W., Willsky, G.R., and Acara, M.A. 1998. Renal drug metabolism. Pharmacol Rev 50:
107-141.
Lyon, A.W., Mansoor, A., and Trotter, M.J. 2002. Urinary gems: acyclovir crystalluria. Arch
Pathol Lab Med 126: 753-754.
Maggs, J.L., and Park, B.K. 1988. Drug-protein conjugates--XVI. Studies of sorbinil
metabolism: formation of 2-hydroxysorbinil and unstable protein conjugates. Biochem
Pharmacol 37: 743-748.

77
Mason, W.J., and Nickols, H.H. 2008. Crystalluria from acyclovir use. N Engl J Med 358; e14.
Matsuzaki, S., and Sieber, C.S. 1977. Increased susceptibility of hepatic mitochondria to the
toxicity of acetaldehyde after chronic ethanol consumption. Biochem Biophys Res Commun 75:
1059-1065.
Meier, P., and Seitz, H.K. 2008. Age, alcohol metabolism and liver disease. Curr Opin Clin Nutr
Metab Care 11: 21-26.
Millipore. 2007. Millipore Technical Publications. RIPA Buffer - Preparation of modified
radioimmunoprecipitation (RIPA) buffer.
[http://www.millipore.com/userguides/tech1/mcproto402].
Mizoi, Y., Yamamoto, K., Ueno, Y., Fukunaga, T., and Harada, S. 1994. Involvement of genetic
polymorphism of alcohol and aldehyde dehydrogenases in individual variation of alcohol
metabolism. Alcohol Alcohol 29: 707-710.
Mulligan, C.J., Robin, R.W., Osier, M.V., Sambuughin, N., Goldfarb, L.G., Kittles, R.A.,
Hesselbrock, D., Goldman, D., and Long, J.C. 2003. Allelic variation at alcohol metabolism
genes ( ADH1B, ADH1C, ALDH2) and alcohol dependence in an American Indian population.
Hum Genet 113: 325-336.
Nishimura, M., and Naito, S. 2006. Tissue-specific mRNA expression profiles of human phase I
metabolizing enzymes except for cytochrome P450 and phase II metabolizing enzymes. Drug
Metab Pharmacokinet 21: 357-374.
O'Brien, P.J., Siraki, A.G., and Shangari, N. 2005. Aldehyde sources, metabolism, molecular
toxicity mechanisms, and possible effects on human health. Crit Rev Toxicol 35: 609-662.
Pawan, G.L. 1972. Metabolism of alcohol (ethanol) in man. Proc Nutr Soc 31; 83-89.
Peterslund, N.A., Larsen, M.L., and Mygind, H. 1988. Acyclovir crystalluria. Scand J Infect Dis
20: 225-228.
Potter, J.L., and Krill, C.E., Jr. 1986. Acyclovir crystalluria. Pediatr Infect Dis 5: 710-712.
Quesenberry, M.S., and Lee, Y.C. 1996. A rapid formaldehyde assay using purpald reagent:
application under periodation conditions. Anal Biochem 234: 50-55.
Ramu, K., Fraiser, L.H., Mamiya, B., Ahmed, T., and Kehrer, J.P. 1995. Acrolein mercapturates:
synthesis, characterization, and assessment of their role in the bladder toxicity of
cyclophosphamide. Chem Res Toxicol 8: 515-524.
Ryan, M.J., Johnson, G., Kirk, J., Fuerstenberg, S.M., Zager, R.A., and Torok-Storb, B. 1994.
HK-2: an immortalized proximal tubule epithelial cell line from normal adult human kidney.
Kidney Int 45: 48-57.

78
Sawyer, M.H., Webb, D.E., Balow, J.E., and Straus, S.E. 1988. Acyclovir-induced renal failure.
Clinical course and histology. Am J Med 84: 1067-1071.
Schnellmann, R.G. 2001. Toxic responses of the kidney. In Casarett and Doull's Toxicology The
Basic Science of Poisons. Edited by Klaassen, C.D. The Mc-Graw Hill Companies Inc., New
York. pp 491-503.
Schreiber, R., Wolpin, J., and Koren, G. 2008. Determinants of aciclovir-induced nephrotoxicity
in children. Paediatr Drugs 10: 135-139.
Shangari, N., and O'Brien, P.J. 2004. The cytotoxic mechanism of glyoxal involves oxidative
stress. Biochem Pharmacol 68: 1433-1442.
Shaw, S., and Jayatilleke, E. 1987. Acetaldehyde-mediated hepatic lipid peroxidation: role of
superoxide and ferritin. Biochem Biophys Res Commun 143: 984-990.
Silverthorn, D.U. 1998. The Kidneys. In Human Physiology An Integrated approach. Edited by
Brake, D.R.. Prentice Hall., Upper Saddle River, New Jersey. pp. 518-542.
Stickel, F., and Osterreicher, C.H. 2006. The role of genetic polymorphisms in alcoholic liver
disease. Alcohol Alcohol 41: 209-224.
Towbin, H., Staehelin, T., and Gordon, J. 1979. Electrophoretic transfer of proteins from
polyacrylamide gels to nitrocellulose sheets: procedure and some applications. Proc Natl Acad
Sci U S A 76: 4350-4354.
Vachvanichsanong, P., Patamasucon, P., Malagon, M., and Moore, E.S. 1995. Acute renal failure
in a child associated with acyclovir. Pediatr Nephrol 9: 346-347.
Vomiero, G., Carpenter, B., Robb, I., and Filler, G. 2002. Combination of ceftriaxone and
acyclovir - an underestimated nephrotoxic potential? Pediatr Nephrol 17: 633-637.
Walker, D., Flinois, J.P., Monkman, S.C., Beloc, C., Boddy, A.V., Cholerton, S., Daly, A.K.,
Lind, M.J., Pearson, A.D., Beaune, P.H., and Jeffrey, R.I. 1994. Identification of the major
human hepatic cytochrome P450 involved in activation and N-dechloroethylation of ifosfamide.
Biochem Pharmacol 47: 1157-1163.
Walker, J.R.L. 1992. Spectrophotometric determination of enzyme activity: alcohol
dehydrogenase (ADH). Biochemical Education 20: 42-43.
Wang, M., McIntee, E.J., Cheng, G., Shi, Y., Villalta, P.W., and Hecht, S.S. 2000. Identification
of DNA adducts of acetaldehyde. Chem Res Toxicol 13; 1149-1157.
Zakhari, S. 2006. Overview: how is alcohol metabolized by the body? Alcohol Res Health 29:
245-254.

79
4.9 Additional experiments not published
4.9.1 The effect of CMMG on cell viability
Based on the results presented in Figure 13, it may be postulated that CMMG and not the
acyclovir aldehyde metabolite is responsible for HK-2 cell death. Therefore, it was necessary to
determine whether CMMG induces HK-2 cell death.
4.9.2 Materials and methods
4.9.2a Exposure to CMMG
A cytotoxicity (alamarBlue® assay) was performed to determine whether CMMG
(GlaxoSmithKline, Raleigh, North Carolina, USA) induces HK-2 cell death. The assay and cell
culture regimen was performed as previously described (section 4.3.5). Cell monolayers were
incubated with CMMG [0 – 23.9 µg/mL (0 – 100 µmol/L)] for 24 hours. Cell viability was
assessed at the end of the incubation period. The assay was performed in replicates of 9.
4.9.2b Statistical analyses
The statistical analyses of the data were performed using the IBM®
SPSS® Statistics version 19
software. The ANOVA followed by Dunnett’s post hoc tests were conducted to assess the
statistical significance of the data from cell viability assays that were conducted to determine
whether CMMG induced HK-2 cell death.
4.9.3 Results
Figure 16 illustrates the effect of CMMG on HK-2 cell viability. Compared to untreated control,
CMMG (0.0239 and 0.239 µg/mL) did not induce HK-2 cell death. Exposure to CMMG (2.39
and 23.9 µg/mL) induced significant (p<0.05) increases in HK-2 cell viability.

80
Figure 16. The effect of 9-carboxymethoxymethylguanine (CMMG) on human renal
proximal tubular (HK-2 cell) viability. Cells were seeded (1.25E+05 cells/well) in 12-well
plates. Cell monolayers were incubated with CMMG [0 – 23.9 µg/mL (0 – 100 µmol/L)] for 24
hrs. Cell viability assays was assessed at the end of the 24 hr incubation period. Cell viability
was assessed using the fluorescent alamarBlue®
assay. The fluorescence was measured using a
BioTek® Synergy HT microplate reader at excitation and emission wavelengths of 540 and 590
nm, respectively. Cell viability assays were performed in replicates of 9. The cell viability
results are expressed as a percentage of the fluorescence of untreated control cell monolayers and
presented as the mean ± standard error (SE). Statistically significant (p<0.05) differences
between the fluorescence from untreated control cell monolayers and cell monolayers exposed to
acyclovir are denoted by the symbol*.
* *
0
20
40
60
80
100
120
0 0.02 0.24 2.39 23.90
cell
via
bil
ity
(% u
ntr
ea
ted
co
ntr
ol)
[CMMG] (µg/mL)

81
Chapter 5
The effect of acyclovir on the tubular secretion of creatinine in vitro
Patrina Gunness,a,b
Katarina Aleksa,a Gideon Koren
a,b
aDivision of Clinical Pharmacology and Toxicology, The Hospital for Sick Children, 555
University Avenue, Toronto, ON, M5G 1X8, Canada
bGraduate Department of Pharmaceutical Sciences, Leslie Dan Faculty of Pharmacy, University
of Toronto, ON, M5S 3M2, Canada
This article has been published: Gunness, P., Aleksa, K., and Koren, G. 2010. The effect of
acyclovir on the tubular secretion of creatinine in vitro. J Transl Med 8: 139-149. This article
was originally published by BioMed Central.
[PG performed all experiments and prepared the manuscript for submission]

82
5.0 Abstract
While generally well tolerated, severe nephrotoxicity has been observed in some children
receiving acyclovir. A pronounced elevation in plasma creatinine in the absence of other clinical
manifestations of overt nephrotoxicity has been frequently documented. Several drugs have
been shown to increase plasma creatinine by inhibiting its renal tubular secretion rather than by
decreasing glomerular filtration rate. Creatinine and acyclovir may be transported by similar
tubular transport mechanisms, thus, it is plausible that in some cases, the observed increase in
plasma creatinine may be partially due to inhibition of tubular secretion of creatinine, and not
solely due to decreased GFR. Our objective was to determine whether acyclovir inhibits the
tubular secretion of creatinine. The LLC-PK1 and HK-2 renal proximal tubular cell monolayers
cultured on microporous membrane filters were exposed to [2-14
C] creatinine (5 µmol/L) in the
absence or presence of quinidine (1000 µmol/L), cimetidine (1000 µmol/L) or acyclovir (22 – 89
µmol/L) in incubation medium. Results illustrated that in evident contrast to quinidine, acyclovir
did not inhibit creatinine transport in LLC-PK1 and HK-2 cell monolayers. The results suggest
that acyclovir does not affect the renal tubular handling of creatinine, and hence, the pronounced,
transient increase in plasma creatinine is due to decreased GFR, and not to a spurious increase in
plasma creatinine.
5.1 Introduction
Acyclovir is an antiviral agent that is commonly used to treat severe viral infections including
herpes simplex and varicella zoster, in children (Bryson 1984). Acyclovir is generally well
tolerated (Keeney et al. 1982), however, in some cases; severe nephrotoxicity has been reported
(Bianchetti et al. 1991; Brigden et al. 1982; Chou et al. 2008; Keeney et al. 1982; Potter and Krill
1986; Vachvanichsanong et al. 1995; Vomiero et al. 2002). Acyclovir – induced nephrotoxicity

83
is typically evidenced by elevated plasma creatinine and urea levels, the occurrence of abnormal
urine sediments or acute renal failure (Bianchetti et al. 1991; Brigden et al. 1982; Chou et al.
2008; Keeney et al. 1982; Vachvanichsanong et al. 1995; Vomiero et al. 2002).
Crystalluria leading to obstructive nephropathy is widely believed to be the mechanism of
acyclovir – induced nephrotoxicity (Sawyer et al. 1988). However, there are several documented
cases of acyclovir – induced nephrotoxicity in the absence of crystalluria (Ahmad et al. 1994;
Vachvanichsanong et al. 1995; Vomiero et al. 2002); suggesting that acyclovir induces direct
insult to tubular cells. Recently, we provided the first in vitro experimental evidence which
supports existing clinical evidence of direct renal tubular damage induced by acyclovir (Gunness
et al. 2010).
A systematic review of the literature reveals a pronounced, transient elevation (up to 9 fold in
some cases) of plasma creatinine levels in children, often without any other clinical evidence of
overt nephrotoxicity (Table 3). Similar to the cases described in Table 3; a marked, transient
increase in plasma creatinine levels has been observed in some patients who received the non-
nephrotoxic drugs, cimetidine (Blackwood et al. 1976; Burgess et al. 1982; Dubb et al. 1978;
Dutt et al. 1981; Haggie et al. 1976), trimethoprim (Berglund et al. 1975; Kastrup et al. 1985;
Myre et al. 1978), pyrimethamine (Opravil et al. 1993), dronedarone (Tschuppert et al. 2007) and
salicylates (Burry and Dieppe 1976).
Creatinine, a commonly used biomarker that is used to assess renal function, is eliminated by the
kidney via both glomerular filtration and tubular secretion (Toto 1995). The mechanisms
underlying the renal tubular transport of creatinine has not been fully elucidated. As explained
by Urakami and colleagues (Urakami et al. 2004), both acid and base secreting mechanisms may

84
play a role in the renal tubular transport of creatinine (Arenshorst and Selkurt 1976; Berglund et
al. 1975; Burry and Dieppe 1976; Dubb et al. 1978; Dutt et al. 1981; Eisner et al. 2010; Kastrup
et al. 1985; Myre et al. 1987; Okuda et al. 2006; Opravil et al. 1993; Tschuppert et al. 2007).
Hence, some drugs may share similar renal tubular transport mechanisms with creatinine. Drugs
that share transport mechanisms with creatinine may compete with it for tubular transport, and
subsequently inhibit creatinine secretion to result in a ungenuine elevation of plasma creatinine
that may not be due to decreased GFR. Cimetidine (Blackwood et al. 1976; Burgess et al. 1982;
Dubb et al. 1978; Dutt et al. 1981; Haggie et al. 1976), trimethoprim (Berglund et al. 1975;
Kastrup et al. 1985; Myre et al. 1978), pyrimethamine (Opravil et al. 1993), dronedarone
(Tschuppert et al. 2007) and salicylates (Burry and Dieppe 1976) are examples of drugs that
share similar renal tubular transport mechanisms with creatinine and induce spurious increases in
plasma creatinine by competing with and subsequently inhibiting its secretion.
Similar to creatinine, both acid and base secreting pathways may be involved in the renal tubular
transport of acyclovir (Takeda et al. 2002). Additionally, it is likely that creatinine (Eisner et al.
2010; Okuda et al. 2006; Urakami et al. 2004) and acyclovir (Takeda et al. 2002) may be
transported by similar organic anion transporters (OAT) and OCTs. Therefore, it is plausible
that acyclovir may compete with and successively inhibit renal secretion of creatinine, resulting
in elevations in plasma creatinine that may be disproportional to the degree of renal dysfunction.
Employing plasma creatinine levels to estimate GFR, results from previous studies (Genc et al.
2010; Schreiber et al. 2008) have illustrated that acyclovir – induced nephrotoxicity induces a
significant reduction in GFR in children. However, based on: (1) the cases presented in Table 3,
(2) the awareness that several non-nephrotoxic drugs are known to induce transient increases in
plasma creatinine (Berglund et al. 1975; Blackwood et al. 1976; Burgess et al. 1982; Burry and

85
Dieppe 1976; Dubb et al. 1978; Dutt et al. 1981; Haggie et al. 1976; Kastrup et al. 1985; Myre et
al. 1987; Opravil et al. 1993; Tschuppert et al. 2007) and (3) the knowledge that acyclovir and
creatinine may share similar renal tubular transport mechanisms; we hypothesized that the
pronounced, transient increase in plasma creatinine levels observed in some patients may be
partially due to the inhibition of renal tubular secretion of creatinine by acyclovir, and not
entirely the result of decreased GFR. To the best of our knowledge, the effect of acyclovir on the
renal tubular secretion of creatinine in vitro has not been previously evaluated. Thus, the
objective of the study was to determine whether acyclovir inhibits the renal tubular secretion of
creatinine. It is important to determine whether acyclovir inhibits the tubular transport of
creatinine, because if this is the case, then in addition to creatinine, other biomarkers should
always be employed to assess renal function in patients receiving acyclovir treatment.
In the present study we were specifically interested in determining the possible interaction
between creatinine and acyclovir during renal tubular transport by the OCT pathway. The
porcine renal tubular cell line, LLC-PK1, has been used as an in vitro renal tubular model in a
vast array of transepithelial transport studies. Furthermore, the LLC-PK1 cells are an
appropriate in vitro model for specifically studying renal tubular transport of organic cations
because they are known to possess functional OCTs (Fauth et al. 1988; Saito et al. 1992;
Urakami et al. 2005). However, although the LLC-PK1 cells retain similar physiological and
biochemical properties compared to human renal proximal tubular cells (Perantoni and Berman
1979), interspecies differences in drug disposition exists (Davila et al. 1998; Eaton and Klaassen
2001; Riddick 1998). Hence, the use of a human renal proximal tubular cell line, such as the
HK-2 cell line, would be a more suitable in vitro model to study the mechanisms of renal tubular

86
drug transport in humans. Porcine LLC-PK1 and human HK-2 cells were employed in our
transepithelial transport studies.
Table 3. Cases of elevated plasma creatinine levels in children who received intravenous
acyclovir
Patient Magnitude of increase
in plasma creatinine
(from baseline)
Relevant clinical details References
1 child 5 fold increase within 2
days
Creatinine returned to normal in 4 days
Elevated urea
No other pathology reported
[Brigden et al. 1982]
10 children
transient elevation
No further impairment reported
[Keeney et al. 1982]
3 children
4 fold increase within 4
days
Mild reduction in urine output
Creatinine returned to normal 1 week
following acyclovir discontinuation
[Biachetti et al. 1991]
1 child
2 fold increase within 6
days
Creatinine continued to increase
following acyclovir discontinuation.
Creatinine returned to normal within 1
week
Elevated urea
Mild proteinuria
[Vacvanichsanong et
al. 1995]
3 children
9 fold increase within 2
to 3 days
High urea
Urinary α1-microglobulin and albumin
Creatinine returned to normal in 3 – 9
days
[Vomiero et al. 2002]
1 child
3 fold increase within 4
days
No other information provided
[Chou et al. 2008]

87
5.2 Materials and methods
5.2.1 Cell culture
The LLC-PK1 cells were cultured in growth medium which consisted of MEM alpha modified,
supplemented with 2 mmol/L L-glutamine, 100 Units/mL penicillin, 100 µg streptomycin and 10
% (v/v) FBS. The HK-2 cells were cultured in growth medium which consisted of Keratinocyte-
SFM, supplemented with human recombinant epidermal growth factor 1-53 (5 ng/mL) and
bovine pituitary extract (0.05 mg/mL). The LLC-PK1 and HK-2 cells were maintained at 37°C
in a sterile, humidified atmosphere of 5 % CO2 and 95 % O2.
5.2.2 Transepithelial transport studies
The transepithelial transport studies were conducted as outlined by Urakami and colleagues
(Urakami et al. 2005) with modifications. The LLC-PK1 and HK-2 cells were seeded at
densities of 4.5E+05 cells/0.9 cm2 and 5.0E+05 cells/0.9 cm
2, respectively, on microporous
membrane filter inserts (3 µm pore size, 0.9 cm2 growth area) that were placed inside cell culture
chambers (VWR International). A consistent (1 mL) volume of growth or incubation medium
(containing no substrates, radiolabeled or non-radiolabeled substrates) was placed in the apical
and basolateral compartments of the cell culture chambers during culturing of the cells or during
all transport experiments. The LLC-PK1 and HK-2 cell monolayers used for transport studies
were cultured in growth medium for 6 and 3 days, respectively, after seeding. All transepithelial
transport studies were conducted on confluent cell monolayers.
At the time of commencement of the transport experiments, the growth medium from the cell
culture chamber was removed and both sides of the cell monolayers were washed twice with
incubation medium (145 mmol/L NaCl, 3 mmol/L KCl, 1 mmol/L CaCl2, 0.5 mmol/L MgCl2, 5

88
mmol/L D-glucose and 5 mmol/L HEPES (pH 7.4)). Incubation medium was used for all
transport experiments. Cell monolayers were incubated with medium for 10 mins. Following
the 10 mins incubation period, the medium was removed and the cell monolayers were incubated
with medium as follows: the medium added to the basolateral compartment of the cell culture
chamber contained respective radiolabeled and non-radiolabeled substrates and the medium
added to the apical compartment of the cell culture chamber contained neither radiolabeled nor
non-radiolabeled substrates. The radiolabeled and non-radiolabeled substrates used in the
transport studies are outlined below.
The transepithelial transport (basolateral-to-apical) of radiolabeled substrates across the cell
monolayers was assessed at specific intervals (LLC-PK1: 0, 15, 30, 45 and 60 mins; HK-2: 0,
7.5, 15, 22.5 and 30 mins) over 60 and 30 mins, respectively. Studies were conducted over
different duration of times in LLC-PK1 and HK-2 cells due to differences in the integrity of the
cell monolayers. The paracellular flux (basolateral-to-apical) of D-[1-3H(N)] mannitol
(PerkinElmer) across the cell monolayers was used to assess the integrity of cell monolayers. A
priori decision was made to eliminate the results from any cell monolayers where the
paracellular flux of D-[1-3H(N)] mannitol across LLC-PK1 or HK-2 cell monolayers was greater
than 5 % over the respective experimental period.
The transport of radiolabeled substrates was assessed by measuring the radioactivity of 50 µL
aliquots of medium that were sampled from the apical and basolateral compartments of the cell
culture chamber, at the aforementioned specified time intervals for the respective cell line.
Radioactivity was measured as disintegrations per minutes (DPM) using a LS 6500 liquid
scintillation (Beckman Coulter Canada Inc., Mississauga, Ontario, Canada).

89
5.2.2a Tetraethylammonium (TEA) transport across cell monolayers
In order to determine whether the LLC-PK1 and HK-2 cells used in the present studies possessed
functional organic cation transporters; TEA transport across cell monolayers was assessed. The
TEA is a classical organic cation substrate for OCTs (Fauth et al. 1988; Grundemann et al. 1994;
Saito et al. 1992). The transport of TEA across LLC-PK1 and HK-2 cell monolayers was
assessed in the presence and absence of the known inhibitor of organic cation transport (Fauth et
al. 1988; Saito et al. 1992; Urakami et al. 2004; 2005), quinidine (Sigma-Aldrich Canada Ltd.).
Cell monolayers were incubated with medium (containing [ethyl-1-14
C] TEA (5 µmol/L)
(American Radiolabeled Chemicals Inc., St. Loius, Missouri, USA) in the presence or absence of
quinidine (1000 µmol/L). The transport of TEA was assessed as described above.
5.2.2b Acyclovir transport across cell monolayers
The transport of acyclovir across LLC-PK1 or HK-2 cell monolayers was assessed in the
presence or absence of quinidine. Cell monolayers were incubated with medium (containing [8-
14C] acyclovir (500 nmol/L) (American Radiolabeled Chemicals Inc.)) in the presence or absence
of quinidine (1000 µmol/L). The transport of acyclovir was assessed as described above.
5.2.2c The effect of acyclovir on creatinine transport across cell monolayers
The transport of creatinine was assessed across LLC-PK1 or HK-2 cell monolayers in the
presence or absence of acyclovir. Cell monolayers were incubated with medium (containing [2-
14C] creatinine (5 µmol/L) (American Radiolabeled Chemicals Inc.)) in the presence or absence
of quinidine (1000 µmol/L), cimetidine (1000 µmol/L) (Sigma-Aldrich Canada Ltd.) or
acyclovir (22 to 89 µmol/L) (Pharmacy at the Hospital for Sick Children). The acyclovir
90
concentrations used in the experiments are representative of concentrations of acyclovir that are
found in the plasma and hence, are the concentrations which creatinine may encounter in plasma.
5.2.3 Statistical analyses
Statistical analyses of the data were performed using IBM® SPSS
® Statistics version 19 software.
Statistical analyses were performed using ANOVA followed by Tukey’s HSD post hoc tests.
Statistical analyses were performed on substrate radioactivity (DPM) data. Data are presented as
the mean ± SE from 3 cell monolayer experiments. Data were considered statistically significant
if p< 0.05.
5.3 Results
5.3.1 TEA transport across LLC-PK1 and HK-2 cell monolayers
The TEA was transported across LLC-PK1 cell monolayers in a time – dependent manner over
the experimental study period (Figure 17). The results illustrate that there was a significant
(p<0.05) decrease in the concentration of [ethyl-14
C] TEA in the apical compartment in the
presence of quinidine at 30, 45 and 60 mins.
Our results illustrate that TEA was transported across HK-2 cell monolayers in a time –
dependent manner over the experimental period (Figure 18). The concentration of [ethyl-14
C]
TEA in the apical compartment was significantly (p < 0.05) decreased in the presence of
quinidine at 22.5 and 30 minutes.
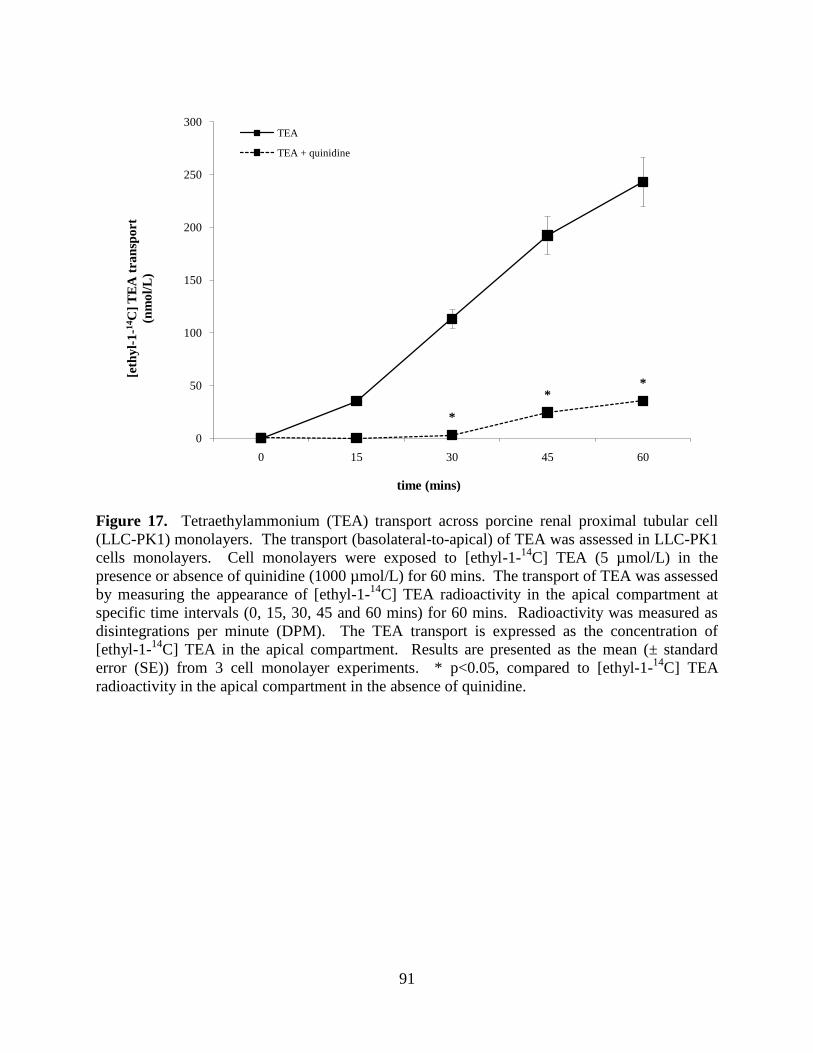
91
Figure 17. Tetraethylammonium (TEA) transport across porcine renal proximal tubular cell
(LLC-PK1) monolayers. The transport (basolateral-to-apical) of TEA was assessed in LLC-PK1
cells monolayers. Cell monolayers were exposed to [ethyl-1-14
C] TEA (5 µmol/L) in the
presence or absence of quinidine (1000 µmol/L) for 60 mins. The transport of TEA was assessed
by measuring the appearance of [ethyl-1-14
C] TEA radioactivity in the apical compartment at
specific time intervals (0, 15, 30, 45 and 60 mins) for 60 mins. Radioactivity was measured as
disintegrations per minute (DPM). The TEA transport is expressed as the concentration of
[ethyl-1-14
C] TEA in the apical compartment. Results are presented as the mean (± standard
error (SE)) from 3 cell monolayer experiments. * p<0.05, compared to [ethyl-1-14
C] TEA
radioactivity in the apical compartment in the absence of quinidine.
*
**
0
50
100
150
200
250
300
0 15 30 45 60
[eth
yl-
1-1
4C
] T
EA
tra
nsp
ort
(nm
ol/
L)
time (mins)
TEA
TEA + quinidine

92
Figure 18. Tetraethylammonium (TEA) transport across human renal proximal tubular cell
(HK-2) monolayers. The transport (basolateral-to-apical) of TEA was assessed in HK-2 cells
monolayers. Cell monolayers were exposed to [ethyl-1-14
C] TEA (5 µmol/L) in the presence or
absence of quinidine (1000 µmol/L) for 30 mins. The transport of TEA was assessed by
measuring the appearance of [ethyl-1-14
C] TEA radioactivity in the apical compartment at
specific time intervals (0, 7.5, 15, 22.5 and 30 mins) for 30 mins. Radioactivity was measured as
disintegrations per minute (DPM). The TEA transport is expressed as the concentration of [ethyl-
1-14
C] TEA in the apical compartment. Results are presented as the mean (± standard error (SE))
from 3 cell monolayer experiments. * p<0.05, compared to [ethyl-1-14
C] TEA radioactivity in
the apical compartment in the absence of quinidine.
*
*
0
50
100
150
200
250
300
350
0 7.5 15 22.5 30
[eth
yl-
1-1
4C
] T
EA
tra
nsp
ort
(nm
ol/
L)
time (mins)
TEA
TEA + quinidine

93
5.3.2 Acyclovir transport across LLC-PK1 and HK-2 cell monolayers
Acyclovir appeared to be transported across LLC-PK1 cell monolayers in a time – dependent
manner from 30 to 60 mins (Figure 19). There was a trend of decreased concentration of [8-14
C]
acyclovir in the apical compartment in the presence of quinidine over the experimental study
period. Acyclovir transport was not significantly (p>0.05) inhibited in the presence of quinidine.
Acyclovir was transported across HK-2 cell monolayers in a time – dependent manner over the
experimental study period (Figure 20). Results illustrate that the concentration of [8-14
C]
acyclovir in the apical compartment was significantly (p<0.05) decreased in the presence of
quinidine at 15, 22.5 and 30 mins.

94
Figure 19. Acyclovir transport across porcine renal proximal tubular cell (LLC-PK1)
monolayers. The transport (basolateral-to-apical) of acyclovir was assessed in LLC-PK1 cells
monolayers. Cell monolayers were exposed to [8-14
C] acyclovir (5E-02 µmol/L) in the presence
or absence of quinidine (1000 µmol/L) for 60 mins. The transport of acyclovir was assessed by
measuring the appearance of [8-14
C] acyclovir radioactivity in the apical compartment at specific
time intervals (0, 15, 30, 45 and 60 mins) for 60 mins. Radioactivity was measured as
disintegrations per minute (DPM). Acyclovir transport is expressed as the concentration of [8-14
C] acyclovir in the apical compartment. Results are presented as the mean (± standard error
(SE)) from 3 cell monolayer experiments.
0
1
0 15 30 45 60
[8-1
4C
] a
cycl
ov
ir t
ran
spo
rt
(nm
ol/
L)
time (mins)
acyclovir
acyclovir + quinidine

95
Figure 20. Acyclovir transport across human renal proximal tubular cell (HK-2) monolayers.
The transport (basolateral-to-apical) of acyclovir was assessed in HK-2 cells monolayers. Cell
monolayers were exposed to [8-14
C] acyclovir (5E-02 µmol/L) in the presence or absence of
quinidine (1000 µmol/L) for 30 mins. The transport of acyclovir was assessed by measuring the
appearance of [8-14
C] acyclovir radioactivity in the apical compartment at specific time intervals
(0, 7.5, 15, 22.5 and 30 mins) for 30 mins. Radioactivity was measured as disintegrations per
minute (DPM). Acyclovir transport is expressed as the concentration of [8-14
C] acyclovir in the
apical compartment. Results are presented as the mean (± standard error (SE)) from 3 cell
monolayer experiments. * p<0.05, compared to [8-14
C] acyclovir radioactivity in the apical
compartment in the absence of quinidine.
** *
0
1
2
3
4
5
6
7
8
0 7.5 15 22.5 30
[8-1
4C
] a
cycl
ov
ir t
ran
spo
rt
(nm
ol/
L)
time (mins)
acyclovir
acyclovir + quinidine

96
5.3.3 The effect of acyclovir on creatinine transport across LLC-PK1 and HK-2 cell
monolayers
Figure 21 illustrates that in contrast to quinidine and cimetidine, acyclovir (22 to 89 µmol/L) did
not inhibit creatinine transport across LLC-PK1 cell monolayers. The concentration of [2-14
C]
creatinine in the apical compartment over the experimental study period was similar between cell
monolayers exposed to creatinine in the presence or absence of acyclovir (22 to 89 µmol/L). In
contrast, there was a decrease in the concentration of [2-14
C] creatinine in the apical
compartment in the presence of quinidine or cimetidine, compared to the concentration of [2-14
C]
creatinine in the apical compartment in the absence of quinidine or cimetidine. Creatinine
transport was significantly (p<0.05) inhibited in the presence of quinidine or cimetidine at 30 and
45 mins.
Figure 22 illustrates that in contrast to quinidine, acyclovir (22 to 89 µmol/L) did not inhibit
creatinine transport across HK-2 cell monolayers. The concentration of [2-14
C] creatinine in the
apical compartment over the experimental study period was similar between cell monolayers
exposed to creatinine in the presence or absence of acyclovir (22 to 89 µmol/L). In contrast, the
concentration of [2-14
C] creatinine was decreased in the apical compartment in the presence of
quinidine, compared to the concentration of [2-14
C] creatinine in the apical compartment in the
absence of quinidine. Creatinine transport was significantly (p<0.05) inhibited in the presence of
quinidine at 30 mins. The concentration of [2-14
C] creatinine appeared to be decreased in the
apical compartment in presence of cimetidine, compared to the concentration of [2-14
C]
creatinine in the apical compartment in the absence of cimetidine.

97
Figure 21. The effect of acyclovir on creatinine transport across porcine renal proximal tubular
cell (LLC-PK1) monolayers. The transport (basolateral-to-apical direction) of creatinine was
assessed in LLC-PK1 cells monolayers. Cell monolayers were exposed to [2-14
C] creatinine (5
µmol/L) in the presence or absence of quinidine (1000 µmol/L), cimetidine (1000 µmol/L) or
acyclovir (22 to 89 µmol/L) for 60 mins. The transport of creatinine was assessed by measuring
the appearance of [2-14
C] creatinine radioactivity in the apical compartment at specific time
intervals (0, 15, 30, 45 and 60 mins) for 60 mins. Radioactivity was measured as disintegrations
per minute (DPM). Creatinine transport is expressed as the concentration of [2-14
C] creatinine in
the apical compartment. Results are presented as the mean (± standard error (SE)) from 3 cell
monolayer experiments. * p<0.05, compared to [2-14
C] creatinine radioactivity in the apical
compartment in the absence of quinidine, cimetidine or acyclovir.
*
*
**
0
20
40
60
80
100
120
140
160
180
0 15 30 45 60
[2-1
4C
] cr
eati
nin
etr
an
spo
rt
(nm
ol/
L)
time (mins)
creatinine
creatinine + quinidine
creatinine + cimetidine
creatinine + acyclovir (22 µmol/L)
creatinine + acyclovir (44 µmol/L)
creatinine + acyclovir (67 µmol/L)
creatinine + acyclovir (89 µmol/L)

98
Figure 22. The effect of acyclovir on creatinine transport across human renal proximal tubular
cell (HK-2) monolayers. The transport (basolateral-to-apical) of creatinine was assessed in HK-
2 cells monolayers. Cell monolayers were exposed to [2-14
C] creatinine (5 µmol/L) in the
presence or absence of quinidine (1000 µmol/L), cimetidine (1000 µmol/L) or acyclovir (22 to
89 µmol/L) for 30 mins. The transport of creatinine was assessed by measuring the appearance
of [2-14
C] creatinine radioactivity in the apical compartment at specific time intervals (0, 7.5, 15,
22.5 and 30 mins) for 30 mins. Radioactivity was measured as disintegrations per minute
(DPM). Creatinine transport is expressed as the concentration of [2-14
C] creatinine in the apical
compartment. Results are presented as the mean (± standard error (SE)) from 3 cell monolayer
experiments. * p<0.05, compared to [2-14
C] creatinine radioactivity in the apical compartment in
the absence of quinidine, cimetidine or acyclovir.
*
0
50
100
150
200
250
300
350
400
450
500
0 7.5 15 22.5 30
[2-1
4C
] cr
eati
nin
etr
an
spo
rt
(nm
ol/
L)
time (mins)
creatinine
creatinine + quinidine
creatinine + cimetidine
creatinine + acyclovir (22 µmol/L)
creatinine + acyclovir (44 µmol/L
creatinine + acyclovir (67 µmol/L
creatinine + acyclovir (89 µmol/L)

99
5.4 Discussion
The objective of our study was to determine whether acyclovir inhibits creatinine transport. The
LLC-PK1 and HK-2 cell lines were employed as our in vitro models. The results suggest that
LLC-PK1 (Figure 17) and HK-2 (Figure 18) cells possess functional OCTs, thereby making
them appropriate models to study the renal tubular transport of organic cations such as creatinine
and acyclovir. In contrast to LLC-PK1 cells, the presence of functional OCTs in HK-2 cells has
not been previously reported. Hence, our study is the first to report that HK-2 cells possess
functional OCTs, thereby making them an invaluable in vitro model to study the renal tubular
transport of organic cations in humans.
Importantly, in contrast to quinidine (LLC-PK1 and HK-2) (Figures 19 and 20) or cimetidine
(LLC-PK1) (Figure 19), acyclovir did not inhibit creatinine transport across both types of cell
monolayers; suggesting that acyclovir does not affect the renal tubular handling of creatinine.
As previously explained; (1) the marked, transient increase in plasma creatinine observed in
some patients who received acyclovir (Table 3) is similar to that observed in some patients who
received non-nephrotoxic drugs that share similar renal tubular transport with creatinine and
hence compete with and subsequently inhibit creatinine secretion (Berglund et al. 1975;
Blackwood et al. 1976; Burgess et al. 1982; Burry and Dieppe 1976; Dubb et al. 1978; Dutt et al.
1981; Haggie et al. 1976; Kastrup et al. 1985; Myre et al. 1987; Opravil et al. 1993; Tschuppert
et al. 2007) and (2) acyclovir may share similar renal tubular transport mechanisms with
creatinine (Eisner et al. 2010; Okuda et al. 2006; Takeda et al. 2002; Urakami et al. 2004).
Hence, if this is the case, it is possible that our results illustrate that acyclovir did not inhibit the
tubular transport of creatinine for the following reasons:

100
First, as reviewed by Andreev et al. (Andreev et al. 1999), some drugs, such as phenacemide and
vitamin D derivatives induce a marked, transient increase in plasma creatinine in the absence of
other significant signs of renal impairment by other less well understood mechanisms, including
interference with the Jaffé-based assay for creatinine measurement and modification of the
production rate and release of creatinine, respectively. Thus, acyclovir may affect plasma
creatinine levels by a yet unknown mechanism(s).
Second, based on our results, it can be argued that acyclovir did not inhibit creatinine transport
across LLC-PK1 cell monolayers because in contrast to creatinine (Figure 21), the OCT pathway
in the LLC-PK1 cells did not appear to play a significant role in acyclovir transport (Figure 19),
and hence acyclovir was unlikely to compete with and subsequently inhibit creatinine transport
via the OCT pathway present in the cells. Furthermore interspecies differences in drug
disposition (Eaton and Klaassen 2001; Riddick 1998) and protein expression (Mersch-
Sundermann et al. 2004) for instance, may provide an explanation for the lack of inhibition of
creatinine transport by acyclovir in LLC-PK1 cells. For example, the degree of amino acid
sequence similarity between porcine OCT1 (pOCT1) and hOCT1 is approximately 78 % (NCBI
Unigene 2009a), while porcine OCT2 (pOCT2) and hOCT2 share approximately 86 % amino
acid sequence homology (NCBI Unigene 2009b).
However, in contrast to the results obtained in LLC-PK1 cells, the OCT pathway in human HK-2
cells played a significant role in both acyclovir (Figure 20) and creatinine transport (Figure 22),
yet similar to the results obtained in LLC-PK1 cells, acyclovir did not inhibit creatinine transport
in human HK-2 cells. The results from previous studies suggest that the OCTs may mediate the
renal tubular transport of both creatinine (Okuda et al. 2006; Urakami et al. 2004) and acyclovir
(Takeda et al. 2002). However, while OCT2 appears to be primarily responsible for creatinine

101
transport (Okuda et al. 2006; Urakami et al. 2004), it appears that OCT1 may be predominantly
accountable for acyclovir transport (Takeda et al. 2002). Reviewed by Dresser et al. (Dresser et
al. 2001), OCT1 and OCT2 are both located in the human kidney, therefore it is possible that
renal secretion of creatinine and acyclovir may be mediated by different OCTs; OCT2 and
OCT1, respectively. Thus, acyclovir may not impede creatinine tubular transport in vitro and
possibly in vivo, in humans as well.
The knowledge that OCT1, rather than OCT2, mediate acyclovir transport may also provide an
explanation for the insignificant transport of acyclovir across LLC-PK1 cells (Figure 19). In
contrast to OCT2 (Grundemann et al. 1997), OCT1 has not been specifically identified in LLC-
PK1 cells. The LLC-PK1 cells may lack or have reduced expression of OCT1. Therefore, LLC-
PK1 cells may be unable to transport acyclovir via their existing OCT system, and hence may be
an inappropriate model to examine acyclovir transport via the same. Furthermore, if the
plausible lack of or reduced OCT1 expression in LLC-PK1 cells resulted in the absence of
significant acyclovir transport across the cell monolayers (Figure 19), then the results provide
additional support for the postulation that acyclovir and creatinine may be transported via
different OCTs.
Third, we employed in vitro models in our studies. Although in vitro models are widely used in
pharmacology and toxicology studies to address questions at both the cellular and molecular
level, there are several major disadvantages of in vitro models that limit their ability to accurately
predict responses in vivo (Davila et al. 1998; Zucco et al. 2004). Major disadvantages include
disruption of cellular structural integrity and intercellular relationships, the production of
artifactual drug binding sites that does not normally exist in vivo, differences between in vitro
and in vivo drug pharmacokinetics and altered protein expression (Davila et al. 1998).

102
Therefore, the transport of creatinine and/or acyclovir in vitro may be altered from its transport
in vivo, in humans.
In our study, we investigated the possible interaction between creatinine and acyclovir at the
OCT pathway. However, it is also possible that the interaction between creatinine and acyclovir
may be occurring at the OAT pathway, rather than at the OCT pathway. Results from studies
suggest that the OAT system may play a fundamental role in both creatinine (Arendshorst and
Selkurt 1970; Burry and Dieppe 1976; Eisner et al. 2010) and acyclovir (Takeda et al. 2002)
transport. The LLC-PK1 cells do not possess OATs (Hori et al. 1993; Mertens et al. 1988), and
therefore are an inappropriate in vitro model to study the possible interaction between creatinine
and acyclovir at the OAT pathway. The expression of functional OATs in HK-2 cells is
currently unknown and we did not determine the same in our study. However, if functional
OATs are expressed in HK-2 cells, and both creatinine and acyclovir were significantly
transported by the same OAT(s), then, in the presence of acyclovir, decreased creatinine
transport across the cell monolayers would have likely been observed. Alternatively, as
suggested for OCTs, creatinine and acyclovir may have been transported by different OATs
expressed in the HK-2 cells, such that acyclovir did not hinder creatinine transport via the OAT
pathway.
Engaging both animal (LLC-PK1) and human (HK-2) cell models, we illustrated that acyclovir
did not inhibit creatinine transport. Taken together, the results suggest that acyclovir does not
affect the renal tubular transport of creatinine, in vitro and possibly, in vivo, in humans as well.
Therefore, the pronounced, transient elevation in plasma creatinine observed in some children
may be solely due to decreased GFR as a result of renal dysfunction induced by acyclovir, and
not due to a spurious acyclovir-creatinine interaction on the tubular level.

103
5.5 Acknowledgements
The study was supported by a grant from CIHR.
5.6 Statement of significance
These are the first experimental results which show that acyclovir does not inhibit the tubular
transport of creatinine in vitro, and possibly, in vivo. Thus, the marked, transient elevation in
plasma creatinine levels observed in some patients may be solely due to decreased GFR as a
result of acyclovir – induced nephrotoxicity, and not due the inhibition of creatinine secretion by
acyclovir.

104
5.7 References
NCBI Unigene. 2009a. Organic cation transporter 1 (OCT1).
[http:www.ncbi.nlm.gov/UniGene/clus.cgi?ORG=Ssc&CID=23507&itool=HomolGeneMainRep
ort].
NCBI Unigene. 2009b. Solute carrier family 22 (organic cation transporter), member 2
(SLC22A2).
[http://www.ncbi.nlm.nih.gov/UniGene/clus.cgi?UGID=454108&TAXID=9823&SEARCH=org
anic cation transporter 2].
Ahmad, T., Simmonds, M., McIver, A.G., and McGraw, M.E. 1994. Reversible renal failure in
renal transplant patients receiving oral acyclovir prophylaxis. Pediatr Nephrol 8: 489-491.
Andreev, E., Koopman, M., and Arisz, L. 1999. A rise in plasma creatinine that is not a sign of
renal failure: which drugs can be responsible? J Intern Med 246: 247-252.
Arendshorst, W.J., and Selkurt, E.E. 1970. Renal tubular mechanisms for creatinine secretion in
the guinea pig. Am J Physiol 218: 1661-1670.
Berglund, F., Killander, J., and Pompeius, R. 1975. Effect of trimethoprim-sulfamethoxazole on
the renal excretion of creatinine in man. J Urol 114: 802-808.
Bianchetti, M.G., Roduit, C., and Oetliker, O.H. 1991. Acyclovir-induced renal failure: course
and risk factors. Pediatr Nephrol 5: 238-239.
Blackwood, W.S., Maudgal, D.P., Pickard, R.G., Lawrence, D., and Northfield, T.C. (1976).
Cimetidine in duodenal ulcer. Controlled trial. Lancet 2: 174-176.
Brigden, D., Rosling, A.E., and Woods, N.C. 1982. Renal function after acyclovir intravenous
injection. Am J Med 73: 182-185.
Bryson, Y.J. 1984. The use of acyclovir in children. Pediatr Infect Dis 3: 345-348.
Burgess, E., Blair, A., Krichman, K., and Cutler, R.E. 1982. Inhibition of renal creatinine
secretion by cimetidine in humans. Ren Physiol 5: 27-30.
Burry, H.C., and Dieppe, P.A. 1976. Apparent reduction of endogenous creatinine clearance by
salicylate treatment. Br Med J 2: 16-17.
Chou, J.W., Yong, C., and Wootton, S.H. 2008. Case 2: Rash, fever and headache....first, do no
harm. Paediatr Child Health 13: 49-52.
Davila, J.C., Rodriguez, R.J., Melchert, R.B., and Acosta, D., Jr. 1998. Predictive value of in
vitro model systems in toxicology. Annu Rev Pharmacol Toxicol 38: 63-96.
105
Dresser, M.J., Leabman, M.K., and Giacomini, K.M. 2001. Transporters involved in the
elimination of drugs in the kidney: organic anion transporters and organic cation transporters. J
Pharm Sci 90: 397-421.
Dubb, J.W., Stote, R.M., Familiar, R.G., Lee, K., and Alexander, F. 1978. Effect of cimetidine
on renal function in normal man. Clin Pharmacol Ther 24: 76-83.
Dutt, M.K., Moody, P., and Northfield, T.C. 1981. Effect of cimetidine on renal function in man.
Br J Clin Pharmacol 12: 47-50.
Eaton, D.L., and Klaassen, C.D. 2001. Principles of Toxicology. In Casarett & Doull's
Toxicology, the basic science of poisons. Edited by Klassen, C.D. The Mc-Graw Hill
Companies, New York. pp 3-34.
Eisner, C., Faulhaber-Walter, R., Wang, Y., Leelahavanichkul, A., Yuen, P.S., Mizel, D., Star,
R.A., Briggs, J.P., Levine, M., and Schnermann, J. 2010. Major contribution of tubular secretion
to creatinine clearance in mice. Kidney Int 77: 519-526.
Fauth, C., Rossier, B., and Roch-Ramel, F. 1988. Transport of tetraethylammonium by a kidney
epithelial cell line (LLC-PK1). Am J Physiol 254: F351-357.
Genc, G., Ozkaya, O., Acikgoz, Y., Yapici, O., Bek, K., Gulnar Sensoy, S., and Ozyurek, E.
2010. Acute renal failure with acyclovir treatment in a child with leukemia. Drug Chem Toxicol
33: 217-219.
Grundemann, D., Babin-Ebell, J., Martel, F., Ording, N., Schmidt, A., and Schomig, E. 1997.
Primary structure and functional expression of the apical organic cation transporter from kidney
epithelial LLC-PK1 cells. J Biol Chem 272: 10408-10413.
Grundemann, D., Gorboulev, V., Gambaryan, S., Veyhl, M., and Koepsell, H. 1994. Drug
excretion mediated by a new prototype of polyspecific transporter. Nature 372: 549-552.
Gunness, P., Aleksa, K., Kousage, K., Ito, S. and Koren, G. 2010. Comparison of the novel HK-2
human renal proximal tubular cell line to the standard LLC-PK1 cell line in studying drug-
induced nephrotoxicity. Can J Physiol Pharmacol 88: 448-455.
Haggie, S.J., Fermont, D.C., and Wyllie, J.H. 1976. Treatment of duodenal ulcer with cimetidine.
Lancet 1: 983-984.
Hori, R., Okamura, M., Takayama, A., Hirozane, K., and Takano, M. 1993. Transport of organic
anion in the OK kidney epithelial cell line. Am J Physiol 264: F975-980.
Kastrup, J., Petersen, P., Bartram, R., and Hansen, J.M. 1985. The effect of trimethoprim on
serum creatinine. Br J Urol 57: 265-268.

106
Keeney, R.E., Kirk, L.E., and Bridgen, D. 1982. Acyclovir tolerance in humans. Am J Med 73:
176-181.
Mersch-Sundermann, V., Knasmuller, S., Wu, X.J., Darroudi, F., and Kassie, F. 2004. Use of a
human-derived liver cell line for the detection of cytoprotective, antigenotoxic and cogenotoxic
agents. Toxicology 198: 329-340.
Mertens, J.J., Weijnen, J.G., van Doorn, W.J., Spenkelink, B., Temmink, J.H., and van Bladeren,
P.J. 1988. Differential toxicity as a result of apical and basolateral treatment of LLC-PK1
monolayers with S-(1,2,3,4,4-pentachlorobutadienyl)glutathione and N-acetyl-S-(1,2,3,4,4-
pentachlorobutadienyl)-L-cysteine. Chem Biol Interact 65: 283-293.
Myre, S.A., McCann, J., First, M.R., and Cluxton, R.J., Jr. 1987. Effect of trimethoprim on
serum creatinine in healthy and chronic renal failure volunteers. Ther Drug Monit 9: 161-165.
Okuda, M., Kimura, N., and Inui, K. 2006. Interactions of fluoroquinolone antibacterials, DX-
619 and levofloxacin, with creatinine transport by renal organic cation transporter hOCT2. Drug
Metab Pharmacokinet 21: 432-436.
Opravil, M., Keusch, G., and Luthy, R. 1993. Pyrimethamine inhibits renal secretion of
creatinine. Antimicrob Agents Chemother 37: 1056-1060.
Perantoni, A., and Berman, J.J. 1979. Properties of Wilms' tumor line (TuWi) and pig kidney
line (LLC-PK1) typical of normal kidney tubular epithelium. In Vitro 15: 446-454.
Potter, J.L., and Krill, C.E., Jr. 1986. Acyclovir crystalluria. Pediatr Infect Dis 5, 710-712.
Riddick, D.S. 1998. Drug Biotransformation. In Principles of Medical Pharmacology. Edited by
Kalant, H., and Roschlau, W.H.E. Oxford University Press, New York. pp 38-54.
Saito, H., Yamamoto, M., Inui, K., and Hori, R. 1992. Transcellular transport of organic cation
across monolayers of kidney epithelial cell line LLC-PK1. Am J Physiol 262: C59-66.
Sawyer, M.H., Webb, D.E., Balow, J.E., and Straus, S.E. 1988. Acyclovir-induced renal failure.
Clinical course and histology. Am J Med 84; 1067-1071.
Schreiber, R., Wolpin, J., and Koren, G. 2008. Determinants of aciclovir-induced nephrotoxicity
in children. Paediatr Drugs 10: 135-139.
Takeda, M., Khamdang, S., Narikawa, S., Kimura, H., Kobayashi, Y., Yamamoto, T., Cha, S.H.,
Sekine, T., and Endou, H. 2002. Human organic anion transporters and human organic cation
transporters mediate renal antiviral transport. J Pharmacol Exp Ther 300: 918-924.
Toto, R.D. 1995. Conventional measurement of renal function utilizing serum creatinine,
creatinine clearance, inulin and para-aminohippuric acid clearance. Curr Opin Nephrol
Hypertens 4: 505-509

107
Tschuppert, Y., Buclin, T., Rothuizen, L.E., Decosterd, L.A., Galleyrand, J., Gaud, C., and
Biollaz, J. 2007. Effect of dronedarone on renal function in healthy subjects. Br J Clin Pharmacol
64: 785-791.
Urakami, Y., Kimura, N., Okuda, M., and Inui, K. 2004. Creatinine transport by basolateral
organic cation transporter hOCT2 in the human kidney. Pharm Res 21: 976-981.
Urakami, Y., Kimura, N., Okuda, M., Masuda, S., Katsura, T., and Inui, K. 2005. Transcellular
transport of creatinine in renal tubular epithelial cell line LLC-PK1. Drug Metab Pharmacokinet
20: 200-205.
Vachvanichsanong, P., Patamasucon, P., Malagon, M., and Moore, E.S. 1995. Acute renal failure
in a child associated with acyclovir. Pediatr Nephrol 9: 346-347.
Vomiero, G., Carpenter, B., Robb, I., and Filler, G. 2002. Combination of ceftriaxone and
acyclovir - an underestimated nephrotoxic potential? Pediatr Nephrol 17: 633-637.
Zucco, F., De Angelis, I., Testai, E., and Stammati, A. 2004. Toxicology investigations with cell
culture systems: 20 years after. Toxicol In Vitro 18: 153-163.

108
5.8 Additional experiments not published
5.8.1 The paracellular flux (basolateral-to-apical) of D-[1-3H(N)] mannitol
As mentioned earlier in the chapter (section 5.2.2), the paracellular flux (basolateral-to-apical) of
D-[1-3H(N)] mannitol across the LLC-PK1 or HK-2 cell monolayers to assess the integrity of
cell monolayers. A priori decision was made to eliminate the results from any cell monolayers
where the paracellular flux of D-[1-3H(N)] mannitol across LLC-PK1 or HK-2 cell monolayers
was greater than 5 % over the respective experimental period.
5.8.2 Materials and methods
The radioactivity of D-[1-3H(N)] mannitol was assessed as previously described (section 5.2.2).
5.8.3 Results
The paracellular flux (basolateral-to-apical) of D-[1-3H(N)] mannitol across LLC-PK1 or HK-2
cell monolayers was not greater than 5 % over the respective experimental time periods [LLC-
PK1:60 mins; HK-2: 30 mins].

109
Figure 23. The paracellular flux of mannitol across procine renal proximal tubular cell (LLC-
PK1) monolayers that were used for determining the transepithelial transport of
tetraethylammonium (TEA) across the cell monolayers. Cell monolayers were exposed to D-[1-3H(N)] mannitol (10 nmol/L) for 60 mins. The paracellular flux of mannitol was assessed by
measuring the appearance of D-[1-3H(N)] mannitol radioactivity in the apical compartment at
specific time intervals (0, 15, 30, 45 and 60 mins) for 60 mins. Radioactivity was measured as
disintegrations per minute (DPM). The paracellular flux of mannitol is expressed as the percent
(%) of radioactivity on the apical side at the respective time interval, compared to the basolateral
side at time zero. Results are presented as the mean ± standard error (SE) from 3 cell monolayer
experiments.
0.00
0.10
0.20
0.30
0.40
0.50
0.60
0 15 30 45 60
D-[
1-3
H(N
)] m
an
nit
ol
pa
race
llu
lar
flu
x
(% o
f ra
dio
act
ivit
y o
n t
he
ap
ica
l si
de
at
the
resp
ecti
ve
tim
e in
terv
al
co
mp
are
d t
o t
he
ba
sola
tera
lsi
de
at
tim
e
zero
)
time (mins)
TEA
TEA + quinidine

110
Figure 24. The paracellular flux of mannitol across human renal proximal tubular cell (HK-2)
monolayers that were used for determining the transepithelial transport of tetraethylammonium
(TEA) across the cell monolayers. Cell monolayers were exposed to D-[1-3H(N)] mannitol (10
nmol/L) for 30 mins. The paracellular flux of mannitol was assessed by measuring the
appearance of D-[1-3H(N)] mannitol radioactivity in the apical compartment at specific time
intervals (0, 7.5, 15, 22.5 and 30 mins) for 30 mins. Radioactivity was measured as
disintegrations per minute (DPM). The paracellular flux of mannitol is expressed as the percent
(%) of radioactivity on the apical side at the respective time interval, compared to the basolateral
side at time zero. Results are presented as the mean ± standard error (SE) from 3 cell monolayer
experiments.
-0.50
0.00
0.50
1.00
1.50
2.00
2.50
3.00
3.50
4.00
4.50
0 7.5 15 22.5 30
D-[
1-3
H(N
)] m
an
nit
ol
pa
race
llu
lar
flu
x
(% o
f ra
dio
act
ivit
y o
n t
he
ap
ica
l si
de
at
the
resp
ecti
ve
tim
e in
terv
al
co
mp
are
d t
o t
he
ba
sola
tera
l si
de
at
tim
e
zero
)
time (mins)
TEA
TEA + quinidine

111
Figure 25. The paracellular flux of mannitol across procine renal proximal tubular cell (LLC-
PK1) monolayers that were used for determining the transepithelial transport of acyclovir across
the cell monolayers. Cell monolayers were exposed to D-[1-3H(N)] mannitol (10 nmol/L) for 60
mins. The paracellular flux of mannitol was assessed by measuring the appearance of D-[1-3H(N)] mannitol radioactivity in the apical compartment at specific time intervals (0, 15, 30, 45
and 60 mins) for 60 mins. Radioactivity was measured as disintegrations per minute (DPM).
The paracellular flux of mannitol is expressed as the percent (%) of radioactivity on the apical
side at the respective time interval, compared to the basolateral side at time zero. Results are
presented as the mean ± standard error (SE) from 3 cell monolayer experiments.
-0.20
0.00
0.20
0.40
0.60
0.80
1.00
1.20
0 15 30 45 60
D-[
1-3
H(N
)] m
an
nit
ol
pa
race
llu
lar
flu
x
(% o
f ra
dio
act
ivit
y o
n t
he
ap
ica
l si
de
at
the
resp
ecti
ve
tim
e in
terv
al
co
mp
are
d t
o t
he
ba
sola
tera
l si
de
at
tim
e
zero
)
time (mins)
acyclovir
acyclovir + quinidine
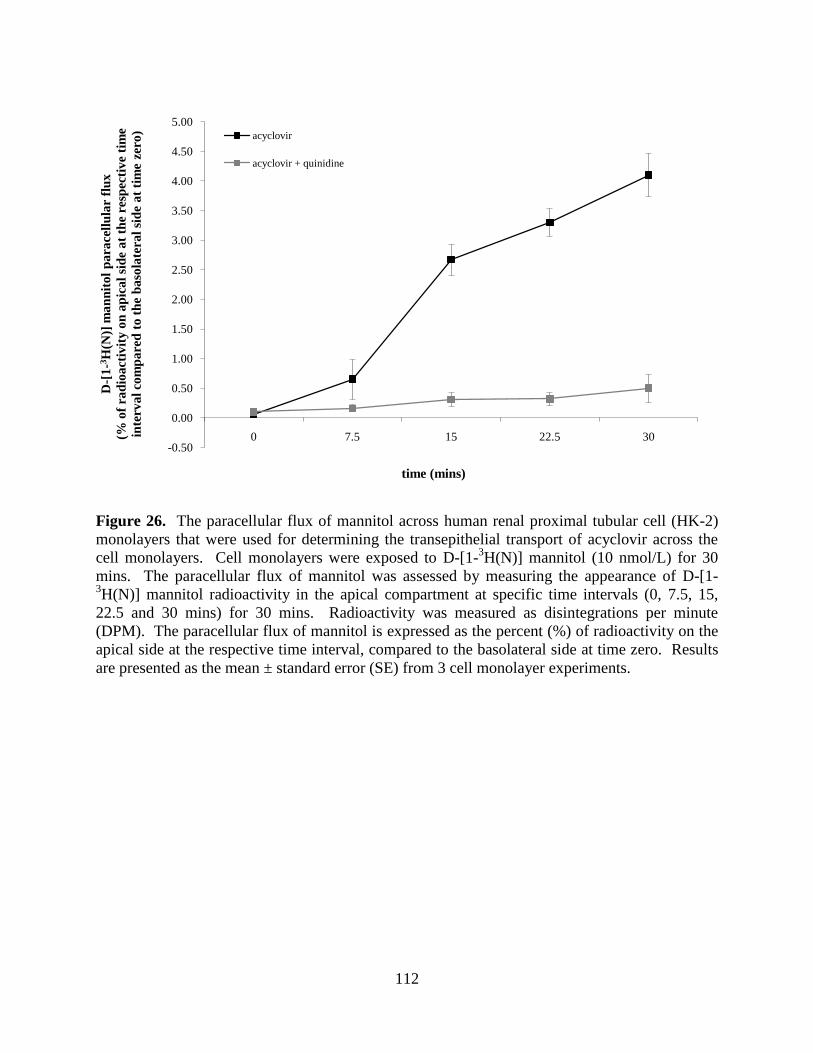
112
Figure 26. The paracellular flux of mannitol across human renal proximal tubular cell (HK-2)
monolayers that were used for determining the transepithelial transport of acyclovir across the
cell monolayers. Cell monolayers were exposed to D-[1-3H(N)] mannitol (10 nmol/L) for 30
mins. The paracellular flux of mannitol was assessed by measuring the appearance of D-[1-3H(N)] mannitol radioactivity in the apical compartment at specific time intervals (0, 7.5, 15,
22.5 and 30 mins) for 30 mins. Radioactivity was measured as disintegrations per minute
(DPM). The paracellular flux of mannitol is expressed as the percent (%) of radioactivity on the
apical side at the respective time interval, compared to the basolateral side at time zero. Results
are presented as the mean ± standard error (SE) from 3 cell monolayer experiments.
-0.50
0.00
0.50
1.00
1.50
2.00
2.50
3.00
3.50
4.00
4.50
5.00
0 7.5 15 22.5 30
D-[
1-3
H(N
)] m
an
nit
ol
pa
race
llu
lar
flu
x
(% o
f ra
dio
act
ivit
y o
n a
pic
al
sid
e a
t th
e re
spec
tiv
e ti
me
inte
rva
l co
mp
are
d t
o t
he
ba
sola
tera
lsi
de
at
tim
e ze
ro)
time (mins)
acyclovir
acyclovir + quinidine

113
Figure 27. The paracellular flux of mannitol across procine renal proximal tubular cell (LLC-
PK1) monolayers that were used to determine acyclovir inhibits the tubular transport of
creatinine. Cell monolayers were exposed to D-[1-3H(N)] mannitol (10 nmol/L) for 60 mins.
The paracellular flux of mannitol was assessed by measuring the appearance of D-[1-3H(N)]
mannitol radioactivity in the apical compartment at specific time intervals (0, 15, 30, 45 and 60
mins) for 60 mins. Radioactivity was measured as disintegrations per minute (DPM). The
paracellular flux of mannitol is expressed as the percent (%) of radioactivity on the apical side at
the respective time interval, compared to the basolateral side at time zero. Results are presented
as the mean ± standard error (SE) from 3 cell monolayer experiments.
-0.30
-0.20
-0.10
0.00
0.10
0.20
0.30
0.40
0.50
0.60
0.70
0.80
0 15 30 45 60
D-[
1-3
H(N
)] m
an
nit
ol
pa
race
llu
lar
flu
x
(% o
f ra
dio
act
ivit
y o
n t
he
ap
ica
l si
de
at
the
resp
ecti
ve
tim
e in
terv
al
co
mp
are
d t
o t
he
ba
sola
tera
l si
de
at
tim
e
zero
)
time (mins)
creatinine
creatinine + quinidine
creatinine + cimetidine
creatinine + acyclovir (22 µmol/L)
creatinine + acyclovir (44 µmol/L)
creatinine + acyclovir (67 µmol/L)
creatinine + acyclovir (89 µmol/L)

114
Figure 28. The paracellular flux of mannitol across human renal proximal tubular cell (HK-2)
monolayers that were used to determine acyclovir inhibits the tubular transport of creatinine.
Cell monolayers were exposed to D-[1-3H(N)] mannitol (10 nmol/L) for 30 mins. The
paracellular flux of mannitol was assessed by measuring the appearance of D-[1-3H(N)] mannitol
radioactivity in the apical compartment at specific time intervals (0, 7.5, 15, 22.5 and 30 mins)
for 30 mins. Radioactivity was measured as disintegrations per minute (DPM). The paracellular
flux of mannitol is expressed as the percent (%) of radioactivity on the apical side at the
respective time interval, compared to the basolateral side at time zero. Results are presented as
the mean ± standard error (SE) from 3 cell monolayer experiments.
0.00
0.50
1.00
1.50
2.00
2.50
3.00
3.50
4.00
4.50
5.00
0 7.5 15 22.5 30
D-[
1-3
H(N
)] m
an
nit
ol
pa
race
llu
lar
flu
x
(% o
f ra
dio
act
ivit
y o
n t
he
ap
ica
l si
de
at
the
resp
ecti
ve
tim
e in
terv
al
co
mp
are
d t
o t
he
ba
sola
tera
l si
de
at
tim
e
zero
)
time (mins)
creatinine
creatinine + quinidine
creatinine + cimitidine
creatinine + acyclovir (22 µmol/L)
creatinine + acyclovir (44 µmol/L)
creatinine + acyclovir (67 µmol/L)
creatinine + acyclovir (89 µmol/L)

115
Chapter 6
Acyclovir is a substrate for the human breast cancer resistance
protein (BCRP/ABCG2): implications for renal tubular transport
and acyclovir – induced nephrotoxicity
Patrina Gunness,a,b
Katarina Aleksa,a,c
Gideon Korena,b
aDivision of clinical Pharmacology and Toxicology, The Hospital for Sick Children, 555
University Avenue, Toronto, ON, M5G 1X8, Canada
bGraduate Department of Pharmaceutical Sciences, Leslie Dan Faculty of Pharmacy, University
of Toronto, ON, M5S 3M2, Canada
cSchool of Pharmacy, University of Waterloo, 200 University Avenue West, Waterloo, Ontario,
N2L 3G1, Canada
This article has been accepted for publication: Gunness, P., Aleksa, K., and Koren, G. 2011.
Acyclovir is a substrate for the human breast cancer resistance protein (BCRP/ABCG2):
implications for renal tubular transport and acyclovir – induced nephrotoxicity. Can J Physiol
Pharmacol. [In press]. This article will be originally published by NRC Research Press.
[PG performed all experiments and prepared the manuscript for submission]

116
6.1 Abstract
The human BCRP is widely expressed in human tissues, including the kidney. In mice, Bcrp1
(murine BCRP ortholog) mediates the transport of acyclovir into breast milk. It is plausible that
acyclovir is also a substrate for human BCRP. The objective of the study was to determine
whether acyclovir is a substrate for human BCRP. Transfected human embryonic kidney
(HEK293) cells [containing the wildtype ABCG2 gene] were exposed to [8-14
C] acyclovir (1
µM) in the presence or absence of the BCRP inhibitor, fumitremorgin C (FTC). Intracellular
acyclovir accumulation was assessed using a liquid scintillation counter. Co-exposure to FTC
resulted in a significant (5-fold) increase in the intracellular accumulation of acyclovir. The
results suggest that acyclovir is a substrate for the human BCRP. The study is the first to provide
direct evidence for the role of human BCRP in acyclovir transport and its potential significance
with respect to renal tubular transport of acyclovir and the direct renal tubular insult induced by
the drug.
6.2 Introduction
The human BCRP is the second member of the subfamily G of the human ABC transporter
superfamily (Dean et al. 2001; Mao and Unadkat 2005; Robey et al. 2009). The 72-kDa protein
(Mao and Unadkat 2005) is an efflux transporter (Doyle et al. 1998; Rocchi et al. 2000)
responsible for the transport of both endogenous and exogenous substrates (Doyle et al. 1998;
Ozvegy et al. 2001). The protein is widely expressed in human tissues, including the placenta,
liver (Allikmets et al. 1988; Doyle et al. 1998; Maliepaard et al. 2001) and kidney (Huls et al.
2008).

117
In mice, it was illustrated that Bcrp1 (murine BCRP ortholog) is responsible for the transport of
acyclovir into breast milk (Jonker et al. 2005). Compared to female mice with functional Bcrp1,
the accumulation of acyclovir in breast milk was significantly less in mice with non-functional
Bcrp1. The results suggested that acyclovir is a substrate for mice Bcrp1 and hence, it may also
be a substrate for human BCRP. However, interspecies differences exist between murine Bcrp1
and human BCRP with respect to amino acid sequences, tissue expression (Allen et al. 1999) and
function (Gonzalez-Lobato et al. 2010). Therefore, the results presented by Jonker and
colleagues cannot be used to definitively conclude that acyclovir is a substrate for human BCRP.
The role of human BCRP in the transport of acyclovir has not been previously investigated. We
hypothesized that acyclovir is a substrate for human BCRP. Our group has been interested in the
study of the pathogenesis of acyclovir – induced nephrotoxicity in children, particularly the
direct renal tubular insult that is induced by the drug. Therefore, in this present study, the
relevance of our results to the renal tubular transport of acyclovir and the direct renal tubular
injury induced by the drug will be discussed.
The antiviral agent, acyclovir may cause severe nephrotoxicity, which can often lead to acute
renal failure in patients (Ahmad et al. 1994; Bianchetti et al. 1991; Brigden et al. 1982; Chou et
al. 2008; Genc et al. 2010; Keeney et al. 1982; Vachvanichsanong et al. 1995; Vomiero et al.
2002). It has long been believed that acyclovir – induced nephrotoxicity is secondary to
crystalluria (Bianchetti et al. 1991; Lyon et al. 2002; Mason and Nickols 2008; Peterslund et al.
1988; Sawyer et al. 1988). However, clinical evidence of nephrotoxicity in the absence of
crystalluria suggests that the drug induces direct insult to renal tubular cells (Ahmad et al. 1994;
Vomiero et al. 2002). Employing both porcine and human renal proximal tubular cells exposed
to concentrations of acyclovir that may be encountered in clinical practice (Hintz et al. 1982), we

118
recently provided the first experimental evidence to support the above clinical evidence
(Gunness et al. 2010). Elucidation of the renal tubular transport mechanisms of acyclovir is
critical for understanding the etiology of the direct renal tubular insult induced by the antiviral
agent. Research has shown that the human BCRP transporter is localized to the apical membrane
of renal tubular cells (Huls et al. 2008). Therefore, if acyclovir is a substrate for human BCRP
and the transporter plays a significant role in renal transport of acyclovir, then reduced or
abolished function of the efflux transporter may result in the increased intracellular accumulation
of acyclovir and subsequent detrimental nephrotoxic consequences, such as direct injury to renal
tubular cells.
6.3 Materials and methods
6.3.1 Cell culture
Stably transfected human embryonic kidney (HEK293) cells containing the full-length human
ABCG2 gene encoding the wildtype ABCG2 amino acid sequence were used as the in vitro
model (Dr. Robert W. Robey, National Institutes of Health (NIH), Bethesda, Maryland, USA).
The cells were maintained as described by Morisaki and colleagues (Morisaki et al. 2005). The
expression of the ABCG2 protein was enforced by selection in G418 (Invitrogen Canada Inc.).
The cells were cultured in Eagles’s Minimum Essential Medium (EMEM) (ATCC)
supplemented with FBS (10 %), penicillin (100 Units/mL), streptomycin (100 µg/mL) and G418
(2 mg/mL). Cells were maintained at 37°C in a sterile, humidified atmosphere of 5 % CO2 and
95 % O2. All experiments were conducted on cell monolayers that were grown to 85 – 90 %
confluence. Hereinafter, these cells will be referred to as ‘overexpressing HEK293 cells’.

119
6.3.2 Determination of protein expression of human BCRP in overexpressing HEK293
cells
Qualitative western blots assays were conducted to confirm the protein expression of human
BCRP in the overexpressing HEK293 cells. Whole cell lysate was used for western blot assays.
Human placenta and mock HEK293 cells [transfected with the empty PC DNA 3.1 vector] were
used as the positive and negative control, respectively, for western blot assays. The human
placenta is known to express high levels of BCRP (Allikmets et al. 1998; Doyle et al. 1998;
Maliepaard et al. 2001). The human placenta tissue was obtained from Mount Sinai Hospital
(Toronto, Ontario, Canada). Mock HEK293 cells were also obtained from Dr. Robert W. Robey.
Total protein for western blot assays was quantified using the Bradford reagent (Sigma-Aldrich
Canada Ltd.).
6.3.3 Whole cell lysate for western blot assays
6.3.3a Mock or overexpressing HEK293 cells
The media from cell monolayers was removed and the cells were washed (2X) with ice-cold
PBS. Cell monolayers were scraped in a modified lysis buffer ([50 mmol/L Tris-HCL (pH7.4), 1
% (v/v) NP-40, 0.25 % (w/v) sodium deoxycholate, 150 mmol/L NaCl, 1 mmol/L EDTA, 1
mmol/L PMSF, 1 µg/mL aprotonin, 1 µg/mL leupeptin, 1 µg/mL pepstatin] (Millipore 2007).
The cell homogenate was centrifuged at 600 x g for 20 mins at 4◦C. The pellet was discarded
and the supernatant (whole cell lysate) was stored at -80◦C until analyses.

120
6.3.3b Human placenta tissue
Human placenta tissue (1 gram) was washed (2X) with ice-cold PBS. The tissue was
homogenized using a polytron homogenizer. The tissue was homogenized in the modified lysis
buffer described above for the HEK293 cells. The homogenate was centrifuged at 600 x g for 20
mins at 4◦C. The pellet was discarded and the supernatant (whole cell lysate) was stored at -80
◦C
until analyses.
6.3.4 Western blot assay
For electrophoresis samples, total protein was mixed with 2X Laemmli buffer (Laemmli 1970).
Total protein from human placenta (20 µg), HEK293 [transfected with the empty PC DNA 3.1
vector] (50 µg) or overexpressing HEK293 (50 µg) cells were resolved on a 10 % SDS-PAGE.
Resolved proteins were transferred unto Hybond™
- P PVDF membranes at 100 V for 1 hour in
transfer buffer [25 mmol/L Tris, 192 mmol/L glycine, 20 % (v/v) methanol, pH 8.3] (Towbin et
al. 1979). Blots were blocked in 5 % (w/v) skim milk overnight at 4◦C. Blots were then washed
in 5 % milk and subsequently incubated with mouse BCRP antibody (BXP-21, Kamiya
Biomedical Company, Seattle, Washington, USA) in 5 % skim milk overnight at 4◦C. The
primary antibody was diluted 1:120 for use. Following the incubation, the primary antibody was
removed and blots were washed in 5 % skim milk. Blots were subsequently incubated with goat
anti-mouse IgG-HRP antibody (sc-2005, Santa Cruz Biotechnology, Inc.) in 5 % skim milk for 2
hours at room temperature. The secondary antibody was diluted 1:5000 for use. The secondary
antibody was removed and the blots were washed sequentially in 5 % skim milk, PBST and PBS
solutions. Blots were developed using Western Lightning® Plus-ECL. Blots were exposed to
Kodak™
BioMax Light Film. The western blot assay was conducted in duplicates.

121
6.3.5 Hoescht 33342 dye efflux assay
The functional activity of the human BCRP in overexpressing HEK293 cells was assessed using
the Hoechst 33342 efflux assay. The assay was performed as described by Brown and
colleagues (Brown et al. 2008) with modification. The media from cell monolayers was removed
and cells were washed (2X) with warm Kreb’s buffer. Cell monolayers were subsequently
incubated in Kreb’s solution containing Hoechst 33342 (1 µmol/L) in the presence or absence of
the BCRP inhibitor, FTC (10 µmol/L) for 90 mins at 37◦C. Following the incubation period, the
cell monolayers were washed (3X) with ice-cold Kreb’s solution. The cell monolayers were then
further incubated in Kreb’s solution in the presence or absence of FTC for an additional 30 mins
at 37◦C. At the end of the incubation period, cell monolayers were washed (2X) with ice-cold
Kreb’s buffer and subsequently lysed using 1 % (v/v) Triton-X (Sigma-Aldrich Canada Ltd.).
The homogenate was centrifuged at 15 000 x g for 5 mins. Hoechst 33342 fluorescence was
measured using a BioTek® Synergy HT microplate reader at excitation and emission
wavelengths of 350 nm and 480 nm, respectively. The Hoechst 33342 efflux assay was
conducted in replicates of 9.
6.3.6 Cell accumulation assay
A cell accumulation assay was conducted to determine whether acyclovir is a substrate for
human BCRP. The assay was conducted as previously described (Bachmeier et al. 2006; Pollex
et al. 2010), with modification. Briefly, cell monolayers (overexpressing HEK293 cells) were
pre-treated with FTC (10 µmol/L) for 30 mins. Following the incubation period, the monolayers
were incubated with [8-14
C] acyclovir (1 µmol/L) in the presence or absence of FTC for an
additional 2 hrs. The media was then removed and the monolayers were washed (2X) with ice-

122
cold PBS. Cells were solubilized with NaOH (1N) on ice for 5 mins. The solubilized cells were
subsequently neutralized with HCL (1N). The cell lysates were centrifuged at 15 000 x g for 5
mins at 4◦C. Intracellular [8-
14C] acyclovir accumulation was determined by measuring the
radioactivity of the supernatant (600 µL) using a Beckman Coulter LS 6500 liquid scintillation
counter. Radioactivity was measured as disintegrations per minute (DPM). Intracellular [8-14
C]
acyclovir accumulation was normalized to total cell protein concentrations (mg/mL). Total
protein was quantified using the Bradford reagent (Sigma-Aldrich Canada Ltd.). The cell
accumulation assay was conducted in replicates of 3.
6.3.7 Statistical analyses
Statistical analyses of the data were performed using IBM® SPSS
® Statistics version 19 software.
Independent student t-tests were conducted to compare the data obtained from different
conditions of Hoechst 33342 or [8-14
C] acyclovir cell accumulation assays.
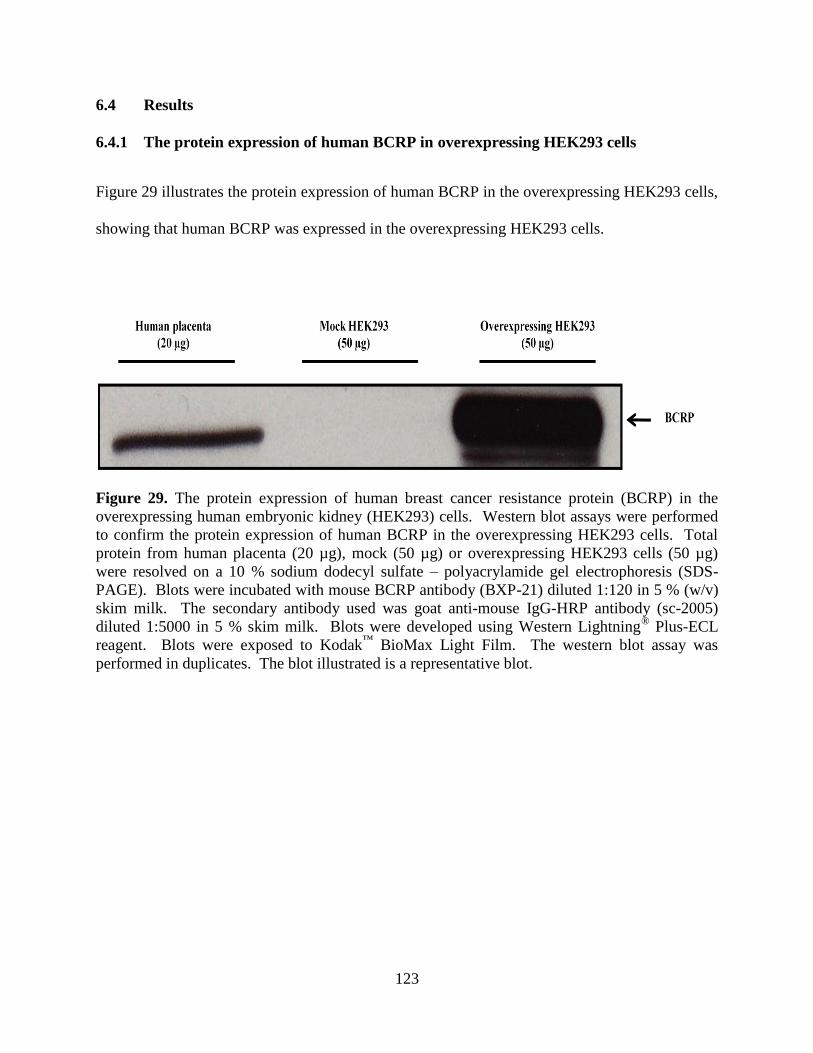
123
6.4 Results
6.4.1 The protein expression of human BCRP in overexpressing HEK293 cells
Figure 29 illustrates the protein expression of human BCRP in the overexpressing HEK293 cells,
showing that human BCRP was expressed in the overexpressing HEK293 cells.
Figure 29. The protein expression of human breast cancer resistance protein (BCRP) in the
overexpressing human embryonic kidney (HEK293) cells. Western blot assays were performed
to confirm the protein expression of human BCRP in the overexpressing HEK293 cells. Total
protein from human placenta (20 µg), mock (50 µg) or overexpressing HEK293 cells (50 µg)
were resolved on a 10 % sodium dodecyl sulfate – polyacrylamide gel electrophoresis (SDS-
PAGE). Blots were incubated with mouse BCRP antibody (BXP-21) diluted 1:120 in 5 % (w/v)
skim milk. The secondary antibody used was goat anti-mouse IgG-HRP antibody (sc-2005)
diluted 1:5000 in 5 % skim milk. Blots were developed using Western Lightning®
Plus-ECL
reagent. Blots were exposed to Kodak™
BioMax Light Film. The western blot assay was
performed in duplicates. The blot illustrated is a representative blot.
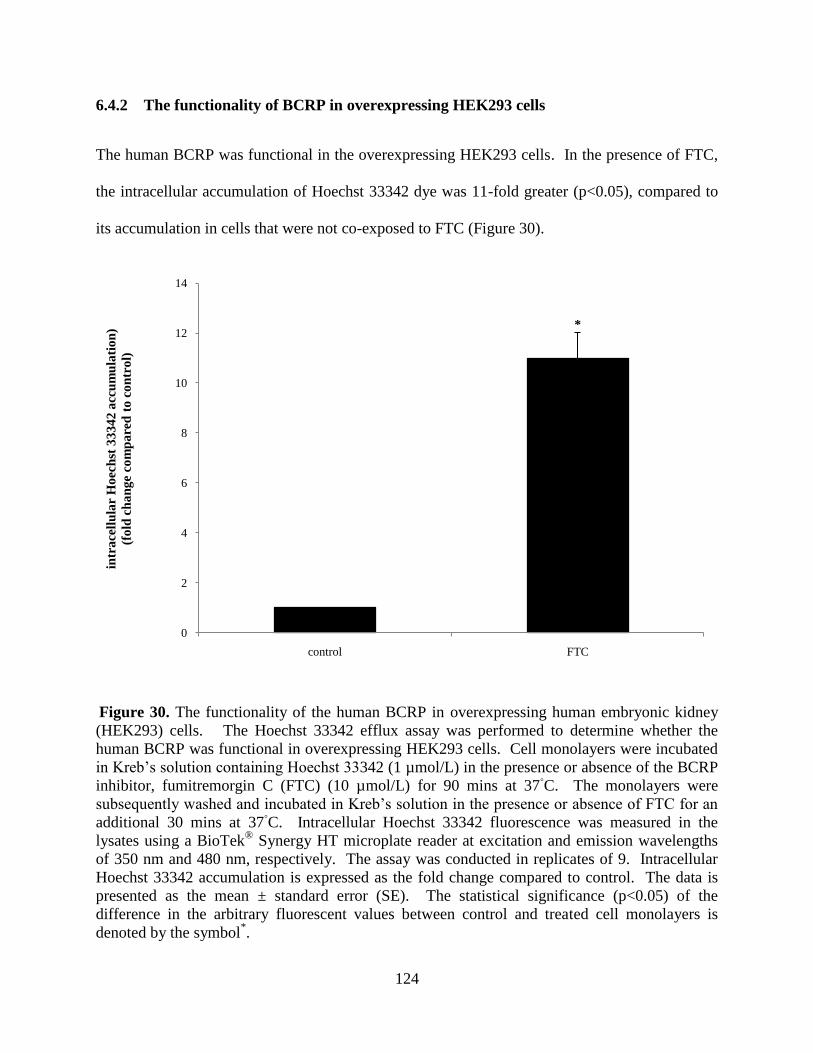
124
6.4.2 The functionality of BCRP in overexpressing HEK293 cells
The human BCRP was functional in the overexpressing HEK293 cells. In the presence of FTC,
the intracellular accumulation of Hoechst 33342 dye was 11-fold greater (p<0.05), compared to
its accumulation in cells that were not co-exposed to FTC (Figure 30).
Figure 30. The functionality of the human BCRP in overexpressing human embryonic kidney
(HEK293) cells. The Hoechst 33342 efflux assay was performed to determine whether the
human BCRP was functional in overexpressing HEK293 cells. Cell monolayers were incubated
in Kreb’s solution containing Hoechst 33342 (1 µmol/L) in the presence or absence of the BCRP
inhibitor, fumitremorgin C (FTC) (10 µmol/L) for 90 mins at 37◦C. The monolayers were
subsequently washed and incubated in Kreb’s solution in the presence or absence of FTC for an
additional 30 mins at 37◦C. Intracellular Hoechst 33342 fluorescence was measured in the
lysates using a BioTek® Synergy HT microplate reader at excitation and emission wavelengths
of 350 nm and 480 nm, respectively. The assay was conducted in replicates of 9. Intracellular
Hoechst 33342 accumulation is expressed as the fold change compared to control. The data is
presented as the mean ± standard error (SE). The statistical significance (p<0.05) of the
difference in the arbitrary fluorescent values between control and treated cell monolayers is
denoted by the symbol*.
*
0
2
4
6
8
10
12
14
control FTC
intr
ace
llu
lar
Ho
ech
st 3
33
42
acc
um
ula
tio
n)
(fo
ld c
ha
ng
e co
mp
are
d t
o c
on
tro
l)

125
6.4.3 Intracellular accumulation of [8-14
C] acyclovir
Figure 31 illustrates the intracellular accumulation of [8-14
C] acyclovir. In the presence of FTC,
the intracellular accumulation of [8-14
C] acyclovir was 5-fold greater (p<0.05), compared to its
accumulation in cells that were not co-exposed to FTC.
Figure 31. Intracellular accumulation of [8-14
C] acyclovir. Cellular accumulation assays were
conducted to determine whether acyclovir is a substrate for human BCRP. Cell monolayers
(overexpressing HEK293 cells) were pre-treated with FTC (10 µmol/L) for 30 mins. Following
the incubation period, the monolayers were incubated with [8-14
C] acyclovir (1 µmol/L) in the
presence or absence of FTC for an additional 2 hrs. Intracellular [8-14
C] acyclovir accumulation
was determined by measuring the radioactivity of the lysate (600 µL) using Beckman Coulter LS
6500 liquid scintillation counter. Radioactivity was measured as disintegrations per minute
(DPM). Intracellular [8-14
C] acyclovir accumulation was normalized to total cell protein
concentrations (mg/mL). The cell accumulation assays were conducted in replicates of 3.
Intracellular [8-14
C] acyclovir accumulation is expressed as the fold change compared to control.
The data is presented as the mean ± standard error (SE). The statistical significance (p<0.05) of
the difference in the intracellular [8-14
C] acyclovir accumulation (dpm/mg/mL) between control
and treated cell monolayers is denoted by the symbol*.
*
0
1
2
3
4
5
6
7
control FTC
intr
ace
llu
lar
[8-1
4C
] a
cycl
ov
ir a
ccu
mu
lati
on
(fo
ld c
ha
ng
e co
mp
are
d t
o c
on
tro
l)

126
6.5 Discussion
Results from the western blot (Figure 29) and Hoechst 33342 efflux (Figure 30) assays
confirmed the functional expression of human BCRP in the overexpressing HEK293 cells. The
results provide evidence illustrating that the cells were an appropriate in vitro model to use in our
study. Results from the cell accumulation assay illustrated that inhibition of human BCRP
caused significant accumulation of [8-14
C] acyclovir (Figure 31). Inhibition of the transporter
activity impeded the efflux of acyclovir from the cells resulting in the increased intracellular
accumulation of the antiviral agent. The study is the first to provide direct evidence illustrating
that acyclovir is a substrate for human BCRP and has the potential to contribute to a better
understanding of; (1) the renal tubular transport mechanisms of acyclovir and (2) the etiology of
the direct renal tubular injury induced by the drug.
Studies that have examined the renal tubular transport mechanisms of acyclovir are limited.
Huls and colleagues showed that functional BCRP is expressed in the apical membrane of human
renal proximal tubular cells (Huls et al. 2008). Therefore, the results of our study suggest that
since acyclovir is a substrate for the human BCRP; the transporter may play an active role in the
efflux of acyclovir from tubular cells.
The tissue expression profile of BCRP suggests that the efflux transporter may play a critical role
in tissue defense (Leslie et al. 2005; Mao and Unadkat 2005). For instance, BCRP expression in
human syncytiotrophoblast is believed to protect the fetus from exposure to circulating harmful
xenobiotics in the maternal blood (Leslie et al. 2005). Similarly, BCRP expression in the apical
membrane of epithelial cells lining the gastrointestinal tract suggests that the transporter provides
defense against oral exposure to harmful exogenous compounds (Leslie et al. 2005). Likewise,

127
the expression of BCRP in the apical membrane of human renal proximal tubular suggest that the
transporter may protect the tubular cells against accumulation of high intracellular concentrations
of xenobiotics, such as acyclovir, that may induce cytotoxicity.
Polymorphisms of drug transporters may decrease or abolish their functionality which may in
turn, result in reduced affinity of transporters for substrates, increased intracellular accumulation
of the substrates and resultant toxicity (Maeda and Sugiyama 2008). Studies have specifically
shown that mutations in the ABCG2 gene result in the reduced affinity of the transporter for
substrates and subsequent decreased efflux of the substrate by the dysfunctional transporter
(Cusatis et al. 2006; Pollex et al. 2010; Sparreboom et al. 2004; Yamasaki et al. 2008; Zhang et
al. 2006). Moreover, a study has shown that polymorphism in the ABCG2 gene may be directly
associated with drug – induced toxicity in humans (Cusatis et al. 2006), most likely due to the
reduced efflux of the substrate by the ABCG2 transporter. Hence, if human BCRP plays a
predominant role in the renal transport of acyclovir, then, reduced or abolished functionality of
human BCRP may impede the cellular efflux of acyclovir, which will result in the accumulation
of high intracellular concentrations of the antiviral agent and adverse cellular effects.
Further studies are required to determine the affinity of the transporter for acyclovir. Moreover,
in vivo studies can be performed to determine whether the transporter plays a significant role in
the renal tubular efflux of the drug and in the pathogenesis of the direct renal tubular injury that
is induced by acyclovir. For instance, studies can be conducted using mice with the wildtype or
knockout Abcg to determine whether the transporter plays a significant role in the efflux of
acyclovir. The studies can also be used to determine whether acyclovir induces a greater degree
of adverse renal tubular effects in Abcg knockout mice, compared to Abcg wildtype. Future
studies could also be employed to determine the potential effects of polymorphisms on the

128
transport of acyclovir by the human BCRP efflux transporter. Nevertheless, the results of our
study provides novel evidence which illustrate that acyclovir is a substrate for human BCRP and
provides a rationale for aforementioned future studies that can be employed in order to obtain a
better understanding of the etiology of the direct renal tubular injury that is induced by the
widely used antiviral agent.
6.6 Statement of significance
The results from this study are the first to show that acyclovir is a substrate for the human BCRP
transporter. These novel findings aid in the further elucidation of the renal transport mechanisms
of acyclovir and hence, may in turn, contribute to a better understanding of the overall etiology
of the direct renal tubular injury that is induced by the drug.

129
6.7 References
Ahmad, T., Simmonds, M., McIver, A.G., and McGraw, M.E. 1994. Reversible renal failure in
renal transplant patients receiving oral acyclovir prophylaxis. Pediatr Nephrol 8: 489-491.
Allen, J.D., Brinkhuis, R.F., Wijnholds, J., and Schinkel, A.H. 1999. The mouse
Bcrp1/Mxr/Abcp gene: amplification and overexpression in cell lines selected for resistance to
topotecan, mitoxantrone, or doxorubicin. Cancer Res 59; 4237-4241.
Allikmets, R., Schriml, L.M., Hutchinson, A., Romano-Spica, V., and Dean, M. 1998. A human
placenta-specific ATP-binding cassette gene (ABCP) on chromosome 4q22 that is involved in
multidrug resistance. Cancer Res 58: 5337-5339.
Bachmeier, C.J., Trickler, W.J., and Miller, D.W. 2006. Comparison of drug efflux transport
kinetics in various blood-brain barrier models. Drug Metab Dispos 34: 998-1003.
Bianchetti, M.G., Roduit, C., and Oetliker, O.H. 1991. Acyclovir-induced renal failure: course
and risk factors. Pediatr Nephrol 5: 238-239.
Brigden, D., Rosling, A.E., and Woods, N.C. 1982. Renal function after acyclovir intravenous
injection. Am J Med 73: 182-185.
Brown, C.D., Sayer, R., Windass, A.S., Haslam, I.S., De Broe, M.E., D'Haese, P.C., and
Verhulst, A. 2008. Characterisation of human tubular cell monolayers as a model of proximal
tubular xenobiotic handling. Toxicol Appl Pharmacol 233: 428-438.
Chou, J.W., Yong, C., and Wootton, S.H. 2008. Case 2: Rash, fever and headache....first, do no
harm. Paediatr Child Health 13: 49-52.
Cusatis, G., Gregorc, V., Li, J., Spreafico, A., Ingersoll, R.G., Verweij, J., Ludovini, V., Villa,
E., Hidalgo, M., Sparreboom, A. and Baker, S.D. 2006. Pharmacogenetics of ABCG2 and
adverse reactions to gefitinib. J Natl Cancer Inst 98: 1739-1742.
Dean, M., Hamon, Y., and Chimini, G. 2001. The human ATP-binding cassette (ABC)
transporter superfamily. J Lipid Res 42: 1007-1017.
Doyle, L.A., Yang, W., Abruzzo, L.V., Krogmann, T., Gao, Y., Rishi, A.K., and Ross, D.D.
1998. A multidrug resistance transporter from human MCF-7 breast cancer cells. Proc Natl Acad
Sci U S A 95: 15665-15670.
Genc, G., Ozkaya, O., Acikgoz, Y., Yapici, O., Bek, K., Gulnar Sensoy, S., and Ozyurek, E.
2010. Acute renal failure with acyclovir treatment in a child with leukemia. Drug Chem Toxicol
33: 217-219.

130
Gonzalez-Lobato, L., Real, R., Prieto, J.G., Alvarez, A.I., and Merino, G. 2010. Differential
inhibition of murine Bcrp1/Abcg2 and human BCRP/ABCG2 by the mycotoxin fumitremorgin
C. Eur J Pharmacol 644: 41-48.
Gunness, P., Aleksa, K., Kosuge, K., Ito, S., and Koren, G. 2010. Comparison of the novel HK-2
human renal proximal tubular cell line with the standard LLC-PK1 cell line in studying drug-
induced nephrotoxicity. Can J Physiol Pharmacol 88: 448-455.
Hintz, M., Connor, J.D., Spector, S.A., Blum, M.R., Keeney, R.E., and Yeager, A.S. 1982.
Neonatal acyclovir pharmacokinetics in patients with herpes virus infections. Am J Med 73: 210-
214.
Huls, M., Brown, C.D., Windass, A.S., Sayer, R., van den Heuvel, J.J., Heemskerk, S., Russel,
F.G., and Masereeuw, R. 2008. The breast cancer resistance protein transporter ABCG2 is
expressed in the human kidney proximal tubule apical membrane. Kidney Int 73: 220-225.
Jonker, J.W., Merino, G., Musters, S., van Herwaarden, A.E., Bolscher, E., Wagenaar, E.,
Mesman, E., Dale, T.C., and Schinkel, A.H. 2005. The breast cancer resistance protein BCRP
(ABCG2) concentrates drugs and carcinogenic xenotoxins into milk. Nat Med 11: 127-129.
Keeney, R.E., Kirk, L.E., and Bridgen, D. 1982. Acyclovir tolerance in humans. Am J Med 73:
176-181.
Laemmli, U.K. 1970. Cleavage of structural proteins during the assembly of the head of
bacteriophage T4. Nature 227: 680-685.
Leslie, E.M., Deeley, R.G., and Cole, S.P. 2005. Multidrug resistance proteins: role of P-
glycoprotein, MRP1, MRP2, and BCRP (ABCG2) in tissue defense. Toxicol Appl Pharmacol
204: 216-237.
Lyon, A.W., Mansoor, A., and Trotter, M.J. 2002. Urinary gems: acyclovir crystalluria. Arch
Pathol Lab Med 126: 753-754.
Maeda, K., and Sugiyama, Y. 2008. Impact of genetic polymorphisms of transporters on the
pharmacokinetic, pharmacodynamic and toxicological properties of anionic drugs. Drug Metab
Pharmacokinet 23: 223-235.
Maliepaard, M., Scheffer, G.L., Faneyte, I.F., van Gastelen, M.A., Pijnenborg, A.C., Schinkel,
A.H., van De Vijver, M.J., Scheper, R.J., and Schellens, J.H. 2001. Subcellular localization and
distribution of the breast cancer resistance protein transporter in normal human tissues. Cancer
Res 61: 3458-3464.
Mao, Q., and Unadkat, J.D. 2005. Role of the breast cancer resistance protein (ABCG2) in drug
transport. AAPS J 7: E118-133.
Mason, W.J., and Nickols, H.H. 2008. Crystalluria from acyclovir use. N Engl J Med 358: e14.

131
Millipore. 2007. Millipore Technical Publications. RIPA Buffer - Preparation of modified
radioimmunoprecipitation (RIPA) buffer.
[http://www.millipore.com/userguides/tech1/mcproto402].
Morisaki, K., Robey, R.W., Ozvegy-Laczka, C., Honjo, Y., Polgar, O., Steadman, K., Sarkadi,
B., and Bates, S.E. 2005. Single nucleotide polymorphisms modify the transporter activity of
ABCG2. Cancer Chemother Pharmacol 56: 161-172.
Ozvegy, C., Litman, T., Szakacs, G., Nagy, Z., Bates, S., Varadi, A., and Sarkadi, B. 2001.
Functional characterization of the human multidrug transporter, ABCG2, expressed in insect
cells. Biochem Biophys Res Commun 285: 111-117.
Peterslund, N.A., Larsen, M.L., and Mygind, H. 1988. Acyclovir crystalluria. Scand J Infect Dis
20: 225-228.
Pollex, E.K., Anger, G., Hutson, J., Koren, G., and Piquette-Miller, M. 2010. Breast cancer
resistance protein (BCRP)-mediated glyburide transport: effect of the C421A/Q141K BCRP
single-nucleotide polymorphism. Drug Metab Dispos 38: 740-744.
Robey, R.W., To, K.K., Polgar, O., Dohse, M., Fetsch, P., Dean, M., and Bates, S.E. 2009.
ABCG2: a perspective. Adv Drug Deliv Rev 61; 3-13.
Rocchi, E., Khodjakov, A., Volk, E.L., Yang, C.H., Litman, T., Bates, S.E., and Schneider, E.
2000. The product of the ABC half-transporter gene ABCG2 (BCRP/MXR/ABCP) is expressed
in the plasma membrane. Biochem Biophys Res Commun 271: 42-46.
Sawyer, M.H., Webb, D.E., Balow, J.E., and Straus, S.E. 1988. Acyclovir-induced renal failure.
Clinical course and histology. Am J Med 84: 1067-1071.
Sparreboom, A., Gelderblom, H., Marsh, S., Ahluwalia, R., Obach, R., Principe, P., Twelves, C.,
Verweij, J., and McLeod, H.L. 2004. Diflomotecan pharmacokinetics in relation to ABCG2
421C>A genotype. Clin Pharmacol Ther 76: 38-44.
Towbin, H., Staehelin, T., and Gordon, J. 1979. Electrophoretic transfer of proteins from
polyacrylamide gels to nitrocellulose sheets: procedure and some applications. Proc Natl Acad
Sci U S A 76: 4350-4354.
Vachvanichsanong, P., Patamasucon, P., Malagon, M., and Moore, E.S. 1995. Acute renal failure
in a child associated with acyclovir. Pediatr Nephrol 9: 346-347.
Vomiero, G., Carpenter, B., Robb, I., and Filler, G. 2002. Combination of ceftriaxone and
acyclovir - an underestimated nephrotoxic potential? Pediatr Nephrol 17: 633-637.
Yamasaki, Y., Ieiri, I., Kusuhara, H., Sasaki, T., Kimura, M., Tabuchi, H., Ando, Y., Irie, S.,
Ware, J., Nakai, Y., Higuchi, S., and Sugiyama, Y. 2008. Pharmacogenetic characterization of

132
sulfasalazine disposition based on NAT2 and ABCG2 (BCRP) gene polymorphisms in humans.
Clin Pharmacol Ther 84: 95-103.
Zhang, W., Yu, B.N., He, Y.J., Fan, L., Li, Q., Liu, Z.Q., Wang, A., Liu, Y.L., Tan, Z.R., Fen, J.,
Huang, Y.F., and Zhou, H.H. 2006. Role of BCRP 421C>A polymorphism on rosuvastatin
pharmacokinetics in healthy Chinese males. Clin Chim Acta 373: 99-103.

133
6.8 Additional experiments not published
6.8.1 The effect of acyclovir on HEK293 cell viability
Since, we previously showed that acyclovir induces cytotoxicity (Chapter 3), it was critical to
determine whether the concentration of acyclovir used in the cell accumulation assay caused
toxicity to HEK293 cells.
6.8.2 Materials and methods
6.8.2a Cytotoxicity assay
A cytotoxicity (measured as a function of cell viability) assay was performed to determine
whether the concentration of acyclovir (1 µmol/L) were toxic to the overexpressing HEK293
cells. The assay was performed in 12-well plates. Cell viability was assessed using the
fluorescent alamarBlue® assay. Cell monolayers were exposed to acyclovir (1 µmol/L) for 2 hrs.
Following the incubation period, the media was removed and the monolayers were washed (2X)
with warm PBS. Fresh media was added to each well and the cell monolayers were subsequently
incubated with the alamarBlue®
reagent for 2.5 hrs. The final concentration of alamarBlue®
reagent in each well was 10 % (v/v). Cell viability was measured using BioTek® Synergy HT
microplate reader at excitation and emission wavelengths of 540 and 590 nm, respectively. The
assay was performed in replicates of 3.
6.8.2b Statistical analyses
Independent student t-tests were conducted to compare the data (arbitrary fluorescence units)
between untreated control and treated cell monolayers.

134
6.8.3 Results
Acyclovir was not toxic to the overexpressing HEK293 cells. Exposure to acyclovir (1 µmol/L)
had no effect on HEK293 cell viability (Figure 32).
Figure 32. The effect of acyclovir on human embryonic kidney (HEK293) cell viability. Cell
(overexpressing HEK293 cells) monolayers were incubated with acyclovir (0 or 1 µmol/L) for 2
hrs. Cell monolayers were subsequently washed with warm PBS and incubated with fresh media
and alamarBlue® reagent for 2.5 hrs. The final concentration of alamarBlue
® reagent in each
well was 10 % (v/v). Cell viability was measured using BioTek® Synergy HT microplate reader
at excitation and emission wavelengths of 540 and 590 nm, respectively. The cytotoxicity assay
was performed in replicates of 3. The results are expressed as a percentage of the fluorescence
of untreated control cell monolayers and presented as the mean ± standard error (SE). The
statistical significance (p<0.05) of the difference between the fluorescence from untreated
control cell monolayers and cell monolayers exposed to acyclovir is denoted by the symbol*.
0
20
40
60
80
100
120
control acyclovir
cell
via
bil
ity
(% u
ntr
ea
ted
co
ntr
ol)

135
Chapter 7
Summary of research findings
7.1 Summary of research findings and their significance
The results from this thesis have revealed several novel and important findings, which, when
taken together contribute to a better understanding of acyclovir – induced nephrotoxicity. The
results particularly aid in an improved insight into the cause of the drug’s direct renal tubular
injury, its tubular interaction with creatinine and renal transport mechanisms. Below is a
summary of the main research findings presented in this thesis and their relevant significance.
7.1.1 To investigate whether acyclovir – induced nephrotoxicity is due to, in part, direct
insult to renal tubular cells
Clinical evidence of tubular toxicity in the absence of crystal formation (Ahmad et al. 1994;
Vomiero et al. 2002) suggests that in addition to crystalluria, acyclovir may also induce direct
injury to renal epithelial cells. Studies have not investigated whether acyclovir induces direct
insult to renal tubular epithelial cells.
Employing both porcine LLC-PK1 and human HK-2 cells, results illustrated that acyclovir
induced a significant concentration – dependent decrease in cell viability. The results are the
first experimental evidence to support existing clinical data which suggest that the antiviral
agent may induce direct insult to renal tubular cells and thus, aid in a more comprehensive
understanding of the pathogenesis of the nephrotoxicity that is induced by the widely used
antiviral agent.

136
7.1.2 To determine whether acyclovir aldehyde plays a role in the direct renal tubular
injury induced by acyclovir
As previously elaborated, in humans, acyclovir is metabolized to an acyclovir aldehyde
intermediate metabolite (de Miranda et al. 1982). Reactive aldehyde metabolites are often
produced endogenously via drug metabolism (O’Brien et al. 2005). Numerous studies have
shown that the aldehyde metabolites cause the toxicities that are associated with the parent drug
(Dubourg et al. 2001; Kapetanovic et al. 2002; Ramu et al. 1995). Therefore, it is plausible that
the acyclovir aldehyde metabolite may cause the direct renal tubular injury that is associated with
acyclovir. Previous studies have not tested this viable hypothesis.
Results from this thesis illustrated that co-exposure to the ADH enzyme inhibitor, 4-
methylpyrazole, induced significant protection from acyclovir – induced HK-2 cell death. The
results suggest that acyclovir aldehyde may cause the direct renal tubular injury associated with
its parent drug. Further studies are required to determine the mechanisms of acyclovir aldehyde
– induced cytotoxicity. Nonetheless, the results from this research are the first to highlight that
the locally produced acyclovir aldehyde may play a role in the direct tubular injury and aids in
the further elucidation of the development of this renal toxicity.
7.1.3 To determine whether acyclovir inhibits the renal tubular secretion of creatinine
Creatinine shares renal tubular transport mechanisms with other drugs, which provides a
favourable opportunity for these drugs to compete with and subsequently inhibit the tubular
transport of creatinine. Inhibition of tubular secretion of creatinine results in an elevation of
plasma creatinine levels that are unreflective of reduced GFR or renal dysfunction. Several non-
nephrotoxic drugs are known to hinder the renal tubular secretion of creatinine to result in

137
transient, marked elevations in plasma creatinine levels that are not due to impaired renal
function (Berglund et al. 1975; Blackwood et al. 1976; Burgess et al. 1982; Burry and Dieppe
1976; Dubb et al. 1978; Dutt et al. 1981; Haggie et al. 1976; Kastrup et al. 1985; Myre et al.
1987; Opravil et al. 1993; Tschuppert et al. 2007).
Case reports (please refer to Table 4, Chapter 5, for a summary of the acyclovir cases) show that
acyclovir induces similar pronounced, transient elevations in plasma creatinine levels in patients
(Bianchetti et al. 1991; Brigden et al. 1982; Chou et al. 2008; Keeney et al. 1982;
Vachvanisanong et al. 1995; Vomiero et al. 2002). Studies reveal that similar to the non-
nephrotoxic drugs; acyclovir may share similar renal organic cation transporter systems with
creatinine (Takeda et al. 2002). Therefore it is plausible the acyclovir may inhibit the tubular
secretion of creatinine; a hypothesis that has not been previously investigated. It is critical to
determine whether acyclovir inhibits the secretion of creatinine because if this is the case, then
creatinine may not be the most appropriate biological marker to employ in order to assess the
renal function of patients administered acyclovir, and thus, other biological markers of renal
function, such as inulin, should always be used to assess renal function in these patients.
The inhibition of creatinine secretion by acyclovir via the OCT system was investigated in this
thesis. Transepithelial transport studies revealed that in contrast to quinidine, acyclovir did not
inhibit the transport of creatinine across LLC-PK1 or HK-2 cell monolayers. The results suggest
that acyclovir does not inhibit the tubular secretion of acyclovir in vitro, and possibly in humans
as well. Therefore, the abrupt, transient and pronounced elevations in plasma levels of creatinine
that are observed in patients may be solely and genuinely due to decreased GFR as a result of
acyclovir – induced renal dysfunction.

138
7.1.4 To determine whether acyclovir is a substrate for human BCRP
Results from a previous study suggest that acyclovir may be a substrate for the human BCRP
(Jonker et al. 2005). Studies have not yet directly determined whether acyclovir is a substrate for
the human BCRP transporter. It is crucial to determine whether acyclovir is a substrate for
human BCRP because this may aid in the further elucidation of the pathogenesis of the direct
tubular injury that is induced by the drug. Human BCRP is located in the apical membrane of
renal tubular cells (Huls et al. 2008), and thus, may play an important role in the renal transport
of acyclovir, and provide protection against the high intracellular accumulation of cytotoxic
acyclovir. Therefore, factors such as genetic polymorphisms may result in reduced or abolished
function of the efflux transporter which can subsequently result in increased intracellular
accumulation of acyclovir and cytotoxicity.
Results from this research showed that acyclovir is a substrate for the human BCRP. Further
studies are required to determine: (1) the affinity of the transporter for the drug, (2) whether the
transporter plays a significant role in the renal transport of acyclovir and (3) the effect of BCRP
polymorphisms on the transport of the drug. Nonetheless, the findings from this thesis are novel
and the first experimental evidence to illustrate that acyclovir is a substrate for human BCRP and
hence, provides a viable rationale for the aforesaid studies to be employed which will contribute
to an overall better understanding of the etiology of acyclovir – induced direct renal tubular
injury.

139
7.2 References
Ahmad, T., Simmonds, M., McIver, A.G., and McGraw, M.E. 1994. Reversible renal failure in
renal transplant patients receiving oral acyclovir prophylaxis. Pediatr Nephrol 8: 489-491.
Berglund, F., Killander, J., and Pompeius, R. 1975. Effect of trimethoprim-sulfamethoxazole on
the renal excretion of creatinine in man. J Urol 114: 802-808.
Bianchetti, M.G., Roduit, C., and Oetliker, O.H. 1991. Acyclovir-induced renal failure: course
and risk factors. Pediatr Nephrol 5: 238-239.
Blackwood, W.S., Maudgal, D.P., Pickard, R.G., Lawrence, D., and Northfield, T.C. 1976.
Cimetidine in duodenal ulcer. Controlled trial. Lancet 2: 174-176.
Brigden, D., Rosling, A.E., and Woods, N.C. 1982. Renal function after acyclovir intravenous
injection. Am J Med 73: 182-185.
Burgess, E., Blair, A., Krichman, K., and Cutler, R.E. 1982. Inhibition of renal creatinine
secretion by cimetidine in humans. Ren Physiol 5: 27-30.
Burry, H.C., and Dieppe, P.A. 1976. Apparent reduction of endogenous creatinine clearance by
salicylate treatment. Br Med J 2: 16-17.
Chou, J.W., Yong, C., and Wootton, S.H. 2008. Case 2: Rash, fever and headache....first, do no
harm. Paediatr Child Health 13: 49-52.
de Miranda, P., Good, S.S., Krasny, H.C., Connor, J.D., Laskin, O.L., and Lietman, P.S. 1982.
Metabolic fate of radioactive acyclovir in humans. Am J Med 73: 215-220.
Dubb, J.W., Stote, R.M., Familiar, R.G., Lee, K., and Alexander, F. 1978. Effect of cimetidine
on renal function in normal man. Clin Pharmacol Ther 24: 76-83.
Dubourg, L., Michoudet, C., Cochat, P., and Baverel, G. 2001. Human kidney tubules detoxify
chloroacetaldehyde, a presumed nephrotoxic metabolite of ifosfamide. J Am Soc Nephrol 12:
1615-1623.
Dutt, M.K., Moody, P., and Northfield, T.C. 1981. Effect of cimetidine on renal function in man.
Br J Clin Pharmacol 12: 47-50.
Haggie, S.J., Fermont, D.C., and Wyllie, J.H. 1976. Treatment of duodenal ulcer with cimetidine.
Lancet 1: 983-984.
Huls, M., Brown, C.D., Windass, A.S., Sayer, R., van den Heuvel, J.J., Heemskerk, S., Russel,
F.G., and Masereeuw, R. 2008. The breast cancer resistance protein transporter ABCG2 is
expressed in the human kidney proximal tubule apical membrane. Kidney Int 73: 220-225.

140
Jonker, J.W., Merino, G., Musters, S., van Herwaarden, A.E., Bolscher, E., Wagenaar, E.,
Mesman, E., Dale, T.C., and Schinkel, A.H. 2005. The breast cancer resistance protein BCRP
(ABCG2) concentrates drugs and carcinogenic xenotoxins into milk. Nat Med 11: 127-129.
Kapetanovic, I.M., Torchin, C.D., Strong, J.M., Yonekawa, W.D., Lu, C., Li, A.P., Dieckhaus,
C.M., Santos, W.L., Macdonald, T.L., Sofia, R.D., and Kupferberg, H.J. 2002. Reactivity of
atropaldehyde, a felbamate metabolite in human liver tissue in vitro. Chem Biol Interact 142:
119-134.
Kastrup, J., Petersen, P., Bartram, R., and Hansen, J.M. 1985. The effect of trimethoprim on
serum creatinine. Br J Urol 57: 265-268.
Keeney, R.E., Kirk, L.E., and Bridgen, D. 1982. Acyclovir tolerance in humans. Am J Med 73:
176-181.
Myre, S.A., McCann, J., First, M.R., and Cluxton, R.J., Jr. 1987. Effect of trimethoprim on
serum creatinine in healthy and chronic renal failure volunteers. Ther Drug Monit 9: 161-165.
O'Brien, P.J., Siraki, A.G., and Shangari, N. 2005. Aldehyde sources, metabolism, molecular
toxicity mechanisms, and possible effects on human health. Crit Rev Toxicol 35: 609-662.
Opravil, M., Keusch, G., and Luthy, R. 1993. Pyrimethamine inhibits renal secretion of
creatinine. Antimicrob Agents Chemother 37: 1056-1060.
Ramu, K., Fraiser, L.H., Mamiya, B., Ahmed, T., and Kehrer, J.P. 1995. Acrolein mercapturates:
synthesis, characterization, and assessment of their role in the bladder toxicity of
cyclophosphamide. Chem Res Toxicol 8: 515-524.
Takeda, M., Khamdang, S., Narikawa, S., Kimura, H., Kobayashi, Y., Yamamoto, T., Cha, S.H.,
Sekine, T., and Endou, H. 2002. Human organic anion transporters and human organic cation
transporters mediate renal antiviral transport. J Pharmacol Exp Ther 300: 918-924.
Tschuppert, Y., Buclin, T., Rothuizen, L.E., Decosterd, L.A., Galleyrand, J., Gaud, C., and
Biollaz, J. 2007. Effect of dronedarone on renal function in healthy subjects. Br J Clin Pharmacol
64: 785-791.
Vachvanichsanong, P., Patamasucon, P., Malagon, M., and Moore, E.S. 1995. Acute renal failure
in a child associated with acyclovir. Pediatr Nephrol 9: 346-347.
Vomiero, G., Carpenter, B., Robb, I., and Filler, G. 2002. Combination of ceftriaxone and
acyclovir - an underestimated nephrotoxic potential? Pediatr Nephrol 17: 633-637.
141
Chapter 8
General Discussion and Conclusions
8.1 Acyclovir and direct renal tubular injury
Employing both porcine (LLC-PK1) and human (HK-2) renal proximal tubular epithelial cells,
the thesis provides the first experimental evidence to support existing clinical evidence which
suggest that acyclovir induces direct insult to renal tubular cells (Figure 8). The findings shed
new insight into the pathogenesis of the nephrotoxicity induced by the antiviral agent.
The next step in the research was to determine whether the locally produced acyclovir aldehyde
metabolite may play a role in the direct tubular insult that is induced by the drug. While, both
porcine (LLC-PK1) and human (HK-2) renal tubular epithelial cells were employed to determine
whether acyclovir induces direct insult to renal tubular cells, inter-species differences exist in
drug disposition (Riddick 1998). The in vitro results obtained from exposure of LLC-PK1 or
HK-2 cells to acyclovir are an excellent example of the inter-species differences that exist in the
disposition of acyclovir. Figure 8 shows that compared to HK-2 cells, the LLC-PK1 cells were
more susceptible to the cytotoxic effects of acyclovir. Therefore, the HK-2 cells were used in all
subsequent studies conducted to study acyclovir – induced nephrotoxicity. The HK-2 cells are
derived from the normal kidney of an adult male and have biochemical and functional
characteristics of well-differentiated renal proximal tubular epithelial cells (Ryan et al. 1994).
Moreover, while, the principle site of acyclovir – induced tubular injury, along the nephron,
remains to be established; it is highly possible that the injury occurs predominantly in the
proximal tubule segment of the nephron. The leaky epithelium, active transporter systems and

142
increased levels of drug biotransformation enzymes in the tubular cells (Schnellmann 2001) are
examples of some morphological and biochemical characteristics that enhances the susceptibility
of the proximal tubule segment of the nephron to toxicant – induced renal damage. The HK-2
cells are epithelial cells of proximal tubular origin and therefore the use of the cells to study
acyclovir – induced nephrotoxicity allows for a more relevant elucidation of the tubular cellular
insult that acyclovir may induce in humans.
Western blot and enzyme activity assays confirmed that the HK-2 cells express functional ADH
(Figures 9A and 11A) and ALDH (Figures 9B and 11B) enzymes. Thus, the cells contained the
enzymatic machinery to locally metabolize acyclovir to its acyclovir aldehyde metabolite,
thereby, making them an appropriate in vitro model to employ in order to study the direct tubular
insult induced by acyclovir.
Importantly, the results from this thesis illustrate that co-exposure to 4-methylpyrazole render
significant protection from acyclovir – induced cell death (Figure 13). The results are the first to
suggest that the acyclovir aldehyde may cause the direct renal tubular injury associated with its
parent drug, because inhibition of its formation resulted in significant alleviation of HK-2
cytotoxicity. Furthermore, these results suggest that local metabolism of acyclovir to an
aldehyde metabolite occurs in human renal proximal tubular cells, in vitro. Additional support
for the local metabolism of acyclovir in human renal proximal tubular cells in vitro can be
derived from the results presented in Figure 14, where the results showed that an aldehyde was
produced in HK-2 cells that were exposed to acyclovir. Taken together, the in vitro results
suggest that human renal proximal tubular cells may be capable of locally metabolizing acyclovir
to its acyclovir aldehyde, in vivo and the aldehyde metabolite may be the ultimate source of the
direct renal tubular toxicity associated with the use of the antiviral.

143
The significant role of acyclovir aldehyde in the direct renal toxicity may be criticized due to the
small alleviation in HK-2 cell death caused by co-exposure to 4-methylpyrazole. A possible
explanation for this observation is that the innate low expression of the ADH enzyme in the cells
resulted in limited local metabolism of acyclovir to its aldehyde metabolite, and inhibition by 4-
methylpyrazole.
In order to extrapolate the biological significance of our in vitro cell results to humans, ADH
protein expression in HK-2 cells and human kidney was compared. Analyses (Figure 15)
suggest that compared to HK-2 cells, the ADH protein expression may be approximately 30 fold
higher in human kidney. Thus, it is highly likely that the local metabolism of acyclovir to
acyclovir aldehyde and the subsequent inhibition of this pathway by 4-methylpyrazole may be
greatly exacerbated in human renal proximal tubular cells, in vivo.
Another possible reason for the small effect that 4-methylpyrazole had on HK-2 cell viability
may be due to the noxioius effect(s) of the acyclovir aldehyde metabolite on the protein
expression and/or function of ADH enzyme. Aldehydes are known to reduce the activity of
enzymes (O’Brien et al. 2005), specifically its detoxifying enzyme, aldehyde dehydrogenase
(Doorn et al. 2006; Kapetanovic et al. 2002). Presently, the effect(s) of aldehydes on the
expression or activity of alcohol dehydrogenase enzymes is not known. However, it is probable
that aldehydes can affect ADH protein expression and/or function either through direct or
indirect mechanisms of toxicity (Gregus and Klaassen 2001).
The results from this study also provide some explanation of the lack of occurrence of
nephrotoxicity in all patients. The occurrence of acyclovir – induced nephrotoxicity is
independent of age and gender (Schreiber et al. 2008). However, genetic polymorphisms

144
(Borson and Li 1986; Mizoi et al. 1994; Mulligan et al. 2003; Stickel and Osterreicher 2006) are
well known to affect the functional expression of enzymes, including the ADH and ALDH
enzymes. Thus, it is likely that such polymorphisms that affect the functional expression of the
ADH or ALDH enzymes may subsequently influence the occurrence or severity of acyclovir –
induced nephrotoxicity in patients. Altered functional expression of ADH or ALDH enzymes
may perturb the local renal tubular disposition of acyclovir such that increased ADH or reduced
ALDH functional expression may result in increased intracellular accumulation of the pernicious
acyclovir aldehyde metabolite and cytotoxicity. A previous study has shown that genetic
polymorphisms in the ALDH2 gene influence of pharmacokinetics of acyclovir in patients, such
that polymorphisms that resulted in the reduced functionality of ALDH2 protein resulted in
significant increases in the elimination half-life of acyclovir (Hara et al. 2008).
Overall, the above findings highlight an important toxicological phenomenon which is
commonly ignored: the fact that the kidney produces its own poison. The kidney, being exposed
to large amounts of parent drugs and their active and/or inactive metabolites, is not commonly
regarded as a drug metabolizing organ, and from a whole body perspective, the liver and
intestine are responsible for most of the burden of drug metabolism.
It is evident that the small amounts of acyclovir metabolism in the kidney is not likely to change
the fact that most of the body load of acyclovir is eliminated unchanged. Yet, as our results
suggest, the kidney is able to produce sufficient amounts of acyclovir aldehyde to cause damage
to tubular cells. A similar phenomenon was reported by our laboratory with the
chemotherapeutic agent, ifosfamide (Aleksa et al. 2005), where the parent drug itself is not
nephrotoxic, but its aldehyde metabolite, chloroacetaldehyde, produced by the renal tubular
cells, is highly toxic.

145
These findings have several basic and important implications: first, one has to seriously consider
the drug metabolizing capacity of organs and cells in the context of producing high local
concentrations of toxic metabolites, rather than amounts that would endanger the whole body.
Second, the fact that only some patients are affected, sparing many others, suggests that
polymorphisms in drug metabolizing enzymes, (in our case, the alcohol and aldehyde
dehydrogenase) may predict patients who might be adversely affected. Finally, the metabolic
patterns of local aldehyde products should direct us toward effective therapies, based on the
mechanisms of injury. In the case of ifosfamide, this has lead us to successfully treat tubular
cells, in vitro, animals and children with the antioxidant, N-Aceytlcysteine (Chen et al. 2007;
2008; Hanly et al. 2011). This thesis suggests similar future work towards prevention of
acyclovir – induced tubular toxicity.
8.2 Acyclovir-creatinine tubular interaction
Utilizing both LLC-PK1 and HK-2 cells, the results (Figure 21 and 22) show that acyclovir does
not inhibit the transepithelial transport of creatinine across the cell monolayers. The reasons for
the lack of inhibition of creatinine secretion by acyclovir in our experiments are detailed in
Chapter 5 (section 5.4) of the thesis and include; (1) the possibility that the increase in the levels
of plasma creatinine may be due to the interference of acyclovir with the Jaffé-based assay for
creatinine measurement, and not due to a tubular inetraction between creatinine and acyclovir
and (2) various limitations of the in vitro models employed in the experiments. Nonetheless, the
results clearly suggest that acyclovir does not inhibit the tubular secretion of creatinine in vitro,
and possibly in vivo, as well. Therefore, the abrupt, marked and transient elevation in the levels
of plasma creatinine observed in some patients may be solely due to decreased GFR as a result of
acyclovir – induced renal dysfunction.

146
8.3 Renal tubular transport of acyclovir
Elucidation of the renal transport mechanisms of drugs, such as acyclovir, that induce direct
insult to tubular cells, is imperative in order to understand the complete etiology of its toxicity.
The human BCRP efflux transporter is localized to the apical membrane of renal tubular cells
(Huls et al. 2008), suggesting that the transporter may play a protective role against the high
intracellular accumulation of xenobiotics in renal tubular cells and the resultant cytotoxicity.
Therefore, if acyclovir is a substrate for human BCRP and the transporter plays a significant role
in the renal transport of acyclovir, then reduced or abolished function of the efflux transporter
may result in the increased intracellular accumulation of acyclovir and subsequent detrimental
nephrotoxic consequences, such as direct injury to renal tubular cells.
The results (Figure 31) clearly illustrate that acyclovir is a substrate for human BCRP. The
findings are novel and bear several important implications with respect to renal transport and the
etiology of the direct renal tubular injury that is induced by the drug. First, the studies suggest
that the efflux transporter may play an active role in the tubular transport of acyclovir. Second,
factors such as genetic polymorphisms that reduce or abolish the functionality of BCRP may
result in the increased intracellular accumulation of acyclovir and subsequent toxicity. Previous
studies have demonstrated that mutations in the ABCG2 gene result in the reduced affinity of the
transporter for substrates and subsequent decreased efflux of the substrate by the dysfunctional
transporter (Cusatis et al. 2006; Pollex et al. 2010; Sparreboom et al. 2004; Yamasaki et al. 2008;
Zhang et al. 2006). More critical are the results from a study that has shown that polymorphism
in the ABCG2 gene may be directly associated with drug – induced toxicity in humans (Cusatis
et al. 2006), most likely due to the reduced efflux of the substrate by the transporter.

147
Hence, these novel findings from this research aid in the further elucidation of the renal transport
mechanisms of acyclovir and in turn, contribute to a more thorough understanding of the
etiology of the direct renal tubular injury that is induced by the antiviral agent.
8.4 Limitations and future directions
The series of studies in this thesis present several novel findings that aid in a more complete
understanding of the etiology of acyclovir – induced nephrotoxicity, however, there are some
limitations of the employed experimental models and there is a need for several future studies to
be conducted. First and foremost, the study employed in vitro cell culture models. Over the past
25 years, in vitro models have gained increased use in pharmacology and toxicology studies,
with established animal and human cell lines being the most common models used for such said
studies (Zucco et al. 2004). Compared to in vivo models, in vitro human cell culture models
provide several main advantages, including; (1) cost-effectiveness, (2) absence of inter-species
differences, (3) increased control over experimental conditions and (4) better elucidation of
underlying cell and molecular mechanisms of action or toxicity (David et al. 1998; Plant 2004).
On the other hand, several disadvantages exists with the use of in vitro human cell culture
models including; (1) the disruption of the normal integrity of the cell structure and inter-cellular
relationships, (2) the production of artifactual drug binding sites that does not normally exist in
vivo, (3) differences between in vitro and in vivo drug pharmaco- or toxicokinetics and (Davila et
al. 1998) and (4) altered protein expression (Plant 2004). Therefore, extreme caution should be
employed when extrapolating the in vitro results obtained from this thesis to humans.
Second, while HK-2 serves as a good model to study acyclovir – induced nephrotoxicity, the
cells expressed inherent low expression of the ADH enzyme in the HK-2 cells, which may have

148
limited the degree of local renal intracellular metabolism of acyclovir to acyclovir aldehyde and
inhibition of the pathway by 4-methylpyrazole. Therefore, co-exposure studies with 4-
methylpyrazole could be performed using transformed cell lines that have been transfected with
the wildtype human ADH enzyme, such that the enzyme would be functionally overexpressed in
the cell lines. Furthermore, the ADH or ALDH isozyme(s) that are responsible for the
metabolism of acyclovir has not been established. In vitro metabolism studies utilizing pure
human ADH or ALDH isozymes and respective enzyme inhibitors could be conducted to
decipher the specific isozyme(s) that are responsible for the metabolism of acyclovir. Acyclovir
and CMMG concentrations could then be subsequently measured using HPLC coupled with UV,
fluorescence or mass spectrometry detectors. The HPLC coupled with UV (Darville et al. 2007),
fluorescence (Svensson et al. 1997) or mass spectrometry (Helldén et al. 2003; 2006) detectors
have been used in previous studies to measure the concentrations of acyclovir and CMMG in
biological matrices.
We postulated that the small effect of 4-methylpyrazole may have been due to the partial
inhibition of the ADH enzyme. Therefore, future studies can be performed employing a series of
concentrations of 4-methylpyrazole to determine the degree of ADH inhibition in the HK-2 cells
and the effect on the viability of cells co-exposed to 4-methylpyrazole and acyclovir.
In this thesis, it was hypothesized that renal tubular cells have the enzymatic machinery required
to locally metabolize acyclovir to its aldehyde metabolite. The results of the present research
suggest that human renal proximal tubular cells were able to locally metabolize acyclovir to
acyclovir aldehyde and that the metabolite was produced in sufficient quantity to cause toxicity;
because prevention of its generation provided significant protection against cell death. Future
studies could be performed to provide further evidence to support the above results. For

149
example, intracellular levels of acyclovir and CMMG could be measured in HK-2 cell
monolayers exposed to acyclovir (0 – 2000 µg/mL) for 24 hours. Samples could be
subsequently analyzed using the aforementioned HPLC techniques. The measurement of
CMMG in these samples would provide indirect evidence for the local production of the
acyclovir aldehyde metabolite. Subsequent studies could also be attempted to measure the levels
of acyclovir aldehyde in HK-2 cells in order to provide direct evidence for the local renal tubular
cellular metabolism of acyclovir to its noxious aldehyde metabolite. Studies can also be
executed to further investigate the underlying cell and molecular mechanism(s) of renal tubular
cell death.
Human kidney tissue, which has been shown in this thesis to express innately higher levels of the
ADH and ALDH enzymes, compared to the HK-2 cell line, could also be used to conduct
metabolism studies in order to determine whether human renal tubular cells are able to locally
metabolize acyclovir. The studies should be conducted using plasma (5 – 20 µg/mL)
concentrations of acyclovir in order to prevent cytotoxicity.
Fourth, the results from the transepithelial transport studies show that acyclovir does not inhibit
the secretion of creatinine across LLC-PK1 or HK-2 cell monolayers. However, one significant
and potential reason for this observation may have been due the possibility that acyclovir and
creatinine were transported by different hOCTs. Therefore, studies could be conducted using
cells overexpressing specific hOCTs in order to determine the interaction of acyclovir and
creatinine at individual hOCTs.
Finally, while the cell accumulation studies clearly show that acyclovir is a substrate for the
human BCRP and suggest that efflux transporter may play a role in the tubular transport of

150
acyclovir; further studies are required to determine whether the transporter does play a
significant role in renal transport of acyclovir. In vivo studies can be conducted using mice with
the wildtype or knockout Abcg gene to determine whether the transporter plays a significant role
in the efflux of acyclovir. The studies can also be used to determine whether acyclovir induces a
greater degree of adverse renal tubular effects in Abcg knockout mice, compared to Abcg
wildtype. The results from the studies will address the importance of the efflux transporter in the
pathogenesis of the direct renal tubular injury induced by the drug. However, due to the inter-
species differences that exists between murine Bcrp1 and human BCRP (see section 6.1), caution
should be employed during extrapolation of the results to humans. Future studies could also be
employed to determine the affinity of the transporter for the drug and the potential effects of
genetic polymorphisms of the ABCG2 gene on the transport of acyclovir.
8.5 Conclusions
Several new pieces of evidence are presented in this thesis that aids in a better understanding of
the overall etiology of acyclovir – induced nephrotoxicity. First, results suggest that in addition
to crystalluria, acyclovir induces direct insult to human renal proximal tubular cells and that the
insult may be caused by the drug’s aldehyde intermediate metabolite which is locally produced
in human renal proximal tubular cells. Second, the results suggest that the abrupt, marked and
transient elevations in the levels of plasma creatinine observed in patients is solely and
genuinely due to reduced GFR as a result of acyclovir – induced renal impairment and not due
to a tubular interaction between the drug and creatinine. Third, the research suggests that
acyclovir is a substrate for human BCRP; results which in turn, bear critical implications for
renal transport and acyclovir – induced nephrotoxicity. Finally, due to the genetic
polymorphisms in human ADH, ALDH and BCRP genes; the results that suggest that acyclovir

151
aldehyde may cause the direct toxicity associated with the parent drug and that the drug is a
substrate for human BCRP, respectively, present a possible explanation for the occurrence of
acyclovir – induced nephrotoxicity in some patients, while sparing other individuals.
In summary, the results presented in this thesis, fills several knowledge gaps that existed in the
study of the pathogenesis of the direct renal damage caused by acyclovir. Critically, the study
highlights the need for future studies that will contribute to the further understanding of the
fundamental cell and molecular mechanism(s) of this toxicity and potential therapies for
deterrence of this renal damage.

152
8.6 References
Aleksa, K., Halachmi, N., Ito, S., and Koren, G. 2005. A tubule cell model for ifosfamide
nephrotoxicity. Can J Physiol Pharmacol 83: 499-508.
Bosron, W.F., and Li, T.K. 1986. Genetic polymorphism of human liver alcohol and aldehyde
dehydrogenases, and their relationship to alcohol metabolism and alcoholism. Hepatology 6:
502-510.
Chen, N., Aleksa, K., Woodland, C., Rieder, M., and Koren, G. 2007. The effect of N-
acetylcysteine on ifosfamide-induced nephrotoxicity: in vitro studies in renal tubular cells. Transl
Res 150: 51-57.
Chen, N., Aleksa, K., Woodland, C., Rieder, M., and Koren, G. 2008. N-Acetylcysteine prevents
ifosfamide-induced nephrotoxicity in rats. Br J Pharmacol 153: 1364-1372.
Cusatis, G., Gregorc, V., Li, J., Spreafico, A., Ingersoll, R.G., Verweij, J., Ludovini, V., Villa,
E., Hidalgo, M., Sparreboom, A., and Baker, S.D. 2006. Pharmacogenetics of ABCG2 and
adverse reactions to gefitinib. J Natl Cancer Inst 98: 1739-1742.
Darville, J.M., Lovering, A.M., and MacGowan, A.P. 2007. Development, evaluation and
application of an isocratic high-performance liquid chromatography (HPLC) assay for the
simultaneous determination of aciclovir and its metabolite 9-carboxymethoxymethylguanine in
human serum and cerebrospinal fluid. Int J Antimicrob Agents 30: 30-33.
Davila, J.C., Rodriguez, R.J., Melchert, R.B., and Acosta, D., Jr. 1998. Predictive value of in
vitro model systems in toxicology. Annu Rev Pharmacol Toxicol 38: 63-96.
Doorn, J.A., Hurley, T.D., and Petersen, D.R. 2006. Inhibition of human mitochondrial aldehyde
dehydrogenase by 4-hydroxynon-2-enal and 4-oxonon-2-enal. Chem Res Toxicol 19: 102-110.
Gregus Z. and Klaassen, C.D. 2001. Mechanisms of Toxicity. In Casarett and Doull's Toxicology
The Basic Science of Poisons. Edited by Klaassen, C.D. The McGraw-Hill Companies Inc., New
York. pp 35-78.
Hanly, L.N., Chen, N., Aleksa, K., Cutler, M., Bajcetic, M., Palassery, R., Regueira, O., Turner,
C., Baw, B., Malkin, B., Freeman, D., Rieder, M.J., Vasylyeya, T.L. and Koren. G. 2011. N-
acetylcysteine as a Novel Prophylactic Treatment for Ifosfamide-Induced Nephrotoxicity in
Children: Translational Pharmacokinetics. J Clin Pharmacol. [Epub ahead of print].
Hara, K., Suyama, K., Itoh, H., and Nagashima, S. 2008. Influence of ALDH2 genetic
polymorphisms on aciclovir pharmacokinetics following oral administration of valaciclovir in
Japanese end-stage renal disease patients. Drug Metab Pharmacokinet 23: 306-312.

153
Hellden, A., Lycke, J., Vander, T., Svensson, J.O., Odar-Cederlof, I., and Stahle, L. 2006. The
aciclovir metabolite CMMG is detectable in the CSF of subjects with neuropsychiatric symptoms
during aciclovir and valaciclovir treatment. J Antimicrob Chemother 57: 945-949.
Hellden, A., Odar-Cederlof, I., Diener, P., Barkholt, L., Medin, C., Svensson, J.O., Sawe, J., and
Stahle, L. 2003. High serum concentrations of the acyclovir main metabolite 9-
carboxymethoxymethylguanine in renal failure patients with acyclovir-related neuropsychiatric
side effects: an observational study. Nephrol Dial Transplant 18: 1135-1141.
Huls, M., Brown, C.D., Windass, A.S., Sayer, R., van den Heuvel, J.J., Heemskerk, S., Russel,
F.G., and Masereeuw, R. 2008. The breast cancer resistance protein transporter ABCG2 is
expressed in the human kidney proximal tubule apical membrane. Kidney Int 73: 220-225.
Kapetanovic, I.M., Torchin, C.D., Strong, J.M., Yonekawa, W.D., Lu, C., Li, A.P., Dieckhaus,
C.M., Santos, W.L., Macdonald, T.L., Sofia, R.D.,and Kupferberg, H.J. 2002. Reactivity of
atropaldehyde, a felbamate metabolite in human liver tissue in vitro. Chem Biol Interact 142:
119-134.
Mizoi, Y., Yamamoto, K., Ueno, Y., Fukunaga, T., and Harada, S. 1994. Involvement of genetic
polymorphism of alcohol and aldehyde dehydrogenases in individual variation of alcohol
metabolism. Alcohol Alcohol 29: 707-710.
Mulligan, C.J., Robin, R.W., Osier, M.V., Sambuughin, N., Goldfarb, L.G., Kittles, R.A.,
Hesselbrock, D., Goldman, D., and Long, J.C. 2003. Allelic variation at alcohol metabolism
genes ( ADH1B, ADH1C, ALDH2) and alcohol dependence in an American Indian population.
Hum Genet 113: 325-336.
O'Brien, P.J., Siraki, A.G., and Shangari, N. 2005. Aldehyde sources, metabolism, molecular
toxicity mechanisms, and possible effects on human health. Crit Rev Toxicol 35: 609-662.
Plant, N. 2004. Strategies for using in vitro screens in drug metabolism. Drug Discov Today 9:
328-336.
Pollex, E.K., Anger, G., Hutson, J., Koren, G., and Piquette-Miller, M. 2010. Breast cancer
resistance protein (BCRP)-mediated glyburide transport: effect of the C421A/Q141K BCRP
single-nucleotide polymorphism. Drug Metab Dispos 38: 740-744.
Riddick, D.S. 1998. Drug Biotransformation. In Principles of Medical Pharmacology. Edited by
Kalant, H., and Roschlau, W.H.E. Oxford University Press, New York. pp 38-54.
Ryan, M.J., Johnson, G., Kirk, J., Fuerstenberg, S.M., Zager, R.A., and Torok-Storb, B. 1994.
HK-2: an immortalized proximal tubule epithelial cell line from normal adult human kidney.
Kidney Int 45: 48-57.
154
Schnellmann, R.G. 2001. Toxic responses of the kidney. In Casarett and Doull's Toxicology The
Basic Science of Poisons. Edited by Klaassen, C.D. The McGraw-Hill Companies Inc., New
York. pp 491-514.
Schreiber, R., Wolpin, J., and Koren, G. 2008. Determinants of aciclovir-induced nephrotoxicity
in children. Paediatr Drugs 10: 135-139.
Sparreboom, A., Gelderblom, H., Marsh, S., Ahluwalia, R., Obach, R., Principe, P., Twelves, C.,
Verweij, J., and McLeod, H.L. 2004. Diflomotecan pharmacokinetics in relation to ABCG2
421C>A genotype. Clin Pharmacol Ther 76: 38-44.
Stickel, F., and Osterreicher, C.H. 2006. The role of genetic polymorphisms in alcoholic liver
disease. Alcohol Alcohol 41: 209-224.
Svensson, J.O., Barkholt, L., and Sawe, J. 1997. Determination of acyclovir and its metabolite 9-
carboxymethoxymethylguanine in serum and urine using solid-phase extraction and high-
performance liquid chromatography. J Chromatogr B Biomed Sci Appl 690: 363-366.
Yamasaki, Y., Ieiri, I., Kusuhara, H., Sasaki, T., Kimura, M., Tabuchi, H., Ando, Y., Irie, S.,
Ware, J., Nakai, Y., Higuchi, S., and Sugiyama, Y. 2008. Pharmacogenetic characterization of
sulfasalazine disposition based on NAT2 and ABCG2 (BCRP) gene polymorphisms in humans.
Clin Pharmacol Ther 84: 95-103.
Zhang, W., Yu, B.N., He, Y.J., Fan, L., Li, Q., Liu, Z.Q., Wang, A., Liu, Y.L., Tan, Z.R., Fen, J.,
Huang, Y.F., and Zhou, H.H. 2006. Role of BCRP 421C>A polymorphism on rosuvastatin
pharmacokinetics in healthy Chinese males. Clin Chim Acta 373: 99-103.