Embed Size (px)
Citation preview

MNRAS 480, 1547–1562 (2018) doi:10.1093/mnras/sty1925
New full evolutionary sequences of H- and He-atmosphere massive whitedwarf stars using MESA
G. R. Lauffer,‹ A. D. Romero and S. O. KeplerInstituto de Fısica, Universidade Federal do Rio Grande do Sul, Av. Bento Goncalves 9500, Porto Alegre 91501-970, RS, Brazil
Accepted 2018 July 12. Received 2018 July 12; in original form 2018 May 4
ABSTRACTWe explore the evolution of hydrogen-rich and hydrogen-deficient white dwarf stars withmasses between 1.012 and 1.307 M�, and initial metallicity of Z = 0.02. These sequences arethe result of main-sequence stars with masses between 8.8 and 11.8 M�. The simulations wereperformed with MESA (Modules for Experiments in Stellar Astrophysics), starting at the zero-age main sequence, through thermally pulsing and mass-loss phases, ending at the white dwarfcooling sequence. We present reliable chemical profiles for the whole mass range considered,covering the different expected central compositions (i.e. C/O, O/Ne and Ne/O/Mg) and itsdependence on the stellar mass. In addition, we present detailed chemical profiles of hybridC/O–O/Ne core white dwarfs, found in the mass range between 1.024 and 1.15 M�. We presentthe initial-to-final mass relation, the mass–radius relation and cooling times considering theeffects of atmosphere and core composition.
Key words: methods: numerical – stars: evolution – stars: white dwarfs.
1 IN T RO D U C T I O N
White dwarf stars are the most common final stage of stellar evolu-tion. They are the end product of main-sequence stars with massesup to 5–12 M� (Garcıa-Berro, Isern & Hernanz 1997a; Poelarendset al. 2008; Siess 2010; Langer 2012; Woosley & Heger 2015; Do-herty et al. 2015), depending on metallicity, which correspond to95–97 % of all stars in the Galaxy. White dwarf stars are excellentgalactic chronometers as they are slowly cooling, releasing the heatstored in the core. The age of stellar populations can be obtained bycomparisons of theoretical computations with their distribution inthe colour–magnitude diagram (Hansen et al. 2007; Campos et al.2016) or from the white dwarf luminosity function (Winget et al.1987; Bedin et al. 2010; Garcıa-Berro et al. 2014). The connec-tion between the properties of progenitor stars and white dwarfs isdepicted in the initial-to-final mass relation (IFMR), which leadsto constraints on the upper mass limit that separates white dwarfprogenitors of Type II supernovae (Siess 2007; Catalan et al. 2008).Also, binary systems with white dwarfs are believed to produceType Ia supernovae as a result of accretion that exceeds the up-per mass limit (e.g. Wang, Podsiadlowski & Han 2017). Finally,a comparison between models and observations of white dwarfscan enhance the comprehension of the physical properties of high-density matter (e.g. Prada Moroni & Straniero 2002; Isern et al.2010).
White dwarf stars can be divided into two main classes, DA andnon-DA types, based on the main component of their atmosphere.
� E-mail: [email protected]
The DA spectral class shows a hydrogen-rich atmosphere and rep-resent � 84 % of all white dwarfs (e.g. Kepler et al. 2007) whilenon-DA types have hydrogen-deficient atmospheres. The non-DAwhite dwarfs can be classified by the dominant element in their spec-tra and effective temperature: a DO class with strong lines of He IIand effective temperatures of Teff ≈ 45 000–200 000 K; a DB classwith strong He I lines and Teff ≈ 11 000–30 000 K; and for effectivetemperatures below Teff ≈ 11 000 K, DC, DQ and DZ classes withtraces of carbon and metals in their spectra. The helium-rich whitedwarfs are believed to be progeny of PG 1159 stars (McGraw et al.1979) formed by a born-again episode (Schoenberner 1979; Ibenet al. 1983) in which a helium flash occurs during the cooling se-quence (i.e. very late thermal pulse) forcing the star to evolve backto the asymptotic giant branch (AGB). As a result, this very latethermal pulse burns out all hydrogen left in the atmosphere of thestar.
White dwarfs with masses in the range 0.4–1.05 M� are believedto harbour a carbon/oxygen (C/O) core, after central hydrogen- andhelium-burning in earlier stages of evolution. However, the progen-itors of white dwarfs with masses larger than ≈1.05 M� (Garcıa-Berro et al. 1997a; Siess 2007) should reach a temperature highenough to achieve stable carbon-burning, forming an oxygen/neon(O/Ne) or neon/oxygen/magnesium (Ne/O/Mg) core, depending onwhether carbon-burning ignites off-centre or at the centre of thestar. When carbon-burning starts off-centre, ignition is followed byan inward propagation of the burning front (hereafter the carbonflame). This carbon flame might or might not reach the centre. Ifthe flame does not reach the centre, then a hybrid C/O+O/Ne whitedwarf will form (Denissenkov et al. 2013; Farmer, Fields & Timmes
C© 2018 The Author(s)Published by Oxford University Press on behalf of the Royal Astronomical Society
Dow
nloaded from https://academ
ic.oup.com/m
nras/article-abstract/480/2/1547/5065044 by Universidade Federal do R
io Grande do Sul user on 16 January 2019

1548 G. R. Lauffer, A. D. Romero and S. O. Kepler
2015), whilst a flame that does reach the centre will form a Ne/O/Mgwhite dwarf. These results are dependent on the evolutionary codeand input physics considered. Siess (2007) calculated sequences forseveral metallicities, with and without overshooting, and found thatfor Z = 0.02 the minimum core mass for O/Ne cores is 1.04 M�.Based on sequences calculated until the thermally pulsing asymp-totic giant branch (TP-AGB) phase, Doherty et al. (2015) found thatfor Z = 0.02 the minimum core mass for an O/Ne core white dwarfstar is 1.154 M�. The determination of the mass range for each typeof core composition is fundamental to improve our understandingof the populations of massive white dwarf stars.
The number of spectroscopically confirmed white dwarf starshas increased to more than ≈ 30 000 with surveys such as the SloanDigital Sky Survey (SDSS; Ahn et al. 2014). The mass distributionfor DA white dwarf stars presented by Kleinman et al. (2013) iscentred at 0.649 M� but it presents another peak at 0.811 M�(Kepler et al. 2015). In addition, an analysis of 112 isolated mas-sive white dwarfs performed by Nalezyty & Madej (2004) showedthat, for known white dwarfs with masses ≥0.8 M�, the mass dis-tribution has a primary peak at ≈0.8 M� and a secondary peakaround 1.04 M�. Around 20 % of all DA white dwarfs are moremassive than 0.8 M� (Liebert, Bergeron & Holberg 2005; Kepleret al. 2007) and about 9 % have mass around 1.12 M� (Kepleret al. 2007). Recent works have presented a high-mass tail on themass distribution with an excess for masses around MWD ≈ 1.0 M�(Falcon et al. 2010; Tremblay et al. 2013; Rebassa-Mansergas et al.2015; Kepler et al. 2016).
In the literature, there are several evolutionary models for low-and intermediate-mass white dwarf stars. For instance, Romero et al.(2012, 2013) and Althaus et al. (2009) have studied C/O core DAand non-DA white dwarfs, respectively, and Althaus, Miller Berto-lami & Corsico (2013), Istrate et al. (2014, 2016), Istrate, Fontaine& Heuser (2017) and Sun & Arras (2017) have studied low-massand extremely low-mass white dwarfs. However, there is a lack offull evolutionary models for massive white dwarfs. Recently, someauthors have computed the evolution of super-AGB stars until theend of the thermally pulsing phase (Siess 2010; Gil-Pons et al.2013; Jones et al. 2013; Doherty et al. 2015), but they have notcomputed the following post-AGB stage or the white dwarf evo-lution. Other authors computed white dwarf models by generatingstatic/politropic models at the top of the cooling sequence and/or byrescaling the mass and/or by artificially inserting a previously cal-culated chemical profile with fixed O/Ne ratios and fixed hydrogenand helium layers on the atmosphere (Benvenuto & Althaus 1999;Salaris et al. 2000; Althaus et al. 2005b, 2007; Salaris, Althaus &Garcıa-Berro 2013).
In this present work, we intend to fill the gap resulting fromthe lack of full evolutionary sequences for massive white dwarfs,computed from the zero age main-sequence (ZAMS) through thered giant branch (RGB) and AGB to the white dwarf cooling se-quence. To this end, we used the MESA evolutionary code (Mod-ules for Experiments in Stellar Astrophysics; Paxton et al. 2011,2013, 2015, 2018). We computed full evolutionary sequences withinitial masses in the range of 8.8–11.8 M� resulting in whitedwarf models with masses in the range of 1.01–1.31 M�, addingboth hydrogen- and helium-rich envelopes. This paper is orga-nized as follows. In Section 2, we present the MESA evolution-ary code and the input physics considered in our computations.The results from our full evolutionary computations are presentedin Section 3. In Section 4, we discuss the mass–radius rela-tion of our sequences. Finally, we present our final remarks inSection 5.
2 N U M E R I C A L S I M U L AT I O N S
The numerical simulations were performed using the MESA code(Paxton et al. 2011, 2013, 2015, 2018), version r8845. We startedthe computations on the ZAMS, considering an initial metallicityZ = 0.02. We computed the hydrogen-burning and helium-burningstages, and the RGB and AGB mass-loss phases. The sequencesended as C/O or O/Ne/Mg white dwarfs cooled to log L/L� ∼−4, which represents Teff ≈ 7 000–10 000 K depending on the finalmass.
The MESA evolutionary code has been extensively used to performcalculations of extremely low-mass white dwarfs (Istrate et al. 2016,2017; Sun & Arras 2017), hybrid C/O/Ne white dwarfs and Type Iasupernova progenitors (Denissenkov et al. 2013; Jones et al. 2013;Chen et al. 2014; Farmer et al. 2015; Brooks et al. 2017a), accretingwhite dwarf binaries with C/O cores (Brooks et al. 2016; Wang et al.2017) and O/Ne cores (Brooks et al. 2017b; Schwab, Bildsten &Quataert 2017), white dwarf isochrones (Dotter 2016) and sets ofsequences covering the white dwarf mass range (Choi et al. 2016;Pignatari et al. 2016; Ritter et al. 2018).
We detail the input physics considered prior and during whitedwarf evolution in the following subsections.
2.1 Pre-white-dwarf evolution
For the evolutionary phases prior to the cooling sequence, weconsidered the nuclear network co burn plus.net, which has16 elements from hydrogen to silicon: 1H, 3, 4He, 12, 13C, 13 − 15N,16 − 18O, 19F, 20, 22Ne, 24Mg and 28Si. This network has 67 nuclearreactions, including pp-chain, CNO cycle, triple-alpha and someauxiliary reactions. We used the Joint Institute for Nuclear Astro-physics (JINA) REACLIB database (Cyburt et al. 2010) with elec-tron screening factors for thermonuclear reactions from Graboskeet al. (1973) and DeWitt, Graboske & Cooper (1973) for weakand intermediate screening, and from Alastuey & Jancovici (1978)for the strong screening regime. Plasma parameters are those fromItoh et al. (1979). The energy-loss rates including the derivativesfrom thermal neutrinos are from Itoh et al. (1996). The equationof state (EOS) is based on the OPAL EOS tables (Rogers & Nay-fonov 2002) including the Saumon–Chabrier–van Horn (SCvH)tables (Saumon, Chabrier & van Horn 1995) for lower tempera-tures and densities, and the HELM EOS (Timmes & Swesty 2000)and Potekhin–Chabrier (PC) EOS (Potekhin & Chabrier 2010) forhigher temperatures and densities.
Convection was consider using the Ledoux criterion, which takesinto account the composition gradient, along with the Cox imple-mentation of mixing-length theory (MLT; Cox & Giuli 1968) witha mixing-length free parameter αMLT = 2. The diffusion and grav-itational settling in MESA are calculated by solving the equationsfrom Burgers (1969) with coefficients of Thoul, Bahcall & Loeb(1994). In the overshoot region, MESA treats convective mixing as atime-dependent diffusion process, with a diffusion coefficient givenby
DOV = Dconv,0 exp − 2z
f λP,0, (1)
where Dconv, 0 is the MLT-derived diffusion coefficient at the con-vective boundary, z is the distance from the convective bound-ary, λP, 0 is the local pressure scale height and f is the adjustableparameter (Herwig 2000), which can have different values atthe upper and lower convective boundaries for H-burning, He-burning, metal-burning (i.e all burning regions that are not H- or
MNRAS 480, 1547–1562 (2018)
Dow
nloaded from https://academ
ic.oup.com/m
nras/article-abstract/480/2/1547/5065044 by Universidade Federal do R
io Grande do Sul user on 16 January 2019
New full evolutionary sequences of massive WDs 1549
He-burning) and non-burning convection zones. Because of con-vergence issues, overshooting was only considered for the lowerboundary of the metal-burning convective region with parametersset to overshoot f below burn z shell = 0.1 and over-shoot f0 below burn z shell = 0.01. The mixing in re-gions unstable to Schwarzschild criteria but stable to Ledoux crite-ria is treated by semiconvection (Langer, Fricke & Sugimoto 1983)using the dimensionless efficiency parameter αsc = 0.01. Thermo-haline mixing (Ulrich 1972; Kippenhahn, Ruschenplatt & Thomas1980) is also considered with the efficiency parameter set to αth =2. For details of the implementation of semiconvection and thermo-haline mixing, refer to Section 4 of Paxton et al. (2013).
Mass loss was considered during the giant phases (i.e. RGB andAGB phases). We used the mass-loss formula from Reimers (1975)with η = 0.1 during the RGB phase, followed by the Bloecker (1995)scheme with η = 10 in the AGB phase. The opacity tables are thosefrom OPAL type 2 (Iglesias & Rogers 1996) for enhanced C/Ovariations in composition. We used a grey atmosphere for the entireevolution. Considering white dwarf stars have rotation periods of∼1 d (Kepler & Romero 2017), in most cases, the effects of rotationare negligible. Even though there are a few known fast rotators, wedo not consider rotation in our computations.
2.2 White dwarf evolution
Chemical diffusion and gravitational settling was modelled follow-ing the formulation from Burgers (1969). Sun & Arras (2017) sug-gested that the routine diffusion use cgs solver is bettersuited for electron degeneracy, but they considered only very low-mass white dwarf models with stellar mass below MWD < 0.17 M�.Employing this formulation for diffusion in massive models leadsto numerical instabilities and to non-physical chemical profiles.
In our models, convection was shut down as a result of numericalinstabilities during the cooling sequence. Computations with orwithout convection show no differences in the final ages of ourcooling sequences. The same happens when the Sun & Arras (2017)formulation is considered. Thus, our treatment of diffusion andconvection does not affect the cooling times in the mass rangeconsidered in this work.
The energy-loss rates from thermal neutrinos and its derivativesare from Itoh et al. (1996).
White dwarf stars are expected to undergo crystallization as aresult of strong Coulomb interactions in their dense interiors (vanHorn 1968). The transition occurs when the energy of the Coulombinteraction between neighbouring ions is much larger than theirthermal energy. The ratio between these two contributions can beexpressed as a coupling parameter � = Z2e2/aikBT , where Z is theaverage ion charge, ai is the mean ion spacing and the other symbolshave their usual meaning. Crystallization for pure oxygen plasmabegins when � ≈ 175 (van Horn 1969). The onset of crystallizationalso depends on the adopted phase diagram. Near the crystalliza-tion limit (� ∼ 175), MESA uses the PC EOS, which accounts forthe thermodynamics of crystals. By default, MESA changes from theHELM EOS to the PC EOS when the Coulomb coupling parameter� > 80 and considers a mixture of solid and liquid for �i = 150and a full crystal when �full = 175. These values were obtainedby Potekhin & Chabrier (2010). Results from the asteroseismolog-ical analysis performed by Romero et al. (2013) indicate that theazeotropic type phase diagram from Horowitz, Schneider & Berry(2010) better represents the crystallization on white dwarfs cores(see also Schneider et al. 2012; Hughto et al. 2012). Hence, wemodified the values for the coupling constant � to �i = 215 and
�full = 220 in our computations. Thus, the release of latent heat oc-curs for � = 215−220. This modification had to be done on the filepc eos.f located inside MESA eos module. Until MESA versionr8845, which is used in this work, there was no option to controlthose parameters.
The Debye cooling regime, which affects the cooling of whitedwarfs at lower luminosities, was not considered in our simula-tions. However, this effect will not be important in our results, as itoccurs for temperatures below ∼ 10 000 K and luminosities lowerthan log L/L� < −4.06 (Althaus et al. 2007) for the mass rangeconsidered in this work (see Section 3.6).
3 EVO L U T I O N FRO M TH E Z A M S TO T H EC O O L I N G C U RV E
We calculated 16 full evolutionary sequences with initial metallicityZ = 0.02 and initial mass at the ZAMS between 8.80 and 11.80 M�.As a result, we obtained white dwarf models with stellar massesranging from 1.012 to 1.307 M�. From our computations, we findthat a sequence with an initial mass of 11.9 M� does not resultin a white dwarf but possibly ends up as a neutron star. Thus, awhite dwarf with the Chandrasekhar limiting mass should have aprogenitor with an initial mass between 11.8 and 11.9 M�. Furthercalculations are needed to determine the model that leads to theChandrasekhar mass limit. Note that within this mass range thereare two possible core compositions (i.e. C/O and O/Ne/Mg). At highstellar masses, our computations complement the works of Romeroet al. (2012, 2013) who computed C/O core white dwarf sequenceswith masses below MWD = 1.050 M�. Our H- and He-atmospheresequences have evolved equally in the stages prior to the coolingsequence, so there is no distinction on the evolution previous to thewhite dwarf stage.
During the AGB phase, the computations present numerical dif-ficulties related to the mass-loss episodes. At this stage, we use themass-loss prescription of Bloecker (1995) with a factor η = 10,which leads to the complete removal of the hydrogen envelope, pre-venting the occurrence of thermal pulses, in all sequences. A lessefficient mass-loss rate, achieved by decreasing the value of η, doesnot allow us to compute the stages following the AGB stage but itstill leads to the complete removal of hydrogen. The same occurs forother MESA built-in mass-loss schemes. Garcıa-Berro et al. (1997a)discussed that a model with rapid radiative wind during the AGBphase is expected to lose all its hydrogen layer and most of its he-lium layer, leading to a PG 1159 star; however, real massive whitedwarfs are known to have H and He envelopes. In order to pro-duce hydrogen atmosphere white dwarf sequences, we artificiallyadded hydrogen at the surface of the models. This procedure wasperformed at high effective temperatures, near the beginning of thecooling sequences, so the transitory effects caused by the artificialprocedure are rapidly washed out. The amount of hydrogen addedto each sequence was computed by a linear extrapolation to higherstellar mass of the results of Romero et al. (2012, 2013). The amountof hydrogen as a function of the white dwarf stellar mass is shownin Fig. 1. Circles correspond to the results from Romero et al. (2012,2013), while the triangles correspond to the values extrapolated forhigher stellar masses.
As an example, Fig. 2 shows two chemical profiles in terms ofouter mass fraction at Teff ≈ 80 000 K on the cooling curve for asequence with stellar mass MWD = 1.019 M� and a C/O core. Thebottom panel shows the chemical profile for the He-atmosphere caseand the top panel presents the chemical profile for the H-atmospheresequence, after MH = 10−5.7MWD of hydrogen was artificially added
MNRAS 480, 1547–1562 (2018)
Dow
nloaded from https://academ
ic.oup.com/m
nras/article-abstract/480/2/1547/5065044 by Universidade Federal do R
io Grande do Sul user on 16 January 2019

1550 G. R. Lauffer, A. D. Romero and S. O. Kepler
Figure 1. Range of star mass and hydrogen envelope mass. Circles are fromRomero et al. (2012, 2013) and triangles are the extrapolated data.
Figure 2. Example of chemical profile in terms of the outer mass fractionat Teff ≈ 80 000 K on the cooling sequence for H-atmosphere (top) andHe-atmosphere (bottom) white dwarfs with 1.019 M�. Hydrogen had to beadded to all sequences due to losses in the mass-loss phase. The quantitiesadded to each evolution are shown in Table 1. This figure shows that only theatmosphere of the star was changed. The nuclei composition are identicalto both H- and He-atmosphere sequences.
to the model. Note that the only difference between the two chemicalprofiles shown in Fig. 2 is the chemical abundance of the outerlayers, while the core regions remain the same.
The sequences with final masses MWD ≥ 1.024 M� experienceloops at high luminosity and at the high effective temperature re-gion in the post-AGB stage (see Fig. 3). The loops are due tocarbon shell-burning followed by helium shell-burning, which, for
Figure 3. Evolutionary tracks for three sequences in the HR diagram, withinitial masses 8.9 M�(solid line), 10 M� (dashed line) and 11 M� (dottedline) and final masses 1.019, 1.11 and 1.22 M�, respectively. Each sequencehas a different core composition in the white dwarf cooling curve stage,which are C/O, O/Ne and Ne/O/Mg for the sequences with white dwarfmasses 1.019, 1.11 and 1.22 M�, respectively.
sequences with MWD ≥ 1.132 M�, burns all the helium contentin the outer layers. This helium shell-burning occurs as a result ofthe huge temperature gradient on the shells surrounding the core.Thus, enough shells must be added to the numerical models inthese regions to account for the large temperature gradients andcomposition gradients in the shell-burning regions.
For sequences with MWD ≥ 1.132 M�, helium was added on topof the model at the beginning of the cooling sequence using thesame procedure used to add hydrogen. The amount of helium to beadded was extrapolated from our sequences, which had not burnt allthe helium. The amount of hydrogen and helium for each sequenceis presented in columns 3 and 4 of Table 1, along with the initialmass at the ZAMS and the white dwarf mass in columns 1 and 2,respectively. Helium-atmosphere sequences were produced by notadding hydrogen on top of the models.
The Hertzsprung–Russell (HR) diagram from the ZAMS to thewhite dwarf cooling sequence is shown in Fig. 3 for three sequenceswith initial masses 8.9, 10 and 11 M� and final masses of 1.019,1.11 and 1.22 M� in the cooling curve, respectively. Each sequencein this figure has a different core composition as a white dwarf star.The solid, dashed and dotted lines represent a C/O core white dwarfwith MWD = 1.019 M�, an O/Ne core white dwarf with MWD =1.11 M� and a Ne/O/Mg white dwarf with MWD = 1.22 M�,respectively.
The MWD = 1.019 M� sequence with a C/O core experienced acore hydrogen-burning stage lasting for 24.51 Myr, and then duringthe next 2.80 Myr helium was burnt until depletion at the centre.For more massive sequences, the time spent on main-sequence andcentral helium-burning decreases. For the sequences with final massMWD = 1.11 M�, with an O/Ne core, the total main-sequence timeis 19.75 Myr plus 2.28 Myr to burn all helium. Lastly, the sequencewith final mass MWD = 1.22 M� burnt hydrogen for 16.83 Myr untildepletion at the centre and burnt helium for 1.81 Myr until extinctionat the centre. The ages for hydrogen and helium depletion at centreand progenitor age (i.e. the age at the beginning of the white dwarfcooling sequence) are listed in columns 3, 4 and 5 of Table 3,respectively (see Section 3.6).
MNRAS 480, 1547–1562 (2018)
Dow
nloaded from https://academ
ic.oup.com/m
nras/article-abstract/480/2/1547/5065044 by Universidade Federal do R
io Grande do Sul user on 16 January 2019
New full evolutionary sequences of massive WDs 1551
Table 1. Values of initial mass at ZAMS (MZAMS), white dwarfs masses (MWD) and hydrogen content for H-rich sequences and helium content for both H-and He-atmosphere sequences. The H abundances were extrapolated from Romero et al. (2012, 2013). The He abundances were extrapolated for sequenceswith MWD ≥ 1.132.
MZAMS (M�) MWD (M�) −log MH/MWD −log MHe/MWD
8.80 1.012 5.722 2.4518.90 1.019 5.732 2.4669.00 1.024 5.740 3.4779.20 1.036 5.785 3.3499.50 1.064 6.076 2.9589.80 1.088 6.365 4.006
10.00 1.110 6.446 3.51710.10 1.125 6.484 2.44710.20 1.131 6.498 2.48910.30 1.132 6.500 2.49510.45 1.147 6.536 2.59710.50 1.151 6.547 2.62810.80 1.216 6.711 3.08911.00 1.220 6.720 3.11611.40 1.267 6.838 3.44911.80 1.307 6.939 3.735
3.1 Carbon flame
As can be seen from Fig. 3, the sequences characterized with whitedwarf masses of 1.11 and 1.22 M� present loops in the upper-left region of the HR diagram, prior to entering the white dwarfcooling sequence. Those loops are due to carbon-burning, whichignites off-centre and moves inwards to the centre of the star. Inparticular, towards the end of the loop, just before the extinctionof the carbon-burning, helium ignites on a shell near the surface.All sequences with MWD ≥ 1.024 M� experience an off-centrecarbon ignition prior to the white dwarf stage, and for sequenceswith MWD ≥ 1.132 M� the subsequent helium-burning consumesall the helium content in the outer layers. If the carbon flame doesnot reach the centre of the star, a hybrid C/O–O/Ne white dwarfwill form (Denissenkov et al. 2013), while if the flame propa-gates to the centre, an O/Ne/Mg white dwarf will be produced.The occurrence of the late carbon flashes can be an explanationfor the luminosity variations observed in the star in the StingrayNebula, CD-59 6479 or SAO 24567 (Henize 1976; Reindl et al.2014). The luminosity variation time-scale at the beginning of thecarbon-burning in our sequence with MWD = 1.024 M� is similarto that observed, although the total change in luminosity in CD-596479 is larger than the one shown in our models by a factor of∼100 (Schaefer & Edwards 2015), and the stellar masses are verydifferent.
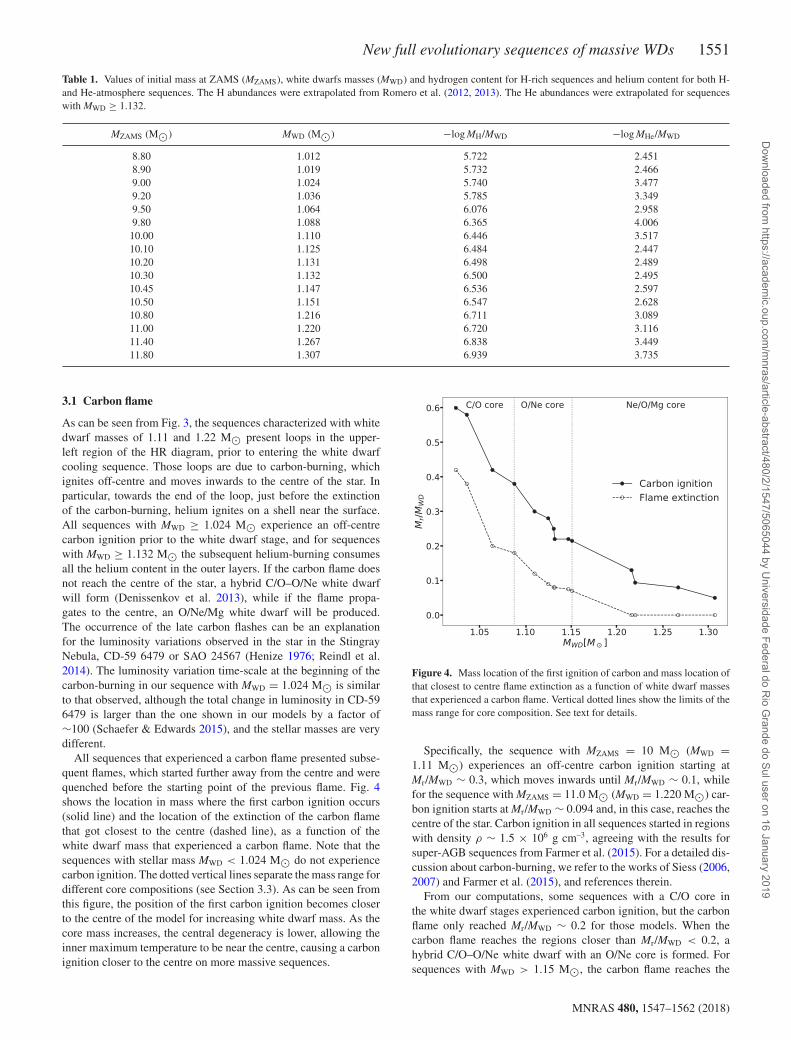
All sequences that experienced a carbon flame presented subse-quent flames, which started further away from the centre and werequenched before the starting point of the previous flame. Fig. 4shows the location in mass where the first carbon ignition occurs(solid line) and the location of the extinction of the carbon flamethat got closest to the centre (dashed line), as a function of thewhite dwarf mass that experienced a carbon flame. Note that thesequences with stellar mass MWD < 1.024 M� do not experiencecarbon ignition. The dotted vertical lines separate the mass range fordifferent core compositions (see Section 3.3). As can be seen fromthis figure, the position of the first carbon ignition becomes closerto the centre of the model for increasing white dwarf mass. As thecore mass increases, the central degeneracy is lower, allowing theinner maximum temperature to be near the centre, causing a carbonignition closer to the centre on more massive sequences.
Figure 4. Mass location of the first ignition of carbon and mass location ofthat closest to centre flame extinction as a function of white dwarf massesthat experienced a carbon flame. Vertical dotted lines show the limits of themass range for core composition. See text for details.
Specifically, the sequence with MZAMS = 10 M� (MWD =1.11 M�) experiences an off-centre carbon ignition starting atMr/MWD ∼ 0.3, which moves inwards until Mr/MWD ∼ 0.1, whilefor the sequence with MZAMS = 11.0 M� (MWD = 1.220 M�) car-bon ignition starts at Mr/MWD ∼ 0.094 and, in this case, reaches thecentre of the star. Carbon ignition in all sequences started in regionswith density ρ ∼ 1.5 × 10⁶ g cm–3, agreeing with the results forsuper-AGB sequences from Farmer et al. (2015). For a detailed dis-cussion about carbon-burning, we refer to the works of Siess (2006,2007) and Farmer et al. (2015), and references therein.
From our computations, some sequences with a C/O core inthe white dwarf stages experienced carbon ignition, but the carbonflame only reached Mr/MWD ∼ 0.2 for those models. When thecarbon flame reaches the regions closer than Mr/MWD < 0.2, ahybrid C/O–O/Ne white dwarf with an O/Ne core is formed. Forsequences with MWD > 1.15 M�, the carbon flame reaches the
MNRAS 480, 1547–1562 (2018)
Dow
nloaded from https://academ
ic.oup.com/m
nras/article-abstract/480/2/1547/5065044 by Universidade Federal do R
io Grande do Sul user on 16 January 2019

1552 G. R. Lauffer, A. D. Romero and S. O. Kepler
Figure 5. Initial-to-final mass relation obtained from our computations(triangles) compared with the results from Siess (2010) and Doherty et al.(2015), shown as circles and squares, respectively. In all cases, the initialmetallicity is Z = 0.02. We only show the massive models of Doherty et al.(2015).
centre of the star, producing a Ne/O/Mg core white dwarf. Thedetails of core composition and chemical profile will be analysedin the following subsections.
3.2 The initial-to-final mass relation
Fig. 5 presents the initial-to-final mass relation obtained from ourcomputations, compared with the results of Siess (2010) and Do-herty et al. (2015), within the stellar mass range considered in thiswork. We consider models with metallicity Z = 0.02. The final massobtained in this work is systematically lower than previous results,because of the different input physics considered in each case. Siess(2010) considers the Vassiliadis & Wood (1993) mass-loss scheme,a mixing-length parameter of αMLT = 1.75 and no core overshoot-ing. However, Doherty et al. (2015) consider the mass-loss ratefrom Reimers (1975) on the RGB, followed by Bloecker (1995) athigh luminosities and changing to Vassiliadis & Wood (1993) inthe thermally pulsing phase, with a similar convection treatmentas Siess (2010). Also, both Siess (2010) and Doherty et al. (2015)evolved their sequences only until the TP-AGB phase, and thenconsidered the mass of the He-free core as the final mass at thewhite dwarf stage. As discussed in Siess (2010), the final mass isdependent on the core growth and mass-loss scheme. In our com-putations, we calculated full evolutionary sequences by employingthe mass-loss formula from Reimers (1975) on the RGB and fromBloecker (1995) on the AGB, with a larger efficiency parameterthan the mass-loss rates considered by previous authors. Thus, thesequences evolve to the post-AGB phase and lead to a lower finalmass in the cooling curve for the same initial mass. From our com-putations, the upper limit of progenitor mass needed to produce awhite dwarf star is MZAMS = 11.8 M� for Z = 0.02, which is 21.6% greater than the value found by Doherty et al. (2015) and 12.4 %greater compared with Siess (2010) for the same initial metallicity.Considering the dispersion in the initial-to final mass relation fromthe different authors in Fig. 5, for a given initial mass in the ZAMSwe can estimate a range of final white dwarf masses. For instance,a sequence with an initial mass of 9 M� can produce a white dwarfwith masses ranging from 1.024 to 1.225 M�, depending on the
Figure 6. Central abundances versus final mass of the white dwarf starsbefore crystallization starts (Teff ≈ 40 000 K). The black circles represent12C, triangles are 16O, squares are 20Ne and empty circles are 24Mg. Wecan identify three regions: one for a C/O core for masses below or equal to1.088 M� where neon is lower than carbon; another region between 1.088and 1.147 M� in which neon is greater than carbon and lower than oxygenbut magnesium is lower than carbon, defining an O/Ne core; and a thirdregion for masses greater than 1.147 M� with an O/Ne/Mg core due toneon being greater than oxygen and magnesium greater than carbon.
input physics applied, especially the mass-loss formulation. Thepresent-day observational data cannot distinguish the best model.
3.3 Central abundances in the cooling sequence
Within the stellar mass range studied in this work, we expect to havethree main core compositions – that is, C/O and O/Ne (Garcıa-Berro,Ritossa & Iben 1997b; Doherty et al. 2015) or Ne/O/Mg, changingwith increasing stellar mass. Fig. 6 shows central abundances ofcarbon, oxygen, neon and magnesium in a logarithmic scale, as afunction of the white dwarf mass. The values are taken at Teff ≈40 000 K, an effective temperature low enough to give time fordiffusion to act on the central composition and still high enoughto be above crystallization. As shown in Fig. 6, the C/O core isdominant for MWD ≤ 1.088 M� due to carbon being more abundantthan neon. In the range 1.088 < MWD ≤ 1.147 M�, we havean O/Ne core as the amount of neon increases but is still lowerthan oxygen, whilst for masses MWD > 1.147 M� neon is themost abundant element in the central composition, followed byoxygen and then by magnesium, defining the core compositionas a Ne/O/Mg core. Note that sequences with MWD > 1.15 M�experienced a carbon flame that reaches the centre of the stars, asshown in Fig. 4 and discussed in Section 3.1. Also, the sequencewith MWD = 1.024 M� is the sequence with the lowest stellarmass to experience carbon-burning, but it does not reach the centre,producing a hybrid C/O–O/Ne white dwarf. This explains the stepin the central 20Ne abundance observed in Fig. 6 for that stellarmass. Doherty et al. (2015) computed sequences for super-AGBstars and found that, for Z = 0.02, sequences with core masses Mc
< 1.075 M� become a C/O core white dwarf, sequences with coremasses 1.075 ≤ Mc < 1.154 M� present a C/O/Ne core, and forcore masses Mc ≥ 1.154 M� the sequences are O/Ne white dwarfs.Woosley & Heger (2015) also calculated sequences on the limit ofsupernova progenitors and obtained models with an O/Ne core for a
MNRAS 480, 1547–1562 (2018)
Dow
nloaded from https://academ
ic.oup.com/m
nras/article-abstract/480/2/1547/5065044 by Universidade Federal do R
io Grande do Sul user on 16 January 2019
New full evolutionary sequences of massive WDs 1553
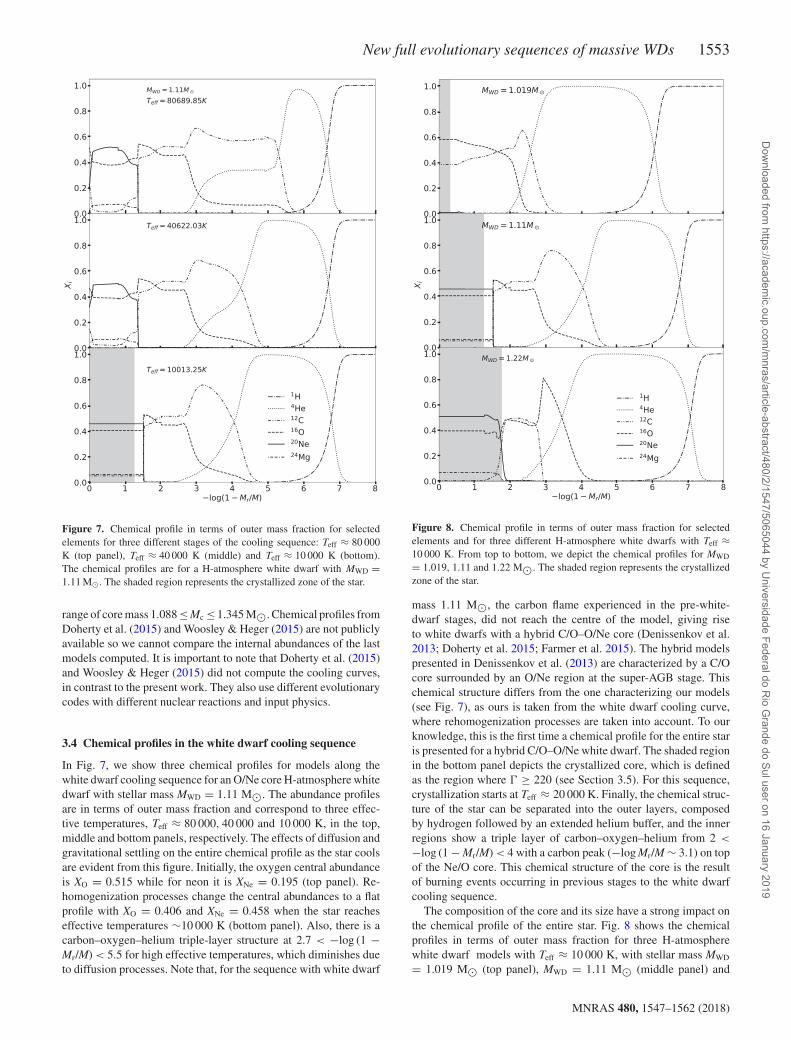
Figure 7. Chemical profile in terms of outer mass fraction for selectedelements for three different stages of the cooling sequence: Teff ≈ 80 000K (top panel), Teff ≈ 40 000 K (middle) and Teff ≈ 10 000 K (bottom).The chemical profiles are for a H-atmosphere white dwarf with MWD =1.11 M�. The shaded region represents the crystallized zone of the star.
range of core mass 1.088 ≤ Mc ≤ 1.345 M�. Chemical profiles fromDoherty et al. (2015) and Woosley & Heger (2015) are not publiclyavailable so we cannot compare the internal abundances of the lastmodels computed. It is important to note that Doherty et al. (2015)and Woosley & Heger (2015) did not compute the cooling curves,in contrast to the present work. They also use different evolutionarycodes with different nuclear reactions and input physics.
3.4 Chemical profiles in the white dwarf cooling sequence
In Fig. 7, we show three chemical profiles for models along thewhite dwarf cooling sequence for an O/Ne core H-atmosphere whitedwarf with stellar mass MWD = 1.11 M�. The abundance profilesare in terms of outer mass fraction and correspond to three effec-tive temperatures, Teff ≈ 80 000, 40 000 and 10 000 K, in the top,middle and bottom panels, respectively. The effects of diffusion andgravitational settling on the entire chemical profile as the star coolsare evident from this figure. Initially, the oxygen central abundanceis XO = 0.515 while for neon it is XNe = 0.195 (top panel). Re-homogenization processes change the central abundances to a flatprofile with XO = 0.406 and XNe = 0.458 when the star reacheseffective temperatures ∼10 000 K (bottom panel). Also, there is acarbon–oxygen–helium triple-layer structure at 2.7 < −log (1 −Mr/M) < 5.5 for high effective temperatures, which diminishes dueto diffusion processes. Note that, for the sequence with white dwarf
Figure 8. Chemical profile in terms of outer mass fraction for selectedelements and for three different H-atmosphere white dwarfs with Teff ≈10 000 K. From top to bottom, we depict the chemical profiles for MWD
= 1.019, 1.11 and 1.22 M�. The shaded region represents the crystallizedzone of the star.
mass 1.11 M�, the carbon flame experienced in the pre-white-dwarf stages, did not reach the centre of the model, giving riseto white dwarfs with a hybrid C/O–O/Ne core (Denissenkov et al.2013; Doherty et al. 2015; Farmer et al. 2015). The hybrid modelspresented in Denissenkov et al. (2013) are characterized by a C/Ocore surrounded by an O/Ne region at the super-AGB stage. Thischemical structure differs from the one characterizing our models(see Fig. 7), as ours is taken from the white dwarf cooling curve,where rehomogenization processes are taken into account. To ourknowledge, this is the first time a chemical profile for the entire staris presented for a hybrid C/O–O/Ne white dwarf. The shaded regionin the bottom panel depicts the crystallized core, which is definedas the region where � ≥ 220 (see Section 3.5). For this sequence,crystallization starts at Teff ≈ 20 000 K. Finally, the chemical struc-ture of the star can be separated into the outer layers, composedby hydrogen followed by an extended helium buffer, and the innerregions show a triple layer of carbon–oxygen–helium from 2 <
−log (1 − Mr/M) < 4 with a carbon peak (−log Mr/M ∼ 3.1) on topof the Ne/O core. This chemical structure of the core is the resultof burning events occurring in previous stages to the white dwarfcooling sequence.
The composition of the core and its size have a strong impact onthe chemical profile of the entire star. Fig. 8 shows the chemicalprofiles in terms of outer mass fraction for three H-atmospherewhite dwarf models with Teff ≈ 10 000 K, with stellar mass MWD
= 1.019 M� (top panel), MWD = 1.11 M� (middle panel) and
MNRAS 480, 1547–1562 (2018)
Dow
nloaded from https://academ
ic.oup.com/m
nras/article-abstract/480/2/1547/5065044 by Universidade Federal do R
io Grande do Sul user on 16 January 2019

1554 G. R. Lauffer, A. D. Romero and S. O. Kepler
Table 2. Age and effective temperature on the onset of crystallization for different Coulomb coupling parameters. The age of crystallization is defined as thetime starting at the cooling sequence and ending at the onset of crystallization (given in Gyr). The effective temperature is in Kelvin. The effective temperaturefor �full = 220 in the last row agrees with table 2 of Romero et al. (2013).
MWD (M�) �full = 175 �full = 220Age (Gyr) Teff (K) Age (Gyr) Teff (K)
1.012 15095 0.647 13152 0.8711.019 15376 0.628 13396 0.8481.024 15552 0.678 13584 0.925
MWD = 1.22 M� (bottom panel). The shaded region representsthe crystallized region of the model. From this figure, we note thatthe crystallization front is closer to the surface of the model forhigher stellar mass, located at −log (1 − Mr/M) ≈ 0.9, 1.2 and2 for MWD = 1.019, 1.11 and 1.22 M� models, respectively. Thesequence characterized by stellar mass MWD = 1.019 M� has a C/Ocore with a core mass of Mc = 1.016 M� extending to −log (1 −Mr/M∗) = 2.6 and present a triple layer of carbon–oxygen–heliumat 1.8 < −log (1 − Mr/M∗) < 2.6. On top of the core, the modelhas a helium buffer of MHe = 10−2.47MWD and a hydrogen envelopewith MH = 10−5.73MWD. All these structures have a strong impacton the propagation of stellar oscillations, when present (Wingetet al. 1997). Althaus et al. (2010) and Romero et al. (2012, 2013)also obtained a triple-layer structure in their C/O core white dwarfmodels.
The sequence with MWD = 1.11 M� has an O/Ne core, extendingto −log (1 − Mr/M) = 4, which represents mass Mc = 1.1099 M�.As discussed before, this O/Ne core model shows a triple-layeroxygen–carbon–helium with a peak of carbon at the outer boundaryof the core, a helium buffer of MHe = 10−3.52MWD and a hydrogenenvelope of MH = 10−6.45MWD. The MWD = 1.22 M� sequence hasa Ne/O/Mg core with Mc = 1.219 M�, which extends to −log (1− Mr/M) = 3.5. It also presents a triple layer of oxygen–carbon–helium with a sharp oxygen peak, instead of a carbon peak in theO/Ne core case. The Ne/O/Mg core model has a helium buffer ofMHe = 10−3.12MWD and a hydrogen envelope of MH = 10−6.72MWD.The differences in core composition are due to the final mass, asshown in Fig. 6. Asteroseismology will be able to distinguish thesestructures.
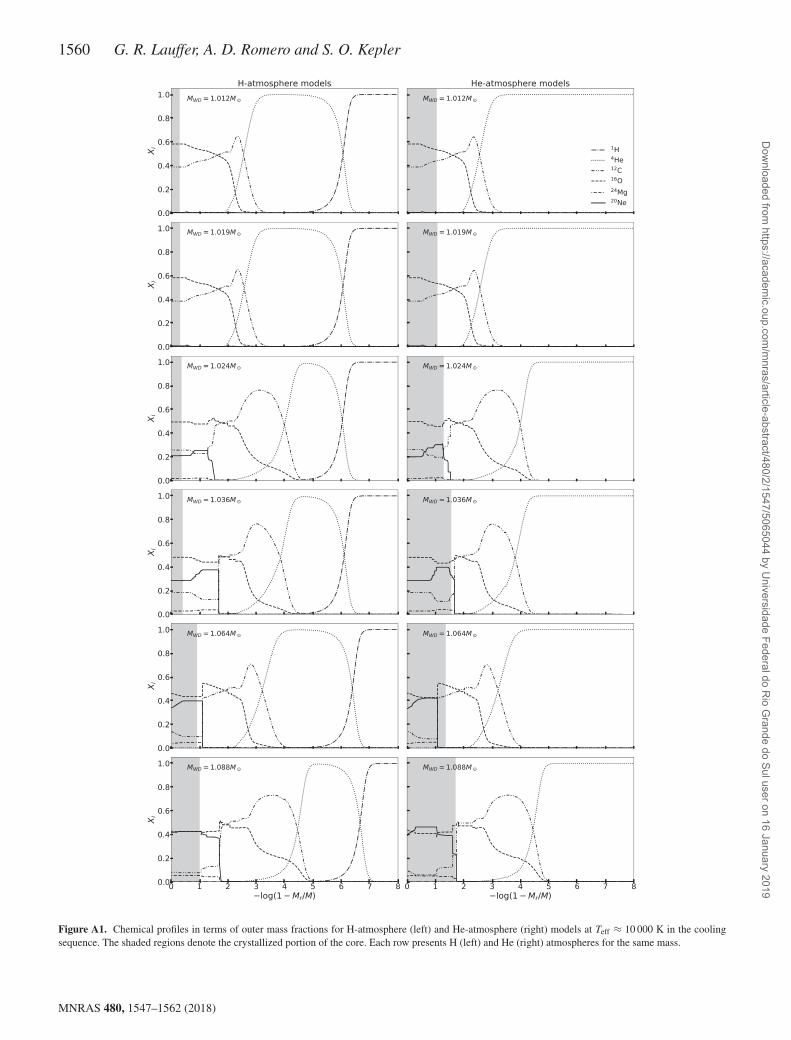
In the Appendix, we present all chemical profiles for bothH- and He-atmosphere sequences at effective temperaturesTeff ≈ 10 000 K.
3.5 Crystallization and the Coulomb coupling parameter
As stated before, as a standard input value the MESA code consid-ers that a mixture of solid and liquid phases occurs for a couplingparameter �i = 150 while a full crystal structure occurs when �full
= 175. However, Romero et al. (2013) calculated white dwarf se-quences considering two types of phase diagram. They concludedthat the azeotropic type from Horowitz et al. (2010) better repre-sents the crystallization on the nuclei of white dwarfs. Hence, wemodify the values of the � parameter to �i = 215 for a liquid/solidcoexisting phase and �full = 220 for a full crystal phase, in line withthe results obtained using the Horowitz et al. (2010) phase diagram.Paxton et al. (2018) calculated cooling sequences for a 0.6-M�white dwarf star, using MESA, varying �i = 174 – 220 and �full =176 – 240, and they found a difference in the cooling times of theorder of ∼0.2 Gyr. For the stellar mass range considered in thiswork, an assumption of �i = 215 and �full = 220 makes the effec-
Figure 9. Comparison of effective temperature on the onset of crystalliza-tion for a range of white dwarf masses. Effective temperature is in unitsof 104 K. Circles denote the data extracted from Romero et al. (2013) andtriangles are results from this work. There is agreement between both worksfor values of mass MWD ∼ 1 M� and the effective temperature rises asmass also increases.
tive temperature at which crystallization starts ≈2000 K lower, andthe age ≈0.23 Gyr larger than the values using the standard inputvalues. Table 2 lists the effective temperature and age on the onsetof crystallization for three sequences considering the two values of�full .
In Fig. 9, we compare the values of the effective temperatureat the onset of crystallization, as a function of the white dwarfmass, with the results obtained by Romero et al. (2013). Note thatthe results obtained in this work (shown by triangles) are in goodagreement with those from Romero et al. (2013), shown by circles,in the stellar mass range where both works overlap.
3.6 White dwarf cooling times
The cooling time is defined as the time spent by a star in the whitedwarf cooling sequence (tcool). We define the beginning of thecooling sequence as the point of maximum effective temperaturein the post-AGB stage, before the star enters the cooling sequence.The progenitor age (ti) is defined as the time from the ZAMS to thebeginning of the cooling sequence. Then the total age of a whitedwarf star can be computed as ttotal = ti + tcool. Table 3 summarizesthe characteristic time-scales for all the sequences computed inthis work. Specifically, for each sequence, we list the initial massin the ZAMS (column 1) and the final mass at the cooling curve(column 2), along with the age for hydrogen and helium exhaustionat the core in columns 3 and 4, respectively. The progenitor age ti
MNRAS 480, 1547–1562 (2018)
Dow
nloaded from https://academ
ic.oup.com/m
nras/article-abstract/480/2/1547/5065044 by Universidade Federal do R
io Grande do Sul user on 16 January 2019
New full evolutionary sequences of massive WDs 1555
Table 3. Mass at ZAMS, white dwarf mass, age when hydrogen is depleted at centre (tH), age when helium is totally consumed at the centre (tHe), progenitorages (ti), effective temperature on crystallization (Teffc ) and age at crystallization (tcryst, accounted from the beginning of the cooling sequence) and coolingtime (tcool = age at Teff = 1 × 10⁴ K minus ti) for H- and He-atmosphere white dwarfs. Ages (tH, tHe, ti) in units of Myr and crystallization and cooling timesin units of Gyr.
H-atmosphere He-atmosphereMZAMS MWD tH tHe ti Teffc tcryst tcool Teffc tcryst tcool
(M�) (M�) (Myr) (Myr) (Myr) (K) (Gyr) (Gyr) (K) (Gyr) (Gyr)
8.80 1.012 24.99 27.87 28.53 13 152 0.870 3.65 13 738 0.839 2.998.90 1.019 24.50 27.30 27.94 13 396 0.847 3.69 13 837 0.839 2.999.00 1.024 23.88 26.61 27.26 13 584 0.924 4.09 13 634 0.933 3.489.20 1.036 22.99 25.73 26.24 14 281 0.810 3.75 14 714 0.756 3.369.50 1.064 21.63 24.17 24.63 14 643 0.754 3.13 14 098 0.924 2.859.80 1.088 20.49 22.82 23.24 16 585 0.636 3.39 15 858 0.742 2.9010.00 1.11 19.75 22.03 22.45 19 356 0.415 3.04 17 945 0.538 2.6210.10 1.125 19.42 21.64 22.03 20 941 0.338 2.65 19 552 0.405 2.3410.20 1.131 19.06 21.23 21.62 21 963 0.310 2.72 19 815 0.387 2.4810.30 1.132 18.75 20.87 21.26 22 276 0.296 2.71 20 383 0.376 2.5710.45 1.147 18.35 20.37 20.74 23 673 0.253 2.52 23 006 0.285 2.2110.50 1.151 18.19 20.17 20.54 24 001 0.250 2.51 23 339 0.278 2.2110.80 1.216 17.38 19.31 19.55 29 651 0.183 2.28 29 982 0.181 1.9111.00 1.22 16.83 18.63 18.88 30 177 0.177 2.25 30 244 0.179 1.9011.40 1.267 15.86 17.51 17.73 36 584 0.133 1.93 36 808 0.132 1.7111.80 1.307 15.02 16.55 16.75 44 953 0.098 1.54 45 137 0.099 1.31
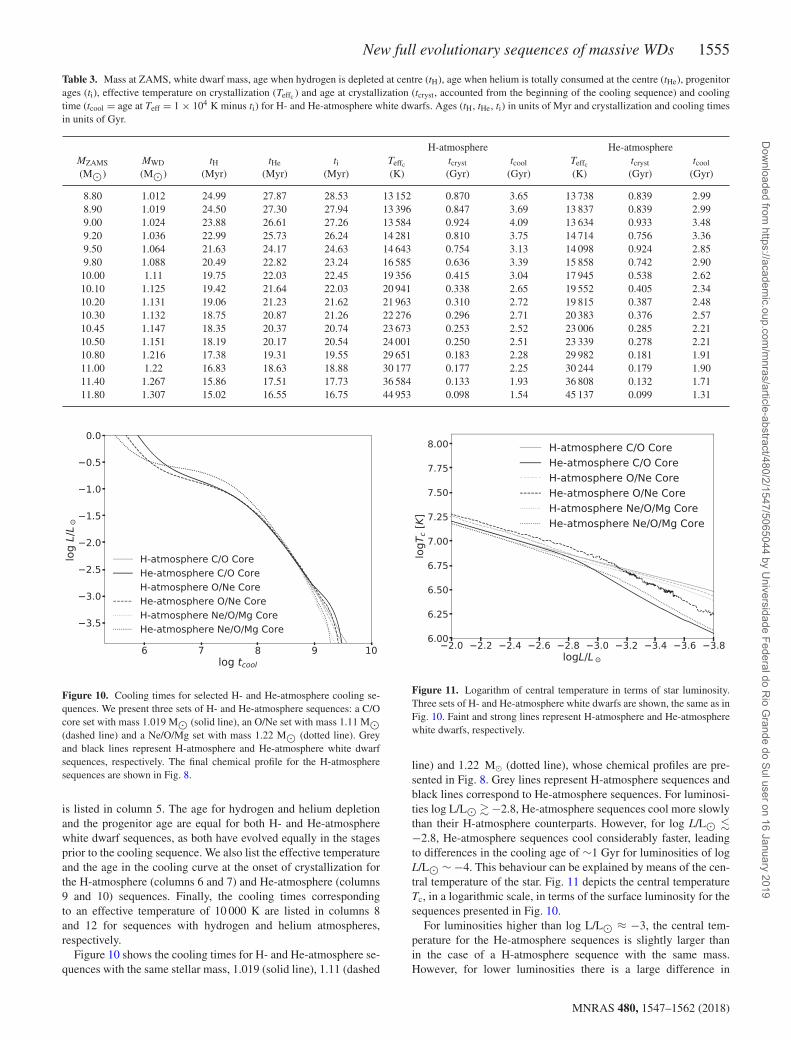
Figure 10. Cooling times for selected H- and He-atmosphere cooling se-quences. We present three sets of H- and He-atmosphere sequences: a C/Ocore set with mass 1.019 M� (solid line), an O/Ne set with mass 1.11 M�(dashed line) and a Ne/O/Mg set with mass 1.22 M� (dotted line). Greyand black lines represent H-atmosphere and He-atmosphere white dwarfsequences, respectively. The final chemical profile for the H-atmospheresequences are shown in Fig. 8.
is listed in column 5. The age for hydrogen and helium depletionand the progenitor age are equal for both H- and He-atmospherewhite dwarf sequences, as both have evolved equally in the stagesprior to the cooling sequence. We also list the effective temperatureand the age in the cooling curve at the onset of crystallization forthe H-atmosphere (columns 6 and 7) and He-atmosphere (columns9 and 10) sequences. Finally, the cooling times correspondingto an effective temperature of 10 000 K are listed in columns 8and 12 for sequences with hydrogen and helium atmospheres,respectively.
Figure 10 shows the cooling times for H- and He-atmosphere se-quences with the same stellar mass, 1.019 (solid line), 1.11 (dashed
Figure 11. Logarithm of central temperature in terms of star luminosity.Three sets of H- and He-atmosphere white dwarfs are shown, the same as inFig. 10. Faint and strong lines represent H-atmosphere and He-atmospherewhite dwarfs, respectively.
line) and 1.22 M� (dotted line), whose chemical profiles are pre-sented in Fig. 8. Grey lines represent H-atmosphere sequences andblack lines correspond to He-atmosphere sequences. For luminosi-ties log L/L� � −2.8, He-atmosphere sequences cool more slowlythan their H-atmosphere counterparts. However, for log L/L� �−2.8, He-atmosphere sequences cool considerably faster, leadingto differences in the cooling age of ∼1 Gyr for luminosities of logL/L� ∼ −4. This behaviour can be explained by means of the cen-tral temperature of the star. Fig. 11 depicts the central temperatureTc, in a logarithmic scale, in terms of the surface luminosity for thesequences presented in Fig. 10.
For luminosities higher than log L/L� ≈ −3, the central tem-perature for the He-atmosphere sequences is slightly larger thanin the case of a H-atmosphere sequence with the same mass.However, for lower luminosities there is a large difference in
MNRAS 480, 1547–1562 (2018)
Dow
nloaded from https://academ
ic.oup.com/m
nras/article-abstract/480/2/1547/5065044 by Universidade Federal do R
io Grande do Sul user on 16 January 2019
1556 G. R. Lauffer, A. D. Romero and S. O. Kepler
Tc between H- and He-atmosphere sequences. The release ofinternal energy due to crystallization occurs at higher luminosi-ties for He-atmosphere sequences, delaying the cooling for thoseluminosities. As helium is more transparent than hydrogen, He-atmosphere sequences lose energy faster than H-atmosphere se-quences at lower luminosities. The results presented in Fig. 10agree with the results from Camisassa et al. (2017, their figs 7 and11), who calculated evolutionary sequences for lower-mass whitedwarfs (MWD ≤ 1 M�) with hydrogen-deficient atmospheres, andcompared these with hydrogen-rich white dwarfs from Camisassaet al. (2016).
The core composition also affects the cooling times of whitedwarf stars. Garcıa-Berro et al. (1997a) compared cooling times forsequences with same mass and two core compositions, C/O andO/Ne , and obtained a difference in cooling time of the order of∼2 Gyr. This is due to the difference in the heat capacity of thecore, which is lower for an O/Ne mixture than for an C/O mixture,reducing the cooling time for a core with a higher mean molecularweight.
The Debye regime of fast cooling for white dwarfs is importantfor very low luminosities. In particular, Althaus et al. (2007) foundthat the Debye cooling regime for H-atmosphere white dwarfs startsto be important for luminosities below logL/L� ∼ −4 for massesMWD ≥ 1.28 M�. Since our computations end at those luminosities,the cooling times presented in Fig. 10 are not affected by Debyecooling.
In the region of 0 > log L/L� > −1.5, the effects of neutrinolosses are present and dominant, as can be seen from Fig. 10. Theneutrino emission decreases at higher luminosities for the more mas-sive sequences when compared to lower-mass sequences, but thereare no differences between the H- and He-atmosphere sequences atthose luminosities. The rate of neutrino emission becomes negligi-ble at log L/L� ∼ −1 for the sequences with masses 1.019 and1.11 M�, and at log L/L� ∼ −0.5 for the sequence with 1.22 M�,in agreement with the results from Althaus et al. (2007). However,the evolution for luminosities lower than log L/L� ∼−2 in our com-putations differs from the luminosities computed by Althaus et al.(2007). In our computations, we consider a crystallization treat-ment that mimics the results from the phase diagram presented byHorowitz et al. (2010), while Althaus et al. (2007) consider the phasediagram from Segretain et al. (1994), which increases the crystal-lization temperature by ∼2000 K (for details, see Romero et al.2013). Also, Althaus et al. (2007) consider a fixed O/Ne core chem-ical profile for all stellar masses, while in the cooling sequencescalculated in this work, the chemical profiles come from evolution-ary computations and are consistent with the stellar mass, coveringC/O, O/Ne and Ne/O/Mg cores. The differences in the cooling timesbetween our computations and those from Althaus et al. (2007) are∼0.6 Gyr at logL/L� ∼ −4 for a stellar mass of ∼ 1.21 M�.
4 MASS–RADIUS RELATION
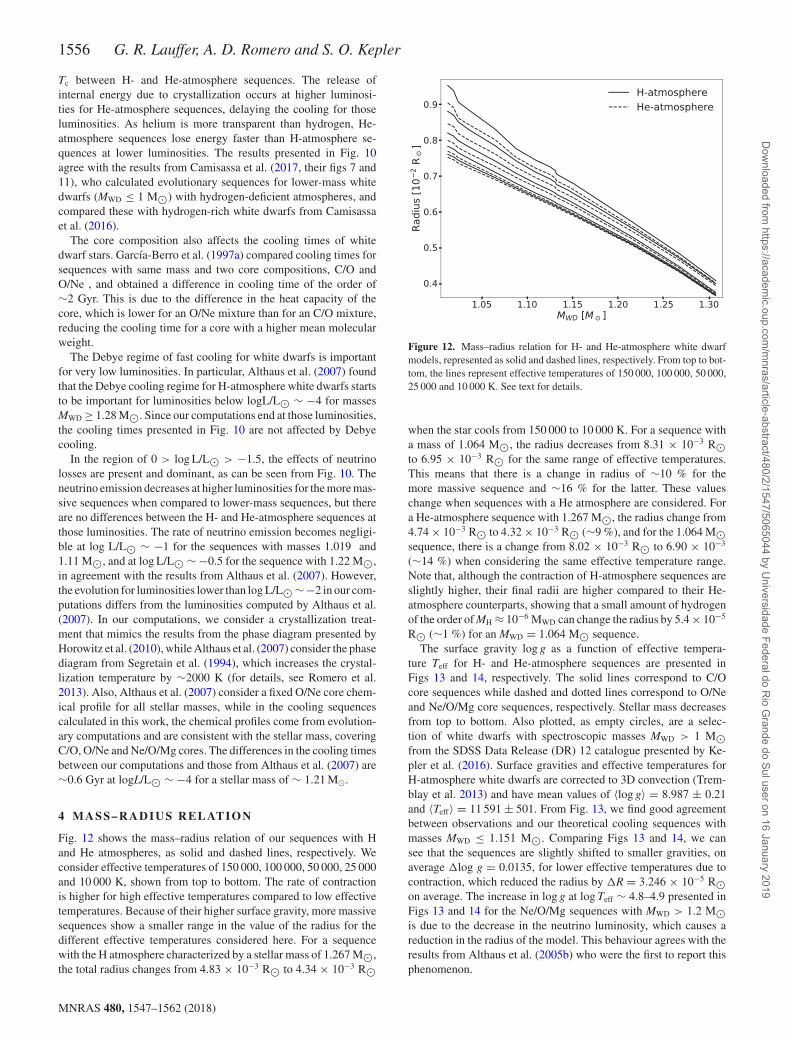
Fig. 12 shows the mass–radius relation of our sequences with Hand He atmospheres, as solid and dashed lines, respectively. Weconsider effective temperatures of 150 000, 100 000, 50 000, 25 000and 10 000 K, shown from top to bottom. The rate of contractionis higher for high effective temperatures compared to low effectivetemperatures. Because of their higher surface gravity, more massivesequences show a smaller range in the value of the radius for thedifferent effective temperatures considered here. For a sequencewith the H atmosphere characterized by a stellar mass of 1.267 M�,the total radius changes from 4.83 × 10⁻³ R� to 4.34 × 10⁻³ R�
Figure 12. Mass–radius relation for H- and He-atmosphere white dwarfmodels, represented as solid and dashed lines, respectively. From top to bot-tom, the lines represent effective temperatures of 150 000, 100 000, 50 000,25 000 and 10 000 K. See text for details.
when the star cools from 150 000 to 10 000 K. For a sequence witha mass of 1.064 M�, the radius decreases from 8.31 × 10⁻³ R�to 6.95 × 10⁻³ R� for the same range of effective temperatures.This means that there is a change in radius of ∼10 % for themore massive sequence and ∼16 % for the latter. These valueschange when sequences with a He atmosphere are considered. Fora He-atmosphere sequence with 1.267 M�, the radius change from4.74 × 10−3 R� to 4.32 × 10⁻³ R� (∼9 %), and for the 1.064 M�sequence, there is a change from 8.02 × 10⁻³ R� to 6.90 × 10⁻³
(∼14 %) when considering the same effective temperature range.Note that, although the contraction of H-atmosphere sequences areslightly higher, their final radii are higher compared to their He-atmosphere counterparts, showing that a small amount of hydrogenof the order of MH ≈ 10−6 MWD can change the radius by 5.4 × 10⁻⁵
R� (∼1 %) for an MWD = 1.064 M� sequence.The surface gravity log g as a function of effective tempera-
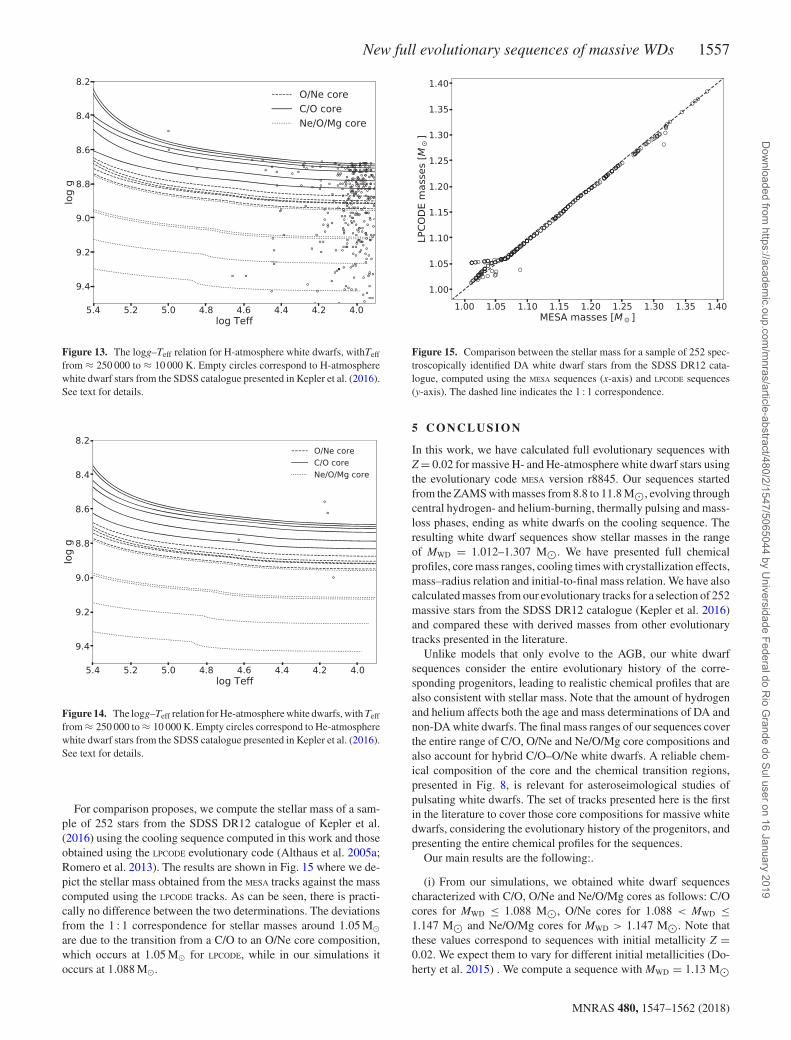
ture Teff for H- and He-atmosphere sequences are presented inFigs 13 and 14, respectively. The solid lines correspond to C/Ocore sequences while dashed and dotted lines correspond to O/Neand Ne/O/Mg core sequences, respectively. Stellar mass decreasesfrom top to bottom. Also plotted, as empty circles, are a selec-tion of white dwarfs with spectroscopic masses MWD > 1 M�from the SDSS Data Release (DR) 12 catalogue presented by Ke-pler et al. (2016). Surface gravities and effective temperatures forH-atmosphere white dwarfs are corrected to 3D convection (Trem-blay et al. 2013) and have mean values of 〈log g〉 = 8.987 ± 0.21and 〈Teff〉 = 11 591 ± 501. From Fig. 13, we find good agreementbetween observations and our theoretical cooling sequences withmasses MWD ≤ 1.151 M�. Comparing Figs 13 and 14, we cansee that the sequences are slightly shifted to smaller gravities, onaverage �log g = 0.0135, for lower effective temperatures due tocontraction, which reduced the radius by �R = 3.246 × 10⁻⁵ R�on average. The increase in log g at log Teff ∼ 4.8–4.9 presented inFigs 13 and 14 for the Ne/O/Mg sequences with MWD > 1.2 M�is due to the decrease in the neutrino luminosity, which causes areduction in the radius of the model. This behaviour agrees with theresults from Althaus et al. (2005b) who were the first to report thisphenomenon.
MNRAS 480, 1547–1562 (2018)
Dow
nloaded from https://academ
ic.oup.com/m
nras/article-abstract/480/2/1547/5065044 by Universidade Federal do R
io Grande do Sul user on 16 January 2019
New full evolutionary sequences of massive WDs 1557
Figure 13. The logg–Teff relation for H-atmosphere white dwarfs, withTeff
from ≈ 250 000 to ≈ 10 000 K. Empty circles correspond to H-atmospherewhite dwarf stars from the SDSS catalogue presented in Kepler et al. (2016).See text for details.
Figure 14. The logg–Teff relation for He-atmosphere white dwarfs, with Teff
from ≈ 250 000 to ≈ 10 000 K. Empty circles correspond to He-atmospherewhite dwarf stars from the SDSS catalogue presented in Kepler et al. (2016).See text for details.
For comparison proposes, we compute the stellar mass of a sam-ple of 252 stars from the SDSS DR12 catalogue of Kepler et al.(2016) using the cooling sequence computed in this work and thoseobtained using the LPCODE evolutionary code (Althaus et al. 2005a;Romero et al. 2013). The results are shown in Fig. 15 where we de-pict the stellar mass obtained from the MESA tracks against the masscomputed using the LPCODE tracks. As can be seen, there is practi-cally no difference between the two determinations. The deviationsfrom the 1 : 1 correspondence for stellar masses around 1.05 M�are due to the transition from a C/O to an O/Ne core composition,which occurs at 1.05 M� for LPCODE, while in our simulations itoccurs at 1.088 M�.
Figure 15. Comparison between the stellar mass for a sample of 252 spec-troscopically identified DA white dwarf stars from the SDSS DR12 cata-logue, computed using the MESA sequences (x-axis) and LPCODE sequences(y-axis). The dashed line indicates the 1 : 1 correspondence.
5 C O N C L U S I O N
In this work, we have calculated full evolutionary sequences withZ = 0.02 for massive H- and He-atmosphere white dwarf stars usingthe evolutionary code MESA version r8845. Our sequences startedfrom the ZAMS with masses from 8.8 to 11.8 M�, evolving throughcentral hydrogen- and helium-burning, thermally pulsing and mass-loss phases, ending as white dwarfs on the cooling sequence. Theresulting white dwarf sequences show stellar masses in the rangeof MWD = 1.012–1.307 M�. We have presented full chemicalprofiles, core mass ranges, cooling times with crystallization effects,mass–radius relation and initial-to-final mass relation. We have alsocalculated masses from our evolutionary tracks for a selection of 252massive stars from the SDSS DR12 catalogue (Kepler et al. 2016)and compared these with derived masses from other evolutionarytracks presented in the literature.
Unlike models that only evolve to the AGB, our white dwarfsequences consider the entire evolutionary history of the corre-sponding progenitors, leading to realistic chemical profiles that arealso consistent with stellar mass. Note that the amount of hydrogenand helium affects both the age and mass determinations of DA andnon-DA white dwarfs. The final mass ranges of our sequences coverthe entire range of C/O, O/Ne and Ne/O/Mg core compositions andalso account for hybrid C/O–O/Ne white dwarfs. A reliable chem-ical composition of the core and the chemical transition regions,presented in Fig. 8, is relevant for asteroseimological studies ofpulsating white dwarfs. The set of tracks presented here is the firstin the literature to cover those core compositions for massive whitedwarfs, considering the evolutionary history of the progenitors, andpresenting the entire chemical profiles for the sequences.
Our main results are the following:.
(i) From our simulations, we obtained white dwarf sequencescharacterized with C/O, O/Ne and Ne/O/Mg cores as follows: C/Ocores for MWD ≤ 1.088 M�, O/Ne cores for 1.088 < MWD ≤1.147 M� and Ne/O/Mg cores for MWD > 1.147 M�. Note thatthese values correspond to sequences with initial metallicity Z =0.02. We expect them to vary for different initial metallicities (Do-herty et al. 2015) . We compute a sequence with MWD = 1.13 M�
MNRAS 480, 1547–1562 (2018)
Dow
nloaded from https://academ
ic.oup.com/m
nras/article-abstract/480/2/1547/5065044 by Universidade Federal do R
io Grande do Sul user on 16 January 2019

1558 G. R. Lauffer, A. D. Romero and S. O. Kepler
and Z = 0.015 and we find that the chemical structure does notchange considerably from the sequence with Z = 0.02 and a similarstellar mass in the cooling curve.
(ii) All sequences with MWD ≥ 1.024 M� experience inwardpropagating carbon flames with subsequent helium-burning of theouter shells, in the post-AGB stage. The carbon flame for sequenceswith masses 1.024 ≤ MWD ≤ 1.147 M� does not reach the centralregions, forming a hybrid C/O–O/Ne white dwarf. For sequenceswith MWD > 1.147 M�, the carbon flame reaches the centre of themodel producing a Ne/O/Mg core. Our hybrid models present anO/Ne core surrounded by a triple layer of oxygen–carbon–helium,differing from the work of Denissenkov et al. (2013) who reporteda C/O core surrounded by an O/Ne zone for hybrid C/O/Ne super-AGB stars.
(iii) Our choice of the Coulomb coupling parameter for crystal-lization �full = 220, based on the latest asteroseismology results,instead of the MESA default � = 175, can increase the cooling timesby ≈0.26 Gyr and decrease the effective temperature at the onset ofcrystallization by ≈2000 K.
(iv) The amount of hydrogen left at the envelope of a whitedwarf has an important affect when determining the stellar mass andthe cooling times. Even low quantities of hydrogen, such as thoseexpected for massive white dwarfs, can affect the radii and cool-ing times. In particular, our H-atmosphere sequences show coolingtimes ∼0.23–0.66 Gyr larger at Teff ≈ 10 000 K, depending on stel-lar mass, when compared to He-atmosphere sequences with thesame mass.
(v) The derived masses for a selection of 252 massive stars fromthe SDSS DR12 catalogue (Kepler et al. 2016) using our simulationsare in good agreement with masses computed using the evolutionarytracks of LPCODE (Althaus et al. 2005a; Romero et al. 2012, 2013),except around masses MWD = 1.05–1.088 M�.
AC K N OW L E D G E M E N T S
We acknowledge the valuable report of the anonymous referee. GRLacknowledges support from CAPES-Brazil. ADR and SOK aregrateful for support from CNPq and PRONEX-FAPERGS/CNPq(Brazil). This research has made use of NASA’s Astrophysics DataSystem.
RE FERENCES
Ahn C. P. et al., 2014, ApJS, 211, 17Alastuey A., Jancovici B., 1978, ApJ, 226, 1034Althaus L. G., Serenelli A. M., Panei J. A., Corsico A. H., Garcıa-Berro E.,
Scoccola C. G., 2005a, A&A, 435, 631Althaus L. G., Garcıa-Berro E., Isern J., Corsico A. H., 2005b, A&A, 441,
689Althaus L. G., Garcıa-Berro E., Isern J., Corsico A. H., Rohrmann R. D.,
2007, A&A, 465, 249Althaus L. G., Panei J. A., Miller Bertolami M. M., Garcıa-Berro E., Corsico
A. H., Romero A. D., Kepler S. O., Rohrmann R. D., 2009, ApJ, 704,1605
Althaus L. G., Corsico A. H., Bischoff-Kim A., Romero A. D., Renedo I.,Garcıa-Berro E., Miller Bertolami M. M., 2010, ApJ, 717, 897
Althaus L. G., Miller Bertolami M. M., Corsico A. H., 2013, A&A, 557,A19
Bedin L. R., Salaris M., King I. R., Piotto G., Anderson J., Cassisi S., 2010,ApJ, 708, L32
Benvenuto O. G., Althaus L. G., 1999, MNRAS, 303, 30Bloecker T., 1995, A&A, 297, 727Brooks J., Bildsten L., Schwab J., Paxton B., 2016, ApJ, 821, 28
Brooks J., Schwab J., Bildsten L., Quataert E., Paxton B., 2017a, ApJ, 834,L9
Brooks J., Schwab J., Bildsten L., Quataert E., Paxton B., 2017b, ApJ, 843,151
Burgers J. M., 1969, Flow Equations for Composite Gases. Academic Press,New York
Camisassa M. E., Althaus L. G., Corsico A. H., Vinyoles N., Serenelli A.M., Isern J., Miller Bertolami M. M., Garcıa-Berro E., 2016, ApJ, 823,158
Camisassa M. E., Althaus L. G., Rohrmann R. D., Garcıa-Berro E., TorresS., Corsico A. H., Wachlin F. C., 2017, ApJ, 839, 11
Campos F. et al., 2016, MNRAS, 456, 3729Catalan S., Isern J., Garcıa-Berro E., Ribas I., 2008, MNRAS, 387, 1693Chen M. C., Herwig F., Denissenkov P. A., Paxton B., 2014, MNRAS, 440,
1274Choi J., Dotter A., Conroy C., Cantiello M., Paxton B., Johnson B. D., 2016,
ApJ, 823, 102Cox J. P., Giuli R. T., 1968, Principles of Stellar Structure. Gordon and
Breach, New YorkCyburt R. H. et al., 2010, ApJS, 189, 240Denissenkov P. A., Herwig F., Truran J. W., Paxton B., 2013, ApJ, 772, 37DeWitt H. E., Graboske H. C., Cooper M. S., 1973, ApJ, 181, 439Doherty C. L., Gil-Pons P., Siess L., Lattanzio J. C., Lau H. H. B., 2015,
MNRAS, 446, 2599Dotter A., 2016, ApJS, 222, 8Falcon R. E., Winget D. E., Montgomery M. H., Williams K. A., 2010, ApJ,
712, 585Farmer R., Fields C. E., Timmes F. X., 2015, ApJ, 807, 184Garcıa-Berro E., Isern J., Hernanz M., 1997a, MNRAS, 289, 973Garcıa-Berro E., Ritossa C., Iben I., Jr. 1997b, ApJ, 485, 765Garcıa-Berro E., Torres S., Althaus L. G., Miller Bertolami M. M., 2014,
A&A, 571, A56Gil-Pons P., Doherty C. L., Lau H., Campbell S. W., Suda T., Guilani S.,
Gutierrez J., Lattanzio J. C., 2013, A&A, 557, A106Graboske H., Dewitt H., Grossman A., Cooper M., 1973, ApJ, 181, 457Hansen B. M. S. et al., 2007, ApJ, 671, 380Henize K. G., 1976, ApJS, 30, 491Herwig F., 2000, A&A, 360, 952Horowitz C. J., Schneider A. S., Berry D. K., 2010, Phys. Rev. Lett., 104,
231101Hughto J., Horowitz C. J., Schneider A. S., Medin Z., Cumming A., Berry
D. K., 2012, Phys. Rev. E, 86, 066413Iben I. Jr. Kaler J. B., Truran J. W., Renzini A., 1983, ApJ, 264, 605Iglesias C. A., Rogers F. J., 1996, ApJ, 464, 943Isern J., Catalan S., Garcia-Berro E., Salaris M., Torres S., 2010, preprint
(arXiv:1010.5351)Istrate A. G., Tauris T. M., Langer N., Antoniadis J., 2014, A&A, 571, L3Istrate A. G., Marchant P., Tauris T. M., Langer N., Stancliffe R. J., Grassitelli
L., 2016, A&A, 595, A35Istrate A. G., Fontaine G., Heuser C., 2017, ApJ, 847, 130Itoh N., Totsuji H., Ichimaru S., Dewitt H., 1979, ApJ, 234, 1079Itoh N., Hayashi H., Nishikawa A., Kohyama Y., 1996, ApJS, 102, 411Jones S. et al., 2013, ApJ, 772, 150Kepler S. O., Romero A. D., 2017, European Physical Journal Web of
Conferences, 152, 01011Kepler S. O., Kleinman S. J., Nitta A., Koester D., Castanheira B. G.,
Giovannini O., Costa A. F. M., Althaus L., 2007, MNRAS, 375, 1315Kepler S. O. et al., 2015, MNRAS, 446, 4078Kepler S. O. et al., 2016, MNRAS, 455, 3413Kippenhahn R., Ruschenplatt G., Thomas H.-C., 1980, A&A, 91, 175Kleinman S. J. et al., 2013, ApJS, 204, 5Langer N., 2012, ARA&A, 50, 107Langer N., Fricke K. J., Sugimoto D., 1983, A&A, 126, 207Liebert J., Bergeron P., Holberg J. B., 2005, ApJS, 156, 47McGraw J. T., Starrfield S. G., Liebert J., Green R., 1979, in van Horn H. M.,
Weidemann V., Savedoff M. P., eds, Proc. IAU Colloq. Vol. 53, WhiteDwarfs and Variable Degenerate Stars. Kluwer, Dordrecht, p. 377
Nalezyty M., Madej J., 2004, A&A, 420, 507
MNRAS 480, 1547–1562 (2018)
Dow
nloaded from https://academ
ic.oup.com/m
nras/article-abstract/480/2/1547/5065044 by Universidade Federal do R
io Grande do Sul user on 16 January 2019
New full evolutionary sequences of massive WDs 1559
Paxton B., Bildsten L., Dotter A., Herwig F., Lesaffre P., Timmes F., 2011,ApJS, 192, 3
Paxton B. et al., 2013, ApJS, 208, 4Paxton B. et al., 2015, ApJS, 220, 15Paxton B. et al., 2018, ApJS, 234, 34Pignatari M. et al., 2016, ApJS, 225, 24Poelarends A. J. T., Herwig F., Langer N., Heger A., 2008, ApJ, 675, 614Potekhin A. Y., Chabrier G., 2010, Contributions to Plasma Physics, 50, 82Prada Moroni P. G., Straniero O., 2002, ApJ, 581, 585Rebassa-Mansergas A., Rybicka M., Liu X-W., Han Z., Garcıa-Berro E.,
2015, MNRAS, 452, 1637Reimers D., 1975, Memoires of the Societe Royale des Sciences de Liege,
8, 369Reindl N., Rauch T., Parthasarathy M., Werner K., Kruk J. W., Hamann
W.-R., Sander A., Todt H., 2014, A&A, 565, A40Ritter C., Herwig F., Jones S., Pignatari M., Fryer C., Hirschi R., 2018,
MNRAS, preprint (arXiv:1709.08677)Rogers F. J., Nayfonov A., 2002, ApJ, 576, 1064Romero A. D., Corsico A. H., Althaus L. G., Kepler S. O., Castanheira B.
G., Miller Bertolami M. M., 2012, MNRAS, 420, 1462Romero A. D., Kepler S. O., Corsico A. H., Althaus L. G., Fraga L., 2013,
ApJ, 779, 58Salaris M., Garcıa-Berro E., Hernanz M., Isern J., Saumon D., 2000, ApJ,
544, 1036Salaris M., Althaus L. G., Garcıa-Berro E., 2013, A&A, 555, A96Saumon D., Chabrier G., van Horn H. M., 1995, ApJS, 99, 713Schaefer B. E., Edwards Z. I., 2015, ApJ, 812, 133Schneider A. S., Hughto J., Horowitz C. J., Berry D. K., 2012, Phys. Rev.
E, 85, 066405Schoenberner D., 1979, A&A, 79, 108Schwab J., Bildsten L., Quataert E., 2017, MNRAS, 472, 3390
Segretain L., Chabrier G., Hernanz M., Garcia-Berro E., Isern J.,Mochkovitch R., 1994, ApJ, 434, 641
Siess L., 2006, A&A, 448, 717Siess L., 2007, A&A, 476, 893Siess L., 2010, A&A, 512, A10Sun M., Arras P., 2018, ApJ, 858, 14Thoul A. A., Bahcall J. N., Loeb A., 1994, ApJ, 421, 828Timmes F. X., Swesty F. D., 2000, ApJS, 126, 501Tremblay P.-E., Ludwig H.-G., Steffen M., Freytag B., 2013, A&A, 559,
A104Ulrich R. K., 1972, ApJ, 172, 165van Horn H. M., 1968, ApJ, 151, 227Van Horn H. M., 1969, Phys. Lett. A, 28, 706Vassiliadis E., Wood P. R., 1993, ApJ, 413, 641Wang B., Podsiadlowski P., Han Z., 2017, MNRAS, 472, 1593Winget D. E., Hansen C. J., Liebert J., van Horn H. M., Fontaine G., Nather
R. E., Kepler S. O., Lamb D. Q., 1987, ApJ, 315, L77Winget D. E., Kepler S. O., Kanaan A., Montgomery M. H., Giovannini O.,
1997, ApJ, 487, L191Woosley S. E., Heger A., 2015, ApJ, 810, 34
APPENDI X: CHEMI CAL PROFI LES AT TH EE N D O F TH E C O O L I N G SE QU E N C E
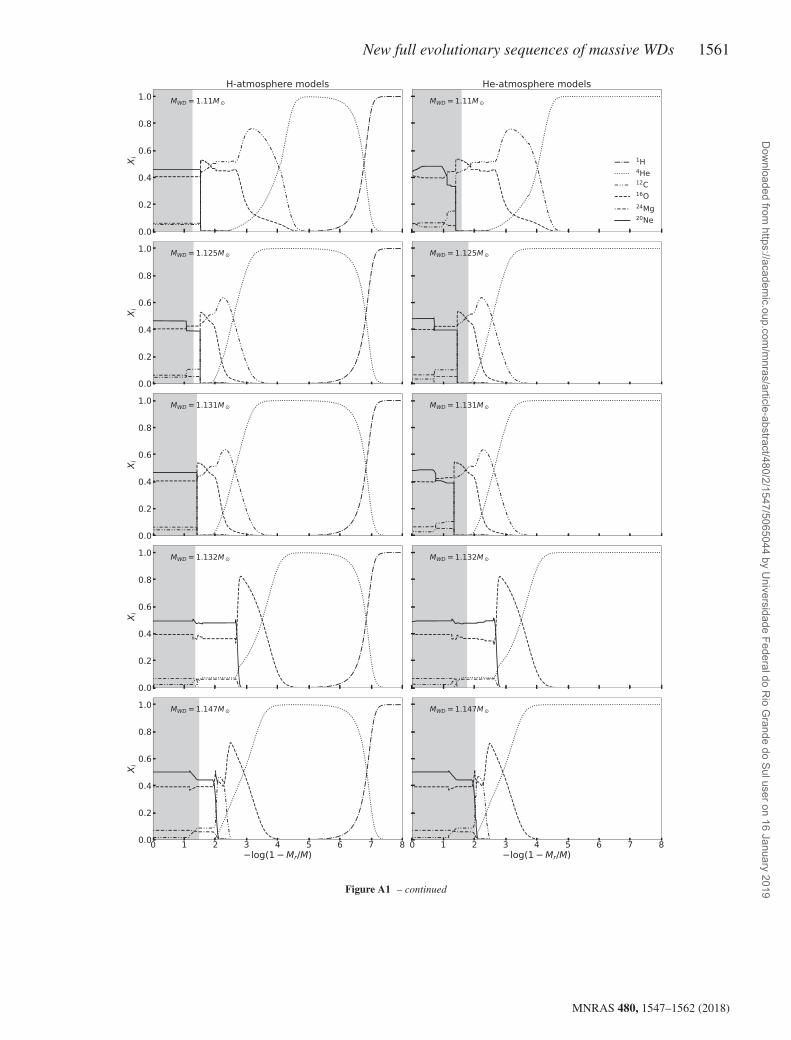
Here, we present the chemical profiles of all our models for H-and He-atmosphere white dwarfs. Fig. A1 shows the chemical pro-files for H and He atmospheres (left and right columns, respec-tively) . Each row presents H- and He-atmosphere models for thesame mass. All chemical profiles presented in this section are forTeff ≈ 10 000 K.
MNRAS 480, 1547–1562 (2018)
Dow
nloaded from https://academ
ic.oup.com/m
nras/article-abstract/480/2/1547/5065044 by Universidade Federal do R
io Grande do Sul user on 16 January 2019
1560 G. R. Lauffer, A. D. Romero and S. O. Kepler
Figure A1. Chemical profiles in terms of outer mass fractions for H-atmosphere (left) and He-atmosphere (right) models at Teff ≈ 10 000 K in the coolingsequence. The shaded regions denote the crystallized portion of the core. Each row presents H (left) and He (right) atmospheres for the same mass.
MNRAS 480, 1547–1562 (2018)
Dow
nloaded from https://academ
ic.oup.com/m
nras/article-abstract/480/2/1547/5065044 by Universidade Federal do R
io Grande do Sul user on 16 January 2019
New full evolutionary sequences of massive WDs 1561
Figure A1 – continued
MNRAS 480, 1547–1562 (2018)
Dow
nloaded from https://academ
ic.oup.com/m
nras/article-abstract/480/2/1547/5065044 by Universidade Federal do R
io Grande do Sul user on 16 January 2019

1562 G. R. Lauffer, A. D. Romero and S. O. Kepler
Figure A1 – continued
This paper has been typeset from a TEX/LATEX file prepared by the author.
MNRAS 480, 1547–1562 (2018)
Dow
nloaded from https://academ
ic.oup.com/m
nras/article-abstract/480/2/1547/5065044 by Universidade Federal do R
io Grande do Sul user on 16 January 2019