Embed Size (px)
Citation preview

New Features and Many Improvements to Analyze
Morphology and Color of Digitalized Plant Organs Are
Available in Tomato Analyzer 3.0
Gustavo Rodriguez, David Francis, and Esther van der KnaapDepartment of Horticulture and Crop Science, The Ohio State University/ Ohio Agricultural Research and
Development Center, Wooster, Ohio 44691
AND
Jaymie Strecker, Itai Njanji, Josh Thomas, and Atticus JackDepartment of Mathematics and Computer Science, The College of Wooster, Wooster,
Ohio 44691
Abstract
Tomato Analyzer measures morphological and colorattributes via image analysis in an objective, high-throughput, and semiautomatic manner. This softwareallows for reproducible quantification of phenotypic datathat previously were done by hand or visual analysis. Thenew version has improved the accuracy of allmeasurements and reduced the need to make time-consuming manual adjustments. In this paper newmorphological and color attributes available in TomatoAnalyzer 3.0 as well as how the color test module wasmade more user-friendly are described.
Introduction
The species in the plant kingdom are characterized by agreat diversity in color, shapes and size displayed inorgans such as leaves, flowers, and fruits. Even within aparticular species the individuals also can be distinguishedby the morphology and color displayed in those organs.Biologists trying to understand the genetic and molecularbasis for this variation need to measure morphological andcolor attributes in an objective and reproducible way. Mostof this type of phenotypic analysis consists of time-consuming manual measurements or subjective visualscoring of characteristics that reduce the success ofidentifying genomic regions or physiological causesunderlying this variation.Tomato Analyzer (TA) is a software program designed tocollect objective data from digital images obtained fromplant organs (Brewer et al, 2006). Many of these data arenearly impossible to quantify manually, such as angles atthe distal and proximal ends of the organs or the variationfor color in their surfaces. Briefly, the software recognizesthe objects (fruits, leaves or seed) in digitalized images and
from the detected boundaries in each object is able toobtain more than 35 morphological attributes. The pixelsinside the boundaries recognized by the software are usedto translate color data from the RGB system into theL*a*b* universal color space which is able to approximatehuman visual perception (Darrigues et al, 2008). Moreover,TA combines controlled vocabulary consistent with termspresent in trait ontology databases and mathematicaldescriptors for each shape and color attribute. Even thoughthe application was specifically developed to analyzetomato fruit, this software can be applied to analyze fruit ofother species and other plant organs such as seeds, flowers,and leaves.This paper describes how morphological and color analysisof plant organs can be precisely done using TomatoAnalyzer. Lastly, some possible applications of Color Testin Tomato Analyzer 3.0 are discussed.
1. Morphological Analysis of Plant Organs UsingTomato Analyzer
Tomato Analyzer can do a high-throughput analysis ofmorphological traits in images obtained from plant organs.Moreover, the data obtained are unbiased compared tothose manually measured by different researchers or usingdifferent instruments. This impartiality allows thereproducibility of the experiments as well as thecompilation and analysis of data obtained fromexperiments conducted in several environments and years.To date, most of the morphological classifications in plantswere made based on eyeball observations. Instead,attributes of TA can be used to objectively classify plantorgans into various morphological categories.Tomato Analyzer 2.0 has been a valuable and effective toolto indentify and confirm genomic regions that controltomato fruit shape as well as performing in-depth analysesof the effect of key fruit shape genes on plant morphology.
It was possible due to color of tomato fruits are contrastingenough with a black background used in the scannedimages. However, the software was unable to detect otherdarker fruits or leaves.
1.1 Workflow for Morphological Analysis
Scan plant organs against a black background toeliminate shadows.
Open the image in TA, select the attributes tomeasure, tell TA to analyze the image.
TA separates objects from background. It does this bylooking at a histogram of luminance for the image andfinding the separation point (area of low histogramvalues) between the foreground (lighter colors) andthe background (darker colors). It then findscontiguous areas of foreground pixels (the objects)and calculates the boundaries around them.
Resulting data appears in a spreadsheet panel in TA(screenshot) and can be exported as .csv file.
Some measurements can be manually adjusted.
1.2 New Features and Attributes for MorphologicalAnalysis in Tomato Analyzer 3.0
1.2.1 Reading TIFF images
The previous version of Tomato Analyzer read only JPEG(.jpg) files but this new version can open both JPEG (.jpg)and TIFF (.tif) files. TIFF files are recommended becausethey preserve the image as it was originally scanned. JPEGimages alter some of the colors in the image, reducing theaccuracy of object boundary detection and color analysis.For example, this new feature has improved the boundarydetection in dark green leaves and cucumber fruits. Thisimproves the accuracy of all measurements and reducesthe need to make time-consuming manual adjustments.
1.2.2 Length, width and fruit shape index attributes incurved fruits.
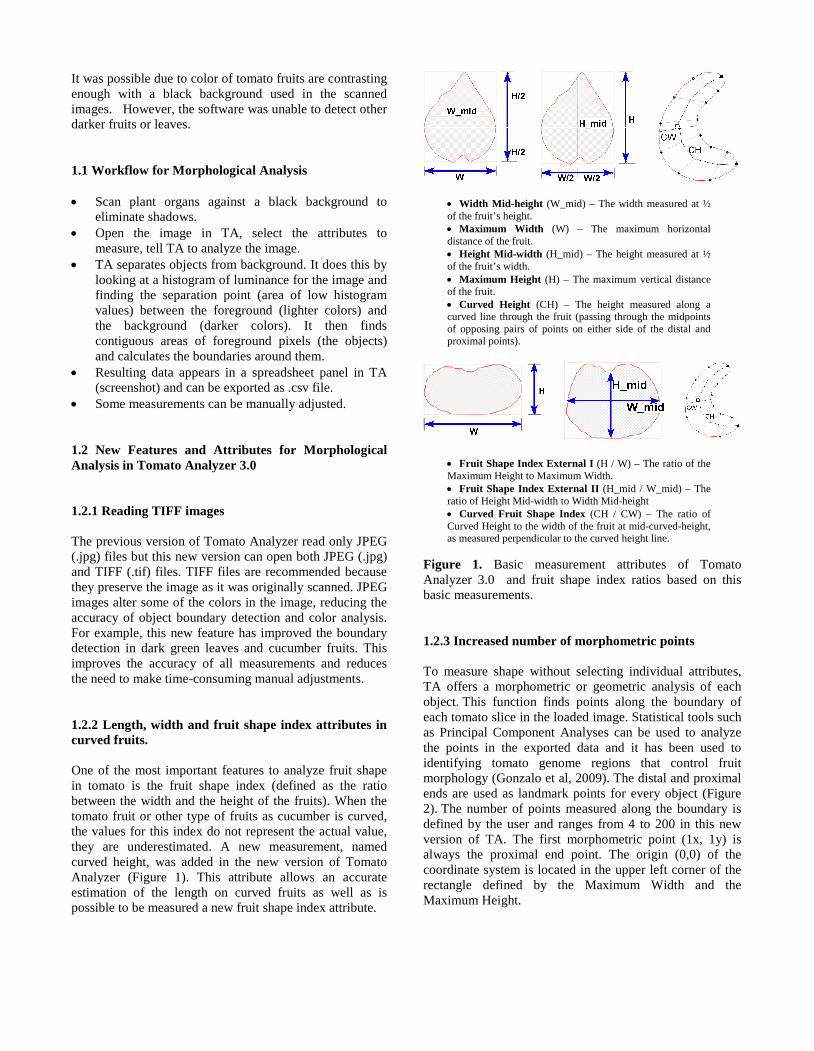
One of the most important features to analyze fruit shapein tomato is the fruit shape index (defined as the ratiobetween the width and the height of the fruits). When thetomato fruit or other type of fruits as cucumber is curved,the values for this index do not represent the actual value,they are underestimated. A new measurement, namedcurved height, was added in the new version of TomatoAnalyzer (Figure 1). This attribute allows an accurateestimation of the length on curved fruits as well as ispossible to be measured a new fruit shape index attribute.
Width Mid-height (W_mid) – The width measured at ½of the fruit’s height. Maximum Width (W) – The maximum horizontaldistance of the fruit. Height Mid-width (H_mid) – The height measured at ½of the fruit’s width. Maximum Height (H) – The maximum vertical distanceof the fruit. Curved Height (CH) – The height measured along acurved line through the fruit (passing through the midpointsof opposing pairs of points on either side of the distal andproximal points).
Fruit Shape Index External I (H / W) – The ratio of theMaximum Height to Maximum Width. Fruit Shape Index External II (H_mid / W_mid) – Theratio of Height Mid-width to Width Mid-height Curved Fruit Shape Index (CH / CW) – The ratio ofCurved Height to the width of the fruit at mid-curved-height,as measured perpendicular to the curved height line.
Figure 1. Basic measurement attributes of TomatoAnalyzer 3.0 and fruit shape index ratios based on thisbasic measurements.
1.2.3 Increased number of morphometric points
To measure shape without selecting individual attributes,TA offers a morphometric or geometric analysis of eachobject. This function finds points along the boundary ofeach tomato slice in the loaded image. Statistical tools suchas Principal Component Analyses can be used to analyzethe points in the exported data and it has been used toidentifying tomato genome regions that control fruitmorphology (Gonzalo et al, 2009). The distal and proximalends are used as landmark points for every object (Figure2). The number of points measured along the boundary isdefined by the user and ranges from 4 to 200 in this newversion of TA. The first morphometric point (1x, 1y) isalways the proximal end point. The origin (0,0) of thecoordinate system is located in the upper left corner of therectangle defined by the Maximum Width and theMaximum Height.

Figure 2. The morphometric points are a fixed number ofpoints along the perimeter.
2. Color Analysis of Plant Organs Using TomatoAnalyzer
Color is an important quality attribute in horticultural andfloricultural crops defined by particular genes. However,color changes in plant organs also are indicators of bioticor abiotic stresses. The genetic bases for color attributes aswell as factors affecting plant health would be betterunderstood if computer-based analysis of digital images isapplied instead of their subjective characterization. TheColor Test module in Tomato Analyzer (TACT) is able ofcollecting and analyzing color parameters in an efficient,accurate and high-throughput manner from scannedimages that contain plant organs. However, the scannerneeds to be calibrated if the user intends to translate RGBvalues to L*, a* and b* parameters. This is becausescanners may change in accuracy and how they capture thecolor scheme over time. Moreover, scanners differ in howwell they capture color information.
2.1 Workflow for Color Analysis
Scan a color checker. Open the image in TA andperform a color calibration.
Scan objects and open the image in TA, as you wouldfor morphological analysis.
Select the color attributes to measure, and tell TA toperform color analysis.
Resulting data appears in the spreadsheet panel, as inmorphological analysis.
2.2 New Features and Attributes for Color Analysis inTomato Analyzer 3.0
2.2.1 Color Attributes Visualized in real time
The most important improvement related to the color testmodule in this new version of TA is that the results are
shown in the real time on the screen shot of the software(Figure 3). In the previous version, the results only couldbe visualized in .csv files after the analysis was done.
Figure 3. Screenshot of the Tomato Analyzer Test ColorModule. This new version shows the color results in realtime (right-down window).
2.2.2. A More User-friendly Test Color Modulecalibration
The user should chose a color checker with a black or verydark background based on the broad range of colorsobserved in the object of interest (Figure 4). Color checkerscan be purchased custom made or standard.
Figure 4. Standard color checker from X-rite (GrandRapids, MI) and actual L*, a*, b* values for each tile of thecolor checker are shown in the table.
After the color checker was scanned should be opened andanalyzed in TA. The software recognizes each tile as an

object. Then, the user needs to enter the actual L*,a*,b*values for each tile in the color checker, as provided by themanufacturer (Figure 4). TA uses the actual and observedL*, a*, and b* values to calculate the linear regression.After that, the color module is calibrated.
2.2.3 Three Methods to Analyze Color with TomatoAnalyzer 3.0
Average color values. The values displayed are:Average Red, Average Green, Average Blue, AverageLuminosity, Average L* Value, Average a* Value,Average b* Value, Average Hue, Average Chroma.These average values are calculated taking account allpixel within the object.
L*, hue, chroma distributions. These measurementsprovide histogram data for L*, hue, and chroma. Thedata appear in the tabs called L* Distributions, HueDistributions, and Chroma Distributions, respectively.Each column shows the fraction of the object whosecolor falls within a certain range. For example, if theL[40..50) column in L* Distributions has the value0.3, then 30% of the fruit has L* between 40(inclusive) and 50 (exclusive).
Set custom color parameters. Based on the L*, hue,chroma distributions, the user can define customranges of L*, hue, chroma, or a combination of thethree. The User-Defined Color Ranges dialog appearsas shown in Figure 5. The user can define up to 6combinations of color ranges. In the example inFigure 5, Parameter 1 includes all colors where thehue is between 30 (inclusive) and 45 (exclusive); L*and chroma may be anything. Parameter 2 includes allcolors where the L* is between 0 and 30 and the hue isbetween 0 and 90; the chroma may be anything. Thedata will appear in the data window tab called CustomColor Parameters.
Figure 5. Set Custom Color parameters dialog box
2.3. Possible Applications Color Test Module of TomatoAnalyzer 3.0
The Color Test module in Tomato Analyzer 3.0 is able todefine the average for several color attributes inside theboundaries of a plant organ as well as the proportion of sixdifferent user-defined color parameters. This new featurecan be useful to study pattern of color variation in someplant organ such as petals or leaves. In the plants, soilnutritional deficiencies, pesticides toxicities and even theseverity of pathogen attacks affect the color pattern onsome plant organ. For example, it has been demonstratedthat the estimation of severity in a specific corn disease ishighly affected by the rater experience when they directlyestimate percentage of diseased leaf area and even morewhen they use a 0 to 9 ordinal rate scale (Poland andNelson 2011). With TACT you can define a color range forthe diseased portion and calculate the percentage of the leafhaving that color. Thus, different researchers will getexactly the same results because they won’t be interpretingthe colors or the ratings differently. Therefore, TomatoAnalyzer software would become in a powerful tool forthis type of studies.
Acknowledgments
This project was funded by the National ScienceFoundation DBI 0227541 to Esther van der Knaap
References
Brewer M.T.; Lang L.; Fujimura K.; Dujmovic N.; Gray,S.; and van der Knaap E. 2006. Development of acontrolled vocabulary and software application to analyzefruit shape variation in tomato and other plant species.Plant Physiology 141 (1): 15-25.
Darrigues A.; Hall J.; van der Knaap E.; and Francis D.M.2008. Tomato analyzer-color test: A new tool for efficientdigital phenotyping. Journal of the American Society forHorticultural Science 133 (4): 579-586.
Gonzalo M.J.; Brewer M.T.; Anderson C.; Sullivan D.;Gray S.; and van der Knaap E. 2009. Tomato fruit shapeanalysis using morphometric and morphology attributesimplemented in tomato analyzer software program. Journalof the American Society for Horticultural Science 134 (1):77-87.Poland J.A. and Nelson R.J. 2011. In the Eye of theBeholder: The Effect of Rater Variability and DifferentRating Scales on QTL Mapping. Phytopathology 101 (2):290-298.