Embed Size (px)
Citation preview

NEW EVIDENCE ON CLASSROOM COMPUTERSAND PUPIL LEARNING*
Joshua Angrist and Victor Lavy
How technology affects learning has been at the centre of recent debates over educational inputs.In 1994, the Israeli State Lottery sponsored the installation of computers in many elementary andmiddle schools. This programme provides an opportunity to estimate the impact of computeri-sation on both the instructional use of computers and pupil achievement. Results from a survey ofIsraeli school-teachers show that the influx of new computers increased teachers’ use of com-puter-aided instruction (CAI). Although many of the estimates are imprecise, CAI does notappear to have had educational benefits that translated into higher test scores.
That small miracle can be replicated in every school, rich and poor, across America ... Everychild in American deserves a chance to participate in the information revolution.
President Clinton, at the East Somerville Community School, 5 June 1998.
We could do so much to make education available 24 hours a day, seven days a week, thatpeople could literally have a whole different attitude toward learning.
Newt Gingrich talking to the Republican National Committee, quoted inOppenheimer (1997).
Netanyahu explained to a group of politicians and computer professionals how he wanted toprovide a quarter-million of his country’s toddlers with interconnected computers.
Recounted by MIT computer scientist Michael Dertouzos, September 1998.
Politicians, educators, parents and researchers have long looked to technology toimprove schools. One of the earliest advocates for technology in the classroom wasThomas Edison, who predicted in 1922 that motion pictures would revolutioniseeducation and ‘be an epoch in the common school’ (Israel, 1998, p. 442). Edisonhimself funded educational films, though he also complained about lack ofteacher interest and high production costs. In the 1950s, psychologist B. F. Skinnerpublished a series of papers predicting that ‘teaching machines’ would makelearning dramatically more efficient (Skinner, 1954, 1958). Skinner’s writing re-flects a modern-sounding emphasis on ‘the constant interchange between pro-gramme and student’ and the value of ‘home instruction’. Recent years have seenrenewed and even more intense interest in classroom computer use, includinginterest in the use of computers in schools in less-developed countries; see, forexample, Anandakirichnan (1988).
The educational use of computers generally falls under two broad heading:computer skills training (CST), which teaches students how to use computers; andcomputer-aided instruction (CAI), which ‘uses computers to teach things that may ormay not have any relation to technology’ (President’s Committee of Advisors onScience and Technology, 1997). CST is essentially vocational, and includes key-
* We thank Rema Hanna, David Matsa and Analia Schlosser for outstanding research assistance, andthe staff in the Chief Scientist’s Office, the Evaluation Division and the Information Systems Division ofthe Israeli Ministry of Education for help with data. Thanks also go to the editor, four referees, LexBorghans, Jeff Kling, Alan Krueger, Bas van ter Weel and seminar participants at Berkeley, MIT, SOLE,and the ASSA meetings for helpful discussions and comments.
The Economic Journal, 112 (October), 735–765. � Royal Economic Society 2002. Published by BlackwellPublishers, 108 Cowley Road, Oxford OX4 1JF, UK and 350 Main Street, Malden, MA 02148, USA.
[ 735 ]

boarding skills, instruction in the use of word processing, database management,the use of spreadsheets and other software tools, and the study of computerprogramming.
Basic familiarity with CST skills seems undeniably useful, just as typing was a usefulskill taught in American high schools earlier in the twentieth century, but most of therecent interest in the educational use of computers focuses on CAI and not CST. Thisfocus is reflected in the report of the President’s Committee of Advisors on Scienceand Technology Panel on Education Technology, in Apple Computer’s ‘Classroomsof Tomorrow’ project (Baker et al., 1993), and in the growing interest in ‘distancelearning’ in schools and universities. In contrast with the apparent consensus re-garding the value of at least some level of computer literacy, the role of CAI remainscontroversial. Skinner’s claims notwithstanding, the theoretical case for CAI is notwell developed, and there are good reasons to believe that computers can actually bea diversion. One widely cited proponent of this negative view is Stoll (1995), whocompared computers to the children’s television programme Sesame Street, arguingthat ‘Both give you the sensation that merely by watching a screen, you can acquireinformation without work and discipline’ (p. 147).1
The question of CAI effectiveness is of more than academic interest since CAIinfrastructure is expensive and may take resources from other educational uses.2
Perhaps the most important shortcoming in the case for further investment in CAIinfrastructure is the fact that the evidence for effectiveness is both limited andmixed. Although CAI has been around for decades, there are few empirical studiesthat meet a rigorous methodological standard. Many studies are qualitative,gathering impressions from participants in demonstration projects, or quantitativebut with no real comparison group. The results of those studies that do attempt tocompare outcomes between CAI-trained pupils and other pupils are hard to assess.A recent review by Kirkpatrick and Cuban (1998) catalogues both individualstudies and meta-analyses that find wide-ranging effects.3
In this paper, we provide new evidence on the educational consequences of CAI.Our study exploits an episode in Israel that facilitates controlled comparisons. In1994, the Israeli State lottery, which uses lottery profits to sponsor various socialprogrammes, funded a large-scale computerisation effort in many elementary andmiddle schools. By June 1996, about 10% of the country’s elementary school pupilsand about 45% of the country’s middle schools pupils had received new computersas a consequence.4 We begin the empirical analysis by using this episode to
1 Oppenheimer (1997) surveys critical assessments. See also Cuban (1986).2 In 1998, for example, Massachusetts schools bought 40,000 computers, and the State Department of
Education encouraged schools to replace one-quarter of them annually at a cost of $250–400 per pupil(Seltz, 1999). Oppenheimer (1997) identifies some school districts where expenditure on computersappears to be crowding out expenditure on music, art and traditional shop programmes.
3 Economists have looked at CAI in their own discipline. An early reference on CAI in economicsteaching is Booms and Kaltreider (1974). Porter and Riley (1992) argue that CAI has not been shown tobe effective in economics. A recent study by Wenglinsky (1998) using nationally representative samplesfinds both positive and negative effects. For other examples and surveys, see Knight et al. (1981), Kulikand Kulik (1991), Liao (1992) and Cuban (1986, 1993).
4 Much of the software used in the programme was from the Center for Educational Technology (CET), aprivate company that accounts for most of the educational software market in Israel. The CET sellseducational software in the US and Europe though a number of well-known foreign partners.
736 [ O C T O B E RT H E E C O N O M I C J O U R N A L
� Royal Economic Society 2002

estimate the effect of the new technology on both teachers’ use of CAI and theirpupils’ test scores. Following this ‘reduced form’ estimation of programmeimpacts, we put the pieces together with two-stage least squares (2SLS).
A variety of unique data sources facilitate our analysis of computers in schools,and allow us to estimate the effects of CAI using a number of statistical methods. Inaddition to ordinary least squares (OLS) estimates of the effect of CAI, we use adummy for programme receipt as an instrument for CAI intensity, and we developa non-linear instrumental variables estimator that exploits information about ap-plicants’ priority ranking for programme funding as determined by local author-ities. These methods show that the influx of new computers in 1994 and 1995 ledto a substantial increase in the use of CAI in elementary schools, with smallereffects on usage in middle schools. There is no evidence, however, that increasededucational use of computers actually raised pupil test scores. OLS estimates showno relationship between CAI and achievement except for a negative effect on 8thgrade Maths scores in models with town effects; and the instrument validity (IV)results show a (marginally) statistically significant decline in the test scores in4th grade Maths classes, where the new computers had the largest impact oninstructional techniques.
1. Data and Background
1.1. The Tomorrow-98 Programme
Many Israeli schools have long had some sort of computer equipment for in-structional use, but the Tomorrow-98 programme (in Hebrew, ‘Mahar’) allowedfor a significant upgrade. The main focus of this programme was on the ‘com-puterisation of the education system’, accomplished by ‘creating a supportiveenvironment that can integrate information technologies in a range of activitieswithin the school’, ‘training teachers to integrate computers in teaching’, and‘equipping schools with hardware and software, and replacing outdated incom-patible equipment’ (Israel Ministry of Education, Culture and Sport, 1994, p. 36).The programme included significant funding for teacher training as well ashardware and software. Between 1994 and 1996, the first three years of the pro-gramme, 35,000 computers were installed in 905 schools. In 1994, 474 schoolsreceived computers and training. In 1995, schools received 16,000 computersthrough the programme. In 1996, more computers were installed and 2100 pri-mary-school Maths teachers received training in CAI (Israel Ministry of Education,Culture and Sport, 1996). The target student-computer ratio was 10:1, to beachieved by 1998, the fifth and final year of the programme. Most of the fundingcame from the Israeli State Lottery, with additional money from the Ministry ofEducation and local authorities.
Funds for Tomorrow-98 were distributed through an application process. Indi-vidual towns and regional authorities applied for funds by submitting a list ofelementary and middle schools to be computerised, ranked according tothe municipalities’ assessment of the schools ability to make good use of thecomputers. This generally meant the schools had some sort of pre-existing
2002] 737N E W E V I D E N C E O N C L A S S R O O M C O M P U T E R S
� Royal Economic Society 2002

computer infrastructure and some ‘need’ and ‘ability’ to make use of the com-puters. The Ministry of Education used a set of guidelines to distribute the projectmoney to schools in towns that applied. Priority was given to towns with a highproportion of 7th and 8th grade enrolment in stand-alone middle schools (asopposed to combined 1–8 schools). After high-priority municipalities received anallocation for their middle schools in a 1:10 computer:pupil ratio, equipment wasdistributed down the municipalities priority list. In this process, each town receivedmoney to computerise their elementary and 1–8 schools in a 1:10 ratio up to aceiling. The ceiling was determined by town 1–8 enrolment as a proportion ofnational 1–8 enrolment. The first computers were delivered in September 1994.5
1.2. Data
The main data source for this study is a test given to pupils attending a randomsample of elementary and middle schools in June 1996. Schools from differentsectors (Arab/Jewish) and types (religious/secular) were sampled, but we lookonly at Jewish schools (including religious and secular schools). The total numberof Jewish schools sampled was about 200, but only 122 of these applied forTomorrow-98 programme money. The test was designed and conducted by theNational Institute for Testing and Evaluation (NITE), which runs college admis-sions testing in Israel.
Test score data were collected as follows: in each sampled school with at leastone 4th grade class (ie an elementary school or a 1–8 school), one class was chosento take a test in Maths and one class was chosen to take a test in Hebrew. Similarly,in schools with 8th grade classes, one class was chosen to be tested in Maths andone class was chosen to be tested in Hebrew. Schools having both 4th and 8thgrades (1–8 schools) contribute test scores for both grades. If there were morethan two classes in a grade, two classes were chosen for testing at random, with thesubject assignment also randomised. The pupil data consist of individual recordswith either a Maths or Hebrew score, and pupil demographic data from schoolrecords. The demographic data include age, sex, immigrant status and special-education status. The tests are grade-normed achievement tests, with scores mea-sured here as percentage right.
The NITE data on test scores are combined with data from a brief survey (alsodesigned by NITE) given to all the teachers of each sampled class. The teachers’survey and pupil testing were done at the same time. Because each 4th or 8th gradeclass is potentially taught by a number of teachers for a range of subjects (Maths,Hebrew, Science, Bible), we attempted to identify the principal Maths and Hebrewteacher for each class. Our analysis file uses data on these teachers only; that is, ouranalysis of Maths scores includes information for a teacher we identified as themain Maths teacher for the class.
5 In 1998, there were roughly 2,000 primary and 500 middle schools in Israel, of which 36% receivedprogramme computers. Most of the computers were installed in a special classroom or computer lab.Classes used the lab, according to a schedule, that allowed for both CST and CAI.
738 [ O C T O B E RT H E E C O N O M I C J O U R N A L
� Royal Economic Society 2002

The teachers’ survey collected information about how teachers teach, includingtheir use of technology in the classroom, and their views on a variety of issuesrelated to technology, teacher training, and instructional methods. Data on CAIwere collected in the following question:
Which of the following do you use when teaching?
a. Xeroxed worksheetsb. Instructional bookletsc. Gamesd. Computer software or instructional computer programmese. TV programmesf. Other audio-visual materials
Teachers responded to each item using a 4-point scale or intensity ranking:
Not at all (0)Sometimes (1)Frequently (2)Almost always (3)
The response to item (d) is our measure of their level of computer use, ie the CAIintensity. In addition to these survey Tresponses, we asked the Ministry of Edu-cation to collect data on teacher demographic characteristics in a follow-up surveyin Spring 1997.
The third component of our data base consists of information on Tomorrow-98implementation schedules and computer infrastructure in schools collected forthe purposes of our evaluation. In 1998, the Ministry of Education obtained in-formation from the contractors who installed the Tomorrow computers, withverification and additional information collected from school principals. This in-formation includes the date of receipt of new equipment the extent and type ofpre-1994 computer resources, and information about non-programme computersreceived between 1994 and 1996. Pre-existing computers are described as either‘sophisticated’ (IBM XT or better), or ‘non-sophisticated’ (Commodore-type ma-chines). Schools may have had no computers, non-sophisticated machines, or bothtypes.
The fourth component of our data base contains information about schools in1996 and 1991. The 1996 data come from Ministry of Education files, and includesthe Israeli pupil disadvantaged (PD) index and school size. The PD index is animportant summary statistic used to categorise schools and to make school fundingdecisions in Israel. The 1991 school-level data come from the data set used in theAngrist and Lavy (1999) study of class size. This data set provides information onlagged test scores. In the analysis of 4th grade scores, we use the 1991 schoolaverage Maths and Hebrew scores in 4th grade to control for possible differencesin performance across schools. In the analysis of 8th grade scores, we use a lessdirect control for lagged scores since we have no early information on 8th gradescores. For 1–8 schools, the 8th grade lagged scores are those of 4th and 5thgraders in these same schools in 1991. For each 7–9 school, the lagged scores arethe averages of the 1991 4th and 5th grade scores from the elementary schools that
2002] 739N E W E V I D E N C E O N C L A S S R O O M C O M P U T E R S
� Royal Economic Society 2002
feed that school. A Data Appendix describes the procedures used to match thevarious data sources in greater detail.
2. Descriptive Statistics and OLS Estimates
2.1. Descriptive Statistics
Descriptive statistics are reported in Table 1 for three samples, for each combi-nation of grade and subject. The first sample for 4th grade Maths scores consists of4,779 pupils in 181 schools. This is the full sample of Jewish 4th graders for whomwe have 1996 Maths scores. The second sample is limited to pupils in schools thatapplied for Tomorrow funds, and includes 3,271 pupils in 122 schools. The thirdsample is the subset of the applicant sample for which we were able to obtain 1991score data. This includes 2,891 pupils in 107 schools. The three samples for othergrades and subjects are organised similarly.
The average 4th grade test score ranges from 67–69 with a standard deviation ofaround 20. The average 8th grade test score ranges from 57–66, also with a stand-ard deviation around 20. There is little evidence of differences in test scores acrosssubsamples in any grade/subject category. Other variables described in the tableinclude an indicator for any use of CAI, and the computer-use ranking (CAIintensity), with a mean of around 0.8 for 4th graders and 0.4 for eight graders. Thisranking is the main regressor of interest. The next line in the table shows the meanproportion of applicants that received Tomorrow programme funding. This pro-portion is 0.14–0.17 for 4th graders and around 0.5 for 8th graders. The differenceby grades reflects the higher priority given to programme funding for middleschools. Descriptive statistics for control variables and lagged test scores are alsoshown in the table. The PD index is measured on a standardised scale.
In addition to being more likely to receive programme funding, 8th graders alsohad the use of programme computers for longer: an average of 13 months versusabout 9 months for 4th graders. Still, on average, 4th graders had the use ofcomputers for a full school year as of the test date in 1996. It is also noteworthy thatalmost half of 4th grade and almost two-thirds of 8th grade pupils had access tosome sort of computer technology before the Tomorrow programme.
Pupils in schools that use computers for instruction differ in a variety of waysfrom those that have little or no usage. This can be seen in Table 2, which reportsvariable means by computer-use intensity and Tomorrow programme status.6 Forboth grades, pupils in schools with more intense use of CAI tend to be fromsomewhat more disadvantaged backgrounds, though these differences are not allsignificant. This may reflect a general tendency in the Israeli school system todirect resources and programmes to schools on a remedial basis (Lavy, 1995).Among 4th graders, heavier computer users are also more likely to have had some(relatively) sophisticated computer equipment before 1994. Eighth graders testedin Maths were less likely to have had sophisticated computers but more likely to
6 The standard errors for differences in means in Table 2 and the regression estimates in Tables 3–6are corrected for school-level clustering using equation (1) in Moulton (1986).
740 [ O C T O B E RT H E E C O N O M I C J O U R N A L
� Royal Economic Society 2002

Table 1
Descriptive Statistics
4th grade 8th grade
Maths Hebrew Maths Hebrew
Fullsample Applicants
Applicantswith
laggedscores
Fullsample Applicants
Applicantswith
laggedscores
Fullsample Applicants
Applicantswith
laggedscores
Fullsample Applicants
Applicantswith
laggedscores
Variables (1) (2) (3) (4) (5) (6) (7) (8) (9) (10) (11) (12)
Test scores 69.0 68.2 68.1 68.0 67.3 67.2 57.6 57.1 57.5 65.1 65.5 64.8(19.9) (20.2) (20.1) (19.8) (20.2) (20.2) (20.0) (19.9) (20.0) (19.1) (18.9) (19.2)
Any computer 0.494 0.556 0.534 0.402 0.422 0.408 0.283 0.300 0.286 0.242 0.264 0.306use (CAI � 1) (0.500) (0.497) (0.499) (0.490) (0.494) (0.352) (0.450) (0.459) (0.452) (0.428) (0.441) (0.461)
CAI intensity 0.851 0.929 0.898 0.775 0.837 0.791 0.437 0.440 0.413 0.424 0.456 0.539(0.970) (0.941) (0.950) (1.03) (1.08) (1.05) (0.769) (0.743) (0.728) (0.834) (0.848) (0.906)
Tomorrow-98 0.115 0.168 0.181 0.092 0.139 0.145 0.445 0.523 0.501 0.448 0.530 0.495(T-98) (0.319) (0.374) (0.385) (0.290) (0.346) (0.352) (0.497) (0.500) (0.500) (0.497) (0.499) (0.500)
Months with T-98 – 9.36 9.57 – 8.87 9.16 – 12.7 13.1 – 12.5 12.9– (6.95) (6.68) – (6.68) (6.84) – (4.56) (4.48) – (4.50) (4.29)
Female 0.498 0.502 0.503 0.521 0.536 0.537 0.521 0.533 0.567 0.535 0.544 0.547(0.500) (0.500) (0.500) (0.499) (0.499) (0.499) (0.499) (0.499) (0.496) (0.498) (0.498) (0.498)
Immigrant 0.056 0.063 0.062 0.054 0.063 0.063 – – – 0.044 0.038 0.042(0.231) (0.242) (0.240) (0.227) (0.242) (0.244) – – – (0.207) (0.192) (0.200)
PD index �0.007 0.084 0.103 �0.062 0.010 0.016 0.073 0.067 0.060 0.060 0.034 0.031(0.558) (0.569) (0.582) (0.514) (0.543) (0.553) (0.638) (0.673) (0.663) (0.633) (0.654) (0.662)
Special education 0.131 0.135 0.140 0.128 0.135 0.140 – – – 0.091 0.091 0.096(0.337) (0.342) (0.347) (0.334) (0.342) (0.347) – – – (0.287) (0.289) (0.294)
Average verbal – – 71.5 – – 72.8 – – 70.8 – – 71.2scores in 1991 – – (7.79) – – (7.19) – – (6.81) – – (6.57)
Average Maths – – 67.5 – – 68.9 – – 67.6 – – 68.2scores in 1991 – – (8.28) – – (8.18) – – (6.94) – – (6.64)
Early computers 0.443 0.446 0.469 0.440 0.453 0.476 0.602 0.612 0.633 0.590 0.601 0.615(sophisticated) (0.496) (0.497) (0.499) (0.496) (0.498) (0.500) (0.489) (0.487) (0.482) (0.491) (0.490) (0.487)
2002]
741N
EW
EV
ID
EN
CE
ON
CL
AS
SR
OO
MC
OM
PU
TE
RS
�R
oyal
Eco
no
mic
Society
2002

Table 1
(Continued)
4th grade 8th grade
Maths Hebrew Maths Hebrew
Full Applicants
Applicantswith
laggedscores Full Applicants
Applicantswith
laggedscores Full Applicants
Applicantswith
laggedscores Full Applicants
Applicantswith
laggedscores
Variables (1) (2) (3) (4) (5) (6) (7) (8) (9) (10) (11) (12)
Early computers 0.078 0.097 0.110 0.077 0.092 0.104 0.057 0.048 0.038 0.054 0.037 0.022(simple) (0.268) (0.296) (0.313) (0.267) (0.289) (0.305) (0.232) (0.214) (0.192) (0.226) (0.190) (0.145)
N 4,779 3,271 2,891 3,689 2,464 2,194 3,196 2,620 2,145 3,182 2,593 2,135
Notes: The test scores are reported as percentage right. The computer-use intensity ranking ¼ 0 if teacher never uses computer, ¼ 1 if sometimes, ¼ 2 if often, ¼ 3 ifalways. T-98 ¼ 1 if the school received computers through the T-98 project. Months with T-98 is reported for those schools that participated in the Tomorrowproject. PD index (mean zero, standard deviation ¼ 1) is a weighted average of parental schooling, family size, family income, percentage immigrant students,distance of school from a large urban area (a larger index is worse). Standard deviations are reported in parentheses.
742[
OC
TO
BE
RT
HE
EC
ON
OM
IC
JO
UR
NA
L
�R
oyal
Eco
no
mic
Society
2002

Table 2
Differences by Computer Use (CAI ‡ 1) and Tomorrow-98 (T-98) Programme Status
4th grade 8th grade
Maths Hebrew Maths Hebrew
MeanDif.by
CAI � 1Dif. byT-98 Mean
Dif.byCAI � 1
Dif. byT-98 Mean
Dif.byCAI � 1
Dif. byT-98 Mean
Dif.byCAI � 1
Dif. byT-98
Variables (1) (2) (3) (4) (5) (6) (7) (8) (9) (10) (11) (12)
A. All ApplicantsAny computeruse 0.556 – 0.240 0.422 – 0.451 0.300 – 0.003 0.264 – 0.020
(CAI ‡ 1) (0.497) – (0.122) (0.494) – (0.139) (0.459) – (0.090) (0.441) – (0.097)0.929 – 0.558 0.837 – 0.708 0.440 – �0.090 0.456 – �0.023
CAI intensity (0.941) – (0.225) (1.08) – (0.318) (0.743) – (0.142) (0.848) – (0.184)Female 0.502 �0.027 0.056 0.536 0.078 0.047 0.533 �0.076 �0.046 0.544 0.008 0.061
(0.500) (0.039) (0.050) (0.499) (0.039) (0.057) (0.499) (0.055) (0.053) (0.498) (0.063) (0.054)Immigrant 0.063 0.005 �0.012 0.063 0.002 0.019 – – – 0.038 �0.014 �0.004
(0.242) (0.012) (0.017) (0.242) (0.014) (0.020) – – – (0.192) (0.012) (0.012)PD 0.084 0.112 0.150 0.010 0.297 0.358 0.067 0.262 �0.389 0.034 0.138 �0.203
index (0.569) (0.102) (0.133) (0.543) (0.107) (0.156) (0.673) (0.135) (0.121) (0.654) (0.178) (0.140)Special education 0.135 0.031 �0.001 0.135 �0.017 0.040 – – – 0.092 �0.018 �0.035
(0.342) (0.016) (0.022) (0.342) (0.021) (0.030) – – – (0.289) (0.021) (0.019)Early comp/ 0.446 0.157 0.115 0.453 0.295 0.180 0.612 �0.246 0.211 0.601 �0.007 0.222sophisticated (0.497) (0.090) (0.121) (0.498) (0.104) (0.150) (0.487) (0.097) (0.094) (0.490) (0.106) (0.101)
Early comp/simple 0.097 0.010 �0.051 0.092 0.032 �0.025 0.048 0.064 �0.012 0.037 �0.013 �0.042(0.296) (0.055) (0.061) (0.289) (0.065) (0.091) (0.214) (0.043) (0.038) (0.190) (0.040) (0.040)
N 3,271 2,464 2,620 2,593
B. Applicants with lagged scoresVerbal scores 1991 71.5 �1.78 0.367 72.8 �1.34 �1.6 70.8 �0.213 3.53 71.2 1.40 2.10
(7.79) (1.48) (1.93) (7.19) (1.51) (2.16) (6.82) (1.59) (1.40) (6.57) (1.58) (1.50)Maths scores 1991 67.5 �1.46 �0.260 68.9 �1.46 �2.10 67.6 2.08 2.10 68.2 2.01 1.30
(8.28) (1.59) (2.08) (8.18) (1.81) (2.51) (6.94) 1.59() (1.46) (6.64) (1.64) (1.54)
2002]
743N
EW
EV
ID
EN
CE
ON
CL
AS
SR
OO
MC
OM
PU
TE
RS
�R
oyal
Eco
no
mic
Society
2002

Table 2
(Continued)
4th grade 8th grade
Maths Hebrew Maths Hebrew
MeanDif.by
CAI � 1Dif. byT-98 Mean
Dif.byCAI � 1
Dif. byT-98 Mean
Dif.byCAI � 1
Dif. byT-98 Mean
Dif.byCAI � 1
Dif. byT-98
Variables (1) (2) (3) (4) (5) (6) (7) (8) (9) (10) (11) (12)
N 2,891 2,194 2,145 2,135
Notes: See notes to Table 1 for variable definitions. The columns labelled ‘Dif. by CAI � 1’ show differences in covariate means by whether computers are used at allfor instruction. The columns labelled ‘Def. by T-98’ show differences in covariate means by whether Tomorrow-98 computers were received. Standard deviations arereported in parentheses for levels. Standard errors are reported in parentheses for differences. The standard errors are corrected for school-level clustering.
744[
OC
TO
BE
RT
HE
EC
ON
OM
IC
JO
UR
NA
L
�R
oyal
Eco
no
mic
Society
2002

have had unsophisticated computers. There is no relationship between the pres-ence of previous computer equipment and computer use for 8th graders tested inHebrew. This may be because 8th grade schools were already relatively well-equiped, though it should also be noted that the ‘previous computers’ measuresare retrospective reports by principals that may not be very accurate. Lagged testscore differences by CAI status are not significant.
Since our primary identification strategy uses Tomorrow-98 as a source of exo-genous variation in computer use, differences by Tomorrow-98 programme statusare more important for our purposes than differences by computer-use. Fourthgrade programme participants are more likely to be disadvantaged, but this dif-ference is significant only for schools tested in Hebrew. Moreover, this is reversedfor 8th graders. These relationships are broadly consistent with features of theselection process for Tomorrow-98 funding. Among 8th graders, middle schoolsreceived priority over 1–8 schools; in Israel, these schools tend to be located inbetter areas. Among 4th graders, some preference was given to schools with ahigher proportion of disadvantaged students. In any case, it is clear that control forpupil background and school type may be important when attempting to estimatethe effect of the programme. Another noteworthy difference is an increasedlikelihood of having pre-programme access to relatively sophisticated computersamong programme participants, both in 4th and 8th grade.
Among 4th graders, there is little evidence of a difference in 1991 test scores byTomorrow-98 programme status while, for 8th graders, the differences are positiveand somewhat larger. Except for the scores of 8th graders tested in Maths, how-ever, none of the contrasts in lagged scores by programme status is significant. Thesimilarity of lagged test scores between programme and non-programme groupsincreases the likelihood that post-treatment differences in test scores are actuallycaused by Tomorrow-98.
2.2. CAI and Test Scores
The estimation framework is based on a regression model, which is meant tocapture the causal effect of computer use for those whose usage was affected by theTomorrow programme. For the ith student in school s, we assume that potentialtest scores with alternative levels of CAI are given by
yis ¼ W0sc þ X0
ib þ cjsa þ gs þ eis ð1Þ
where yis is the test score for pupil i in school s, Ws is a vector of schoolcharacteristics and Xi is a vector of pupil characteristics. The regressor of interest,cjs , is either a dummy indicating whether the level of computer-use is greater thanor equal to j (j ¼ 1, 2, 3), or the CAI intensity itself, which we denote cs . The CAIintensity is coded from our teacher survey. Since all pupils tested in the samesubject and grade have the same teacher, in practice cjs and cs vary only with s. Theother school characteristics, Ws , include the proportion of disadvantaged pupils inthe school and the school’s priority ranking in the Tomorrow-98 allocationprocess. The pupil characteristics, Xi , include sex and immigrant status. The error
2002] 745N E W E V I D E N C E O N C L A S S R O O M C O M P U T E R S
� Royal Economic Society 2002

term gs is an identically and independently distributed (iid) random school effectthat is introduced to parameterise within-school correlation in scores. Theremaining error component, eis, is specific to pupils. The coefficient, a, is theparameter of primary interest. The empirical analysis uses test scores in standarddeviation units, so the estimates of a have an ‘effect size’ interpretation.
Fourth graders in schools where teachers report using more CAI have slightlyhigher Maths scores, but there is less evidence of an association between CAI and4th grade Hebrew scores. This can be seen in Table 3, which reports OLS estimatesof the relationship between CAI intensity and test scores for applicants, forapplicants with test score data, and for a sample of pupils in large towns. This lastsample is used to control for town fixed effects and includes any pupil (whether ornot their school applied for Tomorrow funds) living in a town with at least two
Table 3
OLS Estimates of the Effect of CAI Intensity
Maths Hebrew
Applicants
Applicantswith
laggedscores
Town fixedeffects: fullsample withlagged score Applicants
Applicantswith
laggedscores
Town fixedeffects: fullsample withlagged score
Grade Regressor (1) (2) (3) (4) (5) (6)
4th CAI � 1 0.045(0.068)
0.069(0.072)
�0.005(0.056)
�0.012(0.063)
�0.018(0.067)
0.031(0.056)
CAI � 2 0.105(0.072)
0.080(0.076)
�0.010(0.074)
�0.008(0.066)
�0.0004(0.068)
0.003(0.059)
CAI � 3 0.194(0.174)
0.193(0.168)
0.187(0.137)
�0.142(0.100)
�0.126(0.109)
�0.077(0.285)
CAIintensity
0.047(0.035)
0.047(0.038)
0.007(0.034)
�0.016(0.028)
�0.007(0.031)
0.009(0.030)
N 3,271 2,891 2,947 2,464 2,194 2,237
8th CAI � 1 0.037(0.092)
�0.055(0.100)
�0.267(0.138)
0.72(0.073)
�0.017(0.073)
�0.063(0.062)
CAI � 2 0.168(0.133)
0.176(0.147)
�0.111(0.182)
0.037(0.094)
�0.008(0.086)
�0.064(0.077)
CAI � 3 �0.396(0.356)
�0.873(0.338)
�0.715(0.254)
0.205(0.163)
0.203(0.149)
0.281(0.143)
CAIintensity
0.039(0.059)
�0.0014(0.064)
�0.136(0.070)
0.038(0.039)
0.006(0.037)
�0.014(0.032)
N 2,621 2,145 1,883 2,593 2,135 1,910
Other included controlsPre-existingcomputers
X X X X X X
Basic controls X X X X X X1991 test scores X X X XTown effects X XT-98 town rank X X X X
Notes: Row entries are for separate models, each with the covariates listed. Basic controls: female,immigrant, special education, PD index, total school enrolment. Models for 8th graders also includecontrols for school types (grades1–8, 7–9). For 4th graders, lagged test scores are the school average ofscores for 4th grades in 1991. For 8th graders, lagged scores are the average of 4th and 5th grade scoresin 1991 for the elementary schools that feed these middle schools. The samples used for Columns 3 and6 include all pupils in towns with at least two schools and with data on lagged test scores. Standard errorsare reported in parentheses. The standard errors are corrected for school-level clustering.
746 [ O C T O B E RT H E E C O N O M I C J O U R N A L
� Royal Economic Society 2002

schools.7 Each row in Table 3 shows results from a different regression, accordingto whether the regressor of interest is a dummy variable or the intensity rankingitself. For example, 4th grade applicants with CAI�1 (some use of CAI) have scores0.045 above those with no use of CAI, while the model with an ordinal regressorshows that a one unit increase in CAI intensity is associated with 0.047 higherscores. However, the positive effects for 4th grade Maths scores are not statisticallysignificant in the applicant samples, and control for town effects reduces the CAIeffects for 4th graders essentially to zero.
OLS results for 8th graders in the two applicant samples show little evidence of arelationship between CAI intensity and test scores in either subject. In the town-effects sample for 8th grade Maths scores, however, there are marginally significantnegative score effects for two out of three dummies and using the ordinal ranking.Except for the Hebrew scores of 4th graders, Table 3 also shows a pattern of decliningeffects as the models included larger sets of controls, ie progressing from a specifi-cation for applicants, to applicants with lagged test scores, to control for town effects.This suggests that part of the positive association in Column 1 is due to omittedvariables that are positively associated with test scores and computer use. Forexample, since private fund-raising for public school activities is common in Israel,schools in more prosperous neighbourhoods probably have greater access toparental resources to fund education technology. This possibility motivates the 2SLSestimation strategy discussed in the next Section. The 2SLS estimates exploitTomorrow-98 programme status as a source of exogenous variation in CAI intensity.
3. Instrumental-variables Estimates
3.1. Reduced-form Programme Effects
We begin with a reduced-form analysis of programme impacts since this does notrequire commitment to a particular endogenous variable capturing all possiblechannels for the impact of CAI intensity. The first four columns of Table 4 reportthe relationship between CAI intensity and the Tomorrow-98 programme. CAIintensity is measured using a series of dummies for levels of the ordinal rankingand with the ranking variable itself. Estimates are reported for models with andwithout control for lagged scores, and the same covariates as in Table 3. All of theestimates show that 4th grade pupils in schools that received funding from theTomorrow programme were more likely to be exposed to CAI when studying bothMaths and Hebrew than pupils in schools that did not receive funding. Theestimates for Maths show a shift at all levels of intensity while those for Hebrewshow a shift only from ‘no use’ to ‘some use’ of CAI (ie an effect on CAI�1 or c1s).8
Of course, these shifts may reflect pre-programme differences, but controls for the
7 Estimates for 4th graders control for sex, immigrant status, special education status, school enrol-ment, the PD index, whether schools had simple or sophisticated computers before 1994, and theschool priority ranking in the Tomorrow-98 allocation process. Estimates for 8th grade Hebrew scoresinclude these controls plus dummies for school type. Estimates for 8th grade Maths scores omit controlsfor immigrant and special education status. Towns with only one school are dropped from the samplewhen town effects are included.
8 The effect in Column 4 is the sum of the effects in Columns 1–3.
2002] 747N E W E V I D E N C E O N C L A S S R O O M C O M P U T E R S
� Royal Economic Society 2002

presence of computers in the school before the programme should mitigate pre-programme differences. In contrast with the results for 4th graders, programmefunding had relatively little effect on 8th grade teaching methods in either subject.The difference in programme impact on CAI across grades is consistent with thefact that CAI is less widely used in upper grades.9
In addition to estimating programme effects on CAI intensity, we used theteachers’ survey to explore the relationship between programme status and otheraspects of the school environment. In particular, we used (1) to estimate the effectof programme status on class size, subject coverage, hours of instruction, frequencyof teacher training, use of non-computer audio-visual or TV equipment, andteacher satisfaction with the level of training and class size. None of these variableswere related to programme status, so the Tomorrow-98 programme appears tohave increased the use of CAI in 4th grade, without otherwise changing the ob-served school environment.
The reduced form estimates of programme effects on test scores are reported inColumn 5 of Table 4. For 4th graders, there is a substantial and at least marginallysignificant negative relationship between Tomorrow programme status and testscores, with pupils in the Tomorrow group scoring 0.2–0.25 standard deviationslower than other pupils. Fourth grade Hebrew scores and 8th grade Maths scoresare also lower in the programme group; these differences are not significant.Eighth-grade Hebrew scores are slightly higher for programme participants,
Table 4
Reduced-Form Programme Effects
CAI indicatorsCAI
CAI � 1 CAI � 2 CAI � 3 intensity ScoreGrade Subject Controls (1) (2) (3) (4) (5)
4th Maths Basic controls 0.234(0.121)
0.282(0.116)
0.083(0.044)
0.599(0.224)
�0.204(0.089)
With laggedscore
0.228(0.120)
0.252(0.115)
0.083(0.049)
0.563(0.227)
�0.241(0.088)
Hebrew Basic controls 0.335(0.134)
0.116(0.136)
�0.005(0.094)
0.446(0.310)
�0.052(0.088)
With laggedscore
0.285(0.131)
0.052(0.134)
0.015(0.087)
0.352(0.291)
�0.079(0.088)
8th Maths Basic controls 0.118(0.098)
0.015(0.069)
�0.014(0.022)
0.118(0.152)
�0.080(0.095)
With laggedscore
0.104(0.103)
0.001(0.069)
�0.018(0.022)
0.087(0.157)
�0.051(0.096)
Hebrew Basic controls 0.043(0.102)
�0.068(0.082)
0.071(0.043)
0.046(0.400)
0.055(0.072)
With laggedscore
0.080(0.111)
�0.056(0.097)
0.101(0.053)
0.125(0.224)
0.070(0.072)
Notes: All models include the same covariates as the models reported in Columns 1 and 2 of Table 3.The standard errors are corrected for school-level clustering.
9 Rotin (1999) also concludes that the Tomorrow-98 programme had an impact on the prevalence ofCAI, though he does not present separate estimates for elementary and middle school grades.
748 [ O C T O B E RT H E E C O N O M I C J O U R N A L
� Royal Economic Society 2002

though here too the difference is not significant. Thus, while there is clear evi-dence that computers funded by Tomorrow-98 led to an increase in CAI at least in4th grade, there is no evidence that this translated into higher test scores. The onlystatistically significant test score difference is the negative effect on 4th gradeMaths scores, and two out of three of the other groups show negative effects.10
3.2. 2SLS
The reduced-form effects on test scores capture programme impacts without spe-cifying the specific channel whereby new computers affect scores. It is also of interest,though, to scale these reduced-form effects into the effects of an increase in CAI. Forthe purposes of 2SLS estimation, we focus on models treating the ordinal rankingvariable as the single endogenous regressor of interest. One reason for focusing onthe ranking is that it seems most natural to think of Tomorrow-98 programme awardstatus (T s) as providing a single instrument for cs . Models with more than oneendogenous regressor (ie multiple intensity dummies) would require more than oneinstrument.11 Moreover, in spite of the fact that cs is ordinal, conventional 2SLSestimates of the effect of cs using a single binary instrument can be interpreted asestimating the average effect of a unit increase in the intensity ranking for those whoseintensity was increased by the programme (Angrist and Imbens, 1995, Theorem 1).This interpretation is most straightforward if different teachers interpret the CAIscale similarly, and if the increase in intensity of computer use is constant along thescale.
A second technical point motivating the 2SLS specification is that the reduced-form estimates show the programme shifted the CAI intensity distribution at morethan one point in the distribution. This implies that 2SLS estimates replacing cs
with a single dummy variable for, say, any computer use (c1s), will be ‘too big’ inthe sense that they over-estimate the causal effect of interest (Angrist and Imbens,1995, p. 436). These considerations, discussed in greater detail in the Appendix,lead us to treat cs as the endogenous variable in a 2SLS set-up.
We report 2SLS results for the 4th grade sample only. 2SLS results for 8thgraders are omitted since there is no significant reduced-form effect in the 8thgrade sample. The sign of the 2SLS estimates is necessarily the same as the sign ofthe reduced-form estimate in Table 4; the only change from the reduced form is are-scaling. The first-stage equation for this procedure is
cs ¼ W0sp1 þ X0
ip2 þ T sp0 þ nis ð2Þ
where p0 is the first-stage effect. Estimates of p0 in this equation were reported inColumn 4 of Table 4 (the standard errors in Table 4 allow for school-level
10 Similar results are obtained when the dummy for Tomorrow-98 is replaced with a variable meas-uring the number of months Tomorrow-98 computers were in schools. The absence of a significantreduced effect on 8th grade scores can be seen as a specification check since there are no first-stageeffects on CAI intensity for 8th graders.
11 We also briefly explore specifications using dummies for months of programme exposure asmultiple instruments. In practice, this approach is not powerful enough to identify the effects ofmultiple dummies.
2002] 749N E W E V I D E N C E O N C L A S S R O O M C O M P U T E R S
� Royal Economic Society 2002

clustering in nis). The list of control variables is the same as for the OLS andreduced-form estimates reported in Tables 3 and 4. Results from models with theTomorrow-98 priority ranking are reported in odd-numbered columns.
The results of 2SLS estimation using samples of all applicants and samples ofthose with lagged test scores, reported in Columns 1–4 of Table 5, suggest thatincreasing the CAI intensity by one unit reduces the Maths test scores of 4thgraders by about 0.3 or 0.4 standard deviations. Not surprisingly, given the re-duced-form results, only the Maths estimates are significant.12 The negative effectsfor 4th grade Hebrew scores are of the order of 0.25 standard deviations. Impor-tantly, the contrast between even- and odd-numbered columns shows that the 2SLSresults are not sensitive to control for towns’ priority ranking in the Tomorrow-98allocation process.
Table 5 also reports the results of three simple checks on the basic 2SLS spe-cification. First, the estimates in Columns 5 and 6 use samples composed entirelyof pupils in schools that received Tomorrow-98 funding and for whom we havedata on 1991 scores. As before, the instrument in this case is a dummy indicatingwhether the pupil is in a school that received funding before June 1996; but herethe comparison group consists solely of pupils who received Tomorrow-98 com-puters after June 1996 (and before the end of December 1997, the last date wehave information for). This strategy controls for the possibility that Tomorrow-98winners differ in some unobserved way from Tomorrow-98 losers, thereby biasing2SLS estimates of programme effects. In fact, results using the ‘T-98/will-get-T-98’sample are remarkably similar to those in the full sample.
Second, Columns 7 and 8 report the results of adding controls for the instruc-tional use of computers (as opposed to possession of hardware) by 4th graders in1991. This school-level variable provides an additional control for pre-existingdifferences between programme winners and losers. The data on lagged computeruse come from the same source as lagged test scores. Only a subset of schools havethis information, which consists of the school average of indicators for whetherteachers in the relevant grade in the school used computers for instruction.Control for lagged computer use has little effect on the estimates of the impact ofcomputer use on 4th grade test scores.
Finally, Columns 9 and 10 of Table 5 report the results of replacing a single T-98dummy with dummies indicating the number of months T-98 computers wereused (the number of dummies depends on the subject and grade). The idea hereis that the more time a school had access to the Tomorrow-98 computers, the moreof an impact should be expected on CAI intensity and test scores. Moreover, if theinstruments satisfy the exclusion restriction motivating 2SLS estimation, thisspecification should generate estimates similar to, but more precise than thosegenerated by the basic single-dummy specification. Results using month dummiesas instruments are considerably more precise than estimates using a single dummy,
12 The t-statistics for 2SLS estimates are lower than the corresponding t-statistics for the reduced-formeffects because the 2SLS residuals are more highly correlated within schools than are the reduced-formresiduals.
750 [ O C T O B E RT H E E C O N O M I C J O U R N A L
� Royal Economic Society 2002

Table 5
2SLS Estimates of the Effects of CAI Intensity for 4th Graders
ApplicantsApplicants withlagged scores
T-98/ will-get-T-98with lagged scores
Control for laggedcomputer use
Use dummyinstruments
(1) (2) (3) (4) (5) (6) (7) (8) (9) (10)
A: MathsCAI intensityOver-id test(df)
�0.340(0.214)
�0.341(0.212)
�0.427(0.252)
�0.435(0.245)
�0.417(0.251)
�0.427(0.251)
�0.309(0.187)
�0.317(0.184)
�0.236(0.106)8.8(12)
�0.244(0.106)8.8(12)
N 3,271 2,891 2,035 2,430 2,891
B: HebrewCAI intensityOver-id test(df)
�0.116(0.208)
�0.134(0.194)
�0.224(0.307)
�0.265(0.279)
�0.208(0.214)
�0.284(0.255)
�0.064(0.168)
�0.079(0.139)
�0.104(0.086)15.2(9)
�0.128(0.085)14.7(9)
N 2,464 2,194 1,496 1,823 2,194
Other included controlsPre-existing computers X X X X X X X X X XBasic controls X X X X X X X X X X1991 test scores X X X X X X X XComputer usage in 1991 X X XT-98 town Rank X X X X X
Notes: The endogeneous regressor is the 0–3 CAI intensity ranking. The basic controls and lagged test score controls are as defined in Table 3. The samples inColumns 5 and 6 are limited to pupils in schools that received T-98 funding, including those that received funding after the June 1996 test date (as of 1998). Theinstrument used for all columns except 9 and 10 is a T-98 programme dummy. The instruments in Columns 9 and 10 are dummies for months of programmeoperation. Standard errors are reported in parentheses. The standard errors are corrected for school-level clustering.
2002]
751N
EW
EV
ID
EN
CE
ON
CL
AS
SR
OO
MC
OM
PU
TE
RS
�R
oyal
Eco
no
mic
Society
2002

though somewhat smaller than results from the basic specification. The differencesin estimates across models is not statistically significant, however.
3.3. Assessing Instrument Validity
The Tomorrow-98 instrument arises from a funding process that involved anumber of bureaucratic guidelines and idiosyncratic elements. As we noted earlier,the most important factor determining resource allocation was town ranking ofschools, modified to some extent by central government intervention in caseswhere Ministry of Education officials felt local assessments were biased by politicalconsiderations. A second consideration was grade structure and school organisa-tion, with priority given to those towns having more stand-alone middle schools.Although these factors were certainly not randomly assigned, Table 2 shows littleevidence for a systematic association between Tomorrow-98 award status and eitherpupil characteristics or schools’ average test scores in 1991, three years before theprogramme. This supports a causal interpretation of the IV estimates.
Important additional evidence for instrument validity comes from the pattern of2SLS results. If computers were especially likely to have been awarded to low-achieving schools, we might have expected lower test scores in award schools for allsubjects and grades. The results instead show a significant negative association onlyfor the grade/subject combination where Tomorrow-98 awards were associatedwith a change in computer use. Thus, the first- and second-stage estimates areconsistent with a causal chain linking programme computers to changes in com-puter use and, ultimately, to changes in achievement. Of course, it is impossible toprove that the 2SLS estimates have the interpretation we would like. As a furtherspecification check, we therefore turn to a modified 2SLS strategy that exploits theTomorrow-98 allocation mechanism directly. This strategy is robust to some of thesources of omitted variables bias that may affect the estimates in Table 5.
3.4. Nonlinear Instrumental Variables
The 2SLS estimates discussed above may be biased if schools that received To-morrow-98 computers differ in some way from those that did not, even aftercontrolling for observed covariates. As a further check on the previous results, weexplored an instrumental variables strategy related to the regression-discontinuitymethod used recently by Angrist and Lavy (1999) to estimate the effects of classsize on test scores. This method exploits the fact that, within towns, priority forTomorrow-98 funding was determined largely on the basis of the towns’ ranking ofapplicant schools. Although there is no sharp discontinuity in the relationshipbetween ranking and funding, we can use the fact that funding is a nonlinear andnon-monotonic function of rank to construct instruments for computer use whilecontrolling for parametric functions of rank.
To motivate this approach, let r s denote the school s rank on the list for the townwhere this school is located. That is, r s ¼ 1 if the school is first on the priority list inthe town, r s ¼ 2 for the second school in the town, and so on, up to N s , thenumber of schools on the town list. To adjust for the fact that the likelihood of
752 [ O C T O B E RT H E E C O N O M I C J O U R N A L
� Royal Economic Society 2002

being highly ranked varied with the number of applicants, we work with a nor-malised rank:
Rs ¼ ðN s þ 1 � r sÞ=N s : ð3ÞNote that not all schools were ranked: some schools were deemed ineligible forprogramme funds by the towns. For schools ineligible for funding, we setr s ¼ N s þ 1 so Rs ¼ 0.13 Thus, Rs ranges from 0 (ineligible for funds) to 1 (highestpriority for funding). Rs provides a potential instrumental variable that can be usedto identify the effects of Tomorrow-98 computers or CAI on outcomes. The iden-tification in this case turns on the fact that E(T sjRs ) is a highly nonlinear and non-monotonic function of Rs . We can therefore control for linear and even polynomialfunctions of Rs while using E(T sjRs) as an instrument for cs .
What sort of omitted variables bias does this strategy mitigate? A concern withthe 2SLS estimates discussed in the previous section is bias from correlation be-tween T s and unobserved school-level characteristics, represented by the errorterm, gs . T s can be viewed as determined by town rank, Rs , town size, N s , and otherschool-level random factors, denoted by ms , that are likely correlated with gs . Theseother (random) factors include the town-specific ranking threshold and anythingelse used by the town or central authorities to make allocation decisions. Forexample, the assignment mechanism could be modelled as T s ¼ 1ðhðRsÞ > msÞ.Note that necessarily, we have
Rs ? ½gs � EðgsjRs;N sÞ�
by iterated expectations. The town rank is therefore available as a potential in-strument after controlling for Eðgs jRs ;N sÞ. This requires sufficient variation in therelationship between Rs and T s conditional on EðgsjRs;N sÞ. We therefore makethe following identifying assumption:
Assumption 1.
(i) Eðgs jRs ;N sÞ ¼ g pðRsÞ þ d0Ns , where g pðRsÞ is a polynomial function of order p;(ii) The matrix formed from the columns
Ws g pðRsÞ N s EðT sjRsÞn o
is of full column rank.
Given Assumption 1, the effect of interest is identified even if unobserved com-ponents of programme award status (ms) are correlated with unobserved school-level determinants of test scores (gs).
A natural estimator given Assumption 1 is 2SLS using a modified version of (1),where the term W0
sc is augmented by inclusion of N s and the control function,g pðRs), which we take to be quadratic.14 The resulting equation is
13 We determined N s by counting applicants in Tomorrow-98 programme data provided by theMinistry of Education. The town ranking of schools is also reported in this file. In some cases, themaximum rank recorded in the data falls short of the apparent number of applicants, probably becauseschools were incorrectly grouped or identified. In such cases, we set schools deemed ineligible forfunding (ie ranked by the town at 0) to have r s ¼ max(rank recorded for the town)+1. Rs is the rankingvariable included as a control in the OLS and 2SLS estimates.
14 Results using linear and third-order polynomial controls were similar. As the degree of polynomialcontrol increases, identification breaks down and the estimates become increasingly imprecise.
2002] 753N E W E V I D E N C E O N C L A S S R O O M C O M P U T E R S
� Royal Economic Society 2002
Bandwidth = 0.2
fund
ed
rank0 0.2 0.4 0.6 0.8 1
0
0.2
0.4
0.6
0.8
1
fund
ed
rank0 0.2 0.4 0.6 0.8 1
0
0.2
0.4
0.6
0.8
1
fund
ed
rank0 0.2 0.4 0.6 0.8 1
0
0.2
0.4
0.6
0.8
1
Bandwidth = 0.3
Bandwidth = 0.4
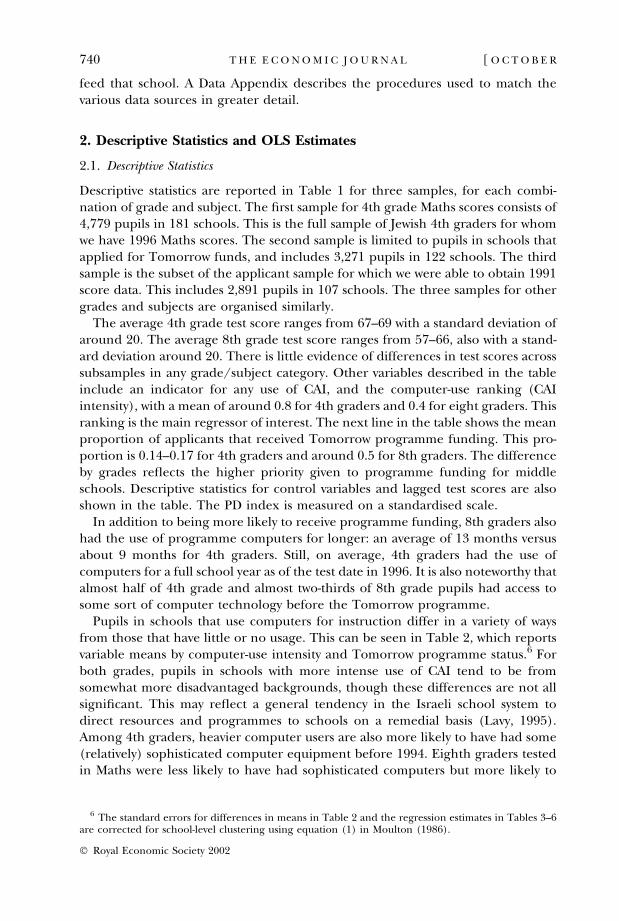
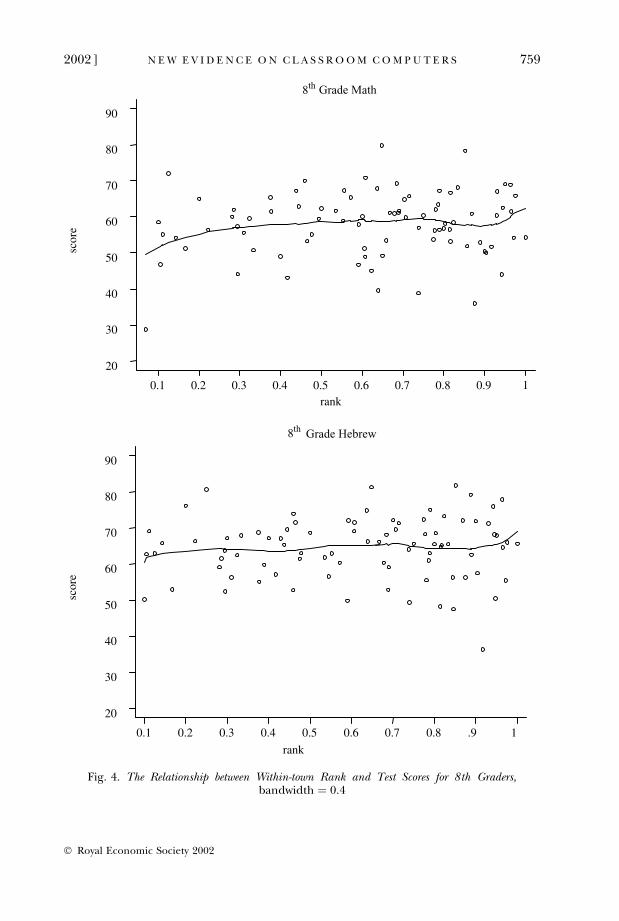
Fig. 1. The Relationship between Within-town Rank and the Probability of Funding forElementary Schools
754 [ O C T O B E RT H E E C O N O M I C J O U R N A L
� Royal Economic Society 2002

yis ¼ W0sc þ d0N s þ d1Rs þ d2R2
s þ X0ib þ csa þ ~ggs þ eis ð4Þ
where ~ggs � gs � EðgsjRs;N sÞ. The quadratic function of Rs controls for possibleeffects of the ranking that operate through mechanisms other than the likelihoodof receiving new computers.
Implementation of the nonlinear IV strategy requires an estimate of E(T s | Rs)since this is unknown. Following an idea developed by Hahn et al. (2001) for arelated problem, we use local linear regression to estimate this conditional ex-pectation function nonparametrically. Hahn et al. (2001) incorporate prior in-formation on the location of discontinuities in their nonparametric estimates.Since there are no discontinuities in our case, E(T s | Rs) was modelled using theentire support of Rs . In particular, we used the Cleveland (1979) local linearregression smoother to construct and estimate EE(T s | Rs), for every Rs .
15
The population of Tomorrow-98 applicants was used to construct EE(T s | Rs ), sothe first-step fitted value can be treated as known for inference purposes. On theother hand, an important source of uncertainty is the appropriate amount ofsmoothing when constructing fitted values. Because of this uncertainty aboutbandwidth, we experimented with a number of choices.
The estimated EE(T s | Rs), is plotted in Figure 1 for elementary schools andFigure 2 for middle schools. Both figures show estimates for bandwidth choices of0.2, 0.3, and 0.4. As the bandwidth widens, the estimated EE(T s | Rs), becomessmoother. At the other extreme, very narrow bandwidths lead to an estimator thatinterpolates every point. The points themselves, zeros and ones since T s is binary,also appear in the figure.
Figures 1 and 2 both show that schools with normalised rank below about 0.7 weremuch less likely to receive Tomorrow-98 computers than schools with higherrankings. For ranks of 0.7 and higher, the likelihood of receiving computers in-creases steeply with rank, though it flattens out below ranks of 0.9 for elementaryschools. Interestingly, schools given a very low ranking by municipal authorities(ie below about 0.2) are more likely to have been given computers than schools withranks between 0.2 and 0.6. This is probably because Ministry of Education au-thorities overruled some low town-based rankings, apparently out of concern thattowns’ preferences over schools were influenced by local political considerations.
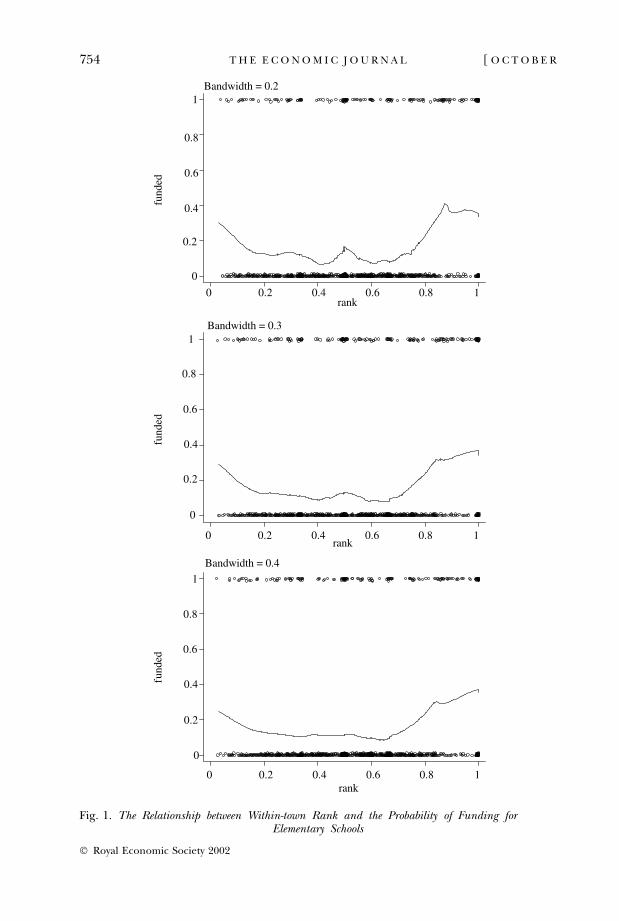
Figures 3 and 4 show local linear regression estimates of the relationship be-tween the normalised town ranking and test scores, parallel to those in Figures 1and 2 (using a bandwidth of 0.4). The top half of Figure 3, for 4th grade Mathsscores, exhibits a pattern that is, in some respects, the mirror image of Figure 1. Inparticular, test scores begin to fall with rank for towns with ranks above about 0.7.Although there is some evidence of a decline for 4th grade Hebrew scores, thepattern is less clear cut than for Maths scores, consistent with the insignificant butnegative estimates for Hebrew scores in Tables 4 and 5. For 8th graders, however,the only semblance of a pattern is slightly lower scores for low ranked schools andslightly higher scores for highly ranked schools. Both groups were more likely to
15 The Cleveland (1979) estimator is called LOWESS; see, for example, Fan and Gijbels 1995). Weused the version of this estimator implemented in Stata.
2002] 755N E W E V I D E N C E O N C L A S S R O O M C O M P U T E R S
� Royal Economic Society 2002

Bandwidth = 0.2
fund
ed
rank0 0.2 0.4 0.6 0.8 1
0
0.2
0.4
0.6
0.8
1
fund
ed
rank0 0.2 0.4 0.6 0.8 1
0
0.2
0.4
0.6
0.8
1
Bandwidh = 0.4
fund
ed
rank0 0.2 0.4 0.6 0.8 1
0
0.2
0.4
0.6
0.8
1
Bandwidth = 0.3
Fig. 2. The Relationship between Within-town Rank and the Probability of Funding for MiddleSchools
756 [ O C T O B E RT H E E C O N O M I C J O U R N A L
� Royal Economic Society 2002

receive Tomorrow-98 computers, so this pattern may be due to chance. NeitherFigure shows strong up or down ‘trend variation’ in scores with rank.
The nonlinear instrumental variables estimates are broadly consistent with the2SLS estimates reported in Table 5. This can be seen in Table 6, which reportsestimates for 4th graders using three bandwidth choices in the first-stage. As be-fore, the clearest results are for 4th grade Maths scores, with estimates mostlyaround 0.2 standard deviations in samples of applicants and applicants with laggedscores. One of the estimates in Column 2 is marginally significant. Estimates for4th grade Hebrew scores are also mostly negative, though none are significant. Theestimates in Column 3 of the table are based on a sample limited to pupils inschools that had a normalised rank above 0.5. These estimates involve a compar-ison that exploits variation in EE(T s | Rs), close to the level where the probability ofreceiving computers sharply increased. This limited sample may lead to bettercontrol for any omitted Rs effects. In practice, however, these results are larger inmagnitude and less precise than the other results.
4. Conclusions
Israel’s Tomorrow-98 programme provides a unique opportunity to assessthe short-run consequences of increased computer technology in schools. The
Table 6
Nonlinear IV Estimates for 4th Graders
Sample
ApplicantsApplicants withlagged scores
Town rank > 0.5with lagged scores
Bandwidth (1) (2) (3)
A. Maths0.2 �0.151 (0.131) �0.266 (0.170) �0.588 (0.262)0.3 �0.121 (0.121) �0.214 (0.142) �0.629 (0.310)0.4 �0.142 (0.119) �0.212 (0.125) �0.572 (0.263)
N 3,271 2,891 1,550B. Hebrew
0.2 �0.088 (0.189) �0.202 (0.329) 3.02 (18.2)0.3 �0.074 (0.145) �0.153 (0.248) 2.93 (12.3)0.4 �0.060 (0.112) �0.118 (0.165) �4.40 (27.2)
N 2,464 2,194 1,281Other included controlsPre-existing computers X X XBasic controls X X X1991 test scores X X
Notes: The table reports IV estimates of effects of CAI intensity using the predicted probability ofreceiving T-98 programme support as an instrument. The predicted probability is a nonparametricallyestimated function of the normalised town rank for funding. Nonparametric estimates use the band-width indicated in the table. All models control for a quadratic function of the normalised T-98 townrank and for the number of applicants in the town. Basic controls and lagged test scores are as definedin Table 3. The samples in Columns 3 are limited to pupils in schools with normalised town ranking forTomorrow-98 funding above 0.5. Standard errors are reported in parentheses. The standard errors arecorrected for school-level clustering.
2002] 757N E W E V I D E N C E O N C L A S S R O O M C O M P U T E R S
� Royal Economic Society 2002

4th
Grade Math
4th
Grade Hebrew
sco r
e
rank 0.1 0.2 0.3 0.4 0.5 0.6 0.7 0.8 0.9 1
20
30
40
50
60
70
80
90
sco
re
rank 0.1 0.2 0.3 0.4 0.5 0.6 0.7 0.8 0.9 1
20
30
40
50
60
70
80
90
Fig. 3. The Relationship between Within-town Rank and Test Scores for 4th Graders,bandwidth ¼ 0.4
758 [ O C T O B E RT H E E C O N O M I C J O U R N A L
� Royal Economic Society 2002
8th
Grade Math
8th
Grade Hebrew
scor
e
rank
0.1 0.2 0.3 0.4 0.5 0.6 0.7 0.8 0.9 1
20
30
40
50
60
70
80
90
scor
e
rank 0.1 0.2 0.3 0.4 0.5 0.6 0.7 0.8 .9 1
20
30
40
50
60
70
80
90
Fig. 4. The Relationship between Within-town Rank and Test Scores for 8th Graders,bandwidth ¼ 0.4
2002] 759N E W E V I D E N C E O N C L A S S R O O M C O M P U T E R S
� Royal Economic Society 2002

programme had a clear impact on the use of computers in elementary schoolinstruction, with a much weaker effect on teaching methods in middle schools.This is in spite of the fact that programme operators hoped to promote the useof CAI at higher grade levels, where it is generally less pervasive. The resultsreported here do not support the view that CAI improves learning, at least asmeasured by pupil test scores. Using a variety of estimation strategies, we find aconsistently negative and marginally significant relationship between the pro-gramme-induced use of computers and 4th grade Maths scores. For other gradesand subjects, the estimates are not significant, though also mostly negative.Simpler OLS strategies generate only one significant estimate for the relationshipbetween CAI and test scores, a negative effect of CAI on 8th grade Maths scoresin models with town effects.
A possible explanation for our findings is that CAI is no better and may evenbe less effective than other teaching methods. Alternately, CAI may have con-sumed school resources or displaced educational activities which, had they beenmaintained, would have prevented a decline in achievement. Our teacher surveyincluded questions that we used to explore possible programme-related changesin teaching methods and educational inputs. As noted earlier, we found noevidence of a significant change in educational inputs, instructional methods orteacher training in Tomorrow-98 schools. This suggest there was no displace-ment. On the other hand, while Tomorrow-98 included a training component,CAI strategies implemented with a larger increase in teacher training may proveto be more effective than the Tomorrow-98 programme, though also morecostly.
Another possible explanation for the findings reported here is that the trans-ition to CAI is disruptive, and any benefits of CAI take time develop. The schools inour sample had Tomorrow-98 computers for an average of one full school year.This may not be long enough for any benefits to appear. Also relevant for anoverall assessment are any spillovers from the use of CAI on computer skills forwhich there is a direct pay-off. The computer-skills benefit may not be reflected inMaths and language scores. It should be emphasised, however, that the resultsreported here show that enough time had passed by the test date for the newcomputers to have had a large and statistically significant impact on instructionalmethods for 4th graders. Although other issues are also important, the short-termimpact of this change is of immediate policy interest. At a minimum, this short-rundecline in test scores is an extra hurdle to overcome if the transition to CAI isultimately to be justified by pupil achievement.
Finally, an important feature of Israel’s computerisation programme, and anelement that is by no means unique to Israel, is the large cost of a broad move toCAI. As noted in the introduction, Tomorrow-98 deployed about 35,000 com-puters in the first three years of the programme. The Ministry of Educationbudgeted this deployment at $3,000 per machine, including the cost of hardware,software and set-up (but not including wiring or other physical infrastructure).Programme schools received an average of about 40 computers, for a cost of$120,000 per school. In Israel, this amount would pay the wages of up to fourteachers. Assuming a depreciation rate of 25% on hardware and software and
760 [ O C T O B E RT H E E C O N O M I C J O U R N A L
� Royal Economic Society 2002

ignoring any training costs, the flow cost of the computers is about one teacher peryear per school.
Recent years have seen similarly ambitious computerisation efforts in USschools, where education technology is thought to have cost $5.2 billion in 1998,and the proportion of elementary school classrooms with internet access jumpedfrom 30% in 1994 to 75% in 1997 (National Center for Education Statistics,1998). The question of future impacts remains open, but this significant andongoing expenditure on education technology does not appear to be justified bypupil performance results to date. In addition to the evidence presented here,our sceptical view of the value of expenditure on education technology is rein-forced by our earlier findings using Israeli data, reported in Angrist and Lavy(1999, 2001), suggesting traditional inputs – reductions in class size and in-creased teacher training – have had substantial achievement benefits. Althoughthe labour market consequences of educational expenditures is difficult to assess,these results have clear implications for education production isoquants. Onbalance, it seems, money spent on CAI in Israel would have been better spent onother inputs.
MIT and NBERHebrew University
Date of receipt of first submission: February 2000Date of receipt of final typescript: October 2001
Appendix
A1. Data
A1.1. Test score data
Four data files provided by the Ministry of Education contain pupil characteristics and testscores (in Maths and Hebrew, for 4th and 8th grade) from the June 1996 national testingprogramme. Our analysis is limited to the Jewish schools in the sample. The 4th grade Mathssample included 213 schools (5,584 pupils). The 8th grade Maths sample included 177schools (4,172 pupils). The 4th grade Hebrew sample included 209 schools (5,466 pupils).The 8th grade Hebrew sample included 176 schools (4,695 pupils).
A1.2. CAI intensity data
The June 1996 testing programme included a brief survey given to all teachers of eachsampled class. This survey included a question on the intensity of computer use in theclassroom. Teachers are identified as Maths or Hebrew teachers. Fourth grade pupils wereassigned the answers of their (unique) teacher. For the 8th Hebrew sample, there are up tofour different teachers who taught the same class Hebrew-related subjects. In such cases, weassigned pupils the answers of their reading teacher.
2002] 761N E W E V I D E N C E O N C L A S S R O O M C O M P U T E R S
� Royal Economic Society 2002

Teachers’ answers on the intensity of computer use were available for 183 schools (4,833pupils) in the 4th grade Maths sample, 142 schools (3,290 pupils) in the 8th grade Mathssample, 166 schools (4,180 pupils) in the 4th grade Hebrew sample and for 140 schools(3,675 pupils) in the 8th grade Hebrew sample. The observation counts were furtherreduced to those in Table 1 because of missing data on other variables.
A1.3. Data on Tomorrow-98 applicants
The Ministry of Education provided a file containing information on the 1994 applicants tothe Tomorrow-98 programme and their ranking within municipalities. This file was mergedwith pupil test scores data. The 4th and 8th grade Maths applicant samples with test scoredata included 146 schools. The 4th and 8th grade Hebrew applicant samples with test scoredata included 144 and 140 schools, respectively.
The Ministry of Education also provided files with information on the Tomorrow im-plementation schedules and existing computer infrastructure (collected for the purposes ofthis evaluation), along with other school level variables, such as the PD index, school size,town code and type of school (secular or religious).
A1.4. Lagged test score and computer use data
Lagged scores for 4th grade were obtained from the 1991 national test programme dataused by Angrist and Lavy (1999). Lagged scores were available for 189 schools in the 4thgrade Maths sample (of which 131 were programme applicants), for 130 schools in the 8thgrade Maths sample (110 programme applicants), for 188 schools in the 4th grade Hebrewsample (150 programme applicants) and for 119 schools in the 8th grade Hebrew sample(97 programme applicants). The estimates controlling for lagged computer use in Table 5also rely on matched data for a subsample of schools from the 1991 testing programme.These data come from a survey of teachers that was done along with the 1991 testing. Thelagged use variable in our analyses measures the proportion of teachers at each school in 4thgrade using computers for instruction in 1991. The 8th grade lagged use variable is theaverage lagged use dummy for 4th grade in elementary schools that feed the relevantmiddle schools.
A2. 2SLS Estimates of Ordinal-response Models
To simplify notation, we drop subscripts indexing individuals and schools, and use theupper case to denote random variables with the same distribution as for a randomly chosenpupil or school. Suppose that a pupil would have average test score Y j when exposed tointensity level j, where j can take on values 0–3. Y j is a potential outcome; that is, we imaginethat for each pupil, all of the elements of Y 0, Y 1, Y 2, Y 3 are well-defined, though only oneis ever observed. The average causal effect of increasing intensity by one unit isE(Y j � Y j�1). We could learn about these average effects in an experiment where pupils arerandomly exposed to different intensities. Similarly, let Ct be the potential intensity thatwould be realised when the binary instrument T equals t, for t ¼ 0,1. The difference inmeans, E(C |T ¼ 1)�E(C | T ¼ 0) ¼ E(C1 � C0), is the average causal effect of T on CAIintensity in a randomised trial.
The empirical work is motivated by a model where potential outcomes vary with intensityaccording to a linear model that is the same for all pupils, but this is almost certainly not anaccurate description of the causal effect of changing computer use. Angrist and Imbens(1995) discuss the interpretation of linear IV estimators in models where the underlyingcausal response function is both heterogeneous and nonlinear. The simplest characterisa-
762 [ O C T O B E RT H E E C O N O M I C J O U R N A L
� Royal Economic Society 2002

tion is for a Wald estimator, i.e. using T as an instrument for a regression of Y on C with nocovariates. Extensions are conceptually straightforward, though the notation is more in-volved. The Wald estimator using T as an instrument can be written in terms of potentialoutcomes as
EðY jT ¼ 1Þ � EðY jT ¼ 0ÞEðC jT ¼ 1Þ � EðC jT ¼ 0Þ ¼
PEðY j � Y j�1jC1 � j > C0ÞPðC1 � j > C0ÞP
PðC1 � j > C0ÞðA:1Þ
where the summation is from j ¼ 1 to j ¼ 3. Formula (A.1) describes the sense in which2SLS captures an average causal response. This interpretation applies to Wald estimates ofcausal effects for any ordered treatment, provided the intensities satisfy C1 � C0 for allpupils (‘monotonicity’).
Table A1 reports the marginal distribution of CAI intensity for Maths and Hebrew. Theweighting function underlying the average causal effect in (A.1) is described in Table 4,which reports the impact of T on the distribution of C. For example, the effect on theprobability CAI � 1 is an estimate of P(C1 � 1 >C0). Using 4th grade Maths data, the tableshows significant positive weights for effects of this kind at j ¼ 1, 2, and 3; for 4th gradeHebrew data, the intensity distribution is shifted only for j ¼ 1.
Suppose now that instead of using C as the endogenous regressor, we use a single dummyindicating CAI intensity greater than j as the endogenous regressor. Denote this regressor bydð jÞ � 1(CAI � j). Using the fact that P(C1 � j > C0) is a difference in CDFs, we have
EðC jT ¼ 1Þ � EðC jT ¼ 0Þ ¼X
j
PðC1 � j > C0Þ:
Since
E½dð jÞjT ¼ 1� � E½dð jÞjT ¼ 0� ¼ PðC1 � j > C0Þ
it follows immediately that IV estimates using d( j) as the endogenous variable will generallybe ‘too big’ in the sense that they over-estimate the causal effect of a unit increase inintensity. The scaling factor is
Xj
PðC1 � j > C0Þ�X
j
PðC1 � j > C0Þ � u � 1:
Table A1
Computer Use Intensity Ranking (CAI) Distribution
Maths Hebrew
CAI ¼ 0 CAI ¼ 1 CAI ¼ 2 CAI ¼ 3 CAI ¼ 0 CAI ¼ 1 CAI ¼ 2 CAI ¼ 3Sample (1) (2) (3) (4) (5) (6) (7) (8)
4th grade 44.3 21.8 30.1 3.61 57.8 10.8 21.1 10.2applicants
4th grade 46.6 21.0 28.3 4.08 59.2 11.0 21.3 8.52applicants withlagged scores
8th grade 67.0 17.4 11.3 1.34 73.6 11.6 10.5 4.36applicants
8th grade 71.4 17.5 9.46 1.63 69.4 12.6 12.7 5.29applicants withlagged scores
Notes: The table reports the percent distribution of the computer-use intensity ranking.
2002] 763N E W E V I D E N C E O N C L A S S R O O M C O M P U T E R S
� Royal Economic Society 2002

This equals 1 only if the instrument shifts the distribution of CAI intensity at a single point(as appears to be true for the impact on computer use for Hebrew). For 4th grade Mathsscores, however, estimates using d(1) as the endogenous regressor can expected to be ap-proximately 2–3 times as large as the 2SLS estimates treating C as the endogenous regressor.This is confirmed in Table A2, which reports estimates using alternate dummy-variablespecifications, comparable to those reported in Table 5.
ReferencesAnandakirichnan, M., Cardenas, J. F., Galaz-Fontes, P. and Robles-Perez, P. (1988). ‘Microcomputers in
schools in developing countries’, in (A. S. Bhalla and J. Dilmus, eds), New Technologies and Devel-opment: Experiences of Technology Blending, London: Rienner, pp. 112–26.
Angrist, J. and Imbens, G. (1995). ‘Two-stage least squares estimates of average causal response inmodels with variable treatment intensity’, Journal of the American Statistical Association, (June).
Angrist, J. and Lavy, V. (1999). ‘Using Maimonides’ rule to estimate the effect of class size on studentachievement’, Quarterly Journal of Economics, vol. 114 (May), pp. 535–575.
Angrist, J. and Lavy, V. (2001). ‘Does teacher training affect pupil learning? Evidence from matchedcomparisons in Jerusalem public schools’, Journal of Labor Economics, forthcoming.
Baker, Eva L., Gearhart, M. and Herman, J. L. (1993). ‘The Apple classrooms of tomorrow: the UCLAevaluation studies’, CSE technical report 353, Center for the Study of Evaluation/Center forTechnology Assessment, Graduate School of Education, UCLA, (January).
Booms, B. H. and Kaltreider, D. L. (1974). ‘Computer-aided instruction for large elementary courses’,American Economic Review, vol. 64 (May), pp. 408–13.
Cleveland, W. (1979). ‘Robust locally weighted regression and smoothing scatterplots’, Journal of theAmerican Statistical Association’, vol. 74, pp. 829–36.
Cuban, L. (1986). Teachers and Machines: the Classroom Use of Technology Since 1920, New York: Teacher’sCollege Press.
Cuban, L. (1993). ‘Computers meet classroom: classroom wins’, Teacher’s College Record, vol. 95,pp. 185–210.
Dertouzos, M. (1998). ‘Wire all schools? Not so fast ... ’, Technology Review, vol. 20 (September–October).Fan, J. and Gijbels, I. (1995). Local Polynomial Modeling and Its Applications, London: Chapman and Hall.Hahn, Jinyong, Todd, P. and van der Klaauw, W. (2001) ‘Identification and estimation of treatment
effects with a regression-discontinuity design’, Econometrica, vol. 69 (January), pp. 201–10.Henry, M. and Ramsett, D. (1978). ‘The effects of computer-aided instruction on learning and attitudes
in economic principles courses’, Journal of Economic Education, vol. 10 (Fall), pp. 26–34.Israel, P. (1998). Edison: A Life of Invention, New York: John Wiley and Sons.Israel Ministry of Education, Culture, and Sport, Economics and Budgeting Administration, (1994).
Facts and Figures About Education and Culture in Israel, Jerusalem.
Table A2
OLS and 2SLS Estimates of the Effects of the CAI Intensity on 4th GradeMaths Scores
CAI indicators
CAI � 1 CAI � 2 CAI � 3Estimate (1) (2) (3)
A. ApplicantsOLS 0.045 (0.068) 0.105 (0.072) 0.194 (0.174)2SLS �0.871 (0.621) �0.723 (0.471) �2.4 (1.74)B. Applicants withlagged scoresOLS 0.069 (0.072) 0.080 (0.076) 0.193 (0.168)2SLS �1.05 (0.735) �0.954 (0.595) �2.88 (2.02)
Notes: The table reports OLS and 2SLS estimates using dummies for CAI intensity as the endogenousregressor. Standard error are reported in parentheses. The standard errors are corrected for school-level clustering.
764 [ O C T O B E RT H E E C O N O M I C J O U R N A L
� Royal Economic Society 2002

Israel Ministry of Education, Culture, and Sport, Economics and Budgeting Administration, (1996).Facts and Figures About Education and Culture in Israel, Jerusalem.
Kirkpatrick, H. and Cuban, L. (1998). ‘Computers make kids smarter – right?’, Technos Quarterly forEducation and Technology, vol. 7(2), (Summer). http://www.technos.net.Eq.07/cuban.htm
Knight, P. B. and Bozeman, W. C. (1981). ‘Computer-assisted instruction and mathematics achieve-ment: is there a relationship?’, Educational Technology, (October), pp. 32–9.
Kulik, C. C. and Kulik, J. A. (1991). ‘Effectiveness of computer-based instruction: an updated analysis’,Computers in Human Behavior, vol. 7, pp. 75–94.
Lavy, V. (1995). ‘Endogenous school resources and cognitive achievement in primary schools in Israel’,Hebrew University, Falk Institute Discussion Paper No. 95.03.
Lewis, D. R., Hearn, J. C. and Zilbert, E. (1991). ‘Keyboarding as general education: post-school em-ployment and earnings effects’, Economics of Education Review, vol. 10, pp. 333–42.
Liao, Y. K. (1992).‘ Effects of computer-assisted instruction on cognitive outcomes: a meta-analysis’,Journal of Research on Computing in Education, vol. 24, pp. 367–80.
Moulton, B. (1986). ‘Random group effects and the precision of regression estimates’, Journal ofEconometrics, vol. 32, pp. 385–97.
Oppenheimer, T. (1997). ‘The computer delusion’, The Atlantic Monthly, (July), pp. 45–63.National Center for Education Statistics (1998). The Condition of Education 1998, US Department of
Education, Office of Educational Research and Improvement (NCES 98-013), Washington, DC:US GPO, October.
Porter, T. A. and Riley, T. M. (1992). CAI in Economics: what happened to the revolution? Journal ofEconomic Education, vol. 23(4), pp. 374–379.
President’s Committee of Advisors on Science and Technology, (1997). Panel on Educational Tech-nology, Report to the President on the Use of Technology to Strengthen K-12 Education in the United States,Washington DC: Office of the President, (March).
Rotin, J. (1999). ‘The contribution of the Mahar 98 project to the advancement of the use of computersand software in schools’, Working Paper 6, The Gordon College of Education, Haifa, (in Hebrew).
Seltz, J. (1999). ‘Some educators question value of school computers’, The Boston Sunday Globe (May 9),p. F5.
Skinner, B. F. (1954). ‘The science of learning and the art of teaching’, Harvard Educational Review,vol. 24, pp. 86–97.
Skinner, B. F. (1958). ‘Teaching machines’, Science, vol. 128 (October), pp. 969–77.Stoll, C. (1995). Silicon Snake Oil: Second Thoughts on the Information Highway, New York: Doubleday.Wenglinsky, H. (1998). Does It Compute? The Relationship Between Educational Technology and Student
Achievement in Mathsematics, Princeton, NJ: Policy Information Center, Research Division, Educa-tional Testing Service.
2002] 765N E W E V I D E N C E O N C L A S S R O O M C O M P U T E R S
� Royal Economic Society 2002