Embed Size (px)
Citation preview

ISSN: 0973-4945; CODEN ECJHAO
E-Journal of Chemistry
http://www.e-journals.net 2011, 8(4), 1881-1885
New Estimation of the Dosage of Scale
Inhibitor in the Cooling Water System
JIANG JIAOMEI and XU YANHUA*
College of Environment, Jiangsu Key Laboratory of Industrial Water-Conservation and
Emission Reduction, Nanjing University of Technology, Nanjing-210009, China
Received 20 December 2010; Accepted 28 February 2011
Abstract: In the cooling water system, excessive use of organic phosphate
scale inhibitors is harmful to environment. Reducing the dosage of the organic
phosphate scale inhibitor is important. A self-made jacketed crystallizer was
used in this experiment. The critical pH values have been determined in
cooling water systems with series of Ca2+ concentrations by adding different
concentration of the scale inhibitor ATMP (Amino Trimethylene Phosphonic
Acid) according to the calcium carbonate Metastable zone theory. A model
equation at 45 oC and pH=9 was proposed to estimate the lowest dose of the
scale inhibitor ATMP. The measured pH value was approximate to the
expected pH value in two cooling water systems through verification test.
Keywords: Metastable zone, Critical pH, Scale inhibitor dosage
Introduction
Normally, using phosphonates as inhibitors is a effective method of preventing mineral scale
and corrosion in cooling water systems1,2
. Excessive using the scale inhibitor can reduce
scale information risk3. But this brings environmental problems. A number of non-toxic, low
phosphorus and phosphate-free chemicals is developed environment-friendly4. However,
there still is no phosphate-free scale inhibitor to replace the traditional organic phosphate
scale inhibitor5. Therefore, how to control strictly the dosage of organic phosphate scale
inhibitor is important.
In cooling water system, calcium carbonate is the predominant component of scales
deposited in cooling water systems5-8
. Chemical crystallization is one of the important scale
formation causes. Theoretically, nucleation should initiate when solute concentration passes
the saturation point and the solution becomes supersaturated. However, this does not occur
instantly and solute remains in solution until a sufficiently high level of supersaturation is
generated to induce spontaneous nucleation9. Wilhelm Ostwald called this unstable state of
labile region. Between this region and the solubility curve is known as metastable zone10,11
.

New Estimation of the Dosage of Scale Inhibitor 1882
The scale inhibitors can broaden the width of metastable zone11
, increase the induction
time, inhibit crystal growth12
and change the morphology of crystalloids13,14
. In different
cooling waters, adding different concentrations of inhibitors, CaCO3 crystallization
metastable zone width will inevitably different. In the actual cooling water system, only
when the operating conditions are controlled within the crystallization metastable zone, the
scale inhibitors could do work.
Based on the calcium carbonate metastable zone theory, by the critical pH method15-17
,
an attempt at the quantitative relation between scale inhibitor ATMP concentration and Ca2+
concentration has been made under 45 oC and pH=9 and a model equation was observed.
This would avoid deciding the inhibitor dosage only by experience. The calculated dosage
by the model could meet the needs of not only inhibiting the scale formation but also
limiting the dosage of organic phosphate scale inhibitor.
Experimental
Figure 1 is the design drawing of self-made jacketed crystallizer. The schematic drawing of
experimental apparatus for cooling water system is in Figure 2.
Figure 1. The design drawing of self-made jacketed crystallizer
1, Thermometer; 2, Thermometer; 3, Super constant temperature water-bathing; 4, Acidometer;
5, Glass electrode; 6, Reference electrode; 7, Outlet line of crystallizer; 8, Inlet line of crystallizer;
9, Jacketed crystallizer
Figure 2. The sketch of experimental setup
Series concentrations (Table 1) of CaCl2 and NaHCO3 stock solutions were prepared
and used to simulate the cooling water. Equal volume of the both stock solutions were added
into a 500 mL jacketed crystallizer with a super constant temperature water-bathing to
control temperature accuracy of ±0.5 oC and the solution was mixed by a magnetic stirrer
Concentration of ATMP, mgL-1
Cri
tica
l p
H
1883 JIANG JIAOMEI et al.
at a constant speed. A metering pump was used for pumping 0.1 mol- L-1
NaOH solution at
the speed of 0.05 mL.min-1
. A pH sensor was used to show the solution changes during
crystallization process.
Table 1. Series concentrations of stock solution
Stock solution Series 1 Series 2 Series 3 Series 4 Series 5
CaCl2, mmol- L-1
6.000 9.000 12.01 14.01 20.01
NaHCO3, mmol- L-1
13.80 21.15 27.60 32.90 47.78
Ca2+
concentration
in simulate cooling
water, mmol- L-1
3.000 4.500 6.005 7.005 10.01
The sets of experiments consisted of putting 200 mL simulate cooling water and the
CaCO3 inhibitor ATMP(Amino Trimethylene Phosphonic Acid) into the thermostated vessel
of 500 mL and after the temperature stabilizing at 45±0.5 oC, titrating the 0.1 mol.L
-1 NaOH
solution at the speed of 0.05 mol. L-1
. The solution pH value was read during crystallization
processes.
Results and Discussion
Critical pH value measurements
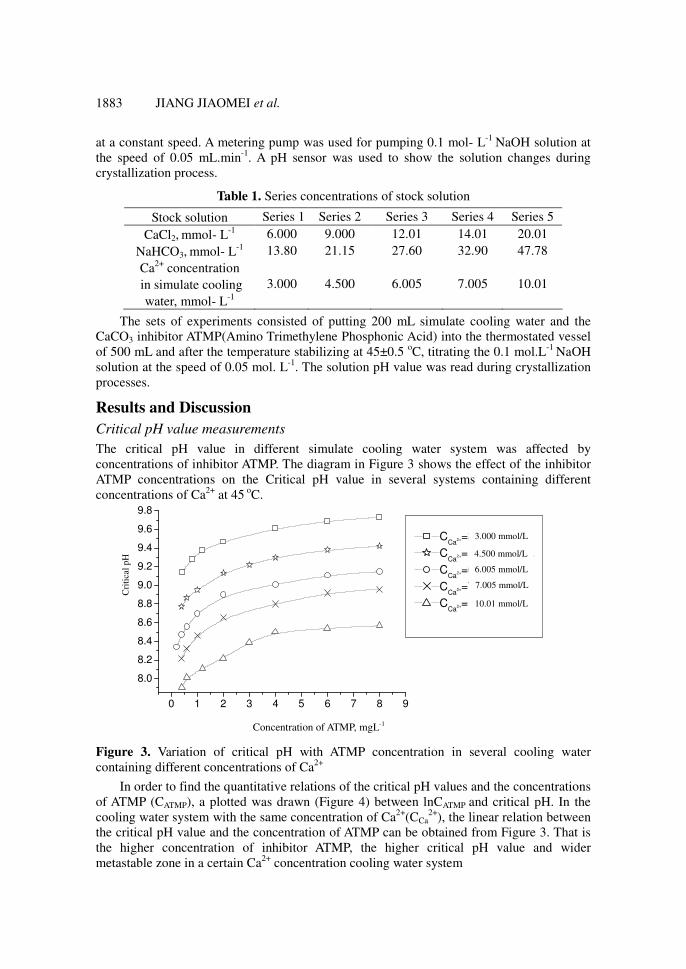
The critical pH value in different simulate cooling water system was affected by
concentrations of inhibitor ATMP. The diagram in Figure 3 shows the effect of the inhibitor
ATMP concentrations on the Critical pH value in several systems containing different
concentrations of Ca2+
at 45 oC.
0 1 2 3 4 5 6 7 8 9
8.0
8.2
8.4
8.6
8.8
9.0
9.2
9.4
9.6
9.8
CCa
2+=3.000mmol/L
CCa
2+=4.500mmol/L
CCa
2+=6.005mmol/L
CCa
2+=7.005mmol/L
CCa
2+=10.01mmol/L
Figure 3. Variation of critical pH with ATMP concentration in several cooling water
containing different concentrations of Ca2+
In order to find the quantitative relations of the critical pH values and the concentrations
of ATMP (CATMP), a plotted was drawn (Figure 4) between lnCATMP and critical pH. In the
cooling water system with the same concentration of Ca2+
(CCa2+
), the linear relation between
the critical pH value and the concentration of ATMP can be obtained from Figure 3. That is
the higher concentration of inhibitor ATMP, the higher critical pH value and wider
metastable zone in a certain Ca2+
concentration cooling water system
3.000 mmol/L
4.500 mmol/L
6.005 mmol/L
7.005 mmol/L
10.01 mmol/L

lnCATMP
Cri
tica
l p
H
lnCCa2+
lnC
AT
MP
New Estimation of the Dosage of Scale Inhibitor 1884
-2.5 -2.0 -1.5 -1.0 -0.5 0.0 0.5 1.0 1.5 2.0 2.5 3.07.8
8.0
8.2
8.4
8.6
8.8
9.0
9.2
9.4
9.6
9.8
CCa
2+=3.000mmol/L
CCa
2+=4.500mmol/L
CCa
2+=6.005mmol/L
CCa
2+=7.005mmol/L
CCa
2+=10.00mmol/L
Figure 4. The plot of critical pH against natural logarithms of CATMP at 45 oC
Modeling of the estimation for ATMP concentration
The actual plant process systems usually were controlled at a relatively stable pH value,
while the concentration of Ca2+
was varied with the makeup water. Different system needs
different inhibitor concentration. It was even necessary to find the relation between the
concentration of Ca2+
and that of inhibitor ATMP for estimating the inhibitor dosage.
According to Figure 5, the theoretical relationship between the concentration of ATMP
and that of Ca2+
could be obtained as the following fitted equation at pH=9.0 and 45 oC:
lnc=−6.65+4.41 lncCa2+
.
So in a cooling water system with relatively stable Ca2+
concentration, the inhibitor ATMP
dosage can be estimated quantificationally by the model: CATMP=exp(-6.65+4.41 ln cCa2+
), which
would ensure to avoid estimating inhibition dosage by experience empirically and roughly.
1 .0 1 .2 1 .4 1 .6 1 .8 2 .0 2 .2 2 .4
-2
-1
0
1
2
3
4
Figure 5. The plot of natural logarithms of CATMP against natural logarithms of CCa2+
at 45 oC
and pH=9.0
Verification test
The model was applied in two systems with two kinds of Ca2+
concentrations. One was
4.000 mmol.L-1 and the other was 8.000 mmol.L
-1. Assumed that the critical pH value 9.0 was
expected, the model calculated dosage ATMP was added into the system. Then the critical pH values
were measured. Table 2 shows that the measured critical pH value is very close to the expected.
10.00 mmol/L
7.005 mmol/L
6.005 mmol/L
4.500 mmol/L
3.000 mmol/L

1885 JIANG JIAOMEI et al.
Table 2. Measured and expected pH value in two systems
Conclusion
The CaCO3 crystal metastable zone has been studied by critical pH method in the self-made
jacketed crystallizer. And the theoretical model was derived for the estimation of inhibitor
ATMP dosage in cooling-water system by considering the Ca2+
concentrations, temperature,
pH value. Verification test results showed that the relative deviation between the measured
and expected critical pH value was 1.22% and 4.4% after adding the model calculated
ATMP concentration into the cooling system. It should be possible to apply the model-
building method in order to estimate the other kind of inhibitor dosage to cooling-water
system, which not only could save the running cost but also decrease the releasing of
phosphoric contaminants.
References
1. BingRu Zhang, Li Zhang, FengTing Li, Wei Hu and Phillip M. Hannam, Corr Sci.,
2010, 52, 3883-3890.
2. Qingfeng Yang, Yangqiao Liu, Anzhong Gu, Jie Ding and Ziqiu Shen, J Colloid
Interface Sci., 2001, 240(2), 608-621.
3. David Hasson, Dan Bramson and Bracha Limnoni-Relis, Desalination, 1997,
108(1-3), 67-97.
4. Kumar T, Vishwanatham S and Kundu S S, J Petrol Sci Eng., 2010, 71, 1-7.
5. Chen Wang, Shu-ping Li, Tian-duo Li, Desalination, 2009, 249, 1.
6. Qingfeng Yang, Yangqiao Liu, Anzhong Gu, Jie Ding and Ziqiu Shen, Chem Eng Sci.,
2002, 57(6), 921-931.
7. Ketrane R, Saidani B, Gil O and Leleyter L and Baraudetc F, Desalination, 2009,
249(3), 1397.
8. Abdel-Aal N, Sawada,ournal K, J Cryst Growth, 2003, 256, 188-200.
9. Trifkovic M, Sheikhzadeh M and Rohani S, J Cryst Growth, 2009, 311, 3640.
10. Marjatta Louhi-Kultanen, Milja Karjalainen, Jukka Rantanen, Int J Pharm., 2006,
320(1),23-29.
11. XU Shouchang. Industrial Cooling Water Treatment Technology: Beijing, 1984, 100
12. Tantayakom V, Sreethawong T, Scott Fogler H, De Moraes F F and Chavadej S, J
Colloid Interface Sci., 2005, 284, 57-65.
13. Martos C, Coto B, Pena J L, Rodríguez R, Merino-Garcia D and Pastor G, J Cryst
Growth, 2010, 312, 2756-2763.
14. Yongming Tang, Wenzhong Yang, Xiaoshuang Yin, Ying Liu, Pengwei Yin and
Jintang Wang, Desalination, 228, 55.
15. Larry M. McGaugheya, Jack V. Matson, Water Res., 1980, 14(12), 1729-1735.
16. Drela I, Falewicz P and Kuczkowska S, Water Res., 1998, 32, 3188.
17. Colin F and Quevauviller P, Monitoring of Water Quality; Elsevier, Amsterdam, 1998, 167.
Parameters I II
Ca2+
concentration mmol.L-1
4.000 8.000
Theoretical critical pH value 7.81 7.66
ATMP calculated concentration, mg.L-1
0.58 12.4
Expected critical pH value 9.0 9.0
Measured critical pH value 8.89 8.60
Relative deviation, % 1.22 4.4

Submit your manuscripts athttp://www.hindawi.com
Chromatography Research International
Hindawi Publishing Corporationhttp://www.hindawi.com Volume 2013
Hindawi Publishing Corporationhttp://www.hindawi.com Volume 2013
Carbohydrate Chemistry
International Journal of
Hindawi Publishing Corporationhttp://www.hindawi.com
International Journal of
Analytical ChemistryVolume 2013
ISRN Chromatography
Hindawi Publishing Corporationhttp://www.hindawi.com Volume 2013
Hindawi Publishing Corporation http://www.hindawi.com Volume 2013Hindawi Publishing Corporation http://www.hindawi.com Volume 2013
The Scientific World Journal
Bioinorganic Chemistry and ApplicationsHindawi Publishing Corporationhttp://www.hindawi.com Volume 2013
Hindawi Publishing Corporationhttp://www.hindawi.com Volume 2013
CatalystsJournal of
ISRN Analytical Chemistry
Hindawi Publishing Corporationhttp://www.hindawi.com Volume 2013
ElectrochemistryInternational Journal of
Hindawi Publishing Corporation http://www.hindawi.com Volume 2013
Hindawi Publishing Corporationhttp://www.hindawi.com Volume 2013
Advances in
Physical Chemistry
ISRN Physical Chemistry
Hindawi Publishing Corporationhttp://www.hindawi.com Volume 2013
SpectroscopyInternational Journal of
Hindawi Publishing Corporationhttp://www.hindawi.com Volume 2013
ISRN Inorganic Chemistry
Hindawi Publishing Corporationhttp://www.hindawi.com Volume 2013
Hindawi Publishing Corporationhttp://www.hindawi.com Volume 2013
Journal of
Chemistry
Hindawi Publishing Corporationhttp://www.hindawi.com Volume 2013
Inorganic ChemistryInternational Journal of
Hindawi Publishing Corporation http://www.hindawi.com Volume 2013
International Journal ofPhotoenergy
Hindawi Publishing Corporationhttp://www.hindawi.com
Analytical Methods in Chemistry
Journal of
Volume 2013
ISRN Organic Chemistry
Hindawi Publishing Corporationhttp://www.hindawi.com Volume 2013
Hindawi Publishing Corporationhttp://www.hindawi.com Volume 2013
Journal of
Spectroscopy