Embed Size (px)
Citation preview

New England Beef-to-Institution Marketing Study
October 4, 2011
Prepared by
Rose Wilson Rosalie J. Wilson Business Development Services
Rosaliewilson.com
Charlene Andersen Kamigo Marketing LLC Kamigomarketing.com
Louise H. Calderwood Everything Agriculture
Kate Rumley

The New England Beef-to-Institution Marketing Study received funding and support from
Vermont Agency of Agriculture, Food and Markets
Connecticut Department of Agriculture
Maine Department of Agriculture
Massachusetts Department of Agricultural Resources
New Hampshire Department of Agriculture, Markets and Food
Rhode Island Division of Agriculture
John Merck Fund
Vermont Agricultural Innovation Center

2011 New England Beef-to-Institution Marketing Study
Page 1
Contents Executive Summary ............................................................................................ 4
Conclusions ................................................................................................................................. 4 Buyers and price sensitivity .................................................................................................... 4 Market Size, Scope - Buyer Responses Extrapolated to Total Institutional Population ......... 5 Models .................................................................................................................................... 6 Hurdles/Making It Happen ................................................................................................... 11 Trends ................................................................................................................................... 12 Findings ................................................................................................................................. 12
Recommendations .................................................................................................................... 16 Needs .................................................................................................................................... 16 Action Plan & Budget ............................................................................................................ 18
Contacts for Next Steps ..................................................................................... 19 Methodology .................................................................................................... 25
Background Literature Review .................................................................................................. 25 Data gathering .......................................................................................................................... 25
Institutional Buyers ............................................................................................................... 25 Producers .............................................................................................................................. 30 Processors ............................................................................................................................. 31 Distributors ........................................................................................................................... 32
Background ....................................................................................................... 33
Growing Interest in Local Food ................................................................................................. 33 Local Meat Feasibility Studies ................................................................................................... 35 Dairy Beef .................................................................................................................................. 38 Initiatives Connecting Institutional Markets with Local Foods ................................................ 38 Partners/State Agencies ........................................................................................................... 40
Food banks ............................................................................................................................ 40 Farm to School Networks ...................................................................................................... 40
Regulatory & Commodity Purchasing ....................................................................................... 41 How USDA Agricultural Marketing Service (AMS) Purchases Are Administered ................. 41 Department of Defense Fresh Foods Program ..................................................................... 42 Beef Purchasing Standards ................................................................................................... 43 Meat Processing Inspection Requirements .......................................................................... 43

2011 New England Beef-to-Institution Marketing Study
Page 2
Analysis of Data ................................................................................................ 46 Producer Analysis ...................................................................................................................... 46
Size & Scale ........................................................................................................................... 46 Culls ....................................................................................................................................... 47 Pricing & Markets .................................................................................................................. 47 Institutional Sales .................................................................................................................. 49 Challenges ............................................................................................................................. 50 Producer Conclusions ........................................................................................................... 51
Processor Analysis ..................................................................................................................... 52 Capacity ................................................................................................................................. 52 Product Capabilities .............................................................................................................. 55 Use of and Method of Acquiring Local Beef ......................................................................... 55 Servicing institutions ............................................................................................................. 56 Distribution ........................................................................................................................... 57 Carcass Yields ........................................................................................................................ 59 Processor conclusions ........................................................................................................... 59
Distributor Analysis ................................................................................................................... 61 Ground Beef Product ............................................................................................................ 61 Storage Capacity ................................................................................................................... 63 Vendor Requirements ........................................................................................................... 63 Demand and Availability ....................................................................................................... 63 Pricing & Price Fluctuations .................................................................................................. 63 Hurdles .................................................................................................................................. 67 Mission driven models .......................................................................................................... 67 Distributor Conclusions ......................................................................................................... 67
Institution Analysis .................................................................................................................... 68 Segment Representation ...................................................................................................... 68 Product Type ......................................................................................................................... 69 Demand ................................................................................................................................. 71 Source ................................................................................................................................... 71 Packaging .............................................................................................................................. 71 Pricing .................................................................................................................................... 71 Price Fluctuation ................................................................................................................... 74 Decision Making .................................................................................................................... 74 Operational Considerations .................................................................................................. 77 Insurance Liability ................................................................................................................. 77 Ordering Cycles ..................................................................................................................... 77 Measurement........................................................................................................................ 78 Institution Segmentation Analysis ........................................................................................ 79 Institutions Conclusion ......................................................................................................... 90

2011 New England Beef-to-Institution Marketing Study
Page 3
Appendices ....................................................................................................... 92 Appendix A: Literature & Internet Resources Appendix B: List of Persons Consulted Appendix C: Detailed Institutional Price Responses Appendix D: Sampling of USDA Commodity Bid Contract Awards 2008 Appendix E: Current USDA 2011 Commodity Bids, Volume and Price Points Appendix F: Institutional Food Market Coalition Model Appendix G: Producer Survey Appendix H: Processor Survey Appendix I: Distributor Survey Appendix J: Institution Survey Appendix K: Follow Up Report on the Regional Ground Beef to Institution Marketing Study
Webinar Presentation & Panel Discussion

2011 New England Beef-to-Institution Marketing Study
Page 4
Executive Summary The goal of this study is to assess the institutional demand for regionally grown ground beef; analyze the logistics and infrastructure required to support such demand; and if feasible, propose a model that could be replicated amongst the New England states to source, process, market and distribute regionally grown ground beef to institutions. The study concluded that:
• There are opportunities for growth in the use of local beef in institutional markets in all six New England States
• The bulk of the need (86%) is for raw, bulk ground beef, with no additional processing (pasteurizing, cooking, spicing, shaping, or scoring) required
• Two models are currently in use that could be replicated on a regional basis to service this demand.
Conclusions
Buyers and price sensitivity Within this market segment we discovered two distinct audiences: 1) Buyers who have more autonomy and decision-making control, whose primary decision
making factors are the animal management practices used to produce the beef they are buying and a desire to support the local economy. These are buyers who are willing to make the effort to seek out local beef if it is available. These buyers are largely hospitals, higher education institutions, and private establishments. 29% of the respondents said they would prefer to buy their locally sourced product direct from a producer.
These buyers have a maximum price threshold of $4-5/lb for locally sourced ground beef.
2) Buyers who are price sensitive and driven by routine. Buyers whose primary purchasing
decision making factors are price and the degree to which the product is incorporated into their existing order and purchasing mechanisms. These buyers are largely K-12 schools, higher education, and food service management companies, and the distributors that service them. 53% of the respondents said they would prefer to buy their locally sourced product from their distributor.
These buyers price sensitivity hovers around $2-3/lb.

2011 New England Beef-to-Institution Marketing Study
Page 5
Market Size, Scope - Buyer Responses Extrapolated to Total Institutional Population Survey respondents represent 8% of the total institutional population in New England. Survey respondents utilize a total of 495,264 pounds of ground beef annually. Of this, respondents noted that they would purchase up to 25% of their total volume needs from a local source if the source could hit a $2-3 per pound price point. According to respondents, 86% of their demand is for un-pasteurized, un-cooked, bulk, ground beef. If one extrapolates this to the total institutional population base, 495,264 pounds equals 8% of 6,190,800 pounds. Therefore total annual New England institutional demand for ground beef approximates 6,190,800 pounds. 86% of the total institutional demand, 5,324,088 pounds is for bulk, ground beef. 25% of 6,190,800 pounds equals 1,547,700 pounds. This means at $2-3 per pound, the initial size and scope for a local beef to New England institutional market equals 1,547,700 pounds per year of which 1,331,022 pounds is raw, bulk ground beef. If one assumes the average 3-5 body condition dairy or non-freezer trade grade beef represents 384 pounds of ground beef,1 then this market has the potential to divert up to 4,030 regional culls into the New England institutional food supply on an annual basis. The table on the next page lists each state’s price sensitivity threshold and the institutional market segments that support that price point. This table can help processors and producers evaluate potential geographic regions, types of institutions, and products to serve and conduct financial analysis to evaluate the feasibility for their enterprise.
1 see Processor Analysis: Carcass Yields.

2011 New England Beef-to-Institution Marketing Study
Page 6
Price Sensitivity Threshold by State, Institution, and Product
CT MA ME NH RI VT Average All States
Bulk $2.64 $2.46 $2.88 $2.43 N/A $3.05 $2.69 C H S C H S C H S C H S N/A H
Patty (4 ounce)
$3.04 $2.55 $2.00 $2.78 N/A $3.08 $2.69 C H C H C H S C H N/A C H
Meatballs $1.88 $2.14 $1.83 $2.53 N/A $2.83 $2.24 C S C S C S C S N/A C S
Frozen uncooked
$2.55 $1.88 N/A $2.13 N/A $2.95 $2.38 H H S N/A H S N/A H
C=College/University H=Hospital S=Schools K-12
Models In our research we found examples of both price sensitive audience’s and source sensitive audience’s ground beef needs being met by a local product. Two models stood out as being replicable on a regional scale, a producer-driven model that is designed for the buyer with decision making control and a proactive desire to source local beef, and a processor-driven model designed to service the institutionalized process and price driven buyers. The models create opportunities for both beef producers and dairy farmers, as well processors in all six New England states.
The producer-driven model 1) is limited in its ability to create widespread regional impact on the amount of local beef sold
to institution markets
2) is best suited for small scale volume producers:
• who want to be involved in the sales transaction • for beef and dairy producers who are engaged in retailing beef and have direct sales
channels for other cuts from the animal • for producers who are charging a premium for their product
institutions:
• who are actively seeking local food • who want to take the time to develop a direct connection to the producer • who value specific attributes of the beef they buy, such as grass fed

2011 New England Beef-to-Institution Marketing Study
Page 7
• who have a flexible cost structure or budget to pay a premium for those attributes and the relationship.
The producer-driven model requires the producer to be the point person selling the product, and coordinating its processing and delivery. The producer-driven model offers the most opportunity for educational outreach and community building because of the direct connection between the farm and the buyer; it also offers the greatest opportunity for profitability for the producer. The producer-driven model also presents the greatest logistical hurdles, it is time consuming and complicated on the buyer end, it is time consuming and complicated on the producer end, it can be difficult to secure processing services, and variability in quality of those services can be damaging to the long-term success of the business relationship.
Producer-Driven Model Pros:
● Can provide direct sale profit margins for producers ● Premium product for buyer ● Ability for secondary benefits such as community education/ag
education/food education ● Ability to “Know Your Farmer” ● Ability to develop direct, long lasting relationships ● Ability to make a deep, meaningful impact on a narrow audience of
producers and institutions Cons:
● Time consuming for producer and for buyer ● Small scale/single animal transactions ● May not be of value to beef producers who command a higher price
point than even committed institutions with discretionary budgets can afford
● Will not alleviate the issue of dairy culls being shipped out of state and resold back as commodity ground beef
● Dependent on processor availability/quality of services ● Will make a significant impact on a few individuals but by and large will
not benefit the majority of the producer or institutional population

2011 New England Beef-to-Institution Marketing Study
Page 8
The processor-driven model 1) offers the majority of the opportunity for regional beef to enter the institutional market.
2) is best suited for:
farms: • that have culls as a cost center and need to find the most efficient and economical
return on investment for them. • that are not seeking diversified markets or new enterprises.
buyers:
• That are price and process driven institutional buyers who may value the concept of buying local but whose budgets and routine still dominate their decision making.
processors: • who are seeking opportunities to create markets for themselves • who have established sales channels and markets • who are interested in expansion or optimizing efficiency and return on assets of
existing infrastructure • who are resourceful
In this model, the buyer-seller relationship is anchored around the processor and the institution or wholesaler servicing the institution. The processor-driven model presents several advantages to serving the institutional market. These advantages enable the processor-driven model to overcome five otherwise insurmountable hurdles to large scale penetration of the institutional market: 1) Sufficient volume of product 2) Streamlined ordering and delivery system 3) Access to processing services 4) Cost efficient processing 5) Ability to compete on price Processor-driven model advantages: Access to unlimited raw materials The average annual cull rate on conventional dairies is one third of the mature dairy head. The cull rate reported from the producers interviewed for this research ranged from 19% for dairy to 2% for beef. At the time of this report, New England had 216,100 mature dairy, not to

2011 New England Beef-to-Institution Marketing Study
Page 9
mention its beef herds. Even at a 19% cull rate, this represents 41,059 culls available to supply local demand, more than sufficient to meet the 4,030 cull needs on the institutional market. While 4,030 culls may be difficult for any one producer or group of producers to coordinate, processors have connections and relationships with a wide network of farms in their area, thus they have are well suited to initiate outreach and source culls as needed to meet buyer demand. Unlike producers, they are not limited by a single farm’s production. Because of this, the processor-model immediately resolves issues of insufficient volume and provides a streamlined sales channel for the buyer.
Control of Processing Services Because the processor also controls the processing services, they have the ability to resolve issues three through four at their discretion. By having authority over the processing schedule, the processor can elect to work overtime, evaluate the financial feasibility of expanding hours/days of kill floor use and cutting, and analyze the schedule to fit these animals in on slow days as ways to service the new market without compromising service to existing customers.2 By controlling the cut sheet, the processor can create a cut sheet aimed at optimizing efficiency and turning out volume, further creating processing efficiencies. Cut time for a custom cut-sheet can reduce productivity by 50% or more, slowing the process from one hour to two or more hours per animal.3 Existing Sales Channels for Prime Cuts According to the processors interviewed 50% of their volume is built around their own private label products in which they buy animals and resell the meat. Processors are experts at efficiently processing animals and harvesting all usable parts for sale. Their core competency is on processing and selling meat, in a business built around tight margins, it will be more effective for long term success and regional replicability for the processor to handle the responsibility of selling and marketing the remainder of the carcass to finance an institution’s purchase rather than requiring the buyer or producer to assume the role.
2Willingness to work after hours on such a project was cited from conversations held with processors, including Herring Brothers Meats and Adams Farm, June 2011. 3Cut times cited from conversation with Bill Tripp Locust Grove Farm, NY June 23, 2011.

2011 New England Beef-to-Institution Marketing Study
Page 10
While the processor-driven model does not represent significant monetary gain to farms or processors, it does present the opportunity for dairy farms to receive a better price for their culls than the traditional options currently at their disposal because it will pay the going commodity rate, without deducting commission or trucking fees, and since the animals’ destination is local, they will likely arrive less dehydrated and in better condition, yielding a better live weight. For processors it represents the opportunity to make marginal profit per unit, but with a high turn-over potential, thus reasonable increase to overall income over time. This increase in work flow will also improve return on assets, increase year round cash flow, and encourage retention and expansion of trained work staff and hours of operation. The processor-driven model works when the price point, including any distributor mark-up, falls within an institution’s price sensitivity range. This range will be largely based on the current commodity pricing for ground beef, the type of institution, and the volume the institution is buying. The range will fluctuate up and down corresponding to the market. The feasibility for a
Processor-Driven Model Pros: ● Improved (albeit marginal) price for culls to producer ● Competitive price for buyer ● Marginal per unit profit, but high volume for processor ● Ability to increase processor volume, improving return on assets,
increasing cash flow, increasing retention and expansion of trained staff
● Ability for processors to automate the process to optimize efficiencies and potential for profitability
● Has the potential to make a broad impact to a large percentage of producers, processors, institutions
● Has the ability to redirect dairy culls to stay local ● Streamlines ordering procedures and ease of access for buyers-
high volume single point of contact Cons • Sourcing regional beef does not fit most food service buyers’
current business models resulting in little to no demand thus will be a slow market adoption process requiring market development, someone to push the effort
● Will never be a high margin business

2011 New England Beef-to-Institution Marketing Study
Page 11
processor to be successful in this market will depend on operating expenses and the ability to derive income from the other parts of the animal. In general, what the processor charges per pound for the ground beef needs to at a minimum cover the cost of purchasing and processing the animal. The opportunity for profit will come from the income received for the other cuts of the animal. Theoretically, the main variable affecting the price of ground beef is the price paid for the animal. This occurs when the processor’s operating expenses and volume of ground beef to live weight ratio stay relatively constant, and the spread between the price paid for the animal and the price charged for the ground beef covers the operating expenses. On average this is also the single variable affecting the price fluctuations of the global market. As long as the local product is competitive at any one point and time, it should remain competitive at any and all times, even with global market fluctuations because it will be trending up and down in a static ratio to the global market price at a ratio that has already been deemed acceptable by the buyer. Financial viability will therefore be dependent on the spread between the going rate for culls, the going rate for ground beef, and the spread needed in between for the processor and distributor to break-even/make a profit. In general the processor/price sensitive driven model can work as long as:
● the processor can generate break even or better off the ground beef and generate profit
from harvesting and selling other parts of the carcass such as tenderloins and rib eyes.
● the price to institution including any distributor markup can still hit the $2.00-3.00/lb price range for bulk ground beef.
Hurdles/Making It Happen Up until now, the effort to increase sourcing of local ground beef into the institutional market has been largely accomplished on an individual basis. Until stake holders decide to push (invest the time and energy to cultivate the markets), and buyers decide to pull (demand local product), distributors and food service management companies will not allocate resources to supporting local ground beef, and the effort will be of little impact. Katherine Sims of the Green Mountain Farm to School Network expressed it this way: “We still need to actively reach out to schools with access to locally grown ground beef; the schools are not yet begging for it.”4 Unless there is buyer demand, distributors will not push the product because warehouse space is limited and priority is given to products with high turnover.5
4Louise Calderwood conversation with Katherine Sims, August, 2011. 5Distilled from conversations with distributors, including Sysco, August 2011.

2011 New England Beef-to-Institution Marketing Study
Page 12
To capitalize on the opportunities and encourage large scale, regional adoption, significant investment in time and resources will be required for market development. Because of low profit margins it is unlikely that any effort could be driven long term by a third party, but as producers and processors may already have limited access to manpower and financial resources, having initial assistance from a third party to drive market acceptance and create pull would greatly expedite the rate of acceptance along the supply and demand chain.
Trends With respect to trends, the study found minimal difference in responses by state. Rather the differences were found to be from the type of institution and producer responding. For example, regardless of what state was being researched, price was volume dependent. Hospitals currently demand the least volume of ground beef, and were paying the most, followed by colleges who used more than hospitals but who paid less than hospitals, and K-12 who used the most and paid the least. Similarly, regardless of state, the producers fell into two groups: dairy producers who have culls as a by-product of their primary operation and who try to minimize their sunk cost when they discard these assets; and beef producers whose profit centers around their beef animals, who have few non-prime animals, and who are selling even their non-prime beef for a premium. There were two exceptions to a general lack of geographic trends:
1. Vermont’s institutions had a higher price sensitivity threshold than the other states. 2. Rhode Island institutions by and large did not participate in the research.
Perhaps Vermont’s price threshold can be at least partially attributed to the attention being given to local food through recent initiatives such as the statewide buy local campaign, the burgeoning localvore movement, and the various recent studies centered on the local agricultural economy. It may be that over time these have begun to influence a change in the customer mindset regarding buying local, price sensitivity, and qualitative properties of the products they purchase. With respect to Rhode Island, it is believed that the higher prevalence of the use of contracted food service companies was what led to zero completed responses, and that this could signify or exemplify the disinterest of outsourced food service providers in altering existing business models to accommodate local or regional meat.
Findings
Producers From the producers interviewed, which included a sampling from organic and conventional beef and dairy, small and large herds across each state, the conclusion is that producers,

2011 New England Beef-to-Institution Marketing Study
Page 13
whether beef or dairy, selling culls or prime animal, have two primary decision making factors they use to gauge new markets/outlets: price and the value of their time. On average, producers interviewed offered $0.65/lb live weight as a fair price for dairy culls and $0.81/lb live weight for non-prime beef animals. Given the present value-proposition for engaging the institutional market is only marginally better or equivalent to the current outlets producers have at their disposal it is not worth a producer’s time to pursue unless the buyers and processors initiate the transaction. In ending comments, many of the producers contacted expressed similar hopeful sentiments for providing local beef to the community. Their comments tempered hope with caution and skepticism from experience. In general, producers interviewed were interested in the project and longed for local institutions to serve local beef to their communities, mentioning children, other family members, and friends who eat at such institutions as personal reasons why they would like local meat to be served.
Processors Similar to the producers, processors expressed skepticism mixed with a sense of hope that this could work out. They were aware of the reality of the commodity driven landscape, yet maintained a personal and empathetic desire to be able to keep things local if it were possible. “I do think there is a need for this, if it could happen. We are shipping loads and loads of beef out of New England, and it should stay here, because it comes back here anyway. There is a need to keep things local.”6 Processors do feel that even with their existing infrastructure they could increase what they are doing and fulfill some institutional volume. They are used to working on margins and are not only looking at the profit this opportunity represents but how it might boost other elements of their business for over-all improved viability. A proven processor-driven model that can be replicated and is in use in at least two states with favorable outcomes reported for all parties is one in which the processor buys in animals for resale, develops relationships with the buyers or distributors, services their needs, and harvests other elements of the carcass for resale to help make the model financially viable while remaining within the institutional market’s price sensitivity for ground beef.
6 Kate Rumley telephone conversation with Arnold Luce, Luce’s Maine Grown Meats, June 27, 2011.

2011 New England Beef-to-Institution Marketing Study
Page 14
Two examples of the Processor-Driven Model are presented for Financial Analysis
Processor 1 in 2011 was ○ paying $0.80/lb live weight ○ charging $2.15/lb for 80:20; $2.25/lb for 85:15 ○ average spread to cover operating expenses = $1.40/lb; ○ 27% of income came from non-ground beef product sales ○ distribution: some institutions retrieve the product themselves, others use a
wholesaler who applies a 12-15% mark up ($.34/lb). ○ Total cost of ground beef to institution: $2.15-$2.59/lb
Processor 2 in 2010 was
○ paying $0.61/lb live weight ○ charging $2.30/lb ○ average spread to cover operating expenses = $1.69/lb ○ 14% of income came from non-ground beef product sales ○ regular K-12 wholesaler stored and delivered the meat, potential surcharge to
school of 12% ($.27/lb). ○ Total cost of ground beef to institution: $2.30-2.57/lb
Distributors While distributors maintain large, efficient warehouses, their business models require rapid movement of goods in and out of their buildings. Sales staff make frequent requests for the addition of new items into the product line offered, however, the products that receive attention and longevity in the line-up are those that can demonstrate demand and high turn-over. To date, locally sourced fresh ground beef for the institutional market has not been in high enough demand to warrant strong consideration and push by the distributors. However, if the ground beef providers can meet the buyers’ needs, there is opportunity, even in the face of vertical integration within the industry, and the product need not be pasteurized. A simple, fresh, bulk, ground beef will suffice. To provide an example of the degree to which there is opportunity: Sysco owns USDA inspected facilities for in-house fabrication of meat products, however, due to liability concerns it refuses to produce its own ground beef. Ground beef is one of the few products in which distributors want to maintain a clear demarcation between their company and ground beef processing, and given this, they are more than willing to work with outside vendors.

2011 New England Beef-to-Institution Marketing Study
Page 15
Institutions Of the three institutional market segments, the healthcare industry represents the easiest point of entry for both producers and processors. There are several reasons:
• Hospitals appear to be early adopters • They have the highest price point and elasticity • From large scale to small scale (less than 100 beds to greater than 250 beds) they are
interested in local beef. • They are aware of the potential health benefits of certain types of meat and are willing
to pay a premium for these attributes. • They are evenly split between those who want to buy direct and those who want to buy
through a distributor. • They tend to have more autonomy and are independently managed.
While hospitals represent the easiest point of entry for both the producer and processor-driven models, they represent the smallest volume needs of the institutional market and therefore higher education and K-12 should not necessarily be overlooked. The bottom line is, if we extrapolate out the survey results to the entire New England Institutional Market:
1. 29% of the institutional population is seeking a direct relationship with a producer and has a sensitivity threshold that can reach as high as $4-5/lb for ground beef, if the product has certain attributes such as single source, grass fed, certified organic, etc.
2. 53% of the institutional population is interested in purchasing local product with local being the key attribute, if it came from their existing distributor.
3. The total New England institutional market uses approximately 6.2 million pounds annually.
4. Institutional buyers are willing to replace up to 25% of their total volume, representing an opportunity to source up to 1.55 million pounds, with a locally sourced product if suppliers can hit a $2-3/lb price point.
5. 86% of this volume, 1.33 million pounds is purchased as bulk, ground beef, requiring no further processing (no pasteurizing, shaped and formed, cooked, flavored, etc).

2011 New England Beef-to-Institution Marketing Study
Page 16
Recommendations Based on the conclusions, the research recommendations are as follows:
Needs 1. Processor Enterprise Analysis To ensure as positive and successful a long-term outcome as possible, it is important for each processor to make certain it makes financial sense for them before focusing on the institutional market. It is recommended that business planning/financial consultants be hired to assist processors evaluate the opportunity one-on-one, as it pertains to their business. Key questions:
1. what are their per unit operating expenses? 2. would the spread between what they paid for the animal and what they could charge to
the institutions for the ground beef cover their per unit operating expenses? 3. Do they have outlets for any other cuts they could salvage, what are the price points
they could receive for those products, and any costs associated with selling them? 4. What is the net per unit income potential from the processor-driven model for this
particular business? Is it break-even or better?

2011 New England Beef-to-Institution Marketing Study
Page 17
2. Market Development
● Facilitate Processor Outreach
Assist processors connect with the buyers and distributors in their area to assess market demand, and begin the sales relationship process. Continue to cultivate product demand and awareness, and nurture the buyer-seller relationships through on-going outreach to processors, distributors, and institutional buyers.
● Facilitate Producer Outreach Conduct outreach to producers raising beef for direct sale and present them with the opportunity to make outreach to interested institutional buyers in their area. Assist them with connecting the dots with the buyers seeking a direct connection to the farmer. Focus on buyers and distributors in Higher Education and Hospitals.
• Affect long term change through championing revisions to the commodity bid program
in the Farm Bill at the federal level. If New England wants to encourage local agricultural economic development, it must look at bottlenecks in the larger system and how they can be overcome.
Advocate for the following changes:
1. The commodity bid program could be broken into a state by state bidding process.
Having each state as a separate bid enables all businesses both large and small, local and non-local, the opportunity to bid. With the current bidding process, bids are not broken out by state or region, precluding small or regional businesses from participating. Having each state as a separate bid will encourage local businesses to consider serving the needs of their states and surrounding states.
2. Advocate for a definition for micro-enterprises for beef processing. At present the commodity bid program gives preference to “small businesses” but the designation for a small meat processing business is 500 employees. This definition is still far larger than any of the processors in New England, and provides no advantage.

2011 New England Beef-to-Institution Marketing Study
Page 18
Action Plan & Budget 1. Secure funding for each interested processor to conduct an enterprise analysis/feasibility
study for entering the institutional market
Cost: $4,000-10,000 per processor 2. Hire Agency of Agriculture Staff or coordinate with another third party entity to assist with
market development. Goal: to expedite adoption of the producer and processor driven models by both the buyers and suppliers. Tasks include: • outreach/networking (marketing and logistics facilitation) to processors, distributors,
and institutional buyers to begin the conversation of the processor driven model, create awareness and demand, and assist individuals overcome hurdles
• outreach/networking to producers to disseminate the report with the list of pre-qualified prospects for direct sale, and assist them with communication and overcoming hurdles.
• Work with K-12 to help schools creatively allocate commodity and non-commodity dollars.
• Advocate supporting and encouraging changes to the Farm Bill as recommended. • Should changes in the Farm Bill be implemented,
o educate processors about the opportunities o assist them with the bidding procedures o provide education and outreach to institutions to make them aware when local
suppliers are available and are bidding on state or regional bids.
Cost: 1.0 FTE at a (Vermont) state employee pay grade of 21.
Fixed Expenses Salary and Benefits $60,000 Travel, estimate 200 miles per week at $0.48/mile $ 5,000 $65,000

2011 New England Beef-to-Institution Marketing Study
Page 19
Contacts for Next Steps On the following five pages readers will find contact information for individuals interviewed who were interested in participating in either supplying or purchasing local ground beef. The information is in table format. For producers, processors, and distributors there is a column indicating which model each individual would prefer to operate under. For all audiences there are columns identifying how the individuals might wish to be involved in helping launch this initiative, from passive participant to leading the effort. Please note that the contacts list is not by any means exhaustive. It does not represent the entirety of any audience’s total population base. There are institutions, processors, and producers who may not have been contacted or who may not have responded to the survey who may be interested in pursuing this market. This list is intended as a template and an active database that can be added on to and updated to facilitate networking by providing a pre-qualified list of market prospect leads for processors and producers, and by providing a pre-qualified list of supplier contacts for proactive buyers.

Dairy Producers Interested in Selling Local Beef to Institutional Market
Leader Active participantPassive Participant Farm Contact Phone Address
Processor-Driven X Devine Farm Inc John (413) 549-5253 26 Knightley Road, Hadley, MA 01035
Processor-Driven XSmith’s Country Cheese Dave Smith (978) 939-2778
[email protected] Otter River Road, Winchendon, MA 01475
Processor-Driven X Shaw Farm Dairy & Ice Cream Stand Warren Shaw (978) 957-0031 195 New Boston Road, Dracut, MA 01826
Processor-Driven X Pearson's Elmhurst Dairy Farm Robert Pearson (508) 865-2158 342 West Main Street, Millbury, MA 01527
BothOake Knoll Ayrshires Terri Lawton (774) 219-6257 cell ; home (508) 543-
6460; [email protected] North Street, Foxborough, MA 02035
Both XCarter and Stevens Farm Molly (978) 355-4940; Molly's phone: 978-
314-2879; [email protected]
500 West St. (Rt. 122), Barre, MA 01005
Both X Bohanon Farm Jamie Robertson (603) 746-4633 945 Penacook Rd, Contoocook, NH 03229Maybe; Both Crescent Farm Sheldon Sawyer (603) 756-4047 (maybe 4049) 420 Wentworth Rd., Walpole, NH 03608
Processor-Driven X Miller Dairy Peter Miller (802) 254-5304 Vernon, VTBoth X X Brotherly Farm Organic Craig Russell (802) 276-9904 Brookfield, VTBoth X Kimball Brook Farm Cheryl JD DeVos (802) 425-3618 North Ferrisburgh, VT
Processor-Driven XPine Hill Jerseys Steven (207) 872-6533
[email protected] Garland Rd Winslow, ME
Grassland Farm T. Garin (207) 474-6864 41 Grassland Ln., Skowhegan, ME [email protected] Ackley Farm Robert (207) 374-5919 42 Ackley Farm Rd, Blue Hill, ME
Processor-Driven XCastonguay Ayrshires, LLC Mary (207) 897-3724
[email protected] Richmond Hill Rd Livermore, ME
Producer-Driven X Smith Family Farm Lucian (207) 288-4848 317 Crooked Rd, Bar Harbor, ME
Processor-Driven XFreund's Farm Ben Freund (860) 824-7524
[email protected] Norfolk Rd, East Canaan, CT 06024
CT
If a program were created to help initiate this effort (market development), how would you like to be involved?
Preferred Participation Model
NH
MA
VT
ME

Beef Producers Surveyed Indicating an Interest in Local Beef to Institutional Market
LeaderActive participant
Passive Participant
Farm Contact Phone Address e-mail
Both X Apple Valley Galloway Farm Johanna (413) 628-4773 1739 Hawley Road Ashfield, MA [email protected]
Producer-Driven X
Ioka Valley Farm Don Leab (413) 738-5915 and (413) 770 1657
PO Box 1045 Hancock MA 01237 [email protected]
Producer-Driven X
Springdell Farm Paula Robinson (978) 486-3865 (978) 486-3726
571 Great Road Littleton MA 01460 [email protected]
Both XBroad Brook Beef - From Double H Farm
Herb Holden (860) 250-3311 47 Broad Brook Road, Broad Brook CT 06016; PO Box 307 Hartford County
Producer-Driven X
Stuart Family Farm Deb Stuart (860) 210-0595; 860-210-1425
191 Northrup Street, Bridgewater, CT 06752; mailing address: 38 Town Line Road Bridgewater CT 06752
Processor-Driven X
Heywood Farm Robert Heywood, Adam Heywood, Joshua Heywood, Daniel Heywood
(401) 232-0554 1828 Atwood Avenue Johnston RI [email protected]
Both XWatson Farm Don and Heather
Minto(401) 423-0005 455 North Road, Jamestown, RI [email protected]
Producer-Driven X
Windmist Farm Martha Neale (401) 529 9951 423 9767
71 Weeden LaneJamestown,RI 02835
Producer-Driven X Archer Angus: Ray and Linda Buck (207) 491-6354 209 Archer Road, Chesterville, ME 04938 archerangus.com
Producer-Driven
Grassland Farm T. Garin (207) 474-6864 41 Grassland Ln., Skowhegan, ME [email protected]
Producer-Driven
Old Ackley Farm Robert (207) 374-5919 42 Ackley Farm Rd, Blue Hill, ME
If a program were created to help initiate this effort (market development), how would you like to be involved?
Preferred Participation Model
MA
CT
RI
ME

Processors interested in Selling Local Beef to InstitutionsPreferred Participation Model Name Contact Phone Email Activity Street City State ZipCT
Processor-Driven Bristol Beef Art Birallio (860) 589-9969 Slaughter 785 Middle Street Bristol CT 06010Processor-Driven Baretta Provision Bill or Dan 860-828-0802 Processing (no slaughter) 172 Commerce Dr. East Berlin CT
Processor-Driven Litchfield Locker Bob 860-567-5448 Processing (no slaughter) 205 East Street, P.O. B Litchfield CT 06759MA
Processor-Driven Adams Farm Slaughterhouse LLC Ed Matlby (978) 249-9441 [email protected] Slaughter Processing 854 Bearsden Road Athol MA 01331ME
Processor-Driven Herring Brothers Inc. Trey (207) 876-2631 [email protected] Slaughter, Processing 346 Water Street Guilford ME 04426
Both Luce’s Maine Grown Meats Arnold Luce (207) 635-2817 Slaughter, Processing 366 Embden Pond Road North Anson ME 04958
Processor-Driven Sanford Butcher Shop Paul (207) 324-2800 Slaughter, Processing 578 Lebanon Street Sanford ME 04073NH
Producer-Driven Lemay and Sons Rick Lemay 603-622-0022 [email protected] Slaughter, Processing 116 Daniel Plummer Rd Goffstown NH 03045RI
Processor-Driven Rhode Island Beef & Veal Joel (401) 474-6855; (401) 232-7220 Slaughter, Processing 60 Armento Street Johnston RI 02919VTBoth Vermont Livestock, Slaughter & ProcessinCarl Cushing 802-877-3421 Slaughter / Processing 76 Depot Road Ferrisburg VT 54569692
Producer-Driven The Royal Butcher, LLC Royal 802-728-9901 Slaughter / Processing 882 VT Rte 12A Braintree VT 05060Both Westminster Meats Dan Mandich (802) 722-3133 dmandich@westminstermea Slaughter / Processing 52 Seafood Lane Westminster VT 05159NY
Processor-Driven Hilltown Pork 518-781-4050 12948 Rte 22 (Mass Pike to Canaan NY 12029Both Locust Grove Farm 518-638-8591 Slaughter / Processing 4725 State Rte 40 Argyle NY

Distributors Who Responded Stating An Interest in Selling Local Beef to Institutions
LeaderActive participant
Passive Participant
Business Name Name First Name Last Business Street Address
Town State Zip Region Served Phone Email
Processor-Driven XD&S Distributers Don Maynard 85 Ind Park Rd Hardwick VT Northeast Kingdom
Processor-Driven X Dennis Paper & Food Service Company
Chris Caler 101 Mecaw Road
Bangor ME 04401 ME 207-947-0321 [email protected]
Both X Reinhart (formerly burlington food service)
Fernando Cresta 784 Hercules Drive
Burlington VT MA/VT/NH/NY 802-655-7595x310
Processor-Driven Sysco Northern New England Louie Cavallero 36 Thomas Drive
Westbrook ME 04092 New England 800-632-4446; 207-871-0700
http://www.sysconne.com/ordereze/1070/Page.aspx
Both X Upper Valley Produce Allen Freund Waterbury VT VT 800-281-7161 [email protected]
Both Black River Tom Biggs VT 802 230 4800 x 14
Dole & Bailey Carl Dematteo New England 339-440-2200 [email protected]
XDonabedian Brothers Greg/Susan Donabedian 475 S
BroadwaySalem NH 03079 Rockingham, NH 603-898-9781 [email protected]
If a program were created to help initiate this effort (market development), how would you like to be involved?
Preferred Participation Model

Institutions Interested In Buying Local Beef
Type of institutionPreferred Method of Sourcing Local Beef
Being part of Effort/Interest in Buying Local Beef Leader
Active participant Join Name Job Title Institution Address City/Town State
Zip Code Phone Email
School Distributor Maybe No Maybe Maybe Gail Sharry Child Nutrition Manager New London Public schools 134 Williams Street New London CT 06320 860-447-6064 [email protected] Distributor Yes No Maybe Yes Barry Sbordy Food Service Director Putnam Public Schools 33 Wicker Street Putnam CT 06260 860-963-6933 [email protected]
School Distributor Yes Yes Timothy Cipriano Executive Director New Haven Public Schools 75 Barnes Ave New Haven CT 06513 203-946-8813 ext [email protected]
School Distributor Yes No Maybe Yes Tim Paquette Food service Director Stonington Public Schools 40 Field Street Pawcatuck CT 06379 869-599-0766 [email protected] Distributor Maybe No No Maybe Mansfield CT [email protected]/University Distributor Maybe No No Yes Jody Thompson GM Sodexo Western Connecticut State University 181 White St. Danbury CT 06810 203-837-8764 [email protected]
School Distributor Yes No No Yes Ernie Koschmieder Director Food Services Windham Public Schools 322 Prospect Street Willimantic CT 06226 860-465-2608 [email protected]
College/University Distributor Maybe No Maybe Maybe Paul Denaro Assistant Director Dining Services Tufts University 89/91 Curtis St Medford MA 02155 617-627-3596 [email protected] Farmer Maybe No No Maybe Megan Food Service Director Town of Braintree 128 Town St Braintree MA 02184 781-380-0144 [email protected] Distributor Maybe No Maybe Yes John Overcash Food Service Director Littleton Public Schools 55 Russell Street Littleton MA 01460 9784868938 x 1243 [email protected] Distributor Maybe No Maybe Maybe J. Mendes Food Service Director Berkley Public Schools 21 N. Main Street Berkley MA 02779 508 884 9434 x 318 [email protected] Processor Maybe No No Yes Ken Whittier FSD Bedford Public Schools 97 McMahon Rd Bedford MA 01730 781-275-9129 thgedgersSchool Distributor Maybe No Maybe Catheirne Donovan FSD Hamilton-Wenham Schools 787 Bay Road Hamilton MA 01982 978-468-0398 [email protected] Distributor Maybe No No No Susan Murray Food Service Director Duxbury Public Schools 130 St. George Street Duxbury MA 02332 781-934-7669 [email protected]
Hospital/Healthcare Distributor Yes No Yes Yes Roger M. KnyshDirector of Nutrition and Foodservices
Fairview Hospital, Berkshire Health Systems 29 Lewis Ave. Great Barrington MA 01230 413-854-9618 [email protected]
College/University Distributor Yes Yes Kathleen Zieja Director Smith College 30 Belmont Ave Northampton MA 01063 413-585-2300 [email protected] Distributor Yes Yes Ann Pitzen Food Service Director Leicester/Auburn Schools 1078 Main Street Leicester MA 01524 508-892-7040 x113 [email protected] Farmer Yes Yes Yes Yes Alden Cadwell Food Service Director Concord Public Schools 120 Merriam Rd Concord MA 01742 ------ [email protected] Farmer Yes Yes Bob Kinch Food Service Director Maynard Schools 3 Tiger Drive Maynad MA 01754 978-897-6100 [email protected]/University Distributor Yes Maybe Yes Eric Johnson Food Production Manager Sodexo 100 State Street Framingham MA 01701 508.626.4066 [email protected]
School Distributor Yes No Maybe Yes Andrew Stratton Director of Dining ServicesChartwells, Granby Public Schools & Easthampton Public Schools 200 Park Street Easthampton MA 01027 413-529-1535 [email protected]
College/University Distributor Maybe No No Maybe Frank Gillespie FSM Sodexo Gordon-Conwell Theological Seminary 130 Essex St. South Hamilton MA 01982 978-468-7111 [email protected]
School Farmer Maybe Yes Judith Campbell Director of School Nutrition Scarborough schools 9 Wentworth Dr Scarborough ME 04074 207-730-4701 [email protected] Farmer Yes Maybe Deborah Dolley Food Service DIrector Falmouth Public Schools 74 Woodville Rd. Falmouth ME 04105 781-7429 [email protected] Distributor Yes No Yes Ron Adams Food Services Director Portland Ublic Schools 28 Homestead Ave Portland ME 04103 207-874-8231 [email protected] Farmer Yes Yes Doris Demers Director York School Nutrition Program 469 US Route One York ME 03909 207-363-5554 [email protected] Farmer Yes No Maybe Yes Mary Emerson School Nutrition Director MSAD 55 137 South Hiram Road Hiram ME 04041 207-625-2490 [email protected]/University Distributor Yes No Yes Mike Heffernan GM Sodexo@Colby-Sawyer College 541 Main St New London NH 03257 603-526-3770 [email protected] Distributor Yes Maybe Yes No Jim Connors Food Service Director Manchester School District 195 McGregor St. Manchester NH 03102 603-624-6300 x165 [email protected] Processor Yes Yes Justin Kitchen Mgr Milford High School 71 Souhegan St Milford NH 03055 603-673-4201 ext 3237 [email protected] Distributor Yes No No Yes Morgan Trahan Food Service Director John Stark Regional High School 618 No. Stark Highway Weare NH 03281 603-529-5305 [email protected] Distributor Yes Yes Jeanne Pierce DIrector Exeter Cooperative Schools 1 Blue Hawk Dr Exeter NH 03833 603 775 8449 [email protected]/Healthcare Farmer Maybe No Maybe Maybe Sam Fazio Food Service Director Alice Peck Day Memorial Hospital 125 Mascoma St. Lebanon NH 03766 603-448-3121 [email protected]/University Distributor Yes Maybe Yes ChrisMongeon Food Service Director Plymouth State University MSC 20, 8 High St. Plymouth NH 03265 603.535.2710 [email protected]
Hospital/Healthcare Farmer Maybe No No No Sheila R. Delworth Food Purchasing Northeastern Vermont Regional Hospital Hospital Drive St. Johnsbury VT 05819 802-748-7479 [email protected] Processor Maybe Maybe Yes Heather Champney Kitchen Manager Mettawee Community School 5788 VT Rte. 153 West Pawlet VT 05775 802-645-9009 [email protected] Distributor Maybe No Maybe Maybe Christine LaPointe Director of Nutritional Services South Burlington School District 500 Dorset St South Burlington VT 05403 802-652-7160 [email protected] Processor Maybe Maybe Peggy Meunier Food Service Director Shelburne Community School 345 Harbor Road Shelburne VT 05482 802-383-1112 [email protected]
Hospital/Healthcare Distributor Yes No Yes NoLaura Brace, CDM, CFPP Director of Nutrition Services Porter Medical Center 115 Porter Drive Middlebury VT 05753 802-388-4775 [email protected]
School Distributor Yes Yes Yes Nicole Fournier Food Service Director The Abbey Group 6212 Vt Route 105 Enousburg VT 05450 802-373-1242 [email protected]
School Distributor Yes Yes Yes Steve Davis Food Service Director Colchester School District131 Laker Lane, PO Box 900 Colchester VT 05446 802-264-5706 [email protected]
School Distributor Yes Yes Wendy Howard FSM Montgomery Town School 249 School DriveMontgomery Center VT 05471 802-326-4618 [email protected]
School Farmer Yes Yes Maybe Paul Morris Foos Service Director Harwood Union High School 458 VT Rt 100 South Duxbury VT 05660 802 882-1113 [email protected] Farmer Yes Yes Alison Forrest Food Service Manager Brewster Pierce School 120 School St. Huntington VT 05462 802-434-2074 [email protected] Farmer Yes Yes Dave Horner Food Service Director Chittenden East Supervisory Union 211 Bridge Street Richmond VT 05477 802-249-2711 [email protected]
School Distributor Yes Yes Steven Marinelli Food Service DirectorFitz Vogt & Associates Barre City Schools 155 Ayers Street Barre VT 05461 802 476 6362 [email protected]
School Distributor Yes No No No Anne Coolidge Co-food Service Manager Monkton Central SchoolPO Box 40 1036 Monkton Rd Monkton VT 05461 802-453-2314- ext 30 [email protected]
School Distributor Yes No Maybe Maybe Leo LaForce Food Service Director Champlain Valley Union HS 369 CVU Road Hinesburg VT 05461 802-482-7176 [email protected]
School Farmer Yes No Yes Yes Karen Russo OSSU School Nutrition Director O.S. Supervisory Union 24 Central Street Randolph VT 05060802-728-3397 or 728-9555 [email protected]
School Distributor Maybe Yes Christopher Hunter Food Service Manager lts 2591 Lily Pd Rd Lyndonville VT 05851 802-626-3209 [email protected] Not Specified Maybe No No Yes Amanda Gifford Admin/Food Service Director Avalon Triumvirate Academy 1841 Main St Fairfax VT 05454 802-849-2488 [email protected] Distributor Maybe No Maybe Maybe Lisa Rock Food Coordinator Laraway Youth and Family Services PO Box 621 Johnson VT 05656 802-635-2805 x208 [email protected]
School Farmer Yes Maybe Yes Paul Lamarre Ex ChefSodexo Services@ St Johnsbury Academy 100 Main St St Johnsbury VT 05819 802-748-1041 [email protected]
School Farmer Yes No Yes Annette L Burrington Food Sevice & Nutrition Director Barnet School 163 Kid Row Barnet VT 05828 802-633-4678 [email protected] Farmer Yes Yes Jennnie Sweet Food Service manager Waits River Valley School 6 Waits River Rd East Corinth VT 05040 802-439-5534 [email protected] Farmer Yes Maybe Yes Yes John Vogt GM Sodexo 725 Veterans Ave. Newport VT 05855 802-624-0471 [email protected] Farmer Yes Yes Scott St John Food Director Cabot School PO Box 98 Cabot VT 05647 802-563-2289 [email protected] Farmer Yes Maybe Yes Laura Collaro Food Services Manager Lincoln Community School 1708 South Lincoln Rd Lincoln VT 05443 (802)453-5877 [email protected]/University Processor Yes Maybe Yes Melissa Zelazny FSM Sodexo University of Vermont 408 South Prospect St. Burlington VT 05405 802.656.4664 [email protected]

2011 New England Beef-to-Institution Marketing Study
Page 25
Methodology
Background Literature Review The study conducted an extensive review of existing research, literature, and data on local beef production, local processing infrastructure, institutional market demand and current mechanisms for servicing that demand, and preexisting organizational models connecting local production with institutional buyers. A summary of our findings follows, while a detailed list of all material reviewed and sources contacted is included in the appendices.
Data gathering Confidential survey questionnaires were created for each audience and hosted on Survey Monkey. An independent analyst reviewed and verified that the questions would lead to measurable outcomes and did not introduce any bias. In addition to this review the survey was sent to the participating State Departments/Agencies/Divisions of Agriculture for input. The surveys contain structured, unstructured and undisguised questions that were relevant to the subject matter. The questions were not lengthy, burdensome or ego threatening. Several determinant-choice questions were used requiring the respondent to select one answer from multiple choices. The language was simple with a reduction of ambiguity in some questions that allowed the respondent to check “other” and type in a response. Various scaling questions were used to obtain measurements.
Institutional Buyers The method of collecting the majority of the data was through surveying, via a questionnaire, to 431 institutions representing K-12 schools and/or districts, colleges or universities, and hospitals in the New England region. The questionnaire was sent to either the Food Service Director/Manager, Food Nutrition Director/Manager, Executive Chef, Director of Dining Services, Kitchen Manager or Dieticians. The survey was administered using the web-based software Survey Monkey. The recipient received an introduction cover letter email from the Vermont Agency of Agriculture with the link to the questionnaire. To increase response rates two follow-up reminders were sent and when necessary a follow-up phone call. For K-12 some State Agriculture Agency/Department personnel sent emails to their contacts informing and/or reminding them about the survey and with hospitals a sub-sample were sent an email from Healthcare Without Harm. In addition, an incentive (sponsored by the team, not the funders) to enter into a drawing for a $25.00 gift card was offered. We found this dollar incentive may be useful for some, but would likely recommend a larger incentive for future surveys. The recipient had the option to Opt-Out as

2011 New England Beef-to-Institution Marketing Study
Page 26
well as to contact the consultant or Agency of Agriculture personnel with any questions or requests. The cross-sectional study of the region received a 28.7% response rate. Of those responses 60.3% completed the entire survey thus, a 17% response rate representing 8% of the total institution population (beds/students).
Institutional Sampling The selection of participants surveyed was based on their role as key personnel in decision-making regarding food purchases and/or menu offerings. The sample size was determined by using ProximityOne demographic and population resources, American Hospital Association Survey Database for fiscal year 2009, several directories, and supplied lists from the State Departments/Agencies/Divisions of Agriculture and from Healthcare Without Harm. In addition, the sample population was reviewed to ensure major food service management company personnel were included such as Sodexo, Aramark, Abbey Group, and Fitz Vogt. Random sampling was used from the supplied lists to reduce self-selection bias when answering the survey questions. The total population of each segment is based on number of students for educational institutions and number of beds for hospitals, and is as follows: ● K-12 Students – 2,160,676 ● Colleges/Universities Students – 907,479 ● Hospital Beds - 43,566

2011 New England Beef-to-Institution Marketing Study
Page 27
K-12 The following chart depicts the K-12 Schools Population and Distribution
Schools Students % by state
Sample Size Enrollment
Sample Size Actual
Sample Size Contacts
CT 1,117 568,405 0.263 149,529 191,356 42
MA 1,878 962,806 0.446 429,030 463,368 140
ME 623 190,737 0.088 16,838 42,842 17
NH 488 200,772 0.093 18,656 113,485 29
RI 328 146,228 0.068 9,896 54,458 22
VT 329 91,728 0.042 3,894 13,051 36
Total 4,763 2,160,676 1.0 627,843 878,560 286
% Total 0.407 0.060 Source: proximityone.com/k12_state.htm The K-12 number of schools and sample size is based on number of enrolled students.

2011 New England Beef-to-Institution Marketing Study
Page 28
College and University The following chart depicts the College and University Population and Distribution
Schools Students
CT 50 180,190
MA 112 460,899
ME 30 65,551
NH 22 79,118
RI 12 81,720
VT 23 40,001
Total 249 907,479
The Colleges/Universities sample size is based on number of enrolled students.
<1,000
1,001-2,000
2,000- 3,000
3,001- 4,000
4,001- 5,000
5,001- 6,000
6,001-10,000 >10000 Actual #
Actual # Student
CT 0 1 0 0 1 1 1 3 7 64,954
MA 4 12 6 5 3 3 5 6 44 256,039
ME 1 1 1 0 0 0 0 2 5 26,490
NH 1 0 0 0 0 2 1 1 5 32,712
RI 0 0 0 0 0 0 2 1 3 31,916
VT 2 0 3 0 0 0 0 1 6 19,876
Total 8 13 11 5 4 6 9 14 70 431,987
Total Student 4,415 18,333 26,163 17,066 18,045 32,696 71,723 243,546 431,987

2011 New England Beef-to-Institution Marketing Study
Page 29
Hospitals The following chart depicts the Hospitals Population and Distribution
State Hospitals Beds Persons / bed
CT 47 9,636 365
MA 111 21,629 305
ME 42 4,062 325
NH 32 3,418 388
RI 16 3,318 317
VT 17 1,503 414
Totals 265 43,566 331
The Hospital sample size is based on number of beds.
State Beds / Hospital Sample Size Per State
Est. Total beds in sample
% by state
50 - 99 100-249 250+
CT 0 4 4 2,034 18
MA 2 5 6 3,896 34
ME 2 3 1 863 8
NH 2 4 2 1,538 14
RI 2 4 1 1,618 14
VT 2 2 1 1,356 12
Totals 10 22 15 11,305 100

2011 New England Beef-to-Institution Marketing Study
Page 30
Producers The method of collecting the producer data was through interviewing, via a questionnaire, 88 producers representing commercial beef and dairy operations, both large and small, conventional and certified organic, in New England. The questionnaire was administered over the phone, although participants were offered to complete it via e-mail if they preferred. The completed interviews were collected using the web-based software Survey Monkey. The recipient received an initial call to introduce and, if possible, conduct the interview. If no individual was available, a voice mail with contact information was left. To increase response rates a minimum of two follow-up attempts were made to reach the intended audience. A total of 36 responses were collected and analyzed, representing a cumulative response rate of 41%. The response rate between dairy and beef was almost evenly split with 15 beef responders, 19 dairy, and 2 beef/dairy combined.
Producer Sampling The goal of the producer research was to focus on commercial beef and dairy producers whose primary income is from their farm operation, ensure representation from each state and ensure representation by type of operation including both large and small scale commercial operations, conventional and organic, grass fed, cow-calf, and feeder. The sample population was determined based on identifying total volume of producers and head of beef by type of operation and by state (see tables below). To develop the contact lists, the researchers received input from State Departments/Agencies/Divisions of Agriculture, Ben Freund, MOFGA, Maine Beef Producers, Maine Dairy Producers Council, New Hampshire Farm to School coordinator, Vermont Beef Producers Association, NOFA-VT, Vermont Grass Farmers Association, the Connecticut Beef Producer List, Rhody Fresh, and Farm Fresh Rhode Island Beef. Given there has been significant research and surveying done with Vermont producers recently, the decision was made to focus the majority of the producer outreach for this study on the remaining New England states to verify whether the feedback we were hearing from other states echoed or was different from the responses we were already hearing in Vermont. A total of 88 producers, representing 50 beef and 38 dairy farms, were contacted for the study.

2011 New England Beef-to-Institution Marketing Study
Page 31
Number of Dairy Farms in New England7 Number of Dairy Cows in New England 8
State Number of Farms
Percentage of NE Total
VT 1016 60% ME 308 18% NH 131 8% CT 109 6% MA 101 6% RI 13 1% Total 1678 100%
Number of Cattle (all cattle and calves, beef and dairy) in New England 9
State Number of Cattle and Calves
Percentage of NE Total
VT 270,000 55% ME 90,000 18% MA 40,000 8% CT 49,000 10% RI 4,900 1% NH 34,000 7% Total 487,900 100%
Number of Beef and Dairy Producers Contacted for the Study
State Beef Dairy RI 5 4 CT 2 2 VT 2 7 ME 18 5 MA 18 13 NH 5 7
Processors The method of collecting the majority of the data was through surveying, via a questionnaire, to 33 processors representing as best possible, all USDA certified slaughterhouses and processors
7http://www.keeplocalfarms.org/meet-local-farmers/participating-farms/ as of July 2010 8as reported January 28,2011 NASS (National Agricultural Statistics, USDA) 9as reported January 28,2011 NASS (National Agricultural Statistics, USDA)
State Number of Dairy Cows
Percentage of NE Total
VT 135,000 62% ME 32,000 15% NH 15,000 7% CT 19,000 9% MA 14,000 6% RI 1,100 0.5% Total 216,100 100%

2011 New England Beef-to-Institution Marketing Study
Page 32
in New England and eastern New York. The questionnaire was administered over the phone, although participants were offered to complete it via e-mail if they preferred. The completed surveys were collected using the web-based software Survey Monkey. The recipient received an initial call to introduce and, if possible be administered the survey. If no individual was available, a voice mail with contact information was left. To increase response rates a minimum of two follow-up attempts were made to reach the intended audience. A total of seventeen responded resulting in a 52% response rate.
Processor Sampling Given its small population, sample size for slaughterhouses included as many known USDA certified slaughterhouses and processors in New England and New York as possible. New York facilities were included because several New York facilities provide services for neighboring states, including Vermont, Connecticut, and Massachusetts.
Distributors The goal of the distributor research was to get a broad sense of the role they play in the institutional selling and distribution of ground beef in New England. The method of collecting the majority of the data was through surveying, via a questionnaire, to fifteen distributors representing large and small, local and regional wholesale distributors servicing beef for the institutional market throughout New England. The questionnaire was administered over the phone, although participants were offered to complete it via e-mail if they preferred. The completed surveys were collected using the web-based software Survey Monkey. The recipient received an initial call to introduce and, if possible, be administered the survey. If no individual was available, a voice mail with contact information was left. To increase response rates a minimum of two follow-up attempts were made to reach the intended audience. A total of eight distributors responded resulting in a 53% response rate.
Distributor Sampling As noted, distributors were selected to represent a broad range and scale of service providers, from small to large, from localized service to multi-state, and from those who are strictly corporate/profit driven to those who have mission component to their business. Additional attention was paid to ensure that all six New England states had at least one distributor who even if they were not based in the state, serviced their area. To develop the list the research team sought input from the State Agencies of Education and Agriculture as well as feedback provided from the institutional surveys. In all, a list of fifteen distributors was compiled.

2011 New England Beef-to-Institution Marketing Study
Page 33
Background In order to create the most complete and targeted recommendations possible, it was important to gain a solid understanding of past and current projects, along with an in-depth look at the regulatory environment, related to bringing local food to institutions, efforts to market local beef, and efforts to understand what bottlenecks are limiting access to local beef. Topics covered included:
● the growing interest in the local food movement ● feasibility studies for marketing and supplying local meat ● the historical uses and destination for New England dairy culls ● organizational models for local food distribution systems ● state and federal regulations and commodity purchasing.
A detailed listing of studies, literature, regulations, and individuals contacted is included in the appendices, meanwhile, below are some highlights. There is considerable untapped potential for the utilization of ground beef by schools and institutions. According to USDA / ERS, 16% of all food purchases are by businesses and government including schools and institutions. There are many possibilities for connecting New England beef producers and processors with a wide variety of institutional purchasers. However, in order to meet required price points, many schools and other institutions pursue low cost strategies, often resulting in many low-skill, low-wage jobs, and the use of lower priced commodity ingredients. Public schools frequently budget meal costs at less than $2.70 per meal to cover the cost of ingredients, labor, and overhead such as facilities and equipment. These price points may limit access to New England sourced ground beef, but should not be automatically considered as insurmountable barriers.
Growing Interest in Local Food The literature corroborated what is in evidence across New England: a growing interest in local foods. As a result of, or coinciding with, increased demand, many research and implementation projects have since been undertaken to increase local food utilization in the region. A sampling of these efforts include: “Farm to Plate-A 10 Year Strategic Plan for Vermont Agriculture” (Vermont Sustainanble Jobs Fund, 2009-2011), “The Agricultural Creative Economy” (ME Dept of Agriculture, 2008), the “Vermont Food Basket Project” (Marcotte, 2008), “Agriculture’s Hold on the Commonwealth” (Holm et al, 2007), and “New Hampshire Department of Agriculture Marketing Research and Recommendations” (Rumbletree Inc, 2003). Among other things, the research found that investments in marketing infrastructure has the potential to yield a large return in farmer income, that demand for local products is growing, and that there are roadblocks to bringing local foods to consumers. Some such roadblocks include inadequate distribution mechanisms to address the unique needs of locally sourced

2011 New England Beef-to-Institution Marketing Study
Page 34
foods, higher costs (or perceived higher costs) of local foods, insufficient storage facilities, and difficulty in accessing processing services such as inspected slaughter services and value added processing infrastructure. Universities and K-12 schools are also expressing growing interest in serving local foods to their students. Over the last decade, groups such as the National Farm to School Network and the Real Food Challenge have grown in popularity and support, and all over New England states have taken steps to increase local foods prepared in schools. This work has had successes and pointed out critical challenges. In New Hampshire, for example, the 2007 study “Developing Sustainable Local Food Sales to a College Institutional Market” described an initial reluctance by the institutions to work with multiple smaller suppliers, as well as a state law prohibiting any food sourced outside of New Hampshire from being labeled as “local.” Initiatives to bring local food to school and universities have made great strides over the past several years, although much of the work has focused on local fruits and vegetables. Less energy has been put behind bringing locally grown meat to these populations. A few institutions stand at the vanguard, pushing the envelope. Examples include Fletcher Allen Health Care in Burlington, Vermont which purchases 400 pounds of local meat a week; Middlebury College which has a longstanding commitment to buying locally produced ground beef; Lyndon Institute which has developed contracts for sourcing beef from local farmers; and Green Mountain Farm to School which has coordinated sourcing and micro-distribution of local beef for twelve schools and five senior centers in the Northeast Kingdom of Vermont. A larger effort afoot is The Market Mobile based in Rhode Island that coordinates 40 farms in Connecticut, Rhode Island and Massachusetts to provide local food including beef to schools, hospitals and work places as well as restaurants and small grocery stores. The idea is to consolidate locally sourced food into one vehicle and one invoice to facilitate the process of buying local, thus increasing institutional adoption rates.

2011 New England Beef-to-Institution Marketing Study
Page 35
Local Meat Feasibility Studies Several studies have been conducted to assess the landscape of slaughter, meat processing capacity, and opportunities for local meat marketing in the Northeast. “Producing Natural Local Meats” in CT, MA, and RI (Bonelli, 2008), "Demand and Options for Local Meat Processing: Finding the way from pasture to market in the CT River Valley" (Coleman, 2008), “Economics of Regional Meat” (National Good Food Network, 2011), “New Hampshire Livestock Inventory and Slaughter Facility Feasibility Study” (Tappan, 2003), “Vermont Ground Beef Marketing Study” (Wilson, 2006), “Slaughterhouse Feasibility Study” (Sleeping Lion Associates, 2005), “Hudson Valley Livestock Marketing Task Force Meat Processing Facility Feasibility Study” (Shepstone Management Co., 2000), “Feasibility of a Local Processing Facility in Carroll County, Georgia” (Wolfe, Luke-Morgan, Daniels, and McKissick, 2009) have all explored existing capacity for processing services, current and growing demand for services, and opportunities for marketing local beef. The body of work includes in-depth financial analyses assessing the financial implications of building new and/or renovating existing slaughter facilities. Findings from the research suggest that demand has been high for the re-localization of slaughter services, especially with the increasing consolidation of large slaughterhouses nationally, but that by and large even with increased demand, the demand is insufficient to warrant construction of new facilities, the return on investment of such an endeavor would not be viable, and public or private support for the construction of new facilities may jeopardize the profitability of existing businesses. On the other hand the cost-benefit of renovating existing facilities could increase throughput enough to make a dent in the capacity bottleneck and at a cost that makes it plausible. Concurrent to these findings was research highlighting that it is important to assess whether there are any patterns to who is expressing processing inconvenience because potential trends could help identify alternative solutions that could address particular needs cost effectively. For example, in addition to renovation of existing facilities, other tools such as itinerant and custom slaughterhouses, and producer education could help alleviate some of the constraints. In 2000, the “Shepstone Meat Processing Study” concluded that a new slaughter plant in the Hudson Valley of New York could expect a 20% return on investment, but was feasible only assuming grant funding for 77% of capital investments. Similarly, the 2008 report "Demand and Options for Local Meat Processing: Finding the way from pasture to market in the CT River Valley" found in its survey of local farmers that additional slaughter and processing options were desired, and demand, while too insufficient for a large scale facility may have supported a small slaughterhouse but “The numbers depend on a long list of assumptions, and adjustments in any category affect the big picture. In general, a small-scale facility would only be economically viable with grant funding/other subsidies and/or limited capital requirements.” (http://www.extension.org/pages/54937/connecticut-river-valley-2008). Meanwhile, research for the “Vermont Farm to Plate 10 Year Strategic Plan for Agriculture,” along with the MA, RI,

2011 New England Beef-to-Institution Marketing Study
Page 36
CT, tri-state SARE research project “Producing Natural Local Meats for Consumers,” and feedback from the Food Venture Center in Hardwick, Vermont point to the conclusion that commercial producers processing a consistent and size-able volume of animals with consistent requirements for processors are experiencing fewer aggravations with existing USDA and state regulated slaughter and processing infrastructure than producers with smaller numbers of animals (1-10/year) who only require access to slaughter facilities infrequently, or new producers who have no established working relationship with a processor. As an outcome to all this research and interest, initial steps to address capacity concerns are underway. For example, since 2009, the Vermont Housing and Conservation Board through the Vermont Farm Viability Enhancement program, has awarded $123,085 in grants to meat processing facilities to expand, update or improve their operations. Recipients include Royal Butcher, Brault’s Market, Vermont Smoke and Cure, Enosburg Meat Market, Vermont Rabbitry & Brown’s Custom Meats, Spring Hill Poultry Processing, Sharon Beef, Vermont Salumi, Westminster Meats, Mad River Food Hub, and Parmelee Farm. While Vermont is working on infrastructure, Connecticut has launched a series of educational workshops for producers to teach them reverse seasonal growing techniques and body conditioning evaluation, so they can optimize yield and time finishing of animals to coincide with seasonal dips in processing demand. Marketing initiatives that have occurred as an outgrowth of the research and interest include the Vermont Agency of Agriculture and Vermont Beef Producer Association’s “Vermont Ski Burger,” and the Vermont Meatball Pilot Project.

2011 New England Beef-to-Institution Marketing Study
Page 37
The Vermont Meatball Pilot Project In 2009-2010, Doug Davis, director of the Burlington School District Food Service contacted local slaughterhouse owner Carl Cushing to buy locally raised meat for his students. The meat was made into one ounce meatballs by NPC Processing, a secondary processor in South Burlington, and then served to students in the Burlington area. The project used five cows from local dairy farms and one beef animal from a local beef producer, totaling 2,184 pounds of ground beef for the schools, along with 6 hides, 210 lbs of bones, and 72 pounds of tenderloin that Carl re-purposed for additional income. After secondary processing, which included the addition of filler ingredients, the school district was the owner of 3,000 pounds of meatballs. Reinhart Foodservice played a pivotal role in the project’s success because as the school district’s contracted service provider all purchased meat product must flow through them, so they needed to be on board with the concept. They were and agreed to store and deliver the finished meatballs to the schools as needed throughout the year. Personal interviews conducted with participants in the project reveal an overall sentiment of success and willingness to continue with an expansion of the project, possibly buying 10,000 pounds of local beef for meatballs and crumbles in the coming year. A key aspect to the success of this project is the motivated individuals whose personal drive brought the goals to fruition. According to all players involved, in our current institutional food buying system, it goes against the grain to buy from new or specialized suppliers, and in order to change the status quo of purchasing, key individuals need to want to make the change happen. It takes creative thinking and problem solving to balance budgets and work with new products. If there is no coordinated effort to localize food buying, it will not happen on its own. According to Doug Davis, “It’s about the individuals, their desire to get going. We’ve done enough research, have enough data to get going. I think that we should just run with it.”1 Another notable asset of the VT Meatball Pilot Project is the close proximity of the supply-demand chain. VT Livestock Slaughter and Processing, NPC Processing, Reinhart, and the Burlington School District schools are all located relatively close to each other, facilitating contact and reducing transportation costs.

2011 New England Beef-to-Institution Marketing Study
Page 38
Additional research investigated the barriers to institutional buying of local beef. In several published reports food service directors from across the country named the increased cost of local ground beef (whether perceived or actual) as a barrier to purchasing ground beef from local farms. In a Washington State School Ground Beef Service Survey, over 81% of respondents cited cost as a primary concern. In addition, 47% of respondents cited cost as a primary concern in an Oklahoma study (Oklahoma Farm-to-School 2003 http://www.kerrcenter.com/ofpc/publications/Farm-to-School_report.pdf). In both studies, ground beef safety and a reliable supply were the other top two concerns.
Dairy Beef In New England, there are approximately 216,100 dairy cows.10 On average ⅓ of a conventional dairy herd will be sent as cull cows per year, representing a cumulative New England annual cull herd population of 71,280. At present the majority of these culls are sent to auctions or sold to dealers, shipped to Pennsylvania and processed into commodity ground beef.11 The question New England states have explored is the possibility to process these culls regionally, rather than having them sent out of state for processing only to be sold back into our markets, “Vermont Ground Beef Marketing Study” (Wilson, 2006). Nationally, several organizations have explored the potential of adding value to dairy animals as sources of beef (“Market Cows: A Potential Profit Center” Wallace, 2002 and “Sustainable Farming” Fanatico, 2010). Both articles cite cull dairy animals as an important resource for farmers and a tangible opportunity to increase farm profits. They recommend that farmers begin to look at their cull animals as such and use foresight and planning in order to market cull animals of higher quality and greater weight, thereby increasing their income. A private company with interest in the dairy cull market, Stonyfield Farm, has stated they are considering exploring efforts for local organic dairy culls to remain in-region to increase value to the farmer.12
Initiatives Connecting Institutional Markets with Local Foods While there is significant effort to source local food for use in schools, the team found few active models of organizations connecting local farms with institutional buyers. The two who have gained a foothold and show promise for long term sustainability are the Institutional Food Market Coalition (IFM) of Dane County, WI, and Good Food on the Public Plate in London, England.
10as reported by NASS January 28,2011 11“Vermont Ground Beef Marketing Study” (Wilson, 2006) 12Louise Calderwood conversation with Britt Lundgren, Stonyfield Farm, June 2011.

2011 New England Beef-to-Institution Marketing Study
Page 39
IFM provides support to producers, processors, distributors, and buyers of local food by facilitating connections between these players and educating them about opportunities and hurdles related to sourcing local food. The program is a collaboration between state and county government, University of Wisconsin staff, and other stakeholders (Dane County, 2011). A detailed description of the discussion we had on their program model is provided in Appendix E. Good Food on the Public Plate is also a government driven initiative but it is focused on assisting public sector organizations in using more sustainable food. According to the British organization’s website, an independent review found that every pound (1 GBP) spent by the group affected between 8.57 and 38.75 pounds of money spent by organizations on food purchases. 13 Good Food on the Public Plate started as a pilot program in 2004 working with four London hospitals. Its success prompted the program’s growth and expansion and by 2011 the group was servicing approximately 150 sites (hospitals, universities, schools, and public services) in the Greater London Authority. Its sister program, Good Food for Our Money, works to establish mandatory health, animal care, ethical and environmental standards for food bought with public funds. Combined the projects aim to solve health and environmental problems, support the production of good food, and to serve as a positive example for the private market. Both the Institutional Food Market Coalition and Good Food on the Public Plate effectively coordinate relationships between farms and institutions serving large populations. Both are extremely “lean” operations, focusing on providing the service of connecting the dots between buyer and seller, rather than providing physical distribution services. As such they run on minimal operating expenses: a coordinator and an office space. And through their efforts they have provided visible proof that a “coordinator” role can result in a significant increase in volume of local product sold for total program dollars spent. Another initiative is occurring in Maryland, where with the help of a Federal State Marketing grant in 2008, Maryland is connecting hospitals with local and sustainable food producers through a program they call the Maryland Hospitals for Healthy Environment (MD H2E). MD H2E found that key elements to success include:
● Having a dedicated staff person to organize and spearhead the movement ● Direct e-mail, telephone and personal contact to specific individuals rather than broad
base email announcements to encourage attendance at events. ● Creating positive media to inspire participation ● Press briefings with photo opportunities
13http://www.sustainweb.org/goodfoodpublicplate/about/

2011 New England Beef-to-Institution Marketing Study
Page 40
● Focusing on clear, branded campaigns that allowed short term trials of the food (ie “eat local week”, or similar challenges)
● Don’t segregate the local foods from the regular food options because when separated, people avoided the local section entirely.
● New and different forms of local food were less likely to be used than familiar forms In 2011, MD H2E launched a specific “Campaign to Buy Local Meat and Poultry” to call attention to the need to expand beyond local fruits and vegetables purchasing. This summer, 36 hospitals are taking part in their Buy Local Challenge (Mitchell, 2011).
Partners/State Agencies
Food banks According to our research, sites receiving food from state food banks operate on limited budgets and may not have the resources to buy ground beef at a price that would allow farmers, processors, and distributors to make a profit. According to a survey at the Vermont Foodbank in 2010 (Rumley and Snow, 2010) only 6% of Network Partners (food shelves and other meat sites) were willing to pay $2.00/lb for ground beef, and 0% were willing to pay $2.50/lb.
Farm to School Networks New Hampshire - An in-person meeting with Stacey Purslow was conducted on July 20, 2011 to learn about current activities in the state regarding beef and other products and initial results were shared. Stacey indicated Exeter, Kearsarge, Winnicut High School, Windham, Somerworth and Gilford school systems were currently using local produce, but not beef. Stacey shared two question topics to ask producers which were integrated into the producer survey. Maine - Ken Morse was contacted via email. He indicated this project is a big part of their effort and they are working on the economics of school and other institutional foods. He suggested we speak with Doris Demers, Director of School Nutrition for Kittery and York schools regarding her purchasing of beef. In a phone interview on June 28, 2011 with Doris we learned she is working with Ray Bock of Archer Angus on a pilot program bringing beef to the school system. She is working directly with Mr. Bock on ordering, packaging and delivery. Archer Angus offers a $50 credit to the school if any family or other institution or restaurant purchases a side of beef. This helps with costs to the school. The program has run for a year and some lessons learned were:
• planning is critical to reduce waste • finding ways to reduce other costs to compensate for the higher priced beef patty (patty
size -3.2 ounce at $0.70/patty approximately $3.50/pound) • dealing with price fluctuation

2011 New England Beef-to-Institution Marketing Study
Page 41
• there is a learning curve for staff in food preparation of grass fed meat (temperature/cooking times).
Overall, response from parents and kids was favorable. Doris indicated the Maine Farm to School program has no state funding and relies on parents volunteering. Vermont- The Vermont Farm to School network has been highly involved in this project and would appreciate seeing more local beef being utilized in local schools, and would appreciate local beef being in the USDA Commodity System. New Hampshire - Cheshire County Conservation District A phone discussion was had with Amanda Costello, District Manager, regarding efforts underway in the county. Amanda discussed holding an annual match making event with producers and restaurant personnel with about 20-30 of each group attending. Some are small-scale beef producers. While not exactly relevant to the target market we are researching, Amanda indicated that barriers to entry between local producers and commercial buyers revolve around wholesale pricing, product quality, and quantity.
Regulatory & Commodity Purchasing
How USDA Agricultural Marketing Service (AMS) Purchases Are Administered Within USDA there are four agencies that have some level of responsibility for the commodity program. The primary agency is the Food Distribution Division (FDD) of the Food and Nutrition Service (FNS), an agency within USDA that governs the federal nutrition programs. FNS determines the total monetary value of commodities that each school district can receive (called “commodity entitlement dollars”), consolidates all the commodity orders (which generally are based on what schools have asked for through their state agencies), and directs USDA’s Agricultural Marketing Service (AMS) and the Farm Service Agency (FSA) to buy the requested foods. AMS is responsible for buying red meats (primarily beef and pork), poultry and eggs, fish, fruits, vegetables, and tree nuts, and FSA buys peanut products, grains, oils, and dairy products, including cheese and dry milk. The Food Safety and Inspection Service (FSIS) ensures food safety through standards and specifications on the handling of commodities. The state agencies responsible for commodities are known as Distributing Agencies (DAs), and they distribute commodities to local school districts, which are called Recipient Agencies (RAs). These RAs ultimately serve the food to students as part of meals. The USDA Foods Master List of commodities available to schools includes some 180 items. Typical fare for the institutional kitchen consists of beans and grains, beef and poultry, cheese, fresh, frozen, and canned fruits and vegetables, and staples such as pasta sauce, peanut butter,

2011 New England Beef-to-Institution Marketing Study
Page 42
and oils. Some processed meats are also available directly through USDA foods, including beef patties, chicken fajita strips and breaded pieces, and turkey taco filling. In recent years, the program has emphasized its growing supply of healthy choices, including, extra-lean ground beef. Individual school districts do not choose from this entire list, but from a shorter one derived by their state distributing agency. Based on surveys of food director preferences, the DA creates a short list, reflecting what the district wants and the timeline they want. It communicates these preferences back to USDA Foods, which uses this information to plan its buying strategies in agricultural markets. School districts are not able to request commodity food produced from a specific region; nor can they place orders for preferred brands or producers. Loosely written specifications optimize the system for competitive purchasing, and USDA Foods is at liberty to replace familiar products with different, less costly ones without advance notice to recipients.(School Food101:School Food Focus 2010, C.S. Mott Group for Sustainable Food Systems at Michigan State University).
Department of Defense Fresh Foods Program In 1994, the Food and Nutrition Service began working with the USDA Agricultural Marketing Service (AMS) and other agencies in and out of government to explore options for providing more fresh fruit and vegetable products to schools. This meeting led to talks with the Department of Defense (DoD) to enter into a pilot project, now known as DoD Fresh, to supply fresh fruit and vegetables directly to hospitals, schools, and prisons along with their deliveries to military installations or other sites in the United States. The program is not currently available for ground beef purchases, but it does provide a workable framework for increased purchases of locally produced food. The pilot project began in school year 1996 with eight states participating, allocating a portion of their commodity entitlement funds toward the program. Produce valued at $3.2 million was delivered to schools that year. Due to the favorable response from states participating in the pilot, the program was opened up to all states. By FY 2010, spending had reached $66 million. At this time, 45 States, the District of Columbia, Puerto Rico, the Virgin Islands and Guam are participating in the program using commodity entitlement funds. Due to the volume of its purchases the DoD has considerable buying power to negotiate favorable rates for all manner of commodities and fresh foods as well as an established system for collecting, sorting and distributing these foods to end users. Schools can use their commodity entitlement funds, section 4 and 11 funds (federal and state meal reim-bursements), and local school system funds to purchase these products. The 2002 Farm Bill included authorization for up to $50 million to expand the program to all states and

2011 New England Beef-to-Institution Marketing Study
Page 43
territories (double the previous authorization). The DoD manages the financial component of the sales (billing districts and paying farmers) and charges a very modest percentage for overhead. A recent improvement to the DoD structure allows local farmers to enter into the contracts and deliver their products directly to the local DoD distributor, rather than having to transport the produce to a central location for re-distribution back into the local school system. (DoD Fresh Fruit and Vegetable Program and Farm to School DoD) Exploring the possibility of extending the DoD purchasing and distribution network to include locally grown ground beef is a possible step to increasing access for New England schools.
Beef Purchasing Standards A food purchase report from the USDA Agricultural Marketing Service (AMS) for February 9, 2011 (see appendices) demonstrates the price points and scale of processing necessary to interact with the USDA Commodity Program. Two vendors successfully placed bids on 440,000 pounds of frozen, fine ground beef with price points between $1.9966 per pound and $2.1124 per pound. A single vendor successfully bid on a contract for 418,000 pounds of frozen 100% beef patties priced between $2.5989 per pound and $2.6597 per pound. The range in prices is a function of the size of the order delivered to varied locations within the bid. For the eleven month period from May of 2010 to April of 2011 the average price paid by USDA for fine ground beef was $2.1938 per pound and for 100% beef patties was $2.3889 per pound. A brief review of the USDA contracting system shows 10,000 pounds as the lowest volume bid accepted through the system in 2008. It is extremely unlikely that any New England based slaughterhouses or meat processing facilities will be able to meet either the price points or volumes necessary to intercut with the USDA commodity system. While USDA does have a program to increase opportunities for small businesses, the cut off for meat processing facilities (to include slaughterhouses) is 500 employees (2008 Frozen Beef Purchases, USDA and April 11 USDA Meat Purchases).
Meat Processing Inspection Requirements The USDA AMS commodity program revised its purchasing specifications for raw ground beef in 2010 in response to concerns expressed in the media that the program’s existing specifications were not as stringent as those of large-scale purchasers of raw ground beef in the corporate sector, such as quick-service restaurants. The new requirements applicable to AMS ground beef contracts awarded after July 1, 2010 call for a zero tolerance for the pathogens E. coli O157:H7 and Salmonella in meat intended for use in the USDA AMS commodity food program. Specifically the new AMS standards (1) tightened microbiological testing protocols; (2) tightened the microbiological upper specification and critical limits; (3) increased microbiological sampling frequency for finished products to every 15 minutes; and, (4) instituted additional rejection criteria for source

2011 New England Beef-to-Institution Marketing Study
Page 44
trimmings used to manufacture AMS purchased ground beef. AMS also considers any vendor classified by FSIS as having a long term poor safety record as an ineligible vendor until a complete cause-and-effect analysis is completed. To achieve these standards the AMS has implemented protocols that include (1) steps taken when cattle are slaughtered, (2) oversight of the suppliers’ slaughter and grinding processes, and (3) microbial testing of the raw ground beef at different points in the production process from slaughter through grinding. Full details of the USDA’s protocol can be found in the GAO report 11-376. Before purchasing raw ground beef from a supplier, commodity program officials visit the supplier’s facilities to evaluate, among other things, its quality control programs, equipment, and documentation that the supplier’s product complies with the program’s specifications. After purchases have begun, commodity program officials periodically inspect the supplier’s facilities, processes, and documentation at a frequency dictated by the size of the purchases. For example, these inspections occur monthly for suppliers with multiple, ongoing contracts, and they occur at least once during each contract period for suppliers with intermittent contracts. If deficiencies are discovered, these inspections may occur more often. Finally, when raw ground beef is being produced, commodity program officials must be present to monitor the supplier’s performance, verify compliance with the program’s specifications, and obtain samples of raw ground beef for microbial testing, among other things. Beef suppliers must send samples of raw boneless beef before and after it is ground to a laboratory, accredited by the commodity program, where the samples are tested for the full range of microbes detailed in the commodity program’s purchasing specifications. Under the current specifications, samples must be taken from each 2,000-pound lot of raw boneless beef to be ground and each 10,000-pound lot of finished raw ground beef. Samples of finished raw ground beef are selected at 15-minute intervals during grinding. Suppliers may not distribute the raw ground beef to schools until the test results are known. The commodity program uses test results of other bacteria to help ensure that the raw ground beef it distributes to schools is produced under sanitary conditions. If the levels of these bacteria exceed certain thresholds, the commodity program rejects the affected lot of raw boneless beef or ground beef. Suppliers that fail to maintain sanitary conditions are barred from producing raw boneless beef or ground beef for the commodity program until they take corrective action to restore sanitary conditions. Although the steps required for participation in the commodity program are more stringent than the standard federal requirements for meat inspection, they are essentially identical to the requirements of other private-sector purchasers—including grocery store chains and quick service restaurants—with variation in such things as the number or placement of required

2011 New England Beef-to-Institution Marketing Study
Page 45
antimicrobial interventions designed to reduce microbial contamination. The specifications used by these purchasers, like those used by the commodity program, call for more-stringent testing for microbial contamination than do federal regulations for the same foods in the commercial marketplace. The commodity program’s specifications and those of many private-sector customers include high standards with only slight differences. Although the standards imposed by AMS for commodity program purchases are similar to many of the largest players in the meat processing community, they far exceed federal requirements and are out of the reach of most small slaughterhouses and meat processing facilities. In our research it appears that the greatest opportunity for increasing the use of locally grown ground beef in schools and institutions in New England is through direct relationships with either farmers or processors, outside of their commodity purchasing dollars. In 1977, 84 percent of all steer and heifer slaughter occurred in plants that slaughtered less than half a million head a year. By 1997, plants in that category saw their share drop to 20 percent, while 63 percent of slaughter occurred in plants that slaughtered more than a million steers and heifers per year.14 By comparison, Larry’s Custom Meats in Otsego County NY recently expanded and can now process up to 5,000 animals per year, up from 1,100 animals in the old plant. Mandating the AMS imposed regulatory structure designed for large scale operations onto small meat businesses, who might process 10,000 lbs per week (compared to 10,000 pounds per hour in some plants) would surely destroy any efforts to increase local sourcing of meat. In 2010, an expert committee convened by the National Research Council at the request of USDA’s commodity program found that the scientific basis of the program’s 2010 revisions to its purchasing specifications for raw ground beef is unclear. In its report, the committee noted that some specifications were based on industry practices, but it could not determine the scientific basis of the industry practices. Further, it noted that other specifications appeared to have been based on information gathered through informal, ad hoc expert consultation, a method the committee deemed to be the least preferred form of evidence for developing specifications. Nevertheless, the committee found that a lack of reported outbreaks in recent years caused by either Salmonella or E. coli O157:H7 associated with raw ground beef purchased by the commodity program strongly suggested that the program’s purchasing specifications have been protective of public health. The committee did, however, recommend that the commodity program develop a systematic, transparent, and auditable system for modifying, reviewing, updating, and justifying science-based purchasing specifications for raw ground beef. The committee was also asked by USDA to compare the commodity program’s purchasing specifications to those used by other large purchasers of raw ground beef. Accordingly, the
14 MacDonald, James M., Michael E. Ollinger, Kenneth E. Nelson, and Charles R. Handy. "Concentration and Consolidation in Livestock Slaughter." USDA Economic Research Service, March 1999. AER-785

2011 New England Beef-to-Institution Marketing Study
Page 46
committee reviewed the purchasing specifications for raw ground beef used by 24 large corporate purchasers and found considerable variation with regard to acceptable levels of microbes. While the committee found substantial differences among the 24 purchasers in their criteria for bacteria that indicate the extent to which production conditions are sanitary the variations were linked to the intended use of the raw ground beef. For example, specifications for raw ground beef distributed in frozen form may need to differ from purchasing specifications designed to improve the shelf life of fresh ground beef. According to its report, because the committee lacked information on the scientific basis for the corporate purchasing specifications, it could not directly compare the commodity program’s specifications with those of the corporate purchasers. (GAO-11-376 School Meal Programs: More Systematic Development of Specifications Could Improve the Safety of Foods Purchased through USDA’s Commodity Program).
Analysis of Data Producer Analysis Six out of thirty-eight producers asked to be sent the interview questions via e-mail. Of those six only two completed the interview. Of thirty six completed interviews two came from e-mailed links, therefore 94% of the responses came via telephone administration of the interviews, which corroborates our assumption that this audience would be more responsive to direct outreach. The purpose of the producer interviews was to identify what dairy producers are doing with their culls, how many culls they have, what they receive for their animals, whether they are or would be interested in direct retail sales of ground beef, and whether they would be interested in an alternative outlet for their culls and if so what the selling points to them would be; and to understand where and how beef producers are currently marketing their beef, do they have culls and if so what are they doing with them, what are they charging for their prime product and their cull beef, and would they be interested in/are they working with institutional buyers.
Size & Scale Participating farms from both dairy and beef represented a wide variety in size of operations. Some beef farms had as little as zero mature animals, while others had 200 grown cattle, excluding replacement animals. The average size of the beef operations reporting came to 89 mature head. Dairy farms reported herds that ranged from 22 to 300 milking head. The average size of the dairy operations reporting came to 139 mature head. Nearly half (45.2%) of all farms estimated that their herds would stay roughly the same size over the next ten years. 41.9% anticipated growing their herds, and 16.1% predicted a decline in number of animals in the same time frame.

2011 New England Beef-to-Institution Marketing Study
Page 47
Of the beef farms planning on expanding, many cited an inability to meet demand for beef as the reason for growing the herd. Businesses planning to shrink their herds listed expensive feed, inability to access land, changing marketing strategy, and personal health among their reasoning. Many respondents found it difficult to predict ten years into the future.
Culls When queried about the number of “cull” (mature dairy and non-freezer cull beef) animals they sell to market annually, thirty farms responded. Most beef farms responded that they have no such animals to sell, while dairy farmers report selling roughly ten animals all the way up to 90 or more. The average number of dairy culls per year came to twenty-seven (19% of the average mature head herd size) while the average number of beef culls came to two (2% of the average mature head herd size). The industry standard for culling of a dairy herd is 30% of the mature animals per year. While the producers interviewed for this study appeared to have a slightly lower cull rate, it is unlikely that over time their cull rate would differ significantly from the standard of 30%. Additionally, in our questioning, we asked for total number of culls and then the number of those that were body condition 3-5. It is possible that some respondents only answered the second half of the question relating to 3-5 body condition culls. This could also be why the producers interviewed had a slightly lower than average cull rate. Farms interviewed reported growing a wide variety of breeds of cattle. Many dairy farms claim to raise Holstein and Holstein crosses, others report milking Ayrshires, Jerseys, and Shorthorns, and a few noted other breeds. Beef producers report growing predominantly Angus, Hereford, and Lineback. The sizes of cull (mature dairy and non-freezer beef cull) reported from these breeds ranged widely. The smallest live weight for a mature dairy cull reported was 650 lbs, while the largest was 2,000 lbs, and the average was 1,304 lbs. The smallest live weight for a mature beef cull reported was 650 lbs, while the largest was 1,800 lbs, and the average was 1,130 lbs. Meanwhile, the average ratio of hanging weight to live weight for dairy cows came in at 44% while for beef cows it came in at 59%.
Pricing & Markets Many respondents found it difficult to answer questions regarding the price they receive when marketing cull animals. It was also hard for most respondents to estimate a “good, fair price” for their cull animals, 61% declined to answer the question. Some farmers added that there would be no way for anyone to pay the price that the animals were truly worth.

2011 New England Beef-to-Institution Marketing Study
Page 48
In general, respondents agreed that beef prices have been high in 2011, with the highest price listed for a dairy cull at $1.30/lb live weight while the lowest price someone remembered receiving was $.25/lb live weight. On average, the historical low for dairy culls came to $0.37/lb live weight, the high came to $0.85/lb live weight, and the average hovers around $0.54/lb live weight. The average of the prices farmers would consider “fair” for culls came in at $0.65/lb live weight. Meanwhile for beef producers who reported selling non-prime animals by auction or dealer (of which there were only three) their numbers were not too far from the dairy culls, with the notable exception being what they felt was a fair price. The average historical low was $0.37/lb live weight, the average historical high was $0.89/lb live weight, the historical average hovered around $0.63/lb live weight, and the average of the prices farmers would consider “fair” came in at $0.81/lb live weight. Respondents reported selling their cull animals in several different ways. For dairy producers 37% were selling cattle at auction, 47% to livestock dealers, 37% as direct sales of USDA certified retail cuts, and 16% as custom whole or half animals. Only one respondent reported also selling animals to local processors for resale. The beef producer responses were quite different. Several beef producers sell all of their animals to direct retail to clients without separating out “cull” animals. These producers reported selling older animals mostly as ground, but not marketing them differently than the rest of their herd. Many producers, when asked about dealer and auction fees, were unsure of what they typically paid, but were aware that there were surcharges or deductions being taken from their pay price. Most reported paying commission fees, trucking fees, and beef promotion fees. Four farmers estimated paying between 2% to 12% in commission, while 2 said they pay between $10-12/per animal. Trucking fees (whether paid to a dealer or cost to the farm in trucking themselves) ranged all the way up to $50 per animal. And beef promotion fees were listed to run between $1-8/animal. One farmer also reported having to pay a stockyard fee of $15-20/animal. When asked to rank avenues for selling culls by preference, dairy farmers reported competing interests of price and convenience as their main decision-making factors, while beef farmers tended to be more concerned with maintaining ownership and control of their product for as long as possible, and animal welfare. While only one producer mentioned selling animals to a local processor for resale, nearly all of the dairy respondents, twelve out of fourteen, (86%) expressed that they would be receptive to the idea. Only three out of eleven beef respondents (27%) reported any interest in a venue other than direct retail. Farmers looking for an outlet for their culls reported finding the

2011 New England Beef-to-Institution Marketing Study
Page 49
monetary and labor costs of trucking animals prohibitive and much preferred a system in which another party schedules a visit to the farm and buys the animals, trucking them away. While it did not trump key decision-making factors, these respondents also noted that if all else was equal they liked the idea of working with local processors or an organizing group that would sell the meat to the local market both for the benefits it brings to the community and the welfare of the animals. Producers who preferred to sell their animals direct were largely beef producers and generally were already direct marketing their animals. When asked about product liability insurance, many dairy farms were unsure if their policies contained that type of coverage. Most who were unsure felt it was likely that they carried the coverage. 65% of dairy producers responding reported having product liability insurance for their business, while 35% reported a lack of coverage. 100% of beef producers reported having product liability insurance.
Institutional Sales Five producers, all of which identified as “beef producers,” although one identified as a combination “beef and dairy producer”, reported they currently sell ground beef directly to institutions. The price per pound for the product ranged from $4.99 to $5.50 per pound. Another producer reported selling halves to a food co-operative for $3.75 per pound hanging weight. Two producers reported selling cuts other than ground beef to institutions, but did not volunteer the price per pound they receive. When selling meat to institutions, most producers reported a minimum order size to deliver the product, with 10 pounds or more as the lowest minimum recorded. Most producers selling product directly, either to consumers or institutions reported transporting the product themselves, in coolers in non-refrigerated vehicles. Most included the cost of delivery in the price charged for the product. One farm reported using a refrigerated truck to deliver, and one a freezer trailer. These producers typify the group favoring more control over their sales relationships. They tend to be receiving a high price for their product, and are often unable to meet the demand of their customer base. These producers are more likely to be beef producers. When queried on the important decision-making factors in deciding to service the institutional beef market, producers most often cited price (84%). A desire to support the local economy was also found important by many (56%), as well as a desire to support the local health of the community (52%), desire to education the community about local agriculture (36%), a stable year round cash flow (32%), ease of transaction (28%), and a long term relationship potential (24%) were all ranked as important factors. Keeping business “in the black”, animal welfare, timing sales well with the market, and providing organic food to the community were also given as important reasons to sell meat locally. Of respondents, 71% claimed to prefer less responsibility and management of selling to institutions (for example selling to a processor who handled institutional contracts) to more

2011 New England Beef-to-Institution Marketing Study
Page 50
responsibility (selling meat directly to a school or hospital). When asked if they would consider being involved in an organized effort to source, supply, and serve locally raised beef to local institutions, 48% of producers answered affirmatively, 24% were not interested, and 28% were unsure. Of those interested in participating, 6% were interested in becoming a leader of the effort, 35% were willing to be an active participant, but not a leader, and 65% preferred to join with no active participation.
Challenges Producers cited many challenges to selling locally raised ground beef to New England institutions. Price was foreseen as a tripping point by many, with several farmers unconvinced that institutions would ever be willing to pay the price they needed to be a successful business. Steady supply of meat, marketing of the concept, lack of farmer ownership of a processor resold product, and lack of inspected, nearby, or humane slaughter facilities were raised as issues by producers interested in the direct sales model. One farmer stated, “Having the supply and the demand in sync is a challenge. Dairy culls cost money for us to keep so if the local market isn't ready, it costs us money and it's better for us to ship them.” This comment speaks to a key flaw the producer-driven model presents to dairy farmers who are looking to minimize lost cost sunk into a cost center: timing. In the processor driven model, the opportunistic nature of the model fits the dairy industries timing concerns. The processor calls his network of farms when he needs supply. If farms have animals they think they might be willing to part with he can come look at them and select those he desires,
Sell Direct
Have Processor Buy Our Culls

2011 New England Beef-to-Institution Marketing Study
Page 51
the rest they will ship. If the farms have animals they want to ship, they can let him know ahead of time and he can come and select any he wants to buy. It creates opportunity for the producers when it works, but it doesn’t cripple the farm when it doesn’t. In the producer driven model, the impact of any unfulfilled transaction has significantly higher repercussions on farm income. Another respondent emphasized the need to educate buyers, especially for the producer-driven model, saying, “People need to understand that our ground beef comes from a single animal. It costs more to produce so it costs more to buy.” A few farmers, who fit into the group more interested in selling product directly to end users, mentioned that testing requirements for schools are unreasonable. Another farm interested in direct sales mentioned that if the institutions needed fresh, unfrozen product that would pose problems for them.
Producer Conclusions In ending comments, many producers expressed similar hopeful sentiments for providing local beef to the community. Their comments tempered hope with caution and skepticism from experience. In general, producers reported being interested in the project and longed for local institutions to serve local beef to their communities, mentioning children, other family members, and friends who eat at such institutions as personal reasons why they would like local meat to be served. From the producer research, the overall conclusion we reeached is that all producers, whether beef or dairy, selling culls or prime animal, have two key decision making factors they use to gauge new markets/outlets: price and the value of their time. On average, with their current market outlets, dairy producers would consider $0.65/lb live weight a fair price for their culls and beef producers $0.81/lb live weight. At present the value-proposition for engaging the institutional market is only marginally better or equivalent to their current outlets or markets, and is not worth their time to pursue unless the buyers and processors take the initiative and come to them.

2011 New England Beef-to-Institution Marketing Study
Page 52
Processor Analysis Seventeen out of seventeen respondents preferred to complete the survey over the phone, corroborating our assumption that this audience would be more responsive to direct outreach. At least one processor from each New England state and New York responded.
Capacity Six out of twelve respondents said their kill floor is open 5 days per week, one said 4-5 days per week, three respondents indicated they had no kill floor, and two indicated that their kill floor operates between 1-2 and 2-3 days per week. One of the respondents who operates it 5 days per week said they would operate it 7 days per week if there was demand for their services, and the respondent who operates only 2-3 days per week said they would operate more days per week if they could find more labor. On the days they are open, 10 respondents answered their maximum kill floor capacity for beef. The largest was 42/day, the smallest was 3/day and the average came to 20. When asked what their maximum processing capacity was per day a total of ten responded. The largest was 42/day, the smallest was 3/day and the average came to 14. An important fact that came to light is that respondents pointed out that processing time varies by type of work. When the processor is cutting for product he will resell he can be much more efficient than when he has to go by a customer’s cut sheet. “Cut and wrap used to take 1 hr/beef animal now takes 2-2.5hrs/beef - cutting my operational efficiency and thus return on expenses in half, because customers are getting more fancy in their cut requests.”15 If the processor model were engaged, the processor gains control over how they cut and wrap the product for the institutional buyers, enabling them to control their operational efficiency, and rate of return on assets and investment, even if the price they charge for the product is lower. When asked whether their facilities were operating at full capacity (either on the kill floor or in processing) the majority of respondents (11 out of 15) answered that they were not operating at full capacity.
15Bill Tripp, Locust Grove Farm, Argyle NY, telephone interview June 2011.

2011 New England Beef-to-Institution Marketing Study
Page 53
When asked where there was opportunity to expand- year round, seasonally, daily or certain days of the week, 45% said they could increase current productivity daily, year round.
No
Yes

2011 New England Beef-to-Institution Marketing Study
Page 54
Verbal responses to support these claims were as follows: “Could fit in another 8 animals per week year round with current infrastructure.” “Currently we are at 80% capacity Sept-Nov and 60% capacity the rest of the year.” “Could handle another 20 per week.” “20 more per week.” “Could process another 3-4 animals per week.” “Could slaughter 2-3 more days per week, 10 animals per day, therefore 30 more per week. Could process 2-3 more animals per day, 5 days per week, therefore 10-15 more per week.” “40-50 more beef week.” “could double what I'm doing.” “We could do up to 30 more beef per week March-Aug. For example this week we only have one beef booked, and next week we only have two.” “In spring, could do one more animal per week.” When processors were asked what prevented them from operating at full capacity their leading response was insufficient demand for their services. While this may seem at odds with the existing sentiment that there is a lack of processing capacity, one must remember that the processors are responding based on how they see overall use of their facilities and assets, not just their ability to service orders. While processing carcasses/animals brought to them for slaughter/processing services and then retrieved by the owners is part of their business (referred to in this document as “custom orders”), product for resale where they purchase, process, and resell meat is also a core part of the industry, and it is this part of the industry where they can gain efficiencies and continue to leverage their existing assets. It is also a part of the industry that until now has not received much attention. When asked how their time is spent their answers demonstrated that the processor’s own product for resale market is perhaps a larger percent of the industry than was previously realized. 50% of the processing industry is made up of product processors buy, process and sell themselves for resale. From the processors’ perspective, there is untapped capacity, there is concern and frustration from more and more demand for custom work reducing operational efficiency and return on assets, and taking more time to manage the customer and the process. There is concern that even with higher pricing for these services their business survives on marginal profits.

2011 New England Beef-to-Institution Marketing Study
Page 55
Meanwhile there is a sizeable portion of their time invested in non-custom, resale operations which they feel could be expanded upon, work in which they have more autonomy and control over the process, and receive less hassle. Both avenues represent marginal profits but one avenue can yield higher turn-over and more autonomy, and one can slow the processor down and be emotionally exhausting. On the whole, processors felt they could continue to meet their custom demand while being able to expand their resale businesses, and that this growth would benefit both lines of business because if sufficient, year round volume of resale product was warranted, they would be able to train and retain more staff, providing better service to their custom customers and an increase in overall hours/days of operation would provide more availability in general.
Product Capabilities 100% (twelve out of twelve) respondents indicate they offer their bulk ground beef in cryovac®/vacuum sealed packaging. One said they also offer it in feeder tubes, and three said they could do white paper wrapped packaging if needed. Patty responses were a bit more varied, four said they cryovac® their patties, one said they are frozen stacked with freezer paper, and one said they are bagged in 10 pound boxes. 82% (nine out of eleven) said they have patty-making capabilities. 66% (eight out of twelve) said they offer both fresh and frozen product. Four respondents noted they offer seasoned ground beef products, and one said they make meatballs. None of the respondents indicated they offered cooked or pasteurized product.
Use of and Method of Acquiring Local Beef Ten processors noted they actively purchase and resell a local beef product while one indicated he would like to start using local beef. Of these ten, six go the farms to select and retrieve the animals at the processor’s expense, two hire local dealers to secure the animals for them at the processor’s expense, one has the farmer bring them to him, one goes to auction, and one would like to start using local beef by going to auctions.

2011 New England Beef-to-Institution Marketing Study
Page 56
Servicing institutions Seven respondents said they are currently serving the institutional market:
Maine: Herring Brothers Meats, VT, Sanford’s Butcher Shop Connecticut: Litchfield Locker, Baretta Provisions Vermont: Royal Butcher, Westminster Meats, and Vermont Livestock Slaughter & Processing
Locust Grove Farm out of New York noted that they used to service schools until the new USDA regulations came into effect. Of these processors, four are using a processor driven model, while three are relying on a producer-buyer relationship. In the processor driven model, 50% are using local beef, and 50% are reselling non-local boxed beef. Both of the processors using boxed beef said they would switch to locally sourced beef if their customers asked for it. Both noted that their institutional customers are more concerned with price than local sourcing, which is preventing them from buying local animals. In the processor driven model, the processor is in the driver’s seat. They buy in the animals or boxed beef, arrange transportation for the animals to the slaughterhouse/processor, salvage any higher end cuts, bones, and hides for other uses/markets to help make the proposition financially feasible, sell the desired amount of finished ground beef to the institutional buyer or distributor, and arrange transportation with the buyer. This model can service a large volume of buyers because the processors can use their network to access supply from many farms, and the processor can create an efficient processing operation. In the producer-buyer driven model, the producer is in the driver’s seat. They secure a processing date, hire a processor to have the animal processed, and work out the sales and transportation arrangements with the buyers. This model is inherently limited from a supply and demand stand point because it is single transaction dependent: there is a single source for supply and a single destination for finished product. However, for buyers looking for specific attributes in their purchased product, such as single sourced animals, grass fed animals (higher omega 3 fatty acids, lower fat, lower calorie)16, humanely raised, certified organic, or value a relationship with where their food comes from, etc., this model ensures they are getting what they desire.
16 http://www.eatwild.com/healthbenefits.htm

2011 New England Beef-to-Institution Marketing Study
Page 57
Distribution Three respondents claimed they currently work with distributors, two are in Vermont, and one is in Maine:
Vermont: Westminster Meats, Vermont Livestock, Slaughter and Processing Maine: Herring Brothers Meats
Distributors with whom they work include: Dennis Paper, Sysco, Reinhart, Black River Produce, Dole and Bailey. One respondent noted they used to work with Sodexo but had a bad experience and ended the relationship. Seven out of thirteen respondents noted that they have delivery vehicles and could distribute to institutions if desired, while an eighth respondent said they would acquire a delivery vehicle if it would help expand their business. In terms of serving local beef, the majority of respondents (eight out of eleven) indicated it was extremely or very important to them. Eleven out of twelve respondents (92%) indicated that incentives such as grant funding or loans would help them expand if needed to service institution demand. When asked how these funds could help, the top priorities were more cooler space, and staff hiring, training and retention. Processors were not without reservations about servicing the institutional market. Some were concerned about price, the ability to make it financially feasible, and the difficulty they have had in the past working with corporate food service companies. Others, however, noted that they have good relationships and models set up to work with schools and are not experiencing any issues. An example of a good working model was described by Herring Brothers Meats as follows:
We already work with institutions. We would like to do more with them if there is demand. Currently the institutions call in or have Dennis Paper call in and place an order for a certain quantity of product and we produce and sell it to them. For example, they call in and order 10,000lbs of ground beef. We buy the animals, and sell the customer the quantity of finished product they are looking for, we resell or utilize any of the other parts of the carcass for other products and income- primarily we save the tenderloins, the top round for beef jerky, and the bones for dog bones and the hide. For the schools we were charging $1.85/lb for 80-20, but with the price of animals now up, we had to raise our price to $2.15/lb for 80-20 and $2.25/lb for 85-15. In order

2011 New England Beef-to-Institution Marketing Study
Page 58
to get the right fat mix, we normally mix bulls with cull cows. We normally find producers still find us a better deal than selling at auction because even though we offer the market rate, we charge no shipping fee. Depending on how far out of state the animals will travel, the buyer will deduct $0.06-0.08/lb for shipping expense, and the livestock dealer gets $0.02/lb, so the producer can save from $0.08-0.10/lb by having their culls stay local. The institutions we work with normally prefer the 5-10lb cryovac® bags of fresh 80-20 ground beef. We print a use or freeze by date of 21 days but send it to them fresh. They pick it up or have it delivered by Dennis Paper. Most of our institutions buy through Dennis Paper.
When asked about key decision making factors in servicing the institutional market three key factors rose to the forefront: year round work, year round cash flow, and price/profitability (see table on following page).

2011 New England Beef-to-Institution Marketing Study
Page 59
Carcass Yields With respect to animals, processors cited the average live weight of a non-freezer grade beef animal at 1,250 pounds and the average hanging weight at 623 pounds, bringing the ratio of hanging weight to live weight to 50%. For dairy culls the average live weight cited came to 1,214 pounds and the average hanging weight to 640 pounds bringing the dairy cull hanging to live weight ratio to 53%. It is interesting to note the discrepancy between the processors’ perception of live to hanging weight from the producers’ perception. On average the dairy producers under-projected what their animals were worth by 72 pounds while the beef producers over-projected by 48 pounds. The amount processors were paying for culls and non-prime beef animals, prices current as of 2011, averaged $0.76/pound live weight for dairy culls and $0.88/pound live weight for non-prime beef animals. These values corroborate those cited by the producers with both audiences noting that 2011 prices have reached a historical high. We also asked processors their estimation of what the harvestable amount of meat on a body condition 3-5 dairy cull or non-prime beef animal would be. The goal was to get a sense of the average amount of ground beef and higher end cuts a cull carcass might yield so we could conduct a rough financial analysis for a processor driven model. The average per carcass came to:
ground beef lbs
tenderloins lbs
rib eye lbs loins lbs bones lbs hides $
Average 384 8 14 12 30 39
Processor conclusions Similar to the producers, processors expressed skepticism mixed with a sense of hope that this could work out. They were aware of the reality of the commodity driven landscape, yet maintained a personal and empathetic desire to be able to keep things local if it were possible. “I do think there is a need for this, if it could happen. We are shipping loads and loads of beef out of New England, and it should stay here, because it comes back here anyway. There is a need to keep things local.” Processors do feel that even with their existing infrastructure they could increase what they are doing and fulfill some institutional volume. They are used to working on margins and are not

2011 New England Beef-to-Institution Marketing Study
Page 60
only looking at the profit this opportunity represents but how it might boost other elements of their business for over-all improved viability. A proven processor-driven model that can be replicated and is in use in at least two states with favorable outcomes reported for all parties is one in which the processor buys in animals for resale, develops relationships with the buyers or distributors, services their needs, and harvests other elements of the carcass for resale to help make the model financially viable while remaining within the institutional market’s price sensitivity for ground beef. Two examples of the Processor-Driven Model are presented for Financial Analysis
Processor 1 in 2011 was ○ paying $0.80/lb live weight ○ charging $2.15/lb for 80:20; $2.25/lb for 85:15 ○ average spread to cover operating expenses = $1.40/lb; ○ 27% of income came from non-ground beef product sales ○ distribution: some institutions retrieve the product themselves, others use a
wholesaler who applies a 12-15% mark up ($.34/lb). ○ Total cost of ground beef to institution: $2.15-$2.59/lb
Processor 2 in 2010 was
○ paying $0.61/lb live weight ○ charging $2.30/lb ○ average spread to cover operating expenses = $1.69/lb ○ 14% of income came from non-ground beef product sales ○ regular K-12 wholesaler stored and delivered the meat, potential surcharge to
school of 12% ($.27/lb). ○ Total cost of ground beef to institution: $2.30-2.57/lb

2011 New England Beef-to-Institution Marketing Study
Page 61
Distributor Analysis New England is home to a number of food distributors who provide a wide variety of customized service to vendors such as international food processors, regional companies and individual farms. Distributors access markets as varied as single schools to full supermarket chains. The distributors themselves range in size from sole individuals with small trucks handling a limited range of products such as Don Maynard of D&S Distributors in Hardwick, Vermont to sophisticated wholesaler operations such as Dennis Paper and Food Company of Bangor, Maine that are able to source and deliver a wide range of products. Some wholesalers such as Black River Produce of Ludlow, Vermont and Dole and Bailey of Chelsea Massachusetts work with farmers to assure production of the quantity and quality of beef they require. For this research a variety of distributors were interviewed in Massachusetts, Maine, New Hampshire and Vermont, and of these at least one also serviced Connecticut and Rhode Island. Their size ranged from sole proprietors operating a small fleet of trucks to a multi-national organization. An effort was made to include mission focused organizations targeting increased access to locally produced food, to more standard businesses offering products across a range of price points to meet the needs of varied customers. The amount of ground beef handled by the companies interviewed ranged from a few hundred pounds a week to several thousand pounds per week. Fifteen distributors were contacted with eight responding resulting in a 53% response rate. One distributor, Sysco, services all six New England states and New York while Donabedian Brothers handles only New Hampshire, D&S Distributors only Vermont, and Dennis Paper only Maine. Of the eight respondents Sysco and Dole and Bailey delivered into Connecticut and Rhode Island. Three distributors service all of the institutions that are the focus of this research while two service only K-12 institutions, two service only higher education and hospitals, and one services only K-12 and hospitals.
Ground Beef Product The responders were asked what product type they handle with the institutions in New England. Six responders supply bulk and frozen, while five supply ground beef in raw form, four in fresh and patties and two in meatball form. Note that not a single distributor surveyed, not even the larger distributors including Sysco and Reinhart, carried a pasteurized ground beef product (see following table).

2011 New England Beef-to-Institution Marketing Study
Page 62
The table below shows the respondents service profile related to states, institution segments and the product forms:
Distributor Institution State Product Form
Black River Produce Higher Ed., Hospitals MA, NH, VT Raw, Frozen, Fresh, Bulk, Patties
Dennis Paper All ME Raw, Fresh, Bulk, Patties
Donabedian Brothers K-12 NH Frozen, Bulk
Dole & Bailey Higher Ed., Hospitals New England Raw, Fresh, Bulk
D&S Distributors K-12 VT Raw, Frozen, Bulk
Reinhart All MA, NH, VT Raw, Frozen, Fresh, Bulk, Patties, Meatballs
Sysco All New England Raw, Frozen, Fresh, Cooked, Bulk, Patties, Meatballs
Upper Valley Produce All NH, VT Raw, Fresh, Bulk, Patties

2011 New England Beef-to-Institution Marketing Study
Page 63
Storage Capacity Distributors were asked “Do you have storage capacity to store a local ground beef product?” Five responded indicating they do with one indicating they do not currently charge for storage but may do so in the future, another stating they do not lease space, and a third noting that their storage space is frozen and institutions prefer fresh ground beef. Regarding warehouse space in general, the larger distributors pointed out that their business models are focused on small margin, high turn-over. So while they may have space, that space is very valuable and will only be allocated to products that move.
Vendor Requirements Another consideration for processors and producers who are interested in supplying distributors is liability insurance. While most all distributors said they require a minimum of $1 million in liability insurance, the two largest distributors indicated they require four and five million dollar policies. In addition to insurance some distributors, such as Sysco, indicated that they have their own HACCP guidelines their vendors must comply with, comparable to USDA.
Demand and Availability From the research data seven out of eight distributors carry a local ground beef product, and 83% (five respondents) had had requests for a local product. Technically speaking therefore, a local product can already be accessed by institutions who want it, in all six New England States. From two distributors we were able to ascertain that at a minimum of 75,400 pounds of local beef is being sold annually within the local distribution chain in Vermont and Maine. At present most of the locally sourced beef distributors carry is prime beef serving the retail and restaurant industries. All the distributors interviewed for this project stated difficulty in sourcing locally produced beef. Most distributors noted they routinely sell out of their locally sourced beef on a weekly basis.
Pricing & Price Fluctuations According to the distributors, restaurants and grocery stores are willing to pay between $4.00 and $5.00 per pound for source verified ground beef, and the distributors can’t keep the product in stock. While this price is beyond the limits of most institutions, it does not impede all of them. In Groton, Massachusetts and Bridgewater, Connecticut, two beef producers interviewed noted they are selling their ground beef to local private high schools, charter schools, and day care centers at $4.99-5.00/lb, and in Maine, Sanford’s Butcher Shop is selling

2011 New England Beef-to-Institution Marketing Study
Page 64
their local K-12 school system ground beef for $3.99/lb. A beef producer in East Montpelier, Vermont is currently servicing the Barre School district with ground beef priced over $5.00/lb.17 On average the current price for commodity ground beef through distributors $2.50-$2.95/lb. According to one distributor colleges, universities and some hospitals are willing to pay about $0.20/lb more for locally produced ground beef. Several food service managers, however, indicated purchasing ground beef for $1.25 per pound. None of the distributors interviewed were able to provide ground meat at such a low price and several stated they are also told of these low prices but don’t understand how any business can provide ground beef at this price on a consistent basis. The assumption of distributors interviewed is that the ground beef being offered at $1.25 pound is either of “short code” (about to exceed its “sell by” date) or is being sold at a loss in an attempt to gain an account. Different institutional users have different abilities to absorb fluctuations in the price of ground beef, and different capacity for price sensitivity. It appears that colleges, universities and hospitals can accommodate some variations in price and on average pay more for the product, while public schools typically set a contracted price for six months to a year, and are the most price sensitive. The point on pricing and opportunity is two-fold, 1) while there are opportunities for producers to find institutional buyers in the $4 and up per pound range, these accounts represent a small proportion of the total make-up of the institutional market; and 2) producers and processors need to recognize that if a distributor is working with K-12 accounts, there will be less room for flexibility in pricing once a contract has been agreed upon between the school and the distributor, regardless of what happens in the marketplace. Differences in the regional cost of production will be irrelevant to distributors once an agreement has been signed and although they may empathize with the locals, if the local source can’t continue to meet the distributor’s price point, it will be replaced with a cheaper alternative. Assistance in Sourcing/Facilitating the action of Buying Local
1. DOD Fresh To increase the use of New England grown ground beef in local schools it may be beneficial for distributors to achieve purchasing clearance for the Department of Defense (DoD) Fresh Commodity Program. Currently only fruits and vegetables are handled by the DoD. USDA AMS manages the commodity ground beef that comes through Commodity Entitlement money credited to schools rather than out of meal program budgets.
17 Louise Calderwood conversation with Bruce Chapell, September, 2011.

2011 New England Beef-to-Institution Marketing Study
Page 65
For a few years Black River Produce of Ludlow, Vermont, gained vendor approval to participate in the DoD bidding program and sourced considerable amounts of New England grown food (but not ground beef) into New England schools. Black River Produce CEO Mark Curran stated that although gaining approval was cumbersome and time consuming, the system worked well for Black River Produce and the farmers who received standard market prices for their goods. Unfortunately, as staff changed both within the DoD and New England state government, it was necessary to re-start the approval process. Black River Produce would consider participating in the program again and feels it merits support.
2. In 2010 students at Sterling College, a small liberal arts school in Craftsbury, Vermont
with a mission to support neighboring food producers, requested that their food service provider limit the number of servings of meat per week to assure local sourcing. The kitchen staff developed the ability to save on some meal preparation costs to allow sourcing of New England raised meat and vegetables. Having access to an AmeriCorps volunteer to assist with sourcing was critical in increasing the use of locally grown ground beef. The need for sourcing assistance is also evident in public schools; during 2003-2004 the four Vermont schools who worked directly with VT-FEED purchased more fresh produce than average, and were more likely to source that produce from local sources (ground beef was not included in the study).
Doug Davis, Food Service Director, Burlington School District, expressed his support of facilitation with this sentiment: “It is a good thing that has been a long time coming, that this year there is now a commodity council in VT. Now after 200 years. Now there will be some foresight, not “let’s just order what we’ve always ordered.”

2011 New England Beef-to-Institution Marketing Study
Page 66
Model of Facilitation At Work A successful model for increasing the distribution of locally sourced ground beef into schools and institutions involves developing a network between the slaughterhouse/meat processor, the distributor and the end user. In northern Vermont Don Maynard of D&S Distribution works with Green Mountain Farm to School Network to streamline the distribution of locally produced meat. The Network provides a regular product list to schools and institutional buyers throughout northeastern Vermont. The customers place their orders for 5 lb bulk containers of fresh ground beef. The processor is sent the list, connects with his farms and secures the necessary volume. The finished product is picked up by D&S Distributors from the processor and distributed to the end users. D&S has limited freezer and cooler capacity but has been able to meet storage demands of the program to date. The distribution cost is built into the price of the product and ranges from approximately 15% for orders of less than 50 pounds of ground beef to 12% for orders greater than pounds lbs. The mission based work of the Green Mountain Farm to School Network is essential for the success of this example. At the time of the research conducted in support of this report the ground beef sourced D&S was being delivered for $2.78 to $2.89/lb compared to $2.95/lb for commodity ground beef sourced through another distributor commonly used by these schools and institutions.

2011 New England Beef-to-Institution Marketing Study
Page 67
Hurdles Price, access to suppliers/ease of access to product and the need to create demand were cited as the major impediments for distributors in sourcing local beef. Additionally, meeting HACCP guidelines for fresh ground, moving product from processor to distributor, insurance requirements (as mentioned earlier), dealing with private managed food service companies, and availability were other responses brought up in conversation.
Mission driven models As more public awareness is paid to concerns such as local economy, personal health, environmental health, greenhouse gasses and carbon emissions, local agriculture, child nutrition, preserving open spaces, national meat recalls, etc., there are more individuals, organizations, and entities willing to become involved in the food supply chain. These bodies can bridge the communication gap between supply and demand for local food. Entities such as the Castanea Foundation who helped provide start up financing for the Vermont Meatball Pilot Project, the Green Mountain Farm to School Network that helps facilitate the ordering and coordinating of local meat purchasing by institutions in Vermont’s northeast kingdom, and Rhode Island’s Market Mobile that coordinates purchasing and order fulfillment of local product including meat to businesses and institutions across the state. These bridges have become moderately successful in moving New England produced ground beef into the market place. By making the connections between farmers, processors, distributors, and end users many of the challenges of utilization of locally sourced ground beef in institutions can be overcome.
Distributor Conclusions While distributors maintain large, efficient warehouses, their business models require rapid movement of goods in and out of their buildings. Sales staff make frequent requests for the addition of new items into the product line offered, however, the products that receive attention and longevity in the line-up are those that can demonstrate demand and high turn-over. To date, locally sourced fresh ground beef for the institutional market has not been in high enough demand to warrant strong consideration and push by the distributors. However, if the ground beef providers can meet the buyers’ needs, there is opportunity, even in the face of vertical integration within the industry, and the product need not be pasteurized. A simple, fresh, bulk, ground beef will suffice. To provide an example of the degree to which there is opportunity: Sysco owns USDA inspected facilities for in-house fabrication of meat products, however, due to liability concerns it refuses to produce its own ground beef. Ground beef is one of the few products in which distributors want to maintain a clear demarcation between their company and ground beef processing, and given this, they are more than willing to work with outside vendors.

2011 New England Beef-to-Institution Marketing Study
Page 68
Institution Analysis The institutional analysis highlights the findings from the survey conducted on Higher Education, Hospitals and K-12 institutions. This analysis reviews the combined answers of all institutions and then breaks into specific discussion on each segment (Higher Education, Hospitals, K-12). This will allow potential users of the report to clearly see each segment’s individual needs. While all questions are not discussed in this section individually the results are listed in the appendices.
Segment Representation Responses to the survey very closely reflected the number of institution’s by segment. 74% (83) of the respondents were schools, 14% (16) were hospitals, and 12% (13) were higher education institutions, (9) respondents did not indicate which type of institution they represented. Overall, the 121 responses represent 8% of the institutional population at large. The overwhelming majority of respondents were from Vermont, followed by Massachusetts, New Hampshire and Connecticut, Maine, and Rhode Island. There was not a single complete response submitted from the state of Rhode Island. The lack of response from Rhode Island may be reflective of the larger number of privately managed food services in the K-12 school system in the state. Maine and New Hampshire response rates were representative of their sampling numbers, while the Massachusetts ratio of responses to sampling numbers was lower, Vermont’s was higher, and Connecticut’s was just slightly under. These differences were likely due to the higher proportion of Higher Education Institutions in Massachusetts coupled with a lower response rate from Higher Education Institutions, a higher proportion of K-12 institutions in Vermont as a percentage of its overall population sample coupled with a higher than average response rate from K-12, and a slightly below average response rate from Connecticut’s K-12 population. Some respondents clearly demonstrated the concern voiced by distributors that there is a lack of demand for local meat from the institutional market. As one food service respondent wrote:
I am sorry to be so unenthusiastic about the local food scene. Not enough people are asking for local purchasing. This all feels like a marketing campaign for the local farmers -- the food service directors and workers are being guilted into putting our programs and our jobs on the line to spend money we don’t have.

2011 New England Beef-to-Institution Marketing Study
Page 69
This respondent also captured that in addition to demand, a second issue limiting large scale adoption of local ground beef at the institutional level is the need for integration into existing purchase and ordering systems:
It sounds great and people are all too happy to have us do the work (... 10x the amount of work as it is to purchase... through our regular provider). The calling around to find out what is available. Orders that have to be in place for a menu that is published a month ahead that take too much time and effort. All that and the kids could care less. So the $5/lb ground meat can get dumped into the compost.
Unfortunately the catch is that, without demand, distributors won’t make the effort to carry the product or make it a regularly stocked item, compounding the issue of how to integrate it into existing purchasing and ordering mechanisms.
Product Type The majority of institutions are buying fresh bulk, meatballs, frozen uncooked bulk, and 4 oz patties. The current use for ground beef is approximately 495,294 pounds of meat from 121 responses representing 8% of the total population. 495,294 pounds represents 1,290 cull cows.18 Of this total, 86% of buyers want bulk product, 57% want it frozen, 40% want it fresh. 60% also want 4 oz patties, and 67% want meatballs. Only 25% mentioned a need for a cooked product. Interestingly, with respect to pasteurization, 45% said they do not need pasteurized product, 35% said they don’t know. Only 11% indicated they definitively required a pasteurized product, and as already noted, none of the distributors contacted indicated they carry a pasteurized product. Similarly, regarding patties, few respondents noted a need for anything more than a basic 4 oz patty, no scoring or equipment other than a basic patty making machine would be required to fulfill this need. See charts on following page for details.
18 Using the average amount of ground beef per cull carcass from the processor survey.

2011 New England Beef-to-Institution Marketing Study
Page 70

2011 New England Beef-to-Institution Marketing Study
Page 71
Demand The food service providers (119 answered) do not foresee the demand/need for ground beef increasing. As previously stated, the current use of the 121 respondents is 495,294 pounds.
Source 59% stated they would prefer to buy local meat through a distributor while 29% stated direct from a farmer, farmer cooperative or Farmers’ market. Many commented that they do not have the time to handle the logistics of working directly with a farmer.
Packaging Packaging is specific to each institution and should be addressed and determined in the beginning stages of discussions between the processors and food service providers. Institutional segment packaging needs are listed for each segment later in this section.
Pricing The survey asked what the maximum price point the food service providers would pay for each of the forms of ground beef they use and asked what percent of their purchases would be at that price point. From the responses a range was determined based on the number of

2011 New England Beef-to-Institution Marketing Study
Page 72
responses. On average the institutions expressed the maximum price point they would pay for local ground beef in bulk form is $2.00-3.00/lb. The table below shows each institutional segments maximum price point and percentage for their top purchases.
Form College/Univ. Percent College/Univ.
Hospital Percent Hospital
School Percent School
Bulk $2.50-3 <10-25% $3.85 61-75% $2-3 10-25% Patty -4ounce
$3-3.85 <10% $3.50 26-75% $1.25-2 10-25%
Meatballs $2.50-3 <10-40% N/A N/A $2.50-3 10-25% Frozen, uncooked
N/A N/A $2-3 10-50% $1.25-2.50 <10-25%
The chart indicates that K-12 maximum price point for frozen uncooked ranges between $1.25-2.50. Further analysis was done on those who answered $1.25 as the maximum price point as this price was below the commodity price. All six responders did not give permission to contact them for further clarification, therefore, only the responders answers could be analyzed. Two of the six responders indicated the price they currently pay for frozen uncooked is $1.10 and $2.77, three responders put zero and one did not answer the question. All six also use bulk form and the average they pay for this is $1.23/lb. Three of the six responders are outsourced/private management companies which may purchase at a discounted price and/or contract price negotiations. Two others use cooperative/collaborative bidding. Several distributors were questioned regarding this very low price point and they said while they are also told of product being purchased for $1.25 per pound it is not a price they can offer on a regular basis. It appears this price might reflect attempts to sell “short code” product to to win accounts. Additionally, this reinforces that the commodity program skews the reality of the beef market. For example as of 2011, the commodity program was paying a low of $1.99/lb for ground beef. Based on how the schools are subsidized, the schools do not see the real cost of beef, and may be under the impression they are only paying $1.25/lb for ground beef. This creates a perception gap and perception is everything. The next series of tables look at a pricing analysis by state to determine if any differences in pricing are reflective based on the geographic and demographic variables. The individual responses are listed in the Appendix. The first table shows the current price the combined institutions are paying based on their responses. It shows each state and in parentheses () the

2011 New England Beef-to-Institution Marketing Study
Page 73
number of responses. The second table shows the average maximum price point in each state as answered by the buyer. Current Price Paying
CT (8) MA (21) ME (5) NH (8) RI (0) VT (31) Bulk $2.17 $2.19 $2.44 $1.52 N/A $2.72 Patty (4 ounce)
$3.21 $2.22 $1.89 $2.44 N/A $2.88
Meatballs $1.32 $1.94 $1.84 $2.08 N/A $2.43 Frozen, uncooked
$2.23 $0.76 $2 $1.69 N/A $1.58
Average Maximum Price Point
CT (8) MA (21) ME (5) NH (8) RI (0) VT (31) Bulk $2.64 $2.46 $2.88 $2.43 N/A $3.05 Patty (4 ounce) $3.04 $2.55 $2 $2.78 N/A $3.08 Meatballs $1.88 $2.14 $1.83 $2.53 N/A $2.83 Frozen, uncooked $2.55 $1.88 N/A $2.13 N/A $2.95
The next two tables show the maximum price point range of the combined institutions in each state as the responders answered. This is followed by the chart shown previously of the maximum price point based on the institution segment. Maximum Price Point Range – All Responses
CT MA ME NH RI VT Bulk $2-3.50 $1.25-4.50 $2.50-4 $1.25-3.85 N/A $2.50-5 Patty (4 ounce) $2-6 $1.25-4 $2 $1.25-3.85 N/A $2-4.50 Meatballs $1.25-2.25 $1.25-3 $1.25-3 $1.25-3.85 N/A $2-3.85 Frozen, uncooked $2-3.50 $1.25-2.50 N/A $1.25-3 N/A $2-3
Maximum Per Pound Price Point & Percent Purchase at Price Point
Form College/Univ.
Percent College/Univ.
Hospital Percent Hospital
School Percent School
Bulk $2.50-3 <10-25% $3.85 61-75% $2-3 10-25% Patty -4ounce $3-3.85 <10% $3.50 26-75% $1.25-2 10-25% Meatballs $2.50-3 <10-40% N/A N/A $2.50-3 10-25% Frozen, uncooked N/A N/A $2-3 10-50% $1.25-2.50 <10-25%

2011 New England Beef-to-Institution Marketing Study
Page 74
The table below lists each state’s average maximum price point per product and which market segments can support it. This table can be used to help a user of this data focus on either an institution segment, a state, and/or a product form. Institution Segment Range that Fits State Average Maximum Price Point
CT MA ME NH RI VT Bulk $2.64 $2.46 $2.88 $2.43 N/A $3.05
C H S C H S C H S C H S N/A H Patty (4 ounce) $3.04 $2.55 $2 $2.78 N/A $3.08
C H C H C H S C H N/A C H Meatballs $1.88 $2.14 $1.83 $2.53 N/A $2.83
C S C S C S C S N/A C S Frozen, uncooked $2.55 $1.88 N/A $2.13 N/A $2.95
H H S N/A H S N/A H C=College/University H=Hospital S=Schools K-12 Two other forms, Frozen-cooked and Taco/Seasoned were used more frequently in Massachusetts K-12 schools. Fifty-three percent (seven of thirteen responders) use Taco/Seasoned and forty-six percent (six of thirteen responders) use frozen, cooked. All other states have K-12 institutions that use the Taco/Seasoned and frozen-cooked form, but at a smaller percent. Some take-aways from this analysis are that in Vermont there is a willingness to pay a higher maximum price point for ground beef. This may be reflective of the pilot projects (Ski burger, VT Meatball) efforts that have been underway and/or a change in consumers’ mindset. The Institution Segment Range table helps any individual or organized effort focus on the best market segments to approach with the best product forms.
Price Fluctuation 92% of food service providers indicated that price stability would be a benefit to buying local.
Decision Making Three questions were asked relating to decision making when purchasing ground beef and purchasing locally raised beef. The responders where given a set list and the option to add choose “other” and add comments for each of the three questions. The top three qualities most influential in purchasing decisions of ground beef, as shown in the chart on the following page, were price, price stability, and local.

2011 New England Beef-to-Institution Marketing Study
Page 75
This question only allowed the responder to choose 3, one of which was other which they could add comments to that choice. Seventy four of the one hundred and twenty one responders answered this question. Additionally, local fared well in another question, with 85% of seventy three respondents agreeing with the statement that “regionally sourced products are a priority in our institution.” With respect to concerns, seventy-three people responded that top concerns with buying local beef, were:
● can they afford local beef ● can they buy it through their existing distributor ● can they ensure local beef meets HACCP regulations ● can they get it in the forms they are used to using ● can they use their USDA commodity funding ● where/how to access local beef

2011 New England Beef-to-Institution Marketing Study
Page 76
Lastly institutions were asked what would be the key decision making factors when purchasing local ground beef. Seventy-three people answered this question. The key decision making factors influencing purchasing decisions were:
• Food Safety • Price • Regular and timely deliveries

2011 New England Beef-to-Institution Marketing Study
Page 77
These three questions indicate that if access to the product is simple or uses buyer’s existing mechanisms for purchase and delivery, their price points are met, and they were assured food safety (HACCP regulations), buying local would be a logical and everyday decision.
Operational Considerations If the institution is privately managed then how they select their suppliers is often based on individual corporate policies. Supplier selection criteria for each institutional segment can be found beginning on page 79.
Insurance Liability A question was asked regarding liability insurance requirements. Forty-two people responded to this question. Hospitals typically required higher insurance levels. The majority of respondents, 48%, require a $1 million liability insurance premium, 28% require $2 million, 12% required $5 million, 10% required $3 million, and 2% required $4 million.
Ordering Cycles One hundred and eighteen answered the question: “What is your typical ordering cycle for ground beef? 49% said weekly, 25% said monthly, 16% said bi-weekly, 4% said quarterly, 3% said daily and 2% said bi-monthly.

2011 New England Beef-to-Institution Marketing Study
Page 78
Eighty-one responded to the question “How long is your ground beef typically stored?” The majority, 43% said up to 90 days, 33% said up to 14 days, and 24% said 2-3 days. Even though the majority sate they typically store their ground beef for fairly long periods, Jeanne Pierce, Exeter NH Food Service Director, stated that some K-12 school districts do not have the capacity and equipment to do so and this should be kept in consideration when approaching institutions about delivery cycles.19 Sixty-eight institutions responded to the question “What are your vendor payment term requirements?” Only one respondent said the paid upon delivery. 53% stated terms of 30 days, 25% stated 60 days, 18% noted 45 days, and 6% said 90 days. These operational considerations should be discussed prior to any effort to either purchase or supply beef to institutions as they are independent to individual institutions and may pose financial or logistical issues for suppliers.
Measurement As noted previously, local is important to buyers, but long-term vendor relations did not rank of high importance to buyers. Price ranked high, but it is not the only consideration when using local ground beef. A question was asked regarding measuring the effectiveness and benefits of purchasing local beef. The responders were given a set list of choices with one choice being “other” with space allowed to specify. Seventy-two people responded, with the key indicator being “customer feedback,” followed by “comments that the beef flavor/taste is better,” that financial measurement of dollars kept in the local economy and documentation of improved nutritional value would serve as indicators, and that increased support for local food in the budget would demonstrate success. Respondents also cited documented reduction in food miles and increased consumption of beef meals would be good indicators that buying local is working. See table on following page for details.
19 Telephone interview by Charlene Andersen with Jeanne Pierce, Exeter NH Food Service Director, August 16, 2011.

2011 New England Beef-to-Institution Marketing Study
Page 79
Institution Segmentation Analysis Next, each segment (Higher Education, Hospitals, K-12) is discussed identifying the results specific to each institution segment responses. This will allow potential users of the report to clearly see each segment’s individual needs. While all questions are not discussed in this section individually the results are listed in the Appendix section.
Findings Colleges & Universities Seventy Dining Services Directors/Managers or Executive Chefs were requested to participate in the survey. This represented 431,987 students or 47.6% of the student population. Thirteen people responded with twelve completing the survey resulting in a 17% response rate representing 51,155 students or 11.8% of the sample size and 5.6% of the total population. This allows for greater insight to the needs and requirements of higher education institutions and the customers they serve. This segment’s ordering cycles are more frequent in comparison to the combined institutions. One hundred percent answered the ordering cycles are either daily or weekly. The total number of pounds of beef currently purchased by higher education institutions who responded came to approximately 148,932 at a total annual estimated cost of $606,250 of

2011 New England Beef-to-Institution Marketing Study
Page 80
which 82% stated an 80/20 lean/fat ratio is preferred. Local beef accounts for $35,500 of the total dollars spent with 46% stating the total annual ground beef budget is unknown and 31% stating it is zero. The following table depicts the higher education institutions’ price elasticity. It shows the top three forms of beef purchases at the current price per pound, at the maximum price point per pound, and the percent they would purchase at the maximum price point.
Form Average Current
Price (per pound)
Maximum Per Pound Price
Point
Percent College/Univ.
would purchase at Price Point
Combined Institutions
Maximum Price Point
Percent Combined Institutions would purchase at Max
Price Point
Bulk $2.46 $2.50-3 <10-25<% $2-3 10-25%
Patty -4ounce $2.79 $3.00-3.85 <10% $2.50-3 10-25%
Meatballs $2.36 $2.50-3 <10-40% $2 10-25%
Packaging requirements to this segment are specific to each institution. The respondents to this questioned answered as follows:
• Portioned - patties or bulk • Frozen • Vacuum packaged for fresh • Bulk pack - 1, 4 and 5 pounds • Not individually Cryovac®
The top three qualities most influential in purchasing decisions of ground beef are price (91%), followed by price stability (58.3%), and local source (50.5%). In comparison to the purchasing decision question, a question regarding criteria importance with purchasing regionally sourced beef was asked. When evaluating options for a local source, the top criteria are:
1. Food Safety 2. Consistent high quality 3. Dependability 4. Adequate Supply
The table on the following page shows the results of this ranking question.

2011 New England Beef-to-Institution Marketing Study
Page 81
How important are the following if/when purchasing regionally sourced ground beef from a farmer/processor/distributor?
Not at all Important Important Extremely Important 1 2 3 4 5 6 7 8 9 10
N/A Rating Average
Consistent high quality 9 9% 82% 9.73 Ease of ordering 27% 9% 18% 9% 9% 27% 7.45 Provides exactly what we are ordering
9 18% 9% 9% 45% 9% 8.60
Adequate supply 9% 9% 73% 9.00 Regular & timely deliveries 9% 9% 9% 9% 55% 9% 8.80 Standardized packaging 18% 18% 9% 9% 46% 7.91 Provides kitchen staff training 18% 18% 18% 18% 18% 9% 3.00 Dependability 18% 9% 73% 9.55 Food Safety 9 73% 18% 9.89 Price 9% 36% 46% 9% 8.70 Price Stability 9% 9% 18% 18% 45% 8.64 Long term vendor relation 18% 18% 18% 9% 27% 9% 6.27 Know Your Farmer 9% 27% 18% 9% 27% 9% 6.45
Thus, price makes the biggest impact in decision-making while the top four influencing factors are important for local suppliers to be aware of. This could mean that either there are either perceptions or prior negative experiences amongst the buyers that will need to be overcome. Three questions were asked to help understand the degree of flexibility and authority regarding beef purchasing within the institution. The first question asked whether the food service operation was privately managed. 58.3% answering in the affirmative with 89% using Sodexo and 11% using Aramark. The second question asked the level of autonomy the buyers had to select suppliers. Only 33% answered Neutral to Complete Autonomy. The third question was an open-ended question and asked: How do you identify and approve food suppliers? The majority answered they must adhere to corporate specifications/approved vendors/the purchasing department. One responded that they hold meetings with prospective suppliers and conduct a site visit, and another noted they were willing to work with suppliers if they fulfilled a need and could demonstrate an ability to work with their systems. The number of local vendors ranged between 1 and 15. Some referenced working with farmers/producers and approximately two vendors were noted as supplying local beef. One respondent has a prime vendor for beef with a contract until 2013. In order for the higher

2011 New England Beef-to-Institution Marketing Study
Page 82
education institutions to consider changing or adding distributors in order to enable the purchase of local beef products the respondents answered vendors must:
● Receive approval from purchasing or supply management ● Match product and provide viable pricing ● Meet availability, delivery capability and food service pack ● Offer price (and/or volume discount), local, organic products that are tested. ● Meet company standards for safety and liability
In addition, local purchasing would not progress unless there was “client demand.” 91% of higher education institutions indicated that if given the choice their preferred source for local ground beef is from a distributor. The top three concerns when sourcing regional ground beef are:
1. Can I get local beef from my primary distributor? – 81.8% 2. How can we afford local beef? – 63.6% 3. Can I get the type of product I’m used to? – 54.5%
The open-ended question “What are the most difficult challenges to overcome in purchasing regionally raised ground beef?” received a 63.6% response with the following challenges:
• Vendor/Product compliance • Price/Cost effectiveness • Insuring safety • Sourcing/Availability
These challenges are consistent with the influential purchasing decision qualities cited with regards to purchasing regionally source beef.
Findings Hospitals Sixty-one Food Nutrition Directors/Managers or Executive Chefs were requested to participate in the survey. This represented 11,305 beds or 26% of the total bed population of 43,566. Fifteen people responded resulting in a 25% response rate representing 2649 beds or 23% of the sample size and 6% of the total population. The responders fit hospitals with bed sizes between 25 and 659. Most hospital respondents were small-scale (25-130 beds), the majority of larger hospitals did not respond. Although we are not sure why the larger institutions were unresponsive to the survey, we are aware that they have been surveyed significantly on local purchasing topics recently and this could have contributed to their lack of response. We do know at least two, Fletcher Allen in Vermont and Maine General are buying local, and that

2011 New England Beef-to-Institution Marketing Study
Page 83
Fletcher Allen in particular is sourcing local ground beef. Additionally, in the Newstimes.com issue of August 10, 2011 in the article “Danbury Hospital to Outsource Food Services”20 we learned two hospitals we had contacted in Connecticut were part of the hiring of Morrison Management Specialists to run their food-services operation. We reached out to Morrison Management for an interview, but received no response. Hospitals’ ordering cycles are more frequent in comparison to the combined institutions. Ninety-one percent answered the ordering cycles are either daily or weekly. The total number of pounds of beef currently purchased by hospitals who responded came to approximately 43,831 at a total annual cost of $134,335. 33% state local beef makes up more than 10% of their annual volume, resulting in an annual expense of $40,335. 50% stated an 80/20 lean/fat ratio is preferred, while the remaining respondents were evenly split between an 85/15 and a 90/10 lean/fat ratio preference. The following table depicts the hospitals’ price elasticity. It shows the top three forms of beef purchases at the current price per pound, at the maximum price point per pound, and the percent they would purchase at the maximum price point as compared to the combined institutions average.
Form Average Current Price (per pound)
Maximum Per Pound Price
Point
Percent Hospital would purchase
at Price Point
Combined Institutions
Maximum Price Point
Percent Combined Institutions would purchase at Max
Price Point
Bulk $3.06 $3.85 61-75% $2-3 10-25%
Patty -4ounce $2.62 $3.50 26-75% $2.50-3 10-25%
Frozen, uncooked
$2.17 $2-3 10-50% $1.25-3 10-25%
20 Newstimes.com - http://www.newstimes.com/local/article/Danbury-Hospital-to-outsource-food-services-1840674.php

2011 New England Beef-to-Institution Marketing Study
Page 84
Packaging requirements for hospitals are specific to each institution. In general buyers are looking for:
• Five pound tubes • Vacuum packaged • Bulk pack • Cryovac®
The top four qualities most influential in purchasing decisions of ground beef are local (100%), grass fed (66.7%), antibiotic free (50%), and price (50%). In comparison to the purchasing decision question, a question regarding criteria importance with purchasing regionally sourced beef was asked. When evaluating options for a local source (see table on following page), the top criteria for hospitals are:
• Price • Price Stability • Food Safety • Regular & Timely Deliveries

2011 New England Beef-to-Institution Marketing Study
Page 85
How important are the following if/when purchasing regionally sourced ground beef from a farmer/processor/distributor?
Not at all Important Important Extremely Important 1 2 3 4 5 6 7 8 9 10
Rating Average
Consistent high quality 33% 67% 8.33
Ease of ordering 33% 17% 50% 8.17
Provides exactly what we are ordering
20% 20% 60% 7.60
Adequate supply 33% 67% 8.33
Regular & timely deliveries 17% 17% 67% 8.67
Standardized packaging 17% 17% 17% 50% 8.00
Provides kitchen staff training 17% 17% 33% 17% 17% 4.83
Dependability 33% 67% 8.33
Food Safety 17% 83% 9.17
Price 17% 83% 9.83
Price Stability 17% 83% 9.50
Long term vendor relation 17% 17% 17% 50% 7.00
Know Your Farmer 17% 50% 33% 6.33
Three questions were asked to help understand the amount of flexibility and authority hospitals have in their beef purchasing decision-making. The first question asked whether the food service operation was privately managed. 33% answered in the affirmative and one respondent identified Tamarlane as the management company. The second question asked the level of autonomy to select suppliers. 83% answered Complete Autonomy. The third question was an open-ended question and asked: How do you identify and approve food suppliers? The answers were quite different from those provided by the higher education institutions and were as follows:
• Safe Handling, fair price, availability, USDA inspected & certified, HACCP • Premier contract • Cost Analysis and quality of company • Sales Representative comes to our facility

2011 New England Beef-to-Institution Marketing Study
Page 86
• Need to have an inspection process in placed and pricing needs to be comparable. The number of local vendors ranged between one and five. Some were noted as farmers/producers with three responses stating they sourced local beef. One respondent listed both PT Farms and Boyden as suppliers of local beef. Given the choice, hospitals were evenly divided on their preferred source for regional ground beef between purchasing from a distributor or buying direct from the farm. The top four concerns when sourcing regional ground beef are:
1. How can we afford local beef? – 100% 2. Can I get local beef from my primary distributor? – 83% 3. How can we ensure local beef meets HACCP regulations? – 67% 4. How can we get the institution to commit food budget to local beef? – 67%
The open-ended question “What are the most difficult challenges to overcome in purchasing regionally raised ground beef?” received a 38% response with the following challenges:
• Availability • Sourcing • Price
Findings K-12 Two hundred and eighty-four Food Services Directors/Managers and/or Executive Chefs were requested to participate in the survey. This represented 878,560 students or 41% of the student population. Eighty-three people responded resulting in a 29% response rate with 51 completing the whole survey representing 195,863 students or 22% of the sample size and 9% of the total population. The total number of pounds of beef currently purchased by K-12 institutions responding came to approximately 302,531 at a total annual cost of $684,429. Unlike the other two institutional market segments, 48% of K-12 state they prefer an 85/15 lean/fat ratio, while only 37% stated an 80/20 preference. Seventy-two percent foresee their annual demand remaining the same. Local beef accounts for $65,295 of their total beef expense with 26% stating the total annual ground beef budget is unknown and 41% stating it is zero. The table on the following page depicts K-12 institutions’ price elasticity. It shows the top three forms of beef purchases at the current price per pound, at the maximum price point per pound, and the percent they would purchase at the maximum price point.
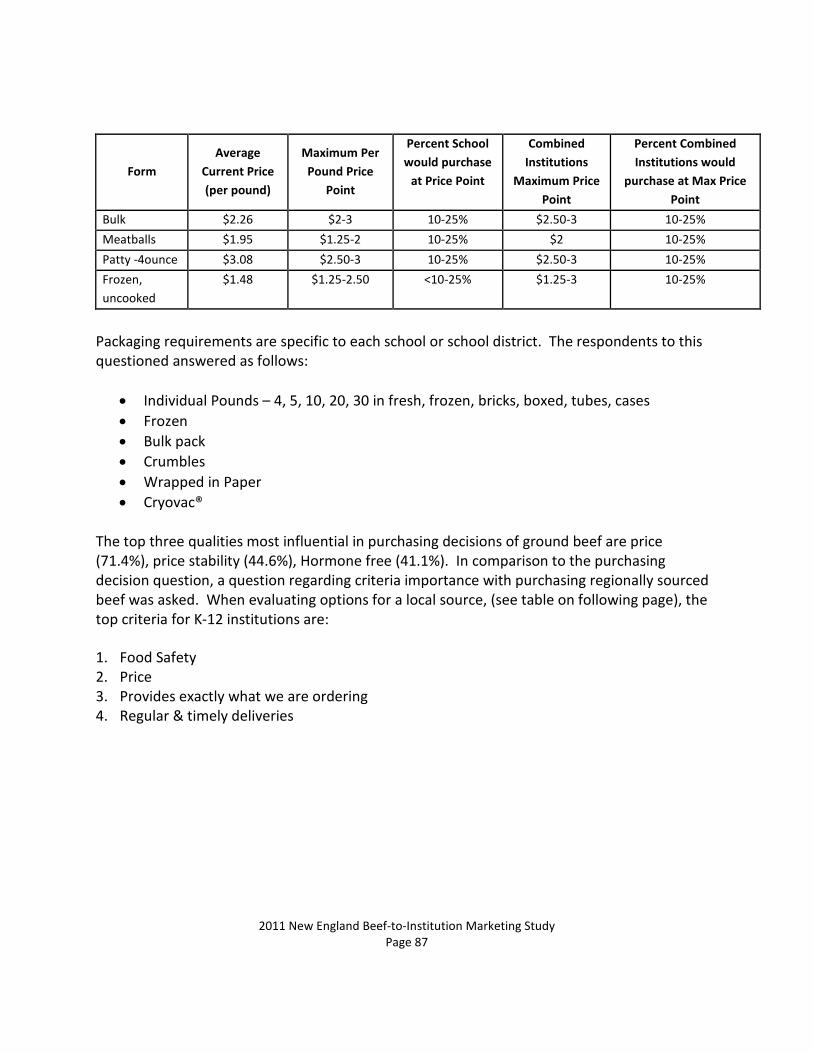
2011 New England Beef-to-Institution Marketing Study
Page 87
Form Average
Current Price (per pound)
Maximum Per Pound Price
Point
Percent School would purchase
at Price Point
Combined Institutions
Maximum Price Point
Percent Combined Institutions would
purchase at Max Price Point
Bulk $2.26 $2-3 10-25% $2.50-3 10-25% Meatballs $1.95 $1.25-2 10-25% $2 10-25% Patty -4ounce $3.08 $2.50-3 10-25% $2.50-3 10-25% Frozen, uncooked
$1.48 $1.25-2.50 <10-25% $1.25-3 10-25%
Packaging requirements are specific to each school or school district. The respondents to this questioned answered as follows:
• Individual Pounds – 4, 5, 10, 20, 30 in fresh, frozen, bricks, boxed, tubes, cases • Frozen • Bulk pack • Crumbles • Wrapped in Paper • Cryovac®
The top three qualities most influential in purchasing decisions of ground beef are price (71.4%), price stability (44.6%), Hormone free (41.1%). In comparison to the purchasing decision question, a question regarding criteria importance with purchasing regionally sourced beef was asked. When evaluating options for a local source, (see table on following page), the top criteria for K-12 institutions are: 1. Food Safety 2. Price 3. Provides exactly what we are ordering 4. Regular & timely deliveries

2011 New England Beef-to-Institution Marketing Study
Page 88
How important are the following if/when purchasing regionally sourced ground beef from a farmer/processor/distributor?
Not at all Important Important Extremely Important
1 2 3 4 5 6 7 8 9 10 N/A Rating
Average Consistent high quality
1.8% 30.4% 3.6% 1.8% 3.6% 7.1% 51.8% 8.00
Ease of ordering
1.8% 1.8% 30.4% 3.6% 8.9% 10.7% 5.4% 37.5% 7.54
Provides exactly what we are ordering
1.8% 1.8% 18.2% 3.6% 5.5% 1.8% 10.8% 56.4% 8.39
Adequate supply
3.6% 3.6% 31.8% 35.4% 3.6% 3.6% 7.3% 1.8% 38.2% 7.11
Regular & timely deliveries
1.8% 1.8% 3.6% 14.5% 3.6% 9.1% 7.3% 56.4% 1.8% 8.35
Standardized packaging
1.9% 5.5% 1.9% 7.4% 16.7% 3.7% 1.9% 9.3% 13.0% 38.9% 7.46
Provides kitchen staff training
16.7% 5.6% 14.8% 5.6% 24.51% 3.7% 5.6% 7.4% 3.7% 5.6% 7.4% 4.58
Dependability 3.6% 32.7% 1.8% 3.6% 7.3% 50.9% 7.82 Food Safety 1.8% 14.5% 1.8% 81.8% 9.09 Price 1.8% 10.9% 1.8% 3.6% 9.1% 10.9% 61.8% 8.84 Price Stability 1.9% 1.9% 14.8% 5.6% 3.7% 13% 5.6% 53.7% 8.35 Long term vendor relation
3.7% 1.9% 35.6% 3.7% 37% 7.4% 9.3% 9.3% 5.6% 16.7% 6.24
Know Your Farmer
5.5% 3.6% 9.1% 3.6% 38.2% 1.8% 3.6% 12.7% 3.6% 18.2% 5.98

2011 New England Beef-to-Institution Marketing Study
Page 89
Three questions were asked to help understand the amount of flexibility and authority K-12 institutions have regarding beef purchasing decision-making. The first question asked whether the food service operation was privately managed. 76% said No. The second question asked the level of autonomy to select suppliers. 46% answered Complete Autonomy. The third question was an open-ended question and asked: How do you identify and approve food suppliers? The most prominent response was through using USDA/FDA-USDA certified/Purchasing-Bidding Cooperative/State Child Nutrition guidance. Second to that came corporate specifications, guidance from distributors, then came answers such as price & product testing, interviews/meetings, word of mouth, “non-USDA local food supplier form that covers insurance and how the food is raised/grown,” and “quality, performance, and cost analysis.” The number of local vendors ranged between 1 and 10 with one respondent having 30 local vendors. Approximately two to three different vendors were noted to be supplying local beef. In order for schools to consider changing or adding distributors in order to enable the purchase of local beef products again the respondents referenced USDA as a core hurdle that would need to be overcome:
● USDA School foodservice purchase ● Recommendation from USDA to the FSM ● Farmers would have to work through Donated Food Section of Dept. of Education to
make sure all schools get equal quality beef with fair pricing. In addition they were concerned about price, quality, supply and distribution, minimum purchase restrictions, and limitations on how much they can buy outside of their “prime vendor” contracts. For example, one institution stated they can only purchase up to 20% of their total needs outside of their prime vendor. 54% percent indicated if given the choice their preferred source for regionally sourced ground beef would be from a distributor while 32% indicated they would purchase direct from a farmer, farmer cooperative or Farmers’ market. The top four concerns K-12 institutions have when sourcing regional ground beef are:
• How can we afford local beef? – 77% • Can we use our USDA commodity funding? – 75% • How can we ensure local beef meets USDA regulations? – 64% • Can I get local beef from my primary distributor? – 64%

2011 New England Beef-to-Institution Marketing Study
Page 90
The open-ended question “What are the most difficult challenges to overcome in purchasing regionally raised ground beef?” received a 60% response with the following challenges:
• Price/Comparative price • Corporate policies • USDA approval • Delivery • Ease or Ordering • Safety • Sourcing/Availability/Logistics • Students acceptability
In order to be successful in K-12 schools the Food Nutrition Directors may need additional assistance from volunteer parents who are willing to work with farmers and processors, and who are willing to help educate the student body, other parents, and the kitchen staff. As an example, Exeter New Hampshire High School holds “food assemblies” to discuss food nutrition and preparation. The assemblies conclude with a cooking class. Upfront planning, building scratch equipment over time, waste reduction efforts, and school lunch pricing analysis will lead to more sustainable efforts for schools to purchase local meat. These efforts will take time but support from school and government administration will help.21
Institutions Conclusion Of the three institutional market segments, the healthcare industry represents the easiest point of entry for both producers and processors. There are several reasons:
• Hospitals appear to be early adopters • They have the highest price point and elasticity • From large scale to small scale (less than 100 beds to greater than 250 beds) they are
interested in local beef. • They are aware of the potential health benefits of certain types of meat and are willing
to pay a premium for these attributes. • They are evenly split between those who want to buy direct and those who want to buy
through a distributor. • They tend to have more autonomy and are independently managed.
• While hospitals represent the easiest point of entry for both the producer and
processor-driven models, they represent the smallest volume needs of the institutional market and therefore higher education and K-12 should not necessarily be overlooked.
21Interview with Doris Demers, June 28, 2011 and Jeanne Pierce and Tracey Miller, August 16, 2011.

2011 New England Beef-to-Institution Marketing Study
Page 91
The bottom line is, if we extrapolate out the survey results to the entire New England Institutional Market:
1. 29% of the institutional population is seeking a direct relationship with a producer and has a sensitivity threshold that can reach as high as $4-5/lb for ground beef, if the product has certain attributes such as single source, grass fed, certified organic, etc.
2. 53% of the institutional population is interested in purchasing local product with local being the key attribute, if it came from their existing distributor.
3. The total New England institutional market uses approximately 6.2 million pounds annually.
4. Institutional buyers are willing to replace up to 25% of their total volume, representing an opportunity to source up to 1.55 million pounds, with a locally sourced product if suppliers can hit a $2-3/lb price point.
5. 86% of this volume, 1.33 million pounds is purchased as bulk, ground beef, requiring no further processing (no pasteurizing, shaped and formed, cooked, flavored, etc).

2011 New England Beef-to-Institution Marketing Study
Page 92
Appendices Appendix A: Literature & Internet Resources Growing Interest In Local Foods 2007-2010 Burlington Food Hub Research and Implementation http://mysare.sare.org/mySARE/ProjectReport.aspx?do=viewRept&pn=LNE07-260&y=2010&t=1 2007 “Agriculture’s Hold on the Commonwealth” http://bct.eco.umass.edu/wp-content/uploads/2007/10/agricultures_hold_on_the_commonwealth.pdf 2006 “A Food Policy for the State of Maine” http://www.maine.gov/agriculture/mpd/information/foodpolicydraft.pdf 2008 “The Agricultural Creative Economy” http://www.maine.gov/agriculture/mpd/information/agcreative.pdf 2004 “New Hampshire Department of Agriculture Marketing Research and Recommendations” http://www.nh.gov/agric/divisions/agricultural_development/documents/strategy.pdf Local Beef Industry Feasibility Studies 2000 Market Research and Building for local beef http://mysare.sare.org/mySARE/ProjectReport.aspx?do=viewRept&pn=FNE00-339&y=2000&t=1 2008-2010 CT, MA, RI Tri-State Project – Producing Natural Local Meats for Consumers http://nesare.org/state-programs/connecticut/connecticut.html http://nesare.org/state-programs/massachusetts/2009_ct_ma_ri_report_summary.pdf http://nesare.org/state-programs/connecticut/CT-2008-Year-End-Report.pdf CT Meat and Poultry Producers’ Association: CMPPA 2008 "Demand and Options for Local Meat Processing: Finding the way from pasture to market in the CT River Valley" Food & Water Watch. http://www.foodandwaterwatch.org/food/foodsafety/meat-inspection-1/usda-vacancies-mean-u-s-food-supply-notinspected. April 18, 2007.

2011 New England Beef-to-Institution Marketing Study
Page 93
http://www.extension.org/pages/54937/connecticut-river-valley-2008 http://www.extension.org/mediawiki/files/6/64/CISA_feasibility_study_2008.pdf 2000 Shepstone Meat Processing Facility Feasibility Study http://www.shepstone.net/HVreport.pdf 2007 Farm to Chef SARE in PA http://mysare.sare.org/mySARE/ProjectReport.aspx?do=viewRept&pn=LNE05-219&y=2007&t=0 2008 “Vermont Food Basket Project” http://mysare.sare.org/mySARE/ProjectReport.aspx?do=viewRept&pn=CNE08-049&y=2008&t=1 2008 “Producers/Buyers Cooperative: Linking Family Farms and Institutions” http://mysare.sare.org/mySARE/ProjectReport.aspx?do=viewRept&pn=CS09-074&y=2010&t=0 2004-2007 “Developing Sustainable Local Food Sales to a College Institutional Market” http://mysare.sare.org/mySARE/ProjectReport.aspx?do=viewProj&pn=LNE04-205 2009 “Economic and Fiscal Impacts of the Dairy Industry in Connecticut” http://www.ct.gov/doag/lib/doag/pdf/dairy_impact_report_-_1-12-2009_v6.pdf 2010 “The Economics of Producing Grass-Finished and Natural Beef in Maine” http://umaine.edu/maineagcenter/files/2010/12/MAC121-proposal-2010.pdf 2011 “Economics of Regional Meat” Webinar from National Good Food Network http://ngfn.org/resources/ngfn-cluster-calls/ngfn-cluster-calls/the-economics-of-regional-meat 2002 “Market Cows: A Potential Profit Center” http://www.livestocktrail.uiuc.edu/dairynet/paperdisplay.cfm?contentid=354 2010 “Dairy Beef” http://www.attra.org/attra-pub/PDF/dairybeef.pdf 2011 “Beef Cattle Producers Want Out-How High for Prices?” http://www.aces.uiuc.edu/news/stories/news5569.html 2011 “CoopMetrics Benchmarking Analysis Pilot Project Report”

2011 New England Beef-to-Institution Marketing Study
Page 94
Print. (from Chelsea) 2005 “Slaughterhouse Feasibility Study” http://www.uvm.edu/~susagctr/Documents/SlaughterhouseSummaryRecommendations.pdf 2003 “New Hampshire Livestock Inventory and Slaughter Facility Feasibility Study” http://www.uvm.edu/livestock/meat/LivestockReportWriteup.pdf 2006 “Vermont Ground Beef Marketing Study” http://www.vhcb.org/pdfs/viabilitygroundbeefmarketingstudy.pdf Revallo, Angela. Solutions to Encourage Local Meat Production and Processing. Sam Comstock UVM Extension. 2010. Print. http://www.sustainweb.org/goodfoodpublicplate/about/ National Farm to School Network, Community Food Security Coalition, Real Food Challenge RI Market Mobile http://www.farmfresh.org/hub/ CT Farm to School Program farms http://www.ct.gov/doag/cwp/view.asp?a=2225&q=308750 CT Farm to School Program schools http://www.ct.gov/doag/cwp/view.asp?a=2225&q=306582 2010 VT Local Banquet article “Older Dairy Cows Could Become Steady Source of Local Beef” http://www.localbanquet.com/issues/years/2010/winter10/cullcows_w10.html Salt of the Earth marketing cull cattle as processed meat grassfed http://www.sotellc.com/ 2009 “Feasibility of a Local Processing Facility in Carroll County, Georgia” http://www.caes.uga.edu/topics/sustainag/documents/MeatProcessingFeasibilityStudy.pdf Healthy Food in Healthcare pledge http://www.noharm.org/lib/downloads/food/Healthy_Food_in_Health_Care.pdf

2011 New England Beef-to-Institution Marketing Study
Page 95
Organizations Institutional Food Market Coalition, IFM http://www.ifmwi.org/about.aspx Local Sourcing 101 for new institutional buyers http://danedocs.countyofdane.com/webdocs/pdf/plandev/ifm/Local_Sourcing_101_0.pdf Good Food on the Public Plate http://www.sustainweb.org/goodfoodpublicplate/ State Bills NH: No bills passed since 1989 concerning local food were found. ME: Resolve, To Establish a Study Group To Promote the Use of Locally Gown Food in Schools http://www.mainelegislature.org/legis/bills/bills_125th/billtexts/HP094801.asp VT: An act relating to state purchasing from local and socially responsible businesses http://www.leg.state.vt.us/docs/2012/bills/Intro/S-063.pdf An act relating to job creation and economic development http://www.leg.state.vt.us/database/status/summary.cfm?Bill=H%2E0287&Session=2012 VT labeling fact sheets http://www.uvm.edu/extension/food/pdfs/meat_inspection_factsheet_april2011.pdf http://www.uvm.edu/extension/food/pdfs/meat_labeling_factsheet_april2011.pdf CT: An Act Concerning Connecticut-Grown Food in Schools http://www.cga.ct.gov/2006/TOB/S/2006SB-00375-R03-SB.htm 2005 “School Meals from Connecticut Farms” http://www.ct.gov/doag/lib/doag/farm_to_school_images_/F2S_BACKGROUND_RPT.pdf Other: 2001 Grants http://www.ams.usda.gov/AMSv1.0/getfile?dDocName=STELPRDC5089219

2011 New England Beef-to-Institution Marketing Study
Page 96
Federal Legislation Farm to Institution http://articles.boston.com/2011-02-18/news/29339212_1_local-food-federal-grant-schools Federal State Marketing Improvement Service 2010 Grants http://www.ams.usda.gov/AMSv1.0/getfile?dDocName=STELPRDC5089228 Federal State Marketing Improvement Service 2009 Grants http://www.ams.usda.gov/AMSv1.0/getfile?dDocName=STELPRDC5089227 Federal State Marketing Improvement Service 2008 Grants Federal State Marketing Improvement Service 2004 Grants http://www.ams.usda.gov/AMSv1.0/getfile?dDocName=STELPRDC5089222 Federal State Marketing Improvement Service 2003 Grants http://www.ams.usda.gov/AMSv1.0/getfile?dDocName=STELPRDC5089222 Federal State Marketing Improvement Service 2002 Grants http://www.ams.usda.gov/AMSv1.0/getfile?dDocName=STELPRDC5089220 department of defense http://www.fas.org/sgp/crs/natsec/RS22190.pdf department of defense http://www.farmtoschool.org/state-programs.php?action=detail&id=31&pid=52 USDA/Commodity/Farm to School http://www.schoolfoodfocus.org/site/wp-content/uploads/2010/06/School-Food-101-Cost-of-School-Lunch-BW.pdf http://www.gao.gov/new.items/d11376.pdf http://waangi.com/jon/farm_to_school.pdf http://www.farmtoschool.org/publications.php http://www.foodsecurity.org/dod_f2s.pdf http://www.fns.usda.gov/fdd/programs/dod/DOD_FreshFruitandVegetableProgram2011.pdf

2011 New England Beef-to-Institution Marketing Study
Page 97
http://frac.org/wp-content/uploads/2009/09/commodities08.pdf Other http://www.tradertech.com/information/LiveCattleTrading.asp http://www.mrci.com/sample/dairyspl.pdf http://www.ers.usda.gov/Data/MeatPriceSpreads/ http://jas.fass.org/content/85/10/2631.full http://beefmagazine.com/cowcalfweekly/1030-know-usda-cull-cow-grades-market/ http://www.livestocktrail.uiuc.edu/dairynet/paperDisplay.cfm?ContentID=10059 http://www.uaex.edu/Other_Areas/publications/PDF/FSA-4008.pdf http://www.simmental.org/userimages/Elanco_Book_Final_pgs.pdf http://extension.psu.edu/scregion/Agriculture/Lessons/marketmeatanimals.htm http://www1.agric.gov.ab.ca/$department/deptdocs.nsf/all/agdex10321 http://mainebeefproducersassociation.org/ www.uky.edu/Ag/AnimalSciences/agents/training/BodyConditionScoringinFarmAnimals.ppt Dr. Gary Parker, Dr. Richard Coffey. Body Condition Scoring in Farm Animals. Introduction to Animal and Food Sciences In-Service. University of Kentucky, College of Agriculture. http://www.ct.gov/doag/cwp/view.asp?a=3260&q=412836 http://www.caes.uga.edu/topics/sustainag/documents/MeatProcessingFeasibilityStudy.pdf http://www.keeplocalfarms.org/meet-local-farmers/participating-farms/ http://e-commons.org/mdh2e/sustainable-foods/may5conference-localsustainablemeatpoultry/ http://e-commons.org/mdh2e/files/2011/04/Conference-Schedule-May-5-Local-Sustainable-Meat-and-Poultry-Purchasing-by-Institutions.pdf http://e-commons.org/mdh2e/ http://www.ams.usda.gov/AMSv1.0/getfile?dDocName=STELPRDC5080896 http://www.cga.ct.gov/2006/TOB/S/2006SB-00375-R03-SB.htm http://www.leg.state.vt.us/database/status/summary.cfm?Bill=H%2E0287&Session=2012 http://www.leg.state.vt.us/docs/2012/bills/Intro/S-063.pdf http://www.mainelegislature.org/legis/bills/bills_125th/billtexts/HP094801.asp http://www.ct.gov/doag/cwp/view.asp?a=2225&q=308750 http://www.ct.gov/doag/cwp/view.asp?a=2225&q=306582 http://www.farmfresh.org/hub/ http://www.sustainweb.org/goodfoodpublicplate/about/ http://danedocs.countyofdane.com/webdocs/pdf/plandev/ifm/Local_Sourcing_101_0.pdf http://www.ifmwi.org/about.aspx http://www.localbanquet.com/issues/years/2010/winter10/cullcows_w10.html http://www.vhcb.org/pdfs/viabilitygroundbeefmarketingstudy.pdf Revallo, Angela. Solutions to Encourage Local Meat Production and Processing. Sam Comstock UVM Extension. 2010. Print. http://www.uvm.edu/~susagctr/Documents/SlaughterhouseSummaryRecommendations.pdf

2011 New England Beef-to-Institution Marketing Study
Page 98
http://www.aces.uiuc.edu/news/stories/news5569.html http://www.attra.org/attra-pub/PDF/dairybeef.pdf http://www.livestocktrail.uiuc.edu/dairynet/paperdisplay.cfm?contentid=354 http://ngfn.org/resources/ngfn-cluster-calls/ngfn-cluster-calls/the-economics-of-regional-meat http://umaine.edu/maineagcenter/files/2010/12/MAC121-proposal-2010.pdf http://www.ct.gov/doag/lib/doag/pdf/dairy_impact_report_-_1-12-2009_v6.pdf http://www.nh.gov/agric/divisions/agricultural_development/documents/strategy.pdf http://www.maine.gov/agriculture/mpd/information/agcreative.pdf http://www.maine.gov/agriculture/mpd/information/foodpolicydraft.pdf http://mysare.sare.org/mySARE/ProjectReport.aspx?do=viewProj&pn=LNE04-205 http://mysare.sare.org/mySARE/ProjectReport.aspx?do=viewRept&pn=CS09-074&y=2010&t=0 http://bct.eco.umass.edu/wp-content/uploads/2007/10/agricultures_hold_on_the_commonwealth.pdf http://www.shepstone.net/HVreport.pdf http://www.extension.org/pages/54937/connecticut-river-valley-2008 http://www.extension.org/mediawiki/files/6/64/CISA_feasibility_study_2008.pdf http://nesare.org/state-programs/connecticut/connecticut.html http://nesare.org/state-programs/massachusetts/2009_ct_ma_ri_report_summary.pdf http://nesare.org/state-programs/connecticut/CT-2008-Year-End-Report.pdf http://mysare.sare.org/mySARE/ProjectReport.aspx?do=viewRept&pn=LNE07-260&y=2010&t=1 http://www.docstoc.com/docs/3455765/A-Resource-Guide-to-Direct-Marketing-Livestock-and-Poultry-Written http://mysare.sare.org/mySARE/ProjectReport.aspx?do=viewRept&pn=FNE00-339&y=2000&t=1 http://quickfacts.census.gov/qfd/states/55/55025.html http://rhodyfresh.com/ http://www.farmfreshri.org/ MacDonald, James M., Michael E. Ollinger, Kenneth E. Nelson, and Charles R. Handy. "Concentration and Consolidation in Livestock Slaughter." USDA Economic Research Service, March 1999. AER-785

2011 New England Beef-to-Institution Marketing Study
Page 99
Appendix B: List of Persons Consulted Kenneth Ayars, Chief State of Rhode Island Department of Environmental Management Division of Agriculture 235 Promenade Street, Providence, RI 02908-5767 (401) 222-2781 Judy Ballard Maine Department of Agriculture 28 State House Station Deering Bldg. - AMHI Complex Augusta, ME 04333-0028 Becky Bessette [email protected] (401) 222-4253
Julie Marie Bickford Executive Director Maine Dairy Industry Association 879 Weeks Mills Road, New Sharon, Maine 04955 Joseph Bonelli Associate Extension Educator (860) 875-3331 [email protected] Koi Boynton Development Coordinator Vermont Agency of Agriculture 116 State Street, Montpelier, VT 05602 802-828-2084 Dorothy Brayley, Executive Director Kids First/Real Food First Hope Artiste Village 1005 Main Street, Suite #1225, Pawtucket, RI 02860 401-475-9696 [email protected]

2011 New England Beef-to-Institution Marketing Study
Page 100
Jennifer Colby Pasture Program Coordinator, VT Grass Farmers’ Association UVM Center for Sustainable Agriculture 106 Highpoint Center, Suite 300, Colchester, VT 05446 (802) 728-2045 [email protected] Laurie Colgan VT Dept. of Education [email protected] 802-828-5153
Amanda Costello Cheshire County Conservation District Walpole NH (603) 756-2988 x 116 [email protected] Elisabeth Farrell Program Coordinator Culture & Sustainability, Food & Society Initiatives UNH Sustainability Academy 107 Nesmith Hall, Durham, NH 03824 (603) 862-5040 [email protected] Sam Fuller NOFA VT PO Box 697, Richmond, VT 05477 (802) 434-4122 Pam Harnden Executive Director Maine Beef Producers Association [email protected] Douglas R. Hoffer 161 Austin Dr. #71, Burlington, VT 05401 (802) 864-5711 [email protected]

2011 New England Beef-to-Institution Marketing Study
Page 101
Linda Hubeny [email protected] Michael T. Keilty Sustainable Agriculture and Foods Educator College of Agriculture & Natural Resources University of Connecticut Maple Spring Farms, 107 Kenyon Rd, Morris CT 06763 (860) 567-8324 [email protected] Jean C. King 126 North Street, Watertown,CT 06795 (860) 916-7367 [email protected]
Chelsea Bardot Lewis Development Coordinator Vermont Agency of Agriculture 116 State Street, Montpelier, VT 05602 (802) 828-3360 Gail Lombardi Maine Department of Education Child Nutrition Services (207) 624-6876 Gail McWilliam-Jellie Director Division of Agricultural Development New Hampshire Department of Agriculture (603) 271-3788 [email protected] Kathleen Millett Mass. Dept. of Elementary and Secondary Education 75 Pleasant St., Malden, MA 02148 [email protected]

2011 New England Beef-to-Institution Marketing Study
Page 102
Chip Morgan, President VT Beef Producers Association Wood Creek Farm 560 Lake Street, Bridport, VT 05734 (802) 758-2909 [email protected] Ken Morse Maine Lead - Northeast Region National Farm to School Network (207) 393-0134 [email protected] Alyssa Nathanson, MS, RD Vermont Coordinator, Healthy Food in Health Care (802) 371-8741 Abbie Nelson Vermont FEED PO Box 697, Richmond, VT 05477 (802) 434-4122 Bonita Oehlke Massachusetts Department of Agricultural Resources 251 Causeway Street, Suite 500, Boston, MA 02114 (617) 626-1753 Stacey Purslow NH Farm to School Coordinator University of New Hampshire (603) 862-2542 [email protected] Jacomijn Schravesande-Gardei Associate Director of Crops MOFGA Certification Services, LLC POB 170 Unity, ME 04988 (207) 568-4142

2011 New England Beef-to-Institution Marketing Study
Page 103
Jane M. Slupecki Agricultural Marketing & Inspection Rep II Connecticut Department of Agriculture 165 Capitol Avenue, Room 129, Hartford, CT 06106 (860) 713-2588 Theresa Snow Director of Agricultural Resources Vermont Foodbank (802) 477-4114 Jon Walker Good Food on the Public Plate [email protected] Amy Winston CEI Farm to Institution National Farm to School Network - Northeast Regional Lead [email protected] (207) 882-7552 x 172 Laura Witzling IFM Coordinator Dane County Planning and Development Dept. City County Building, Room 116, 210 Martin Luther King, Jr. Blvd., Madison, WI 53703-3342 (608) 266-6389 Cheryl Wixson Maine Organic Farmers and Gardeners Association PO Box 170 294 Crosby Brook Road, Unity, ME 04988 (207) 237-2636
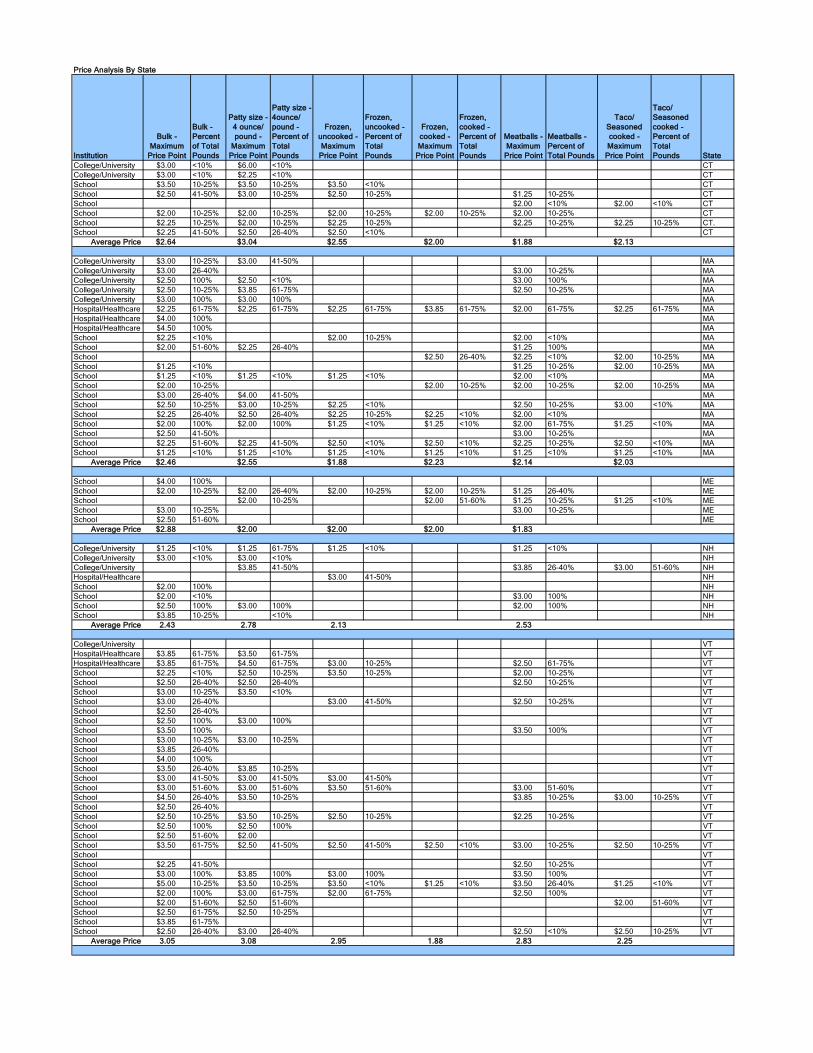
Price Analysis By State
Institution
Bulk - Maximum
Price Point
Bulk - Percent of Total Pounds
Patty size - 4 ounce/ pound -
Maximum Price Point
Patty size - 4ounce/ pound - Percent of Total Pounds
Frozen, uncooked - Maximum
Price Point
Frozen, uncooked - Percent of Total Pounds
Frozen, cooked - Maximum
Price Point
Frozen, cooked - Percent of Total Pounds
Meatballs - Maximum
Price Point
Meatballs - Percent of Total Pounds
Taco/ Seasoned cooked - Maximum
Price Point
Taco/ Seasoned cooked - Percent of Total Pounds State
College/University $3.00 <10% $6.00 <10% CTCollege/University $3.00 <10% $2.25 <10% CTSchool $3.50 10-25% $3.50 10-25% $3.50 <10% CTSchool $2.50 41-50% $3.00 10-25% $2.50 10-25% $1.25 10-25% CTSchool $2.00 <10% $2.00 <10% CTSchool $2.00 10-25% $2.00 10-25% $2.00 10-25% $2.00 10-25% $2.00 10-25% CTSchool $2.25 10-25% $2.00 10-25% $2.25 10-25% $2.25 10-25% $2.25 10-25% CT.School $2.25 41-50% $2.50 26-40% $2.50 <10% CT
Average Price $2.64 $3.04 $2.55 $2.00 $1.88 $2.13
College/University $3.00 10-25% $3.00 41-50% MACollege/University $3.00 26-40% $3.00 10-25% MACollege/University $2.50 100% $2.50 <10% $3.00 100% MACollege/University $2.50 10-25% $3.85 61-75% $2.50 10-25% MACollege/University $3.00 100% $3.00 100% MAHospital/Healthcare $2.25 61-75% $2.25 61-75% $2.25 61-75% $3.85 61-75% $2.00 61-75% $2.25 61-75% MAHospital/Healthcare $4.00 100% MAHospital/Healthcare $4.50 100% MASchool $2.25 <10% $2.00 10-25% $2.00 <10% MASchool $2.00 51-60% $2.25 26-40% $1.25 100% MASchool $2.50 26-40% $2.25 <10% $2.00 10-25% MASchool $1.25 <10% $1.25 10-25% $2.00 10-25% MASchool $1.25 <10% $1.25 <10% $1.25 <10% $2.00 <10% MASchool $2.00 10-25% $2.00 10-25% $2.00 10-25% $2.00 10-25% MASchool $3.00 26-40% $4.00 41-50% MASchool $2.50 10-25% $3.00 10-25% $2.25 <10% $2.50 10-25% $3.00 <10% MASchool $2.25 26-40% $2.50 26-40% $2.25 10-25% $2.25 <10% $2.00 <10% MASchool $2.00 100% $2.00 100% $1.25 <10% $1.25 <10% $2.00 61-75% $1.25 <10% MASchool $2.50 41-50% $3.00 10-25% MASchool $2.25 51-60% $2.25 41-50% $2.50 <10% $2.50 <10% $2.25 10-25% $2.50 <10% MASchool $1.25 <10% $1.25 <10% $1.25 <10% $1.25 <10% $1.25 <10% $1.25 <10% MA
Average Price $2.46 $2.55 $1.88 $2.23 $2.14 $2.03
School $4.00 100% MESchool $2.00 10-25% $2.00 26-40% $2.00 10-25% $2.00 10-25% $1.25 26-40% MESchool $2.00 10-25% $2.00 51-60% $1.25 10-25% $1.25 <10% MESchool $3.00 10-25% $3.00 10-25% MESchool $2.50 51-60% ME
Average Price $2.88 $2.00 $2.00 $2.00 $1.83
College/University $1.25 <10% $1.25 61-75% $1.25 <10% $1.25 <10% NHCollege/University $3.00 <10% $3.00 <10% NHCollege/University $3.85 41-50% $3.85 26-40% $3.00 51-60% NHHospital/Healthcare $3.00 41-50% NHSchool $2.00 100% NHSchool $2.00 <10% $3.00 100% NHSchool $2.50 100% $3.00 100% $2.00 100% NHSchool $3.85 10-25% <10% NH
Average Price 2.43 2.78 2.13 2.53
College/University VTHospital/Healthcare $3.85 61-75% $3.50 61-75% VTHospital/Healthcare $3.85 61-75% $4.50 61-75% $3.00 10-25% $2.50 61-75% VTSchool $2.25 <10% $2.50 10-25% $3.50 10-25% $2.00 10-25% VTSchool $2.50 26-40% $2.50 26-40% $2.50 10-25% VTSchool $3.00 10-25% $3.50 <10% VTSchool $3.00 26-40% $3.00 41-50% $2.50 10-25% VTSchool $2.50 26-40% VTSchool $2.50 100% $3.00 100% VTSchool $3.50 100% $3.50 100% VTSchool $3.00 10-25% $3.00 10-25% VTSchool $3.85 26-40% VTSchool $4.00 100% VTSchool $3.50 26-40% $3.85 10-25% VTSchool $3.00 41-50% $3.00 41-50% $3.00 41-50% VTSchool $3.00 51-60% $3.00 51-60% $3.50 51-60% $3.00 51-60% VTSchool $4.50 26-40% $3.50 10-25% $3.85 10-25% $3.00 10-25% VTSchool $2.50 26-40% VTSchool $2.50 10-25% $3.50 10-25% $2.50 10-25% $2.25 10-25% VTSchool $2.50 100% $2.50 100% VTSchool $2.50 51-60% $2.00 VTSchool $3.50 61-75% $2.50 41-50% $2.50 41-50% $2.50 <10% $3.00 10-25% $2.50 10-25% VTSchool VTSchool $2.25 41-50% $2.50 10-25% VTSchool $3.00 100% $3.85 100% $3.00 100% $3.50 100% VTSchool $5.00 10-25% $3.50 10-25% $3.50 <10% $1.25 <10% $3.50 26-40% $1.25 <10% VTSchool $2.00 100% $3.00 61-75% $2.00 61-75% $2.50 100% VTSchool $2.00 51-60% $2.50 51-60% $2.00 51-60% VTSchool $2.50 61-75% $2.50 10-25% VTSchool $3.85 61-75% VTSchool $2.50 26-40% $3.00 26-40% $2.50 <10% $2.50 10-25% VT
Average Price 3.05 3.08 2.95 1.88 2.83 2.25

COARSE 2/ ALL PATTIES ROUND ROASTS SPECIAL TRIM
Quantity Quantity Quantity Quantity QuantityValue Value Value Value Value Value
Pounds % Dollars Pounds % Dollars Pounds % Dollars Pounds % Dollars Pounds % Dollars Pounds % Dollars(mil.) (mil.) (mil.) (mil.) (mil.) (mil.) (mil.) (mil.) (mil.) (mil.) (mil.) (mil.)
Hansford, CAAmarillo, TX 1.76 2.41 2.89 1.76 1.41 2.89
Beef Product, Inc. South Sioux City, NE 0.08 1.06 0.17 0.08 0.06 0.17
Cargill-Beef Packers Inc. Fresno, CA 4.78 6.52 7.17 4.78 3.82 7.17
Cargill Taylor Beef Milwaukee, WI 0.50 0.69 0.77 0.50 0.40 0.77
Central Valley Meat Company * Hansford, CA 6.08 13.76 9.80 13.36 18.22 22.24 0.17 100.00 0.42 19.61 15.65 32.46
Cherry Meat Packers, Inc * Chicago, IL 14.36 32.49 24.31 10.54 14.38 17.22 7.07 98.94 11.85 31.97 25.51 53.38
Criss Cross Express * Rantoul, IL 2.08 4.71 3.94 10.79 14.72 17.09 12.87 10.27 21.03
Delgado Meat Company, Inc. ** Chicago, IL 1.55 2.12 2.54 1.55 1.24 2.54
Fins & Feathers Seafood & Poultry ** Chicago, IL 1.30 1.78 2.06 1.30 1.04 2.06
Guidry Liason Group, Inc.** Chicago, IL 1.18 1.60 2.00 1.18 0.94 2.00
Mactree, LLC *** Chicago, IL 0.17 0.23 0.33 0.17 0.13 0.33
Martin's Abattoir & Wholesale Meat* Godwin, NC 0.08 0.11 0.11 0.08 0.06 0.11
Wichita, KS 0.48 52.17 1.80 0.48 0.38 1.80 Chicago, IL 1.30 1.78 2.06 1.30 1.04 2.06
Palo Duro Meat Processing * Amarillo, TX 14.84 33.58 24.38 16.52 22.52 26.89 31.36 25.02 51.26
Skylark Meats Inc Omaha, NE 3.76 8.50 6.55 0.44 47.83 1.62 3.76 3.00 6.55
Taylor Packing Company, Inc. Wyalusing, PA 1.26 1.72 1.78 1.26 1.01 1.78
Tyson Meat Holcomb, KS 0.04 0.05 0.05 0.04 0.03 0.05
Veterans For Kids *** Chino, CA 0.25 0.34 0.34 0.25 0.20 0.34
Westland Meat Co * Chino, CA 3.08 6.97 4.25 7.85 10.71 10.72 10.93 8.72 14.97
GRAND TOTAL ALL VENDORS 44.20 100.00 73.22 73.33 100.00 116.44 7.14 100.00 12.02 0.92 100.00 3.43 0.17 100.00 0.42 125.32 100.00 203.91
SMALL BUSINESS (Excludes 8(a)) 40.44 91.50 66.67 59.15 80.66 94.27 7.07 98.94 11.85 0.48 52.17 1.80 0.17 100.00 0.42 106.83 85.24 173.21 SMALL BUSINESS 8(a) Firms 5.41 7.38 8.84 5.89 4.70 10.64 SMALL BUSINESS (Service Disabled Veterans) 2.18 2.98 3.55 2.18 1.74 3.55 TOTAL SMALL BUSINESS 40.44 91.50 66.67 66.74 91.02 106.66 7.07 98.94 11.85 0.48 52.17 1.80 0.17 100.00 0.42 114.90 91.68 187.41 LARGE BUSINESS 3.76 8.50 6.55 6.59 8.98 9.78 0.08 1.06 0.17 0.44 47.83 1.62 10.42 8.32 16.51 TOTAL 44.20 100.00 73.22 73.33 100.00 116.44 7.14 100.00 12.02 0.92 100.00 3.43 0.17 100.00 0.42 125.32 100.00 203.91
Represent Small Business *Represent Small Business 8(a) Firms **Represent Small Business Service Disabled Veterans ***Totals may not add due to rounding.1/ Includes 1 Lb Chubs2/ Includes Fresh Boneless Combos
FROZEN BEEFPURCHASED BY VENDOR
FISCAL YEAR 2008
Barrios Distributing ***
McGreevy's Mid West Meat Co. *(*)
VENDOR PROCESSING POINT
Purchases through September 30, 2008Livestock and Seed Program
QuantityTOTAL FROZEN BEEF Fine 1/

FOOD PURCHASE
REPORT
United States
Department
Of Agriculture
Agricultural
Marketing
Service
April 12, 2011
USDA BUYS FROZEN BEEF:
The Agricultural Marketing Service of the U.S. Department
of Agriculture today purchased 924,000 pounds of frozen beef at
a cost of approximately $1,818,000. These products are for use
in Federal food and nutrition assistance programs. Details of
today’s purchase follows:
Beef Product Pounds Awarded Prices
Inv.No.140
No. Of Bids
Accepted
Reprocessing Beef 924,000 $1.9492-$2.0318 1 of 6
Purchases of frozen beef products for School Year 2010-11
since the program began on May 5, 2010, follow:
Commodity Cumulative
Pounds
Cumulative
Dollars
Reprocessing Beef 67,494,000 140,463,000
Fine Ground 25,280,000 55,460,000
SPP Patties 1,786,000 3,877,000
100% Patties 2,242,000 5,356,000
Lean Patties 1,102,000 2,816,000
95% Lean Patties 76,000 193,000
Fine Ground (1-lb) 6,520,000 14,628,000
Total Purchases 104,500,000 218,363,000
Inquiries should be addressed to the Contracting Officer;
Livestock and Seed Program; USDA, AMS, Room 2610-South; 1400
Independence Avenue, Washington, D.C. 20250. Telephone:
202/720-4517; FAX: 202/720-2782
- MORE –

FOOD PURCHASE REPORT PAGE 2 OF 2
04/12/11
Awards made today for LS-200, Invitations 140 to be delivered
between May 16 and May 31, 2011, follow:
ANNOUNCEMENT : LS200
COMM GROUP : BEEF, FROZEN
INVITATION : 140
COMMODITY TYPE : BEEF,COARSE GROUND, REPROCESS
PACK SIZE : 60 LB CTN
CONTRACTOR NAME: AMERICAN BEEF PACKERS
PLANT ADDRESS : CHINO CA
ITEM ----DESTINATION---- QUANTITY PRICE PER
NUM CITY ST (LBS ) (LB )
---- ---------------- -- ----------- -----------
001 CINCINNATI OH 126,000 $ 2.0318
002 ENID OK 126,000 $ 1.9992
003 GARDENA CA 84,000 $ 1.9492
004 VERNON CA 588,000 $ 1.9498
TOTAL AWARDED: 924,000
An electronic version of this food purchase report can be obtained via the
World Wide Web at: http://www.ams.usda.gov/LSCP
-----

FOOD PURCHASE
REPORT
United States
Department
Of Agriculture
Agricultural
Marketing
Service
February 9, 2011
USDA BUYS FROZEN BEEF:
The Agricultural Marketing Service of the U.S. Department
of Agriculture today purchased 1,200,000 pounds of frozen beef
at a cost of approximately $2,831,000. No offers were made on
the lean patties. These products are for use in Federal food
and nutrition assistance programs. Details of today’s purchase
follows:
Beef Product Pounds Awarded Prices
Inv.No.231
No. Of Bids
Accepted
Fine Ground 440,000 $1.9966-$2.1124 2 of 5
SPP Patties 342,000 $2.3646-$2.4262 1 of 1
100% Patties 418,000 $2.5989-$2.6597 1 of 1
Purchases of frozen beef products for School Year 2010-11
since the program began on May 5, 2010, follow:
Commodity Cumulative
Pounds
Cumulative
Dollars
Reprocessing Beef 61,194,000 131,636,000
Fine Ground 22,200,000 49,172,000
SPP Patties 1,558,000 3,315,000
100% Patties 2,166,000 5,158,000
Lean Patties 836,000 2,080,000
95% Lean Patties 38,000 81,000
Fine Ground (1-lb) 4,360,000 9,648,000
Total Purchases 92,352,000 201,090,000
Inquiries should be addressed to the Contracting Officer;
Livestock and Seed Program; USDA, AMS, Room 2610-South; 1400
Independence Avenue, Washington, D.C. 20250. Telephone:
202/720-2650; FAX: 202/720-9538
- MORE –

FOOD PURCHASE REPORT PAGE 2 OF 4
02/09/11
Awards made today for LS-200, Invitations 231 to be delivered
between March 16 and March 31, 2011, follow:
ANNOUNCEMENT : LS200
COMM GROUP : BEEF, FROZEN
INVITATION : 231
COMMODITY TYPE : BEEF-FROZEN FINE GROUND
PACK SIZE : 40 LB CTN
CONTRACTOR NAME: CENTRAL VALLEY MEAT COMPANY
PLANT ADDRESS : HANFORD CA
ITEM ----DESTINATION---- QUANTITY PRICE PER
NUM CITY ST (LBS ) (LB )
---- ---------------- -- ----------- -----------
005 BRIGHTON MI 40,000 $ 2.0974
006 LITTLE ROCK AR 40,000 $ 2.0677
007 GRAND PRAIRIE TX 80,000 $ 2.0566
008 SAN ANTONIO TX 40,000 $ 2.0566
009 BELLEVUE NE 10,000 $ 2.0655
LINCOLN NE 10,000 $ 2.0655
OMAHA NE 20,000 $ 2.0655
010 LOS ANGELES CA 11,640 $ 1.9966
VERNON CA 28,360 $ 1.9966
TOTAL AWARDED: 280,000
CONTRACTOR NAME: CHERRY MEAT PACKERS, INC.
PLANT ADDRESS : CHICAGO IL
ITEM ----DESTINATION---- QUANTITY PRICE PER
NUM CITY ST (LBS ) (LB )
---- ---------------- -- ----------- -----------
001 COAL TOWNSHIP PA 20,000 $ 2.1124
WILKES-BARRE PA 20,000 $ 2.1124
002 LOUISVILLE KY 40,000 $ 2.0962
003 SHEPHERDSVILLE KY 40,000 $ 2.0847
004 LEXINGTON KY 16,280 $ 2.1062
SHEPHERDSVILLE KY 23,720 $ 2.1062
TOTAL AWARDED: 160,000
COMMODITY TYPE : FROZEN BEEF PATTIES, W/SPP
PACK SIZE : 40 LB CTN
CONTRACTOR NAME: CHERRY MEAT PACKERS, INC.
PLANT ADDRESS : CHICAGO IL
ITEM ----DESTINATION---- QUANTITY PRICE PER
NUM CITY ST (LBS ) (LB )
---- ---------------- -- ----------- -----------
011 ROCKY HILL CT 114,000 $ 2.4262
- MORE –

FOOD PURCHASE REPORT PAGE 3 OF 4
02/09/11
ANNOUNCEMENT : LS200
COMM GROUP : BEEF, FROZEN
INVITATION : 231
COMMODITY TYPE : FROZEN BEEF PATTIES, W/SPP
PACK SIZE : 40 LB CTN
CONTRACTOR NAME: CHERRY MEAT PACKERS, INC.
PLANT ADDRESS : CHICAGO IL
ITEM ----DESTINATION---- QUANTITY PRICE PER
NUM CITY ST (LBS ) (LB )
---- ---------------- -- ----------- -----------
012 MADISON HEIGHTS VA 14,120 $ 2.4047
RICHMOND VA 9,200 $ 2.4047
SUFFOLK VA 14,680 $ 2.4047
013 BATESVILLE MS 38,000 $ 2.3942
014 CREEDMOOR NC 27,280 $ 2.3863
SALISBURY NC 10,720 $ 2.3863
COMMODITY TYPE : FROZEN BEEF PATTIES, W/SPP
PACK SIZE : 40 LB CTN
CONTRACTOR NAME: CHERRY MEAT PACKERS, INC.
PLANT ADDRESS : CHICAGO IL
ITEM ----DESTINATION---- QUANTITY PRICE PER
NUM CITY ST (LBS ) (LB )
---- ---------------- -- ----------- -----------
015 SALISBURY NC 38,000 $ 2.3727
016 LEXINGTON SC 38,000 $ 2.3646
017 JOHNSON CITY TN 12,480 $ 2.4171
MADISON HEIGHTS VA 25,520 $ 2.4171
TOTAL AWARDED: 342,000
COMMODITY TYPE : FROZEN BEEF PATTIES, 100% BEEF
PACK SIZE : 40 LB CTN
CONTRACTOR NAME: CHERRY MEAT PACKERS, INC.
PLANT ADDRESS : CHICAGO IL
ITEM ----DESTINATION---- QUANTITY PRICE PER
NUM CITY ST (LBS ) (LB )
---- ---------------- -- ----------- -----------
018 TAUNTON MA 19,000 $ 2.6461
WILMINGTON MA 19,000 $ 2.6461
019 TAUNTON MA 76,000 $ 2.6247
020 WILMINGTON MA 76,000 $ 2.6325
021 CHICOPEE MA 19,000 $ 2.6597
WORCESTER MA 19,000 $ 2.6597
- MORE –

FOOD PURCHASE REPORT PAGE 4 OF 4
02/09/11
ANNOUNCEMENT : LS200
COMM GROUP : BEEF, FROZEN
INVITATION : 231
COMMODITY TYPE : FROZEN BEEF PATTIES, 100% BEEF
PACK SIZE : 40 LB CTN
CONTRACTOR NAME: CHERRY MEAT PACKERS, INC.
PLANT ADDRESS : CHICAGO IL
ITEM ----DESTINATION---- QUANTITY PRICE PER
NUM CITY ST (LBS ) (LB )
---- ---------------- -- ----------- -----------
022 PHILADELPHIA PA 14,000 $ 2.6063
WILKES-BARRE PA 24,000 $ 2.6063
023 BIRMINGHAM AL 114,000 $ 2.6161
024 CLANTON AL 38,000 $ 2.5989
TOTAL AWARDED: 418,000
An electronic version of this food purchase report can be obtained via the
World Wide Web at: http://www.ams.usda.gov/LSCP
-----

Appendix F: Institutional Food Market Coalition Model http://ifmwi.org/about.aspx Dane County's Institutional Food Market Coalition (IFM) was established in 2006 in an effort to:
● Expand market opportunities for Dane County and regional growers ● Increase the sales of local Wisconsin food into institutional markets ● Connect large volume institutional buyers, such as hospitals, universities, nursing
homes, prisons, office parks and large businesses with local Wisconsin product ● Identify and resolve obstacles to local sourcing
Challenges identified by IFM staff to bring local food to institutions:
1. Institutions find it hard to recieve extra deliveries from multiple suppliers 2. Some institutions do not cook food on site 3. Institutional price points are low 4. Institutions are concerned with reliability of supply 5. Staff time at institutions is tight 6. Institutional buyers are unsure of how to begin sourcing local food 7. Buyers are concerned with the safety of small producers
Challenges identified by IFM staff for producers looking to service the institutional market
● Small producers sometimes find it hard to transition from a direct market to a wholesale price
● Finding a balance between the demand predicted from an institution with the insecurity that a buyer might not follow through, while feeling reticent to signing a contract
● Achieving Good Agricultural Practice (GAP) certification ● Hesitancy to work through a distributor
Significant IFM successes
● Effectively forging connections between producers of produce, meat, and dairy with institutional buyers at annual meetings
● In 2010, facilitating 1.5 million dollars of food sales ● Educational meeting for food buyers across the county ● Winter meetings between producers and buyers allowing growers to know what to
grow in the coming season ● Using “e-news” effectively to share information about supply, price, demand, and
success stories Recommendations from IFM staff 1. It is important to bring all parties together to tell their stories. Producers, distributors, and
buyers need to understand each other’s concerns and needs. The distributors’ stories are especially important as the rest of the parties need to understand the key role they play in

creating a stable arena for sales relationships; they are not insignificant “middlemen” taking profit away from producers.
2. The advisory committee, with members from the University of Wisconsin, private businesses, and extension agents, lend legitimacy to the project. They provide key in-roads to individuals crucial to making this process work.
IFM Program Details
● IFM staff time is slightly less than one FTE, with additional support from typically one unpaid intern. Funding for the program comes from public and private sources, including a new program called “Friends of the IFM”. This is a membership program through which individuals who support the work of the IFM contribute to the organization.
● The IFM works to support farm to institution relationships in Dane County, total 2010 population 488,073 according to the US Census. Some producers come from nearby areas.
● The Advisory Committee meets four times per year to make recommendations on policy and topics for annual meetings.

Dairy/Beef Producers SurveyDairy/Beef Producers SurveyDairy/Beef Producers SurveyDairy/Beef Producers Survey
1. What is the physical location of the farm?
2. Is this a beef or dairy farm?
3. What is the size of your herd? I am interested in mature animals so for dairy it is milking cows and for beef it is the breeding animals or animals to be marketed in the next 12 months.
4. Do you foresee the size of your herd growing, shrinking or staying the same over the next ten years?
5. How many culls do you have per year? (Beef) How many nonfreezer trade beef do you have/cull per year? (Dairy) Of those culls how many would you consider are fairly good, sized “fleshy” culls that are pretty much culls just because they are older and less productive than they used to be? (ie that would yield some tender higher end cuts as well as be good for ground beef?. If you are used to body condition scoring I am talking about cows that score a three or better on a scale of 1 to 5.
6. What breeds do you have?
55
66
55
66
55
66
Beef
gfedc
Dairy
gfedc
Growing
gfedc
Shrinking
gfedc
Staying the same
gfedc
If growing or shrinking, by how much? And Why?

Dairy/Beef Producers SurveyDairy/Beef Producers SurveyDairy/Beef Producers SurveyDairy/Beef Producers Survey7. What would you consider an average size for a healthy dairy cull (body condition 35) or nonfreezer trade (but not distressed) beef cull (live weight and hanging weight)?
8. What is the highest price per pound you've received for your animals (note if it is live or hanging weight, and if any fees have been deducted)?
9. What is the lowest price per pound you've received for your animals (note if it is live or hanging weight, and if any fees have been deducted)?
10. What is the average price you receive? Please list the gross (before) any fees have been deducted from the pay price. Or note that it is net and explain what fees were deducted and how much they were so we can recalculate gross.
11. What would you feel is a "good, fair price" to receive for these culls or nonfreezer trade beef cows? Please list this as gross (before) any fees have been deducted from the pay price.
Breed
Live Weight
Hanging Weight
Breed
Live Weight
Hanging Weight
Breed
Live Weight
Hanging Weight
55
66

Dairy/Beef Producers SurveyDairy/Beef Producers SurveyDairy/Beef Producers SurveyDairy/Beef Producers Survey12. How do you currently sell your good cull dairy cows or nonfreezer trade beef?
13. If you sell animals at auction, what do you pay for commission fees? And to whom (is it just the auctioneer, or do you have dealer fees?)
14. If you sell at auction, what do you pay for transportation fees? Both getting the animal to auction, and then once it is sold?
15. If you sell at auction, are there any other fees you are charged?
16. If you sell animals to a dealer, what fees are deducted from your pay price? (and how much are they?)
17. How do you normally get your culls to market or auction? (what or who do you use for transport?)
18. If not answered before, what does it (transport) cost you?
19. If you had the ability to choose between selling your culls to auction or through a dealer, or selling them locally to a processor or direct institutional sale, what would your preference be? Why?
55
66
55
66
55
66
55
66
55
66
Auction
gfedc
Dealer
gfedc
Local Processor
gfedc
Direct Sales Retail Cuts USDA Certified
gfedc
Custom Whole/Halves
gfedc
Who are the buyers?

Dairy/Beef Producers SurveyDairy/Beef Producers SurveyDairy/Beef Producers SurveyDairy/Beef Producers Survey
20. Have you worked with local processors before where they initiate the transaction calling you and asking if you have culls or animals that would meet their needs, and then coming out and selecting the ones they want to buy from you?
21. If a local processor were to initiate the interaction, calling you and buying animals from you when he had demand, would you be interested in this type of transaction? (where you don't have to do anything?)
22. If you wanted to/or currently do sell your animals direct to the institution, do you have product liability insurance?
23. If you sell to institutions what do you charge for your ground beef?
24. Are they buying other cuts? If so, which and how much do you charge for those?
25. What institutions are you already selling to, and how much are they buying of each product?
55
66
55
66
55
66
Yes
gfedc
No
gfedc
Details?
Yes
gfedc
No
gfedc
Why/Why Not please explain
Yes
gfedc
No
gfedc

Dairy/Beef Producers SurveyDairy/Beef Producers SurveyDairy/Beef Producers SurveyDairy/Beef Producers Survey26. If you sell beef how do you distribute it to your customers and institutional accounts do they pick it up, do you have a delivery vehicle and is it refrigerated? And if you deliver, do you charge for this service?
27. If you wanted to/or do sell your beef to service the local institutional market, either through direct sales or by selling culls to a local processor, what are the most important decision making factors for you?
28. If you did want to/or do service the institutional market, how would you prefer to be involved?
29. If there was an organized effort to source, supply and serve locally raised beef to local institutions would you consider being part of this effort?
30. If a program were created to help initiate this effort of getting local beef into local institutions, what role(s) would you consider participating in?
55
66
stable, year round cash flow
gfedc
price
gfedc
long term relationship potential
gfedc
desire to support the local economy
gfedc
desire to support the local health of the community
gfedc
desire to educate the community about local agriculture
gfedc
ease of transaction
gfedc
Other (please specify)
More responsibility and managing the process: Sell direct to the school
gfedc
Less responsibility and no management: Have a processor buy animals from me on an as needed basis.
gfedc
yes
gfedc
no
gfedc
maybe
gfedc
Please explain
Leader of the effort
gfedc
Active participant, not a leader
gfedc
Join, no active participation
gfedc

Dairy/Beef Producers SurveyDairy/Beef Producers SurveyDairy/Beef Producers SurveyDairy/Beef Producers Survey
31. What are the most difficult challenges to overcome in selling regionally raised (dairy cull and nonfreezer trade) ground beef?
32. Please add any comments.
33. May we contact you for more details or clarification?
34. Would you like to receive a link to the Final Study Report once published, and be included on future communications about this effort?
55
66
55
66
Yes
gfedc
No
gfedc
If no, please explain
Yes, both
gfedc
Yes, link to finished report only
gfedc
No
gfedc
What is your email address?

Processor Regional Beef SurveyProcessor Regional Beef SurveyProcessor Regional Beef SurveyProcessor Regional Beef Survey
1. What is the name and location of your facility
2. What State are you located in
3. What are your hours of operation?
4. How many days per week do you slaughter animals?
5. Are you a USDA inspected facility
6. How many animals are you capable of killing per day?
7. How many animals are you capable of processing per day?
55
66
55
66
55
66
55
66
55
66
MA
nmlkj
VT
nmlkj
CT
nmlkj
RI
nmlkj
ME
nmlkj
NH
nmlkj
NY
nmlkj
Yes
nmlkj
No
nmlkj

Processor Regional Beef SurveyProcessor Regional Beef SurveyProcessor Regional Beef SurveyProcessor Regional Beef Survey8. Is your facility operating at its full capacity?
9. If not what capacity are you currently operating at?
10. when is there opportunity to expand operations?
11. Please specify # of animals per week and months of the year that you could increase your production if there was need
12. What factors prevent you from operating at full capacity?
13. What percent of your business is custom work and what percent is for animals you purchase, process and resell?
14. Are there times when you cannot meet your customers’ demand for slaughter/cutting?
55
66
55
66
55
66
Yes
nmlkj
No
nmlkj
daily year round
gfedc
weekly year round
gfedc
seasonally
gfedc
insufficient demand for your services
gfedc
insufficient staff
gfedc
insufficient infrastructure
gfedc
Other (please specify)
Yes
gfedc
No
gfedc
If so, when, and why?

Processor Regional Beef SurveyProcessor Regional Beef SurveyProcessor Regional Beef SurveyProcessor Regional Beef Survey15. Can you print labels for retail packages at your facility?
16. What size packages do you offer for ground beef?
17. How do you package your beef
18. Do you offer preformed patties as an option?
19. Do you offer additional processing services?
20. How do you package your ground beef?
55
66
Yes
nmlkj
No
nmlkj
fresh
gfedc
frozen
gfedc
both
gfedc
Yes
gfedc
No
gfedc
If yes, what sizes?
seasoned ground beef
gfedc
beef meatballs
gfedc
cooking the ground beef crumbles, patties, meatballs
gfedc
pasteurized raw beef
gfedc
Other (please specify)
vaccum seal/cryovac
gfedc
tube feeder packages
gfedc
styrofoam tray
gfedc
white paper wrap
gfedc
Other (please specify)

Processor Regional Beef SurveyProcessor Regional Beef SurveyProcessor Regional Beef SurveyProcessor Regional Beef Survey21. How are your patties packaged?
22. With respect to the size of your operation do you wish to maintain, expand, or decrease your current capacity?
23. Do you work with regional institutions (schools, hospitals, prisons, etc) and food service providers (Sodexho, Aramark, Chartwell, etc.) to bring local meat into their kitchens?
24. If so, how is the business model structured? Please explain the logistics and financials.
25. Do you work with food service distributors (Black River Produce, Reinhart, etc)?
26. If so, how is the business model structured? Please explain the logistics and financials.
27. If you buy animals for processing and resale, how do you acquire them?
55
66
55
66
55
66
55
66
maintain
gfedc
expand
gfedc
decrease
gfedc
Yes
nmlkj
No
nmlkj
If yes, which ones?
Yes
nmlkj
No
nmlkj
If yes, which ones?

Processor Regional Beef SurveyProcessor Regional Beef SurveyProcessor Regional Beef SurveyProcessor Regional Beef Survey28. If not answered, from the other questions. How would you consider charging for the product would any of the meat be reserved for the higher end cuts or all of it go to ground beef? Would reserving some of the higher end cuts help make the transaction more financially viable for both parties?
29. Do you have a delivery vehicle?
30. Would you be interested in delivering the product to the institution (or the distributor or a secondary processor), if you were paid for this service?
31. Overall, how important is it to you that the food you process goes to feed your local area/region? Rank on a scale of 1 to 10 with 1 as Not at all important and 10 as extremely important.
32. Do you have any thoughts or concerns about working with regional institutions (schools, hospitals, prisons, etc) and food service providers (Sodexho, Aramark, Chartwell, etc.) to bring local meat into their kitchens? Please explain the benefits and concerns you see in serving the institutional market.
55
66
55
66
Yes
nmlkj
No
nmlkj
Yes
nmlkj
No
nmlkj
Additional Details
Not Important
nmlkj
Fairly Important
nmlkj
Very Important
nmlkj
Extremely Important
nmlkj

Processor Regional Beef SurveyProcessor Regional Beef SurveyProcessor Regional Beef SurveyProcessor Regional Beef Survey33. Would incentives such as special grants or loans increase your interest in expanding if needed to service institution demand?
34. For custom processing, what do you charge for:
35. What do you currently pay for beef cows?
36. What do you currently pay for dairy culls?
transportation
kill fee
processing (bone/chill/box/freeze)
grinding
rendering/disposal
boxes
vacuum seal
patties
seasonings
filler & meatballs
cooked crumbles
cooked patties
cooked meatballs
pasteurizing
delivery
55
66
55
66
Yes
nmlkj
No
nmlkj
Please explain what would be helpful to you.

Processor Regional Beef SurveyProcessor Regional Beef SurveyProcessor Regional Beef SurveyProcessor Regional Beef Survey37. Does the price you pay fluctuate?
38. Do you have any suggestions/recommendations for an institutional ground beef product? (ie what it should be made up ofdairy vs beef, how much/any of the higher end cuts that may be able to be salvaged, etc.)
39. What is an average sized nonfreezer trade beef cull/bull
40. What is an average sized healthy, good fleshy, dairy cull? Answer a #, we'll assume this is pounds.
41. How much finished product would you expect off of the animal
55
66
live weight
hanging weight
live weight
hanging weight
ground beef
tenderloins
rib eye
loins
bones
hide
other
Yes
nmlkj
No
nmlkj
If so why and how often?

Processor Regional Beef SurveyProcessor Regional Beef SurveyProcessor Regional Beef SurveyProcessor Regional Beef Survey42. What is/would be the most important factors in making a decision to service the institutional ground beef market?
43. Other/Notes/Comments
55
66
stable, year round work
gfedc
stable, year round cash flow
gfedc
price
gfedc
long term relationship potential
gfedc
desire to support local economy
gfedc
desire to support the environment
gfedc
desire to improve local health of the community
gfedc
desire to educate the community about local agriculture and where our food comes from
gfedc

Distributor SurveyDistributor SurveyDistributor SurveyDistributor Survey
1. Name of Distributor
2. Warehouse location/address
3. Do you currently distribute ground beef to institutions such as hospitals, k12 schools or colleges universities?
4. What states do you service?
55
66
55
66
k12
gfedc
Colleges/Universities
gfedc
Hospitals
gfedc
Other
gfedc
None
gfedc
ME
gfedc
MA
gfedc
RI
gfedc
CT
gfedc
VT
gfedc
NH
gfedc
NY
gfedc
Other (please specify)

Distributor SurveyDistributor SurveyDistributor SurveyDistributor Survey5. What type of ground beef products do institutions buy from you?
6. What is your markup for ground beef?
7. What is your demand for ground beef products, does it fluctuate seasonally?
8. What is your annual sales volume of the following?
9. Have you had requests for locally grown beef?
55
66
55
66
Raw Bulk
Cooked Bulk
Pasteurized Bulk
Seasoned
Patties
Meatballs
Other
Raw
gfedc
Pasteurized
gfedc
Frozen
gfedc
Fresh
gfedc
Cooked
gfedc
Bulk
gfedc
Patties
gfedc
Seasoned
gfedc
Meatballs
gfedc
Other (please specify)
Yes
nmlkj
No
nmlkj
Maybe
nmlkj
Comments

Distributor SurveyDistributor SurveyDistributor SurveyDistributor Survey10. If there was a source for locally grown ground beef, would you be willing to carry it?
11. If you did/or do offer local ground beef, what percentage of your total volume do you think a local offering might represent?
12. If the local product was more expensive, do you think your customers would still be willing to consider it? Do you have any thoughts on what their price sensitivity might be at what point would the value equation reach a tipping point?
13. If you have or begin to carry local ground beef products, do you think this could/or has increased the total annual volume of ground beef you sell?
Raw
Cooked
Pasteurized
Patties
Seasoned
Meatballs
Other
Yes
gfedc
No
gfedc
Maybe
gfedc
Comments
Yes
nmlkj
No
nmlkj
Maybe
nmlkj
Explain
Yes
nmlkj
No
nmlkj
Maybe
nmlkj
Comments

Distributor SurveyDistributor SurveyDistributor SurveyDistributor Survey14. What would be key hurdles that could help you increase your current sales of or help you start offering local ground beef products?
15. Do you have storage capacity to store a local ground beef product? If so how much and for fresh or frozen.
16. Do you have a mechanism for tracking and selling the products you carry as “local”?
17. Do you have a definition of "local"? What is it?
18. How do you choose your suppliers and what requirements do you have for suppliers?
19. Do you have plans to extend to any NE states that you don’t currently serve?
55
66
55
66
55
66
Price
gfedc
Storage
gfedc
User requirements (pasteurization, package type/size)
gfedc
Processor capabilities (raw/cooked/seasoned/etc)
gfedc
Access to suppliers/Ease of access to product
gfedc
Create demand from buyers
gfedc
Other (please specify)
Yes
nmlkj
No
nmlkj
Comments
Yes
gfedc
No
gfedc
Maybe
gfedc
Comments

Distributor SurveyDistributor SurveyDistributor SurveyDistributor Survey20. Do you have plans to distribute or serve additional market segments that you don’t currently serve?
21. Would you participate in a regional ground beef effort to sell local ground beef to local institutions?
22. If a program were created to help initiate this effort of getting local beef into local institutions, what role(s) would you consider participating in?
23. Who currently supplies your ground beef needs? How does it get to you do you pick it up or is it delivered?
24. Are you in a contractual relationship with your beef supplier or could you buy beef from a local source if you wanted to?
25. If you were interested in buying beef from a local processor, how would you prefer they contact you and deliver the product? What would your suggestions be to start the relationship off right?
55
66
55
66
55
66
55
66
Yes
nmlkj
No
nmlkj
Maybe
nmlkj
Comments
Leader of the effort
gfedc
Active participant, not leader
gfedc
Join, no active participation
gfedc
If leader, who would be the contact person for this?

Distributor SurveyDistributor SurveyDistributor SurveyDistributor Survey26. Would we be able to contact you for additional information/clarifications?
27. Would you like to receive a link to the finished copy of the report and be kept in the communication loop for additional progress and movement on the project?
28. More Info
55
66
Yes
gfedc
No
gfedc
Contact Info
Yes to both
gfedc
Yes to link only
gfedc
No
gfedc
Please list your email address

Institutions' SurveyInstitutions' SurveyInstitutions' SurveyInstitutions' Survey
Welcome. All six State Agricultural Departments in New England, Healthcare Without Harm, Northeast FarmtoSchool & Harvest New England appreciate your time. Your confidential input will help with proposing a framework for a regional network for ground beef throughout New England. This survey should only take about 8 minutes. Your information is confidential. If you have any questions, please contact [email protected] or call 6039427160. Please note, at the bottom of each page please hit the "next" button to continue the survey until complete. Thank you for your participation.
1. What type of institution do you represent?
2. What is your typical ordering cycle for ground beef?
3. What percent of your institution's total annual food service budget is spent on ground beef products?
4. What are the total annual pounds of ground beef being purchased at your location? Are there general trends (ie. seasonality, dips, surges) in demand?
5. How much do you spend on ground beef products per year? (Ex. $10,000)
6. Do you foresee your current total demand for ground beef:
1. Page 1
55
66
55
66
School
nmlkj
College/University
nmlkj
Hospital/Healthcare
nmlkj
daily
nmlkj weekly
nmlkj every 2 weeks
nmlkj monthly
nmlkj bimonthly
nmlkj quarterly
nmlkj
less than 2%
nmlkj
3 to 5%
nmlkj
6 to 9%
nmlkj
10 to 15%
nmlkj
16 to 20%
nmlkj
greater than 20%
nmlkj
Decreasing greater than 5 percent
nmlkj
Decreasing less than 5 percent
nmlkj
Remaining the same
nmlkj
Increasing less than 5 percent
nmlkj
Increasing greater than 5 percent
nmlkj
Other
Other

Institutions' SurveyInstitutions' SurveyInstitutions' SurveyInstitutions' Survey7. What percent of your total annual ground beef budget is from locally raised meat?
8. Please estimate your total annual dollars spent purchasing locally raised ground beef. (Ex. 10,000)
55
66
unknown
nmlkj
zero
nmlkj
less than 2%
nmlkj
3 to 5%
nmlkj
6 to 9%
nmlkj
10 to 15%
nmlkj
16 to 20%
nmlkj
greater than 20%
nmlkj

Institutions' SurveyInstitutions' SurveyInstitutions' SurveyInstitutions' Survey
The next series of questions relate to pricing, quality, suppliers and use(s) of ground beef.
1. In what form(s) do you purchase ground beef? (Select all that apply)
2. If purchasing patties, do you have them scored for faster cooking?
3. What type of lean/fat ratio do you prefer to purchase?
2.
Bulk
gfedc
Patty size 4 ounce patties/pound
gfedc
Patty size 1.6 ounce patties/pound
gfedc
Fresh, unfrozen
gfedc
Frozen, uncooked
gfedc
Fresh, vacuum packaged
gfedc
Frozen, cooked
gfedc
Refrigerated, cooked
gfedc
Meatballs
gfedc
Taco/Seasoned cooked
gfedc
Other (please specify)
gfedc
No scoring
nmlkj
One side scored
nmlkj
Both sides scored
nmlkj
Unknown
nmlkj
Don't purchase patties
nmlkj
80/20
nmlkj 85/15
nmlkj 90/10
nmlkj
Other (please specify)
Other

Institutions' SurveyInstitutions' SurveyInstitutions' SurveyInstitutions' Survey4. What do you pay per pound for each of the following? (Select all that apply)
5. Does the pricing fluctuate? If so, are there general trends?
6. Would price stability be a benefit to buying locally raised beef?
7. Please list the maximum price point you would be willing to pay for locally raised beef and the percent of total annual pounds you would be willing to buy at that price. (Select all that apply)
Bulk
Patty size 4 ounce/pound
Patty size 1.6 ounce/pound
Fresh, unfrozen
Frozen, uncooked
Fresh, vacuum packaged
Frozen, cooked
Refrigerated, cooked
Meatballs
Taco/Seasoned cooked
Other
55
66
Maximum Price Point Percent of Total Pounds
Bulk 6 6
Patty size 4 ounce/pound 6 6
Patty size 1.6 ounce/pound
6 6
Fresh, unfrozen 6 6
Frozen, uncooked 6 6
Fresh, vacuum packaged 6 6
Frozen, cooked 6 6
Refrigerated, cooked 6 6
Meatballs 6 6
Taco/Seasoned cooked 6 6
Other 6 6
Yes
nmlkj
No
nmlkj

Institutions' SurveyInstitutions' SurveyInstitutions' SurveyInstitutions' Survey
1. How do you prefer the beef be packaged for your use(s)?
2. How long is your ground beef typically stored?
3. Do you require pasteurized raw meat?
4. Do you purchase meat using the Institututional Meat Product Specifications (IMPS)?
3.
55
66
1 day
nmlkj 2 to 3 days
nmlkj Up to 14 days
nmlkj Up to 90 days
nmlkj
Yes
nmlkj No
nmlkj Maybe
nmlkj Unknown
nmlkj
Yes
nmlkj No
nmlkj Unknown
nmlkj

Institutions' SurveyInstitutions' SurveyInstitutions' SurveyInstitutions' Survey
1. Which IMPS requirement(s)? (Select all that apply)
2. If "no" or "unknown", what, if any, specifications do you require?
3. Please choose the top three qualities that are most influential in your purchasing decision of ground beef.
4. Is your food service operation privately managed? If yes, please list the company.
4.
55
66
IMPS 136 Ground Beef
gfedc
IMPS 136A Ground beef and vegetable protein product
gfedc
IMPS 136C Beef patty mix, NTE 10% fat
gfedc
IMPS 136D Pure beef
gfedc
IMPS 137 Ground beef, special
gfedc
IMPS 137A Ground beef & vegetable protein product, special
gfedc
Antibiotic free
gfedc
Fair price to farmers
gfedc
Grass fed
gfedc
Hormone free
gfedc
Humanely handled
gfedc
Local
gfedc
Organic
gfedc
Pasture raised
gfedc
Price
gfedc
Price stability
gfedc
Other (please specify)
gfedc
Yes
nmlkj No
nmlkj
Company (please specify)

Institutions' SurveyInstitutions' SurveyInstitutions' SurveyInstitutions' Survey5. How much autonomy do you have to select suppliers?
6. How do you identify and approve food suppliers?
7. How many vendors supply local food to you and do they supply locally raised beef? Are any single sourced/prime vendors? Are any farmers/producers?
8. What, if any, contracts are you under related to ground beef? When does it expire & what is the bidding process?
9. What would it take for the institution to consider changing/adding distributors, if needed, to purchase regional (local) beef products?
10. What is your minimum requirement a vendor must have of General Liability Insurance?
11. What are your vendor payment term requirements?
No Autonomy Neutral Complete Autonomy
Autonomy nmlkj nmlkj nmlkj nmlkj nmlkj
55
66
55
66
55
66
55
66
$1 million
nmlkj $2 million
nmlkj $3 million
nmlkj $4 million
nmlkj $5 million
nmlkj
Other (please specify)
30 days
nmlkj 45 days
nmlkj 60 days
nmlkj 90 days
nmlkj
Other (please specify)

Institutions' SurveyInstitutions' SurveyInstitutions' SurveyInstitutions' Survey
The next series of questions relate to possible opportunities.
1. Select which closely defines the following statement:
2. What are some of the specific concerns when sourcing regional ground beef? (Select all that apply)
3. If given the choice, what is your preferred source for regionally sourced ground beef?
5.
Strongly Disagree Somewhat Disagree Agree Somewhat Agree Strongly Agree
Regionally sourced products are a priority in our operation.
nmlkj nmlkj nmlkj nmlkj nmlkj
Can I get local beef from my primary distributor?
gfedc
Can I get the type of product I'm used to using?
gfedc
Can we use our USDA commodity funding?
gfedc
Do I need additional storage space?
gfedc
How can we afford local beef?
gfedc
How can we ensure local beef meets HACCP regulations?
gfedc
How can we get the institution to commit food budget to local beef?
gfedc
How do I get the institution to realize the value of local beef?
gfedc
Is my staff trained to handle the beef?
gfedc
No concerns
gfedc
Where do I buy local/regional ground beef?
gfedc
Will it take more time to prepare?
gfedc
Other (please specify)
gfedc
Direct from a farmer, farmer cooperative or Farmers' market
nmlkj
From a broker
nmlkj
From a distributor
nmlkj
From a local manufacturer or processor
nmlkj
Other (please specify)
nmlkj

Institutions' SurveyInstitutions' SurveyInstitutions' SurveyInstitutions' Survey4. How important are the following if/when purchasing regionally sourced ground beef from a farmer/processor/distributor?
5. How do/will you measure the effectiveness and benefits of purchasing local ground beef?
6. Purchasing local food has had a positive impact on my institution's reputation.
Not at all Important
ImportantExtremely Important
N/A
Adequate supply nmlkj nmlkj nmlkj nmlkj nmlkj nmlkj nmlkj nmlkj nmlkj nmlkj nmlkj
Consistent high quality nmlkj nmlkj nmlkj nmlkj nmlkj nmlkj nmlkj nmlkj nmlkj nmlkj nmlkj
Dependability nmlkj nmlkj nmlkj nmlkj nmlkj nmlkj nmlkj nmlkj nmlkj nmlkj nmlkj
Ease of ordering nmlkj nmlkj nmlkj nmlkj nmlkj nmlkj nmlkj nmlkj nmlkj nmlkj nmlkj
Food safety nmlkj nmlkj nmlkj nmlkj nmlkj nmlkj nmlkj nmlkj nmlkj nmlkj nmlkj
Know your Farmer nmlkj nmlkj nmlkj nmlkj nmlkj nmlkj nmlkj nmlkj nmlkj nmlkj nmlkj
Long term vendor relations nmlkj nmlkj nmlkj nmlkj nmlkj nmlkj nmlkj nmlkj nmlkj nmlkj nmlkj
Price nmlkj nmlkj nmlkj nmlkj nmlkj nmlkj nmlkj nmlkj nmlkj nmlkj nmlkj
Price stability nmlkj nmlkj nmlkj nmlkj nmlkj nmlkj nmlkj nmlkj nmlkj nmlkj nmlkj
Provides exactly what we are ordering
nmlkj nmlkj nmlkj nmlkj nmlkj nmlkj nmlkj nmlkj nmlkj nmlkj nmlkj
Provides kitchen staff training nmlkj nmlkj nmlkj nmlkj nmlkj nmlkj nmlkj nmlkj nmlkj nmlkj nmlkj
Regular and timely deliveries nmlkj nmlkj nmlkj nmlkj nmlkj nmlkj nmlkj nmlkj nmlkj nmlkj nmlkj
Standardized packaging nmlkj nmlkj nmlkj nmlkj nmlkj nmlkj nmlkj nmlkj nmlkj nmlkj nmlkj
Strongly DisgreeSomewhat Disagree
Agree Somewhat Agree Strongly Agree N/A
Positive impact on reputation
nmlkj nmlkj nmlkj nmlkj nmlkj nmlkj
Comments that beef taste/flavor is better
gfedc
Customer feedback
gfedc
Dollars kept in local/regional economy
gfedc
Improvement in nutritional value
gfedc
Increased consumption of beef meal offerings
gfedc
Increased support for local food in the budget
gfedc
Reduction in food miles
gfedc
Other (please specify)
gfedc

Institutions' SurveyInstitutions' SurveyInstitutions' SurveyInstitutions' Survey7. If there was an organized effort to source, supply and serve locally raised beef would you consider being part of this effort?
Yes
nmlkj
No
nmlkj
Maybe
nmlkj
Please explain

Institutions' SurveyInstitutions' SurveyInstitutions' SurveyInstitutions' Survey
1. What role(s) would you consider participating as in an organized effort?
2. What are the most difficult challenges to overcome in purchasing regionally raised ground beef?
6.
Yes No Maybe
Leader nmlkj nmlkj nmlkj
Active participant, not a leader
nmlkj nmlkj nmlkj
Join, no active participation
nmlkj nmlkj nmlkj
55
66

Institutions' SurveyInstitutions' SurveyInstitutions' SurveyInstitutions' Survey
1. Please add any comments.
2. Please indicate below whether you would like to be:
7.
55
66
Contacted if clarification or more information is required.
gfedc
Receive a link to the Final Study Report once published.
gfedc
Entered into a drawing for a chance to win a $25.00 gift certificate.
gfedc
None of the above
gfedc

Institutions' SurveyInstitutions' SurveyInstitutions' SurveyInstitutions' Survey
1. Please fill out the information so we may contact you.
8.
Name
Job Title
Company
Address
City/Town
State
Zip Code
Phone

Institutions' SurveyInstitutions' SurveyInstitutions' SurveyInstitutions' Survey
1. Your institution is located in what state?
9.
CT
nmlkj MA
nmlkj ME
nmlkj NH
nmlkj RI
nmlkj VT
nmlkj

Appendix K: Follow Up Report on the Regional Ground Beef to Institution Marketing Study Webinar Presentation & Panel Discussion
The event was held on September 10, 2011 in Westminster, VT as part of the 2011 Meat
Producer-Processor Workshop Series. The session was entitled: Scaling Up: Producing & Processing for the Larger Regional Market Workshop
More than thirty people attended the workshop. There were members in the audience from all New England states except Rhode Island. The attendees consisted of producers, processors, distributors, institutional buyers, government agencies, extension specialists, and general public. The day started with a webinar presentation of the preliminary findings from the marketing study presented by Rosalie Wilson and Charlene Andersen. The webinar was followed by a panel discussion to engage in a personal conversation with producers, processors, and institutional buyers on the hurdles, opportunities, demand, and limitations of serving the institutional market. Jean Hamilton of NOFA-VT facilitated the panel. Panelists included Rosalie Wilson, researcher; Bob Kinch, Maynard MA Food Director; Carl Cushing, Vermont Livestock, Slaughter and Processing; Dan Mandich, Westminster Meats; and Nelson Lamson, beef producer. Bob Kinch started the panel by describing his efforts in Massachusetts. The Maynard Schools System was one of five districts in the state to start a farm-to-school program over ten years ago. They started with one farm. That one farm now services fifty six school districts. The effort has grown to such an extent that Bob is a member of a buying group for fifty two districts. Bob discussed how farmers have joined together to creatively overcome hurdles, for example having one farmer as the location/drop-off for all the participating farms’ produce to ease the logistics for both the buyers and the suppliers. By working together the farms are bringing a larger variety and amount of locally grown fruits and vegetables to the Maynard school district with one trip. To date there is no beef or protein in the farm-to-school program, it is limited to fruits and vegetables. Bob would like to buy local beef. He feels it can be done if food service directors and farmers communicate. But, he cautioned, producers will need to “lower your standards to serve the K-12 market. If you do you could serve two million students. Kids don’t need a grade A apple, a number two will do, and the smaller apples are easier for them to eat anyway.” He went on to explain that food service directors are tasked with a budget of $2.50 per plate and that budget needs to include dairy, vegetables, protein and pasta. He noted that if schools could buy local ground beef for $1.50-2/lb this would fit within his budgetary needs. He also noted that schools offer suppliers nine months of solid business. Bob continued to focus on the economics, stating that Sodexo allows a maximum of 38% of a per plate budget to be allocated to labor costs, while Bob’s costs are 52% labor per plate. Protein is the second most expensive cost to labor on the plate. Lastly, he noted that he places his annual order for beef twelve months in advance to help him with budgeting.

A comment was brought up about USDA, and the note was that USDA will pay the supplier $4/box of beef to cover storage and delivery expense, this is above and beyond the cost of the beef on the supplier invoice. Following Bob, Carl Cushing continued the discussion on economics noting that the meat business is run on high volume, low margins. He supported Bob’s comments on working together and said in his experience bringing local beef from the farm to the institution requires attention with training, facility expansion and working with distributors. Everyone needs a slice of the pie and everyone must be willing to have a realistic view of what this means. He stated there isn’t a lot of money to go around, but that the institutional market does increase the volume of work and with the current price of beef it can have a small profit. Dan Mandich stressed that there is demand for additional capacity at his plant. Both Westminster Meats and Vermont Livestock, Slaughter and Processing are running at near to maximum capacity with their current infrastructure and both are willing to expand or improve efficiencies via remodeling. Nelson Lamson, representing both his farm and the Vermont Beef Producers’ Association, said the association is trying to get a constant supply and demand of beef to local processors. Creating more year round flow would alleviate some of the processing constraints and open doors for new opportunities. The audience corroborated the study’s findings that assistance with market development is needed, and that neither the producers nor the processors have time to do it on their own. The audience believes that increased public awareness will lead to increased demand. Also, they emphasized the aspect of working together as the researchers suggested- that it’s a matter of communicating, linking buyers to suppliers. Along these lines, it was mentioned that in Connecticut there is a pilot program afoot in which three regions- Region 4, Deep River, and Essex, are working with the Department of Agriculture to have the state source local beef for them. A challenge that has come up during the pilot is how to deal with coordinating a bulk purchase order when product definitions become varied for example one school district may want grass fed while another wants certified organic and a third just wanted it to be from a local animal, so creating a product definition before approaching the state as to what the group is seeking would facilitate the bulk order and coordinated sourcing.