Embed Size (px)
Citation preview

ANNUAL REPORT 2012
NEW DIRECTIONS
in action

AWE LIMITED ANNUAL REPORT 2012

ObjECTIvESOur goal is to be a leading energy company in Australia, with a sustainable business providing superior returns to shareholders. We aim to deliver this objective by implementing a clear strategy of: optimising production performance across our core assets, maximising near field opportunities, utilising our skills in new energy and unconventional oil and gas projects, and identifying and pursuing selective acquisitions. We are committed to achieving this aim while preserving our goals of zero harm to our people, minimising our environmental footprint, supporting the communities in which we operate and building a motivated and engaged team.
PROgRESSDuring 2011-12, AWE has exceeded the performance of the ASX 200 Energy Index by approximately 30%. We increased our Reserves and Resources base by 31% during the year through the acquisition of key assets in Indonesia, including the undeveloped Ande Ande Lumut oil field, and we improved the balance of our asset portfolio with the sale of part of our interest in the BassGas project. Our unconventional gas business has experienced success in the USA and Australia, and has the potential to add substantially to our reserves and production base. The Company continues to deliver strong and stable production and cash flow from its core production assets, providing the financial base for achieving further growth as an energy company.
FuTuRE OuTlOOkWe are committed to delivering on our core strategy in a consistent and disciplined fashion. Over the coming year we will focus on progressing the Ande Ande Lumut project in Indonesia to a final investment decision. In Western Australia, early success in the shale and tight gas projects provides a new and potentially transformational gas project for the Company. At the Sugarloaf shale gas project in the USA, the accelerated development drilling program will continue, with further infill drilling having the potential to substantially increase reserves and production for this asset. We will also continue to pursue opportunities to optimise the performance of our producing assets to maximise value and cash flows. At the core of our success will be our commitment to technical and commercial excellence and financial discipline to deliver continued growth in shareholder returns.
AFTER NEW DIRECTIONS, COMES THE TIME FORaction
1

The Chairman’s Message
AWE IMPlEMENTED A NuMbER OF kEy STRATEgIC INITIATIvES DuRINg THE yEAR.
Despite the continuing economic and financial uncertainties in global markets, the upstream energy industry in Australia remained strong, underpinned by oil and domestic gas prices well above historic averages. Against this backdrop, AWE became more focussed as an energy company and started to deliver improved performance during 2011-12. Two initiatives implemented during the year have positioned AWE for a period of growth as an energy company, while delivering good operational and financial results from our core business.
• The sale of an 11.25% interest in the BassGas project for $80 million; and • The acquisition of 100% interests in two Production Sharing Contracts in Indonesia,
which included the undeveloped AAL oil field with 76 million barrels of estimated recoverable oil (43 million barrels net Contingent Resources).
The oil and gas industry in Australia experienced considerable change during the past year. The introduction of carbon pricing and the extension of PRRT to the onshore industry by the Australian federal government, commencing 30 June 2012, will influence future investment decision making for our industry. AWE does not expect these changes to have a material impact on our business in the near term. The continued growth of the LNG industry through conventional gas development in Western Australia and coal seam gas development in Queensland is changing the domestic gas markets across the country. Initial exploration for unconventional shale gas in central and Western Australia has highlighted the potential for this resource as a future source of energy. With a strong operating presence, significant existing infrastructure, and a large acreage position in Western Australia, AWE is well positioned to take advantage of opportunities these changes may create.
In 2011-12, we continued our focus on governance, business sustainability, and technical and commercial excellence. The Board and Board Committees are working effectively; management of safety, environment and community relations has strengthened; and improvements in technical and commercial performance are evident in the initial results from our unconventional gas exploration program in the North Perth Basin and from the Company’s Indonesian acquisition.
I am particularly pleased with the way the Directors, Management and staff have responded to the challenges confronting the Company and the changes we have introduced over the last two years. The AWE team has worked together to overcome these challenges and to move the Company forward, strengthening the business and creating a number of new opportunities for growth. I am confident that with continued focus on our strategy, we will achieve our goal of providing superior returns to AWE shareholders from a sustainable business.
2 AWE LIMITED ANNUAL REPORT 2012

DIRECTORS
bruce Phillips (RIGhT)
ChAIRMAN
bruce Clement (LEfT)MANAGING DIRECTOR
3

IMPROvINg SHAREHOlDER vAluE AND PROvIDINg OPPORTuNITIES FOR gROWTH.
Key Highlights
PROjECTS
jason PeacockTUI ASSET MANAGER
Jason joined AWE in 2008 after working for Chevron in the UK North Sea and Shell International in South East Asia. Jason has a Master’s degree in Petroleum Engineering and is currently the Asset Manager for the Tui field, based in New Plymouth, New Zealand.
4 AWE LIMITED ANNUAL REPORT 2012

RESERvES & RESOURCES
CASh fLOW
DIvESTMENT
SALES REvENUE
ACQUISITIONS
LOAN fACILITY
Sales revenue remained strong through a greater percentage of oil production and higher average oil prices. Revenues were at the higher end of the guidance range.
The purchase of the two Indonesian PSC’s has added to Contingent Resources and provides opportunity for value additions through further appraisal and development activity.
AWE negotiated a substantial multi-currency loan facility during the year, which will provide capital to pursue further growth and shareholder value.
Reported 2P Reserves and 2C Contingent Resources increased primarily as a result of the acquisition of two PSC’s offshore Indonesia, including the undeveloped AAL oil field.
Strong sales revenues and a decrease in operating costs have driven the business to maintain operating cash flow during the year.
Part of AWE’s interest in the BassGas project was sold during the year, aimed at reducing business risk on a single project and providing capital for other growth opportunities.
+31%
$124m
$80m
$298m
2
$300m
5

Managing Director’s Report
MANAgEMENT AND THE bOARD HAvE ESTAblISHED A ClEAR DIRECTION AND STRATEgy.
AWE has undertaken a number of strategic initiatives during 2011-12 that have delivered a clear direction for the Company and positioned us well for a period of sustainable growth. The acquisition of two PSC’s in Indonesia, including the undeveloped 76 million barrel AAL oil field, the commencement of the shale gas and tight gas exploration program in the North Perth Basin and the increased development drilling in the Sugarloaf shale gas and liquids project in the USA all represent significant and immediate growth opportunities. Underlying these growth initiatives, AWE’s core production assets continue to deliver strong production performance and cash flow.
Our production assets delivered 4.7 million BOE in 2011-12, despite the extended shut-in of BassGas. Significantly, our field operating costs were reduced by $30 million (23%) and administration costs reduced by $6 million (37%) on the prior year reflecting the focus on improving the performance of the core business. The Company’s emphasis on business sustainability is being maintained, with environmental management and stakeholder engagement and communication continuing as important elements. We have already taken further positive action to improve our safety performance, an area where the Company reported disappointing results in 2011-12.
The Company’s financial position is sound, with operating cash flow of $124 million for the 2011-12 year and a net cash position of $27 million at year end. During the year we completed the refinancing of our corporate loan facility with a new $300 million multi-currency loan facility, that together with the cash flow from our portfolio of production assets, provides the financial capacity to deliver planned development projects and to pursue further opportunities for growth as an energy company.
Importantly, total 2P Reserves and 2C Contingent Resources increased by 31% to 189 million BOE at 30 June 2012. The Company’s Contingent Resources of 133 million BOE provides a valuable portfolio of opportunities for near term and medium term growth; from Sugarloaf development drilling in 2012-13, through the AAL development with a target for first oil production in 2015-16, to the future development of the Trefoil gas and condensate field as part of the BassGas project.
The Company’s production guidance for 2012-13 is in line with the result for 2011-12, primarily due to ongoing delays with the BassGas MLE. We expect to improve production performance from 2013-14 onwards, with enhanced production from BassGas and further development drilling at Sugarloaf expected to increase production. Management and the Board have established a clear direction and strategy and we will focus on taking advantage of the opportunities in front of us. As a team, we look forward to delivering these opportunities and providing positive returns for shareholders.
6 AWE LIMITED ANNUAL REPORT 2012

OPERATIONS
Michael broadSENIOR RESERvOIR ENGINEER
Michael joined the AWE Group in 2007 after working in Australia with RPS. Michael is based in Perth and retains responsibility for the Onshore WA subsurface assets.
7

Current ActivitiesAWE’S CuRRENT PRODuCTION OPERATIONS PROvIDE STRONg CASH FlOW FROM A DIvERSE RANgE OF DEvElOPED OIl AND gAS PROjECTS.
Oil and gas production totalled 4.7 million BOE for the 12 months to 30 June 2012. Production performance was impacted by the extended, seven month shut in of the BassGas project as a result of delays in completing offshore construction work for the MLE. The remainder of AWE’s production portfolio performed well, with increased production on the prior year from Cliff head and Sugarloaf and continued good performance from the Tui and Casino/henry projects.
Sales revenue of $298 million and operating cash flow after tax of $124 million remained strong, supported by higher realised oil prices and lower field operating costs, which were reduced by $30 million on the previous year. field EBITDAX for the year of $189 million, up $17 million on the previous year, confirmed the strength of the Company’s portfolio of production assets.
During the year, the Company continued to focus on opportunities to increase production from, and pursue opportunities adjacent to, existing operations. The successful workover of the Cliff head-12 well increased production from the field by 7.5% over the prior year and production from the Redback and Redback South gas wells, adjacent to the Beharra Springs gas field, in the onshore Perth Basin added significant gas sales revenue for the reporting period. Accelerated development drilling at Sugarloaf in the USA has seen gas and liquids production increase substantially subsequent to year end. further opportunities to improve production performance are being pursued in 2012-13. Potential infill drilling at Tui is being considered by the joint venture and tighter well spacing is currently being evaluated at Sugarloaf, offering substantial potential reserves and production upside for the shale gas and liquids project.
Operating costs were reduced during the year and AWE completed two important maintenance and inspection programs on the Tui field on schedule and within budget that resulted in minimal disruption to production. The Company will continue to focus on opportunities to improve the operating performance of its assets in 2012-13 and beyond.
Production is estimated to be in the range of 4.5 to 5.0 million BOE for the 2012-13 year, with sales revenue targeted for $250 to $280 million, based on a Brent oil price of US$100 per barrel and an AUD:USD exchange rate of 1.0. This estimate includes further downtime at BassGas to complete the MLE project and continuing improved production performance from AWE’s Sugarloaf shale gas and liquids project in the USA.
8 AWE LIMITED ANNUAL REPORT 2012

PRODuCTION
geoff WhittomePIC DONGARA GAS PLANT
9

OPERATIONS
Tracey PhelanCOMMERCIAL MANAGER
Tracey joined AWE in 2006 after working in New Zealand and South East Asia with fletcher Challenge Energy and Shell for fifteen years. Tracey is responsible for the commercial and logistic functions for the Tui operations in New Zealand.
10 AWE LIMITED ANNUAL REPORT 2012

EXPlORATION
Future ActivitiesAWE HAS STRENgTHENED ITS TECHNICAl AND OPERATINg CAPAbIlITIES AND EXPERIENCE IN uNCONvENTIONAl gAS.
Exploration is a core element of AWE’s growth strategy, with the near term focus on unconventional gas in the North Perth Basin and conventional gas exploration and appraisal offshore Indonesia. The Company is maintaining its technical and commercial focus on the evaluation of exploration opportunities, while controlling overall expenditures within annual budget targets of less than $50 million. AWE has strengthened its technical and operating capabilities and experience in unconventional gas and additional exploration resources have been added to the Company’s Jakarta office.
During 2011-12, significant progress was made with the Company’s exploration program in the onshore Perth Basin for both conventional and unconventional gas. Preparatory works were completed and all regulatory approvals were received for the extensive shale gas and tight gas testing program, involving the hydraulic fracture stimulation of eight separate zones in three wells. further, the Redback-Irwin 3D seismic survey (comprising 291 square km) was acquired across the northern section of AWE’s exploration acreage in the basin. Importantly, this survey provides 3D seismic coverage of the Senecio and Corybas tight gas fields as well as extending seismic data coverage in the area to target tight gas exploration opportunities. following success with the Redback and Redback South conventional gas discoveries, the joint venture is evaluating the potential for the northern extension of the play which may involve the drilling of further exploration wells.
In the Bass Basin, processing of the Chappell 3D seismic survey in T/18P was completed and interpretation of the data is in progress. Initial technical evaluation of the Trefoil gas and condensate discovery for future commercialisation commenced, with the tie-in of the field to the existing Yolla platform facility being considered as a potential future development alternative. The BassGas joint venture is also evaluating the potential to drill an additional appraisal/development well into the Upper EvCM reservoir as part of the BassGas MLE, to test the potential for additional recovery of gas and liquids intersected in the Yolla-3 development well.
In Indonesia, AWE is moving forward with plans to drill an appraisal well on the Lengo gas discovery, offshore East Java. If successful, the 200 Bcf gas discovery, located in shallow water approximately 60 kilometres offshore, has the potential to be developed to supply gas into the rapidly growing energy market on the island of Java. During the year, AWE increased its exploration acreage in Indonesia through the acquisition of 100% interests in the North West Natuna and Anambas PSCs, both located in the Natuna Sea. In addition to the AAL oil field, a number of potential exploration opportunities have been identified in the North West Natuna PSC that could be tied back to the AAL development facilities, on exploration success. These opportunities will be evaluated in conjunction with development planning for AAL. In the Anambas PSC, AWE acquired the discovered Anambas gas field, with estimated recoverable Resources of 60 Bcf of gas and six million bbls of liquids, together with a number of other gas exploration prospects, all located close to existing gas infrastructure in the area. During 2012-13 it is planned to complete a full evaluation of these opportunities and develop plans for future exploration and/or appraisal drilling in the PSC.
11

THE ANDE ANDE luMuT PROjECT
Future ActivitiesAWE ANNOuNCED THE PuRCHASE OF THE INTERESTS IN jANuARy, 2012 AND COMPlETED THE TRANSACTION PRIOR TO THE END OF FEbRuARy, 2012.
As part of the acquisition of 100% interests in two Indonesian PSCs during 2011-12, AWE acquired the AAL oil field, which contains an estimated 76 million barrels of recoverable oil (43 million barrels net 2C Contingent Resources). The AAL development represents a significant growth opportunity for the Company in South East Asia, with the potential to increase the asset value through improvements to the development plan and oil recovery as well as opportunities to tie in other existing discoveries in the area and exploration prospects within the PSC.
The investment in the AAL project is consistent with the Company’s strategy to acquire material growth opportunities at an early stage in the project appraisal/development cycle and to utilise AWE’s operating capability and experience in project delivery. The acquisition price of less than $2 per barrel for undeveloped resources ensures there is considerable upside potential for AWE in successful delivery of the project as well as providing substantial additional potential in the exploration/appraisal of the two PSCs. In particular, the Anambas gas discovery and additional gas prospects in the Anambas PSC could provide the basis for a material gas development in an area with existing gas infrastructure.
The Plan of Development for the AAL project was approved by the Indonesian government in 2011, prior to the acquisition by AWE. The POD includes the development of the field with approximately 40 wells producing through a wellhead platform to a leased fPSO, with estimated development costs of approximately US$600 million for the platform and development wells. The majority of this expenditure will be incurred on development drilling currently planned to commence in 2015.
During the year, AWE commenced preliminary engineering on a number of key aspects of the project, including geological modelling and reservoir simulation, horizontal well and completion design, and process and facilities design. This work has confirmed the facilities concept included in the POD and has identified opportunities to improve the commercial outcome of the project. These opportunities include use of longer reach horizontal wells, optimised well placement in the reservoir and improved artificial lift design, all areas in which the Company has significant previous operational and engineering experience. AWE has also engaged with the Indonesian regulator in relation to contracting strategy and project implementation, as well as on the opportunities to improve project outcomes for both parties.
As part of AWE’s business strategy to manage financial risk, the Company plans to sell down up to 50% of its share of the project prior to making a final investment decision. This will provide additional financial liquidity for the Company and reduce the future capital commitment required to deliver the project. It will also ensure that a good portfolio balance is maintained within the Company. To maximise value for shareholders, it is planned to undertake the sell down in parallel with the completion of front end engineering and major contract tendering, to benefit from improved technical and commercial definition for the project ahead of the final investment decision. AWE will retain operatorship of the project and plans to use the AAL development as the cornerstone to position the Company for further growth in Indonesia and the region.
12 AWE LIMITED ANNUAL REPORT 2012

PROjECT DElIvERy
gatot SoedarsonoDRILLING AND COMPLETIONS MANAGER
Gatot joined AWE in June 2012, having previously worked with Premier Oil and CNOOC in Indonesia. Gatot is responsible for all drilling and completions activities for the AAL project.
Herry WibiksanaPRESIDENT AND GENERAL MANAGER AWE INDONESIA
herry joined AWE in 2010 having previously worked with ConocoPhillips for 24 years in Indonesia and North America. herry is President and General Manager of AWE’s Indonesian operations.
Sean MiddletonvICE PRESIDENT ANDE ANDE LUMUT OIL PROJECT
Sean joined AWE in March of this year, after 35 years experience in the Oil & Gas industry globally and extensive experience in project management within South East Asia. Sean is based in Jakarta and is the Project Manager for the AAL oil field development.
13

lEADERSHIP
Mark FabianASSET MANAGER ONShORE WA
Mark joined AWE in 2008 following the merger with ARC Energy. Mark is responsible for the management, delivery and performance of AWE’s onshore WA projects, including the shale gas and tight gas initiative.
14 AWE LIMITED ANNUAL REPORT 2012

uNCONvENTIONAl ENERgy
Future ActivitiesTHE MOvE INTO uNCONvENTIONAl HAS PROvIDED POSITIvE RETuRNS FOR THE COMPANy.
AWE recognised the potential of unconventional gas, particularly shale gas, and moved quickly to take advantage of being an “early mover” in the industry. In 2010, the Company acquired a 10% interest in the Sugarloaf Area of Mutual Interest, within the liquids rich Eagle ford shale play in central Texas. At the same time, plans were made for the evaluation of the shale potential in acreage already held by AWE in the onshore Perth Basin, and, more recently, the Company has entered into joint study agreements with the Indonesian government to evaluate opportunities for shale gas exploration in onshore central Sumatra.
The investment in Sugarloaf has already yielded substantial value for AWE. Total 2P Reserves and 2C Contingent Resources for Sugarloaf have increased to 16 million BOE, with 64% in liquids, and recent transactions to acquire acreage in the area, unrelated to AWE, support valuations well in excess of the net $70 million purchase price paid by AWE for the asset.
During 2011-12, the Operator, Marathon Oil, commenced a major drilling program on the Sugarloaf acreage, with 29 wells drilled during the six months to June 2012, substantially increasing production. This drilling program is planned to continue through 2012-13 and AWE expects up to 60 wells to be drilled during the year. The Operator is also pursuing opportunities to add additional value to the acreage, particularly via infill drilling plans involving drilling wells on tighter spacing, effectively moving well spacing from the current development model of using 80 acre spacing to 40 acre and 60 acres spacing. If successful, the results could add substantial reserves and resources to the project during 2012-13.
AWE’s shale gas and tight gas exploration program in the onshore North Perth Basin commenced in July 2012 after regulatory approvals were obtained and site preparations were completed. During 2011-12, the Company worked closely with landowners, local communities and government regulators to provide open and transparent communications on the exploration plans and work program. The experience AWE has gained from its early involvement in Sugarloaf has been applied to the North Perth Basin program and the Company has now built an experienced technical and operational team.
Three wells are being tested during the North Perth Basin exploration program, with eight separate zones in tight gas and shale gas formations being hydraulically fracture stimulated. The initial results have been promising, with fracture stimulations being successfully completed in all zones and gas being recovered during initial well flow back and clean-up from each of the zones.
During the year, the Company expanded its interests in unconventional gas when it entered into joint study agreements over three areas in onshore central Sumatra in Indonesia. AWE is one of four companies involved in the country’s first evaluation of shale gas and the experience obtained from Sugarloaf and the North Perth Basin is being applied to the initial evaluation. The Company will be able to take advantage of its technical and management team in Jakarta and its industry relationships established over the six years operating in the country.
15

COMMuNITy
Puke ArikiAWE has provided funds for an interactive site at the Puke Ariki Information Centre, located in New Plymouth. This site highlights detailed information about Mount Taranaki including history, walking tracks, huts and conservation projects.
16 AWE LIMITED ANNUAL REPORT 2012

SustainabilityAWE’S bOARD AND MANAgEMENT ARE COMMITTED TO DEvElOPINg AND buIlDINg A SuSTAINAblE buSINESS.
AWE recognises the importance of operating a sustainable business that delivers superior returns to its shareholders. Management and the Board are committed to developing and building a sustainable business, ensuring that the Company is an active and responsible member of the communities in which we operate. AWE has established the following sustainability principles that are key elements of our business strategy and will ensure the Company maintains its ability to operate in the future:
• Operate a healthy and safe workplace with a goal to achieve zero harm to people. • Minimise the impact of our business activities on the environments in which
we operate. • Benefit the local communities in which we operate. • Build a team that is engaged, motivated and rewarded by working with AWE. • Deliver superior, sustainable returns for shareholders.
The Company’s Sustainability Report for 2011-12 has been published separately and is available on the AWE web site. That report addresses in detail AWE’s performance on health, Safety and Environment as well as community relations and the management of the Company’s team of employees. While improvement in the Company’s performance is evident in a number of areas, our performance in some aspects of the business has not been acceptable, particularly in safety results reported for 2011-12. Management has already taken initiatives to improve future safety performance.
During the year, AWE continued to focus on strengthening its relationships with the communities in which it operates. In the onshore Perth Basin in Western Australia, significant community communication and consultation was undertaken prior to the shale gas and tight gas exploration program. Senior management, including the Managing Director, held numerous meetings with landowners, local communities and government regulators to establish dialogue and provide open and transparent communication of the Company’s plans.
AWE is continuing its investment in local communities with its sponsorship of the Taranaki Big Brothers Big Sisters program in New Zealand, which has now expanded into a national program. In the Perth Basin, AWE has invested in indigenous education and medical equipment for local communities and has provided support for the local cray fishing industry. In Indonesia, AWE has also supported local fishing communities in the area around its operations offshore East Java.
Over the past few years, the Company has built a diverse and talented team of employees. The size of the team has increased as AWE has taken on additional operating responsibilities in Australia, New Zealand and Indonesia and will continue to grow with the development activity for the important AAL project in Indonesia. The diversity of the team can be seen in the mix of age, nationality and gender in all levels within the organisation. At the senior management and Board levels of the Company there is a strong diversity of gender and nationality contributing to the direction and decision making of the organisation.
17

2P RESERvESAT 30.06.11 RESERvES MOvEMENTS 2P RESERvES AT 30.06.2012
Total ProductionTransfers /Revisions
Acquisitions /Divestments Total Sales Gas LPG Condensate Oil
AREAmillion
BOEmillion
BOEmillion
BOEmillion
BOEmillion
BOE PJk
TOnnESmillion
bblsmillion
bbls
SOuTH EAST AuSTRAlIA
Bass Basin 1 36.3 (1.1) 0.0 (6.9) 28.3 115.5 366.3 4.4 0.4Otway Basin 2 10.6 (1.4) 0.0 0.0 9.3 55.3 – 0.1 –
WESTERN AuSTRAlIA
Offshore Perth Basin 4.0 (0.7) 0.0 0.0 3.3 – – – 3.3Onshore Perth Basin 3 2.6 (0.4) 0.2 0.0 2.4 13.9 – – 0.0
NEW ZEAlAND
Taranaki Basin 4.1 (0.9) 0.0 0.0 3.1 – – – 3.1
uNITED STATES OF AMERICA
Sugarloaf AMI 4 8.5 (0.2) 1.4 0.0 9.7 19.0 153.4 4.8 –
Total 5,6 66.1 (4.7) 1.6 (6.9) 56.1 203.7 519.7 9.3 6.8
Notes:1. Yolla reserves include undeveloped reserves from future Yolla-5 and Yolla-6 wells and oil reserves from existing gas development well, Yolla-3.2. vic/P44 reserves include recovery from a future development well in the henry field.3. Includes reserves from Jingemia, Corybas, Dongara, Beharra Springs and Redback Terrace fields.4. Reserves increase is a result of development drilling and associated re-classification of 2C resources to 2P reserves. Sugarloaf reserves are net of royalty.5. Numbers may not add due to rounding6. Conversion factors used: Gas 6 PJ = 1 million BOE LPG: 1 tonne =11.6 BOE Oil 1 barrel =1 BOE Condensate 1 barrel =1 BOE
PROvED PluS PRObAblE (2P) RESERvES AT 30 juNE 2012 (AWE SHARE)
Reserves
18 AWE LIMITED ANNUAL REPORT 2012

COMMuNITy
Roger XiangGEOLOGIST, ShALE RESOURCES GROUP
Roger joined AWE in 2011 after graduating from the University of New South Wales with a double degree in Geology (hons) and international relations. Roger works within the Shale Resources Group evaluating the North Perth Basin shale and tight gas projects and new venture opportunities in unconventional oil and gas.
gaz bisht (RIGhT)
MANAGER, ShALE RESOURCES GROUP
Gaz joined AWE in 2008. he has over 26 years experience in the industry, a large part of which has been in Australia and Asia. Gaz is manager of the North Perth Basin shale and tight gas exploration project and also manages the Company’s new venture activities in Australia and New Zealand, targeting conventional and unconventional oil and gas opportunities.
19

Resources
2C RESOuRCESAT 30.06.11
RESOuRCE MOvEMENTS 2C RESOuRCES AT 30.06.2012
Total Transfers /Revisions
Acquisitions /Divestments Total Sales Gas LPG Condensate Oil
AREAmillion
BOEmillion
BOEmillion
BOEmillion
BOE PJk
TOnnESmillion
bblsmillion
bbls
SOuTH EAST AuSTRAlIA
Bass Basin 1 40.0 0.0 (2.7) 37.3 130.1 289.0 6.4 5.9Otway Basin 2 4.8 0.0 0.0 4.8 28.9 – 0.0 –
WESTERN AuSTRAlIA
Offshore Perth Basin 3 1.2 0.0 0.0 1.2 – – – 1.2Onshore Perth Basin 4 8.2 (0.1) 0.0 8.2 42.1 – 0.4 0.8
NEW ZEAlAND
Taranaki Basin 5 1.4 0.0 0.0 1.4 – – – 1.4
uNITED STATES OF AMERICA
Sugarloaf AMI 6 8.7 (2.3) 0.0 6.3 15.6 38.3 3.3 –
INDONESIA
NW Natuna 7 – 0.0 43.0 43.0 – – – 43.0Other Indonesia 8 13.5 0.0 17.4 30.9 149.3 – 6.0 –
Total 9,10 77.8 (2.4) 57.7 133.0 365.9 327.3 16.1 52.2
Notes:1. Includes Upper-EvCM and Mid-EvCM of Yolla field and Trefoil, White Ibis and Rockhopper discoveries.2. Includes additional Netherby potential and the Martha and Blackwatch discoveries.3. Comprises workover opportunities and the Cliff head West high field extension.4. Comprises gas resources for Corybas, Senecio and Snottygobble and oil resources at Drakea and Centella. These resources exclude onshore Perth Basin
shale potential.5. Comprise infill opportunities in existing fields.6. Decrease includes reclassification of 2C resources to 2P reserves. Includes Eagle ford and Austin Chalk.7. Comprises AWE’s net entitlement from Ande Ande Lumut future development as per PSC terms.8. Includes gas and condensate resources from the Lengo and Anambas gas discoveries.9. Numbers may not add due to rounding10. Conversion factors used: Gas 6 PJ = 1 million BOE LPG: 1 tonne =11.6 BOE
Oil 1 barrel =1 BOE Condensate 1 barrel =1 BOE
CONTINgENT (2C) RESOuRCES AT 30 juNE 2012 (AWE SHARE)
20 AWE LIMITED ANNUAL REPORT 2012

21

Texas Sugarloaf AMI
Activities
Notes:1. Subject to a Net Cash Interest payable to the previous owners of a subsidiary of the Company (AWE Taranaki Limited, previously New Zealand Overseas
Petroleum Limited), if returns from the Tui Area oil project in PMP 38158 exceed certain benchmark levels. 2. The Sugarloaf AMI is subject to a landowner royalties. These royalties are approximately 25%.3. Relinquished subsequent to the end of the financial year.4. The Company is also entitled to a Net Profits Royalty at rates varying from 7.5% to 8.3% from the Tintaburra field in ATP 299P. This royalty will be received
when gross revenues from the permit exceed the sum of total expenditures from the permit.
AWE jOINT vENTuRE INTERESTS AT 30 juNE 2012
AREAjOINTvENTuRE
INTEREST(%)
ProductionAuSTRAlIA
Bass Basin T/L1 46.25Perth Basin WA 31 L 57.50
L1/L2 Dongara 100.00L1/L2 hovea and Eremia 50.00L4/L5/PL 6 Woodada 100.00L7 Mt horner 100.00L11 Beharra Springs 33.00L14 Jingemia 44.14
Otway Basin vIC/L 24 25.00vIC/L 30 25.00
NEW ZEAlAND
Taranaki Basin 1 PMP 38158 42.50
uNITED STATES OF AMERICA 2
Sugarloaf AMI 10.00
AREAjOINTvENTuRE
INTEREST(%)
ExplorationAuSTRAlIA
Bass Basin T/18 P 44.75Perth Basin EP 320 33.00
EP 413 44.25EP 455 81.50
Otway Basin vIC/P 44 25.00
NEW ZEAlAND
Canterbury Basin PEP 38259 3 25.00
INDONESIA
East Java Basin Bulu PSC 42.50East Muriah PSC 50.00Terumbu PSC 100.00Titan PSC 40.00North Madura PSC 50.00NW Natuna PSC 100.00Anambas PSC 100.00
yEMEN
Block no. 7 19.25Block no. 74 29.75
22 AWE LIMITED ANNUAL REPORT 2012

AAl-West Natuna basin
East java basin
yemen-Shabwa basin
Sumatra shale gas study
Perth basin
Otway basin bass basin Taranaki basin
Canterbury basin
Corporate HQ, Sydney
Development
Exploration
Production
23
The directors present their report of the consolidated entity (“AWE”), being the Company and its controlled entities for the year ended 30 June 2012 and the auditor’s report thereon.
DirectorsThe directors of the Company at any time during or since the end of the financial year are:
Bruce J. Phillips, Independent Non-executive Chairman, BSc (Hons) Geol
Bruce Phillips is a petroleum explorationist who has more than 30 years of technical, financial and managerial experience in the upstream energy sector of the oil and gas industry. He has broad domestic and international exploration and production experience throughout Australia, South East Asia, Africa and South America. Bruce is an active member of Petroleum Exploration Society of Australia and the Australian Society of Exploration Geophysicists.
Bruce is currently a non-executive director of AGL Energy Limited and non-executive Chairman of Platinum Capital Limited. He was formerly a non-executive director of Sunshine Gas Limited.
Bruce was founder and Managing Director of AWE. He retired as Managing Director on 31 August 2007 and was appointed as a non-executive director on 19 November 2009 and non-executive Chairman on 18 November 2010. He is a member of the People Committee.
Bruce F.W. Clement, Managing Director, BSc, BEng (Hons), MBA
Bruce Clement has more than 30 years of oil and gas industry experience, including banking sector exposure, having held engineering and project management, commercial and supervisory roles with Exxon Corporation and Ampolex Limited, before joining AIDC Limited (Australian resource bank). Bruce joined Roc Oil Company Limited in 1997 and held the positions of Commercial Manager, Company Secretary and Chief Financial Officer, and Chief Operating Officer before being appointed Chief Executive Officer in 2008.
Bruce was appointed Managing Director of AWE on 1 February 2011.
David I. McEvoy, Independent Non-executive Director, BSc (Physics), Grad Dip (Geophysics)
David McEvoy has a petroleum geoscience background with almost 40 years experience in international exploration and development. He has held several senior executive positions in affiliates of ExxonMobil, most recently Vice President, Business Development in ExxonMobil Exploration Company from 1997 to 2002.
David is currently a non-executive director of Woodside Petroleum Ltd and ACER Energy Limited (formerly Innamincka Petroleum Ltd) and was formerly a non-executive director of Po Valley Energy Limited.
David was appointed a non-executive director of AWE on 22 June 2006. He is a member of the Audit and Governance Committee and is Chairman of the Sustainability Committee.
Andy J. Hogendijk, Independent Non-executive Director, AAUQ, FCPA, FAICD
Andy Hogendijk has had an extensive senior financial management career with Suncorp Metway, Commonwealth Bank and the John Fairfax Group and roles with Shell Company of Australia and Australian Paper Manufacturers.
Andy is a fellow of CPA Australia and is a non-executive director of Magellan Flagship Fund Limited. He was formerly Chairman of Gloucester Coal Limited and a non-executive director of Aditya Birla Minerals Limited. He was appointed as a non-executive director of AWE on 4 October 2007 and is Chairman of the Audit and Governance Committee and a member of the People Committee.
Ken G. Williams, Independent Non-executive Director, BEc (Hons)
Ken Williams has over 20 years operational experience in corporate finance with an emphasis on treasury and financial risk management as well as diverse experience in mergers, acquisitions, divestments and corporate reconstructions. During his executive career he has worked for significant Australian enterprises including Renison Goldfields, Qantas, Normandy Mining and Newmont Australia.
Ken has an Honours degree in Economics and a Masters of Applied Finance and is a member of the Australian Institute of Company Directors. Ken is a non-executive director of Havilah Resources NL, non-executive director of Curnamona Energy Limited and a non-executive director of Geothermal Resources Limited (the latter two companies now both delisted from ASX).
He was appointed as a non-executive director of AWE on 26 August 2009 and is a member of the Audit and Governance Committee and is Chairman of the People Committee.
Nicholas N. Jukes, Independent Non-executive Director, BEng (Civil), FIEAust
Nick Jukes is a civil engineer with 30 years experience in the engineering, construction and mining sectors and was formerly a senior executive with Thiess Pty Ltd.
He is a fellow of the Institute of Engineers Australia. During his career with Thiess Pty Ltd and BHP Billiton Limited, he was actively involved in the planning, development, construction and operations of major coal and metalliferours projects throughout Australia and South East Asia. He is currently Managing Director of Sedgman Limited and was formerly a non-executive director of Australasian Resources Limited.
Nick was appointed a non-executive director of AWE on 24 August 2010 and is a member of the Sustainability Committee.
DIrECtorS’ rEPort
24 AWE LIMITED ANNUAL REPORT 2012

DIrECtorS’ rEPort
Vijoleta Braach-Maksvytis, Independent Non-executive Director, BSc PhD MAICD
Dr Vijoleta Braach-Maksvytis is an innovation strategist with more than 20 years experience in organisational change, formation of cross-sectoral and global partnerships, the commercialisation of technology, and intellectual property strategy. Previous roles include Head of the Office of the Chief Scientist of Australia, Senior Executive and Director Global Development for CSIRO, and most recently, Deputy Vice Chancellor Innovation and Development at the University of Melbourne, and is currently an advisor in the area of social innovation.
Dr Vijoleta Braach-Maksvytis is a Member of the Australian Federal Government’s Green Car Innovation Fund Committee, on the advisory board of the Intellectual Property Research Institute of Australia, and is also a member of other public interest boards. She is currently a non-executive director of Orbital Corporation Limited.
Vijoleta was appointed a non-executive director of AWE on 7 October 2010 and is a member of the People Committee and the Sustainability Committee.
No directors of the Company either resigned or were appointed during or since the end of the financial year.
Company SecretaryNeville Kelly – Company Secretary, BCom (Merit), CPA
Neville Kelly is an accountant with 30 years commercial experience including over 27 years in the upstream sector of the Australian oil and gas industry, including 12 years experience with Bridge Oil Limited. Neville was also the Chief Financial Officer of AWE until 31 October 2011 and joined the Company on its public listing in 1997.
Neville was appointed to the position of Company Secretary in October 1999.
Directors’ MeetingsThe number of directors’ meetings (including meetings of committees of directors) and the number of meetings attended by each of the directors of the Company during the financial year were:
DIrECtorDIrECtorS’MEEtINGS
AUDIt AND GoVErNANCECoMMIttEEMEEtINGS
PEoPlECoMMIttEEMEEtINGS
SUStAINABIlItyCoMMIttEEMEEtINGS
A B A B A B A B
B. J. Phillips 11 11 – – 4 4 – –B. F. W. Clement 11 11 – – – – – –D. I. McEvoy 11 11 7 7 – – 4 4A. J. Hogendijk 11 11 7 7 4 4 – –K. G. Williams 11 11 7 7 4 4 – –N. N. Jukes 10 11 – – – – 3 4V. Braach-Maksvytis 11 11 – – 4 4 4 4
A – Number of meetings attended.
B – The number of meetings held during the time that the director held office during the financial year.
remuneration reportThe Remuneration Report is set out on pages 33 to 45 and forms part of the Directors’ Report for the financial year ended 30 June 2012.
Corporate Governance StatementDetails of the Company’s corporate governance practices are included in the Corporate Governance Statement that is set out on pages 46 to 54 and forms part of the Directors’ Report for the financial year ended 30 June 2012.
Principal ActivitiesThe principal activities of the consolidated entity during the course of the financial year included:
• exploration for oil and gas;
• appraisal and development of oil and gas properties; and
• production and sale of oil and gas.
AWE LIMITED ANNUAL REPORT 2012 25

DIrECtorS’ rEPort
operating and Financial reviewOverview of the Consolidated Entity
2012MMBoE
2011MMBoE
VArIANCE%
ProductionGas 2.58 3.42 (24.6)LPG production 0.14 0.30 (53.3)Condensate production 0.28 0.44 (36.3)Oil 1.69 1.96 (13.8)Total production 4.69 6.12 (23.4)
$MIllIoN $MIllIoN %
Sales revenue 298.4 304.9 (2.1%)Field EBITDAX1 188.7 171.8 9.8%Exploration and evaluation expense (36.5) (63.3) (42.4%)Statutory Net Profit after Tax (NPAT) (66.5) (117.6) 43.4%Less non-recurring items(after tax) (81.3) (101.6)Underlying NPAT2 14.8 (16.0)Net operating cash flow after tax 123.9 139.9 (11.4%)
reconciliation of Underlying NPAt $MIllIoN
Statutory NPAT (66.5)Less non-recurring items (after tax): Sale of Buru Energy shareholding 11.8 Recognition of deferred tax benefit on PRRT 6.9 Impairment of BassGas (96.8) Sale of BassGas interest (0.1) Yemen exploration provision (3.1)
Total non-recurring items (after tax) (81.3)
Underlying NPAT 14.8
1 Sales revenue less production costs and royalties. Refer also to Note 10 for information by segment.
2 AWE’s Financial Report complies with Australian Accounting Standards and International Financial Reporting Standards (IFRS). The underlying (non-IFRS) profit is unaudited but is derived from the audited accounts by removing the impact of non-recurring items from the reported (IFRS) audited profit. AWE believes the non–IFRS profit reflects a more meaningful measure of the consolidated entity’s underlying performance.
Summary of Financial PerformanceThe consolidated entity reported a net loss after tax of $66.5 million for the year (2011: net loss of $117.6 million). This result includes an after-tax impairment charge of $96.8 million relating to the BassGas project.
AWE recorded sales revenue for 2012 of $298.4 million (2011: $304.9 million) and achieved a 10% increase in field EBITDAX to $188.7 million from the prior year (2011: $171.8 million). This reflects a 20% increase in the average realised oil price from A$91 in 2011 to A$109 per barrel in 2012 and a $23.4 million decrease in production costs to $109.7 million, offset by a 14% decrease in oil production volume of 0.28 million barrels.
Total oil and gas production of 4.69 million BOE was 23% lower than 2011 and reflects the shut-in at Yolla for over 6 months for the construction of the Phase 1 BassGas Mid Life Enhancement (MLE) project. This was partially offset by small increases in volume at Cliff Head of 7.5% to 0.7 million barrels of oil and at Sugarloaf of 60% to 0.1 million barrels of condensate.
After adjusting for non-recurring items of $81.3 million, the underlying profit for the period was $14.8 million compared to an underlying loss of $16.0 million in 2011. A significant portion of the non-recurring items relate to the impairment charge for the BassGas project of $96.8 million ($138.2 million pre-tax, $41.4 million tax effect), which reflects the increase in estimated capital costs associated with the MLE project as well as anticipated increases in future operating costs.
In accordance with AWE’s successful efforts accounting policy, $36.5 million of exploration and evaluation costs were expensed in 2012 (2011: $63.3 million). Exploration and evaluation costs expensed during the year included drilling costs associated with Atlas-1 ($7.7 million), Evandra-2 ($3.8 million) wells and the Redbank-Irwin 3D seismic survey carried out in the Perth Basin ($6.0 million).
Net cash from operating activities decreased from $139.9 million in 2011 to $123.9 million during 2012. This was mainly due to the lower cash receipts received during the period ($33.1 million), largely attributed to higher debtor and accrued revenue balances at 30 June 2012 compared to the previous year. This was partly offset by lower cash operating costs ($19.8 million) where prior year costs included a significant one off cost for the Tui workover in late 2010.
26 AWE LIMITED ANNUAL REPORT 2012

DIrECtorS’ rEPort
Taxation The taxation expense for the year totals $3.4 million. In addition to income tax, taxation expense includes the tax effect of the consolidated entity’s Australian Petroleum Resource Rent Tax (“PRRT”) and New Zealand Accounting Profits Royalty (“APR”) projects. As a producer of oil and gas in Australian and New Zealand offshore waters, the consolidated entity is subject to, in addition to income tax, additional government imposts in the form of PRRT in Australia, including the extension of PRRT to onshore projects enacted during the 2012 financial year and effective from 1 July 2012, and APR in New Zealand. Exploration costs incurred outside Australia or New Zealand are not deductible.
As a consequence of the impairments made to “oil and gas” assets during the 2012 financial year, following a reassessment of the future cash flow expected to be generated from these assets, a tax benefit of $41.4 million has been credited to taxation expense during the 2012 financial year.
The extension of the Australian PRRT regime to onshore petroleum products has resulted in the recognition of a deferred tax benefit of $6.9m in respect of the starting base which is claimable against future PRRT liabilities.
Summary of Financial PositionAWE’s financial position is strong with a cash position of $42.8 million and undrawn facilities of $284 million at the end of the period. In May 2012 AWE completed the refinancing of a $300 million multi-currency bilateral bank facility for a term of 3 years.
The available cash at the end of the period of $42.8 million compared to $117.1 million at the end of 2011. During the 2012 financial period AWE made significant investments in development assets ($171.5 million) which included the BassGas MLE project ($146.6 million), part of which was recovered through the sale of an interest to Toyota Tsusho Gas E&P Trefoil Pty Ltd, and exploration activities ($39.2 million). AWE also invested in the acquisition of two companies with 100% interest in two Production Sharing Contracts (PSC’s) in Indonesia for US$39 million. As part of the transaction, AWE also assumed and refinanced approximately US$100 million in loans and receivables of the two companies acquired.
operating reviewTuiIn New Zealand, the Tui Area oil project (PMP 38158, offshore Taranaki Basin, New Zealand, AWE share 42.5%) recorded gross oil production of 2.21 million barrels (AWE share 0.94 million barrels), down 21% on the corresponding period due to natural field decline. Two planned shutdowns for maintenance were successfully completed on schedule and within budget during the year.
BassGass ProjectThe BassGas project (T/L1, Bass Basin, offshore southern Australia, AWE share 46.25%) was shut-in from 12 December 2011 for the remainder of the period for Phase One of the MLE project. During the period the project achieved gross gas sales of 8.4 PJ, 278,000 barrels of condensate and 20,700 tonnes of LPG. AWE’s share for the approximately 5.5 months of production was 4.7 PJ of gas with approximately 160,000 barrels of associated condensate, and 12,000 tonnes of LPG.
The BassGas MLE project is being progressed in two separate phases: Phase One comprising installation of an accommodation and controls module and additional compression facilities on the platform; and Phase Two comprising the drilling of additional development wells. Work on Phase One continued during the period with the successful installation of the accommodation and controls module. The installation of the compression module was not able to be completed during the period and has been delayed until the 2012-13 summer period. The project is expected to come back into production in September 2012. Planning for Phase Two work continues with the drilling of the Yolla-5 and Yolla-6 wells expected to be undertaken during the 2013-14 summer period. As at 30 June 2012, gross expenditure in relation to the MLE project is $373 million.
During the period, AWE completed the sale of an 11.25% interest in the BassGas project to Toyota Tsusho, reducing AWE’s interest in the project from 57.5% to 46.25% effective 1 November 2011.
Casino Gas ProjectThe Casino gas project, including the Casino, Henry and Netherby gas fields, (Otway Basin, offshore southern Australia, AWE share 25%) continued its strong production performance during the year, producing 32.3 PJ of gross gas production, in line with the long-term contracted rates. AWE’s share of production for the year was 8.1 PJ of gas with approximately 6,500 barrels of associated condensate. Gas production from the Otway Basin fields was marginally lower than the prior year due to a plant shut-down during this year.
Cliff HeadThe Cliff Head oil project (WA31L, Perth Basin, offshore Western Australia, AWE share 57.5%) contributed gross production of 1.2 million barrels of oil. AWE’s net share of production was approximately 700,000 barrels for the year. Work on the installation of a higher capacity pump for the Cliff Head-12 well was completed during August 2011, doubling early production from this well. As a result, production from the field for the 2012 financial year was 7.5% higher than the prior year. The Cliff Head joint venture is reviewing further opportunities to optimise field performance.
Onshore Perth BasinThe Onshore Perth Basin operations (AWE share 33.0% to 100%) continued to contribute modest levels of oil with net gas production through the year, with AWE’s share totalling 60,000 barrels of oil and condensate and 2.3 PJ of natural gas.
AWE operates the Hovea oil facilities and the Dongara and Corybas gas fields in the region. AWE also has equity in the Jingemia oil and Redback/Beharra Springs gas fields, operated by Origin Energy.
Net gas production increased by 35% during the year to 2.3 PJ with the largest contributions from the Redback gas field. Oil production from the Hovea and Jingemia fields was lower during the year at 54,000 barrels compared to 115,000 barrels in 2011. The Hovea facility was shut-in from April 2012 with production suspended from this date.
AWE LIMITED ANNUAL REPORT 2012 27

DIrECtorS’ rEPort
SugarloafDrilling and production activities continued at the Sugarloaf Area of Mutual Interest (AMI) shale gas project during the year with a total of 36 wells on production by 30 June 2012. AWE’s working interest in the Sugarloaf AMI is approximately 10% and a Net Revenue Interest of approximately 7.5% after deduction of landowner royalties. AWE reported net oil and condensate production of approximately 104,000 barrels, an increase of 55% compared to the prior year, and net gas production of 435 TJ, an increase of 9% over the prior year.
The operatorship of the Sugarloaf AMI was transferred to Marathon Oil on 1 November 2011. Marathon commenced a new accelerated drilling program early 2012 with 29 wells drilled during the period to 30 June 2012, of which 15 were producing at 30 June 2012.
Exploration operationsTaranaki BasinThe Tui joint venture (AWE share 42.5%) continued with the assessment of in-fill and near field opportunities within PMP 38158 during the year. The review and rationalisation of the Taranaki Basin exploration portfolio has also continued, with the relinquishment of interests in PEP 38524 and PEP 381202 during the year. AWE has stepped down as operator of the Canterbury Basin permit, PEP 38259 but has retained its 25% interest.
Bass BasinIn exploration permit T/18P interpretation has continued on the Chappell 3D seismic survey including a study of the remaining prospectivity in the permits. AWE has reduced its interest in T/18P from 47.5% to 44.75% following completion of the sale of a 2.75% interest to Toyota Tsusho. During the year the exploration permit T/44P (AWE share 40%) was surrendered.
Onshore Perth BasinSite preparations were completed for the planned hydraulic fracture stimulations at the Woodada Deep-1 (AWE share 100%), Arrowsmith-2 (AWE share 44.25%) and Senecio-2 (AWE share 50%) wells. The stimulations were approved by the Western Australian government authorities and subsequent to the end of the financial year, hydraulic stimulation of each of the three wells was successfully carried out. The results to date of the report have been promising with gas flows recorded from all zones during clean-up.
The Evandra-2 well was drilled in April 2012. The well did not intersect the target reservoir in the Dongara Sandstone and has been plugged and abandoned.
AWE is also continuing to pursue conventional oil and gas opportunities in the north Perth Basin. The Redback-Irwin 3D seismic survey (comprising 291 square km) was completed in April 2012 and will be used to assess the further potential in the region.
East Java Basin, IndonesiaAWE continues to assess other opportunities in the East Java Basin, with work carried out in the Titan, Terumbu and North Madura PSC’s. Seismic reprocessing was completed during the year on the 2D surveys in both the Terumbu and North Madura PSC’s.
The Atlas-1 well in the Titan PSC (AWE share 40% and operator) was drilled in June 2012. The well intersected a well-developed carbonate reservoir which contained gas but unfortunately the gas contained a high percentage of carbon dioxide and the well was plugged and abandoned.
A shale gas study area located in the Central Sumatra Basin in Indonesia was also granted to AWE during the year and is one of the first four initial shale gas areas to be granted in Indonesia. Work being carried out on the shale gas study is expected to be completed in the first quarter of the 2013 financial year.
The wells drilled during the year are summarised as follows:
WEll NAME loCAtIoN AWE SHArE CoMMENtS
Atlas-1 East Java (Indonesia) 40.0% Plugged and abandonedEvandra-2 Perth Basin 100.0% Plugged and abandoned29 wells in Sugarloaf AMI Eagle Ford Shale 10.0% 15 wells in production at year end; work being carried out
to bring remaining wells into production
CorporateAWE implemented a number of key strategic initiatives during the year including the acquisition of growth assets in Indonesia, the sale of an 11.25% interest in the BassGas project and completion of the divestment of its 13% shareholding in Buru Energy Limited. The Company has continued its focus on maximising the value of existing assets during the year with significant work being undertaken on key assets, including the BassGas MLE project and the Perth Basin shale gas project.
AWE’s wholly-owned subsidiary ARC Energy Pty Limited sold all of its ordinary shares held in Buru Energy Limited on 29 July 2011. Net proceeds from the sale of the shares amounted to $16.9 million.
AWE sold a portion of its Bass Basin portfolio to Toyota Tsusho for a cash consideration of $80.13 million. Under the terms of the sale and purchase agreement, AWE sold an 11.25% interest in T/L 1, which includes the BassGas Project, and a 2.75% interest in T/18P. The transaction was completed on 30 March 2012.
On 17 February 2012, AWE (AAL) NZ Limited, a wholly owned subsidiary of AWE, completed the acquisition of a 100% interest and operatorship of two Production Sharing Contracts (PSCs) offshore Indonesia, which includes the undeveloped Ande Ande Lumut (AAL) oil field, which is estimated to contain 76 million barrels of recoverable oil, as well as a number of potential exploration opportunities. Consideration paid for the shares of the two companies that are parties to the PSCs was US$39 million. In addition, another wholly owned subsidiary of AWE assumed and refinanced approximately US$100 million of existing loans and receivables of the two companies acquired.
On 8 December 2011, the Company declared a special fully franked dividend to shareholders of 5 cents per share ($26.1 million).
28 AWE LIMITED ANNUAL REPORT 2012

outlookFollowing completion of the acquisition of AAL in February 2012, AWE management has focussed on establishing the development team and advancing pre-development studies in respect of the AAL oil field.
Part of the offshore construction work for Phase One of the BassGas MLE project involving the installation of the compression module has been delayed and is now planned to be undertaken during the 2012-13 summer period. Phase Two of the project, the drilling of the additional development wells on the platform is scheduled for the 2013-14 summer period. A revised project plan has been agreed by the BassGas joint venture which will incorporate the re-establishment of free flow gas in September 2012.
A review of reserves has confirmed the Company’s 2P reserves at 30 June 2012 of 56.1 million BOE, a net reduction in reserves of 5.28 million BOE in addition to production for the year of 4.69 million BOE. A major part of the revision is to account for the divestment of 11.25% interest in BassGas (-6.9 million BOE), while upward revisions were made to Sugarloaf reserves (1.38 million BOE) and onshore Perth basin (net increase of 0.22 million BOE).
At year end, AWE held a net cash position of $27 million, following a year of significant investment in development projects and acquisition of growth assets. The Company generated sales revenue of $298 million and operating net cash flow after tax of $124 million, despite the shut-in of BassGas production for over six months of the year. Following the establishment of a $300 million multi-currency bilateral loan facility to replace the existing $150 million revolving loan facility, and with production continuing from its portfolio of production assets, the company is well positioned to implement its growth initiatives during 2012-13.
The Board believes AWE is in a strong financial position to take advantage of opportunities to add to its asset base and to further exploit those assets within the Company’s existing portfolio. The Board and AWE management looks towards to the future with considerable optimism.
Significant Changes in the State of Affairs Other than as set out below, in the opinion of the directors there were no significant changes in the state of affairs of the consolidated entity during the financial year under review.
Australian Clean Energy ActThe Australian Government’s Clean Energy Act (CEA) was enacted during the period leading to a potential obligation, from the 2013 financial year, to acquire and surrender eligible emission units in respect of the covered emissions from operated and non-operated facilities under AWE’s existing joint venture arrangements (or be liable to unit shortfall charges). The expected cash flows arising from any liability arising under the CEA have been included in the estimated recoverable amount for assets when assessing their carrying values, however the impact on the recoverable amount is not expected to be material.
DividendsDividends paid or declared by the Company to members since the end of the previous financial year were:
CENtS PEr SHArE totAl AMoUNt $’000 FrANKING DAtE oF PAyMENt
Declared and paid during the 2012 financial year – special dividend 5.0 26,094 Franked 20 January 2012
Events Subsequent to Balance DateIn the opinion of the directors, no matter or circumstance has arisen since 30 June 2012 that has significantly affected, or may significantly affect:
• the consolidated entity’s operations in future financial years;
• the results of those operations in future financial years; or
• the consolidated entity’s state of affairs in future financial years.
likely DevelopmentsIn the opinion of the directors, the provision of further information regarding likely developments in the operations of the consolidated entity in future financial years and the expected results of those operations would be likely to result in unreasonable prejudice to the consolidated entity and accordingly, has not been included in this report.
Directors’ Interests The relevant interest of each director in the share capital of the Company, as notified by the directors to the Australian Securities Exchange (“ASX”) in accordance with section 205G(1) of the Corporations Act 2001, at the date of this report is as follows:
FUlly PAIDorDINAry SHArES
B. J. Phillips 2,900,914B. F. W. Clement 30,000D. I. McEvoy 30,000A. J. Hogendijk 10,000K. G. Williams 20,000N. N. Jukes –V. Braach-Maksvytis –
No directors’ interests are subject to margin loans.
Details of employee share options are set out under “Options”.
DIrECtorS’ rEPort
AWE LIMITED ANNUAL REPORT 2012 29
DIrECtorS’ rEPort
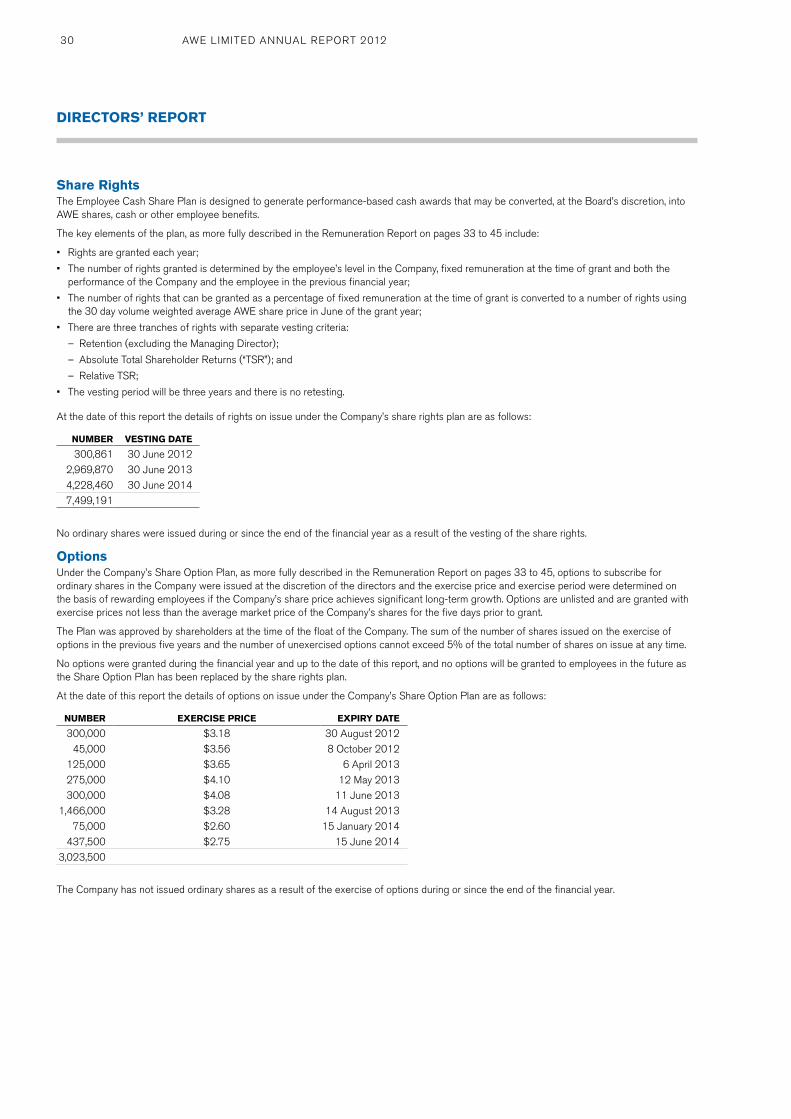
Share rightsThe Employee Cash Share Plan is designed to generate performance-based cash awards that may be converted, at the Board’s discretion, into AWE shares, cash or other employee benefits.
The key elements of the plan, as more fully described in the Remuneration Report on pages 33 to 45 include:
• Rights are granted each year;
• The number of rights granted is determined by the employee’s level in the Company, fixed remuneration at the time of grant and both the performance of the Company and the employee in the previous financial year;
• The number of rights that can be granted as a percentage of fixed remuneration at the time of grant is converted to a number of rights using the 30 day volume weighted average AWE share price in June of the grant year;
• There are three tranches of rights with separate vesting criteria:
– Retention (excluding the Managing Director);
– Absolute Total Shareholder Returns (“TSR”); and
– Relative TSR;
• The vesting period will be three years and there is no retesting.
At the date of this report the details of rights on issue under the Company’s share rights plan are as follows:
NUMBEr VEStING DAtE
300,861 30 June 20122,969,870 30 June 20134,228,460 30 June 20147,499,191
No ordinary shares were issued during or since the end of the financial year as a result of the vesting of the share rights.
optionsUnder the Company’s Share Option Plan, as more fully described in the Remuneration Report on pages 33 to 45, options to subscribe for ordinary shares in the Company were issued at the discretion of the directors and the exercise price and exercise period were determined on the basis of rewarding employees if the Company’s share price achieves significant long-term growth. Options are unlisted and are granted with exercise prices not less than the average market price of the Company’s shares for the five days prior to grant.
The Plan was approved by shareholders at the time of the float of the Company. The sum of the number of shares issued on the exercise of options in the previous five years and the number of unexercised options cannot exceed 5% of the total number of shares on issue at any time.
No options were granted during the financial year and up to the date of this report, and no options will be granted to employees in the future as the Share Option Plan has been replaced by the share rights plan.
At the date of this report the details of options on issue under the Company’s Share Option Plan are as follows:
NUMBEr ExErCISE PrICE ExPIry DAtE
300,000 $3.18 30 August 201245,000 $3.56 8 October 2012
125,000 $3.65 6 April 2013275,000 $4.10 12 May 2013300,000 $4.08 11 June 2013
1,466,000 $3.28 14 August 201375,000 $2.60 15 January 2014
437,500 $2.75 15 June 20143,023,500
The Company has not issued ordinary shares as a result of the exercise of options during or since the end of the financial year.
30 AWE LIMITED ANNUAL REPORT 2012

Indemnification and Insurance of officersUnder the Company’s Constitution, and to the extent permitted by law, every person who is, or has been, a director or secretary is indemnified against:
1. a liability incurred by that person, in his or her capacity as a director or secretary, to another person (other than the Company or a related body corporate of the Company) provided that the liability does not arise out of conduct involving a lack of good faith; and
2. a liability for costs and expenses incurred by that person:
(i) in defending any proceedings in which judgement is given in that person’s favour, or in which that person is acquitted, or
(ii) in connection with an application in relation to any proceedings in which the Court grants relief to that person under the Corporations Act.
During the financial year, the Company paid premiums based on normal commercial terms and conditions to insure all directors, officers and employees of the Company against the costs and expenses in defending claims brought against the individual while performing services for the consolidated entity. The premium paid has not been disclosed as it is subject to the confidentiality provisions of the insurance policy.
The Company has entered into Indemnity Deeds to indemnify directors and certain executives of the Company against all liabilities incurred in the course of or arising out of their employment with the Company and its controlled entities, except where the liability results wholly or in part from serious and wilful misconduct by the executive or director.
Audit and Non-audit Services Details of the amounts paid to the auditor of the Company, Ernst & Young, and its related practices for audit and non-audit services provided during the year are set out below.
2012$
2011$
Statutory audit:
Auditor of the Company:
Ernst and Young Australia – audit and review of financial reports 242,200 226,600
Non-audit Services:
Ernst & Young Australia
– Taxation compliance services 95,000 140,659
– Due diligence procedures related to asset acquisition 62,160 –
Overseas Ernst & Young firms
– Taxation compliance services – 3,283
157,160 143,942
Auditor’s Independence Declaration under Section 307C of the Corporations Act 2001 The auditor’s independence declaration is set out on page 32 and forms part of the Directors’ Report for the year ended 30 June 2012.
rounding offThe Company is of a kind referred to in Australian Securities and Investments Commission (“ASIC”) Class Order 98/100 dated 10 July 1998 and in accordance with that Class Order amounts in the financial report and the Directors’ Report have been rounded off to the nearest one thousand dollars unless otherwise stated.
Signed in accordance with a resolution of the directors:
B. J. PHIllIPS B. F. W. ClEMENt Chairman Managing Director
Dated at Sydney this twenty seventh day of August 2012
DIrECtorS’ rEPort
AWE LIMITED ANNUAL REPORT 2012 31

AUDItor’S INDEPENDENCE DEClArAtIoN TO THE DIRECTORS OF AWE LIMITED
In relation to our audit of the financial report of AWE Limited for the year ended 30 June 2012, to the best of my knowledge and belief, there have been no contraventions of the auditor independence requirements of the Corporations Act 2001 or any applicable code of professional conduct.
Ernst & young
trent van Veen Partner
Dated at Sydney this 27th day of August 2012
32 AWE LIMITED ANNUAL REPORT 2012

rEMUNErAtIoN rEPort
Key points
• AWE Total Shareholder Return (“TSR”) performance in the financial year better than both the ASX200 and ASX200 Energy Index;
• Fixed remuneration of Managing Director increased by 4%;
• Short-term incentive (STI) payment to the senior executives averaged 38% of maximum allowable;
• STI payment to the Managing Director set at 40% of maximum allowable;
• Long-term incentives (LTI) – implementation of changes to the Share Rights Plan (Plan) to decrease the maximum number of share rights (rights) to be granted and to increase the hurdle rates for future vesting of rights;
• No vesting of Relative and Absolute TSR rights and vesting of only the retention component of rights for the initial three year cycle of the Plan(1); and
• No increase in non-executive director fees in the financial year.
1 Retention rights are not granted to the Managing Director.
1. IntroductionThis report is prepared in accordance with section 300A of the Corporations Act 2001 (the Act) and has been audited as required by section 308 (3C) of the Act. Where appropriate, information which is included in other parts of the Annual Financial Report is included in this report by reference.
This report sets out remuneration information pertaining to directors and senior executives who are the ‘Key Management Personnel’ of the consolidated entity. Key Management Personnel are defined as those persons having authority and responsibility for planning, directing and controlling the activities of the consolidated entity, directly or indirectly.
1.1 ObjectivesThe key objectives of AWE’s remuneration practices are to:
• Align the interests of senior executives, staff and shareholders;
• Attract and retain suitably qualified senior executives and staff; and
• Motivate senior executives and staff to achieve superior performance.
1.2 Mix of RemunerationTo achieve these objectives remuneration packages consist of:
• Fixed remuneration (refer section 4);
• Short-term performance benefits (refer section 5); and
• Long-term performance benefits (refer section 6).
The remuneration structures take into account:
• The performance of the consolidated entity including:
– the growth in total returns to shareholders;
– the consolidated entity’s financial results;
– delivery of base business (that is, “business as usual”);
– the results of exploration, development and production activities;
– business growth;
– adherence to health, safety and environment policies; and
– compliance with regulatory regimes;
• The capability and experience of senior executives;
• The ability of senior executives to control the performance of their relevant area of responsibility; and
• Current economic and industry circumstances.
1.3 Market ComparativesIn order to attract and retain suitably qualified senior executives and technical professionals and to ensure that salary packages are reasonable and competitive but not excessive, fixed remuneration levels and at risk remuneration structures in the form of short-term incentive benefits and long-term incentive benefits are benchmarked against independently provided data on Australian upstream oil and gas companies. The current market for such senior executives and technical professionals in the upstream oil and gas industry is very tight and competitive and the Company’s remuneration framework needs to be structured accordingly.
To ensure that long-term incentive structures are appropriately aligned to the long-term interests of shareholders, the vesting of share rights are conditional on performance conditions which are tied to the three year total shareholder return of the Company and to the three year total shareholder returns of comparator ASX listed energy companies.
AWE LIMITED ANNUAL REPORT 2012 33

rEMUNErAtIoN rEPort
1.4 Changes to Remuneration StructuresAs foreshadowed in the Company’s 2011 Remuneration Report and as part of the continual review of remuneration structures, the Company has reviewed these remuneration structures and has implemented a number of refinements to apply for future issues of rights.
In particular, changes have been made to the Share Rights Plan to reduce the amount of rights that can be issued (more fully described in section 6.1) by:
• Establishing a maximum number of rights that can be granted rather than an absolute number;
• Basing the number of rights that can be granted by taking into account Company and individual performance in the previous financial year; and
• Reducing the participation scales for the Managing Director and senior executives.
Further, the vesting criteria applying to rights has been tightened, once again as more fully described in section 6.1, by;
• Increasing the hurdle rates applying to absolute performance measures;
• Increasing the hurdle rates applying to relative performance measures; and
• Decreasing the retention component for senior executives.
Also, the Company has determined that a more appropriate comparator group for relative performance measurement is peer companies in the ASX300 Energy Index.
2. Key management personnelFor the purposes of this report, the senior executives who represent key management personnel of the consolidated entity at any time during the June 2012 financial year were:
Senior Executive Position
Bruce F W Clement Managing Director
Dennis Washer Chief Operating Officer/General Manager, New Zealand
Neville F Kelly Company Secretary (also Chief Financial Officer up to 31 October 2011)
Brod W Wray General Manager, Commercial and Business Development (ceased employment on 31 January 2012)
David R N Gaudoin General Manager, Exploration and Geoscience
Ayten Saridas Chief Financial Officer (appointed 31 October 2011)
Mr Ian Palmer was previously defined as a member of key management personnel by virtue of being one of the five highest paid executives of the consolidated entity but is no longer defined as a member of key management personnel.
3. People committee (formerly the remuneration committee)The People Committee is responsible for making recommendations to the Board on remuneration policies and employment practices applicable to directors, senior executives and other employees.
The role and responsibilities of the People Committee are documented in a charter approved by the Board and is reviewed at least annually. A copy of this charter is available on the Company’s website.
The People Committee is to be comprised of not less than two non-executive directors, the majority of whom shall be independent. No executive can be a member of the Committee. The People Committee currently comprises Ken Williams (Chairman), Bruce Phillips, Andy Hogendijk and Vijoleta Braach-Maksvytis, all of whom are non-executive directors of AWE and are considered to be independent.
3.1 RoleThe role of the People Committee as defined in the charter is to ensure that the remuneration policies and employment practices of AWE:
• are consistent with the Company’s goals and objectives;
• deliver outcomes in line with strategic business goals;
• recognise the scale and complexity of the Company’s business activities;
• encourage directors and senior executives to deliver short-term objectives and to pursue the long-term growth and success of the Company within an appropriate control framework;
• deliver a level and composition of remuneration that is appropriate and fair to a broad range of stakeholders;
• define the relationship of remuneration to corporate and individual performance; and
• attract and retain talented and effective directors and staff so as to encourage enhanced performance of the Company.
The People Committee also evaluates the appropriateness of remuneration packages given trends in comparable companies, the need to drive a performance-based culture and the objectives of the Company’s remuneration strategy.
34 AWE LIMITED ANNUAL REPORT 2012

rEMUNErAtIoN rEPort
3.2 ResponsibilitiesThe responsibilities of the People Committee as defined in the charter are to review and make recommendations to the Board on:
• policies for employment and remuneration of all AWE staff;
• recruitment, retention and termination policies and procedures for senior executives;
• the remuneration package of the Managing Director;
• the remuneration packages of senior executives in consultation with the Managing Director;
• performance schemes including short-term and long-term incentives;
• superannuation arrangements;
• the remuneration framework for non-executive directors, within the limit approved by shareholders;
• management succession planning;
• procedures necessary to ensure compliance with industrial relations law;
• the appointment of external remuneration consultants and evaluation of advice from remuneration consultants in accordance with the Act;
• the diversity disclosure plan and the Company’s progress in achieving measurable diversity objectives;
• the annual Statutory Remuneration Report; and
• other matters as requested by the Board.
4. Fixed remunerationFixed remuneration consists of base salary calculated on a total cost basis, including fringe benefits tax and employer contributions to superannuation (if applicable).
Remuneration levels are reviewed at least annually by the People Committee through a process that considers independent externally provided remuneration data and also taking into account the overall performance of the consolidated entity to ensure that remuneration is appropriate and competitive in the market place.
For details of fixed remuneration paid to directors and senior executives please refer to section 10.
5. Short-term performance benefitsShort-term performance benefits are awarded in the form of cash bonuses. These benefits are “at risk” and are paid for performance during the financial year and are designed to reward senior executives for meeting or exceeding Company and individual Key Performance Indicators (“KPIs”).
Managing Director KPI’sEach year, the Board sets corporate KPIs for the Managing Director which are based on overall corporate performance targets.
June 2012 Financial YearFor the June 2012 financial year the corporate KPI’s for the Managing Director were based on a balanced scorecard approach with the Board believing that the attainment of these measures will result in meaningful shareholder returns both in the short-term and long-term. These performance measures were:
• Delivery of base budget (30%) – includes delivery of production, operating expenditure and capital expenditure budgets.
• Optimisation of the business (30%) – includes implementation of cost control measures, achievement of oil and gas reserves replacement targets, maintaining and improving HSE performance and community and regulatory relationships and overall team performance goals.
• Business growth (30%) – includes specific targets aimed at expanding the business and positioning the Company for long-term growth.
• In addition, a 10% allowance is determined at the discretion of the Board to cover potential changed circumstances during the financial year.
On an assessment of actual performance under these measures for the financial year the Board has determined that a total of 40% of maximum KPI will be awarded to the Managing Director. For further details refer to section 11.1.
June 2013 Financial YearFor the June 2013 financial year the corporate KPI’s for the Managing Director will again be based on a balanced scorecard approach and include corporate performance measures as follows:
• Delivery of work program and budget (45%) – includes specific targets with respect to delivery of capital expenditure and exploration programs, operating expenditure targets, administration costs targets, reserves replacement, team performance, HSE performance, community, regulatory and environment.
• Portfolio balancing and regeneration (35%) – includes specific targets with respect to individual assets and also includes targets with respect to expanding the asset base of the Company.
• Board discretion (20%) – includes an allowance to cover the potential and inevitable changing circumstances during the financial year.
Given the continuing changing circumstances of both the Company and the upstream oil and gas industry in general the Board is of the view that these KPI performance measures will inevitably be required to respond to such circumstances and accordingly will vary from year to year.
The Board believes that the attainment of these measures will result in meaningful shareholder returns both in the short-term and long-term.
AWE LIMITED ANNUAL REPORT 2012 35

rEMUNErAtIoN rEPort
Senior Executives KPI’sCorporate KPIs for senior executives are based on the same corporate KPI’s as the Managing Director. In addition, the Managing Director sets individual KPIs for the senior executives. These KPI’s take into account individual and departmental performance over which the senior executive has responsibility. The Board believes that the attainment of these individual and departmental KPIs is essential in delivering overall corporate objectives.
The structure of these short-term performance benefits as a percentage of fixed remuneration are as follows:
MANAGINGDIrECtor(a)
SENIorExECUtIVES(b)
Target – meets performance objectives 25% 20%Stretch – exceeds performance objectives 25% 20%Total potential short-term performance benefit 50% 40%
(a) 100% of Managing Director KPIs are based on achieving corporate performance measures.
(b) 50% of senior executive KPIs are based on the same corporate KPI’s as the Managing Director and 50% are subject to individual and departmental KPIs over which the individual senior executive has responsibility.
In the special circumstance of outstanding individual performance, the Board may award up to 100% of that individual’s short-term performance benefit even though some KPIs have not been achieved. This special circumstance is designed to reward and retain outstanding employees in times where some KPI targets have not been achieved due to circumstances beyond the control of the individual senior executive.
The Company is aware of proposed legislative changes with respect to the ability to clawback bonuses paid to the Managing Director and senior executives in the case of a subsequent misstatement in the Company’s financial statements and the Company intends to implement appropriate changes to executive service contracts once the legislation is finalised.
For details of short-term performance benefits paid in the June 2012 financial year, refer to section 11.
6. long-term performance benefitsLTI “at risk” performance benefits are awarded in the form of rights with vesting conditions tied to retention, absolute TSR and relative TSR.
The rationale for the choice of this criteria include:
• to align employees with commonly shared goals related to producing high returns for shareholders over the medium to long-term;
• to encourage and assist employees to become shareholders of AWE themselves;
• to provide a long-term component of remuneration to enable AWE to compete effectively for the calibre of talent required for the Company to be successful; and
• to help retain talented personnel, minimise employee turnover and stabilise the workforce.
The Company no longer issues employee share options as a method of rewarding long-term performance and no employee share options have been issued since June 2009. There are however residual unexercised employee share options on issue, all of which will be exercised or will lapse by no later than June 2014.
6.1 Share Rights PlanIn the June 2010 financial year the Company introduced a Share Rights Plan for the award of long-term performance benefits.
The Plan is designed to generate performance-based awards that may be converted, at the Board’s discretion, into AWE shares, cash or other employee benefits.
The key elements of the Plan include:
• Rights are granted each year and the number of rights granted will be determined by the employee’s level in the Company, fixed remuneration at the time of grant and taking into account both the Company and employee’s performance in the previous financial year.
• There are three tranches of rights with separate vesting criteria:
– Retention(1);
– Absolute TSR; and
– Relative TSR.
• The vesting period is for three years, the rights will lapse after three years and there will be no retesting.(1) Retention rights are not granted to the Managing Director.
The Plan defines TSR as “The percentage change over a period in shareholder value due to share price movement and dividends assuming dividends are reinvested into AWE shares”.
Early vesting of rights is not permitted other than at the time of change in control of the Company where the extent of any vesting is to be determined at the discretion of the Board. On termination of employment, rights are forfeited unless and to the extent determined by the Board. The Board has discretion whether or not to make a determination and reserves the right to exercise that discretion having regard to the circumstances that might arise from time to time.
36 AWE LIMITED ANNUAL REPORT 2012

The number of rights that can be granted as a percentage of fixed remuneration at the time of grant and converted to a number of rights using the 30 day volume weighted average price (“VWAP”) of the AWE share price in June of the grant year, and reflecting changes referred to in section 1.4, are as follows:
rIGHtS GrANtED FroM JUNE 2013 FINANCIAl yEAr (MAxIMUM NUMBEr AS A PErCENtAGE oF FIxED
rEMUNErAtIoN)
rIGHtS GrANtED UP to JUNE 2012 FINANCIAl yEAr (ABSolUtE NUMBEr AS A PErCENtAGE oF FIxED
rEMUNErAtIoN)
Retention vesting
condition
Absolute TSR vesting
condition
Relative TSR vesting
condition total
Retention vesting
condition
Absolute TSR vesting
condition
Relative TSR vesting
condition total
Managing Director – 50% 50% 100% – 75% 75% 150%
Senior Executives 15% 30% 30% 75% 20% 30% 30% 80%
The above tables also represent the maximum number of rights that can vest three years subsequent to grant, but only if all vesting conditions are satisfied to 100% (and then only if the maximum number of initial rights were granted based on past Company and individual performance).
Vested rights will entitle the senior executive to an amount which will vary with the AWE share price at the time of vesting. The Board may decide in its absolute discretion the form of payment (eg: cash or issue of shares) to satisfy these vested rights.
Retention Grants• Number of rights calculated using the 30-day VWAP of the AWE share price in June of grant year.
• Vest after three years if the employee remains employed by AWE.
Absolute TSR Grants• Number of rights calculated using the 30-day VWAP of the AWE share price in June of grant year.
• Vest after three years according to the Company’s Absolute TSR for that three year period.
• The vesting scales to apply for Absolute TSR grants, and reflecting changes referred to in section 1.4 are as follows:
ABSolUtE tSr rIGHtS GrANtED FroM JUNE 2013 FINANCIAl yEAr ABSolUtE rIGHtS GrANtED UP to JUNE 2012 FINANCIAl yEAr
AWE tSr % oF rIGHtS to VESt AWE tSr % oF rIGHtS to VESt
< 8% pa compound – < 6% pa compound –8% pa compound 25% 6% pa compound 25%
>8% and <10% pa compound Pro rata >6% and <9% pa compound Pro rata10% pa compound 50% 9% pa compound 50%
>10% and <12% pa compound Pro rata >9% and <12% pa compound Pro rata12% pa compound 100% 12% pa compound 100%
Relative TSR Grants• Number of rights calculated using the 30-day VWAP of AWE share price in June of grant year.
• Vest after three years according to the Company’s TSR relative to companies in ASX 300 Energy Index in grant year as per the table below (companies no longer in the index are excluded).
• The vesting scales to apply for Relative TSR grants, and reflecting changes referred to in section 1.4 are as follows:
rElAtIVE tSr rIGHtS GrANtED FroM JUNE 2013 FINANCIAl yEAr rElAtIVE tSr rIGHtS GrANtED UP to JUNE 2012 FINANCIAl yEAr
AWE tSr rElAtIVE to tSr oF CoMPANIES IN S&P/ASx ENErGy
INDEx At DAtE oF GrANt % oF rIGHtS to VESt
AWE tSr rElAtIVE to tSr oF CoMPANIES IN S&P/ASx ENErGy
INDEx At DAtE oF GrANt % oF rIGHtS to VESt
< 50% – < 50% –50% 25% 50% 50%
>50% and <90% Pro rata >50% and <75% Pro rata90% and above 100% 75% and above 100%
No rights vested in prior years due to the initial three year vesting period not having been reached.
For details of rights vesting at 30 June 2012, refer to section 11.2.
For details of unvested rights, refer to section 12.2 and for details of movements in rights, refer to section 13.2.
rEMUNErAtIoN rEPort
AWE LIMITED ANNUAL REPORT 2012 37

rEMUNErAtIoN rEPort
6.2 Employee Share OptionsEmployee share options were previously granted to senior executives and the number granted was based on the relative level of the individual senior executive in the consolidated entity and generally had a vesting period of three years and a total term of five years.
No employee share options have been granted since June 2009 and no further employee share options will be issued. No employee share options vested or were exercised in respect of the June 2012 financial year and certain employee options lapsed (refer section 13.1).
The vesting of all employee share options is subject to the satisfaction of relative performance conditions. Relative performance criteria used to determine the ability of senior executives to exercise employee share options is measured by comparing the consolidated entity’s TSR over a rolling three-year period against both the ASX Energy Index and the ASX 200 Index. Accordingly, senior executives will only be rewarded in circumstances where the Company’s share price exceeds the relative performance criteria. Retesting of this relative performance measure is allowed every 12 months until expiry of the employee share option (which is generally a period of a further two years from initial testing).
Refer to section 11.2 for relative performance criteria applying to the June 2012 financial year.
Any options granted in prior years were issued under the Employee Share Option Plan (“ESOP”). Key terms of the ESOP include:
• The exercise price must not be less than the higher of the market price or the minimum price specified in the ASX Listing Rules. The market price is determined by the five-day volume weighted average price prior to grant;
• The sum of the number of shares issued on the exercise of options in the previous five years and the number of unexercised options cannot exceed 5% of the total number of shares on issue at any time; and
• Options are issued for a term of not more than five years, may have various vesting periods and can only be exercised after the conditions of exercise are met.
For details of unvested options, please refer to section 12.1 and for details of movements in options, please refer to section 13.1.
6.3 Employee Share TradingThe ability of senior executives to trade in the Company’s securities is governed by the Company’s Securities Trading Policy which in particular provides for the prohibition in dealing in the Company’s securities while in possession of price sensitive information and during defined blackout periods and further prohibits speculative trading. A copy of this policy is available on the Company’s website.
7. other benefitsThe personal needs of directors and senior executives may be taken into account when determining the appropriate remuneration mix and the Company allows salary sacrifice arrangements to the extent that it complies with all applicable laws, and there is no net cost to the Company doing so.
8. Service agreements8.1 Managing Director – Bruce ClementOn 1 February 2011, Mr Bruce Clement commenced as Managing Director and at the time of his formal appointment, the details of the service agreement entered into with Mr Clement were disclosed and are summarised as follows:
Terms of ContractA commencement date of 1 February 2011 with a minimum term of three years but can be terminated earlier under the terms of the service agreement.
RemunerationRemuneration is made up of the following components:
• Current Fixed Remuneration in the form of base salary of $832,000 per annum inclusive of salary, superannuation and fringe benefits tax which is reviewed annually effective 1 July;
• At risk short-term performance benefits which are summarised in section 5 and can represent up to 50% of base salary for the year; and
• At risk long-term performance benefits which are granted on a rolling three year basis. The benefits are in the form of employee rights under the Share Rights Plan. On the commencement of his employment, Mr Clement was granted 920,245 rights vesting on 30 June 2013. In addition, and to align the timing of award and vesting conditions to other senior executives, from 1 July 2011 Mr Clement was awarded 916,030 rights vesting on 30 June 2014. The award of these rights was approved by shareholders at the Company’s 2011 Annual General Meeting.
In addition, and based on the changes to the Share Rights Plan as detailed in section 1.4 and 6.1, a total of 331,474 rights will be granted to Mr Clement for the three year period vesting 30 June 2015 with this grant being subject to shareholder approval at the Company’s 2012 Annual General Meeting. Further details will be provided with the 2012 Notice of Meeting.
TerminationThe service agreement contract may be terminated in the following circumstances:
• Voluntary termination by the Company or Mr Bruce Clement on six months’ notice. On termination by the Company, a termination payment of 6 months of then base salary is payable in addition to any payment in lieu of notice. On termination by Mr Clement, no such termination payment will be made. Pro-rated short-term benefits will be paid according to the achievement of KPIs to the date on which notice is given. Any granted but unvested rights at the date on which notice is given will be forfeited;
• Termination by the Company on three months’ notice in the event of illness or injury. Pro-rated short-term benefits will be paid according to the achievement of KPIs to the date on which notice is given. Any granted but unvested rights at the date on which notice is given will be forfeited; or
• Termination by the Company for cause and without notice. Any short-term benefits or rights that have not vested at the date on which notice is given will be forfeited.
38 AWE LIMITED ANNUAL REPORT 2012

8.2 Senior ExecutivesBrod Wray
Mr Brod Wray was General Manager, Commercial and Business Development to 31 January 2012. He received normal base salary and superannuation until the date he ceased employment on this date. On cessation of employment he received:
• Unpaid accrued annual and long service leave;
• A pro rata bonus up to cessation of employment; and
• An amount equal to one year’s average base salary calculated in accordance with the Corporations Act 2001.
In respect of long-term performance benefits held by Mr Wray:
• Employee share options were forfeited; and
• Rights were forfeited to the extent of the retention component but otherwise retained for testing in July 2012, July 2013 and July 2014 on a pro rata basis. Subsequent to the end of the financial year it was determined that no rights which were retained for testing in July 2012 passed vesting conditions and accordingly will lapse.
other Senior Executives
The key terms and conditions of service agreements for all other senior executives (excluding the Managing Director) are summarised as follows:
RemunerationService contracts standardise the executive’s entitlement to:
• Fixed remuneration;
• Short-term performance benefits;
• Long-term performance benefits; and
• Any other benefits that may be provided by the Company.
TerminationService agreements may be terminated under the following circumstances:
• Resignation on three months’ notice by the executive;
• Termination on three months’ notice by the Company; or
• Termination without notice by the Company for cause.
In the event of a redundancy or defined change in circumstances the senior executive is entitled to a 12 month termination payment (in the case of Neville Kelly this entitlement is two years under certain defined circumstances) unless not otherwise permitted by law.
The service contracts have no fixed term.
9. Non-executive directorsTotal remuneration for all non-executive directors, last voted upon by shareholders at the 2009 Annual General Meeting of the Company, is not to exceed $900,000 per annum, inclusive of superannuation. Total remuneration paid to non-executive directors in the financial year amounted to $776,000. Fees are set based on review of externally provided remuneration data with reference to fees paid to other non-executive directors of comparable companies.
Directors’ base fees (including superannuation) for the 2012 financial year were as follows:
BoArDAUDIt
CoMMIttEEPEoPlE
CoMMIttEE SUStAINABIlIty
CoMMIttEE
Chair $210,000 $22,000 $16,000 $16,000Member $90,000 $11,000 $8,000 $8,000
Non-executive directors do not receive incentive-based remuneration and do not receive any retirement benefits other than statutory entitlements.
There was no increase in non-executive director fees for the financial year ending 30 June 2012.
rEMUNErAtIoN rEPort
AWE LIMITED ANNUAL REPORT 2012 39

rEMUNErAtIoN rEPort
10. Directors’ and executive officers’ remunerationDetails of the nature and amount of each major element of remuneration of each director of the Company and each of the named senior executives are as follows:
SHort–tErM
PoStEMPloy-
MENt
otHErloNGtErM(c)
SHArEBASED
PAyMENtS
SAlAryPACKAGE
ANDFEES(a)
$
CASH BoNUS
$
NoN-MoNEtAry
BENEFItS$
totAl$
SUPEr-ANNUAtIoNBENEFItS(b)
$ $
tErMIN-AtIoN
BENEFItS(d)
$
totAlCASH
rElAtED
$
VAlUE oFoPtIoNS/
rIGHtS(e)
$totAl
$
PErFor-MANCE
rElAtED%
VAlUE oFoPtIoNS/
rIGHtS %
Executive Directors
B. F. W. Clement(2) 2012 786,412 166,400 8,172 960,984 45,589 20,766 – 1,027,339 327,359 1,354,698 36% 24%
2011 322,958 58,000 3,359 384,317 10,375 3,271 – 397,963 67,033 464,996 27% 14%
B. J. W. Wood(3) 2012 – – – – – – – – – – – –
2011 440,740 43,750 4,806 489,296 48,150 (28,567) 377,777 886,656 97,155 983,811 14% 10%
Sub-total 2012 786,412 166,400 8,172 960,984 45,589 20,766 – 1,027,339 327,359 1,354,698 36% 24%
2011 763,698 101,750 8,165 873,613 58,525 (25,296) 377,777 1,284,619 164,188 1,448,807 18% 11%
Non-Executive Directors
B. J. Phillips(1) 2012 200,000 – – 200,000 18,000 – – 218,000 – 218,000 – –
2011 157,798 – – 157,798 14,201 – – 171,999 – 171,999 – –
D. I. McEvoy 2012 107,339 – – 107,339 9,661 – – 117,000 – 117,000 – –
2011 107,339 – – 107,339 9,661 – – 117,000 – 117,000 – –
A. J. Hogendijk 2012 110,092 – – 110,092 9,908 – – 120,000 – 120,000 – –
2011 109,312 – – 109,312 9,838 – – 119,150 – 119,150 – –
K. G. Williams 2012 107,339 – – 107,339 9,661 – – 117,000 – 117,000 – –
2011 105,367 – – 105,367 9,483 – – 114,850 – 114,850 – –
N. N. Jukes(4) 2012 89,908 – – 89,908 8,092 – – 98,000 – 98,000 – –
2011 75,950 – – 75,950 6,835 – – 82,785 – 82,785 – –
V. Braach-Maksvytis(4) 2012 97,248 – – 97,248 8,752 – – 106,000 – 106,000 – –
2011 71,105 – – 71,105 6,400 – – 77,505 – 77,505 – –
B. G. McKay(1) 2012 – – – – – – – – – – – –
2011 112,112 – – 112,112 7,179 – – 119,291 – 119,291 – –
Sub-total 2012 711,926 – – 711,926 64,074 – – 776,000 – 776,000 – –
2011 738,983 – – 738,983 63,597 – – 802,580 – 802,580 – –
total 2012 1,498,338 166,400 8,172 1,672,910 109,663 20,766 – 1,803,339 327,359 2,130,698 23% 15%
2011 1,502,681 101,750 8,165 1,612,596 122,122 (25,296) 377,777 2,087,199 164,188 2,251,387 12% 7%
(1) Bruce McKay retired as director and Chairman of the Company on 18 November 2010. Bruce Phillips assumed the role of Chairman on 18 November 2010.
(2) Bruce Clement was appointed Managing Director of the Company on 1 February 2011.
(3) Bruce Wood ceased to be a director of the Company on 31 January 2011.
(4) Nick Jukes was appointed a director of the Company on 24 August 2010. Vijoleta Braach-Maksvytis was appointed a director of the Company on 7 October 2010.
40 AWE LIMITED ANNUAL REPORT 2012

SHort–tErM
PoStEMPloy-
MENt
otHErloNGtErM(c)
SHArEBASED
PAyMENtS
SAlAryPACKAGE
ANDFEES(a)
$
CASH BoNUS
$
NoN-MoNEtAry
BENEFItS$
totAl$
SUPEr-ANNUAtIoN
BENEFItS(b)
$ $
tErMIN-AtIoN
BENEFItS(d)
$
totAlCASH
rElAtED
$
VAlUE oFoPtIoNS/
rIGHtS(e)
$totAl
$
PErFor-MANCE
rElAtED%
VAlUE oFoPtIoNS/
rIGHtS %
Executives
D. Gaudoin(1) 2012 450,667 72,000 10,265 532,932 20,833 10,397 – 564,162 161,348 725,510 32% 22%
2011 550,958 27,222 58,802 636,982 46,656 15,597 – 699,235 134,550 833,785 19% 16%
N. F. Kelly 2012 362,432 65,000 8,172 435,604 28,503 9,969 – 474,076 150,109 624,185 34% 24%
2011 347,448 45,108 8,144 400,700 28,451 10,044 – 439,195 121,107 560,302 30% 22%
D. Washer 2012 488,335 78,302 – 566,637 32,835 – – 599,472 194,345 793,817 34% 24%
2011 459,688 48,618 – 508,306 29,776 – – 538,082 151,050 689,132 29% 22%
A. Saridas(2) 2012 257,628 43,000 – 300,628 11,831 6,550 – 319,009 32,459 351,468 21% 9%
2011 – – – – – – – – – – – –
B. Wray(3) 2012 261,953 19,939 – 281,892 19,542 (17,895) 383,724 667,263 (8,318) 658,945 2% (1%)
2011 360,873 31,360 – 392,233 31,125 7,527 – 430,885 125,815 556,700 29% 23%
I. D. Palmer(4) 2012 – – – – – – – – – – – –
2011 361,401 129,360 8,144 498,905 30,597 11,601 – 541,103 120,317 661,420 38% 18%
L. J. Brooks(5) 2012 – – – – – – – – – – – –
2011 451,031 27,245 5,051 483,327 38,062 8,292 406,897 936,578 65,984 1,002,562 9% 7%
total 2012 1,821,015 278,241 18,437 2,117,693 113,544 9,021 383,724 2,623,982 529,943 3,153,925 26% 17%
2011 2,531,399 308,913 80,141 2,920,453 204,667 53,061 406,897 3,585,078 718,823 4,303,901 24% 17%
(1) David Gaudoin was General Manager, Europe to 6 February 2011. He was appointed General Manager, Exploration and Geoscience for the AWE Group on 7 February 2011.
(2) Ayten Saridas commenced employment as Chief Financial Officer on 31 October 2011.
(3) Brod Wray ceased employment on 31 January 2012. For details of entitlements received on ceasing employment refer to section 8.2. Certain share based payment previously expensed in respect to the rights have been reversed.
(4) Up to 30 June 2011 Mr Ian Palmer was defined as a member of key management personnel by virtue of being one of the five highest paid executives of the consolidated entity but is no longer defined as a member of key management personnel.
(5) Leigh Brooks was General Manager, Exploration to 6 February 2011 but continued to be employed by the AWE group until 19 August 2011.
Notes in relation to table of directors’ and executives’ remuneration:
a) Salary package and fees include amounts salary sacrificed.
b) Superannuation benefits include the amount required to be contributed by the consolidated entity and does not include amounts salary sacrificed.
c) Other long-term benefits comprise the amount of long service leave accrued in the period.
d) Amounts classified as termination benefits include salaries paid to senior executives after they ceased to be classified as key management personnel but continued to be employed by the consolidated entity.
e) The Company no longer grants employee share options as a method of rewarding long-term performance and accordingly no employee share options have been issued during the June 2011 and 2012 financial years. For past grants of employee share options the fair value of options had been calculated at the grant date using a modified binomial option-pricing model. In valuing the options, market conditions were taken into account.
Non-market performance conditions (including continuous employment requirements) are not taken into account in the fair value measurement of the share rights on grant date.
For grants of rights the fair value have been calculated at the grant date using a Black-Scholes Pricing Model and assuming an expected share price volatility of 25% and vesting probability of 43.5% for performance related awards.
The fair value of options and rights has been calculated at the grant date and allocated to each reporting period evenly over the period from grant date to vesting date. The value disclosed is the portion of the fair value of the options and rights allocated to this reporting period. The value disclosed does not therefore represent cash received.
f) Amounts disclosed for remuneration exclude insurance premiums paid by the consolidated entity in respect of directors’ and officers’ liability insurance contracts. The premium paid has not been allocated to the individuals covered by the insurance policy as, based on all available information; the directors believe that no reasonable basis for such allocation exists.
rEMUNErAtIoN rEPort
AWE LIMITED ANNUAL REPORT 2012 41

rEMUNErAtIoN rEPort
11. Analysis of performance benefits included in remunerationThe value of options and rights are allocated to each reporting period over the period from grant date to vesting date. Accordingly, amounts included as remuneration for the financial year represent that amount allocated to the financial year from the grant of options and rights both in the current financial year and previous financial years.
11.1 Award of Short-term Performance BenefitsShort-term performance benefits in the form of cash bonuses are awarded to the Managing Director and senior executives on the achievement of consolidated entity and individual performance KPIs (refer to section 5) for the current financial year.
The award of bonuses in August 2012 was in recognition of this performance and details of the vesting profile of these bonuses are as follows:
INClUDED IN rEMUNErAtIoN (A$)(a)
% VEStED IN yEAr% ForFEItED IN yEAr(b)
Directors
B. F. W. Clement 166,400 40% 60%
Executives
N. F. Kelly 65,000 42% 58%D. Washer 78,302 38% 62%B. W. Wray(c) 19,939 18% 82%D. R. N. Gaudoin 72,000 38% 62%A. Saridas(d) 43,000 40% 60%
(a) Amounts included in remuneration for the financial year represent the amount that vested in the financial year and include any superannuation payments applicable. No amounts vest in future financial years.
(b) The percentages forfeited are due to that component of base and stretch performance criteria not being met in the financial year.
(c) B. W. Wray ceased employment on 31 January 2012.
(d) A. Saridas commenced employment on 31 October 2011.
11.2 Grant and Vesting of Long-term Performance BenefitsSections 6.1 and 6.2 of this report detail the consolidated entity’s approach to the granting and vesting of long-term performance benefits.
Share Rights• For details of rights granted and lapsed in the current financial year, refer to section 13.2.
• For details of the vesting profile of rights, refer to section 12.2.
• For details of the vesting of rights subsequent to the end of the financial year:
Analysis of actual Vesting Criteria for the three Years to 30 June 2012
Retention RightsRetention rights vested due to senior executive being employed by the consolidated entity three years subsequent to initial grant.
Absolute TSR RightsForfeited as vesting conditions not satisfied as follows:
• AWE annual compound TSR for the three year period to 30 June 2012. (18.5%)
• Minimum annual compound rate required for vesting – refer section 6.1. 6.0%
Relative TSR RightsForfeited as vesting conditions not satisfied as follows:
• AWE relative performance against comparator group for the three year period to 30 June 2012. 47th percentile
• Minimum relative performance required for vesting – refer section 6.1. 50th percentile
For further detail, refer to section 13.2.
Employee Share OptionsGranting – no employee share options were granted in the financial year and no further options will be issued. For details of the vesting profile of employee share options, refer to section 12.1.
Vesting – as the consolidated entity’s absolute TSR for the rolling three-year period to 30 June 2012 of – 46% was below the performance of both the ASX 200 Energy Index of – 19% and the ASX 200 Index of 3% it has been determined that options granted in previous financial years and vesting in July 2012 are not capable of exercise. These options will be retested in July 2013.
42 AWE LIMITED ANNUAL REPORT 2012

The following table identifies the consolidated entity’s performance in respect of the current financial year and the previous eight financial years:
2012 2011 2010 2009 2008 2007 2006 2005 2004
Profit/(loss) ($ millions) (66.50) (117.6) (28.93) 88.58 264.36 35.38 (1.4) (11.48) 5.96
30 June share price ($) 1.34 1.28 1.78 2.57 4.16 3.64 3.42 2.02 1.52
Change in share price ($) 0.06 (0.50) (0.79) (1.59) 0.52 0.22 1.40 0.50 0.70
Total shareholder return (%) 9% (28%) (31%) (35%) 14% 6% 69% 33% 85%
AWE performance relative to ASX 200 Energy Index 30% (35%) (27%) (11%) (21%) (12%) 38% (31%) 45%
AWE performance relative to ASX 200 Index 21% (35%) (40%) (15%) 31% (17%) 50% 12% 69%
12. Analysis of share-based payments granted as remuneration12.1 Employee Share OptionsDetails of vesting profiles of unvested employee share options granted as remuneration to each director of the Company and each of the named senior executives are detailed below:
NUMBEr GrANt DAtEVEStED
%
FINANCIAl yEArS IN WHICH
oPtIoNS VESt
FAIr VAlUEPEr oPtIoN
GrANtED $
DirectorsNilExecutivesD. R. N. Gaudoin 200,000 16 June 2009 – 30 June 2013 (b) 0.43N. F. Kelly 150,000 13 July 2007 – 30 June 2013 (a) 0.71
100,000 15 August 2008 – 30 June 2013 (b) 0.59D. Washer 100,000 13 July 2007 – 30 June 2013 (a) 0.71
100,000 15 August 2008 – 30 June 2013 (b) 0.59
The exercise of options is conditional upon satisfaction of relative performance conditions.
The fair value per option granted represents the modified binomial option-pricing model valuation for options granted and calculated at grant date.
a) These options lapsed unexercised subsequent to the end of the financial year.
b) Based on the Company’s relative TSR performance for the 3 year period to 30 June 2012 these options have not vested and will be retested in July 2013 (refer section 11.2).
12.2 Employee Share RightsDetails of vesting profiles of unvested employee rights granted as remuneration to each director of the Company and each of the named senior executives are detailed below:
NUMBEr(a) GrANt DAtEVEStED
%
FINANCIAl yEArS IN WHICH
rIGHtS VESt
FAIr VAlUEPEr rIGHt
GrANtED $(b)
Directors
B. F. W. Clement* 920,245 24 November 2011 – 30 June 2013 0.42916,030 24 November 2011 – 30 June 2014 0.54
ExecutivesD. R. N. Gaudoin 116,310 22 January 2010 – 30 June 2012 (c) 1.42
159,952 25 June 2011 – 30 June 2013 0.62280,917 16 September 2011 – 30 June 2014 0.60
N. F. Kelly 103,611 22 January 2010 – 30 June 2012 (c) 1.42142,488 3 December 2010 – 30 June 2013 0.87229,557 16 September 2011 – 30 June 2014 0.60
D. Washer 133,018 22 January 2010 – 30 June 2012 (c) 1.42188,406 3 December 2010 – 30 June 2013 0.87296,904 16 September 2011 – 30 June 2014 0.60
A. Saridas 162,850 31 October 2011 – 30 June 2014 0.80
* The grant of rights to Mr Clement was approved by shareholders at the 2011 Annual General Meeting of the Company. As this was the actual grant date the fair value of the grant and amount expensed in the financial year has been based on the Company’s share price at that date.
a) The vesting of rights is conditional upon satisfaction of vesting conditions as described in section 6.1.
b) The fair value per right granted represents the valuation for rights granted and calculated at grant date.
c) Tested for satisfaction of vesting conditions subsequent to the end of the financial year. Refer section 13.2.
rEMUNErAtIoN rEPort
AWE LIMITED ANNUAL REPORT 2012 43

rEMUNErAtIoN rEPort
13. Analysis of movements in long-term performance benefits13.1 Employee Share OptionsThere were no employee options granted over ordinary shares in AWE during the financial year. In addition, there were no shares issued on the exercise of options previously granted as remuneration.
Details of employee options lapsing during the financial year are detailed below:
GrANt DAtE NUMBEr
Directors
Nil
Executives
N. F. Kelly 21 July 2006 130,000D. Washer 21 July 2006 50,000B. W. Wray 12 June 2008 300,000
15 August 2008 100,000
No value was attributable to options that lapsed during the financial year.
13.2 Share RightsThe movement during the financial year, by value, of rights granted to directors and senior executives is detailed below:
GrANt DAtE NUMBEr
GrANtED DUrINGtHE yEAr AND VEStING
PoSt 30 JUNE 2012 VAlUE ($)
Directors
B. F. W. Clement* 24 November 2011 916,030 498,092
Executives
D. R. N. Gaudoin 16 September 2011 280,917 167,544N. F. Kelly 16 September 2011 229,557 136,912D. Washer 16 September 2011 296,904 177,079B. W. Wray 16 September 2011 239,389 142,776A. Saridas 31 October 2011 162,850 129,971Total 2,125,647 1,252,374
* This grant of rights was approved by shareholders at the 2011 Annual General Meeting of the Company. As this was the actual grant date the fair value of the grant and amount expensed in the financial year has been determined as at this date.
Details of rights forfeited during the financial year are detailed below:
GrANt DAtE NUMBEr
Directors
Nil
Executives
B. W. Wray 22 January 2010 27,0293 December 2010 37,171
16 September 2011 59,847
No value was attributable to rights that were forfeited during the financial year.
44 AWE LIMITED ANNUAL REPORT 2012

Details of rights which were tested for vesting conditions subsequent to the end of the financial year and as more fully described in section 11.2 are as follows:
rEtENtIoN rIGHtS
ABSolUtE tSr rIGHtS
rElAtIVE tSr rIGHtS
totAl rIGHtS
Directors
Nil
Executives
D. R. N. GaudoinOn Issue 29,076 43,617 43,617 116,310Forfeited – (43,617) (43,617) (87,234)Vested 29,076 – – 29,077N. F. KellyOn Issue 25,903 38,854 38,854 103,611Forfeited – (38,854) (38,854) (77,708)Vested 25,903 – – 25,903D. WasherOn Issue 33,254 49,882 49,882 133,018Forfeited – (49,882) (49,882) (99,764)Vested 33,254 – – 33,254B. W. WrayOn Issue – 40,543 40,543 81,086Forfeited – (40,543) (40,543) (81,086)Vested – – – –
total
on Issue 88,233 172,896 172,896 434,025
Forfeited – (172,896) (172,896) (345,792)
Vested 88,233 – – 88,233
All the above rights had a grant date of 22 January 2010 in respect of the 2009 financial year.
rEMUNErAtIoN rEPort
AWE LIMITED ANNUAL REPORT 2012 45
CorPorAtE GoVErNANCE StAtEMENt
The ASX Listing Rules require listed entities to disclose the extent to which they have followed the Corporate Governance Principles and Recommendations set by the ASX Corporate Governance Council during the reporting period. This corporate governance statement summarises the corporate governance practices that have been formally reviewed and adopted by the AWE Board with a view to ensuring continued investor confidence in the operations of the Company and endorsing the corporate governance principles relevant to a company of AWE’s nature and size. A table has been included at the end of this statement detailing the Company’s compliance with the recommendations.
The Company’s website at www.awexplore.com contains a corporate governance section that includes copies of the Company’s corporate governance policies and Board committee charters mentioned in this statement.
ASx Principle 1 – lay Solid Foundations for Management and oversight Role of the BoardThe responsibilities of the Board are to:
• set the strategic direction for the Company and monitor progress of those strategies;
• establish policies appropriate for the Company;
• monitor the performance of the Company, the Board and management;
• approve the business plan and annual work programs and budgets in line with the approved strategy;
• authorise and monitor major investment and strategic commitments;
• review and ratify systems for health, safety and environmental management; risk management and internal control; codes of conduct and regulatory compliance;
• appoint and monitor performance of the Managing Director;
• report to shareholders, including but not limited to, the financial statements of the Company;
• evaluate the performance of the Board and identify and appoint new directors to the Board; and
• take responsibility for corporate governance.
Board committees have been established to assist the Board in discharging these responsibilities.
Delegation to ManagementOther than matters specifically reserved for the Board, responsibility for the operation and administration of the Company has been delegated to the Managing Director. This responsibility is subject to an approved delegation of authority which is reviewed regularly and at least annually.
Internal control processes are designed to allow management to operate within the parameters approved by the Board and the Managing Director cannot commit the Company to additional activities or obligations in excess of these delegated authorities without specific approval of the Boards.
ASx Principle 2 – Structure the Board to Add ValueComposition of the BoardThe names of the directors of the Company in office at the date of this statement and information regarding directors’ experience and responsibilities are set out in the Directors’ Report.
The Company’s constitution provides for the Board to determine a number of directors that is not less than three and not more than ten directors.
The Board has resolved that it will at all times have a majority of non-executive directors, with at least 50% of directors considered to be independent, including the Chairman, who shall be non-executive.
The preferred combination of skills and experience for the Board of AWE include:
• technical disciplines of upstream oil and gas exploration, development and production;
• finance, taxation and accounting;
• company strategy and business planning;
• business and corporate development;
• both local and international experience; and
• public company administration.
Chairman of the BoardThe Chairman of the Board will be a non-executive director and the Chairman will be elected by the directors. The Board considers that at the date of this report, the Chairman Mr Bruce Phillips, is also independent.
Independent Directors The Board considers that a director is independent if that director complies with the following criteria:
• apart from director’s fees and shareholdings, independent directors should not have any business dealings which could materially affect their independent judgement;
• must not have been in an executive capacity in the Company in the last three years;
• must not have been in an advisory capacity to the Company in the last three years;
• must not be a significant customer or supplier for the Company;
• must not be appointed through a special relationship with another Board member;
46 AWE LIMITED ANNUAL REPORT 2012

• must not owe allegiance to a particular group of shareholders which gives rise to a potential conflict of interest;
• must not hold conflicting cross directorships; and
• must not be a substantial shareholder or a nominee of a substantial shareholder (as defined under section 9 of the Corporations Act).
The Board considers that on application of the above guidelines the status of the independence of directors is as follows:
DIrECtor StAtUS rolES
Mr B. J. Phillips(1) Independent, non-executive Chairman, member of People CommitteeMr B. F. W. Clement Non-Independent, executive Managing DirectorMr D. I. McEvoy Independent, non-executive Chairman of Sustainability Committee, member of Audit & Governance CommitteeMr A. J. Hogendijk Independent, non-executive Chairman of Audit & Governance Committee, member of People CommitteeMr K. G. Williams Independent, non-executive Chairman of People Committee, member of Audit & Governance CommitteeMr N. N. Jukes Independent, non-executive Member of Sustainability CommitteeDr V. Braach-Maksvytis Independent, non-executive Member of People Committee, member of Sustainability Committee
(1) Mr Bruce Phillips was previously Managing Director of the Company up to 31 August 2007, remained as an employee until 31 December 2007 and was appointed a non-executive director on 19 November 2009 and non-executive Chairman on 18 November 2010. The Board considers Mr Phillips is independent since it has been in excess of three years since Mr Phillips held an executive role with the Company and that there has been significant change in the composition of the senior executive committee of the Company since that time.
Retirement and Rotation of DirectorsRetirement and rotation of directors is governed by the Corporations Act 2001 and the Constitution of the Company. Each year, one third of directors must retire and offer themselves for re-election. Any casual vacancy filled will be subject to shareholder vote at the next Annual General Meeting of the Company.
Independent Professional Advice Each director has the right to seek independent professional advice at the Company’s expense after consultation with the Chairman. Once received, the advice is to be made immediately available to all Board members.
Access to EmployeesDirectors have the right of access to any employee. Any employee shall report any breach of corporate governance principles or Company policies to the Managing Director who shall remedy the breach. If the breach is not rectified to the satisfaction of the employee, they shall have the right to report any breach to an independent director without further reference to senior executives of the Company.
Directors’ and Officers’ Liability InsuranceDirectors’ and officers’ liability insurance for directors are arranged by the Company at the Company’s expense.
Share OwnershipDirectors are encouraged to own Company shares.
The Company’s policy is that directors shall not engage in speculative trading. Also, directors must inform the Chairman if any Company securities are subject to a margin loan. The Company reserves the right to disclose this arrangement to the ASX if the Company believes it is appropriate having regard to the Listing Rules.
Board MeetingsThe frequency of Board meetings and the extent of reporting from management at Board meetings are as follows:
• a minimum of six scheduled meetings are to be held per year;
• other meetings will be held as required;
• meetings can be held where practicable by electronic means;
• information provided to the Board includes all material information on exploration, development and production operations, budgets, forecasts, cash flows, funding requirements, investment and divestment proposals, business development activities, investor relations, financial accounts, taxation, external audits, internal controls, risk assessments, people and health, safety and environmental reports and statistics;
• the Chairman of the appropriate Board committee reports to the next subsequent Board meeting the outcomes of that meeting and the minutes of those committee meetings are also tabled.
The number of directors’ meetings (including meetings of committees of directors) and the number of meetings attended by each of the directors of the Company during the financial year are set out in the Directors’ Report.
Board Performance Review A review of the Board’s own performance and effectiveness is conducted annually and commencing in the June 2012 financial year the performance of individual directors is also undertaken.
As required by their respective charters the Audit and Governance Committee, the Sustainability Committee and the People Committee undertake an annual self-assessment. The Board and the Board Committees have the discretion for these reviews to be conducted independently from time to time.
Performance evaluation of senior executives and staff is undertaken at least annually (refer to separate discussion in the Remuneration Report).
CorPorAtE GoVErNANCE StAtEMENt
AWE LIMITED ANNUAL REPORT 2012 47

CorPorAtE GoVErNANCE StAtEMENt
Other Areas for Board Review• Reporting to shareholders and the market to ensure trade in the Company’s securities takes place in an efficient, competitive and informed market;
• succession planning for senior executives and the Board;
• insurance, both corporate and joint venture related insurances; and
• approval of external directorships for the Managing Director and senior executives and disclosure of external directorships by other directors.
Board Committees
Audit and Governance Committee The role of the Audit and Governance Committee is documented in a formal charter approved by the Board and is reviewed on at least an annual basis.
The Audit and Governance Committee’s primary role is to assist the Board of Directors in discharging its responsibilities in respect of the financial affairs and related matters of the Company and to advise and make appropriate recommendations to the Board in respect of such financial responsibilities.
The objectives of the Audit and Governance Committee are to:
• assist the Board in discharging its responsibility to exercise due care, diligence and skill in relation to the Company’s:
– reporting of financial information to users of financial reports;
– application of accounting policies;
– financial management;
– internal control system;
– corporate and governance risk management;
– taxation risk management;
– business policies and practices;
– protection of the entity’s assets; and
– compliance with applicable laws, regulations, standards and best practice guidelines;
• improve the credibility and objectivity of the accountability process (including financial reporting), especially where the role of the Audit and Governance Committee and its membership by independent non-executive directors is disclosed to shareholders and the public;
• provide a forum for communication between the Board and senior financial management;
• improve the efficiency of the Board by delegating tasks to the committee and thus allowing more time for issues to be discussed in sufficient depth;
• improve the effectiveness of the external audit functions and to be a forum for improving communication between the Board and the external auditor;
• satisfy itself as to the independence of the external auditor (each reporting period the external auditor provides an independence declaration in relation to the audit or review); and
• improve the quality of internal and external reporting of financial information.
Under its charter, the Audit and Governance Committee must be comprised of at least three independent non-executive Board members appointed by the Board. Any director who is not a member of the Audit and Governance Committee, may attend Audit and Governance Committee meetings but will have no voting powers at such meetings. Members will have the appropriate skills (including financial literacy) and time to fill their role on the Audit and Governance Committee. The majority of members will have significant experience with financial and business matters. The Managing Director should not be a member of the Audit and Governance Committee. The Chairperson of the Board of Directors should not be the Chairperson of the Audit and Governance Committee.
At the discretion of the Audit and Governance Committee, the external auditor and the Managing Director and other executives are invited to attend meetings. At least once a year, the Audit and Governance Committee meets with the external auditor without executives present. Further, at least once a year the Audit and Governance Committee meets with the Company’s tax advisers.
The Audit and Governance Committee comprises Mr Andy Hogendijk (Chairman), Mr David McEvoy and Mr Ken Williams, all of whom are non-executive and considered to be independent. Meetings are to be scheduled prior to the commencement of each financial year and the charter stipulates that meetings are to be held at least three times a year. The number of Audit and Governance Committee meetings and number of meetings attended by each of the members of the Audit and Governance Committee during the financial year and information regarding committee member experience and responsibilities are set out in the Directors’ Report.
The Managing Director and the Chief Financial Officer have declared in writing to the Board that the Company and consolidated entity’s financial reports for the year ended 30 June 2012 present a true and fair view, in all material respects, of the Company and consolidated entity’s financial condition and operational results and are in accordance with relevant accounting standards. This representation is made by the Managing Director and Chief Financial Officer prior to the directors’ approval of the release of both the annual and six-monthly accounts. This representation is made after enquiry of, and representation by, appropriate levels of management (refer also to Risk Management section for declaration made in respect of risk management).
48 AWE LIMITED ANNUAL REPORT 2012

People CommitteeThe roles and responsibilities of the People Committee are documented in a charter approved by the Board and are more fully disclosed in the Remuneration Report.
For details in relation to the Company’s Share Rights Plan and Share Option Plan, refer to note 32 to the financial statements and to the Remuneration Report.
For details of remuneration paid to directors and senior executives for the financial year and the process for evaluating the performance of senior executives, please refer to the Remuneration Report. The Remuneration Report is included in the Directors’ Report on pages 33 to 45.
The People Committee comprises Mr Ken Williams (Chairman), Mr Bruce Phillips, Mr Andy Hogendijk and Dr Vijoleta Braach-Maksvytis all of whom are non-executive and are considered to be independent at the date of this report.
Sustainability Committee The role of the Sustainability Committee is documented in a charter approved by the Board and is reviewed on at least an annual basis.
The Sustainability Committee’s role is to assist the Board in meeting its oversight responsibilities in relation to the health, safety, sustainability, integrity and community relations aspects of the Company’s operations.
The responsibilities of the Sustainability Committee are:
• Corporate Responsibility:
– Monitoring of compliance with and suggested changes to the Company’s policies and procedures in respect of responsible and ethical business dealings.
• Occupational Health and Safety (“OHS”)
– Review of the management of OHS risks and issues; and
– Monitoring of the Company’s OHS performance and compliance with the relevant OHS legislation.
• Sustainability
– Review of the management of environmental risks and issues;
– Monitoring of the Company’s environmental reporting requirements and processes and compliance with relevant legislation; and
– Review of and recommendation for approval of the annual Sustainability Report.
• Operational Risk
– In accordance with the Company’s Risk Policy, review of the management of the material operational risk factors associated with the Company’s equity/participatory interests in oil and gas exploration, development and production projects and operations; and
– In accordance with the Company’s Risk Policy, overseeing the appropriateness of risk mitigation measures identified for these material operational risks.
The Sustainability Committee will be comprised of not less than three non-executive directors, and whenever possible, the majority of members will have significant experience in oil and gas operations.
The members of the Sustainability Committee are Mr David McEvoy (Chairman), Mr Nick Jukes and Dr Vijoleta Braach-Maksvytis.
The number of Sustainability Committee meetings and the number of meetings attended by each of the members of the Sustainability Committee during the financial year and information regarding committee member experience and responsibilities are set out in the Directors’ Report.
CorPorAtE GoVErNANCE StAtEMENt
AWE LIMITED ANNUAL REPORT 2012 49

CorPorAtE GoVErNANCE StAtEMENt
ASx Principle 3 – Promote Ethical and responsible Decision-MakingCode of Conduct The goal of establishing AWE as a significant Australian-based petroleum exploration and production company is underpinned by its core values of honesty, integrity, common sense and respect for people. AWE desires to remain a good corporate citizen and appropriately balance, protect and preserve all stakeholders’ interests.
The Board has adopted a Code of Conduct for directors and employees of the Company. The Company’s goal of achieving above average wealth creation for our shareholders should be enhanced by complying with this Code of Conduct, which provides principles with which directors, key executives and employees should be familiar and with which they are expected to adhere and advocate. Further, a separate Code of Conduct – Foreign Jurisdictions Policy and a Business Conduct Policy have been adopted.
It is the responsibility of the Board to monitor the Company’s performance under these Codes and for their regular review.
Trading in Company Securities by Directors, Officers and EmployeesTrading of AWE’s shares is covered by, amongst other things, the Corporations Act and the ASX Listing Rules. The Board has established a Securities Trading Policy that establishes strict guidelines as to when a director, officer or an employee can deal in Company shares. The policy prohibits trading in the Company’s securities during designated blackout periods, particularly around quarterly, six monthly and annual results announcements and whilst the director, officer or employee is in the possession of price-sensitive information.
The policy also describes the Company’s policy in respect of equity-based remuneration, “hedge contracts”, speculative trading and margin lending. This policy is reviewed by the Board on an annual basis with any material changes being notified to ASX.
For details of shares held by directors and officers, please refer to the Directors’ Report and note 21 to the financial statements.
DiversityAWE believes that having a diverse, motivated and talented staff provide AWE with a competitive advantage in every country in which it conducts business. The Company believes that having the right person in the right position delivers job satisfaction and engagement for all staff and this, in turn, delivers enhanced corporate performance, reputation and shareholder value for the AWE group.
AWE and the Board are committed to diversity within a merit based culture for all employees and management.
A diversity policy has been in place since June 2011 and a copy of the policy is available on the Company’s website.
The following table shows the gender representation at various levels within AWE of its workforce as at 30 June 2012:
GENDEr rEPrESENtAtIoN oF AWE’S WorKForCE
No. MAlES % MAlES No. FEMAlES % FEMAlES
Non-Executive Directors 5 83% 1 17%Senior Executives¹ 4 80% 1 20%Senior Technical & Professional 24 83% 5 17%Technical & Professional 17 61% 11 39%Support Staff 10 30% 23 70%Total workforce 60 59% 41 41%
¹ Includes Managing Director
For the purposes of the above statistics AWE defines “workforce” as all full-time, part-time, casual and temporary employees and independent contractors.
During the financial year, there was an increase in the proportion of women across the organisation and female staff are represented at all levels within the Company.
AWE’s policy is to recruit and retain people on the basis of their ability and performance, regardless of factors such as gender, age, cultural, ethnic or religious background, nationality, physical ability or race.
AWE intends to meet its ongoing commitment to diversity by:
• Supporting professional development, life balance, promotion and remuneration equity at every stage from recruitment through career progression for all employees; and
• Maintaining a key focus on seeking and supporting, where possible, greater gender diversification in our workplace.
50 AWE LIMITED ANNUAL REPORT 2012

CorPorAtE GoVErNANCE StAtEMENt
The measurable objectives adopted by the Board for achieving gender diversity are outlined below:
oBJECtIVE ProGrESS / INItIAtIVES
Continue to increase the percentage of female directorship on the Board over the next three years.
A director appointed to the AWE Board in the 2011 financial year was female and female candidates will continue to be actively considered for any director vacancies that may arise.
A medium term goal (3-5 years) is to be equal to, or better than, AWE’s peer group with respect to its gender diversity mix across the organisation.
The Board has appointed a contact director to be the Board member responsible for liaising with management with respect to diversity matters.
Due to recent ASX requirements with respect to disclosure of gender diversity data, peer group data will now be readily available for comparative purposes and will be reported against in the June 2013 financial year.
Continue to increase the number of female senior managers within its organisation through appropriate succession planning and recruitment.
Female staff are now represented at all levels within the Company. A female Chief Financial Officer was appointed in the current period, becoming the first female member of the Company’s Senior Executive Committee.
Increase the number of female graduates joining the Company in the engineering and G & G disciplines.
To raise awareness of the industry AWE is the premier sponsor of UNSW Engineering Society and is the silver sponsor of the UNSW Geoscience Faculty 50% of under-graduate students that have worked at AWE on a casual basis in the past year have been female.
Maintain commitment to further education opportunities for employees, including women, in support of their career progression to more senior positions.
With a limited percentage of women practicing earth sciences and engineering, a key focus for AWE is to seek and support, where possible, greater gender diversification in our operations and management. AWE is currently sponsoring a female employee who first joined the Company as an office co-ordinator and after being promoted to Technical Assistant in the exploration group, is now undertaking a Masters Degree in Geoscience at Macquarie University.
It should be noted that diversity refers to other factors beyond gender and the Company is proud of its achievements in other areas of diversity. The Company’s Diversity Policy includes a commitment to recruit and retain people regardless of factors such as age, cultural, ethnic or religious background, gender, nationality, physical ability or race. Further information on the Company’s progress towards achieving an appropriate diversity mix will be provided in the Company’s Sustainability Report.
ASx Principle 4 – Safeguard Integrity in Financial reportingThe Board is committed to ensuring that the Company’s financial reports present a true and fair view of the Company’s financial position and comply with relevant accounting standards.
It is the responsibility of the Audit and Governance Committee to assist the Board in discharging its responsibilities for financial reporting and to ensure that appropriate internal controls are in place. For full details on the roles and responsibilities of the Audit and Governance Committee and the processes in place for safeguarding the integrity of the financial reporting processes please refer to commentary on the Audit and Governance Committee in Principle 2 above.
ASx Principle 5 – Make timely and Balanced DisclosureThe Board is committed to the promotion of investor confidence in the Company by ensuring that trading in the Company’s securities takes place in a fully informed and efficient market. The Company has in place policies and procedures that are designed to ensure compliance with ASX Listing Rule disclosure requirements and to ensure accountability at a senior executive level for that compliance. This disclosure policy includes processes for the identification of matters that may have a material effect on the price of the Company’s securities, notifying such matters to the ASX on a timely basis and posting these ASX releases immediately on the Company’s website.
Briefings with investors and analysts are held regularly and processes are in place to ensure that any price sensitive information included in such presentations is first made available to the market. The Company maintains a summary for internal use of issues discussed at briefings with investors and analysts, including a record of those present and the time and place of the meeting.
The Company had in place a formal Disclosure Policy which contains detailed processes for ensuring compliance with ASX continuous disclosure and periodic disclosure requirements. This policy is reviewed by the Board on an annual basis.
AWE LIMITED ANNUAL REPORT 2012 51

ASx Principle 6 – respect the rights of ShareholdersShareholder Communications The Board aims to ensure that shareholders and investors have equal access to the Company’s information.
The Company also has a strategy to promote effective communication with shareholders and encourage effective participation at general meetings through a policy of open disclosure to shareholders, regulatory authorities and the broader community of all material information with respect to the Company’s affairs including, but not limited to:
• conflicts of interest and related party transactions;
• executive remuneration;
• grant of options and share rights;
• external directorships;
• process for performance evaluation of the Board, its committees, and senior executives;
• the link between remuneration paid to the Managing Director and senior executives and corporate performance; and
• shorter, more comprehensible notices of meetings.
The following information is communicated to shareholders:
• the Annual Report and notices of meetings of shareholders including the ability to lodge proxy votes electronically;
• for those shareholders not electing to be mailed a copy of the Annual Report, a copy can be viewed on the Company’s website;
• all documents that are released to the ASX are made immediately available on the Company’s website and via the website, shareholders may elect to receive notification of all ASX releases;
• the Company webcasts key events such as profit results and Annual General Meetings;
• all relevant shareholder information is made available on the Company’s website including past ASX releases, annual reports, quarterly reports, investor presentations and information on the Company’s operational activities; and
• all operational information on the Company’s website is updated at least quarterly.
Further, all the material policies adopted by the Company are available in the Corporate Governance section of the Company’s website.
ASx Principle 7 – recognise and Manage riskRisk ManagementAWE recognises the need to proactively manage the risks and opportunities associated with both day-to-day operations of the organisation and its longer term strategic objectives. AWE seeks to ensure the following through its risk management framework:
• Risks are well understood and managed proactively by those in the organisation best able to deal with them.
• Staff are actively involved in risk management activities. Time is taken to discuss and explore risk issues with colleagues that may not otherwise be addressed as part of day-to-day management.
• Risk reporting provides insight, accountability and a trigger for escalation of significant risk issues.
• Consistent use of language and risk scales across the organisation enables prioritisation and comparison of risks arising from different functional areas.
• The organisation constantly strives to achieve effective risk management practices through adherence to risk management standards, while retaining an adaptive approach that evolves to meet the needs of the organisation.
While every person in the organisation has responsibility for managing risk effectively, there are specific responsibilities for providing oversight to ensure that risks are being managed appropriately:
• The Board and delegated Board committees are responsible for oversight of risk management activities within AWE. On an annual basis the Board also undertake a full review of the material business risks facing the organisation.
• The AWE Senior Executive Committee is responsible for reviewing summarised risk registers and preparing consolidated risk reports of significant risk issues arising for inclusion in papers submitted to the Board and relevant Board Committees.
• AWE management is responsible for ensuring that each functional area they oversee has identified, assessed and are proactively managing risks appropriately. Each functional area must maintain a live risk register for documenting the results of this risk management process.
CorPorAtE GoVErNANCE StAtEMENt
52 AWE LIMITED ANNUAL REPORT 2012

The Board has identified the following major sources of material business risks for the organisation:
rISK CAtEGory oVErSEEN By tyPES oF IMPACt
Strategic AWE Board Financial
Reputational
operational Sustainability Committee Safety
Environmental
Financial
Reputational
Corporate and Governance Audit and Governance Committee Financial
Reputational
External Board oversight but generally assumed shareholders accept these risks Financial
The organisation’s approach to risk management aligns with the Australian/New Zealand Standard for Risk Management (AS/NZS 4360). For more information on how the Company implements risk management, please refer to the Risk Policy which can be found on AWE’s website.
The Managing Director and the Chief Financial Officer have declared in writing to the Board that the financial reporting risk management and associated compliance and controls have been assessed and found to be operating effectively in all material respects in relation to financial reporting risks and such other risks as specified by the Board. This representation is made by the Managing Director and Chief Financial Officer prior to the directors’ approval of the release of the annual and six-monthly accounts. This representation is made after enquiry of, and representation by, appropriate levels of management.
Sustainability and EnvironmentThe Board and management are committed to developing and building a sustainable business, ensuring that the Company is an active and responsible member of the communities in which we operate. Our employees and contractors are encouraged to personally support and implement the sustainability initiatives being pursued by the Company and to contribute to identifying opportunities to further improve our performance.
The Company’s commitment to sustainability is more fully detailed in the 2012 Sustainability Report.
Reserves ReportingDuring the June 2012 financial year the Company formed a Reserves Committee reporting to the Managing Director with the role of monitoring:
• The integrity of the reporting of the Company’s oil and gas reserves (“reserves”);
• Compliance by the Company with legal and regulatory requirements with respect to reserves;
• The discharge of the Company’s responsibilities with respect to annual and interim reviews of the Company’s reserves; and
• The Company’s procedures with respect to the engagement of independent reserves evaluators.
ASx Principle 8 – remunerate Fairly and responsiblyThe Company is committed to adopting remuneration practices that:
• Align the interests of employees and shareholders;
• Attract and retain suitably qualified employees; and
• Motivate employees to achieve superior performance.
It is the responsibility of the People Committee to assist the Board in achieving these objectives. For full details on the roles and responsibilities of the People Committee and the Company’s remuneration practices please refer to the commentary on the People Committee in Principle 2 above and to the Company’s Remuneration Report.
CorPorAtE GoVErNANCE StAtEMENt
AWE LIMITED ANNUAL REPORT 2012 53

CorPorAtE GoVErNANCE StAtEMENt
ASx CorPorAtE GoVErNANCE PrINCIPlES AND rECoMMENDAtIoNSThe table below identifies the Corporate Governance Principles and Recommendations (2nd Edition) and whether or not the Company has complied with the recommendations during the reporting period:
CoMPlIED NotE
1.1 Establish the functions reserved to the Board and those delegated to senior management and disclose those functions 1.2 Disclose the process for evaluating the performance of senior executives 1.3 Provide the information indicated in Guide to Reporting on Principle 1 2.1 A majority of the Board should be independent directors 2.2 The chair should be an independent director 2.3 The roles of chair and chief executive officer should not be exercised by the same individual 2.4 The Board should establish a nomination committee 12.5 Disclose the process for evaluating the performance of the Board, its committees and individual directors 2.6 Provide the information indicated in Guide to Reporting on Principle 23.1 Establish a code of conduct and disclose the code or a summary of the code as to:
• the practices necessary to maintain confidence in the Company’s integrity• the practices necessary to take into account their legal obligations and the reasonable expectations of their stakeholders• the responsibility and accountability of individuals for reporting and investigating reports of unethical practices
3.2 Establish a policy concerning diversity and disclose or a summary of that policy which should include requirements for the Board to establish measurable objectives for achieving gender diversity for the Board to assess annually both the objectives and progress in achieving them
3.3 Disclose in each annual report the measurable objectives for achieving gender diversity set by the Board in accordance with the diversity policy and progress towards achieving them
3.4 Disclose in each annual report the proportion of women employees in the whole organisation, in senior executive positions and on the Board
3.5 Provide the information indicated in Guide to Reporting on Principle 3 4.1 The Board should establish an audit committee 4.2 Structure the audit committee so that it consists of:
• only non-executive directors• a majority of independent directors• an independent chair, who is not chair of the Board• at least three members
4.3 The audit committee should have a formal charter 4.4 Provide the information indicated in Guide to Reporting on Principle 4 5.1 Establish written policies designed to ensure compliance with ASX Listing Rule disclosure requirements and to ensure
accountability at a senior executive level for that compliance and disclose those policies or a summary of those policies
5.2 Provide the information indicated in Guide to Reporting on Principle 5 6.1 Design a communications policy for promoting effective communication with shareholders and encouraging their
participation at general meetings and disclose their policy or a summary of that policy
6.2 Provide the information indicated in Guide to Reporting on Principle 6 7.1 Companies should establish policies for the oversight and management of material business risks and disclose a
summary of those policies
7.2 The Board should require management to design and implement the risk management and internal control system to manage the company’s material business risks and report to it on whether those risks are being managed effectively. The Board should disclose that management has reported to it as to the effectiveness of the company’s management of its material business risks
7.3 The Board should disclose whether it has received assurance from the chief executive officer (or equivalent) and the chief financial officer (or equivalent) that the declaration provided in accordance with section 295A of the Corporations Act is founded on a sound system of risk management and internal control and that the system is operating effectively in relation to financial reporting risks
7.4 Provide the information indicated in Guide to Reporting on Principle 7 8.1 The Board should establish a remuneration committee 8.2 The remuneration committee should be structured so that it:
• consists of a majority of independent directors• is chaired by an independent chair• has at least three members
8.3 Clearly distinguish the structure of non-executive directors’ remuneration from that of executive directors and senior executives 8.4 Provide the information indicated in Guide to Reporting on Principle 8
(1) The Board of Directors of the Company does not have a nomination committee. The Board is of the opinion that due to the relatively small size of the Company’s Board, the specialised nature of the upstream oil and gas industry and the limited number of suitably qualified candidates available to fill Board positions, it is appropriate that the functions performed by a nomination committee be handled by the full Board.
54 AWE LIMITED ANNUAL REPORT 2012

Consolidated Income Statement 56 Consolidated Statement of Comprehensive Income 57 Consolidated Statement of Financial Position 58 Consolidated Statement of Cash Flows 59 Consolidated Statement of Changes In Equity 60 Notes to the Consolidated Financial Statements
1. Statement of significant accounting policies 612. Revenue 703. Cost of sales 704. Other income 705. Other expenses 706. Net financing (expense)/income 707. Taxation expense 718. Earnings per share 729. Auditors’ remuneration 72
10. Segment reporting 7311. Cash and cash equivalents 7412. Trade and other receivables 7413. Inventories 7514. Investments 7515. Exploration and evaluation assets 7516. Oil and gas assets 7617. Other plant and equipment 7718. Intangible assets 7719. Trade and other payables 7820. Interest-bearing liabilities 7821. Employee benefits 7922. Provisions 8323. Taxation payable 8324. Deferred tax assets and liabilities 8425. Capital and reserves 8526. Interests in oil and gas permits 8627. Capital and other commitments 8728. Contingencies 8929. Reconciliation of cash flows from operating activities 8930. Controlled entities 9031. Financial risk management 9132. Related party disclosures 9533. Parent entity disclosures 9834. Deed of cross guarantee 9935. Events subsequent to balance date 99
Directors’ Declaration 100 Independent Auditors Report 101 Stock Exchange and Shareholder Information 102
ANNUAl FINANCIAl StAtEMENtS CONTENTS
These financial statements are for the consolidated entity consisting of AWE Limited and its subsidiaries. The financial statements are presented in the Australian currency.
AWE Limited is a company limited by shares, incorporated and domiciled in Australia. Its registered office and principal place of business is:
Level 16, 40 Mount Street North Sydney NSW 2060 Australia
A description of the nature of the consolidated entity’s operations and its principal activities is included in the review of operations and activities in the Directors’ Report on pages 24 to 31, which is not part of these financial statements.
The financial statements were authorised for issue by the directors on 27 August 2012.
We have ensured that our corporate reporting is timely and complete through posting all press releases, financial reports and other information are available at our Investors’ Centre on our website: www.awexplore.com
AWE LIMITED ANNUAL REPORT 2012 55

CoNSolIDAtED INCoME StAtEMENt FOR THE YEAR ENDED 30 JUNE 2012
NotE2012
$’0002011
$’000
Revenue 2 299,727 306,071
Cost of sales 3 (190,232) (235,616)
Gross profit 109,495 70,455
Other income 4 18,077 1,527
Administration expenses (10,227) (16,243)
Exploration and evaluation expenses 15 (36,477) (63,289)
Impairment of exploration and evaluation assets 15 – (101,324)
Impairment of oil and gas assets 16 (138,151) (35,686)
Other expenses 5 (1,571) (2,460)
Operating loss before financing activities (58,854) (147,020)
Financial income 4,283 1,673
Financial expenses (8,565) (15,188)
Net financing expense 6 (4,282) (13,515)
Loss before taxation (63,136) (160,535)
Taxation (expense)/benefit 7 (3,360) 42,980
Loss for the year (66,496) (117,555)
Loss attributable to:
Owners of the Company (66,496) (117,555)
Loss for the year (66,496) (117,555)
Basic and diluted earnings per ordinary share (cents) 8 (12.74) (22.53)
The above Consolidated Income Statement is to be read in conjunction with the notes to the financial statements.
56 AWE LIMITED ANNUAL REPORT 2012

CoNSolIDAtED StAtEMENt oF CoMPrEHENSIVE INCoME FOR THE YEAR ENDED 30 JUNE 2012
2012$’000
2011$’000
loss for the year (66,496) (117,555)
other comprehensive income
Foreign currency translation differences for foreign operations 5,333 (11,624)
Net change in fair value of available-for-sale financial assets 2,511 6,774
Net change in fair value of available-for-sale financial assets transferred to profit or loss (13,602) (1,854)
Income tax relating to other components of comprehensive income 873 428
other comprehensive loss for the year (net of income tax) (4,885) (6,276)
total comprehensive loss for the year (net of income tax) (71,381) (123,831)
Total comprehensive loss attributable to owners of the company (71,381) (123,831)
Total comprehensive loss for the year (71,381) (123,831)
The above Consolidated Statement of Comprehensive Income is to be read in conjunction with the notes to the financial statements.
AWE LIMITED ANNUAL REPORT 2012 57

CoNSolIDAtED StAtEMENt oF FINANCIAl PoSItIoN AS AT 30 JUNE 2012
NotE2012
$’0002011
$’000
Current assets
Cash and cash equivalents 11 42,759 117,168
Trade and other receivables 12 42,415 33,762
Taxation receivable 23 – 794
Inventory 13 7,616 12,973
Available for sale financial assets 14 – 15,927
total current assets 92,790 180,624
Non-current assets
Trade and other receivables 12 3,197 –
Exploration and evaluation assets 15 84,154 82,516
Oil and gas assets 16 847,026 843,729
Other property, plant and equipment 17 1,887 2,136
Intangible assets 18 133 1,085
Deferred tax assets 24 32,821 5,308
total non-current assets 969,218 934,774
total assets 1,062,008 1,115,398
Current liabilities
Trade and other payables 19 60,762 49,887
Employee benefits 21 1,146 1,221
Provisions 22 8,921 7,272
Taxation payable 23 17,746 6,170
total current liabilities 88,575 64,550
Non-current liabilities
Interest bearing liabilities 20 12,877 –
Employee benefits 21 536 743
Provisions 22 104,998 99,179
total non-current liabilities 118,411 99,922
total liabilities 206,986 164,472
Net assets 855,022 950,926
Equity
Issued capital 25 772,172 772,172
Reserves 8,933 12,247
Retained earnings 73,917 166,507
total equity 855,022 950,926
The above Consolidated Statement of Financial Position is to be read in conjunction with the notes to the financial statements.
58 AWE LIMITED ANNUAL REPORT 2012

CoNSolIDAtED StAtEMENt oF CASH FloWS FOR THE YEAR ENDED 30 JUNE 2012
NotE2012
$’0002011
$’000
Cash flows from operating activities
Cash receipts in the course of operations 310,721 343,792
Cash payments in the course of operations (141,419) (161,192)
Payments for exploration and evaluation expenses (24,576) (21,322)
Payments for merger and acquisition transaction costs – (1,710)
Interest received 3,688 1,680
Borrowing costs paid (6,824) (2,886)
Income tax refunded – Australia – 1,072
Tax refunded – Australian Petroleum Resource Rent Tax – 639
Income tax paid – New Zealand (6,903) (212)
Tax paid – New Zealand Accounting Profits Royalty (10,819) (20,008)
Net cash provided by operating activities 29 123,868 139,853
Cash flows from investing activities
Acquisition of Adelphi Energy Limited (net of cash acquired) – (32,221)
Acquisition of assets inclusive of debt assumed for North West Natuna (135,157) –
Payments for:
Exploration and evaluation assets initially capitalised (8,237) (48,091)
Oil and gas assets (152,442) (79,725)
Other plant and equipment and intangibles (515) (820)
Proceeds from sale of plant and equipment 91,866 –
Proceeds from sale of available-for-sale financial assets 16,930 3,111
Net cash used in investing activities (187,555) (157,746)
Cash flows from financing activities
Proceeds from borrowings 57,722 –
Repayment of borrowings (42,139) –
Dividends paid 25 (26,094) –
(Payments)/release of security deposits (4,876) 9,645
Net cash (used in) / provided by financing activities (15,387) 9,645
Net decrease in cash held (79,074) (8,248)
Cash at the beginning of the financial year 117,168 135,331
Effect of exchange rate fluctuations on the balances of cash held in foreign currencies 31 4,665 (9,915)
Cash at the end of the financial year 11 42,759 117,168
The above Consolidated Statement of Cash Flows is to be read in conjunction with the notes to the financial statements.
AWE LIMITED ANNUAL REPORT 2012 59

CoNSolIDAtED StAtEMENt oF CHANGES IN EQUIty FOR THE YEAR ENDED 30 JUNE 2012
CoNSolIDAtED
SHArE CAPItAl
$’000
EQUItyCoMPENSAtIoN
rESErVE$’000
trANSlAtIoNrESErVE
$’000
FAIr VAlUErESErVE
$’000
rEtAINEDEArNINGS
$’000totAl EQUIty
$’000
Balance at 1 July 2010 772,172 7,558 4,057 4,870 284,062 1,072,719
loss for the year (117,555) (117,555)Other comprehensive incomeForeign currency translation differences for foreign operations – – (11,624) – – (11,624)Net change in available-for-sale financial assets – – – 6,774 – 6,774Net change in available-for-sale financial assets transferred to profit or loss – – – (1,426) – (1,426)
total other comprehensive income – – (11,624) 5,348 – (6,276)
total comprehensive income for the year – – (11,624) 5,348 (117,555) (123,831)Transactions with owners recorded directly in equityContributions by and distributions to owners: Share Option Plan – 357 – – – 357 Share Rights Plan – 1,681 – – – 1,681
Balance at 30 June 2011 772,172 9,596 (7,567) 10,218 166,507 950,926
loss for the year – – – – (66,496) (66,496)
Other comprehensive incomeForeign currency translation differences for foreign operations – – 5,333 – – 5,333
Net change in available-for-sale financial assets – – – 2,511 – 2,511
Net change in available-for-sale financial assets transferred to profit or loss – – – (12,729) – (12,729)
total other comprehensive income – – 5,333 (10,218) – (4,885)
total comprehensive income for the year – – 5,333 (10,218) (66,496) (71,381)
Transactions with owners recorded directly in equity
Dividends provided for or paid – – – – (26,094) (26,094)
Contributions by and distributions to owners:
Share Option Plan – 29 – – – 29
Share Rights Plan – 1,542 – – – 1,542
Balance at 30 June 2012 772,172 11,167 (2,234) – 73,917 855,022
The above Consolidated Statement of Changes in Equity is to be read in conjunction with the notes to the financial statements.
60 AWE LIMITED ANNUAL REPORT 2012

NotES to tHE FINANCIAl StAtEMENtS FOR THE YEAR ENDED 30 JUNE 2012
1. Statement of significant accounting policies AWE Limited (the “Company”) is a company domiciled in Australia. The consolidated financial statements of the Company for the
financial year ended 30 June 2012 comprises the Company and its controlled entities (together referred to as the “consolidated entity”).
(a) Basis of preparation (i) Statement of compliance The consolidated financial statements are general purpose financial statements which have been prepared in accordance with
Australian Accounting Standards (“AASBs”) (including Australian Interpretations) adopted by the Australian Accounting Standards Board (“AASB”) and the Corporations Act 2001. The consolidated financial statements also comply with International Financial Reporting Standards (IFRSs) and interpretations issued but not yet adopted by the International Accounting Standards Board.
The accounting policies set out in Note 1 have been applied consistently to all periods presented in these consolidated financial statements. Certain comparative amounts have been reclassified to conform with the current year’s presentation.
The consolidated financial statements were authorised for issue by the directors on 27 August 2012.
(ii) Functional and presentation currency The financial statements are presented in Australian Dollars, which is the Company’s functional currency and the functional currency
of the majority of controlled entities within the consolidated entity.
The Company is of a kind referred to in Class Order 98/100, issued by the Australian Securities and Investments Commission (“ASIC”), relating to the “rounding off” of amounts in the financial statements. Amounts in the financial statements have been rounded off in accordance with that Class Order to the nearest thousand dollars, or in certain cases, the nearest dollar.
(iii) Basis of measurement The financial statements are prepared on the historical cost basis except that derivative financial instruments and available for sale
financial assets are stated at their fair value.
(iv) Uses of estimates and judgements The preparation of financial statements in conformity with Australian Accounting Standards requires management to make
judgements, estimates and assumptions that affect the application of policies and reported amounts of assets and liabilities, income and expenses. The estimates and associated assumptions are based on historical experience and various other factors that are believed to be reasonable under the circumstances, the results of which form the basis of making the judgements about carrying values of assets and liabilities that are not readily apparent from other sources. Actual results may differ from these estimates.
The estimates and underlying assumptions are reviewed on an ongoing basis. Revisions to accounting estimates are recognised in the period in which the estimate is revised if the revision affects only that period, or in the period of the revision and future periods if the revision affects both current and future periods.
The most significant estimates and assumptions that have a significant risk of causing a material adjustment to the carrying amounts of assets and liabilities within the next financial year relate to:
Exploration and evaluation assets The consolidated entity’s accounting policy for exploration and evaluation expenditure is set out at Note 1 (k). The application of
this policy necessarily requires management to make certain estimates and assumptions as to future events and circumstances, in particular, the assessment of whether economic quantities of reserves have been found. Any such estimates and assumptions may change as new information becomes available. If, after having capitalised expenditure under this policy, management concludes that the capitalised expenditure is unlikely to be recovered by future exploitation or sale, then the relevant capitalised amount will be written off to the income statement. Changes in assumptions may result in a material adjustment to the carrying amount of exploration and evaluation assets.
Restoration obligations The consolidated entity estimates the future removal costs of production facilities and wells at the time of installation of the assets. In
most instances, removal of assets occurs many years into the future. This requires judgemental assumptions regarding removal date, future environmental legislation, the extent of reclamation activities required, the engineering methodology for estimating cost, future removal technologies in determining the removal cost, and asset specific discount rates to determine the present value of these cash flows. The consolidated entity’s accounting policy for restoration obligations is set out at Note 1(q).
Reserve estimates Estimates of recoverable quantities of proven and probable reserves reported include assumptions regarding commodity prices,
exchange rates, discount rates, production and transportation costs for future cash flows. It also requires interpretation of complex and difficult geological and geophysical models in order to make an assessment of the size, shape, depth and quality of reservoirs and their anticipated recoveries. The economic, geological and technical factors used to estimate reserves may change from period to period. Changes in reported reserves can impact asset carrying values, the provision for restoration and the recognition of deferred tax assets, due to changes in expected future cash flows. Reserves are integral to the amount of depreciation and amortisation charged to the income statement.
Impairment of oil and gas assets The consolidated entity assesses whether oil and gas assets are impaired when preparing its annual and interim financial statements.
Estimates of the recoverable amount of oil and gas assets are made based on the present value of future cash flows.
AWE LIMITED ANNUAL REPORT 2012 61

NotES to tHE FINANCIAl StAtEMENtS FOR THE YEAR ENDED 30 JUNE 2012
Income taxes The consolidated entity is subject to income taxes in Australia and jurisdictions where it has foreign operations. Significant judgement
is required in determining the worldwide provision for income taxes. There are certain transactions and calculations undertaken during the ordinary course of business for which the ultimate tax determination is uncertain. The consolidated entity estimates its tax liabilities based on the consolidated entity’s understanding of the tax law. Where the final tax outcome of these matters is different from the amounts that were initially recorded, such differences will impact the current and deferred income tax assets and liabilities in the period in which such determination is made.
Share-based payment transactions The consolidated entity measures the cost of equity-settled transactions with employees by reference to the fair value of the equity
investments at the date on which they are granted.
Australian Government’s carbon pricing mechanism The Australian Government’s Clean Energy Act (CEA) was enacted during the period leading to a potential obligation, from the 2013
financial year, to acquire and surrender eligible emission units in respect of the covered emissions from operated and non-operated facilities under AWE’s existing joint venture arrangements (or be liable to unit shortfall charges). The expected cash flows arising from any liability arising under the CEA have been included in the estimated recoverable amount for assets when assessing their carrying values; however the impact on the recoverable amount is not expected to be material.
Australian Government’s proposed expanded Petroleum Resource Rent Tax (“PRRT”) The Australian Government has enacted legislation during the period to extend the PRRT regime to all onshore oil and gas projects,
applying from 1 July 2012. PRRT will be applied to onshore and offshore oil and gas projects at a rate of 40%. State petroleum royalties will continue to apply to projects within state jurisdictions; however these royalties will be fully creditable against PRRT liabilities. The extended PRRT will apply to AWE’s onshore Perth basin operations, however it is not expected to have a material impact on the recoverability of the carrying amount of assets as at 30 June 2012.
Disclosures in relation to PRRT for the year ended 30 June 2012 in the consolidated financial statements are in relation to both onshore and offshore oil and gas projects.
(b) Basis of consolidation (i) Controlled entities Controlled entities are entities controlled by the Company. Control exists when the Company has the power, directly or indirectly, to
govern the financial and operating policies of an entity so as to obtain benefits from its activities. In assessing control, potential voting rights that presently are exercisable or convertible are taken into account. The financial statements of controlled entities are included in the consolidated financial statements from the date that control commences until the date that control ceases.
Non-controlling interests in the results and equity of subsidiaries are shown separately in the consolidated income statement, statement of comprehensive income, statement of changes in equity and statement of financial position respectively.
(ii) Jointly controlled operations and assets The interests of the Company and of the consolidated entity in unincorporated joint ventures and jointly controlled assets are brought
to account by recognising in the financial statements the proportionate share of the assets they control, the liabilities and expenses they incur, and their share of the income that they earn from the sale of goods or services by the joint venture.
(iii) Transactions eliminated on consolidation Intragroup balances and any unrealised gains and losses or income and expenses arising from intragroup transactions, are eliminated
in preparing the consolidated financial statements.
(iv) Changes in ownership interests The consolidated entity treats transactions with non-controlling interests that do not result in a loss of control as transactions with
equity owners of the consolidated entity. A change in ownership interest results in an adjustment between the carrying amounts of the controlling and non-controlling interests to reflect their relative interests in the subsidiary. Any difference between the amount of the adjustment to non-controlling interests and any consideration paid or received is recognised in a separate reserve within equity attributable to owners of AWE Limited.
When the consolidated entity ceases to have control, joint control or significant influence, any retained interest in the entity is remeasured to its fair value with the change in carrying amount recognised in profit or loss. The fair value is the initial carrying amount for the purposes of subsequently accounting for the retained interest as an associate, jointly controlled entity or financial asset. In addition, any amounts previously recognised in other comprehensive income in respect of that entity are accounted for as if the consolidated entity had directly disposed of the related assets or liabilities. This may mean that amounts previously recognised in other comprehensive income are reclassified to profit or loss.
If the ownership interest in a jointly-controlled entity or an associate is reduced but joint control or significant influence is retained, only a proportionate share of the amounts previously recognised in other comprehensive income is reclassified to profit or loss where appropriate.
1. Statement of significant accounting policies (continued)
62 AWE LIMITED ANNUAL REPORT 2012

NotES to tHE FINANCIAl StAtEMENtS FOR THE YEAR ENDED 30 JUNE 2012
(c) Business combinations The acquisition method of accounting is used to account for all business combinations, including business combinations involving
entities or businesses under common control, regardless of whether equity instruments or other assets are acquired. The consideration transferred for the acquisition of a subsidiary comprises the fair values of the assets transferred, the liabilities incurred and the equity interests issued by the consolidated entity. The consideration transferred also includes the fair value of any contingent consideration arrangement and the fair value of any pre-existing equity interest in the subsidiary. Acquisition-related costs are expensed as incurred. Identifiable assets acquired and liabilities and contingent liabilities assumed in a business combination are, with limited exceptions, measured initially at their fair values at the acquisition date. On an acquisition-by-acquisition basis, the consolidated entity recognises any non-controlling interest in the acquiree either at fair value or at the non-controlling interest’s proportionate share of the acquiree’s net identifiable assets.
The excess of total consideration transferred over the fair value of the consolidated entity’s share of the net identifiable assets acquired is recorded as goodwill. If those amounts are less than the fair value of the net identifiable assets of the subsidiary acquired and the measurement of all amounts has been reviewed, the difference is recognised directly in profit or loss. Where settlement of any part of cash consideration is deferred, the amounts payable in the future are discounted to their present value as at the date of exchange. The discount rate used is the entity’s incremental borrowing rate, being the rate at which a similar borrowing could be obtained from an independent financier under comparable terms and conditions.
Contingent consideration is classified either as equity or a financial liability. Amounts classified as a financial liability are subsequently remeasured to fair value with changes in fair value recognised in profit or loss.
(d) Foreign currency (i) Foreign currency transactions Transactions in foreign currencies are translated at the foreign exchange rate ruling at the date of the transaction. Monetary assets
and liabilities denominated in foreign currencies at the end of the reporting period are translated at the foreign exchange rate ruling at that date. Foreign exchange differences arising on translation are recognised in the income statement. Non-monetary assets and liabilities that are measured in terms of historical cost in a foreign currency are translated using the exchange rate at the date of the transaction. Non-monetary assets and liabilities denominated in foreign currencies that are stated at fair value are translated at foreign exchange rates ruling at the dates the fair value was determined.
(ii) Financial statements of foreign operations The assets and liabilities of foreign operations, including goodwill and fair value adjustments arising on consolidation, are translated
to Australian dollars at foreign exchange rates ruling at the end of the reporting period. The revenues and expenses of foreign operations are translated to Australian dollars at rates approximating the foreign exchange rates ruling at the dates of the transactions. Foreign exchange differences arising on retranslation are recognised directly in a separate component of equity.
(iii) Presentation of foreign exchange gains and losses in the income statement The consolidated entity presents its foreign exchange gains and losses within net financing income/expense in the income statement.
(e) Impairment The carrying amounts of the Company’s and the consolidated entity’s assets, other than inventories (refer note 1(h)) and deferred tax
assets (refer note 1(t)), are reviewed at the end of the reporting period to determine whether there is any indication of impairment. If any such indication exists, the asset’s recoverable amount is estimated.
An impairment loss is recognised whenever the carrying amount of an asset or its cash-generating unit exceeds its recoverable amount.
Calculation of recoverable amount The recoverable amount of an asset is the greater of its fair value less cost to sell and value in use. In assessing value in use, the
estimated future cash flows are discounted to their present value using a post-tax discount rate that reflects current market assessments of the time value of money and the risks specific to the asset. For an asset that does not generate largely independent cash inflows, the recoverable amount is determined for the cash-generating unit to which the asset belongs.
Reversals of impairment An impairment loss is reversed if there has been a change in the estimates used to determine the recoverable amount.
An impairment loss is reversed only to the extent that the asset’s carrying amount does not exceed the carrying amount that would have been determined, net of depreciation or amortisation, if no impairment loss had been recognised.
(f) Cash and cash equivalents Cash and cash equivalents comprise cash balances and call deposits. Bank overdrafts that are repayable on demand and form an integral
part of the consolidated entity’s cash management are included as a component of cash and cash equivalents for the purpose of the statement of cash flows.
(g) trade and other receivables Trade receivables are recognised initially at fair value and subsequently measured at amortised cost using the effective interest method,
less provision for impairment. Trade receivables are generally due for settlement between 14 and 30 days.
1. Statement of significant accounting policies (continued)
AWE LIMITED ANNUAL REPORT 2012 63

NotES to tHE FINANCIAl StAtEMENtS FOR THE YEAR ENDED 30 JUNE 2012
Collectability of trade receivables is reviewed on an ongoing basis. Debts which are known to be uncollectable are written off by reducing the carrying amount directly. An allowance account (provision for impairment of trade receivables) is used when there is objective evidence that the consolidated entity will not be able to collect all amounts due according to the original terms of the receivables. Significant financial difficulties of the debtor, probability that the debtor will enter bankruptcy or financial reorganisation, and default or delinquency in payments are considered indicators that the trade receivable is impaired. The amount of the impairment allowance is the difference between the asset’s carrying amount and the present value of estimated future cash flows, discounted at the original effective interest rate. Cash flows relating to short-term receivables are not discounted if the effect of discounting is immaterial.
The amount of the impairment loss is recognised in profit or loss within other expenses. When a trade receivable for which an impairment allowance had been recognised becomes uncollectable in a subsequent period, it is written off against the allowance account. Subsequent recoveries of amounts previously written off are credited against other expenses in profit or loss.
(h) Inventory Oil inventory is recorded at the lower of cost and net realisable value. Cost is determined on an average basis and includes production
costs and amortisation of producing oil and gas assets.
Other inventories are recorded at the lower of cost and net realisable value. The cost of inventories is based on the first-in first-out principle and includes expenditure incurred in acquiring the inventories and bringing them to their existing location and condition.
(i) Investments and other financial assets Classification The consolidated entity classifies its financial assets in the following categories: financial assets at fair value through profit or loss, loans
and receivables, held-to-maturity investments and available-for-sale financial assets. The classification depends on the purpose for which the investments were acquired. Management determines the classification of its investments at initial recognition and, in the case of assets classified as held-to-maturity, re-evaluates this designation at the end of each reporting period.
(i) Financial assets at fair value through profit or loss A financial asset is classified as fair value through profit or loss if it is classified as held for trading or is designated as such upon initial
recognition. A financial asset is classified in this category if acquired principally for the purpose of selling in the short-term. Derivatives are classified as held for trading unless they are designated as hedges. Assets in this category are classified as current assets.
(ii) Loans and receivables Loans and receivables are non-derivative financial assets with fixed or determinable payments that are not quoted in an active market.
They are included in current assets, except for those with maturities greater than 12 months after the reporting period which are classified as non-current assets. Loans and receivables are included in trade and other receivables (note 12) in the statement of financial position.
(iii) Held-to-maturity investments Held-to-maturity investments are non-derivative financial assets with fixed or determinable payments and fixed maturities that the
consolidated entity’s management has the positive intention and ability to hold to maturity. If the consolidated entity were to sell other than an insignificant amount of held-to-maturity financial assets, the whole category would be tainted and reclassified as available-for-sale. Held-to-maturity financial assets are included in non-current assets, except for those with maturities less than 12 months from the end of the reporting period, which are classified as current assets.
(iv) Available-for-sale financial assets Available-for-sale financial assets, comprising principally marketable equity securities, are non-derivatives that are either designated in
this category or not classified in any of the other categories. They are included in non-current assets unless the investment matures or management intends to dispose of the investment within 12 months of the end of the reporting period. Investments are designated as available-for-sale if they do not have fixed maturities and fixed or determinable payments and management intends to hold them for the medium to long-term.
Subsequent measurement Loans and receivables and held-to-maturity investments are carried at amortised cost using the effective interest method.
Available-for-sale financial assets and financial assets at fair value through profit or loss are subsequently carried at fair value.
Gains or losses arising from changes in the fair value of the “financial assets at fair value through profit or loss” category are presented in profit or loss within other income or other expenses in the period in which they arise. Dividend income from financial assets at fair value through profit or loss is recognised in profit or loss as part of revenue from continuing operations when the consolidated entity’s right to receive payments is established.
Changes in the fair value of monetary securities denominated in a foreign currency and classified as available-for-sale are analysed between translation differences resulting from changes in amortised cost of the security and other changes in the carrying amount of the security. The translation differences related to changes in the amortised cost are recognised in profit or loss, and other changes in carrying amount are recognised in other comprehensive income. Changes in the fair value of other monetary and non-monetary securities classified as available-for-sale are recognised in other comprehensive income.
1. Statement of significant accounting policies (continued)
64 AWE LIMITED ANNUAL REPORT 2012

NotES to tHE FINANCIAl StAtEMENtS FOR THE YEAR ENDED 30 JUNE 2012
When securities classified as available-for-sale are sold, the accumulated fair value adjustments recognised in other comprehensive income are reclassified to profit or loss as gains and losses from investment securities.
Details on how the fair value of financial instruments is determined are disclosed in note 31.
Impairment The consolidated entity assesses at the end of each reporting period whether there is objective evidence that a financial asset is
impaired. In the case of equity securities classified as available-for-sale, a significant or prolonged decline in the fair value of a security below its cost is considered as an indicator that the securities are impaired. If any such evidence exists for available-for-sale financial assets, the cumulative loss – measured as the difference between the acquisition cost and the current fair value, less any impairment loss on that financial asset previously recognised in profit or loss – is reclassified from equity and recognised in profit or loss as a reclassification adjustment. Impairment losses recognised in profit or loss on equity instruments classified as available-for-sale are not reversed through profit or loss.
If there is evidence of impairment for any of the consolidated entity’s financial assets carried at amortised cost, the loss is measured as the difference between the asset’s carrying amount and the present value of estimated future cash flows, excluding future credit losses that have not been incurred. The cash flows are discounted at the financial asset’s original effective interest rate. The loss is recognised in profit or loss.
(j) Property, plant and equipment (i) Oil and gas assets The cost of oil and gas producing assets and capitalised expenditure on oil and gas assets under development are accounted for
separately and are stated at cost less accumulated depreciation and impairment losses. Costs include expenditure that is directly attributable to the acquisition or construction of the item as well as past exploration and evaluation costs. In addition, costs include, (i) the initial estimate at the time of installation and during the period of use, when relevant, of the costs of dismantling and removing the items and restoring the site on which they are located, and (ii) changes in the measurement of existing liabilities recognised for these costs resulting from changes in the timing or outflow of resources required to settle the obligation or from changes in the discount rate.
When an oil and gas asset commences production, costs carried forward will be amortised on a units of production basis over the life of the economically recoverable reserves. Changes in factors such as estimates of economically recoverable reserves that affect amortisation calculations do not give rise to prior financial period adjustments and are dealt with on a prospective basis.
Expenditure on major maintenance refits or overhauls comprises the cost of replacement assets or parts of assets, inspection costs and overhaul costs. Where an asset or part of an asset that was separately depreciated and is now written off is replaced and it is probable that future economic benefits associated will result, the expenditure is capitalised. Where part of the asset was not separately considered as a component, the replacement value is used to estimate the carrying amount of the replaced assets which is immediately written off. All other maintenance costs are expensed as incurred.
(ii) Other plant and equipment The cost of other plant and equipment is stated at cost less accumulated depreciation and impairment losses. Costs include, (i) the
initial estimate at the time of installation and during the period of use, when relevant, of the costs of dismantling and removing the items, and (ii) changes in the measurement of existing liabilities recognised for these costs resulting from changes in the timing or outflow of resources required to settle the obligation or from changes in the discount rate.
Other plant and equipment is depreciated using the straight line method over its estimated useful life. The depreciation rates used for other plant and equipment are in the range 5% to 27% (2011: 5% to 27%).
(k) Exploration and evaluation Exploration and evaluation costs are accumulated in respect of each separate area of interest and are accounted for using the successful
efforts method of accounting. An area of interest is usually represented by an individual oil or gas field.
The cost of acquisition of joint venture interests, successful drilling costs and costs incurred in relation to feasibility studies and the technical evaluation of a potential development are carried forward where right to tenure of the area of interest is current and they are expected to be recouped through sale or successful development and exploitation of the area of interest, or where the assessment to determine the existence of economically recoverable reserves for a potential development in an area of interest is not yet complete. Exploration licence acquisition is subject to impairment testing annually. Where potential impairment is indicated, assessment is performed for each area of interest to which the exploration and evaluation expenditure is attributed. To the extent that capitalised expenditure is not expected to be recovered it is charged to the income statement.
All other exploration and evaluation costs, including pre-licence costs are expensed as incurred.
(l) Capitalised borrowing costs Borrowing costs relating to oil and gas assets under development up to the date of commencement of operations are capitalised as a
cost of the development. Where funds are borrowed specifically for qualifying projects the actual borrowing costs incurred are capitalised. Where the projects are funded through general borrowings the borrowing costs are capitalised based on the weighted average borrowing rate. Other borrowing costs are expensed.
1. Statement of significant accounting policies (continued)
AWE LIMITED ANNUAL REPORT 2012 65

NotES to tHE FINANCIAl StAtEMENtS FOR THE YEAR ENDED 30 JUNE 2012
(m) Intangible assets The costs of computer software and loan establishment fees are stated at cost less accumulated depreciation. Amortisation on computer
software is calculated on a straight-line basis over 2.5 years. Amortisation on loan establishment fees is calculated on a straight-line basis over the life of the loan.
(n) trade and other payables These amounts represent liabilities for goods and services provided to the consolidated entity prior to the end of the financial year which
are unpaid. The amounts are unsecured and are usually paid within 14 days of recognition.
(o) Interest-bearing borrowings Interest-bearing borrowings are recognised initially at fair value less attributable transaction costs. Subsequent to initial recognition,
interest-bearing borrowings are stated at amortised cost with any difference between cost and redemption value being recognised in the income statement over the period of the borrowings on an effective interest basis.
Fees paid on the establishment of loan facilities are recognised as transaction costs of the loan to the extent that it is probable that some or all of the facility will be drawn down. In this case, the fee is deferred until the draw down occurs. To the extent there is no evidence that it is probable that some or all of the facility will be drawn down, the fee is capitalised as an intangible asset and amortised over the period of the facility to which it relates.
(p) Employee benefits (i) Wages, salaries and annual leave The provisions for employee entitlements to wages, salaries and annual leave represents the amount which the consolidated entity
has a present obligation to pay resulting from employees’ services provided up to the end of each reporting period. The provisions have been calculated at undiscounted amounts based on wage and salary rates that the consolidated entity expects to pay and include related on-costs.
(ii) Long-term service benefits Long service leave represents the present value of the estimated future cash outflows to be made resulting from an employee’s
services provided to the end of each reporting period. The provision is calculated using estimated future increases in wage and salary rates including related on-costs and expected settlement dates based on turnover history and is discounted using the rates attaching to national government securities at balance date which most closely match the terms of maturity of the related liabilities.
(iii) Share-based payment transactions Share-based compensation benefits are provided to employees via the Employee Share Rights Plan and the Employee Share Option
Plan. Information relating to these schemes is set out in note 21.
The fair value of rights granted is recognised as an employee expense with a corresponding increase in equity. The fair value of the rights granted is measured using the Black-Scholes Option Pricing model, and includes any market performance conditions but excludes the impact of any service and non-market performance vesting conditions and the impact of any non-vesting conditions.
The fair value of options granted is recognised as an employee expense with a corresponding increase in equity. The fair value of the options granted is measured using a modified binomial option pricing model, and includes any market performance conditions but excludes the impact of any service and non-market performance vesting conditions and the impact of any non-vesting conditions.
Non-market and service related vesting conditions are included in assumptions about the number of rights and options that are expected to vest.
The total expense is recognised over the vesting period, which is the period over which all of the specified vesting conditions are to be satisfied. At the end of each period, the entity revises its estimates of the number of rights and options that are expected to vest based on the non-market and service related vesting conditions. It recognises the impact of the revision to original estimates, if any, in profit or loss, with a corresponding adjustment to equity.
(iv) Superannuation plans Obligations for contributions to accumulation type superannuation plans are recognised as an expense in the income statement as incurred.
(q) Provisions A provision is recognised in the statement of financial position when the consolidated entity has a present legal or constructive obligation
as a result of a past event, and it is probable that an outflow of economic benefits will be required to settle the obligation. If the effect is material, provisions are determined by discounting the expected future cash flows at a pre-tax rate that reflects current market assessments of the time value of money and, where appropriate, the risks specific to the liability.
Site restoration Provisions made for decommissioning, restoration and environmental rehabilitation are recognised where there is a present obligation as a
result of exploration, development or production activities having been undertaken, and it is probable that an outflow of economic benefits will be required to settle the obligation. The estimated future obligations include the costs of removing facilities, abandoning wells and restoring the affected areas. The provision for future restoration costs is the best estimate of the present value of the expenditure required to settle the obligation at the end of each reporting period, based on current legal requirements and technology. The ultimate costs are
1. Statement of significant accounting policies (continued)
66 AWE LIMITED ANNUAL REPORT 2012

NotES to tHE FINANCIAl StAtEMENtS FOR THE YEAR ENDED 30 JUNE 2012
uncertain and cost estimates can vary in response to many factors including changes to relevant legal requirements, the emergence of new techniques or experience at other production sites. Future restoration costs are reviewed annually and any changes are reflected in the present value of the restoration provision at the end of the reporting period. The amount of the provision for future restoration costs relating to exploration and development activities is capitalised as a cost of those activities. If the effect is material, provisions are determined by discounting the expected future cash flows at a pre-tax rate that reflects current market assessments of the time value of money, and where appropriate the risks specific to the liability. The unwinding of discounting on the provision is recognised as a finance cost.
(r) revenue recognition (i) Sales revenue Revenue from the sale of oil and gas is recognised in the income statement when the significant risks and rewards of ownership have
been transferred to the buyer. Revenue received during the commissioning phase of oil and gas assets is recorded, together with the related costs of production, against the capitalised carrying value of the asset.
(ii) Other revenues Other revenues are recognised on an accrual basis and include royalty receipts and equipment rental income.
(s) leased assets Leases of property, plant and equipment where the consolidated entity, as lessee, has substantially all the risks and rewards of ownership
are classified as finance leases. Finance leases are capitalised at the lease’s inception at the fair value of the leased property or, if lower, the present value of the minimum lease payments. The corresponding rental obligations, net of finance charges, are included in other short-term and long-term payables. Each lease payment is allocated between the liability and finance cost. The finance cost is charged to profit or loss over the lease period so as to produce a constant periodic rate of interest on the remaining balance of the liability for each period. The property, plant and equipment acquired under finance leases is depreciated over the asset’s useful life or over the shorter of the asset’s useful life and the lease term if there is no reasonable certainty that the consolidated entity will obtain ownership at the end of the lease term
Leases in which a significant portion of the risks and rewards of ownership are not transferred to the consolidated entity as lessee are classified as operating leases and are not recognised on the consolidated entity’s statement of financial position. Payments made under operating leases (net of any incentives received from the lessor) are charged to profit or loss on a straight-line basis over the period of the lease.
(t) taxation (i) Income tax Income tax on the income statement comprises current and deferred tax. Income tax is recognised in the income statement except to
the extent that it relates to items recognised directly in equity, in which case it is recognised in equity.
Current tax is the expected tax payable on the taxable income for the year, using tax rates enacted or substantially enacted at the end of the reporting period, and any adjustment to tax payable in respect of previous years.
Deferred tax is provided using the balance sheet method, providing for temporary differences between the carrying amounts of assets and liabilities for financial reporting purposes and the amounts used for taxation purposes. The following temporary differences are not provided for goodwill not deductible for tax purposes, the initial recognition of assets or liabilities that affect neither accounting nor taxable profit, and differences relating to investments in controlled entities to the extent that they will probably not reverse in the foreseeable future. The amount of deferred tax provided is based on the expected manner of realisation or settlement of the carrying amount of assets and liabilities, using tax rates enacted or substantively enacted at the end of the reporting period.
A deferred tax asset is recognised only to the extent that it is probable that future taxable profits will be available against which the asset can be utilised. Deferred tax assets are reduced to the extent that it is no longer probable that the related tax benefit will be realised.
Additional income taxes that arise from the distribution of dividends are recognised at the same time as the liability to pay the related dividend.
(ii) Petroleum Resource Rent Tax (“PRRT”) and other government royalties In addition to corporate income taxes, the consolidated financial statements also include and disclose certain taxes determined from
oil and gas production and levied on net income.
Resource rent taxes and government royalties are treated as taxation arrangements when they are imposed under Government authority and when the calculation of the amount payable falls within the definition of “taxable profit” for the purposes of AASB 112. Current and deferred tax is then provided on the same basis as described in (i) above.
Royalty arrangements that do not meet the criteria for treatment as a tax are recognised on an accruals basis.
(iii) Tax consolidation The Company and its wholly-owned Australian resident entities have formed a tax consolidated group with effect from 1 July 2003
and are therefore taxed as a single entity from that date. The head entity within the tax-consolidated group is AWE Limited.
Current tax expense/income, deferred tax liabilities and deferred tax assets arising from temporary differences of the members of the tax-consolidated group are recognised in the separate financial statements of the members of the tax-consolidated group using a modified stand alone tax allocation methodology.
1. Statement of significant accounting policies (continued)
AWE LIMITED ANNUAL REPORT 2012 67

NotES to tHE FINANCIAl StAtEMENtS FOR THE YEAR ENDED 30 JUNE 2012
Any current tax liabilities (or assets) and deferred tax assets arising from unused tax losses of the controlled entities are assumed by the head entity in the tax-consolidated group and are recognised as amounts payable (receivable) to (from) other entities in the tax-consolidated group in conjunction with any tax funding arrangements.
The Company recognises deferred tax assets arising from unused tax losses of the tax-consolidated group to the extent that it is probable that future taxable profits of the tax-consolidated group will be available against which the asset can be utilised. Any subsequent period adjustments to deferred tax assets arising from unused tax losses as a result of revised assessments of the probability of recoverability is recognised by the head company only.
(iv) Nature of tax funding and tax sharing arrangements The head entity, in conjunction with other members of the tax-consolidated group, has entered into a tax funding arrangement which
sets out the funding obligations of members of the tax-consolidated group in respect of tax amounts. The tax funding arrangements require payments to/from the head entity equal to the current tax liability (asset) assumed by the head entity and any tax-loss deferred tax asset assumed by the head entity, resulting in the head entity recognising an inter-entity receivable (payable) equal in amount to the tax liability (asset) assumed. The inter-entity receivable (payable) is at call.
(u) Goods and services tax Revenue, expenses and assets are recognised net of the amount of goods and services tax (“GST”), except where the amount of GST
incurred is not recoverable from the taxation authority. In these circumstances, the GST is recognised as part of the cost of acquisition of the asset or as part of the expense.
Receivables and payables are stated with the amount of GST included. The net amount of GST recoverable from, or payable to, the Australian Taxation Office (“ATO”) is included as a current asset or liability in the statement of financial position.
Cash flows are included in the statement of cash flows on a gross basis. The GST components of cash flows arising from investing and financing activities which are recoverable from, or payable to, the ATO are classified as operating cash flows.
(v) Segment reporting An operating segment is a component of the consolidated entity that engages in business activities from which it may earn revenues and
incur expenses, including revenues and expenses that relate to transactions with any of the consolidated entity’s other components. An operating segment’s operating results are reviewed regularly by the chief operating decision maker to make decisions about resources to be allocated to the segment and assess its performance, and for which discrete financial information is available.
Segment results that are reported to the chief operating decision maker include items directly attributable to a segment as well as those that can be allocated on a reasonable basis.
Segment assets include both oil and gas assets, exploration assets and other assets, such as cash, receivables and inventory, which are directly attributable to the segment.
Unallocated items comprise mainly head office income and expenses, foreign exchange gains and losses and corporate assets.
(w) Contributed equity Ordinary shares are classified as equity. Incremental costs directly attributable to the issue of new shares, share rights or options are
shown in equity as a deduction, net of tax, from the proceeds. Incremental costs directly attributable to the issue of new shares, share rights or options for the acquisition of a business are not included in the cost of the acquisition as part of the purchase consideration.
If the entity reacquires its own equity instruments, for example, as the result of a share buy-back, those instruments are deducted from equity and the associated shares are cancelled. No gain or loss is recognised in profit or loss and the consideration paid including any directly attributable incremental costs (net of income taxes) is recognised directly in equity.
(x) Dividends Provision is made for the amount of any dividend declared, being appropriately authorised and no longer at the discretion of the entity, on
or before the end of the reporting period but not distributed at the end of the reporting period.
(y) Earnings per share (i) Basic earnings per share Basic earnings per share is calculated by dividing the profit attributable to owners of the Company by the weighted average number
of ordinary shares outstanding during the financial year.
(ii) Diluted earnings per share Diluted earnings per share adjusts the figures used in the determination of basic earnings per share to take into account the
weighted average number of additional ordinary shares that would have been outstanding assuming the conversion of all dilutive potential ordinary shares.
(z) New accounting standards and interpretations Certain new accounting standards and interpretations have been published that are not mandatory for the 30 June 2012 reporting periods.
The consolidated entity has not elected to early adopt any pronouncements before their operative date in the current reporting period ended 30 June 2012. The consolidated entity’s assessment of the impact of these new standards and interpretations is set out below.
1. Statement of significant accounting policies (continued)
68 AWE LIMITED ANNUAL REPORT 2012

NotES to tHE FINANCIAl StAtEMENtS FOR THE YEAR ENDED 30 JUNE 2012
tItlE oF StANDArD APPlICAtIoN DAtE(1) NAtUrE oF AMENDMENt AND IMPACt oN AWE lIMItED
AASB 2011-9 Amendments to Australian Accounting Standards – Presentation of Other Comprehensive Income [AASB 101]
1 July 2012 In September 2011, the AASB made an amendment to AASB 101 Presentation of Financial Statements which requires entities to separate items presented in other comprehensive income into two groups, based on whether they may be recycled to profit or loss in the future. This will not affect the measurement of any of the items recognised in the balance sheet or the profit or loss in the current period.
The consolidated entity intends to adopt the new standard from 1 July 2012.AASB 9 Financial Instruments, AASB 2009-11 Amendments to Australian Accounting Standards arising from AASB 9 and AASB 2010-7 Amendments to Australian Accounting Standards arising from AASB 9 (December 2010)
1 January 2013 AASB 9 Financial Instruments addresses the classification, measurement and derecognition of financial assets and financial liabilities. The standard is not applicable until 1 January 2013 but is available for early adoption.
There will be no impact on the consolidated entity’s accounting for financial liabilities, as the new requirements only affect the accounting of financial liabilities that are designated as at fair value through profit or loss and the consolidated entity does not have such liabilities. The derecognition rules have been transferred from AASB 139 Financial Instruments: Recognition and Measurement and have not been changed. The consolidated entity has not yet decided when to adopt AASB 9.
IFrS 10 Consolidated Financial Statements
1 January 2013 IFRS 10 establishes a new control model that applies to all entities. The new control model broadens the situations when an entity is considered to be controlled by another entity and includes new guidance for applying the model to specific situations, including when acting as a manager may give control, the impact of potential voting rights and when holding less than a majority voting rights may give control. This is likely to lead to more entities being consolidated into the group.
While the consolidated entity does not expect the new standard to have a significant impact on its composition, it has yet to perform a detailed analysis of the new guidance in the context of its various investees that may or may not be controlled under the new rules.
IFrS 11 Joint Arrangements
1 January 2013 IFRS 11 uses the principle of control in IFRS 10 to define joint control, and therefore the determination of whether joint control exists may change. In addition IFRS 11 removes the option to account for jointly controlled entities (JCEs) using proportionate consolidation. Instead, accounting for a joint arrangement is dependent on the nature of the rights and obligations arising from the arrangement. Joint operations that give the venturers a right to the underlying assets and obligations themselves is accounted for by recognising the share of those assets and obligations. Joint ventures that give the venturers a right to the net assets is accounted for using the equity method. This may result in a change in the accounting for the joint arrangements held by the group.
While the consolidated entity does not expect the new standard to have a significant impact on its composition, it has yet to perform a detailed analysis of the new guidance in the context of its various investees that may or may not be joint ventures or joint arrangement under the new rules.
IFrS 12 Disclosures of Interests in Other Entities
1 January 2013 IFRS 12 includes all disclosures relating to an entity’s interests in subsidiaries, joint arrangements, associates and structures entities. New disclosures have been introduced about the judgements made by management to determine whether control exists, and to require summarised information about joint arrangements, associates and structured entities and subsidiaries with non-controlling interests.
The consolidated entity is yet to assess the full impact of this change. IFrS 13 Fair Value Measurement
1 January 2013 IFRS 13 establishes a single source of guidance under IFRS for determining the fair value of assets and liabilities. IFRS 13 does not change when an entity is required to use fair value, but rather, provides guidance on how to determine fair value under IFRS when fair value is required or permitted by IFRS. Application of this definition may result in different fair values being determined for the relevant assets. IFRS 13 also expands the disclosure requirements for all assets or liabilities carried at fair value.
The consolidated entity is yet to assess the full impact of this change. AASB119 Employee benefits
1 January 2013 The AASB has issued a revised standard on accounting for employee benefits which will become applicable for financial reporting periods commencing on or after 1 January 2013.
The revised standard is not expected to have a significant impact on employee benefit expenses or employee provisions of the consolidated entity.
AASB 2011-4 Amendments to Australian Accounting Standards to Remove Individual Key Management Personnel Disclosure Requirements [AASB 124]
1 July 2013 In July 2011 the AASB decided to remove the individual key management personnel (KMP) disclosure requirements from AASB 124 Related Party Disclosures, to achieve consistency with the international equivalent standard and remove duplication of the requirements with the Corporations Act 2001. While this will reduce the disclosures that are currently required in the notes to the financial statements, it will not affect any of the amounts recognised in the financial statements. The amendments apply from 1 July 2013 and cannot be adopted early. The Corporations Act requirements in relation to remuneration reports will remain unchanged for now, but these requirements are currently subject to review and may also be revised in the near future.
(1) Application date of standards is the annual reporting period beginning on or after the given dates
1. Statement of significant accounting policies (continued)
AWE LIMITED ANNUAL REPORT 2012 69

NotES to tHE FINANCIAl StAtEMENtS FOR THE YEAR ENDED 30 JUNE 2012
2. revenue2012
$’0002011
$’000
Sales revenue – oil and gas 298,354 304,870Other revenue from continuing operations 1,373 1,201
299,727 306,071
3. Cost of sales 2012
$’0002011
$’000
Production costs 101,280 131,789Royalties 7,942 3,178Amortisation (refer note 16) 79,628 104,910Movement in oil inventory: Production costs 472 (1,907) Amortisation 910 (2,354)
190,232 235,616
Made up of: Production costs (net of movement in oil inventory) 101,752 129,882 Royalties 7,942 3,178 Amortisation (net of movement in oil inventory) 80,538 102,556
190,232 235,616
4. other income2012
$’0002011
$’000
Net gain on disposal of available-for-sale financial assets 12,681 1,426Net gain on disposal of part interest in BassGas project 2,402 –Insurance recovery 2,600 –Other income 394 101
18,077 1,527
The disposal of an interest in the BassGas project results in a net gain (pre-tax) of $2.4 million and loss (post-tax) of $0.1 million.
5. other expenses2012
$’0002011
$’000
Merger and acquisition costs expensed – 215Share-based payments 1,571 2,038Loss on disposal of fixed assets – 207
1,571 2,460
6. Net financing (expense)/income2012
$’0002011
$’000
Interest income 3,623 1,673Net foreign exchange gain 660 –Financial income 4,283 1,673
Other borrowing costs (4,792) (3,384)Unwinding of discount – restoration provisions (refer note 22) (3,773) (3,650)Net foreign exchange loss – (8,154)Financial expense (8,565) (15,188)
Net financing expense (4,282) (13,515)
70 AWE LIMITED ANNUAL REPORT 2012

NotES to tHE FINANCIAl StAtEMENtS FOR THE YEAR ENDED 30 JUNE 2012
7. taxation expense2012
$’0002011
$’000
recognised in income statement
tax expense comprises:Income taxCurrent tax expense (12,495) (2,546)Adjustments from prior years (227) 1,691Tax expense related to movements in deferred tax balances 28,998 38,203Net effect of tax losses derecognised – (16,740)
16,276 20,608Prrt/APrCurrent tax expense (16,818) (9,825)Tax (expense)/benefit related to movements in deferred tax balances (9,682) 32,197Tax benefit recognised from introduction of onshore PRRT 6,864 –
(19,636) 22,372
tax (expense)/benefit reported in the consolidated income statement (3,360) 42,980
Numerical reconciliation between loss before tax and tax (expense)/benefit:loss before tax (63,136) (160,535)Prima facie taxation benefit at 30% (2011: 30%) 18,941 48,160(Increase)/decrease in income tax expense due to: Non-deductible expenses (6,302) (5,784) Overseas tax losses not recognised as a deferred tax asset (3,708) (8,817) Derecognition of tax losses – (20,323) Foreign exchange and other translation adjustments (717) 1,949 PRRT (net of income tax deduction for PRRT)* – (192) APR (net of income tax deduction for APR paid)* (11,646) (6,987) Deferred PRRT and royalty related tax expense* (9,682) 32,197 Recognition of onshore PRRT deferred tax asset* 6,864 – Realised loss on available-for-sale financial assets 2,914 – Other 181 1,086 Adjustments for prior years (205) 1,691total tax (expense)/benefit (3,360) 42,980
For information in relation to taxation payments made during the financial year refer to the Consolidated Statement of Cash Flows. For further information in relation to tax payable and deferred tax assets and liabilities refer to notes 23 and 24.
* As a producer of oil and gas in Australian and New Zealand offshore waters, the consolidated entity is subject to, in addition to income tax, additional government imposts in the form of PRRT in Australia and APR in New Zealand. PRRT is levied on Australian offshore oil and gas production operations and from 1 July 2012 to onshore operation at a rate of 40% of project profits after allowing for the recoupment of past deductible project costs and after appropriate compounding of these past costs. Further, subject to the satisfaction of certain tests, exploration costs incurred by the consolidated entity can be transferred to PRRT payable projects thereby having the effect of reducing or deferring the actual liability to pay PRRT. Similarly, APR is levied on the Tui production operation in New Zealand at a rate of 20% of project profits after allowing for the recoupment of past deductible project costs. However, these past project costs are not compounded and exploration costs incurred outside of the Tui project cannot be transferred to the Tui project. PRRT and APR are deductible for income tax purposes in Australia and New Zealand respectively.
AWE LIMITED ANNUAL REPORT 2012 71

NotES to tHE FINANCIAl StAtEMENtS FOR THE YEAR ENDED 30 JUNE 2012
8. Earnings per share2012
$’0002011
$’000
loss reconciliation
Basic and diluted earnings (66,496) (117,555)
2012NUMBEr
2011NUMBEr
Weighted average number of ordinary shares
Issued ordinary shares – opening balance 521,871,941 521,871,941
Effect of shares issued – –
Weighted average number of ordinary shares 521,871,941 521,871,941
Weighted average number of ordinary shares (diluted)
Weighted average number of ordinary shares at 30 June 521,871,941 521,871,941
Effect of employee rights on issue 8,884,217 5,001,207
Weighted average number of ordinary shares (diluted) 530,756,158 526,873,148
2012CENtS
2011CENtS
Basic and diluted earnings per share
From continuing operations attributable to the ordinary equity holders of the company (12.74) (22.53)
9. Auditors’ remuneration2012
$2011
$
Audit services
Auditor of the Company
Ernst & Young Australia
• Audit and review of financial reports 242,200 226,600
other services
Auditor of the Company
Ernst & Young Australia
• Taxation compliance services 95,000 140,659
• Due diligence procedures related to asset acquisition 62,160 –
Overseas Ernst & Young firms
• Taxation compliance services – 3,283
157,160 143,942
72 AWE LIMITED ANNUAL REPORT 2012

NotES to tHE FINANCIAl StAtEMENtS FOR THE YEAR ENDED 30 JUNE 2012
10. Segment reporting(a) Description of segments
Management has determined the operating segments based on the reports reviewed by the chief operating decision maker that are used to make strategic decisions. The chief operating decision maker considers the business from both a product and a geographic perspective and on this basis has identified seven reportable segments. For each reportable segment, the chief operating decision maker reviews internal management reports on at least a monthly basis. The following summary describes the operations in each of the consolidated entity’s reportable segments:
• New Zealand – production and sale of crude oil from the Tui Area oil project (PMP 38158, offshore Taranaki Basin, New Zealand);
• South-Eastern Australia Gas – production and sale of gas, condensate and LPG from the BassGas (T/L1, Bass Basin, offshore southern Australia) and Casino gas (VIC/L 24, Otway Basin, offshore southern Australia) projects;
• Western Australia Oil and Gas – production and sale of crude oil, gas and condensate from the Cliff Head oil project (WA 31 L, Perth Basin, offshore Western Australia) and a series of small oil and gas fields to the south of Dongara, Western Australia;
• United States – production and sale of gas and condensate from the Sugarloaf AMI (Texas, United States of America);
• Indonesia – development and exploration assets acquired during the year ended 30 June 2012 including the undeveloped Ande Ande Lumut oil (AAL) field;
• Exploration Activities – exploration and evaluation activities within the production licences and exploration permits held by AWE; and
• Other – other oil and gas fields in which interests are held by AWE Limited and its subsidiaries.
(b) Segment information provided to the chief operating decision maker for the year ending 30 June
NEW ZEAlANDSoUtH-EAStErN AUStrAlIA GAS
WEStErN AUStrAlIA oIl
AND GAS UNItED StAtES INDoNESIAExPlorAtIoN
ACtIVItIES otHEr totAl
2012$’000
2011$’000
2012$’000
2011$’000
2012$’000
2011$’000
2012$’000
2011$’000
2012$’000
2011$’000
2012$’000
2011$’000
2012$’000
2011$’000
2012$’000
2011$’000
Sales revenue 110,883 105,130 72,376 115,538 98,397 78,310 16,698 5,832 – – – – – 60 298,354 304,870
Production costs (23,419) (44,312) (39,604) (38,566) (35,922) (46,424) (2,807) (503) – – – – – (77) (101,752) (129,882)
Royalties (1,293) (833) (45) (102) (572) (777) (6,032) (1,466) – – – – – – (7,942) (3,178)
Net contribution from producing oil and gas fields 86,171 59,985 32,727 76,870 61,903 31,109 7,859 3,863 – – – – – (17) 188,660 171,810
Exploration and
evaluation expenses – – – – – – – – – – (36,477) (63,289) – – (36,477) (63,289)
Amortisation (21,469) (21,932) (33,927) (55,836) (19,952) (22,520) (5,190) (2,268) – – – – – – (80,538) (102,556)
Impairment – – (138,151) – – (35,686) – – – – – (101,324) – – (138,151) (137,010)
Reportable segment profit/(loss) 64,702 38,053 (139,351) 21,034 41,951 (27,097) 2,669 1,595 – – (36,477) (164,613) – (17) (66,506) (131,045)
Unallocated income/(expenses):
Other revenue 1,373 1,201
Administration expenses (10,226) (16,243)
Net financing expense (4,283) (13,515)
Other income/(expense) 16,506 (933)
Net loss before income tax (63,136) (160,535)
Segment assets:
Oil and gas assets 65,753 83,138 434,178 544,194 101,372 121,994 111,435 94,403 134,288 – – – – – 847,026 843,729
Exploration assets – – – – – – – – – – 84,155 82,516 – – 84,155 82,516
Other assets 5,940 7,107 18,253 5,813 2,270 6,648 – 1,776 – – – – – – 26,463 21,344
71,693 90,245 452,431 550,007 103,642 128,642 111,435 96,179 134,288 – 84,155 82,516 – – 957,644 947,589
Corporate and unallocated assets 104,364 167,809
Total assets 1,062,008 1,115,398
For details of taxation paid by the consolidated entity refer to the Statement of Cash Flow.
AWE LIMITED ANNUAL REPORT 2012 73

NotES to tHE FINANCIAl StAtEMENtS FOR THE YEAR ENDED 30 JUNE 2012
(c) Major customersThe consolidated entity had revenues from four external customers that each represent greater than 10% of total sales revenue, and when combined represent 87.29% of total sales revenue (2011: three external customers; 81%):
2012$’000
2011$’000
revenues from major customers by segment
New Zealand 110,884 105,310
South-Eastern Australia Gas 72,376 83,405
Western Australia Oil and Gas 77,174 57,893
260,434 246,608
11. Cash and cash equivalents2012
$’0002011
$’000
Bank balances 1,500 3,588
Call deposits 14,237 102,450
Cash held by joint ventures (refer note 26(b)) 27,022 11,130
42,759 117,168
12. trade and other receivables2012
$’0002011
$’000
Current
Trade receivables 31,688 22,815
Interest receivable 43 108
Joint venture receivables (refer note 26(b)) 3,212 8,888
Prepayments 1,448 594
Other receivables 6,024 1,357
42,415 33,762
Non-current
Other receivables 3,197 –
Foreign exchange, commodity price and credit riskInformation about the consolidated entity’s exposure to foreign currency risk, commodity price risk and credit risk in relation to trade and other receivables is provided in note 31.
10. Segment reporting (continued)
74 AWE LIMITED ANNUAL REPORT 2012

NotES to tHE FINANCIAl StAtEMENtS FOR THE YEAR ENDED 30 JUNE 2012
13. Inventories2012
$’0002011
$’000
Current
Oil inventory 3,703 4,877
Spares and consumables (refer note 26(b)) 3,913 8,096
7,616 12,973
14. Investments2012
$’0002011
$’000
Current
Available for sale financial assets – 15,927
On 29 July 2011 AWE’s wholly-owned subsidiary ARC Energy Limited sold all of its ordinary shares held in Buru Energy Limited. The shares in Buru Energy Limited were classified as a current available-for-sale financial asset as at 30 June 2011. The net proceeds from sale of shares is reflected in note 4.
All available for sale investments are denominated in Australian currency. For an analysis of the sensitivity of available-for-sale financial assets to price risk, refer to note 31.
15. Exploration and evaluation assets2012
$’0002011
$’000
Exploration and/or evaluation phase (at cost) 84,154 82,516
reconciliation of movements:
Carrying amount at the beginning of the financial year 82,516 271,347
Transfer to oil and gas assets (2011: Sugarloaf AMI) – (88,740)
Additions (net of amount recovered from joint ventures) 39,236 67,402
Foreign exchange translation difference 544 (2,880)
Exploration costs incurred and expensed during the year (36,477) (63,289)
Impairment charge – (101,324)
Disposals (1,665) –
Carrying amount at the end of the financial year 84,154 82,516
The recoverability of the carrying amounts of exploration and evaluation assets is dependent on the successful development and commercial exploitation or sale of the respective area of interest.
ImpairmentThere was nil impairment in respect of exploration and evaluation assets during the year ended 30 June 2012.
The impairment at 30 June 2011 related mainly to:
• Bass Basin exploration amounting to $31.0 million on a post-tax basis ($62.9 million pre-tax, $31.9 million tax effect). The impairment is primarily due to the reassessment of the risked future value of a Trefoil development (T/18P) via the BassGas facilities (T/L1) following completion of a detailed internal review during the period; and
• Yemen exploration amounting to $27.6 million on a post-tax basis ($35.3 million pre-tax, $7.7 million tax effect). The impairment is primarily as a consequence of the unrest and political uncertainty that has existed since February 2011 in Yemen. Both Operators of Blocks 7 and 74 have submitted notices of Force Majeure under the terms of the Production Sharing Contract (PSC’s) for those blocks.
AWE LIMITED ANNUAL REPORT 2012 75

NotES to tHE FINANCIAl StAtEMENtS FOR THE YEAR ENDED 30 JUNE 2012
16. oil and gas assets2012
$’0002011
$’000
Oil and gas assets (at cost) 1,588,111 1,387,319
Less amortisation and impairment (741,085) (543,590)
847,026 843,729
reconciliation of movements:
Carrying amount at the beginning of the financial year 843,729 817,292
Transfer from exploration assets (2011: Sugarloaf AMI) – 88,740
Acquired (North West Natuna) 132,731 –
Additions 171,531 57,249
Disposals (96,188) –
Increase in restoration and abandonment provision (refer note 22) 9,826 29,477
Foreign exchange translation difference 3,176 (8,433)
Amortisation (79,628) (104,910)
Impairment charge (138,151) (35,686)
Carrying amount at the end of the financial year 847,026 843,729
ImpairmentImpairment tests are performed where there is an indication of impairment. The consolidated entity performs annually an internal review of asset values using cash flow projections, these asset values are then used for impairment testing. Each oil and gas producing asset is considered a separate cash-generating unit. The asset values are used to determine a recoverable amount for each asset based on the higher of its value in use or net selling price. If the carrying amount of an asset exceeds its recoverable amount, the asset is impaired and an impairment loss is charged to the income statement with a corresponding reduction in the carrying value of the asset.
The asset valuations are based on a proved and probable (2P) reserve production profile and various estimates and assumptions. The key assumptions used in the cash flow projections include the following:
• Oil and gas prices – a combination of contracted gas prices, forward market prices and longer term observable price forecasts;
• Exchange rates – a combination of current spot USD/AUD exchange rate prevailing at 30 June and long-term observable forecasts; and
• Discount rates – the post-tax discount rate applied to cash flow projections is 10%.
The impairment at 30 June 2012 relates to the BassGas Project and arises due to a reassessment of the costs associated with the Mid-Life Enhancement (MLE) project ($138.2 million pre-tax, $41.4 million tax effect).
Asset valuations, based on cash flow projections, use a range of assumptions that are subject to change. Accordingly, losses are sensitive to reasonable possible changes in key assumptions. The impairment that would arise from a possible change in key assumptions (all other assumptions remaining the same) is shown below:
• A 10% decrease in oil prices would result in additional impairment of $32 million;
• A 10% decrease in the gas price would result in additional impairment of $18 million;
• A 10% increase in exchange rate would result in additional impairment of $27 million; and
• A 1% increase in the post tax discount rate would result in additional impairment of $22 million.
DisposalsDuring the period, AWE completed the sale of an 11.25% interest in the BassGas project to Toyota Tsusho, reducing AWE’s interest in the project from 57.5% to 46.25% effective 1 November 2011.
76 AWE LIMITED ANNUAL REPORT 2012

NotES to tHE FINANCIAl StAtEMENtS FOR THE YEAR ENDED 30 JUNE 2012
17. other plant and equipment2012
$’0002011
$’000
Other plant and equipment (at cost) 4,674 4,446
Less accumulated depreciation (2,787) (2,310)
1,887 2,136
reconciliation of the carrying amount of other plant and equipment is set out below:
Carrying amount at the beginning of the financial year 2,136 2,089
Additions 373 854
Depreciation (622) (617)
Disposal of fixed assets – (190)
Carrying amount at the end of the financial year 1,887 2,136
18. Intangible assets2012
$’0002011
$’000
Intangible assets (at cost) 3,091 4,499
Less amortisation (2,958) (3,414)
133 1,085
reconciliation of movements:
Computer software
Carrying amount at the beginning of the financial year 354 744
Additions 84 150
Amortisation (305) (524)
Disposal of software – (16)
Carrying amount at the end of the financial year 133 354
Loan establishment fees
Carrying amount at the beginning of the financial year 731 1,228
Write-off of loan facility fees (731) –
Amortisation – (497)
Carrying amount at the end of the financial year – 731
The loan establishment fees relate to a line of credit which remained undrawn at 30 June 2011. This facility was terminated during the year ended 30 June 2012 and a new multi-currency facility was established. Refer to note 20 for further details.
AWE LIMITED ANNUAL REPORT 2012 77

NotES to tHE FINANCIAl StAtEMENtS FOR THE YEAR ENDED 30 JUNE 2012
19. trade and other payables2012
$’0002011
$’000
Current
Trade payables 129 136
Joint venture creditors (refer note 26(b)) 32,175 33,589
Net cash interest payments accrued 1,687 1,952
Other payables and accrued expenses 26,771 14,210
60,762 49,887
20. Interest-bearing liabilities2012
$’0002011
$’000
Non-current
Bank loans 15,660 –
Less loan establishment fees (2,783) –
12,877 –
The consolidated entity has access to the following lines of credit:
Bank loans 300,000 150,000
Facilities utilised at balance date:
Bank loans 15,660 –
Facilities not utilised at balance date:
Bank loans 284,340 150,000
300,000 150,000
Bank loan – unsecured A $300 million multi-currency loan facility was established during the year and was used to refinance the previous facility. The facility is available for general corporate purposes and bears interest at the applicable base rate plus a margin. This facility expires in May 2015. At 30 June 2012, $15.6 million had been drawn under the terms of this facility.
78 AWE LIMITED ANNUAL REPORT 2012

NotES to tHE FINANCIAl StAtEMENtS FOR THE YEAR ENDED 30 JUNE 2012
21. Employee benefits2012
$’0002011
$’000
Current
Provision for employee benefits 1,146 1,221
Non-current
Provision for employee benefits 536 743
(a) Superannuation plansThe consolidated entity makes contributions to complying accumulation type superannuation plans nominated by individual employees. The consolidated entity contributes at least the amount required by law. The amount recognised as an expense was $1,051,000 for the financial year ended 30 June 2012 (2011: $1,052,000).
(b) Employee benefits expensed2012
$’0002011
$’000
Salaries and wages 19,231 17,751
Share-based payments 1,571 2,037
Other associated personnel costs 6,242 5,732
27,044 25,520
Salaries and wages and other associated personnel costs are allocated to various income statement categories based on the function of the expenditure.
(c) Share-based payments – Share rights PlanThe employee Share Rights Plan is designed to generate performance-based cash awards that may be converted, at the Board’s discretion, into cash, AWE shares or other employee benefits.
The key elements of the plan include:
• Rights are granted each year and the number of rights granted will be determined by the employee’s level in the Company, fixed remuneration at the time of grant and both the Company and employee’s performance in the previous financial year.
• There are three tranches of rights with separate vesting criteria:
– Retention(1);
– Absolute TSR; and
– Relative TSR
• The vesting period is for three years, the rights will lapse after three years and there will be no retesting. (1) Retention rights are not granted to the Managing Director
The conditions for the award of rights and the criteria for vesting are:
Retention Grants• Number of rights calculated using the 30-day VWAP of the AWE share price in June of grant year.
• Vest after three years if the employee remains employed by AWE.
Absolute TSR Grants• Number of rights calculated using the 30-day VWAP of the AWE share price in June of grant year.
• Vest after three years according to the Company’s Absolute TSR for that three year period.
• The vesting scales to apply for Absolute TSR grants are as follows:
ABSolUtE tSr rIGHtS GrANtED FroM JUNE 2013 FINANCIAl yEAr ABSolUtE rIGHtS GrANtED UP to JUNE 2012 FINANCIAl yEAr
AWE tSr % oF rIGHtS to VESt AWE tSr % oF rIGHtS to VESt
< 8% pa compound – < 6% pa compound –8% pa compound 25% 6% pa compound 25%
>8% and <10% pa compound Pro rata >6% and <9% pa compound Pro rata10% pa compound 50% 9% pa compound 50%
>10% and <12% pa compound Pro rata >9% and <12% pa compound Pro rata12% pa compound 100% 12% pa compound 100%
AWE LIMITED ANNUAL REPORT 2012 79

NotES to tHE FINANCIAl StAtEMENtS FOR THE YEAR ENDED 30 JUNE 2012
Relative TSR Grants• Number of rights calculated using the 30-day VWAP of AWE share price in June of grant year.
• Vest after three years according to the Company’s TSR relative to companies in ASX 200 Energy Index in grant year as per the table below (companies no longer in the index are excluded).
• The vesting scales to apply for Relative TSR grants are as follows:
rElAtIVE tSr rIGHtS GrANtED FroM JUNE 2013 FINANCIAl yEAr rElAtIVE tSr rIGHtS GrANtED UP to JUNE 2012 FINANCIAl yEAr
AWE tSr rElAtIVE to tSr oF CoMPANIES IN S&P/ASx ENErGy
INDEx At DAtE oF GrANt
% oF rIGHtS to VESt AWE tSr rElAtIVE to tSr oF CoMPANIES IN S&P/ASx ENErGy
INDEx At DAtE oF GrANt
% oF rIGHtS to VESt
< 50% – < 50% –50% 25% 50% 50%
>50% and <90% Pro rata >50% and <75% Pro rata90% and above 100% 75% and above 100%
A summary of rights in the consolidated entity and the Company is as follows:
GrANt DAtE VEStING DAtEoPENINGBAlANCE GrANtED VEStED lAPSED
CloSINGBAlANCE
AWE SHArEPrICE At DAtE
oF ISSUE
2012
19 November 2009 30 June 2012 387,487 – – (55,351) 332,136 $2.8022 January 2010 30 June 2012 1,486,486 – – (163,686) 1,322,800 $2.8331 March 2010 30 June 2012 25,303 – – (4,533) 20,770 $2.7223 April 2010 30 June 2012 11,363 – – (1,182) 10,181 $2.583 December 2010 30 June 2013 1,895,793 – – (185,600) 1,710,193 $1.7425 June 2011 30 June 2013 402,101 – – (62,670) 339,431 $1.2130 June 2011 30 June 2013 920,246 – – – 920,246 $1.2816 September 2011 30 June 2014 – 3,491,295 – (341,717) 3,149,578 $1.03531 October 2011 30 June 2014 – 162,850 – – 162,850 $1.38524 November 2011 30 June 2014 – 916,032 – – 916,032 $1.25
5,128,779 4,570,177 – (814,739) 8,884,217
2011
19 November 2009 30 June 2012 387,487 – – – 387,487 $2.8022 January 2010 30 June 2012 1,529,807 – – (43,321) 1,486,486 $2.8331 March 2010 30 June 2012 25,303 – – – 25,303 $2.7223 April 2010 30 June 2012 30,800 – – (19,437) 11,363 $2.583 December 2010 30 June 2013 – 1,898,885 – (3,092) 1,895,793 $1.7425 June 2011 30 June 2013 – 402,101 – – 402,101 $1.2101 February 2011 30 June 2013 – 920,246 – – 920,246 $1.25
1,973,397 3,221,232 – (65,850) 5,128,779
For grants of rights, the fair value has been calculated at the grant date using a Black-Scholes Pricing Model and assuming a vesting probability of 43.5% for performance related awards and a 10% staff turnover rate for retention awards.
The fair value of rights has been calculated at the grant date and allocated to each reporting period evenly over the period from grant date to vesting date. The value disclosed is the portion of the fair value of the rights allocated to this reporting period. The value disclosed does not therefore represent cash received.
The share rights outstanding at 30 June 2012 have fair value in the range of $0.33 to $2.83, and a weighted average remaining contractual life of 1.3 years (2011: 1.5 years).
21. Employee benefits (continued)
80 AWE LIMITED ANNUAL REPORT 2012
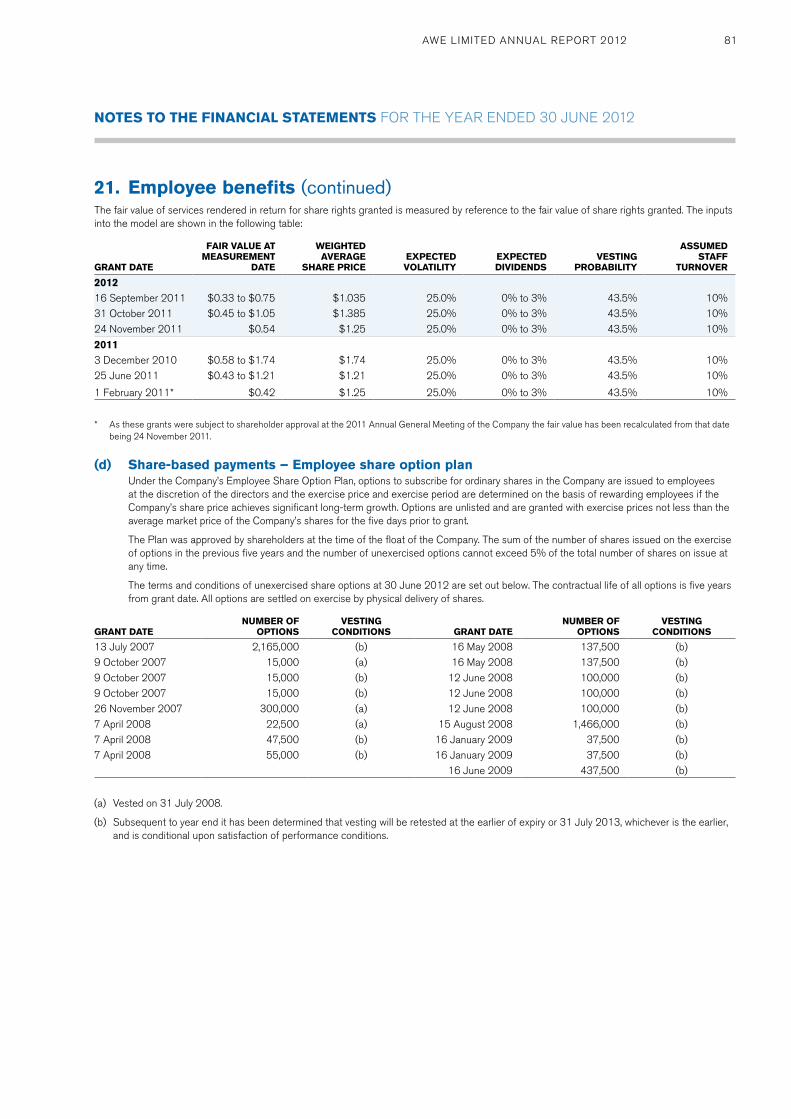
NotES to tHE FINANCIAl StAtEMENtS FOR THE YEAR ENDED 30 JUNE 2012
The fair value of services rendered in return for share rights granted is measured by reference to the fair value of share rights granted. The inputs into the model are shown in the following table:
GrANt DAtE
FAIr VAlUE AtMEASUrEMENt
DAtE
WEIGHtED AVErAGE
SHArE PrICEExPECtEDVolAtIlIty
ExPECtEDDIVIDENDS
VEStINGProBABIlIty
ASSUMEDStAFF
tUrNoVEr
2012
16 September 2011 $0.33 to $0.75 $1.035 25.0% 0% to 3% 43.5% 10% 31 October 2011 $0.45 to $1.05 $1.385 25.0% 0% to 3% 43.5% 10%24 November 2011 $0.54 $1.25 25.0% 0% to 3% 43.5% 10%
2011
3 December 2010 $0.58 to $1.74 $1.74 25.0% 0% to 3% 43.5% 10% 25 June 2011 $0.43 to $1.21 $1.21 25.0% 0% to 3% 43.5% 10%
1 February 2011* $0.42 $1.25 25.0% 0% to 3% 43.5% 10%
* As these grants were subject to shareholder approval at the 2011 Annual General Meeting of the Company the fair value has been recalculated from that date being 24 November 2011.
(d) Share-based payments – Employee share option planUnder the Company’s Employee Share Option Plan, options to subscribe for ordinary shares in the Company are issued to employees at the discretion of the directors and the exercise price and exercise period are determined on the basis of rewarding employees if the Company’s share price achieves significant long-term growth. Options are unlisted and are granted with exercise prices not less than the average market price of the Company’s shares for the five days prior to grant.
The Plan was approved by shareholders at the time of the float of the Company. The sum of the number of shares issued on the exercise of options in the previous five years and the number of unexercised options cannot exceed 5% of the total number of shares on issue at any time.
The terms and conditions of unexercised share options at 30 June 2012 are set out below. The contractual life of all options is five years from grant date. All options are settled on exercise by physical delivery of shares.
GrANt DAtENUMBEr oF
oPtIoNSVEStING
CoNDItIoNS GrANt DAtENUMBEr oF
oPtIoNSVEStING
CoNDItIoNS
13 July 2007 2,165,000 (b) 16 May 2008 137,500 (b)9 October 2007 15,000 (a) 16 May 2008 137,500 (b)9 October 2007 15,000 (b) 12 June 2008 100,000 (b)9 October 2007 15,000 (b) 12 June 2008 100,000 (b)26 November 2007 300,000 (a) 12 June 2008 100,000 (b)7 April 2008 22,500 (a) 15 August 2008 1,466,000 (b)7 April 2008 47,500 (b) 16 January 2009 37,500 (b)7 April 2008 55,000 (b) 16 January 2009 37,500 (b)
16 June 2009 437,500 (b)
(a) Vested on 31 July 2008.
(b) Subsequent to year end it has been determined that vesting will be retested at the earlier of expiry or 31 July 2013, whichever is the earlier, and is conditional upon satisfaction of performance conditions.
21. Employee benefits (continued)
AWE LIMITED ANNUAL REPORT 2012 81

NotES to tHE FINANCIAl StAtEMENtS FOR THE YEAR ENDED 30 JUNE 2012
A summary of outstanding options to acquire ordinary shares in the Company is as follows:
GrANt DAtE ExPIry DAtEExErCISE
PrICEoPENINGBAlANCE GrANtED ExErCISED lAPSED
CloSINGBAlANCE
VAlUE oFSHArES AtExErCISE
DAtE
2012
21 July 2006 19 July 2011 $3.27 1,225,000 – – (1,225,000) – –30 August 2006 19 July 2011 $3.27 50,000 – – (50,000) – –10 November 2006 9 November 2011 $3.10 65,000 – – (65,000) – –15 January 2007 14 January 2012 $2.86 150,000 – – (150,000) – –12 March 2007 11 March 2012 $2.68 555,000 – – (555,000) – –13 July 2007 14 July 2012 $3.56 2,315,000 – – (150,000) 2,165,000 –9 October 2007 8 October 2012 $3.56 45,000 – – – 45,000 –26 November 2007 10 April 2012 $2.77 500,000 – – (500,000) – –26 November 2007 30 August 2012 $3.18 1,000,000 – – (700,000) 300,000 –7 April 2008 6 April 2013 $3.65 125,000 – – – 125,000 –16 May 2008 12 May 2013 $4.10 275,000 – – – 275,000 –12 June 2008 11 June 2013 $4.08 300,000 – – – 300,000 –15 August 2008 14 August 2013 $3.28 1,566,000 – – (100,000) 1,466,000 –16 January 2009 15 January 2014 $2.60 75,000 – – – 75,000 –16 June 2009 15 June 2014 $2.75 437,500 – – – 437,500 –
8,683,500 (3,495,000) 5,188,500
2011
26 September 2005 25 September 2010 $2.10 700,000 – – (700,000) – –24 November 2005 24 November 2010 $2.10 300,000 – – (300,000) – –
24 November 2005 24 November 2010 $2.21 300,000 – – (300,000) – –24 November 2005 24 November 2010 $2.31 300,000 – – (300,000) – –20 March 2006 19 March 2011 $2.46 300,000 – – (300,000) – –20 March 2006 19 March 2011 $2.59 2,100,000 – – (2,100,000) – –20 March 2006 19 March 2011 $2.71 2,960,000 – – (2,960,000) – –11 April 2006 11 April 2011 $2.66 100,000 – – (100,000) – –16 June 2006 15 June 2011 $3.00 275,000 – – (275,000) – –21 July 2006 19 July 2011 $3.27 1,225,000 – – – 1,225,000 –30 August 2006 19 July 2011 $3.27 50,000 – – – 50,000 –10 November 2006 9 November 2011 $3.10 65,000 – – – 65,000 –15 January 2007 14 January 2012 $2.86 150,000 – – – 150,000 –12 March 2007 11 March 2012 $2.68 555,000 – – – 555,000 –13 July 2007 14 July 2012 $3.56 2,315,000 – – – 2,315,000 –9 October 2007 8 October 2012 $3.56 45,000 – – – 45,000 –26 November 2007 10 April 2012 $2.77 500,000 – – – 500,000 –26 November 2007 30 August 2012 $3.18 1,000,000 – – – 1,000,000 –7 April 2008 6 April 2013 $3.65 125,000 – – – 125,000 –16 May 2008 12 May 2013 $4.10 275,000 – – – 275,000 –12 June 2008 11 June 2013 $4.08 300,000 – – – 300,000 –15 August 2008 14 August 2013 $3.28 1,566,000 – – – 1,566,000 –16 January 2009 15 January 2014 $2.60 75,000 – – – 75,000 –16 June 2009 15 June 2014 $2.75 437,500 – – – 437,500 –
16,018,500 – – (7,335,000) 8,683,500
The options outstanding at 30 June 2012 have an exercise price in the range of $2.60 to $4.10, and a weighted average remaining contractual life of 0.7 years (2011: 1.2 years).
The fair value of services rendered in return for share options granted is measured by reference to the fair value of share options granted. The estimate of the fair value of the services received is measured based on a modified binomial option-pricing model. The contractual life of the option is used as an input into this model. Expectations of early exercise are incorporated into the binomial option-pricing model.
21. Employee benefits (continued)
82 AWE LIMITED ANNUAL REPORT 2012
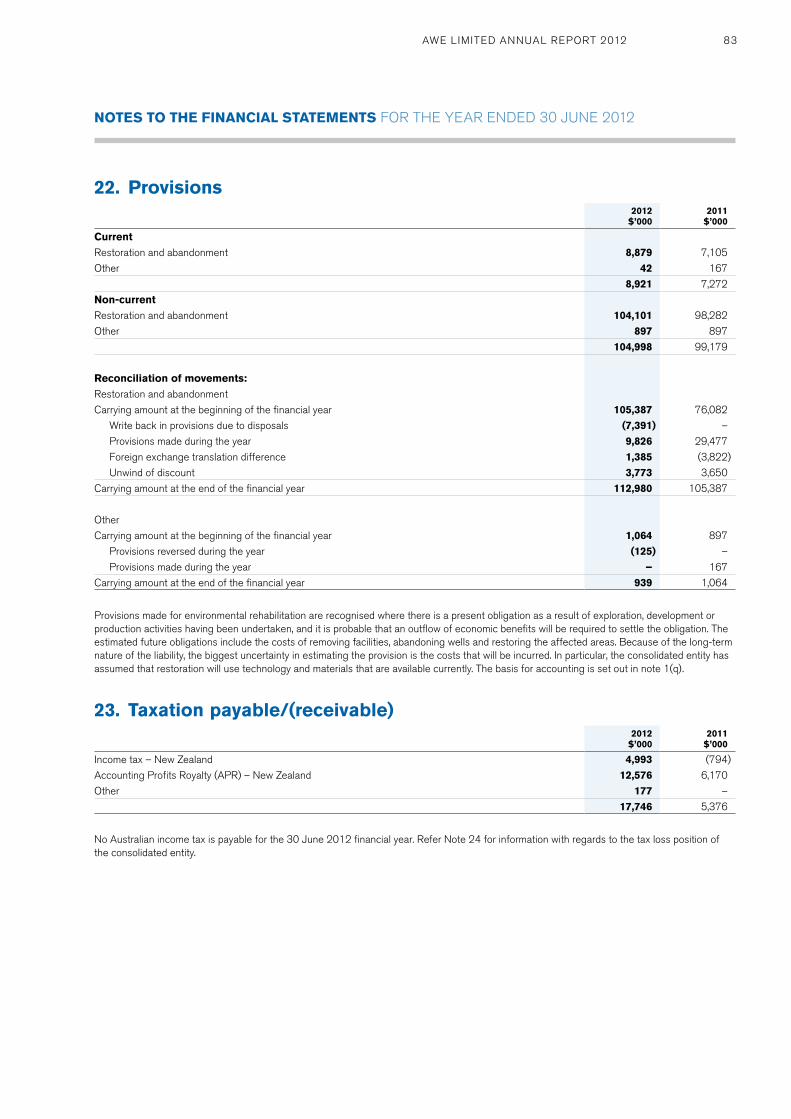
NotES to tHE FINANCIAl StAtEMENtS FOR THE YEAR ENDED 30 JUNE 2012
22. Provisions2012
$’0002011
$’000
Current
Restoration and abandonment 8,879 7,105
Other 42 167
8,921 7,272
Non-current
Restoration and abandonment 104,101 98,282
Other 897 897
104,998 99,179
reconciliation of movements:
Restoration and abandonment
Carrying amount at the beginning of the financial year 105,387 76,082
Write back in provisions due to disposals (7,391) –
Provisions made during the year 9,826 29,477
Foreign exchange translation difference 1,385 (3,822)
Unwind of discount 3,773 3,650
Carrying amount at the end of the financial year 112,980 105,387
Other
Carrying amount at the beginning of the financial year 1,064 897
Provisions reversed during the year (125) –
Provisions made during the year – 167
Carrying amount at the end of the financial year 939 1,064
Provisions made for environmental rehabilitation are recognised where there is a present obligation as a result of exploration, development or production activities having been undertaken, and it is probable that an outflow of economic benefits will be required to settle the obligation. The estimated future obligations include the costs of removing facilities, abandoning wells and restoring the affected areas. Because of the long-term nature of the liability, the biggest uncertainty in estimating the provision is the costs that will be incurred. In particular, the consolidated entity has assumed that restoration will use technology and materials that are available currently. The basis for accounting is set out in note 1(q).
23. taxation payable/(receivable)2012
$’0002011
$’000
Income tax – New Zealand 4,993 (794)
Accounting Profits Royalty (APR) – New Zealand 12,576 6,170
Other 177 –
17,746 5,376
No Australian income tax is payable for the 30 June 2012 financial year. Refer Note 24 for information with regards to the tax loss position of the consolidated entity.
AWE LIMITED ANNUAL REPORT 2012 83

NotES to tHE FINANCIAl StAtEMENtS FOR THE YEAR ENDED 30 JUNE 2012
24. Deferred tax assets and liabilitiesDeferred tax assets and liabilities are attributable to the following:
2012$’000
2011$’000
Deferred tax asset
Tax benefit attributable to tax losses 47,457 47,127
Provisions and accruals 34,699 35,102
Other 1,227 618
83,383 82,847
Deferred tax liability
Exploration and evaluation assets (22,173) (21,534)
Oil and gas assets (4,214) (34,863)
Arising from PRRT and APR (24,175) (21,142)
(50,562) (77,539)
Net deferred tax assets 32,821 5,308
Australian Petroleum Resource Rent Tax and New Zealand Accounting Profits RoyaltyThe consolidated entity applies tax effect accounting to both PRRT and to APR for all of the consolidated entity’s onshore and offshore Australian and offshore New Zealand producing operations. Applying tax effect accounting principles to both PRRT and APR causes the tax effect of the difference between the PRRT/APR tax base and the accounting base of these assets to be recognised as a deferred tax asset or deferred tax liability on the balance sheet. The PRRT/APR tax base represents the remaining deductible project costs of the relevant projects. The accounting base represents the written down net balance sheet value of the project which is amortised over the life of reserves. Where the remaining deductible project costs for a project exceed the accounting base and the excess cannot be transferred to a PRRT payable project then no deferred tax asset is recorded. The application of tax effect accounting to both PRRT and APR may impact the reported income tax expense whether or not a current tax liability to pay PRRT or APR arises.
The expansion of the Australian PRRT regime to onshore petroleum projects from 1 July 2012 results in the recognition of a deferred tax asset in respect of the onshore Perth basin operations. The deferred tax asset is calculated as the difference between the accounting written down value and the starting base for PRRT purposes.
Unrecognised deferred tax assets
2012$’000
2011$’000
Tax value of Australian income tax losses (calculated at 30%) 64,341 72,261
Deferred tax asset recognised (39,207) (47,127)
Tax value of Australian income tax losses not recognised as an asset (calculated at 30%) 25,134 25,134
The reduction in the deferred tax asset recognised of $7.9 million to $39.2 million is a result of the utilisation of carried forward tax losses to offset Australian taxable income for the year ended 30 June 2012.
Total Australian income tax losses incurred prior to forming a tax consolidated group amount to $29,410,000 (calculated at 30%).
All Australian income tax losses incurred after 30 June 2003 and that remain unutilised at 30 June 2012 have been recorded as a deferred tax asset ($34,931,000 calculated at 30%). There are no unutilised New Zealand tax losses.
Tax losses or Production Sharing Contract (PSC’s) credits incurred in other jurisdictions have been treated as permanently not deductible due to uncertainty of future usage due to insufficient estimated recoverable taxable income in those jurisdictions.
All US income tax losses as at 30 June 2012 have been recorded as a deferred tax asset ($8,250,477 calculated at 35%).
84 AWE LIMITED ANNUAL REPORT 2012

NotES to tHE FINANCIAl StAtEMENtS FOR THE YEAR ENDED 30 JUNE 2012
25. Capital and reserves(a) Share capital
2012$’000
2011$’000
521,871,941 (2011: 521,871,941) ordinary shares, fully paid 772,172 772,172
There were no movements in share capital during the year.
Holders of ordinary shares are entitled to receive dividends as declared from time to time and are entitled to one vote per share at shareholders’ meetings.
(b) Equity compensation reserveThe equity compensation reserve represents the fair value of options expensed by the Company to 30 June 2012.
(c) translation reserveThe translation reserve comprises all foreign exchange differences arising from the translation of the financial statements of foreign operations where the functional currency is different to the presentation currency of the reporting entity.
(d) Fair value reserveThe fair value reserve comprises the cumulative net change in the fair value of available-for-sale financial assets until the investments are derecognised or impaired.
(e) Dividends paid2012
$’0002011
$’000
Declared and paid during the year:
Dividends on ordinary shares:
Special franked dividend for 2012: 5 cent per share (2011: nil) 26,094 –
(f) Dividend franking account2012
$’0002011
$’000
30% franking credits available at 30 June 11,493 11,493
Franking debits that arise from payment of special dividend during the year (11,182) –
30% franking credits available to shareholders for subsequent financial years 311 11,493
AWE LIMITED ANNUAL REPORT 2012 85

NotES to tHE FINANCIAl StAtEMENtS FOR THE YEAR ENDED 30 JUNE 2012
26. Interests in oil and gas permitsAt the end of the financial year the consolidated entity held the following oil and gas production, exploration and appraisal permits:
CoNSolIDAtED BENEFICIAl INtErESt
PErMIt CoUNtry2012
%2011
%
T/L1 BassGas Australia 46.25 57.50
T/18P Australia 44.75 47.50
T/44P Australia – 40.00
VIC/L 24 Casino Australia 25.00 25.00
VIC/L 30 Henry Australia 25.00 25.00
VIC/P 44 Australia 25.00 25.00
WA 31 L Cliff Head Australia 57.50 57.50
L1/L2 Dongara Australia 100.00 100.00
L1/L2 Hovea and Eremia Australia 50.00 50.00
L1/L2 Corybas Australia Australia 50.00 50.00
L4/L5/PL 6 Woodada Australia 100.00 100.00
L7 Mt Horner Australia 100.00 100.00
L11 Beharra Springs Australia 33.00 33.00
L14 Jingemia Australia 44.14 44.14
EP 320 Australia 33.00 33.00
EP 413 Australia 44.25 44.25
EP 455 Australia 81.50 90.00
PMP 38158 Tui New Zealand 42.50 42.50
PEP 38259 New Zealand 25.00 25.00
PEP 38481 New Zealand – 53.75
PEP 38524 New Zealand – 60.00
PEP 51321 New Zealand – 44.32
PEP 381202 New Zealand – 100.00
Bulu PSC Indonesia 42.50 42.50
East Muriah PSC Indonesia 50.00 50.00
Terumbu PSC Indonesia 100.00 100.00
North Madura PSC Indonesia 50.00 50.00
Titan PSC Indonesia 40.00 40.00
North West Natuna PSC Indonesia 100.00 –
Anambas PSC Indonesia 100.00 –
Las Bases Exploitation Concession Argentina – 15.00
Yemen Block no. 7 Yemen 19.25 19.25
Yemen Block no. 74 Yemen 29.75 29.75
Sugarloaf Area of Mutual Interest (AMI) United States of America 10.00 10.00
86 AWE LIMITED ANNUAL REPORT 2012

NotES to tHE FINANCIAl StAtEMENtS FOR THE YEAR ENDED 30 JUNE 2012
Included in the assets and liabilities of the Company and the consolidated entity are the following items which represent the Company’s and the consolidated entity’s interest in the assets and liabilities employed in the permits.
2012$’000
2011$’000
Current assets
Cash and cash equivalents 27,022 11,130
Trade and other receivables 3,212 8,888
Inventory 3,913 8,096
34,147 28,114
Non-current assets
Exploration and evaluation assets 84,154 82,516
Oil and gas assets 869,996 843,729
954,150 926,245
total assets 988,297 954,359
Current liabilities
Trade and other payables 32,175 33,589
total liabilities 32,175 33,589
Refer to notes 27 and 28 for details of commitments and contingent liabilities.
27. Capital and other commitments(a) Capital expenditure commitments
2012$’000
2011$’000
Contracted but not provided for or payable:
Not later than one year 73,141 43,438
Included in capital expenditure commitments is $32.1 million of expenditure related to the BassGas MLE project (BassGas project, T/L1, Bass Basin, offshore Southern Australia, AWE share 46.25%). This project is being progressed in two separate phases: Phase One comprising installation of an accommodation and controls module and additional compression facilities on the platform; and Phase Two comprising the drilling of additional development wells.
Work on Phase One continued during the period with the successful installation of the accommodation and controls module. The installation of the compression module was not able to be completed during the period and has been delayed until the 2012-13 summer period. The project is expected to come back into production in September 2012.
Planning for Phase Two work continues with the drilling of the Yolla-5 and Yolla-6 wells expected to be undertaken during the 2013-14 summer period.
(b) Exploration and evaluation expenditure commitments2012
$’0002011
$’000
Total exploration and evaluation expenditure contracted for but not provided for in the financial statements, payable:
Not later than one year 39,676 42,120
Later than one year but not later than five years 51,994 55,384
91,670 97,504
In order to meet contractual obligations and to maintain the various licences, in which the consolidated entity and its respective joint venture partners are involved, the consolidated entity has ongoing commitments as part of its normal operations. The above exploration, evaluation and capital expenditure commitments represent commitments made to the appropriate government authorities, to the respective joint venture partners and to third party contractors. However, these commitments are subject to continual review within the joint ventures in which the consolidated entity is a participant and the extent of future commitments is subject to continual renegotiation.
26. Interests in oil and gas permits (continued)
AWE LIMITED ANNUAL REPORT 2012 87

NotES to tHE FINANCIAl StAtEMENtS FOR THE YEAR ENDED 30 JUNE 2012
(c) time charter commitments2012
$’0002011
$’000
Floating Production Storage and Offtake vessel (“FPSO”) time charter contracted for but not provided for in the financial statements, payable:
Not later than one year 13,218 13,128
Later than one year but not later than five years 33,553 44,699
46,771 57,827
The Operator of the Tui Area oil project (PMP 38158, offshore Taranaki Basin, New Zealand) has entered into a USD denominated charter contract for the provision of an FPSO for the Tui Field development. The Charter Contractor built and operates the FPSO as part of the charter arrangement. The contract is for a fixed initial term to 31 December 2015 with options exercisable by the joint venture for seven one-year extensions. The commitment would increase by A$97,545,444 if the full seven-year option is exercised.
(d) Non-cancellable operating lease rental commitments2012
$’0002011
$’000
Future operating lease rentals, not provided for in the financial statements, payable:
Not later than one year 1,681 786
Later than one year but not later than five years 2,883 4,131
4,564 4,917
Office premises – the consolidated entity leases a number of premises all of which expire no later than June 2016. During the financial year, $1,500,000 was recognised as an expense in the income statement (2011: $1,840,000).
BassGas operations - the consolidated entity has entered into a lease contract relating to the provision of generators and compressors for one of its producing oil and gas assets.
(e) remuneration commitments2012
$’0002011
$’000
Commitments for the payment of salaries and other compensation under long-term employment contracts in existence at the end of each reporting period but not provided for in the financial statements, payable:
Not later than one year 1,046 1,359
Later than one year but not later than five years 485 1,825
1,531 3,184
27. Capital and other commitments (continued)
88 AWE LIMITED ANNUAL REPORT 2012

NotES to tHE FINANCIAl StAtEMENtS FOR THE YEAR ENDED 30 JUNE 2012
28. Contingencies(a) The Operator of the Tui Area oil project (PMP 38158, offshore Taranaki Basin, New Zealand) has entered into a charter contract for the provision
of an FPSO for the Tui Field development. The Charter Contractor built and operates the FPSO as part of the charter arrangement. The contract is for a fixed initial term to 31 December 2015 with options exercisable by the joint venture for seven one-year extensions. The consolidated entity has provided a letter of credit for the benefit of the Charter Contractor amounting to US$11.9 million (2011: US$15.5 million).
(b) The consolidated entity has entered into agreements whereby it is required to pay a Net Cash Interest to the previous owners of a wholly-owned controlled entity of the Company, AWE Taranaki Limited (previously New Zealand Overseas Petroleum Limited), if returns from the Tui Area oil project in PMP 38158 exceed certain benchmark levels.
(c) The consolidated entity has entered into joint venture operations with other parties for the purpose of exploring and developing its permit interests. If a party to a joint venture operation defaults and does not contribute its share of joint venture operation obligations, then the other joint venturers are liable to meet those obligations. In this event, the permit interest held by the defaulting party may be redistributed to the remaining joint venturers.
(d) In accordance with normal oil and gas industry practice and under the terms of various joint venture operating and product sales agreements, the consolidated entity has provided performance guarantees to wholly-owned controlled entities and guarantees to fulfil its permit obligations in various jurisdictions where it conducts its operations.
(e) The Company has entered into Indemnity Deeds to indemnify executives of the Company against all liabilities incurred in the course of or arising out of their employment with the Company and its controlled entities, except where the liability results wholly or in part from serious and wilful misconduct by the executive.
(f) The consolidated entity provides for all known environmental liabilities. There can be no assurance that material new provisions will not be required as a result of new information or regulatory requirements with respect to the consolidated entity’s assets.
(g) The Native Title Act (“NTA”) may impact on the consolidated entity’s ability to gain access to new prospective exploration areas or obtain production titles. Some of the consolidated entity’s onshore petroleum tenements now include land that is the subject of a Native Title claim under the NTA. Under the NTA, all claims for Native Title are subject to the rights derived from the grant to the consolidated entity of its existing petroleum tenements for the term of that grant and any routine renewals. The consolidated entity is not liable to pay any compensation to Native Title parties by exercising its rights existing to petroleum tenements.
29. reconciliation of cash flows from operating activities2012
$’0002011
$’000
Cash flows from operating activitiesloss for the period (66,496) (117,555)
Adjustments for:
Amortisation of oil and gas assets 79,628 104,910
Amortisation of intangible assets 305 524
Depreciation 622 617
Loss on disposal of fixed assets – 207
Gain on disposal of available-for-sale financial assets (12,681) –
Gain on disposal of part interest in BassGas project (2,402) –
Impairment of oil and gas assets 138,151 35,686
Impairment of exploration and evaluation assets – 101,324
Exploration drilling costs 11,289 41,966
Loan establishment fees written off/amortised 803 497
Unwinding of discount – restoration provisions 3,773 3,650
Share-based payments 1,571 2,038
Net foreign currency losses 1,235 5,279
Non-cash gains recognised in other income (241) (1,426)
Non-cash taxation expense (14,361) (51,575)
Change in assets and liabilities during the financial year:
(Increase)/decrease in trade and other receivables (8,229) 18,797
Decrease/(increase) in oil inventory 1,382 (4,261)
Increase/(decrease) in provisions and employee benefits (422) 525
Decrease in accounts payable (10,059) (1,350)
Net cash from operating activities 123,868 139,853
AWE LIMITED ANNUAL REPORT 2012 89

NotES to tHE FINANCIAl StAtEMENtS FOR THE YEAR ENDED 30 JUNE 2012
30. Controlled entitiesEQUIty HolDING
NAME NotECoUNtry oF
INCorPorAtIoN2012
%2011
%
Parent entityAWE LimitedControlled entitiesAWE Administration Pty Limited (a) Australia 100 100AWE Finance Pty Limited (a) Australia 100 100AWE Overseas Pty Limited (a) Australia 100 100AWE Offshore Pty Limited (a) Australia 100 100AWE Argentina Pty Limited (a),(b) Australia 100 100AWE New Zealand Pty Limited (a),(b) Australia 100 100AWE UK Pty Limited (a) Australia 100 100AWE Australia Pty Limited (a) Australia 100 100Omega Oil Pty Ltd (a) Australia 100 100Wells Fargo Resources Pty Ltd Australia 100 100AWE Petroleum Pty Ltd (a) Australia 100 100Peedamullah Petroleum Pty Ltd (a) Australia 100 100AWE Services Pty Ltd (a) Australia 100 100AWE Resources (Western Australia) Pty Ltd (a) Australia 100 100AWE Oil (Western Australia) Pty Ltd (a) Australia 100 100Perthshire Petroleum Pty Ltd (a) Australia 100 100Tepstew Pty Ltd (a) Australia 100 100Western Petroleum Management Pty Ltd (a) Australia 100 100AWE (NSW) Pty Ltd (a) Australia 100 100AWE (Australia) Energy Pty Ltd (a) Australia 100 100AWE Energy (Australasia) Pty Ltd (a) Australia 100 100ARC Energy Pty Limited (a) Australia 100 100ARC (Beharra Springs) Pty Ltd (a) Australia 100 100ARC Energy Holdings Pty Limited (a) Australia 100 100ARC Energy Trading Pty Ltd (a) Australia 100 100ARC Investment Company Pty Ltd (a) Australia 100 100ARC (Wandoo) Pty Ltd (a) Australia 100 100ARC (Bass Gas) Pty Ltd (a) Australia 100 100ARC (Offshore PB) Pty Limited (a) Australia 100 100Adelphi Energy Pty Limited (a) Australia 100 100Adelphi Energy (Yemen) Pty Ltd (a) Australia 100 100AWE Malaysia Pty Limited (c) Australia 100 –Adelphi Energy Texas Inc. USA 100 100AWE Finance US Inc. (c) USA 100 –Adelphi Energy Yemen (B74) Limited British Virgin Islands 100 100AWE Holdings NZ Limited New Zealand 100 100AWE Taranaki Limited New Zealand 100 100AWE (Satria) NZ Limited New Zealand 100 100AWE (East Muriah) NZ Limited New Zealand 100 100AWE (Terumbu) NZ Limited New Zealand 100 100AWE (North Madura) NZ Limited New Zealand 100 100AWE (Titan) NZ Limited New Zealand 100 100AWE Finance NZ Limited (c) New Zealand 100 –AWE (AAL) NZ Limited (c) New Zealand 100 –AWE Singapore Pte. Ltd. Singapore 100 100AWE Holdings Singapore Pte. Ltd. Singapore 100 100AWE Vietnam Pte. Ltd. Singapore 100 100AWE (Northwest Natuna) Pte. Ltd. (c) Singapore 100 –AWE (Anambas) Pte. Ltd. (c) Singapore 100 –AWE Offshore UK Limited UK 100 100Greenslopes Limited Papua New Guinea 100 100
(a) These controlled entities are a party to a Deed of Cross Guarantee between those group entities and the Company pursuant to ASIC Class Order 98/1418 and are not required to prepare and lodge financial statements and directors’ reports (refer note 35). The Company and those group entities are the “Closed Group”.
(b) AWE New Zealand Pty Limited and AWE Argentina Pty Limited are Australian companies with branches in New Zealand and Argentina respectively.(c) These entities were acquired or were incorporated during the year.
90 AWE LIMITED ANNUAL REPORT 2012

NotES to tHE FINANCIAl StAtEMENtS FOR THE YEAR ENDED 30 JUNE 2012
31. Financial risk managementThe consolidated entity has exposure to market, credit and liquidity risks from its use of financial instruments in the normal course of its business. This note presents information about the consolidated entity’s exposure to each of the above risks.
The Board of Directors has overall responsibility for the establishment and oversight of the risk management framework of the consolidated entity. The Board has established an Audit and Governance Committee and a Sustainability Committee, which are responsible for developing and monitoring risk management policies.
The Sustainability Committee’s primary role is to advise and assist the Board of Directors in assessing risk factors associated with the execution of projects in which the consolidated entity has equity or participatory interests. The Audit and Governance Committee assesses the internal processes for determining and managing key financial risk areas. In addition, the Audit and Governance Committee ensures that the consolidated entity has an effective financial risk management system and that macro risks to the Company are reported to the Board. The consolidated entity’s financial risk management policies and systems are reviewed annually by the Audit and Governance Committee to reflect changes in market conditions and the consolidated entity’s activities.
The consolidated entity, through its training and management standards and procedures, aims to develop a disciplined and constructive control environment in which all employees understand their roles and obligations.
The consolidated entity’s management of financial risk aims to ensure that sufficient liquidity is available to fund its business plans. Identification and analysis of relevant financial risks to the achievement of the organisation’s objectives forms the basis for determining how such risks should be managed. The forecast financial position of the consolidated entity is continually monitored and derivative financial instruments can be used to hedge exposure to fluctuations in interest rates, exchange rates and commodity prices.
Hedging activities are conducted in accordance with the hedging policy endorsed by the Board. The following guidelines have been set by the Board in reviewing proposals to hedge:
• No speculative hedging is to be entered into;
• Only specific commitments and exposures are to be hedged;
• No hedging program is to be entered into without the prior approval of the Board;
• Hedging transactions must take into account any bank loan covenants that the Company has in place; and
• Any hedging program will ensure that the net exposure will not increase as a result of entering into the hedge.
(a) Market risk(i) Commodity price riskThe consolidated entity has revenue from the sale of hydrocarbons – gas, crude oil, condensate and LPG. Australian gas sales are not subject to commodity price risk as the product is sold in Australian Dollars under long-term contracts with CPI escalators in place. However, crude oil, condensate and LPG are priced against world benchmark commodity prices and the consolidated entity is therefore subject to significant commodity price risk for these products. The consolidated entity may enter into certain derivative instruments to manage its commodity price risk. As at the end of the financial year, the consolidated entity has no commodity price hedging or derivatives in place.
(ii) Interest rate riskA controlled entity of the Company has available an unsecured multi-currency corporate loan facility of up to A$300 million equivalent (2011: A$150 million equivalent). The facility utilised at 30 June 2012 was $15.7 million (NZ$20 million) (refer note 20). When drawn, the Australian Dollar portion of the facility bears interest at the bank bill swap rate plus a margin, the United States Dollar portion of the facility bears interest at LIBOR plus a margin and the New Zealand portion of the facility bears interest at BKBM plus a margin. Borrowings under the facility are floating rate borrowings and if the facility is drawn the consolidated entity would be subject to interest rate risk from movements in the Australian dollar bank bill swap rate, United States dollar LIBOR and New Zealand BKBM.
Similarly, the consolidated entity is subject to interest rate risk from movements in the Australian, United States and New Zealand cash rates on cash held.
The consolidated entity may enter into certain derivative instruments to manage its interest rate risk. As at the end of the financial year, the consolidated entity has no interest rate hedging or derivatives in place.
AWE LIMITED ANNUAL REPORT 2012 91

NotES to tHE FINANCIAl StAtEMENtS FOR THE YEAR ENDED 30 JUNE 2012
(iii) Foreign exchange riskThe consolidated entity operates internationally and is exposed to foreign exchange risk arising from various currency exposures, primarily with respect to United States and New Zealand dollars.
The consolidated entity is subject to the following significant foreign exchange risks:
• the sale of crude oil, condensate and LPG which are priced against world benchmark United States Dollar commodity prices;
• domestic and international operating, development and exploration expenditures which can be incurred in a number of different currencies, especially United States and New Zealand Dollars; and
• consolidation of entities with a functional currency different to the entity’s functional currency of Australian dollars.
The following measures are taken to reduce the consolidated entity’s foreign currency exposure:
• surplus funds are held in a mixture of both United States, New Zealand and Australian Dollars;
• where possible, specific commitments and exposures are hedged naturally by using United States Dollar revenues to fund United States Dollar denominated expenditures;
• to meet other foreign currency obligations the consolidated entity purchases foreign currency as the obligations accrue; and
• debt facilities have been arranged such that, if required, borrowings can be denominated in United States, New Zealand and Australian Dollars.
The consolidated entity may enter into certain derivative instruments to manage its foreign exchange risk. As at the end of the financial year, the consolidated entity has no foreign exchange hedging or derivatives in place.
The following significant exchange rates applied during the year:
AVErAGE rAtESPot rAtE At tHE END
oF tHE rEPortING PErIoD
2012 2011 2012 2011
AUD/USD 1.0317 0.9890 1.0191 1.0739
AUD/NZD 1.2834 1.3047 1.2771 1.2953
The financial instruments denominated in United States dollars and New Zealand dollars are as follows:
2012$’000
2011$’000
United States dollars:
Financial assets:
Cash 12,856 41,400
Trade and other receivables 31,209 19,026
Financial liabilities:
Trade and other payables (14,486) (12,953)
New Zealand dollars:
Financial assets:
Cash 1,335 8,169
Financial liabilities:
Trade and other payables (91) –
Bank loans (15,660) –The effects of exchange rate fluctuations on the balances of cash held in foreign currencies shown in the Consolidated Statement of Cash Flows is as follows:
Effect of exchange rate fluctuations on the balances of cash held in foreign currencies 4,665 (9,906)
31. Financial risk management (continued)
92 AWE LIMITED ANNUAL REPORT 2012

NotES to tHE FINANCIAl StAtEMENtS FOR THE YEAR ENDED 30 JUNE 2012
Summarised sensitivity analysis
The following table summarises the sensitivity of the consolidated entity’s financial assets and financial liabilities to interest rate risk, foreign exchange risk and other price risk.
CoMMoDIty & otHEr PrICE rISK INtErESt rAtE rISK ForEIGN ExCHANGE rISK
-10% +10% -1% +1% -10% +10%
CArryINGAMoUNt
$’000ProFIt
$’000
otHErEQUIty
$’000ProFIt
$’000
otHErEQUIty
$’000ProFIt
$’000
otHErEQUIty
$’000ProFIt
$’000
otHErEQUIty
$’000ProFIt
$’000
otHErEQUIty
$’000ProFIt
$’000
otHErEQUIty
$’000
30 June 2012
Financial assets
Cash and cash equivalents 42,759 – – – – (299) – 299 – 1,014 – (1,014) –
Trade and other receivables 45,612 (2,219) – 2,219 – – – – – 2,185 – (2,185) –
Financial liabilities
Trade and other payables 60,762 – – – – – – – – (1,014) – 1,014 –
Bank loans 15,660 – – – – (110) – 110 – (1,096) – 1,096
total increase/(decrease) (2,219) – 2,219 – (189) – 189 – (2,141) – 2,141 –
30 June 2011
Financial assets
Cash and cash equivalents 117,168 – – – – (820) – 820 – 3,492 – (3,492) –
Trade and other receivables 33,762 (1,597) – 1,597 – – – – – 1,332 – (1,332) –
AFS investments 15,927 – (1,115) – 1,115 – – – – – – – –
Financial liabilities
Trade and other payables 49,887 – – – – – – – – (907) – 907 –
total increase/(decrease) (1,597) (1,115) 1,597 1,115 (820) – 820 – 3,917 – (3,917) –
(b) Credit riskCredit risk represents the loss that would be recognised if counterparties failed to perform as contracted.
The credit risk on financial assets of the consolidated entity which have been recognised on the statement of financial position is the carrying amount, net of any provision for doubtful debts.
Exposure to credit riskCredit risk arises from the financial performance of:
• Customers receiving supplies of hydrocarbons from the consolidated entity. Trade receivable balances are monitored on an ongoing basis and further, the nature of upstream oil and gas operations is that hydrocarbons are generally sold to large creditworthy companies, with the result being that the consolidated entity’s exposure to bad debts is not significant.
• The financial institutions holding the cash and short-term deposits of the consolidated entity. In accordance with Board policy, funds are invested with up to a maximum of eight financial institutions with short-term security ratings of A1 or better and subject to working capital considerations, not more than $50 million is to be invested with any one financial institution.
• The joint venture participants with which the consolidated entity is involved. If a participant to a joint venture defaults and fails to contribute its share of joint venture obligations, the remaining joint venture participants are liable to meet the obligations of the defaulting participant. In this event the interest in the tenement of the defaulting participant may be redistributed to the remaining participants.
Receivables, cash and cash equivalents represent the Company’s and the consolidated entity’s maximum exposure to credit risk:
2012 $’000
2011$’000
Cash 42,759 117,168
Trade and other receivables 45,612 33,762
The consolidated entity does not hold any credit derivatives to offset its credit exposure. There is no concentration of credit risk to a single party.
The ageing of trade receivables at the end of each reporting period was as follows:
2012 $’000
2011$’000
Less than 1 month 31,594 19,533
1 month to 3 months 35 375
Greater than 3 months 59 2,907
There are no trade receivables past due or impaired at the end of the reporting period (2011: Nil).
31. Financial risk management (continued)
AWE LIMITED ANNUAL REPORT 2012 93

NotES to tHE FINANCIAl StAtEMENtS FOR THE YEAR ENDED 30 JUNE 2012
(c) liquidity riskLiquidity risk is the risk that the consolidated entity will not be able to meet its financial obligations as they fall due.
Responsibility for liquidity risk management rests with the Board of Directors who have built an appropriate framework for the management of the consolidated entity’s short, medium and long-term funding and liquidity management requirements.
The consolidated entity manages liquidity risk by continually monitoring forecast and actual cash flows and matching maturity profiles of financial assets and liabilities. Short and long-term cash flow projections are prepared periodically and submitted to the Board at each Board meeting of the Company.
Contractual cash flows
NotEtotAl$’000
lESS tHAN1 yEAr
$’0001-2 yEArS
$’0002-5 yEArS
$’000
MorE tHAN 5yEArS
$’000
2012
Consolidated
Trade and other payables 19 60,762 60,762 – – –
Bank loans 15,660 – – 15,660 –
2011
Consolidated
Trade and other payables 19 49,887 49,887 – – –
(d) Fair values of financial assets and liabilitiesThe carrying values of financial assets and liabilities of the consolidated entity and the Company approximate their fair value. The fair values are determined as follows:
• the fair value of financial assets and liabilities with standard terms and conditions and traded on an active liquid market is determined with reference to the quoted price; and
• the fair value of other financial assets and liabilities is determined in accordance with generally accepted pricing models based on discounted cash flow analyses.
AWE Limited has adopted the amendment to AASB 7 Financial Instruments: Disclosures which requires disclosure of fair value measurements by level of the following fair value measurement hierarchy:
(a) quoted prices (unadjusted) in active markets for identical assets or liabilities (level 1);
(b) inputs other than quoted prices included within level 1 that are observable for the asset or liability, either directly (as prices) or indirectly (derived from prices) (level 2), and
(c) inputs for the asset or liability that are not based on observable market data (unobservable inputs) (level 3).
The following table presents the consolidated entity’s assets and liabilities, per the requirements of AASB 7, measured and recognised at fair value as at each balance date:
NotElEVEl 1
$’000lEVEl 2
$’000lEVEl 3
$’000totAl$’000
30 June 2012
Assets
Available-for-sale financial assets – equity securities 14 – – – –
30 June 2011
Assets
Available-for-sale financial assets – equity securities 14 15,927 – – 15,927
The fair value of financial instruments traded in active markets is based on quoted market prices at the end of the reporting period. The quoted market price used for financial assets held by the consolidated entity is the current bid price. These instruments are included in level 1. There were no available-for-sale financial assets during the year.
(e) Capital managementThe consolidated entity maintains an ongoing review of its capital management program to ensure appropriate allocation of its capital resources.
The first order of priority for capital management initiatives is to ensure payment of its financial obligations.
The second order of priority for capital management is to fund new growth initiatives.
The overriding objective is to provide strong total shareholder returns.
The future payment of dividends is regularly reviewed by the Board, taking into account the Company’s future funding requirements. The Board will endeavour to pay dividends where it can do so in a tax effective manner to AWE shareholders.
31. Financial risk management (continued)
94 AWE LIMITED ANNUAL REPORT 2012

NotES to tHE FINANCIAl StAtEMENtS FOR THE YEAR ENDED 30 JUNE 2012
32. related party disclosuresKey management personnel disclosures
(a) Key management personnel compensationThe key management personnel compensation included in note 21 is as follows:
2012$’000
2011$’000
Salaries and wages 4,371 5,556
Share-based payments 857 883
Other associated personnel costs 56 116
5,284 6,555
(b) Individual directors’ and executives’ compensation disclosuresApart from the details disclosed in this note, no director or executive has entered into a material contract with the consolidated entity since the end of the previous financial year and there were no material contracts involving directors’ or executives’ interests existing at year-end.
(c) Share rightsThe movement during the financial year in the number of share rights in the Company held, directly, indirectly or beneficially, by each key management person, including their related parties, is as follows:
oPENINGBAlANCE
GrANtED ASrEMUNErAtIoN ExErCISED
NEt CHANGEotHEr
CloSINGBAlANCE
2012
Directors
B. F. W. Clement(i) 920,245 916,030 – – 1,836,275
Executives
N. F. Kelly 246,099 229,557 – – 475,656
I. D. Palmer(ii) 246,099 – – (246,099) –
D. Washer 321,424 296,904 – – 618,328
B. W. Wray(iii) 256,798 239,389 – (496,187) –
D. R. N. Gaudoin(iv) 276,262 280,917 – – 557,179
A. Saridas(v) – 162,850 – – 162,850
2011
Directors
B. F. W. Clement(i) – 920,245 – – 920,245B. J. W. Wood(vi) 387,487 – – (387,487) –
Executives
N. F. Kelly 103,611 142,488 – – 246,099I. D. Palmer 103,611 142,488 – – 246,099D. Washer 133,018 188,406 – – 321,424B. W. Wray 108,115 148,683 – – 256,798D. Gaudoin 116,310 159,952 – – 276,262L. J. Brooks(vii) 121,624 167,259 – (288,883) –
(i) B. F. W. Clement was appointed as Managing Director on 1 February 2011. These share rights were approved by shareholders at the 2011 Annual General Meeting of the Company.
(ii) I. D. Palmer was previously considered to be a member of key management personnel by virtue of being one of the five highest paid executives of the consolidated entity but is no longer considered to be a member of key management personnel.
(iii) B. W. Wray ceased employment on 31 January 2012.
(iv) D. R. N. Gaudoin was General Manager, Europe to 6 February 2011. He was appointed General Manager, Exploration and Geoscience for the AWE Group on 7 February 2011.
(v) A. Saridas commenced employment as Chief Financial Officer on 31 October 2011.
(vi) B. J. W. Wood ceased to be a director of the Company on 31 January 2011 and ceased to be a key management person from that date. He ceased employment on 31 July 2011.
(vii) L. J. Brooks was General Manager, Exploration to 6 February 2011 and ceased to be a key management person from that date but continued to be employed by the AWE group for the full year 2011 financial year.
AWE LIMITED ANNUAL REPORT 2012 95

NotES to tHE FINANCIAl StAtEMENtS FOR THE YEAR ENDED 30 JUNE 2012
(d) options over equity instrumentsThe movement during the financial year in the number of options in the Company held, directly, indirectly or beneficially, by each key management person, including their related parties, is as follows:
oPENINGBAlANCE ExErCISED
lAPSEDUNExErCISED
NEt CHANGEotHEr
CloSINGBAlANCE
2012
Directors
B. F. W. Clement(i) – – – – –
Executives
D. Gaudoin(ii) 200,000 – – – 200,000
N. F. Kelly 380,000 – (130,000) – 250,000
I. D. Palmer(iii) 300,000 – – – 300,000
D. Washer 300,000 – (50,000) – 250,000
B. W. Wray(iv) 400,000 – – (400,000) –
A. Saridas(v) – – – – –
2011
Directors
B. F. W. Clement(i) – – – – –B. J. Phillips(vi) 900,000 – (900,000) – –B. J. W. Wood(vii) 1,500,000 – – (1,500,000) –
Executives
D. Gaudoin(ii) 200,000 – – – 200,000N. F. Kelly 1,330,000 – (950,000) – 380,000I. D. Palmer(iii) 900,000 – (600,000) – 300,000D. Washer 575,000 – (275,000) – 300,000B. W. Wray(iv) 400,000 – – – 400,000L. J. Brooks(viii) 1,250,000 – (850,000) (400,000) –
(i) B. F. W. Clement was appointed as Managing Director on 1 February 2011.
(ii) D. R. N. Gaudoin was General Manager, Europe to 6 February 2011. He was appointed General Manager, Exploration and Geoscience for the AWE Group on 7 February 2011.
(iii) I. D. Palmer was previously considered to be a member of key management personnel by virtue of being one of the five highest paid executives of the consolidated entity but is no longer considered to be a member of key management personnel.
(iv) B. W. Wray ceased employment on 31 January 2012.
(v) A. Saridas commenced employment as Chief Financial Officer on 31 October 2011.
(vi) B. J. Phillips was appointed a director of the Company on 19 November 2009. The options lapsing unexercised in the previous financial year relate to options which were granted during his employment with the Company up to 31 December 2007.
(vii) B. J. W. Wood ceased to be a director of the Company on 31 January 2011 and ceased to be a key management person from that date. He ceased employment on 31 July 2011 and options held lapsed on cessation of employment.
(viii) L. J. Brooks was General Manager, Exploration to 6 February 2011 and ceased to be a key management person from that date but continued to be employed by the AWE group for the full year 2011 financial year.
32. related party disclosures (continued)
96 AWE LIMITED ANNUAL REPORT 2012

NotES to tHE FINANCIAl StAtEMENtS FOR THE YEAR ENDED 30 JUNE 2012
(e) Movements in sharesThe movement during the financial year in the number of ordinary shares in the Company held, directly, indirectly or beneficially, by each key management person, including their related parties, is as follows:
oPENINGBAlANCE
GrANtED ASrEMUNErAtIoN
rECEIVED oNExErCISE oF
oPtIoNSNEt CHANGE
otHErCloSINGBAlANCE
2012
Directors
B. F. W. Clement(i) – – – 30,000 30,000
B. J. Phillips 2,900,914 – – – 2,900,914
V. Braach-Maksvytis(ii) – – – – –
A. J. Hogendijk 10,000 – – – 10,000
N. N. Jukes(iii) – – – – –
D. I. McEvoy 30,000 – – – 30,000
K. Williams – – – 20,000 20,000
Executives
D. Gaudoin(iv) – – – – –
N. F. Kelly 125,476 – – – 125,476
I. D. Palmer(v) – – – – –
D. Washer 10,000 – – – 10,000
B. W. Wray(vi) 25,000 – – (25,000) –
A. Saridas(vii) – – – – –
2011
Directors
B. F. W. Clement(i) – – – – –
B. J. Phillips 2,900,914 – – – 2,900,914V. Braach-Maksvytis(ii) – – – – –A. J. Hogendijk 10,000 – – – 10,000N. N. Jukes(iii) – – – – –D. I. McEvoy 30,000 – – – 30,000K. Williams – – – – –B. G. McKay(viii) 265,610 – – (265,610) –B. J. W. Wood(ix) 176,885 – – (176,885) –
Executives
D. Gaudoin(iv) – – – – –N. F. Kelly 125,476 – – – 125,476I. D. Palmer(v) – – – – –D. Washer 20,000 – – (10,000) 10,000B. W. Wray(vi) 25,000 – – – 25,000L. J. Brooks(x) 1,301,910 – – (1,301,910) –
(i) B. F. W Clement was appointed a director of the Company on 1 February 2011.
(ii) V. Braach-Maksvytis was appointed a director of the Company on 7 October 2010.
(iii) N. N. Jukes was appointed a director of the Company on 24 August 2010.
(iv) D. R. N. Gaudoin was General Manager, Europe to 6 February 2011. He was appointed General Manager, Exploration and Geoscience for the AWE Group on 7 February 2011.
(v) I. D. Palmer was previously considered to be a member of key management personnel by virtue of being one of the five highest paid executives of the consolidated entity but is no longer considered to be a member of key management personnel.
(vi) B. W. Wray ceased employment on 31 January 2012.
(vii) A. Saridas commenced employment as Chief Financial Officer on 31 October 2011.
(viii) B. G. McKay retired as a director of the Company on 18 November 2010.
(ix) B. J. W. Wood ceased to be a director of the Company on 31 January 2011 and ceased to be a key management person from that date. He ceased employment on 31 July 2011.
(x) L. J. Brooks was General Manager, Exploration to 6 February 2011 and ceased to be a key management person from that date but continued to be employed by the AWE group for the full year.
32. related party disclosures (continued)
AWE LIMITED ANNUAL REPORT 2012 97

NotES to tHE FINANCIAl StAtEMENtS FOR THE YEAR ENDED 30 JUNE 2012
Changes in shareholdings classified as “Net change other” in the table above do not necessarily reflect purchases or disposals of shares but may include movements relating to changes in key management personnel during the period.
No shares were granted to key management personnel during the financial year as remuneration.
The disclosures above may not be consistent with the disclosure in the Directors’ Report as the basis of calculation differs due to the differing requirements of the Corporations Act 2001 and the Accounting Standards.
(f) Key management personnel transactions with the Company or its controlled entitiesNo loans have been made to key management personnel. The Company has entered into Indemnity Deeds to indemnify executives of the Company against certain liabilities incurred in the course of performing their duties.
(g) Non-key management personnel disclosuresThe consolidated entity has a related party relationship with its controlled entities (note 30), joint ventures (note 26) and with its key management personnel. The Company and its controlled entities engage in a variety of related party transactions in the ordinary course of business. These transactions are generally conducted on normal terms and conditions.
33. Parent entity disclosuresAs at, and throughout the year ended 30 June 2012 the parent company of the consolidated entity was AWE Limited.
tHE CoMPANy
2012$’000
2011$’000
result of the parent entity
Loss for the period (4,475) (23,168)
Other comprehensive income – –
Total comprehensive income for the period (4,475) (23,168)
Financial position of the parent entity at year end
Current assets 357,288 378,263
Total assets 883,472 912,627
Current liabilities 1,311 1,468
Total liabilities 1,311 1,468
Net assets 882,161 911,159
total equity of the parent entity comprising of:
Share capital 772,172 772,172
Reserves 11,167 9,596
Retained earnings 98,822 129,391
Total equity 882,161 911,159
Parent entity contingencies and commitmentsThe contingent liabilities of the parent entity as at the end of the reporting period are disclosed in note 28. The directors are of the opinion that provisions are not required in respect of these matters, as it is not probable that a future sacrifice of economic benefits will be required or the amount is not capable of reliable measurement.
The parent entity did not have any capital or expenditure commitments as at end of the reporting period.
Parent entity guarantees in respect of debts of its subsidiariesThe parent entity has entered into a Deed of Cross Guarantee with the effect that the Company guarantees debts in respect of its subsidiaries. Further details of the Deed of Cross Guarantee and the subsidiaries subject to the deed, are disclosed in Note 34.
32. related party disclosures (continued)
98 AWE LIMITED ANNUAL REPORT 2012

NotES to tHE FINANCIAl StAtEMENtS FOR THE YEAR ENDED 30 JUNE 2012
34. Deed of cross guaranteeThe Company and certain of the Company’s wholly-owned subsidiaries have entered into a Deed of Cross Guarantee. Pursuant to ASIC Class Order 98/1418 (as amended) dated 13 August 1998, certain of the Company’s wholly-owned subsidiaries (refer note 30) are relieved from the Corporations Act 2001 requirements for preparation, audit and lodgement of financial statements, and directors’ report.
It is a condition of the Class Order that the Company and each of the subsidiaries enter into a Deed of Cross Guarantee. The effect of the Deed is that the Company guarantees to each creditor payment in full of any debt in the event of winding up of any of the subsidiaries under certain provisions of the Act, the Company will only be liable in the event that after six months any creditor has not been paid in full. The subsidiaries have also given similar guarantees in the event that the Company is wound up.
A consolidated statement of financial position and consolidated income statement, comprising the Company and controlled entities which are a party to the Deed of Cross Guarantee, at 30 June 2012, is set out as follows:
Consolidated statement of financial positionCloSED GroUP
2012$’000
2011$’000
Current assetsCash and cash equivalents 30,812 100,280Trade and other receivables 135,946 27,840Inventory 5,517 10,044total current assets 172,275 138,164Non-current assetsInvestments 11,341 27,268Exploration and evaluation assets 73,911 72,260Oil and gas assets 638,689 793,115Other property, plant and equipment 1,836 2,144Intangible assets 2,915 1,085Deferred tax assets 31,141 3,909total non-current assets 759,833 899,781total assets 932,108 1,037,945Current liabilitiesTrade and other payables 34,304 60,894Employee benefits 996 1,079Provisions 8,675 7,184Taxation payable 7,981 912total current liabilities 51,956 70,069Non-current liabilitiesEmployee benefits 536 743Provisions 88,579 84,153total non-current liabilities 89,115 84,896total liabilities 141,071 154,965Net assets 791,037 882,980EquityIssued capital 772,172 772,172Reserves 21,822 15,337Retained earnings (2,957) 95,471total equity 791,037 882,980
Summarised consolidated income statement2012
$’0002011
$’000
Loss before tax (84,184) (163,521)Income tax benefit 11,850 49,313Net loss after tax for the year (72,334) (114,208)Retained earnings at the beginning of the year 95,471 209,679Dividends provided for or paid (26,094) –Retained earnings at the end of the year (2,957) 95,471
35. Events subsequent to balance dateIn the opinion of the directors, no matter or circumstance has arisen since 30 June 2012 that has significantly affected, or may significantly affect:
(a) the consolidated entity’s operations in future financial years;
(b) the results of those operations in future financial years; or
(c) the consolidated entity’s state of affairs in future financial years.
AWE LIMITED ANNUAL REPORT 2012 99

In the opinion of the directors of AWE Limited:
(a) the financial statements and accompanying notes, and the Remuneration Report in the Directors’ Report, set out on pages 55 to 99 and pages 33 to 45, are in accordance with the Corporations Act 2001, including:
(i) giving a true and fair view of the financial position of the consolidated entity as at 30 June 2012 and of its performance for the financial year ended on that date; and
(ii) complying with Australian Accounting Standards (including the Australian Accounting Interpretations) and the Corporations Regulations 2001; and
(b) the financial statements also comply with International Financial Reporting Standards as disclosed in note 1(a); and
(c) there are reasonable grounds to believe that the Company will be able to pay its debts as and when they become due and payable; and
(d) there are reasonable grounds to believe that the Company and the group entities identified in Note 34 will be able to meet any obligations or liabilities to which they are or may become subject to by virtue of the Deed of Cross Guarantee between the Company and those group entities pursuant to ASIC Class Order 98/1418.
The directors have been given the declarations required by Section 295A of the Corporations Act 2001 from the Managing Director and Chief Financial Officer for the financial year ended 30 June 2012.
Signed in accordance with a resolution of the directors:
Dated at Sydney this twenty seventh day of August 2012.
B. J. PHIllIPS B. F. W. ClEMENt Chairman Managing Director
DIrECtorS’ DEClArAtIoN
100 AWE LIMITED ANNUAL REPORT 2012

INDEPENDENt AUDItor’S rEPort TO THE MEMBERS OF AWE LIMITED
report on the financial reportWe have audited the accompanying financial report of AWE Limited, which comprises the consolidated statement of financial position as at 30 June 2012, the consolidated income statement, consolidated statement of comprehensive income, consolidated statement of changes in equity and consolidated statement of cash flows for the year then ended, notes comprising a summary of significant accounting policies and other explanatory information, and the directors’ declaration of the consolidated entity comprising the company and the entities it controlled at the year’s end or from time to time during the financial year.
Directors’ responsibility for the financial reportThe directors of the company are responsible for the preparation of the financial report that gives a true and fair view in accordance with Australian Accounting Standards and the Corporations Act 2001 and for such internal controls as the directors determine are necessary to enable the preparation of the financial report that is free from material misstatement, whether due to fraud or error. In Note 1, the directors also state, in accordance with Accounting Standard AASB 101 Presentation of Financial Statements, that the financial statements comply with International Financial Reporting Standards.
Auditor’s responsibilityOur responsibility is to express an opinion on the financial report based on our audit. We conducted our audit in accordance with Australian Auditing Standards. Those standards require that we comply with relevant ethical requirements relating to audit engagements and plan and perform the audit to obtain reasonable assurance about whether the financial report is free from material misstatement.
An audit involves performing procedures to obtain audit evidence about the amounts and disclosures in the financial report. The procedures selected depend on the auditor’s judgment, including the assessment of the risks of material misstatement of the financial report, whether due to fraud or error. In making those risk assessments, the auditor considers internal controls relevant to the entity’s preparation and fair presentation of the financial report in order to design audit procedures that are appropriate in the circumstances, but not for the purpose of expressing an opinion on the effectiveness of the entity’s internal controls. An audit also includes evaluating the appropriateness of accounting policies used and the reasonableness of accounting estimates made by the directors, as well as evaluating the overall presentation of the financial report.
We believe that the audit evidence we have obtained is sufficient and appropriate to provide a basis for our audit opinion.
IndependenceIn conducting our audit we have complied with the independence requirements of the Corporations Act 2001. We have given to the directors of the company a written Auditor’s Independence Declaration, a copy of which is included in the directors’ report.
opinionIn our opinion:
(a) the financial report of AWE Limited is in accordance with the Corporations Act 2001, including:
(i) giving a true and fair view of the consolidated entity’s financial position as at 30 June 2012 and of its performance for the year ended on that date; and
(ii) complying with Australian Accounting Standards and the Corporations Regulations 2001; and
(b) the financial report also complies with International Financial Reporting Standards as disclosed in Note 1(a).
report on the remuneration reportWe have audited the Remuneration Report included in the Directors’ Report for the year ended 30 June 2012. The directors of the company are responsible for the preparation and presentation of the Remuneration Report in accordance with section 300A of the Corporations Act 2001. Our responsibility is to express an opinion on the Remuneration Report, based on our audit conducted in accordance with Australian Auditing Standards.
opinionIn our opinion, the Remuneration Report of AWE Limited for the year ended 30 June 2012, complies with section 300A of the Corporations Act 2001.
Ernst & young
trent van Veen Partner Sydney 27 August 2012
AWE LIMITED ANNUAL REPORT 2012 101
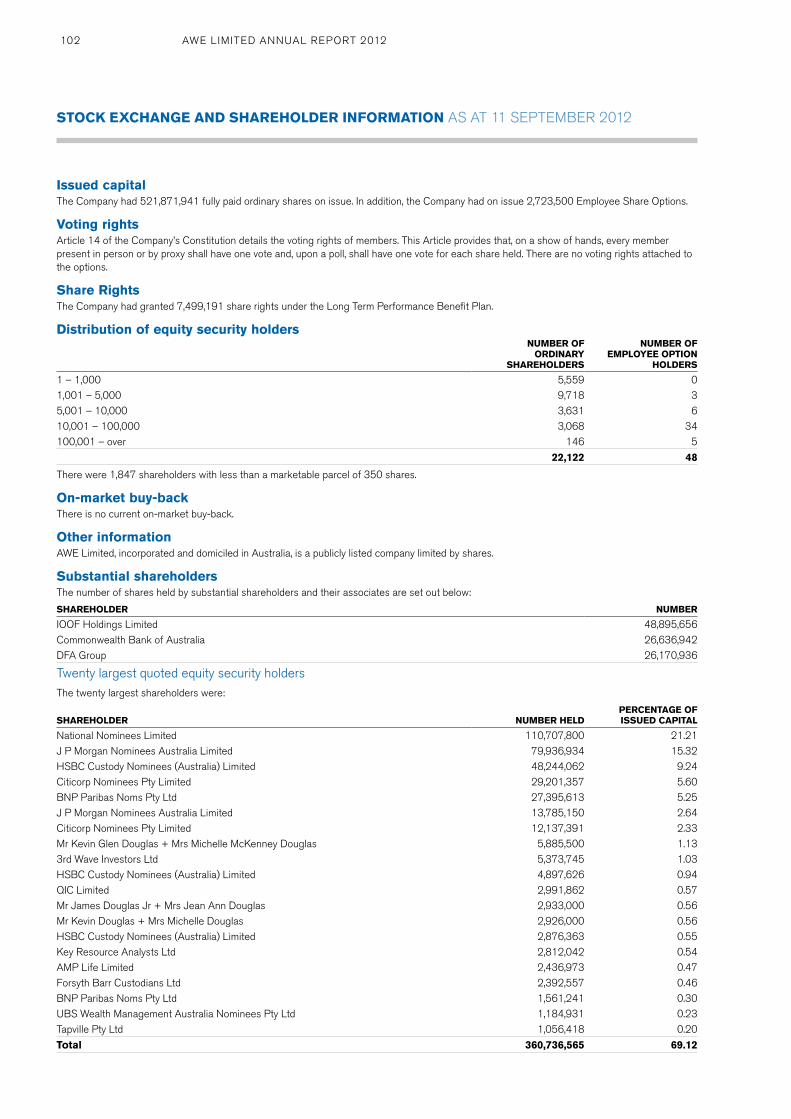
StoCK ExCHANGE AND SHArEHolDEr INForMAtIoN AS AT 11 SEPTEMBER 2012
Issued capitalThe Company had 521,871,941 fully paid ordinary shares on issue. In addition, the Company had on issue 2,723,500 Employee Share Options.
Voting rightsArticle 14 of the Company’s Constitution details the voting rights of members. This Article provides that, on a show of hands, every member present in person or by proxy shall have one vote and, upon a poll, shall have one vote for each share held. There are no voting rights attached to the options.
Share rightsThe Company had granted 7,499,191 share rights under the Long Term Performance Benefit Plan.
Distribution of equity security holdersNUMBEr oF
orDINAry SHArEHolDErS
NUMBEr oF EMPloyEE oPtIoN
HolDErS
1 – 1,000 5,559 01,001 – 5,000 9,718 35,001 – 10,000 3,631 610,001 – 100,000 3,068 34100,001 – over 146 5
22,122 48
There were 1,847 shareholders with less than a marketable parcel of 350 shares.
on-market buy-backThere is no current on-market buy-back.
other informationAWE Limited, incorporated and domiciled in Australia, is a publicly listed company limited by shares.
Substantial shareholdersThe number of shares held by substantial shareholders and their associates are set out below:
SHArEHolDEr NUMBEr
IOOF Holdings Limited 48,895,656Commonwealth Bank of Australia 26,636,942DFA Group 26,170,936
Twenty largest quoted equity security holdersThe twenty largest shareholders were:
SHArEHolDEr NUMBEr HElDPErCENtAGE oF ISSUED CAPItAl
National Nominees Limited 110,707,800 21.21J P Morgan Nominees Australia Limited 79,936,934 15.32HSBC Custody Nominees (Australia) Limited 48,244,062 9.24Citicorp Nominees Pty Limited 29,201,357 5.60BNP Paribas Noms Pty Ltd 27,395,613 5.25J P Morgan Nominees Australia Limited 13,785,150 2.64Citicorp Nominees Pty Limited 12,137,391 2.33Mr Kevin Glen Douglas + Mrs Michelle McKenney Douglas 5,885,500 1.133rd Wave Investors Ltd 5,373,745 1.03HSBC Custody Nominees (Australia) Limited 4,897,626 0.94QIC Limited 2,991,862 0.57Mr James Douglas Jr + Mrs Jean Ann Douglas 2,933,000 0.56Mr Kevin Douglas + Mrs Michelle Douglas 2,926,000 0.56HSBC Custody Nominees (Australia) Limited 2,876,363 0.55Key Resource Analysts Ltd 2,812,042 0.54AMP Life Limited 2,436,973 0.47Forsyth Barr Custodians Ltd 2,392,557 0.46BNP Paribas Noms Pty Ltd 1,561,241 0.30UBS Wealth Management Australia Nominees Pty Ltd 1,184,931 0.23Tapville Pty Ltd 1,056,418 0.20
total 360,736,565 69.12
102 AWE LIMITED ANNUAL REPORT 2012

Abbreviations
$ Australian Dollars
2P proved and probable
3D three-dimensional
AMI Area of Mutual Interest
APr means the New Zealand Accounting Profits Royalty
ASIC Australian Securities and Investments Commission
ASx Australian Securities Exchange
bbl barrel
BCF billion cubic feet
BoE barrels of oil equivalent
cps cents per share
EBIt earnings before interest and tax
EBItDAx earnings before interest, tax, depreciation, amortisation and exploration expenses
FEED Front End Engineering and Design
FID Final Investment and Decision
FPSo Floating Production Storage and Offloading Vessel
GSt Goods and Services Tax
HS & E Health, Safety and Environment
km kilometre
KPI Key Performance Indicator
K tonnes thousand tonnes
lPG liquefied petroleum gas
ltI lost time injury
lNG Liquefied natural gas
ltIFr lost time injury frequency rate
MlE mid life enhancement
million bbls million barrels
million BoE million barrels of oil equivalent
mmcfgd million cubic feet of gas per day
PESA Petroleum Exploration Society of Australia
PJ petajoule
PoD Plan of development
PSC Production Sharing Contract
Probable reserves means reserves additional to proved reserves which can be estimated with a degree of certainty (greater than 50% probability) sufficient to indicate they are more likely to be recovered than not
Proved reserves means reserves which can be estimated with reasonable certainty (greater than 90% probability) to be recoverable under current economic conditions
Prrt means the petroleum resource rent tax imposed with respect to petroleum products pursuant to the Petroleum Resource Rent Tax Act 1987 (Cth) and the Petroleum Resource Rent Tax Assessment Act 1987 (Cth)
reserves means the volume of economically recoverable oil or gas contained in a geological formation form a given date forward
reservoir means a rock that is both porous and permeable
scf standard cubic feet
SPE Society of Petroleum Engineers
sq km square kilometres
tJ terajoule
tSr total shareholder returns
trIFr total recordable injury frequency rate
WtI West Texas intermediate
Conversion tableVolume1 cubic metre = 1 kilolitre = 35.3 cubic feet = 6.29 barrels 1 megalitre = 1,000 cubic metres
Energy Value1,000 standard cubic feet of sales gas yields about 1.1 gigajoules of heat 1 petajoule (PJ) = 1,000,000 gigajoules (GJ) 1 gigajoule = 947,817 British Thermal Units (BTU)
Barrel of Oil Equivalents (BOE)Sales Gas – 6,000 standard cubic feet is approx. = 1 BOE lPG – 1 tonne of LPG is approx. = 11.6 BOE Condensate – 1 barrel of condensate = 1 BOE oil – 1 barrel of oil = 1 BOE
Decimal Number Prefixeskilo = thousand = 103 mega = million = 106 giga = 1,000 million = 109 tera = million million = 1012 peta = 1,000 million million = 1015
reservesThe reserve and resource information contained in this report is based on information compiled by David Gaudoin (General Manager, Exploration and Geoscience) and Ian Palmer (General Manager Development). Mr Gaudoin is a petroleum geologist, holds a Masters Degree in Petroleum Geology, and has 22 years experience in petroleum exploration. Mr Palmer holds a Bachelor Degree in Engineering and has 31 years experience in the practice of petroleum engineering. Both have consented in writing to the inclusion of this information in the form and context in which it appears.
The reserves in this report are estimated according to the SPE/WPC/AAPG/SPEE Petroleum Resources Management System of March 2007.
GloSSAry
AWE LIMITED ANNUAL REPORT 2012 103

AWE limitedABN 70 077 897 440 PO Box 733, North Sydney NSW 2059
Place of IncorporationNew South Wales, Australia
Board of DirectorsB. J. Phillips (Chairman) B. F. W. Clement (Managing Director) D. I. McEvoy A. J. Hogendijk K. G. Williams N. N. Jukes V. Braach-Maksvytis
Company SecretaryN. F. Kelly
registered office and Principal Business officeLevel 16, 40 Mount Street North Sydney NSW 2060 Australia
Telephone: +61-2-8912 8000 Facsimile: +61-2-9460 0176 Email: [email protected] Website: www.awexplore.com
Share registerComputershare Investor Services Pty Limited Level 3, 60 Carrington Street Sydney NSW 2000 Australia
Telephone: +61-2-8234 5000 Facsimile: +61-2-8234 5050
AuditorErnst & Young 680 George Street Sydney NSW 2000
legal AdvisersPiper Alderman Lawyers Level 23, Governor Macquarie Tower 1 Farrer Place Sydney NSW 2000
BankersCommonwealth Bank of Australia 48 Martin Place Sydney NSW 2000
Stock ExchangeAustralian Securities Exchange (Sydney) ASX Code: AWE
CorPorAtE DIrECtory
104 AWE LIMITED ANNUAL REPORT 2012

AWE Board of Directors(STANDING L-R) Ken Williams, Vijoleta Braach-Maksvytis, Andy Hogendijk, Nick Jukes (SEATED L-R) Bruce Phillips, Dave McEvoy, Bruce Clement
This report is printed on Maine Recycled and Sun Offset paper.
Maine Recycled is produced with a blend of 60% post consumer waste fibre and 40% FSC® certified virgin fibre. Made with fibre derived only from sustainable sources and is produced with a low reliance on fossil fuel energy. Maine Recycled’s low carbon footprint has been neutralised to zero from seedling to delivery at printer through the purchase of carbon offsets. This chosen offset project is the Kasigau Corridor REDD+ project in Kenya. A programme which makes a difference to not only the precious carbon sink but the local community and people who inhabit the land. Every tonne of Maine Recycled sold means A$23 will go towards helping this valuable and worthy cause. Sun Offset is FSC certified by Sun Paper who also carry the ISO 14001 EMS accreditation, it is made with elemental chlorine free pulps.
Designed and produced by ArmstrongQ – www.armstrongQ.com.au